The AUD/USD has made a weekly break below the significant support level of 0.755. The Aussie closed at 0.7512 and hasn’t made a weekly close down in this region since May 2009, that is, in over six years. The weekly break of 0.755 is rather bearish as it may signal the start of a Bear Flag pattern worth around 1,700 pips which, if correct, would no doubt please RBA Gov Glen Stevens. However, is this bearish A/U move just a dip to help the AUD/NZD affect a technical pullback to test a broken trend line before bullish continuation?
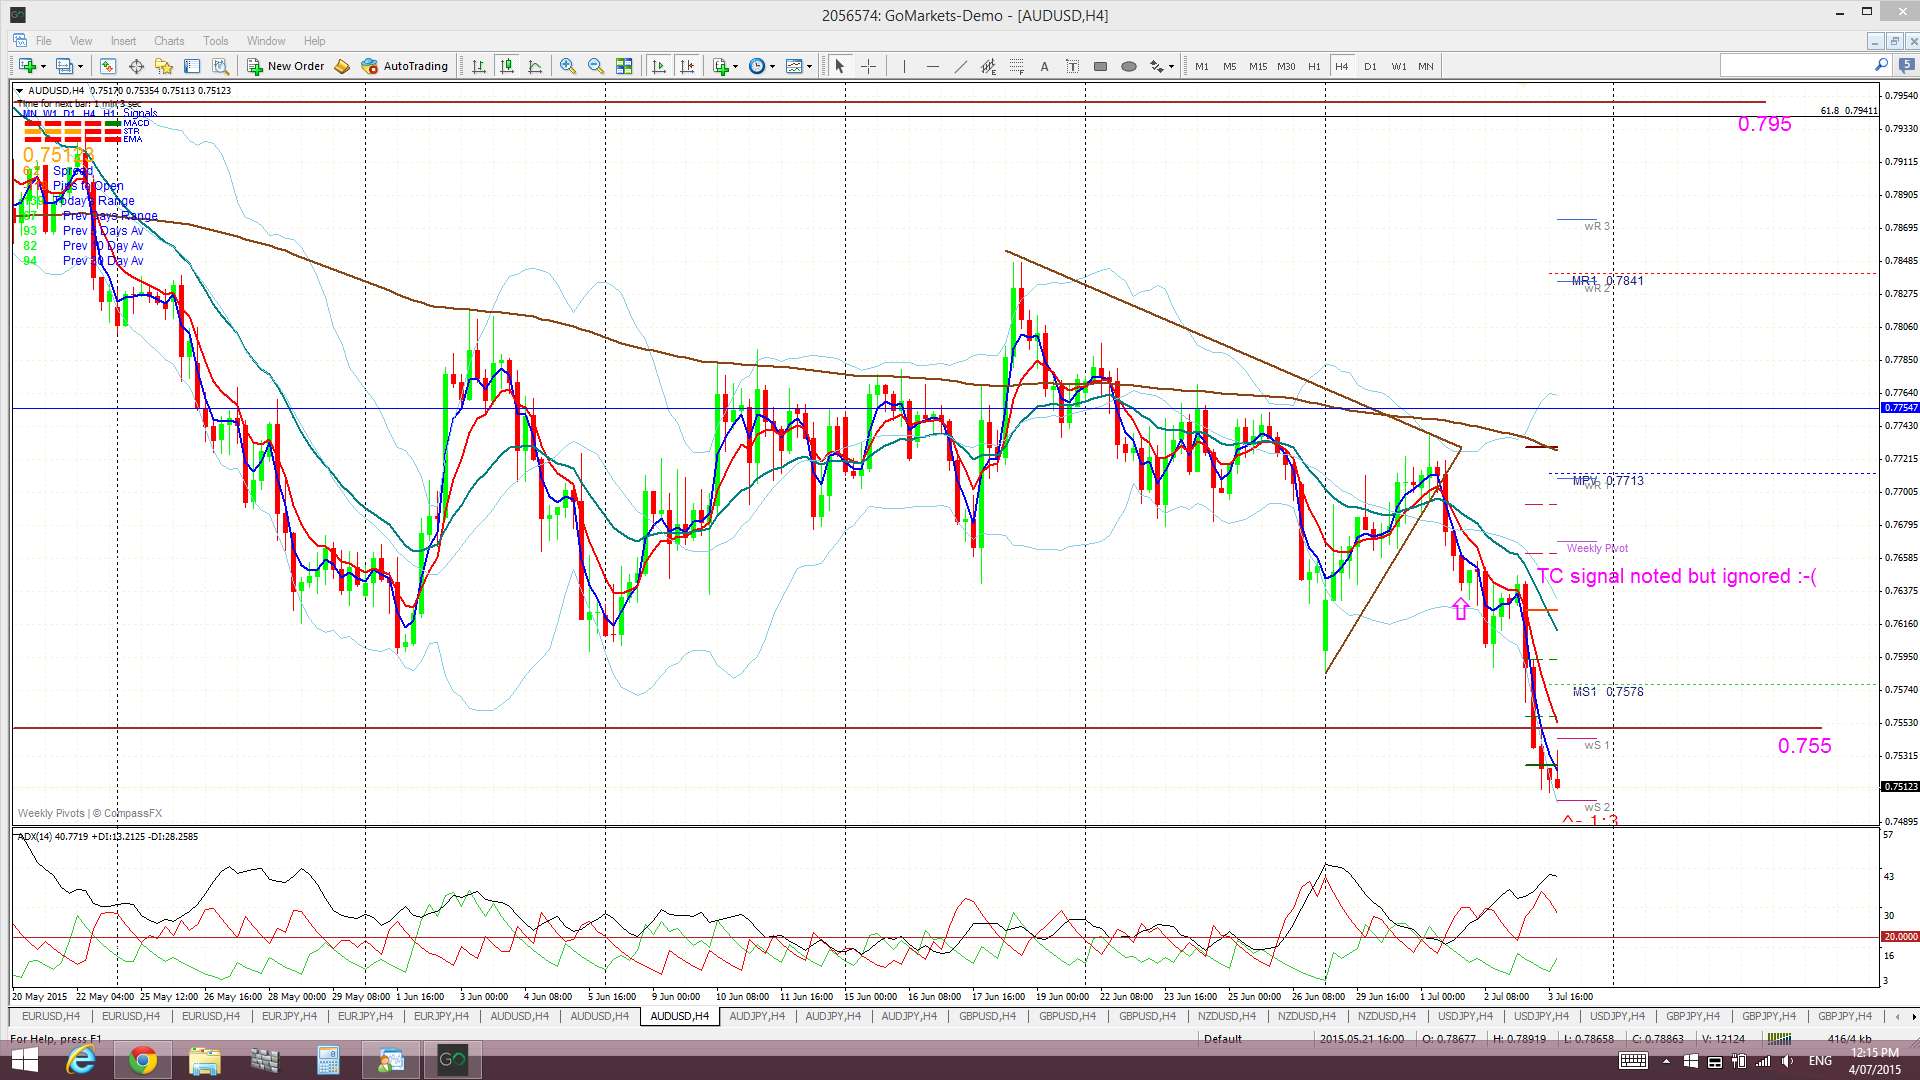
I had noted in an update late last week how I had received a TC signal to short the A/U but was ignoring signals given the looming Greek Referendum weekend news. More the pity for me though as this TC signal has gone on to deliver up to 120 pips:
A/U 4hr: an earlier TC SHORT signal ignored:
A/U daily: the daily chart shows Friday’s close as the first below 0.755 in recent history:

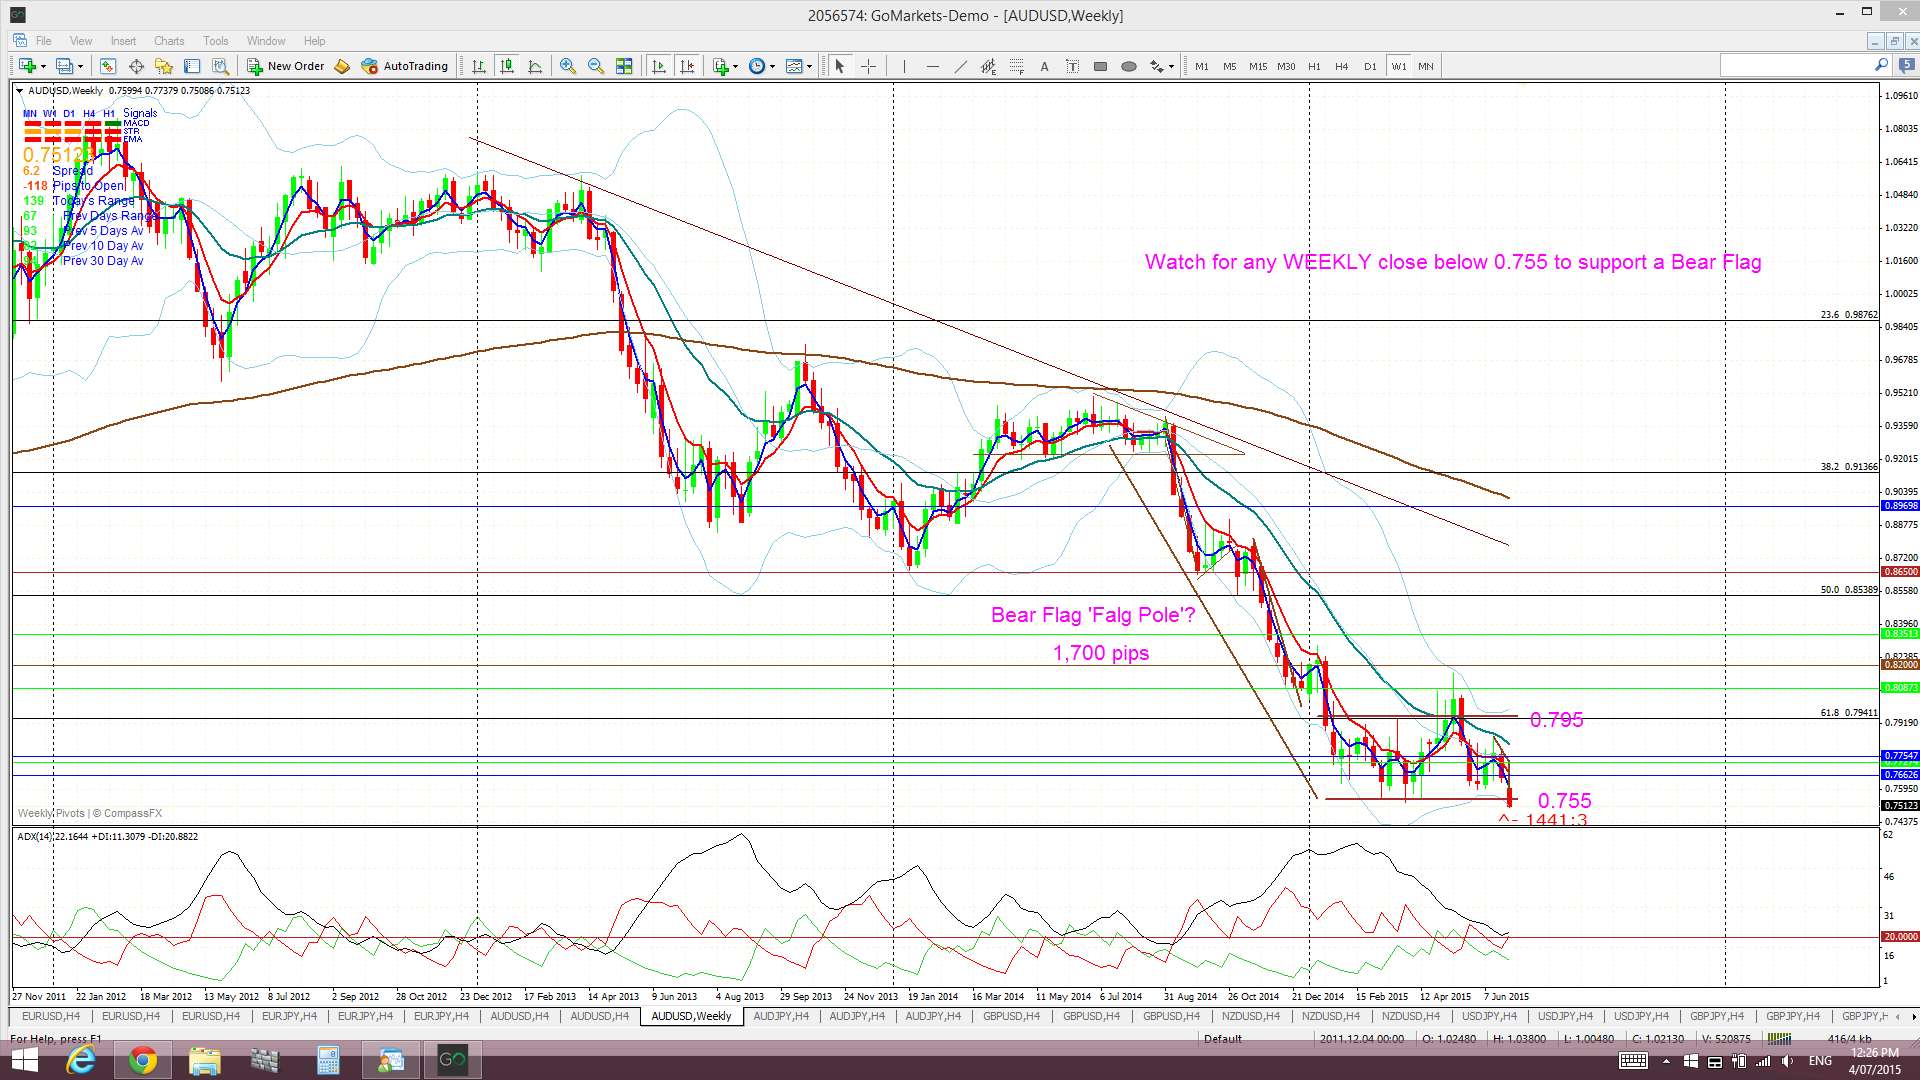
A/U weekly: the weekly charts shows this as the first weekly close below 0.755 and the perspective on this time frame also reveals the potential of a Bear Flag pattern. Look for any test and respect of 0.755 to suggest the start of a possible 1,700 pip Bear Flag continuation move:
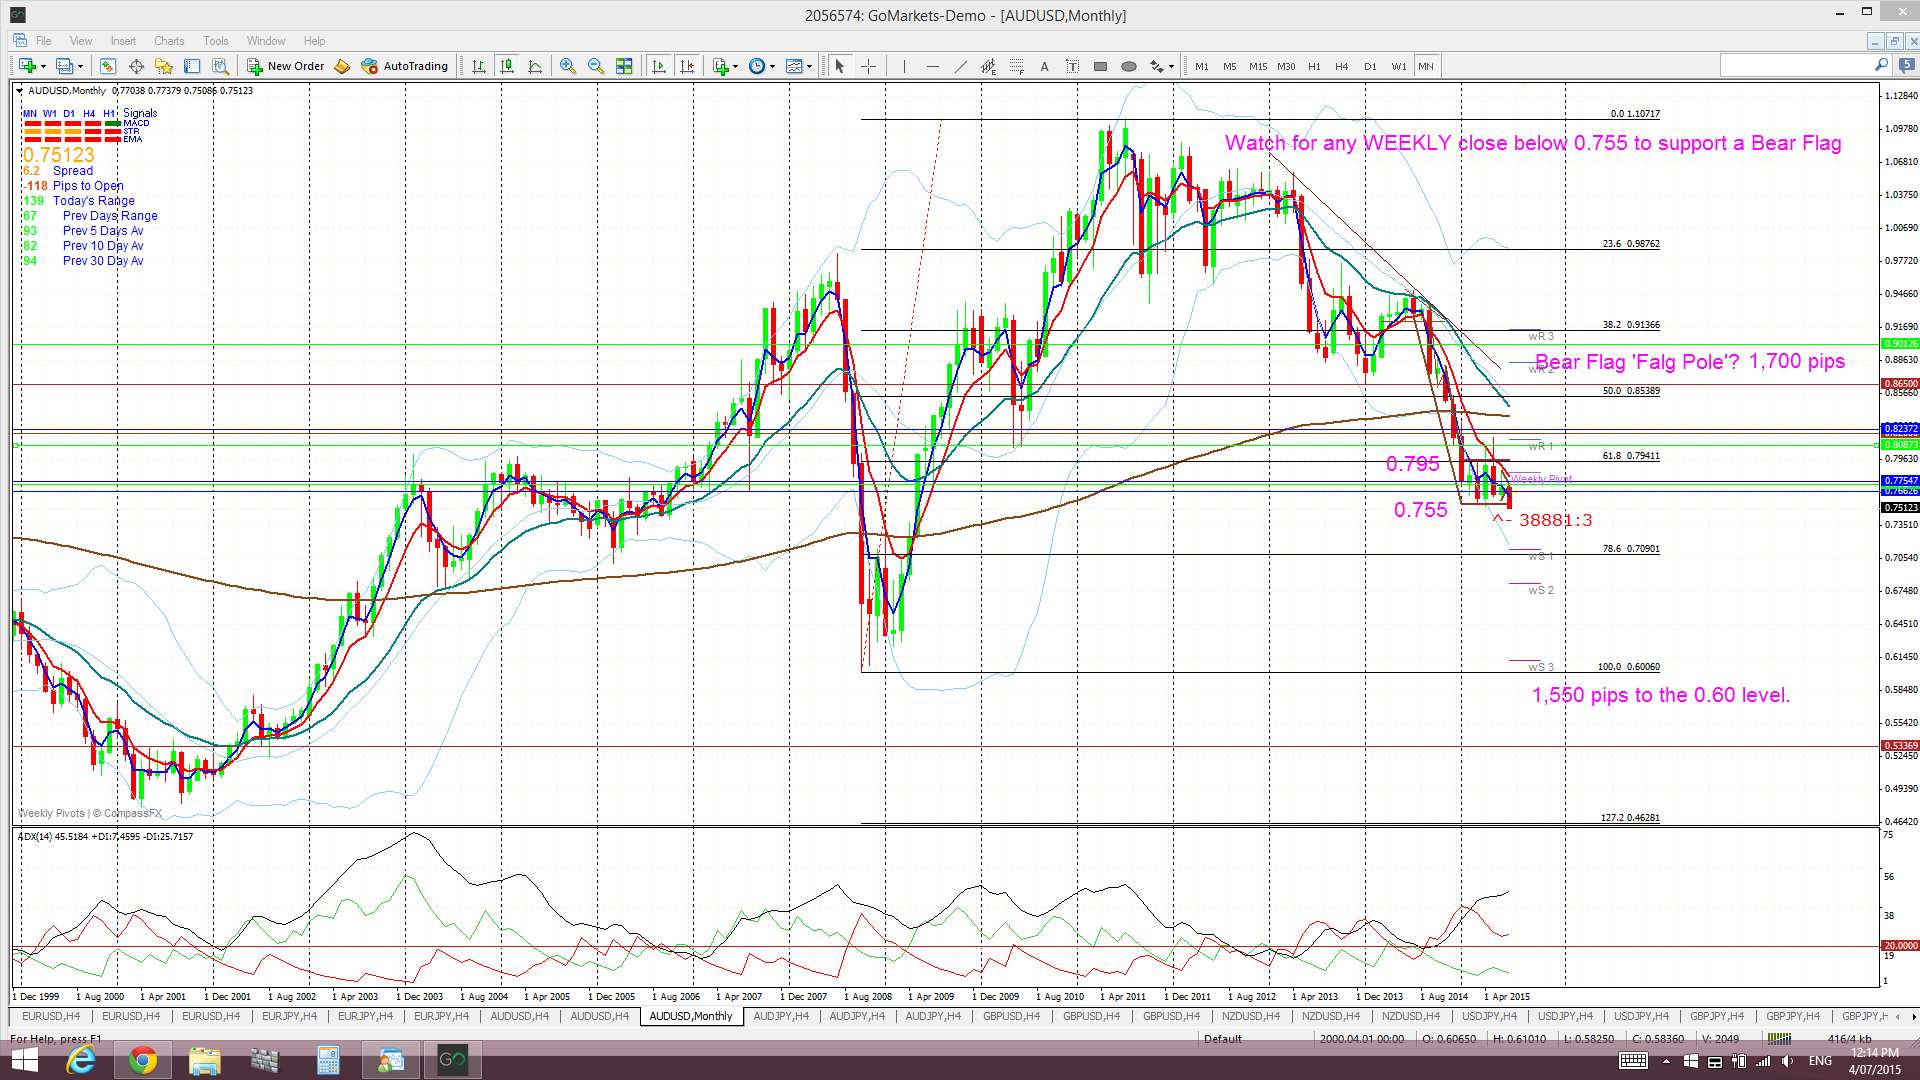
A/U monthly: this chart reveals that even just a 1,550 pip bearish move would bring price down to the 2008 low near 0.60 cents:
AUD/NZD: this bearish A/U move is helping to affect a pullback on the AUD/NZD.
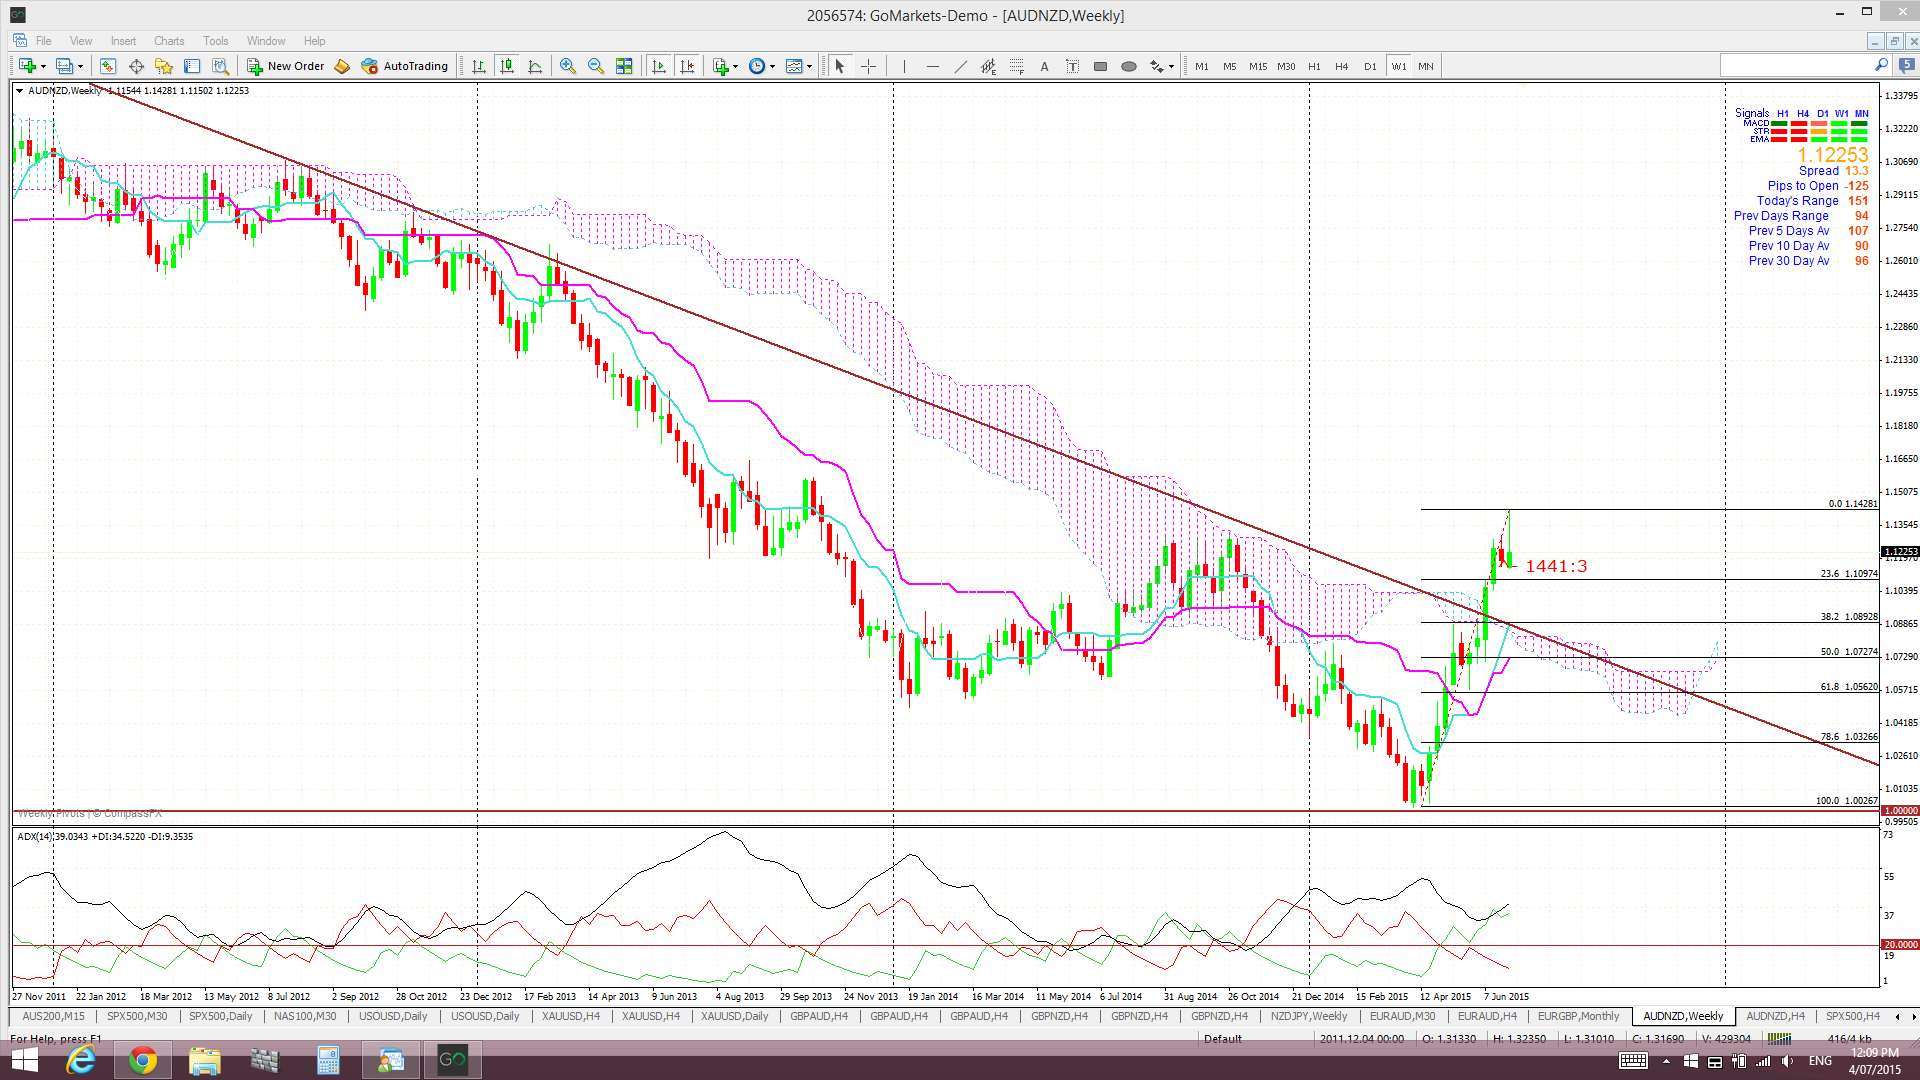
AUD/NZD monthly: The AUD/NZD has been bullish for the last three months and has put on over 1,300 pips. This move also resulted in a bullish trend line break above a bear trend line that had been in force for almost four years:
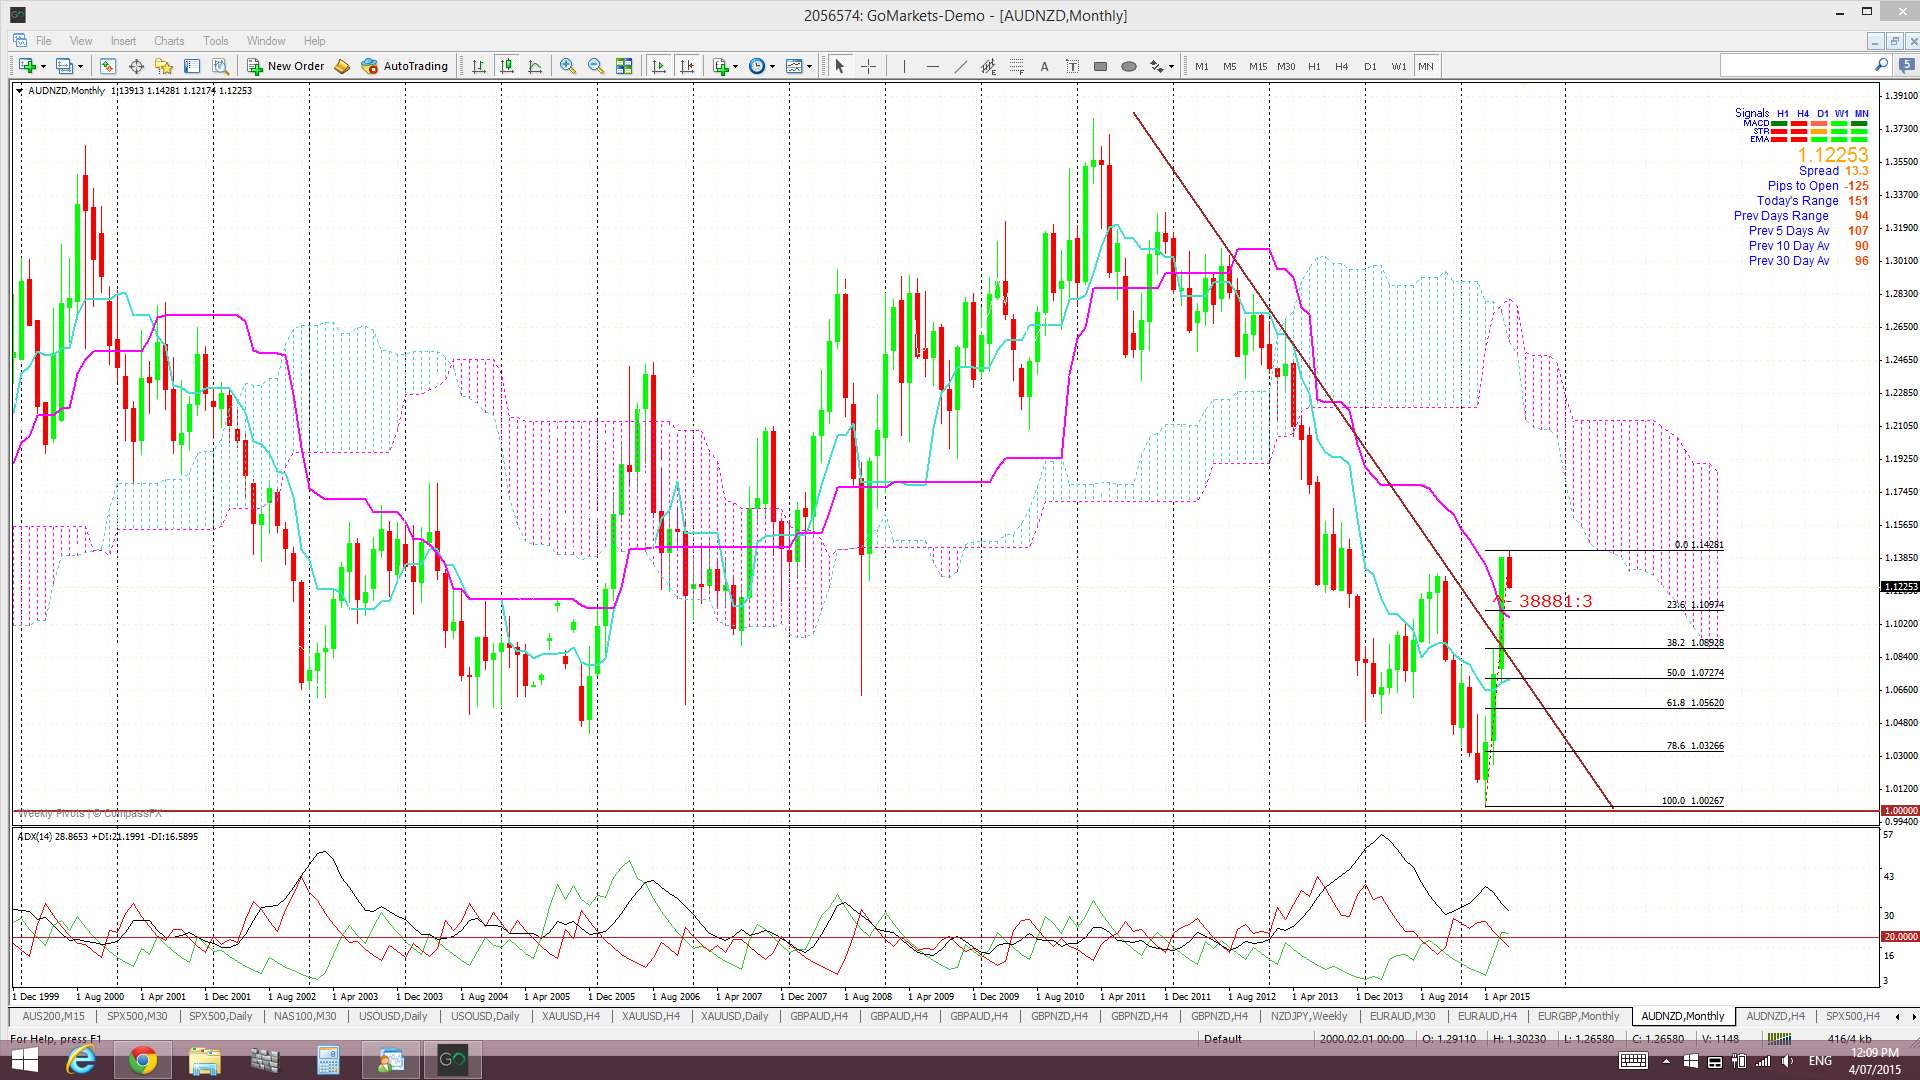
Technical theory would suggest a possible test of the broken trend line before any potential bullish continuation. A pullback to the 50% fib of the recent swing high move would bring price down to the 1.07 region and to near the broken trend line. Thus, this bearish A/U move may help to bring about this AUD/NZD test of the broken trend line. Any AUD/NZD pullback beyond the 61.8% fib near 1.055 would suggest there could be further bearish movement and that the move may be more of a reversal rather than just a pullback.
AUD/NZD weekly: the 1.07 region is also near the top of the weekly Cloud.
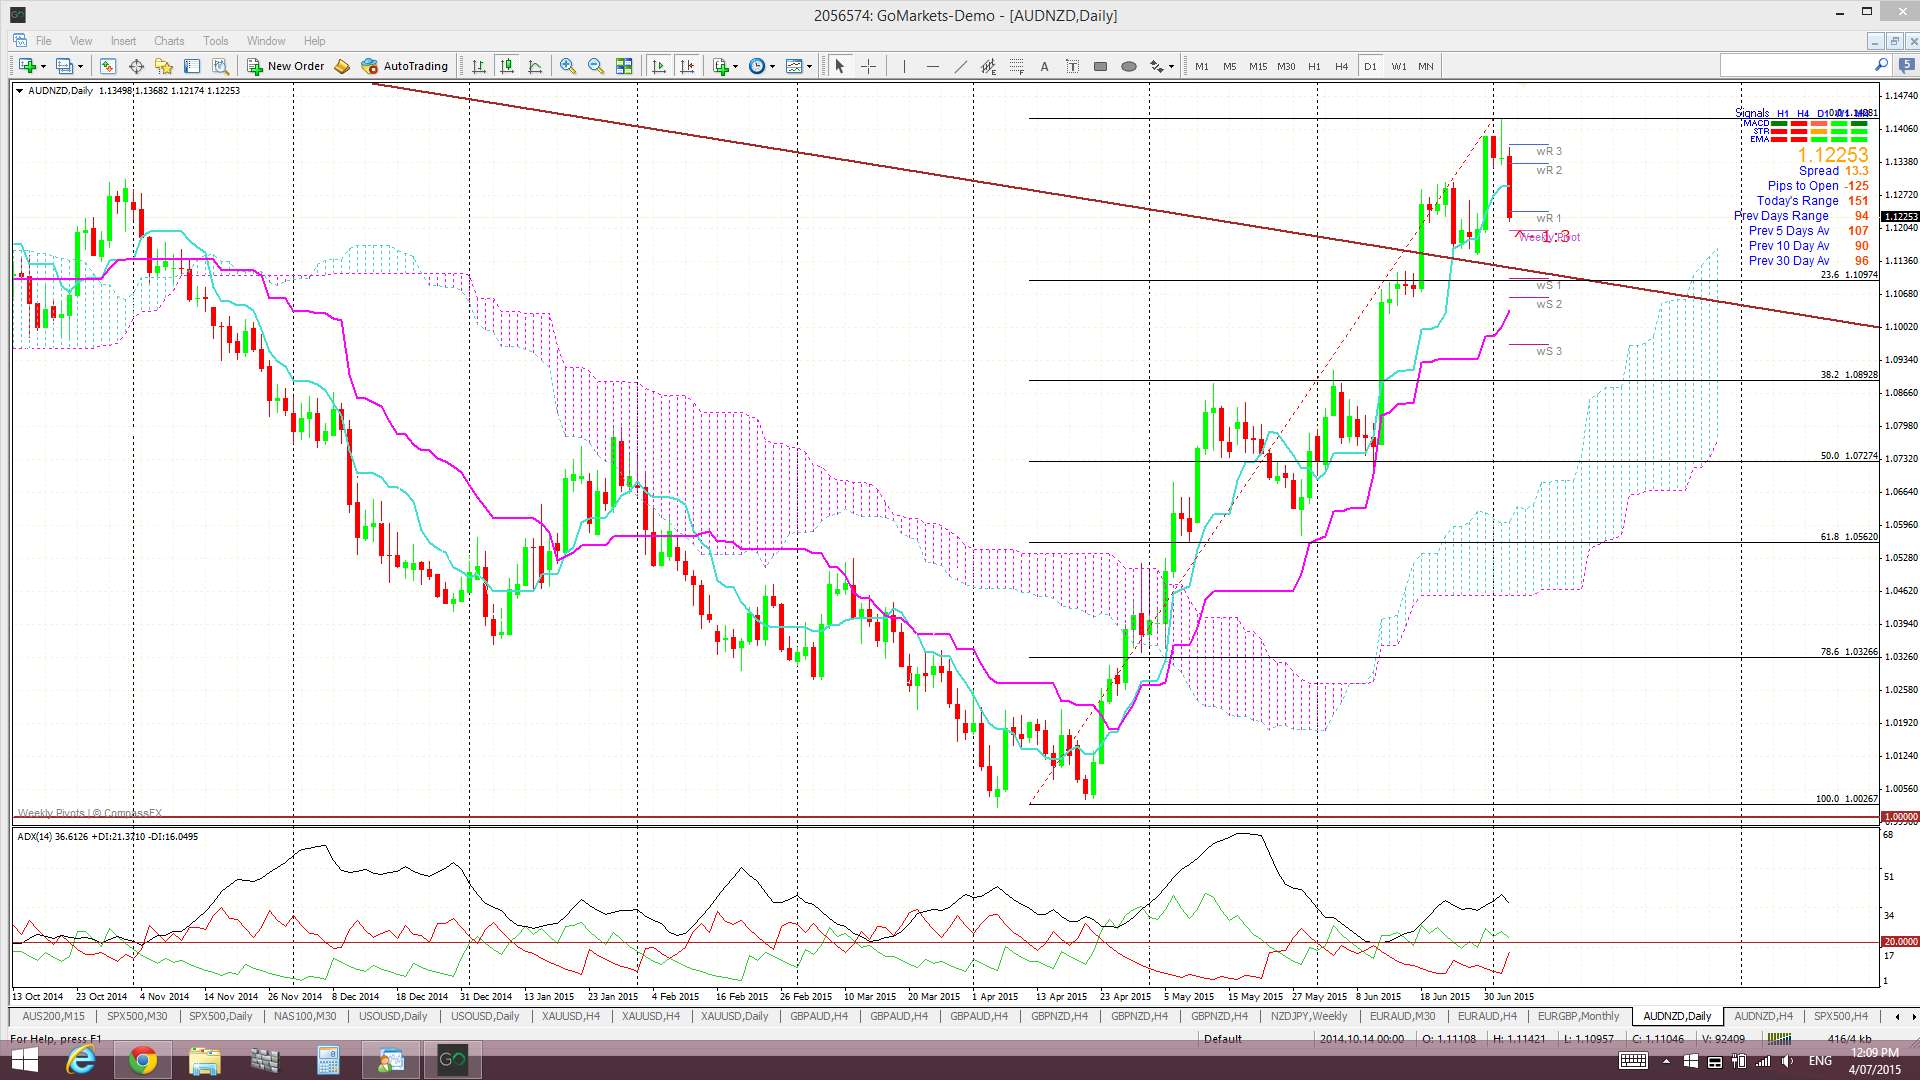
AUD/NZD daily: the 1.07 is near the bottom of the daily Cloud:
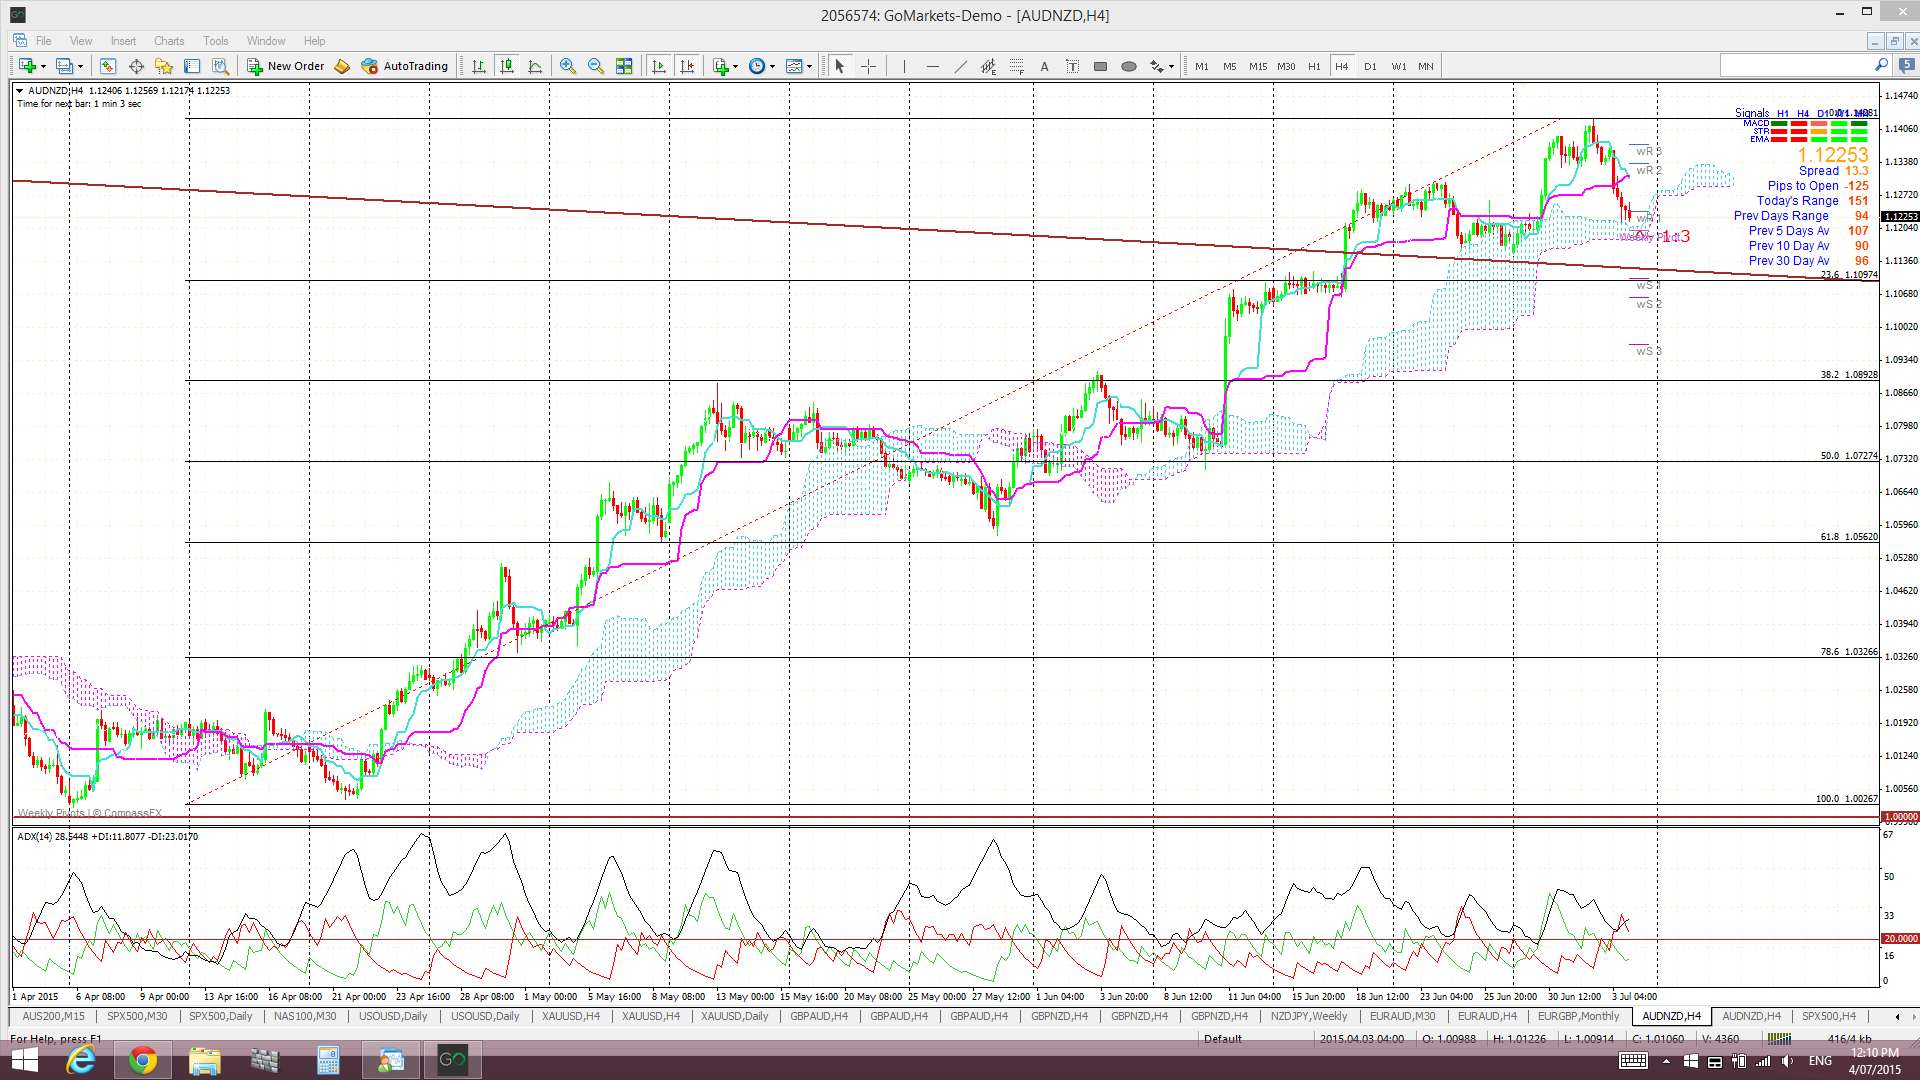
AUD/NZD 4hr: note how price is still above the 4hr Cloud for now. Any move below the 4hr Cloud would support bearish continuation:
Summary: The AUD/USD has made a weekly close below 0.755 support and this may signal the start of a 1,700 pip Bear Flag move. Look for any test AND THEN respect of 0.755 to support this Bear Flag pattern.
However, it may just be that the bearish A/U move is simply a dip helping to affect an AUD/NZD pullback to test a broken trend line before bullish continuation. The 1.07 level may be worth watching on the AUD/NZD as this is near the 50% fib of the recent swing high move and, also, near the previously broken trend line. Thus, watch for any A/U support to kick in IF the AUD/NZD pulls back as far as 1.07.
NB: The obvious caveat with the above technical analysis is that we need to get past the w/e Greek Referendum and no one can predict how this news might alter the charting patterns on not just EUR but ALL Forex pairs.
The post A/U breaks key support but is this just linked to the AUD/NZD? appeared first on www.forextell.com.