The AUD/JPY is often viewed as the risk-barometer pair for Forex and as a metric to gauge broader market sentiment. I thought I’d take a look at the charts here and see if they’re telling us anything whilst I wait for my son to come home after his final HSC exam.
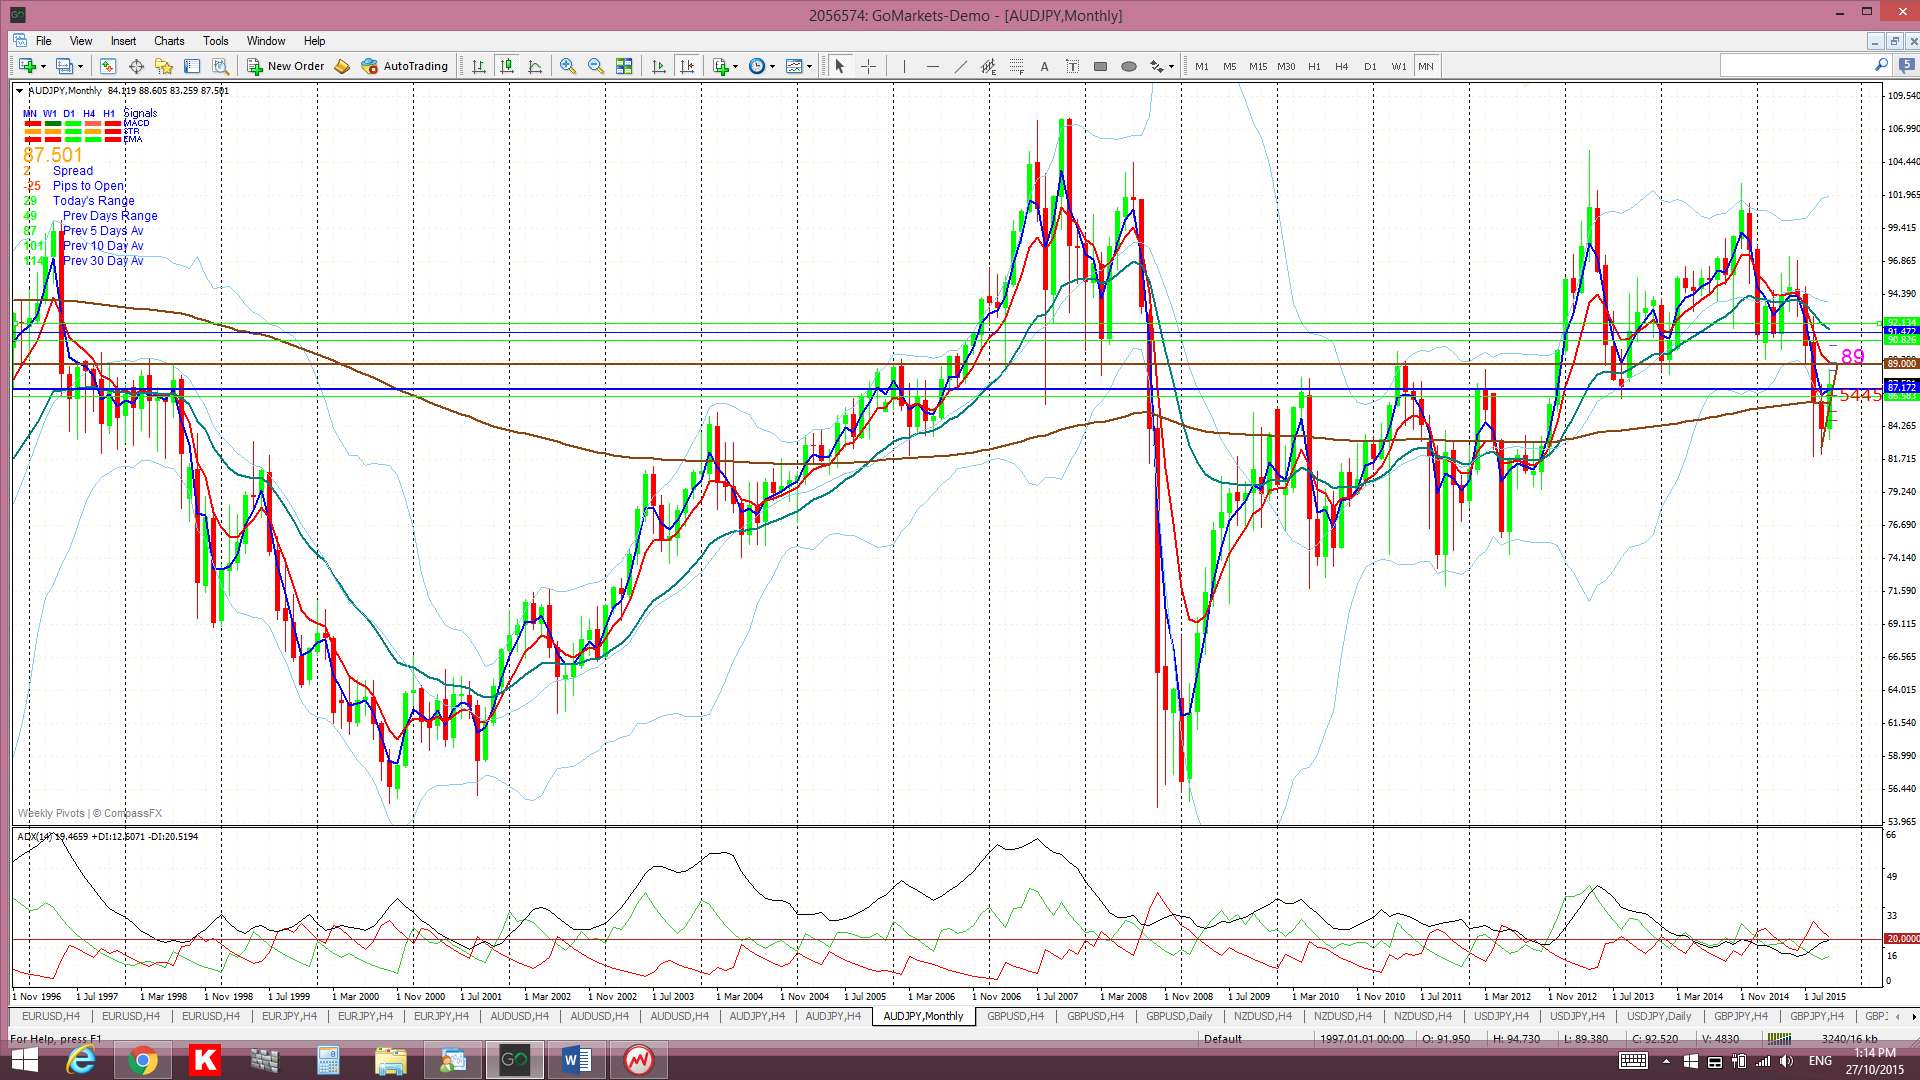
A/J monthly: the monthly chart shows a few different S/R levels but 89 is one of the major ones and the A/J is just below this at the current time.
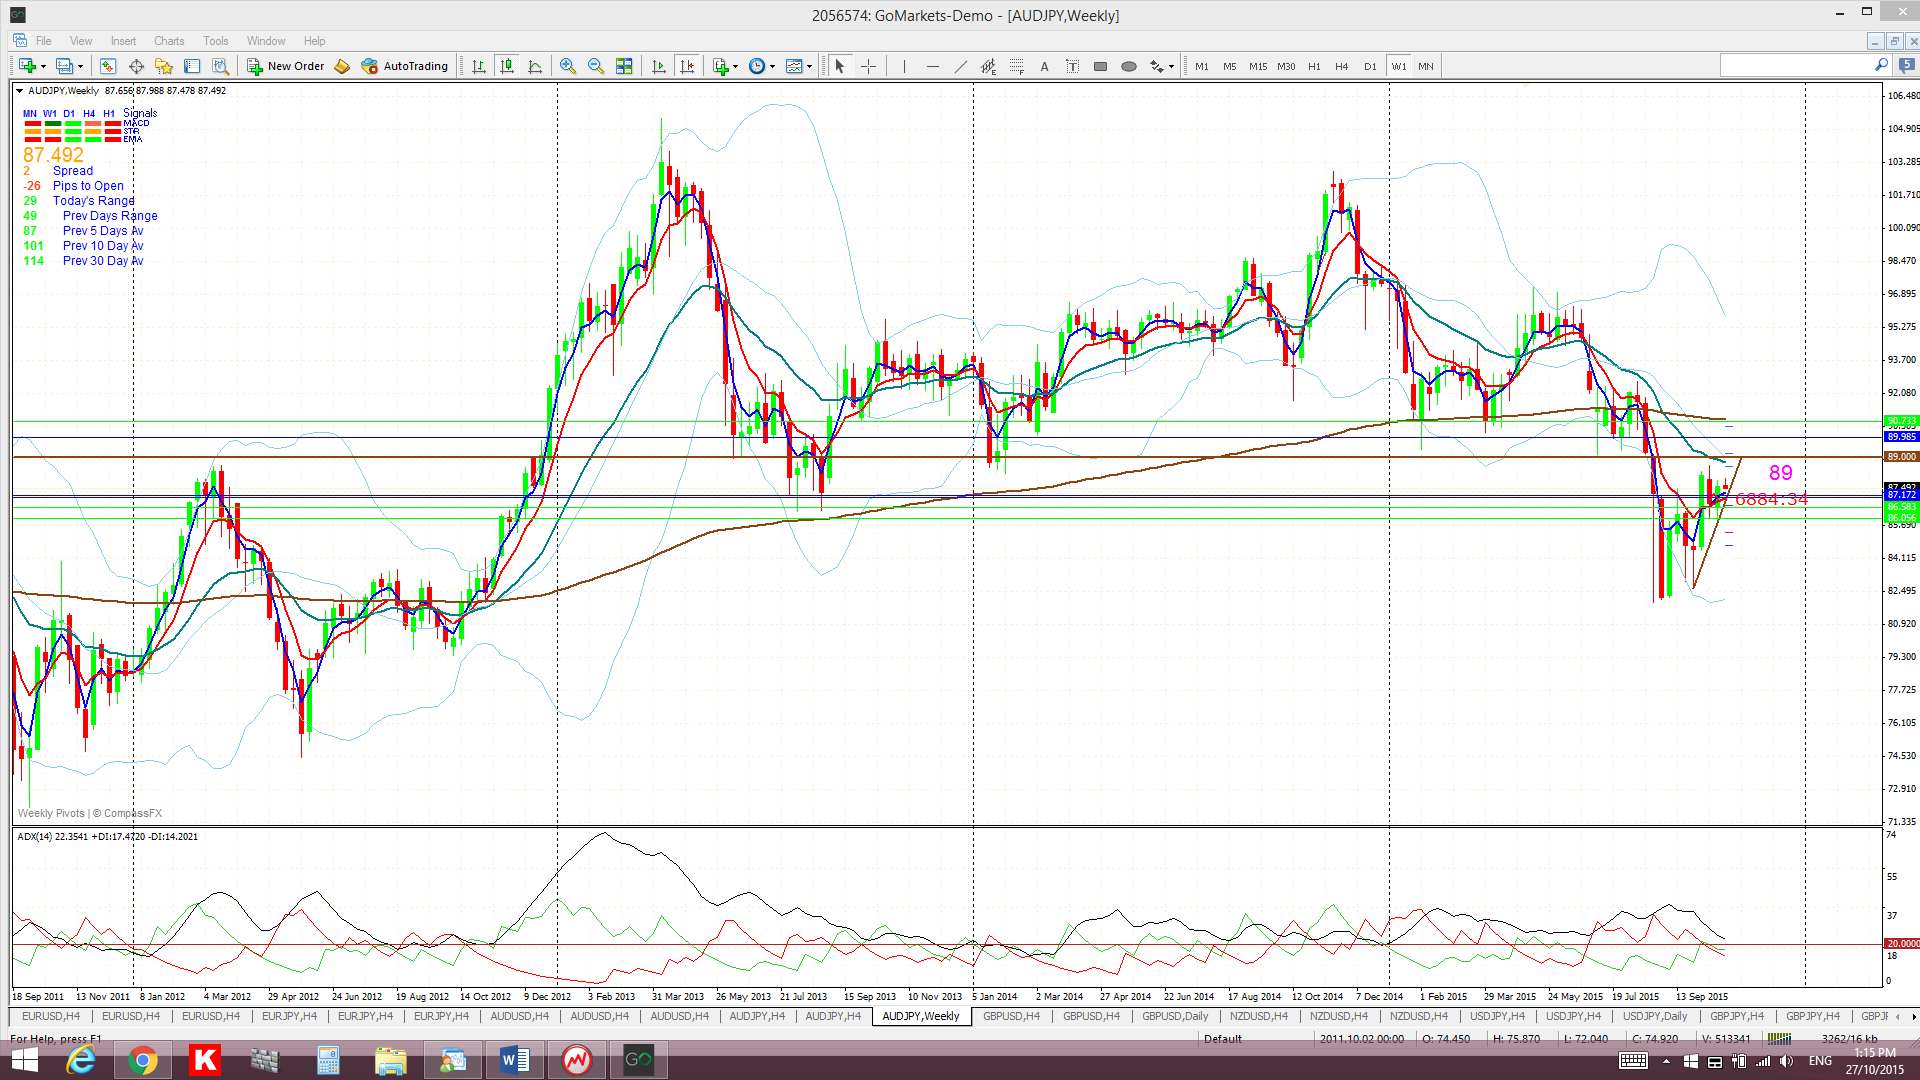
A/J weekly: the 89 has been quite a pivotal level; especially over the last fours years:
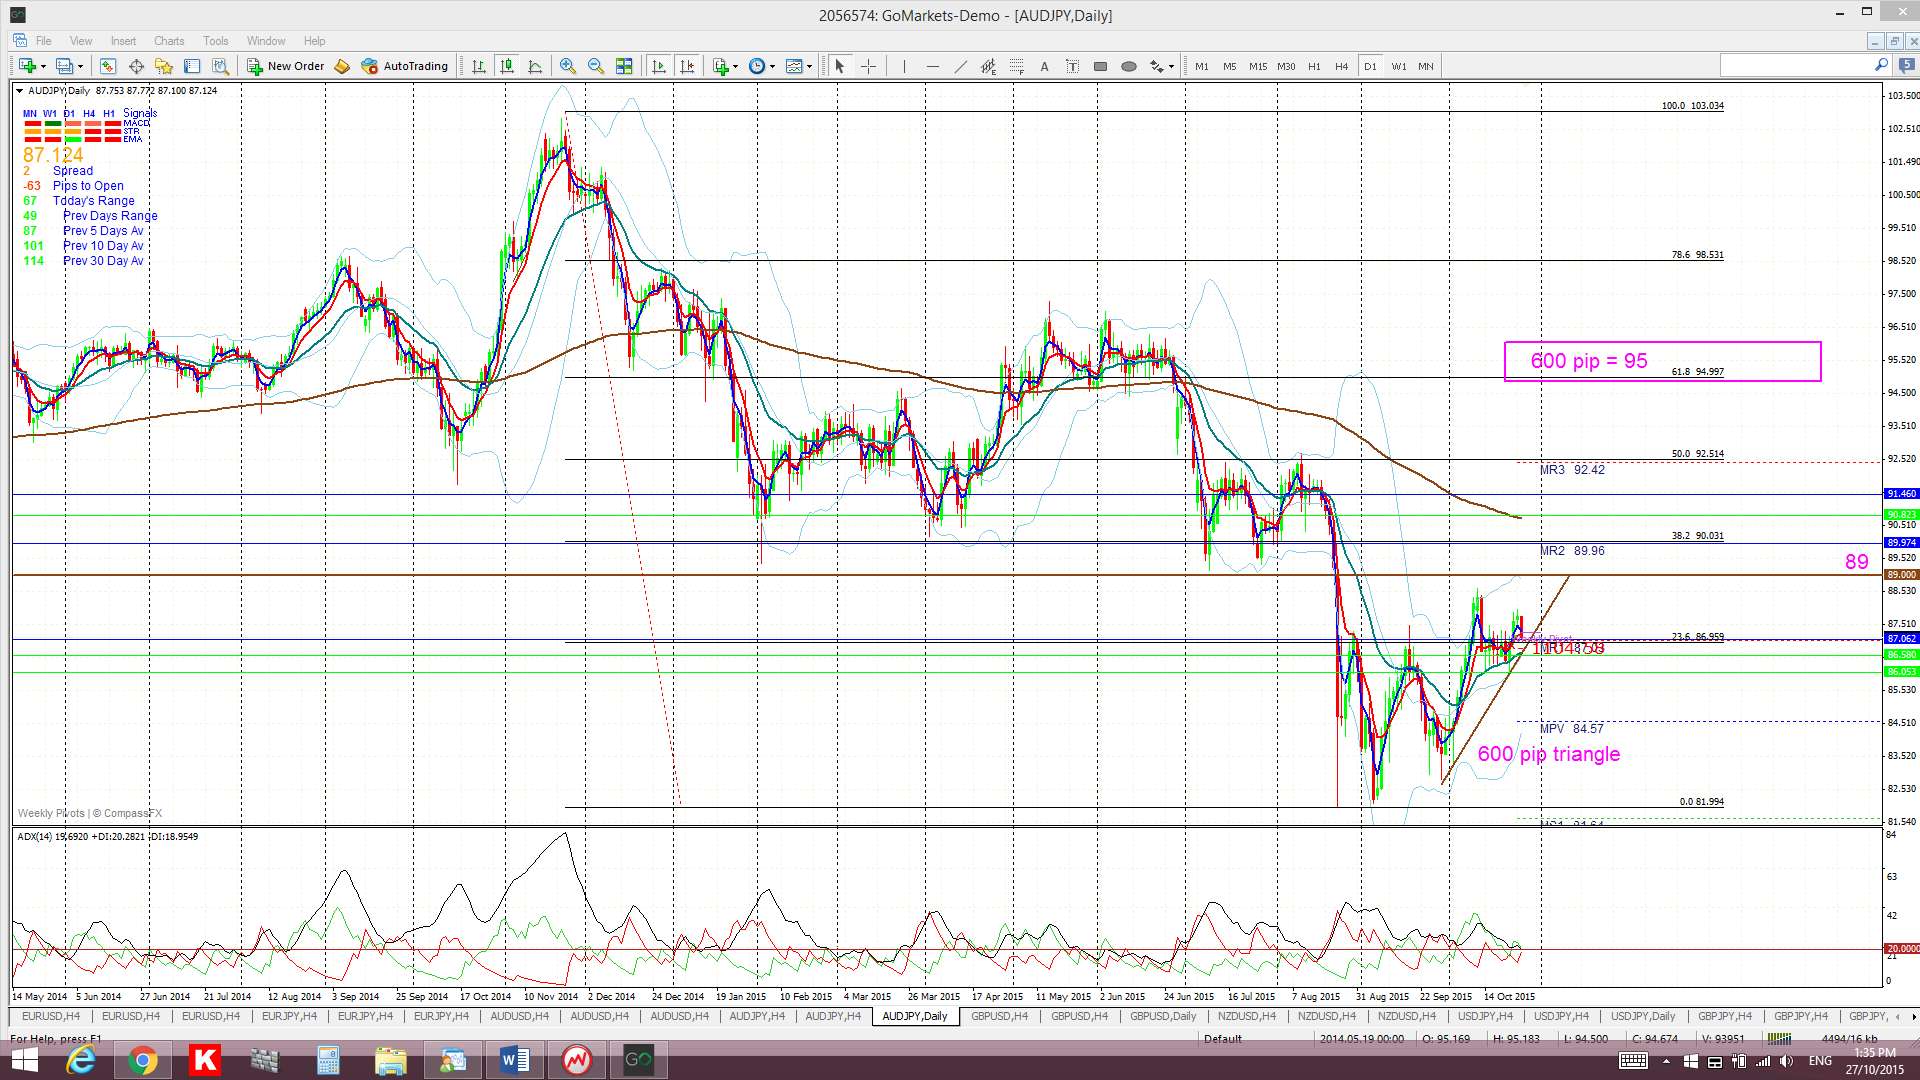
A/J daily: the 89 level looks to be the one to take out if this pair was going to try and send any ‘risk on’ signal. Note the current lack of momentum on the daily chart though, however, this is a GREAT thing. Watch for any close and hold back above 89 that evolves with an increase in momentum:

A/J 4hr: is this a bullish ascending triangle in the making? FOMC and BoJ might shape the short-term future of this pair but any break and hold back above 89 would have to be read as bullish for this pair.
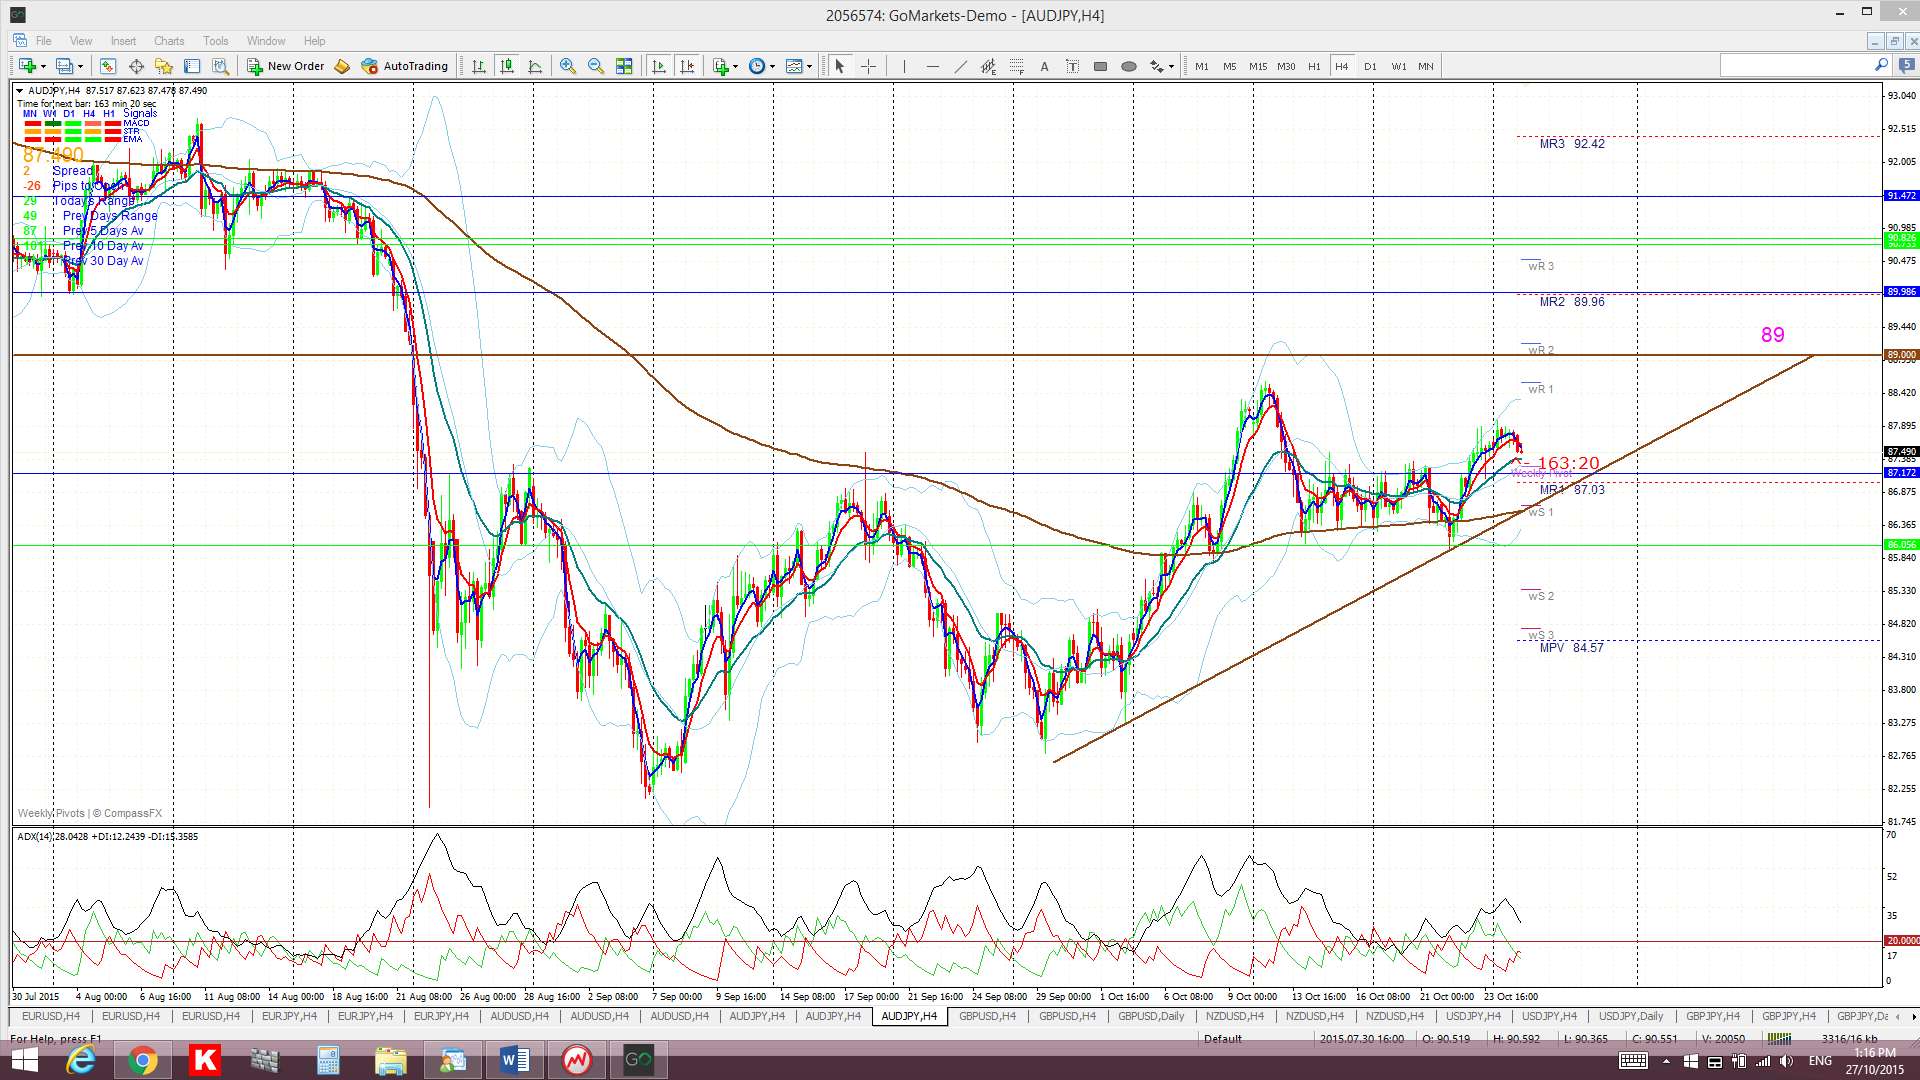
The height of the ascending triangle is 600 pips and technical theory would suggest that any bullish follow through might target an advance of 600 pips as well. This is rather interesting because if you scan up 600 pips from the 89 level you then reach the 95 whole number level which also happens to be the 61.8% fib of the recent swing low move. Now, I do like confluence like that!
Summary: Some use the AUD/JPY as a ‘risk barometer’ and, for the time being, whilst it isn’t flashing any major warning signal it is consolidating below a potentially bullish breakout level. Thus, keep an eye on the 89 level towards the end of the week once FOMC and BoJ are out of the way:
- a hold below 89 would be bearish and suggest bearish continuation.
- a break and hold above 89 would be bullish and suggest bullish continuation.
The post AUD/JPY: telling us anything? appeared first on www.forextell.com.