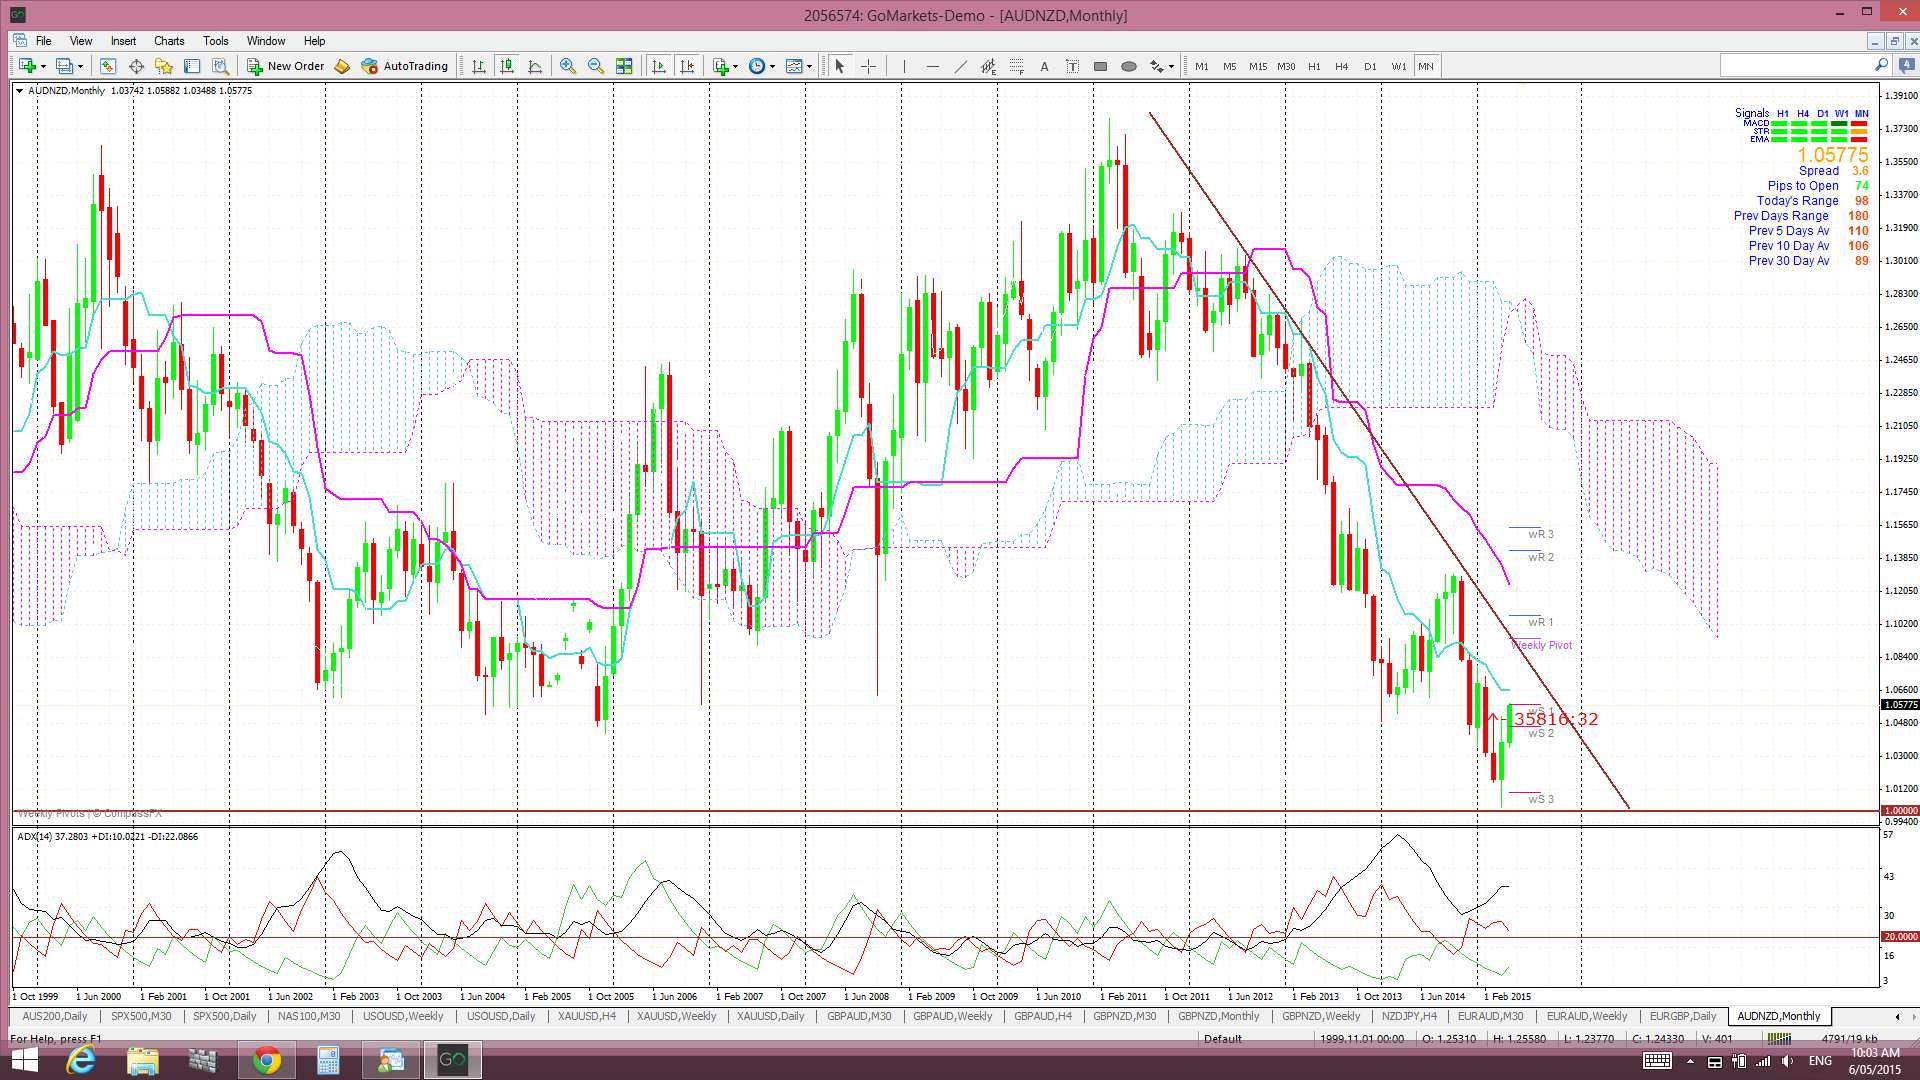
I had mentioned in my w/e analysis that the monthly chart of the AUD/NZD with its, essentially, bullish engulfing candle might be pointing towards some developing divergence between the AUD and NZD currencies. This divergence has continued so far this week and the gains on the AUD/NZD have been up to 180 pips to date. However, there is another technical level to watch now with this pair!
AUD/NZD monthly: This pair has been in a downtrend since April 2011 but the parity level has been strong support to date. Any continued bullish activity will bring a monthly chart bear trend line into focus. This is the next major level of resistance to watch on this pair:
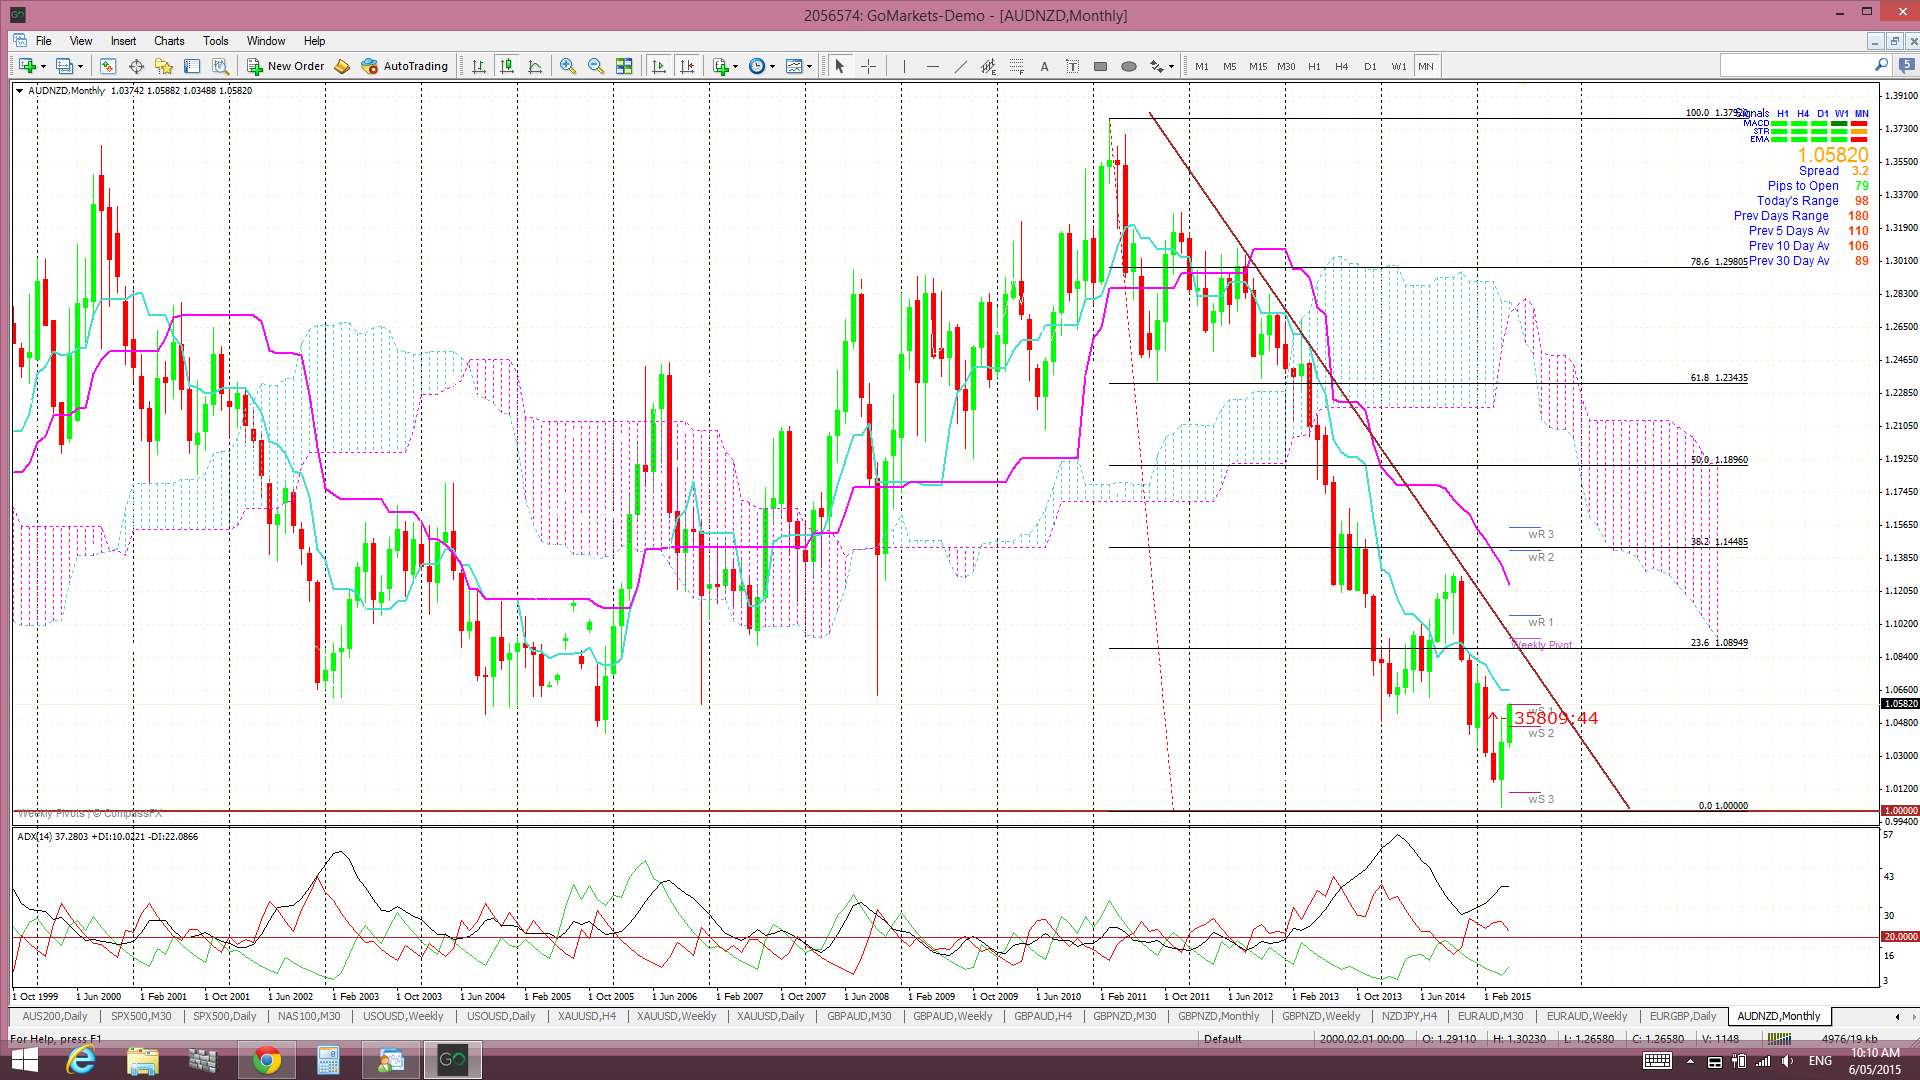
Adding Fibonacci levels to this monthly chart can help to identify profit targets IF there is any bullish continuation and trend line breakout:
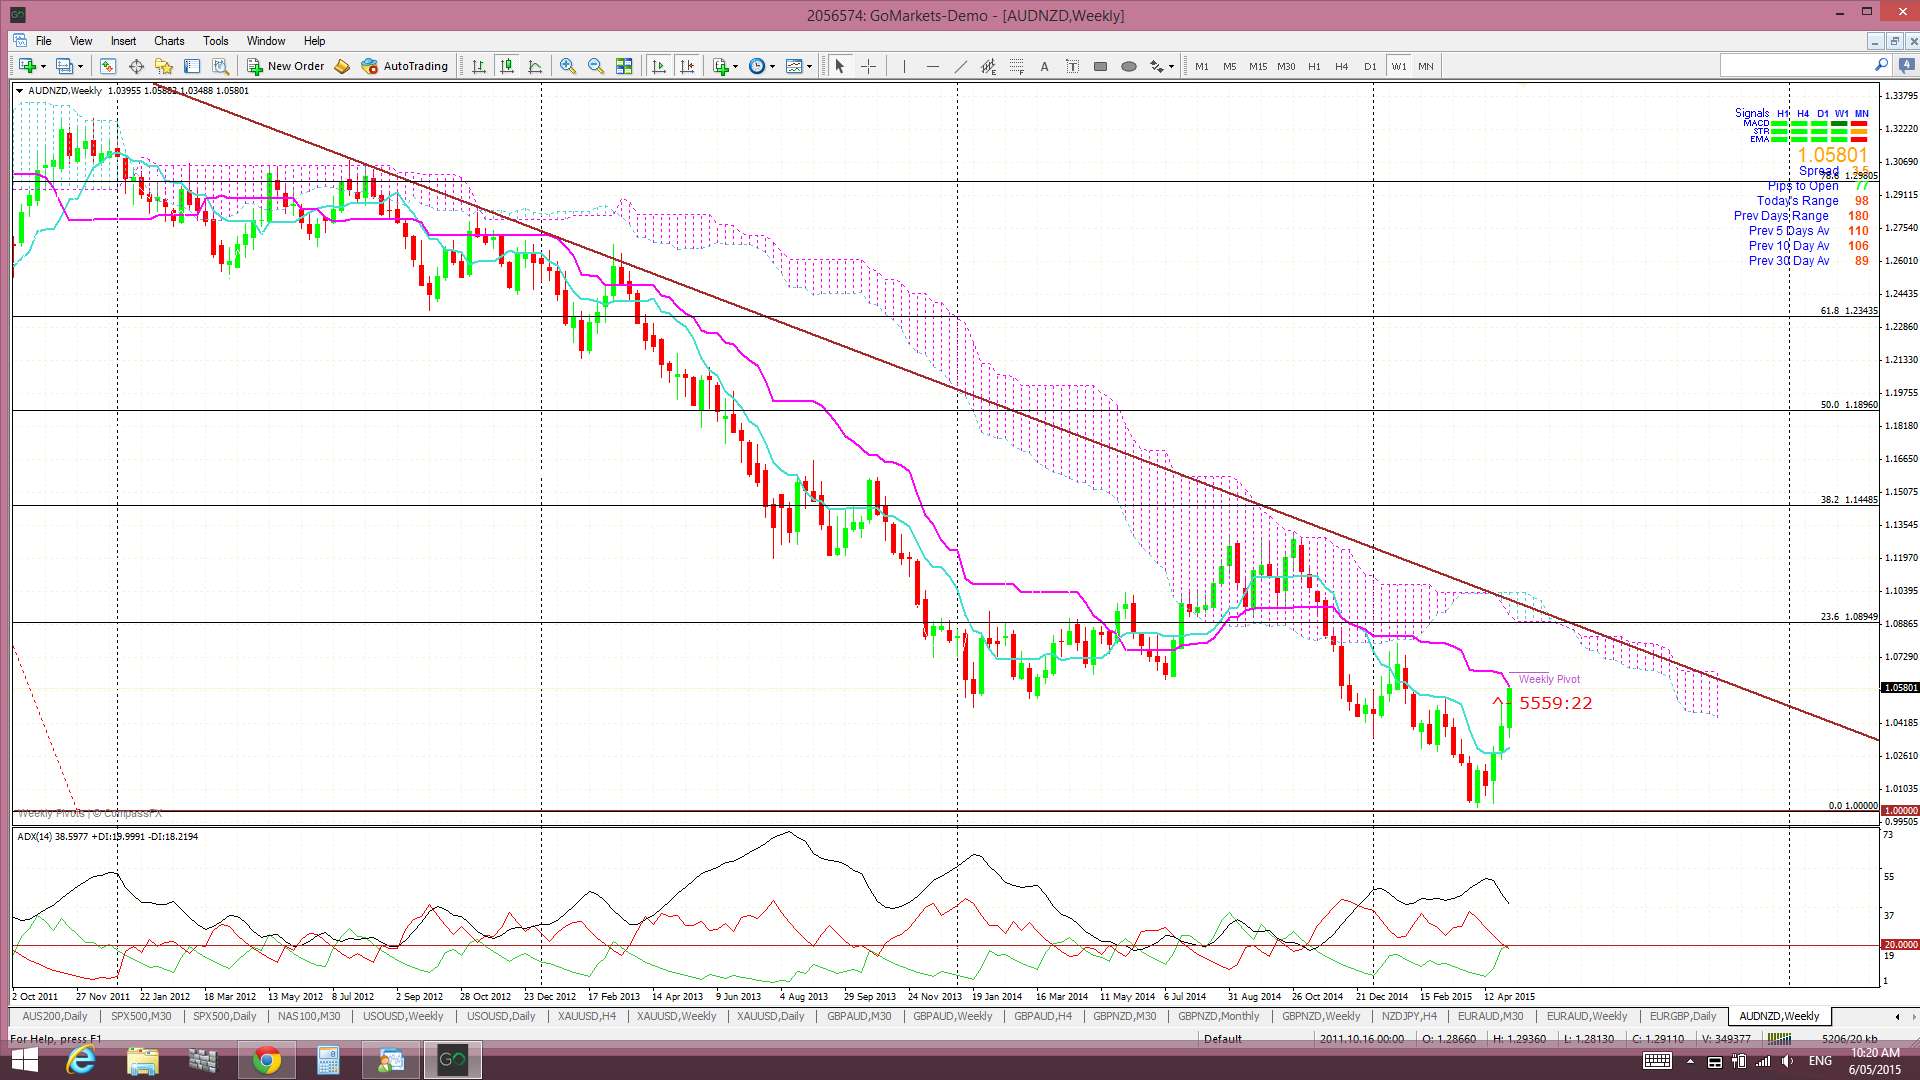
AUD/NZD weekly: the weekly chart shows that this monthly bear trend line coincides with the weekly Cloud and 23.6% Fib level. Thus, any bullish breakout above this combined resistance level would be very significant:
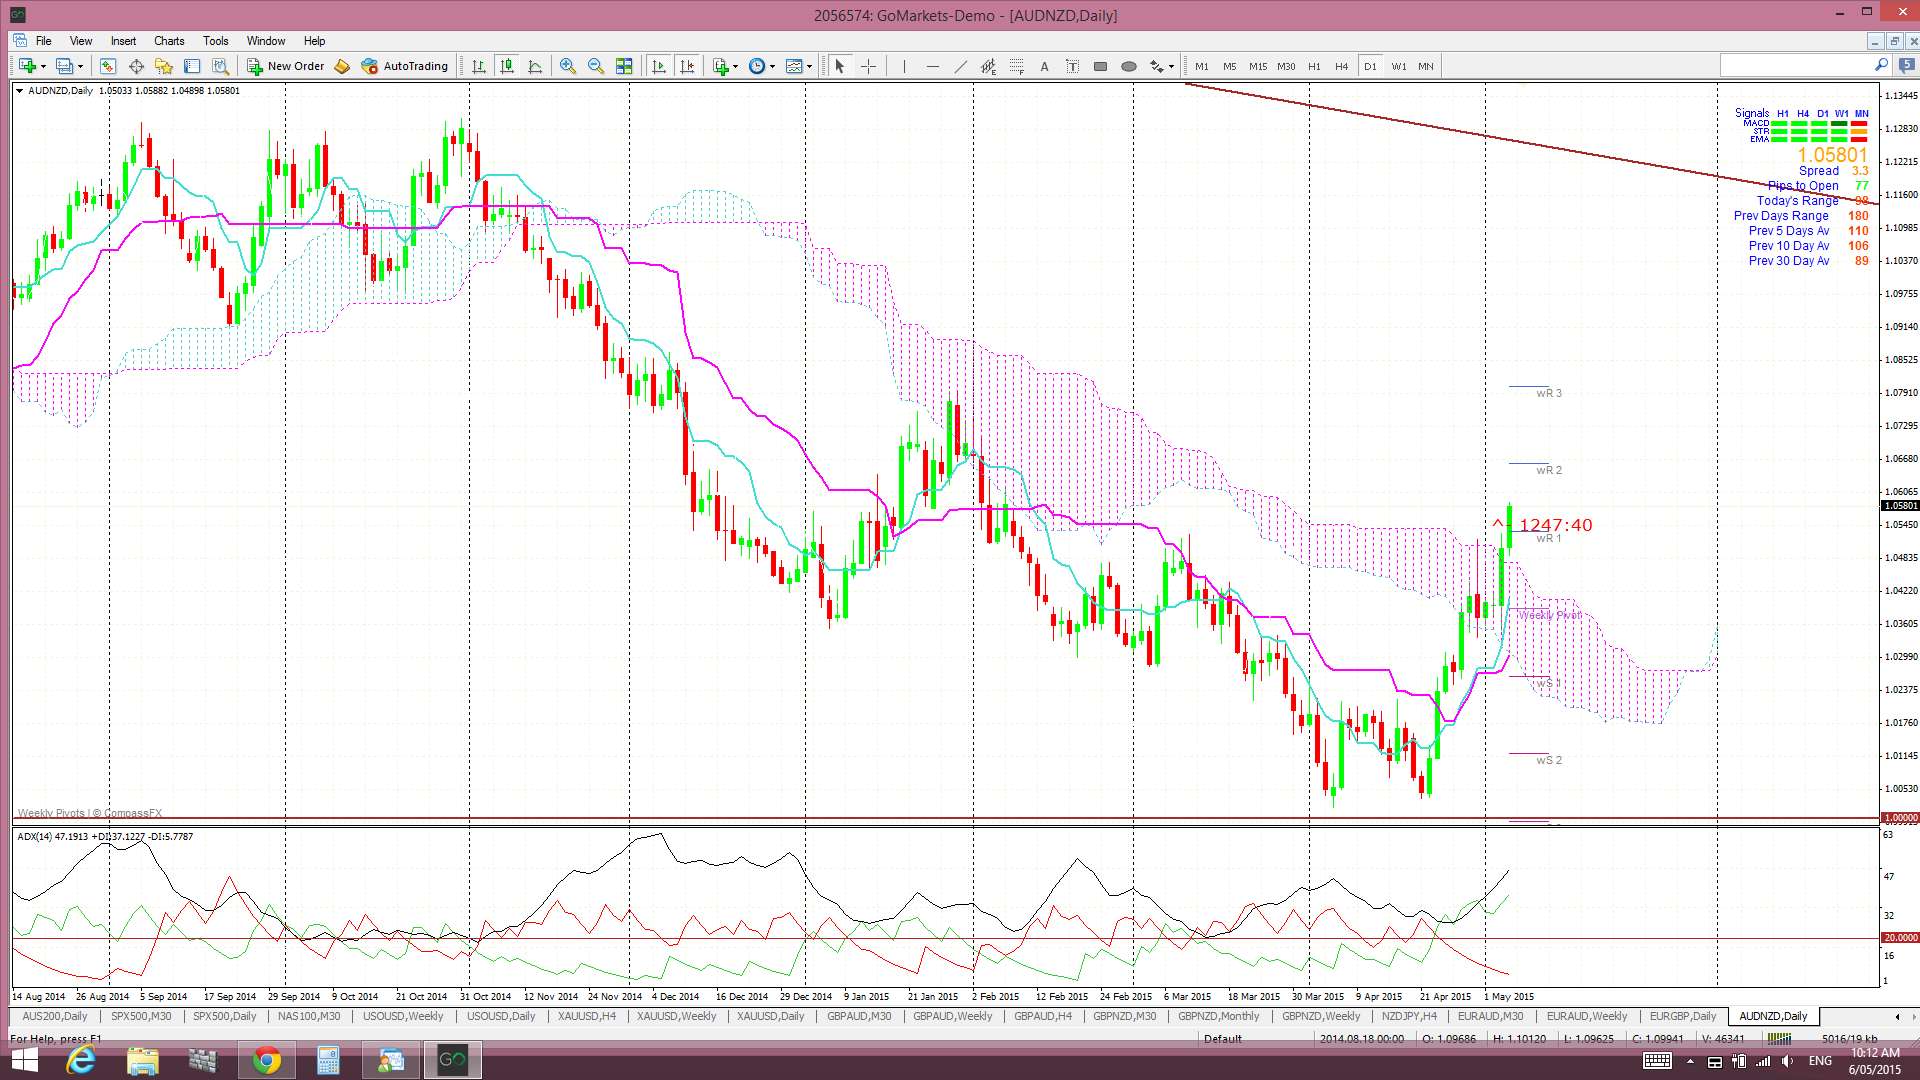
AUD/NZD daily: price is already above the daily Cloud:
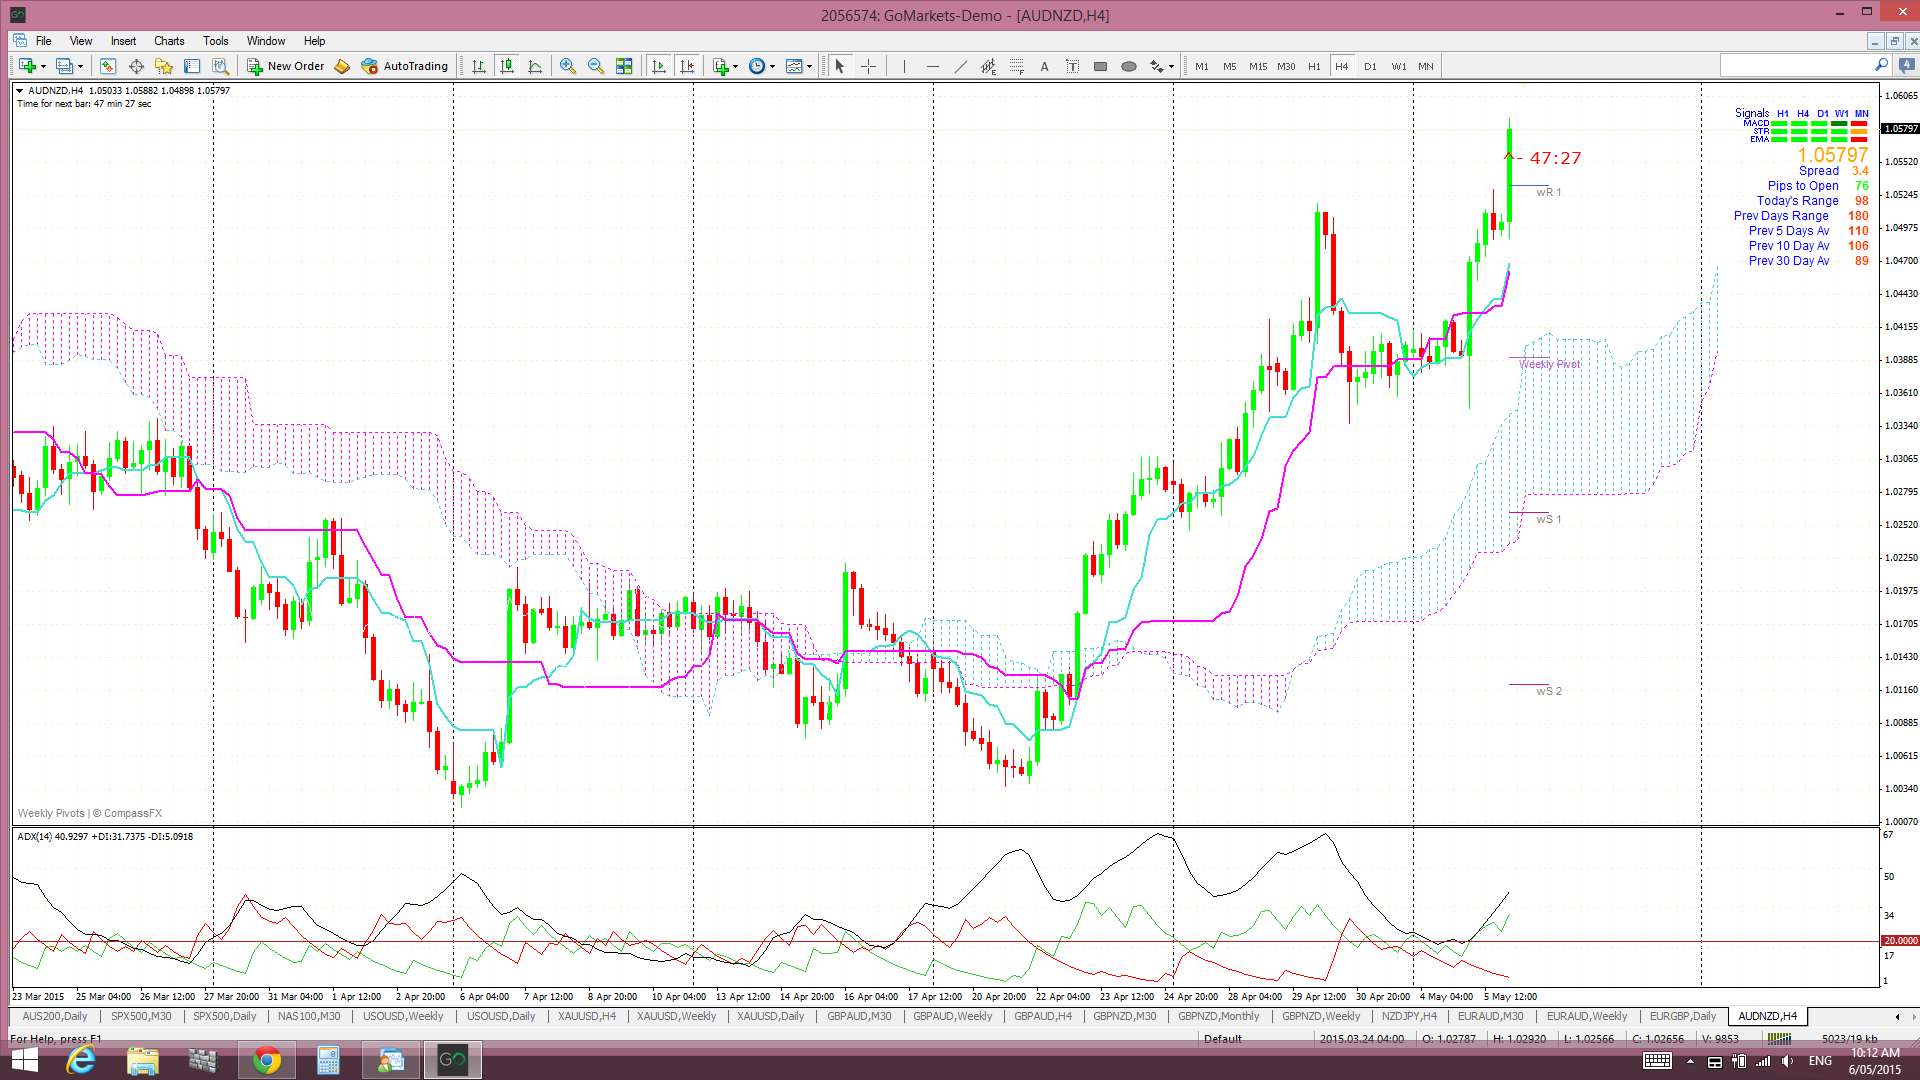
AUD/NZD 4hr: price is also already above the 4hr Cloud:
Summary: the AUD/NZD is looking bullish following the print of a monthly bullish engulfing candle. Watch for any monthly-chart bear trend line plus weekly Cloud breakout to support bullish continuation.
The post AUD/NZD: update. appeared first on www.forextell.com.