Last week: Much of last week was choppy even before the SNB activity on Thursday. Until then I had only two signals: on the U/J and later on the A/U. The U/J came with an eventual triangle break and gave up to 150 pips before closing off. The A/U chopped sideways and has now closed off for no real loss. Following SNB activity on Thursday though there was a new TC signal on the E/U and Gold and both are still open.
It is quite an understatement to say that the SNB intervention caught traders off guard as most would have had their eyes focused on next weeks scheduled ECB news. This unscheduled SNB activity triggered some wild swings but the market action, both before and after this news, was not conducive to the development of strong, ordered momentum trend moves and TC signals anyway. I am hoping this may evolve once next week’s ECB update is out of the way.
This week:
The USD index has managed a bullish weekly close up through the major S/R level of 92.50:
USDX weekly chart:
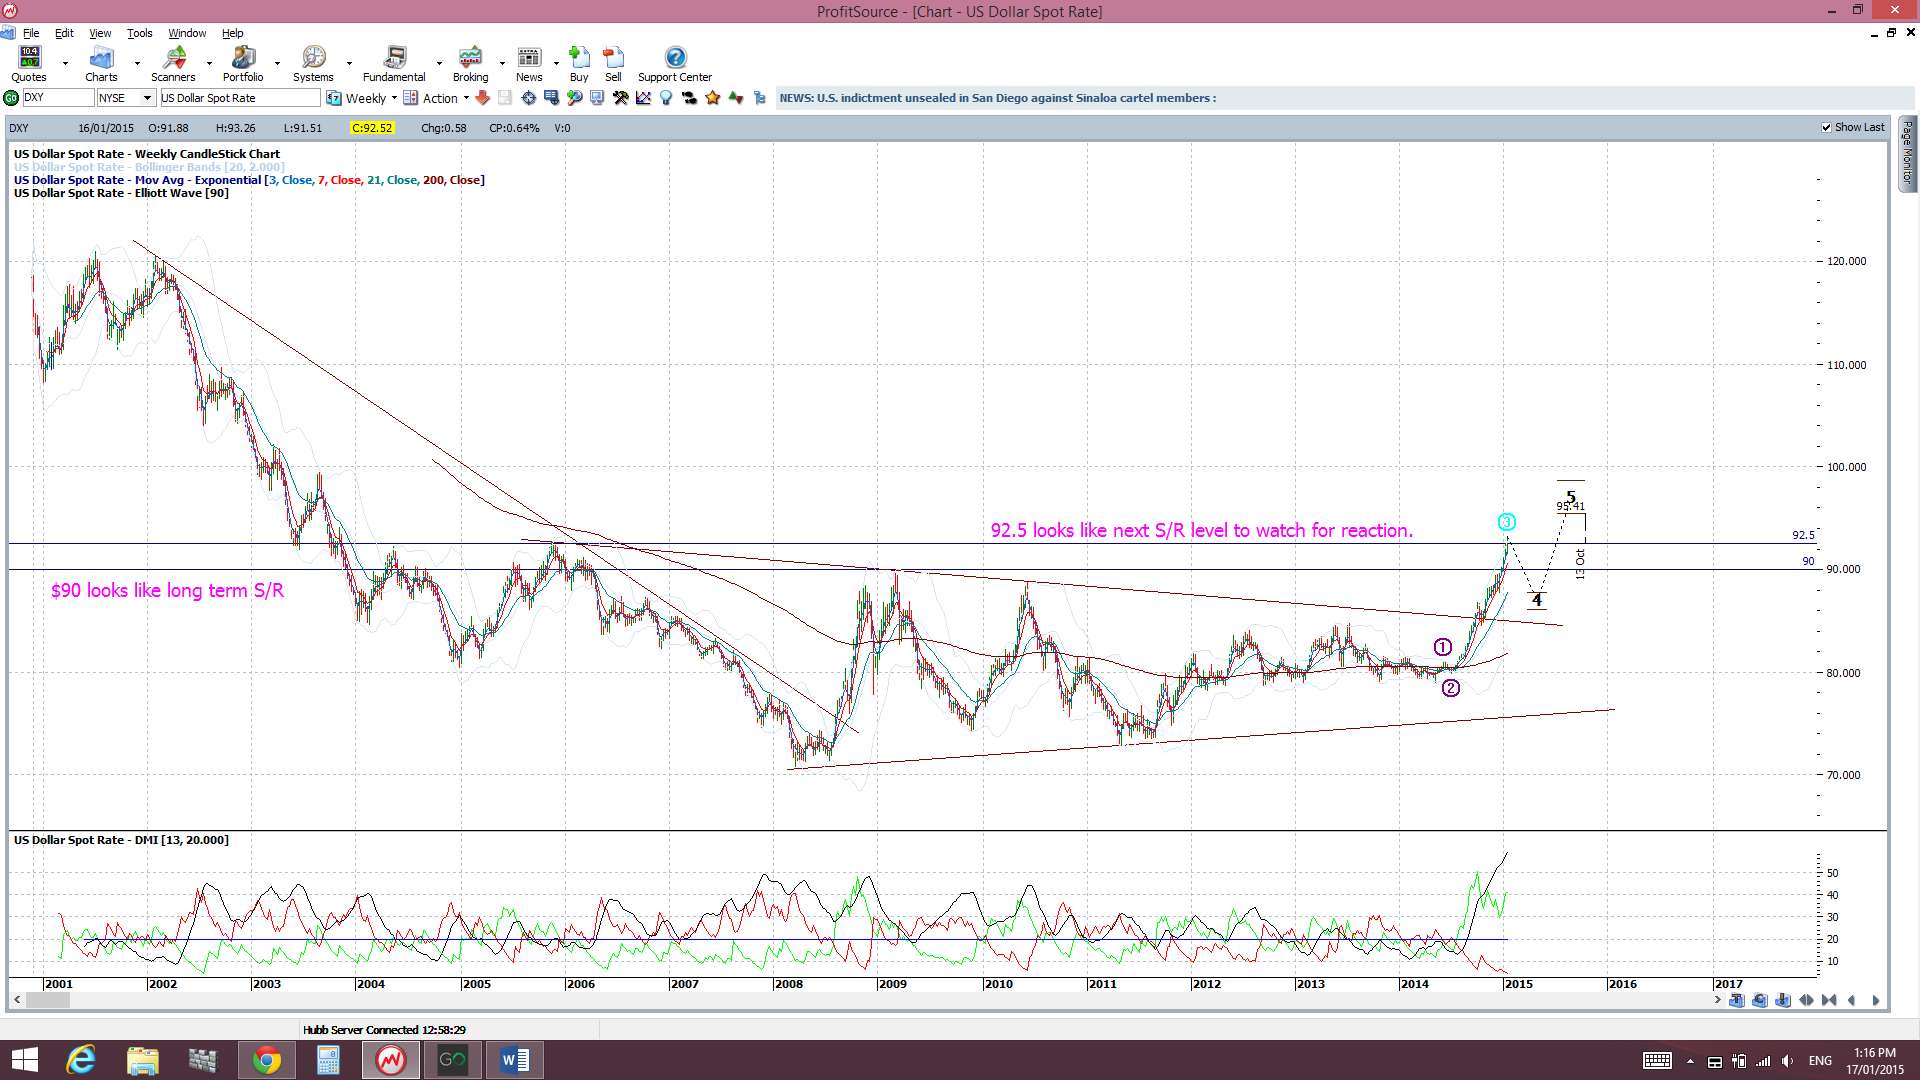
Friday’s US CPI miss however has been cited as potentially problematic for the Fed with the timing of any new US interest rate increase. Could this 92.50 S/R juncture on the USDX and the fear of deflation be the catalyst to trigger a pull back on the USDX? The next FOMC is not for another week, Wed 28th Jan, and it may take until then for there to be any clarity with US interest rates. Either way, the weekly close above 92.50 was a significant achievement for the USDX and is worth keeping in mind as many FX pairs trade at significant ‘make or break’ levels.
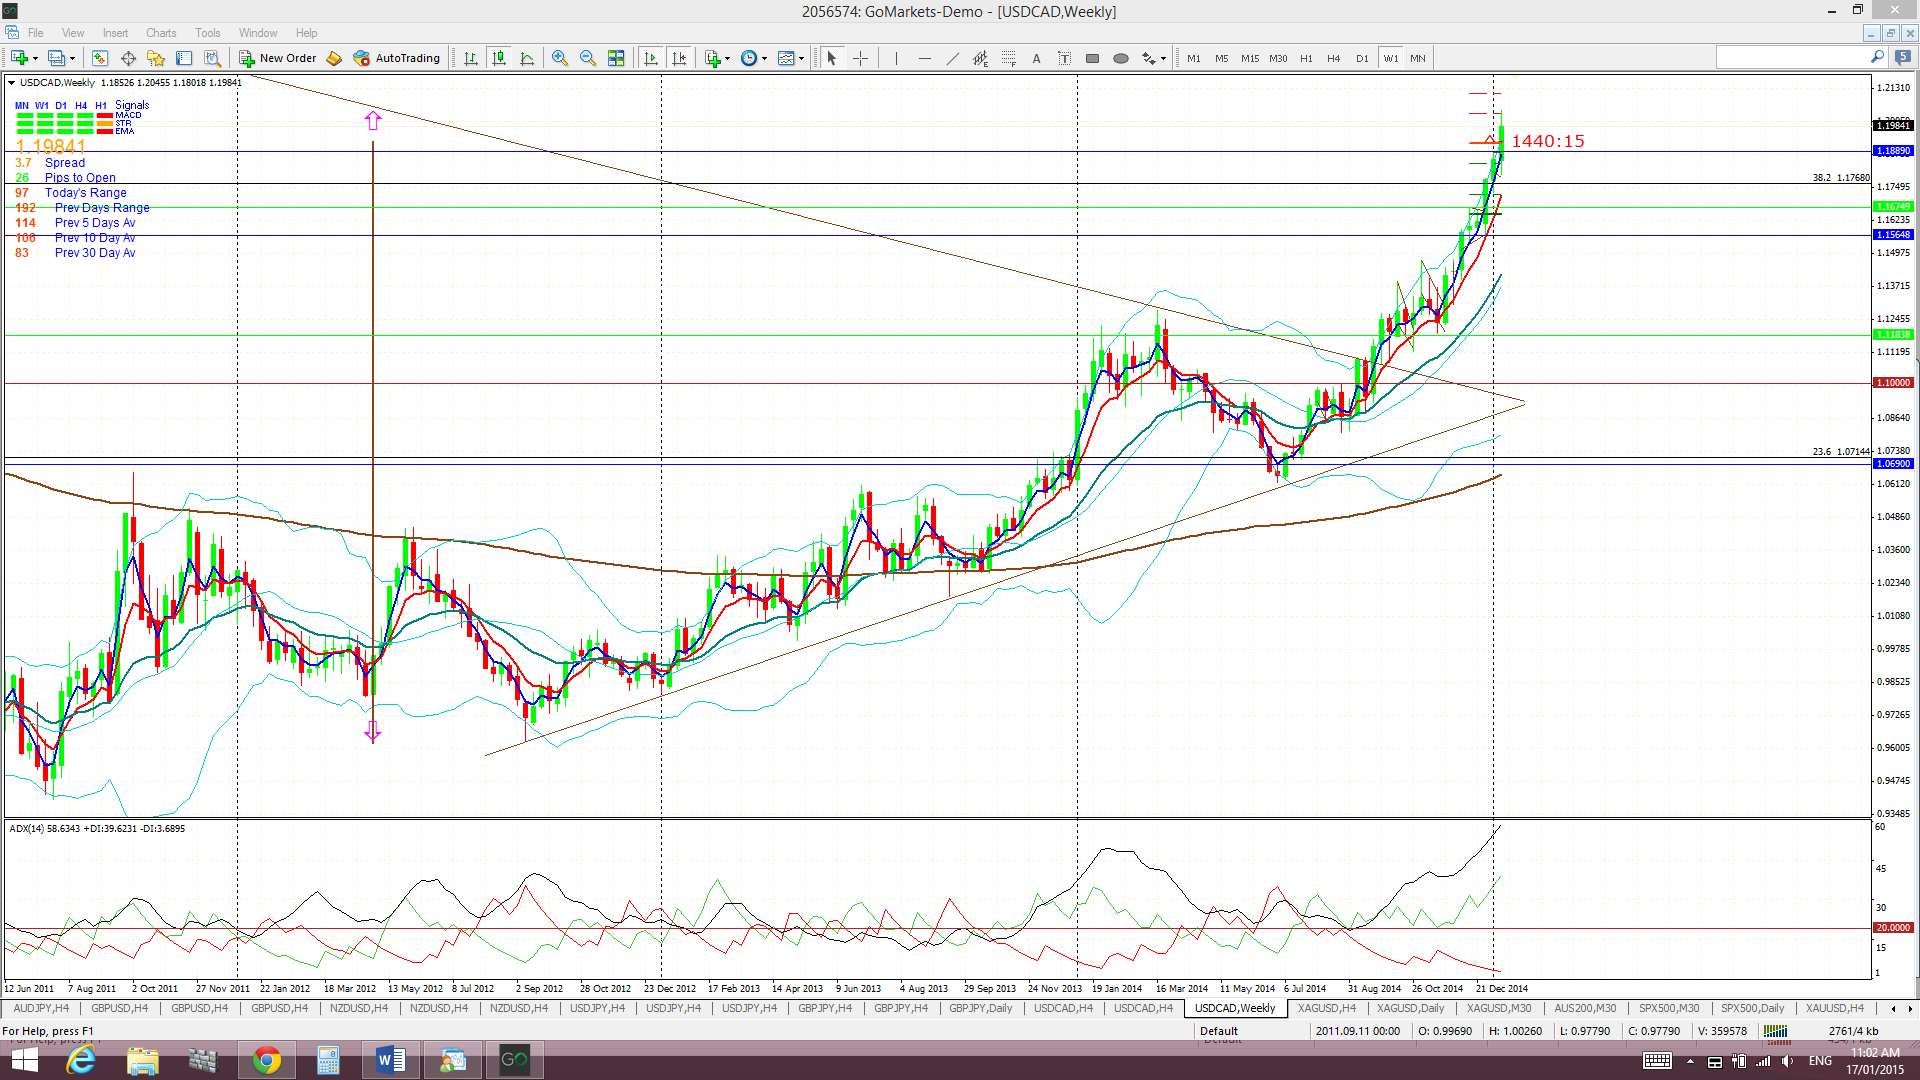
- USD/CAD: is still trading above the monthly 200 EMA and continues on its 2,500 pip triangle breakout.
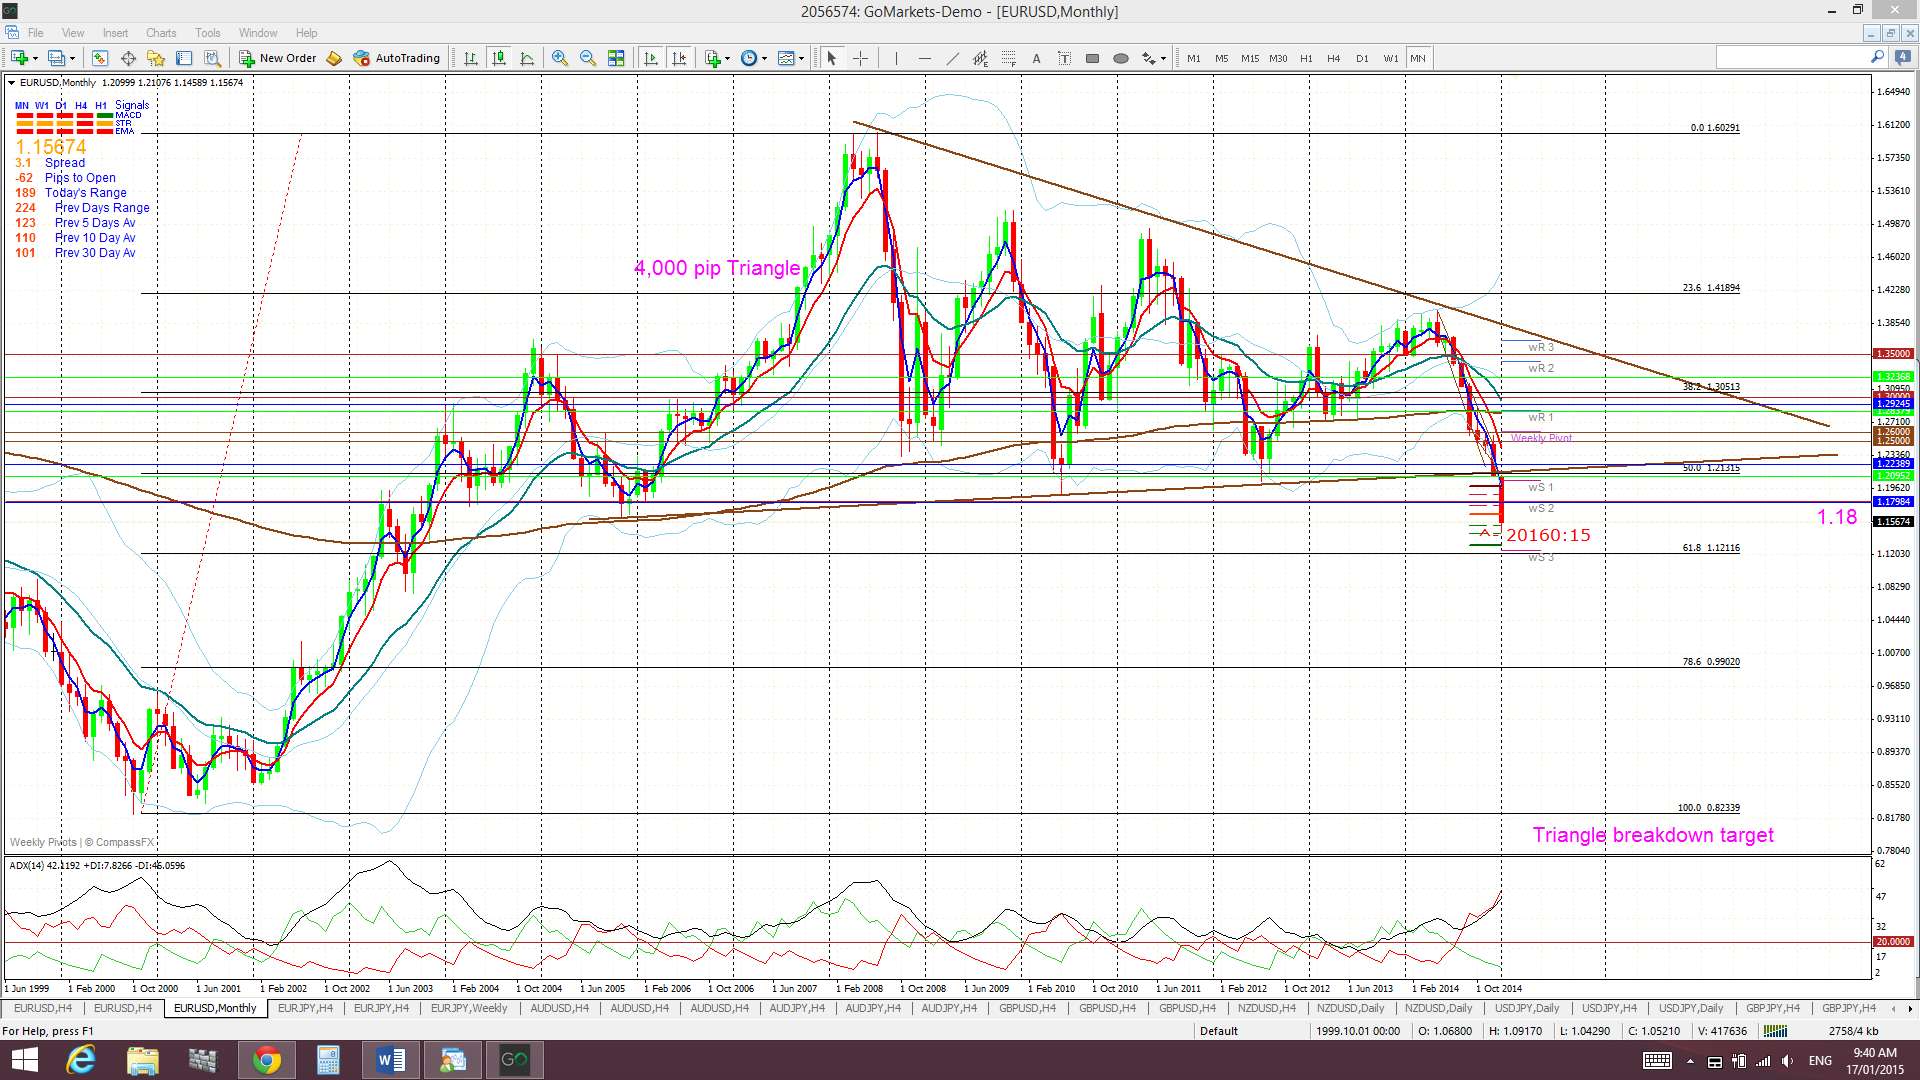
- EUR/USD: has now made a weekly close below major 1.18 support and this might lead to the start of a 4,000 pip triangle breakout move?
- AUD/USD: The previous weekly bullish engulfing candle, the first such bullish candle for seven weeks, was on the money and this pair has closed the week with a bullish, albeit small, candle above 0.82. More significantly though, price has closed up and out of a recent trading range (0.80 – 0.82) in spite of a stronger USD. I note w/e reports of further Chinese stimulus so will this trigger a bounce from here? Any move back below 0.80 might start a new 600 pip Bear Flag however so this 0.80 – 0.82 range remains in focus.
- NZD/USD: This pair is still stuck in a 3 month-duration trading channel and so where to from here given the stronger USD?
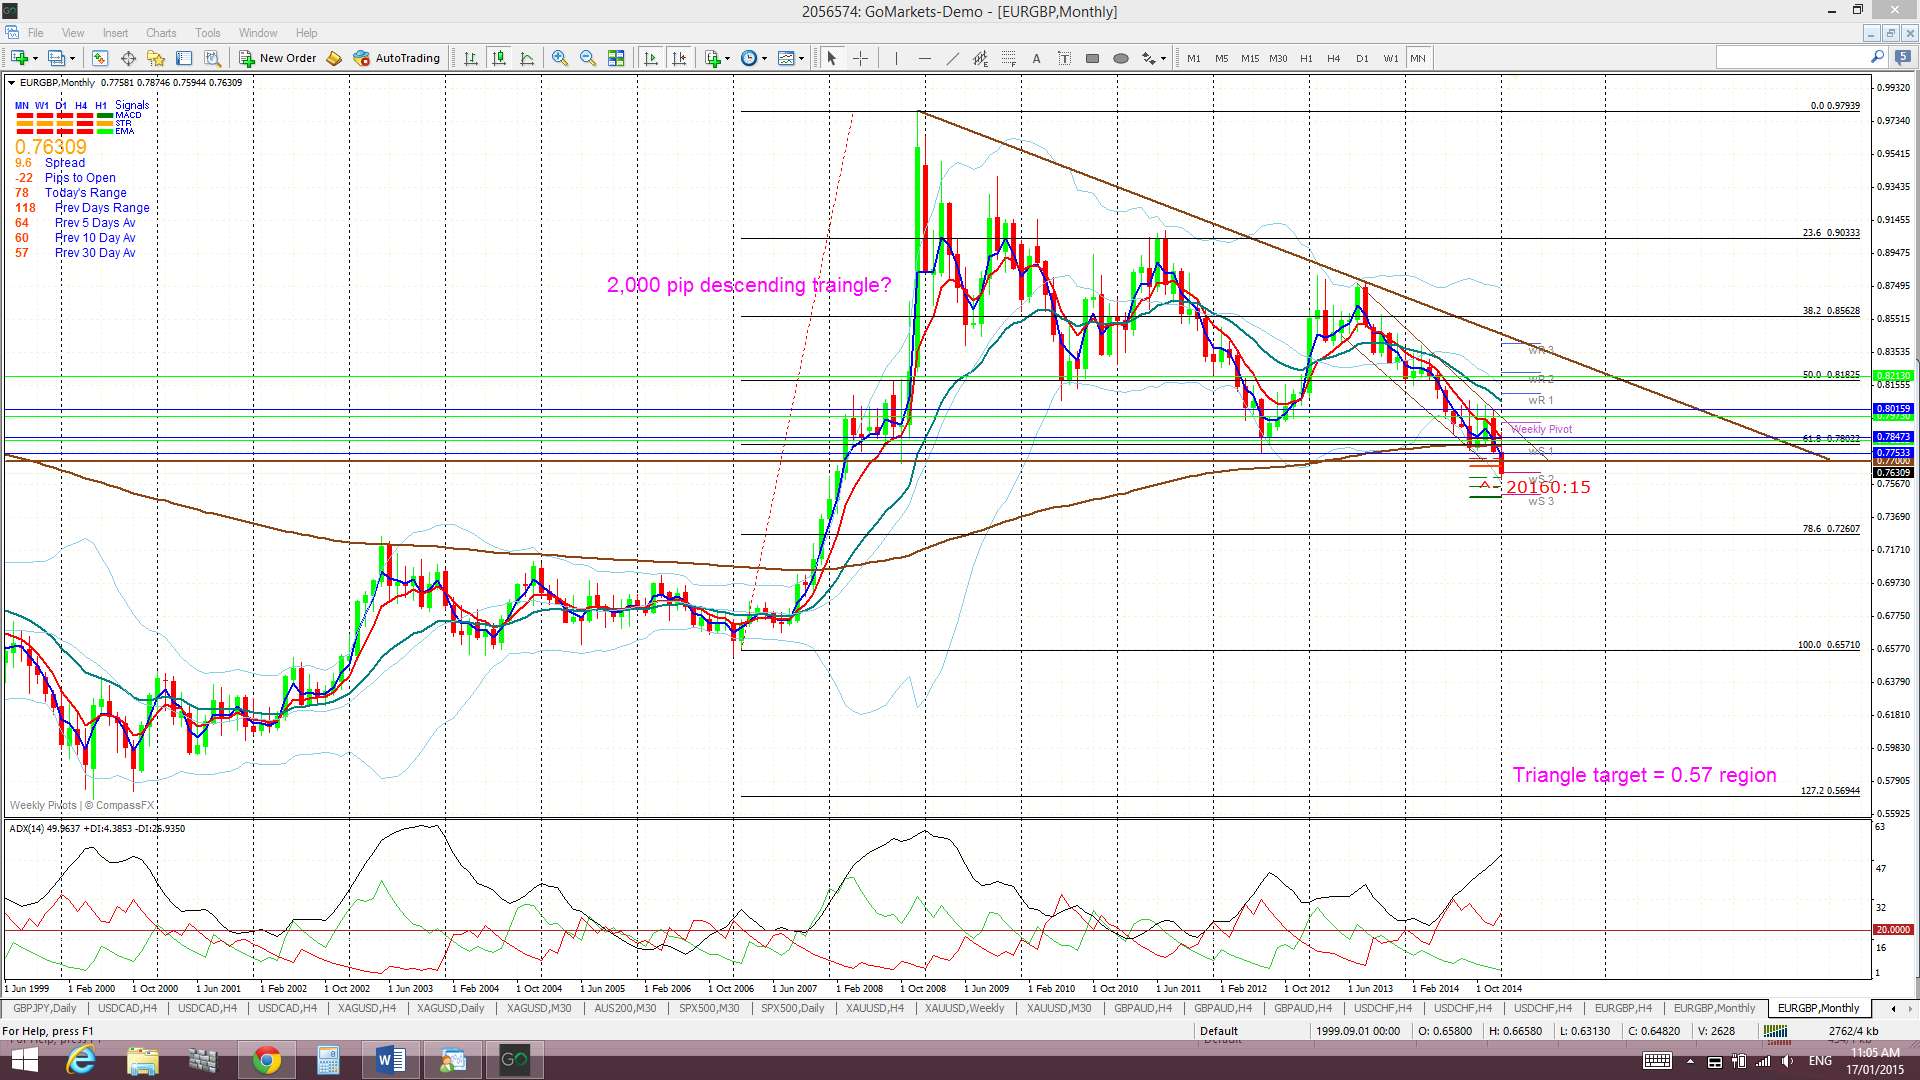
- EUR/GBP: This has made a weekly close below key 0.77 support. Will this lead to a 2,000 pip triangle breakdown?
It is a major news week this week with three central banks releasing interest rate updates, the BoJ, BoC and ECB, with the ECB being the most anticipated of these events. It is expected that the ECB will announce plans for further QE stimulus and this news has the potential to trigger large moves with FX pairs. Details about the timing and size of any such QE package are keenly awaited.
Gold and Silver have been giving off a few bullish signals recently. They both printed bullish engulfing candles for the month of December and both have now just printed bullish weekly candles that closed up through significant bear trend lines. It’s not hard to see why these two commodities are appreciating despite the stronger USD. The prospect of further ECB easing, fear of EZ fragility, Greek elections, geo-political issues and the recent SNB activity are helping to support these two commodities. Both are looking like they have carved out a base following a lengthy decline and could be in for a bullish reversal. I wrote a separate article about Gold and Silver (stocks, ETFs and Futures) that can be found through this link.
As noted last week, the collapsing of Oil price is continuing to generate a lot of uncertainty across stock markets. Oil is approaching a key support level though now as it nears $40 and any pause with price action could translate into positive sentiment for stocks. Still something to bear in mind.
Monday is a US holiday.
Events in the Ukraine and the Middle East, as well as with Ebola, continue to have the potential to undermine any developing ‘risk’ appetite and need to be monitored.
Stocks and broader market sentiment:
The four major US stock indices, S&P500, DJIA, NASDAQ and Russell 2000, all printed bearish weekly candles and are still forming up with bearish monthly candles. The rate of decline with the Oil price has slowed as $40 support looms and there was even a small bullish candle printed last week. This may give some hope to stocks in coming sessions.
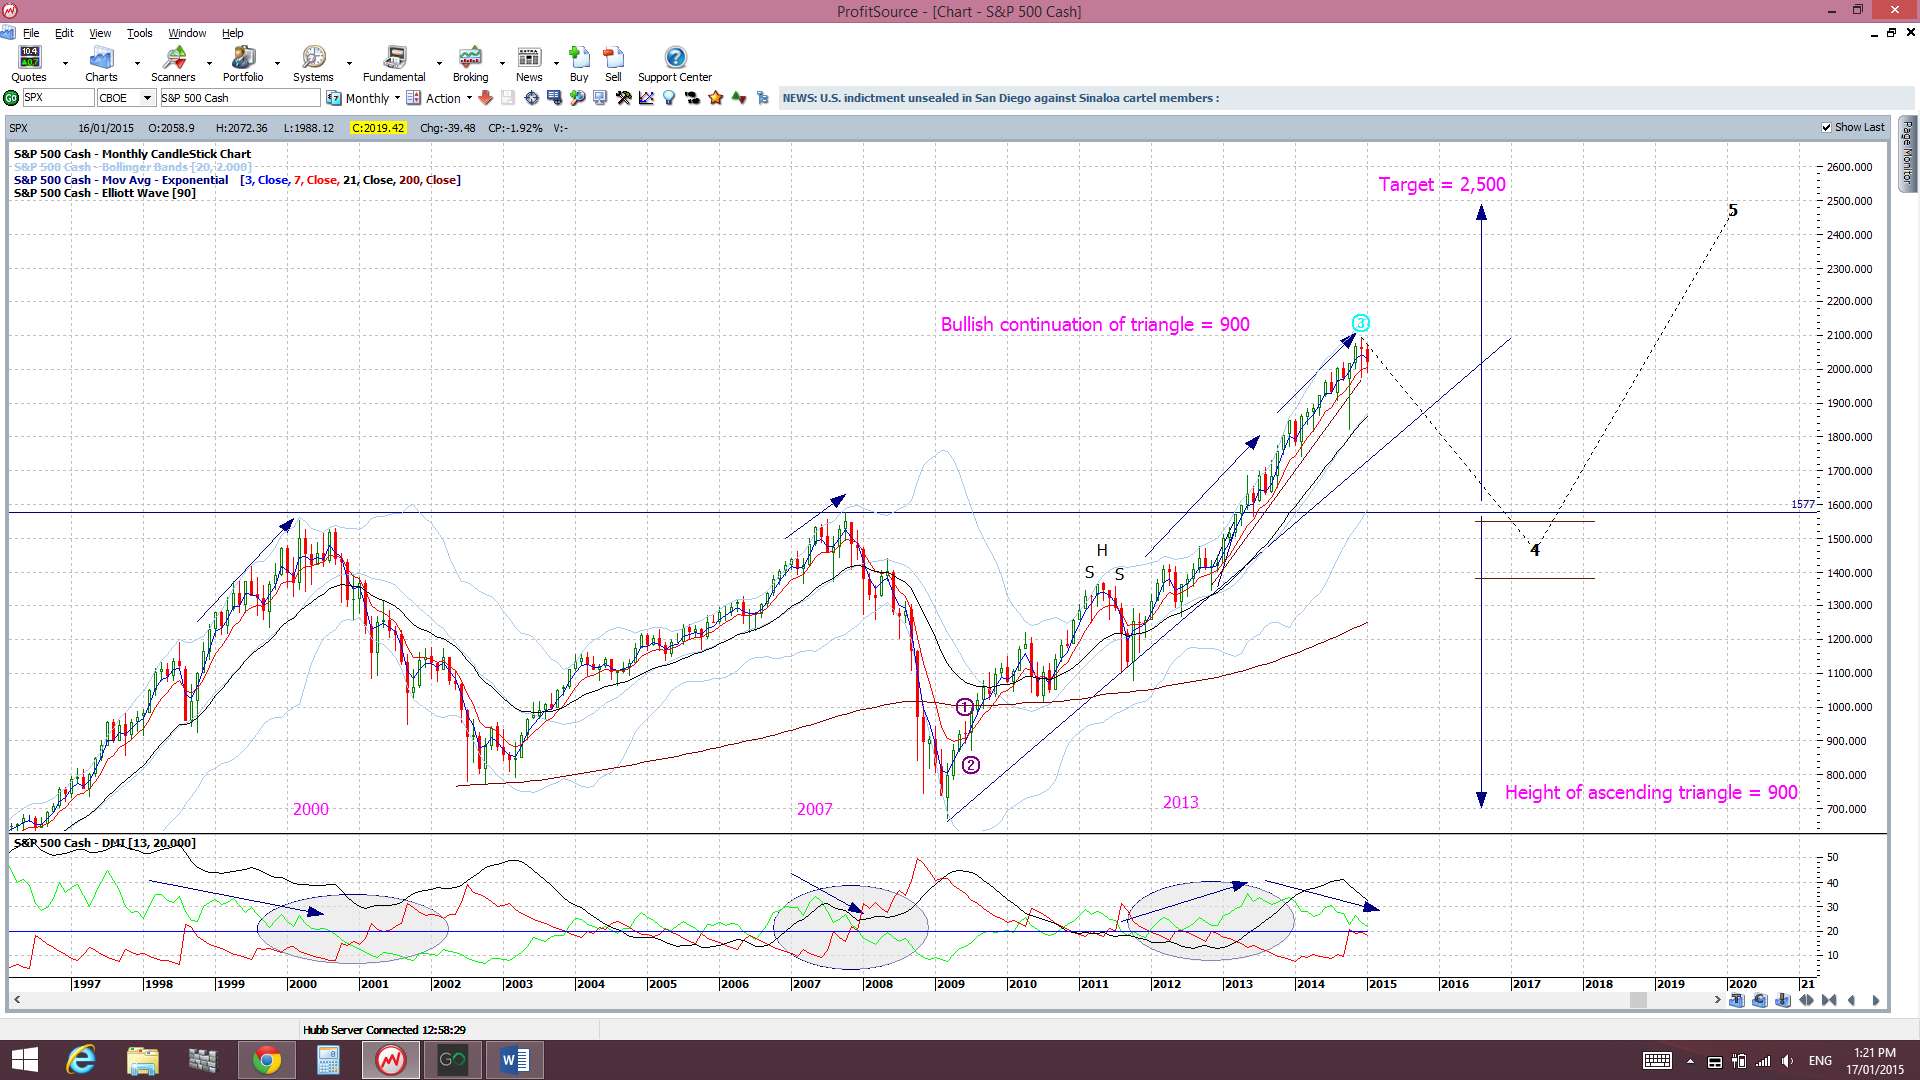
I am still seeing divergence on the monthly S&P500 monthly chart however and whilst this might just be warning of a pause, as the index navigates these new highs up circa 2000, the chance of a pullback cannot be ruled out either. There has not been any real deep pull back since the break up through the 1,577, 1,600, 1,700 and 1,800 levels and the major break of the 1,577 level was only tested once.
Thus, with all of this, I continue to watch out for further clues as to any new momentum move, long or short though! In particular I’m looking out for:
S&P500 daily chart: The index managed to close the week above the psychological 2,000 level and is above the daily trend line but a test of 1,900 might be on here as this level interacts with daily support.

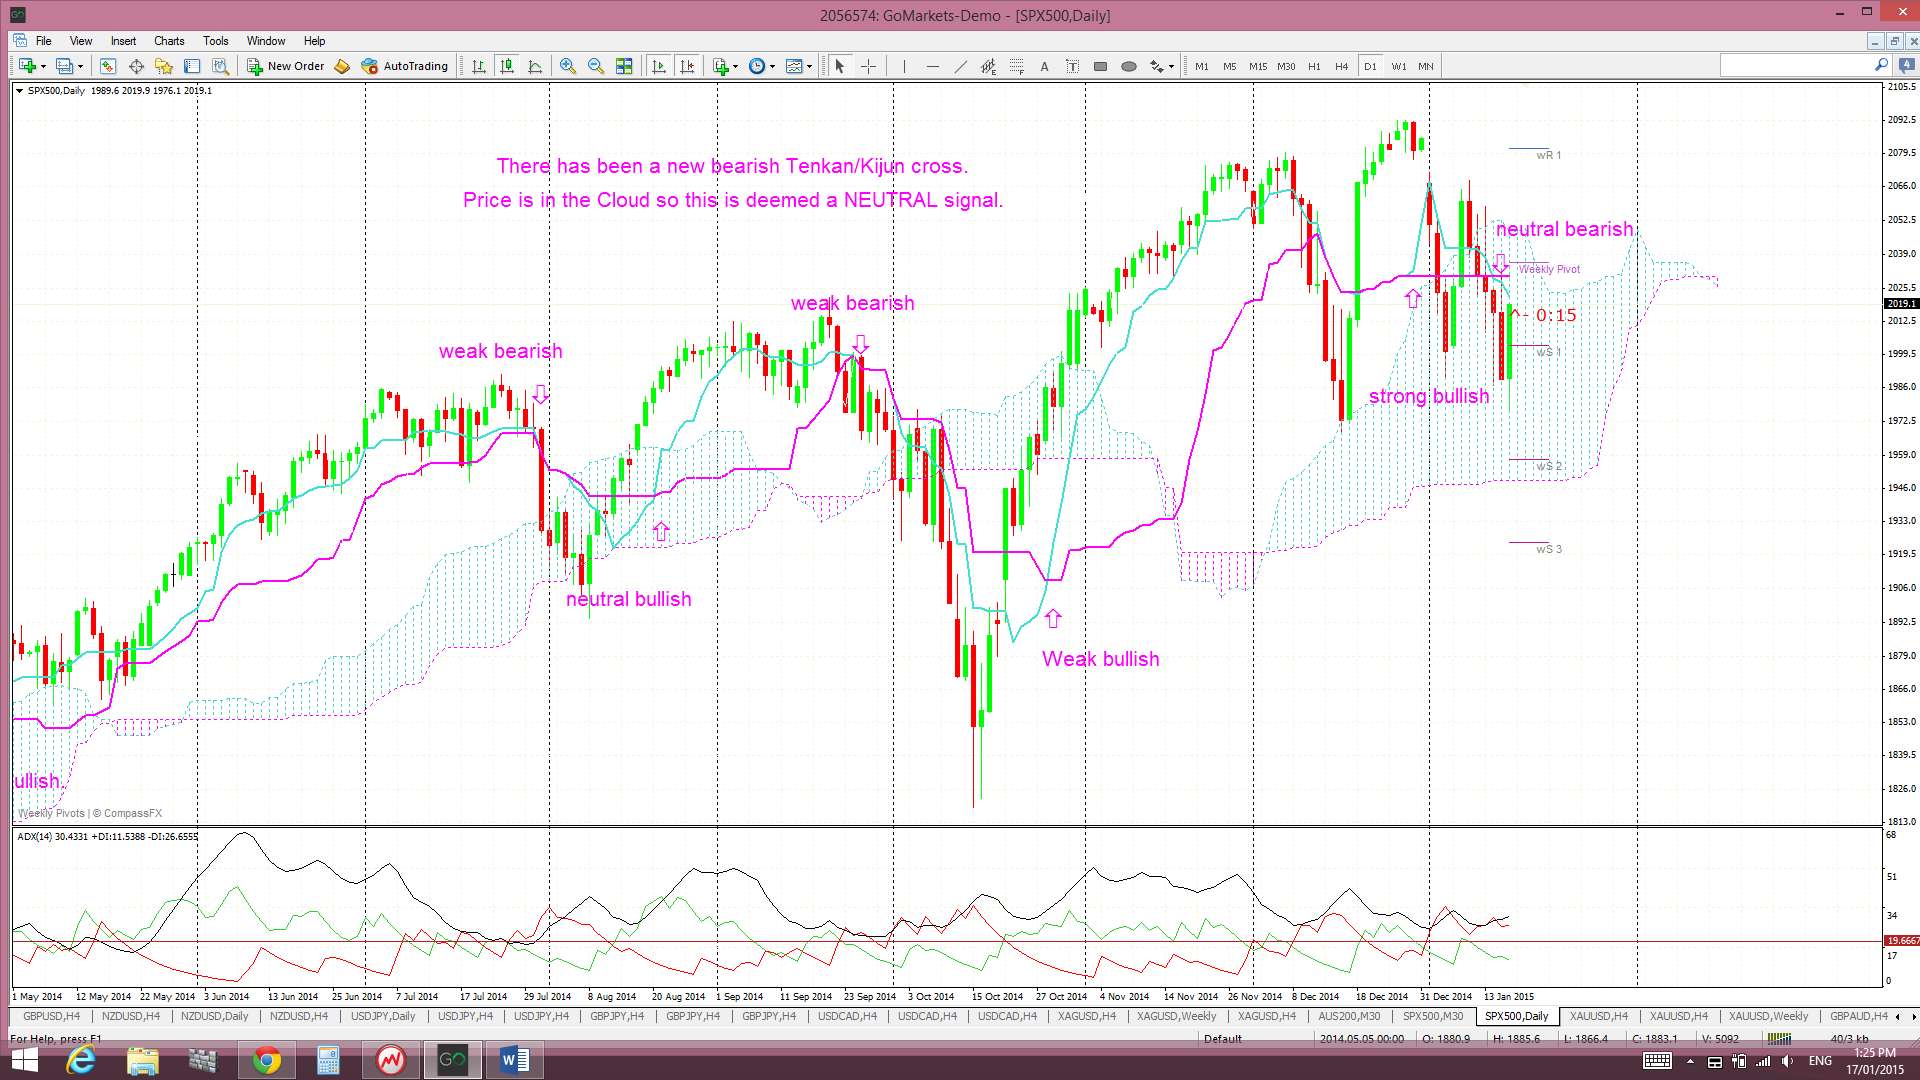
Ichimoku S&P500 chart: a clear cross of the blue Tenkan-sen line below the pink Kijun-sen line. There has been a new bearish Tenkan/Kijun cross. This new bearish cross evolved IN the Cloud and so is deemed a ‘neutral’ signal and the index is now trading in the Cloud:
S&P500 monthly chart: a break of the monthly support trend line (see monthly chart). The monthly trend line remains intact.
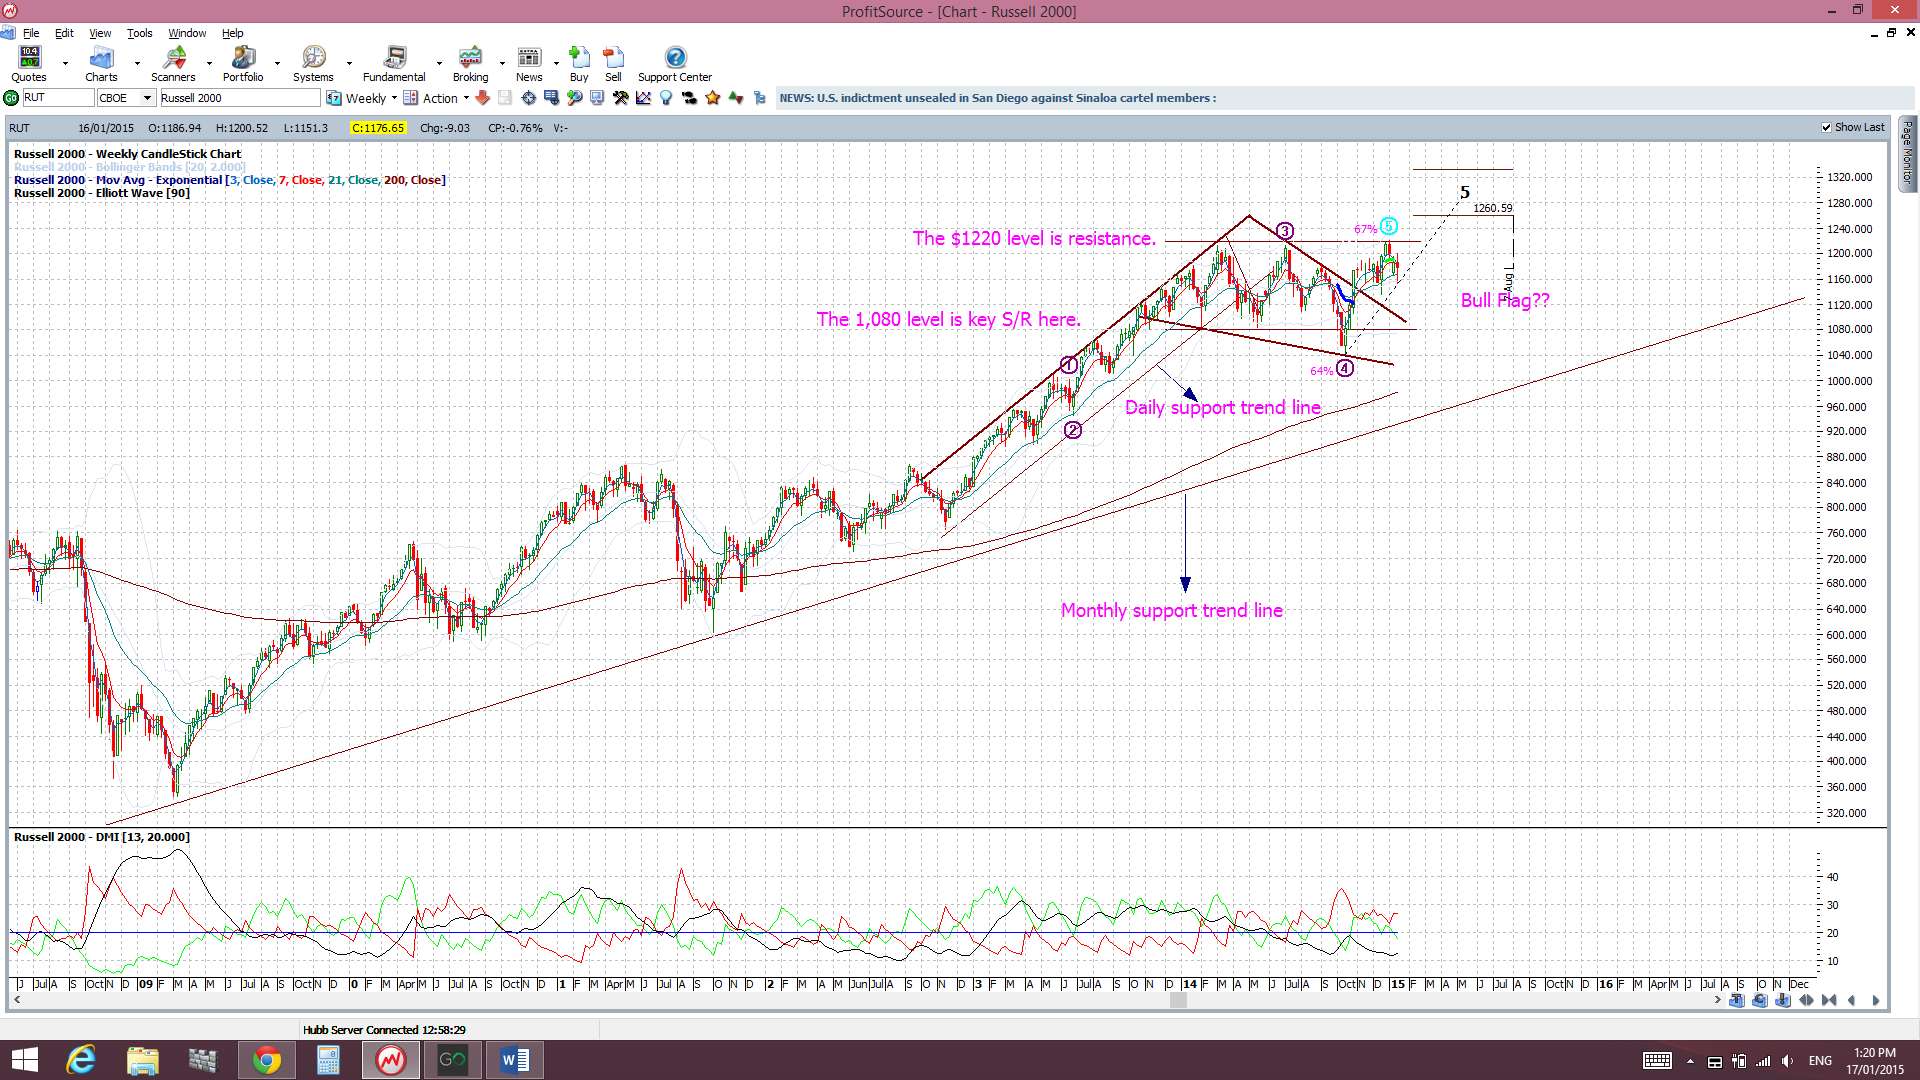
Russell 2000 Index: this small caps index is a bit of a US market ‘bellwether’ and I see the 1,080 level as key support here. The index continues to hold up and out from a ‘Bull Flag’ but has yet to breakout above the 1,220 level. I am surprised to see this index holding up as well as it has been given the uncertainty with US stocks:
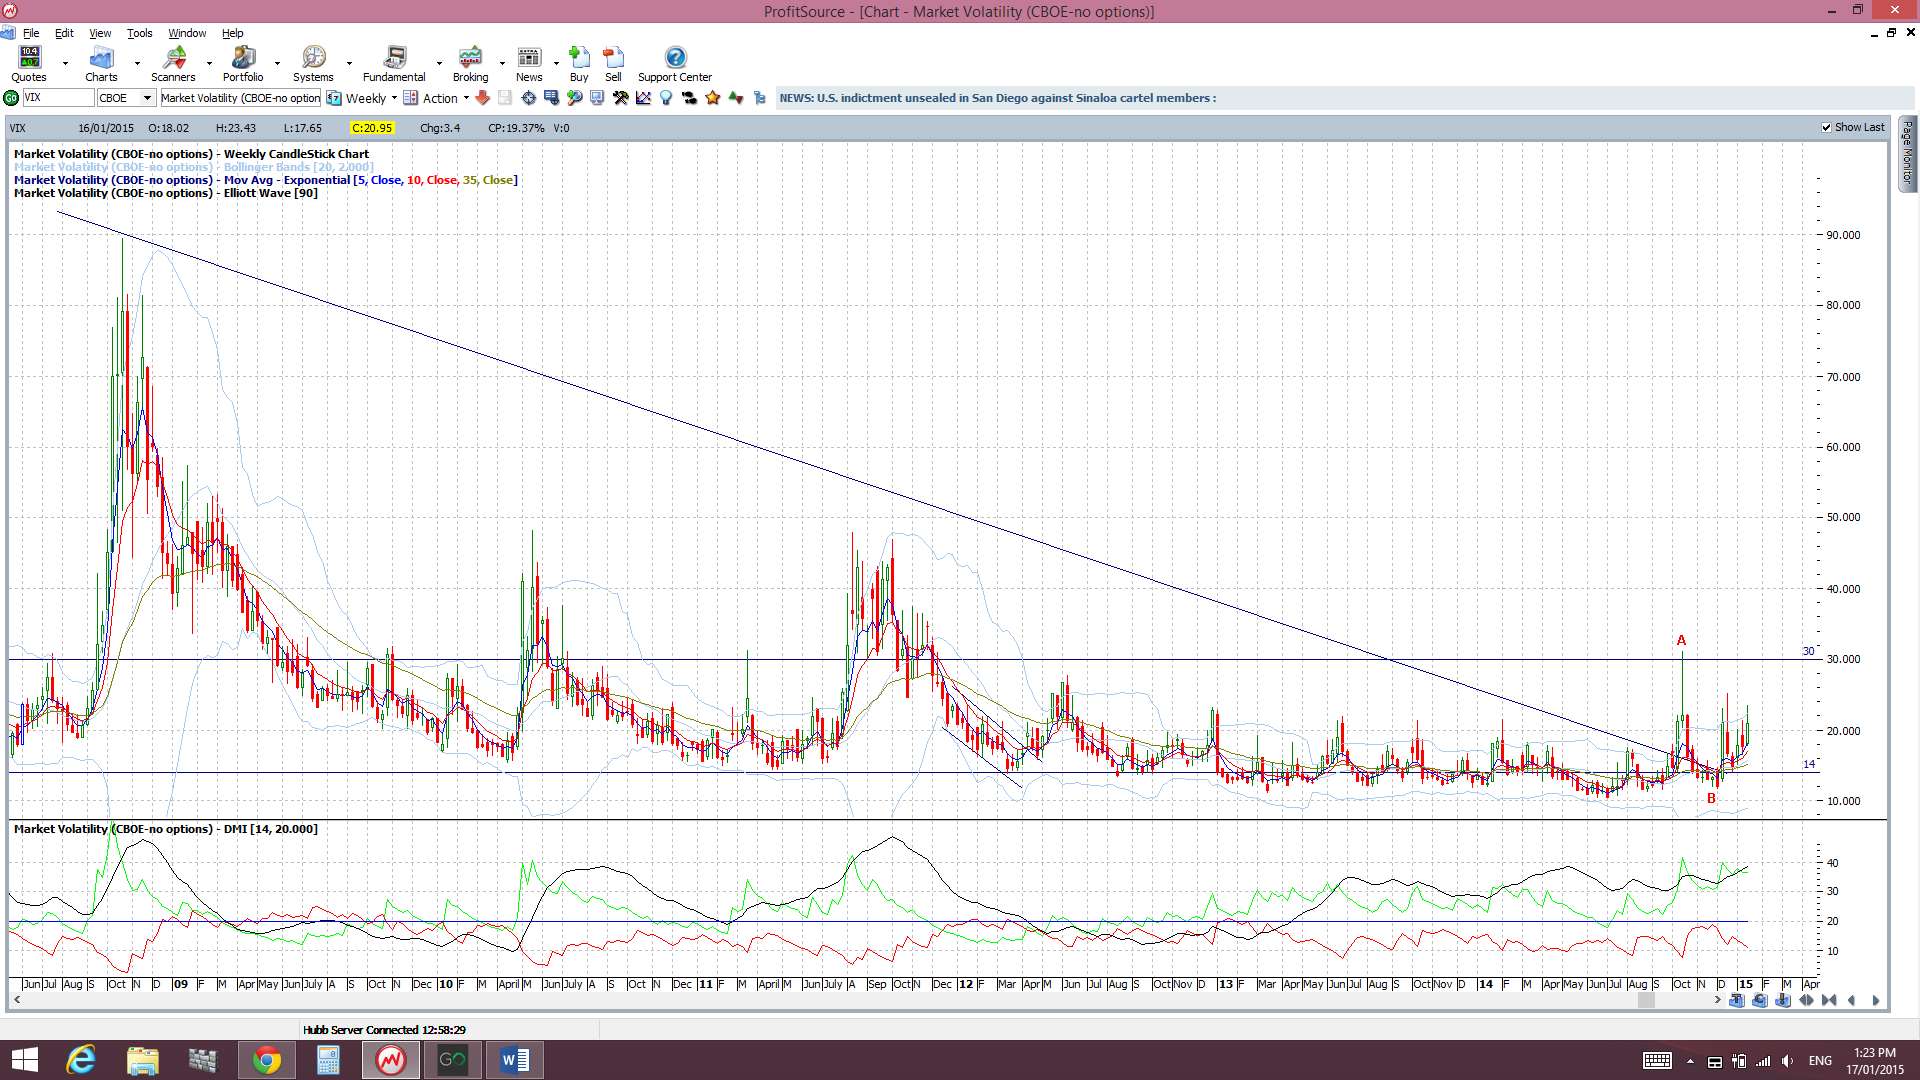
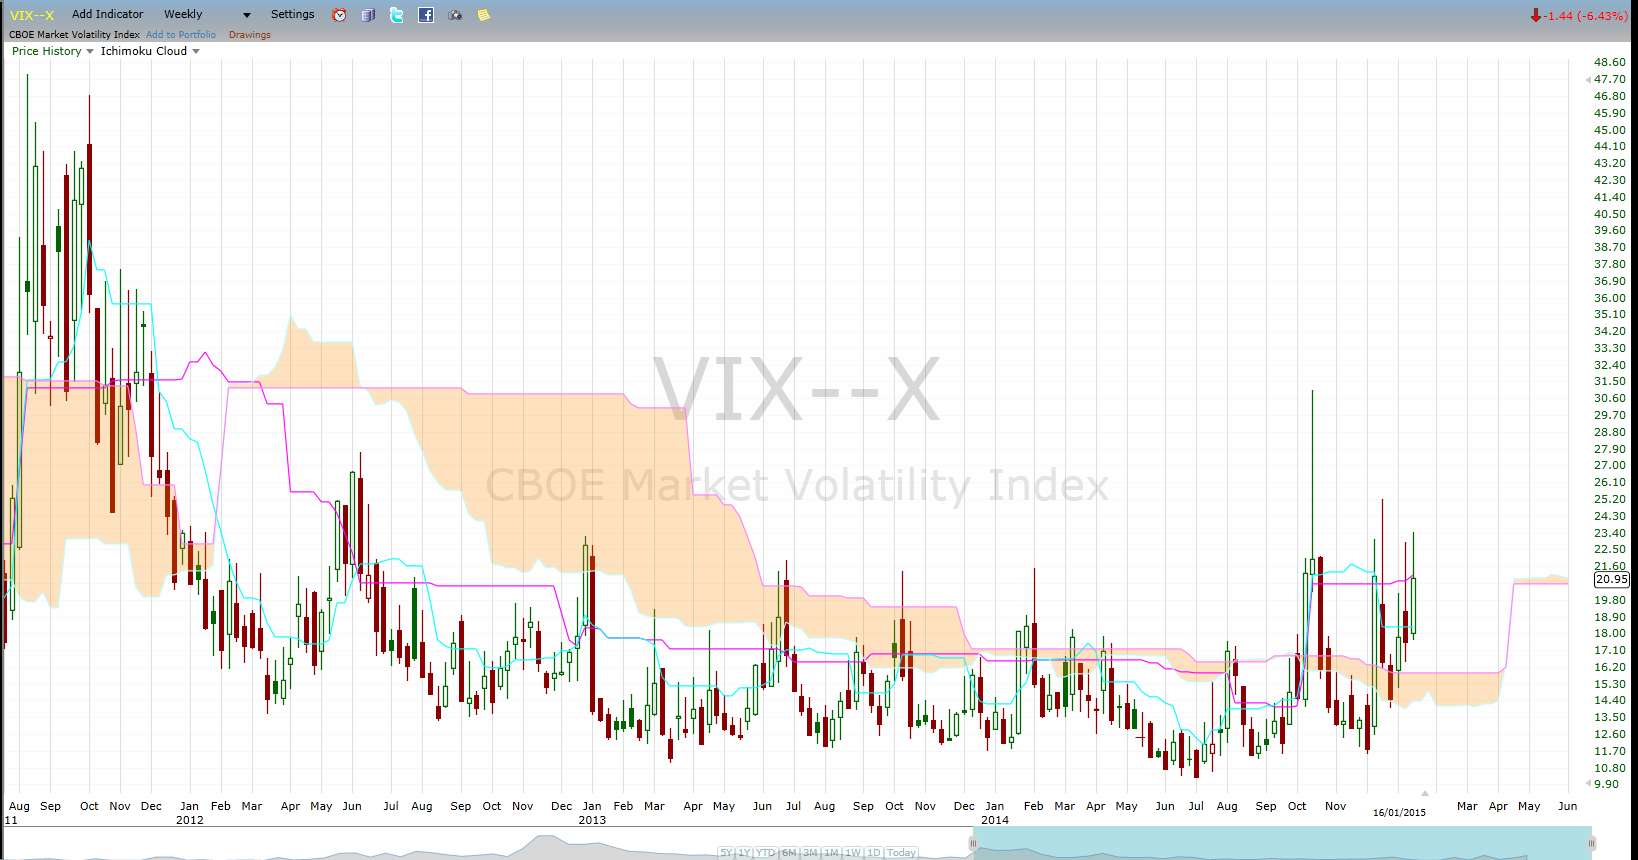
VIX Index: The ‘Fear’ index it is still under the key 30 level. Whilst it is trading above the weekly Cloud there is an open bearish Tenkan/Kijun cross.
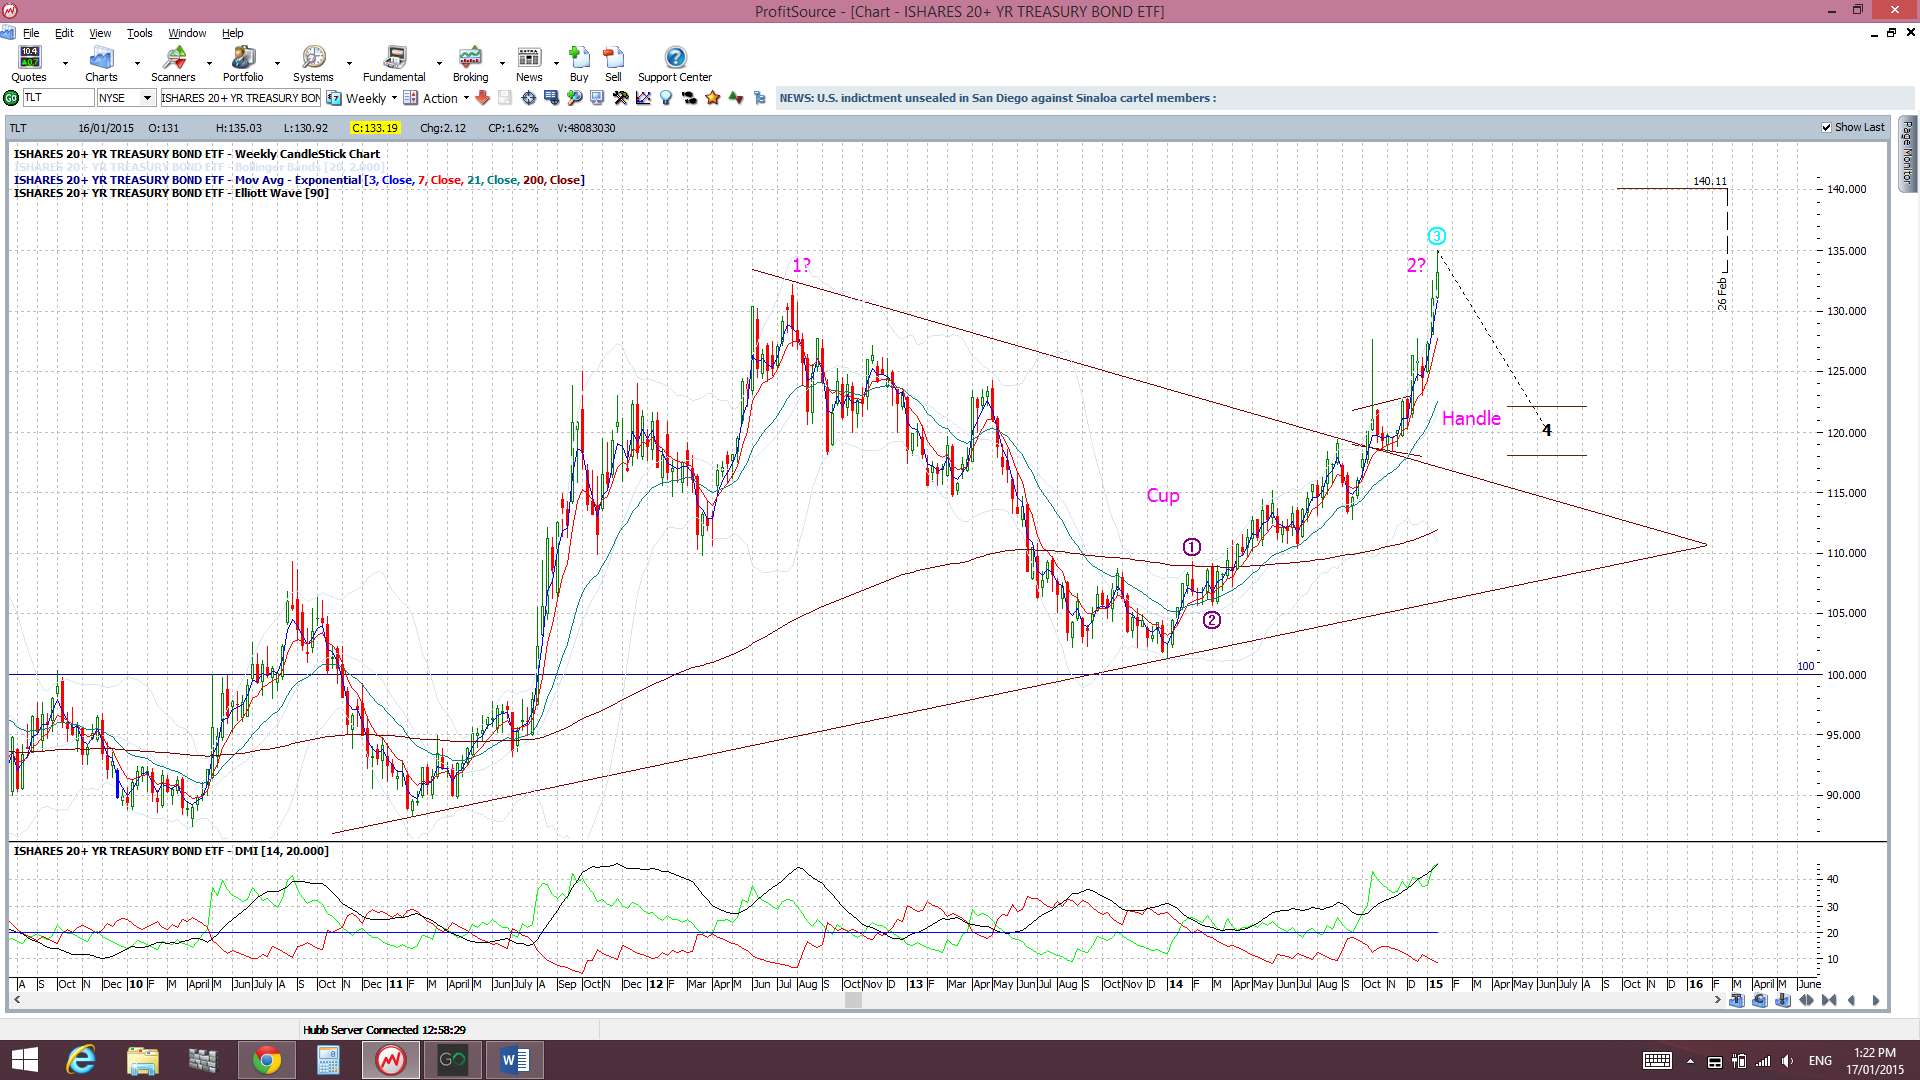
Bonds: The bond ETF remains above the triangle breakout and the bullish breakout from the Cup ‘n’ Handle pattern has held for now as well. The potential ‘Double Top’ looks to have been avoided. I would expect this to extend its rally if the USD weakens at all.
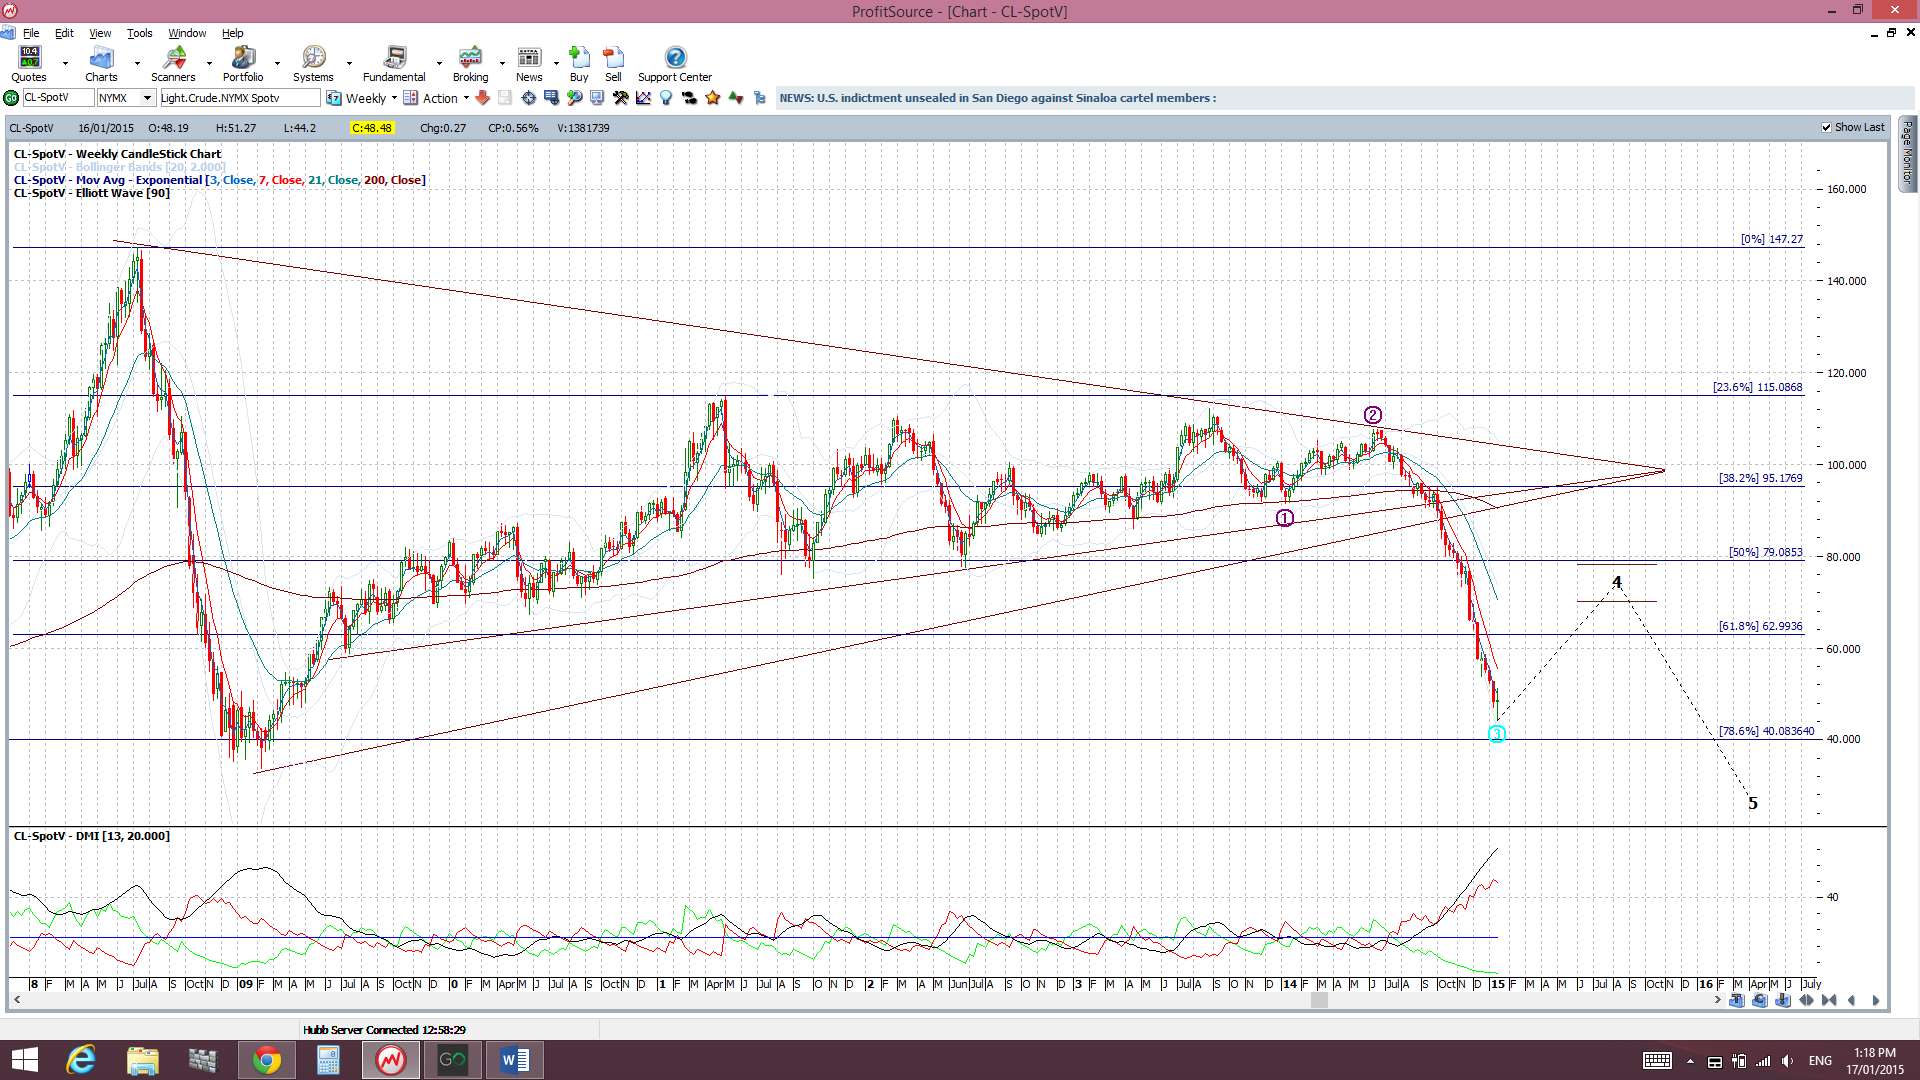
Oil: I am still expecting this to test $40, with or without a bounce, and price action is getting down near this territory.The Elliott Wave indicator is suggesting a bounce here and there has actually been a bullish-reversal style pin bar candle printed last week so this may be the next move here:
Trading Calendar Items to watch out for:
Forex:
- Mon 19th: US Bank Holiday Martin Luther King Day.
- Tue 20th: NZD NZIER Business Confidence. CNY GDP.EUR German ZEW Economic Sentiment. CAD Manufacturing Sales. NZD GDT Price.
- Wed 21st: NZD CPI. JPY Monetary Policy Statement & Press Conference. GBP Employment Data & Bank Rate Votes. CAD Wholesale Sales, BoC Monetary Policy Statement & Press Conference. US Building Permits. World Economic Forum Day 1.
- Thurs 22nd: EUR ECB Min Bid Rate & Press Conference. World Economic Forum Day 2.
- Fri 23rd: CNY HSBC Flash Manufacturing PMI. EUR French & German Flash Manufacturing PMI. GBP Retail Sales. CAD Retail Sales & CPI. World Economic Forum Day 3.
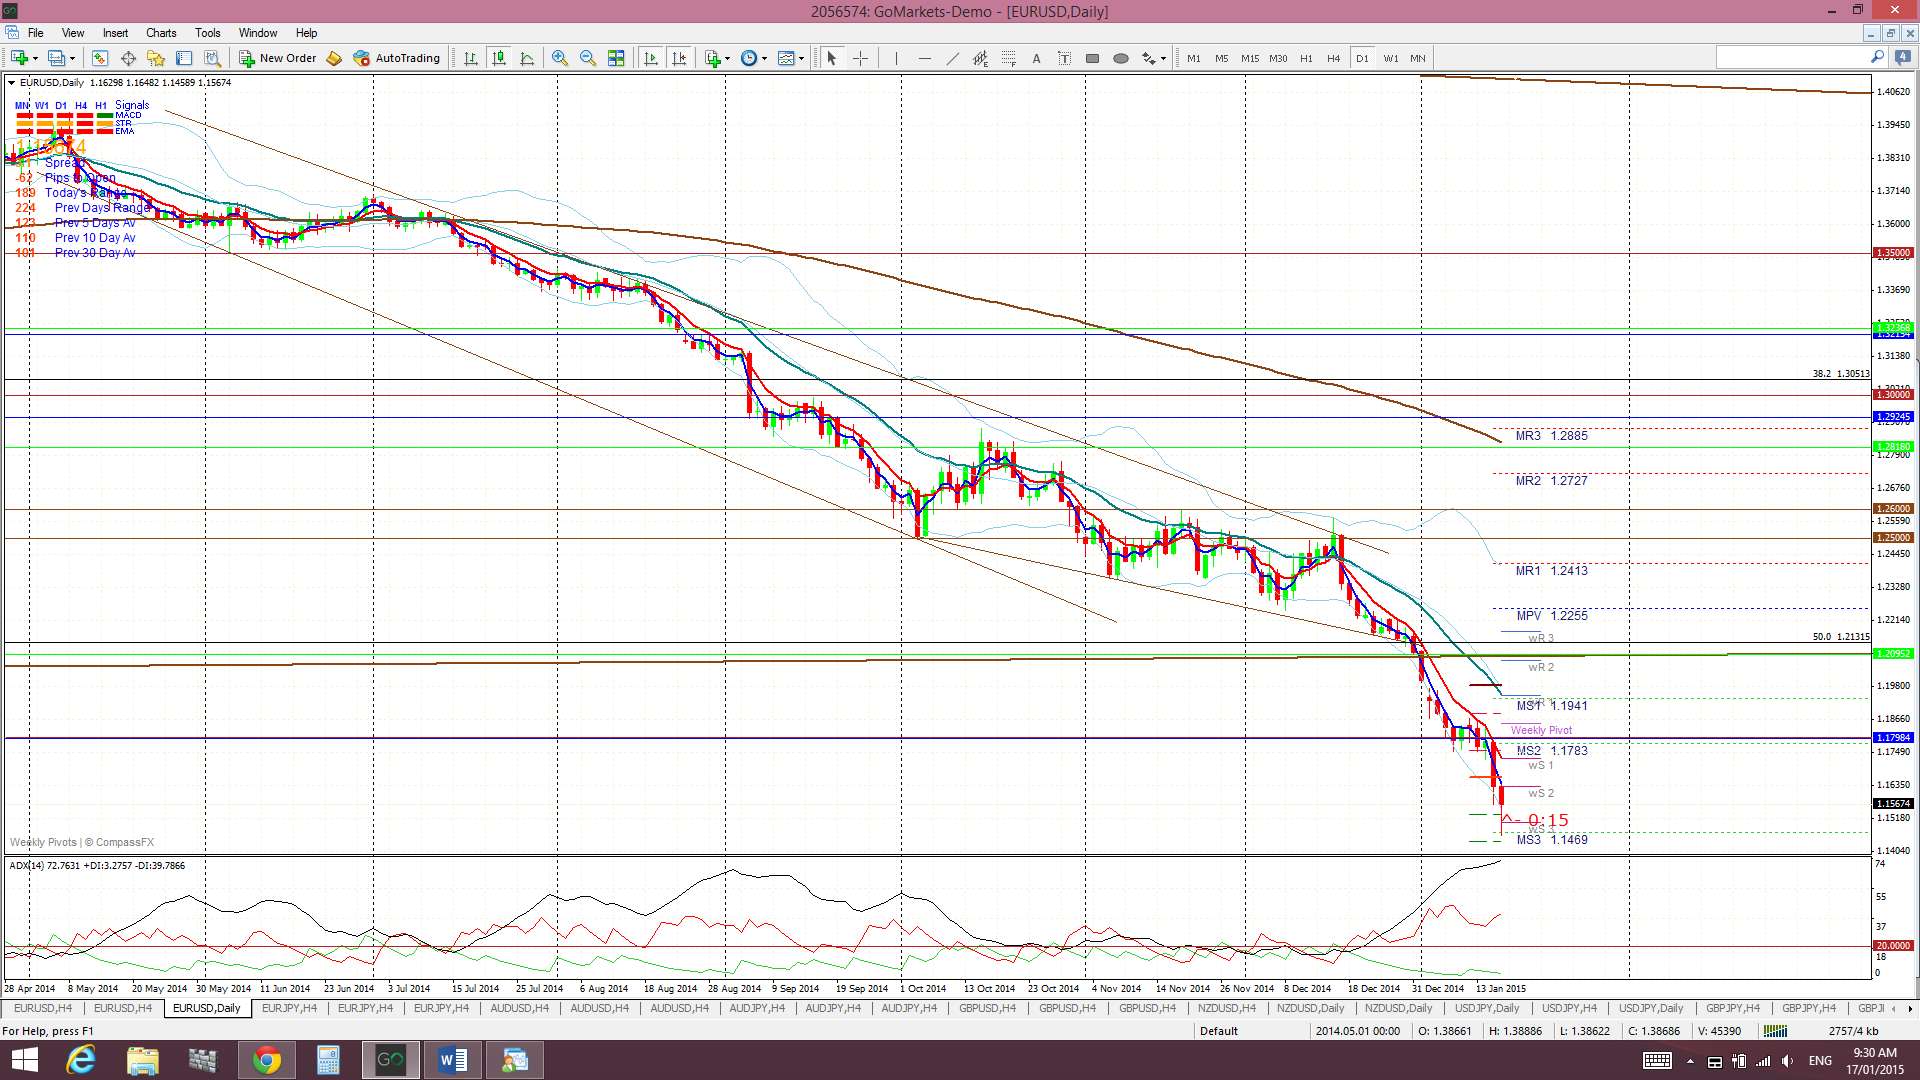
E/U: The E/U traded along the 1.18 level for much of the week until the unexpected SNB intervention on Thursday. This triggered a sharp move lower for the E/U and a new TC signal. I am expecting this key 1.18 level to be tested again though before any possible bearish continuation.
The E/U is facing the prospect of a much deeper fall now that it has closed below 1.18. A hold below this level might signal the start of a 4,000 pip Descending Triangle breakout move.
Descending triangle on the monthly chart: the descending triangle pattern is a bearish continuation pattern and has a base at around the 1.18 level. The height of this triangle is about 4,000 pips. Technical theory would suggest that any bearish breakdown of this triangle below 1.18 might see a similar move. It is worth noting that this would bring the E/U down near 0.80 and to levels not seen since 2000/2001! The monthly chart shows how critical this 1.18 level is for the E/U. The 61.8% of the 2000-2008 bull run is down near 1.12 and might be an interim target on any breakdown move. This is a monthly chart pattern though and traders need to wait and see a monthly candle close below 1.18 to confirm here. There has been a weekly candle close now below 1.18 however.
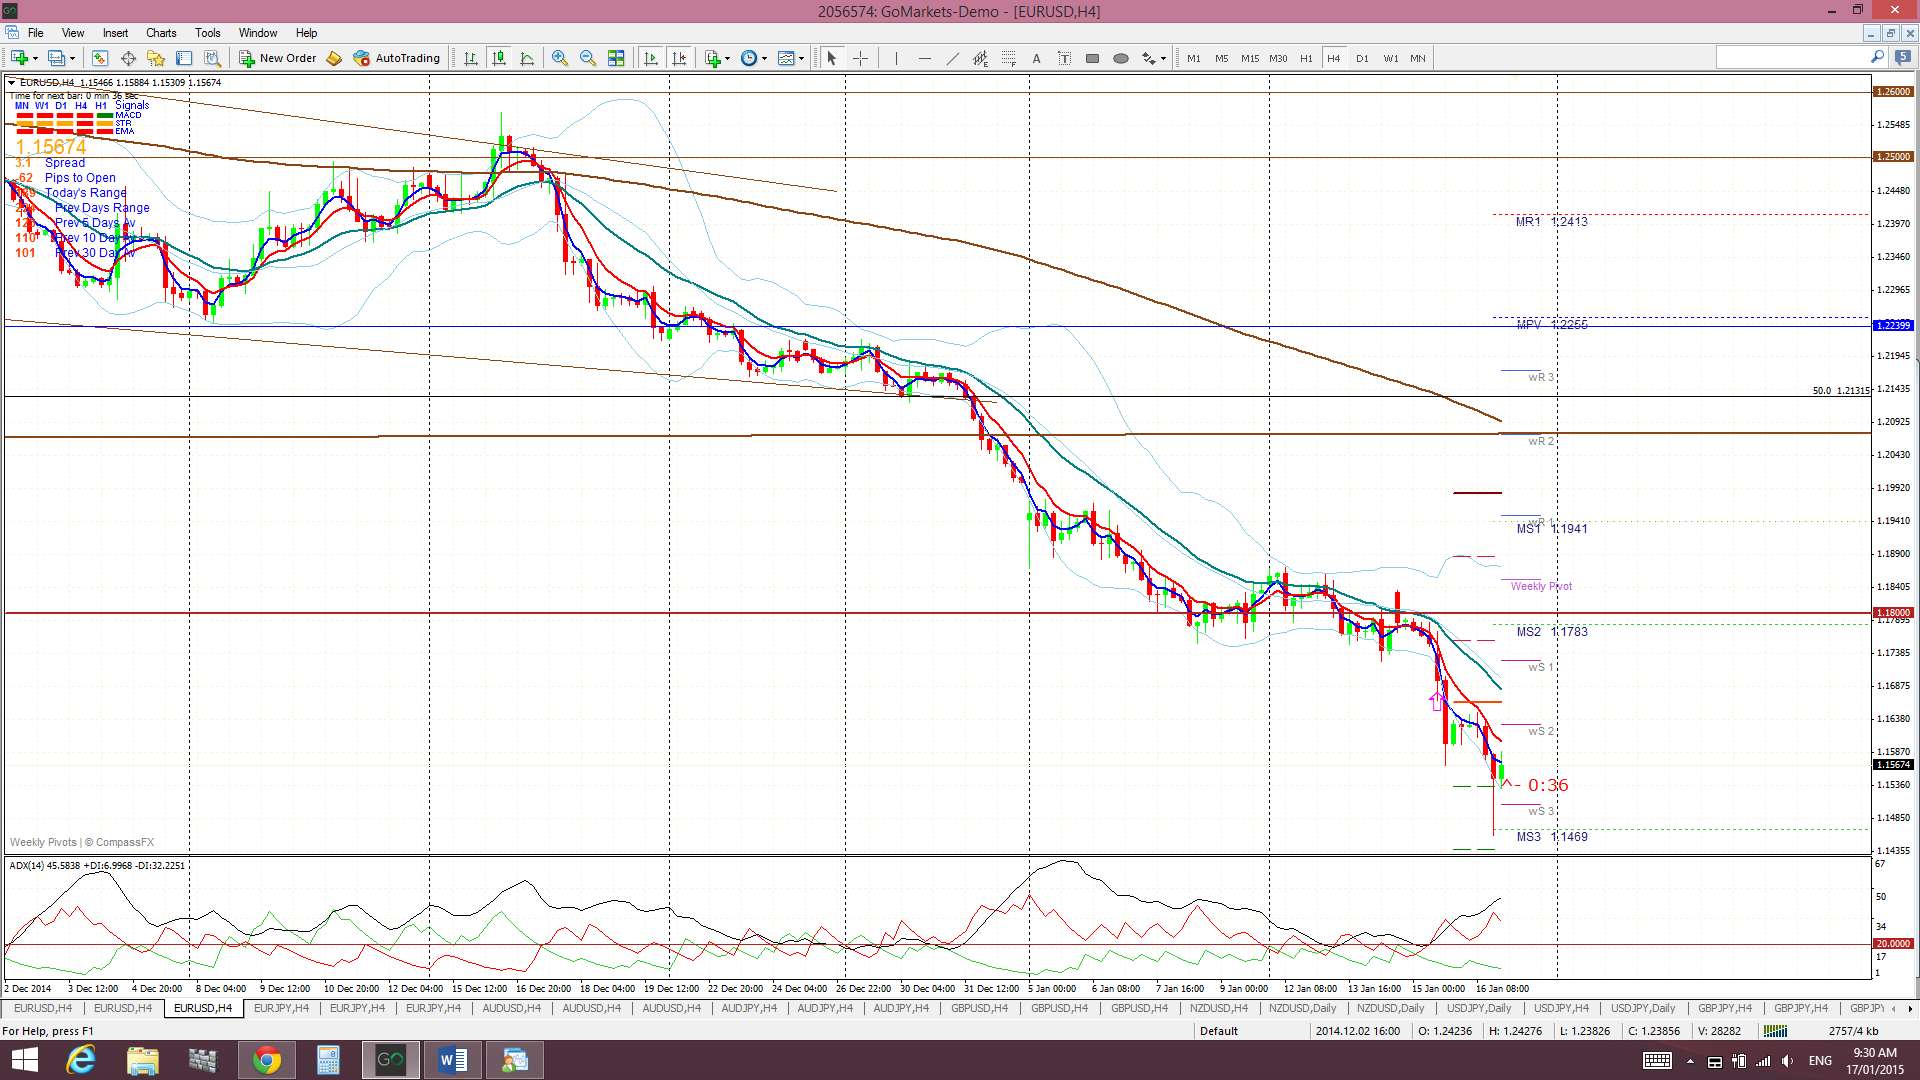
Price is trading below the Ichimoku Cloud on the 4hr, daily, weekly and monthly charts which is bearish.
The weekly candle closed as a large bearish candle.
Traders will need to watch for any reaction on the E/U to Thursday’s ECB news. It is widely expected that a QE package will be announced but the size and timing of any package may determine the reaction to this news. A delayed or reduced size QE program could see the E/U bounce back even if just in a short term relief-rally mode.
- There is an open TC short signal on this pair BUT I am expecting a test of 1.18 again and also watching for the impact of any QE announcement.

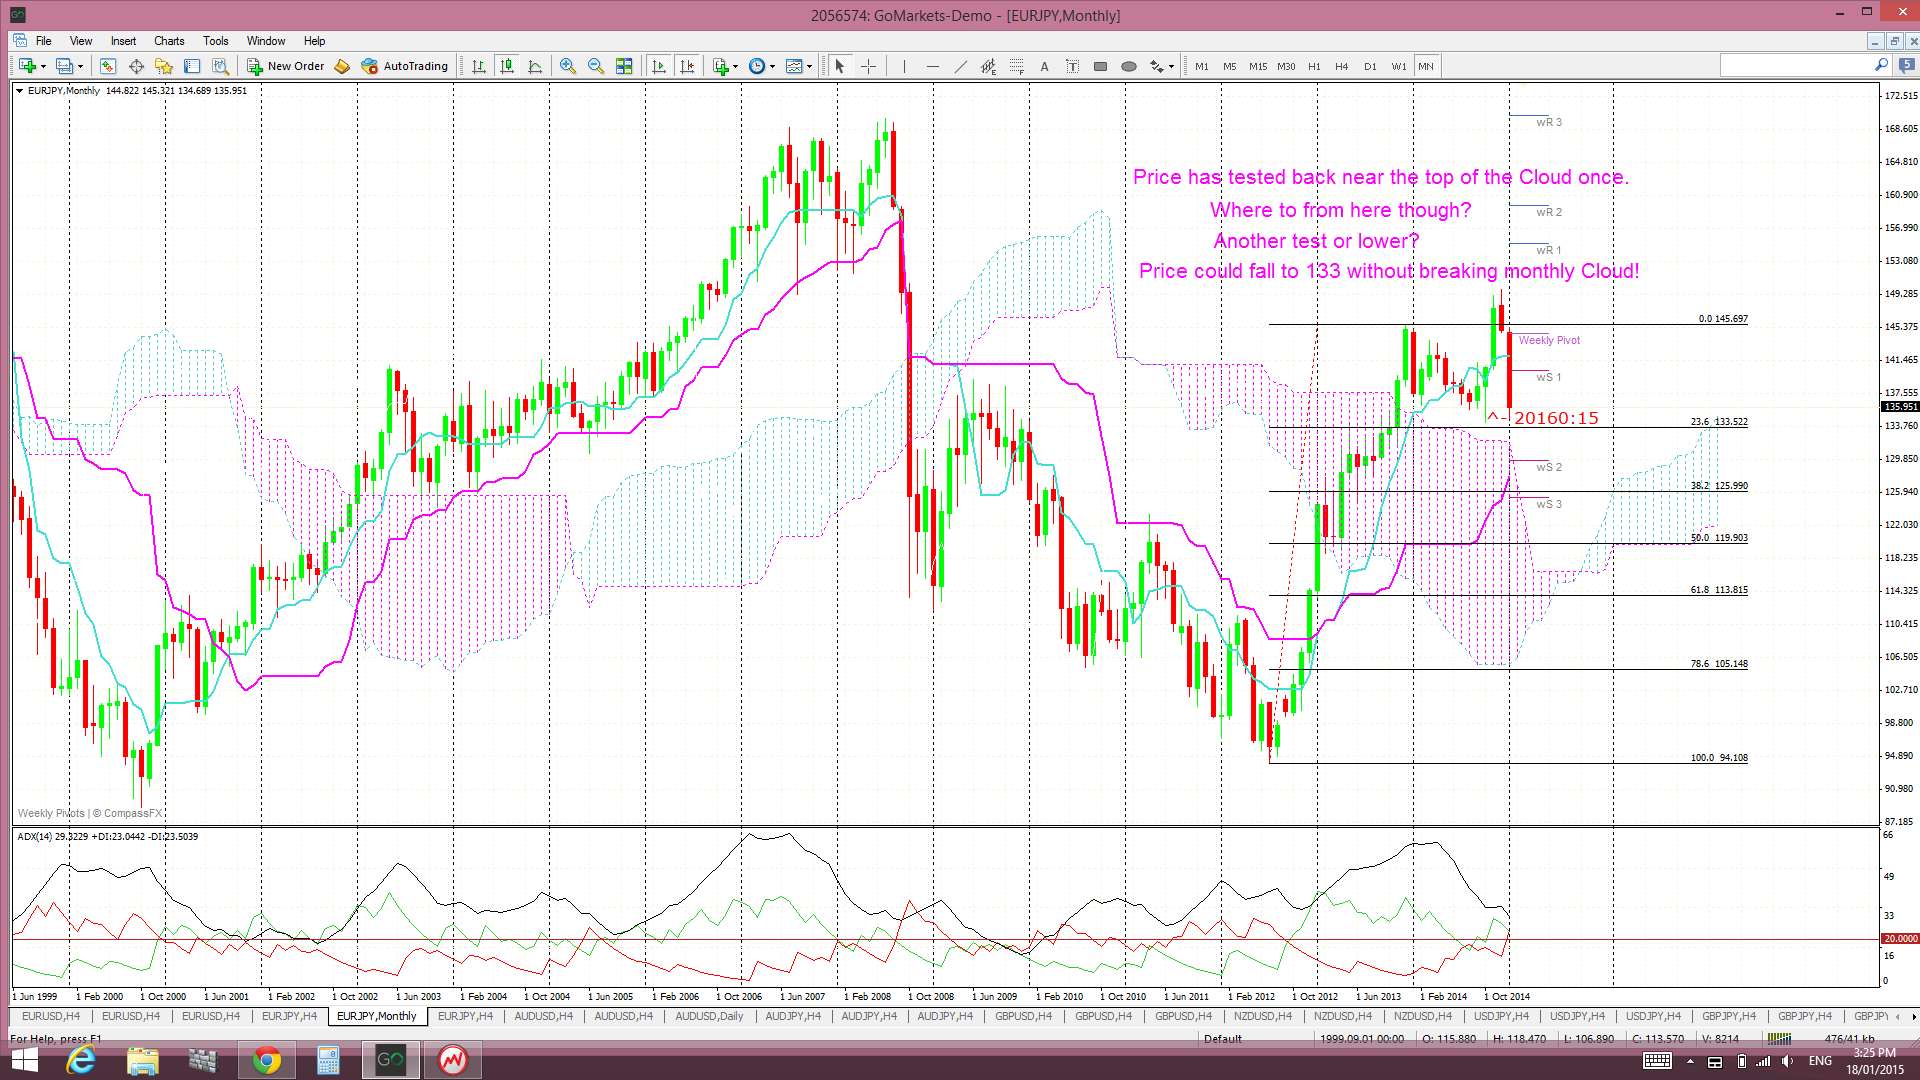
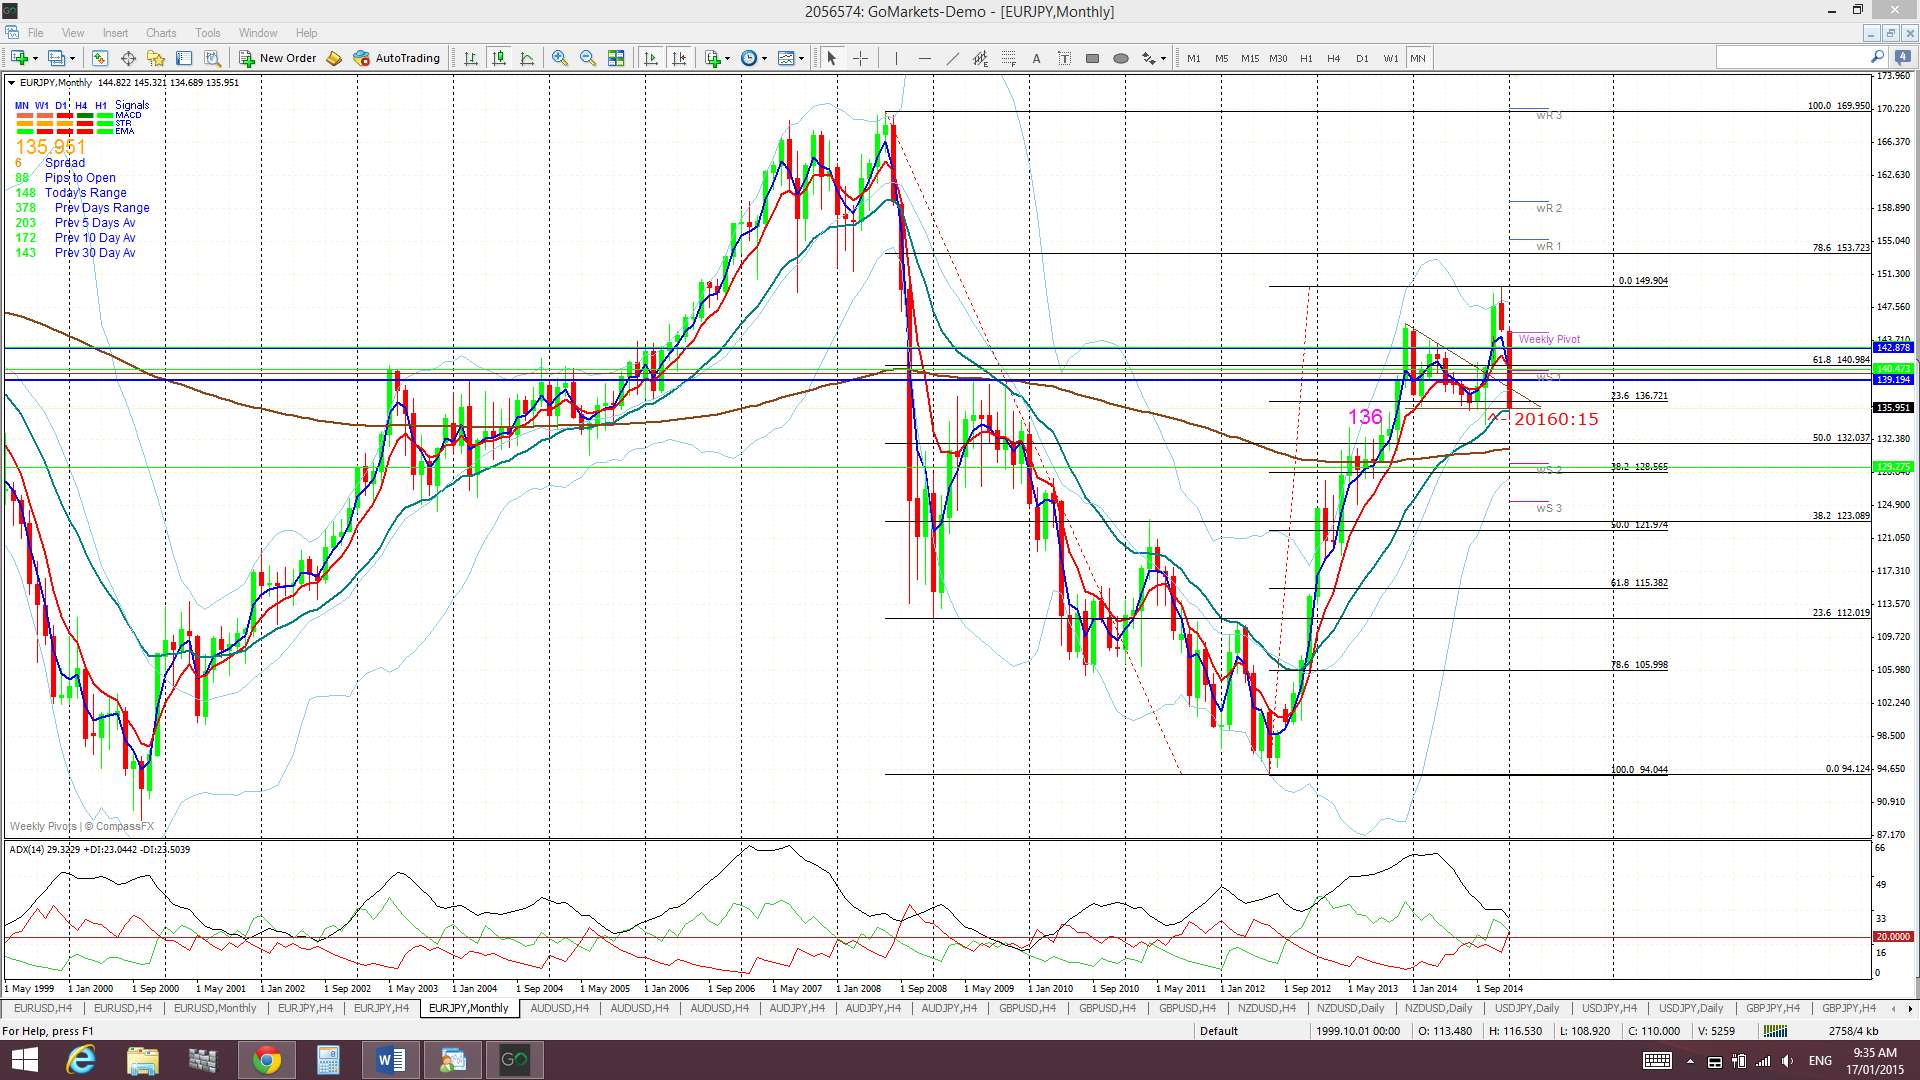
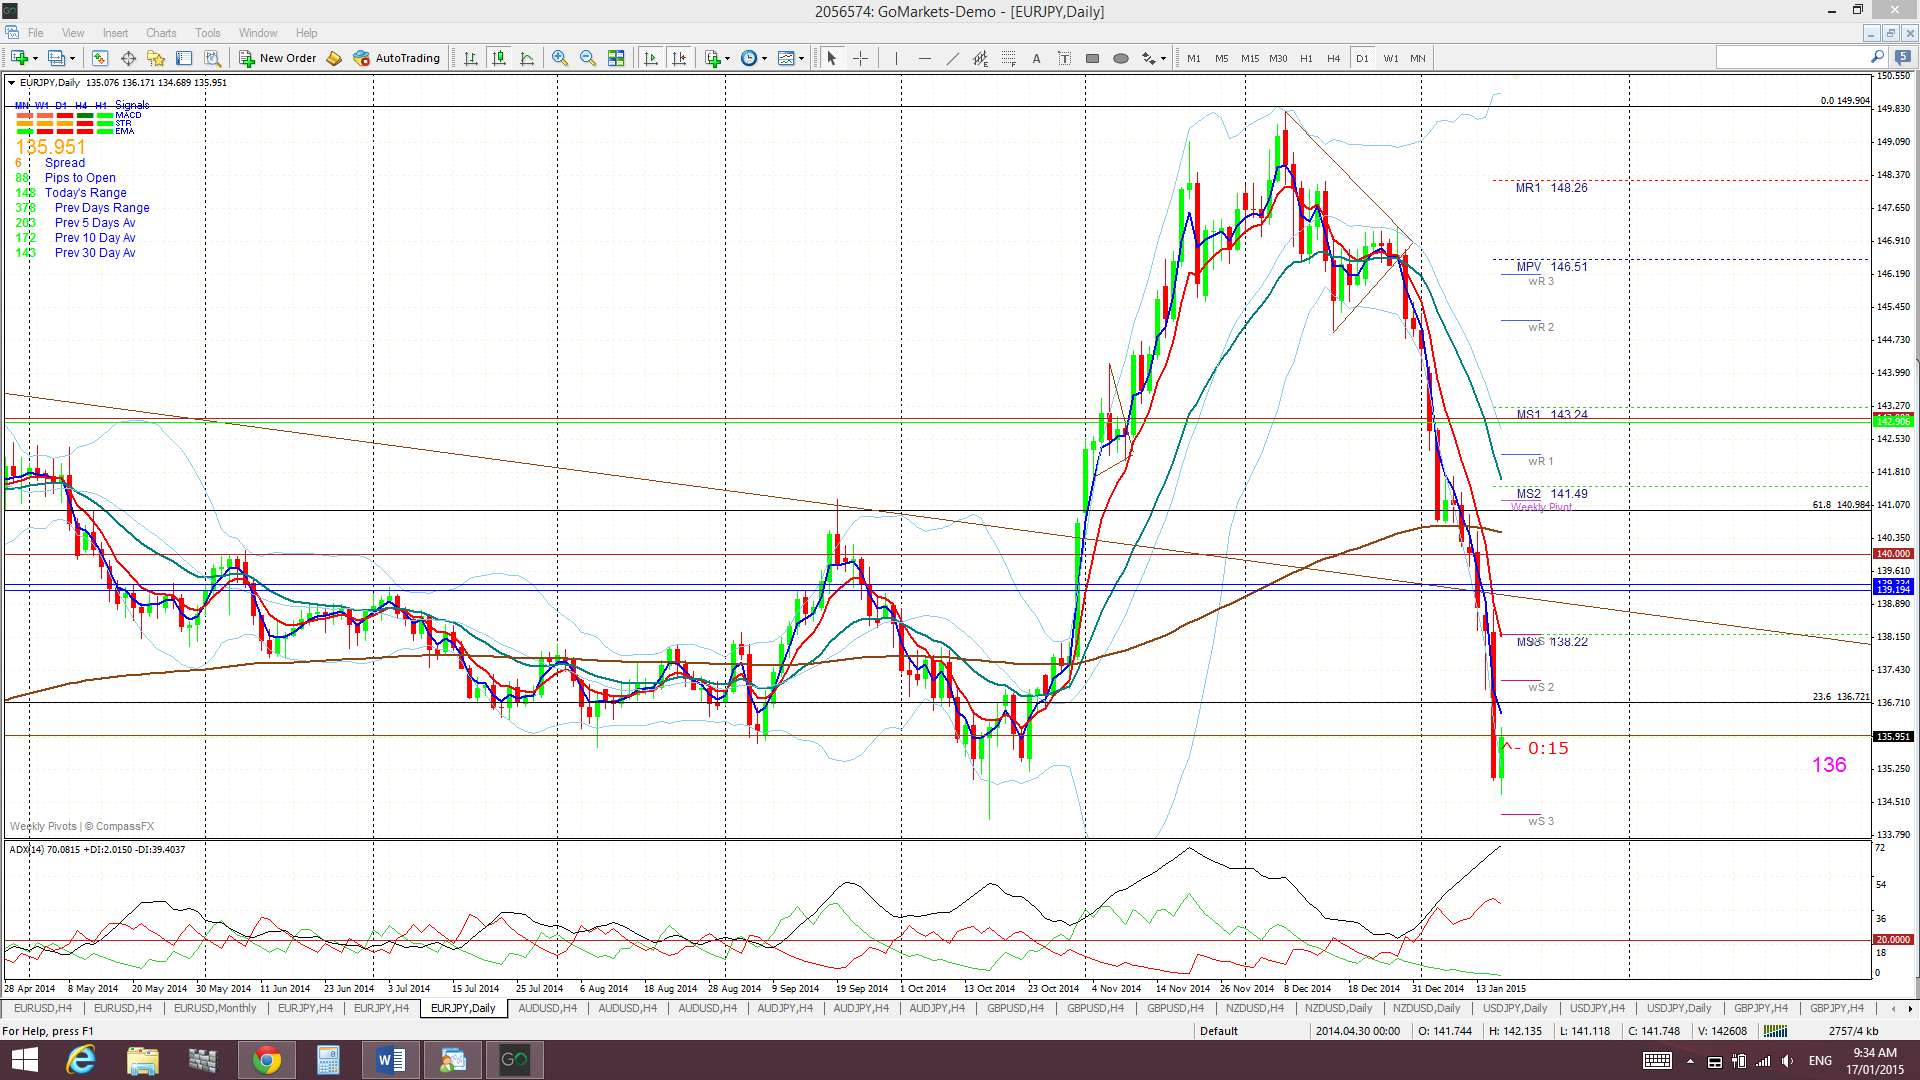
E/J: The 140 level gave way early in the week and price kept falling from there. I am now looking out at the monthly chart for further pull back targets given the move thus far has been so big.
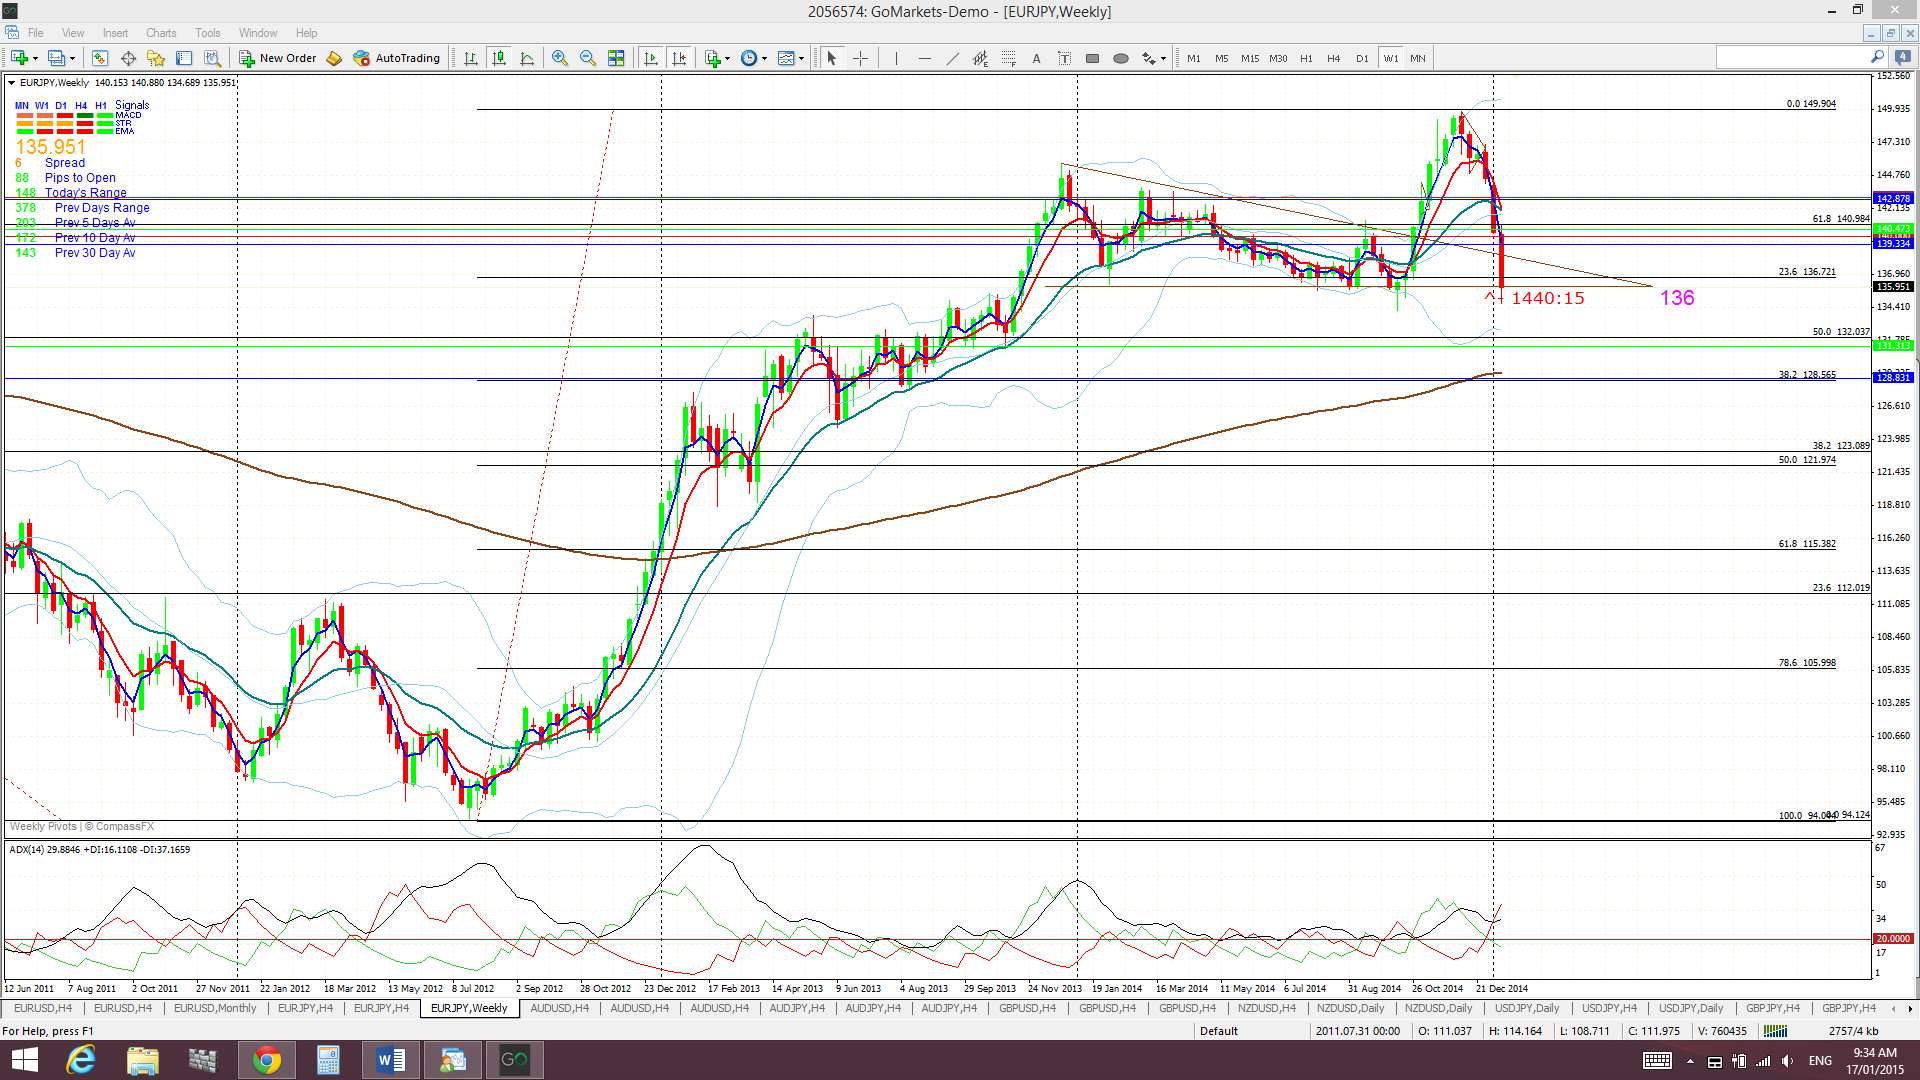
It is interesting to see how price pulled back to close the week right on the 136 level. This has been previous support and resistance and the charts show that this level formed up the base of a recent descending triangle. The weekly chart shows this support clearly and how any further dip may target the weekly 200 EMA down near 129 which would offer about a 700 pip move. Watch for any reaction to ECB news here on Thursday to see if this triggers either a bounce or bearish continuation.
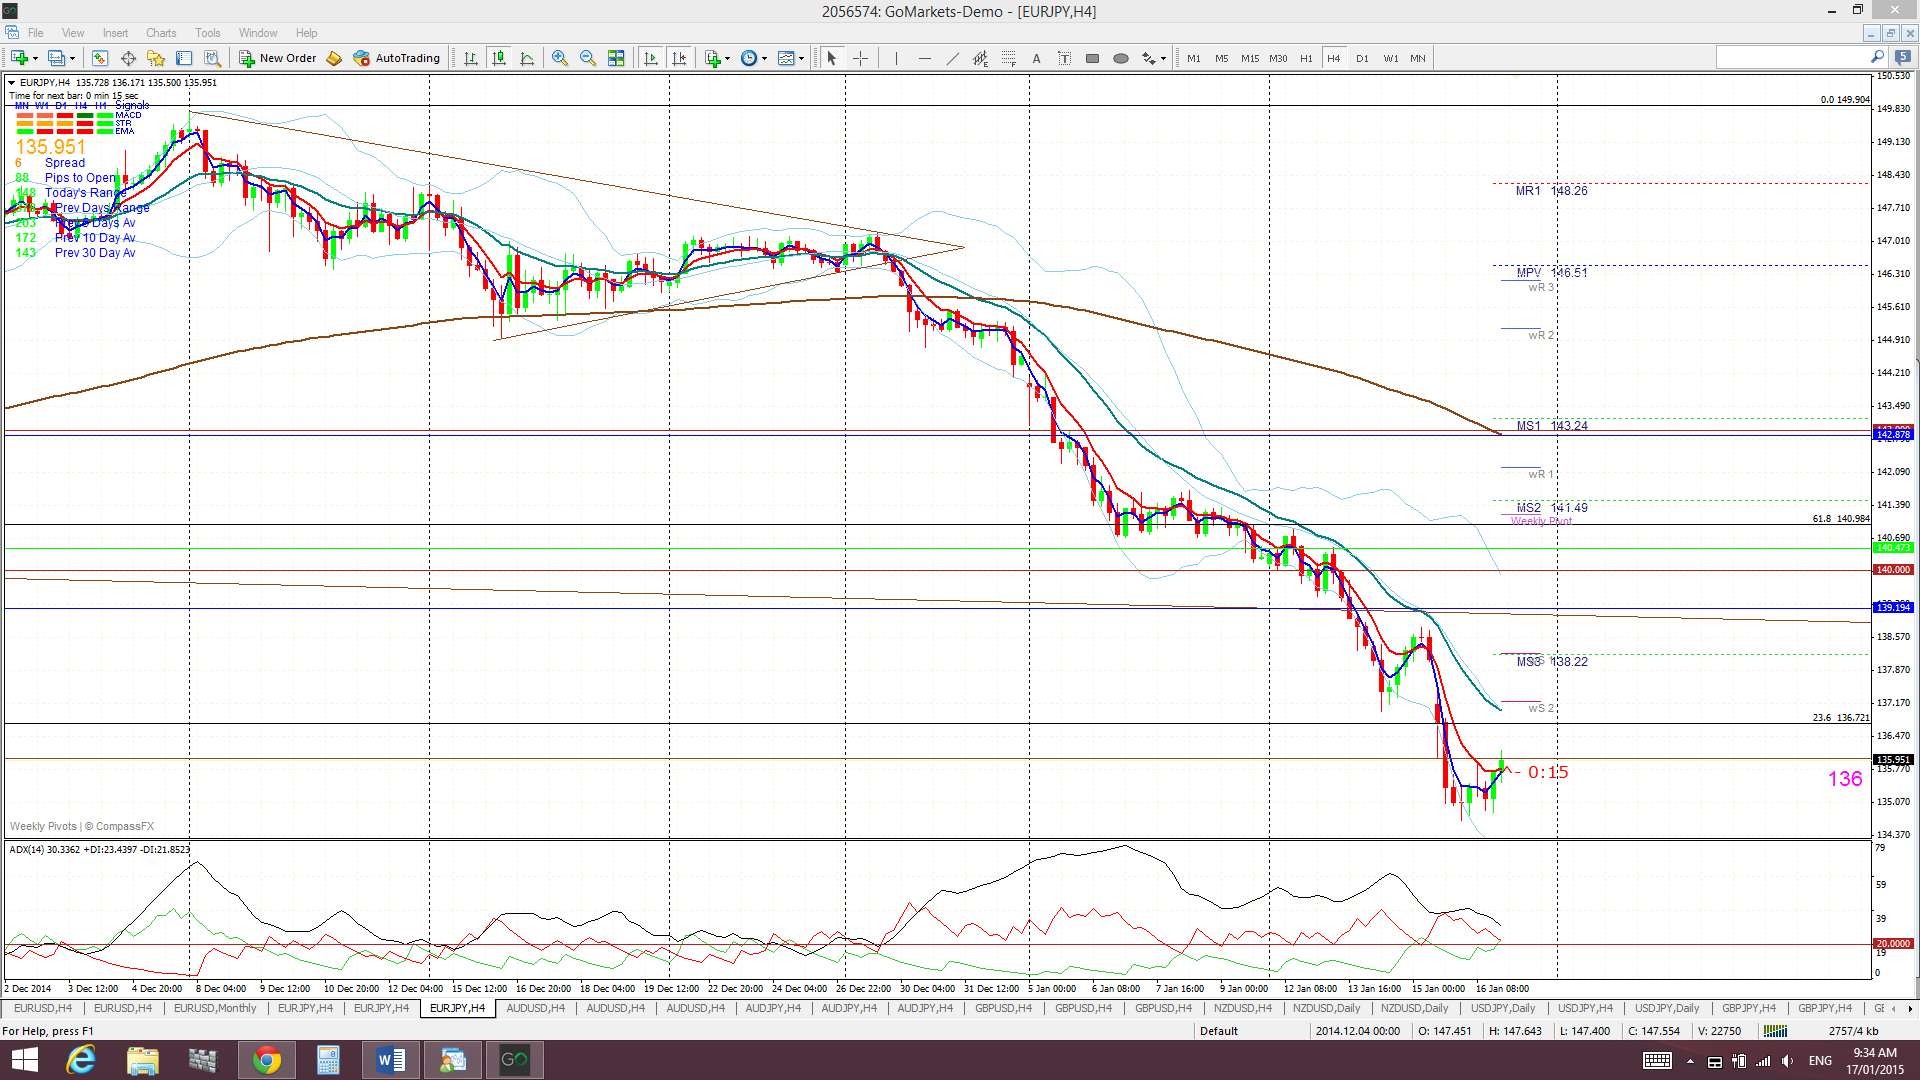
Price is now trading below the Cloud on the 4hr, daily and weekly charts but above on the monthly chart. Note how price action is similar to the last time the E/J broke above the monthly Cloud:
The weekly candle closed as a large bearish candle.
- I’m watching for any new TC signal on this pair and the 136 level.
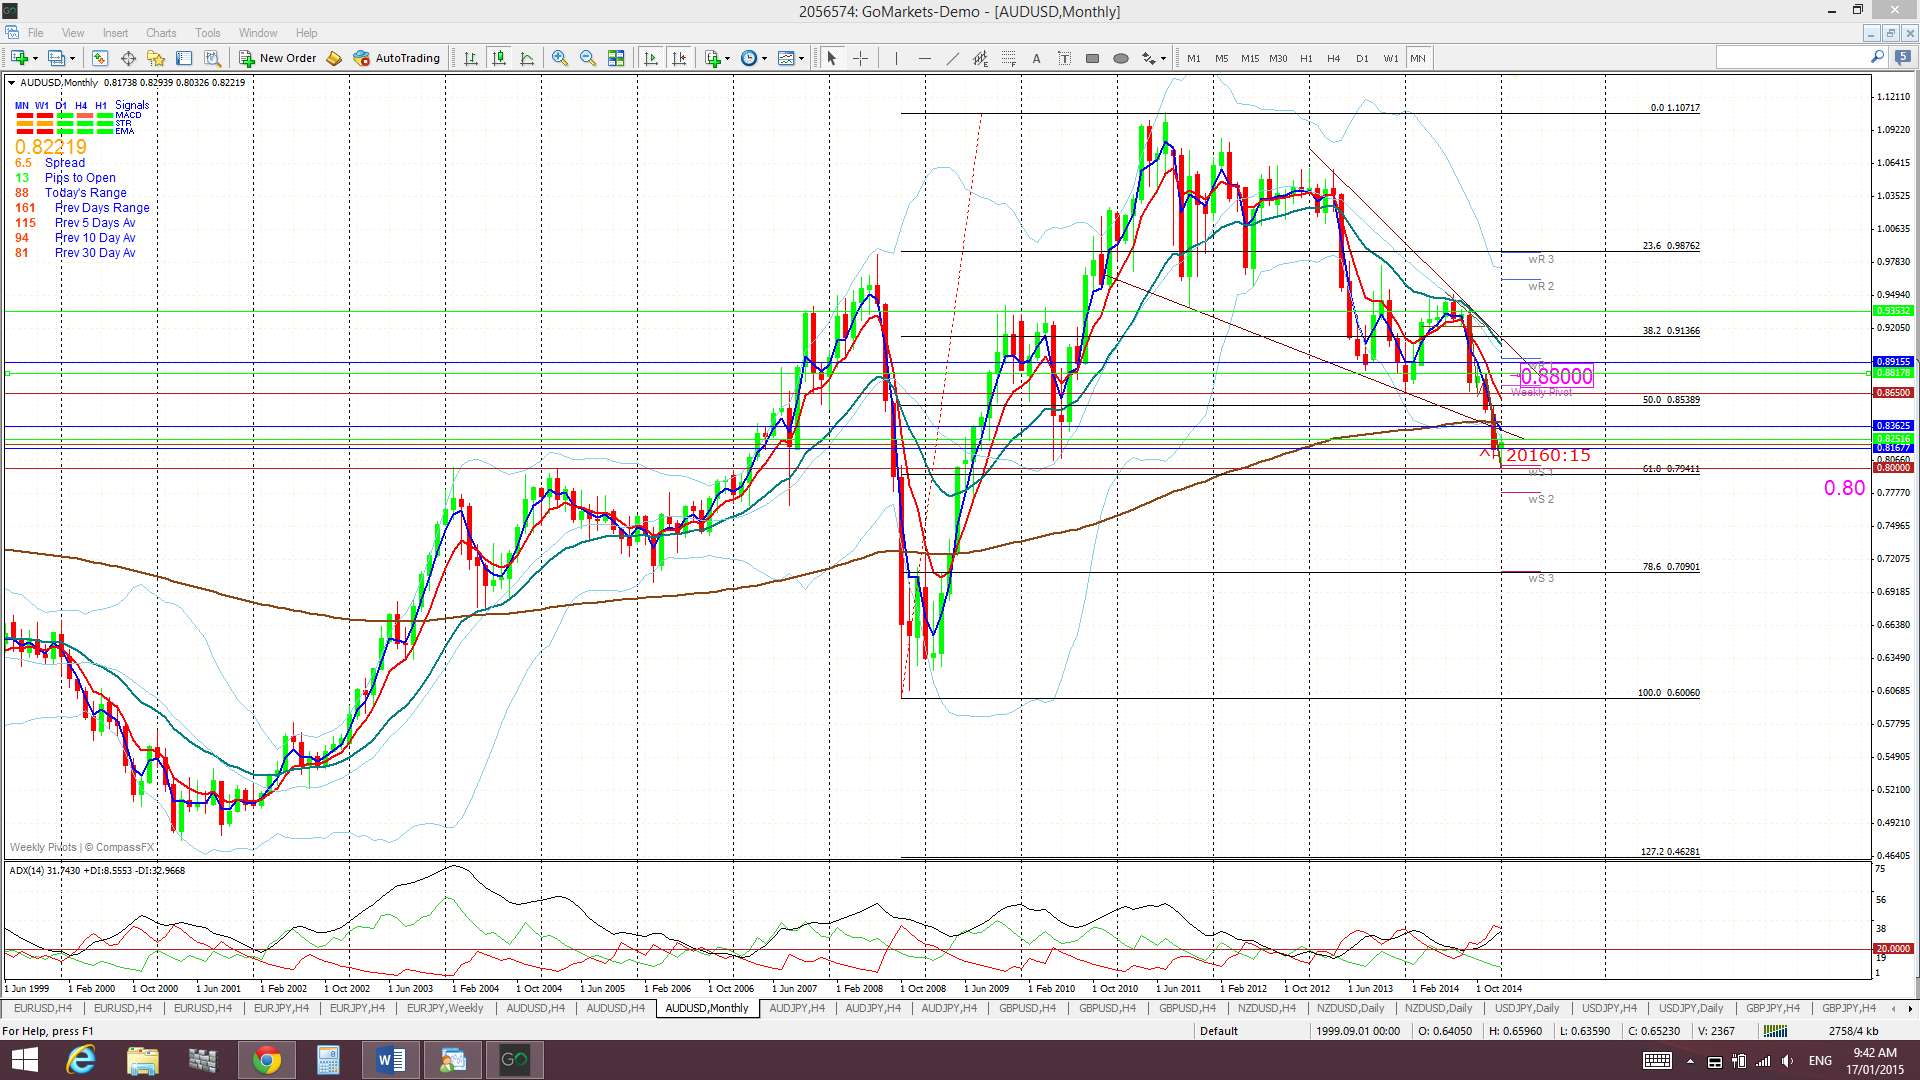
A/U: The A/U popped above the 0.82 level twice last week and has managed to close the week above this key S/R level. Price had been stuck in a 0.80-0.82 trading channel for much of the last 4 weeks.
It is no surprise that 0.80 has offered some decent support for the A/U as this is the region of the 61.8% fib from the 2008-2011 bull run and the 50% fib of the 2001-2011 bull run. However, any break and hold below 0.80 support would suggest a trip lower, possibly down to the 70 region where the next layers of fib support kick in:
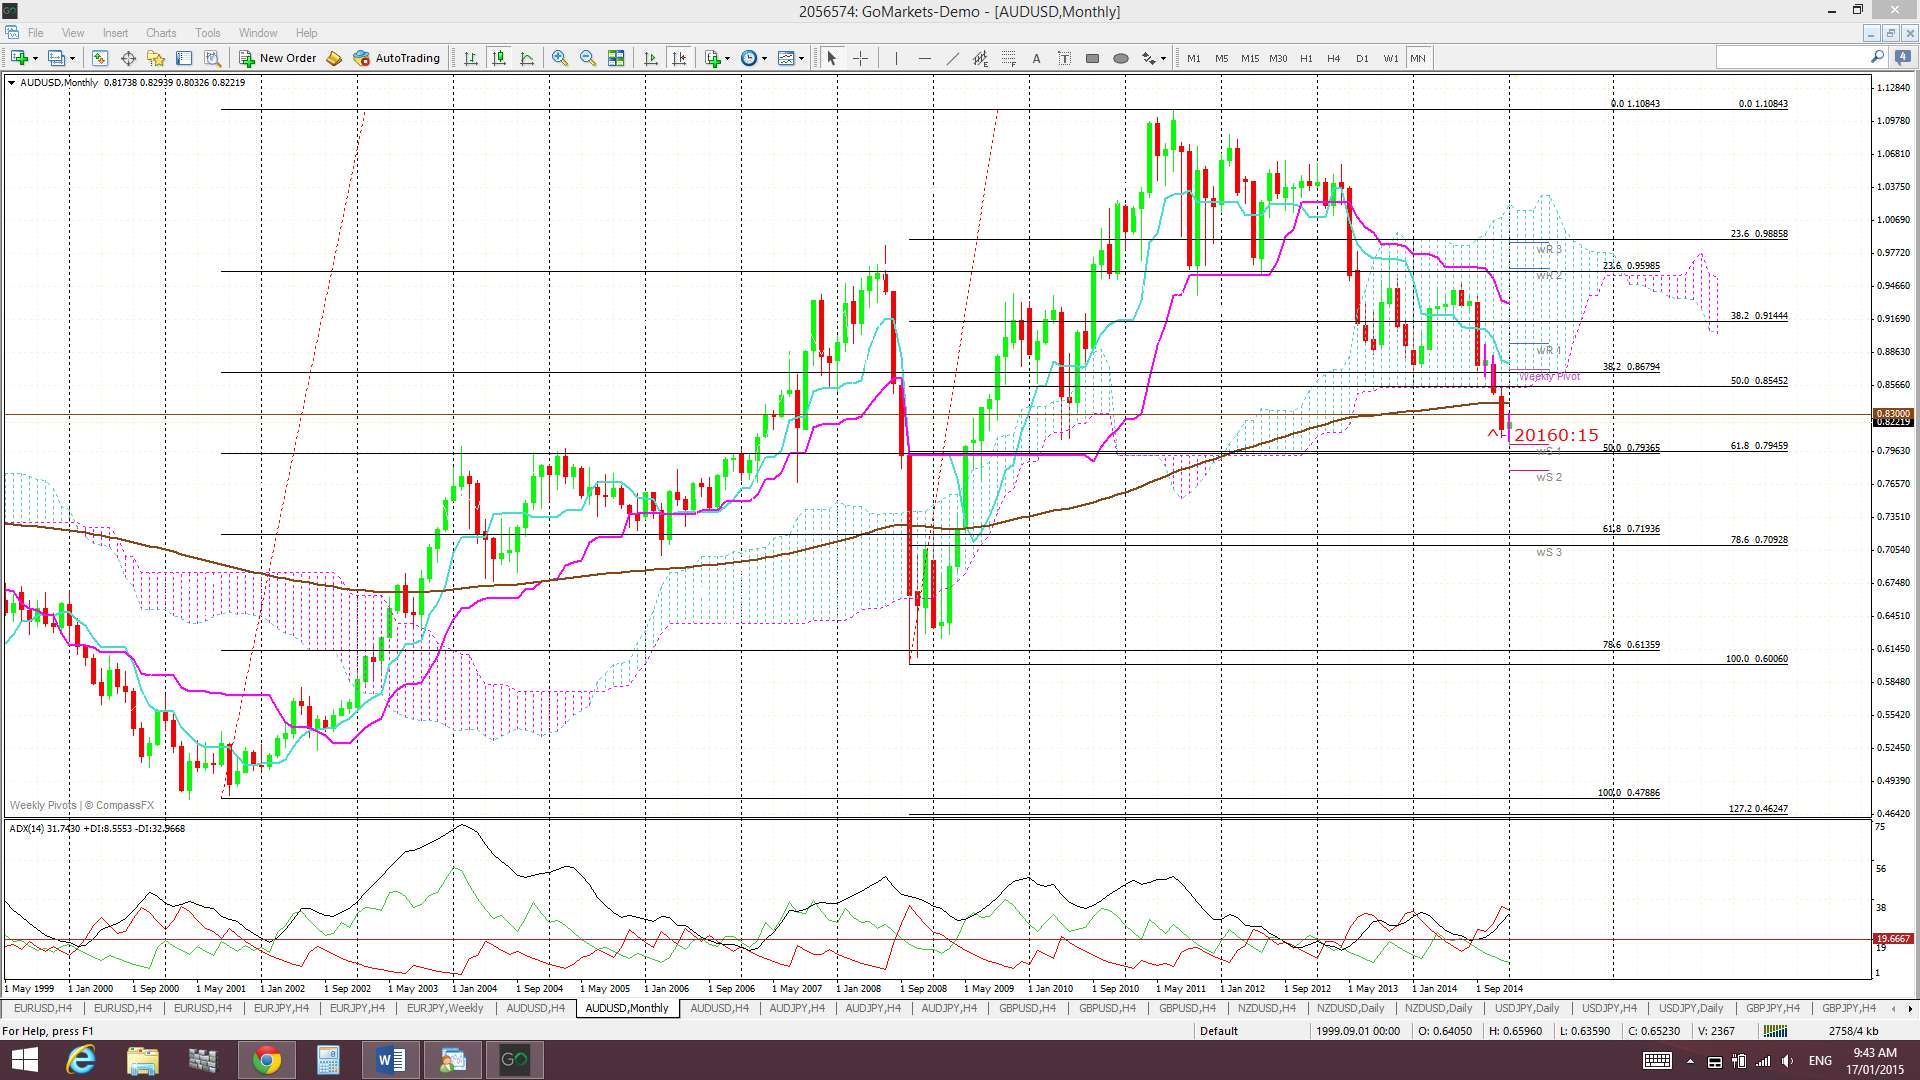
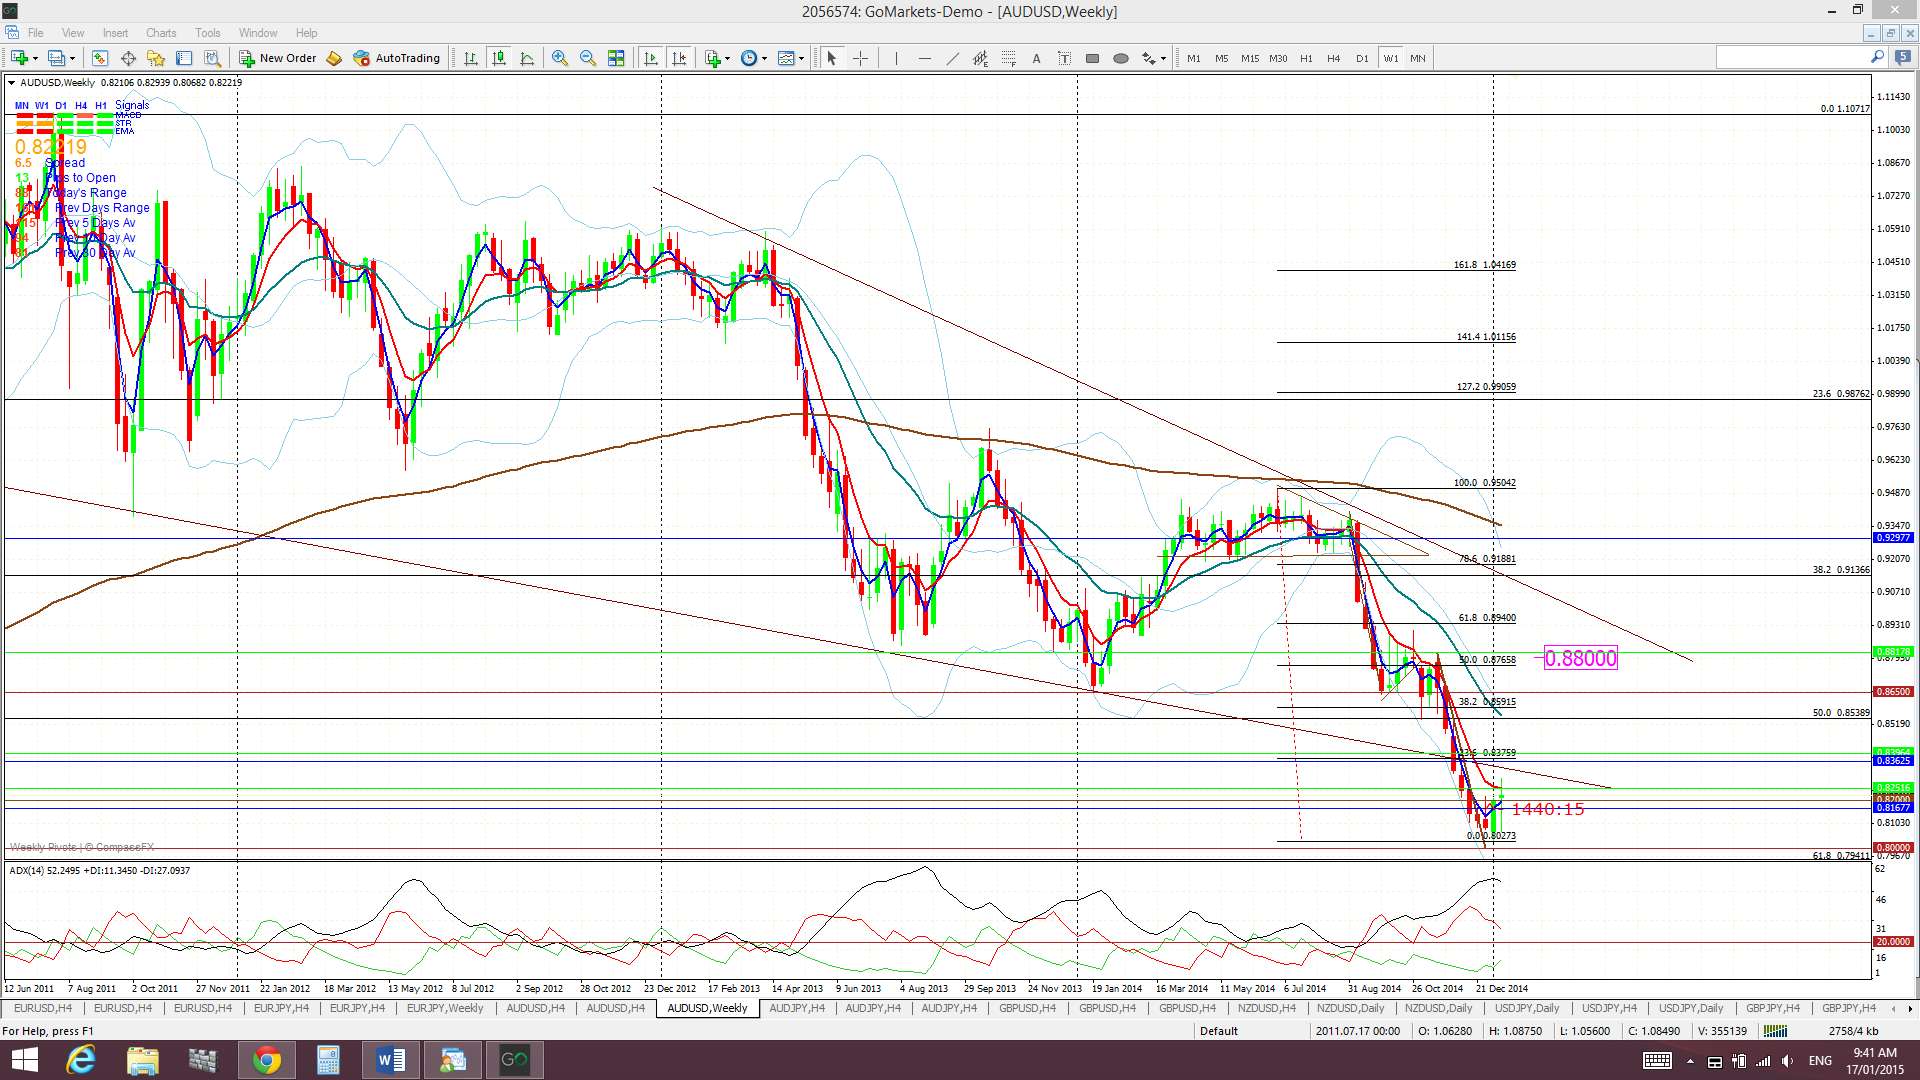
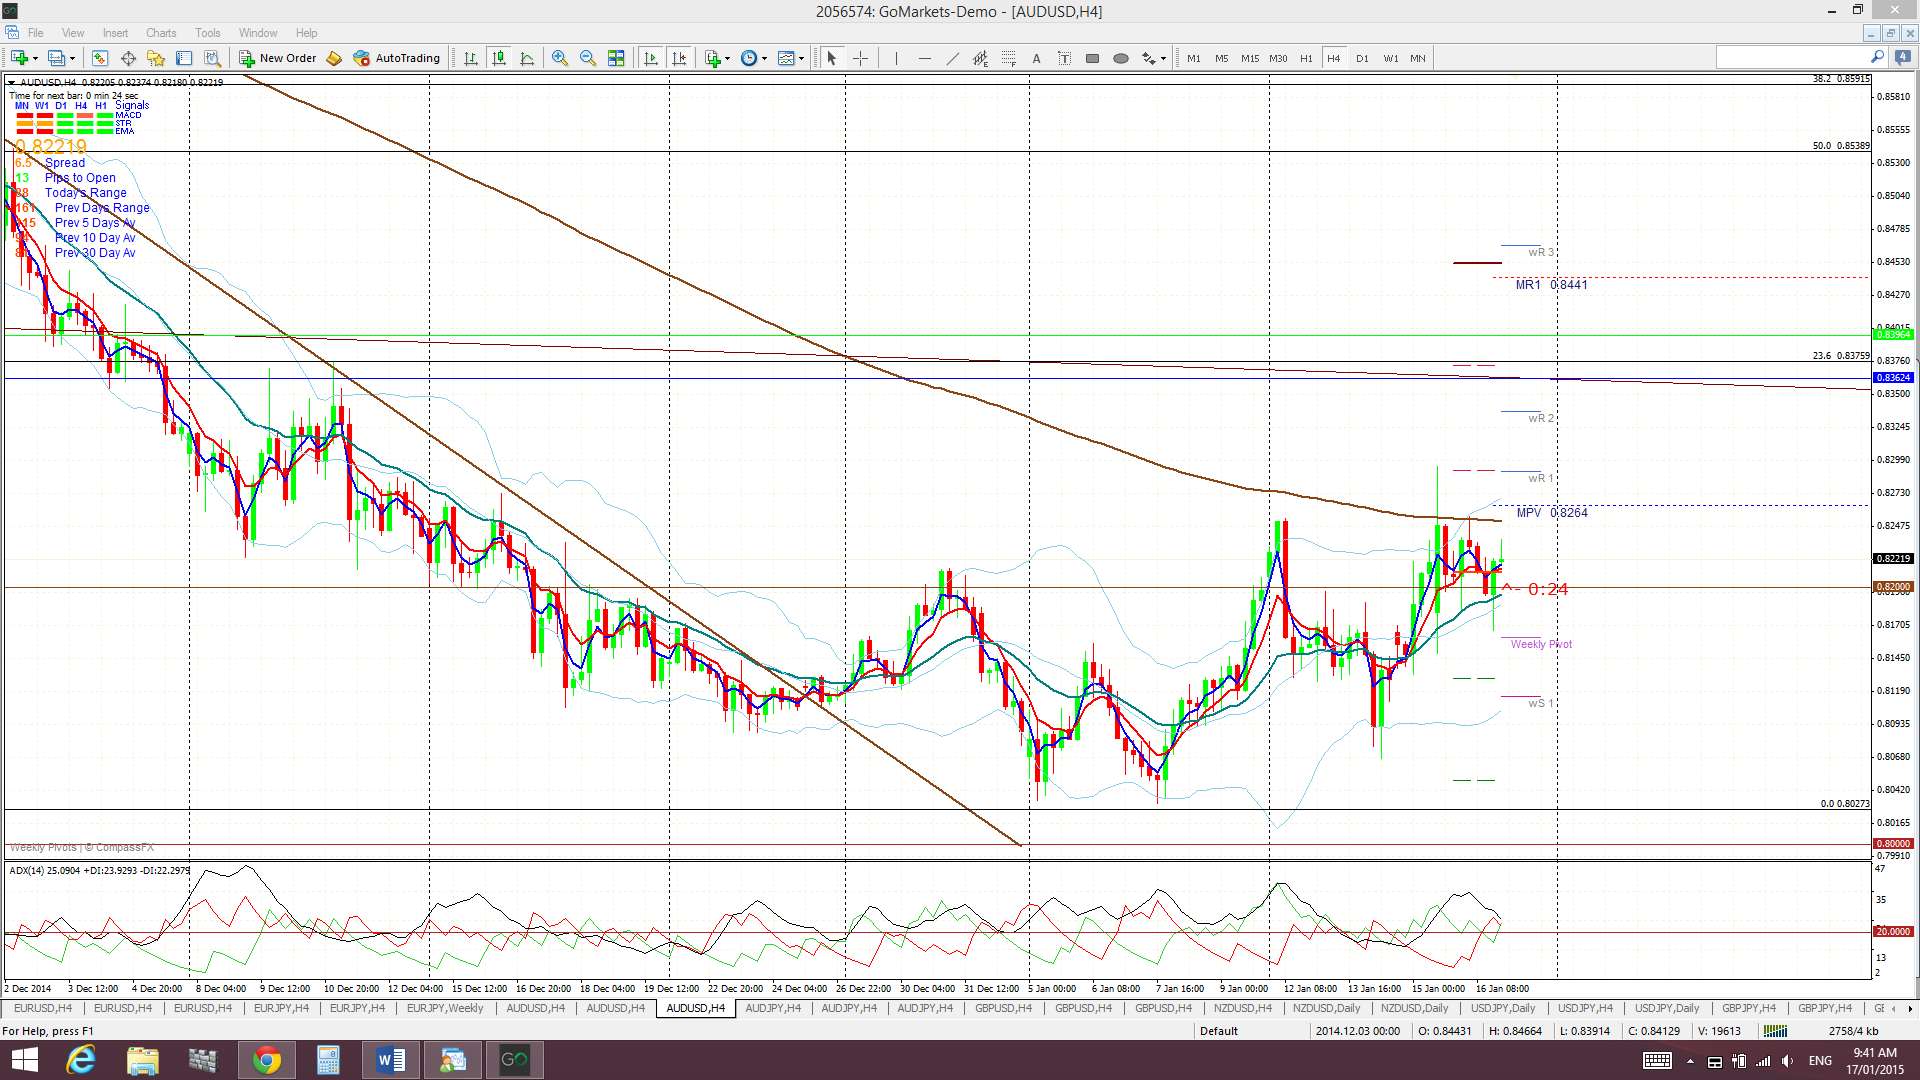
The daily chart shows how the recent Bear Flag has closed off but how any move back below 0.80 could signal the start of another such 600 pip Bear Flag.
Price is now trading above the Cloud on the 4hr but below on the daily, weekly and monthly charts. I’m watching to see if price action can make a decisive move away from the 4hr Cloud:

The weekly candle closed as a bullish coloured Doji following last week’s bullish engulfing candle.
I read a w/e report citing that the PBOC (Peoples Bank of China) recently unveiled further stimulus measures. This news has the potential to support the A/U and any hold above 0.82 will have me looking for a possible move up towards 0.88. This is the region of the daily 200 EMA and is mid-way between the 61.8% and 50% fib of the recent swing low move. These levels are best seen on the daily chart posted below.
Whilst RBA jawboning of the AUD lower is still close to mind a bounce, even if only temporary, isn’t out of the question. Keep in mind too that any continued increase with Gold and potential USD weakness would help to support this pair too.
- I’m watching for any new TC signal on this pair and the 0.82 level.

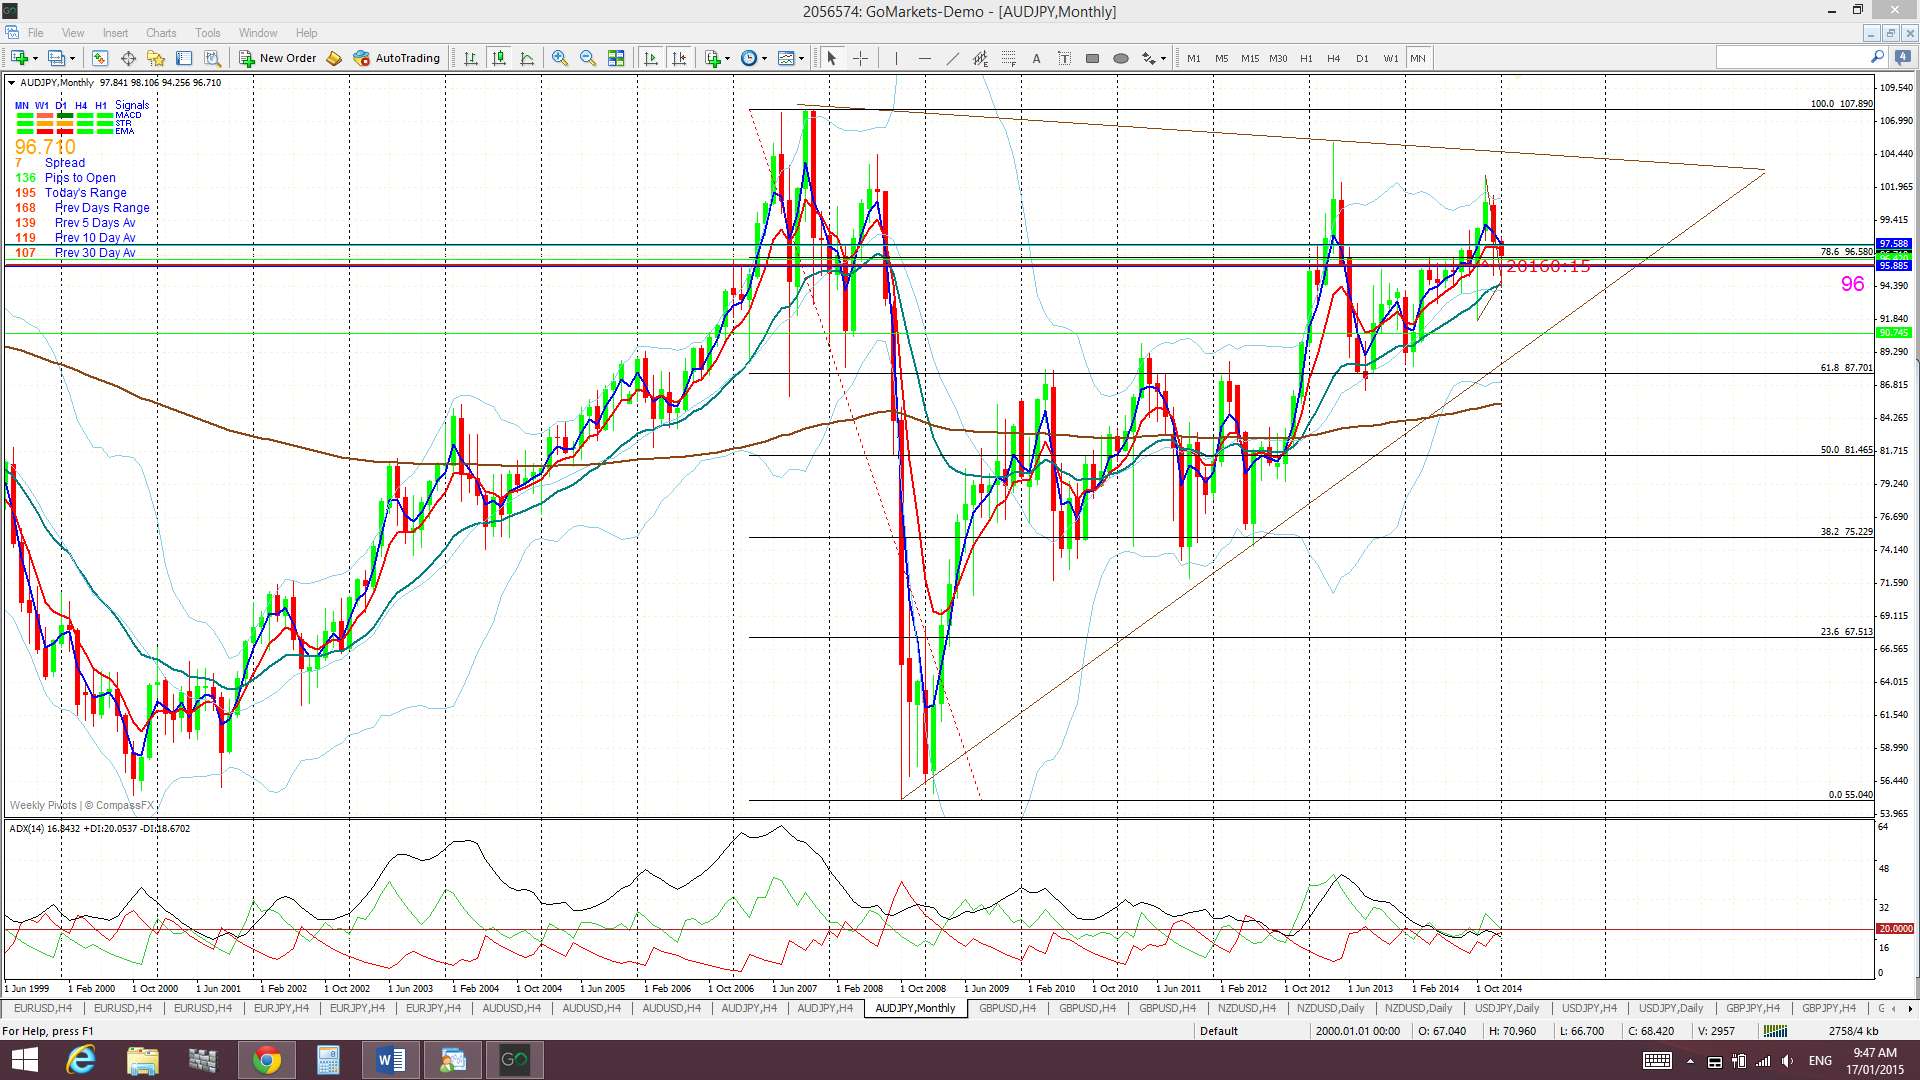
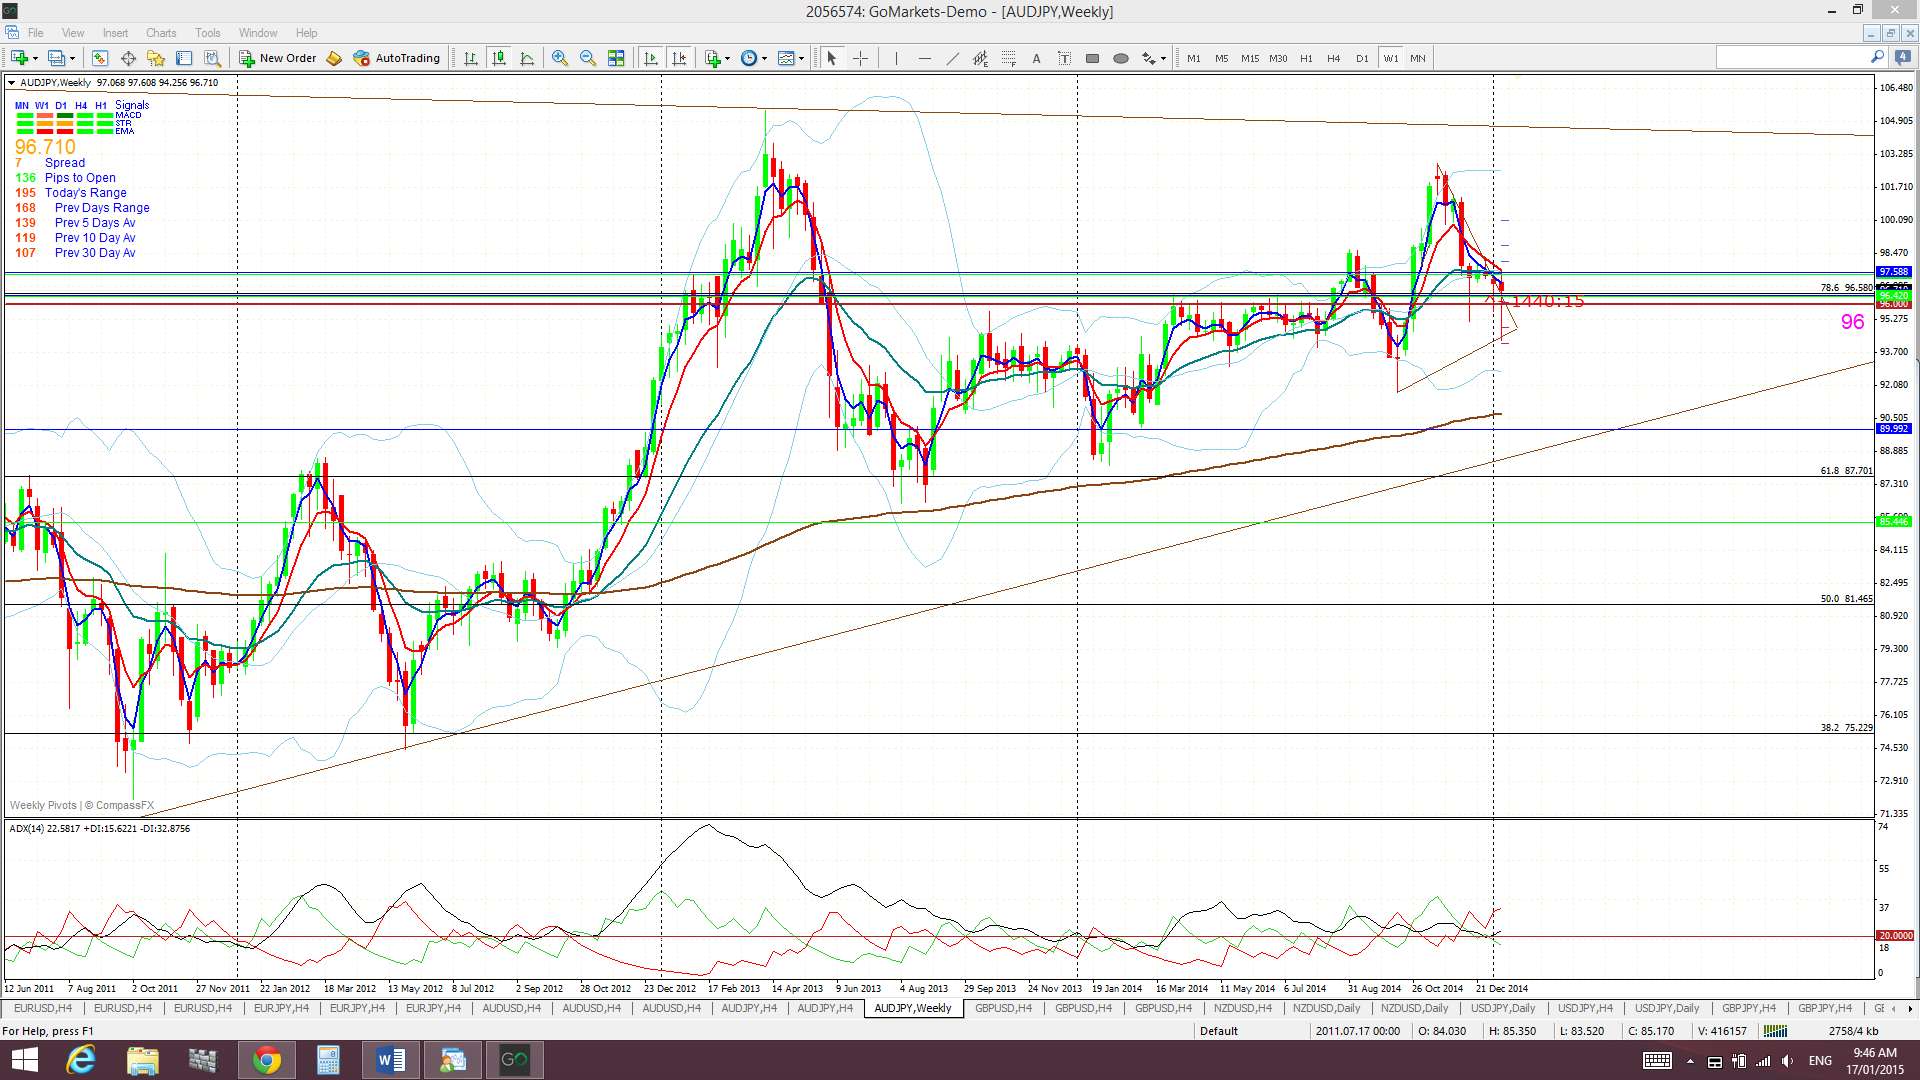
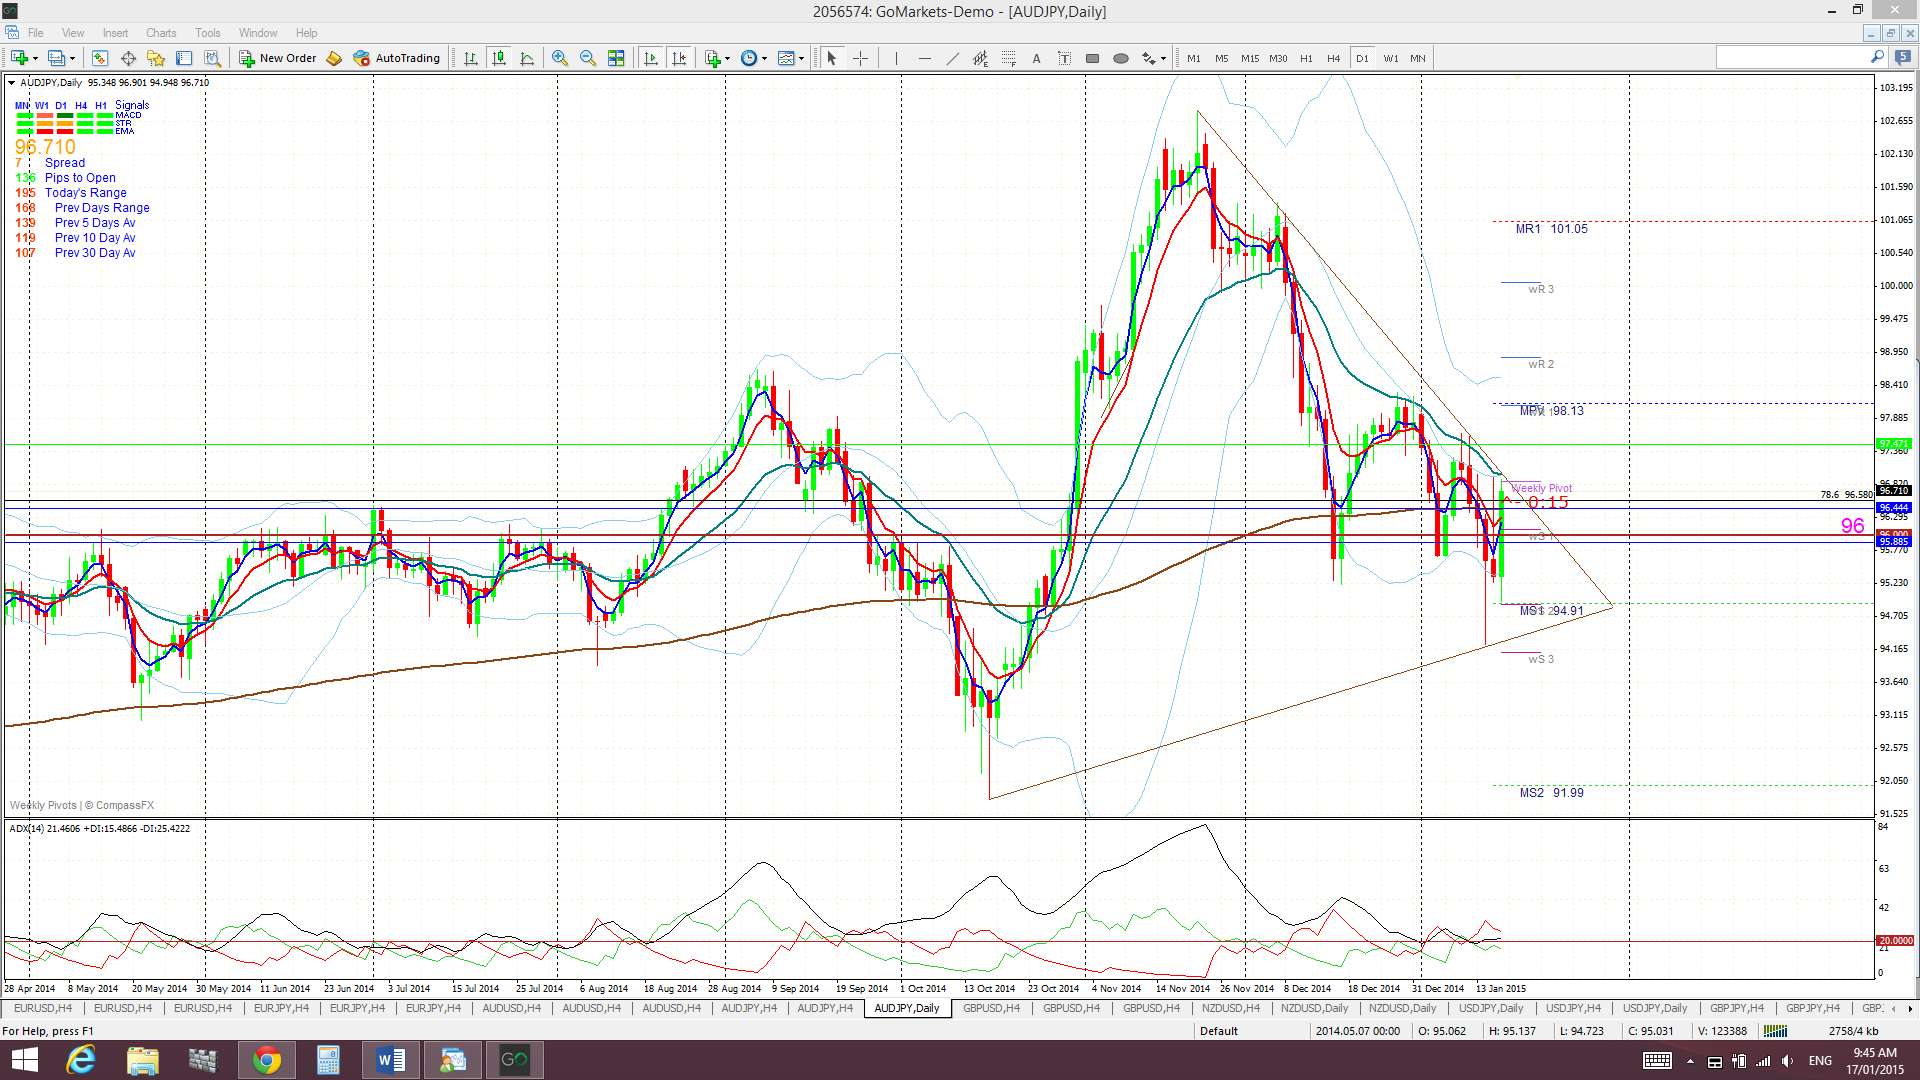
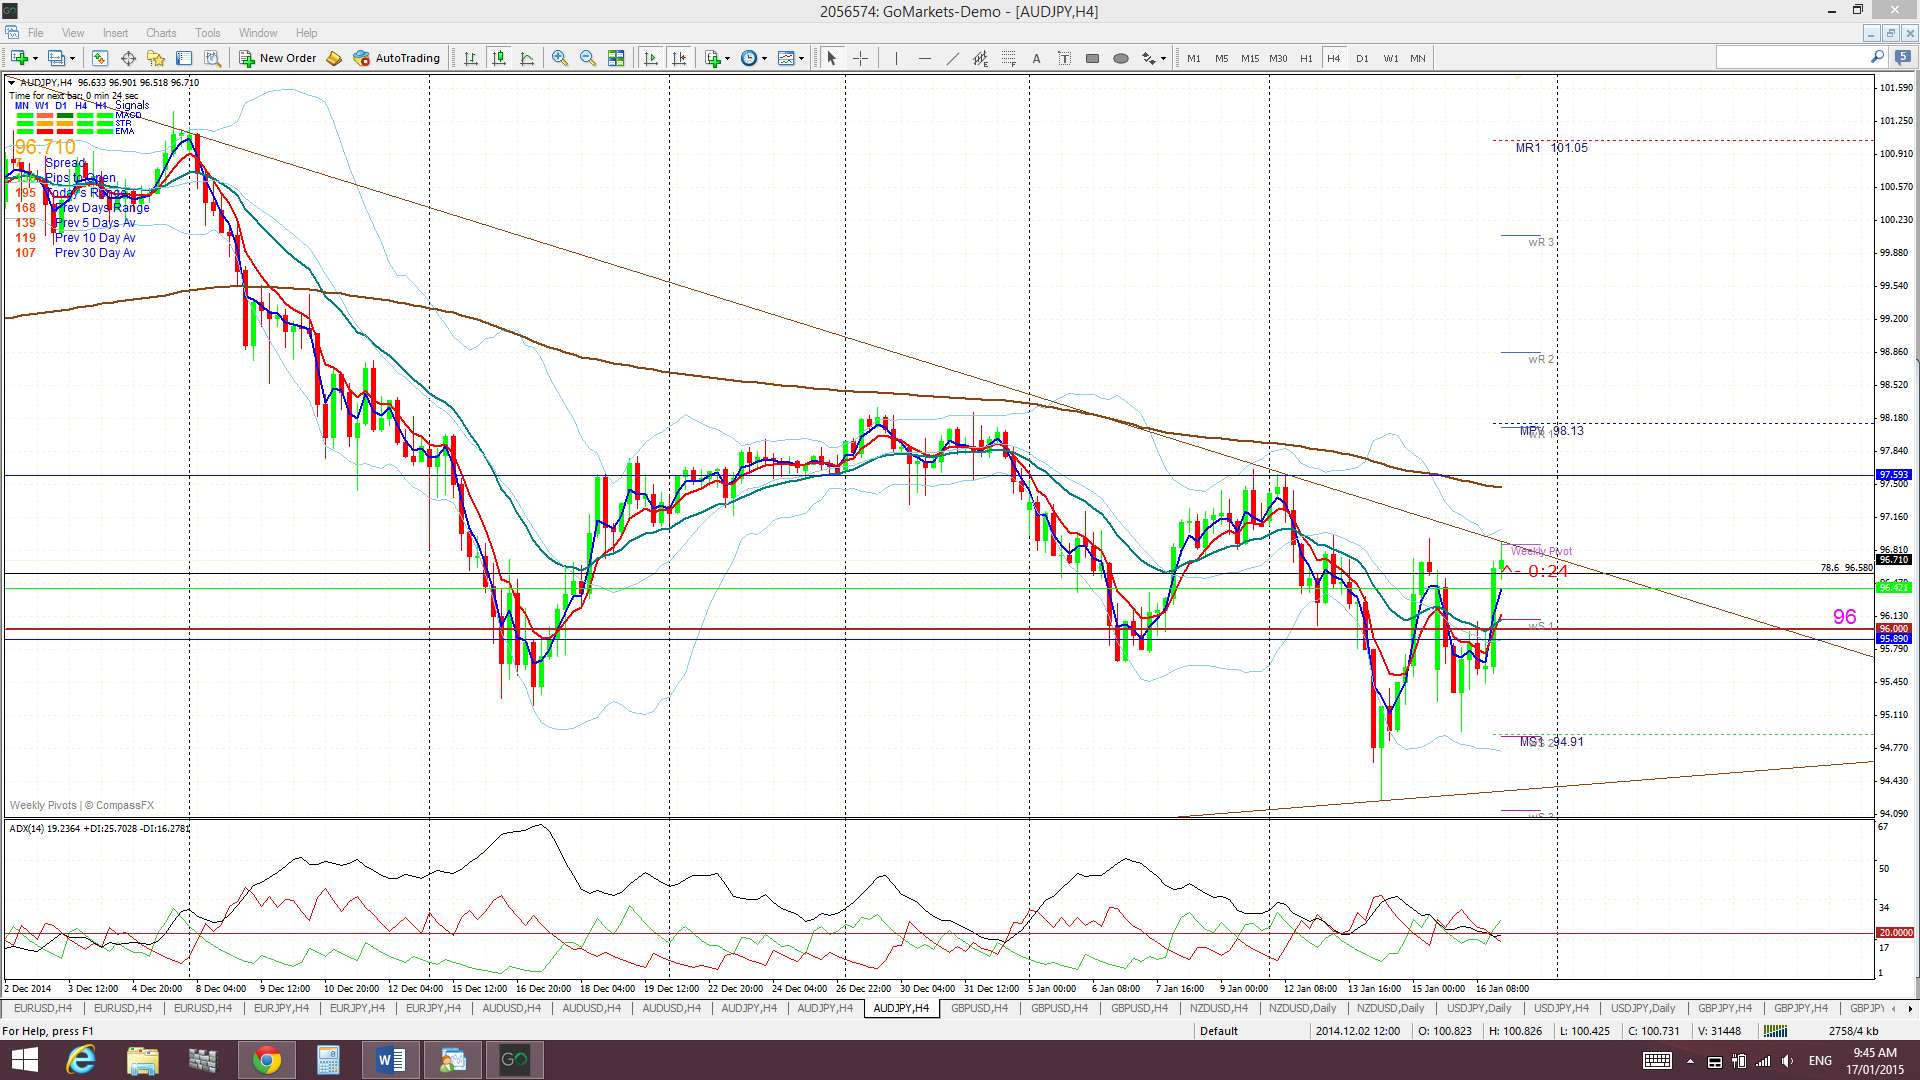
A/J: The A/J continued to chop around either side of the 96 level last week but finished the week above this support. The 96 level is a major S/R level for the A/J as can be seen on the monthly chart. This pair has given a few false triangle breakdowns and so I have revised this pattern. I will continue to watch for any triangle breakout that evolves with momentum.
Price is trading just below the Cloud on the 4hr and daily charts but above on the weekly and monthly charts.
The weekly candle closed as another bearish coloured Doji candle.
- I’m watching for any new TC signal on this pair, the 96 level and the triangle trend lines.
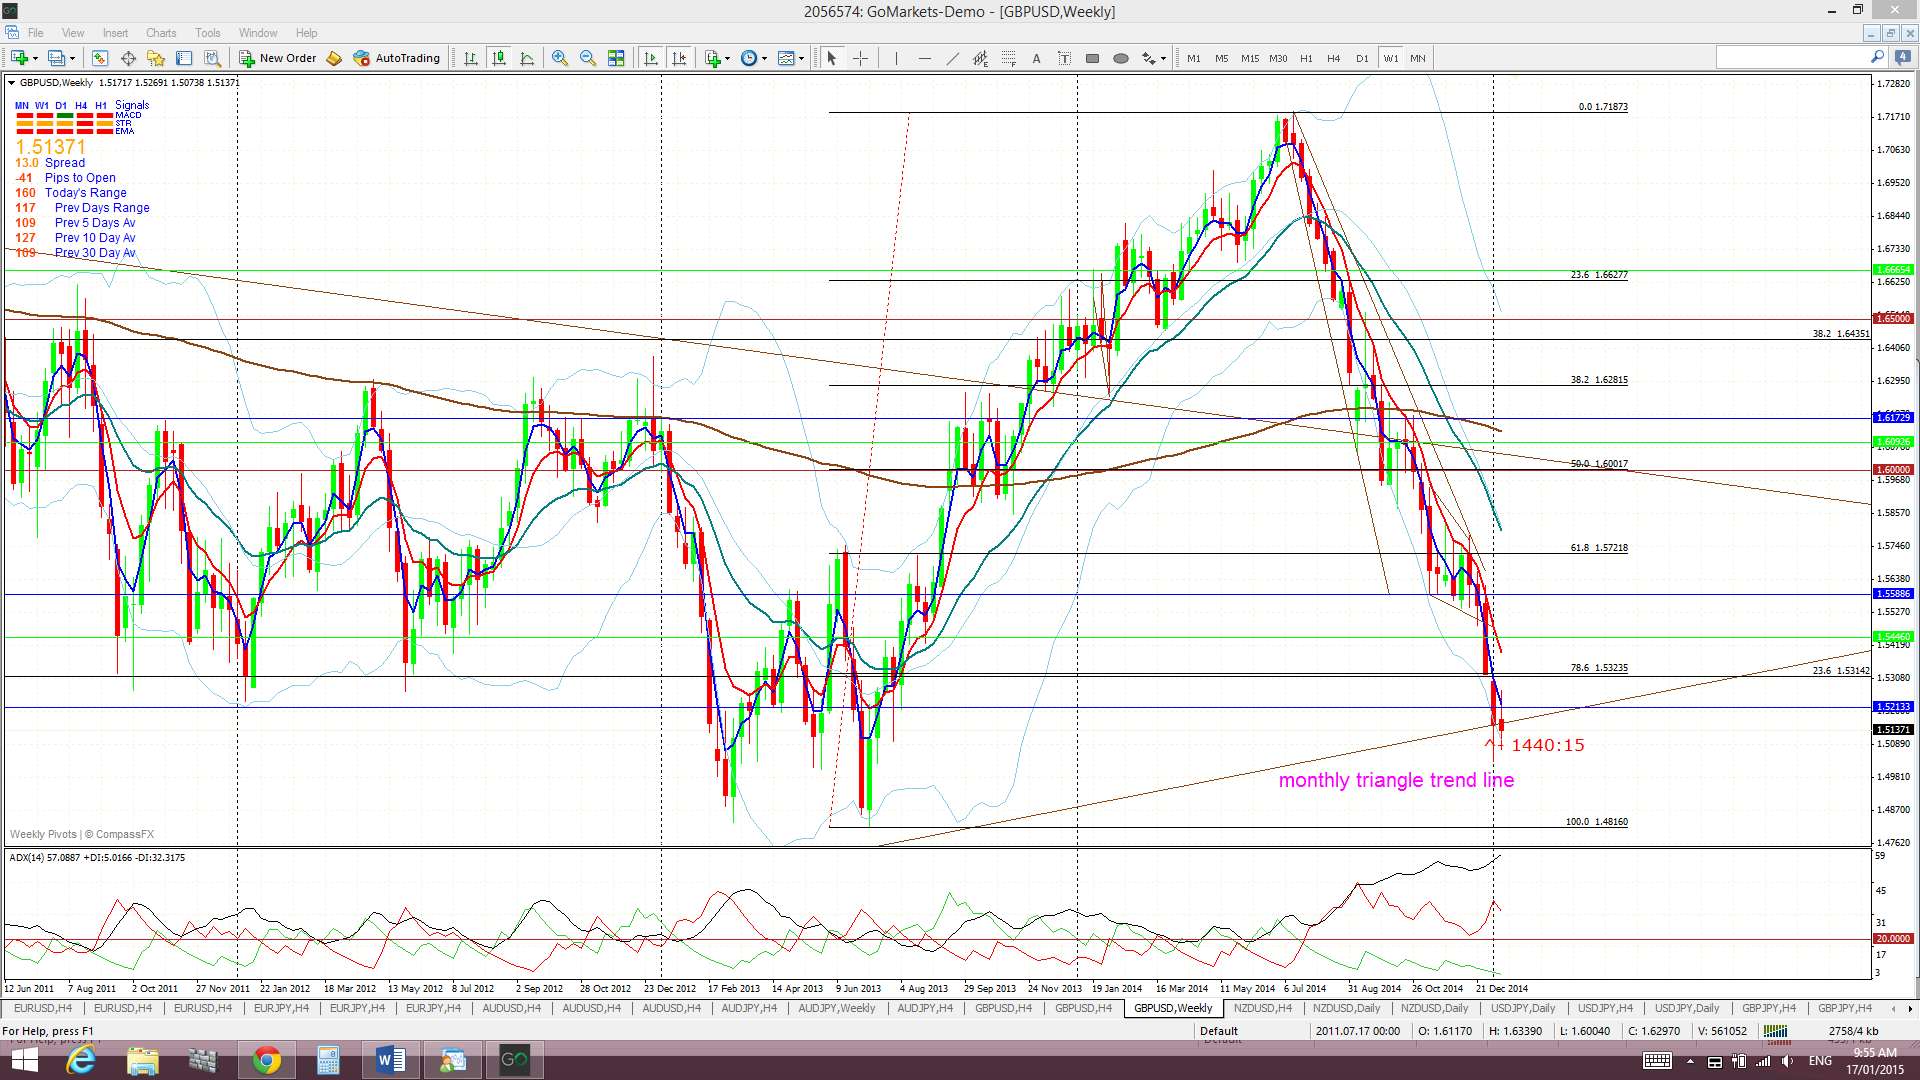
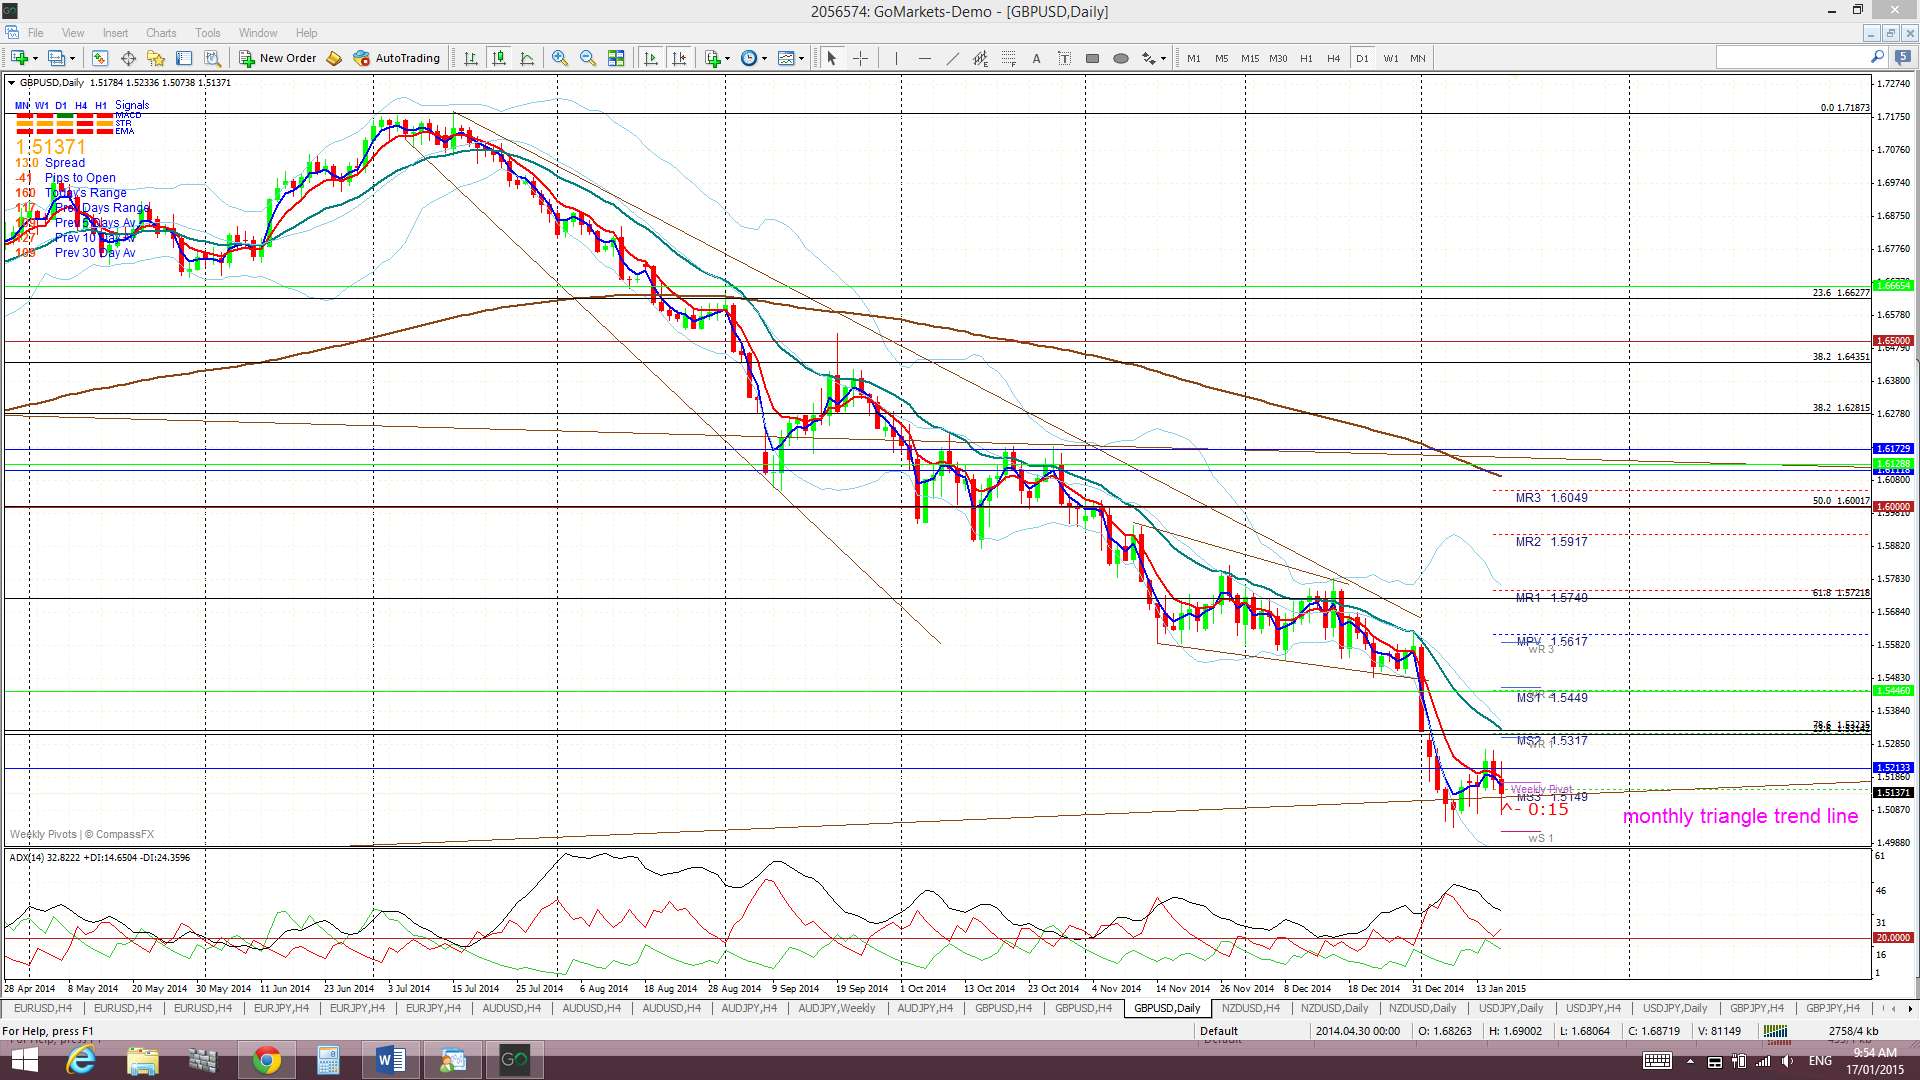
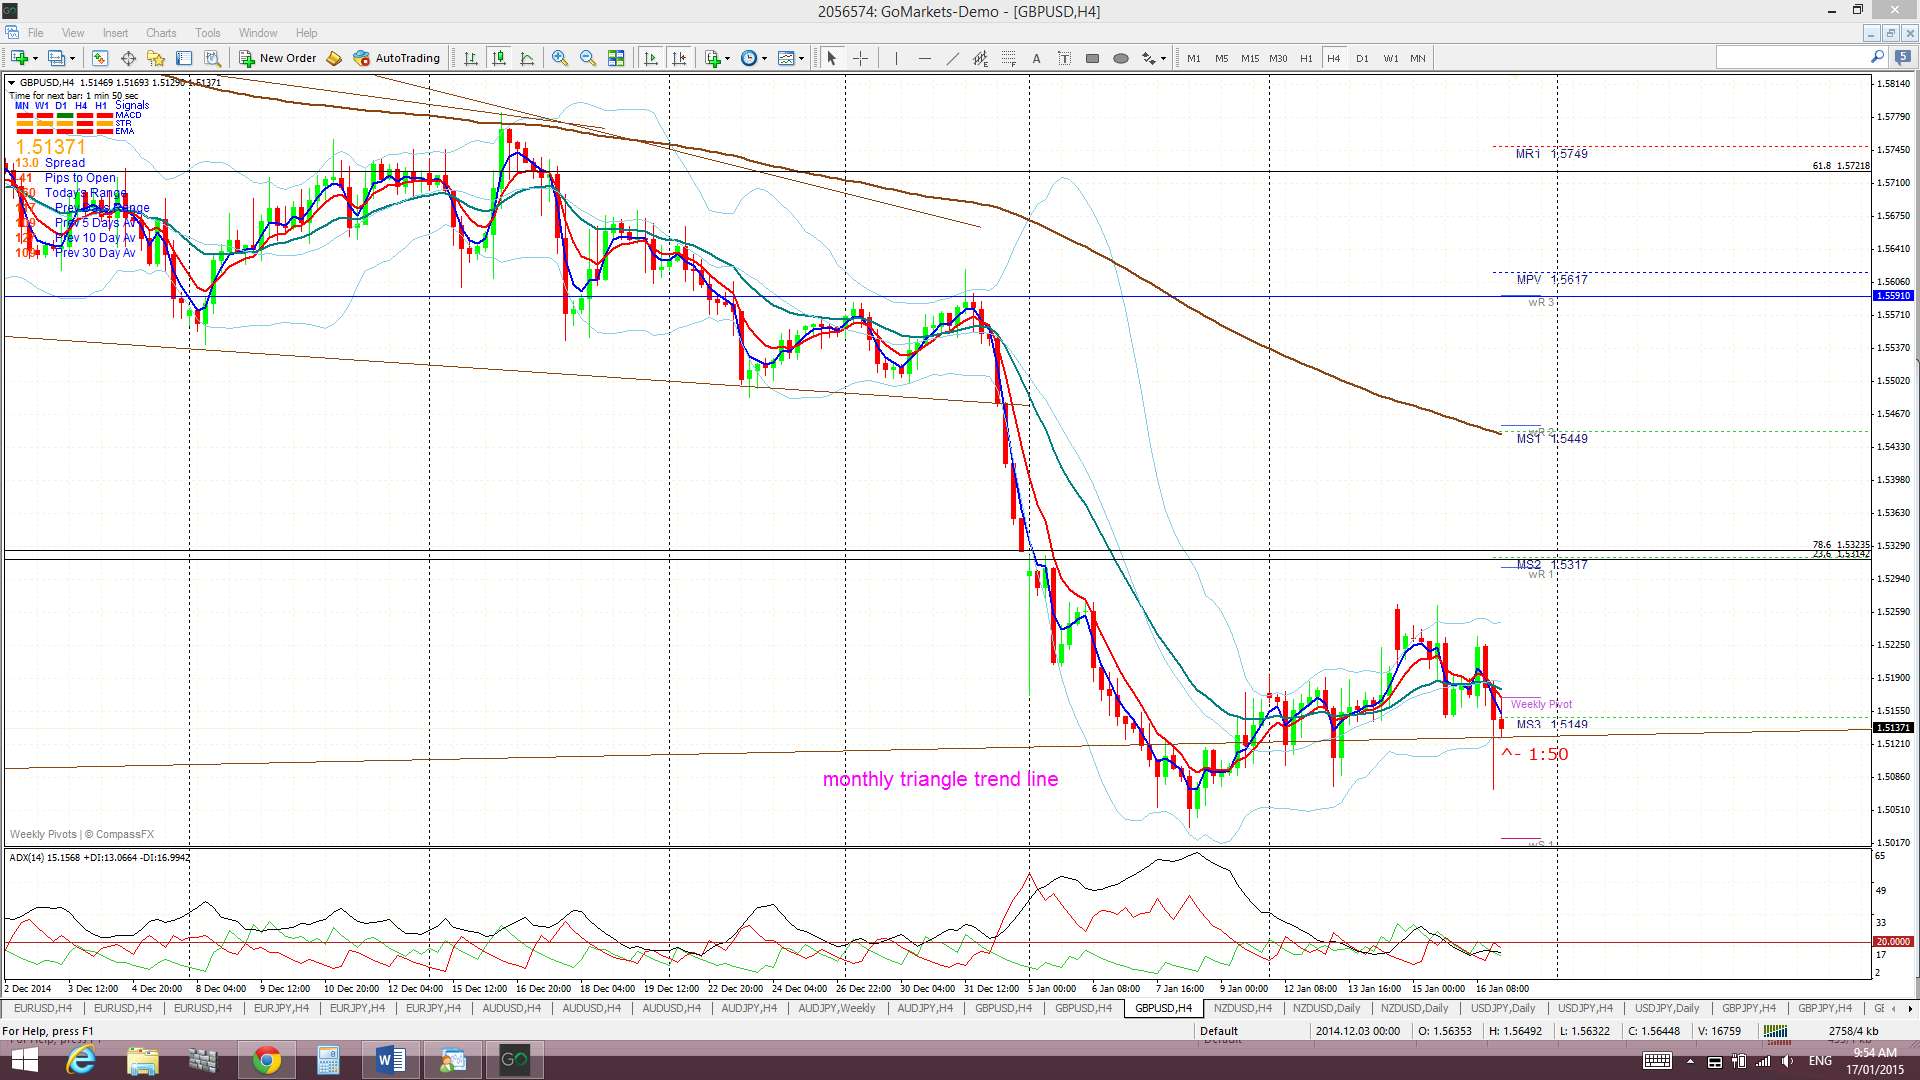
G/U: Although printing a bearish weekly candle the Cable put in a reasonable week. Price managed to hold up near the support of the major, monthly-chart triangle trend line. The falls with the EUR/GBP would be helping here to offer support here too and, depending on how next week’s ECB news pans out then, this pair could stand to benefit on further flows out of EUR.
Price is now trading in the bottom edge of the Cloud on the 4hr chart but below on the daily, weekly and monthly charts.
The weekly candle closed as a bearish coloured ‘Spinning Top’ candle reflecting some indecision here.
- I’m watching for any new valid TC signal on this pair and the monthly support trend line.

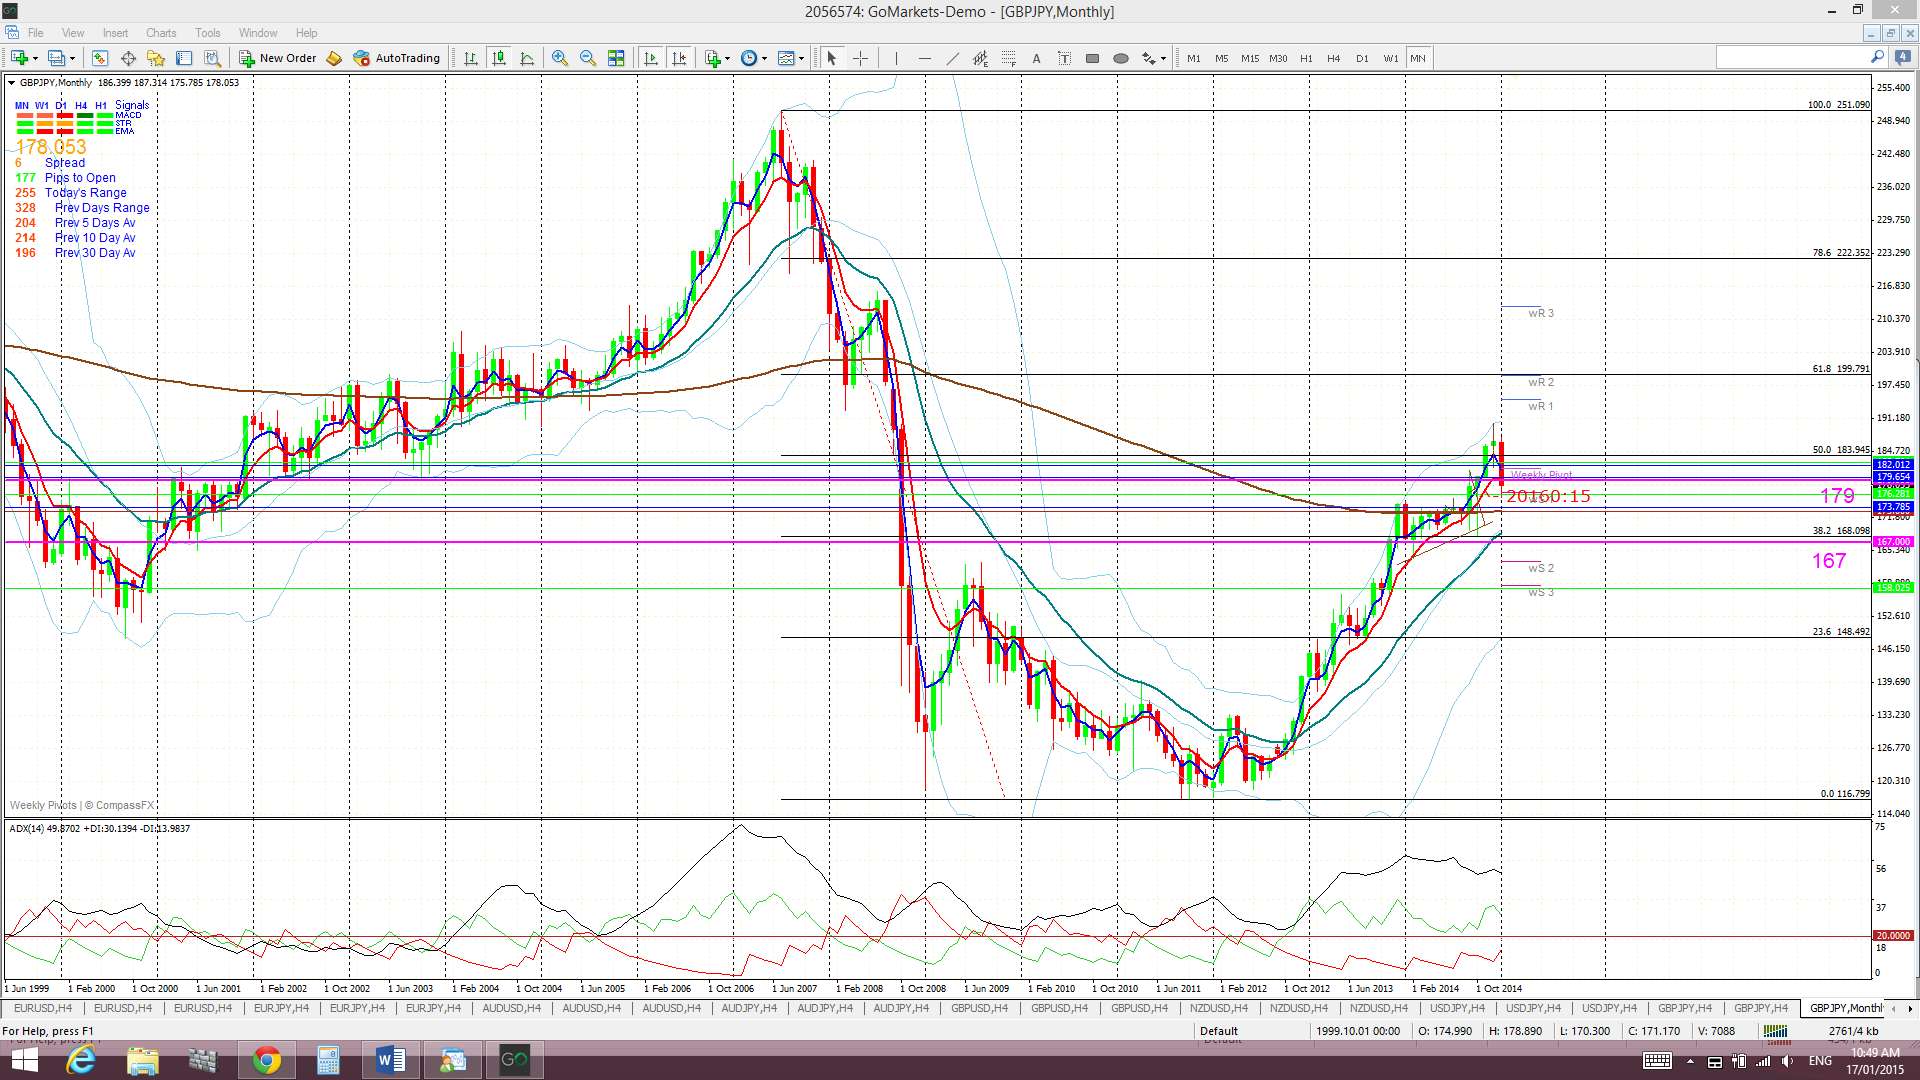
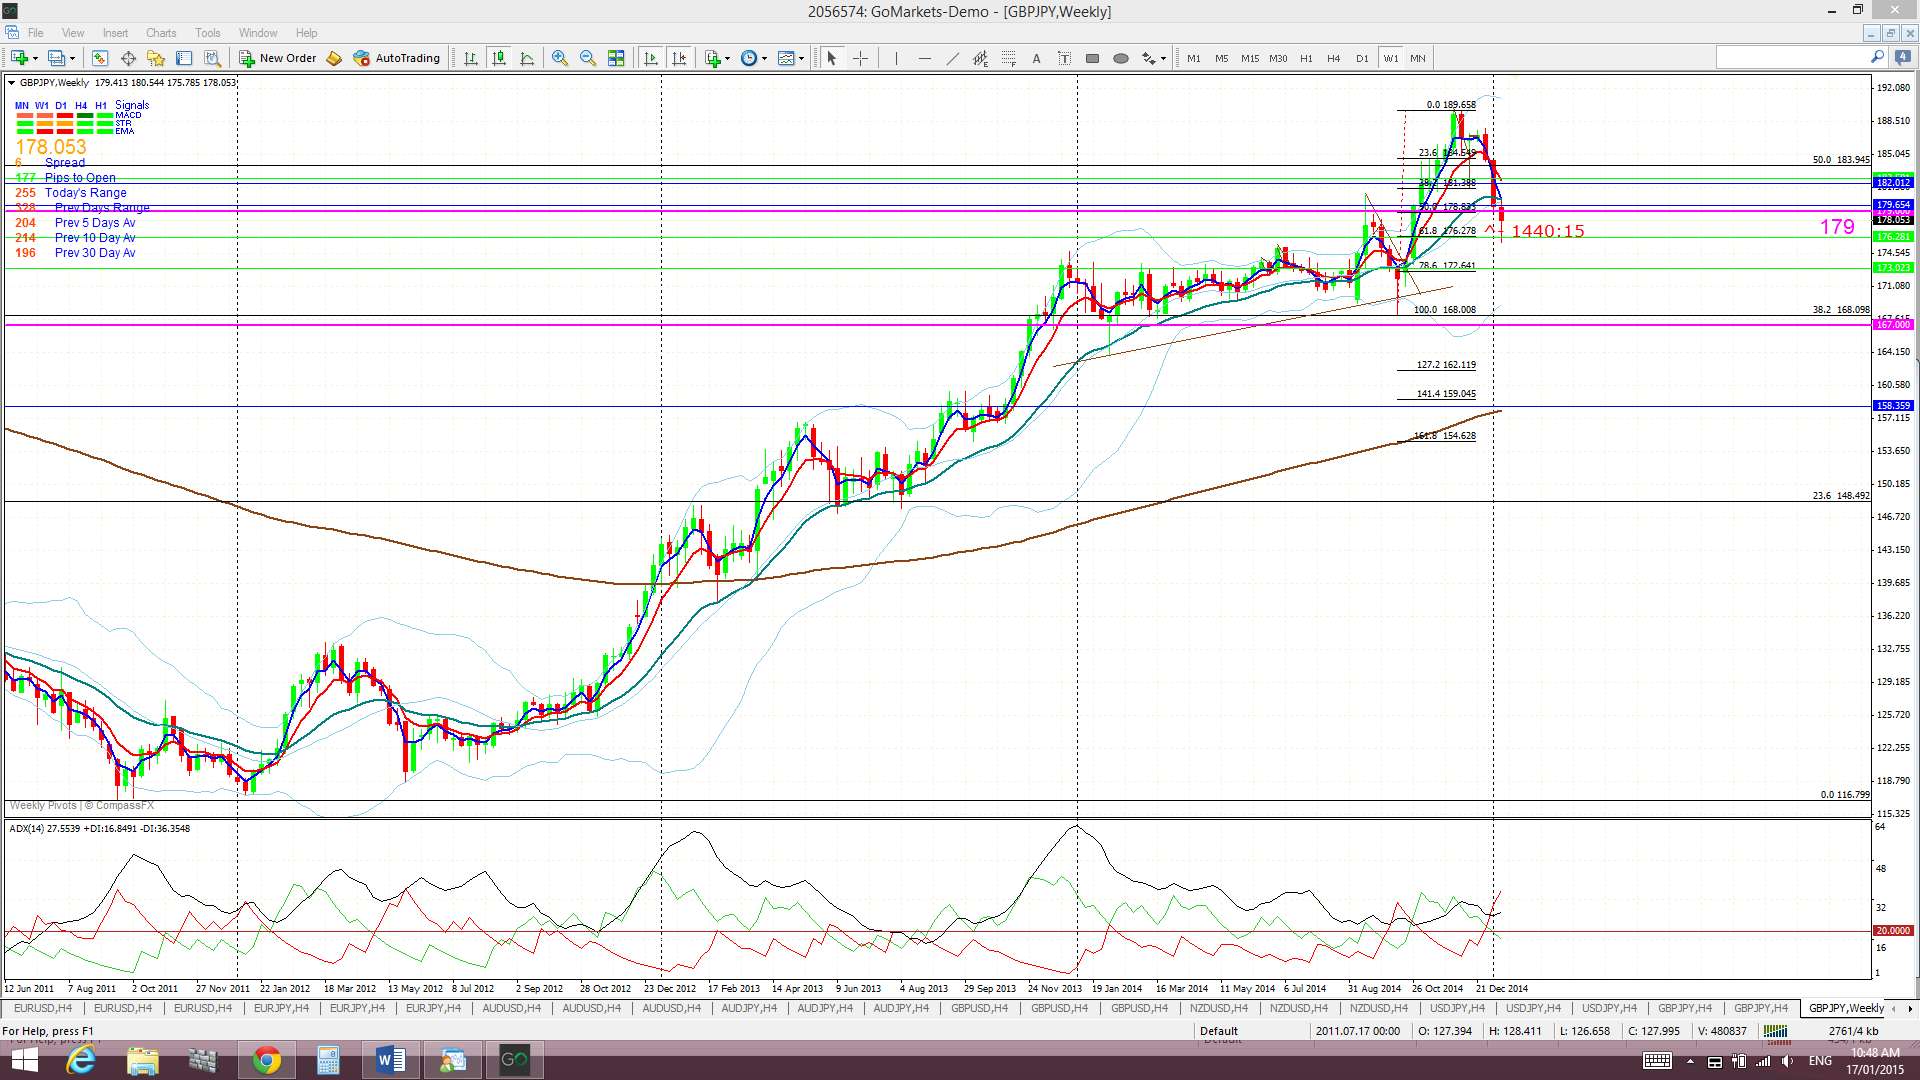
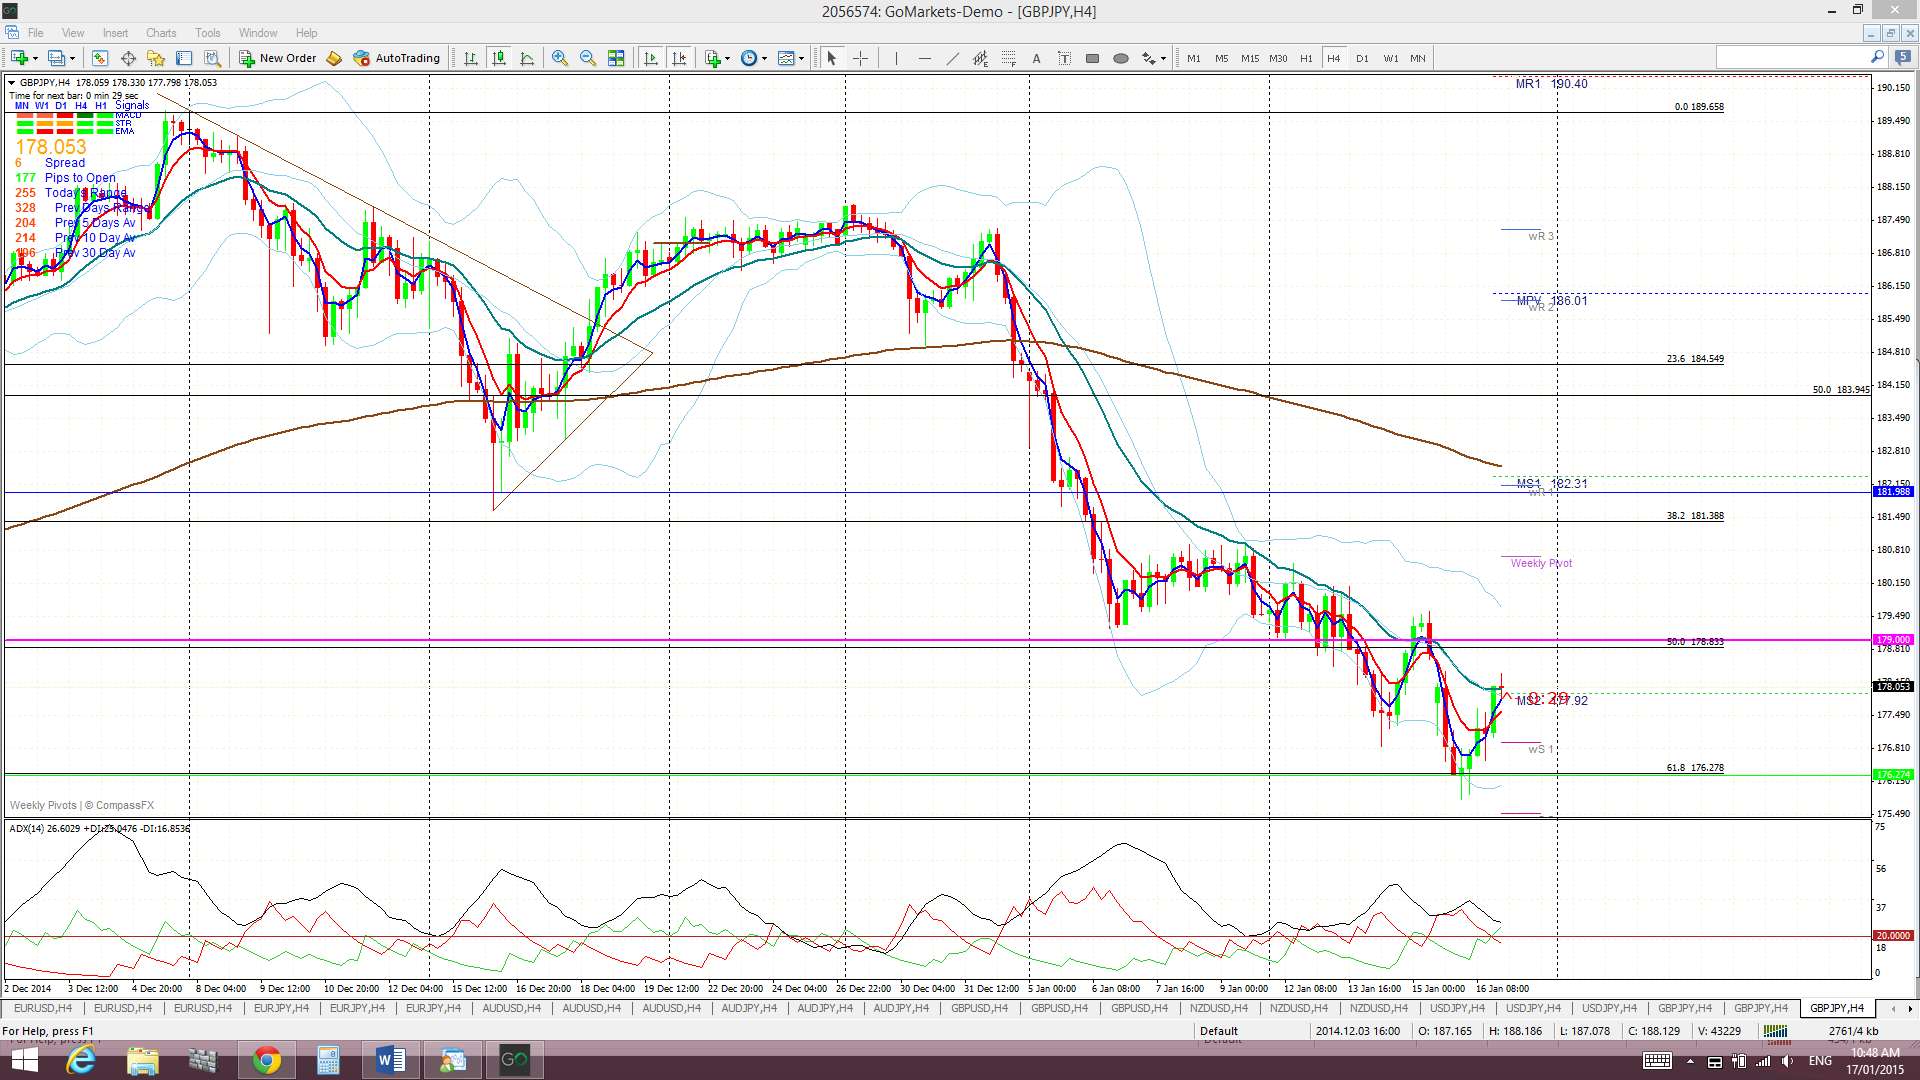
GBP/JPY: The GBP/JPY had a bearish week and fell below the key 179 level. Price pulled back to test this level mid-week but promptly fell away again however it pulled back to just under this level again on Friday. Note on the daily chart how price has bounced back up off the 61.8% fib level. This could be a signal for the end of the bearish pullback so I’m keeping an open mind here and watching the 179 level for clues.
Two key S/R levels on the G/J chart: The monthly chart shows a band of choppy congested activity across the chart. This band is defined by rather strong S/R levels at 179 and 167. The 179 level seems to be a key demarcation level and a close and hold above this would suggest bullish continuation. The key 173 level lies midway between these two S/R levels. Targets for any bullish continuation include the the 61.8% fib near 200 and the 78.6% fib near 222.
Price is now trading below the Ichimoku Cloud on the 4hr and daily charts but above the Cloud on the weekly and monthly charts.
The weekly candle closed as a bearish coloured ‘Spinning Top’ and about as confused as I am!
- I’m watching for any new valid TC signal on this pair and the 179 level.

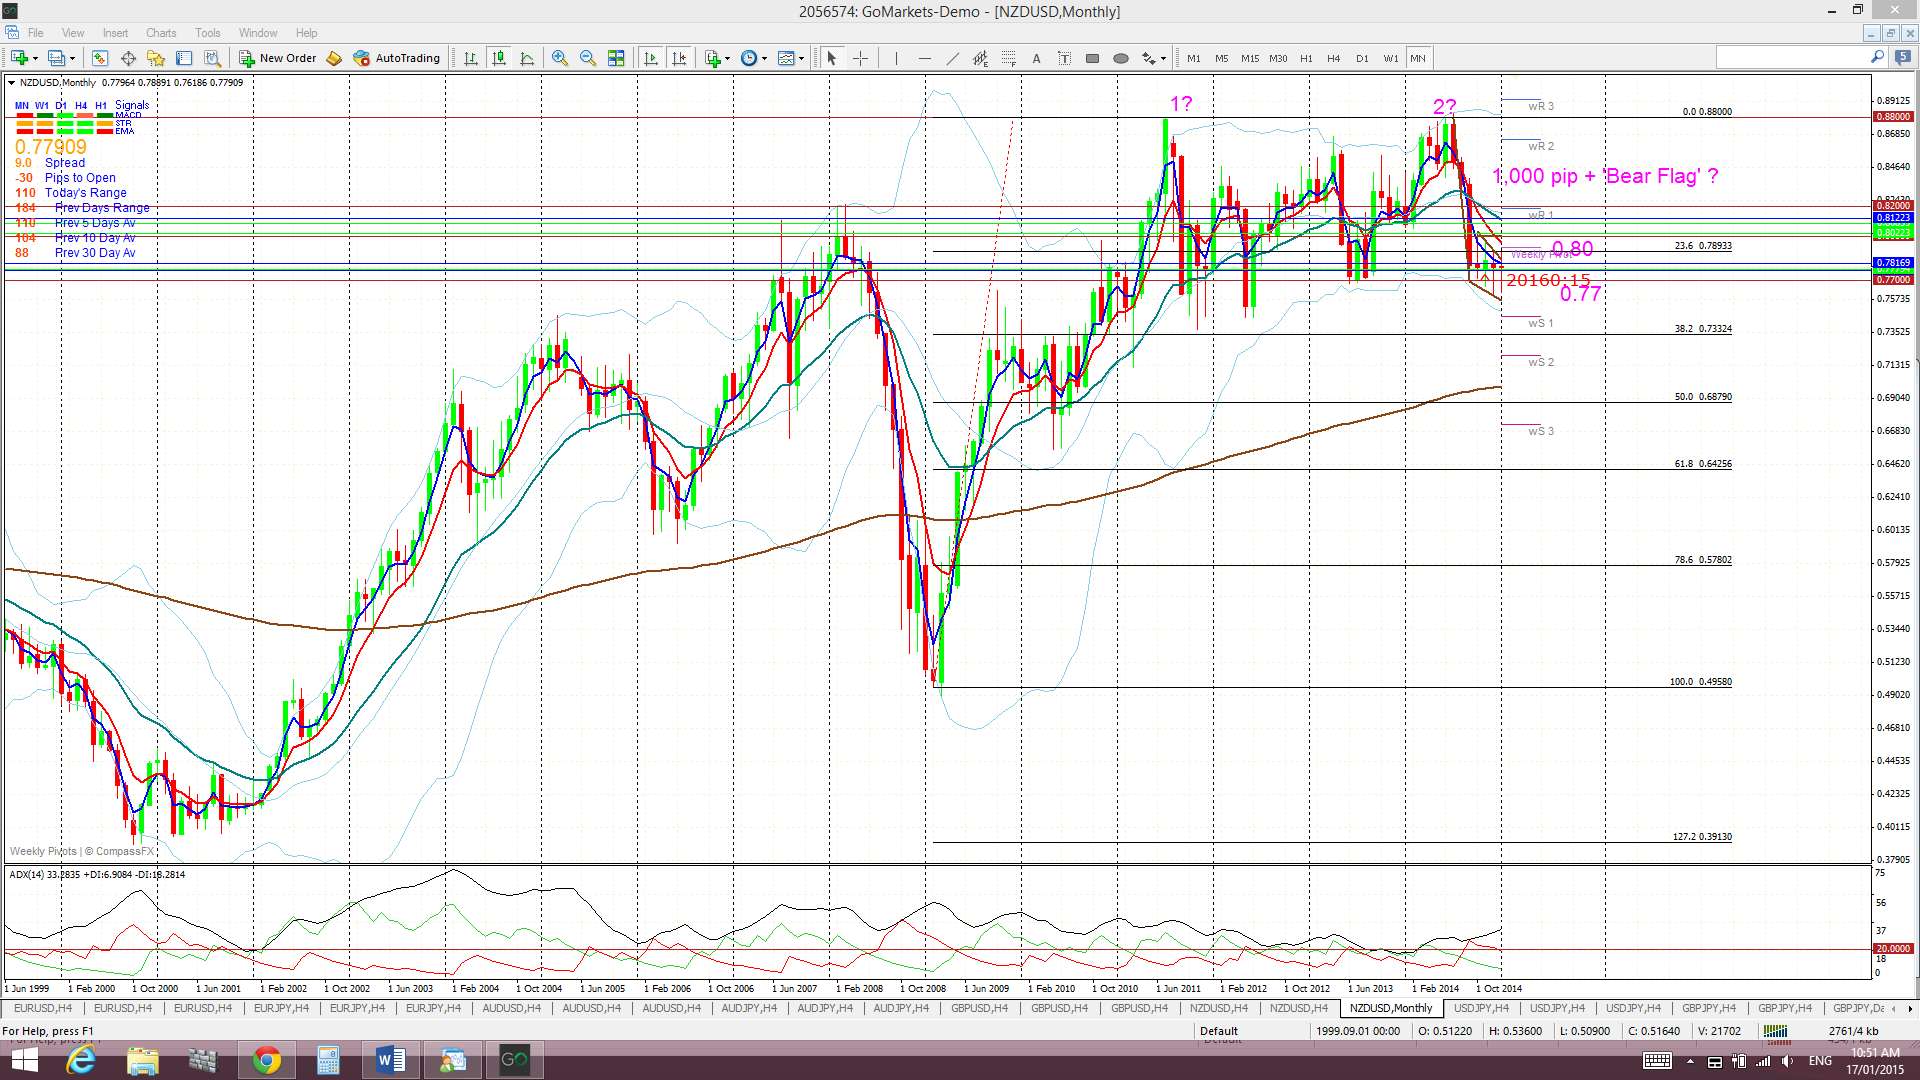
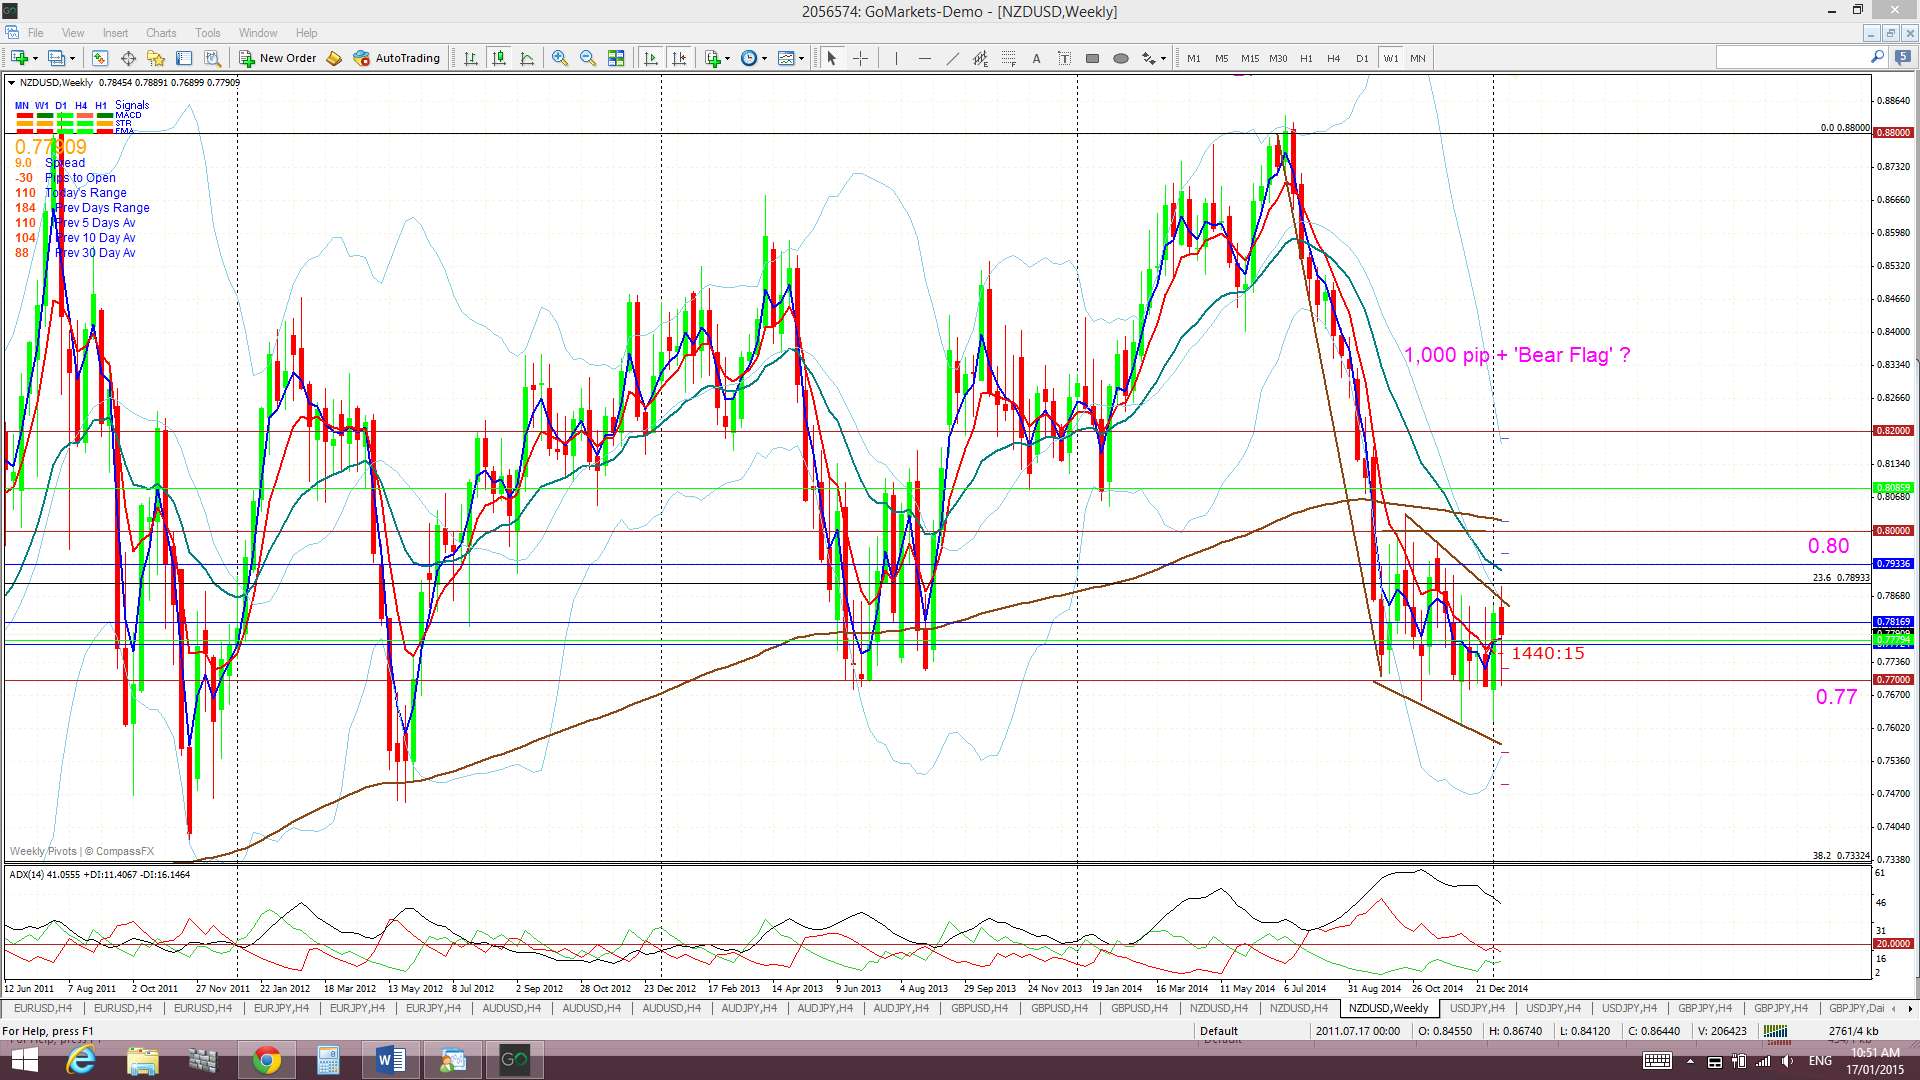
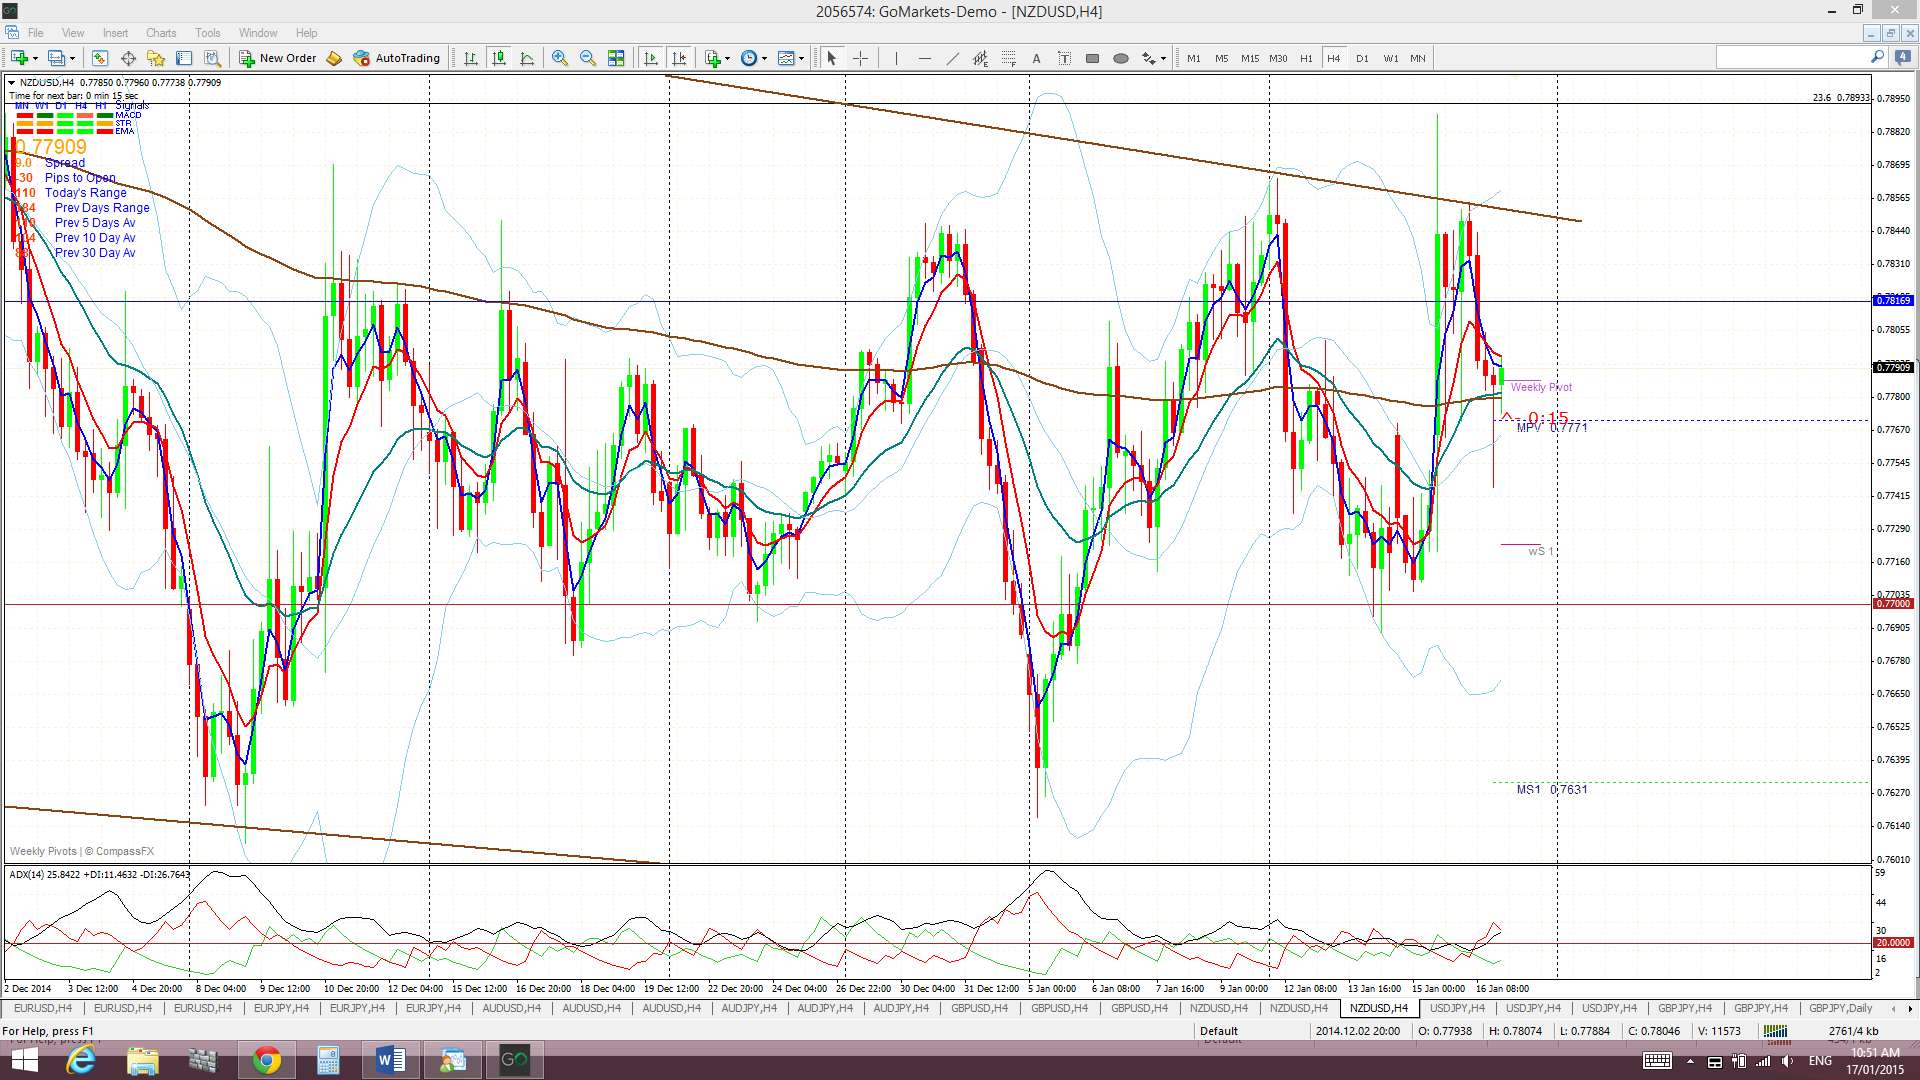
Kiwi: NZD/USD: The Kiwi bounced up off 0.77 support again last week and rallied back for another test of the upper trading channel trend line but failed, yet again, to break out of this channel. The Kiwi has been trading in this descending trading channel for the last 3 months and this has contributed to the ‘Bear Flag’ appearance.
‘Bear Flag’ for Kiwi: The 0.77 remains the key level to watch here as any break and hold below this level would trigger the start of a possible ‘Bear Flag’ move. The 0.77 level represents the previous swing low for the period during mid-2013 and, prior to then, from mid-2012. The ‘Flag Pole’ for the Kiwi’s ‘Bear Flag’ is about 1,100 pips. Thus, any bearish breakdown and continuation below the ‘Flag’ trend line may be expected to extend by 1,100 pips as well. This would bring the Kiwi down to near 0.67 cents. This level is between the 61.8 and 78.6% fibs of the 2009-2014 bull run. Given that the 0.77 is strong support I would still prefer to wait to confirm any possible ‘Bear Flag’ move until there is a close and hold below this 0.77 level.
Fib levels shows other possible targets for any bearish continuation below 0.77 as being the:
- 38.2% fib near 73.5.
- 50% fib near 70 and the monthly 200 EMA.
- 61.8% fib near 0.65.
Price is trading in the top edge of the Ichimoku Cloud on the 4hr chart, in the Cloud on the daily chart, well below on the weekly chart and in the top edge of the Cloud on the monthly chart. The Kiwi has been trading below the daily Cloud since last July and so any break above this resistance would be bullish:
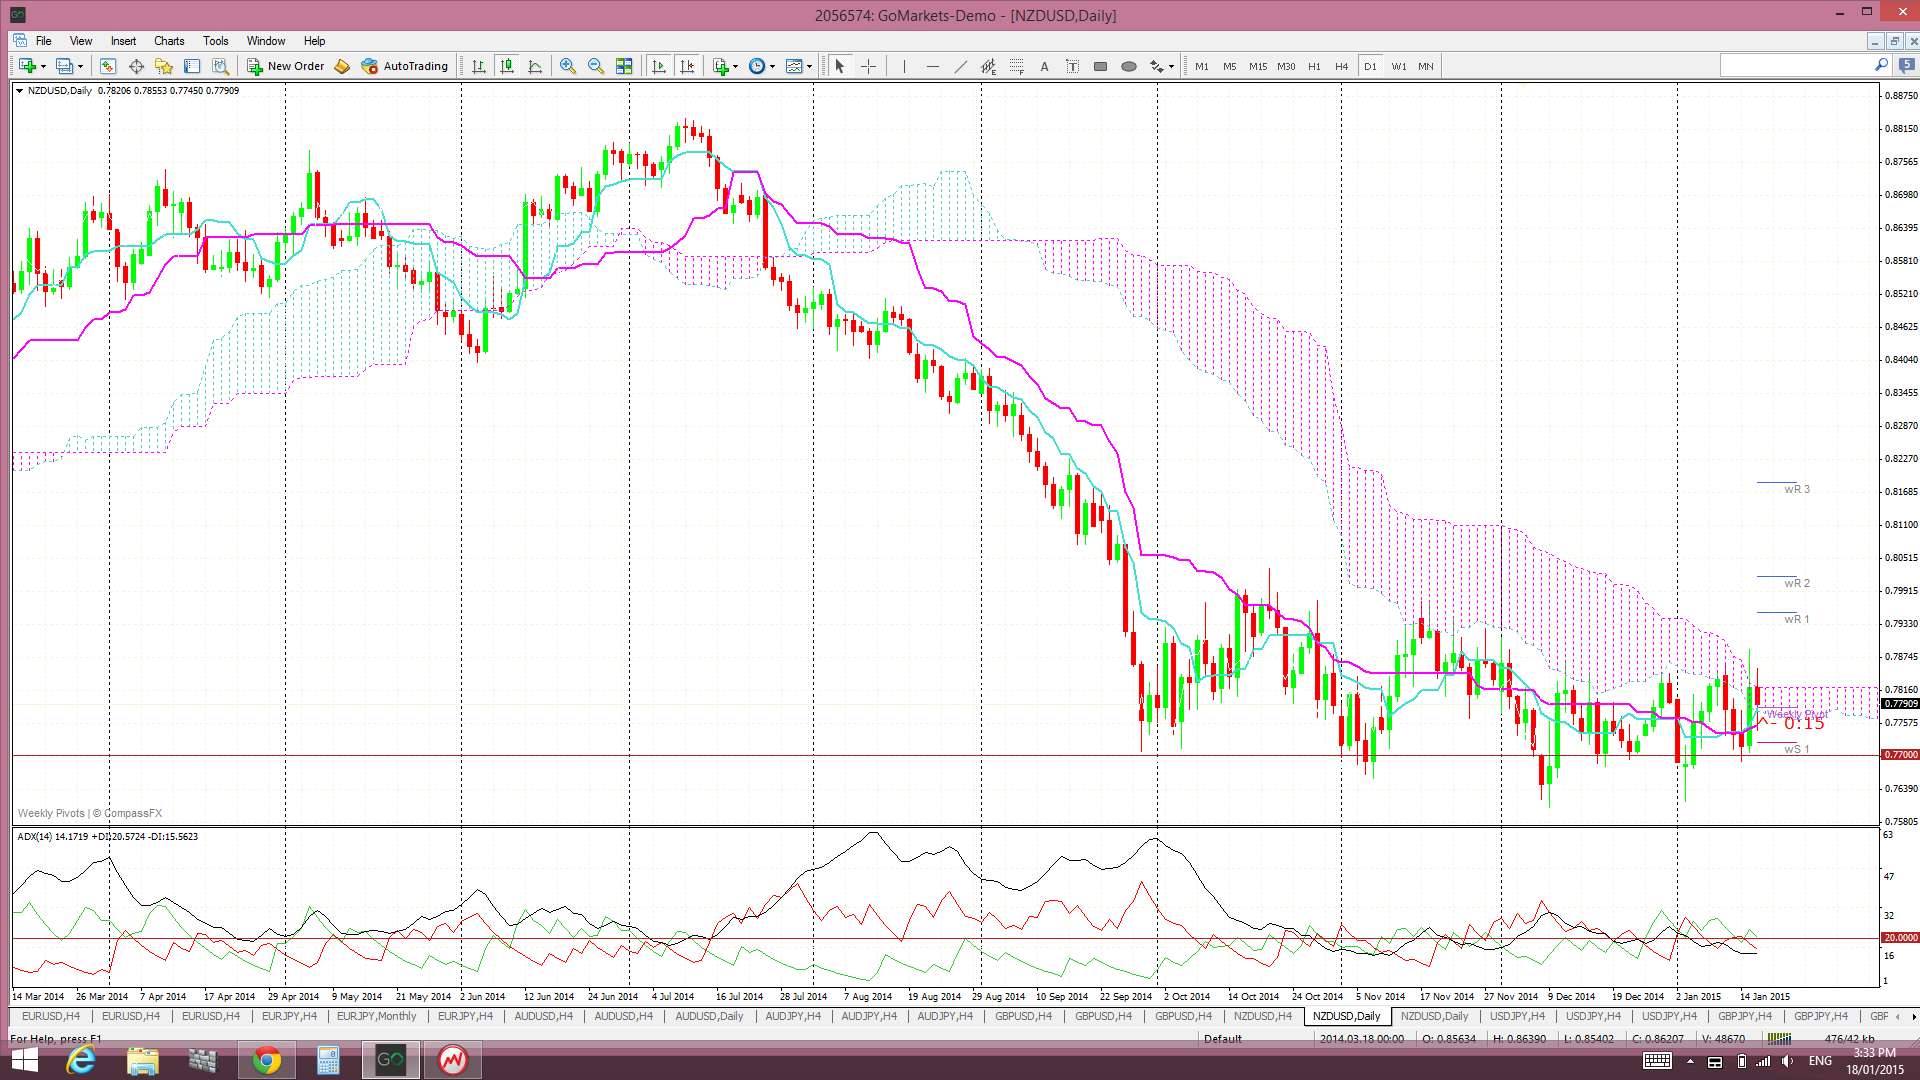
The weekly candle closed as a bearish candle.
- I’m watching for any new TC signal on this pair and the trading channel trend lines.

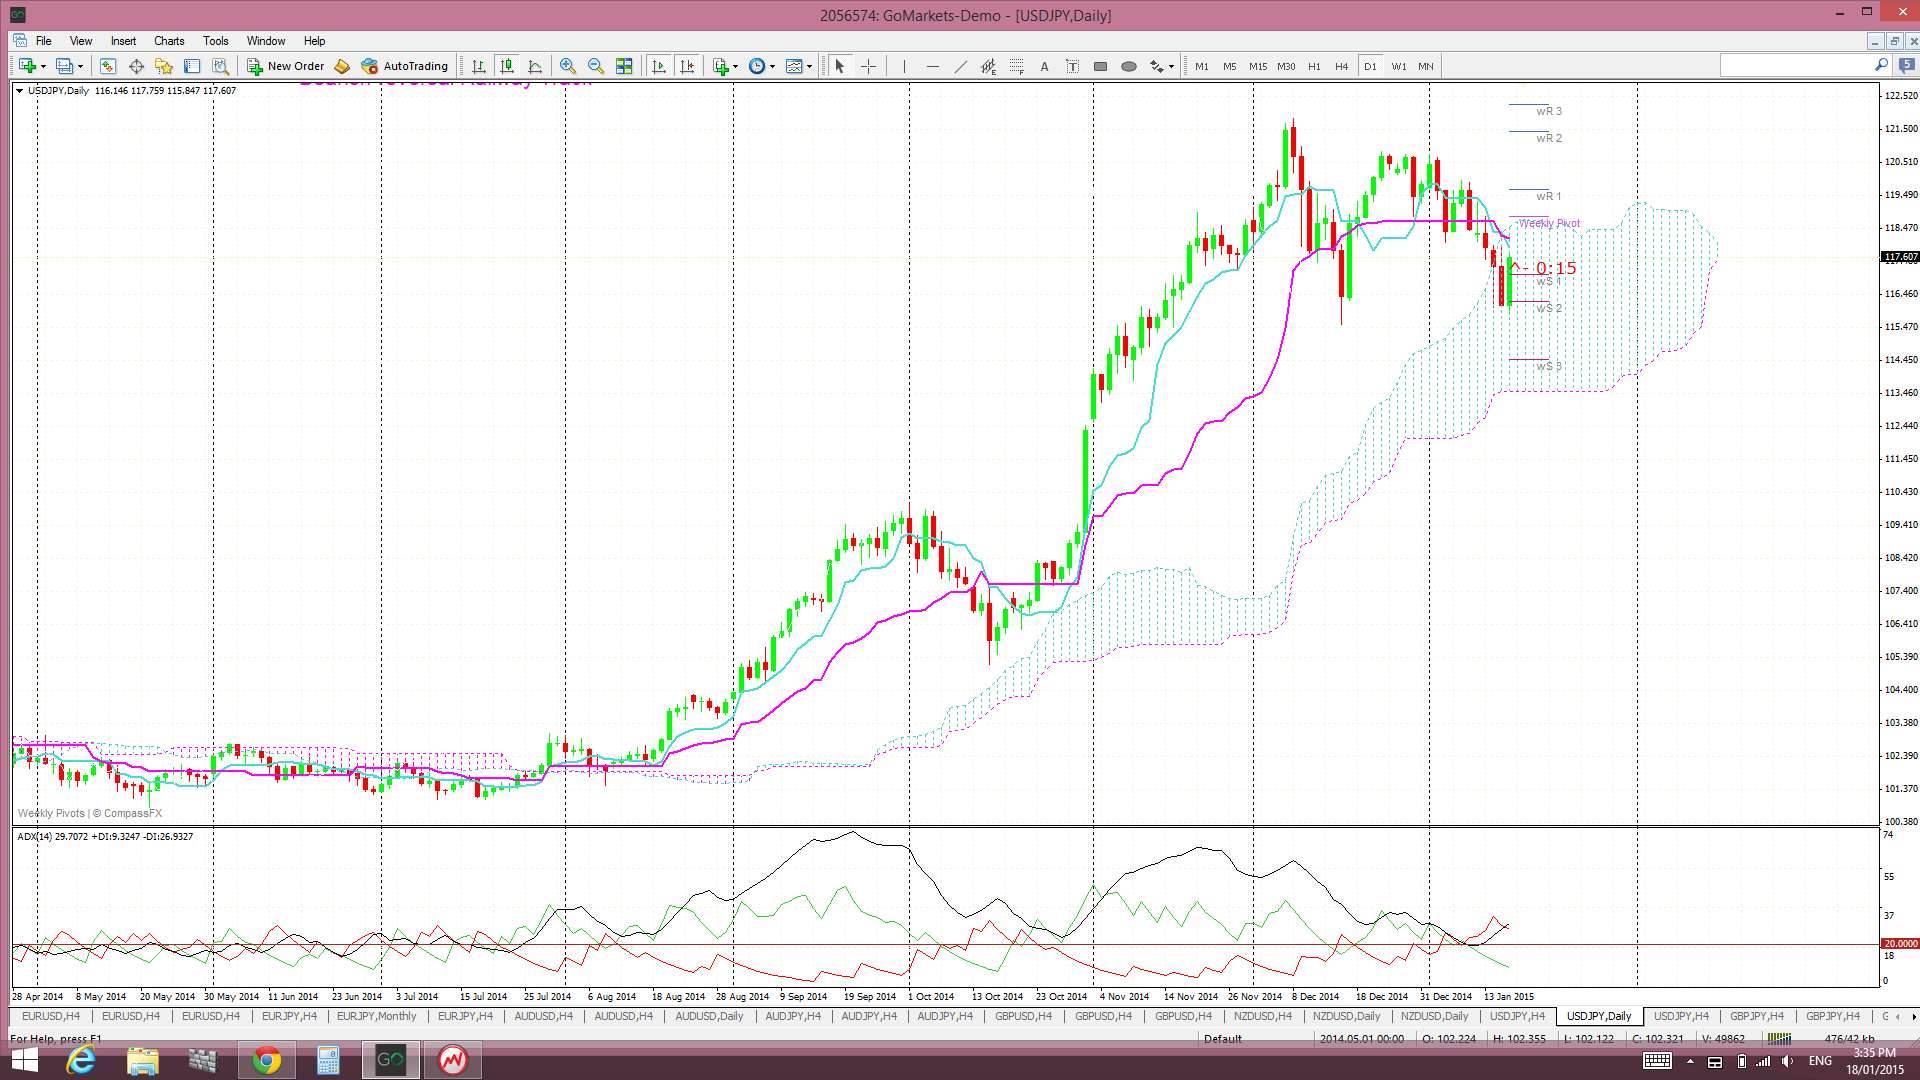
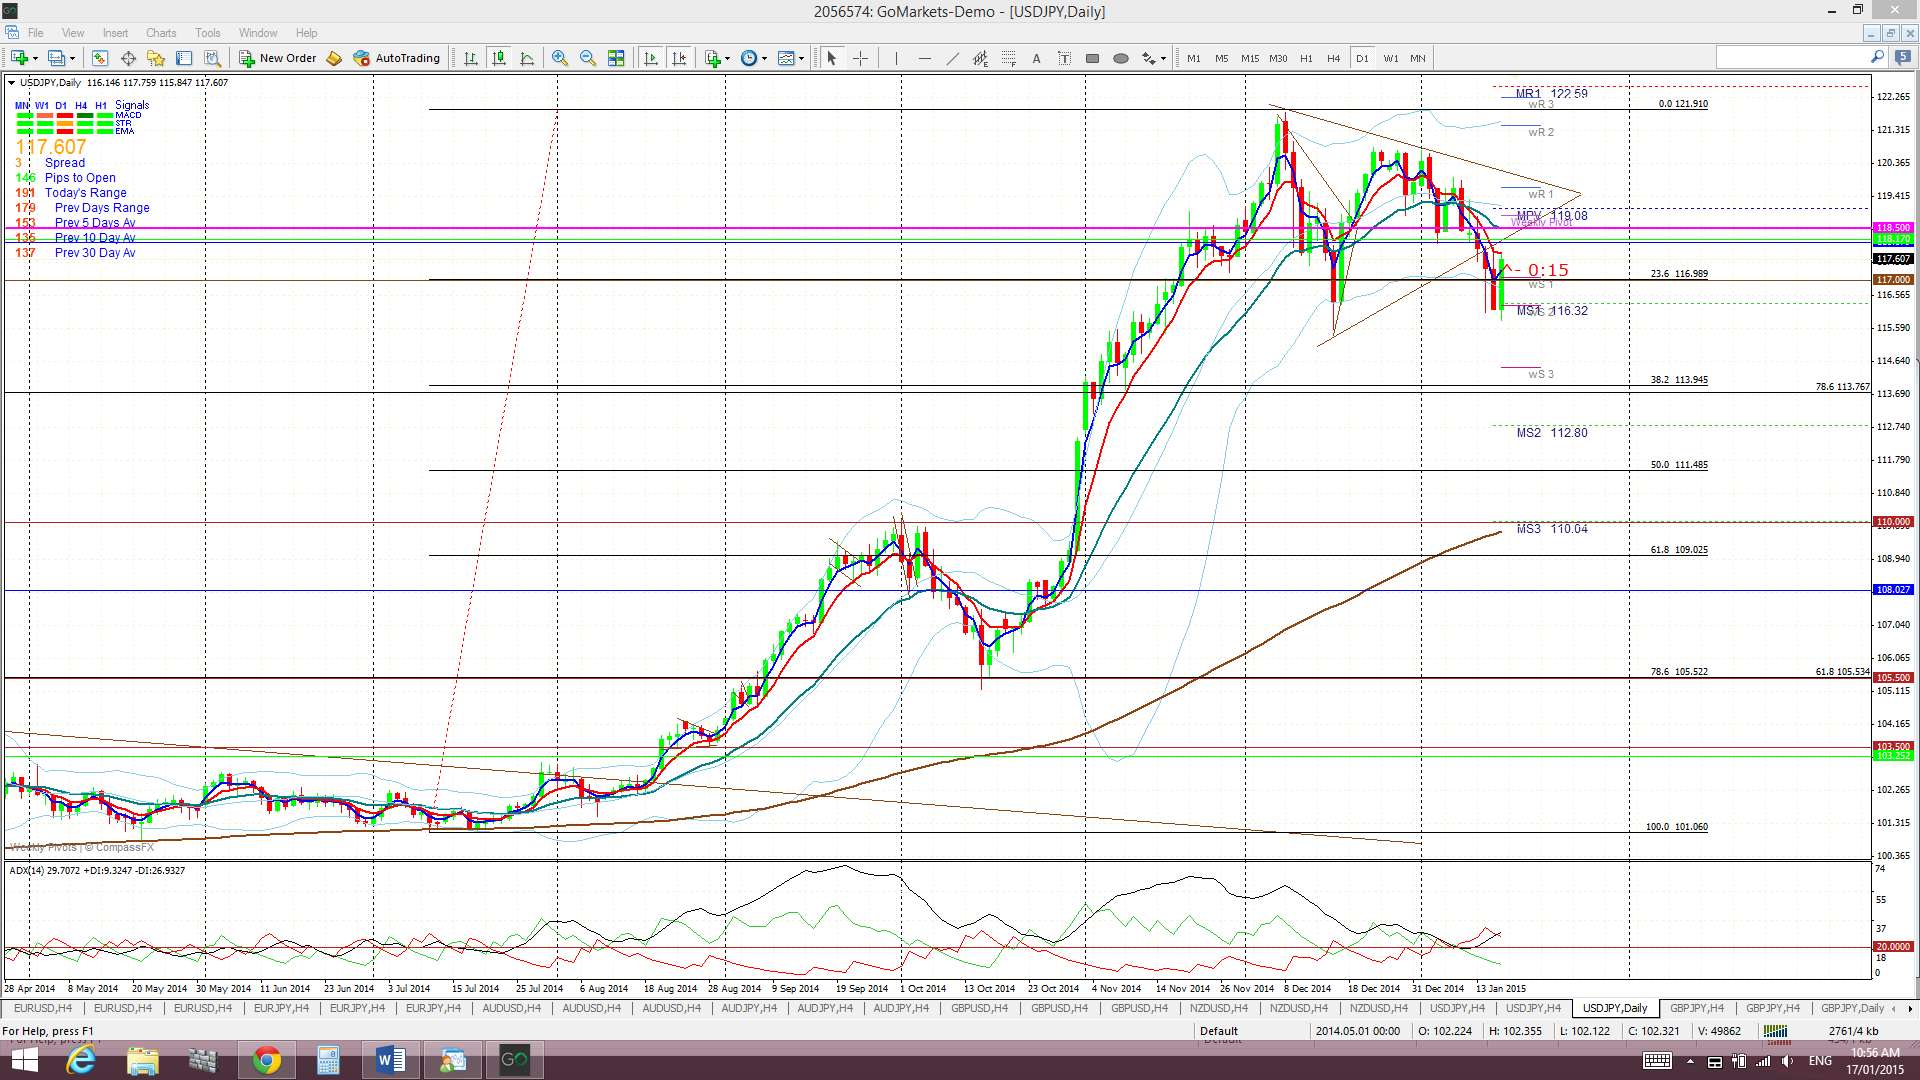
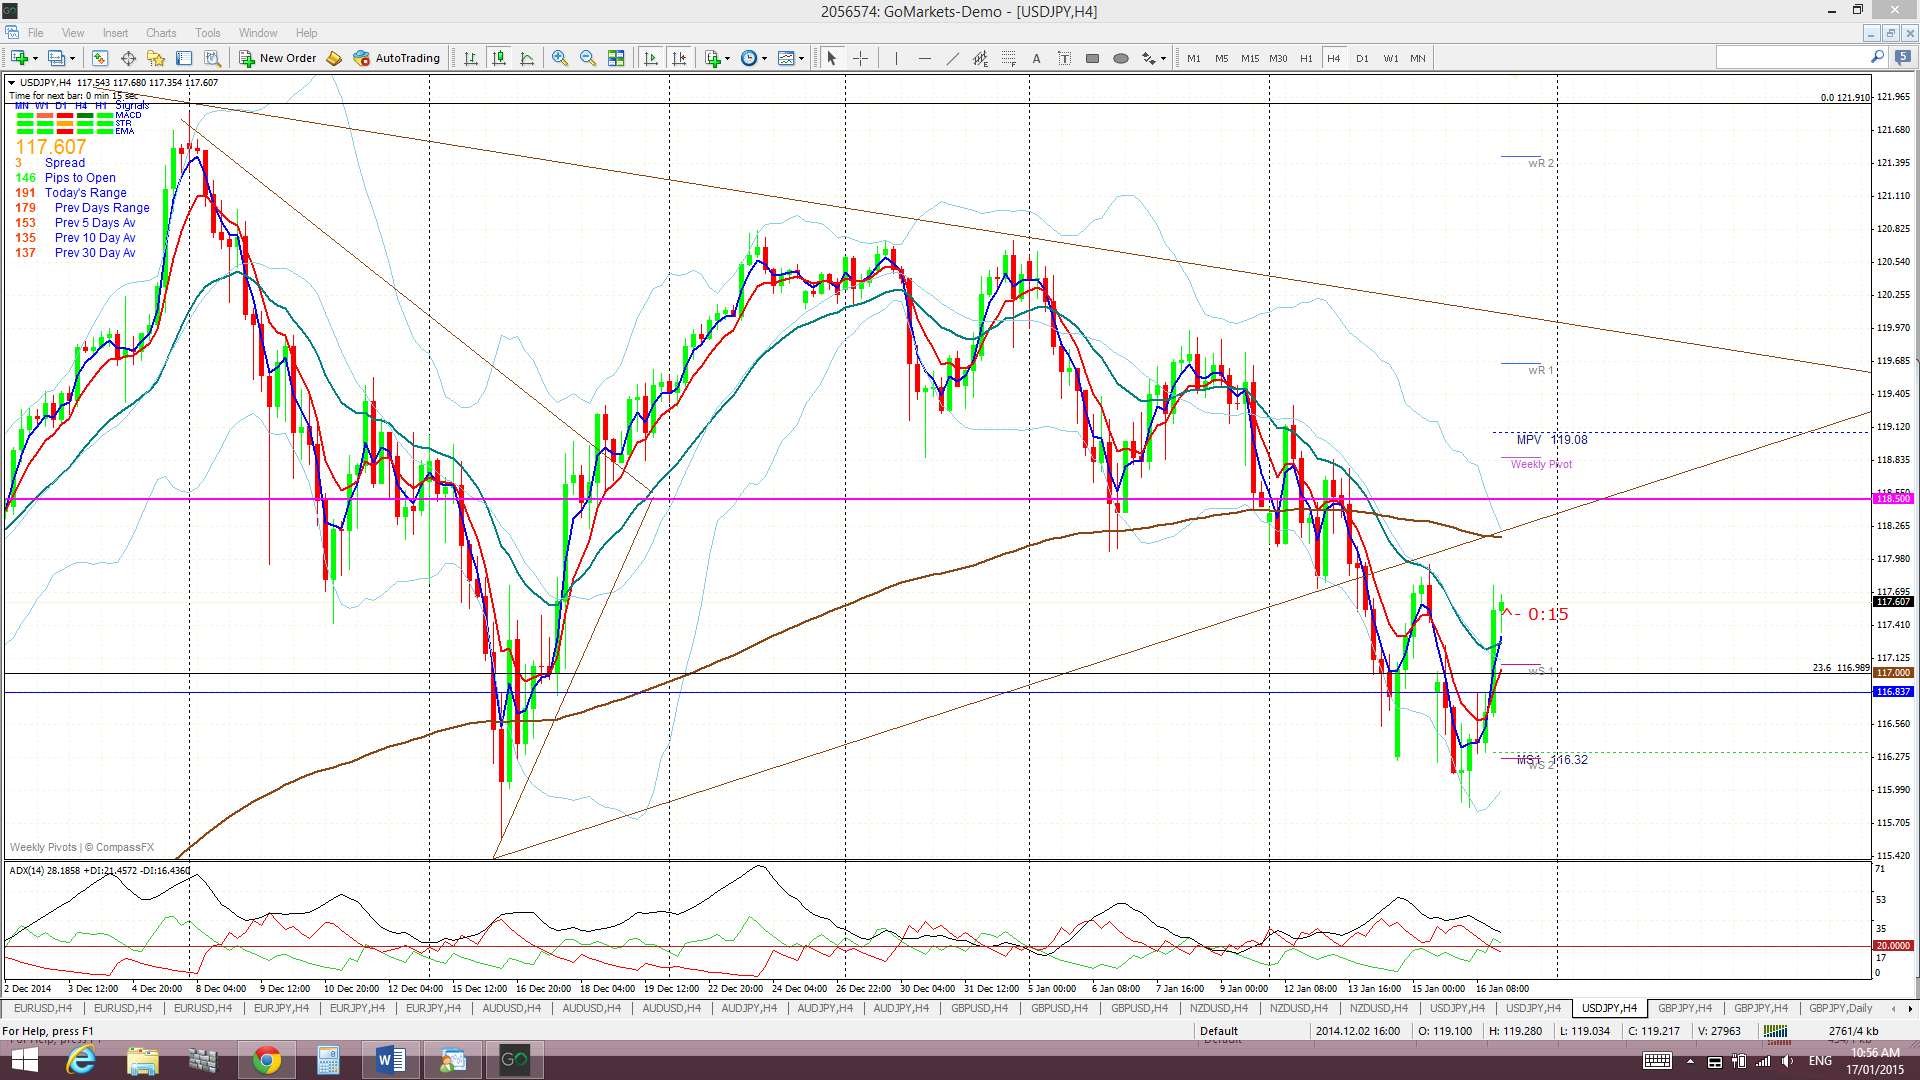
The Yen: U/J: The U/J had another bearish week but it really didn’t stand a chance following last week’s close below 118 support. Price fell last week and broke down from a triangle pattern and triggered a new TC signal that gave 150 pips before closing off. The U/J had been looking like bearish continuation would continue after testing the triangle trend line but it rallied on Friday along with a rally in stocks and the USD index. I had mentioned that whilst the U/J was trading within the daily Cloud that price action could be expected to be choppy so at least I got that call right. Price is still trading in the daily Ichimoku Cloud so I’m expecting this choppiness to continue:
The USDX has broken above a major S/R level and any bullish continuation there might take to the U/J along for the ride.
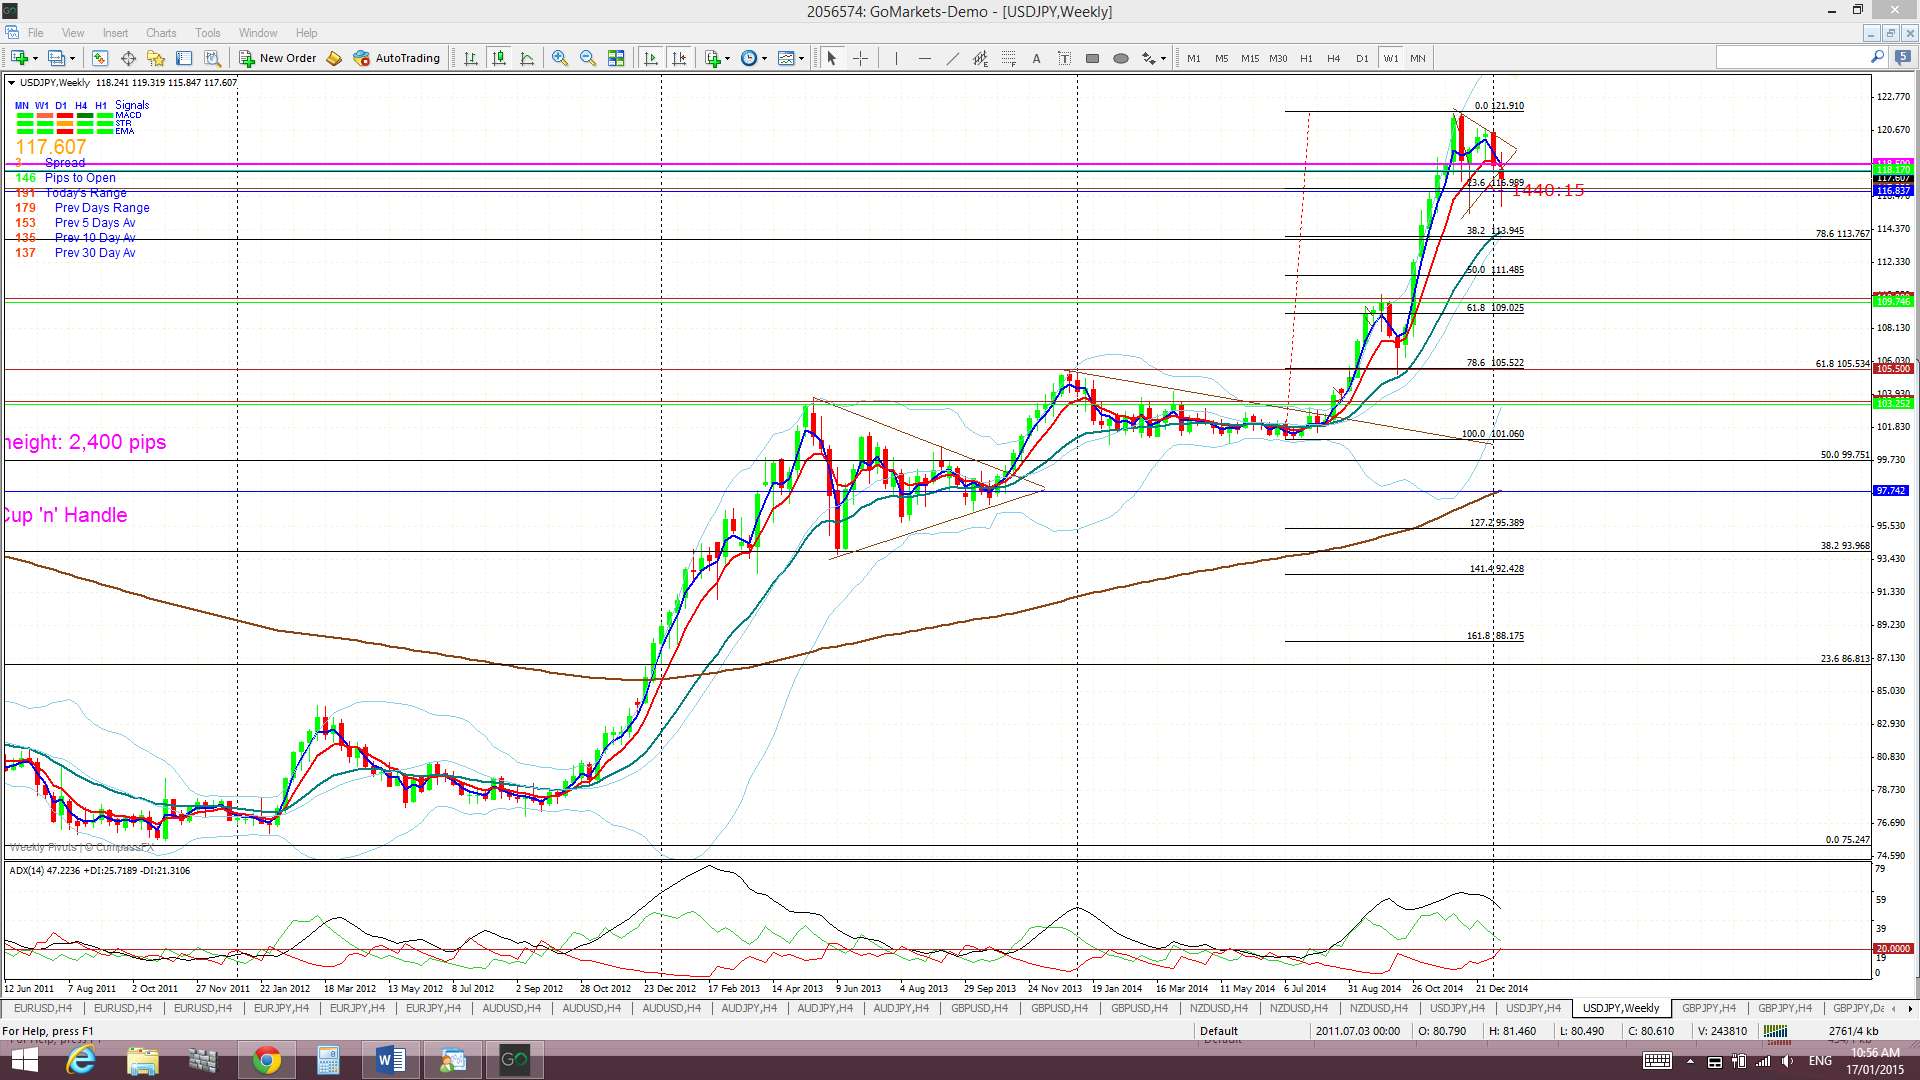
Price is now trading below the Cloud on the 4hr, in the Cloud on the daily charts but above the Cloud on the weekly and monthly charts. However, November 2013 was the first monthly candle close above the Ichimoku Cloud since mid-2007 and the bullish hold above the monthly Cloud continues to be noteworthy.
The weekly candle closed as a bearish coloured ‘Spinning Top’ following last week’s bearish engulfing candle.
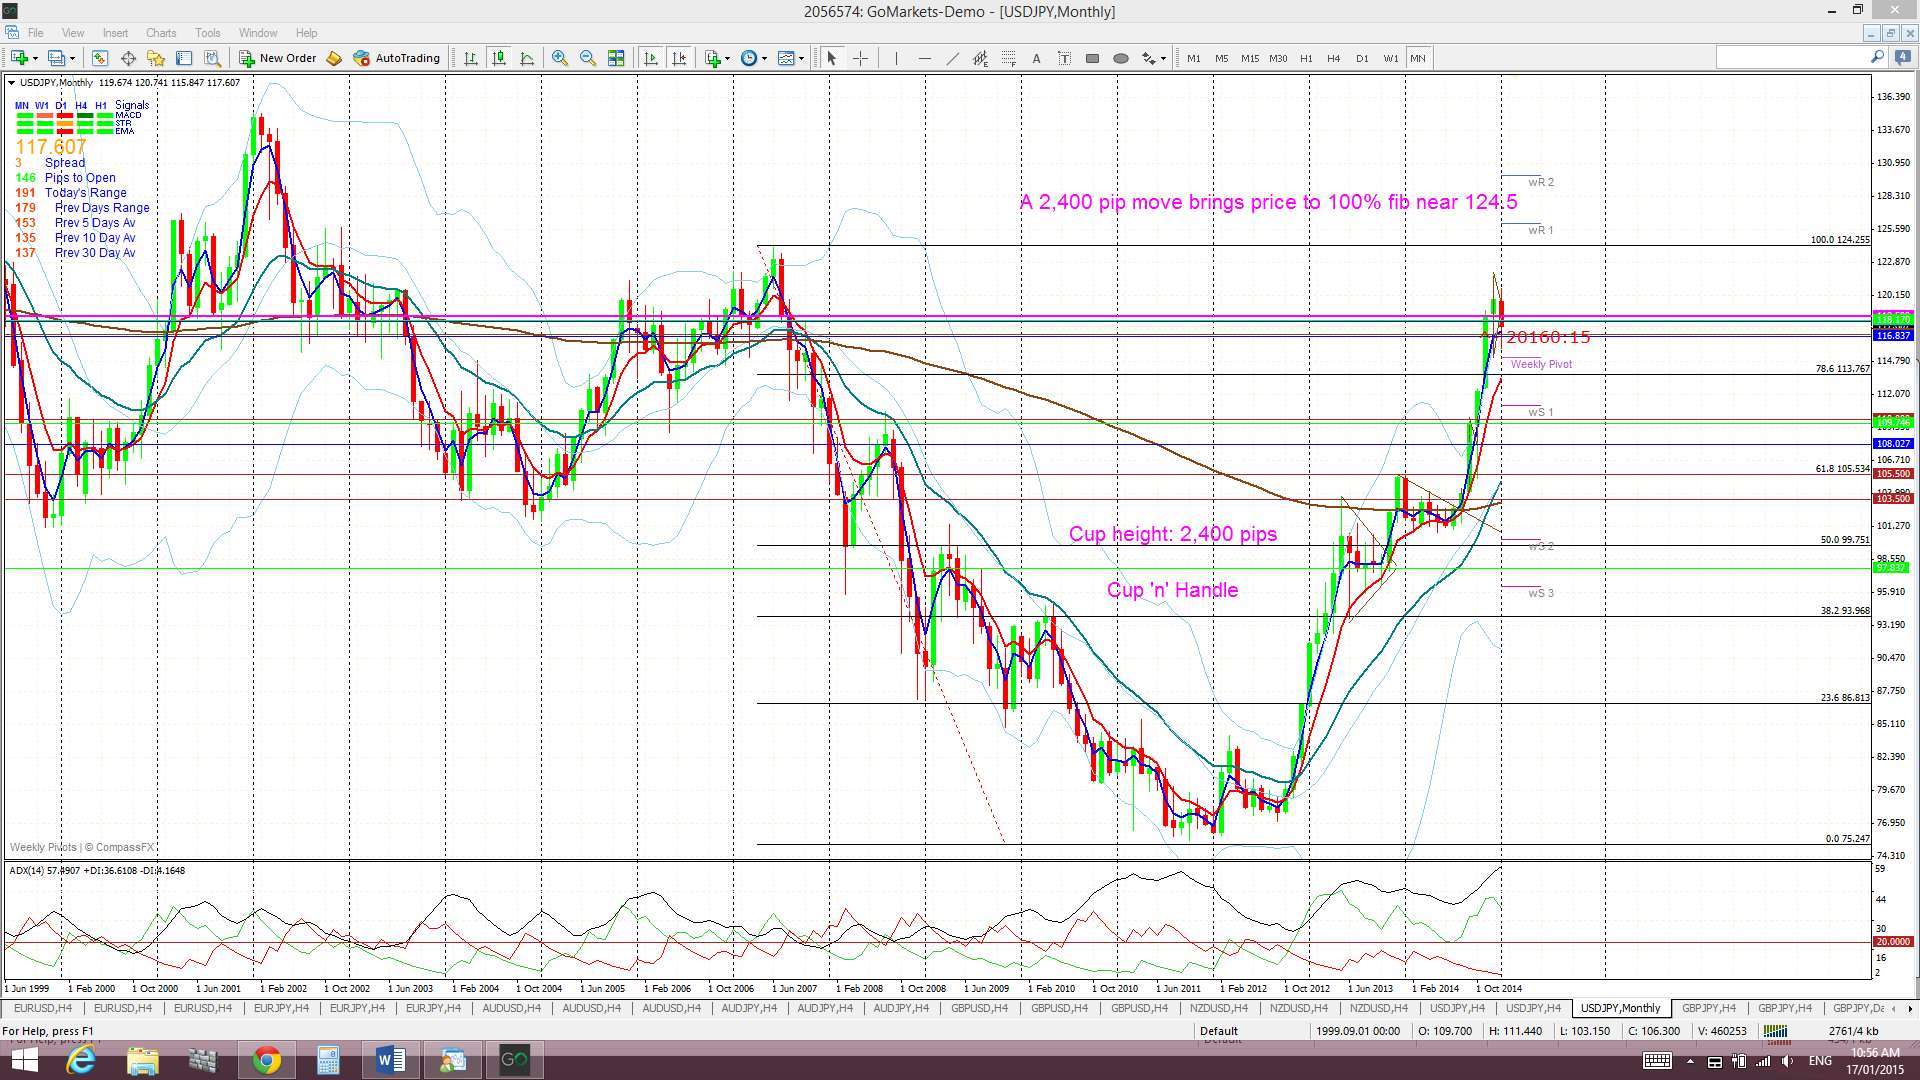
Weekly Chart Bullish Cup’ n’ Handle pattern: This pattern seems to have completed now just 300 pips short of the 2,400 pip target. The theory behind these patterns is that the height of the ‘Cup’ pattern is equivalent to the expected bullish move from the ‘handle’ breakout. The height of the Cup for the U/J weekly chart is around 2,400 pips. The interesting point here is that a 2,400 pip bullish move up from the ‘Handle’ would put price up near the 124 level. This level is the last major swing high for the U/J from back in 2007 and represents the 100% fib pullback for the move down in 2007 to the lows of 2012. This pattern has already given up to 2,100 pips of the 2,400 pip target!
- I’m watching for any new valid TC signal, the 118.5 level and the daily Cloud.
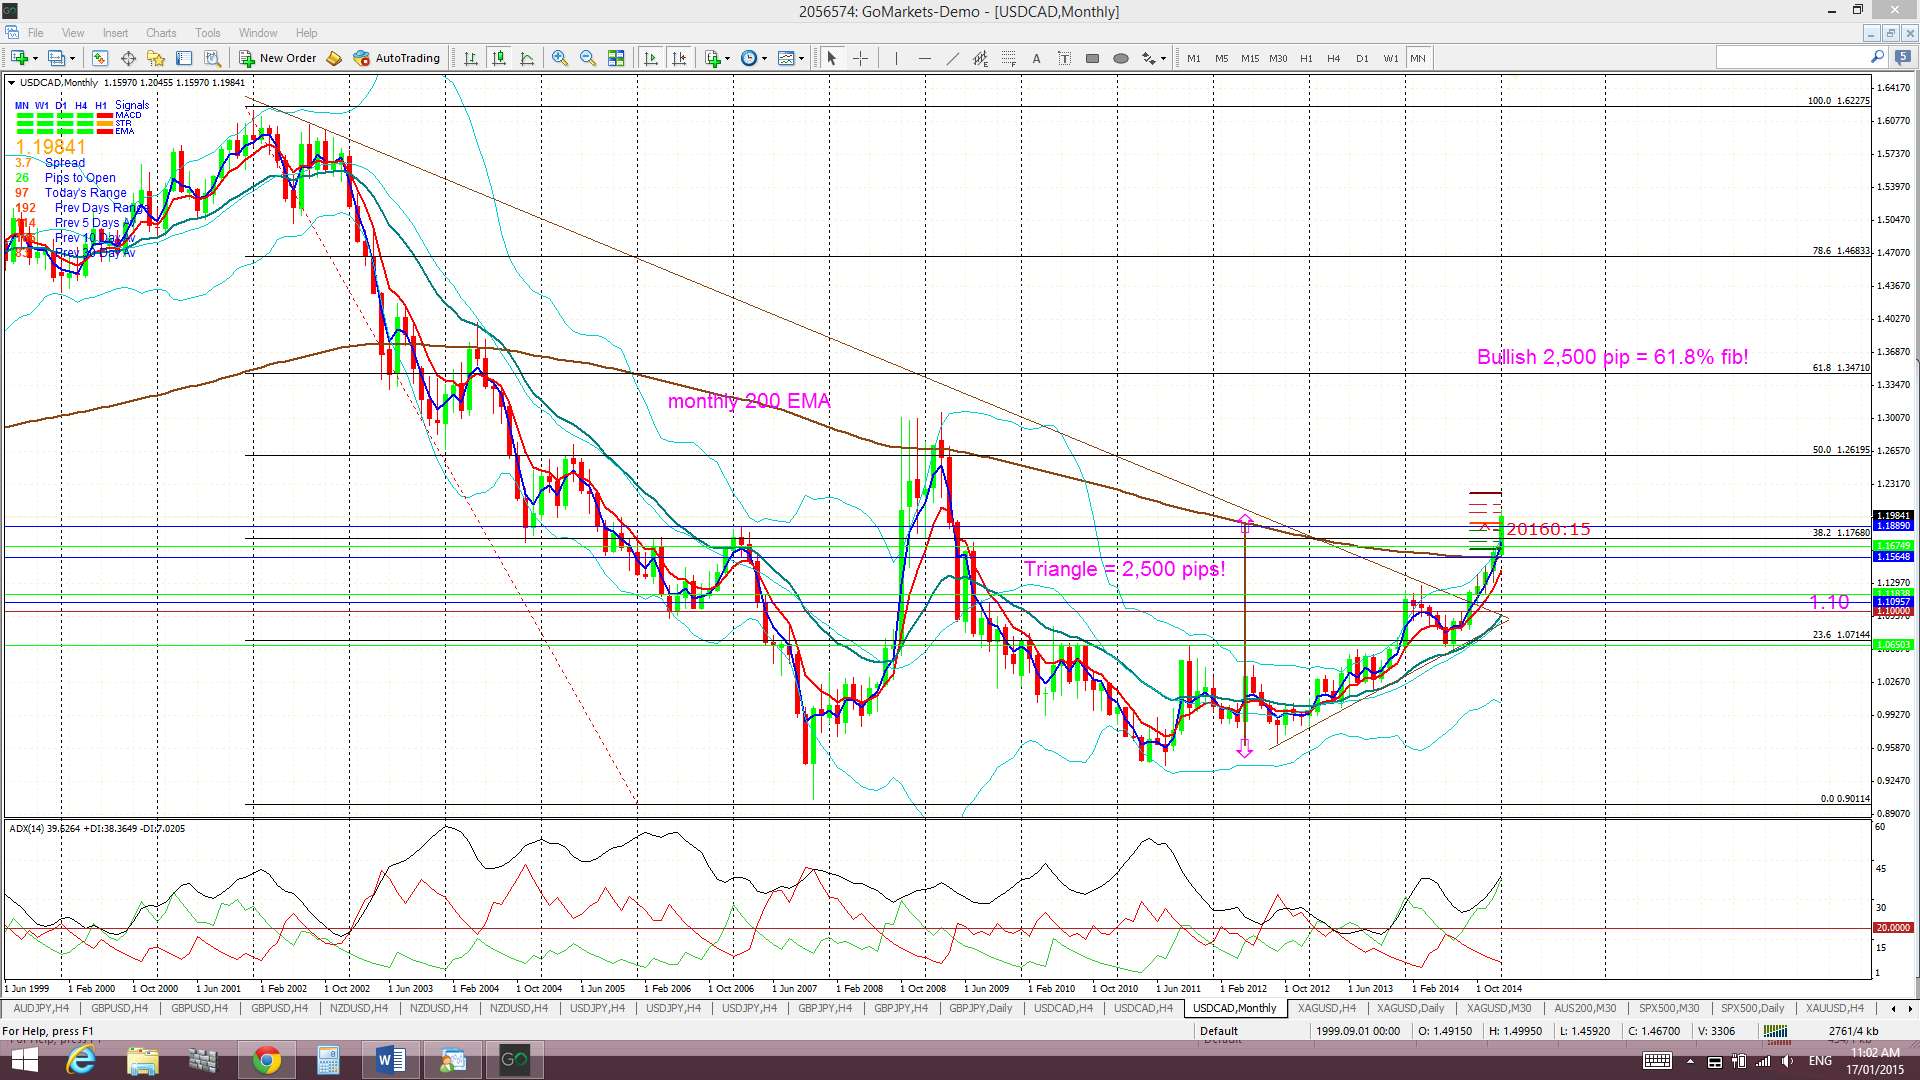
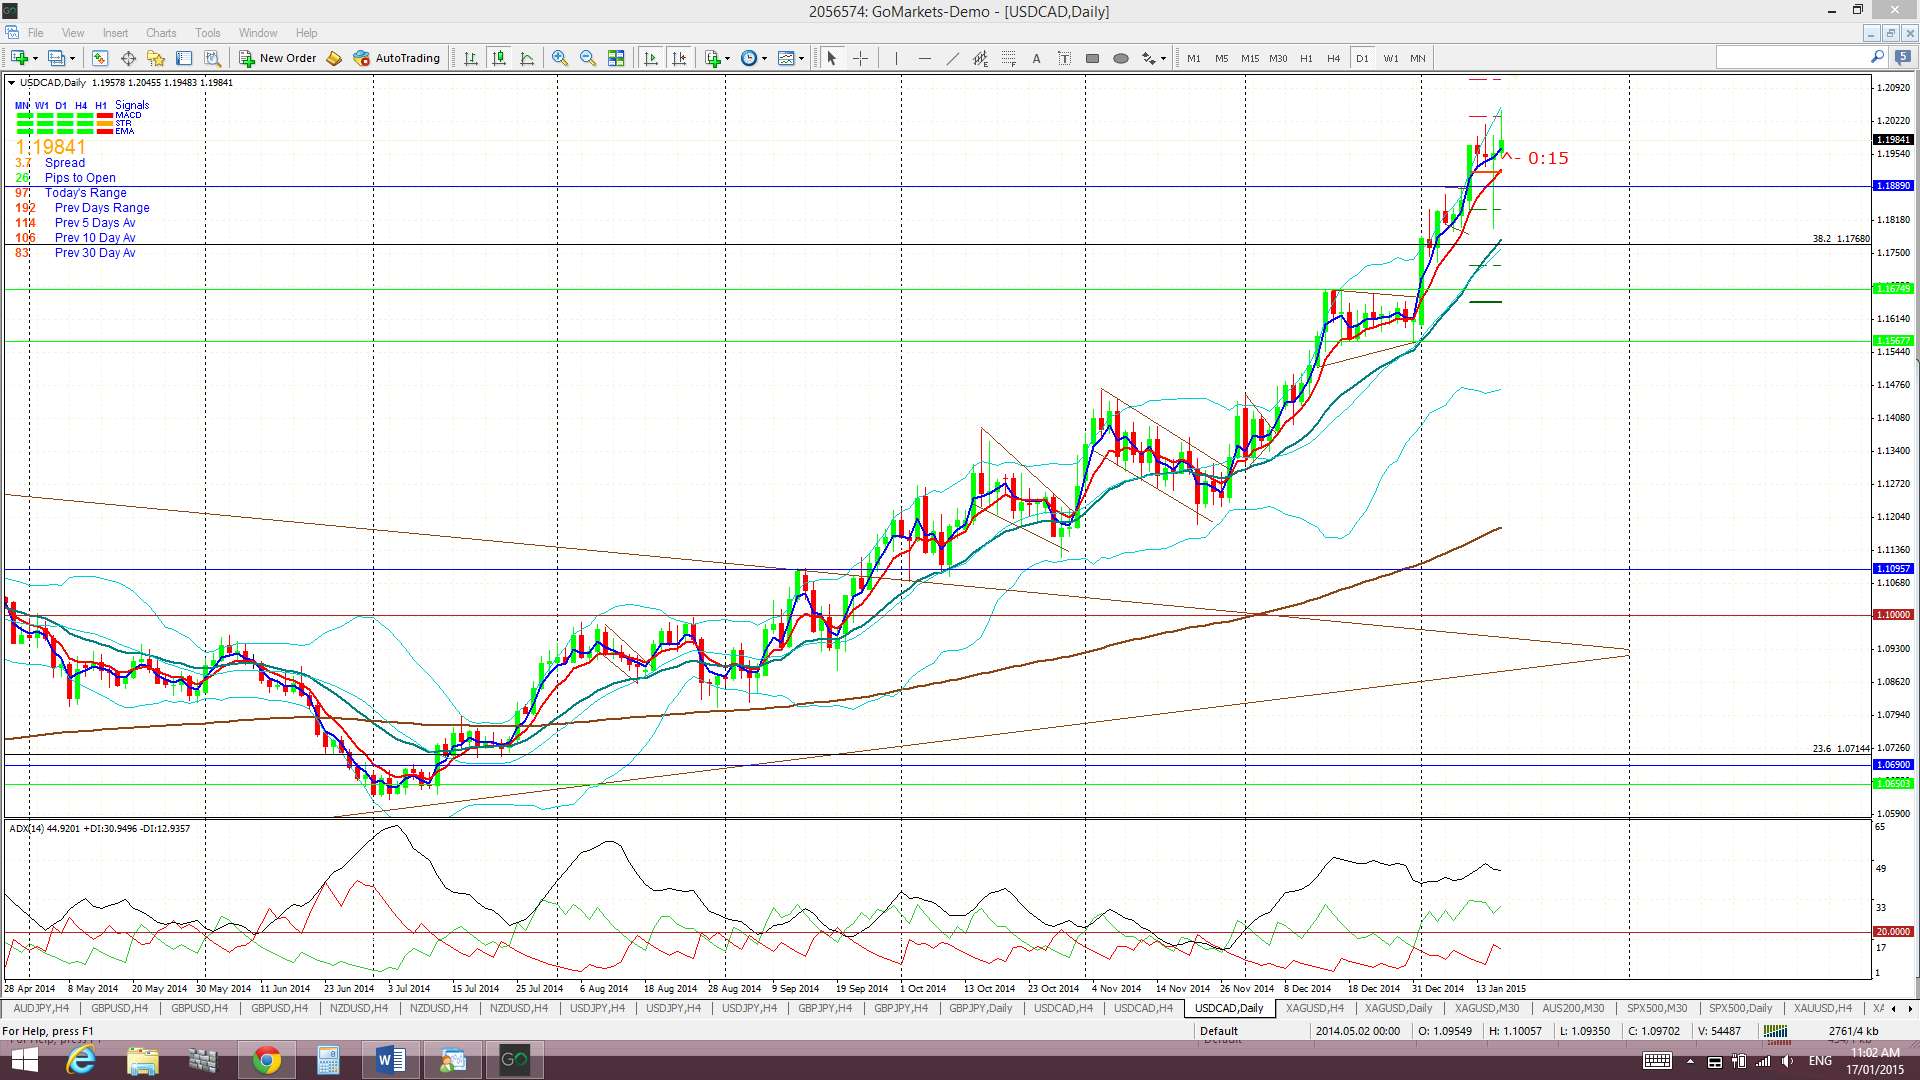
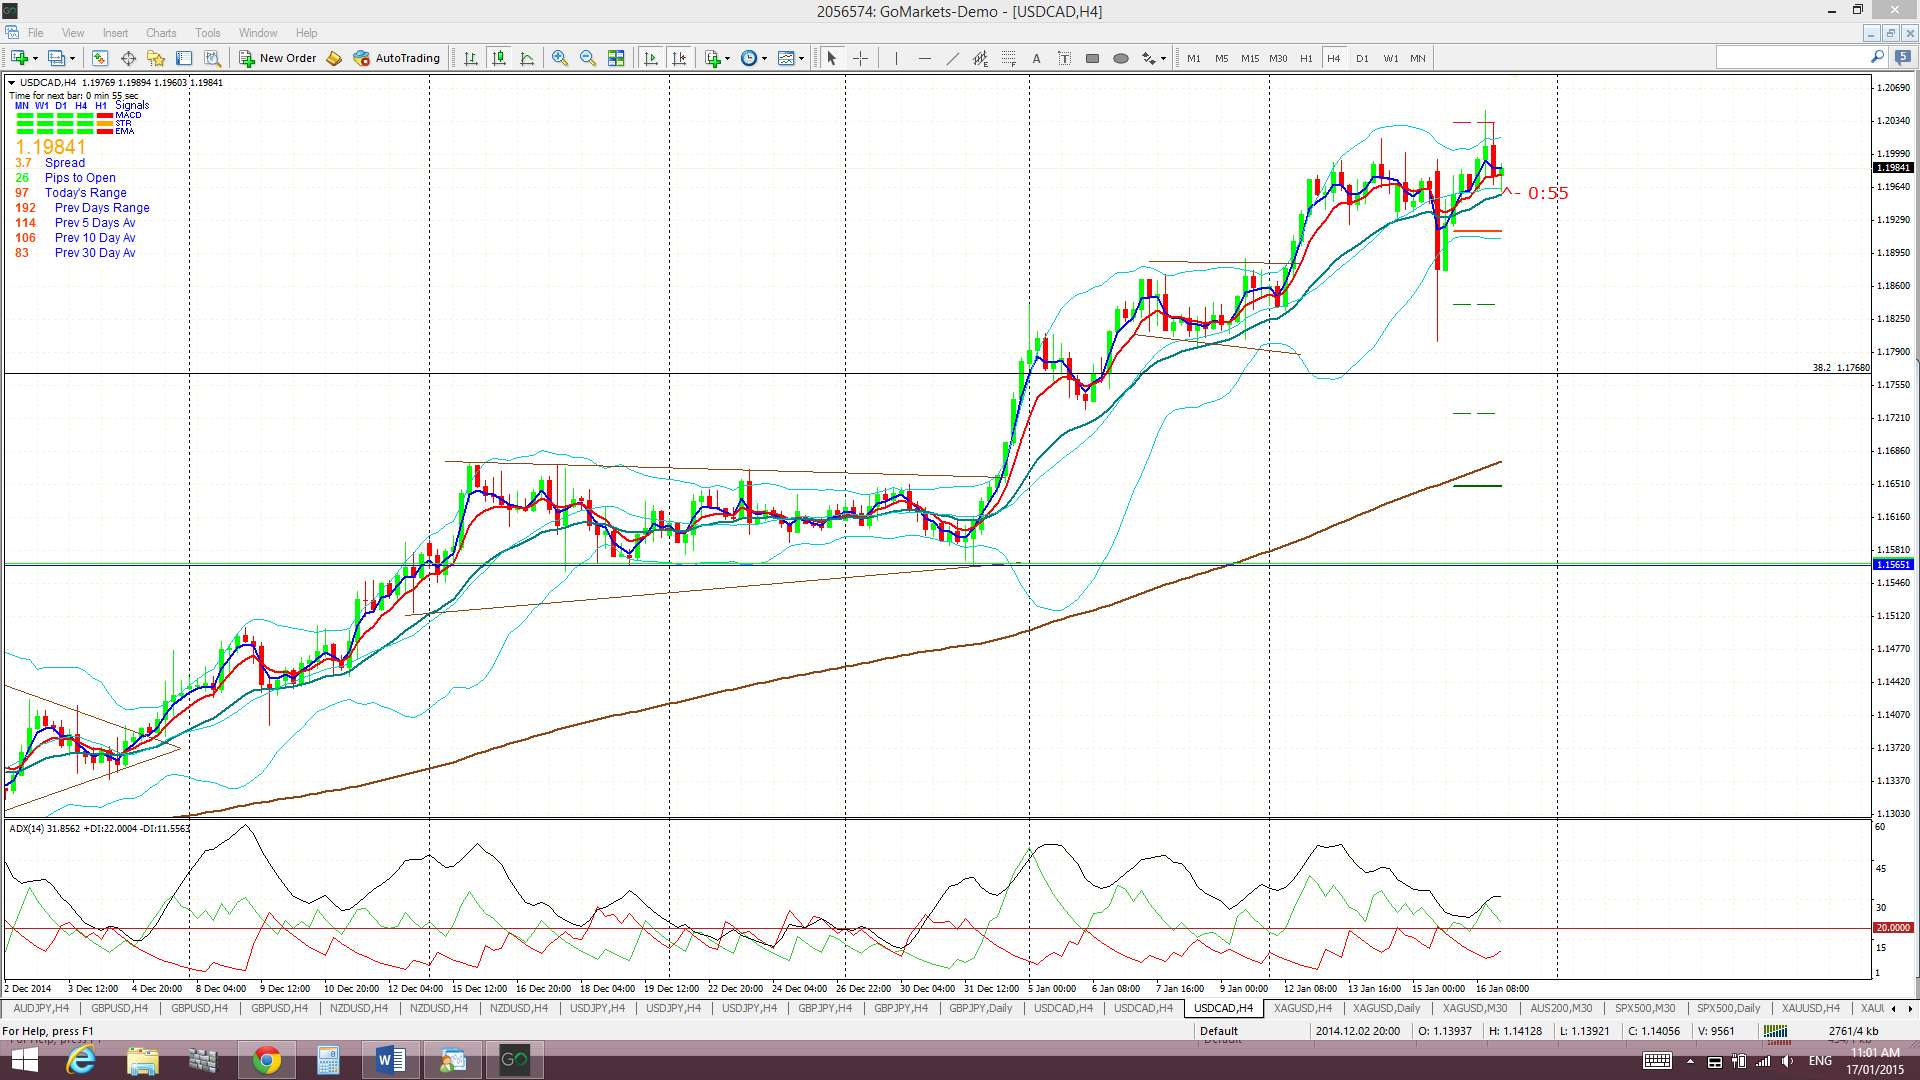
USD/CAD: The USD/CAD chopped higher last week but found resistance at the 1.20 level. The slow down with both the USD rally and fall in Oil pricing contributed to this choppy action.
Price continues holding above the monthly 200 EMA and it is worth remembering that the last bullish monthly candle close above this level was back in February 2009, almost 6 years ago. This period also marks the longest bullish hold by the Loonie above the monthly Cloud since 2002!

Triangle breakout target: The Loonie has already broken up and out from a major monthly chart triangle pattern that could deliver up to 2,500 pips. This 2,500 pip figure is evaluated from the height of the triangle. I have used the triangle height from the beginning of the bull trend line, as shown in the monthly chart below. The height of the triangle is around 2,500 pips and, thus, this would be the expected move from any breakout action. This is where it gets interesting! Extrapolating a bullish move from this triangle places price up at the 61.8% fib level. These fibs levels are popular targets in retracement moves and so this adds some confluence to this as a possible target. The bullish move so far has given almost 900 pips!
Price is still trading above the Cloud on the 4hr, daily, weekly and monthly charts.
The weekly candle closed as a bullish candle.
There is a lot of high impact CAD data next week so traders need to watch out for these items: Manufacturing data, Wholesale Sales, BoC Interest Rates and CPI.
Note how the 1.26 level on the monthly chart is previous S/R and also note the current ‘cupping’ action. Any choppy action up at 1.26 here might contribute to the formation of a bullish Cup ‘n’ Handle pattern.
- I’m watching for any new valid TC signal on this pair and the 1.20 level.
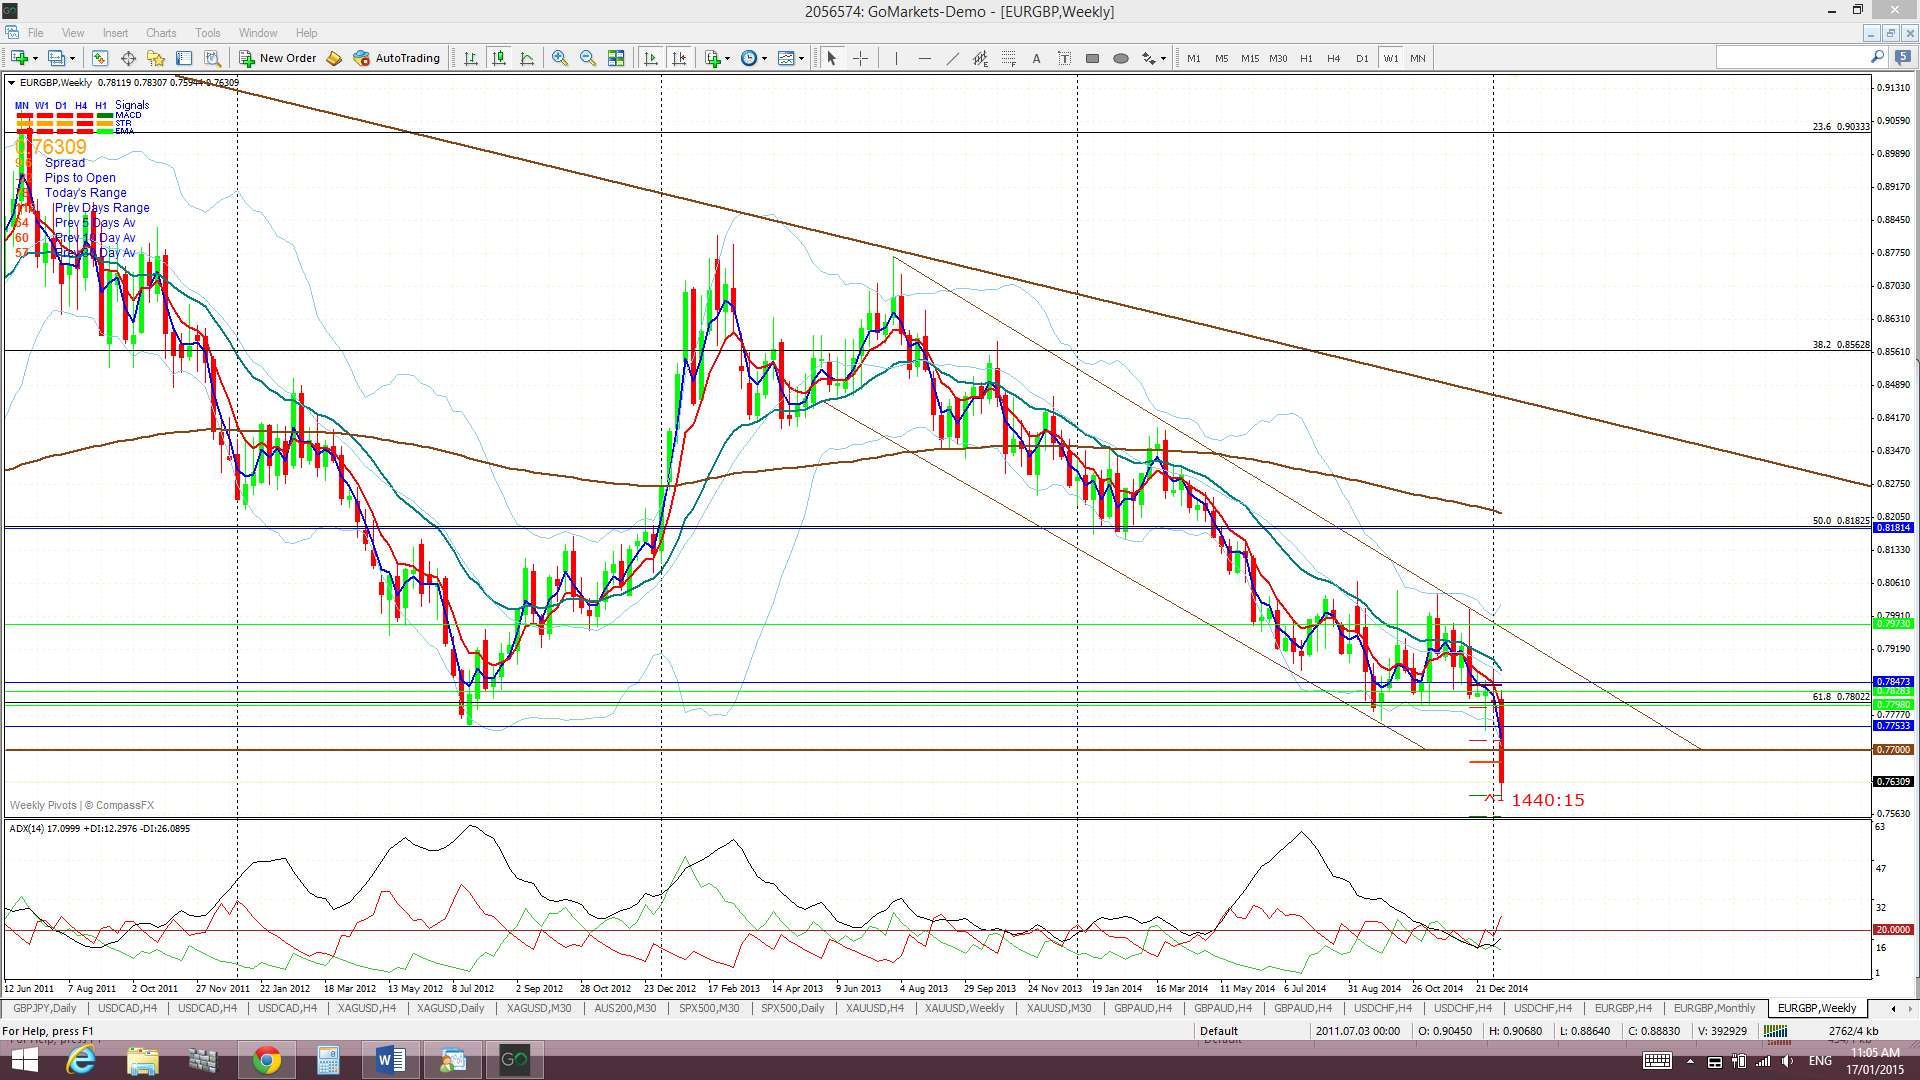
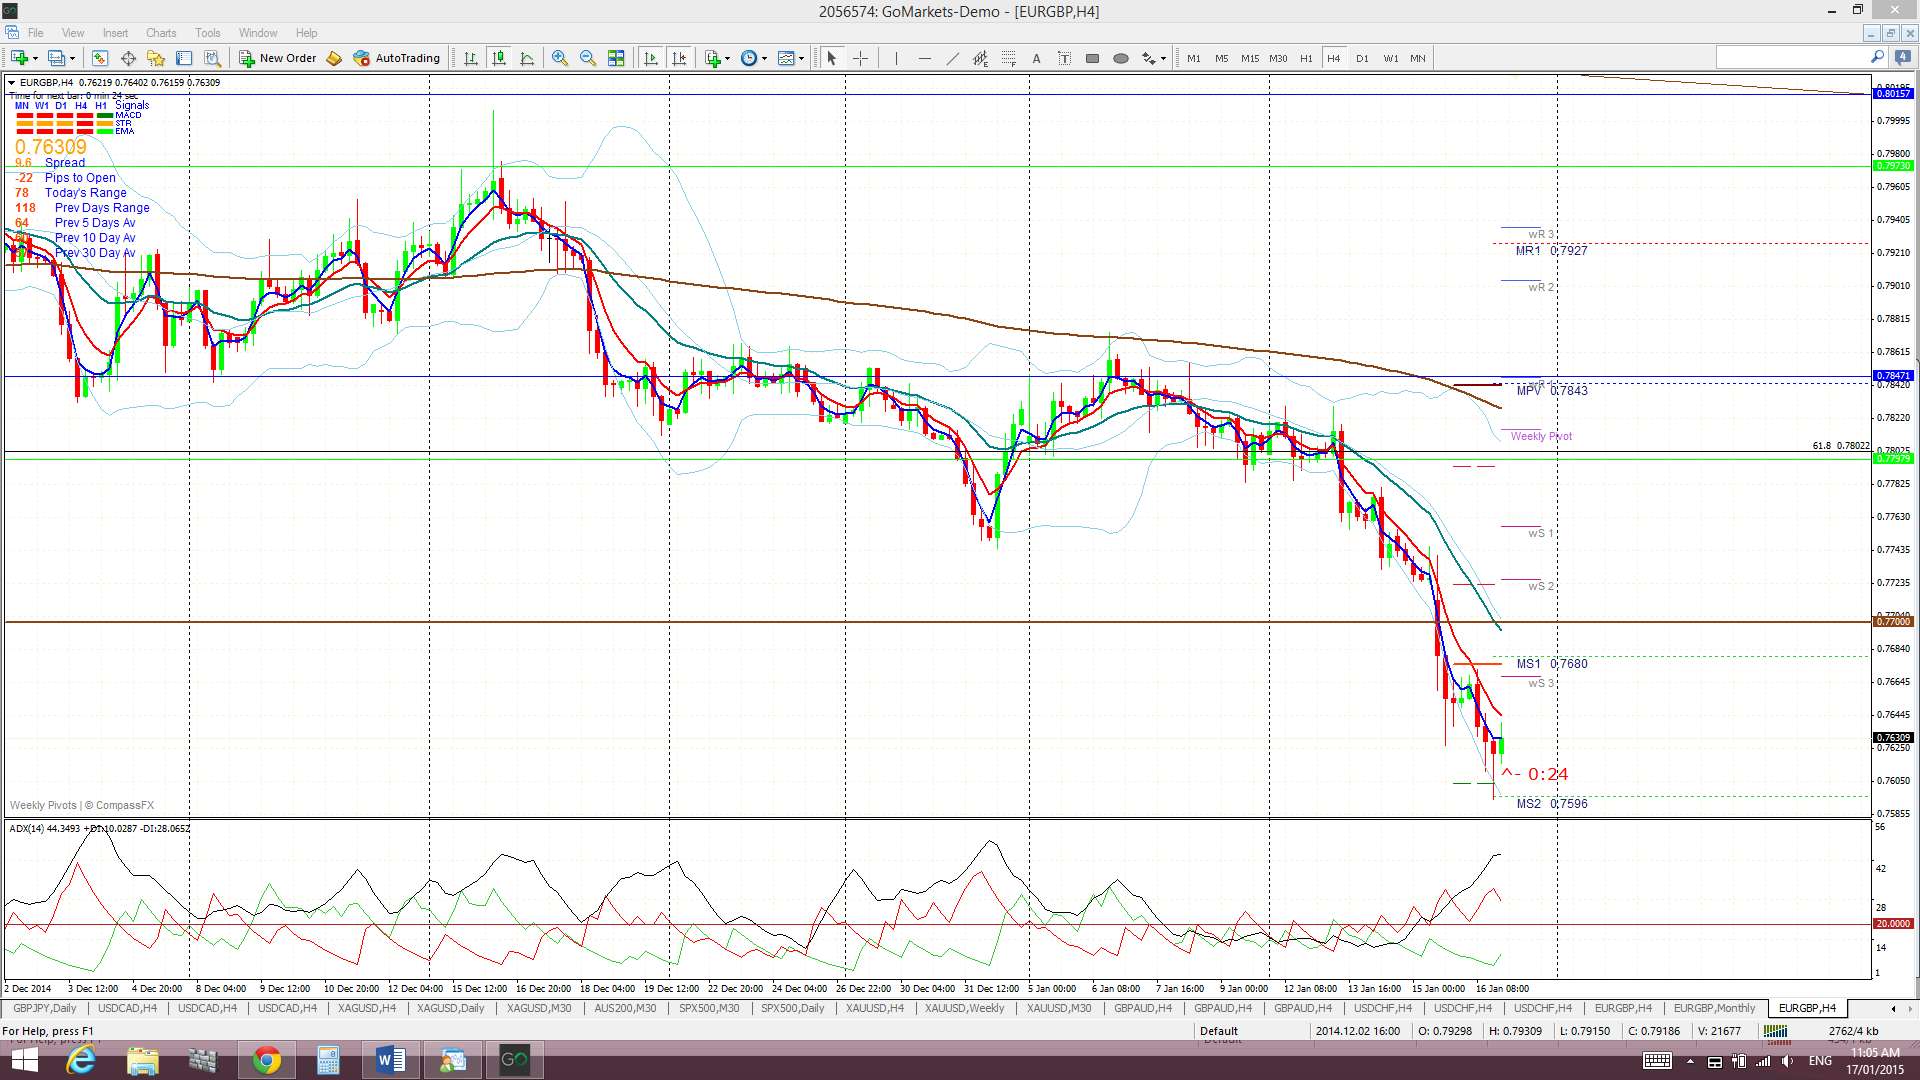
EUR/GBP: This pair fell below key 0.78 early in the week and then just kept falling, no doubt helped by Thursday’s SNB intervention. Price actually closed the week below the other main support level of 0.77 and this is a significant bearish development.
The 0.78 level had been fairly well defended since 2008 but has come under a lot of pressure over recent months with price flirting down here in four of the last five months and closing below this level for December and for the year of 2014.
The 0.77 level is major support and a kind of ‘line in the sand’ level below this 0.78 and forms the bottom of a monthly chart descending triangle. Price has made a weekly close below this key 0.77 level but traders need to watch for any monthly close below this level to confirm the start of any triangle breakdown.
Descending triangle move: Any monthly close and hold below the 0.77 level would suggest the start of a descending triangle breakdown. The height of the EUR/GBP triangle is 2,000 pips and this would suggest a similar magnitude move below the 0.77 level. Thus the target for any triangle breakdown move is near 0.57 which seems to be the lows from 2,000. There has been a weekly close below 0.77 but this is a monthly chart pattern and so needs to be confirmed off the monthly candle close.
The E/G is now trading below the Cloud on the 4hr, daily, weekly and monthly charts.
The weekly candle closed a large bearish candle.
- I’m watching for any new TC signal and the 0.77 level.

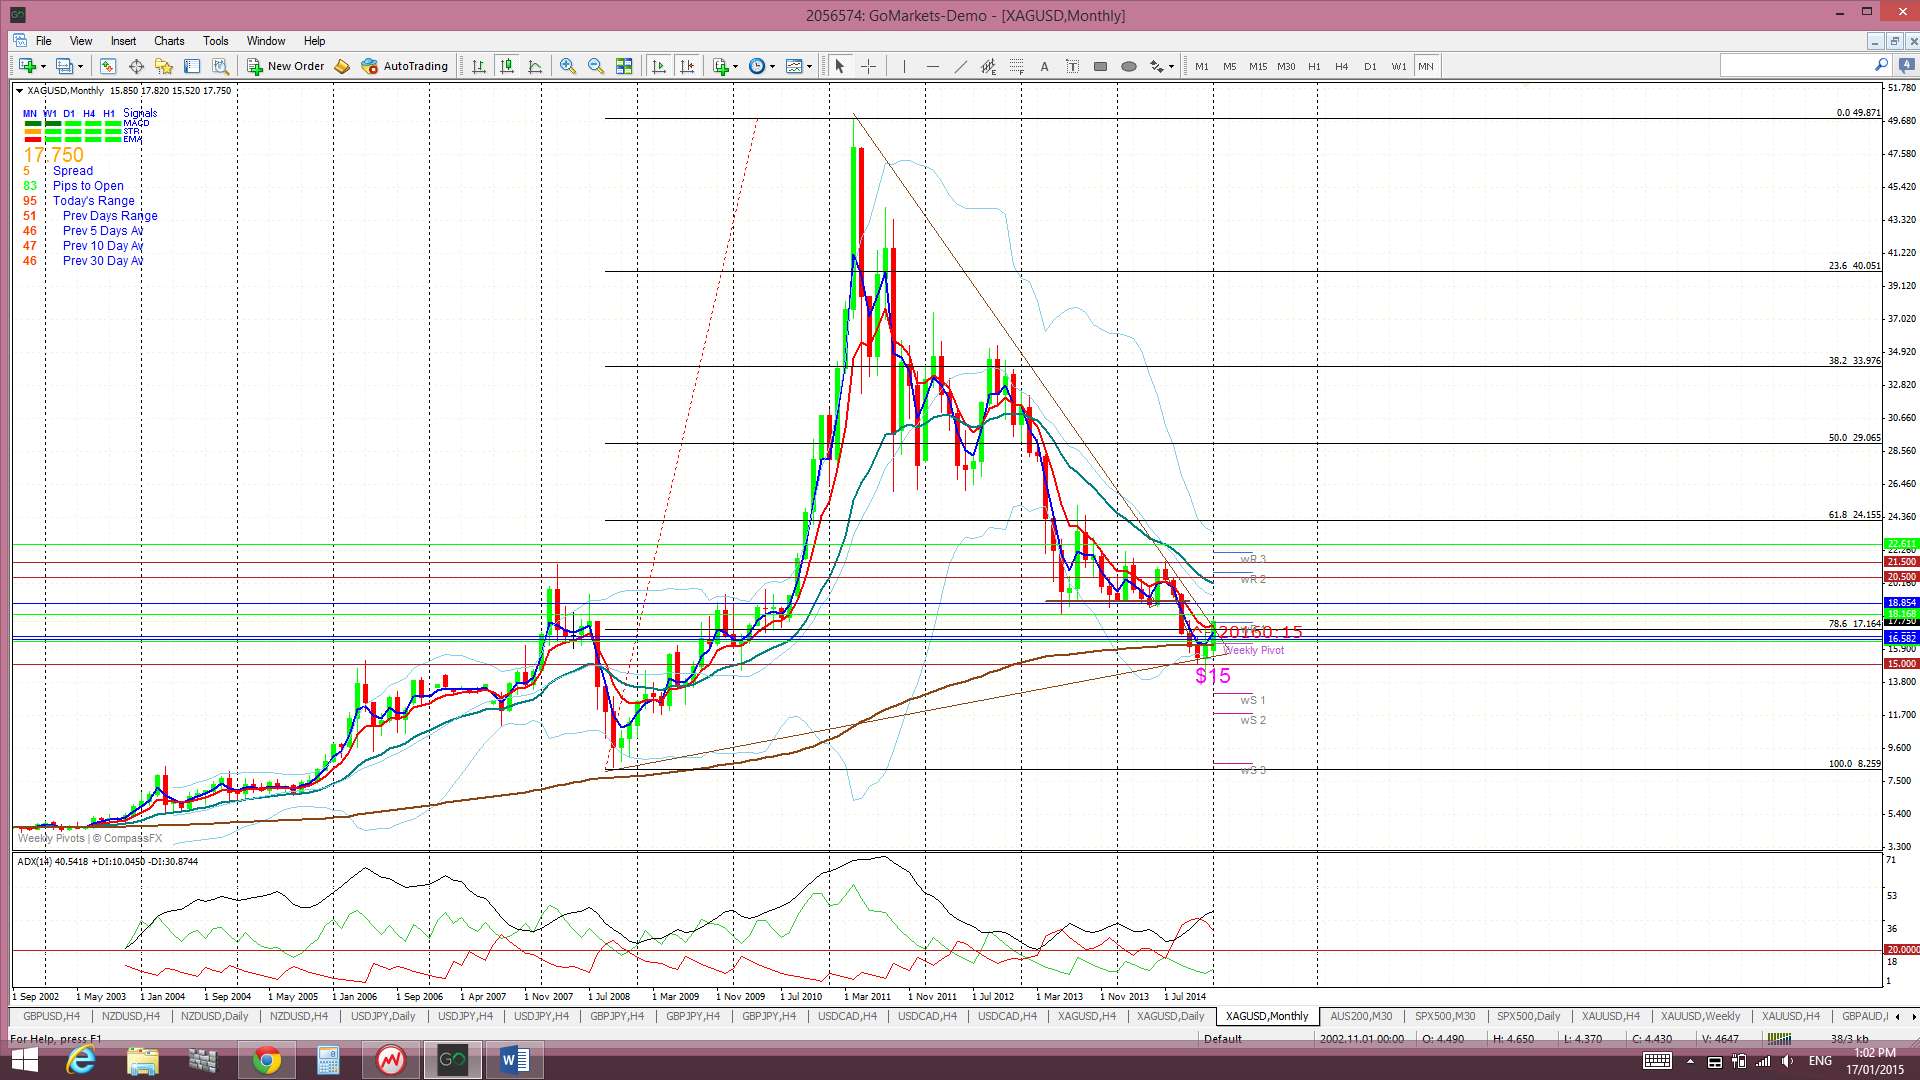
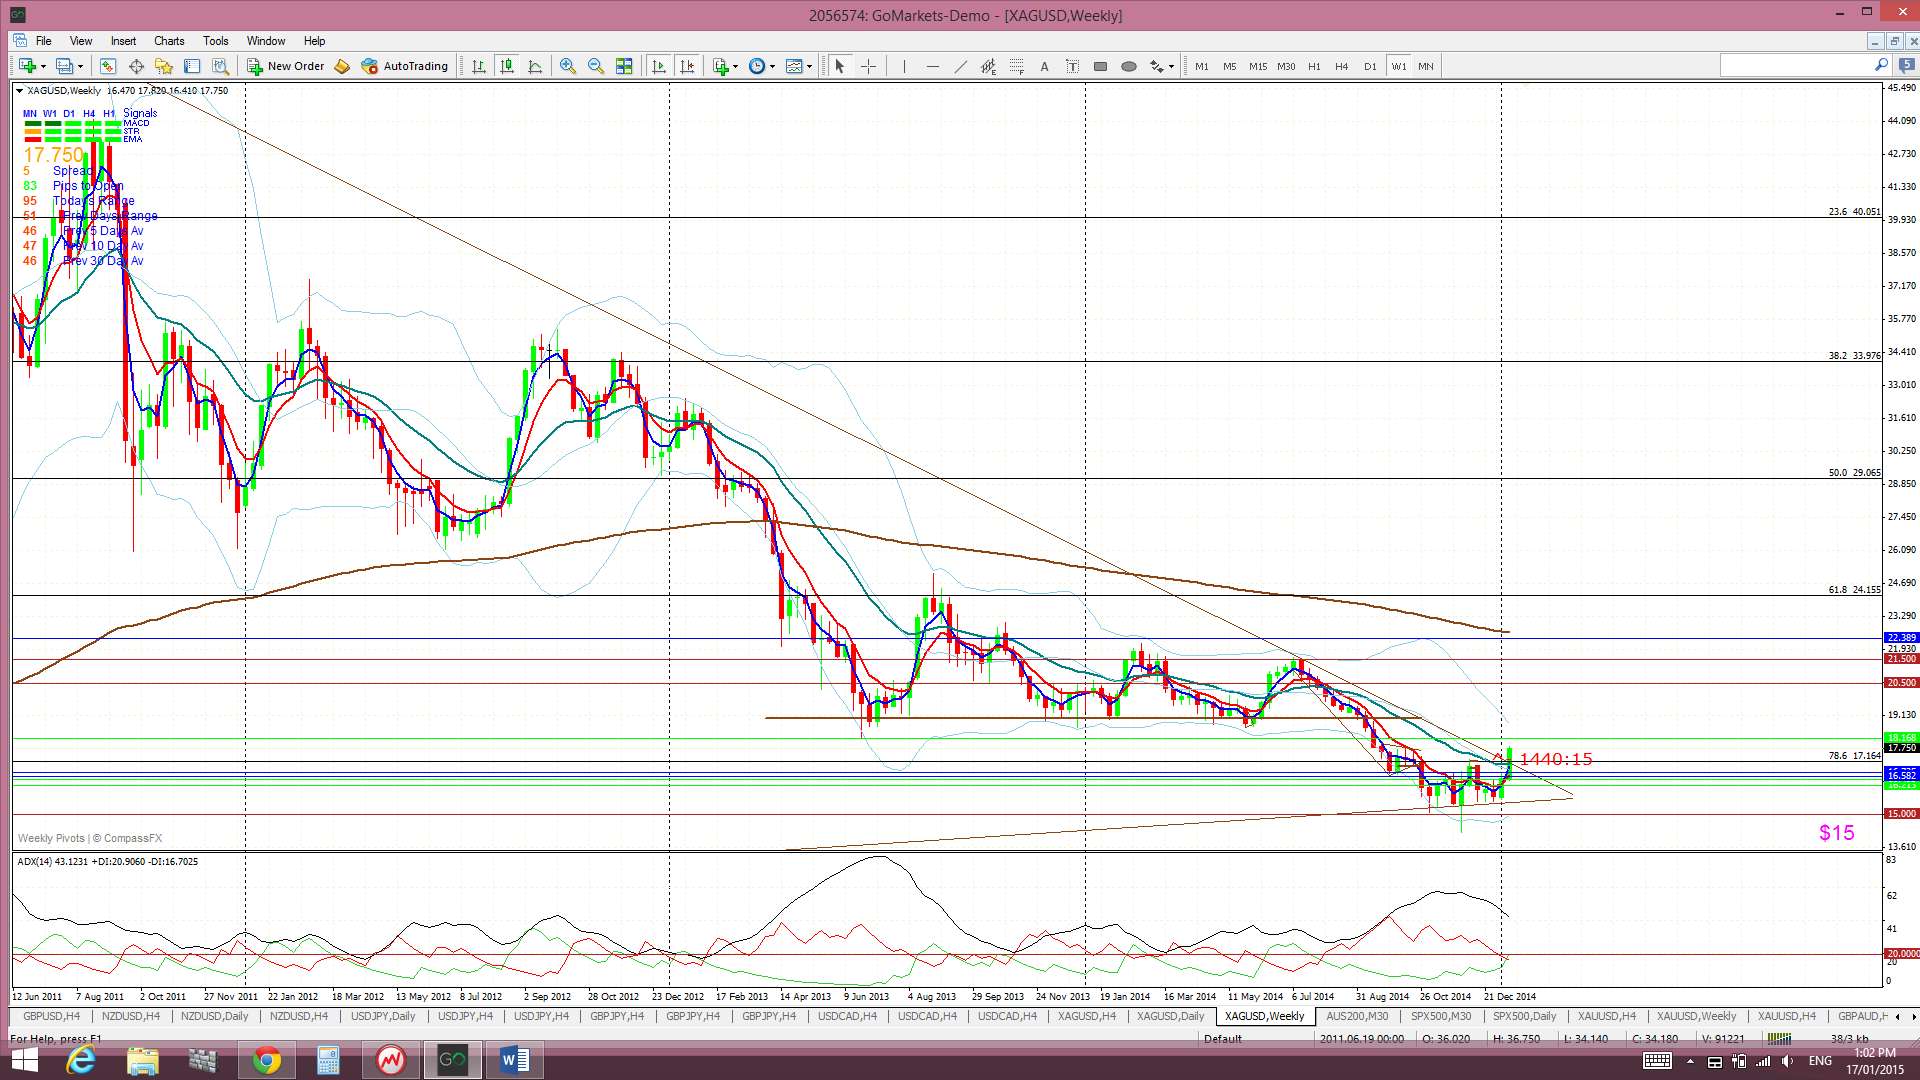
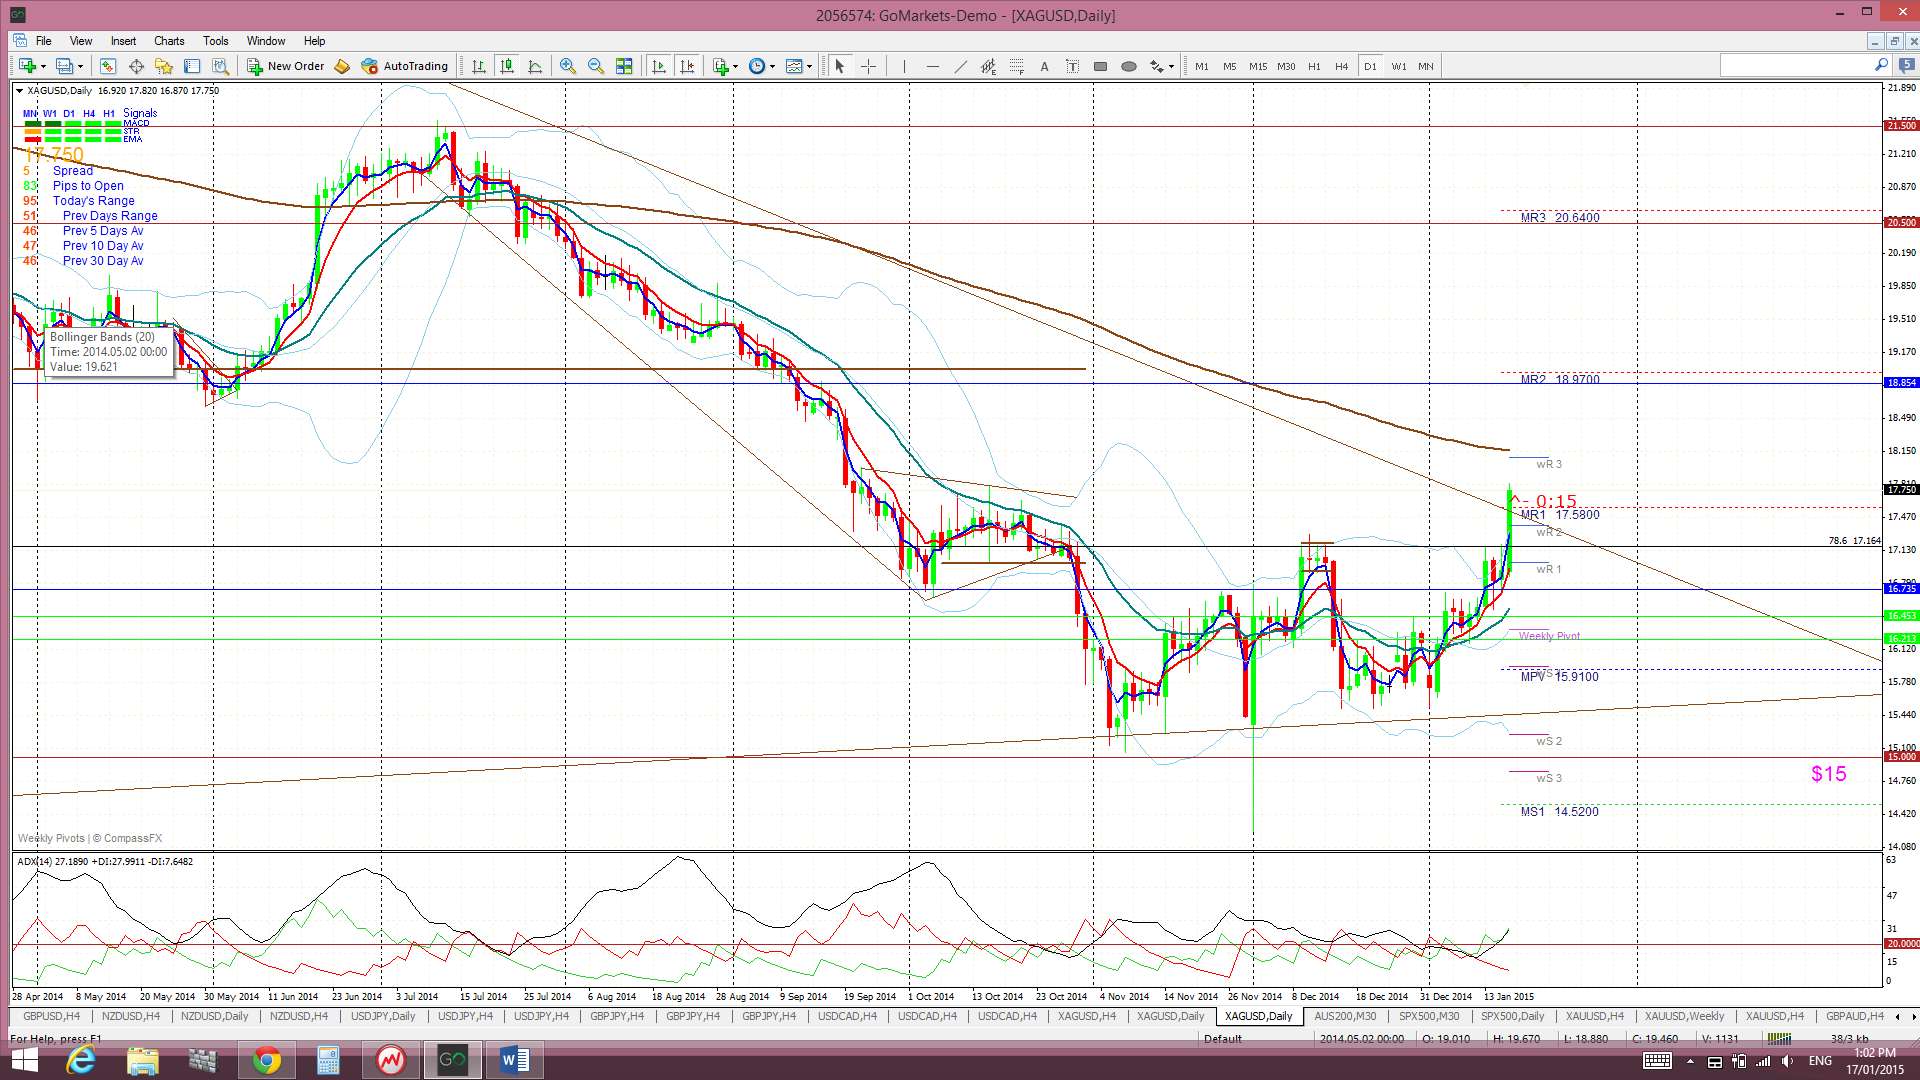
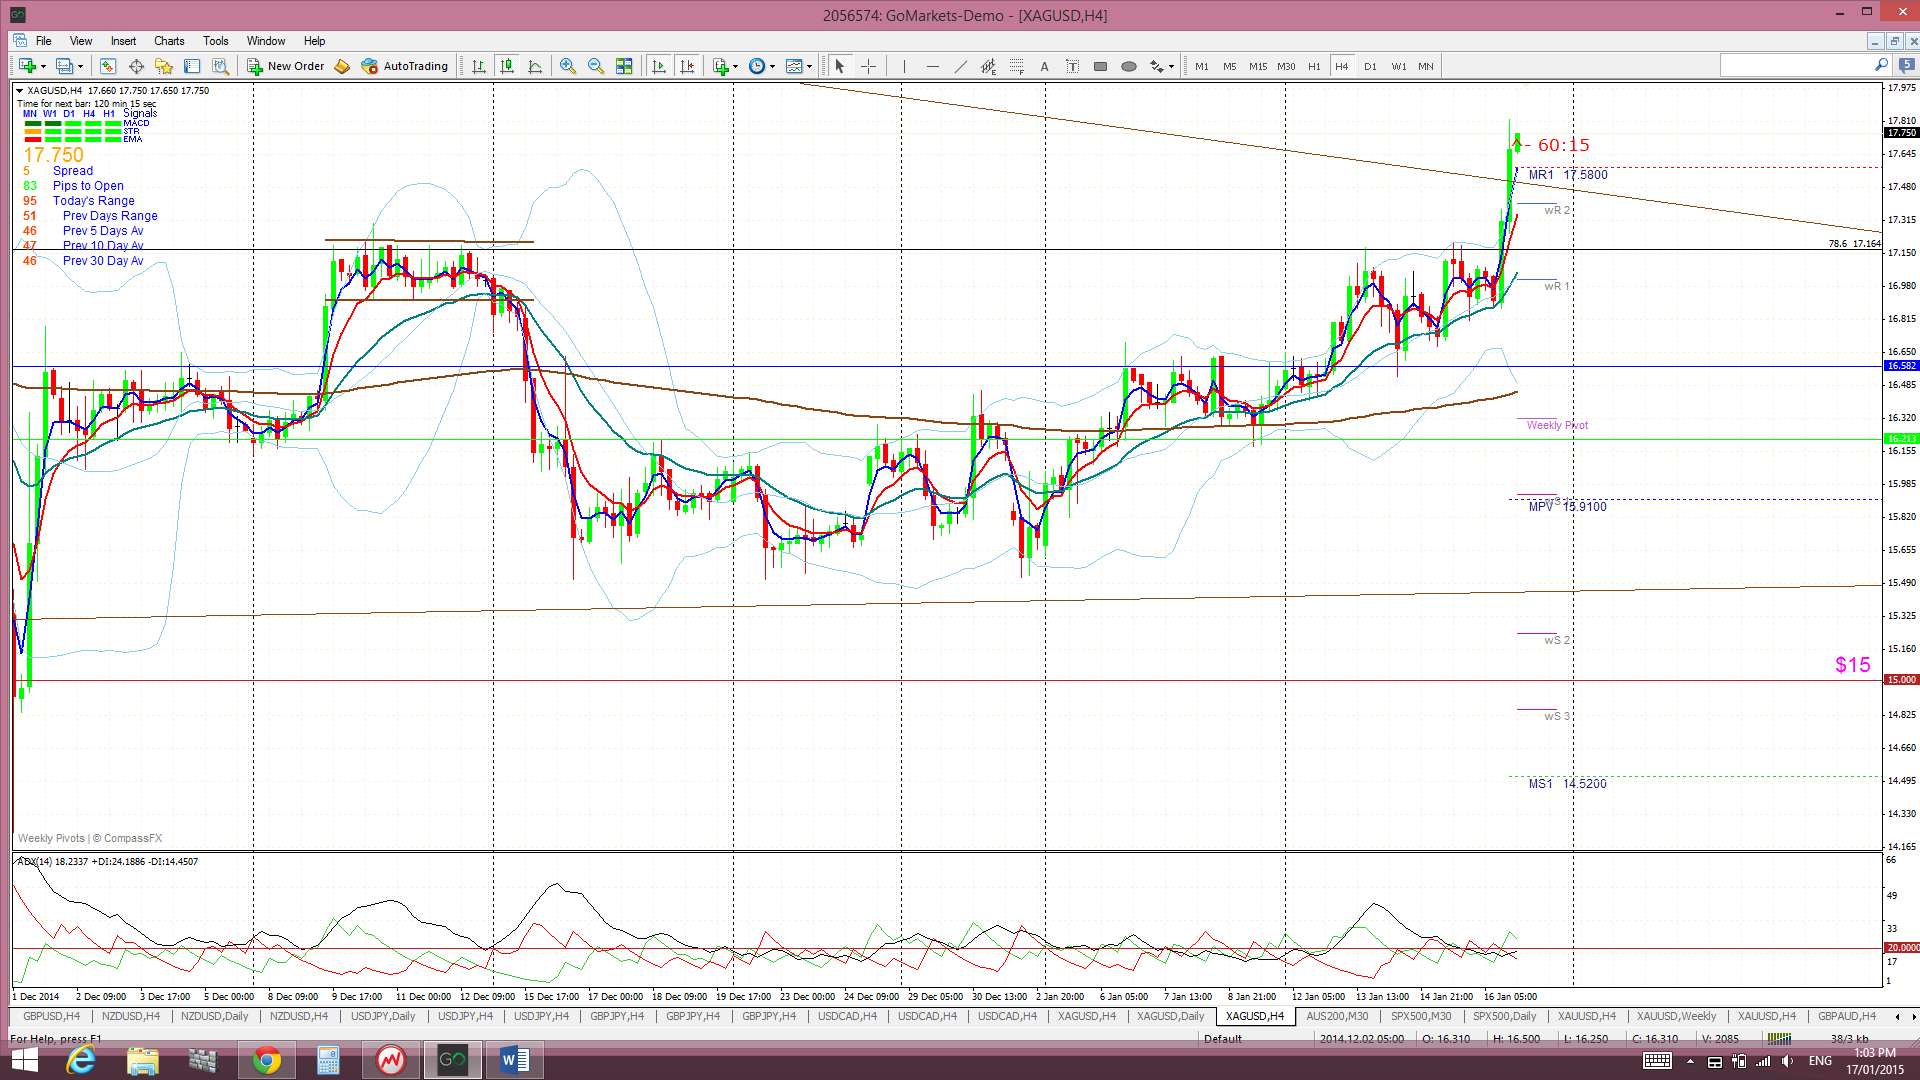
Silver: Silver chopped higher last week and on Thursday was trading only about $0.35 (35 pips) away from a major monthly triangle trend line that has been in effect since 2011. A rally on Friday though saw price break above this bear trend line and a new TC signal looks set to form shortly. This is a monthly chart pattern however and traders really should wait and see a monthly close above this triangle trend line to confirm any possible bullish triangle breakout.
Silver is still trading above the Ichimoku Cloud on the 4hr and daily charts but below the Cloud on the weekly and monthly charts.
The weekly candle closed as a large bullish candle following last week’s bullish engulfing candle. Traders need to remember that Silver printed a bullish engulfing candle for the December monthly candle and that was the first bullish candle in over five months.
- I’m watching for any new TC signal, the monthly triangle trend lines and the $15 level.
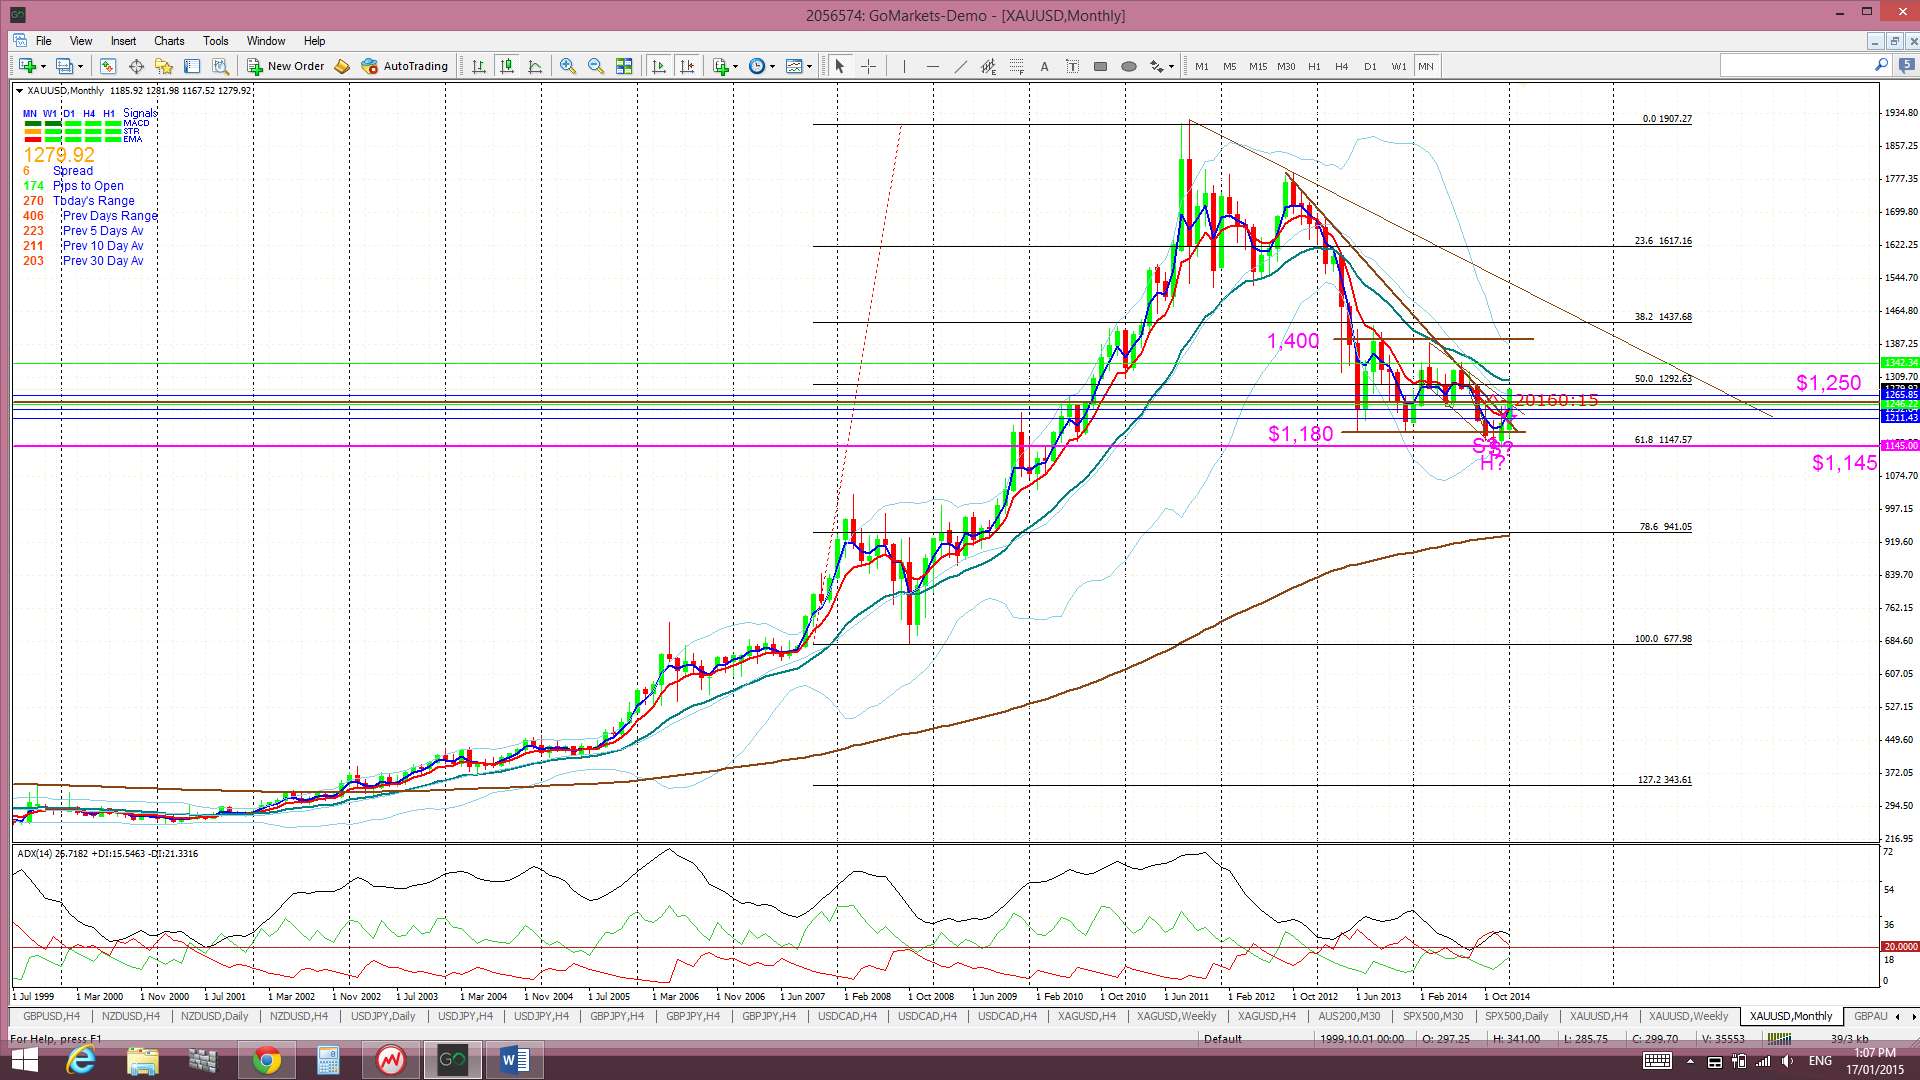
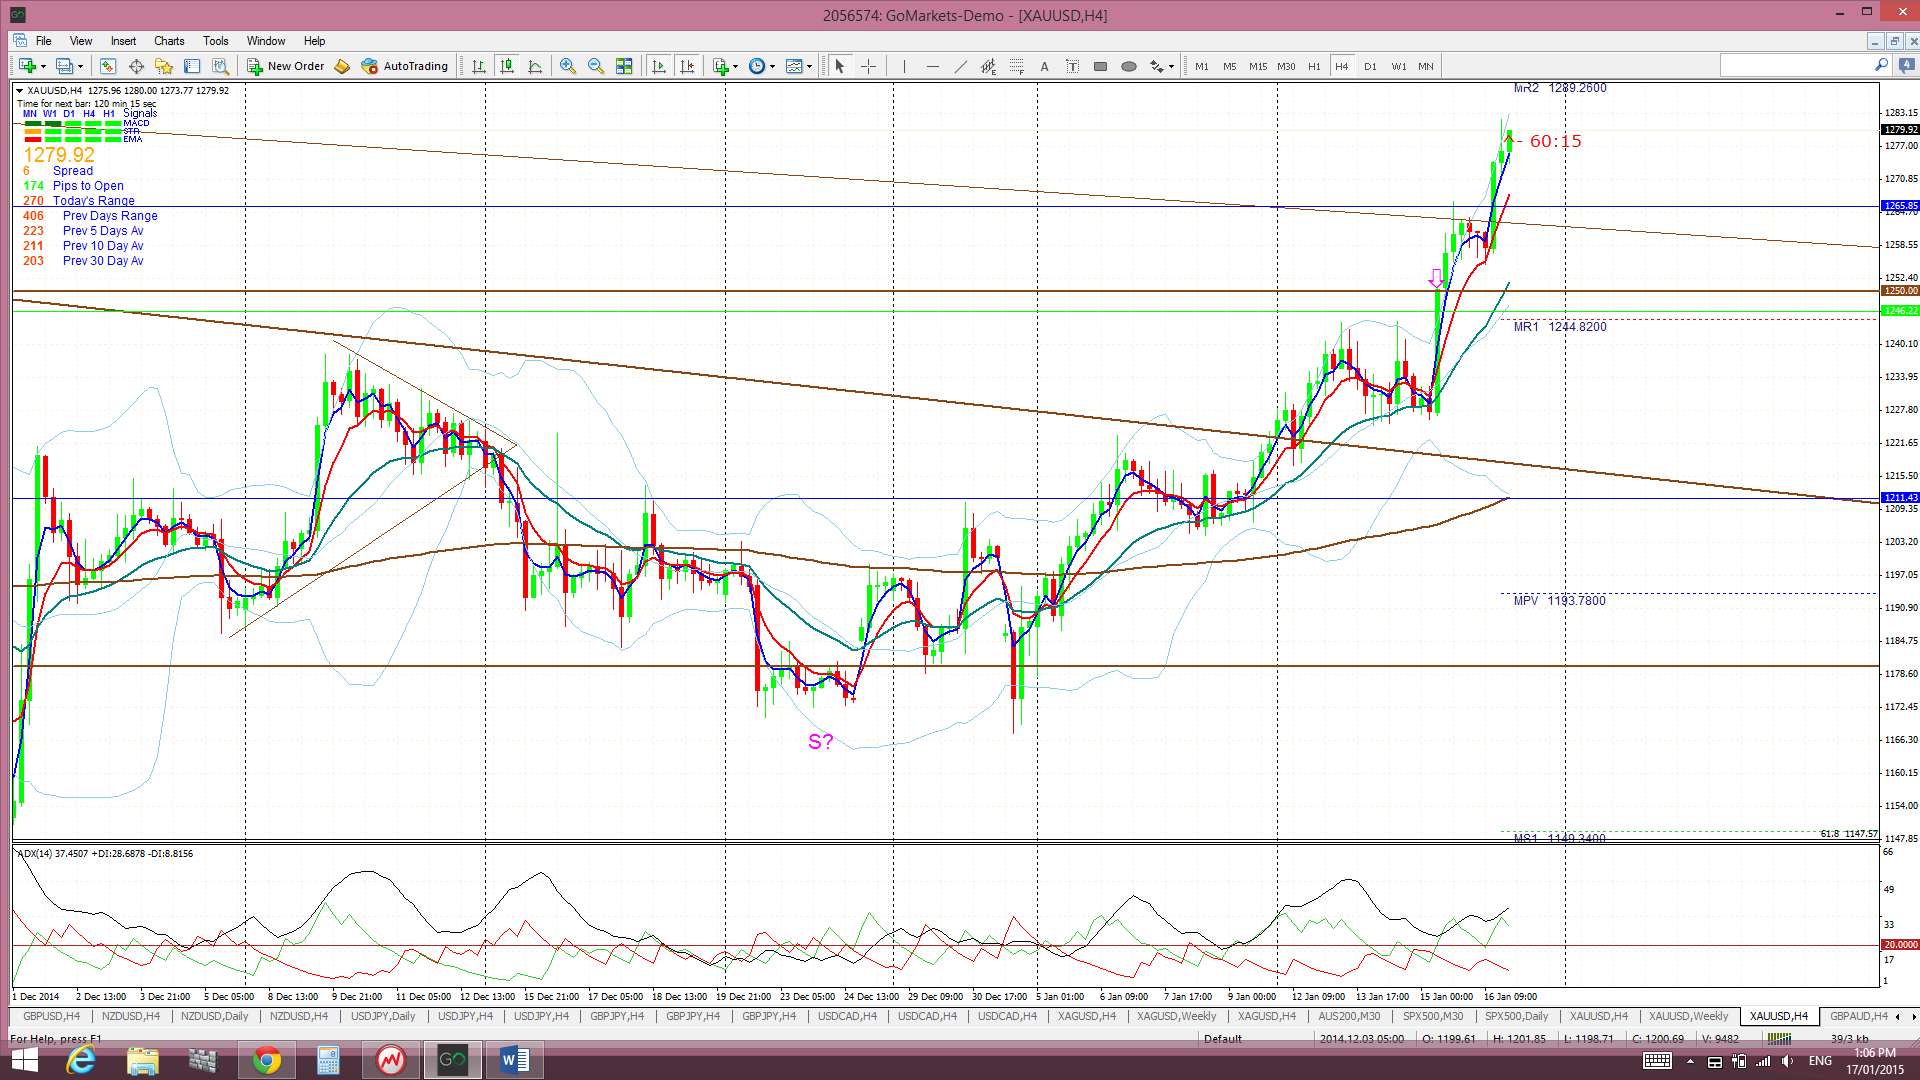
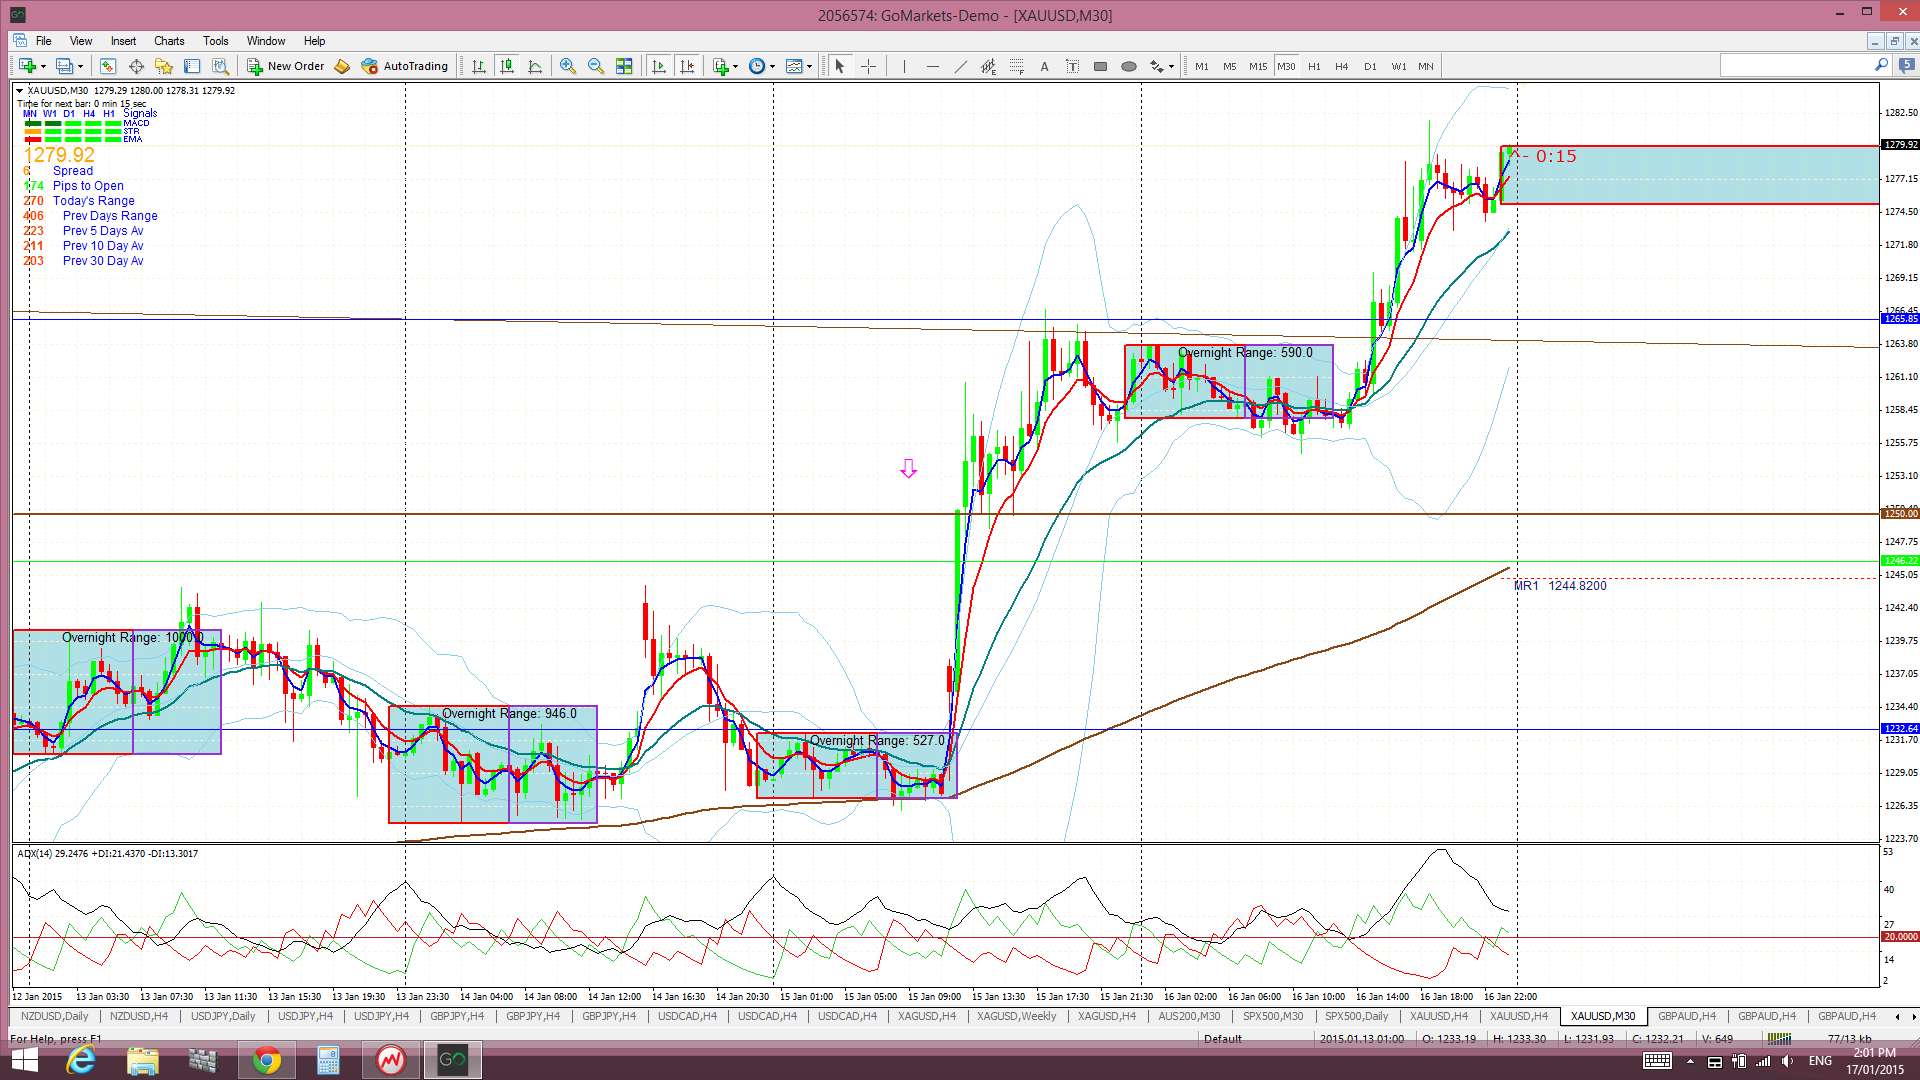
Gold: Gold chopped higher last week and the SNB intervention gave it the push to break above the $1,250 level in a move which also triggered a new TC signal that is up over 300 pips. Thursday’s daily close above $1,250 was the first in almost 4 months and the weekly close above this level suggests a bullish ‘inverse H&S’ may be in play. It certainly looks like the 61.8% fib of the 2007-2011 bull run, down near the $1,145 level, has formed a base for this metal now and it may be in for some bullish continuation.
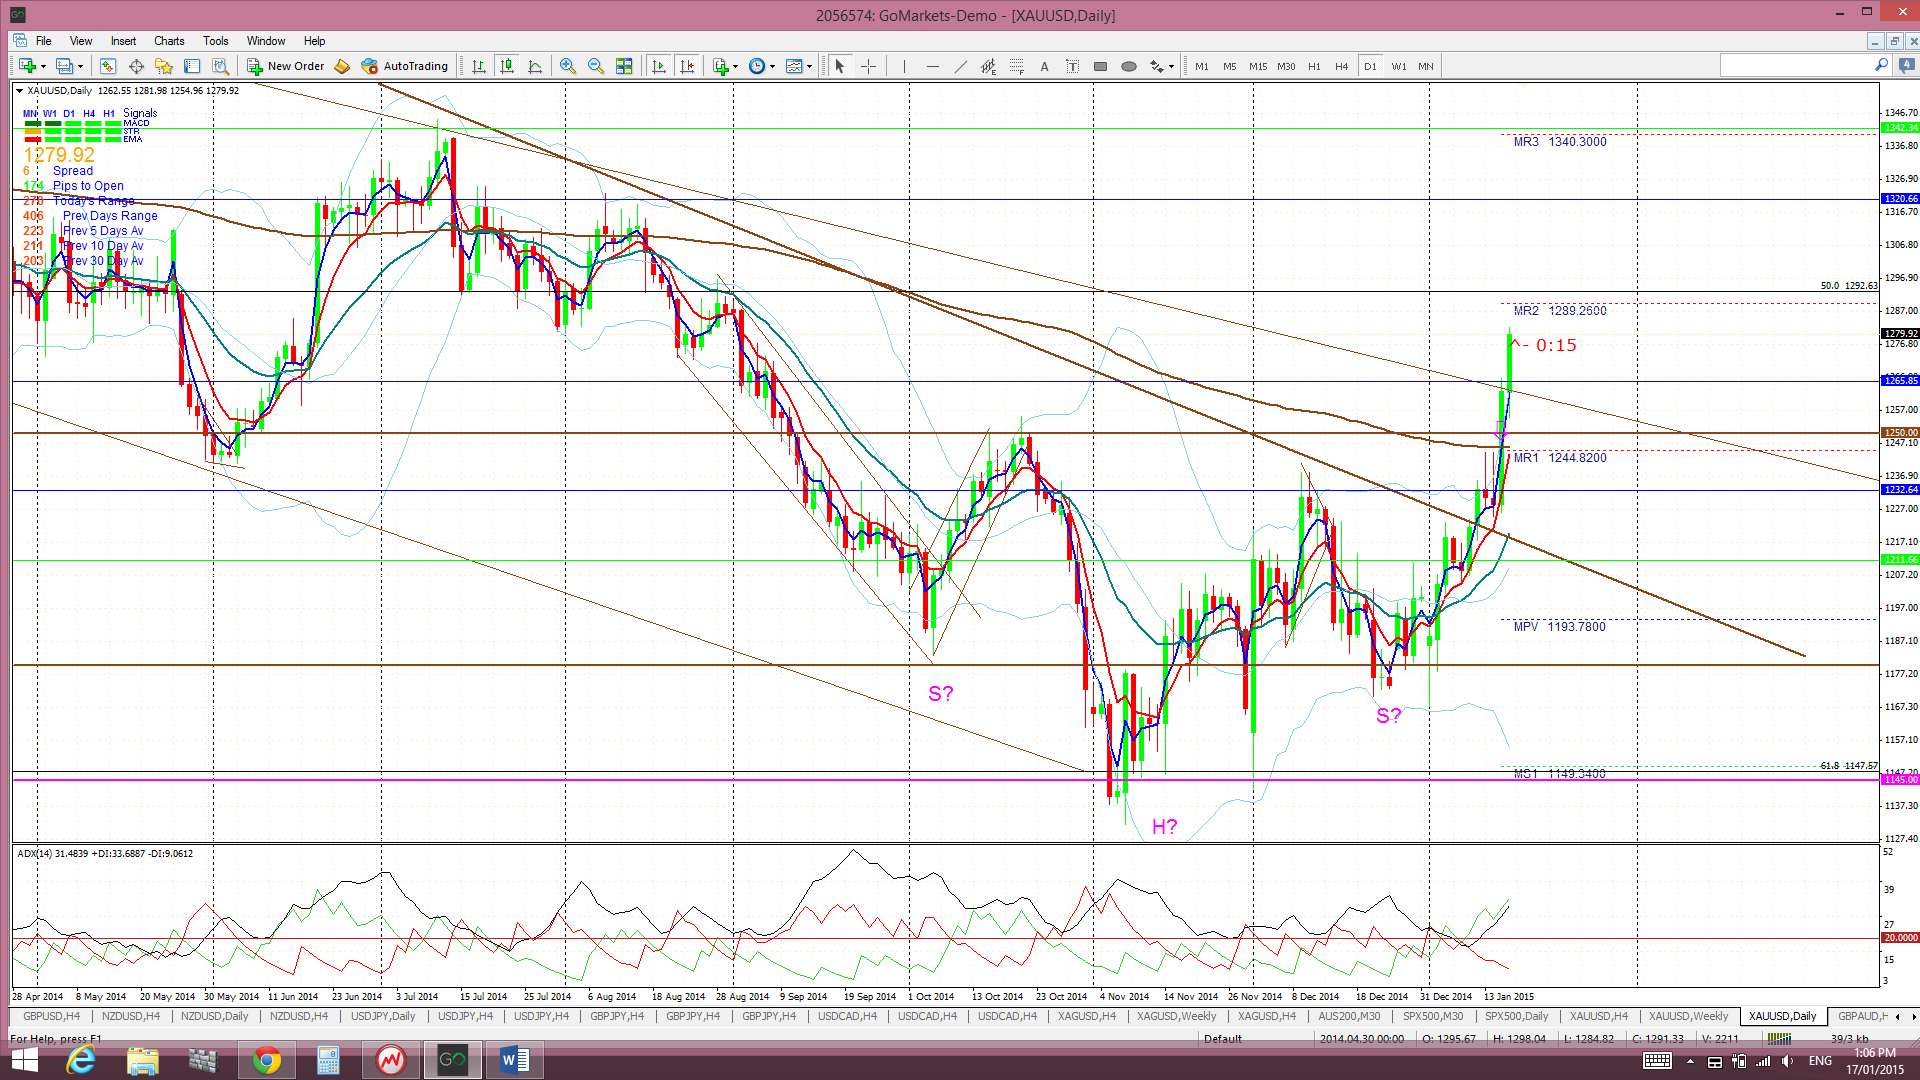
Even before this SNB activity I had noted the bullish ‘Inverse H&S’ pattern setting up on the Gold daily chart. The daily chart, at that time of posting, appears below:
Gold daily chart: Inverse H&S noted with a ‘neck line’ at $1,250 PRIOR to SNB:
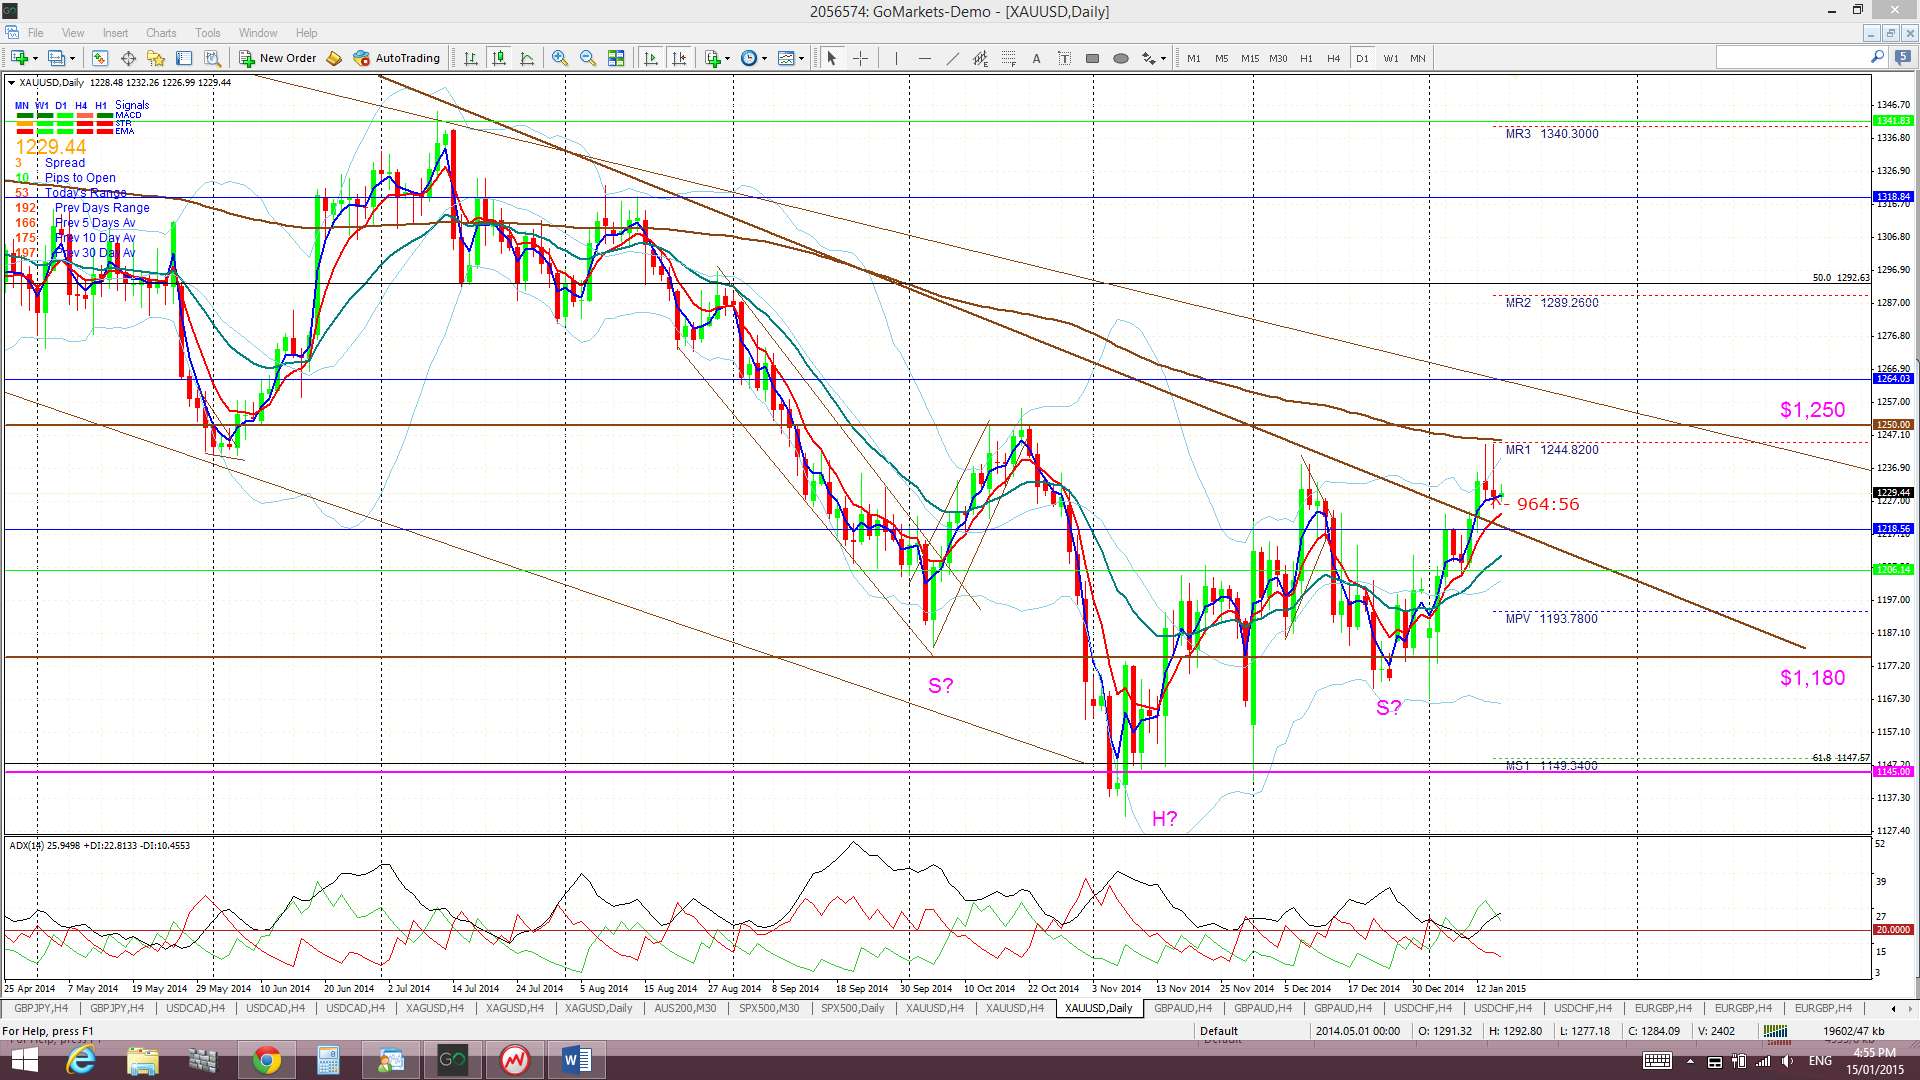
Inverse H&S: The weekly close above the $1,250 ‘neck line’ suggests that this technical pattern is underway. The ‘height’ of the H&S is about $105 ( $1,250 – $1,145). This would suggest bullish continuation of the same order which places the target move at around $1,355 ($1,250 + $105). Interestingly, this target is near the weekly 200 EMA and just below the upper limit of the weekly charts horizontal trading channel that has held price since the start of 2013. I would not be surprised to see another test of this $1,250 level though so ‘long’ traders might want to lock in profit before any possible dip.
The weekly chart shows that Gold has also broken above two bear trend lines: one that has been in place since late 2012 and one that has been in place for much of 2014 and, as such, this also marks a significant bullish breakout. The next major trend line above current price is that of the upper trend line of the horizontal trading channel at $1,400 but, clearly, the whole number $1,300 and half number $1,350 levels will be resistance as well.
The monthly chart shows that price action is forming up in a larger descending triangle pattern. The weekly chart though shows that any 61.8% fib pullback of the recent swing low move (2012-present) would bring price up to near this monthly trend line. This will be a level to watch if the $1,400 is broken.
It certainly looks like Gold has carved out a base here BUT any new break and hold below $1,145 would suggest that this support might give way to a deeper pull back. Bearish targets below $1,145 include the $1,000 psychological level and, then, the 78.6% fib near $950.
Gold is trading above the Ichimoku Cloud on the 4hr and daily charts but just below the Cloud on the weekly and monthly charts.
The weekly candle closed as a large bullish candle following last week’s bullish, almost ‘engulfing’ candle.
- There is an open TC signal on this pair.

The post Big week for the EUR, some FX pairs at critical levels & Gold and Silver shine. appeared first on www.forextell.com.