USDX
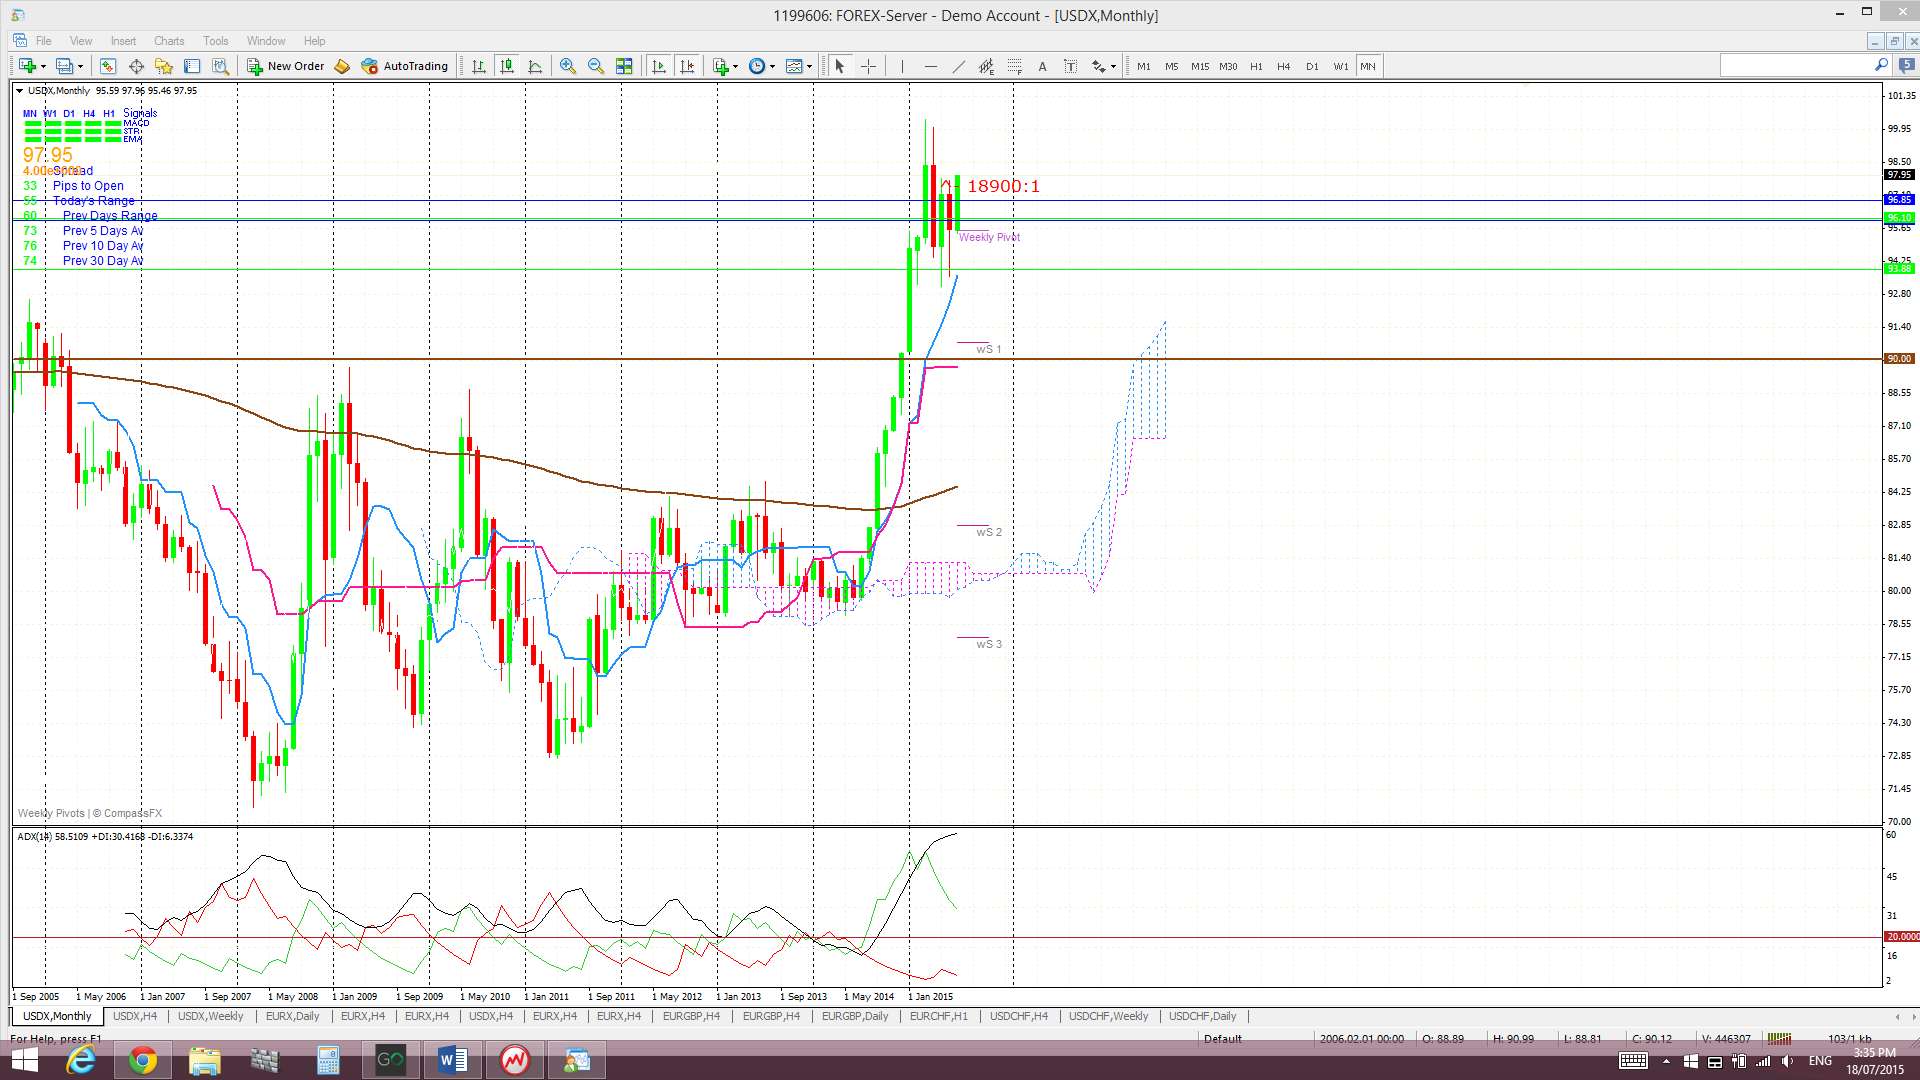
Monthly: The July candle is printing an, essentially, bullish engulfing candle.
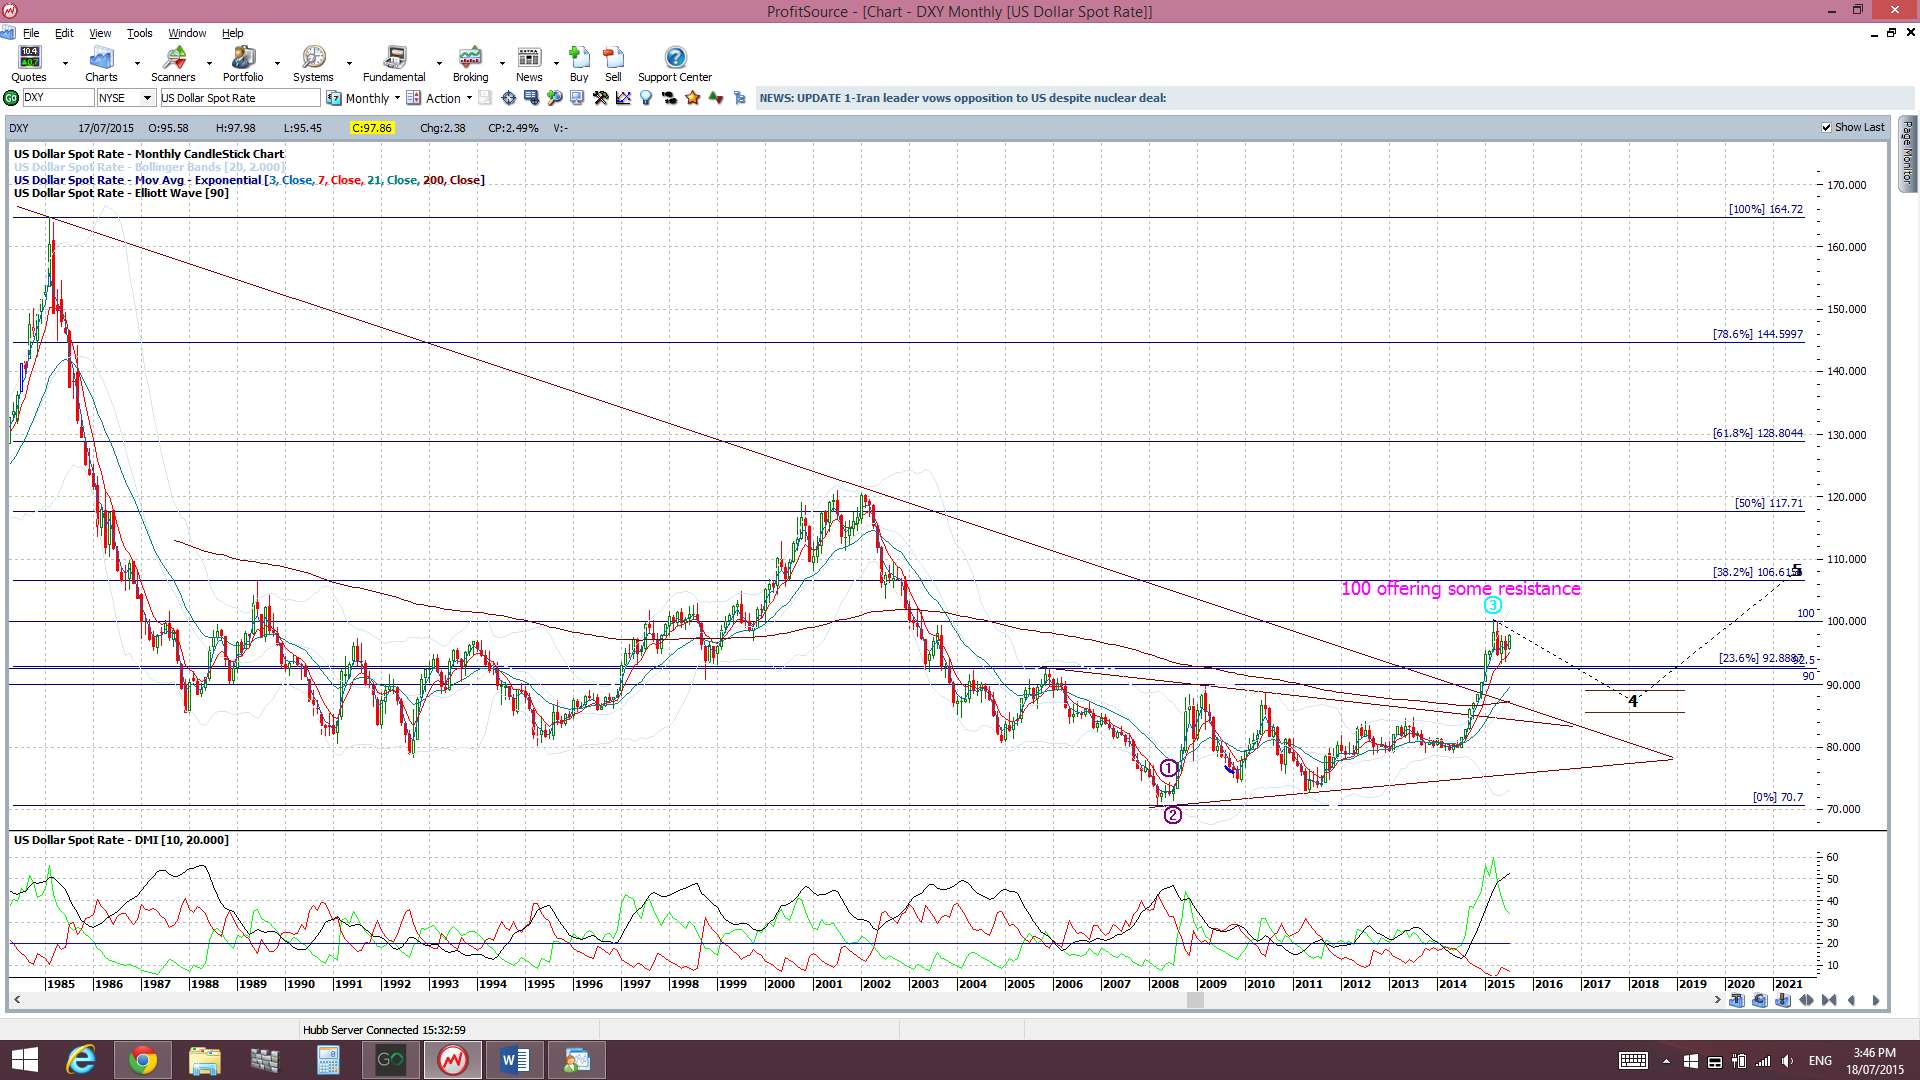
Monthly Ichimoku: The July candle is trading above the Cloud.
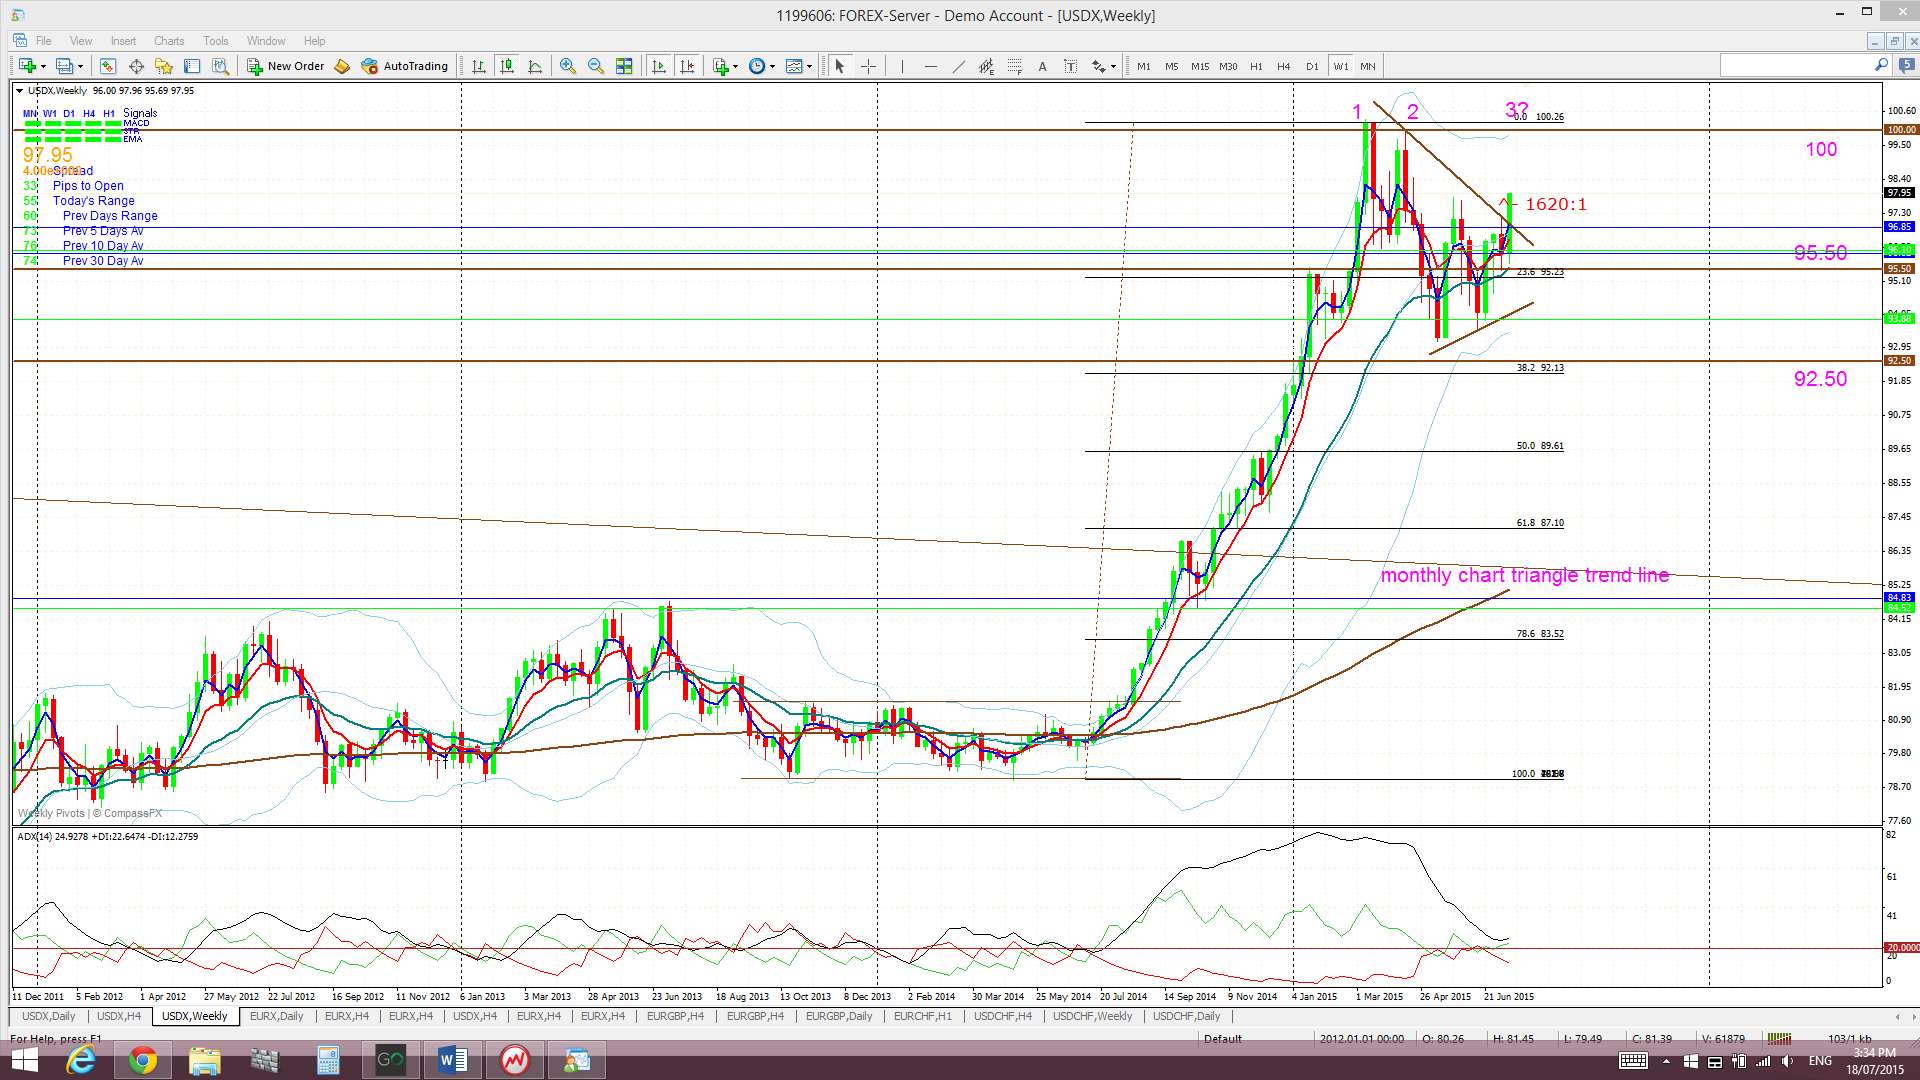
Weekly: Last week’s candle closed as a large bullish engulfing candle and it also broke up and out from a triangle pattern that has been brewing since the start of March. This trend line break is supporting a Bull Flag breakout on the weekly chart but any bullish continuation from here will bring the 100 level back into focus with, perhaps, some bearish ‘Triple Top’ jitters.
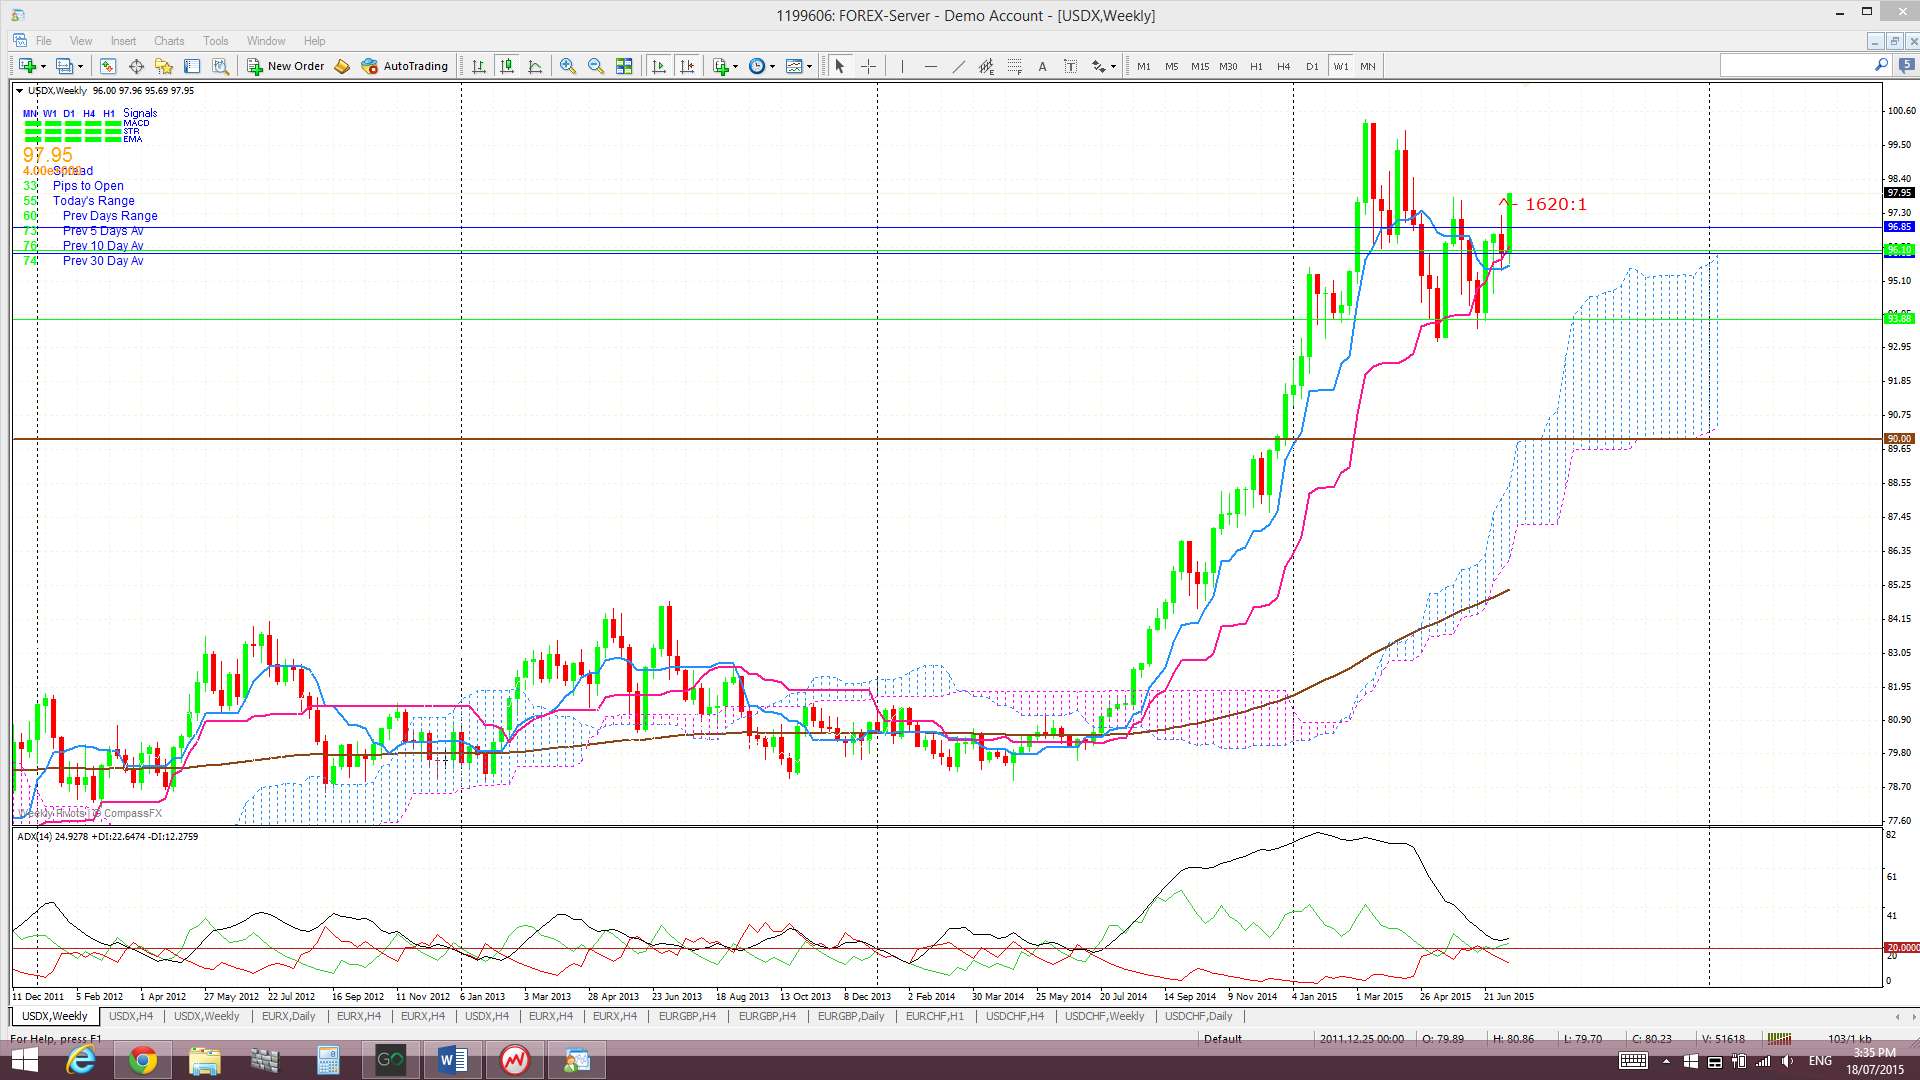
Weekly Ichimoku: The weekly candle closed ABOVE the weekly Cloud.
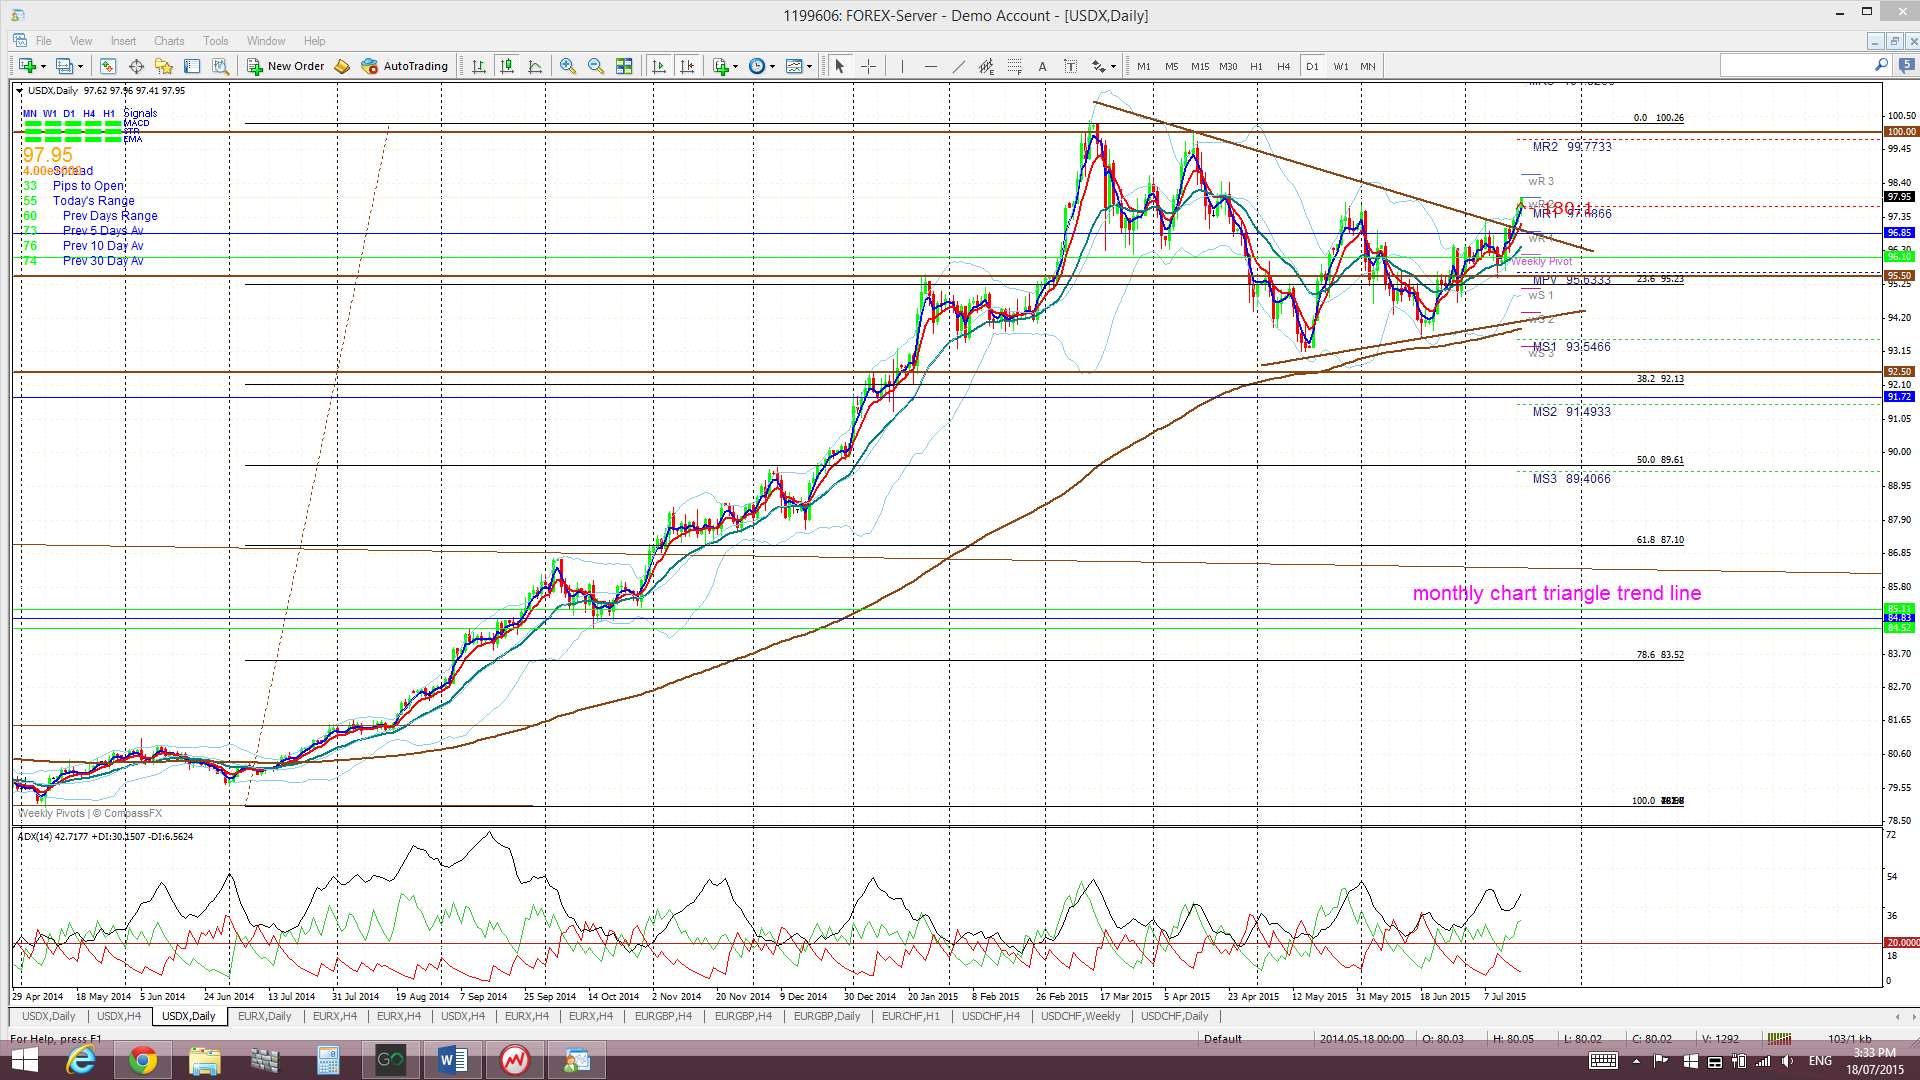
Daily: Price chopped higher last week but the 100 level remains as overall resistance above current price.
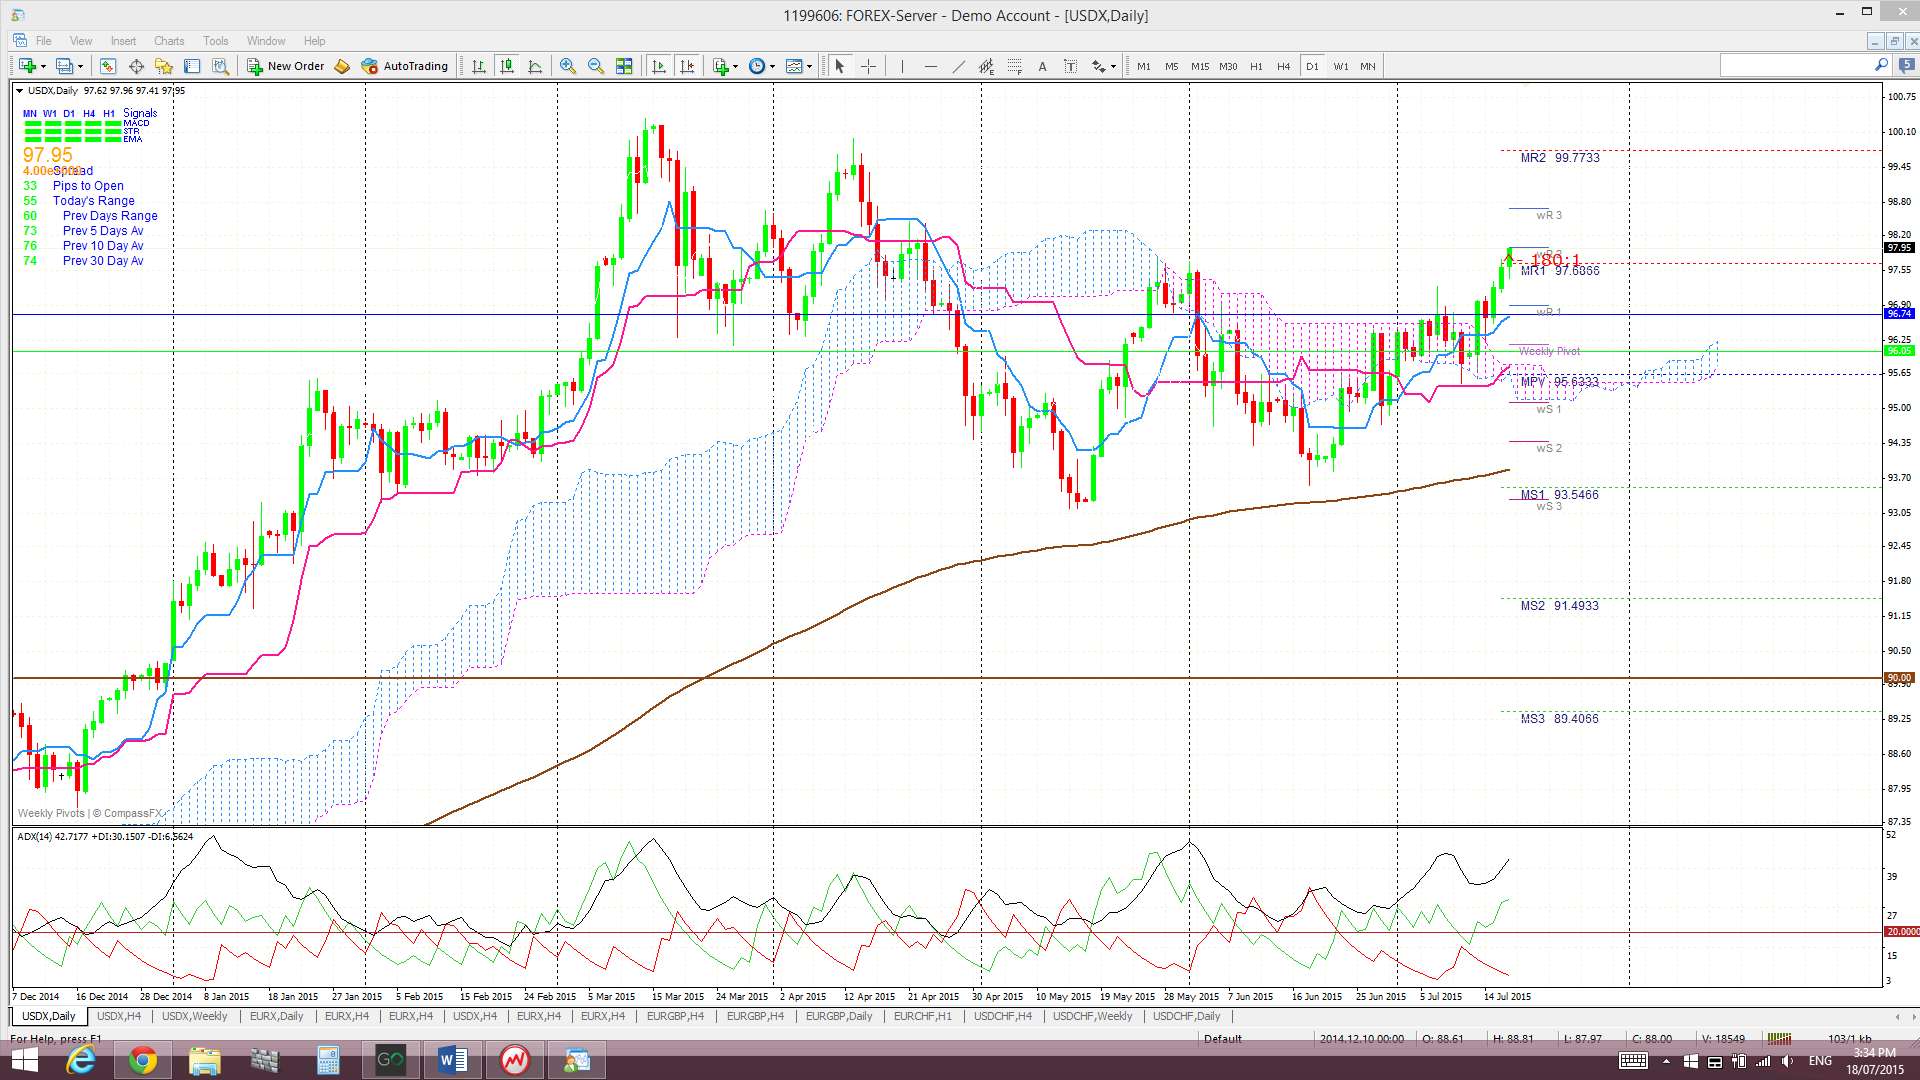
Daily Ichimoku Cloud chart: Price moved up out of the daily Cloud last week.
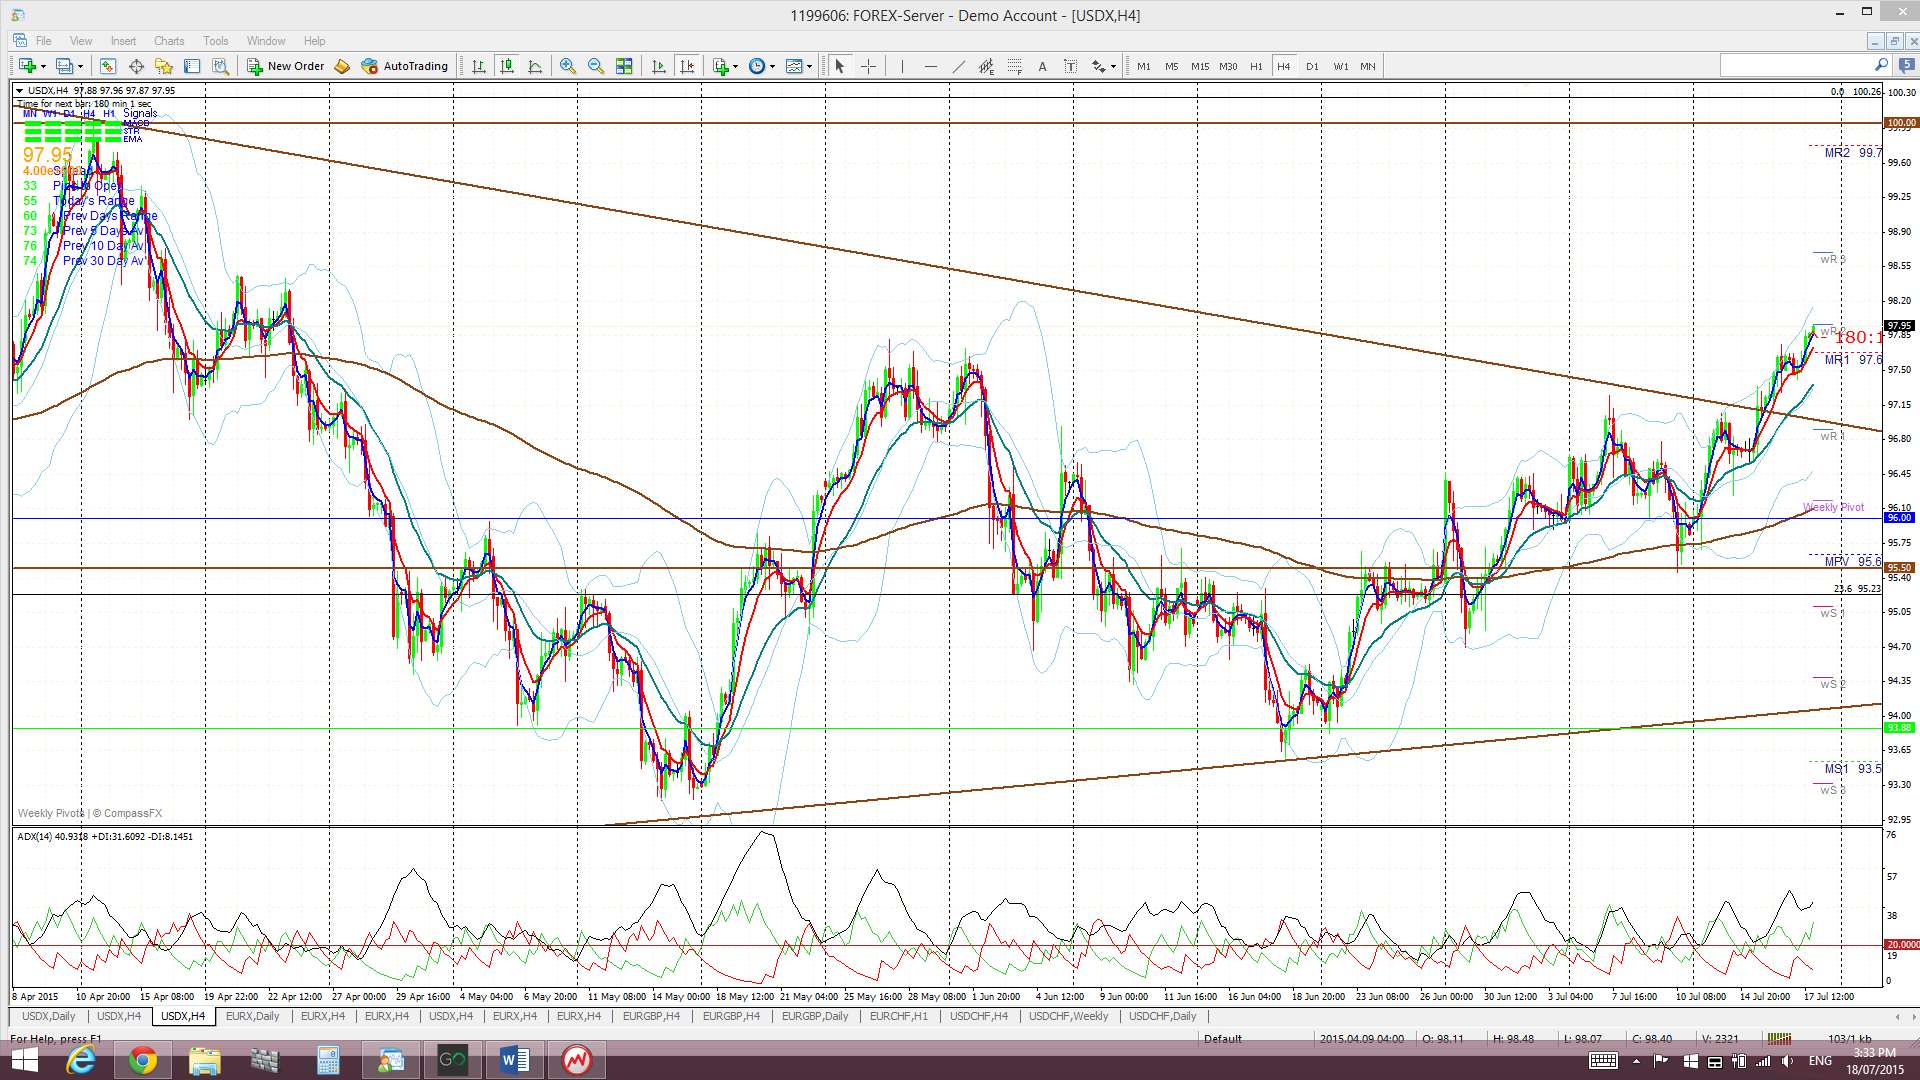
4hr: Price chopped higher last week.
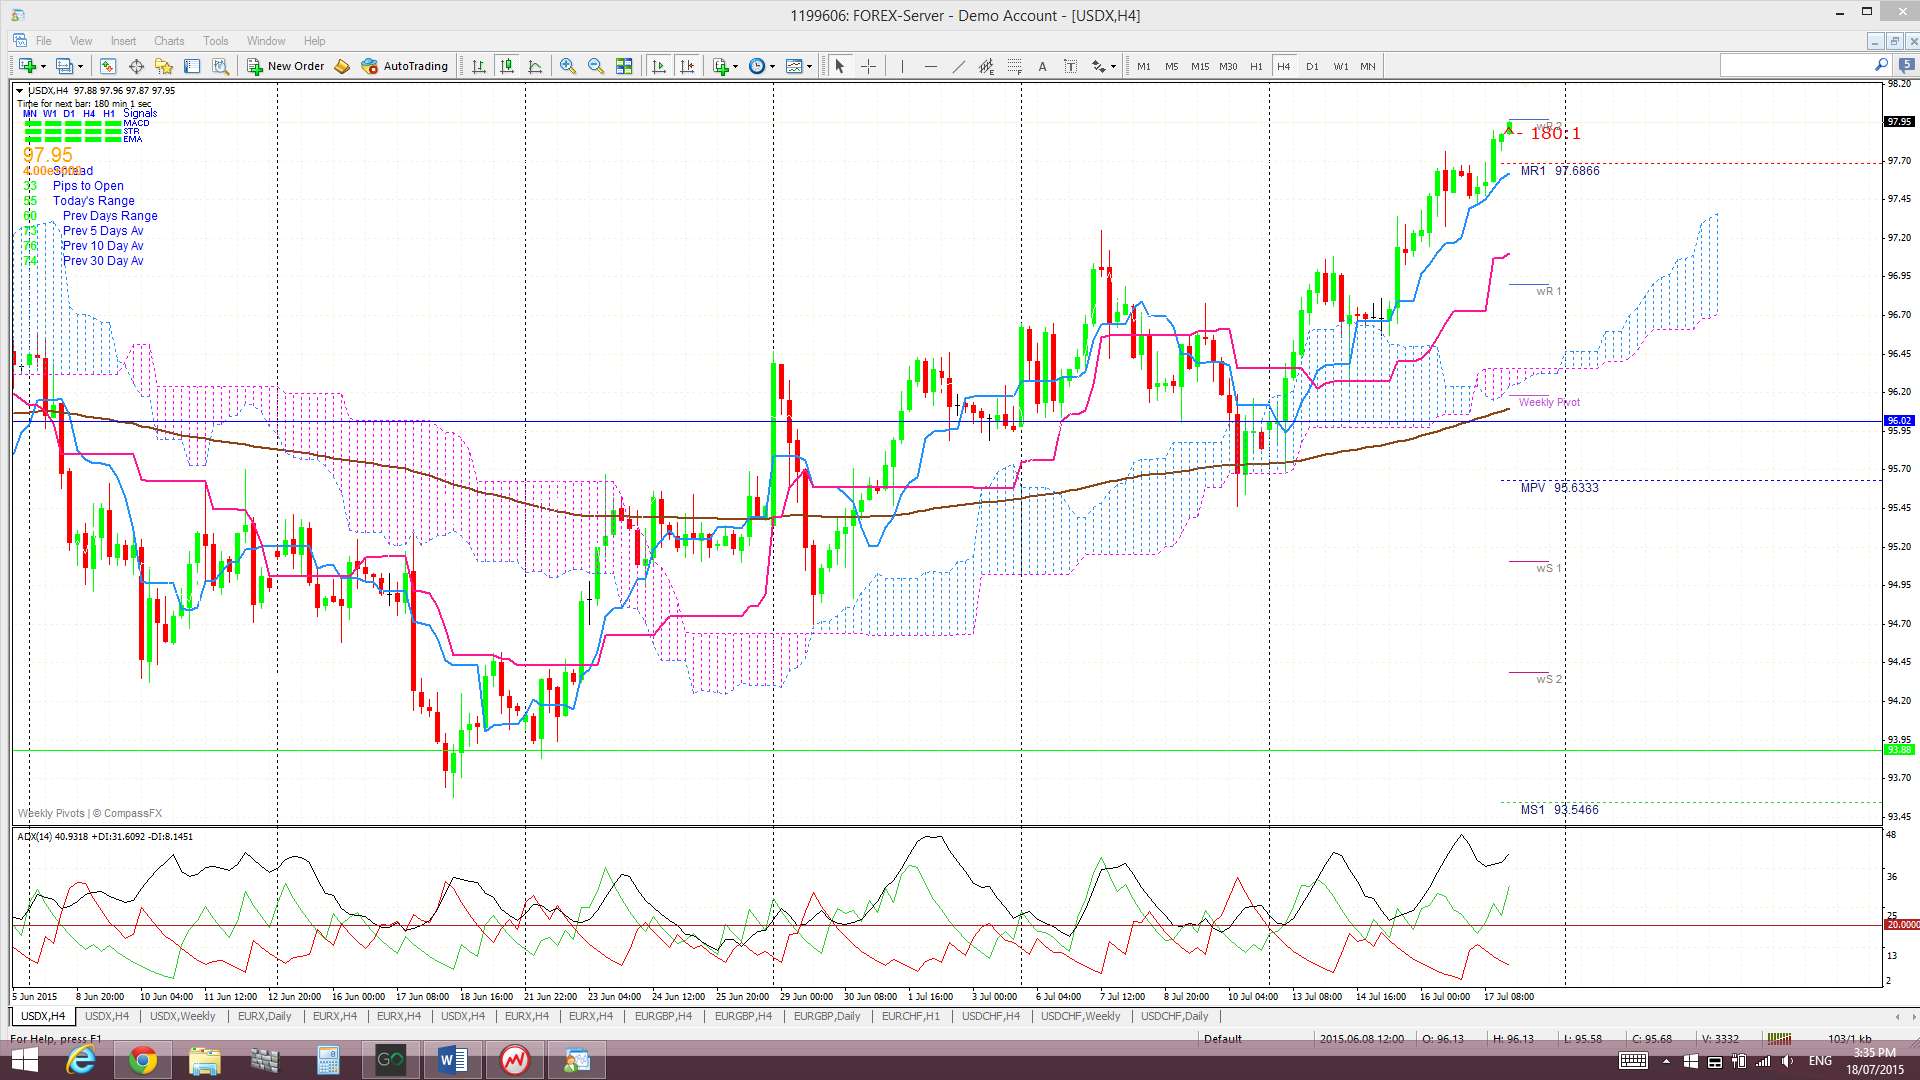
4hr Ichimoku Cloud chart: Price traded up out of the 4hr Cloud last week. This chart is now aligned with the the daily chart and suggests LONG US$.
EURX
Monthly: The July candle is printing a bearish candle and is currently back below the key 96 ‘Double Bottom’ level.
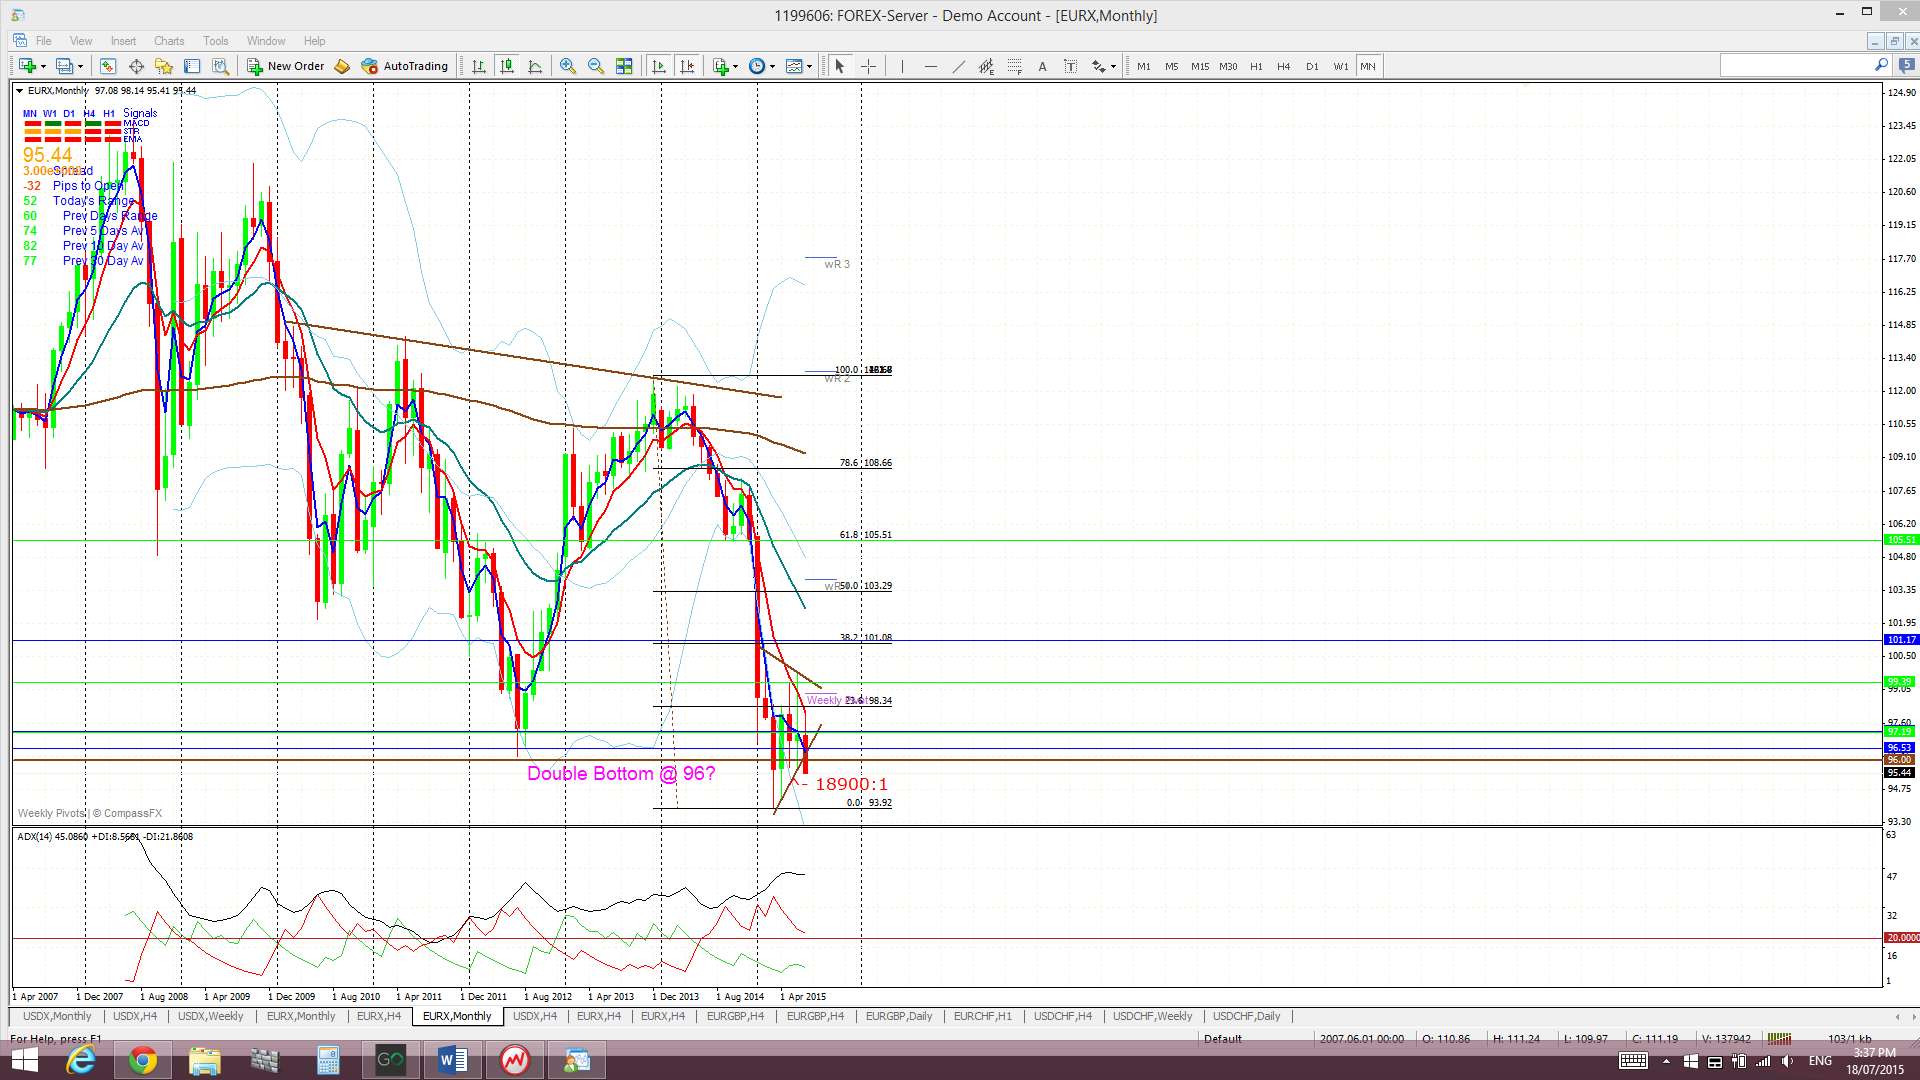
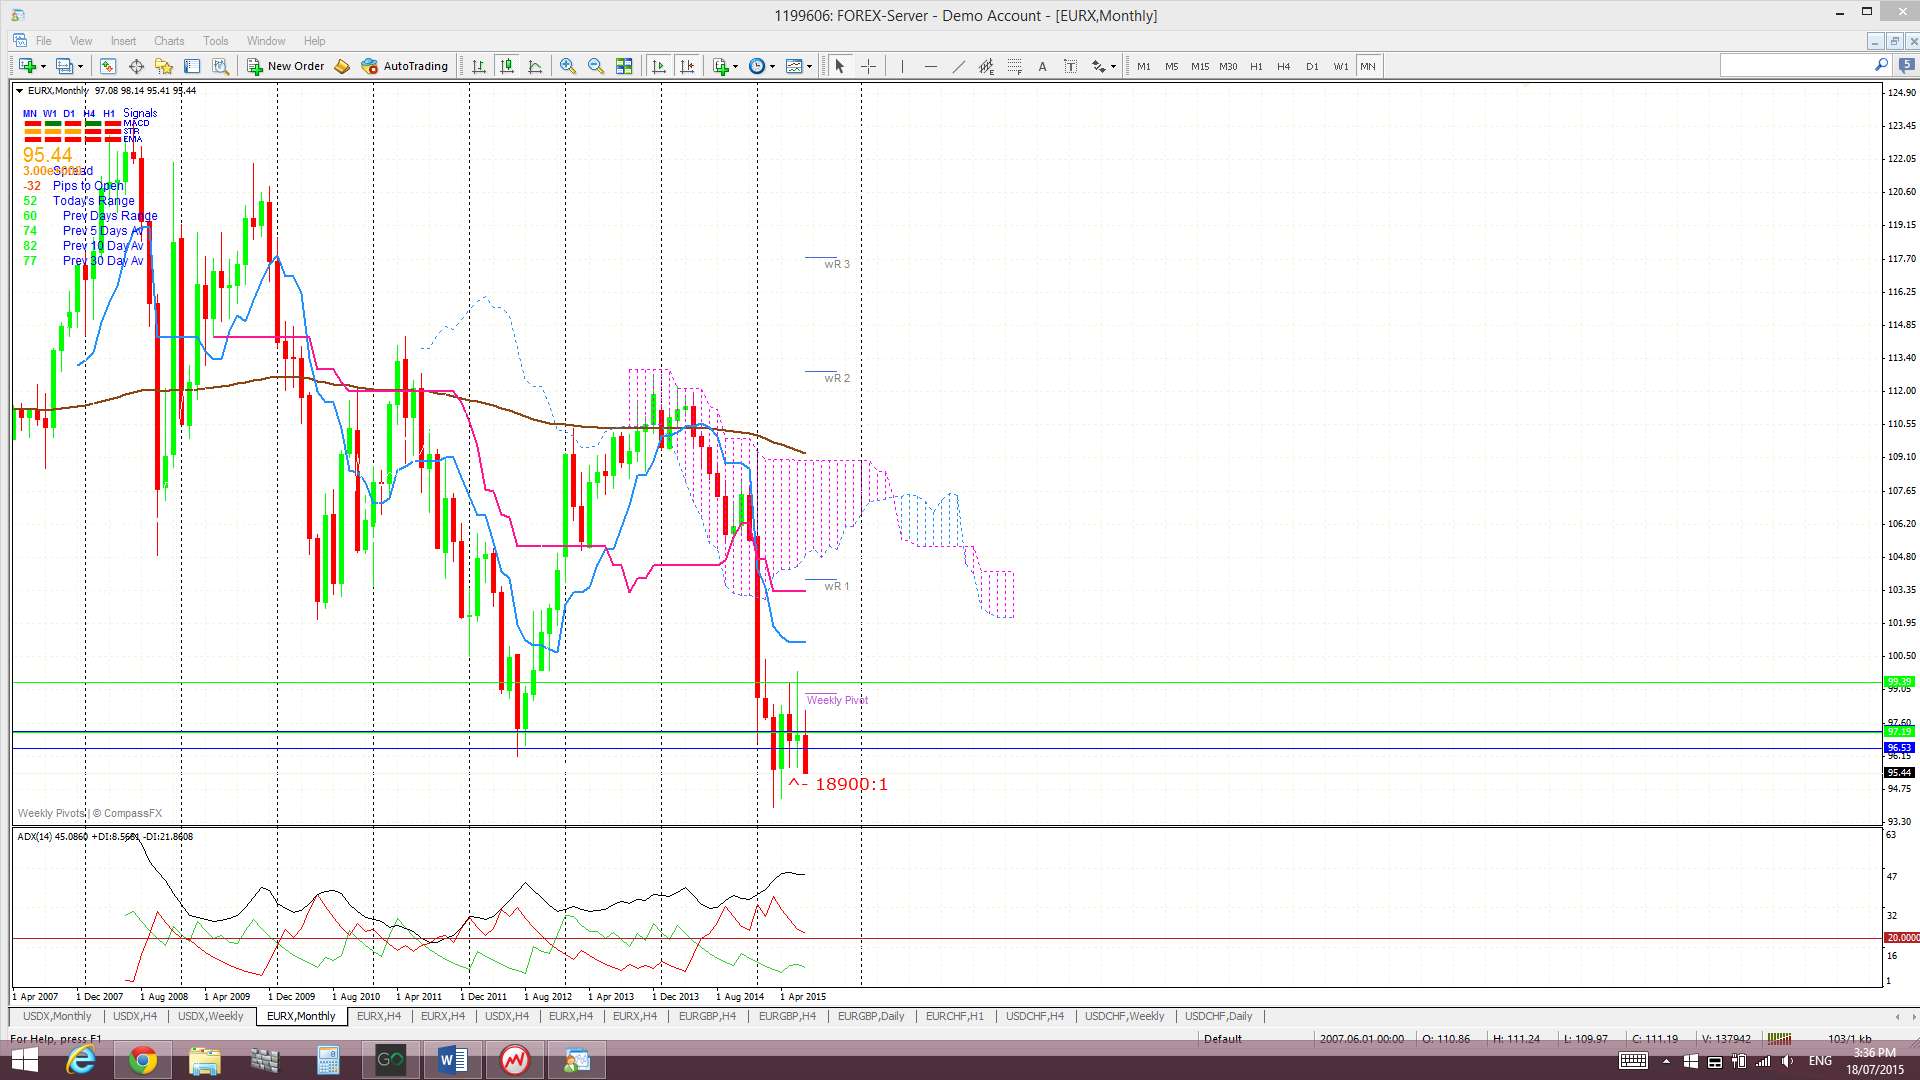
Monthly Ichimoku: The July candle is trading below the Cloud.
Weekly: The weekly candle closed as a large bearish engulfing candle and back below the key 96 level. Price also closed below a recent triangle pattern and this is supporting a Bear Flag breakdown. There have been two conflicting technical patterns competing over recent weeks; a basing-style bullish ‘Double Bottom’ near 96 and a Bear Flag but it seems that the Bear Flag may be trumping. The next level to watch here is the 94 level; a close and hold below this recent low would support the Bear Flag. However, this could also kick in with some support for the index so needs to be monitored:
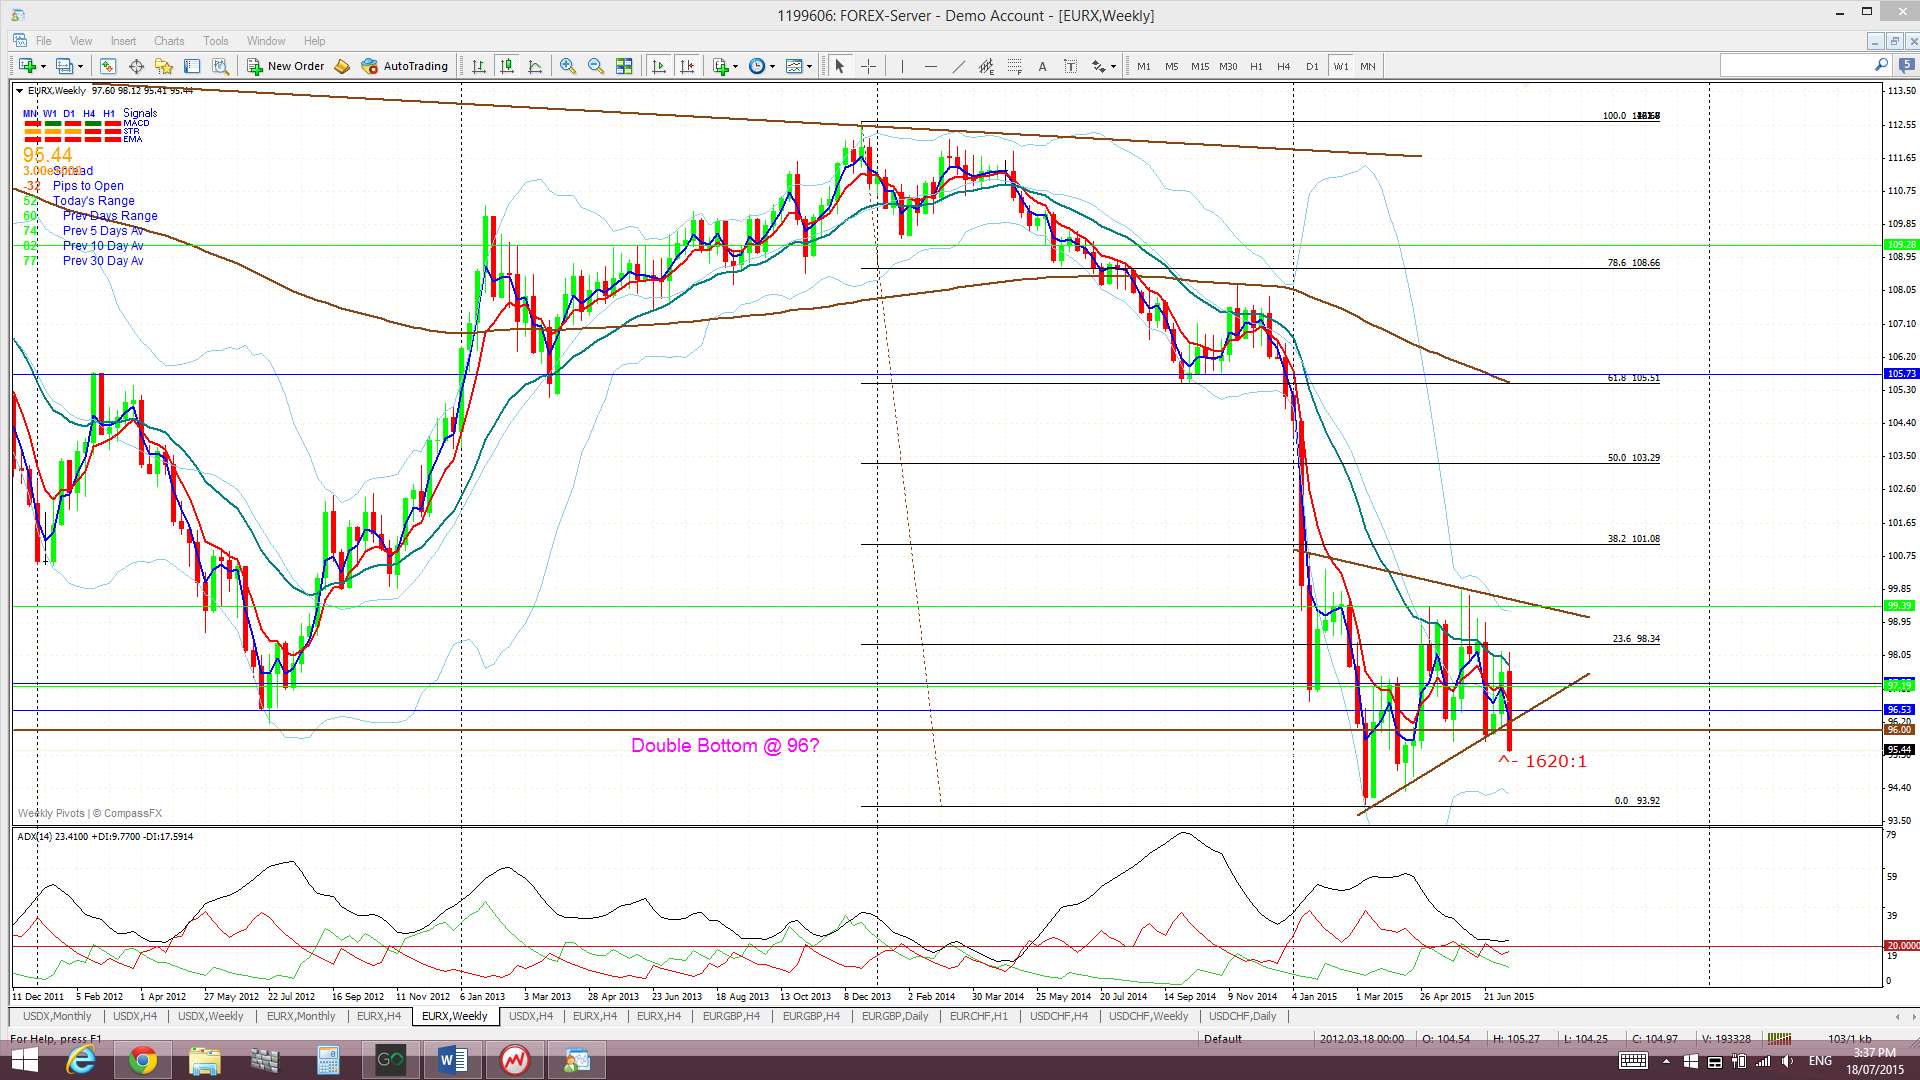
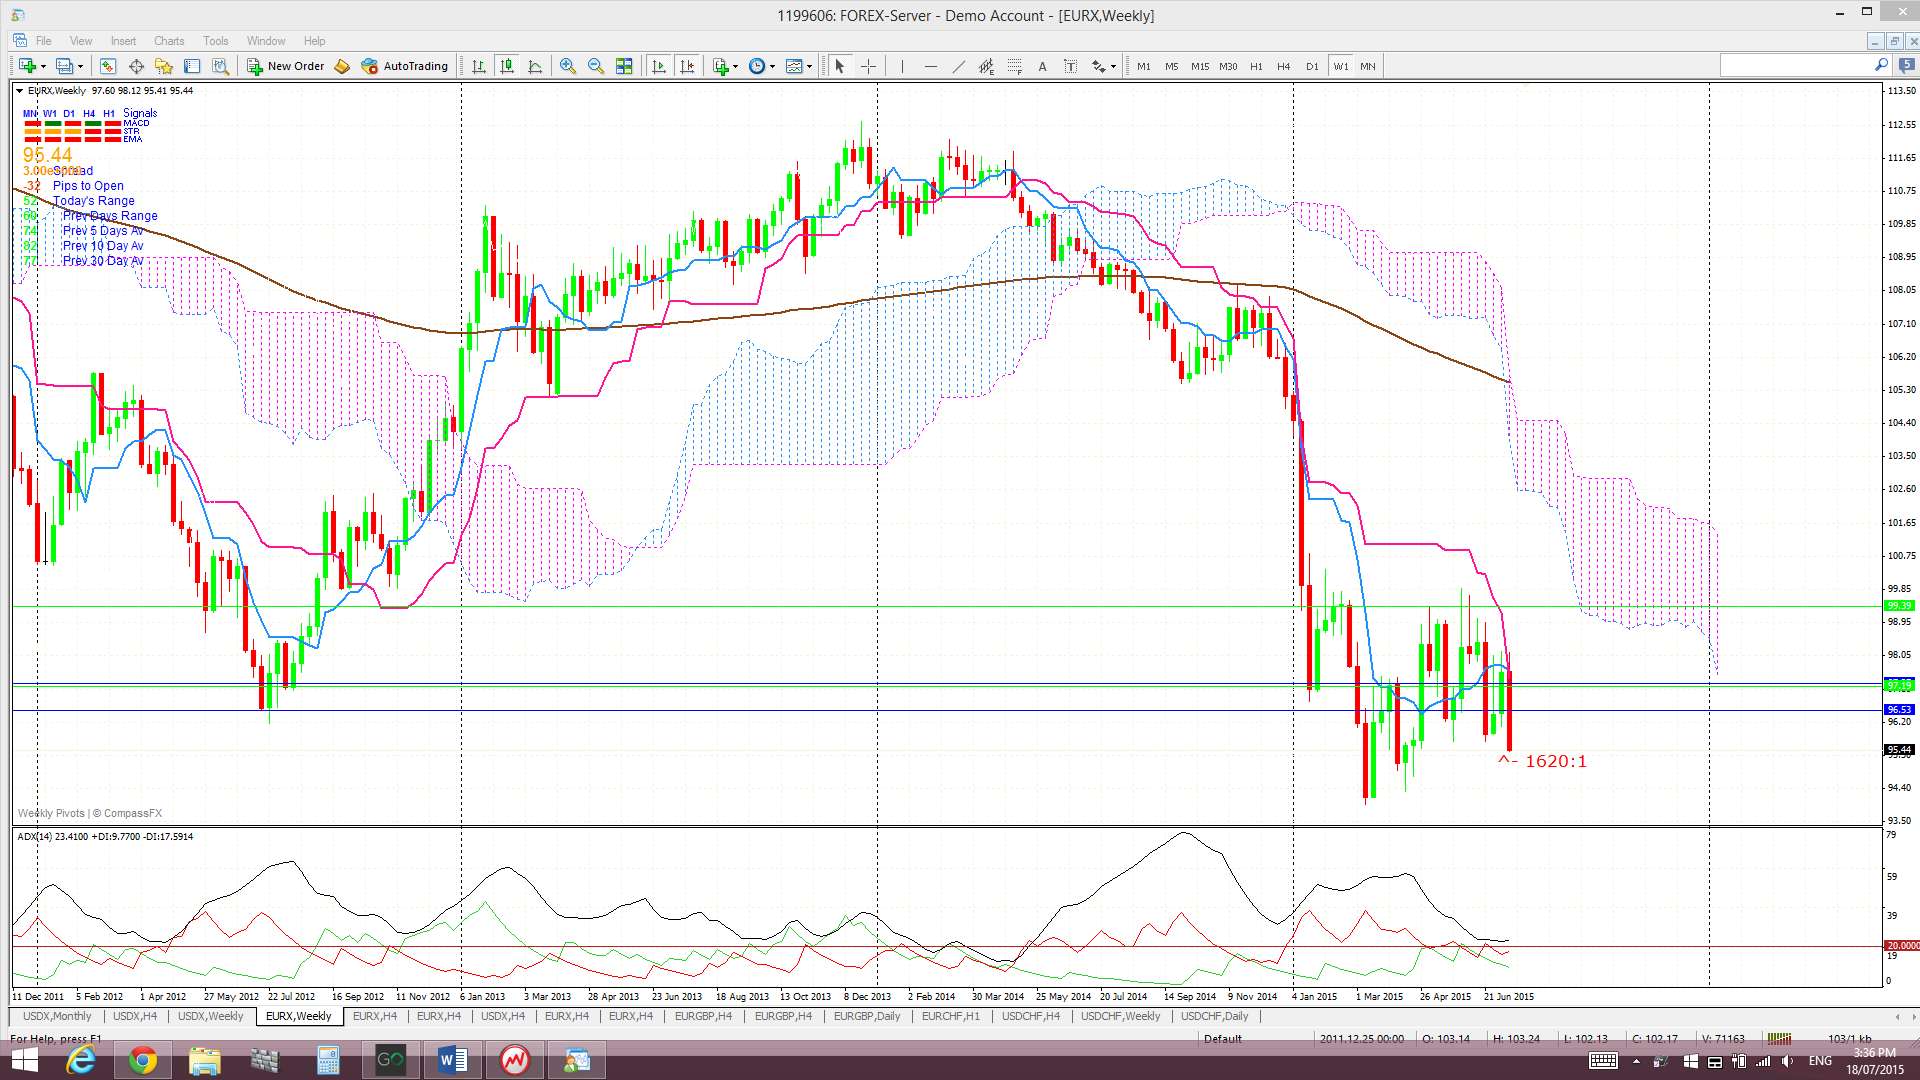
Weekly Ichimoku: Price is still trading well below the weekly Cloud.
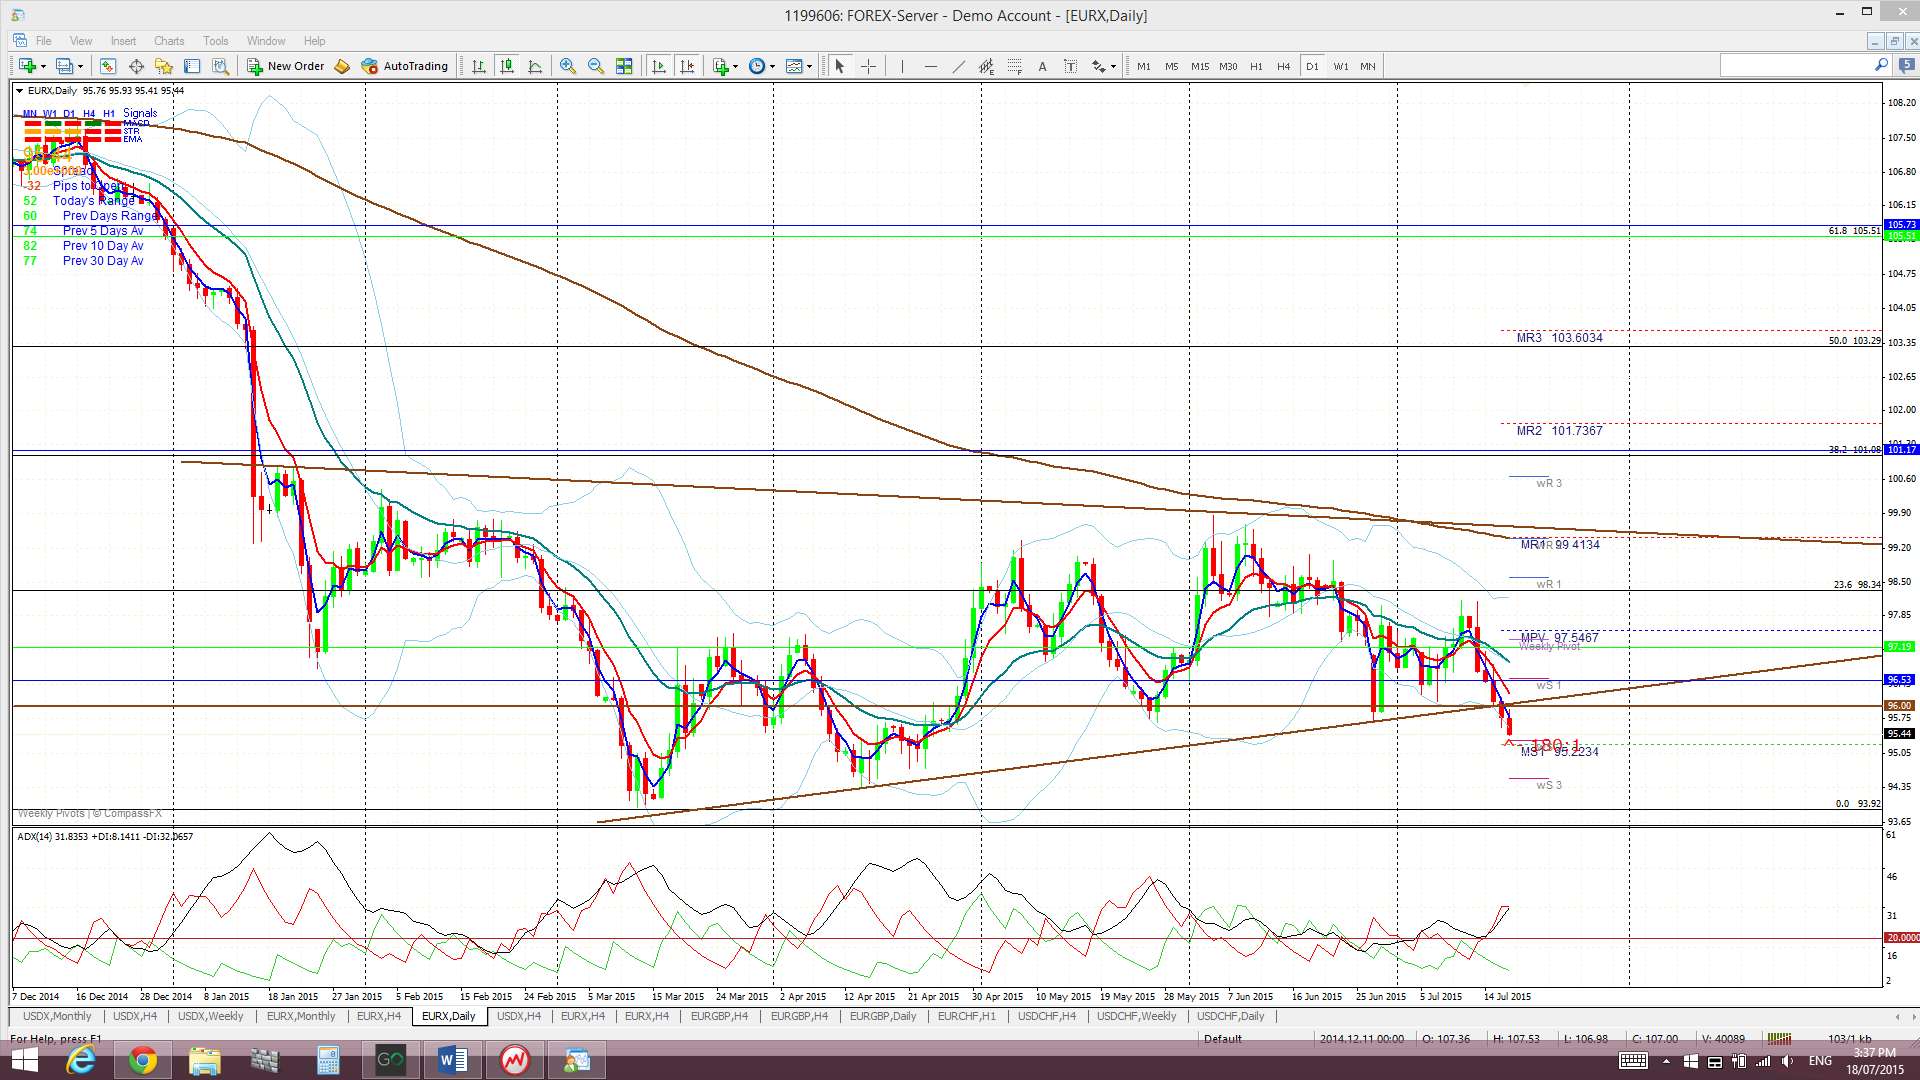
Daily: Price moved lower last week with bearish candles printed each day. The weekly trend line was also broken during the week:
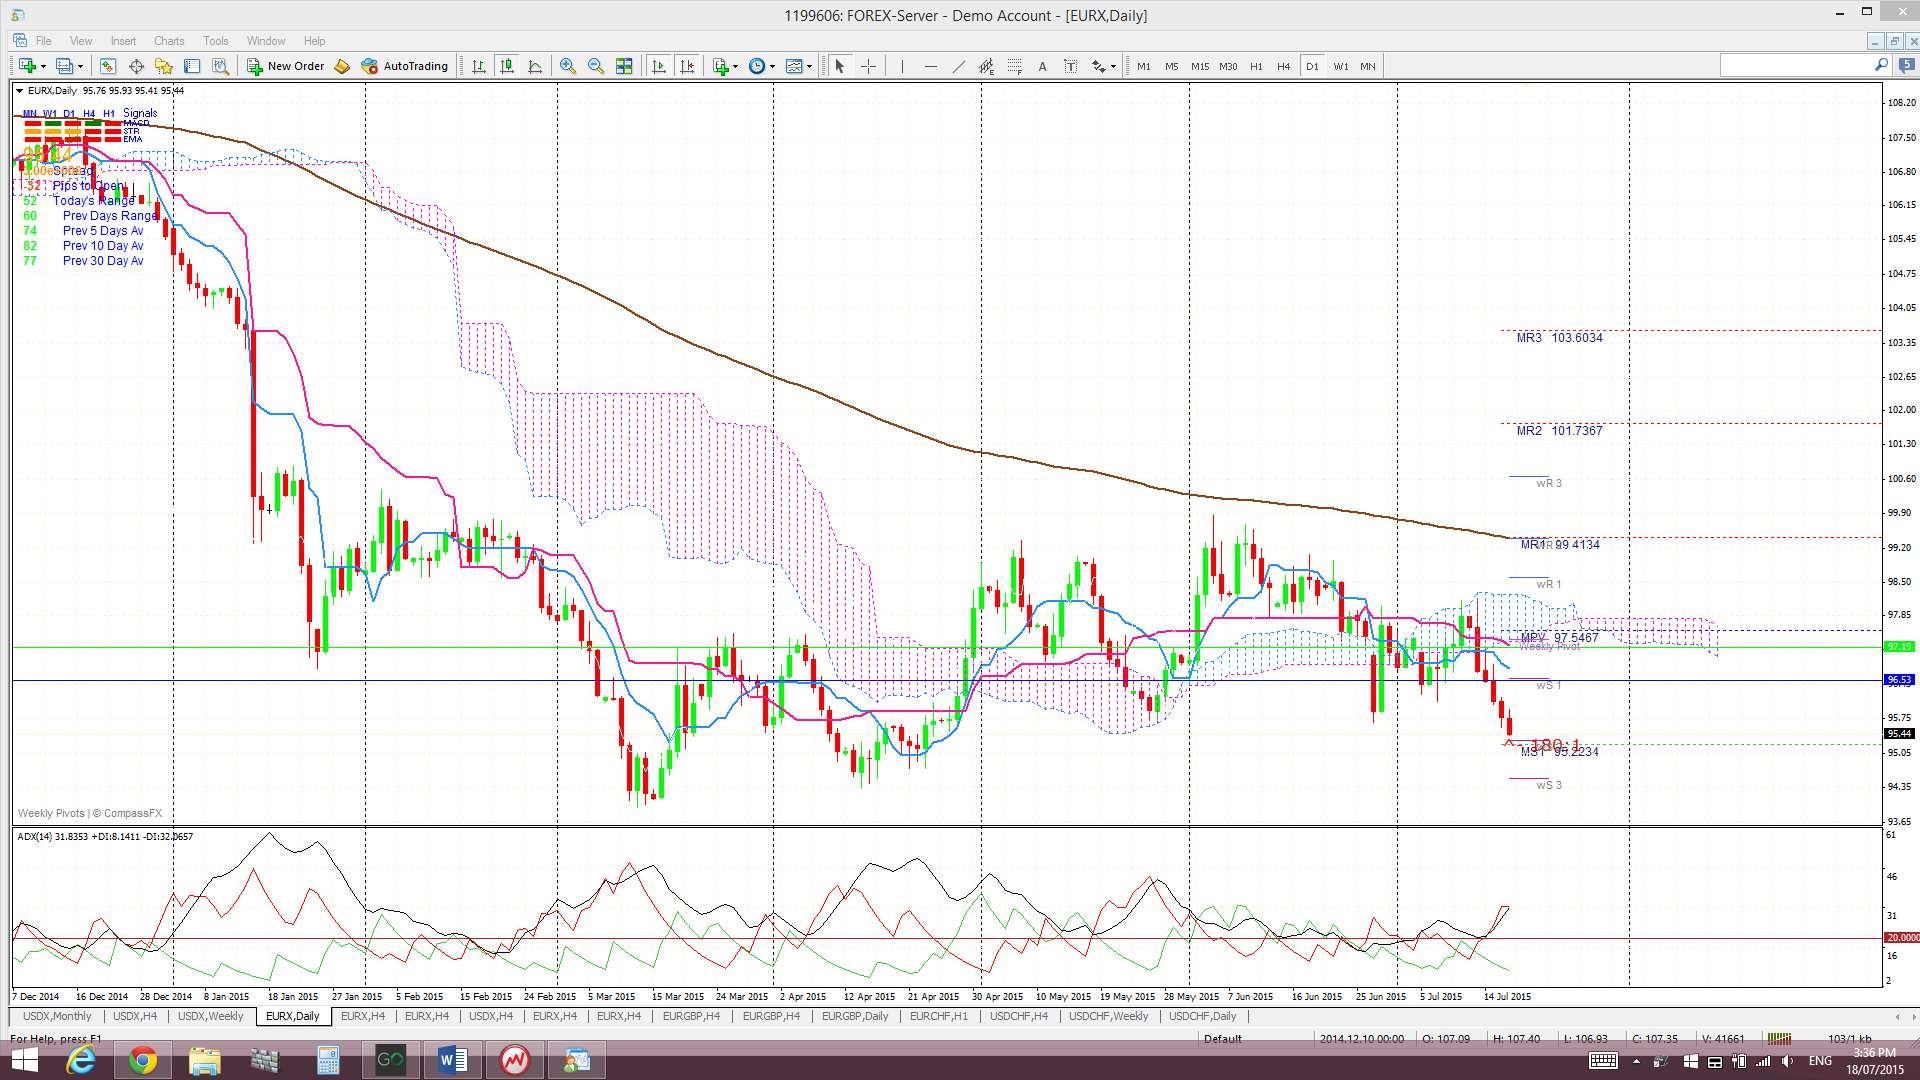
Daily Ichimoku Cloud chart: Price chopped down from the the daily Cloud last week.
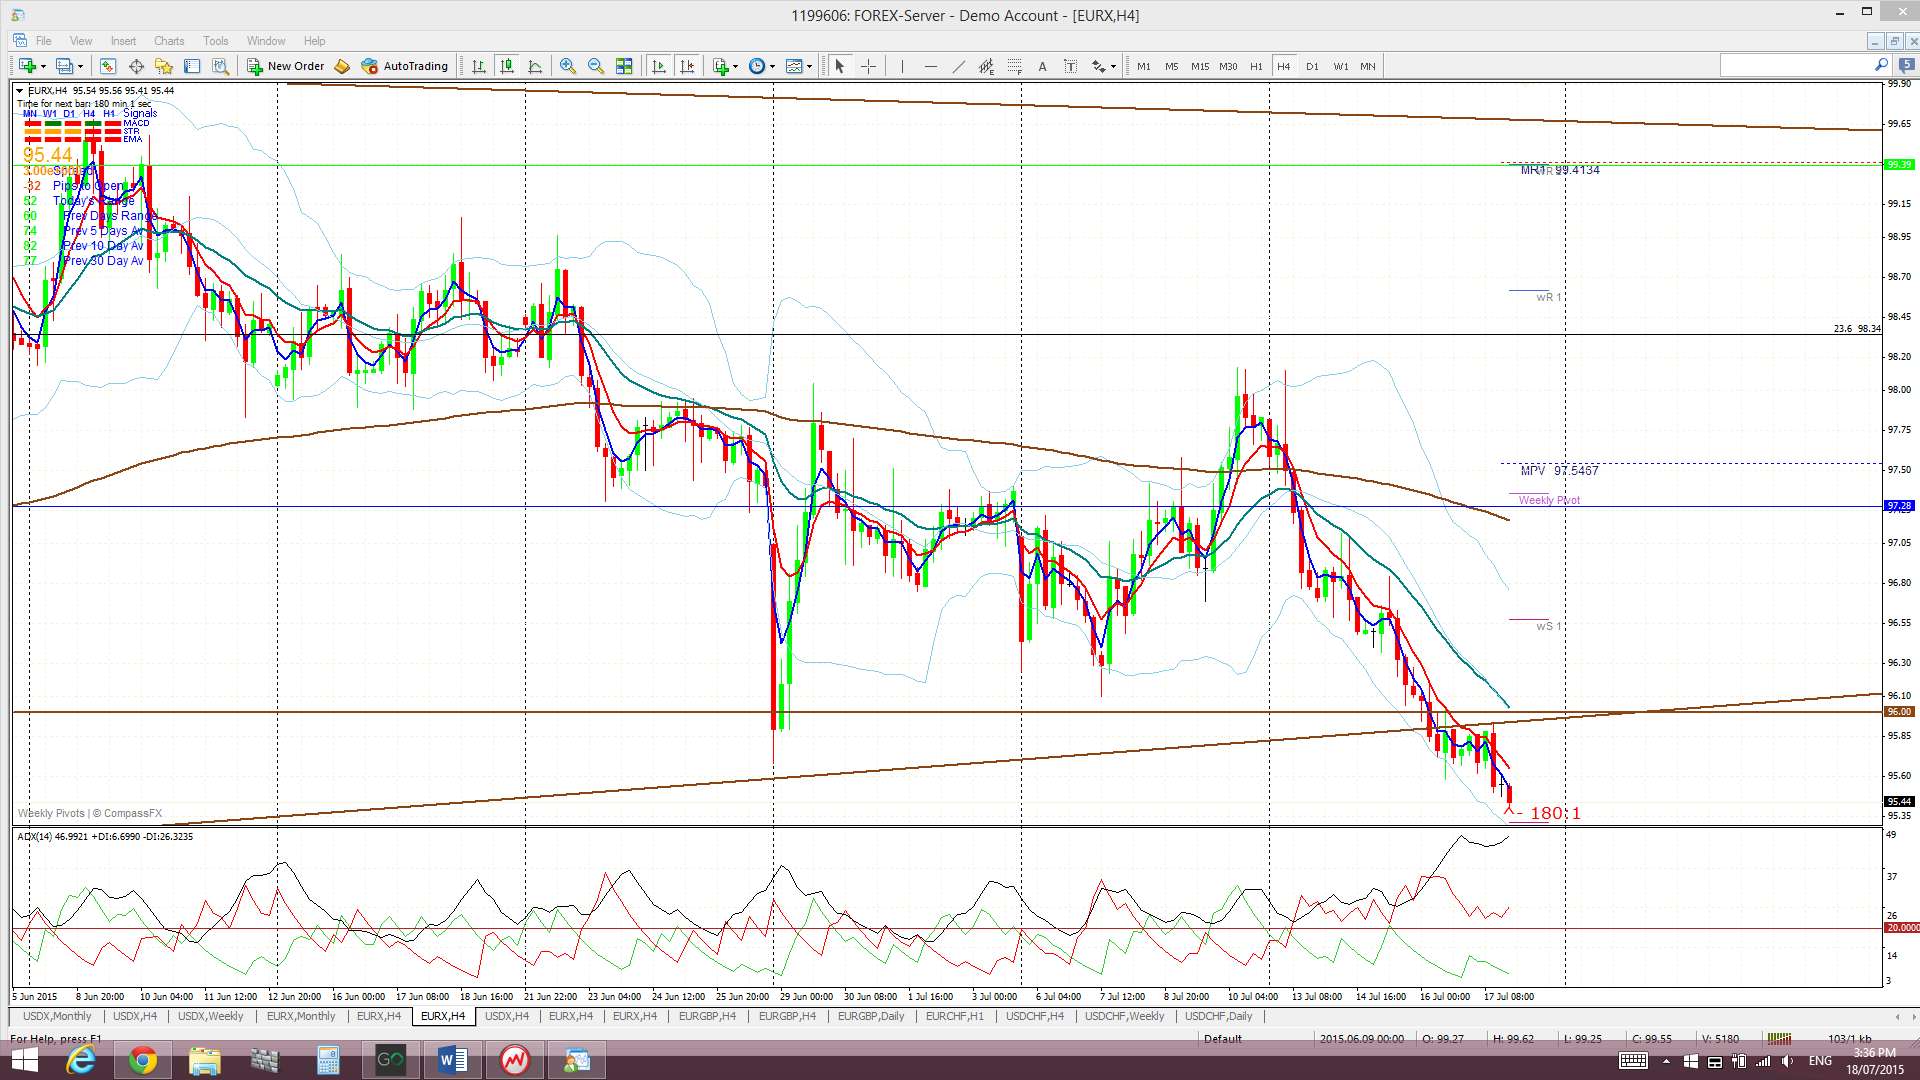
4 hr: Price trended steadily lower last week.
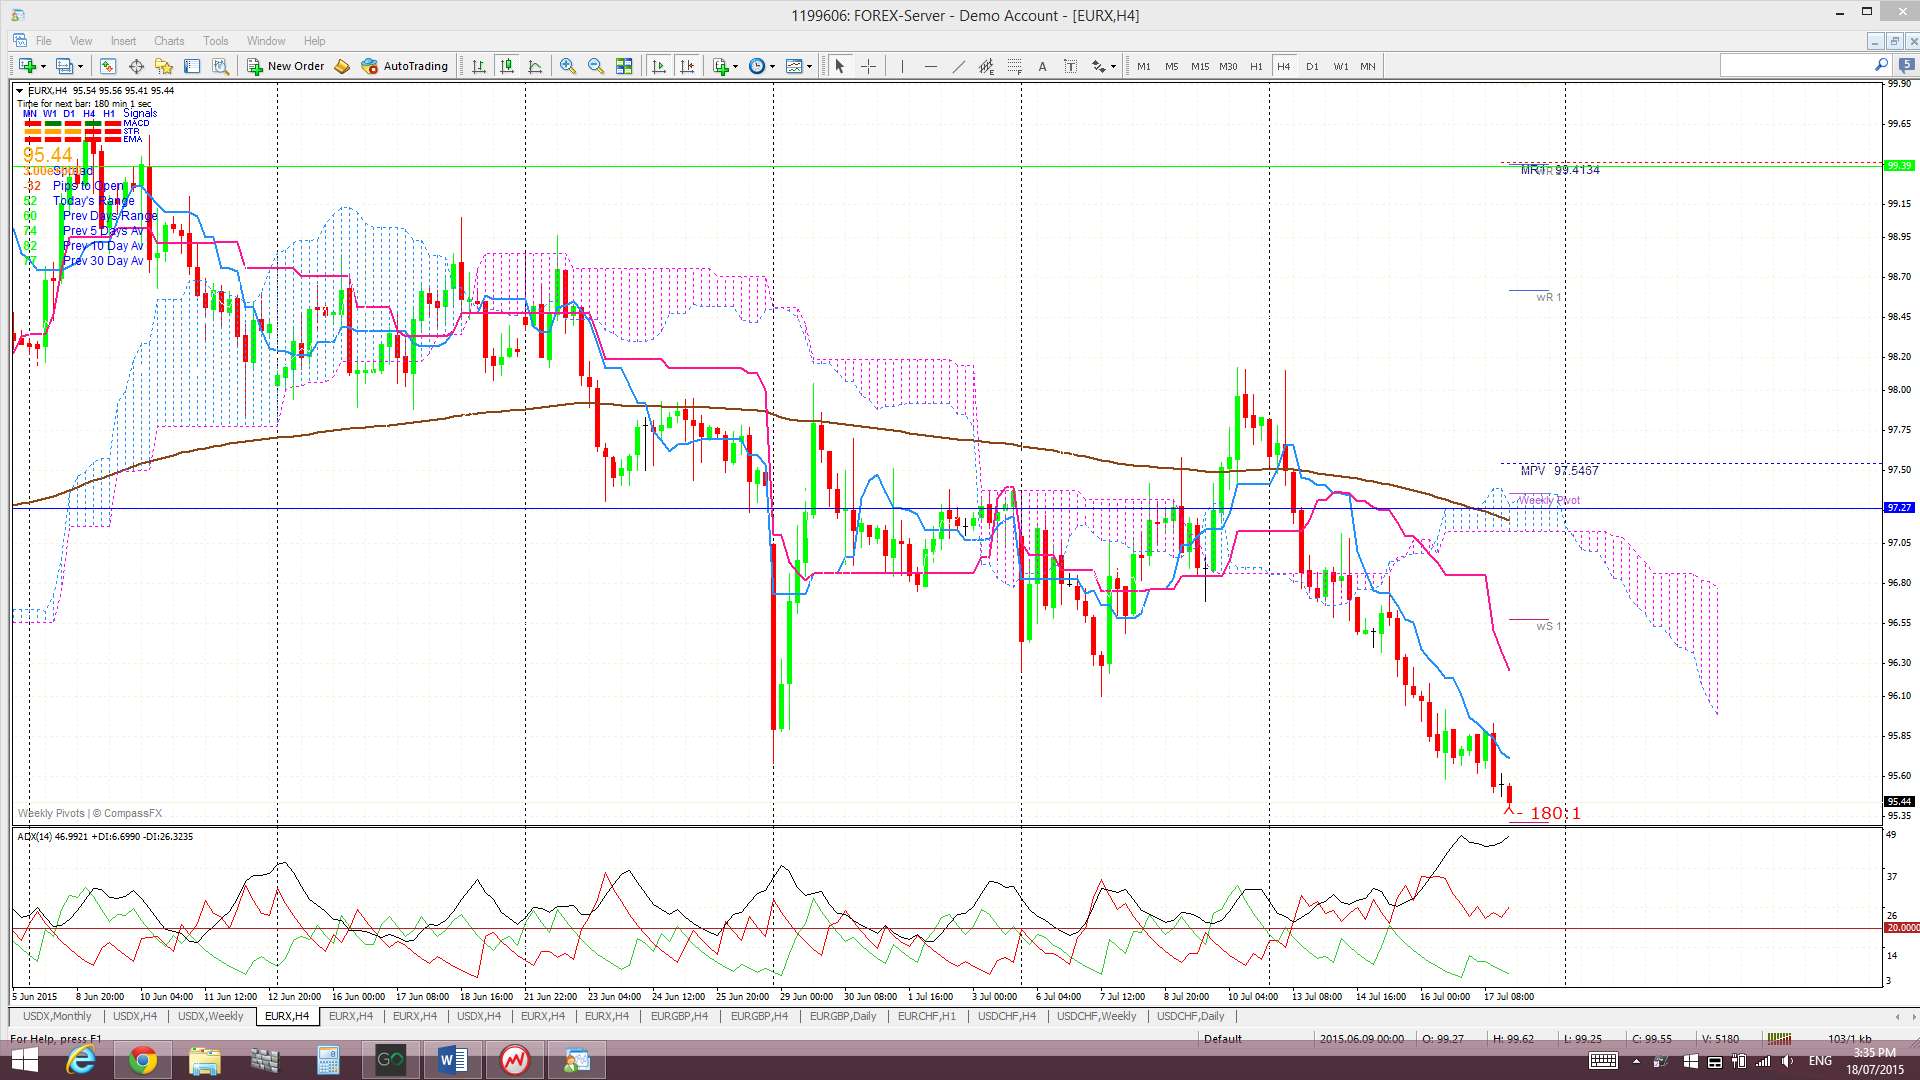
4 hr Ichimoku Cloud chart: The EURX moved down through thin 4hr Cloud last week. This chart is aligned with the daily chart and suggests SHORT EUR.
Comments:
FX Index Alignment: Last week saw the EURX and USDX charts slip back into alignment for classic-style ‘risk off’. That is, for LONG US$ and SHORT EUR. Periods of alignment often, but not always, result in periods of decent trending markets. I will be on the lookout for any evidence of this across the currency charts in coming sessions whilst the alignment holds.
USDX: The US$ had a bullish week and affected a weekly-chart Bull Flag breakout. I would be expecting the index to head up to test the 100 level and any break and hold above this resistance would support the Bull Flag and continuation. However, I will also be watching for any sentiment shift up at this major psychological level.
For me, though, the US$ is still in no-man’s land whilst it trades above 92.50 but below 100. The Bull Flag breakout is shedding some light about renewed bullish momentum but I am still waiting for a decisive breakout from this region to signal the next major directional move on the index as this choppy and range-bound price action has gone on for almost five months now.
Thus, the levels to keep watching on the USDX are:
- The psychological 100 level above current price. This is the top of the recent trading range.
- The 92.50 level below current price. This is the bottom of the recent trading range.
EURX: The EURX took a bit of a beating last week as it moved below the key 96 support level and also triggered a weekly-chart Bear Flag breakout. Despite resolution of the recent Greek-debt crisis the fact remains that the Eurozone is trading within a monetary easing cycle and the US is emerging from one. Like with the USDX though, I’ll be watching how the EURX reacts around the 94 level and for any potential sentiment shift at this major low.
The levels to watch on the EURX remain as:
- The 105.5 level: The weekly chart reveals that a 61.8% fib retracement of the recent lengthy bear move is back up near the 105.50 level and weekly 200 EMA. Any hold back above 96 and continued recovery effort might see the index target this region.
- The 96 level:This has been a major support level for the EURX and a potential bullish ‘Double Bottom’ region but has been broken during last week.
- The 94 level: Any break and hold back below 96 might suggest bearish continuation as it represents a break of the monthly charts ‘Double Bottom’. If so, the recent low printed near 94 will come back into focus.
Note: The analysis provided above is based purely on technical analysis of the current chart set ups. As always, Fundamental-style events, by way of any Ukraine, Eurozone or Middle East events and/or news announcements, continue to be unpredictable triggers for price movement on the indices. These events always have the potential to undermine any technical analysis.
The post Bull and Bear Flags seem to trigger but watch the US$ near 100. appeared first on www.forextell.com.