Last week: It was a bit of a quiet week for trend line breakout trading given sentiment swings caused by US tariff talk and the wait for the ECB and BoJ rate updates and NFP combining to feed into a lack of directional momentum. There were some bullish breakouts that triggered after NFP but plenty of other consolidation patterns are still in play. Some segments of the market look to be flexing their bullish muscles so this needs to be monitored for any flow-through to other areas.

Trend line breakouts and TC signals: there were a few trend line breakout trades last week and these were updated on my site here, here, here and here:
- EUR/JPY: 120 pips.
- EUR/USD: 120 pips.
- Gold: 140 pips with a TC signal for 3 R. And another move for 50 pips.
- AUD/USD: 80 pips.
- NZD/USD: 60 pips and a TC signal for 3 R.
- GBP/USD: 90 pips and a TC signal for 3.5 R.
Next week:
- FX Indices: The US$ index closed with an indecision-style candle, but, so too did the EUR weekly candle. An update on both FX indices can be found through this link.
- Stocks: there have been bullish Bull Flag-style breakouts on the S&P500, NASDAQ and Russell-2000 weekly charts so watch for any follow-through on the DJIA (click on individual charts to enlarge view):
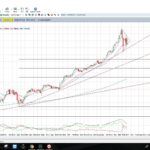
- S&P500 weekly
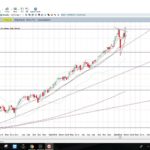
- NASDAQ weekly
- Russell-2000 weeky
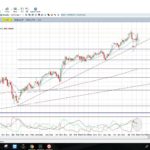
- DJIA weekly
- QQQ: With the NASDAQ closing at an all time high it is worth remembering this previous bullish call on the QQQ, the ETF of the NASDAQ-100. This call was first posted back at the end of 2016, see through this link, and the trade is now up around 44%!
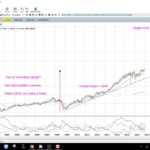
- QQQ monthly: Dec 2016
- QQQ monthly today +44%
- TC Upgrade: Recall that I am upgrading my website over coming weeks so please be patient throughout this process in case access is impacted at all. My blog site started rather humbly as a method of distraction for me back in 2011 when I was undergoing chemotherapy. During that time it has evolved to be a more professional site where I post charts and detailed measured analysis on numerous trading instruments for free and on a very regular basis. Please keep this in mind when updates about website changes are released.
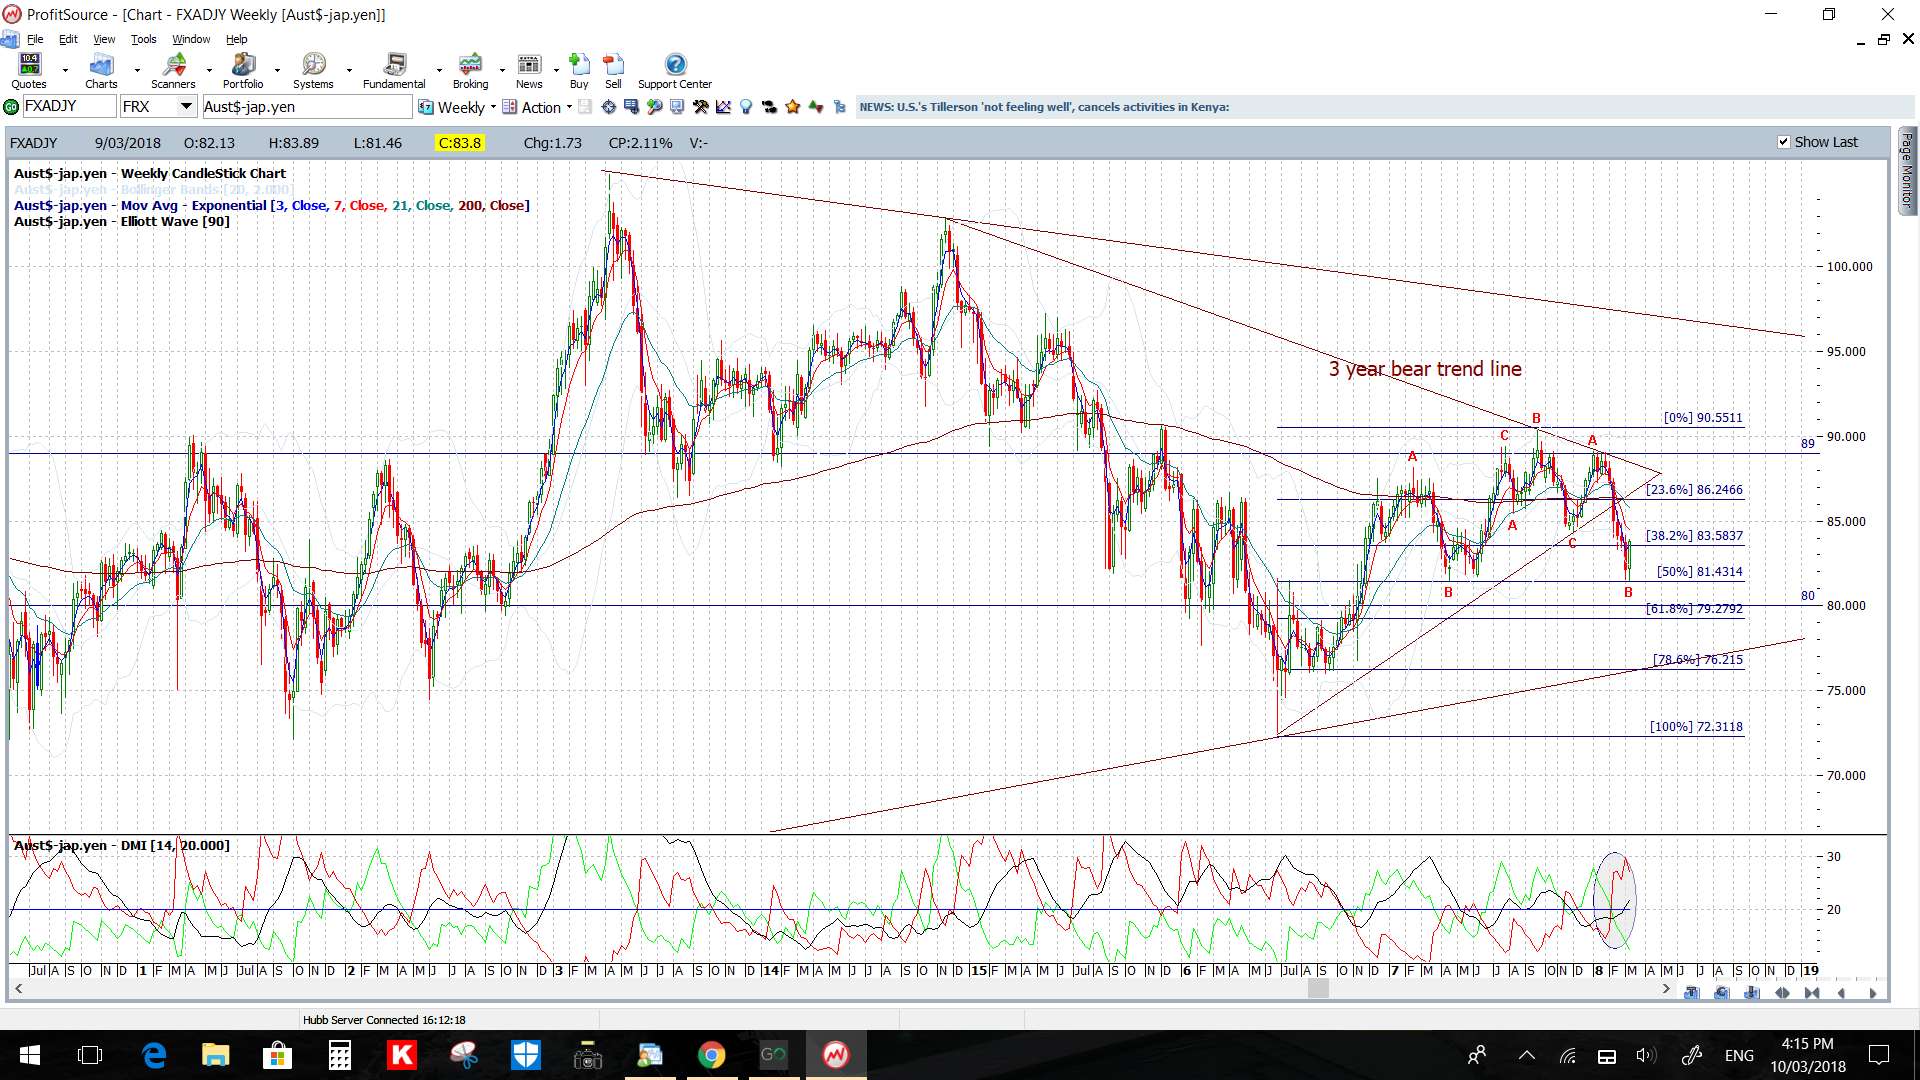
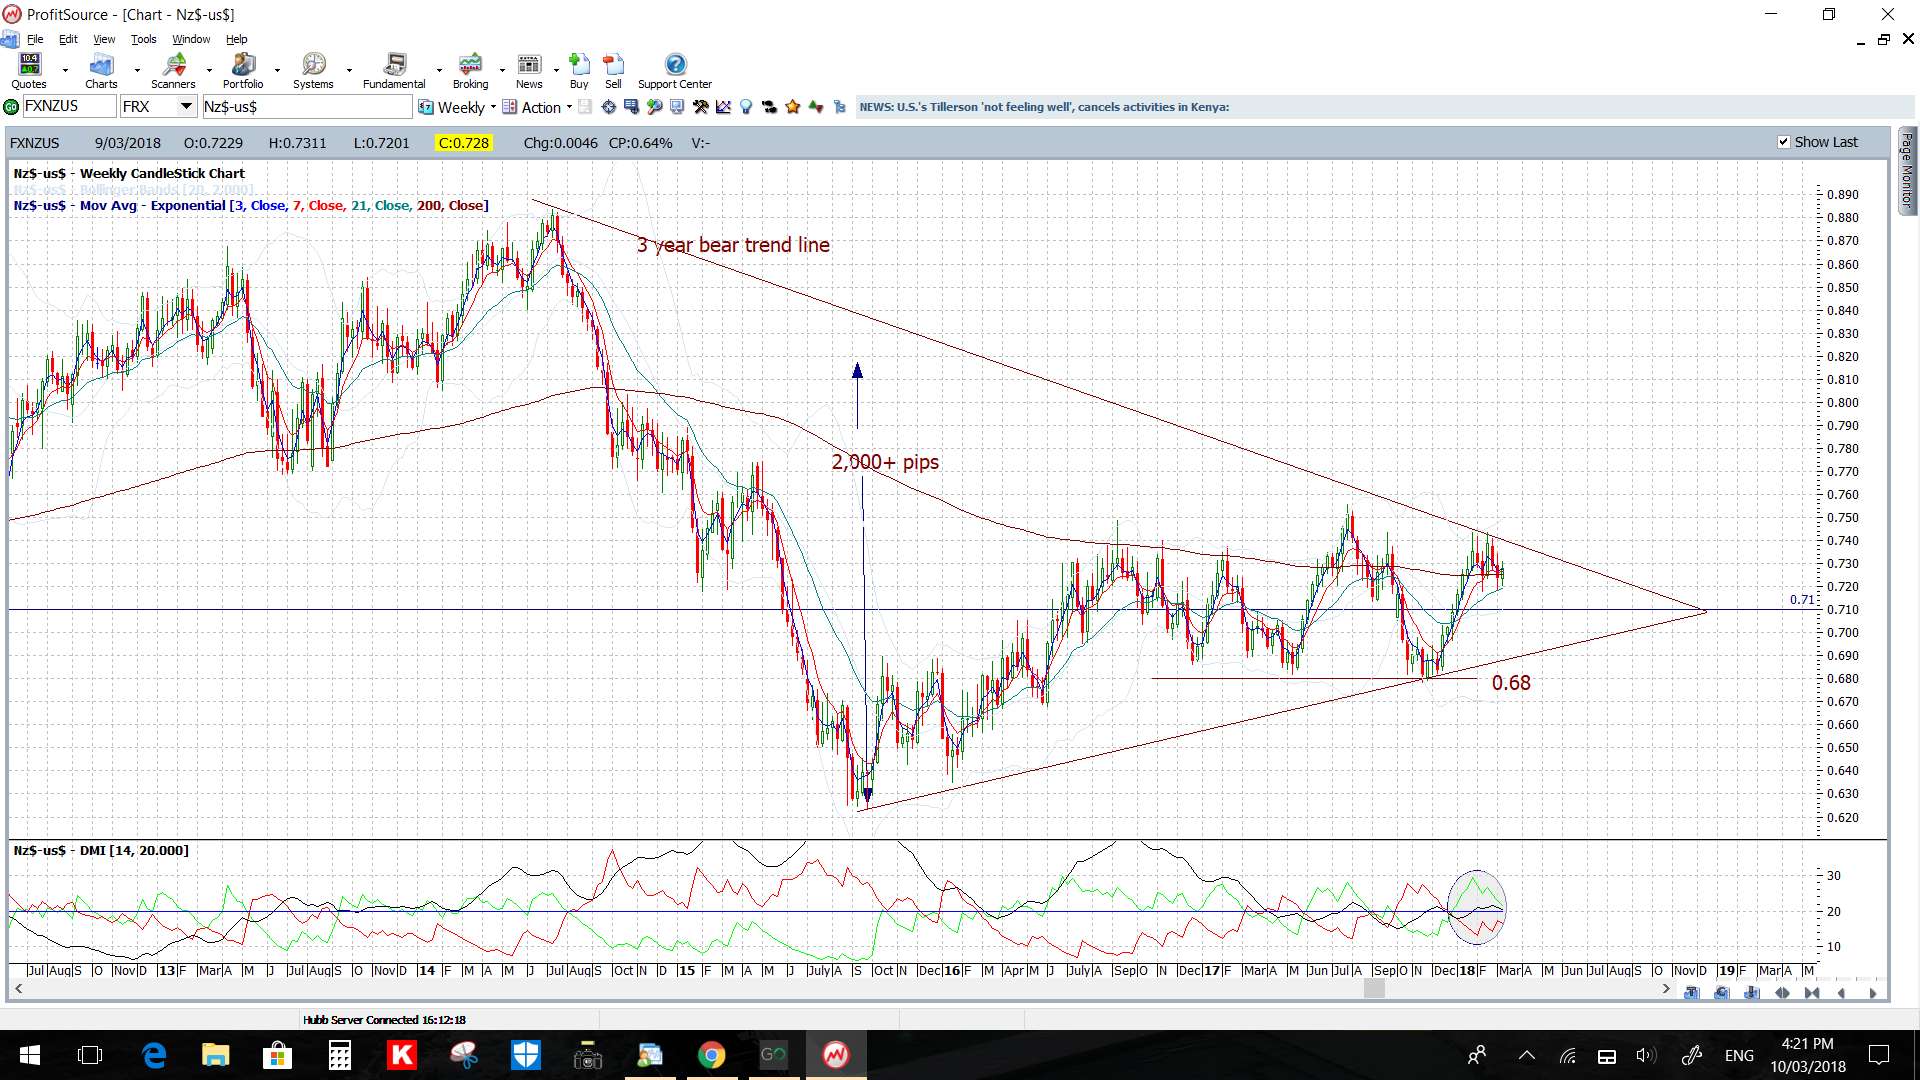
- Major S/R levels: a number of FX pairs continue to consolidate near long-term major S/R levels so watch out for any new make or breakaction at these regions: EUR/USD (1.260), AUD/USD (0.80), NZD/USD (0.73), GBP/USD (1.40), GBP/NZD (1.90), GBP/JPY (150), EUR/AUD (1.55), Oil $60 and Gold ($1,400).
- Daylight savings shift: note there is a daylight saving shift this weekend for the US and Canada.
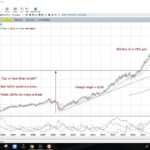
- Bitcoin: is lower again but $8,000 remains the make or break level here:
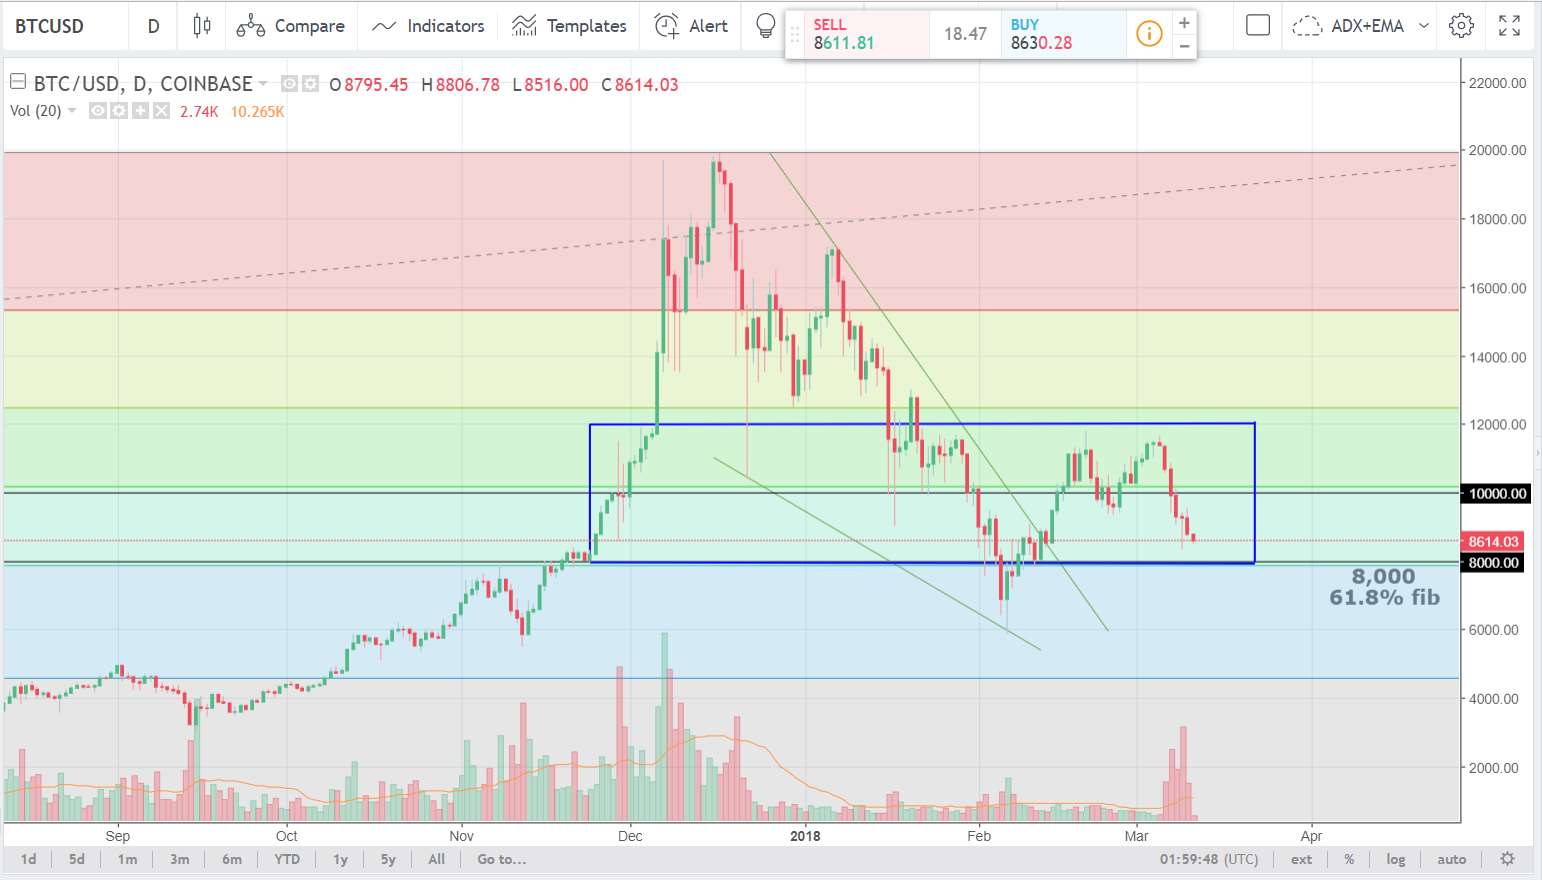
Calendar: there is a lot of US data to monitor this week:
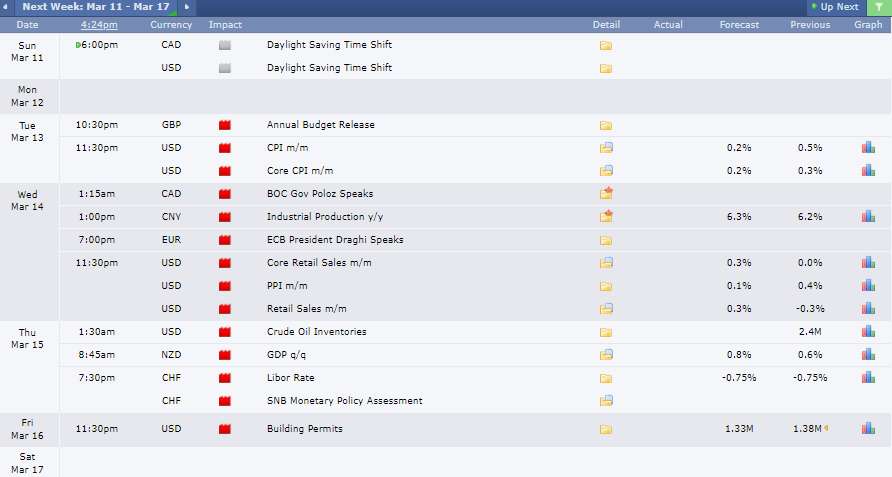
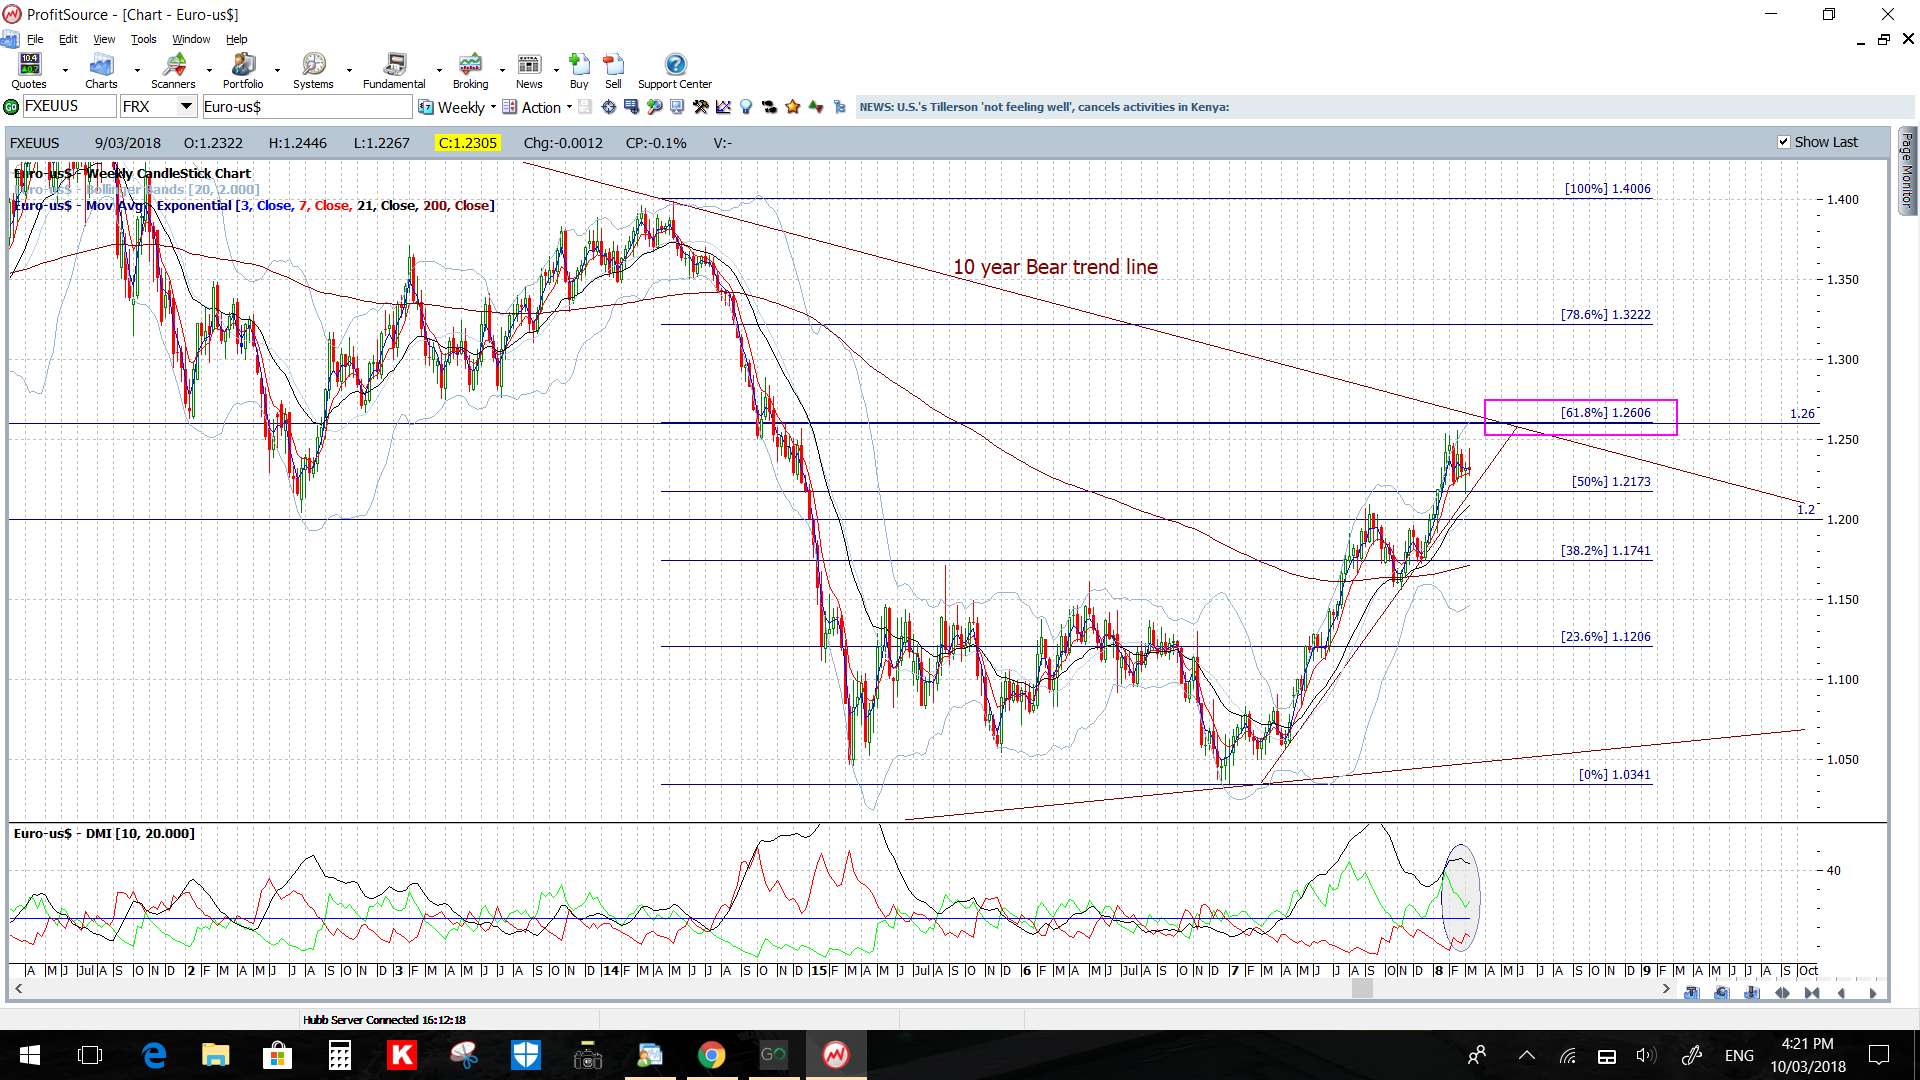
EUR/USD: The EUR/USD closed with an indecision-style ‘Spinning Top’ candle and is range-bound within a triangle on the 4hr chart and, as per my commentary over recent weeks, I see all of this as consolidation under the major 1.260 S/R level.
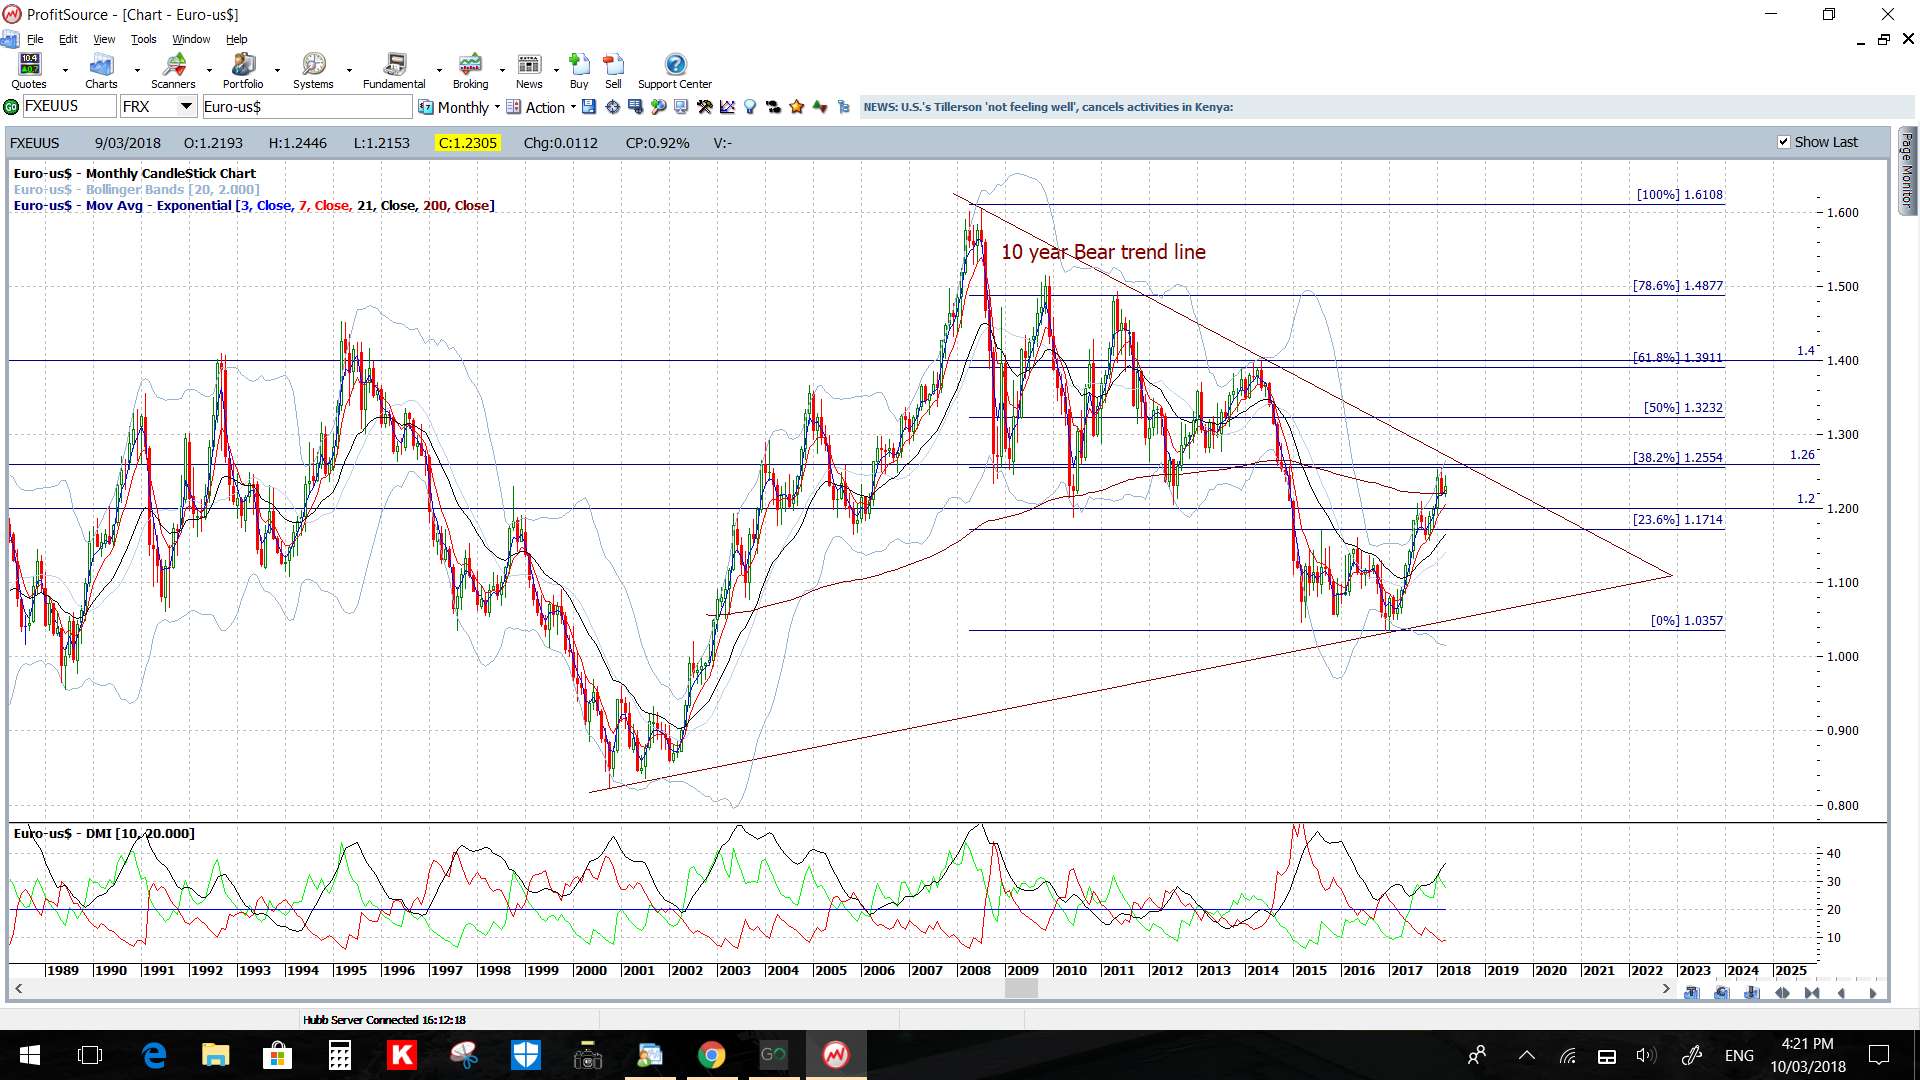
The 1.260 region remains a major S/R level for this pair as the weekly chart’s 61.8% fib is nearby and it also intersects with the monthly chart’s 10-year bear trend line. Thus, whilst almost 300 pips away, the 1.26 remains the major level to monitor in coming sessions.
Bullish targets: The first target would 1.260 which is about 300 pips away. After that, the 1.40 S/R level would be in focus as this is near the monthly chart’s 61.8% fib. A move from 1.26 to 1.40 comprises about 1,400 pips and so is well worth stalking!
Bearish targets: Any pullback and break below the triangle support trend line would have me looking for a test of the key 1.20 level.
- Watch the 4hr chart trend lines for any new breakout; especially with this week’s ECB Draghi speech and all of the US data:
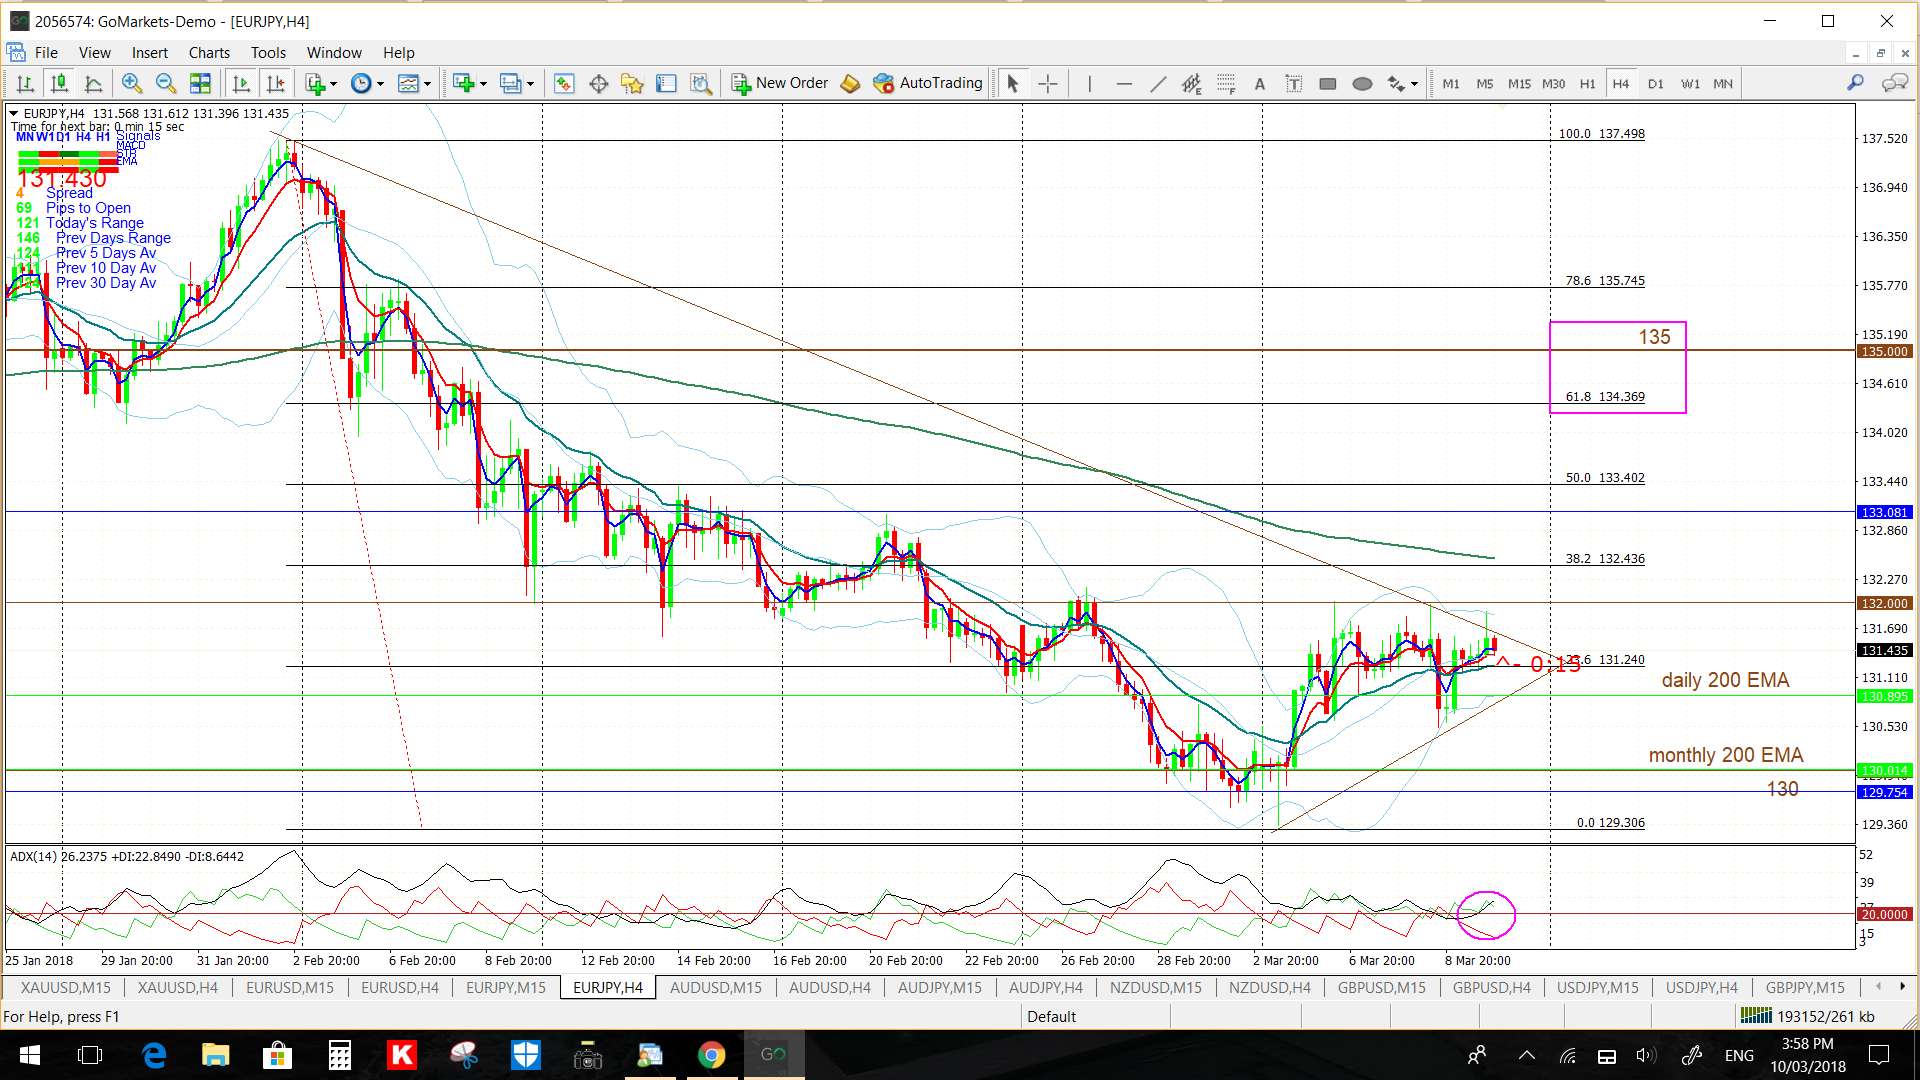
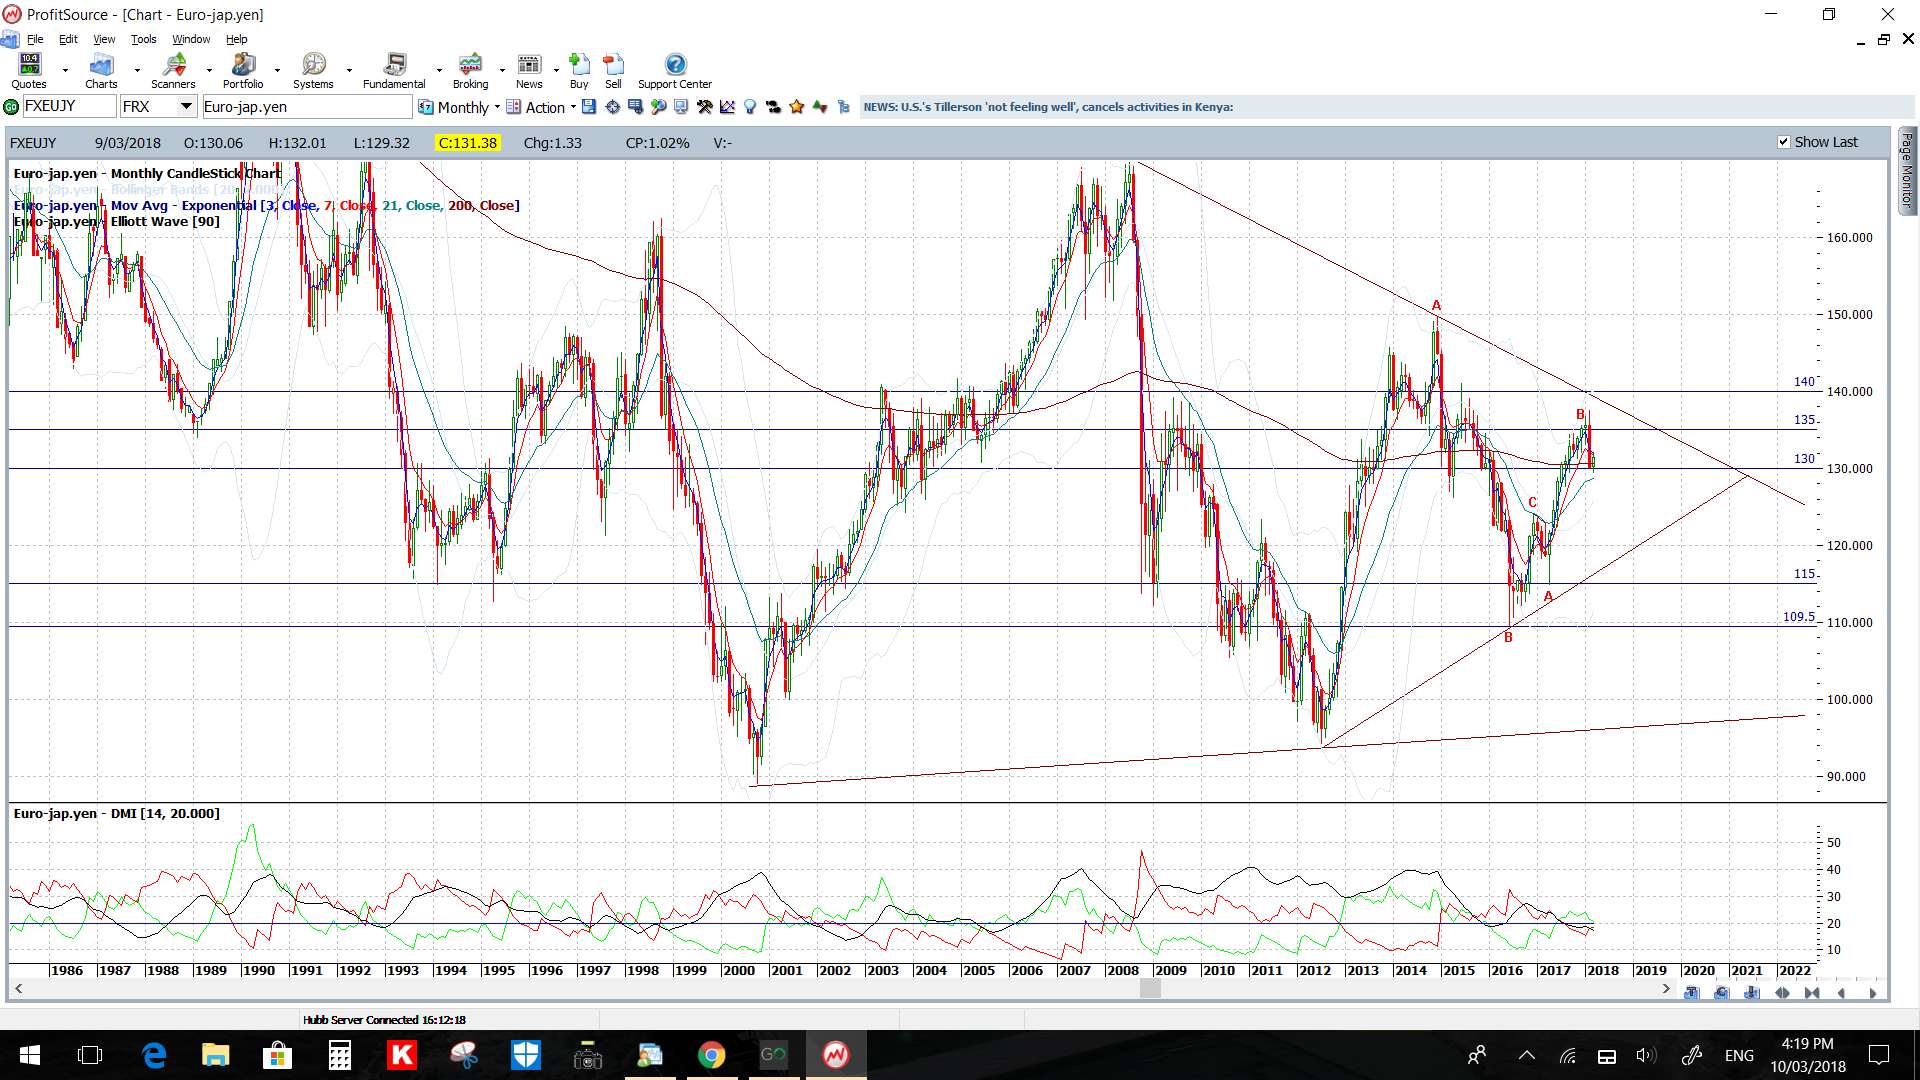
EUR/JPY: This pair chopped sideways for much of the week and I’m still seeing a potentially bullish-reversal descending wedge shaping up on the 4hr chart.
Bullish targets: I remain on the lookout for any test of the major 135 S/R level as it is the 4hr chart’s 61.8% fib.
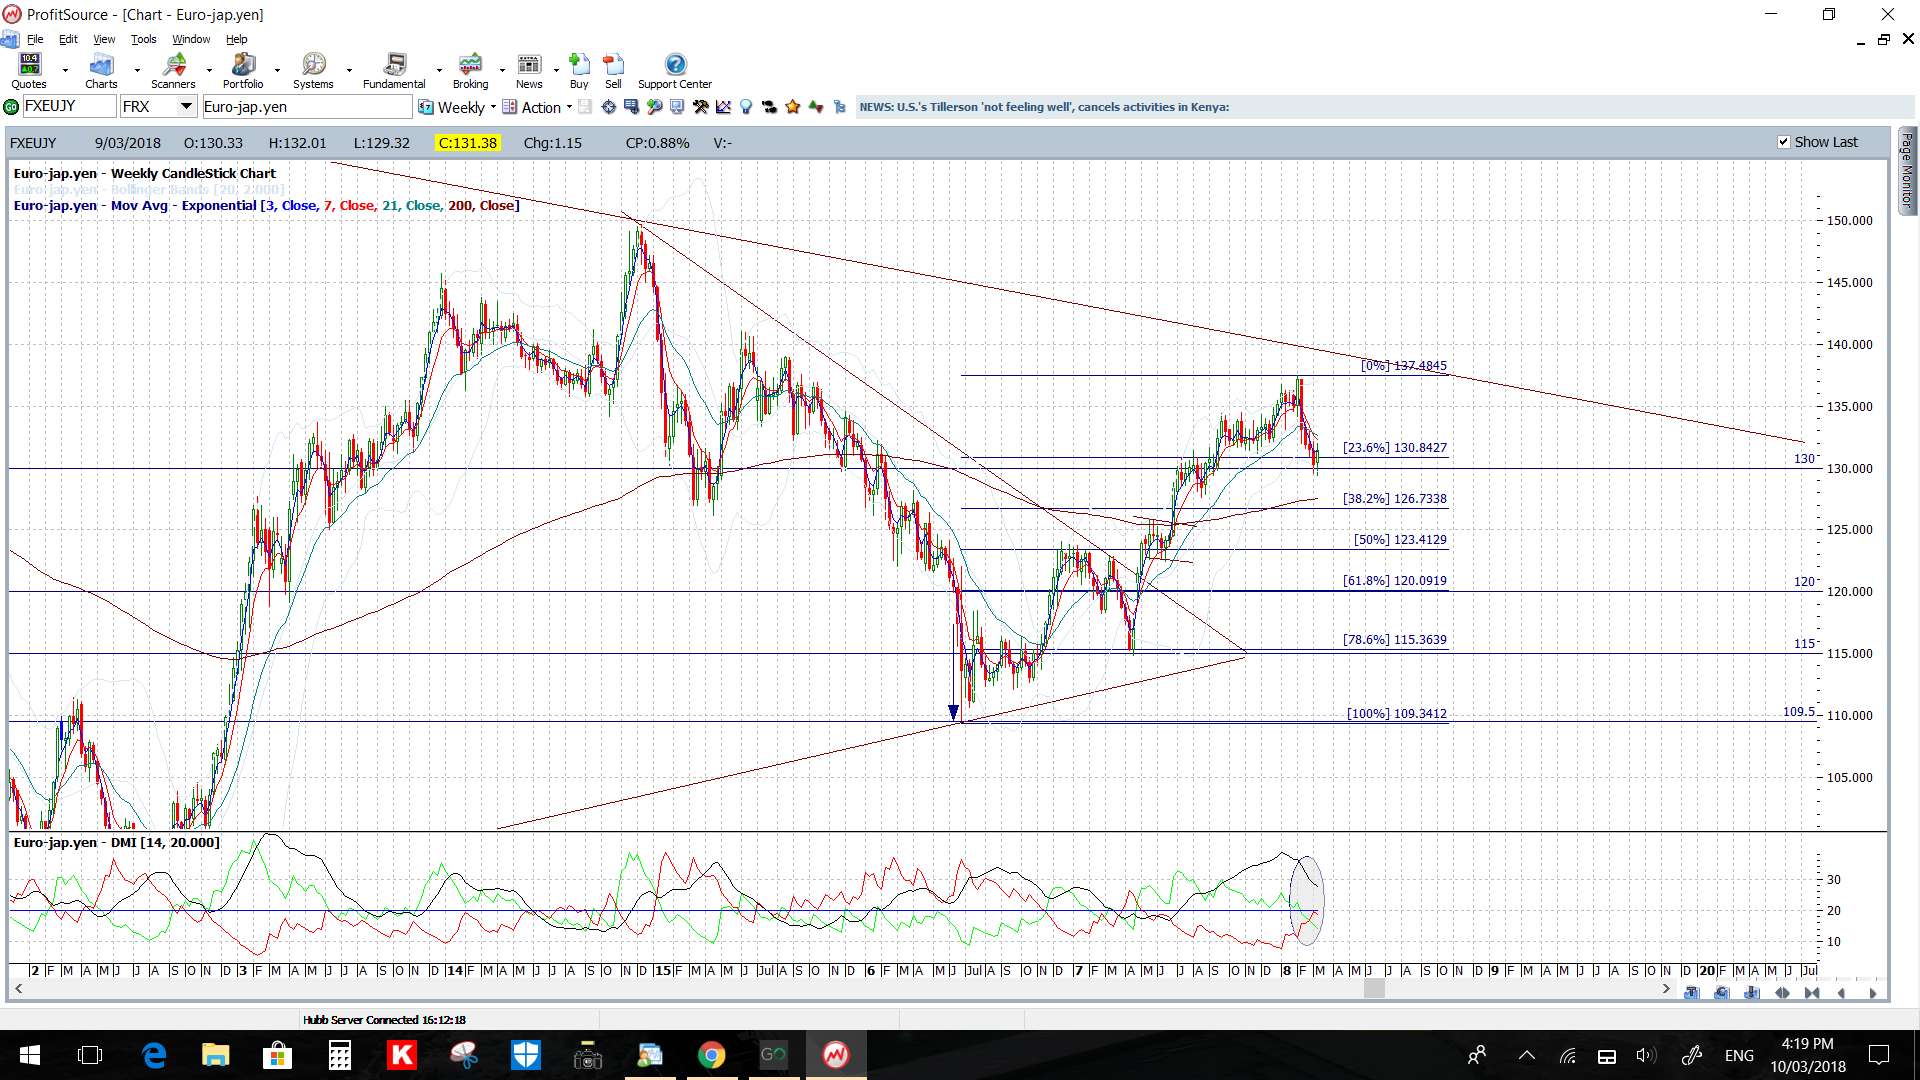
Bearish targets: The 130 level remains the level to watch in coming sessions but any deeper pullback would have me looking to the 120 region as it is the weekly 61.8% fib level of the last swing high move.
- Watch the 4hr chart wedge trend lines for any new breakout
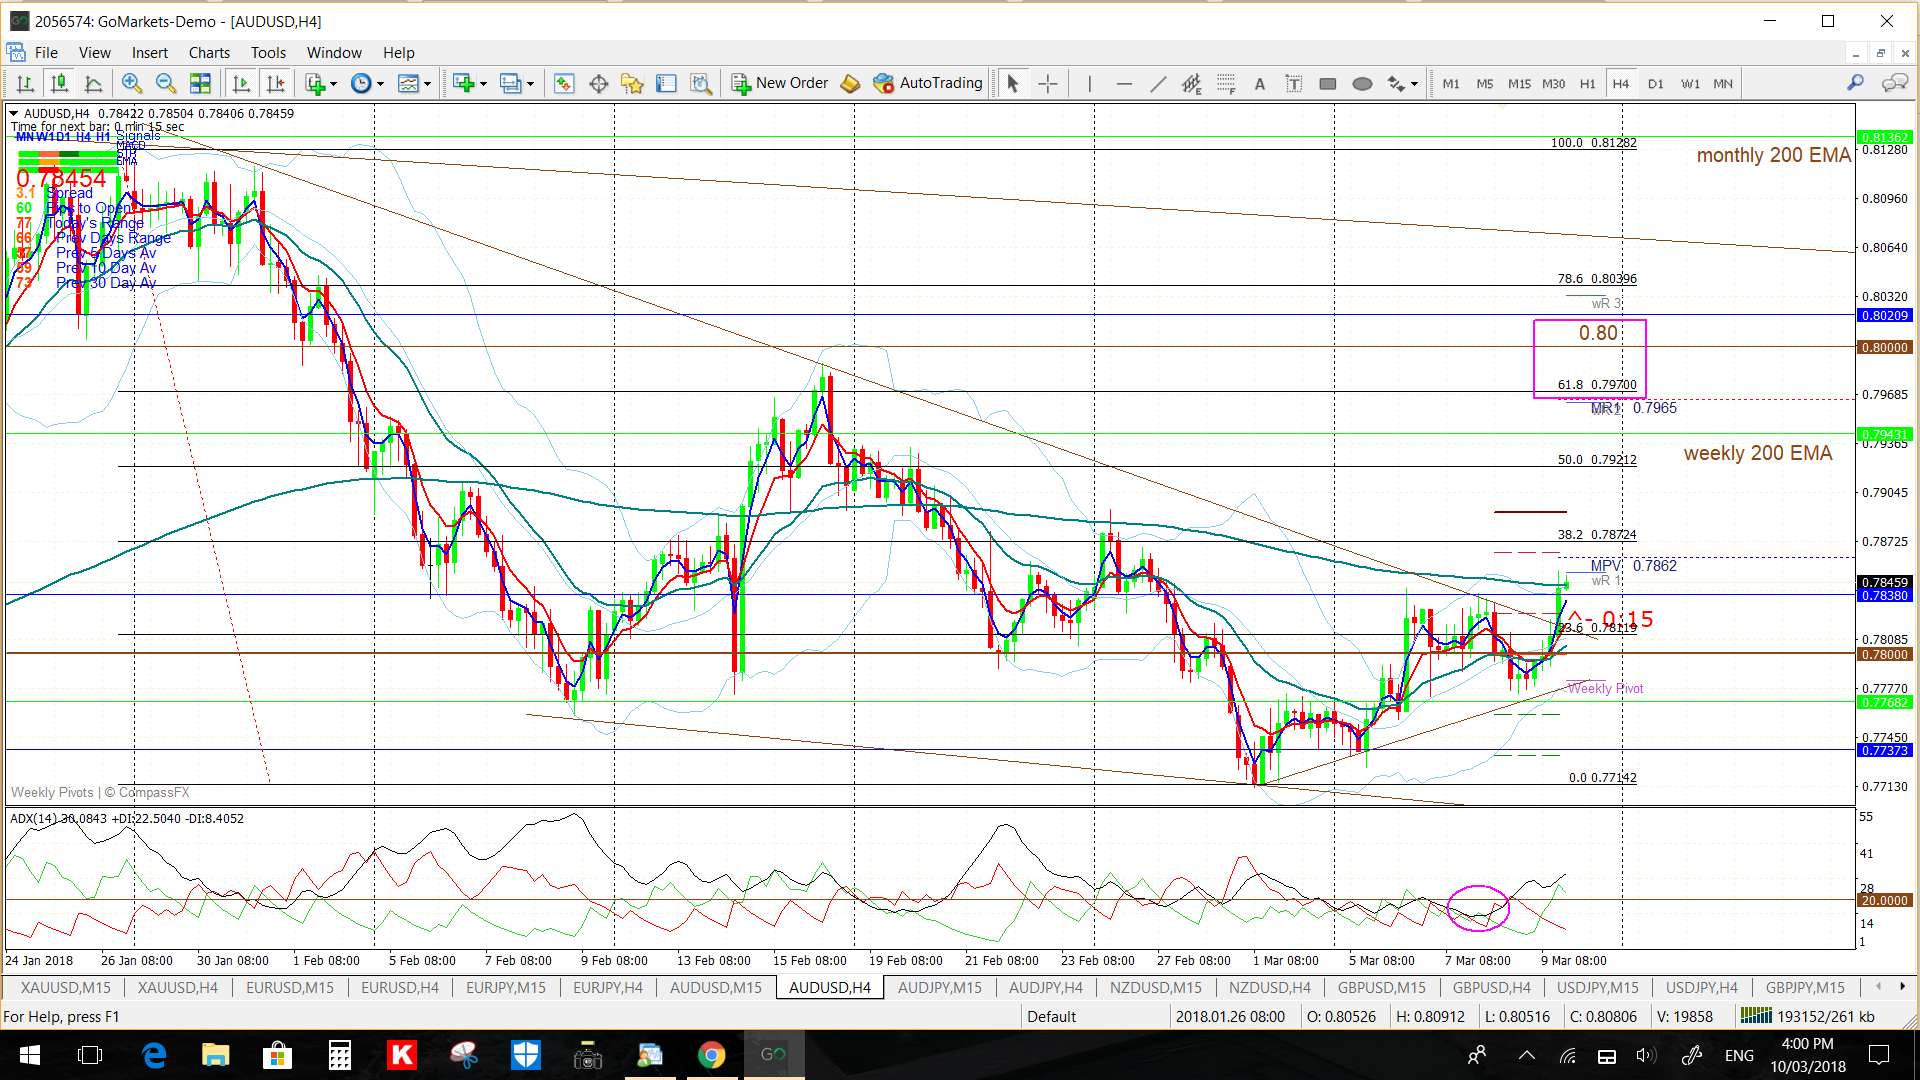
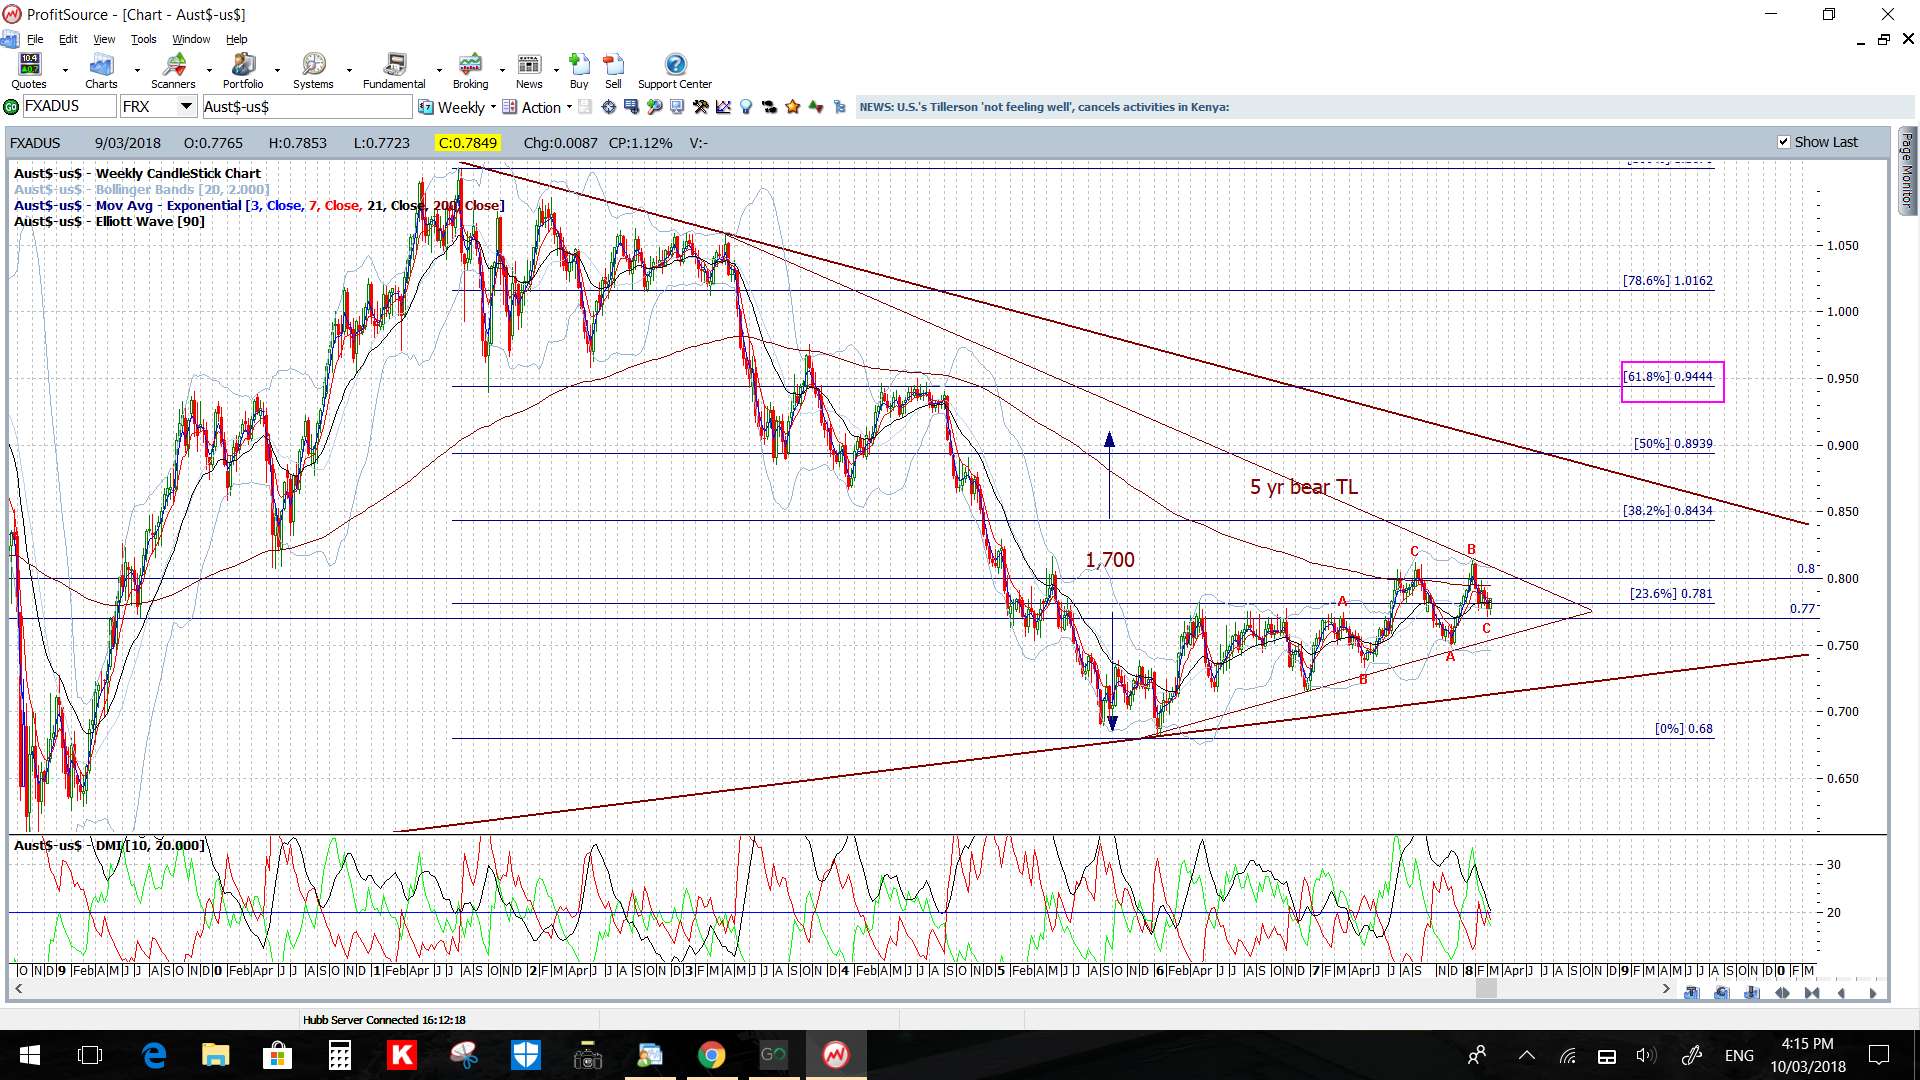
AUD/USD: The Aussie had a bullish week and made a smaller 4hr chart triangle breakout that has been followed by a larger 4hr chart descending wedge breakout.
Bullish targets: the weekly 200 EMA is about 100 pips away and the key 0.80 level is about 150 pips away so these are the two, key bullish targets.
Bearish targets: the 0.78 level and, after that, the recent Low near 0.77.
- Watch for any continuation from the wedge breakout; especially with this week’s CNY Industrial Production data release.
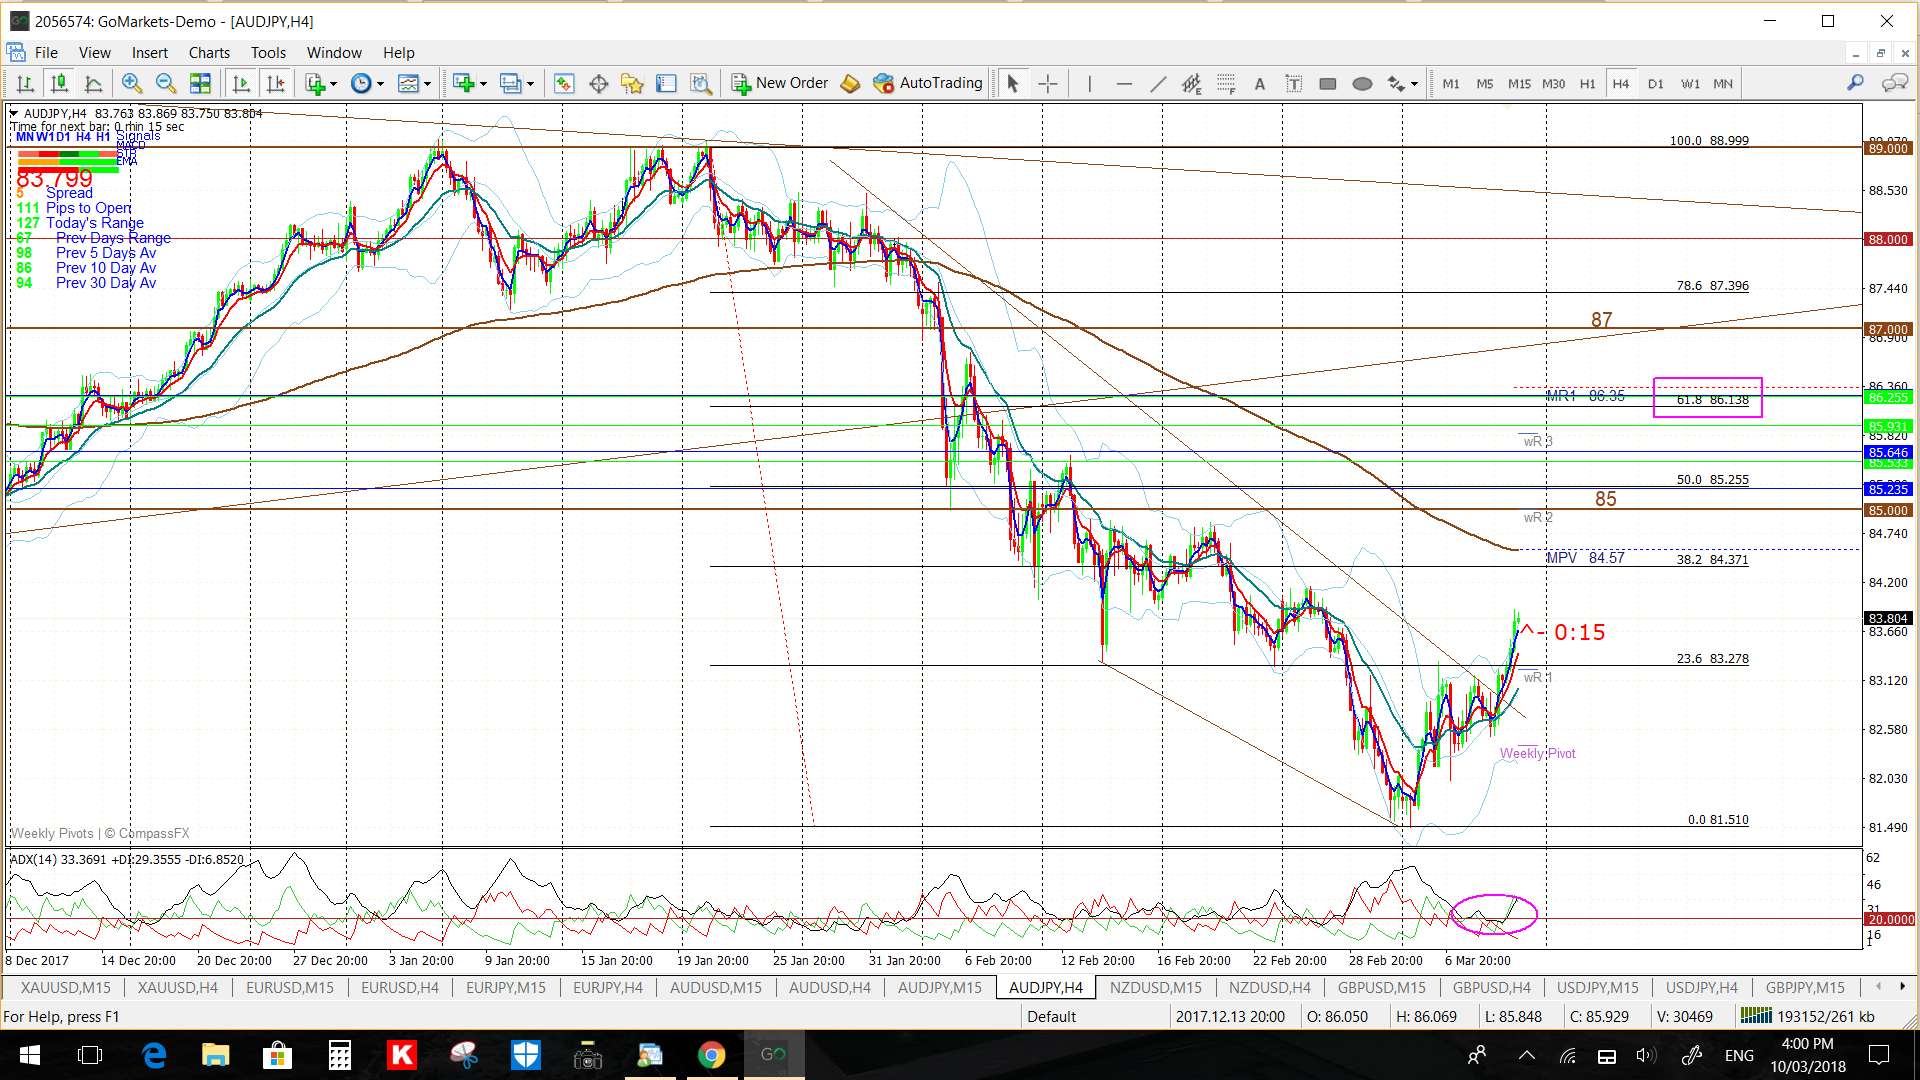
AUD/JPY: LIke the Aussie, the AUD/JPY has made a bullish breakout from a descending wedge pattern so watch for any continuation, especially if the bullish move on the S&P500 develops as these two entities are highly positively correlated.
Bullish targets: The 85 S/R level, then the 4hr chart’s 61.8% fib near 86 followed by the 87 S/R level.
Bearish targets: the recent low near 81.50.
- Watch for any continuation from the wedge breakout; especially with this week’s CNY Industrial Production data release.
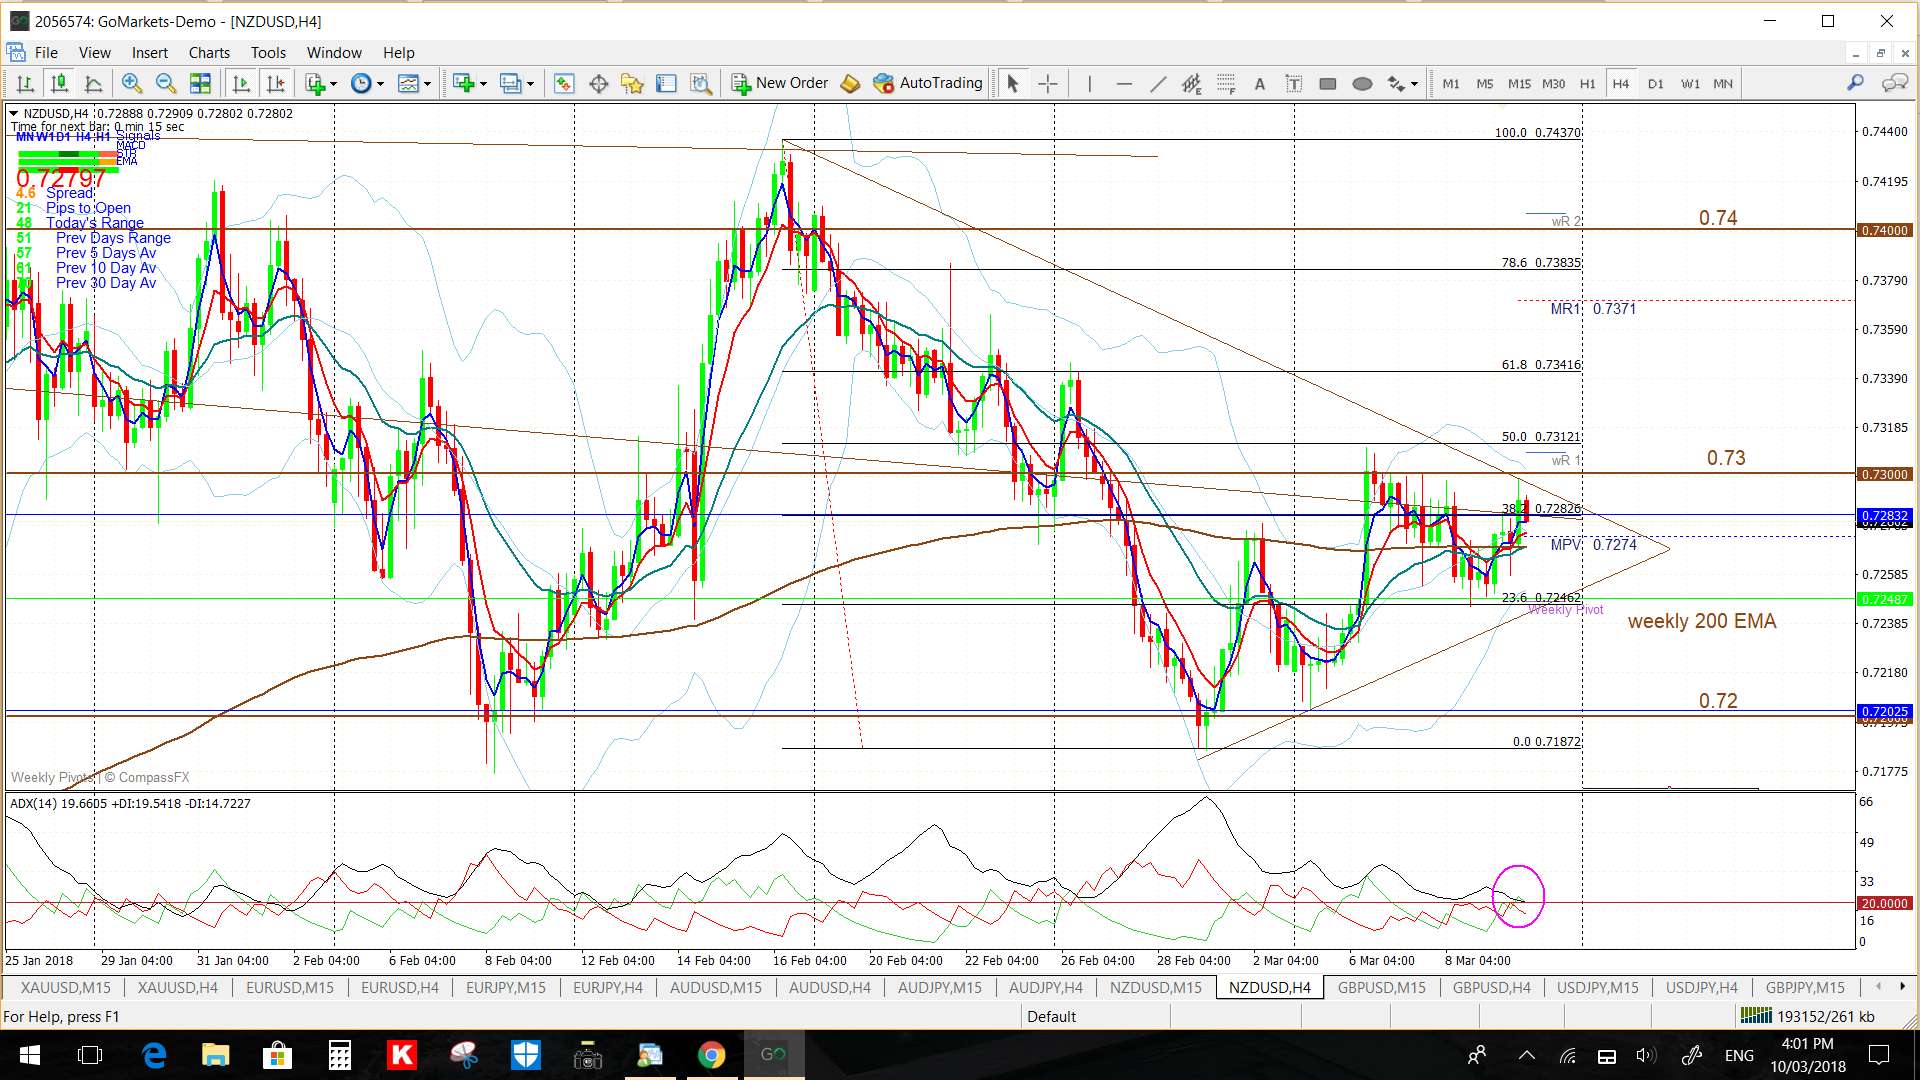
NZD/USD: The Kiwi has essentially chopped sideways and is ranging within a 4hr chart triangle under the 0.73 S/R level.
Bullish targets: the 4hr chart’s 61.8% fib near 0.735 followed by the 74 S/R level.
Bearish targets: the recent low near 0.72.
- Watch for any new momentum-based trend line breakout; especially with this week’s CNY Industrial Production data and NZD GDP data release.
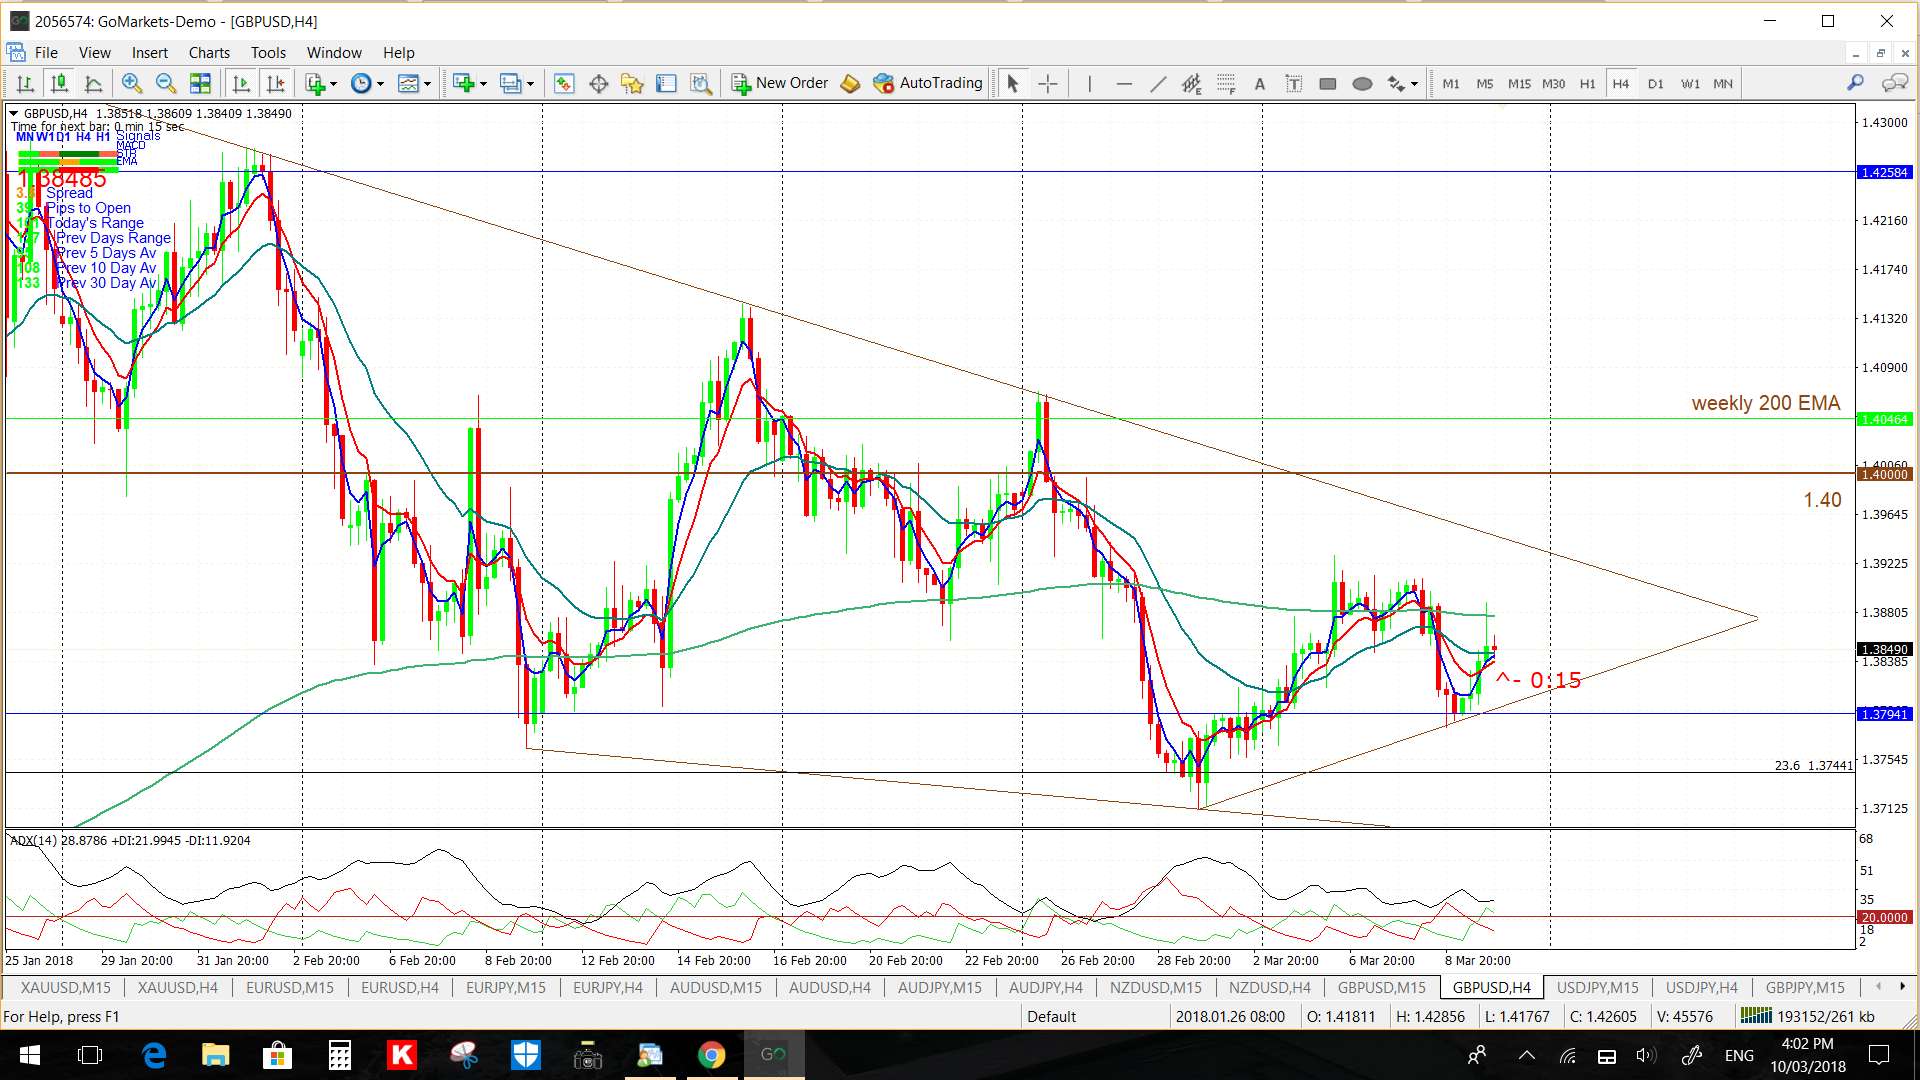
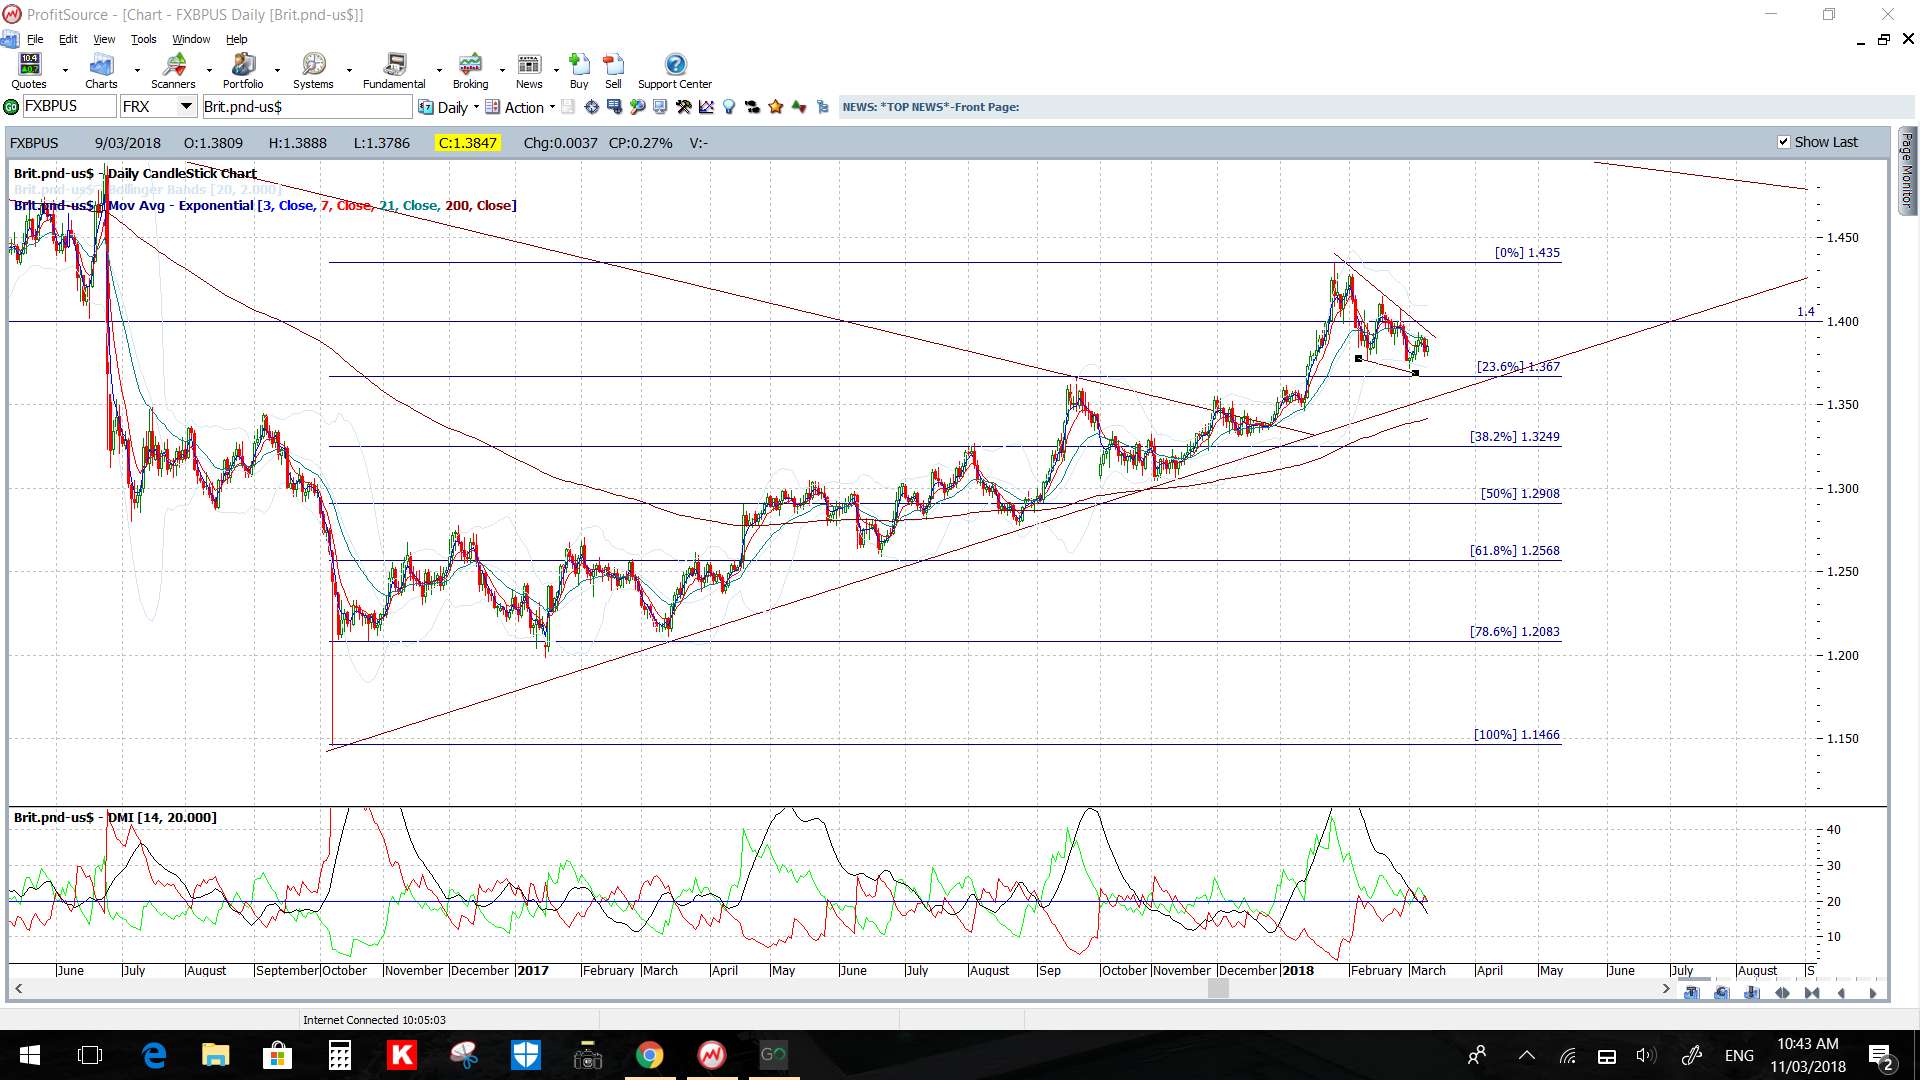
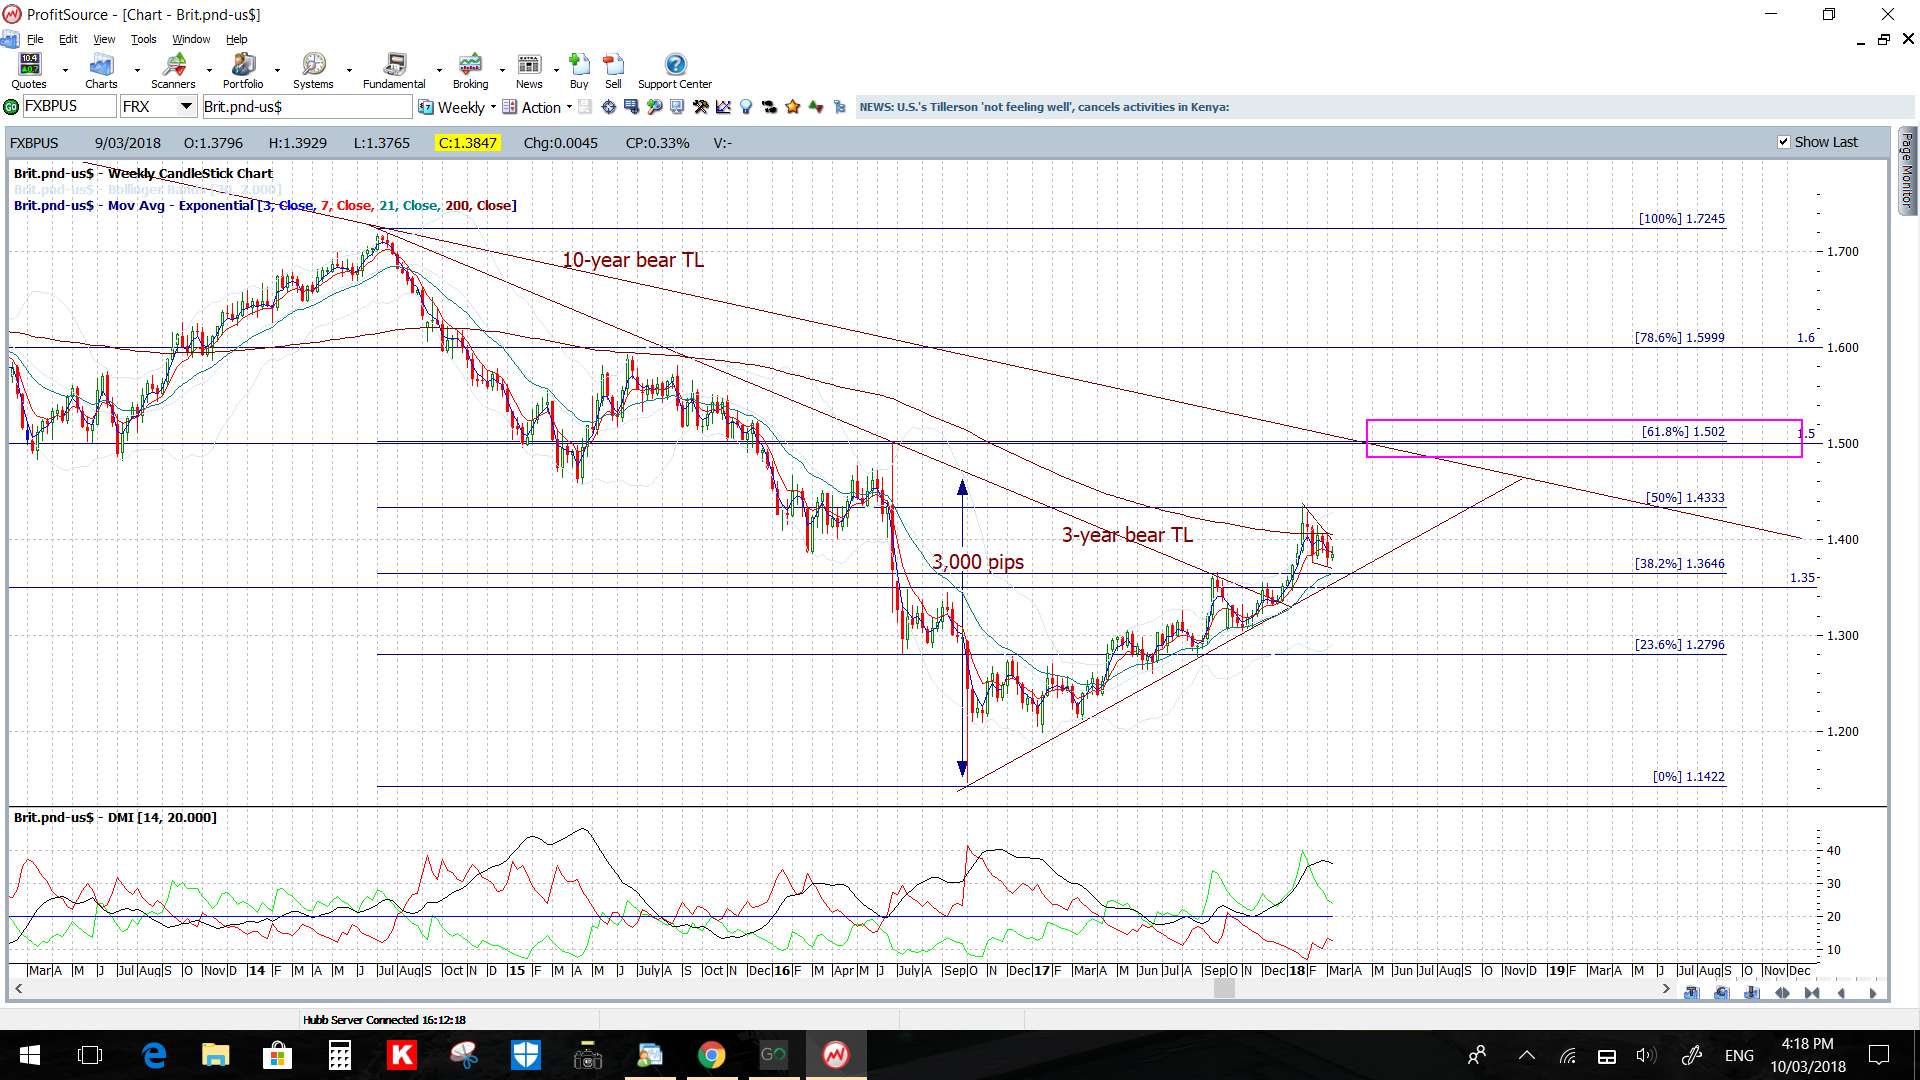
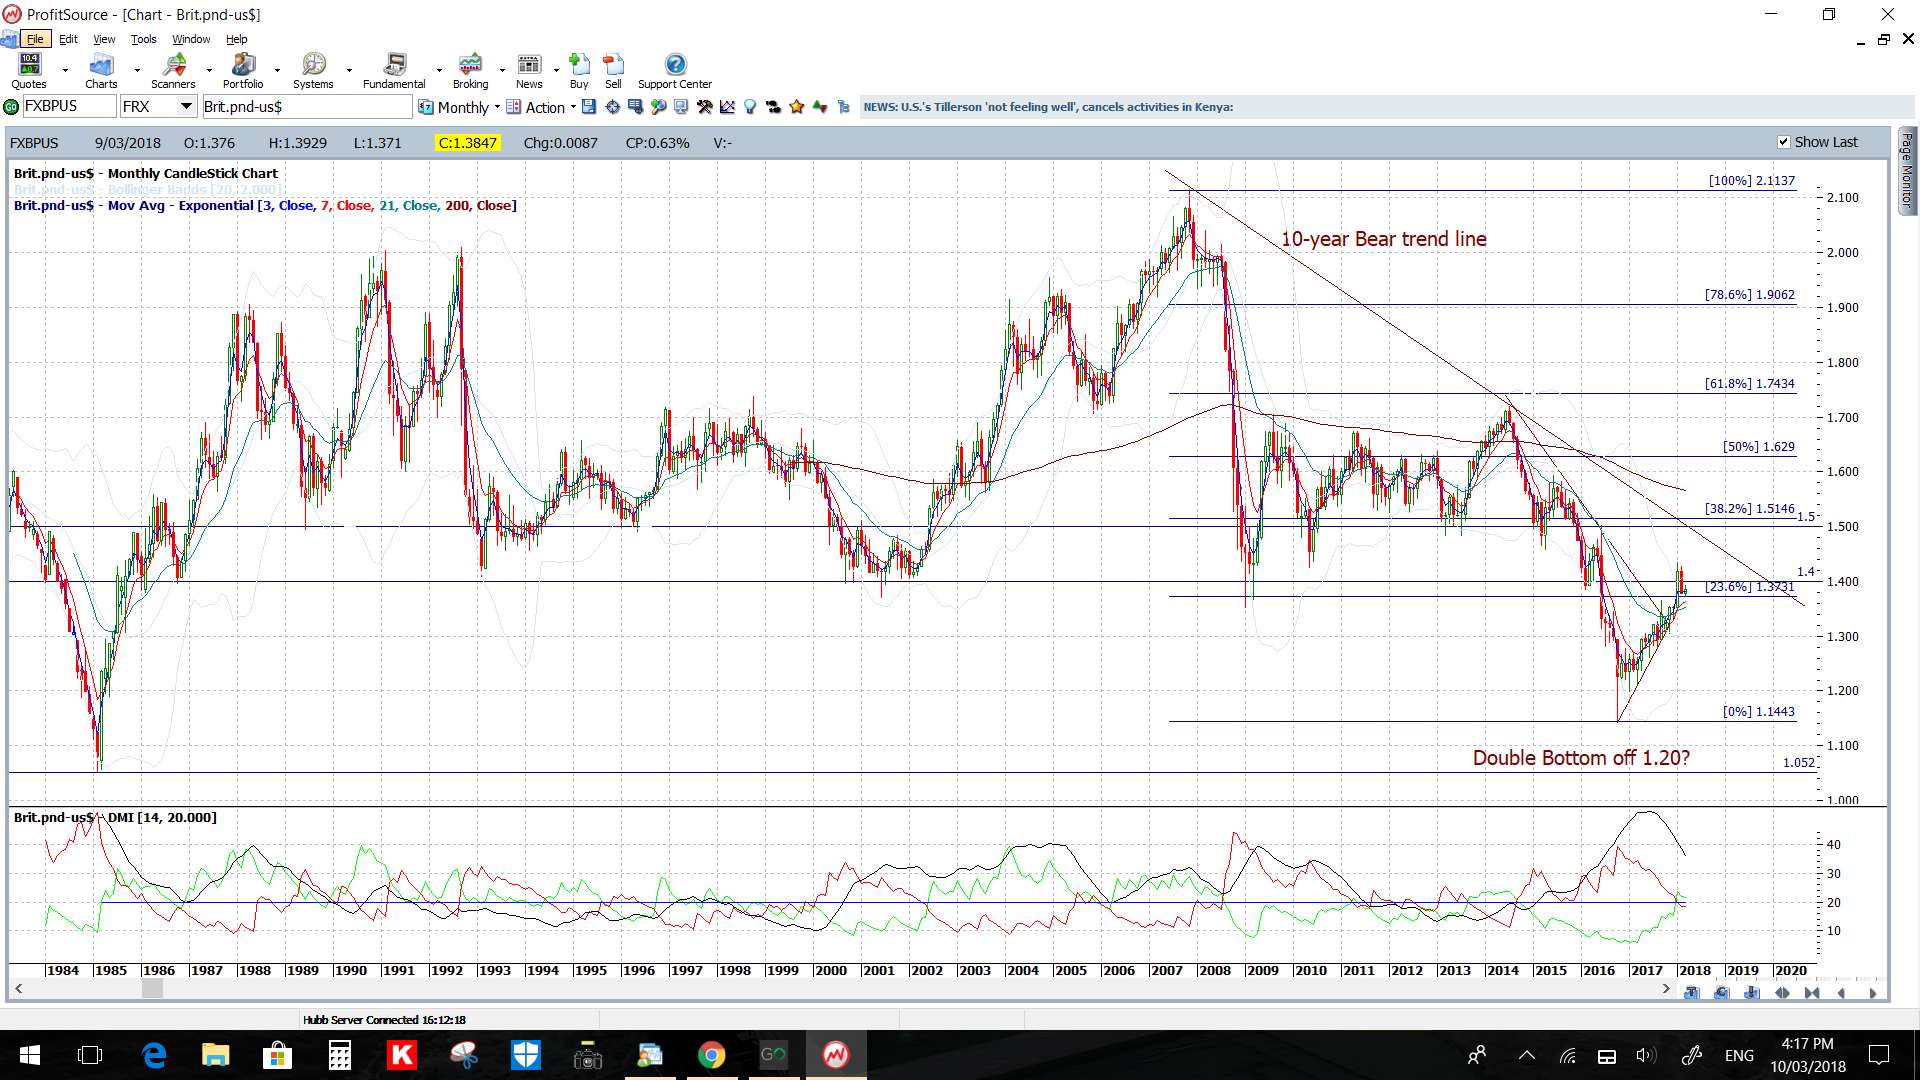
GBP/USD: The Cable is still, essentially, consolidating below the key 1.40 level as this is a major S/R zone (best viewed on the monthly chart).
Bullish targets: Any move back above 1.40 would have me looking to the 1.50 region as this is the 61.8% fib of the weekly chart’s longer-term swing low move. This is a move worth 1,000 pips so is worth stalking!
Bearish targets: The daily chart reveals how a weekly support trend line is still in play here but any break below this would have me looking down to the 1.25 level as this is the 61.8% fib of the last major swing high move (see daily chart).
- Watch for any new momentum-based trend line breakout; especially with this week’s Annual Budget update.
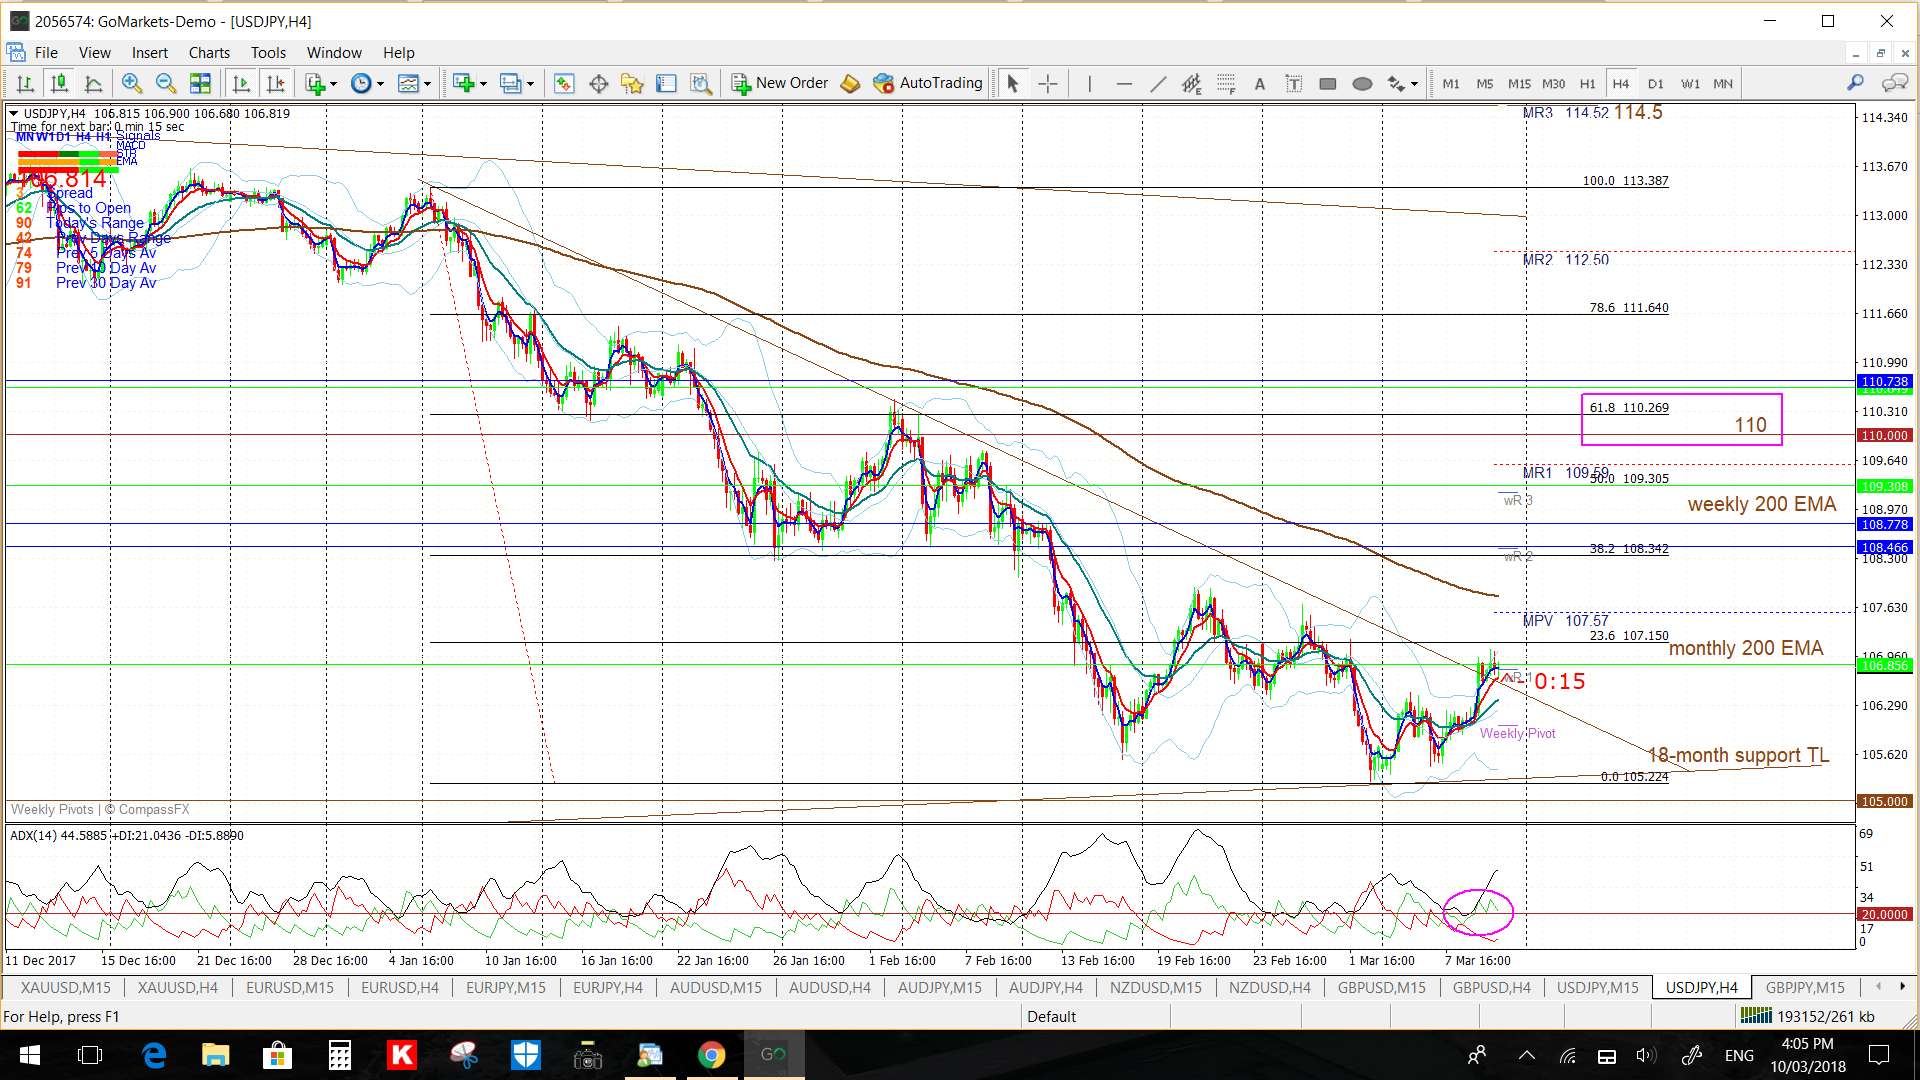
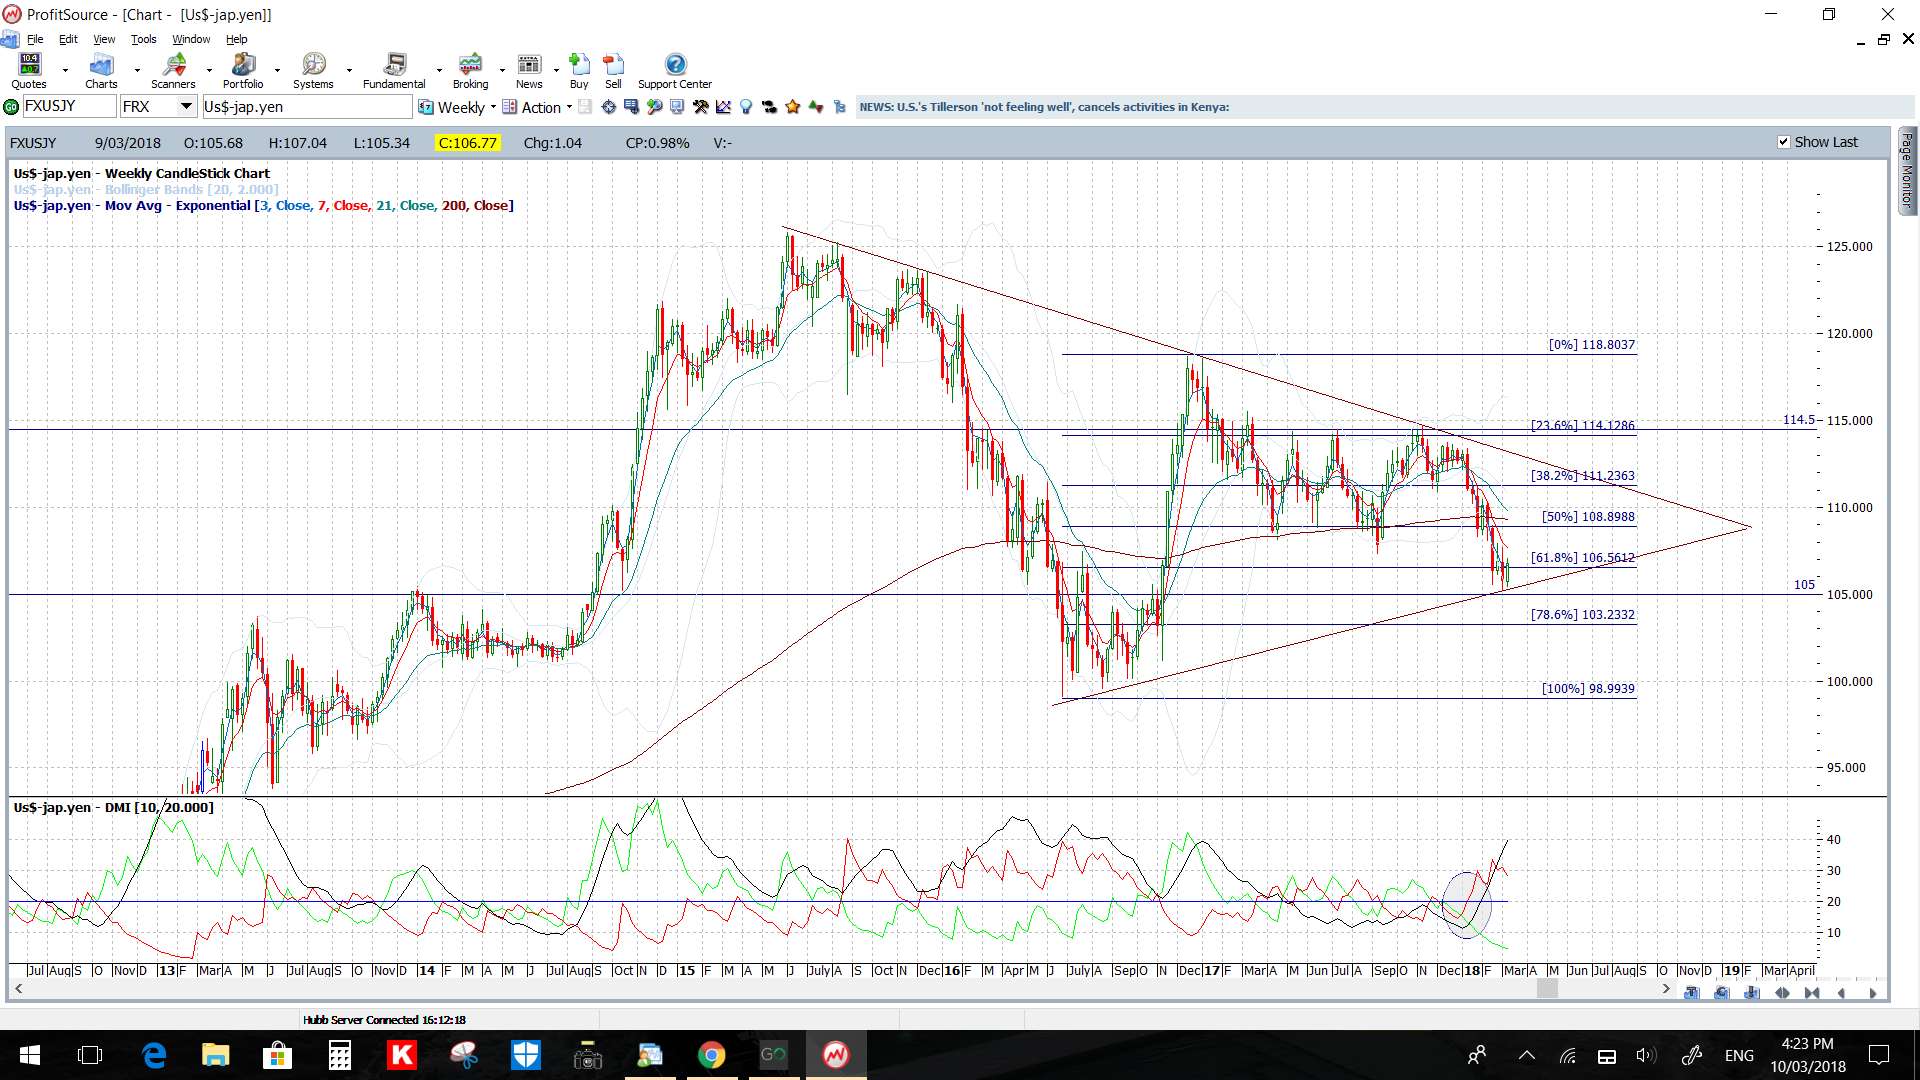
USD/JPY: The USD/JPY looks to be breaking out above a 9-week bear trend line so watch for any follow through in the coming week. Price is hovering near the monthly 200 EMA so watch this S/R level as well.
Bullish targets: the weekly 200 EMA near 109.50 followed by the key 110 S/R level that is also near the 4hr chart’s 61.8% fib level.
Bearish targets: the recent low near the 18-month support trend line.
- Watch for any continuation from the trend line breakout.
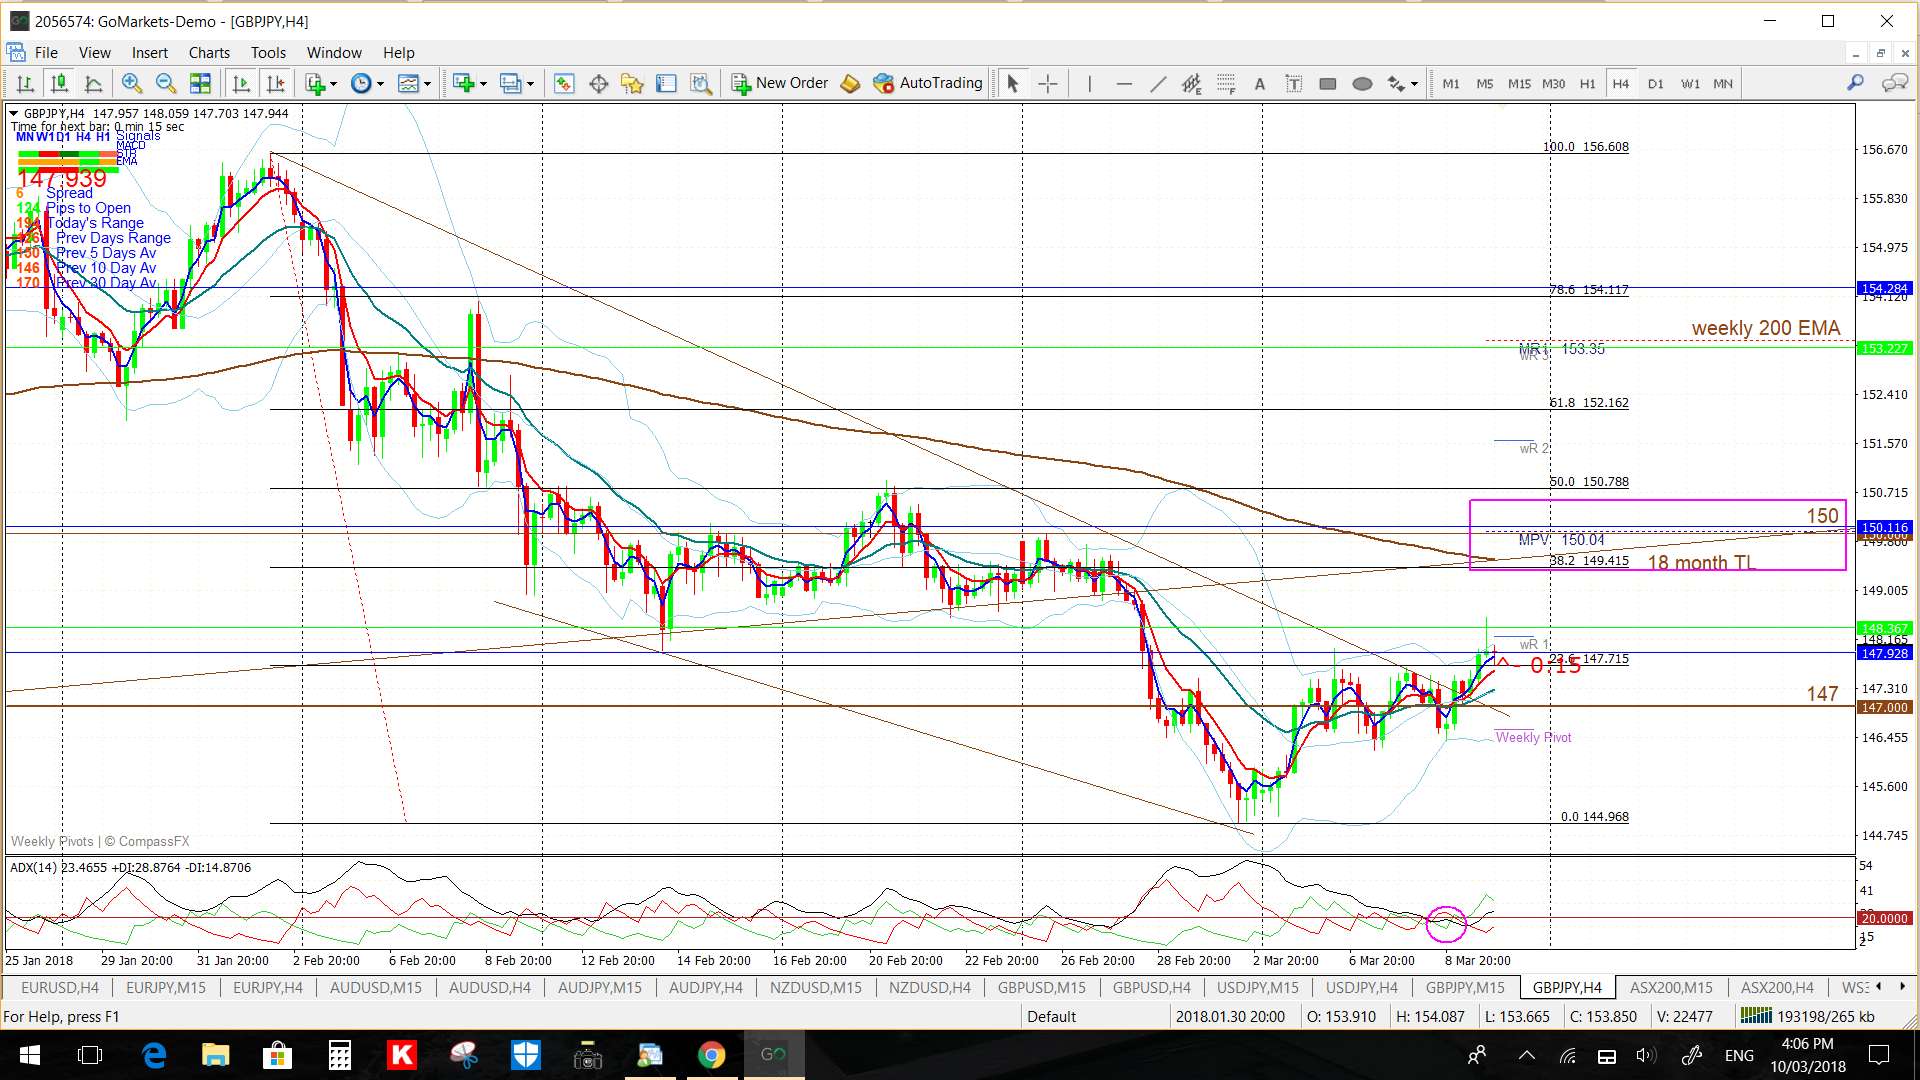
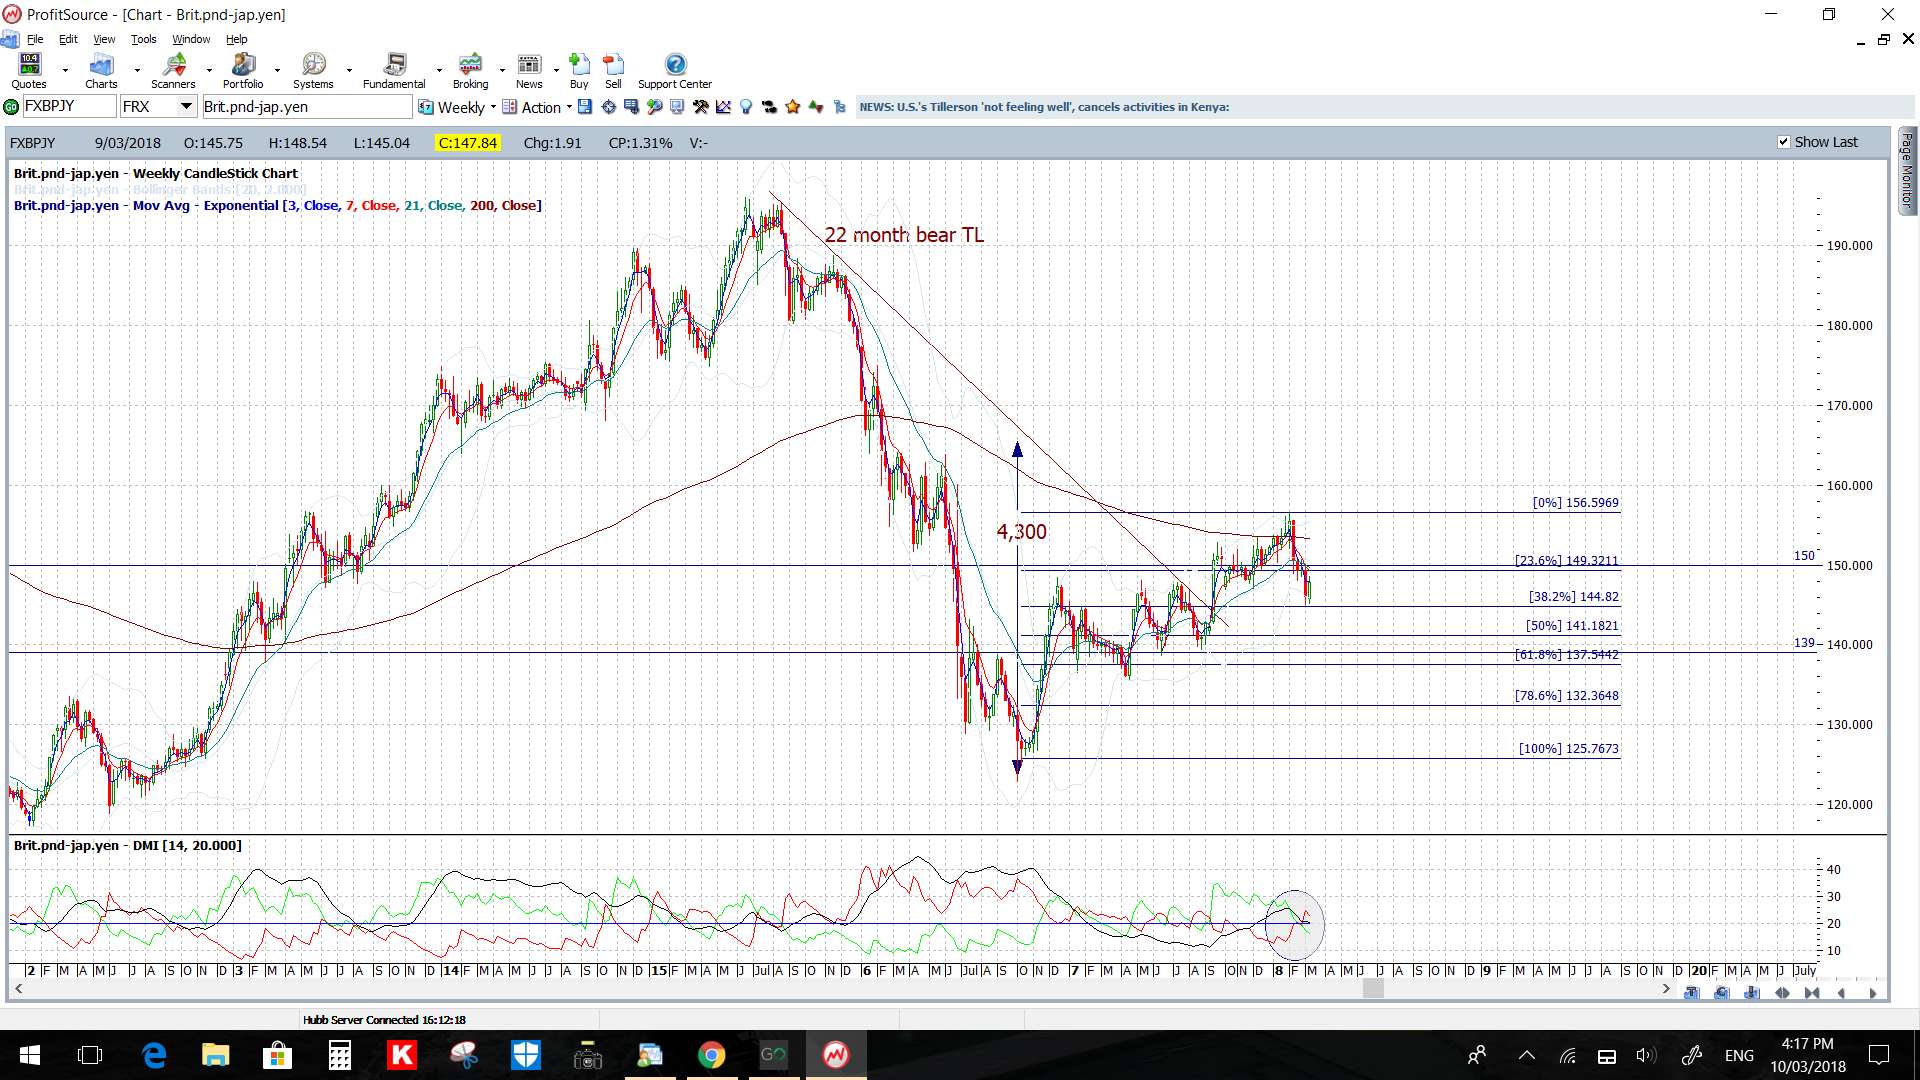
GBP/JPY: Like the USD/JPY, this also looks to be trying for a bullish trend line breakout.
Bullish targets: The 150 S/R level, which is near the previously broken support trend line, 4hr 200 EMA and monthly pivot followed by the weekly 200 EMA.
Bearish targets: the recent low near 145 and, after that, the 139 level as this is near the weekly chart’s 61.8% fib region.
- Watch for any continuation from the wedge breakout.
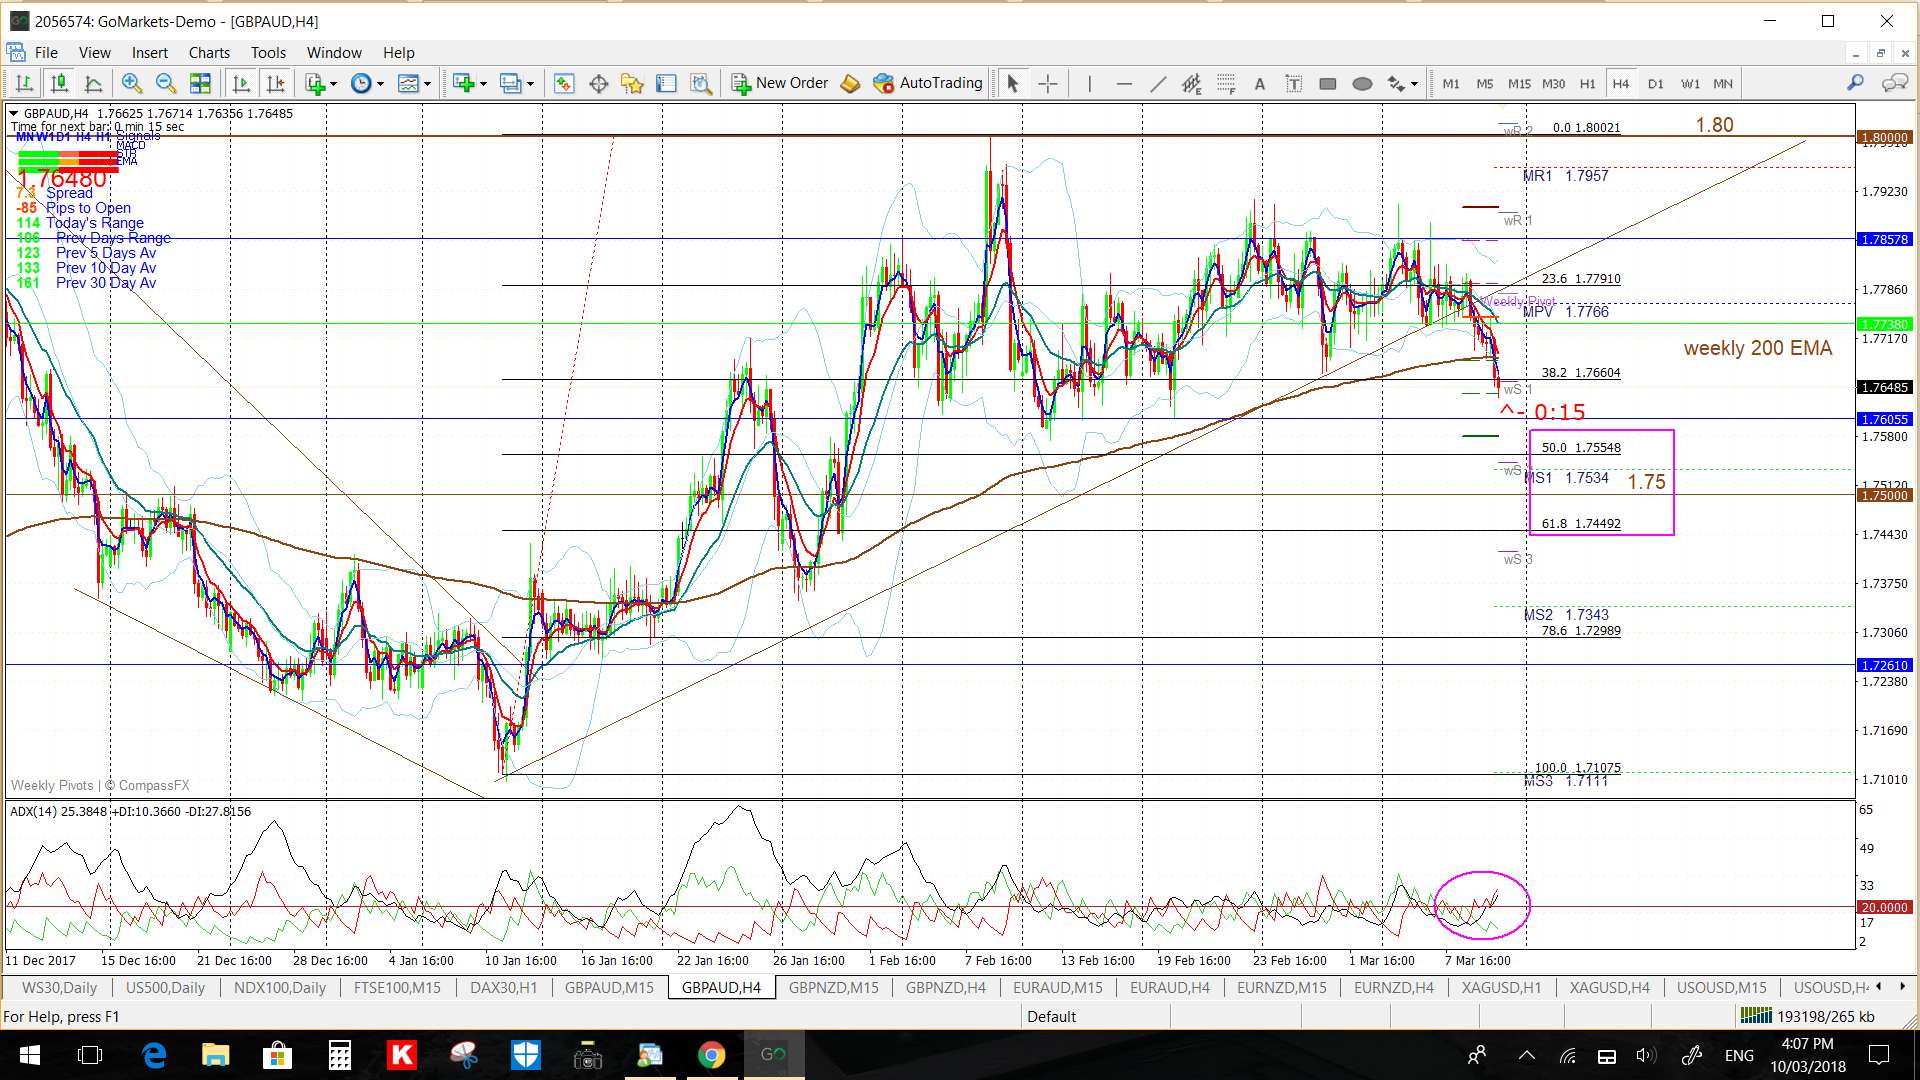
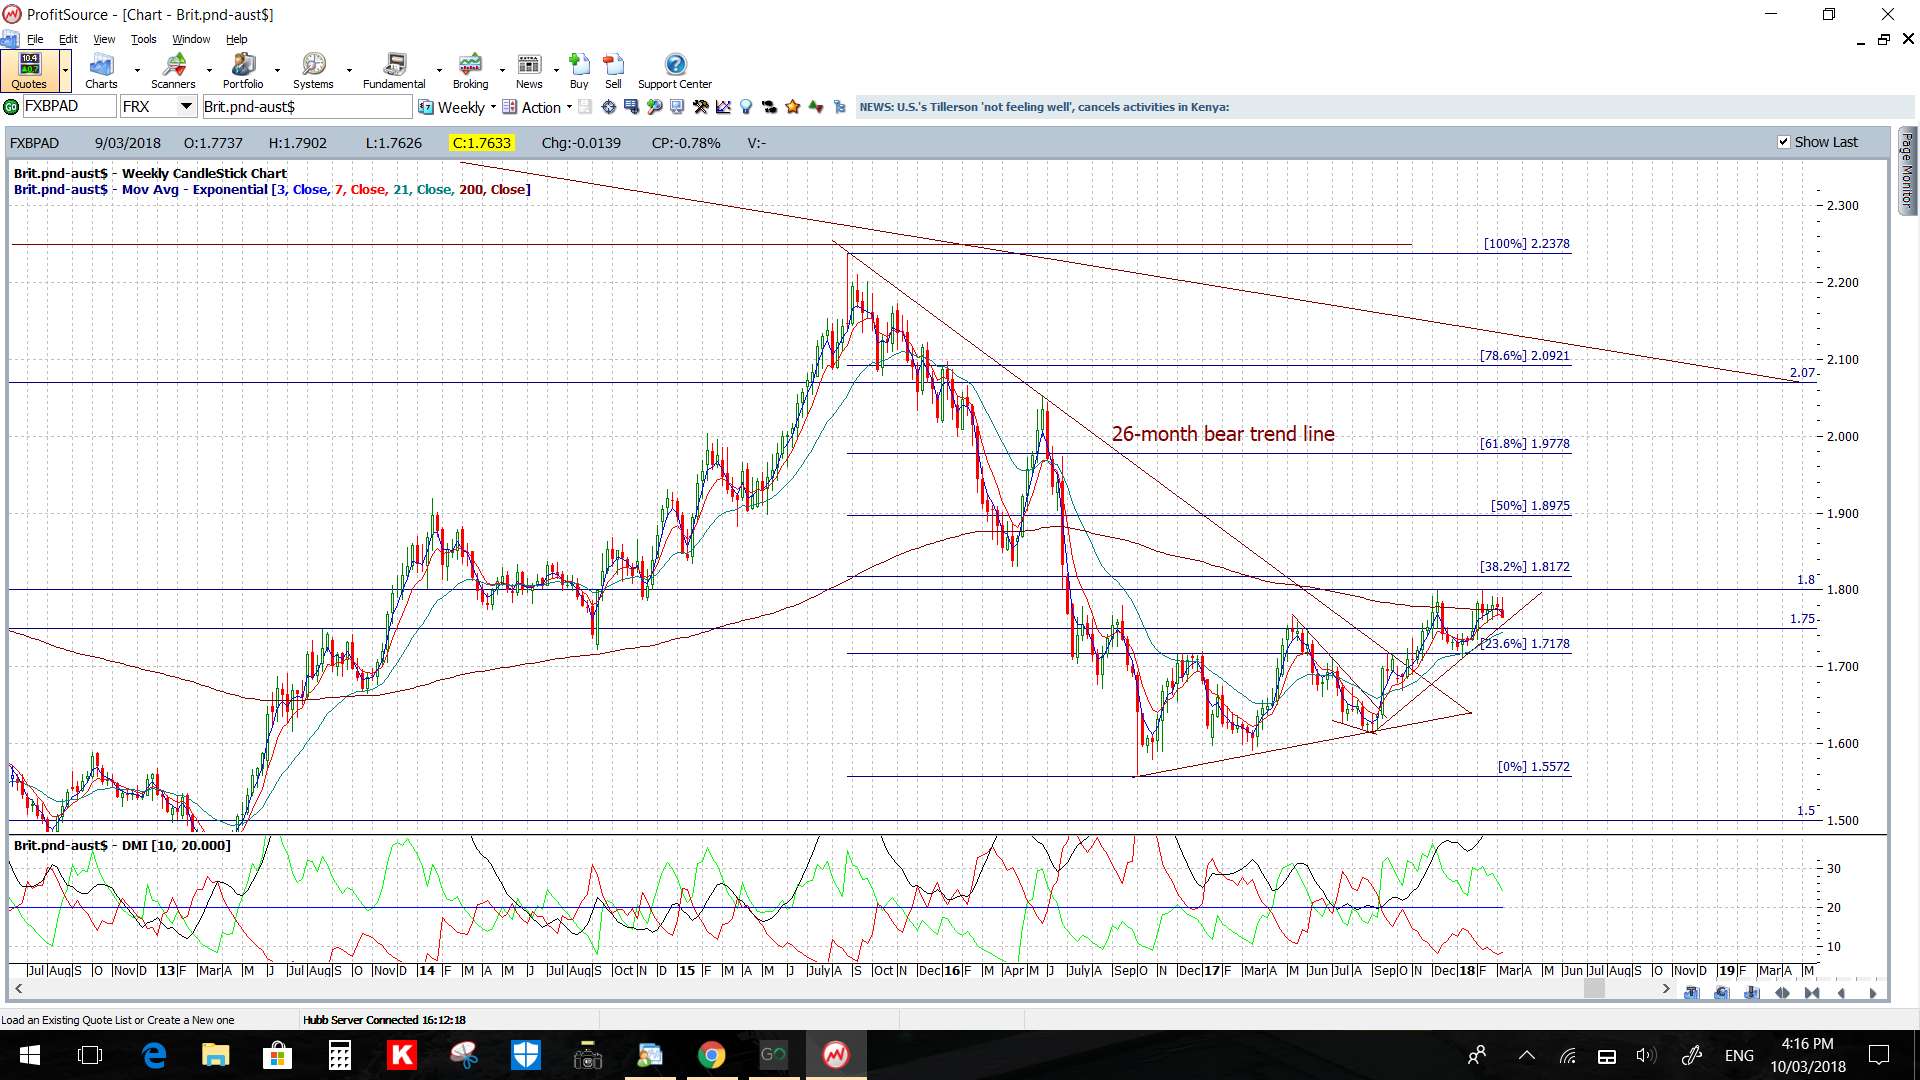
GBP/AUD: This pair traded lower last week and eventually broke through a support trend line.
- Watch for any test of the 1.75 S/R level.
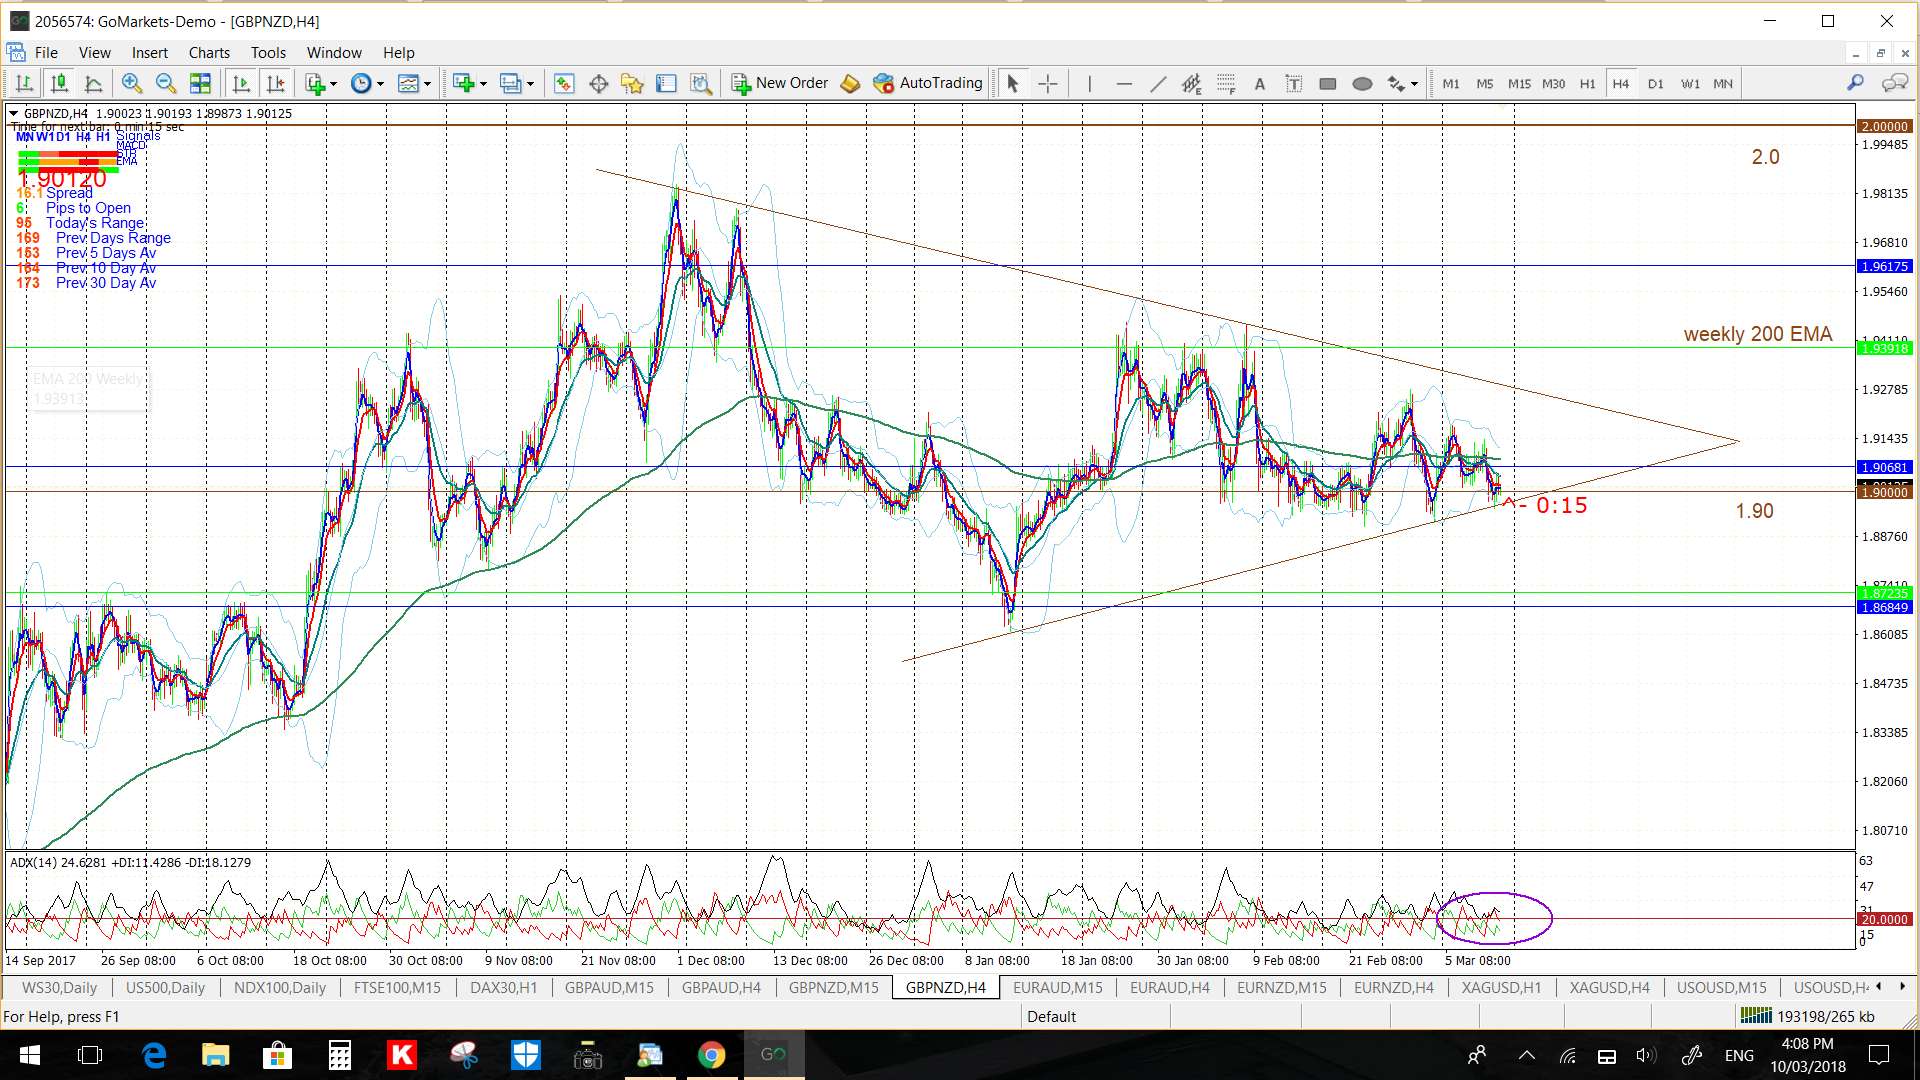
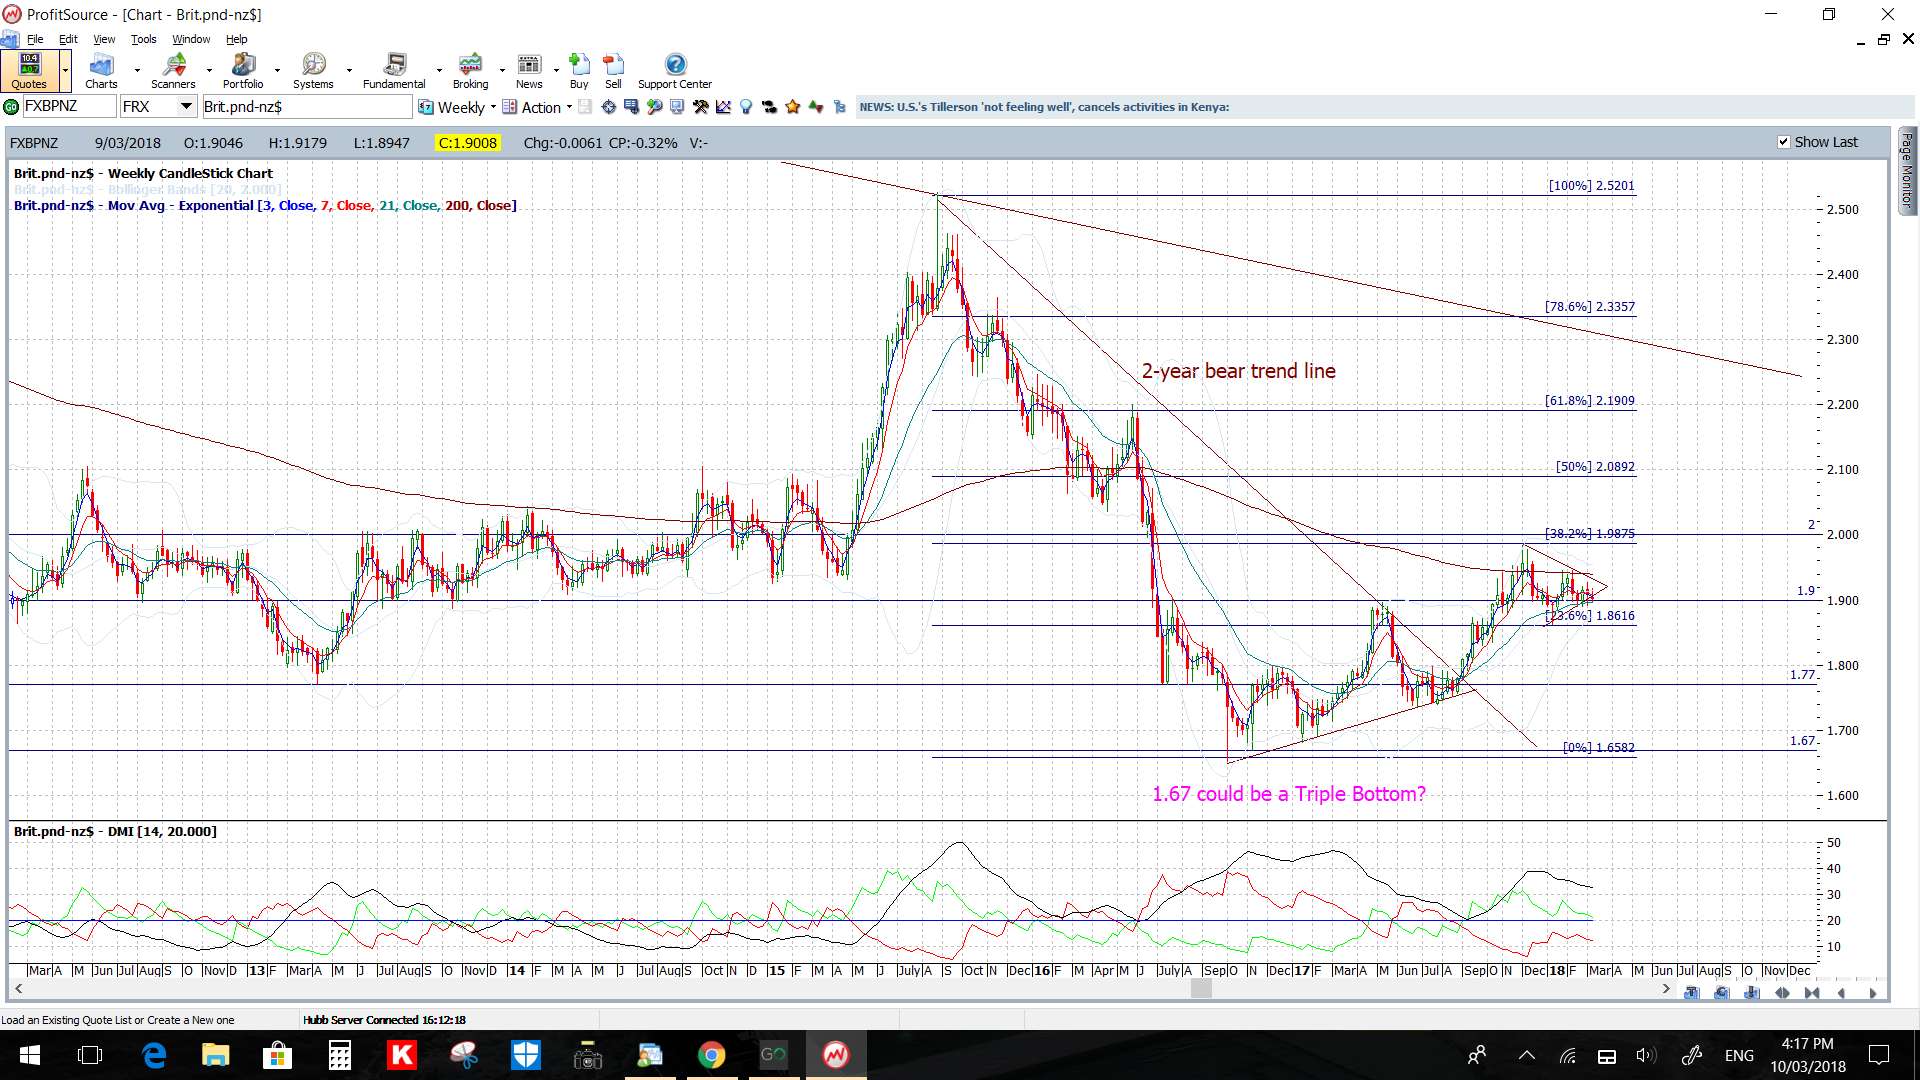
GBP/NZD: Price action continues to consolidate sideways near the 1.90 level.
- Watch the 4hr/weekly chart triangle trend lines for any new breakout.
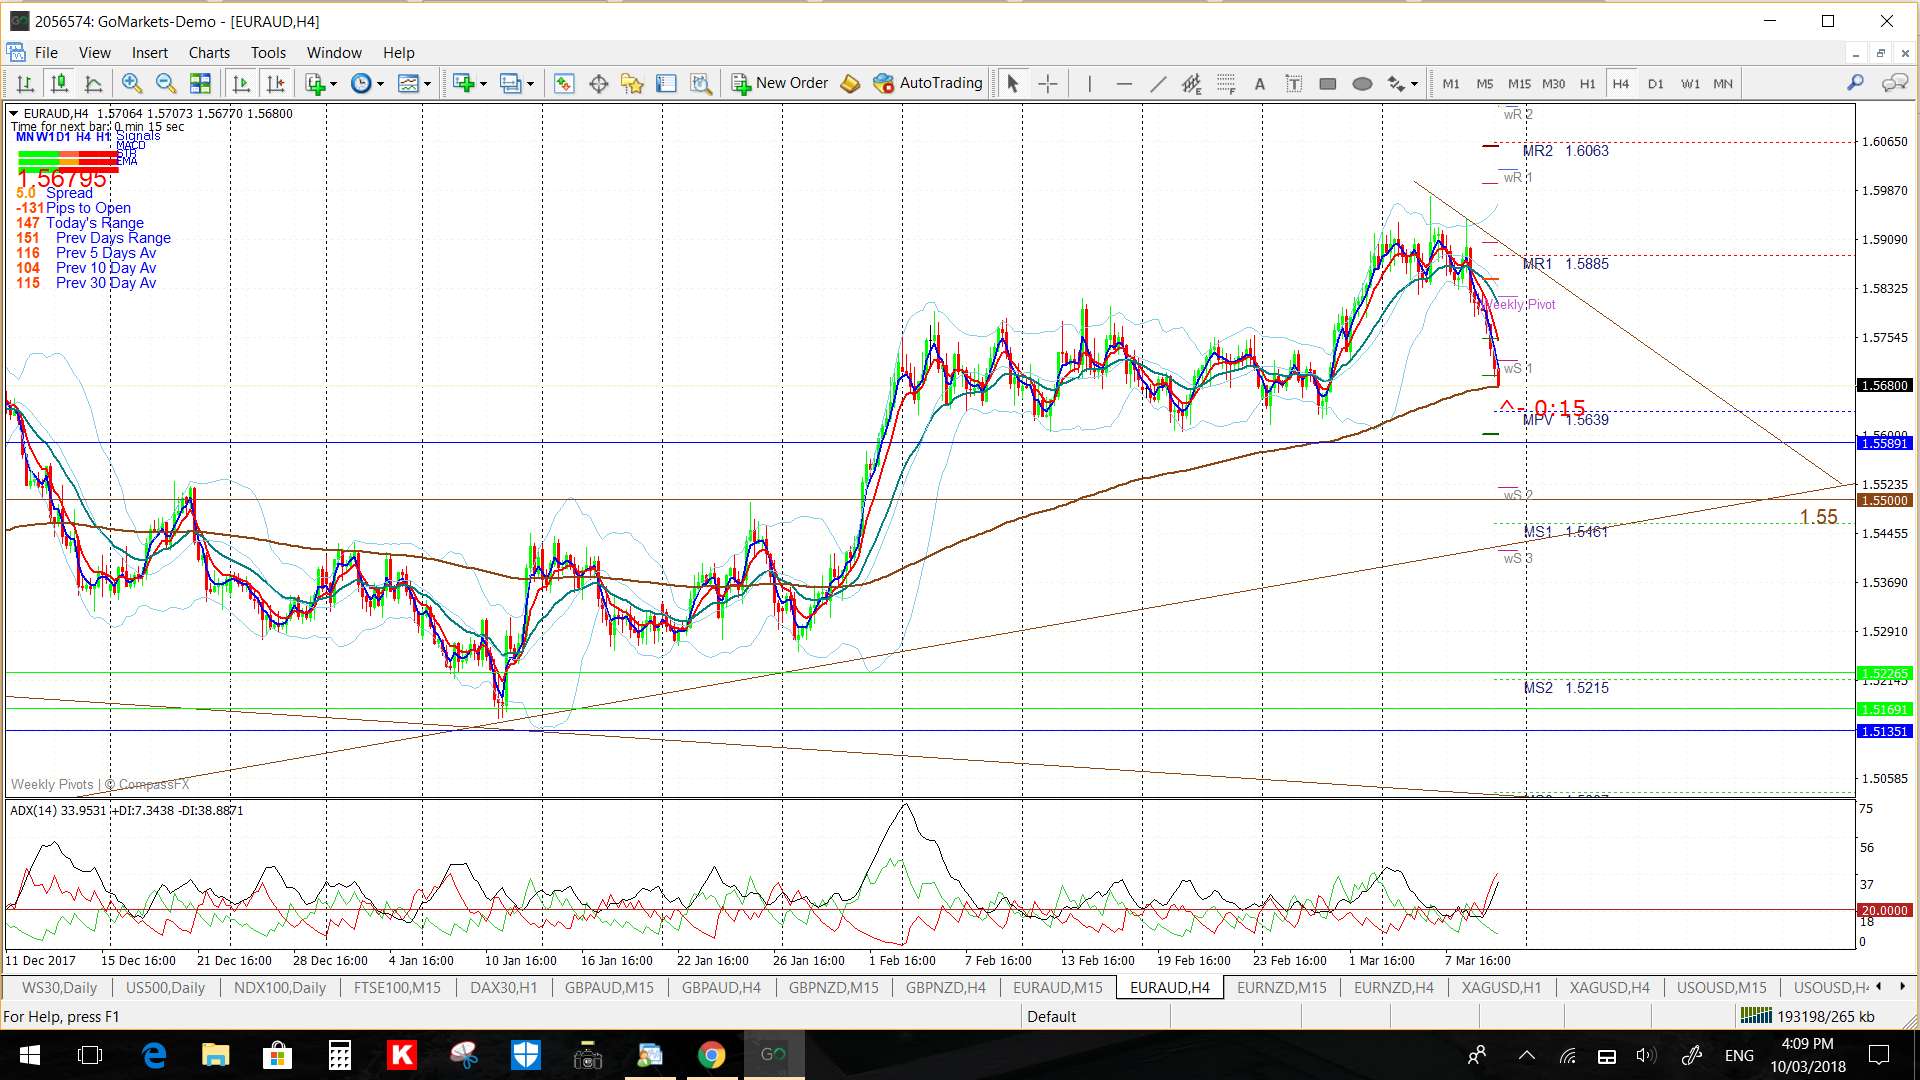
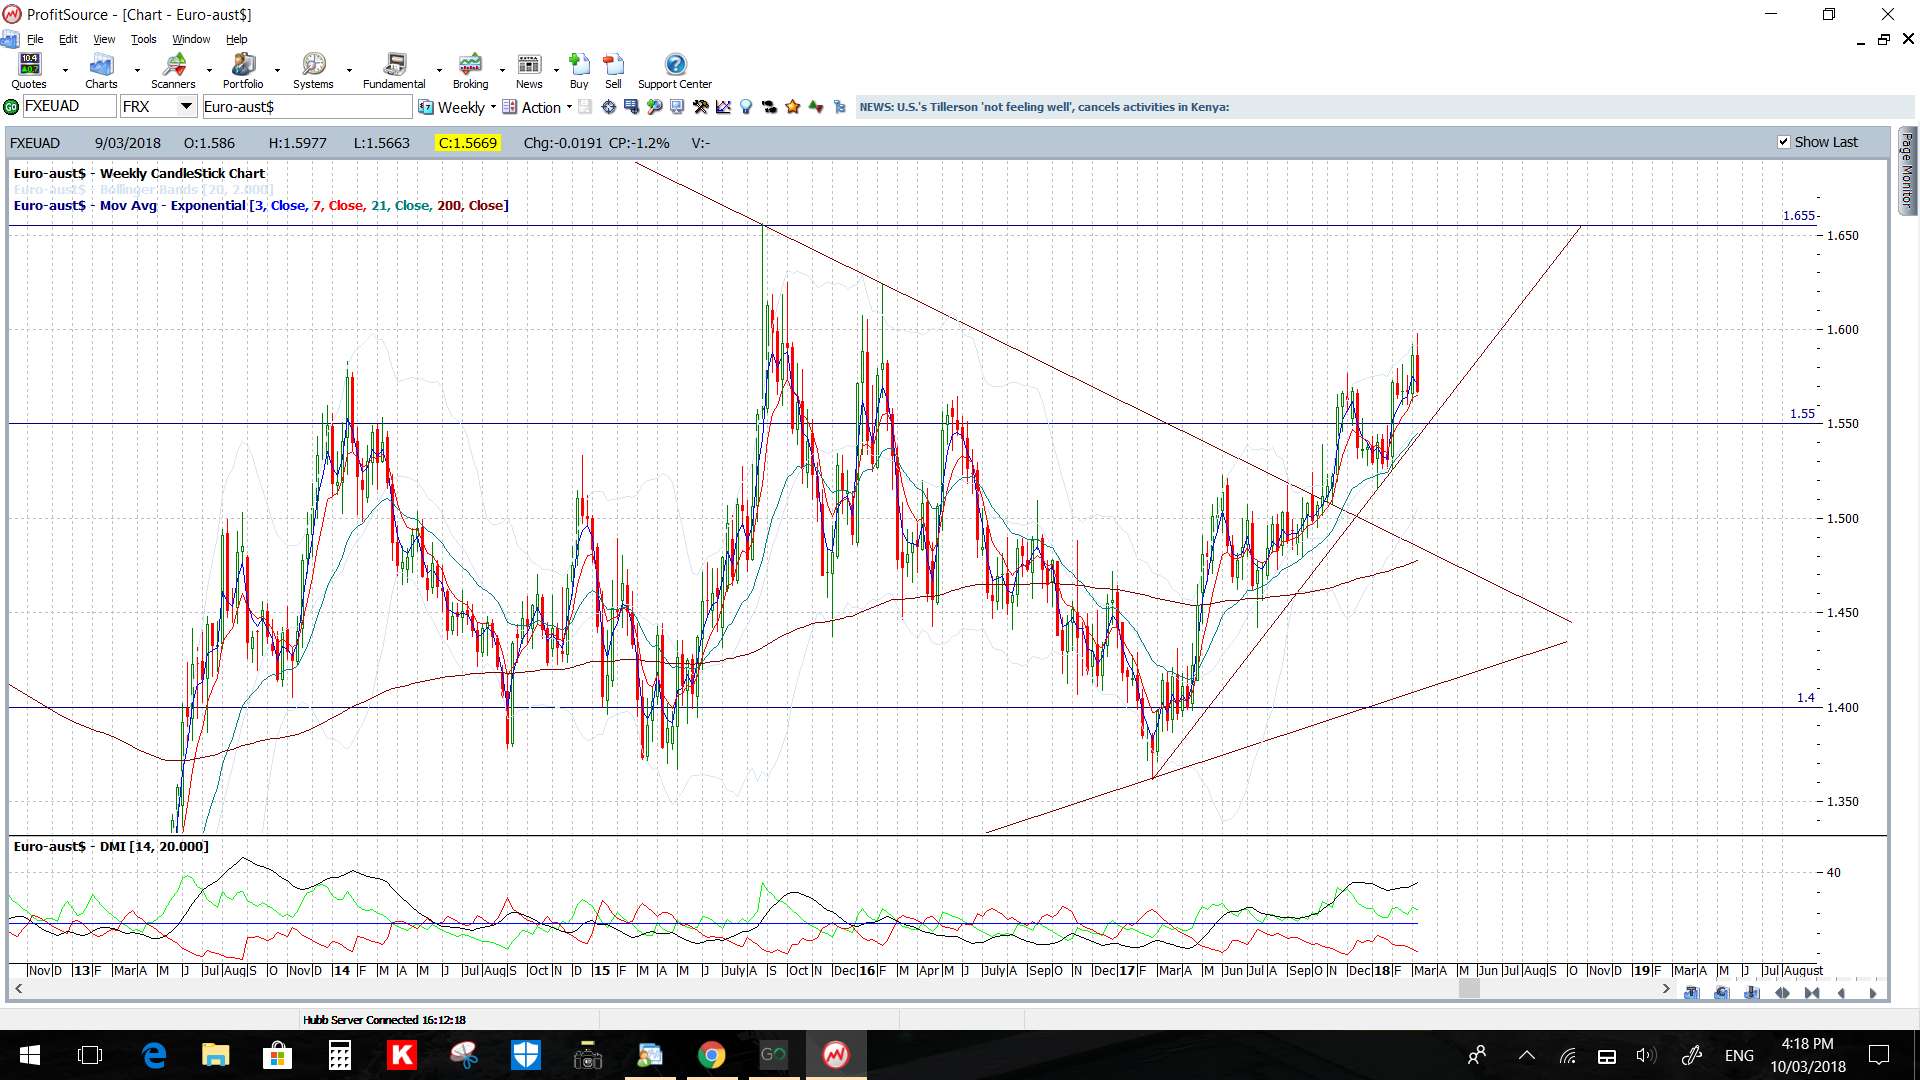
EUR/AUD: This traded lower last week.
Bearish targets: the 1.55 S/R level.
Bullish targets: the recent High.
- Watch the 4hr chart’s 200 EMA for any new make or break.
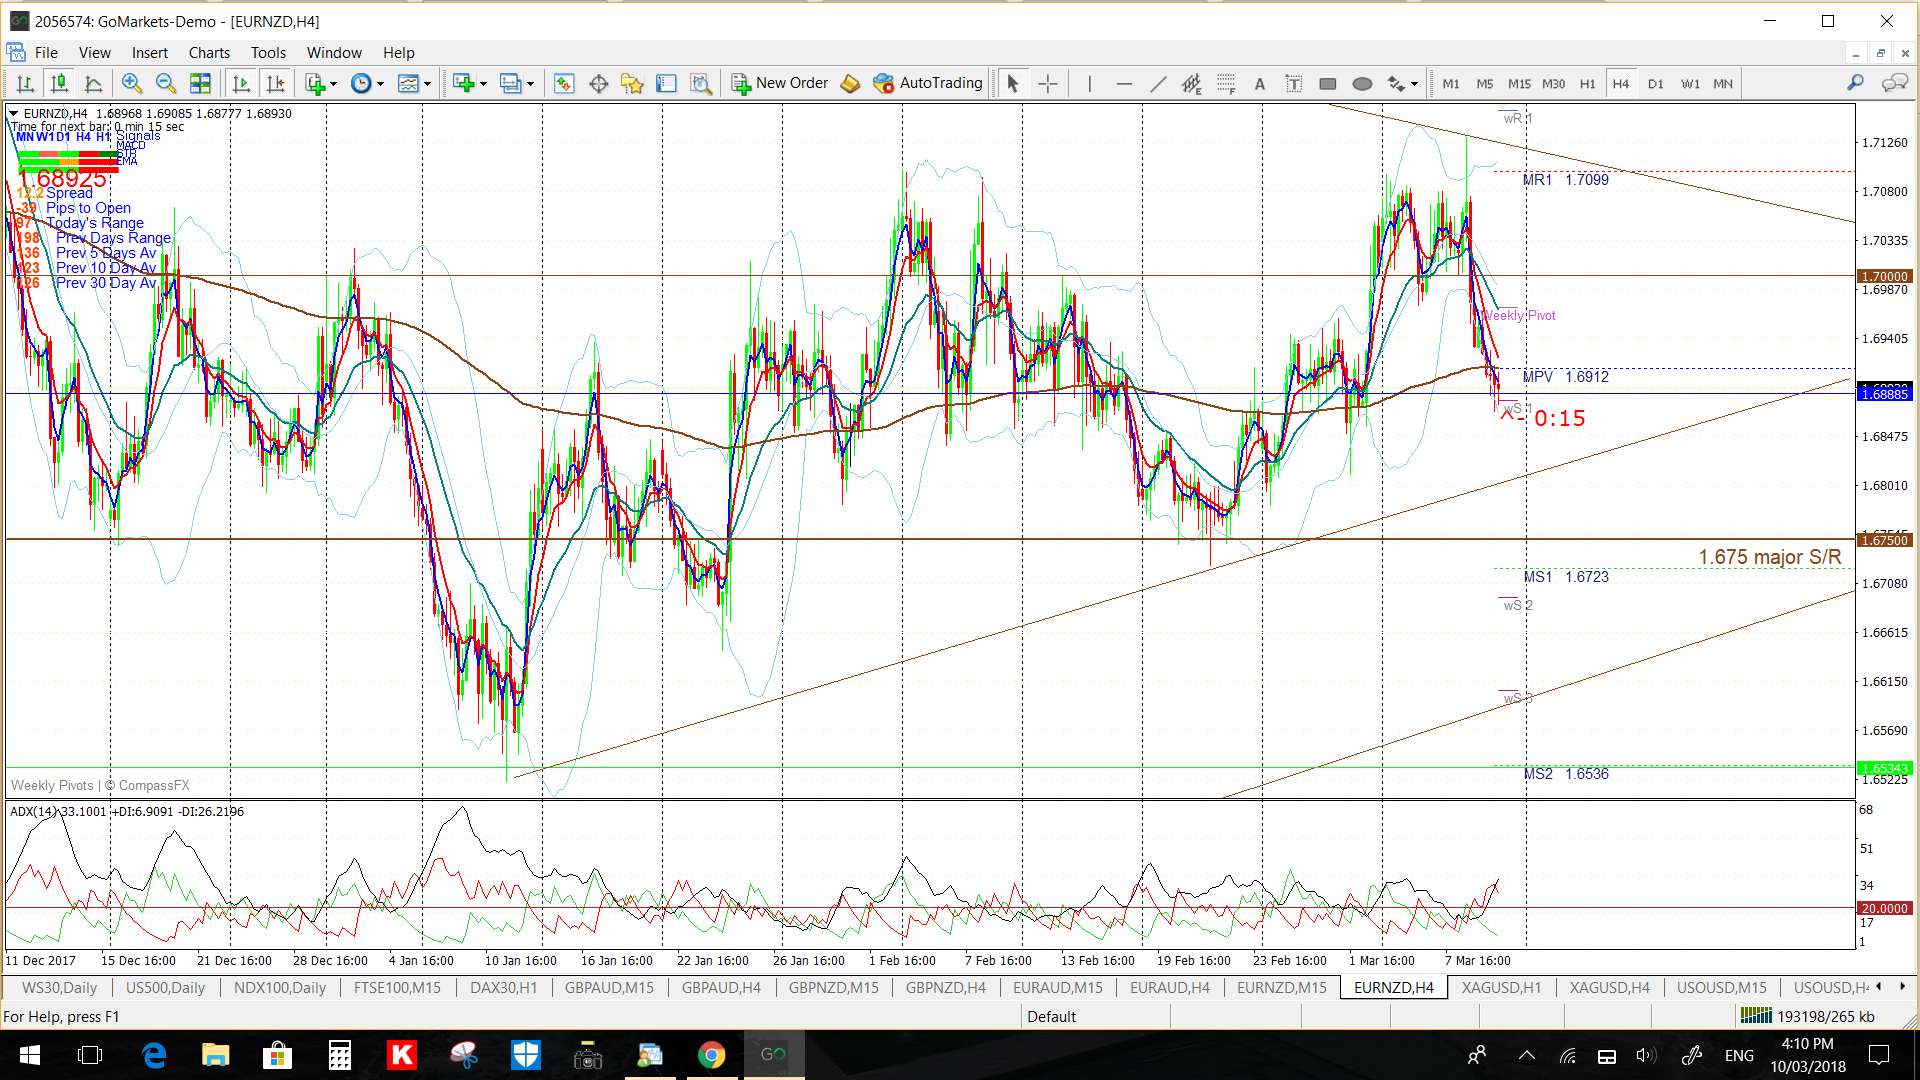
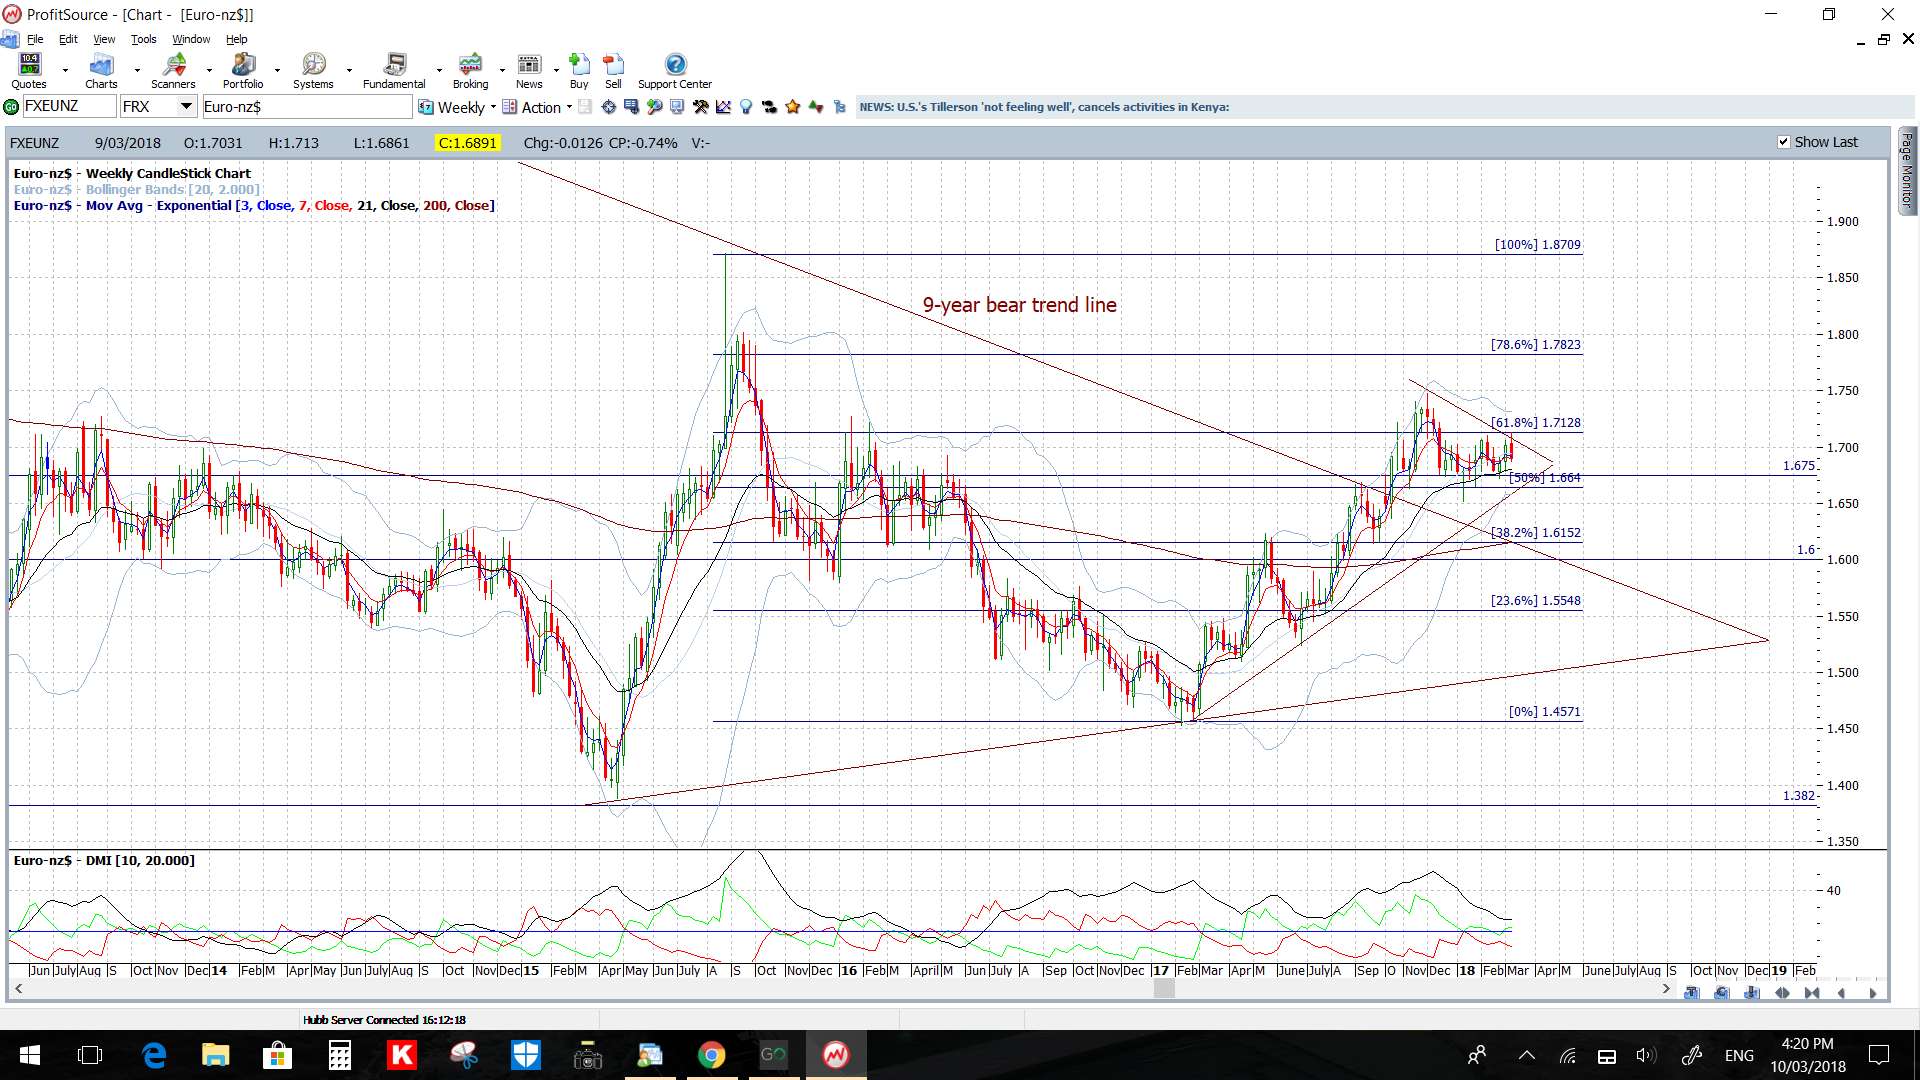
EUR/NZD: This traded lower last week.
- Watch the 4hr chart’s triangle trend lines for any new breakout.
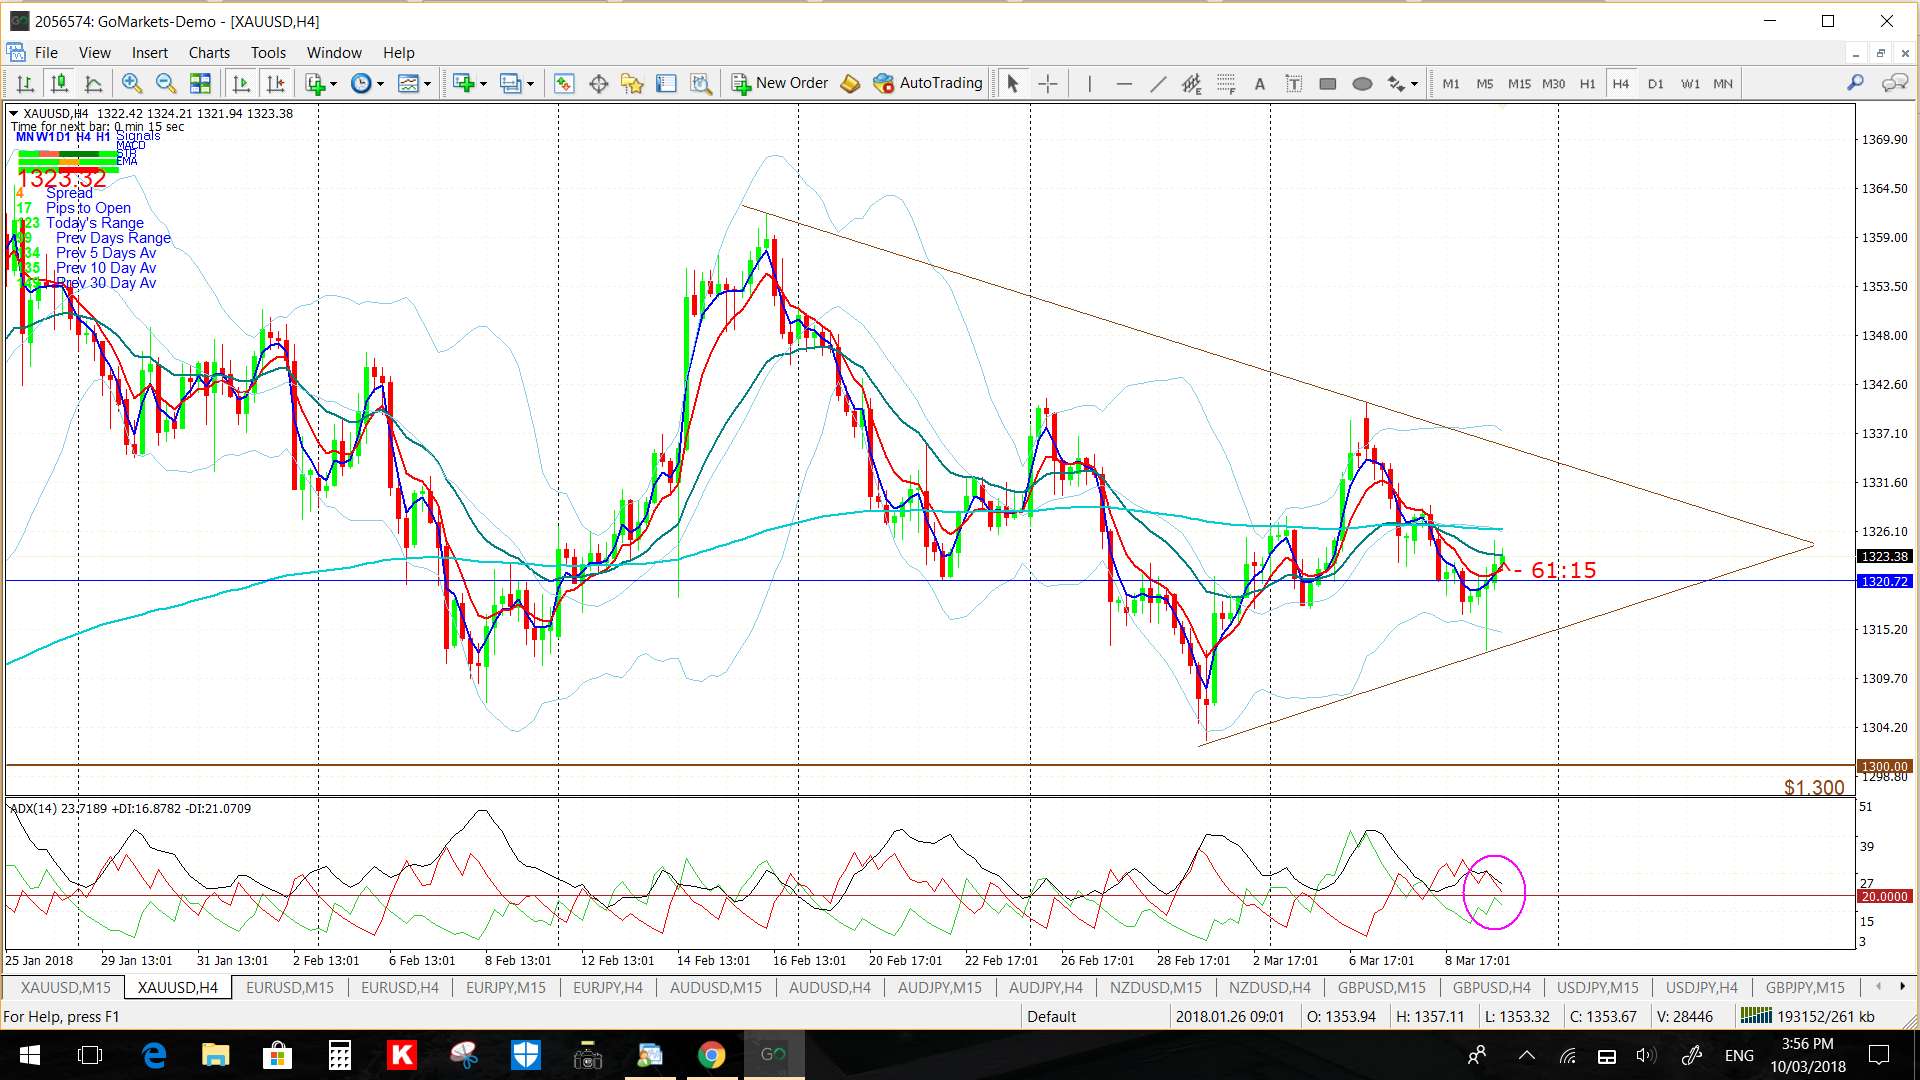
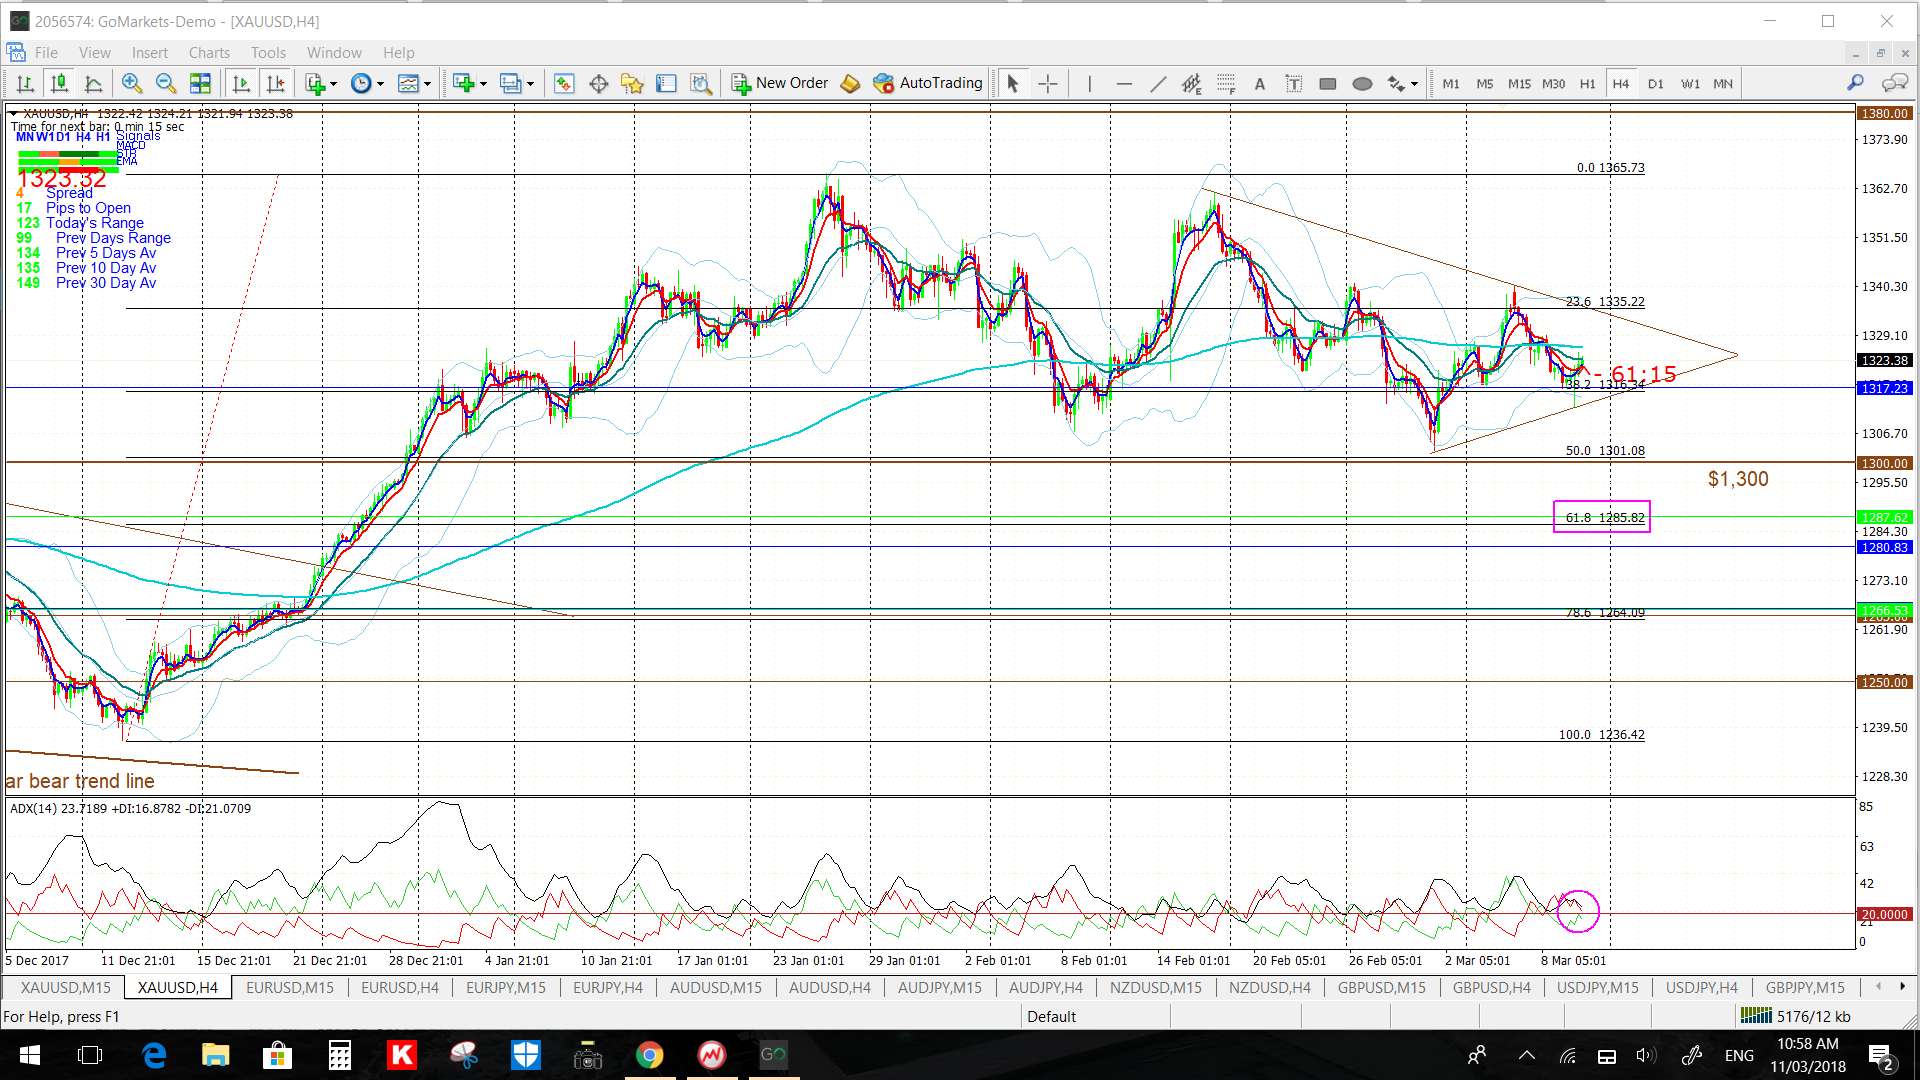
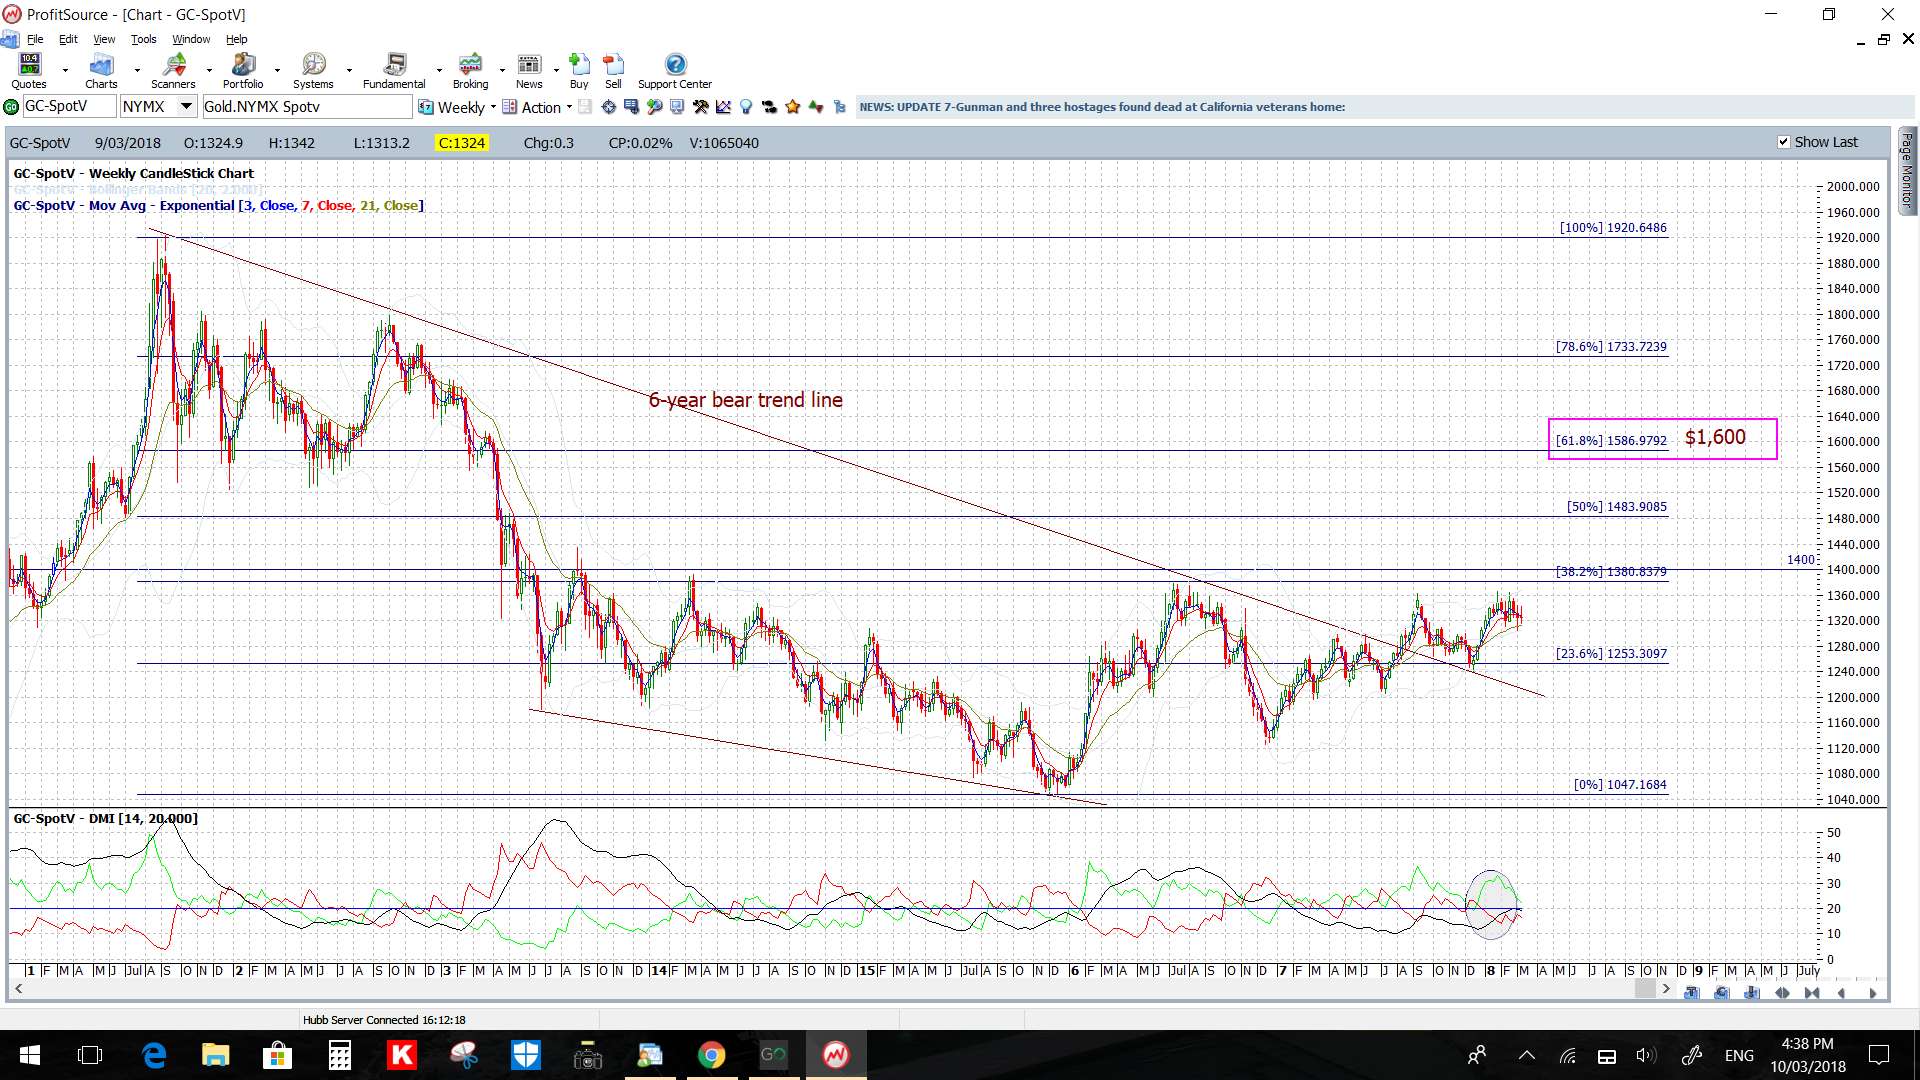
Gold: Gold is consolidating in a triangle under the $1,400 level. This remains the big level to watch for any new make or break when defining the next major move for Gold.
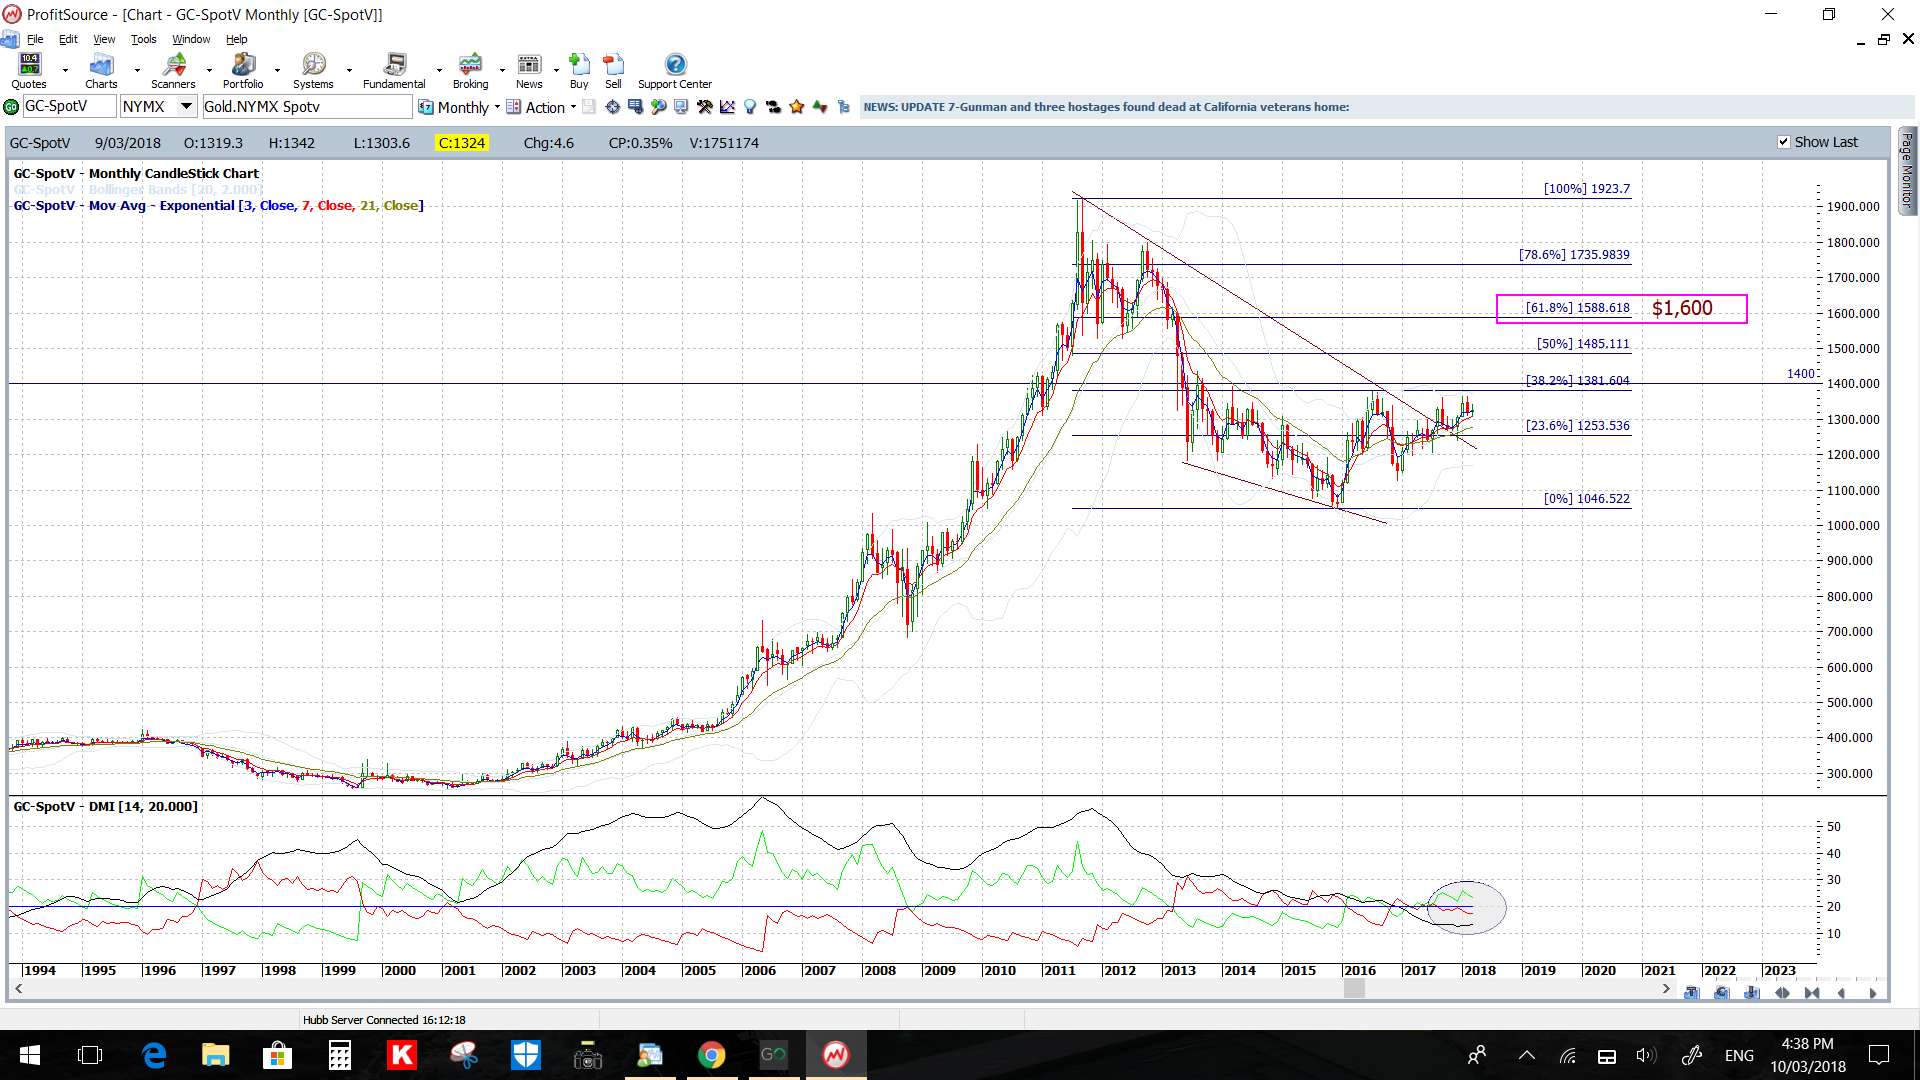
Bullish targets: Any bullish triangle breakout would have me looking for a test of the $1,400 S/R level and this would be worth over 650 pips so is well worth stalking.
Bearish targets: Any bearish triangle breakout would have me looking for a test of the $1,300 S/R level followed by the 4hr chart’s 61.8% fib that is near $1,285 and the daily 200 EMA.
- Watch the 4hr chart’s triangle trend lines for any new breakout.
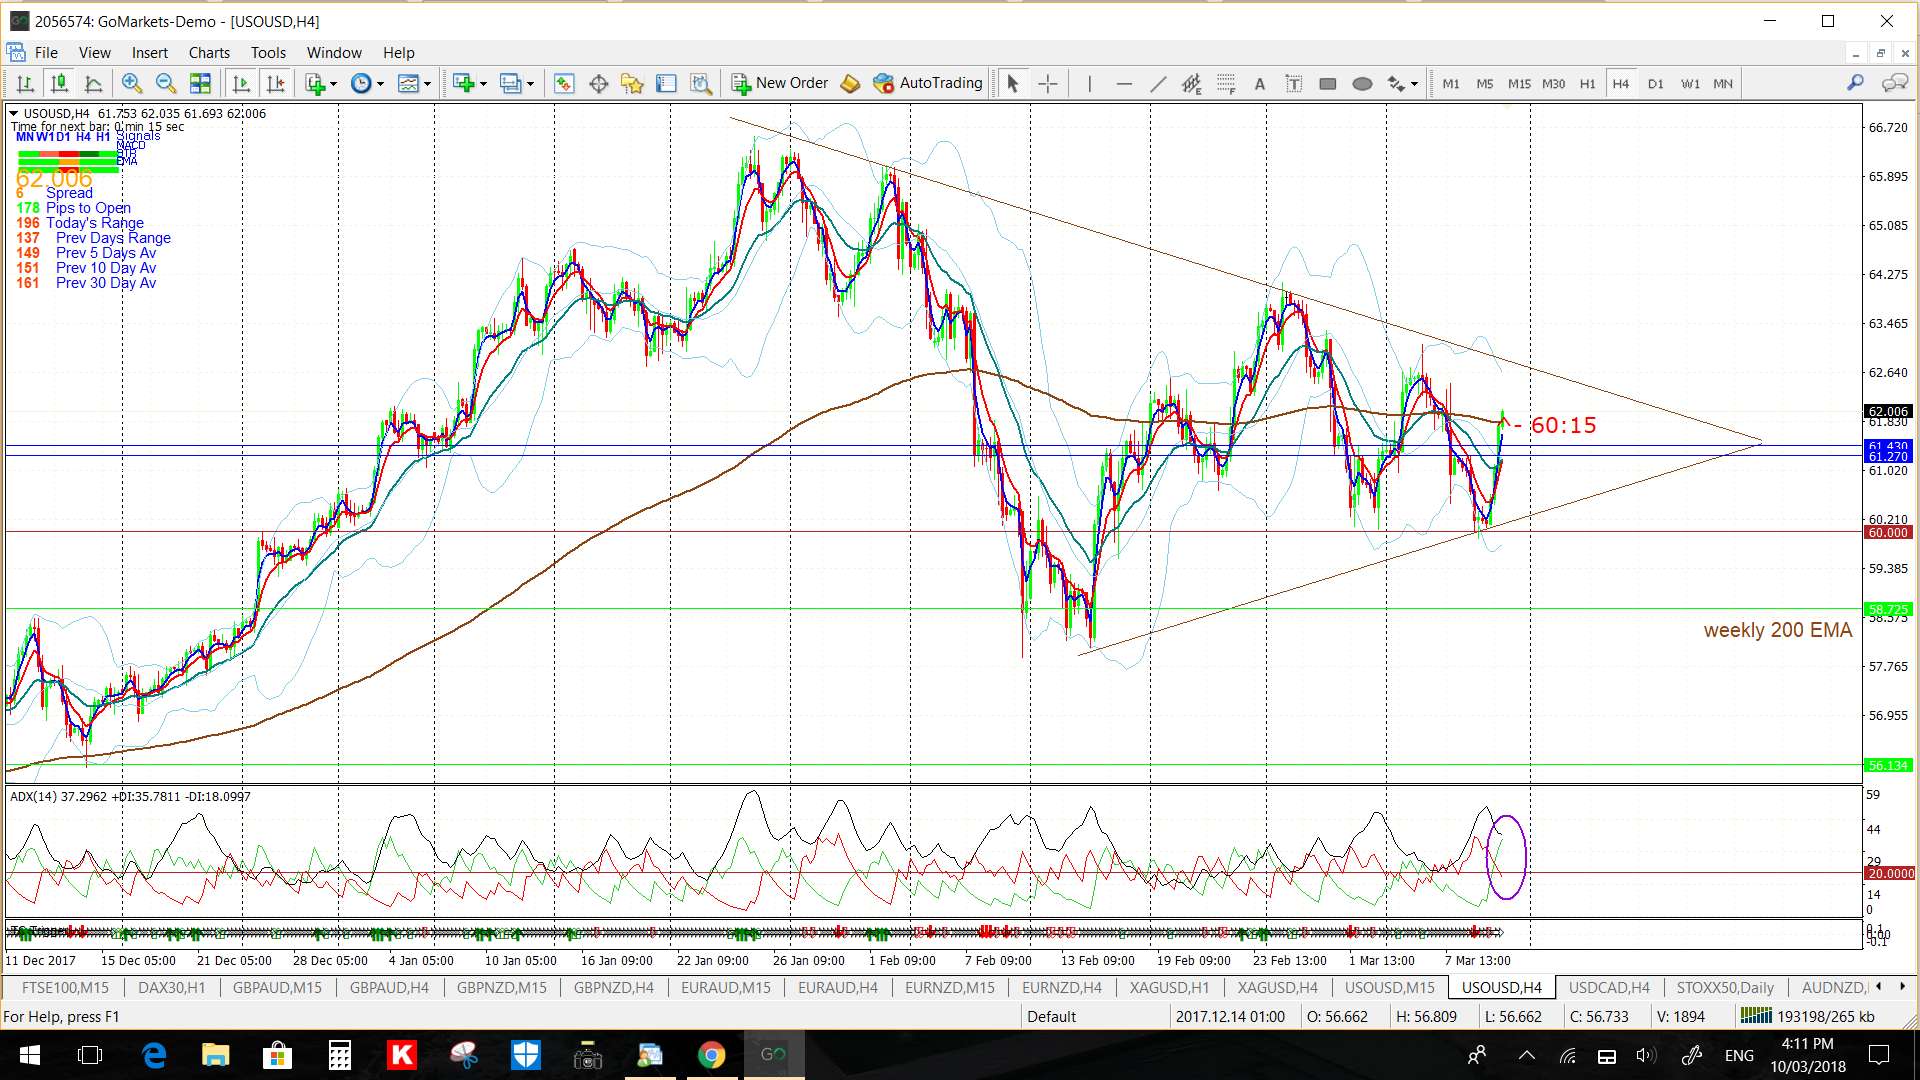
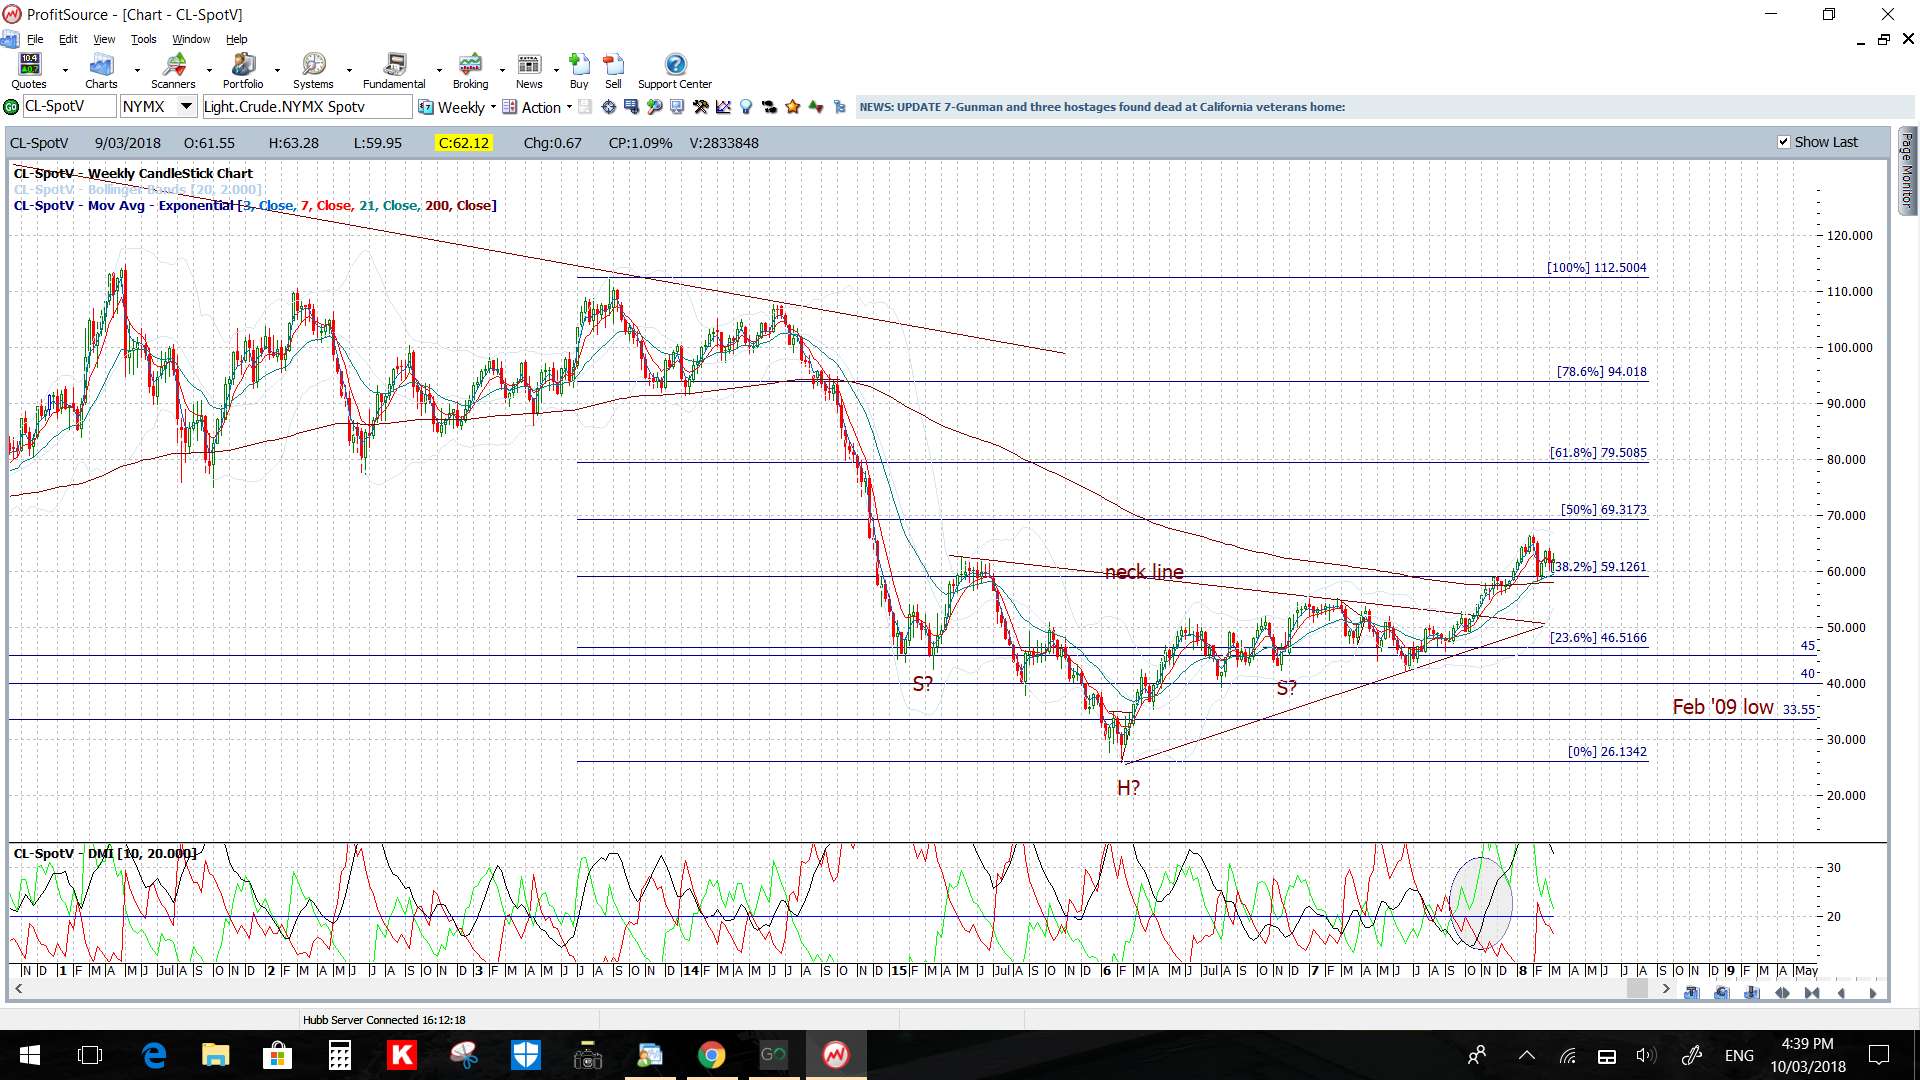
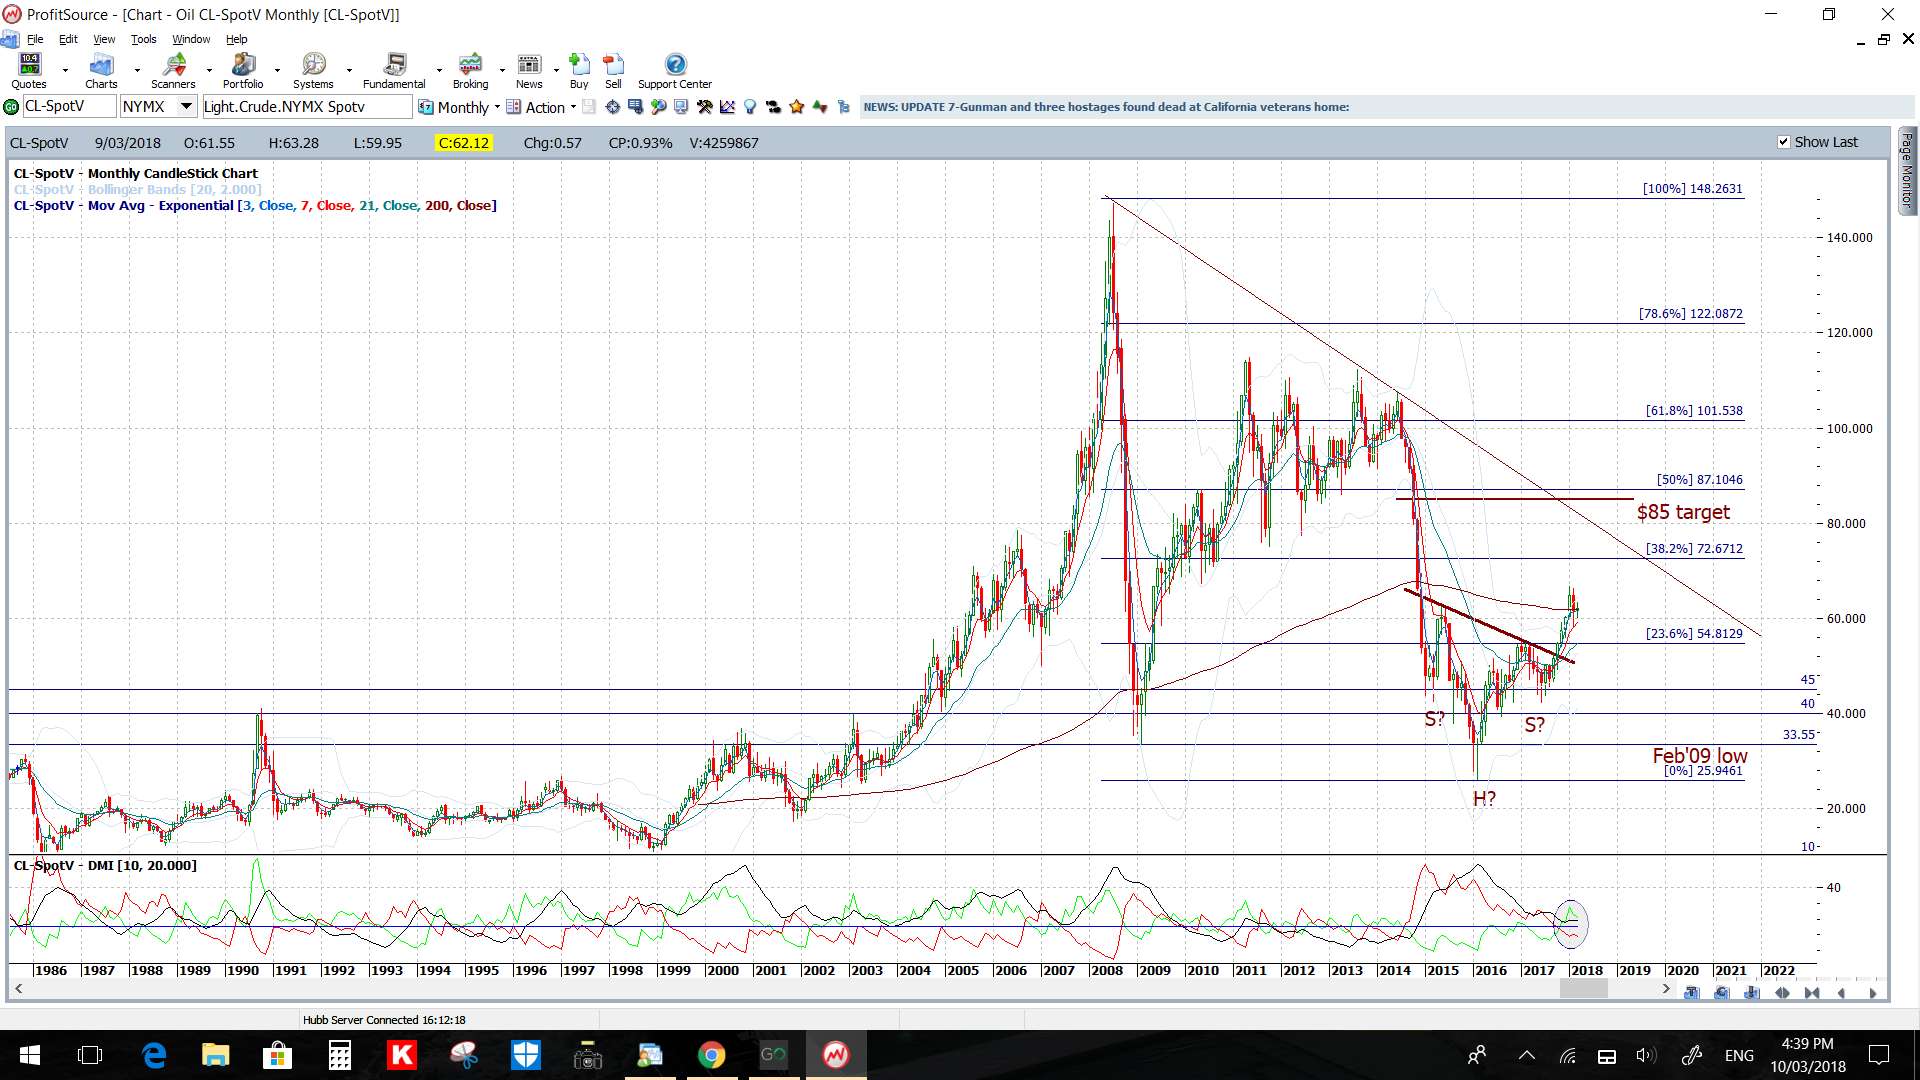
Oil: Oil is consolidating in a triangle above the $60 support level and weekly 200 EMA. Keep the bullish monthly-chart pattern in mind here when trading this commodity.
- Watch the 4hr chart’s triangle trend lines for any new breakout.