I have previously looked at the US$ index as forming up within a Bull Flag but recent price action suggests another possibility here now. Read on!
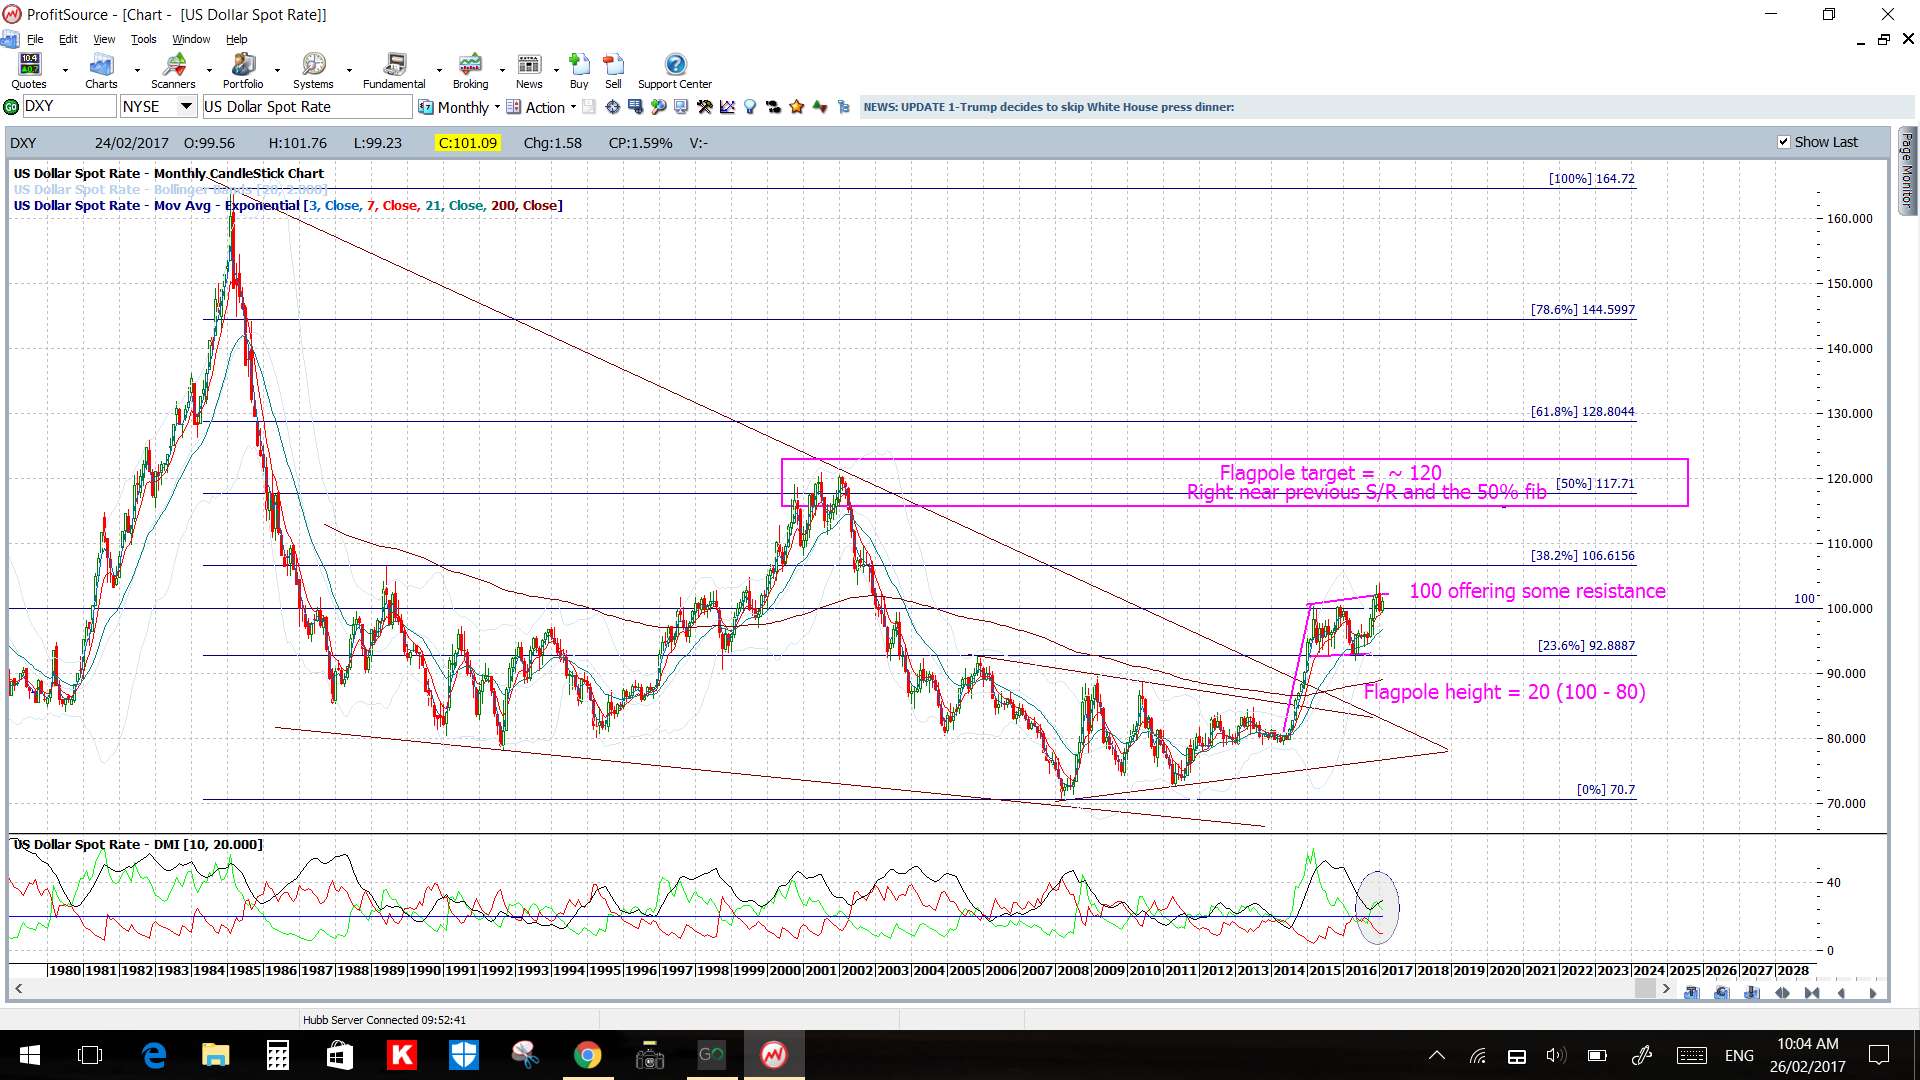
DXY monthly: I’ve previously looked at this consolidation as a potential Bull Flag with a target up near 120. The target was been calculated as follows: the height of the Flag pole of the Bull Flag is about 20 units (100 – 80 = 20). Extrapolating up 20 from the top of the Bull Flag, as per Bull Flag breakout technical theory, puts price up in the vicinity of the 120 area. This happens to be a key region for two reasons: Firstly, this is the 50% fib of the 1985-2008 major swing low move and, secondly, this is a previous S/R region with price action reacting here for over a two year period from mid-2000 to mid-2002.
DXY weekly: However, recent price action is now showing this consolidation as shaping up in more of a symmetrical wedge rather that the classic-style Bull Flag:
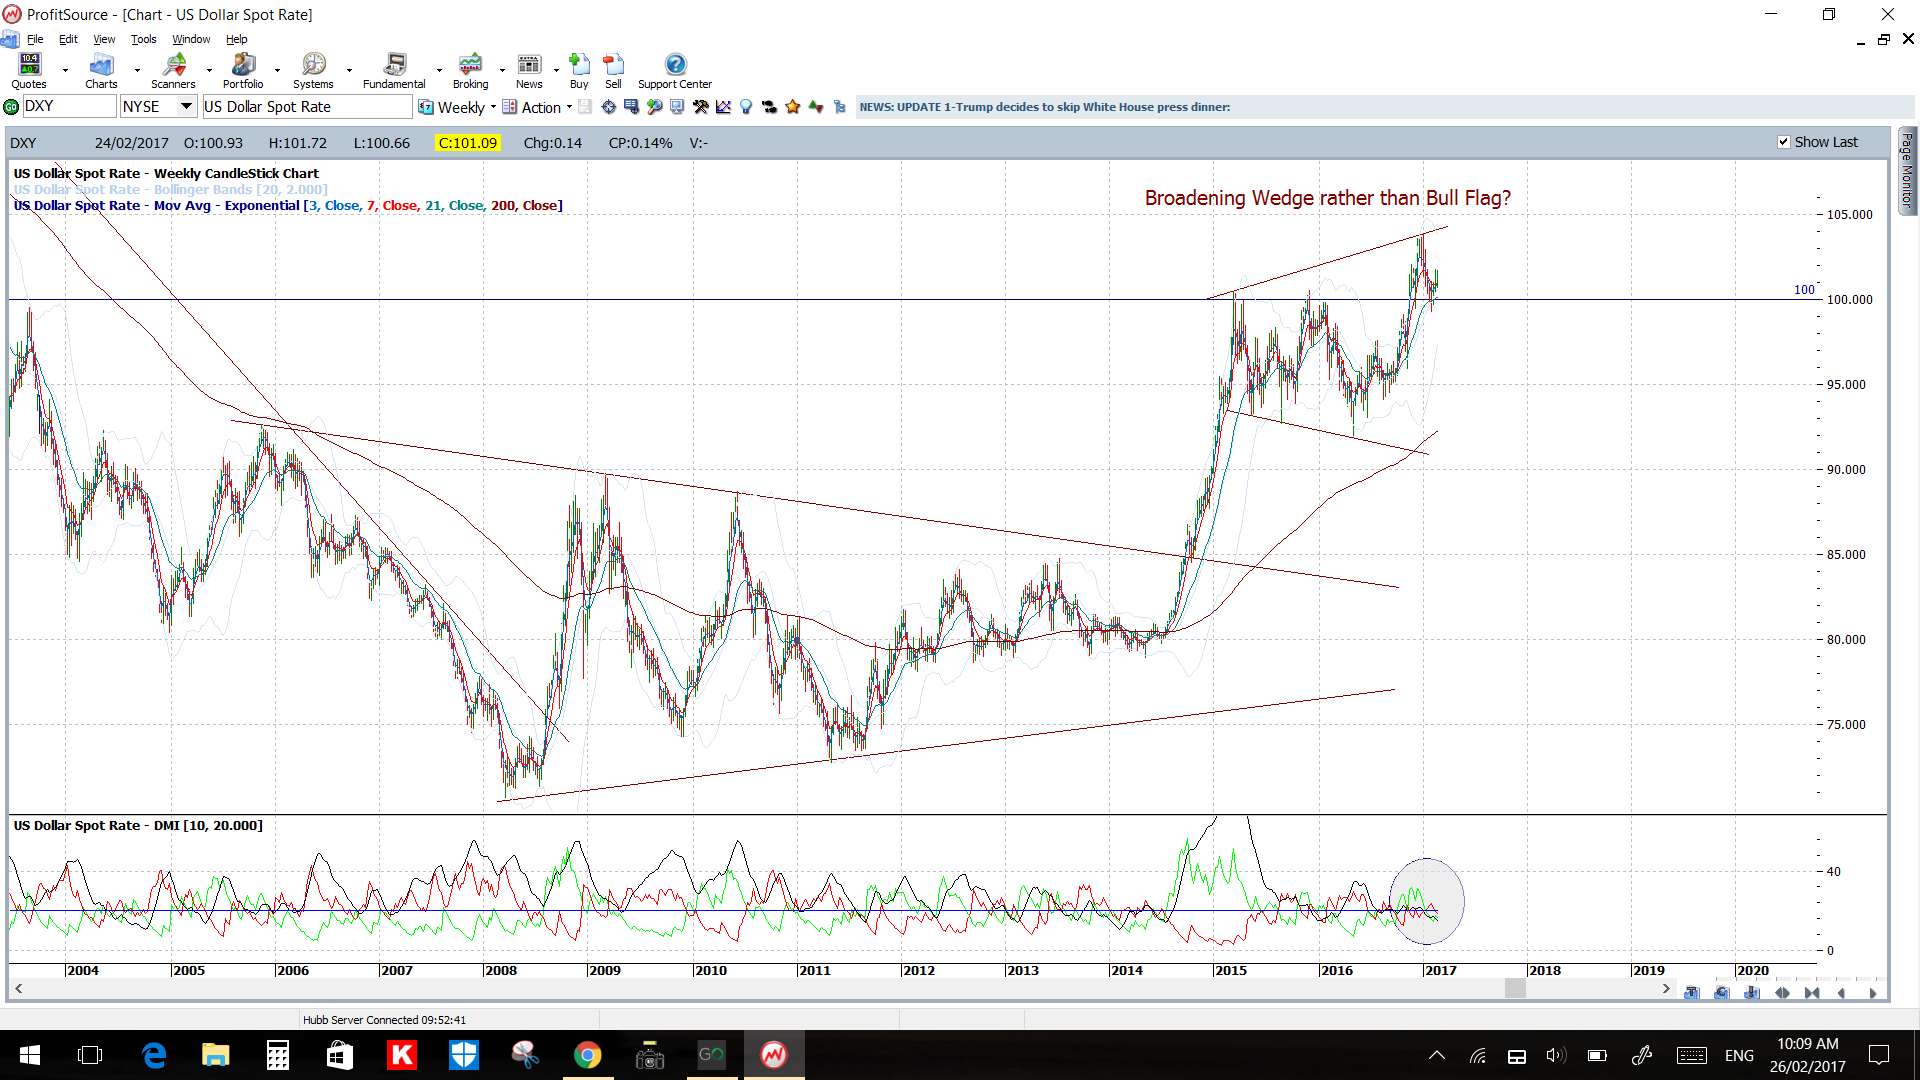
This is a subtle but important difference as Bull Flags more often than not follow through as bullish. However, with symmetrical wedge breakouts my search results suggest varied outcomes. This site suggests the breakouts are random and as as likely to be bearish as bullish. However, some searched images denote symmetrical wedges as potential reversal patterns, as per the images below:


Summary: The US$ index weekly chart is now showing price action forming up in a symmetrical broadening wedge where breakouts, at best, can be described as random. Traders who may have formed a bullish bias based on previous price action of the DXY would benefit from reviewing their charts and keeping an open mind about future price direction for the index.
The post DXY: maybe a Wedge not Bull Flag? appeared first on Trade Charting.
The post DXY: maybe a Wedge not Bull Flag? appeared first on www.forextell.com.