Last week: Despite the shorter week there were still plenty of trend line breakout trades that triggered and with many more setting up for the shortened Easter week ahead. The concept of World Peace was once parodied in Miss Congeniality and one can’t help but feel we need a good dose of this right now. My thoughts are with the people in Turkey this weekend in what I hope will be a safe and peaceful Referendum.

Successful trend line breakout trades were noted throughout the week and summarised in posts here and here. The final pip tally on these trades are noted below:
- Gold: 210 pip.
- EUR/JPY: 170 pips.
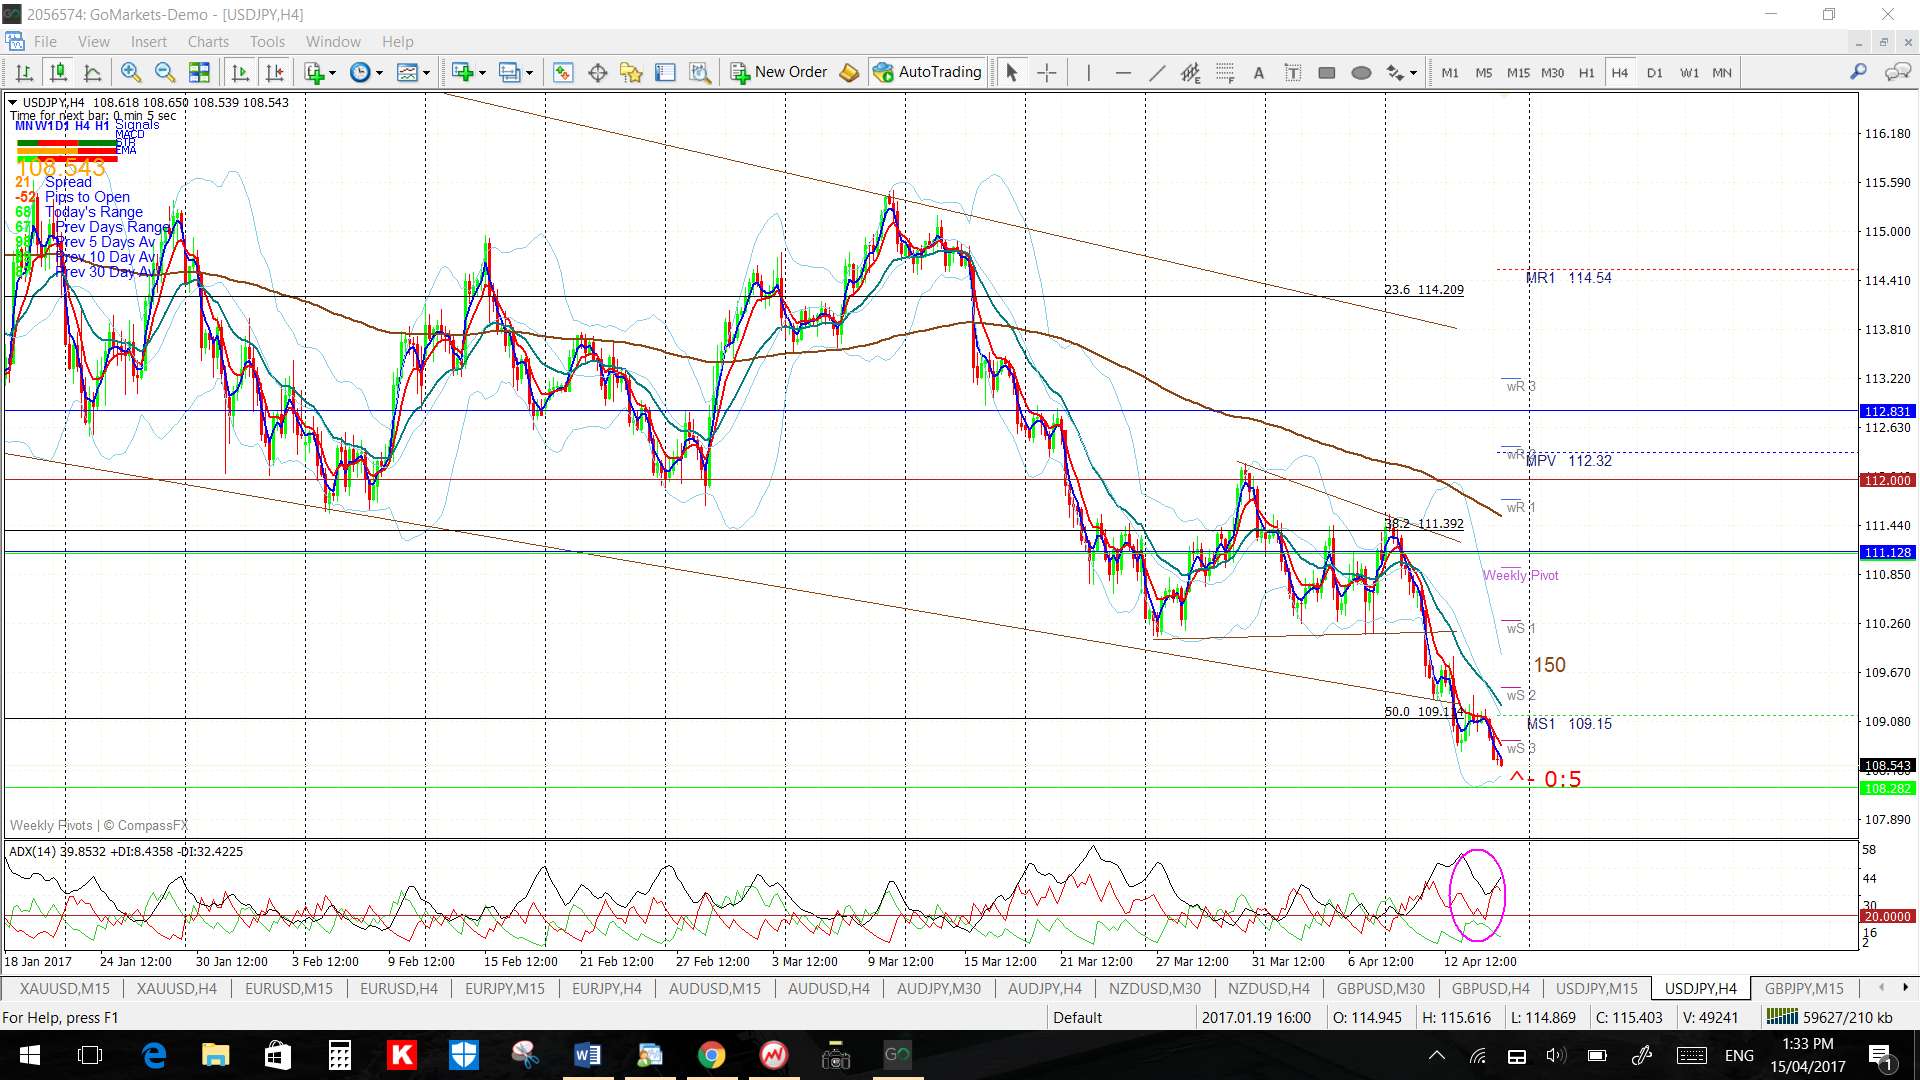
- USD/JPY: 150 pips.
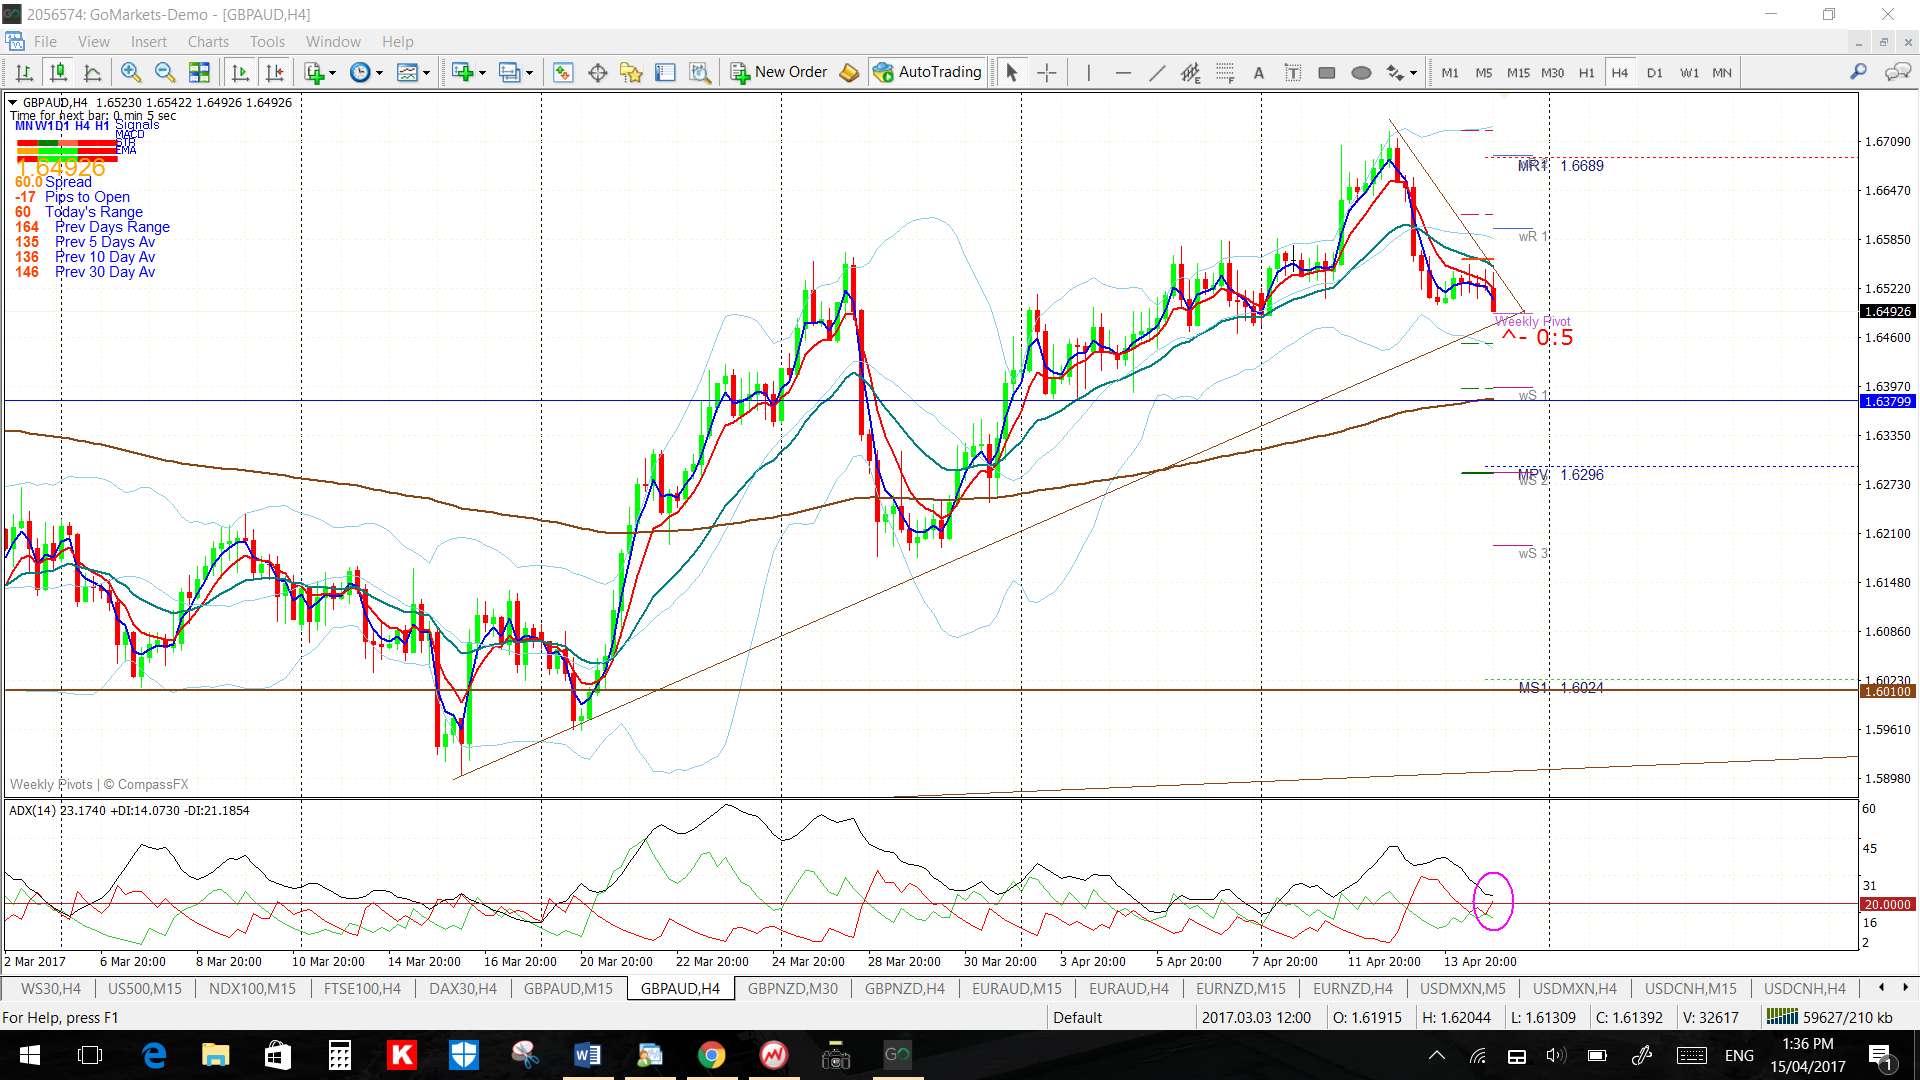
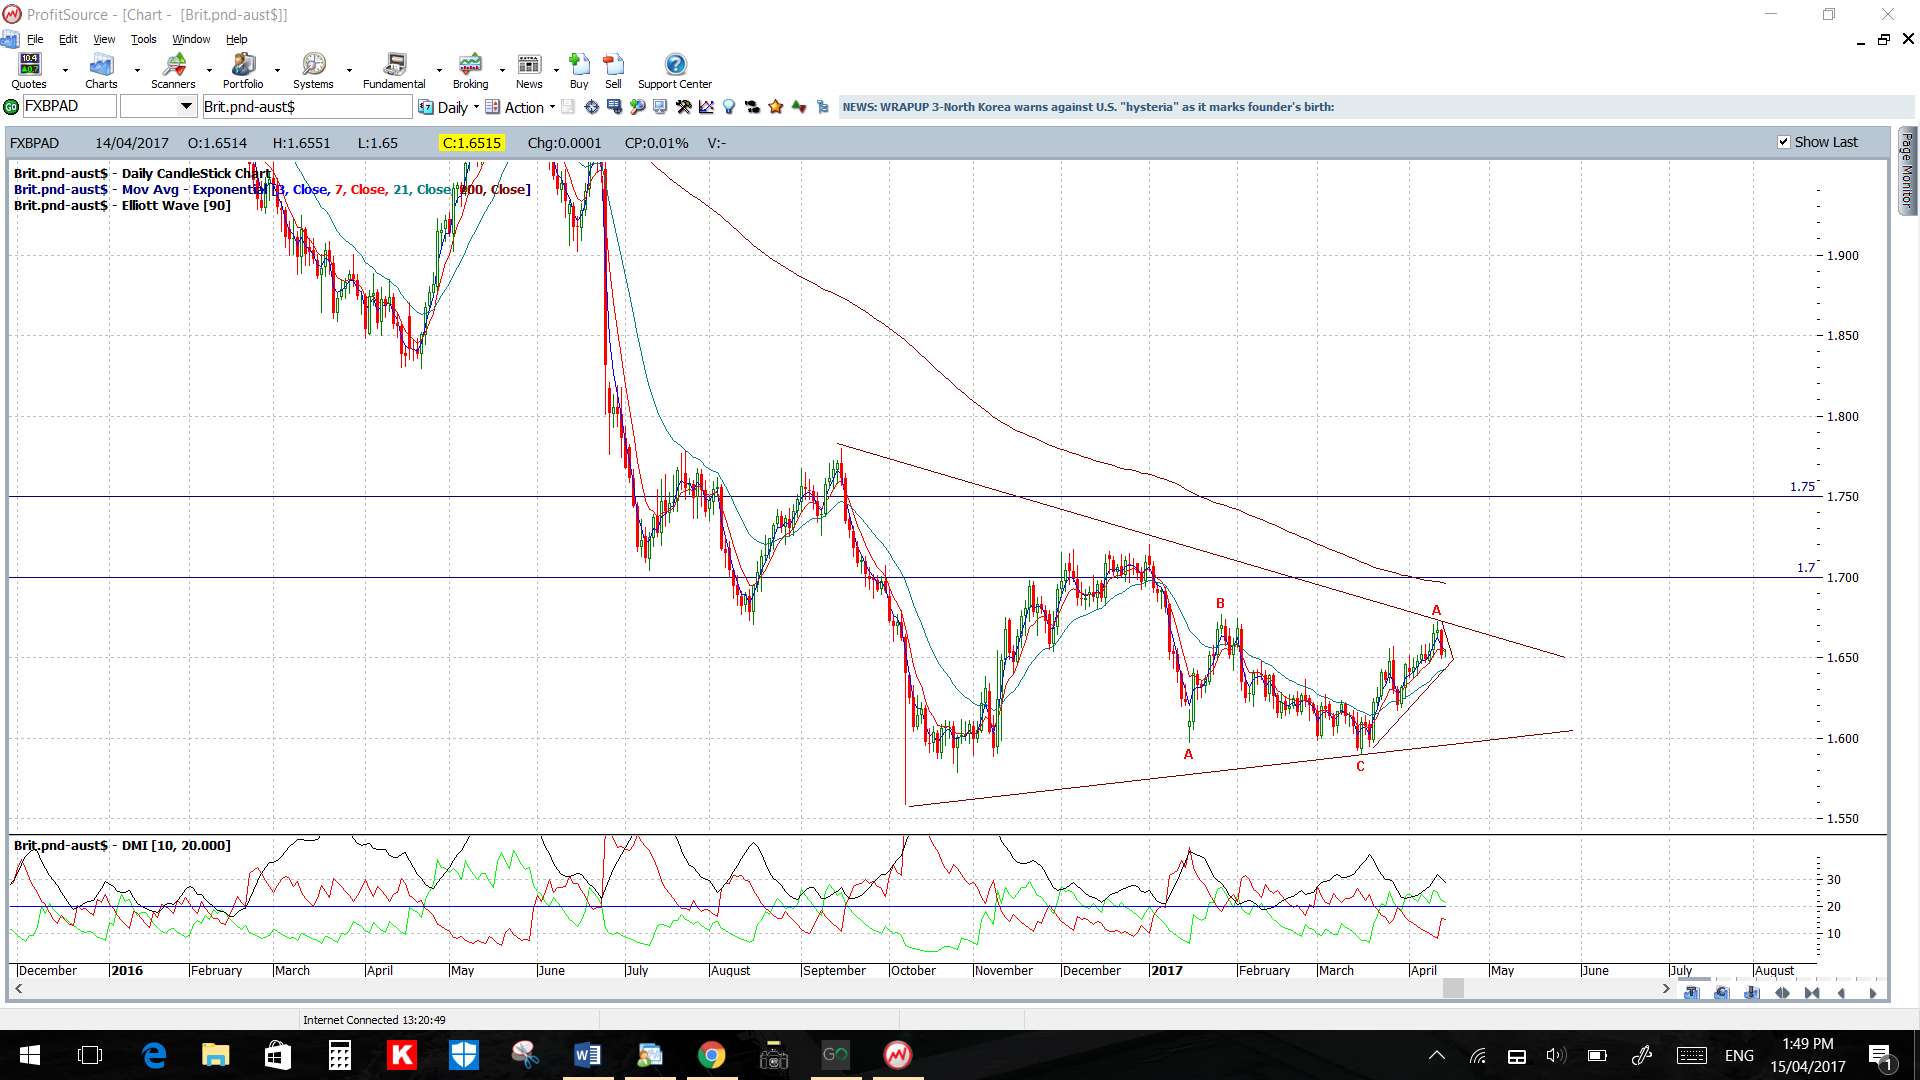
- GBP/AUD: 140 pips.
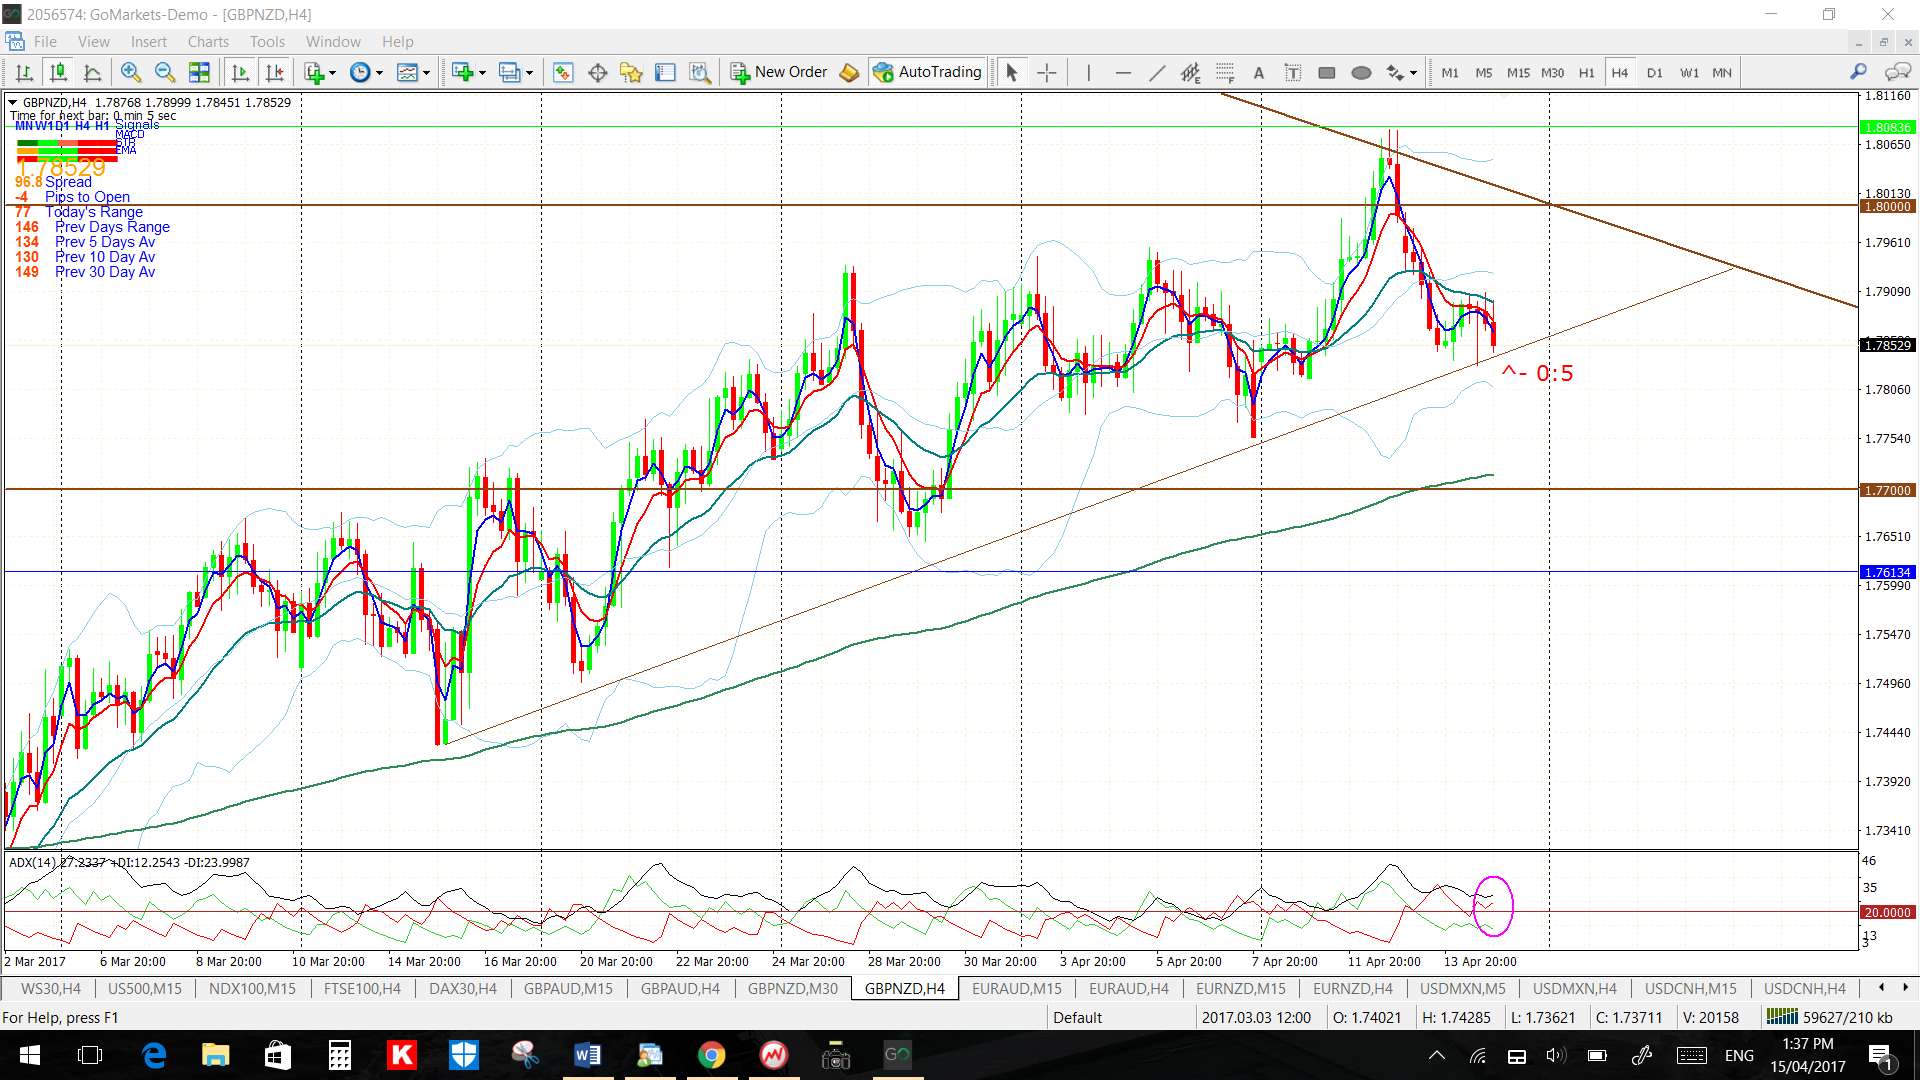
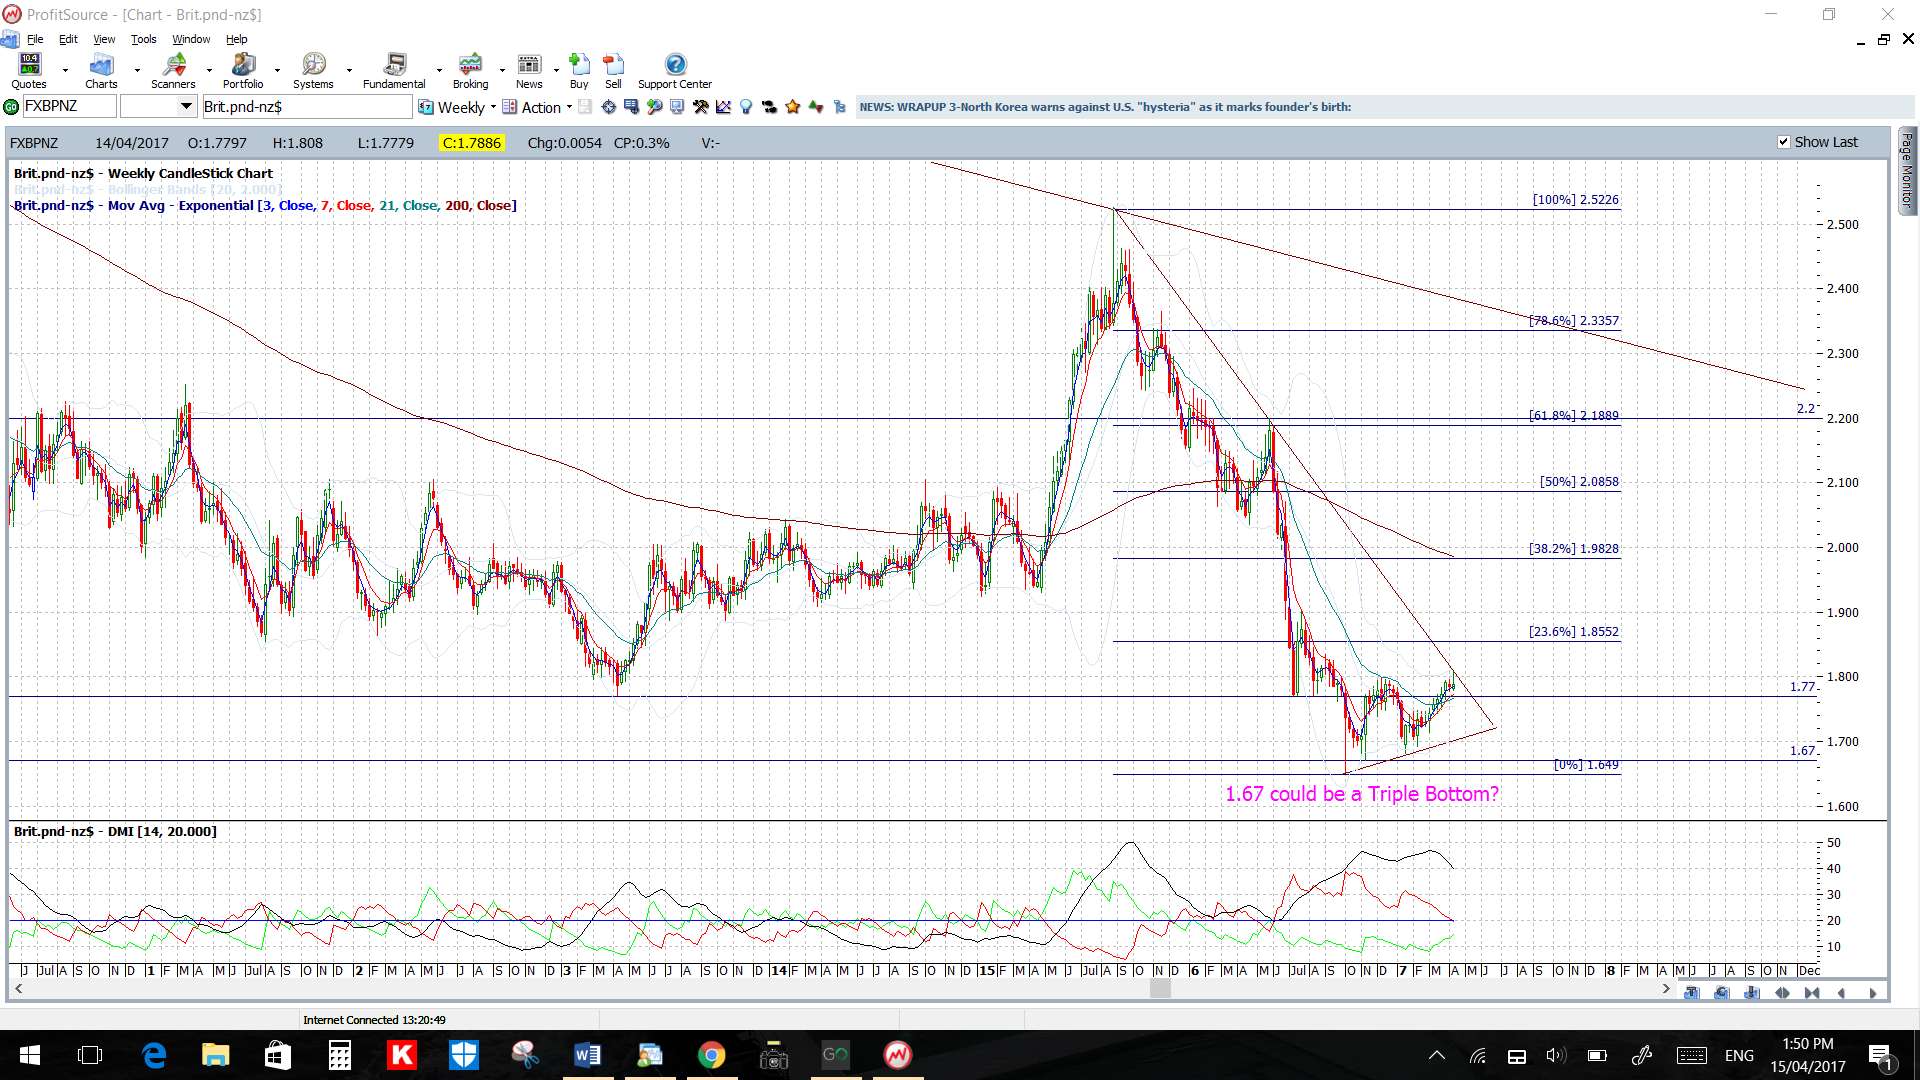
- GBP/NZD: 200 pips.
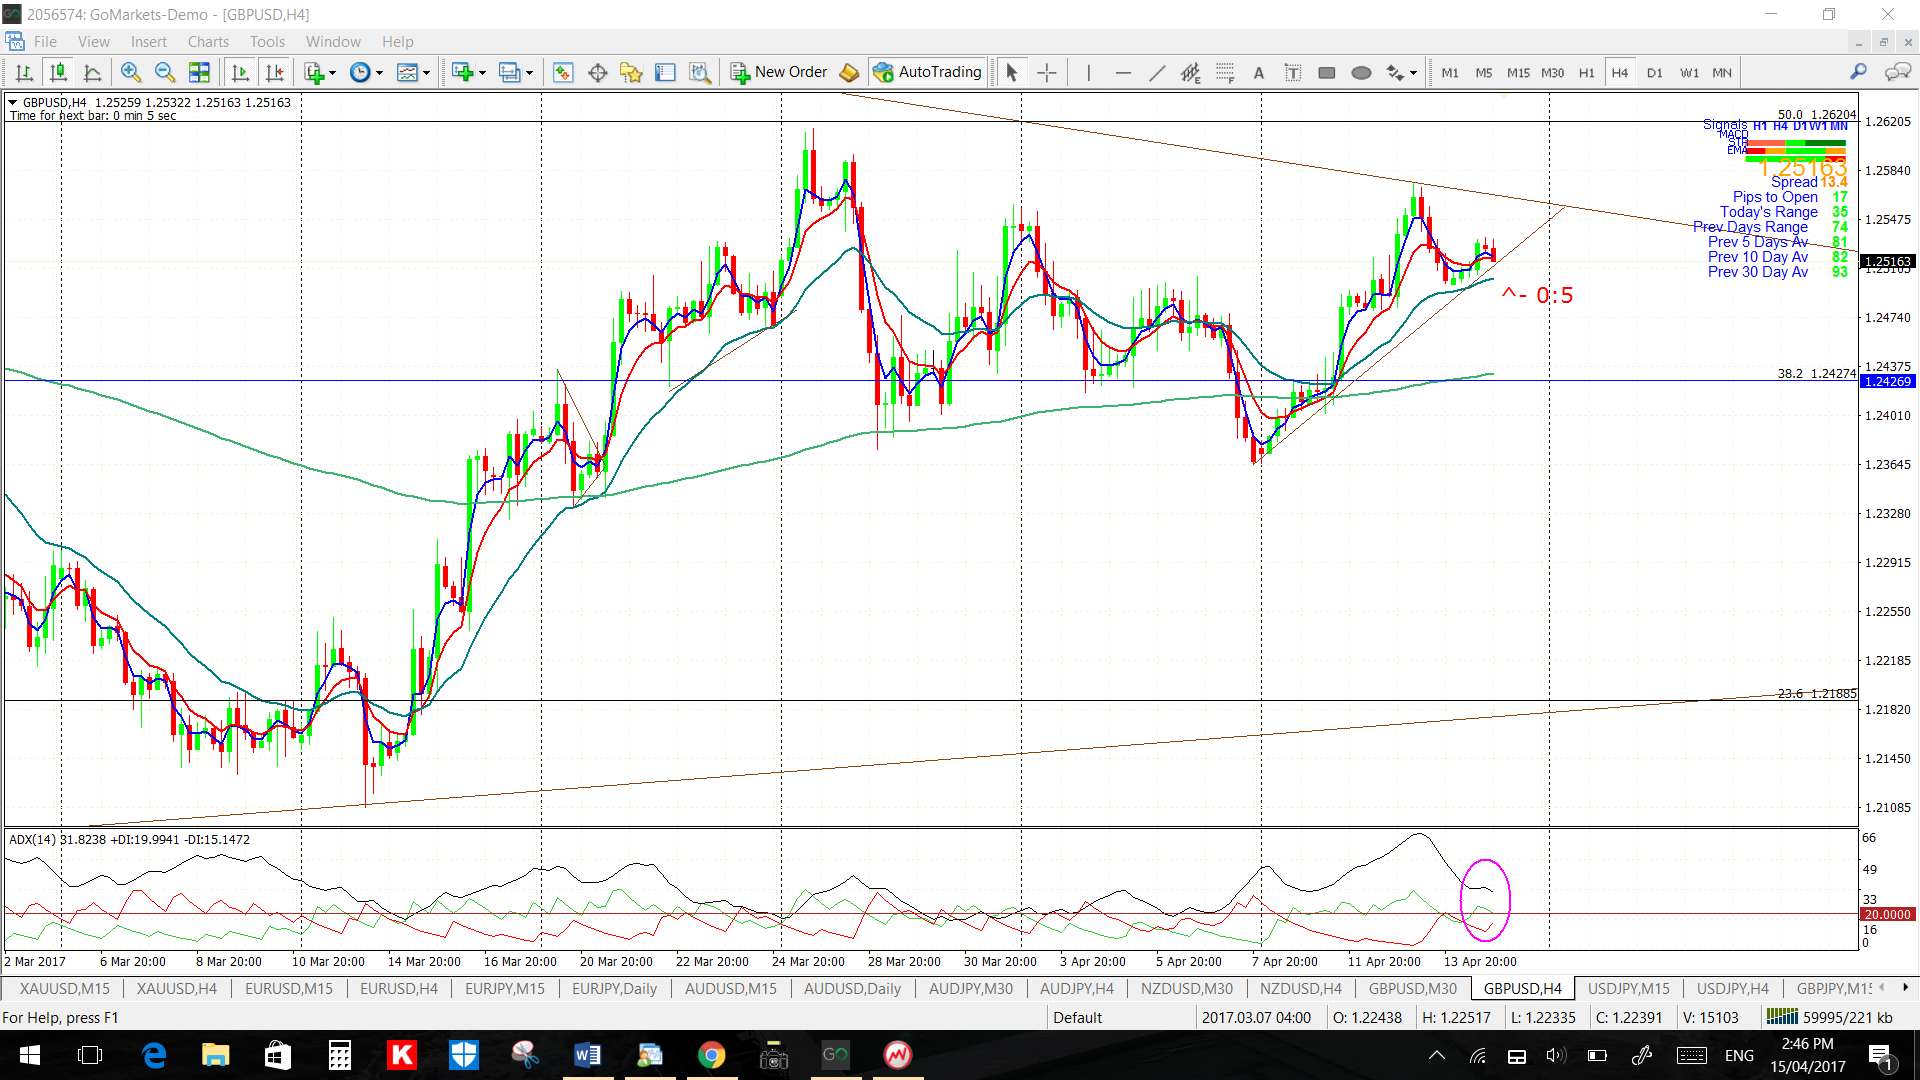
- GBP/USD: 100 pips.
- GBP/JPY: 100 pips.
Next Week:
- Monday: Monday is a holiday in many parts of the world so expect lighter trading volumes.
- US$: could come under a bit of pressure following last week’s activity so watch the key 100 level for any make or break activity. A review of the FX Indices can be found through this link.
- Turkish Referendum: the Turkish Referendum is on Sunday so watch for impact on the USD/TRY in coming sessions.
- TC Trigger: this newly programmed indicator is helping with my analysis and continues to be a work in progress.
- Gold and Silver: are both up at 6-year bear trend lines and have been reviewed in a separate post that can be found through this link.
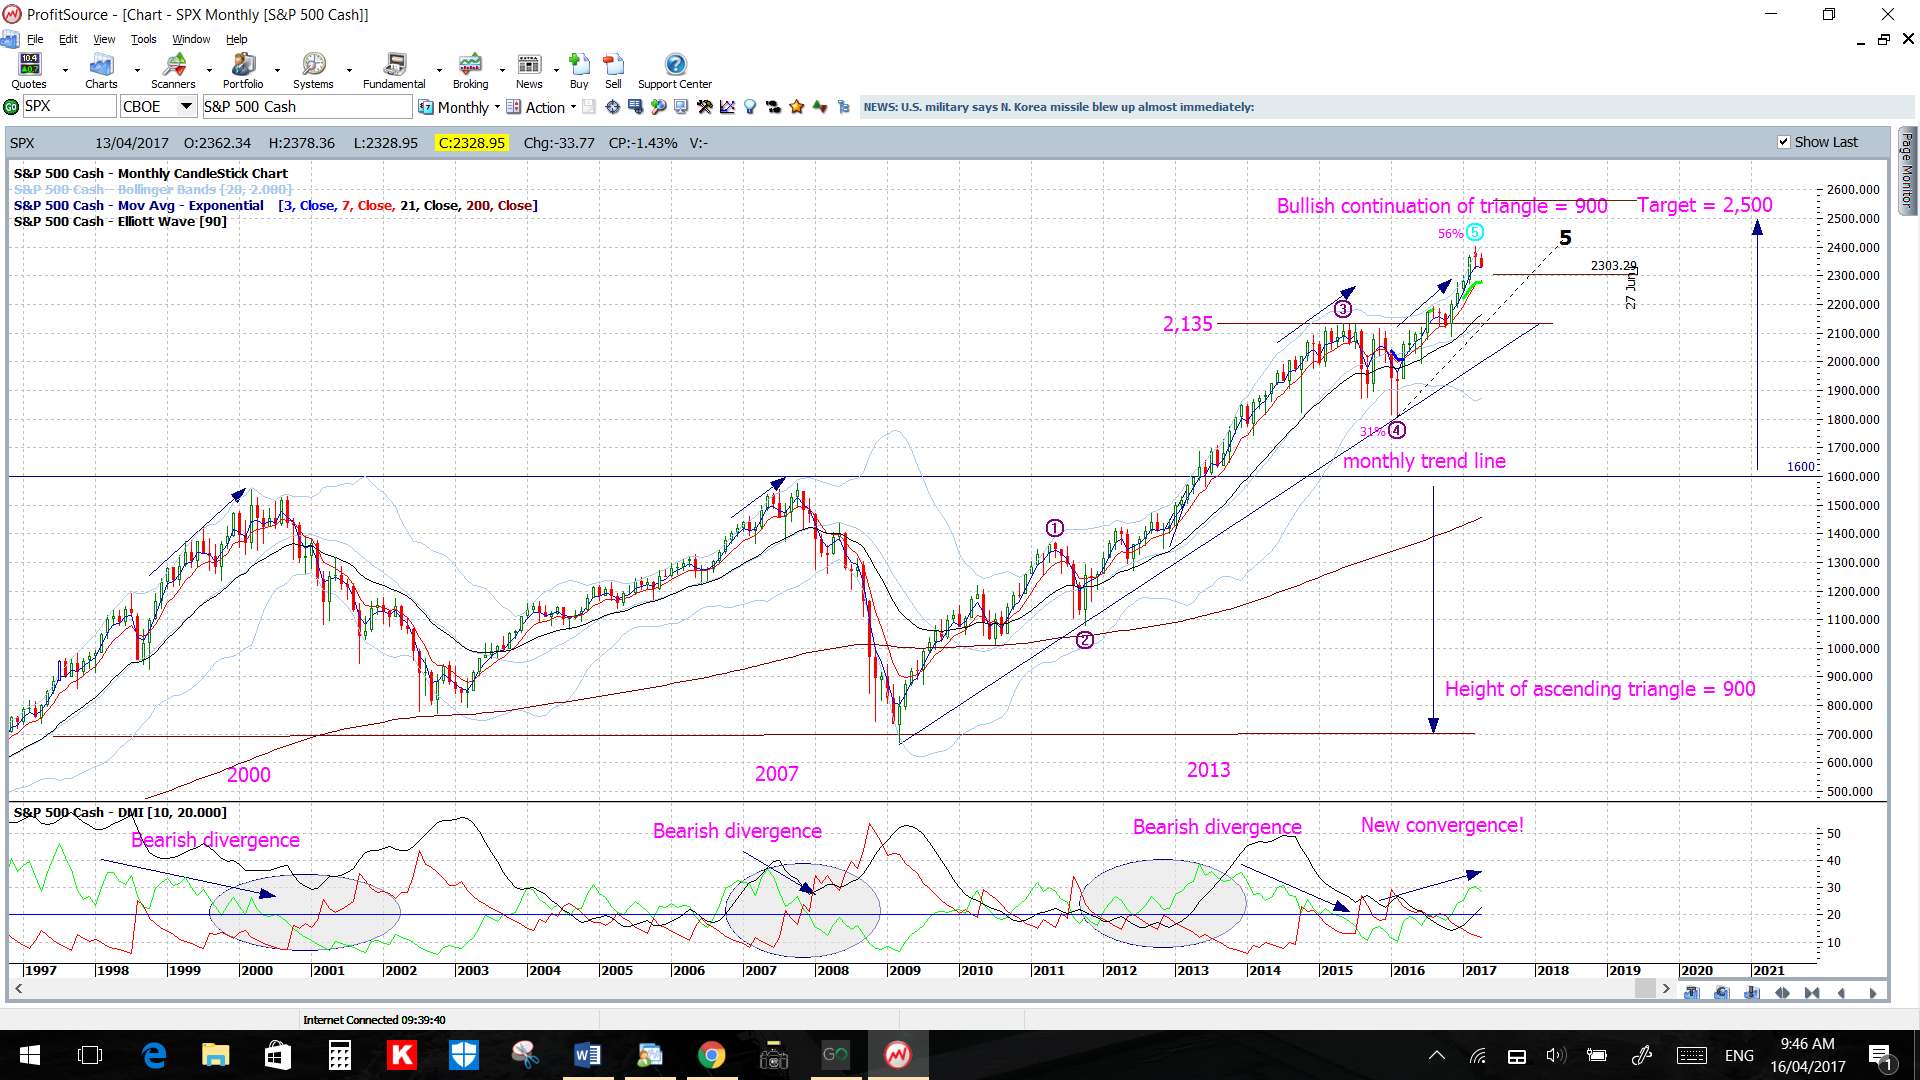
- Risk appetite? The S&P500 monthly chart is currently forming up with a rounding out / topping style pattern after, essentially, completing the 900 point monthly-chart ascending triangle breakout move. I do believe that we are in the bottom section of the next new multi-year trading range however a technical test of the bottom of this range at 1,600 would not surprise me. I had previously wondered what global event(s) could possibly trigger such a deep pullback but, with the developments in North Korea and Syria and various Election and Referendum events, there seems to be a raft to choose from of late.
S&P500 monthly chart:
 S&P500 multi-year chart:1,600 is bottom of the new trading range:
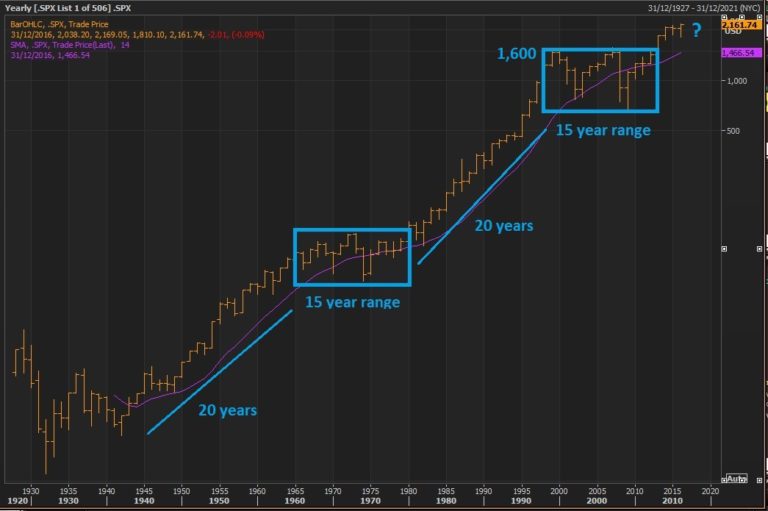
- This update is just a brief one given the Easter weekend.
Calendar:
- Mon 17th: Bank Holiday: AUD, NZD, CHF, EUR & GBP. CNY GDP & Industrial Production. JPY BoJ Gov Kuroda speaks.
- Tue 18th: AUD Monetary Policy Meeting Minutes. USD Building Permits. NZD GDT Price Index data.
- Wed 19th: USD Crude Oil Inventories.
- Thurs 20th: NZD CPI. USD Philly Fed Manufacturing Index, Weekly Unemployment Claims & US Treasury Secretary speaks. GBP BoE Gov Carney speaks (x2).
- Fri 21st: GBP Retail Sales. CAD CPI.
- Sat 22nd: OPEC /IMF meetings.
Forex:
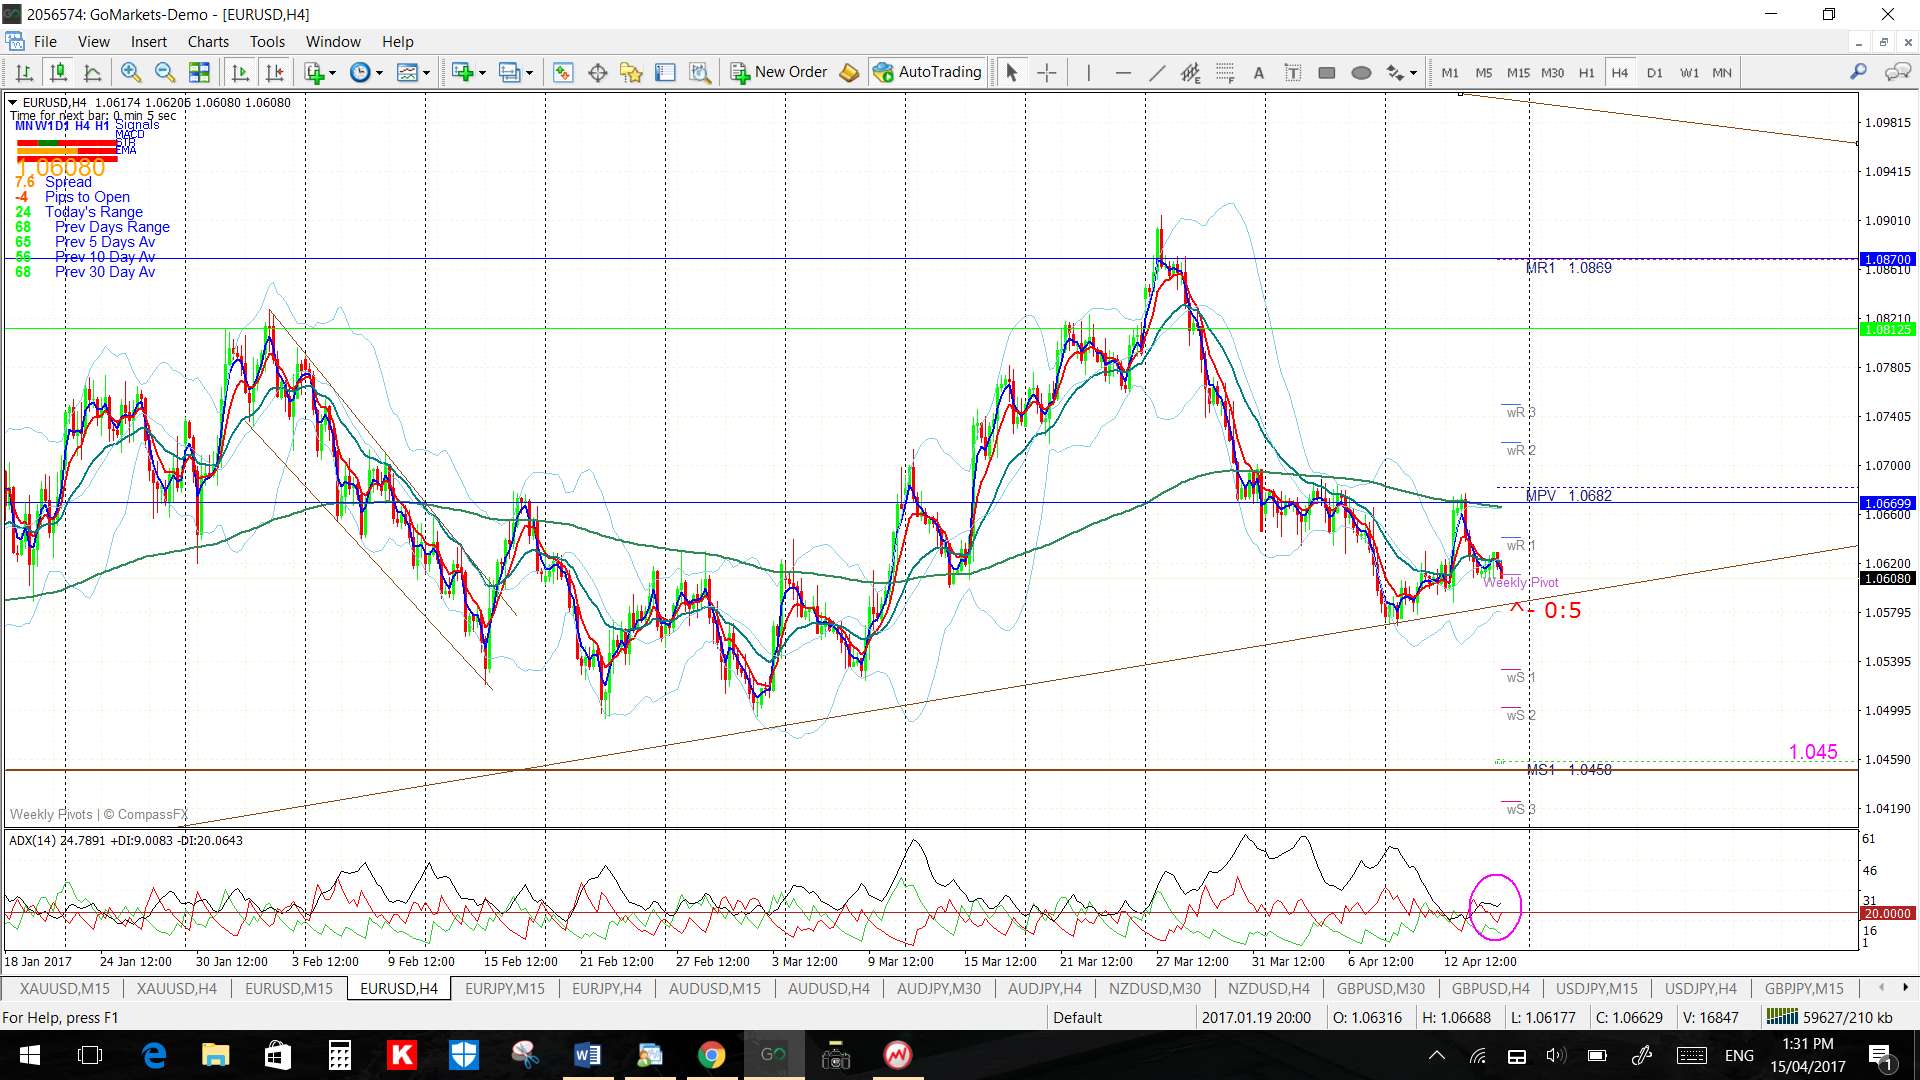
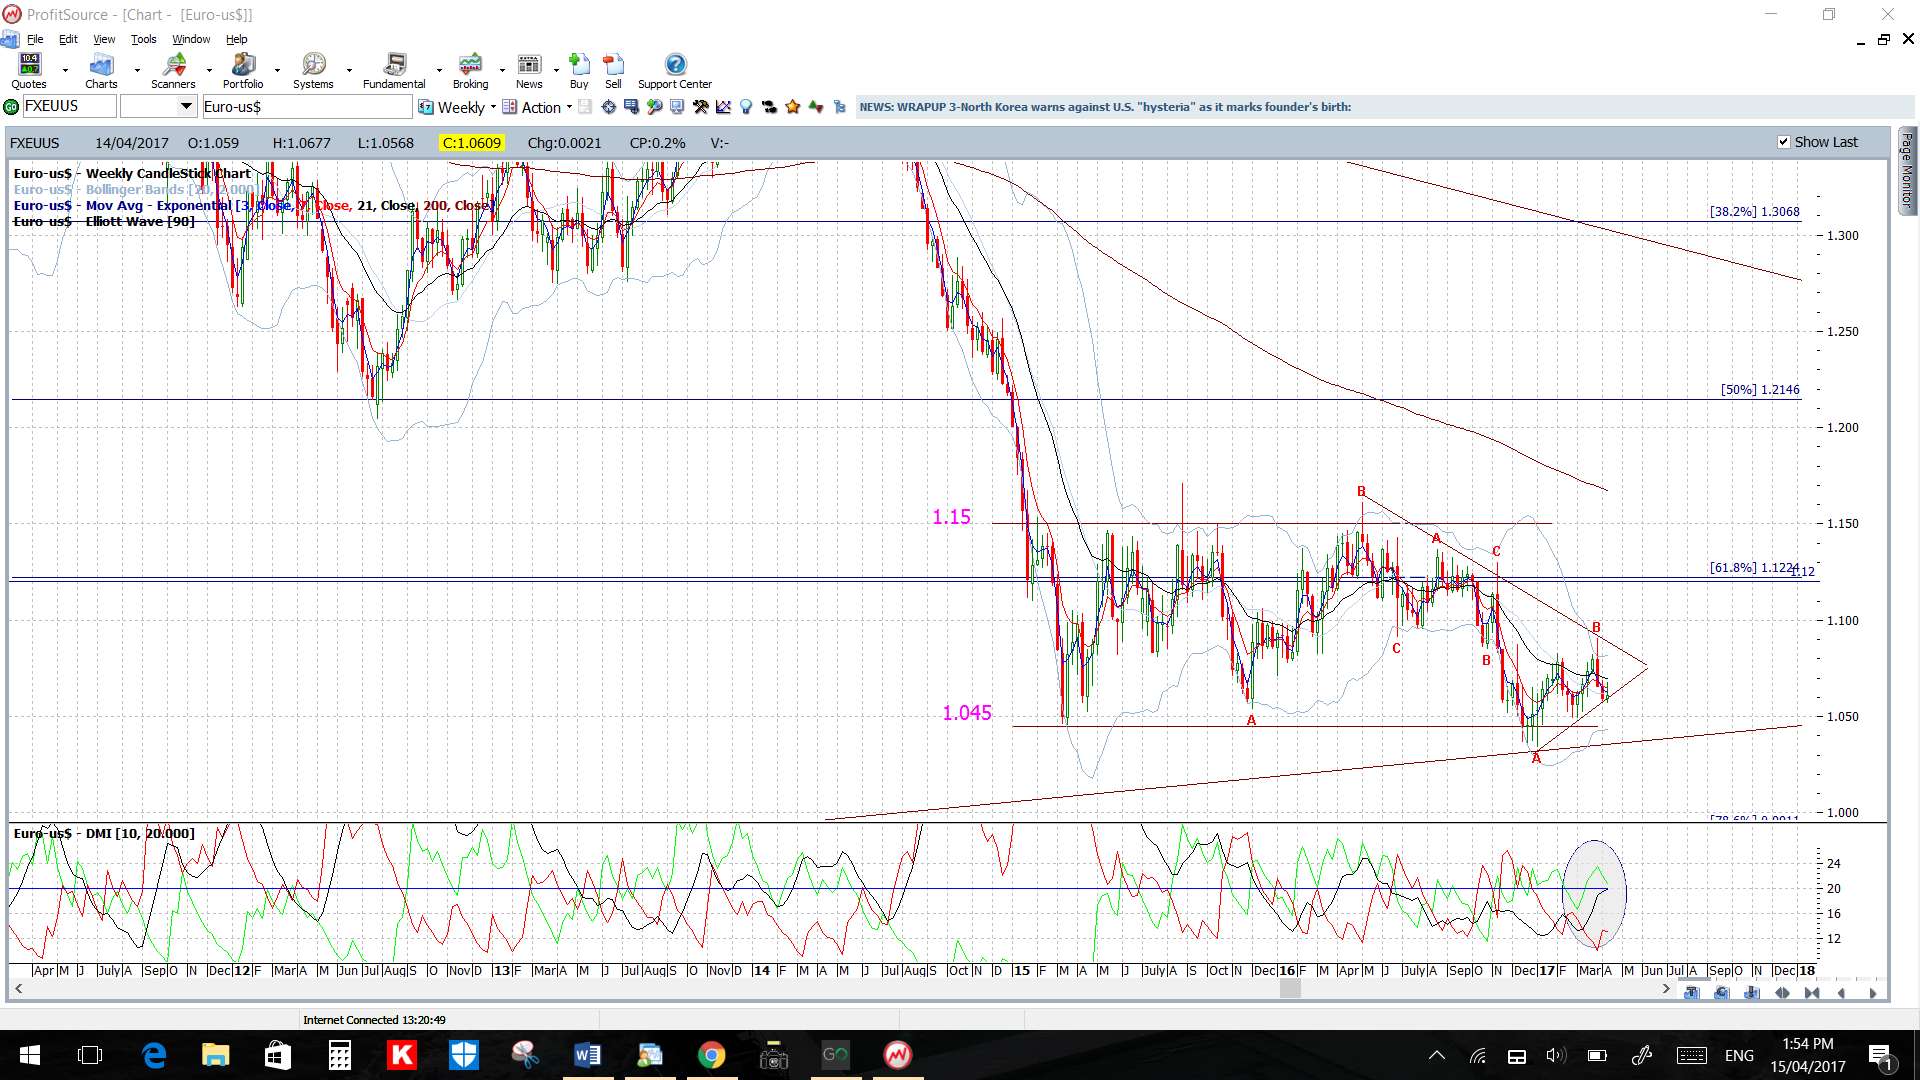
EUR/USD: Watch the daily chart’s triangle trend lines for any make or break activity:
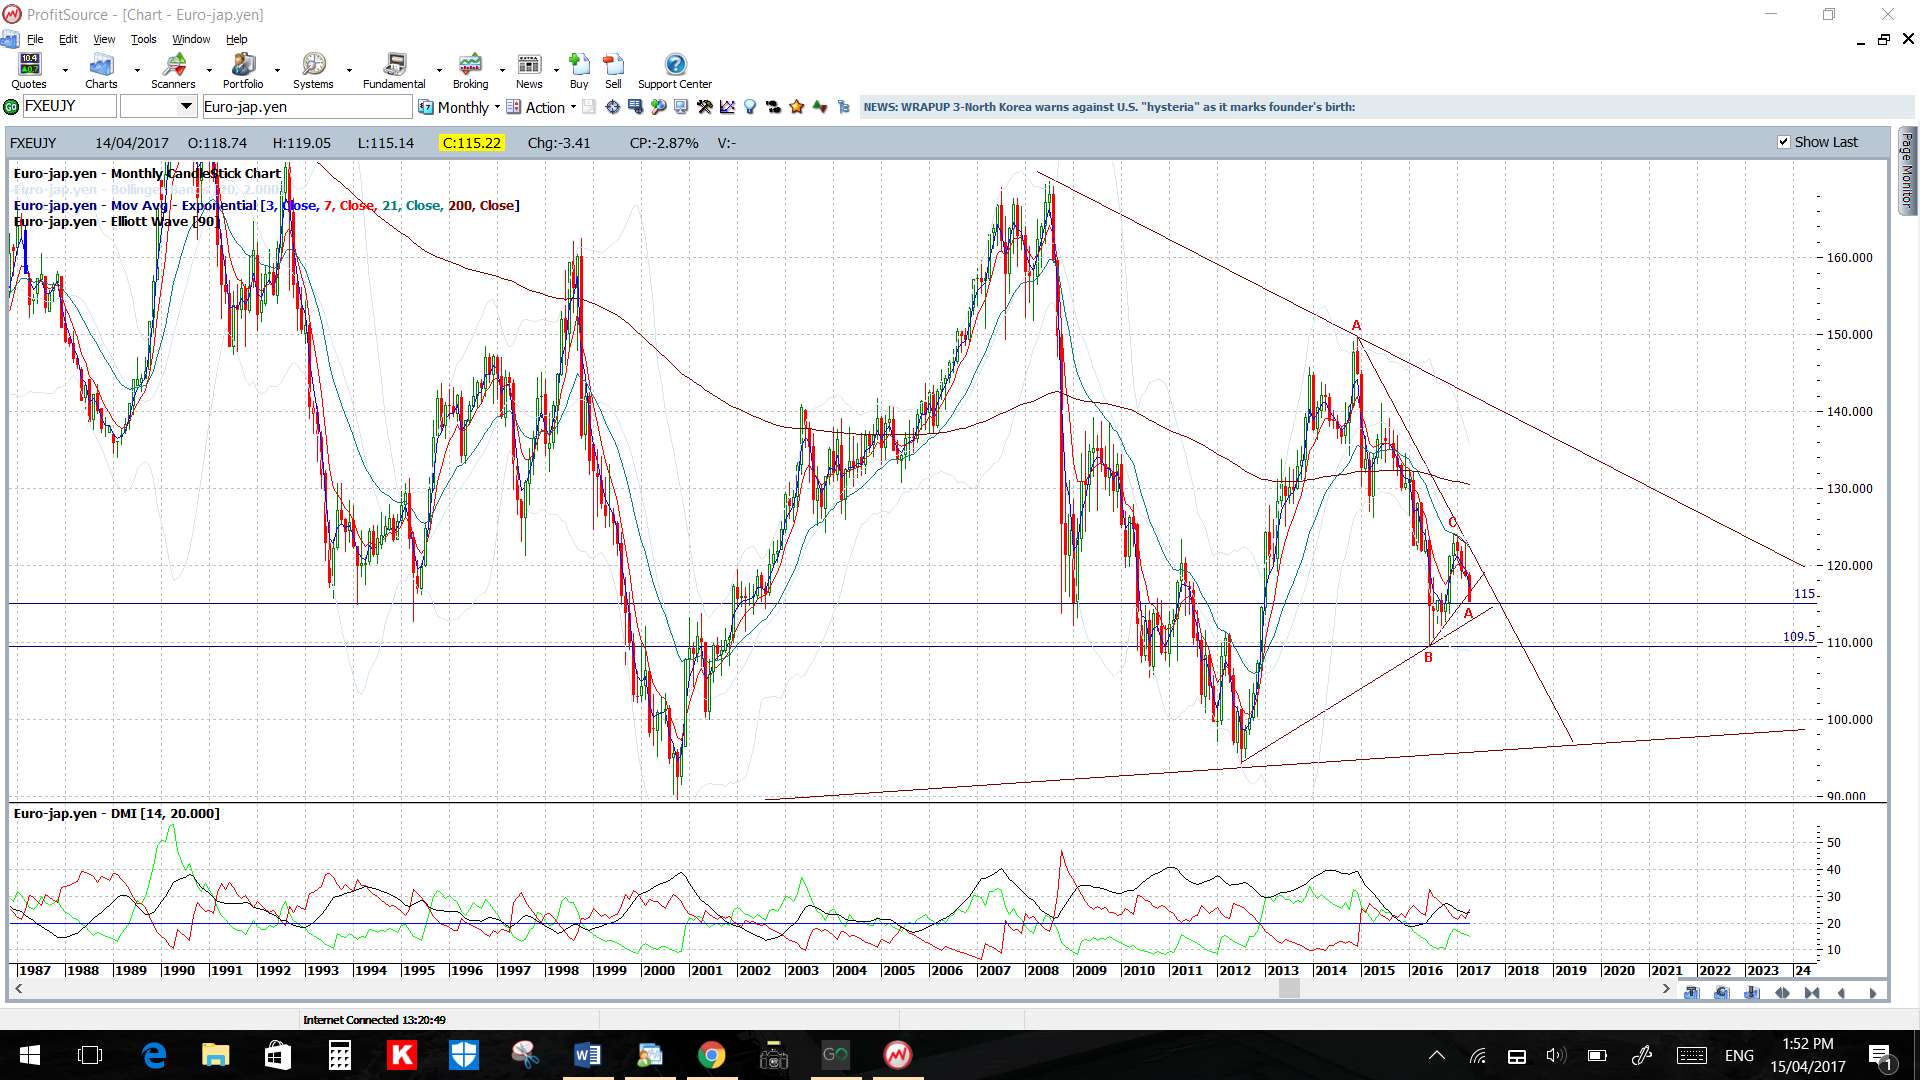
EUR/JPY: This has broken the daily chart’s triangle support trend line but watch for any support from the previous S/R level of 115. Any break and hold below 115 will have me looking at the next triangle support trend line; which is about 150 pip below the 115:

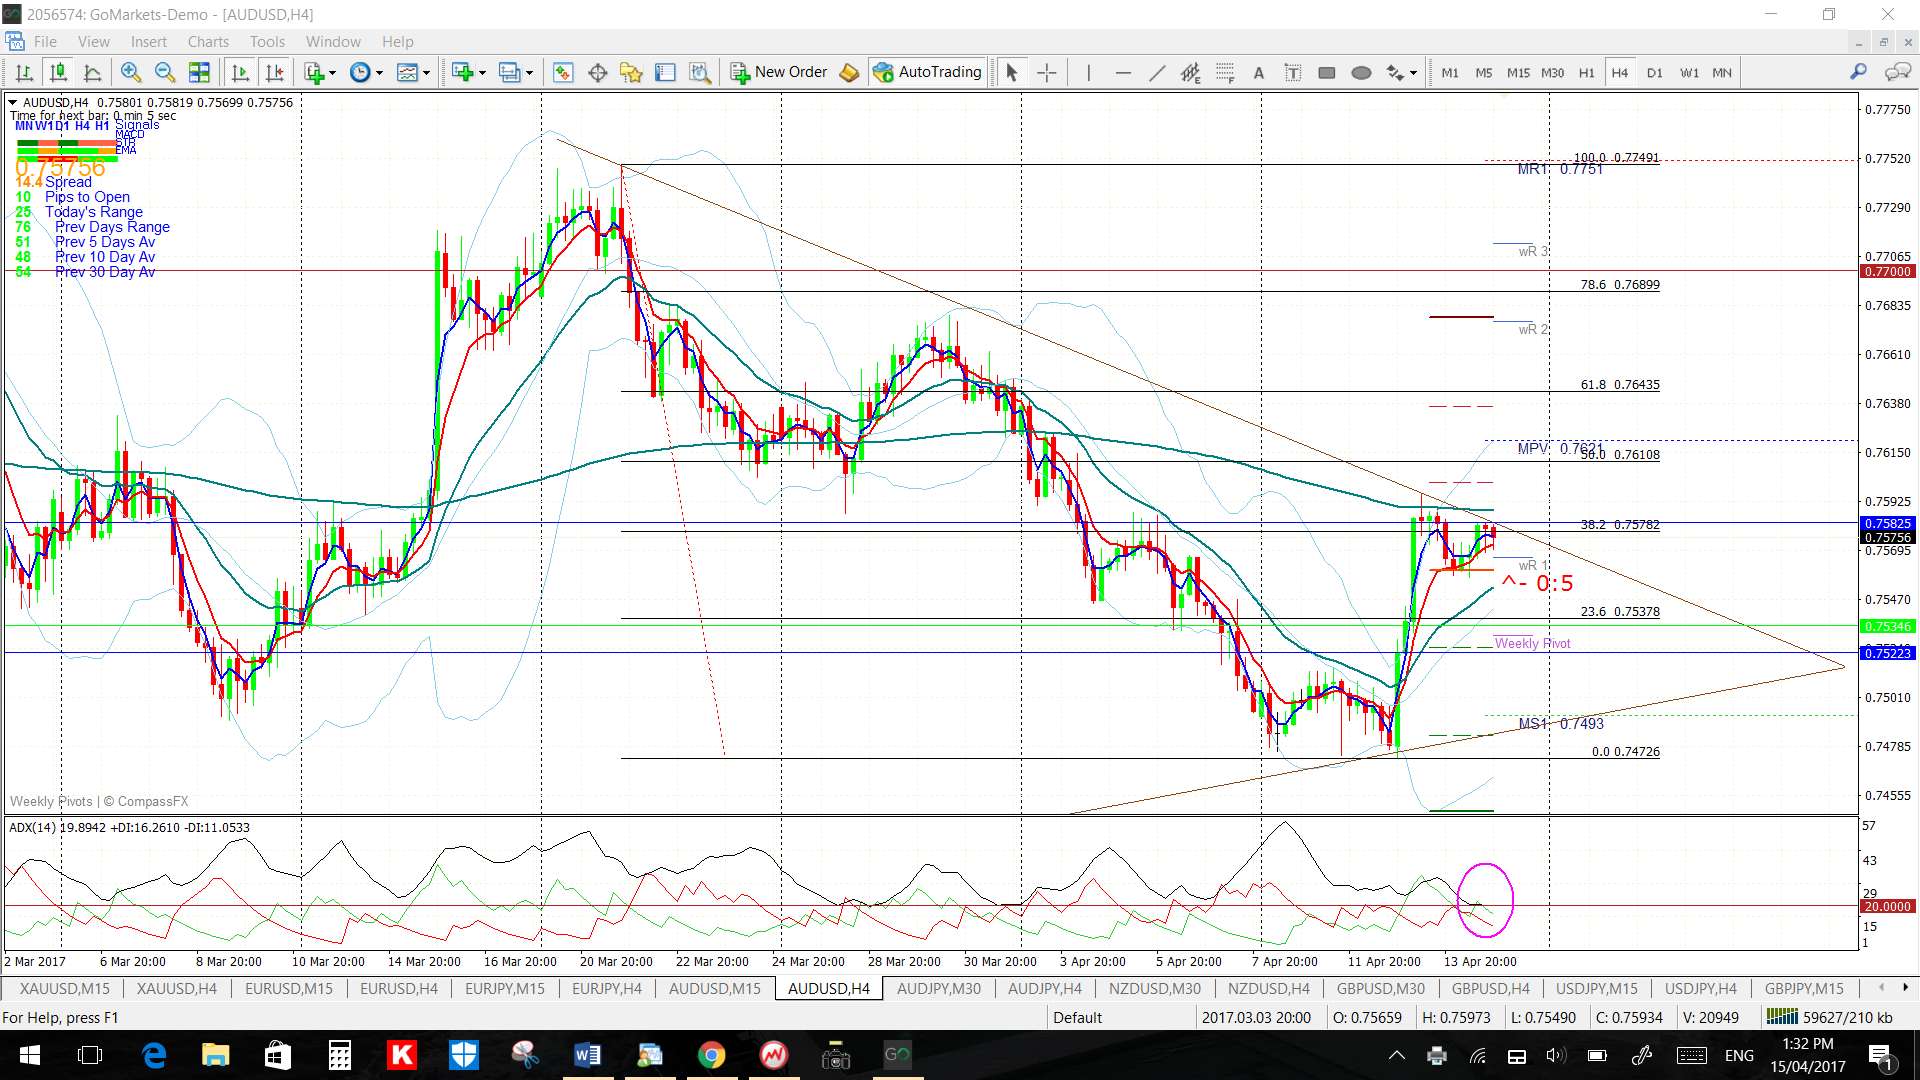
AUD/USD: Watch the daily chart’s triangle trend lines for any make or break activity:

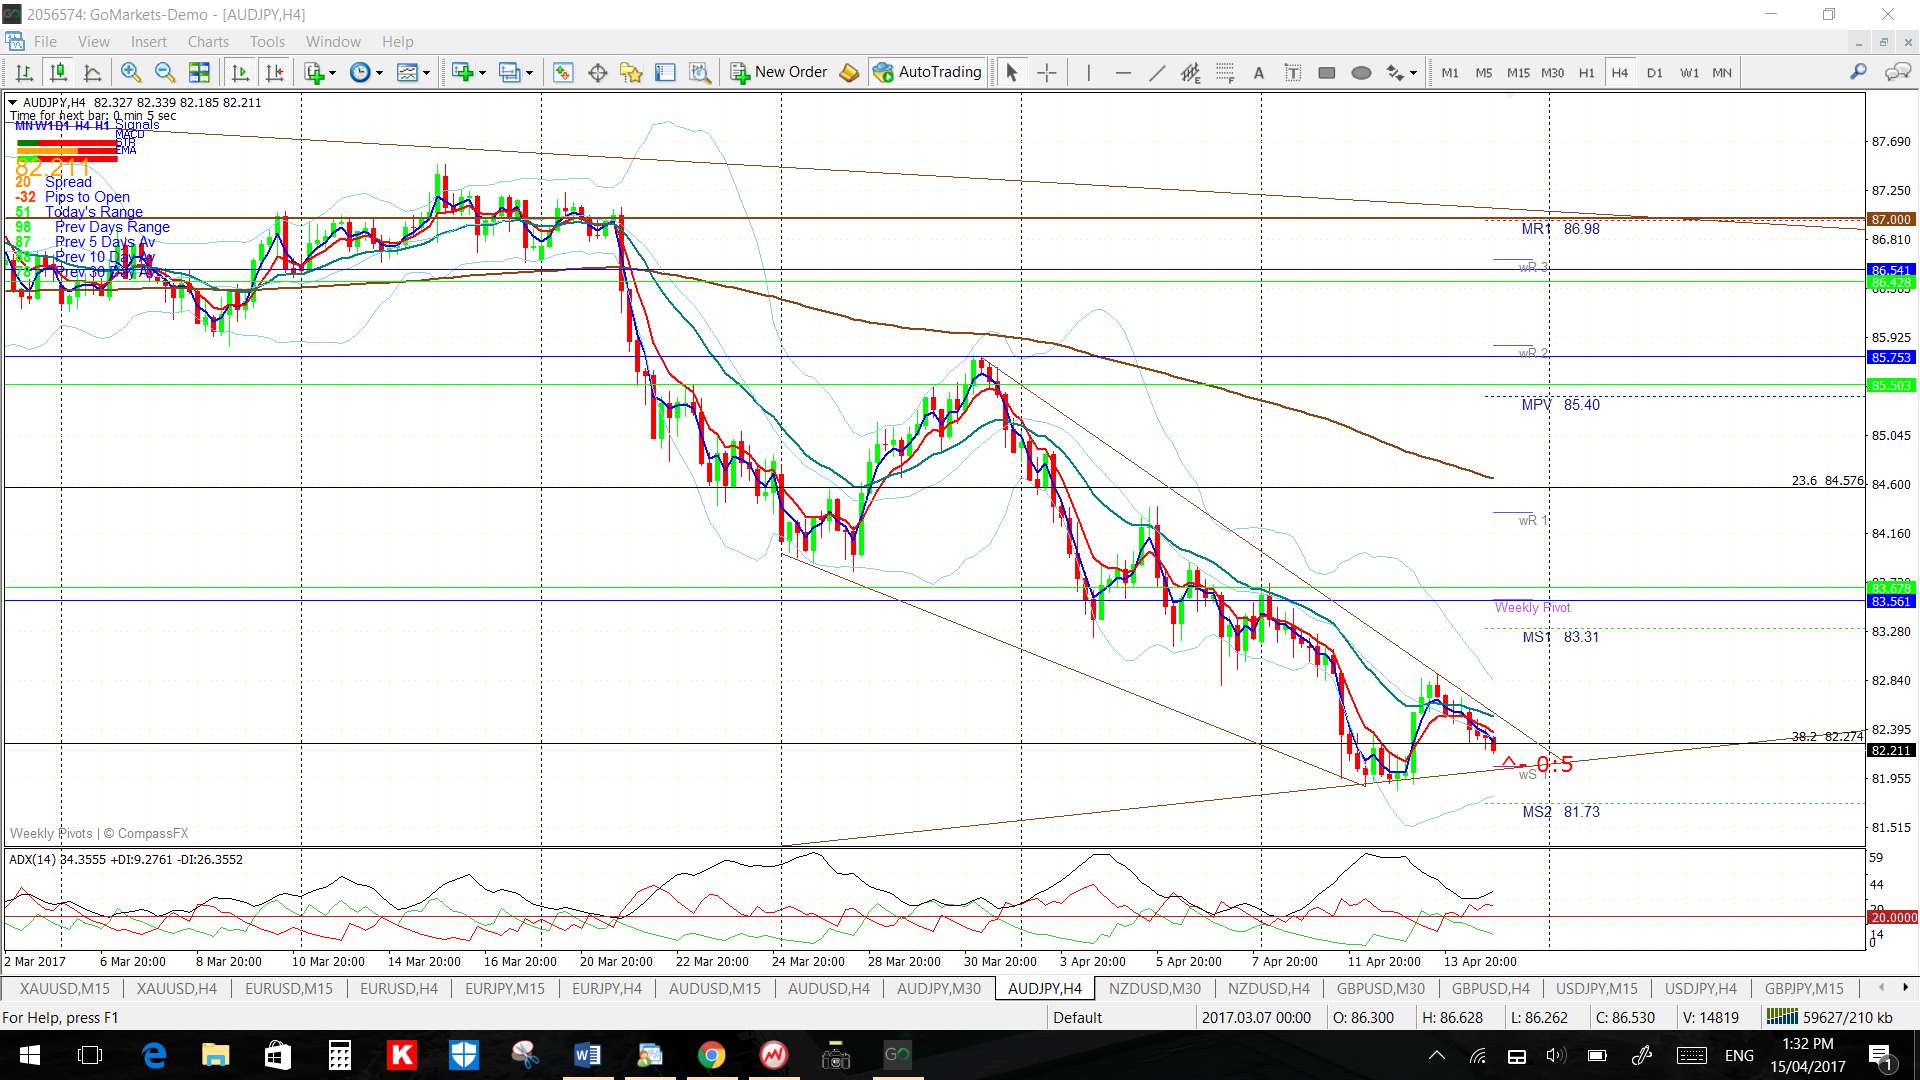
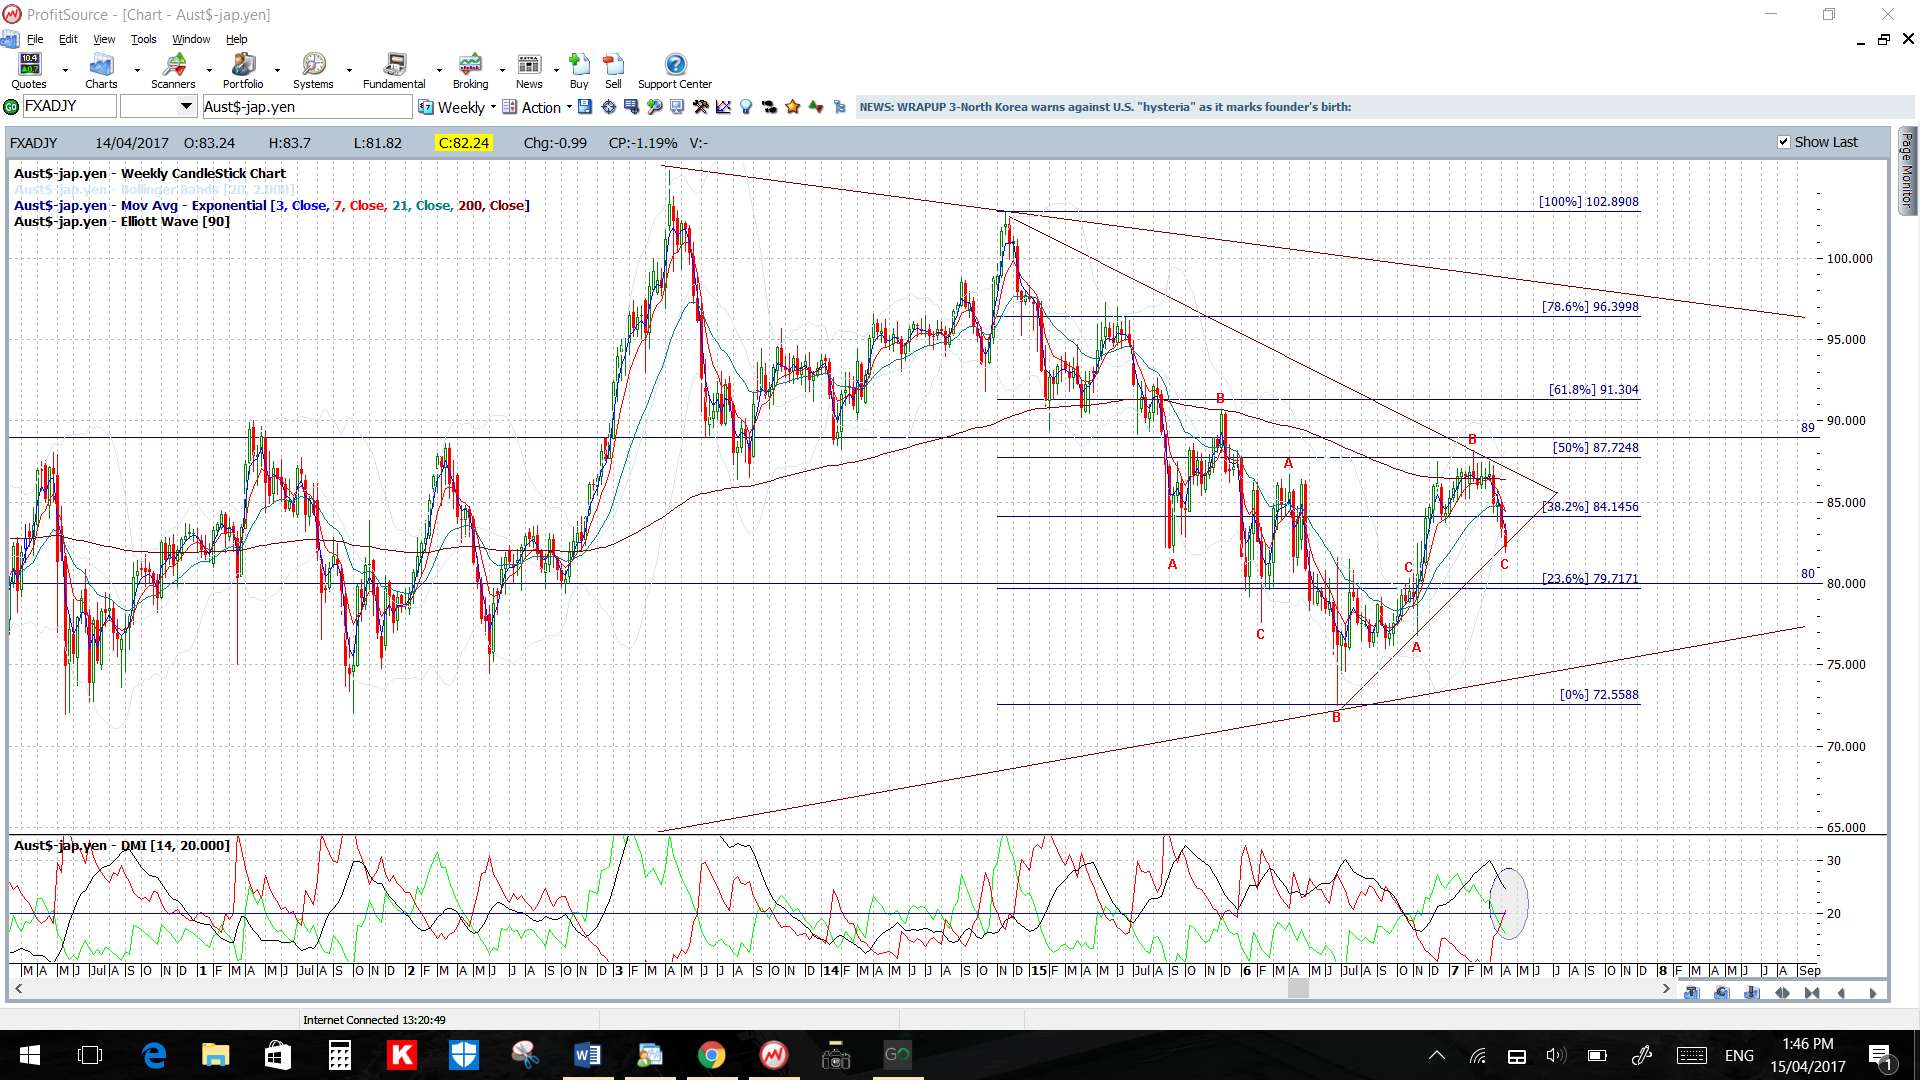
AUD/JPY: Watch the 4hr chart’s wedge and daily chart’s triangle trend lines for any make or break activity:
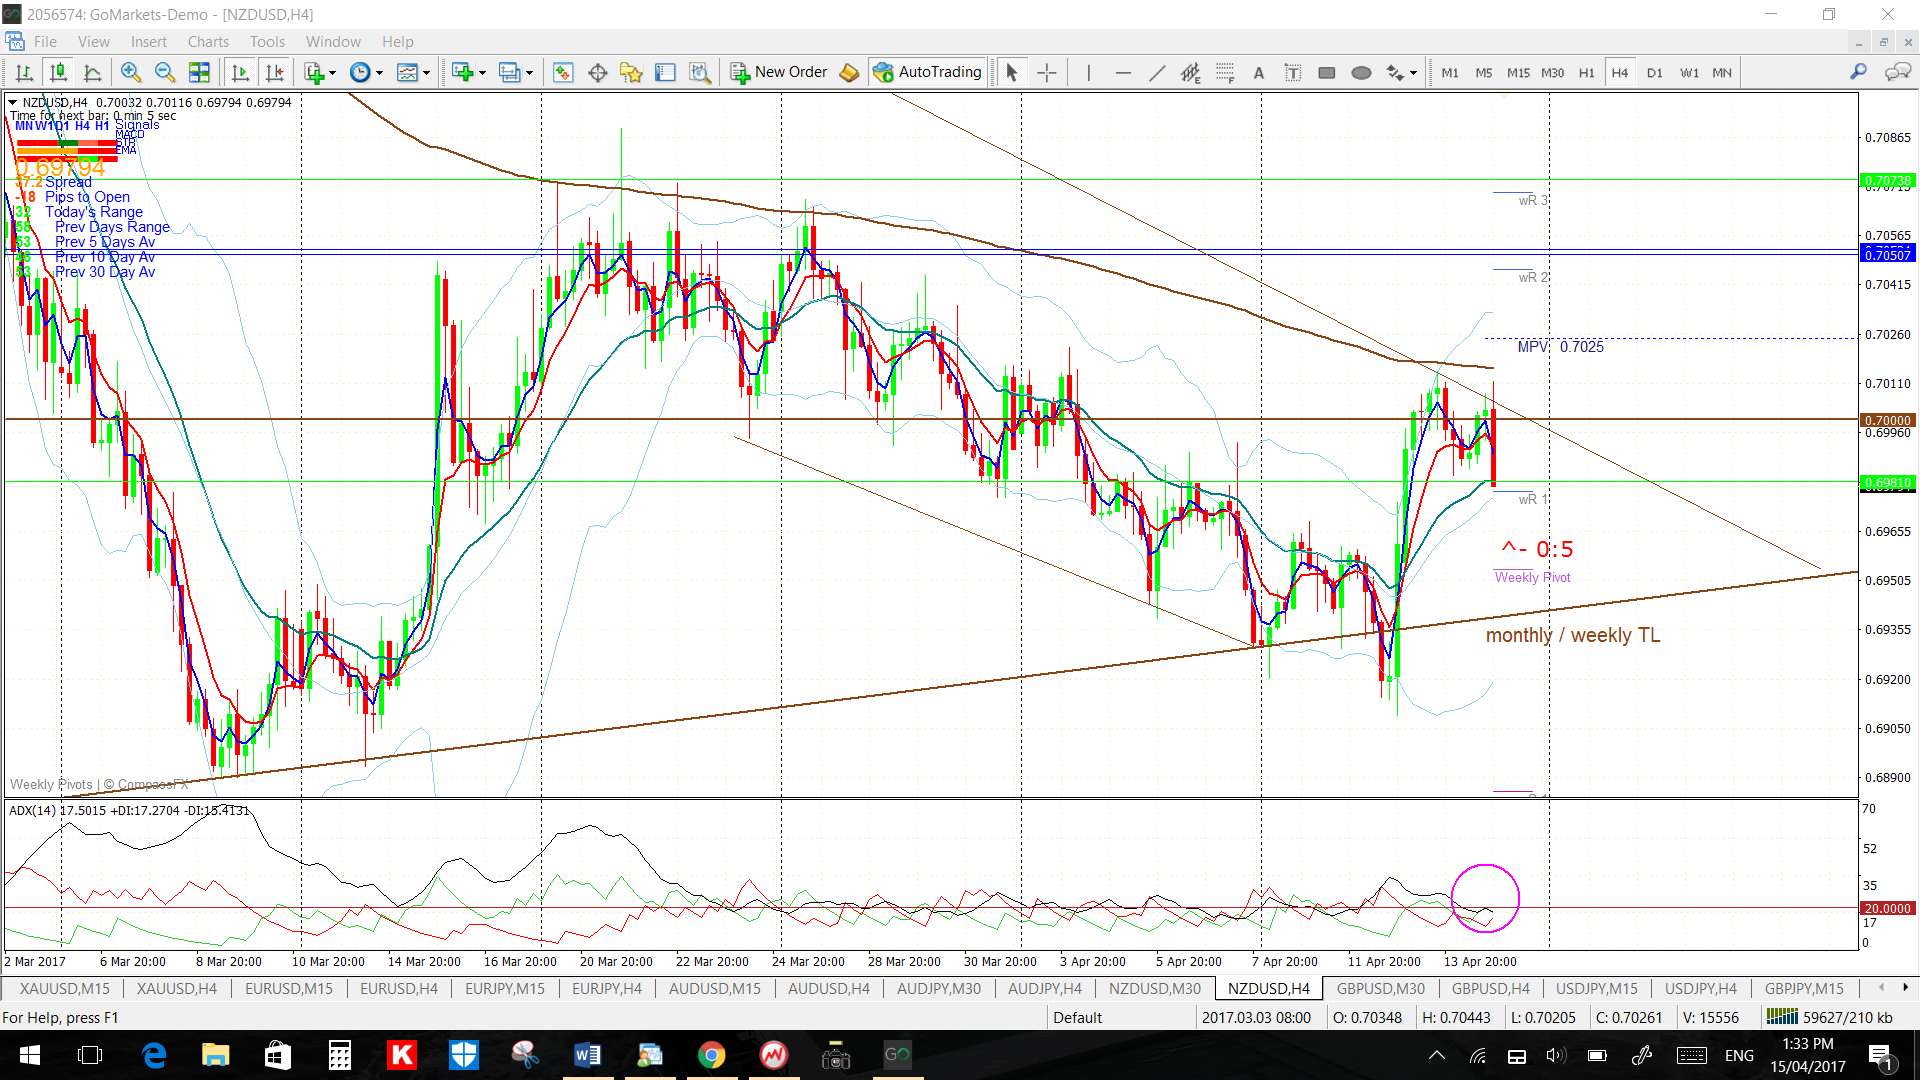
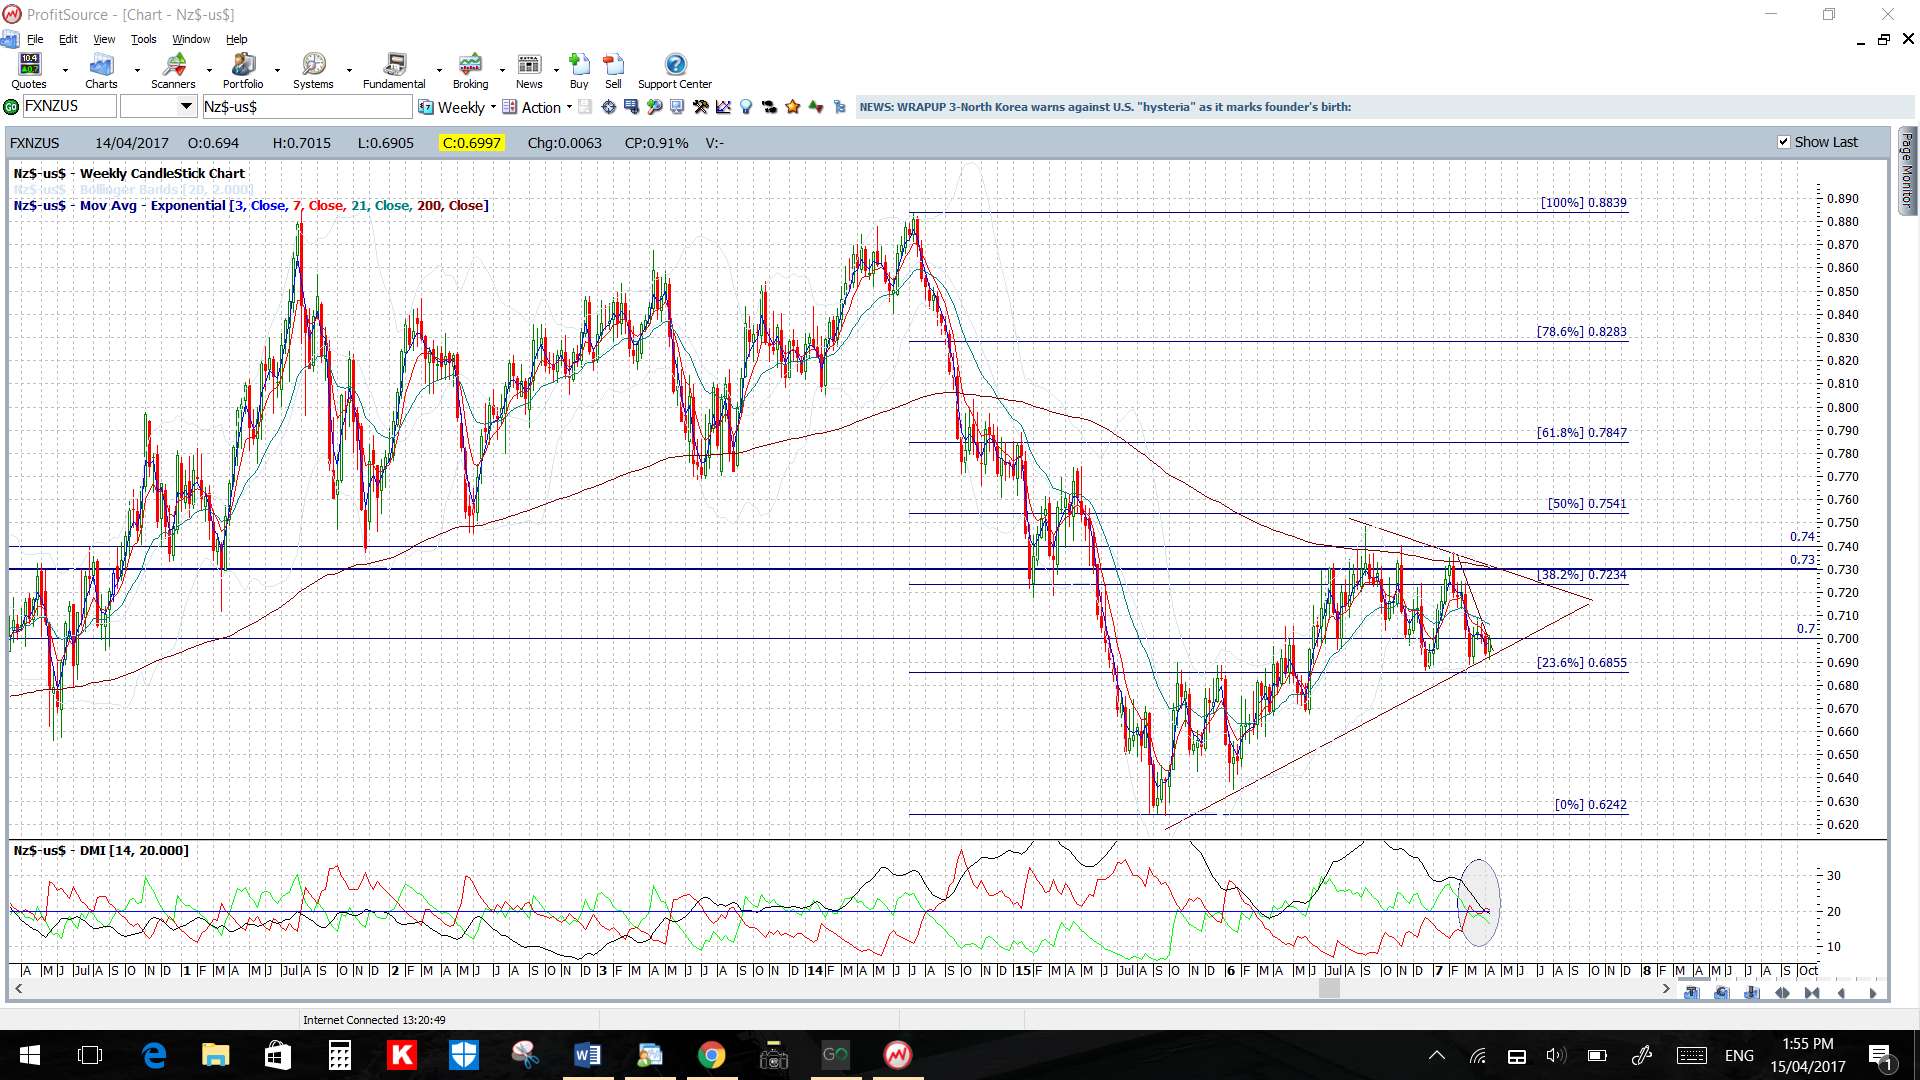
NZD/USD: Watch the daily chart’s triangle trend lines for any make or break activity. Remember, the bottom trend line here is a monthly chart support trend line:
GBP/USD: Watch the 4hr and daily chart triangle trend lines for any make or break activity:

USD/JPY: Watch to see if the 50% fib gives way and, if so, watch the 61.8% fib down near 106.50:

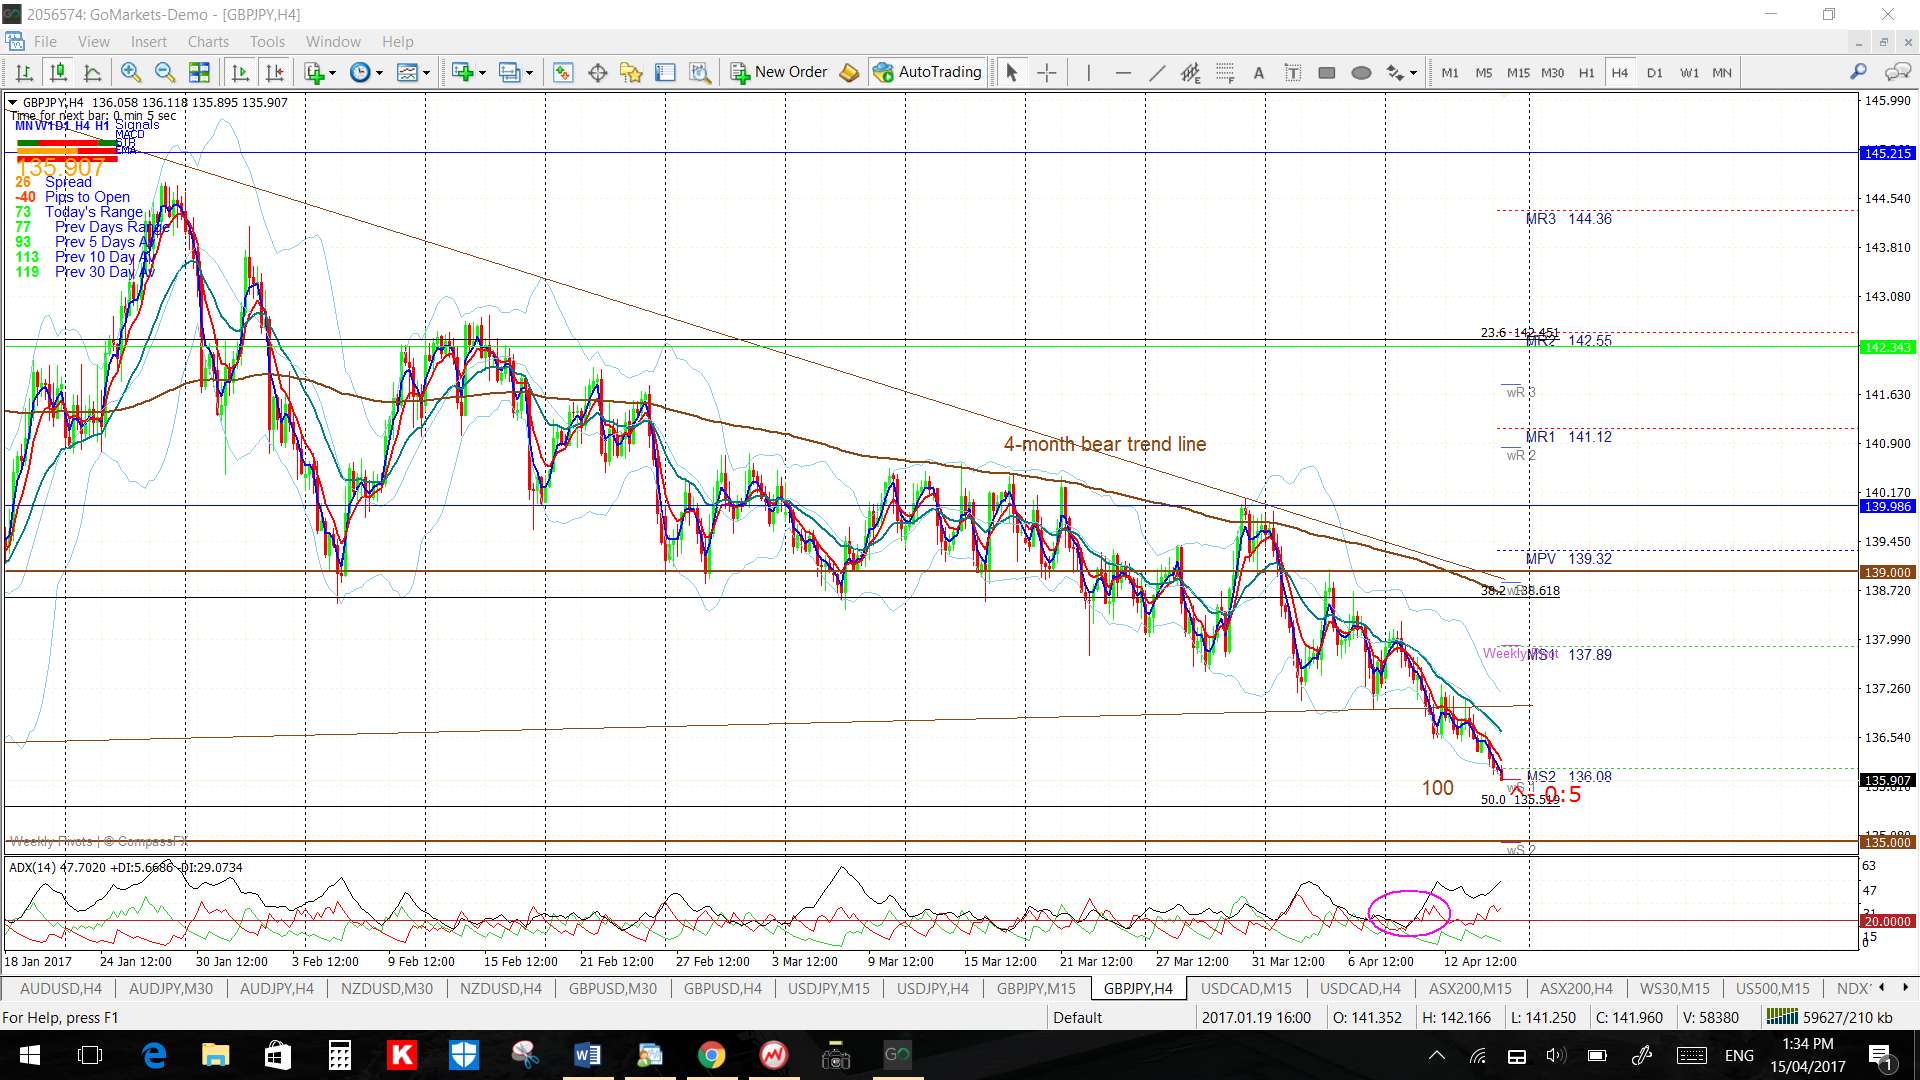
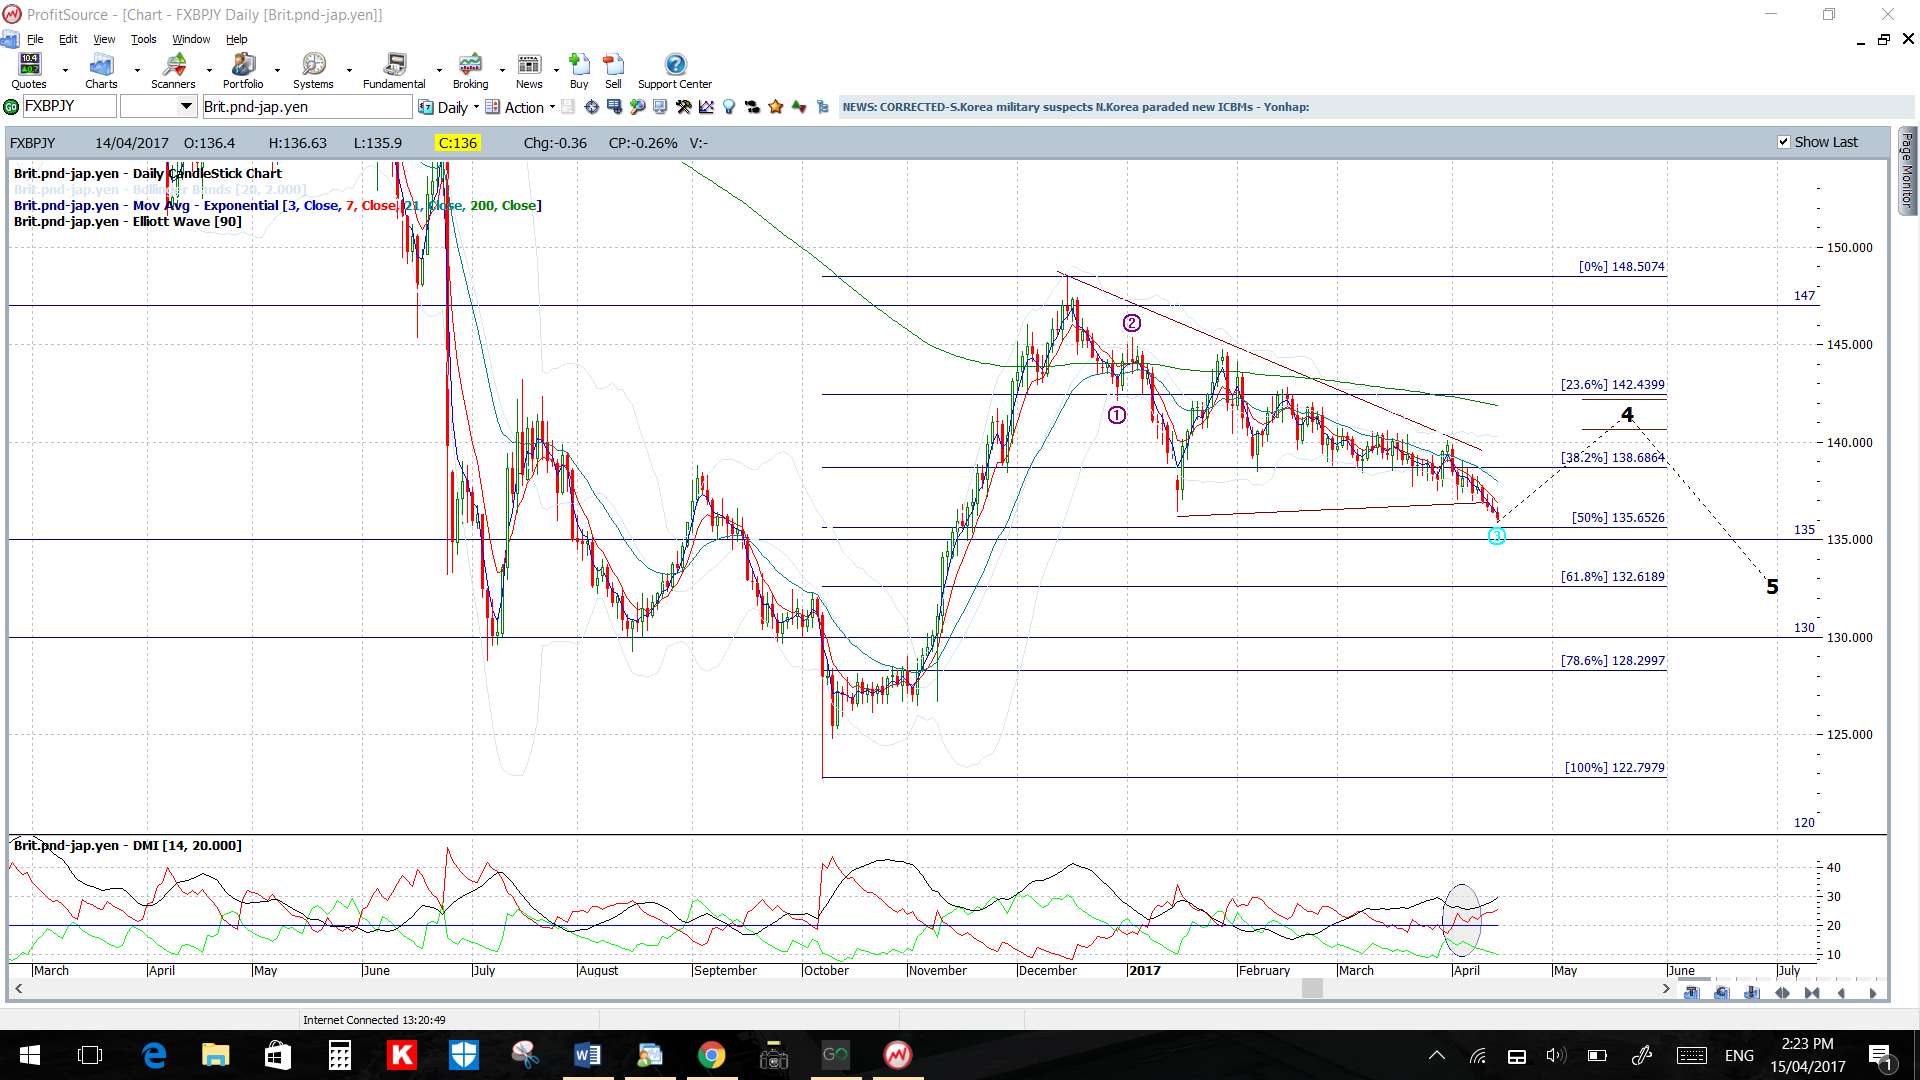
GBP/JPY: Watch for any support from the 50% fib, just under current price, and also the 135 region. I would then look for a test of the 61.8% fib if these give way.
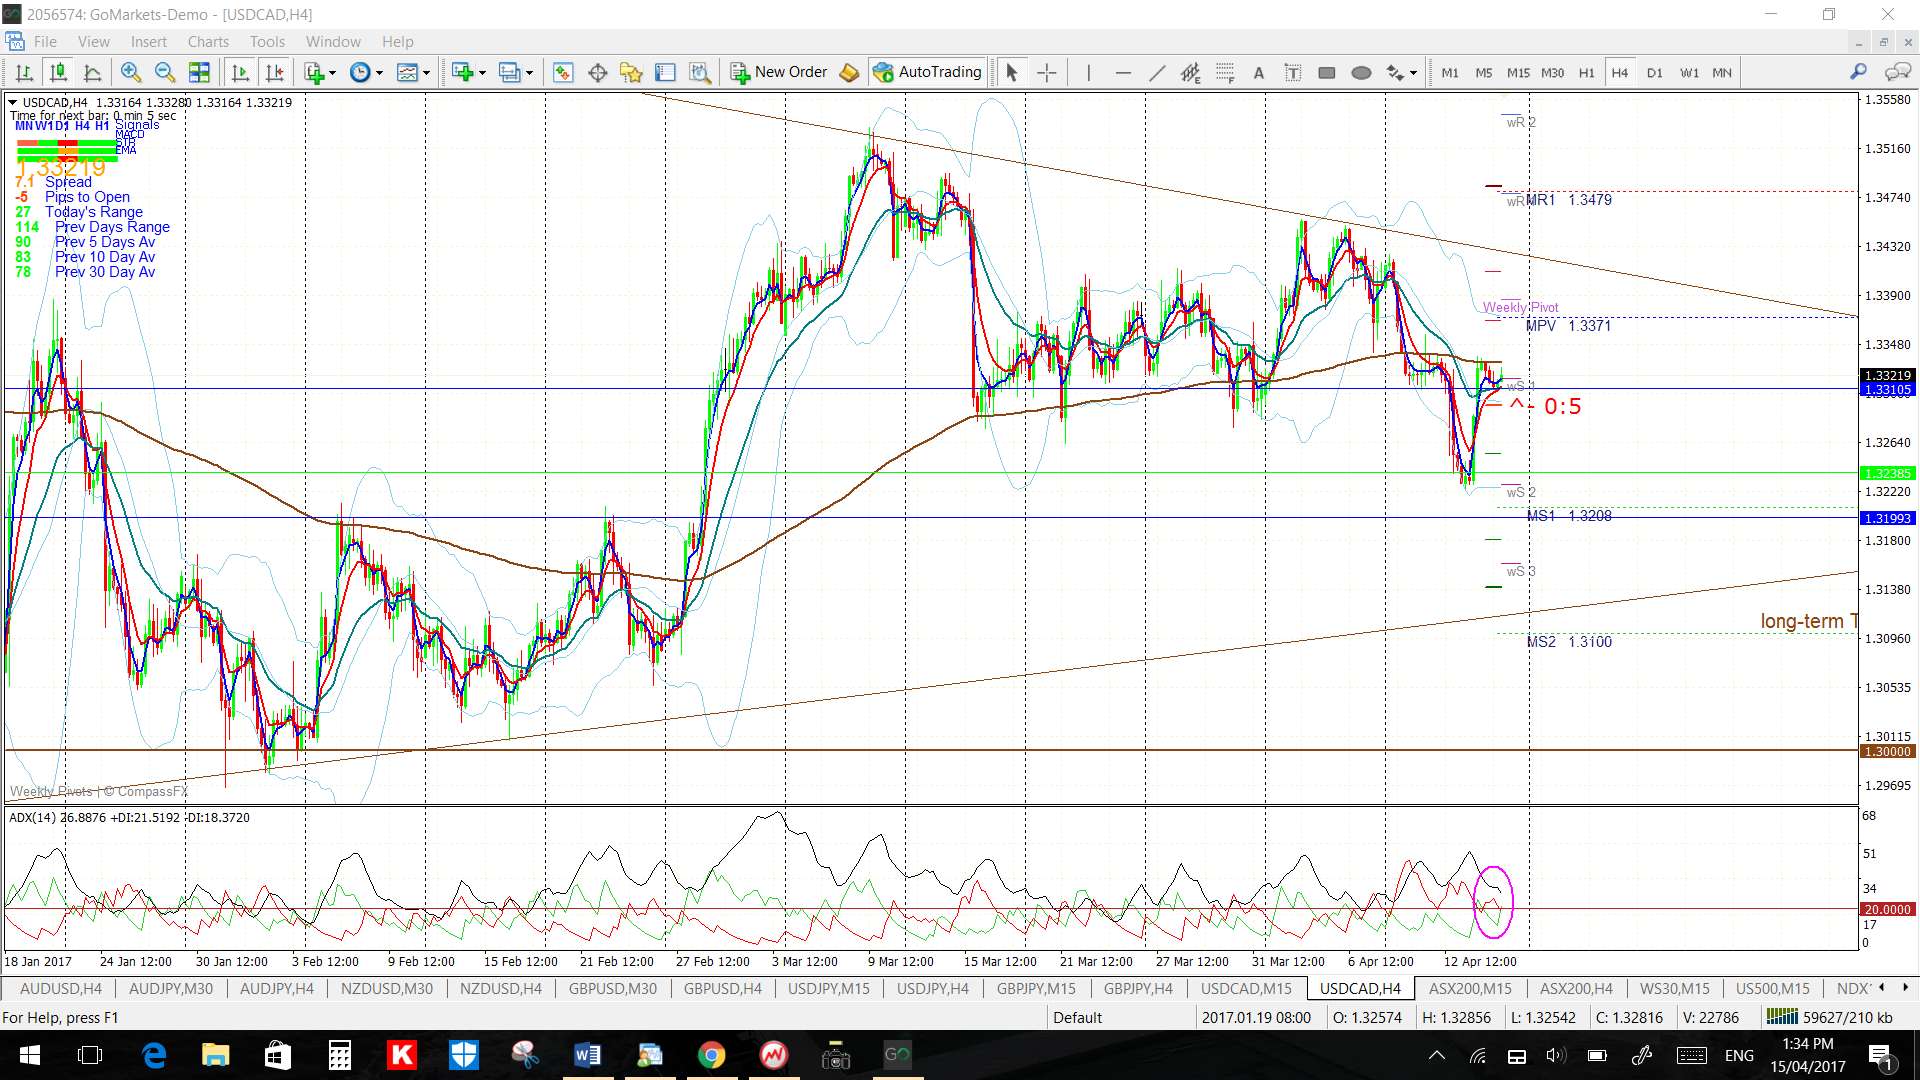
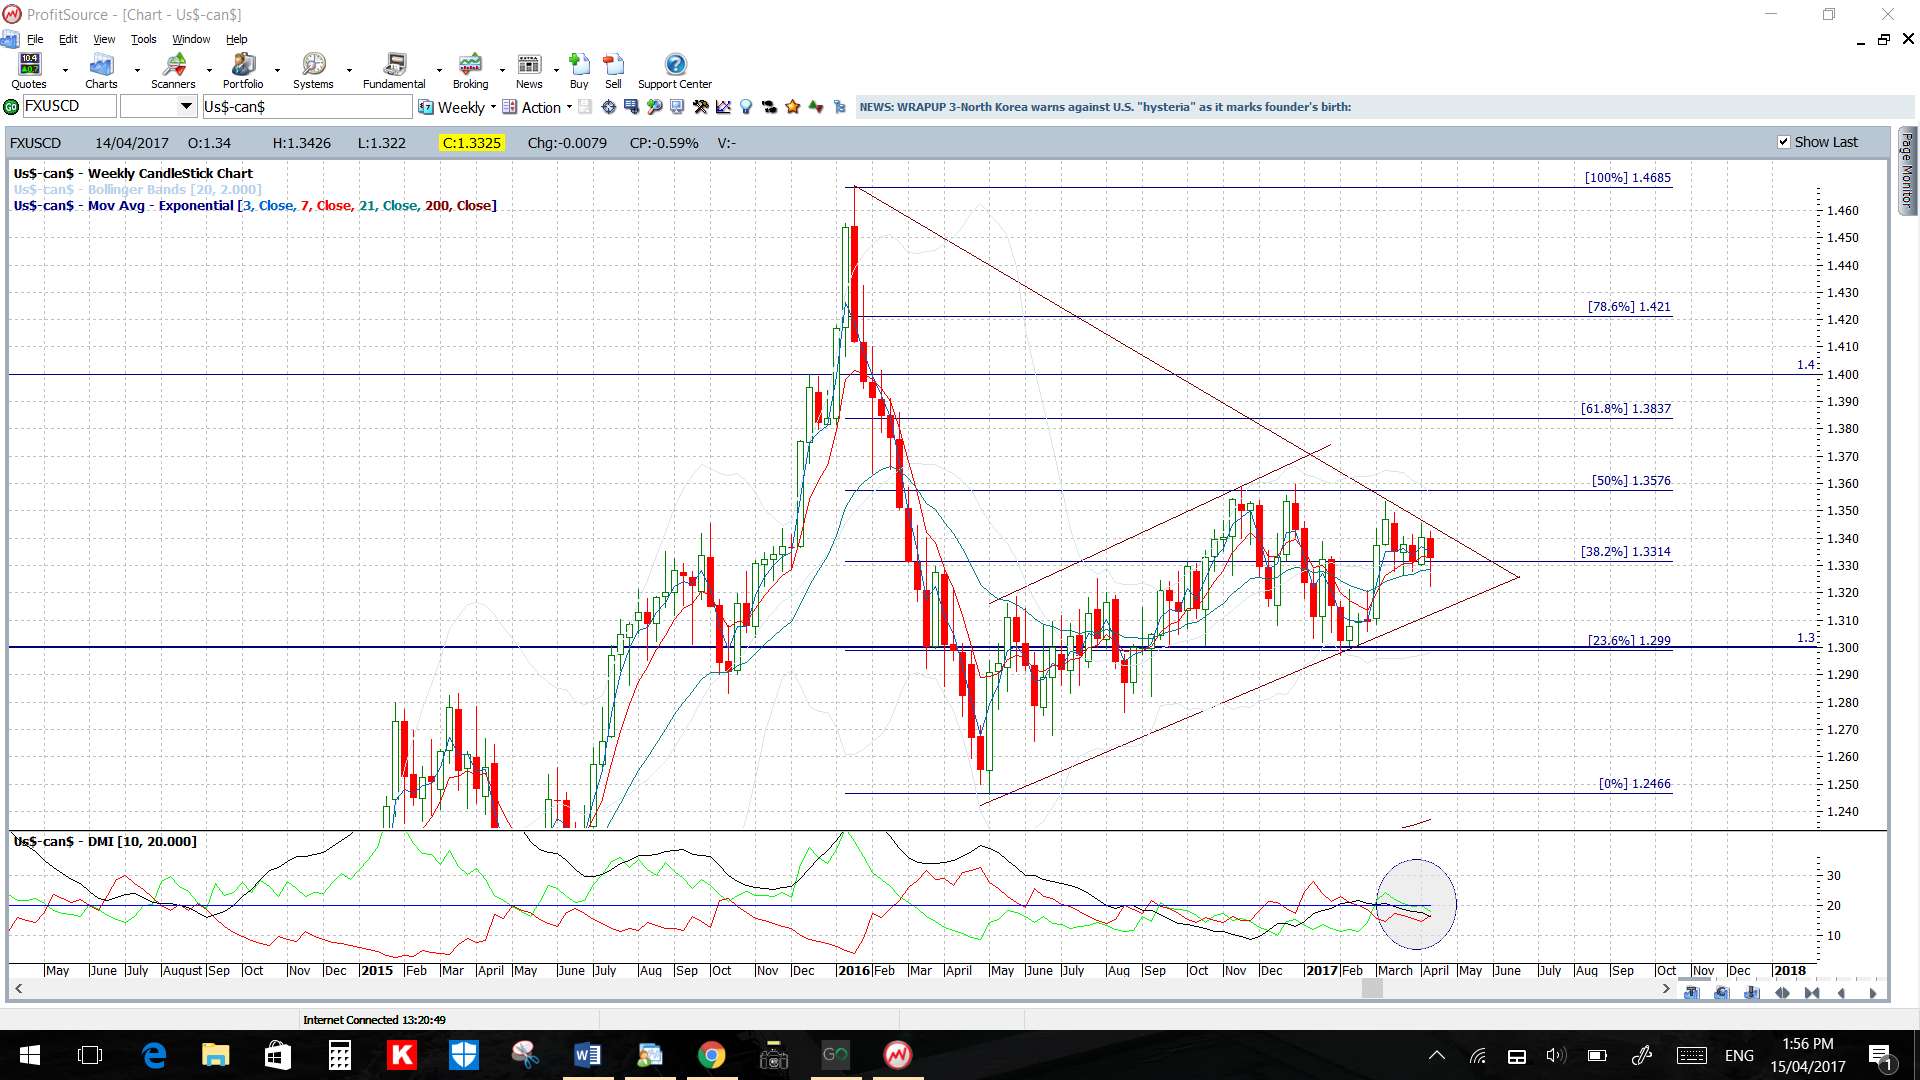
USD/CAD: Watch the daily chart’s triangle trend lines for any make or break activity:
GBP/AUD: Watch the 4hr chart’s triangle trend lines for any make or break activity. Note that this 4hr triangle is set within a daily chart wedge:
GBP/NZD: Note how price retreated from the 20-month bear trend line! Watch the 4hr chart’s triangle trend lines now for any make or breakactivity. The 1.77 is a major S/R level so could well be tested again too:
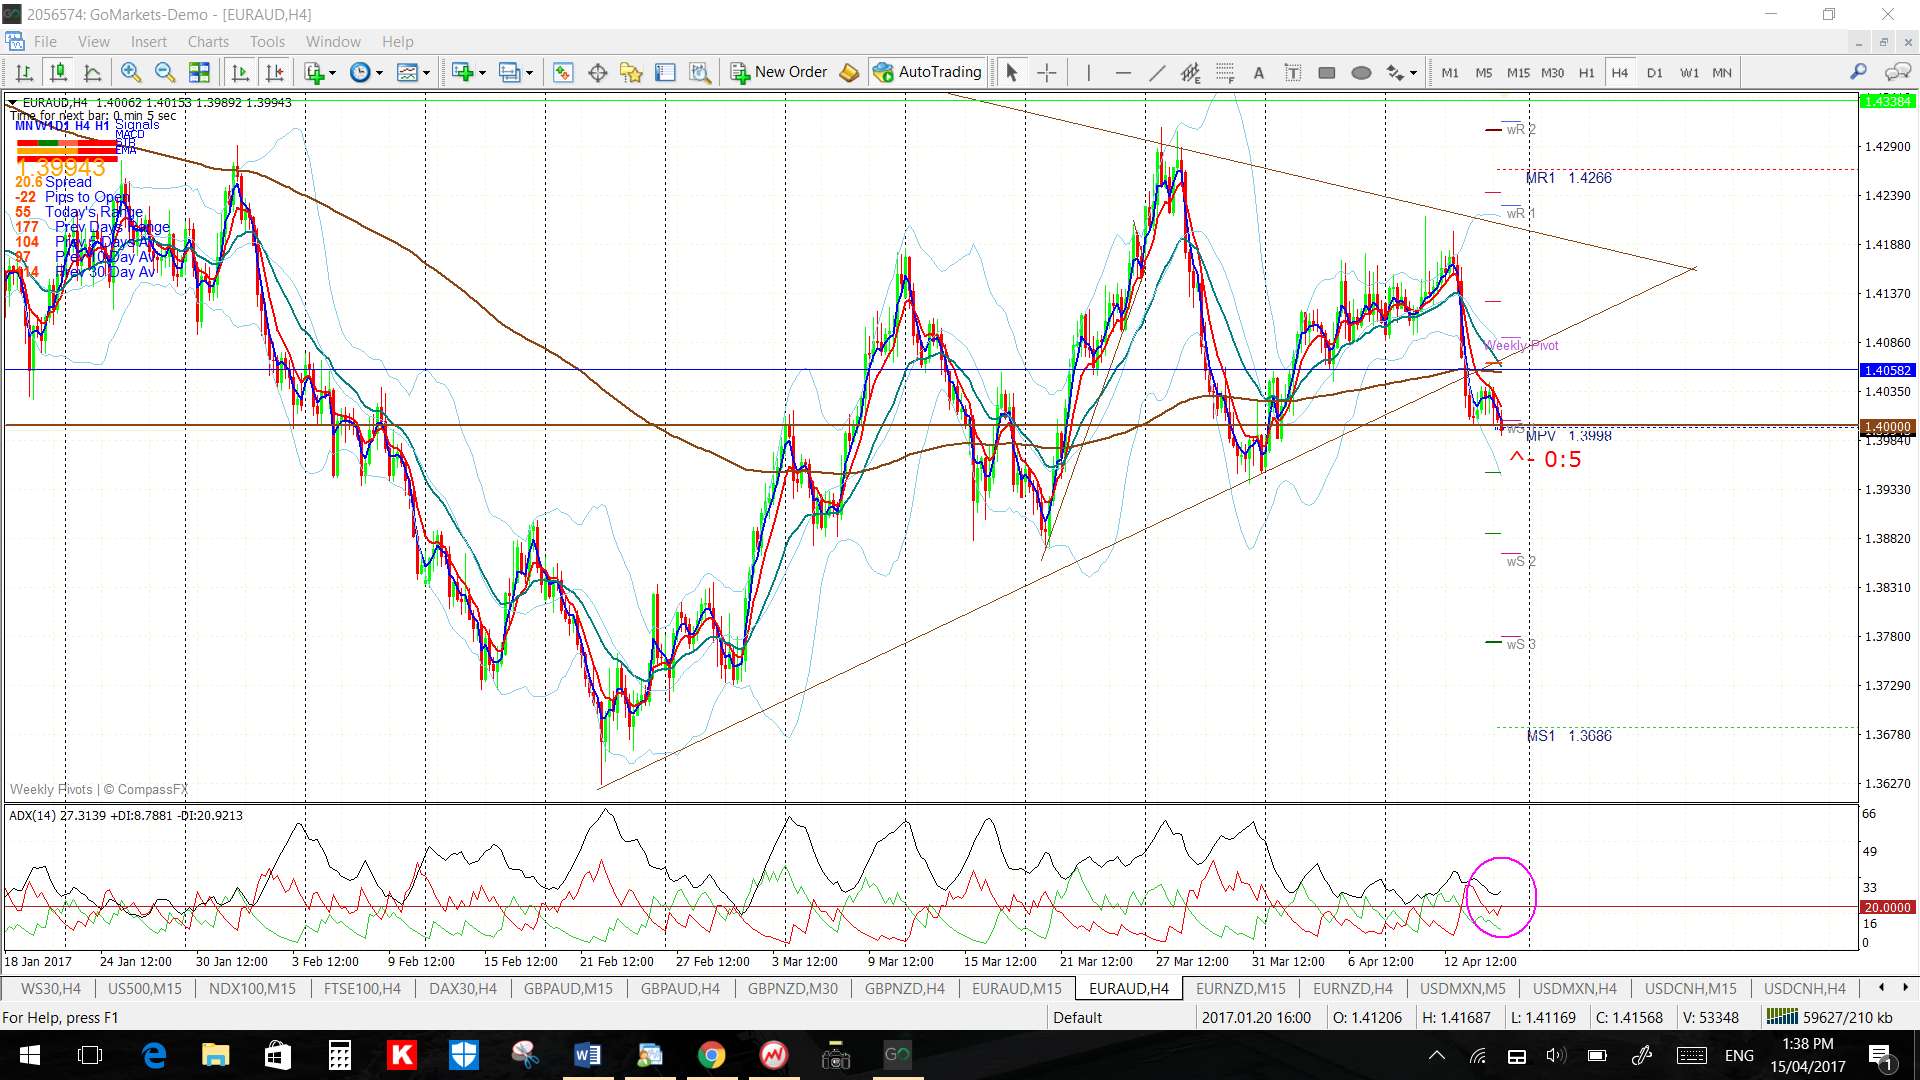
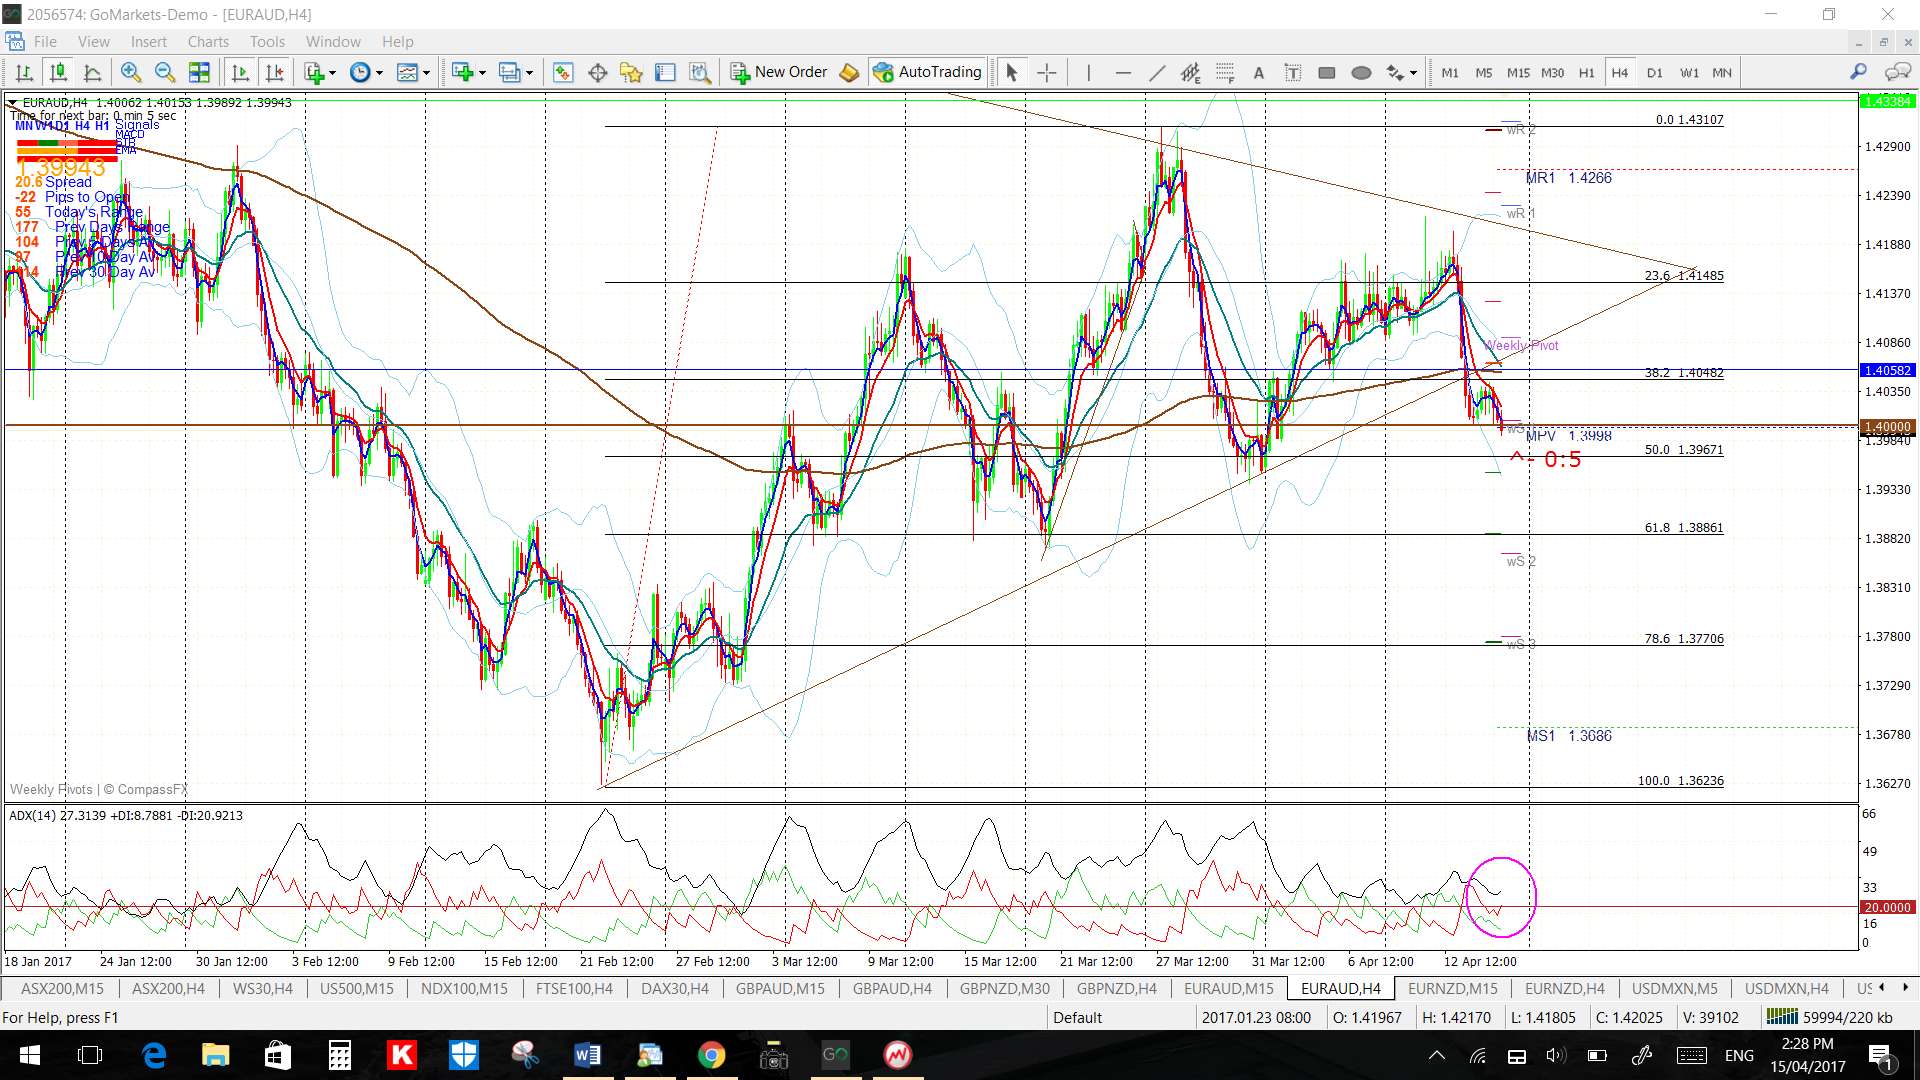
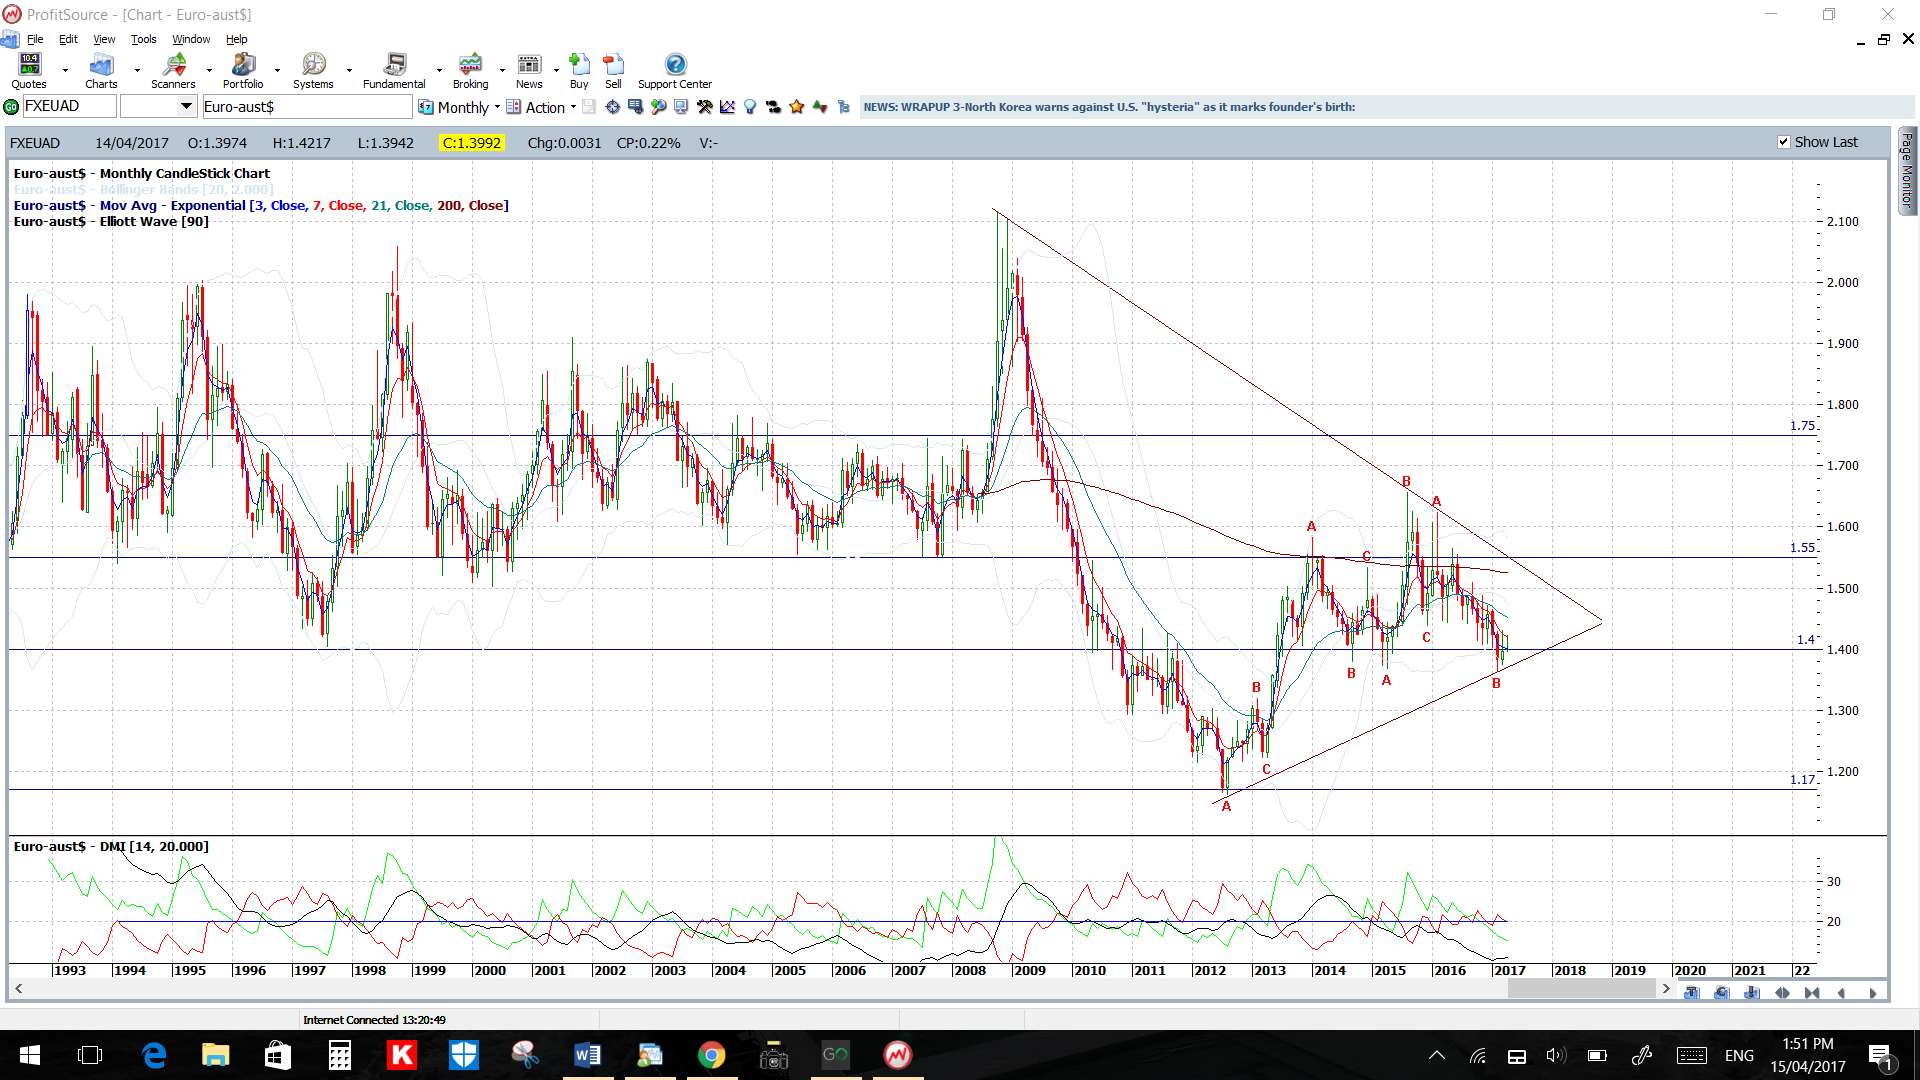
EUR/AUD: The daily support trend line has recently broken and price closed just below the key 1.40 level. Watch to see if this major level is recovered but, if not, I’d look for a test of the 4hr chart’s 61.8% fib as this is down at previous S/R:
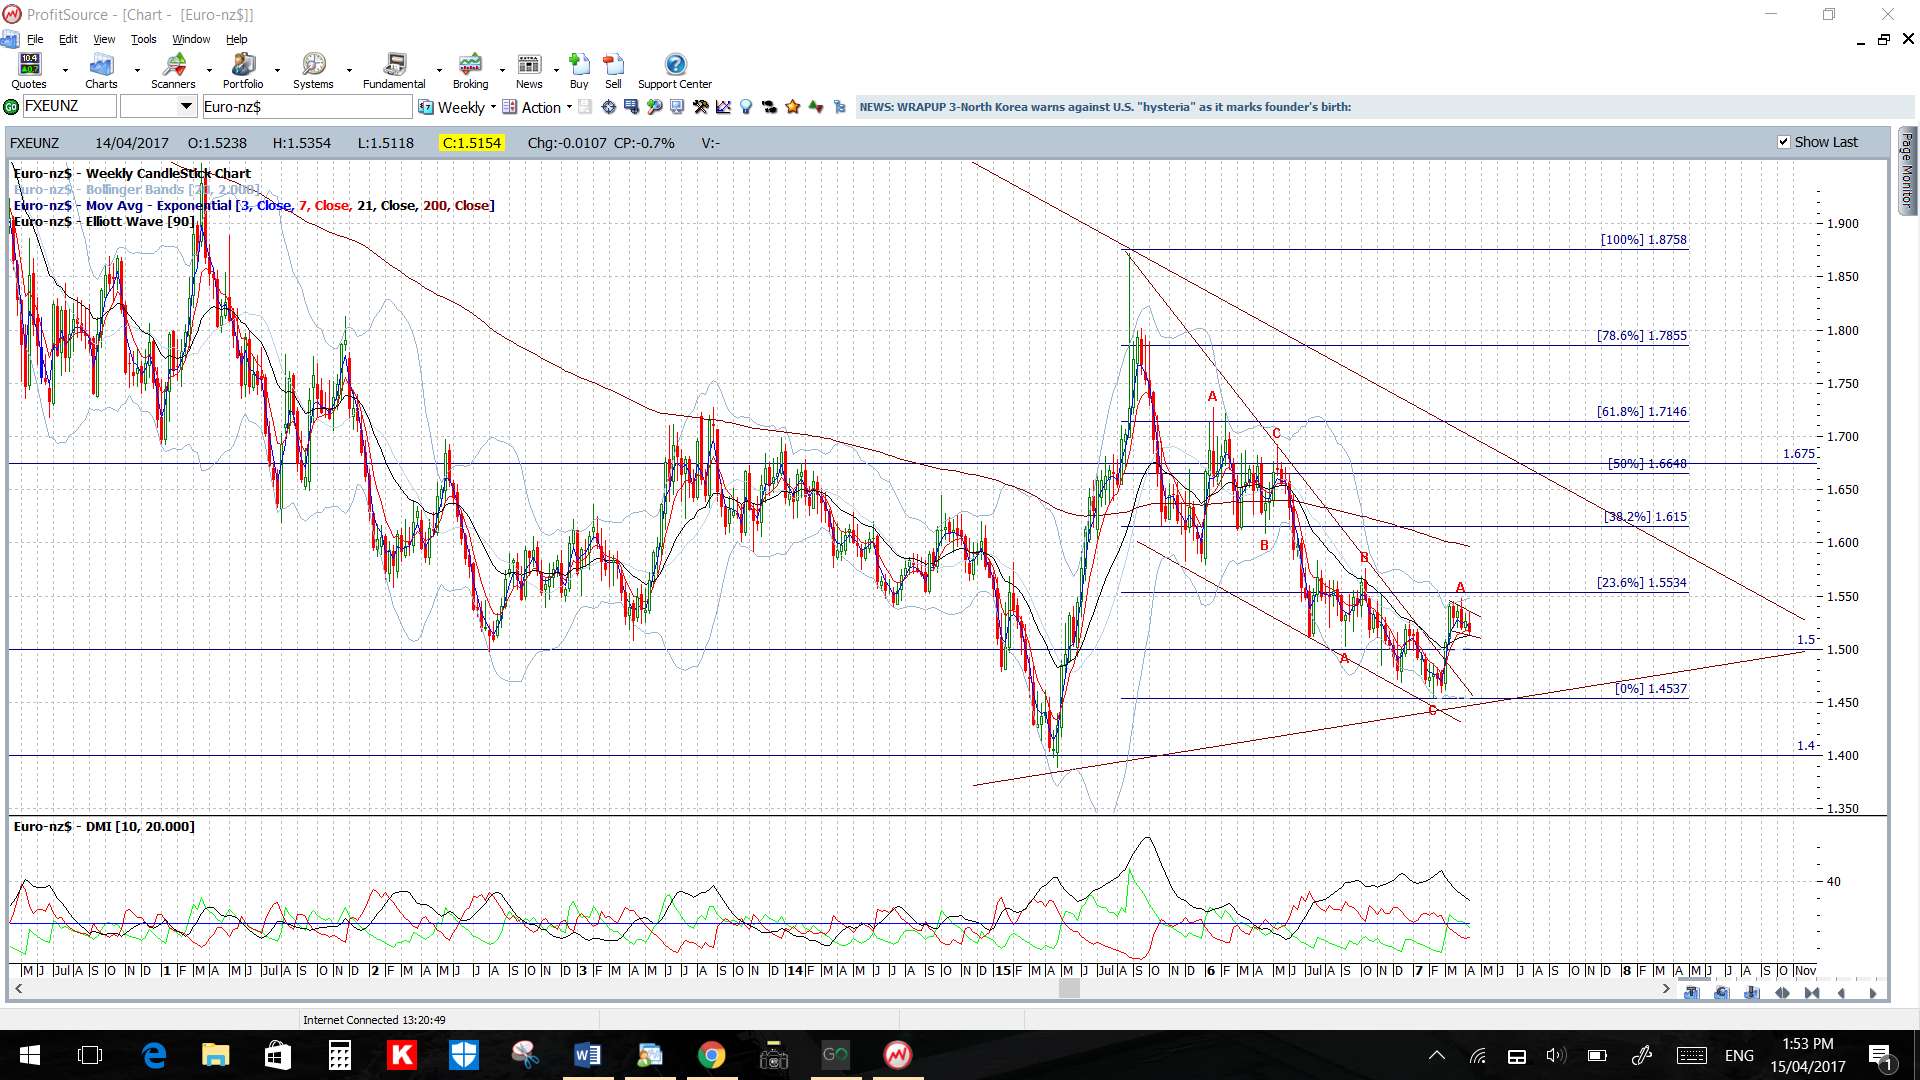
EUR/NZD: Watch the 4hr chart’s wedge trend lines for any make or break activity:

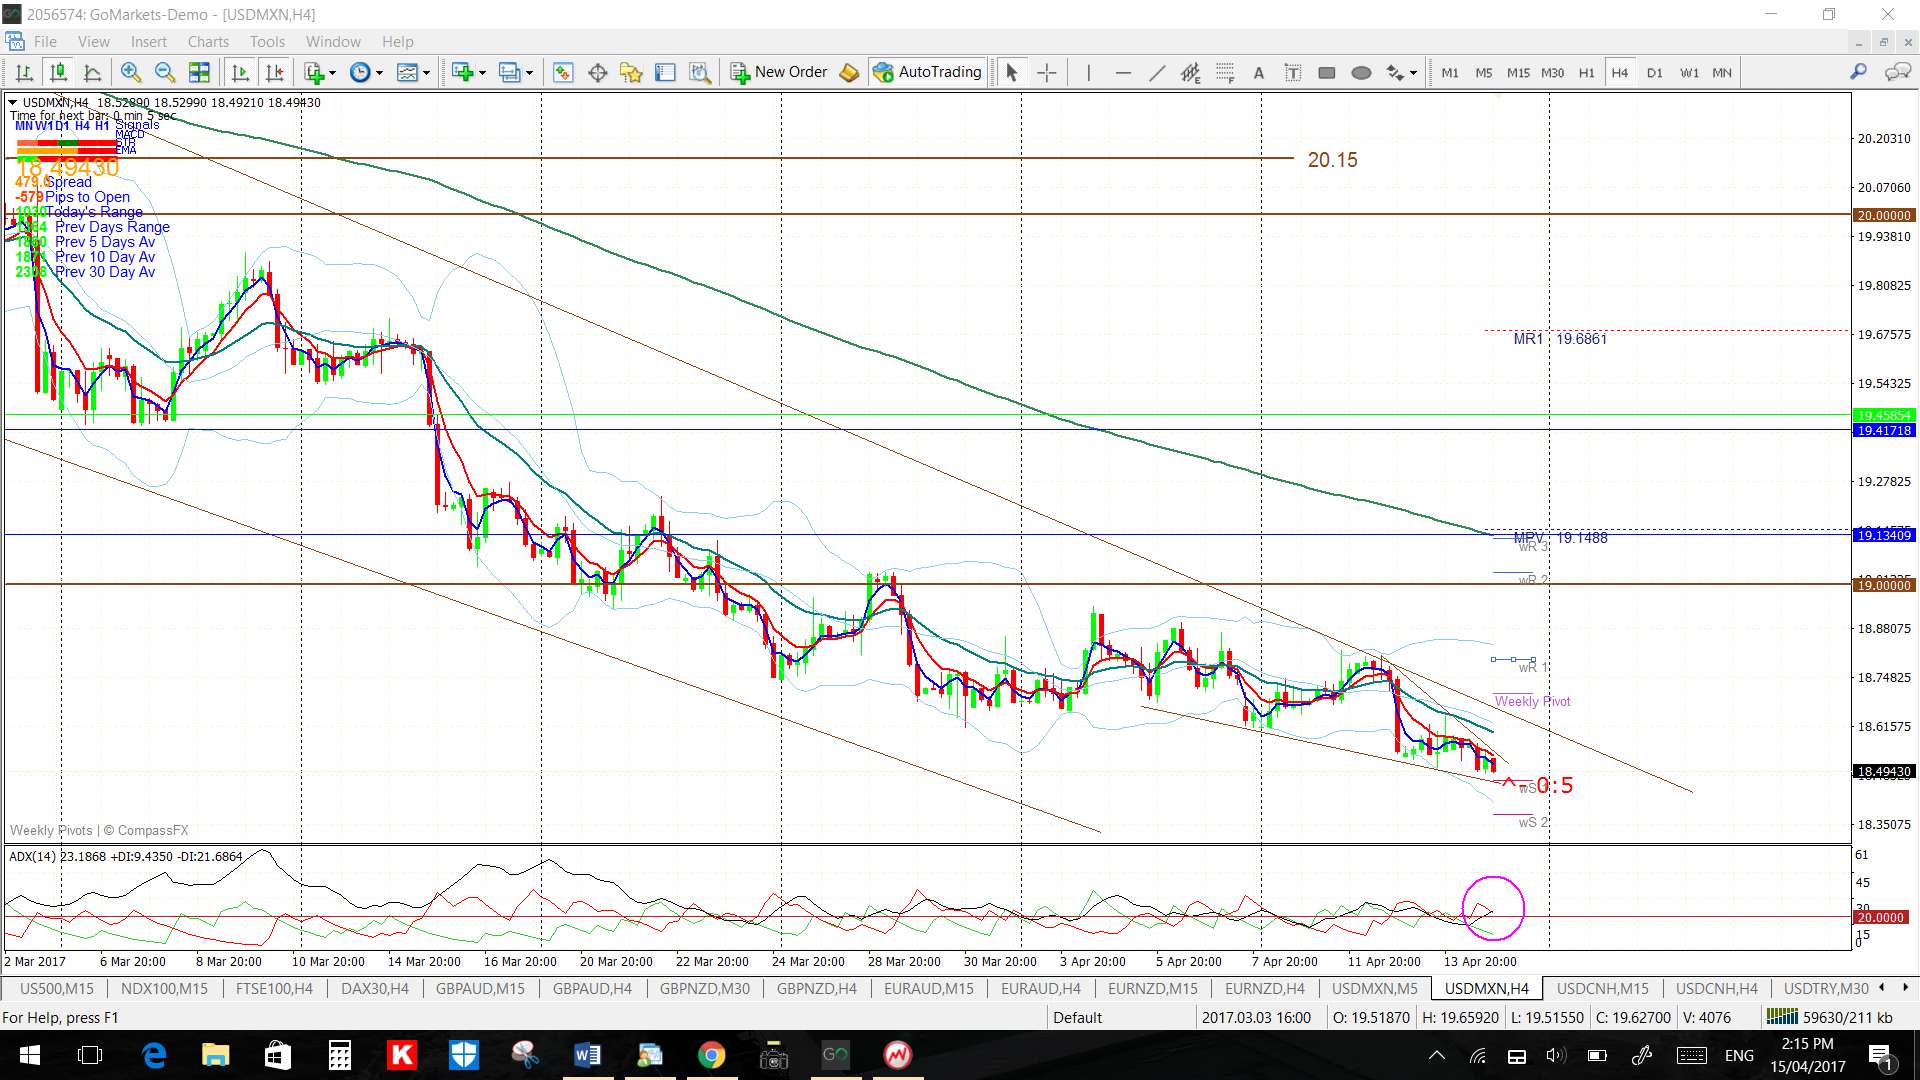
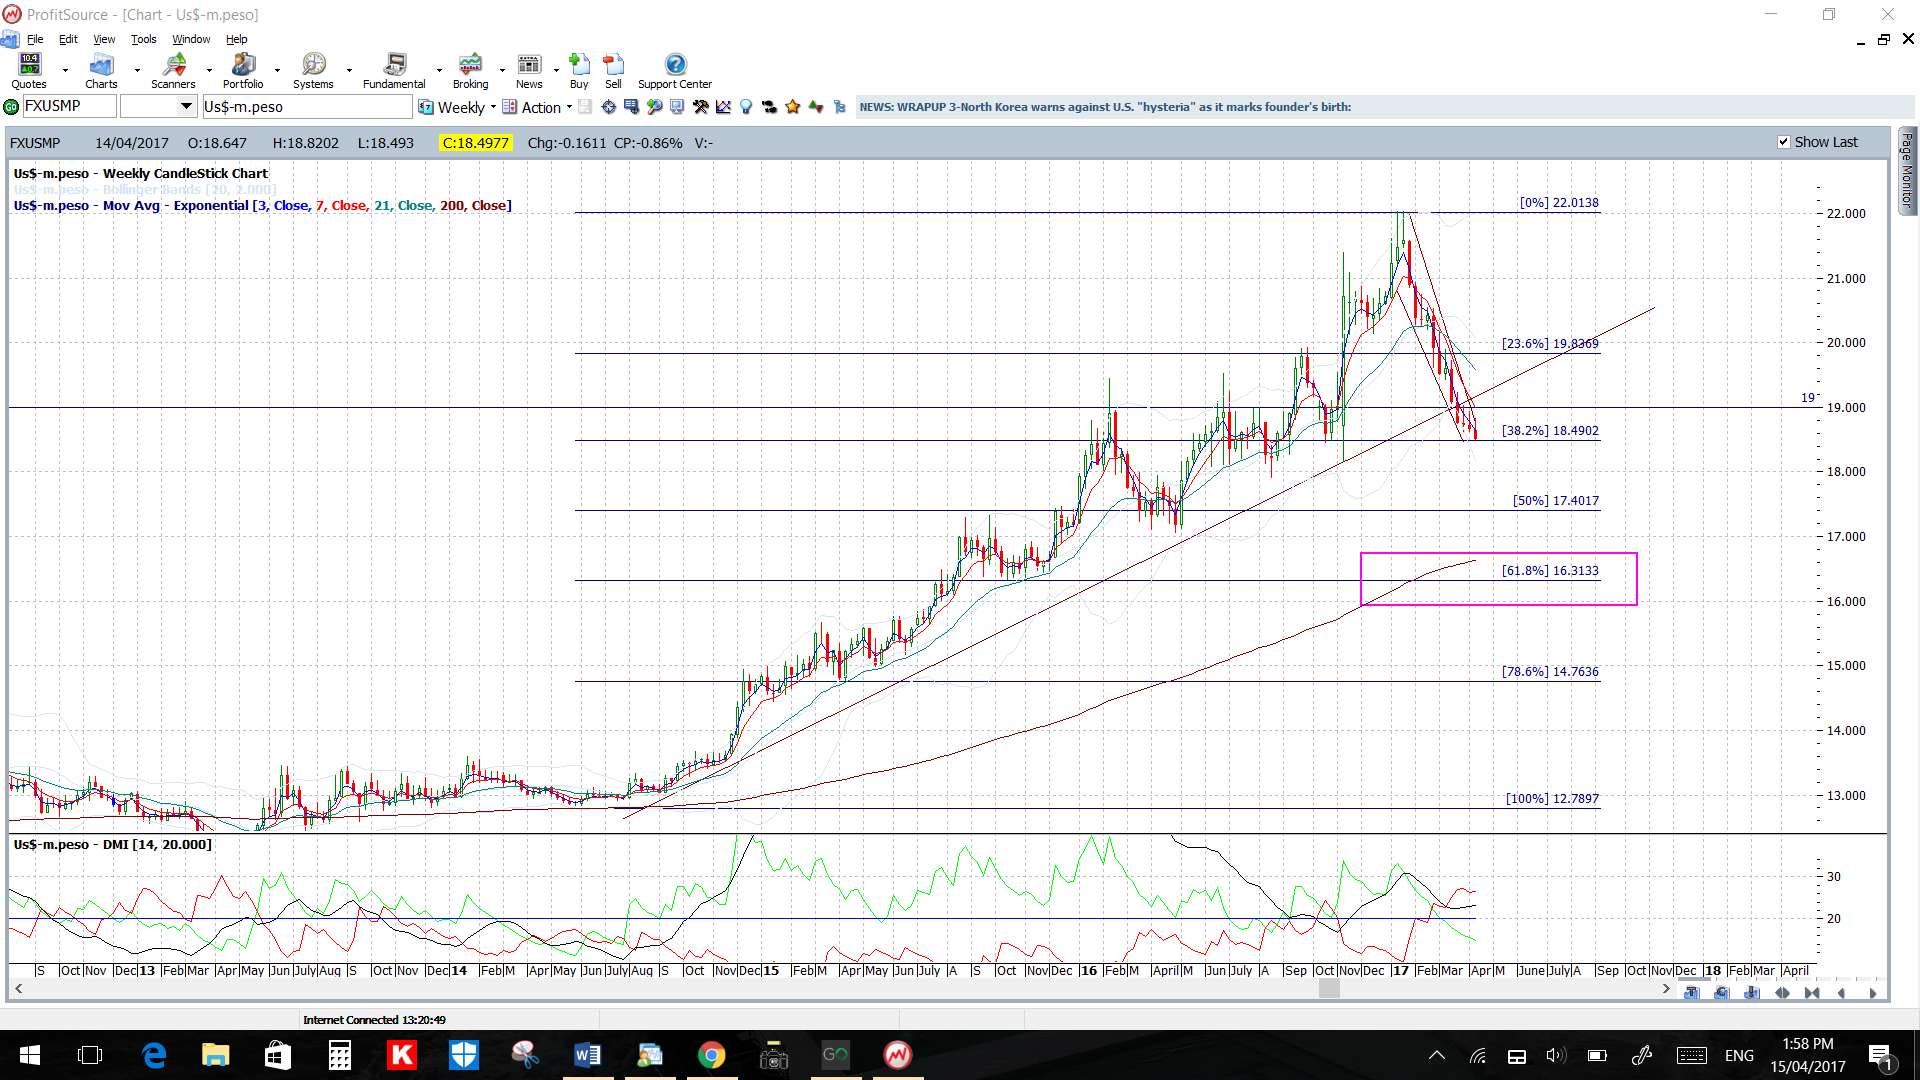
USD/MXN: Watch the 4hr chart’s wedge trend lines for any make or break activity but note this is still set within a longer-term descending trading channel. Remember; I’m looking for a test of the 61.8% fib given the break of the weekly support trend line and 19 level:
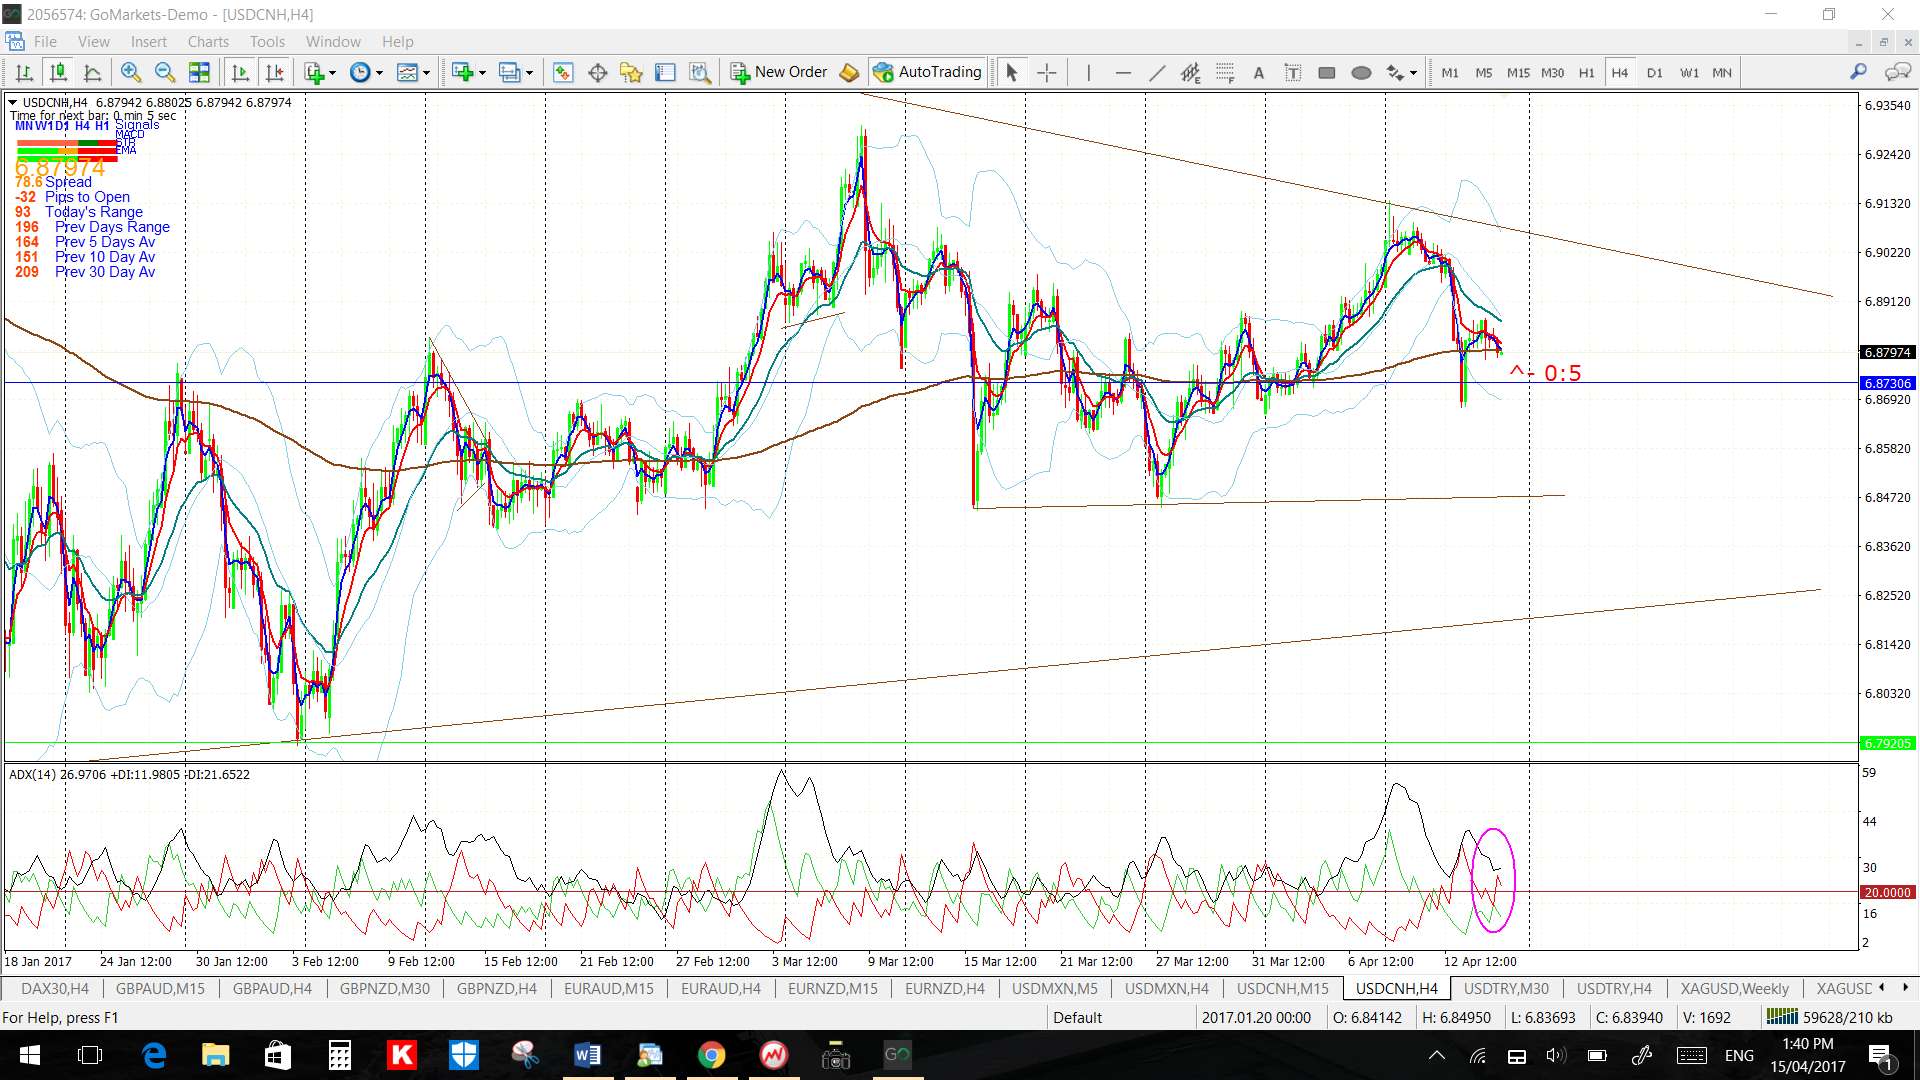
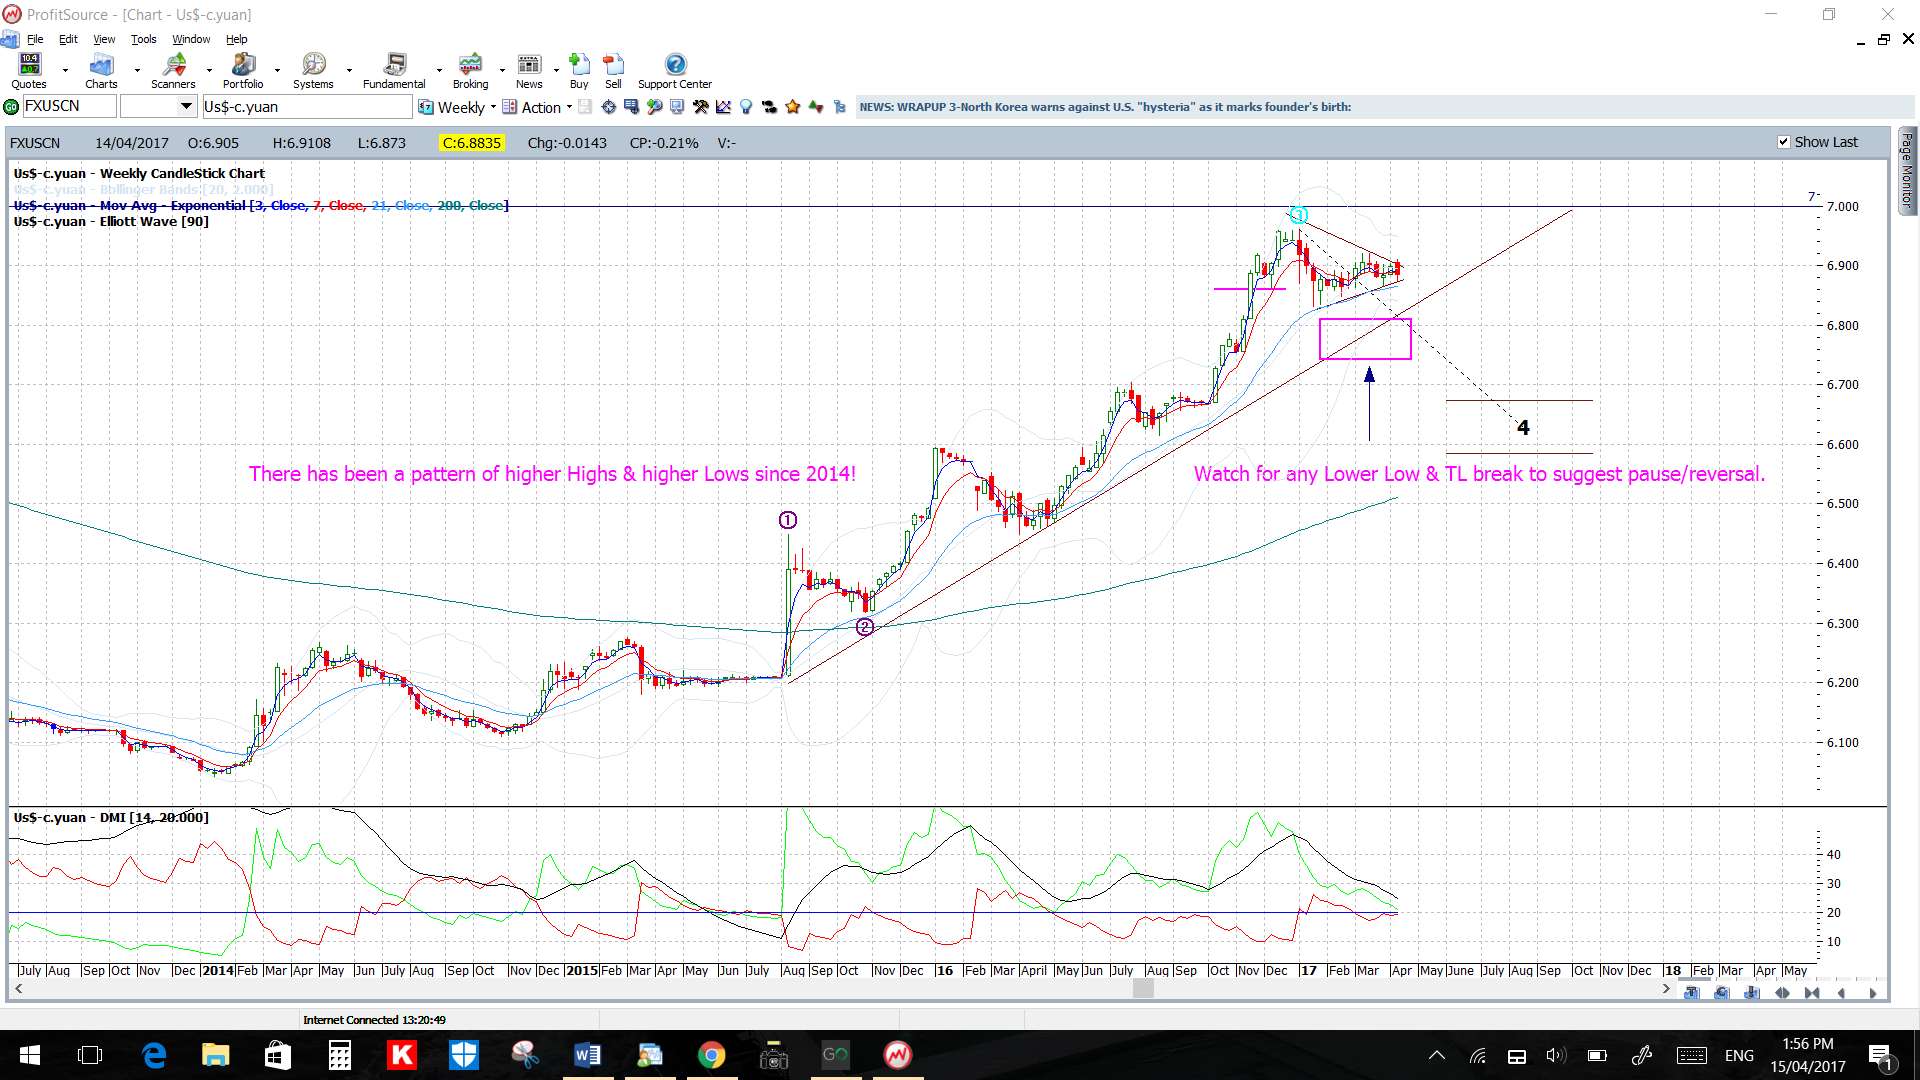
USD/CNH: Watch the daily chart’s triangle trend lines for any make or break activity:
USD/TRY: It is an important weekend for this currency pair given the Turkish Referendum on Sunday. I’d noted late last week how the retreat on this pair might slow at the 61.8% fib and this was the chart from that post:
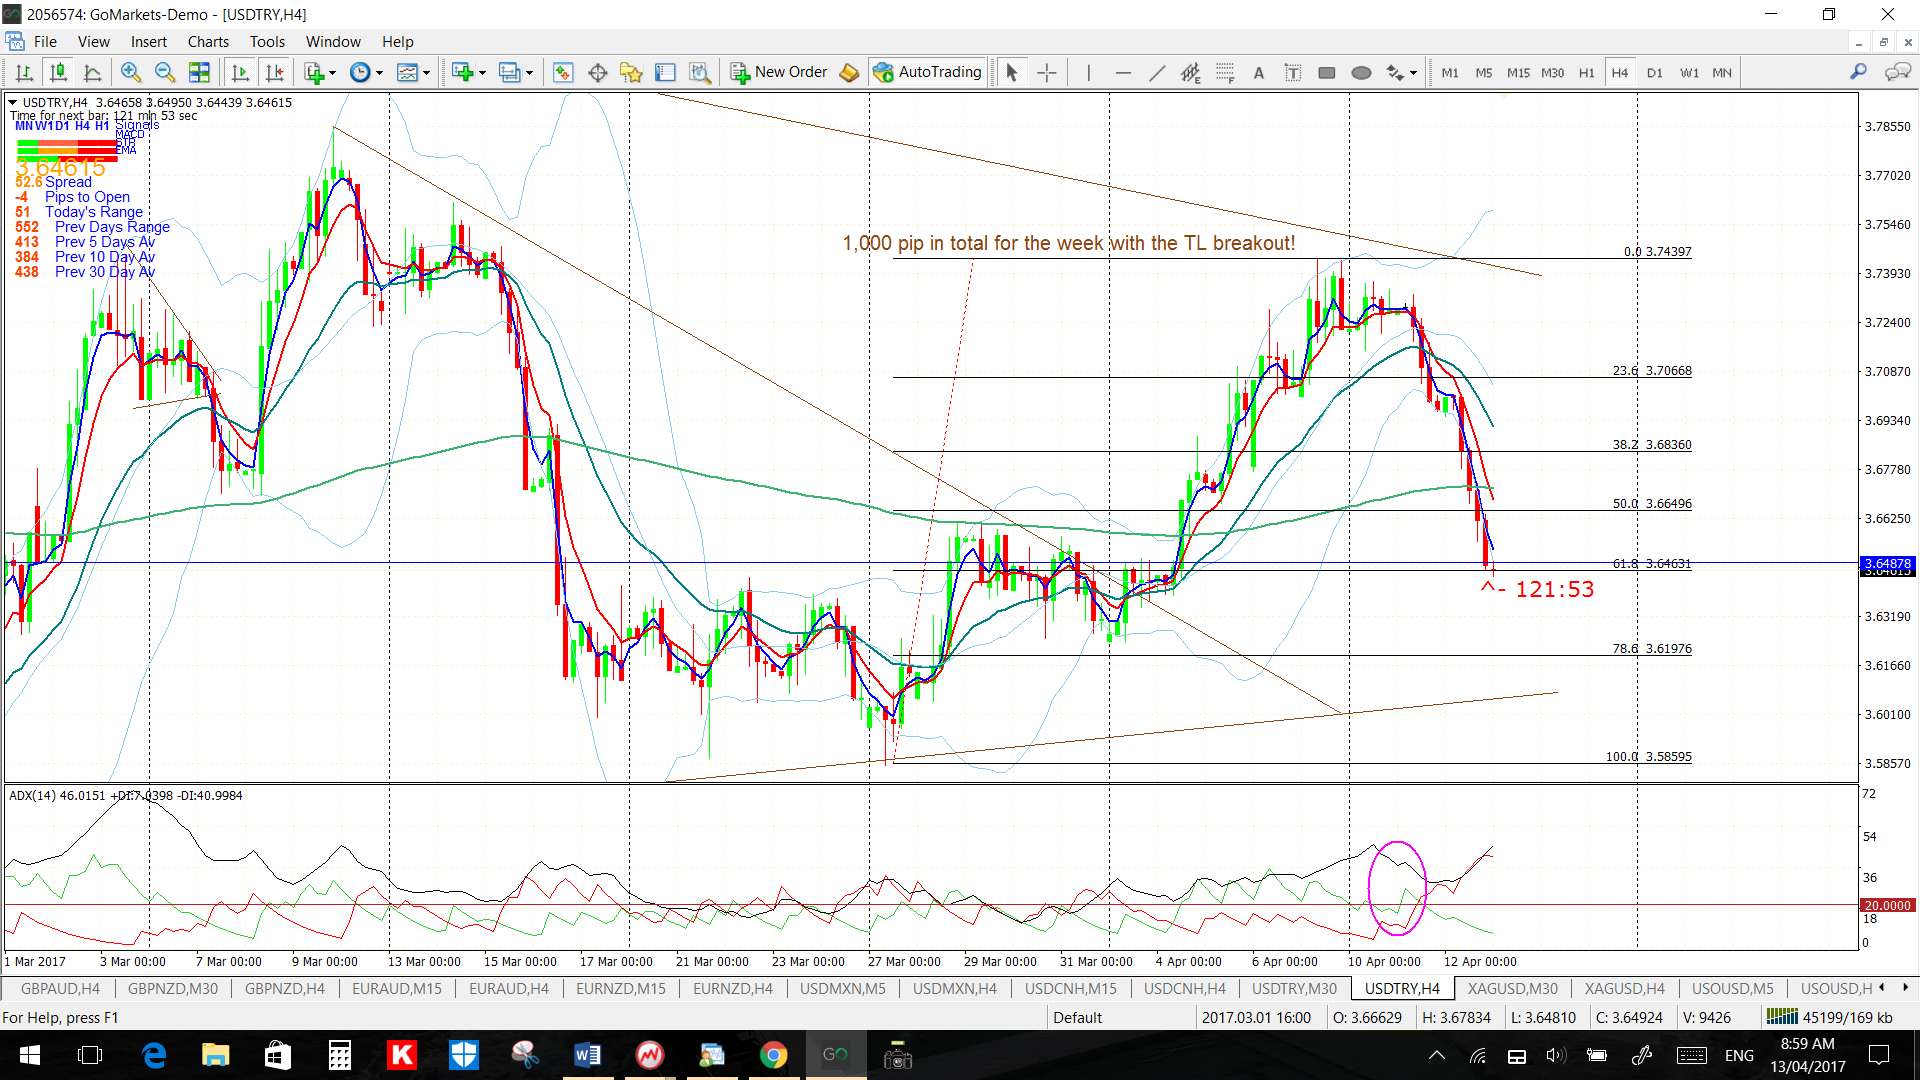
Note how this Fibonacci level was indeed respected and how price bounced back up from there…. twice!
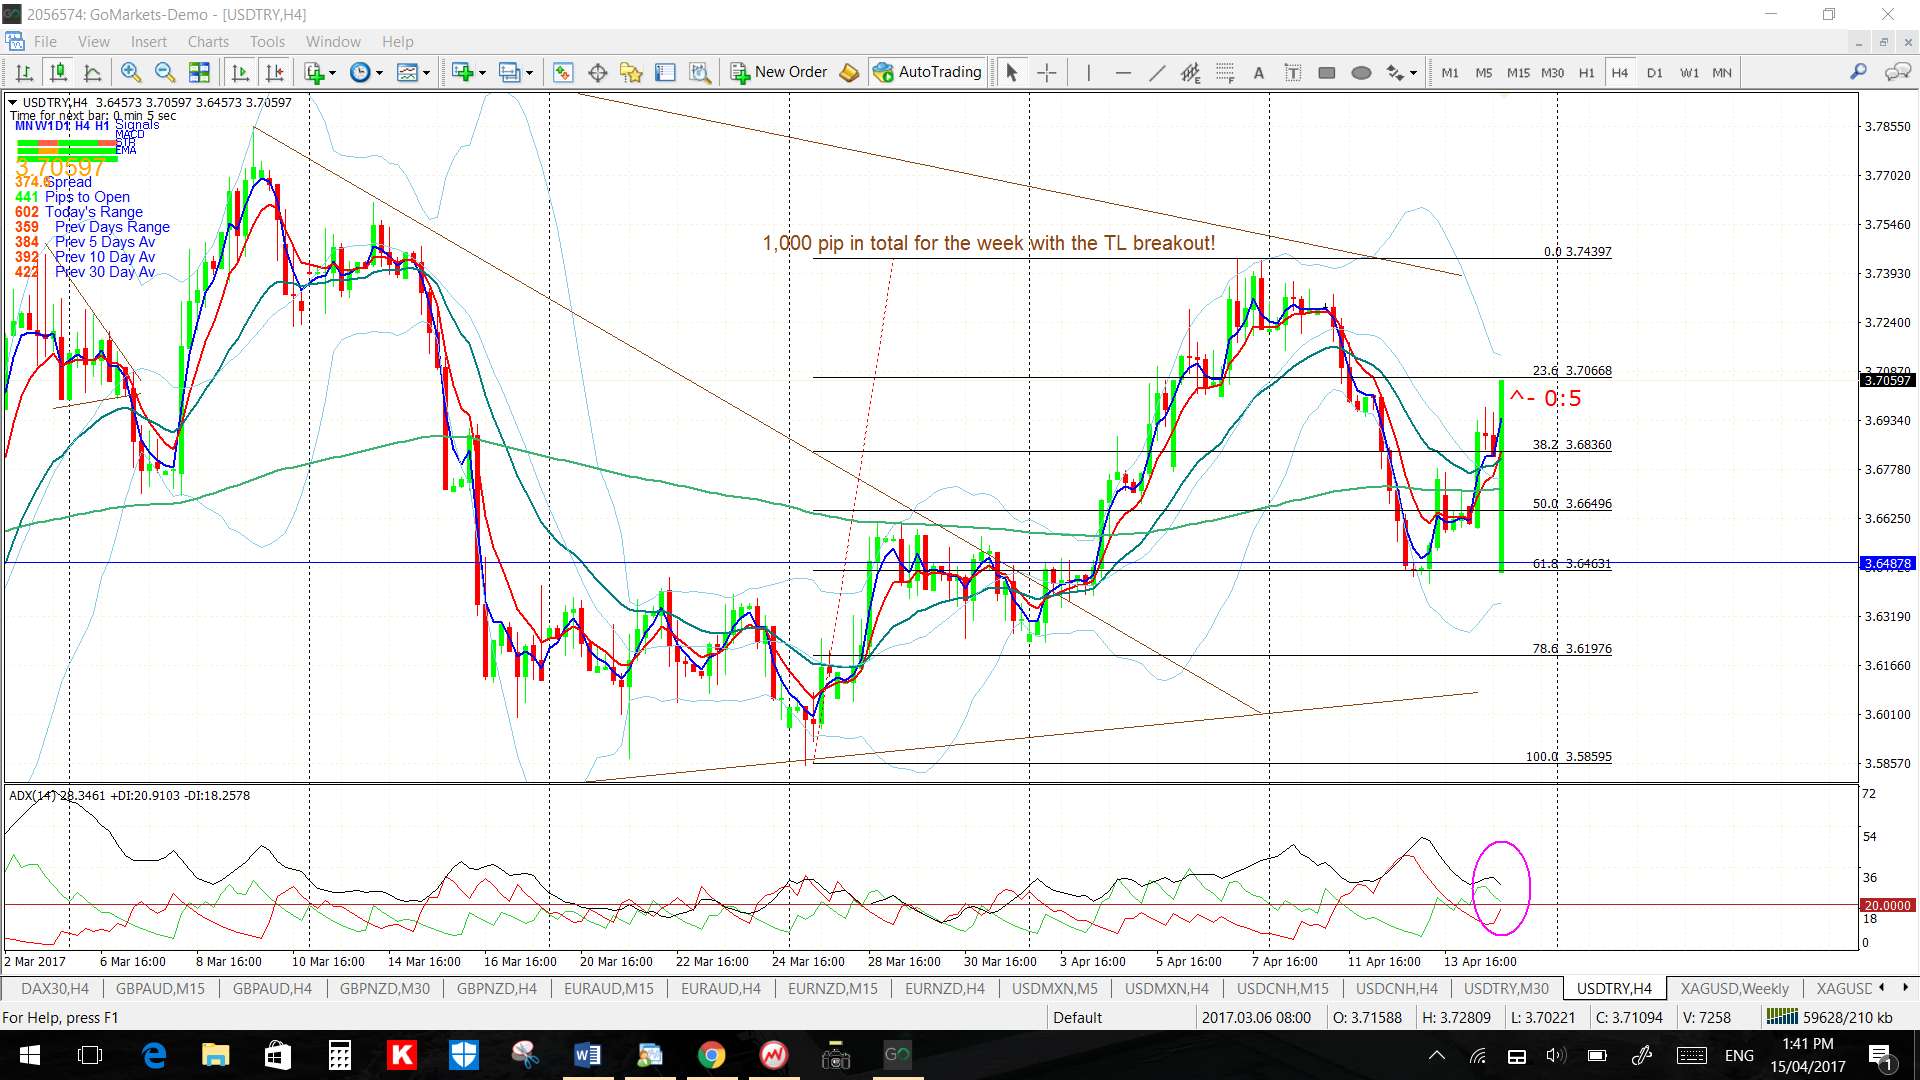
Keep an eye on the bigger-picture daily chart Flag trend lines here with this Referendum result:
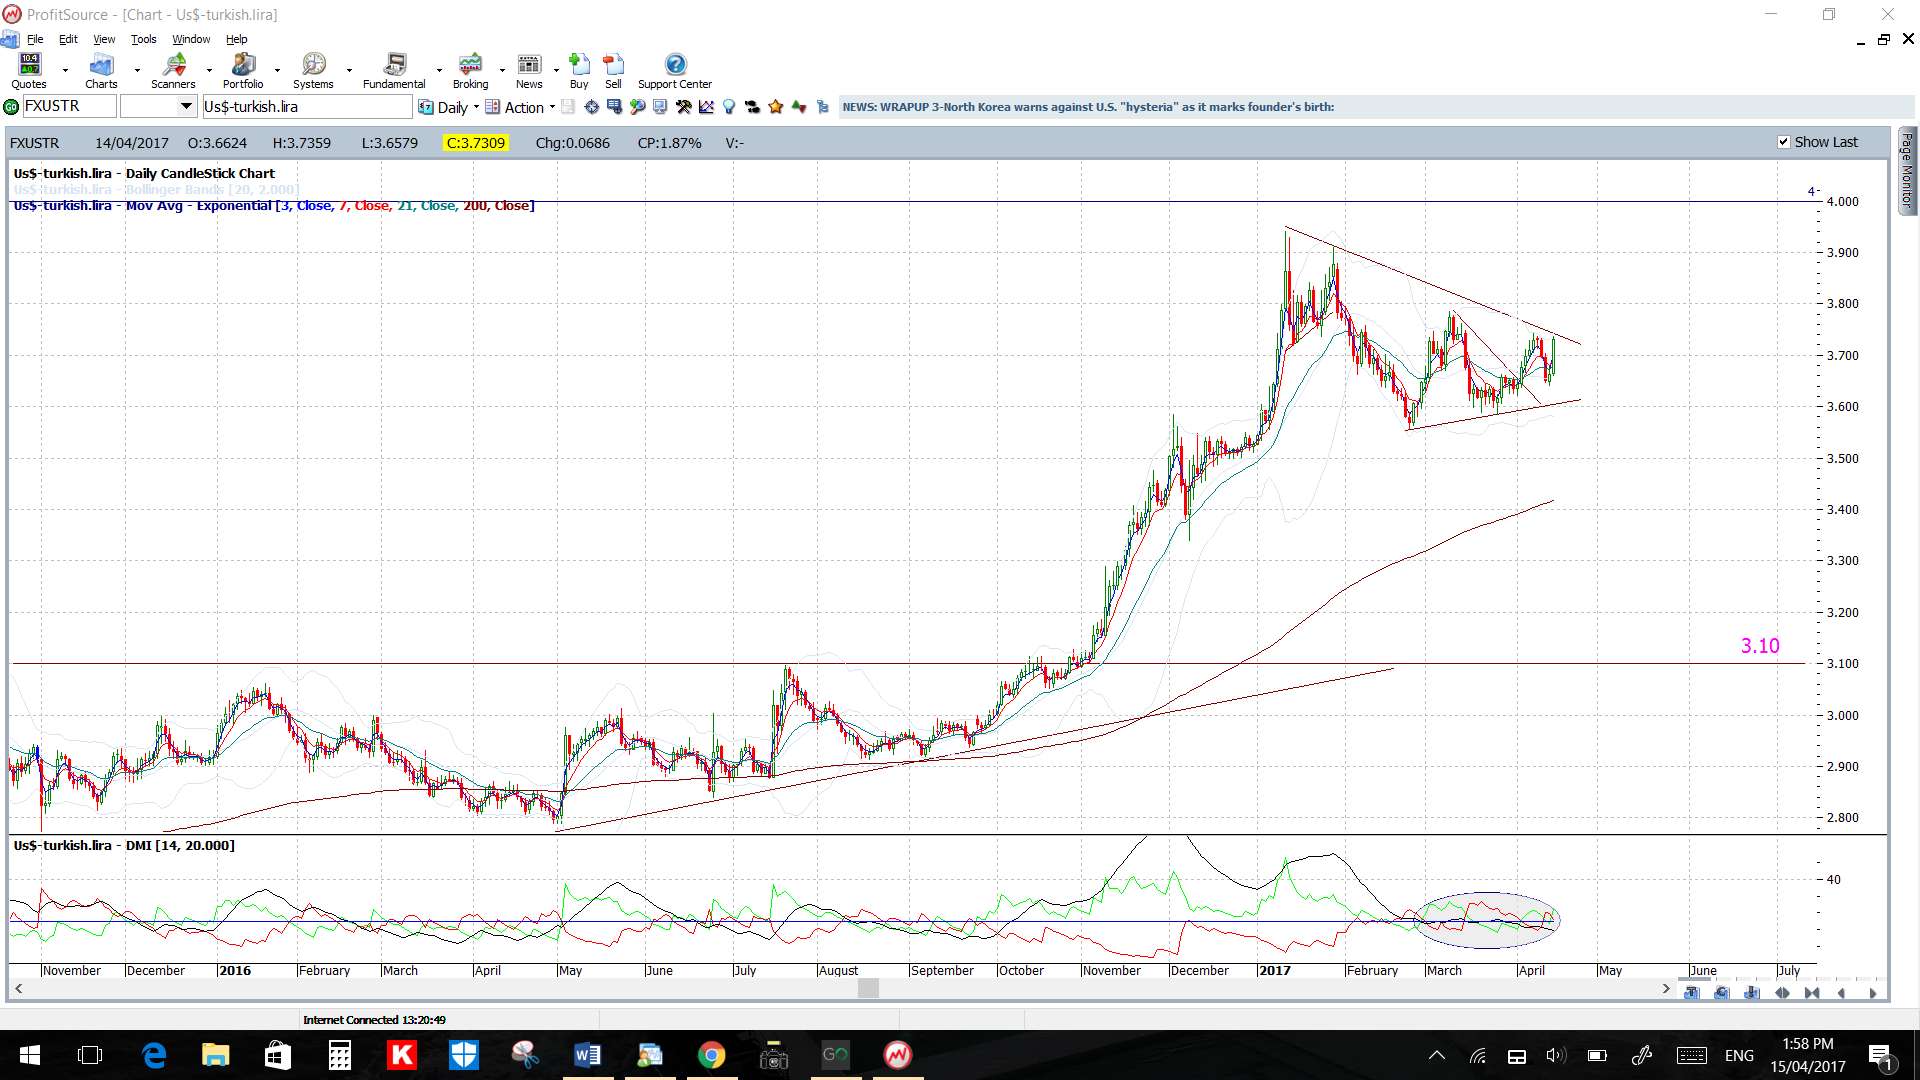
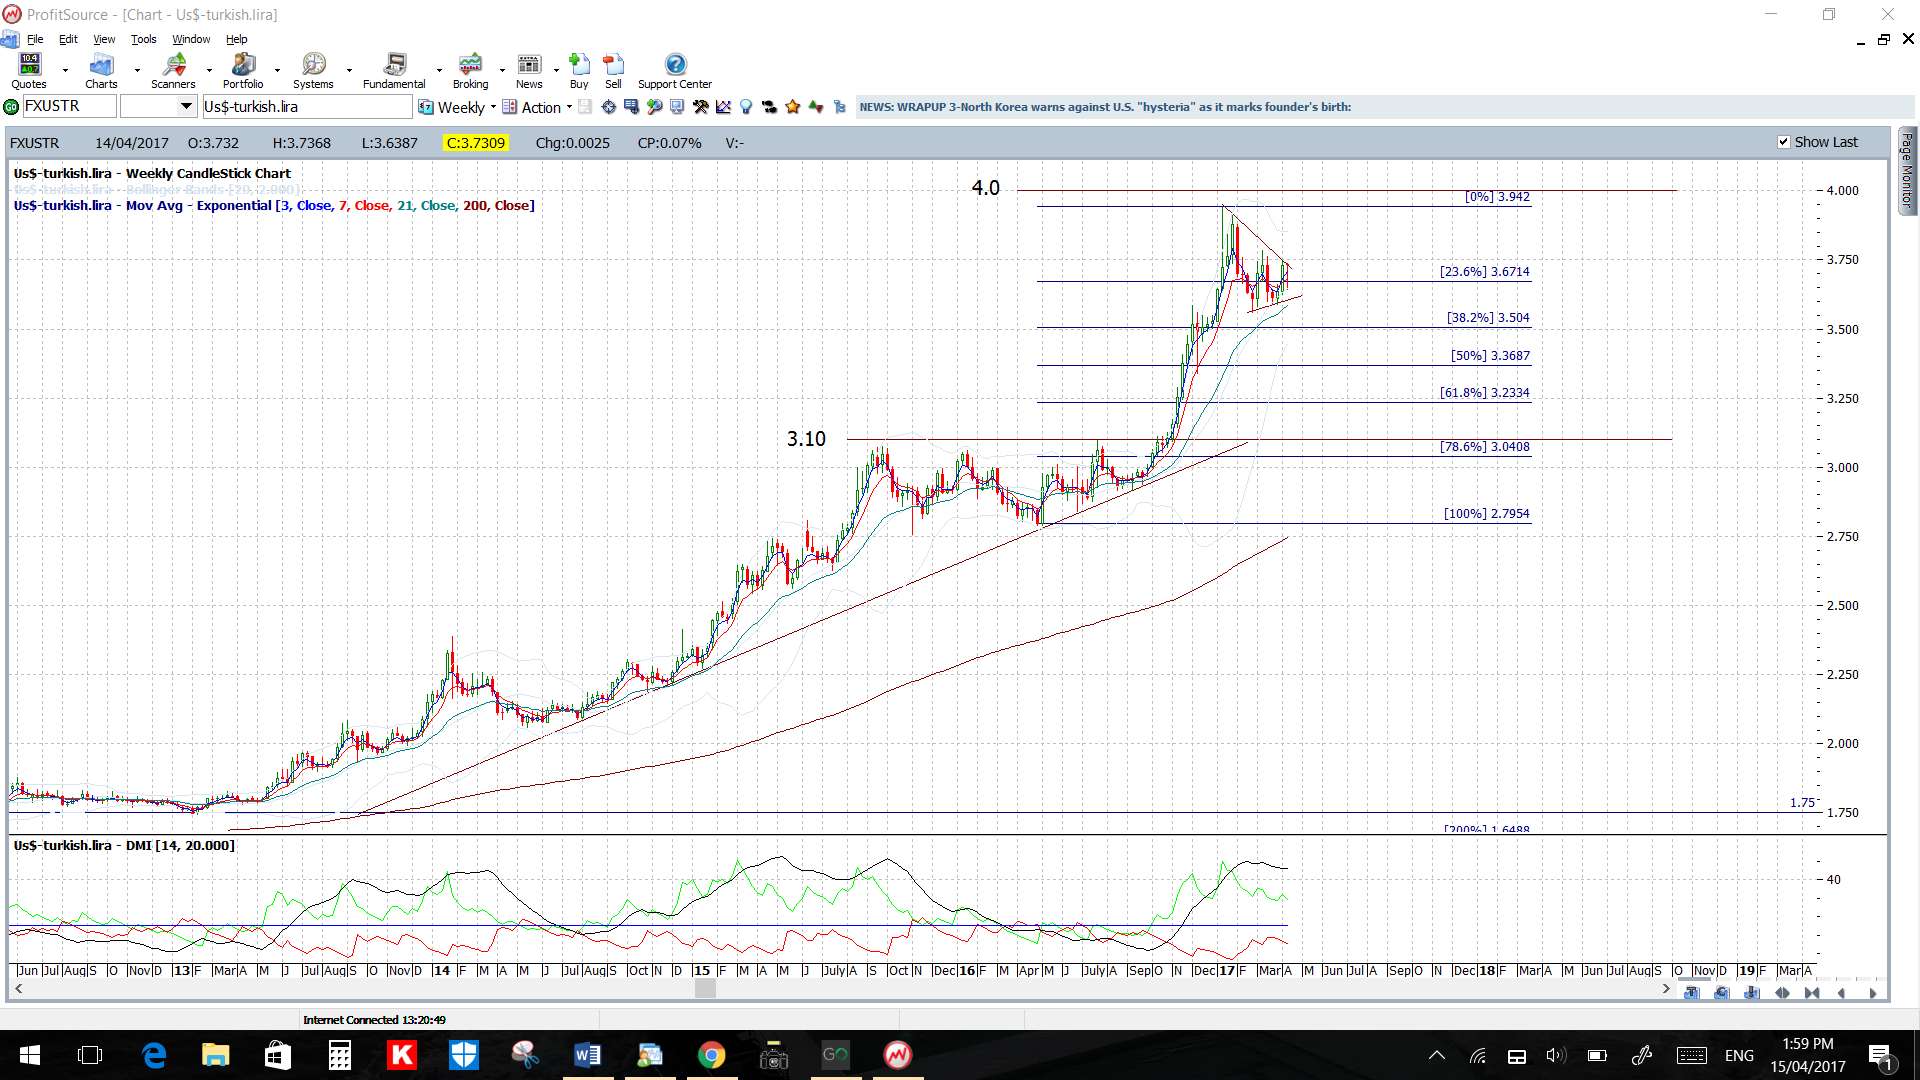
A bullish breakout will have me looking for a test of the 4.0 level. A bearish break will have me looking for a test of the 61.8% fib and 3.10 S/R level:

Source: tradecharting.com