Last week: there were plenty of trend line breakout trades last week but more are setting up in the Easter week ahead. Easter is known as a period of New Life and continued US$ strength could give this index new life but create havoc for some direct and indirect Forex pairs.

Successful Breakout Signals: Last week’s tally of maximum movement was up to 3,355 pips but two exotic pairs contributed most of that with 2,500 pips between them (USD/TRY and USD/MXN). Regardless of which pair gave what, all of the charts were posted here in advance and available for anyone to track for potential breakout movement trades. The following is a pip tally of successful trend line breakout trades with summaries offered mid week through posts here, here and here.
- Gold: 120 pips.
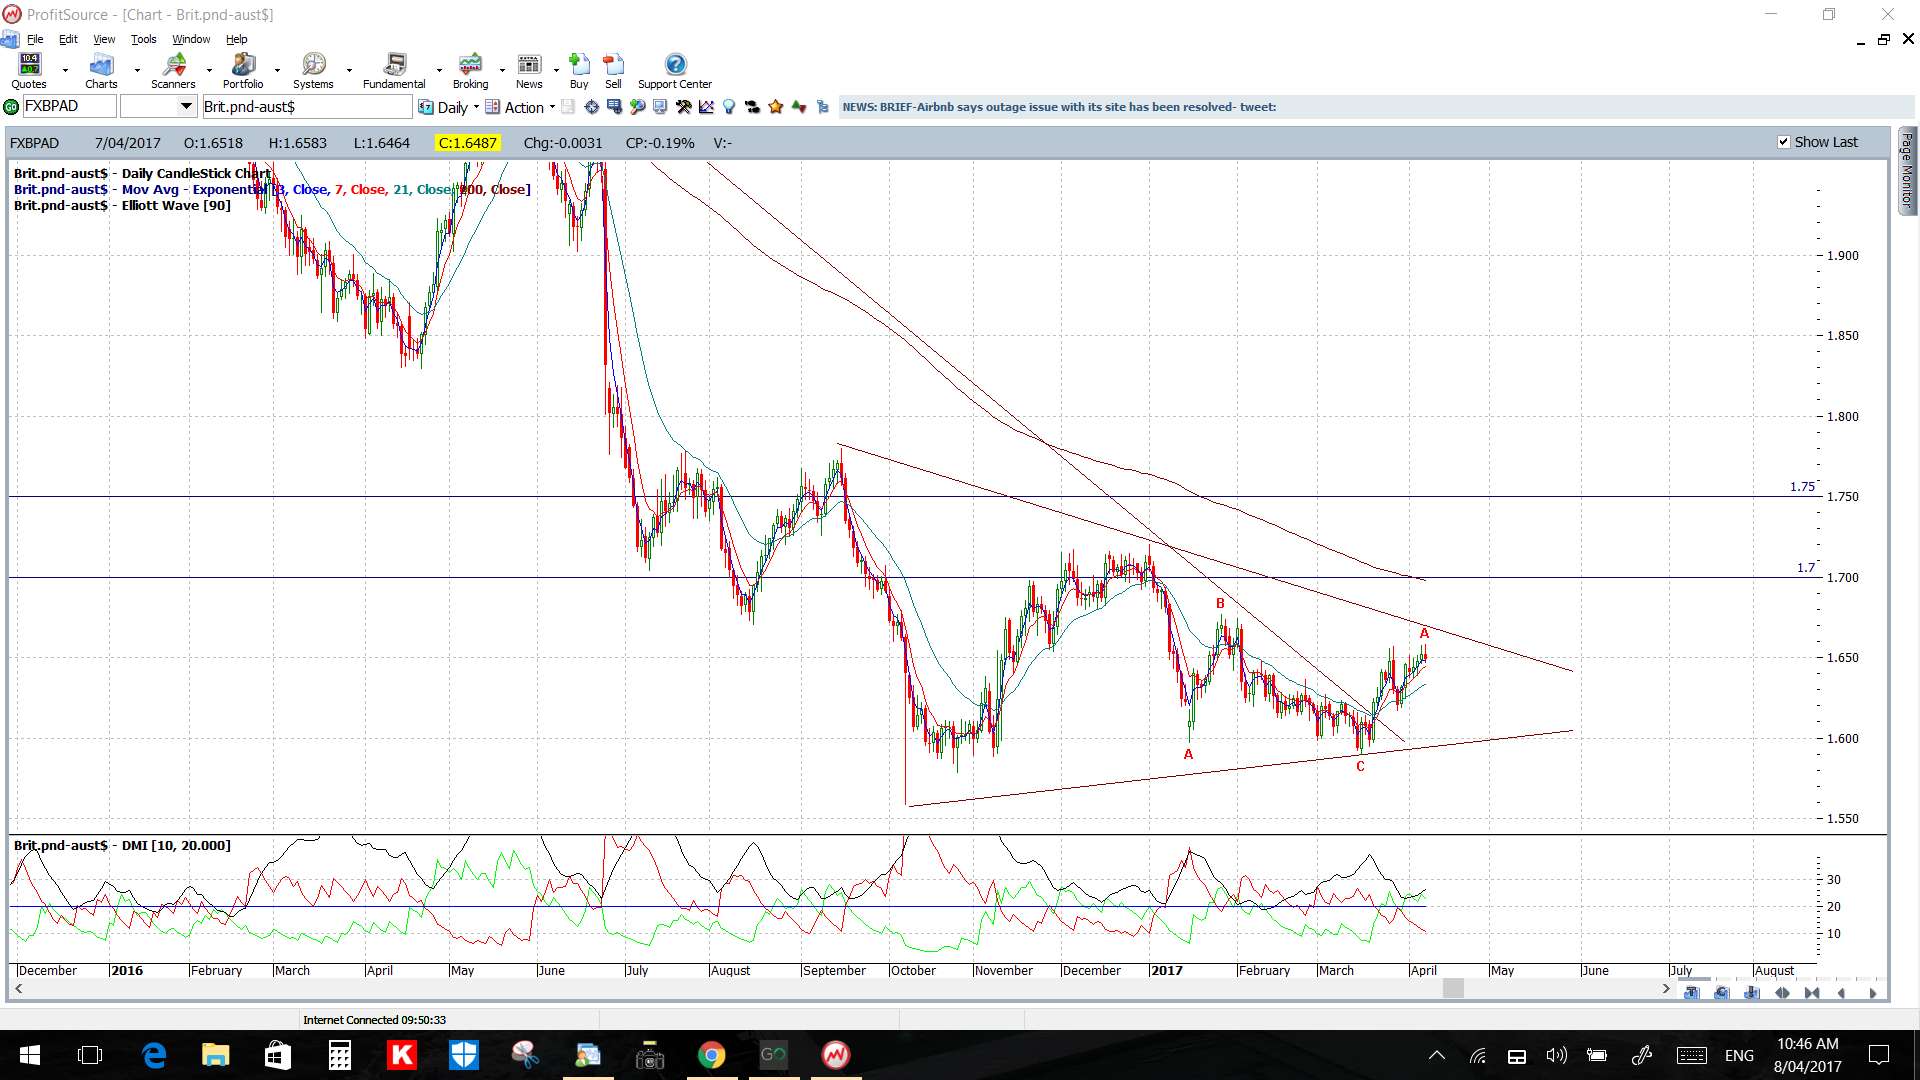
- GBP/AUD: 80 pips.
- GBP/NZD: 70 pips and another later in the week for 100 pips & then 80 pips.
- USD/MXN: 1,500 pips.
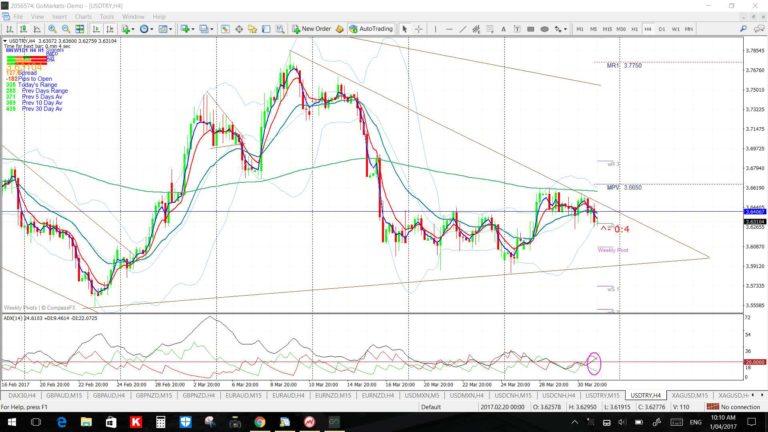
- USD/TRY: went on for the week to give 1,000 pips.
- USD/CAD: 80 pips.
- USD/CNH: 170 pips.
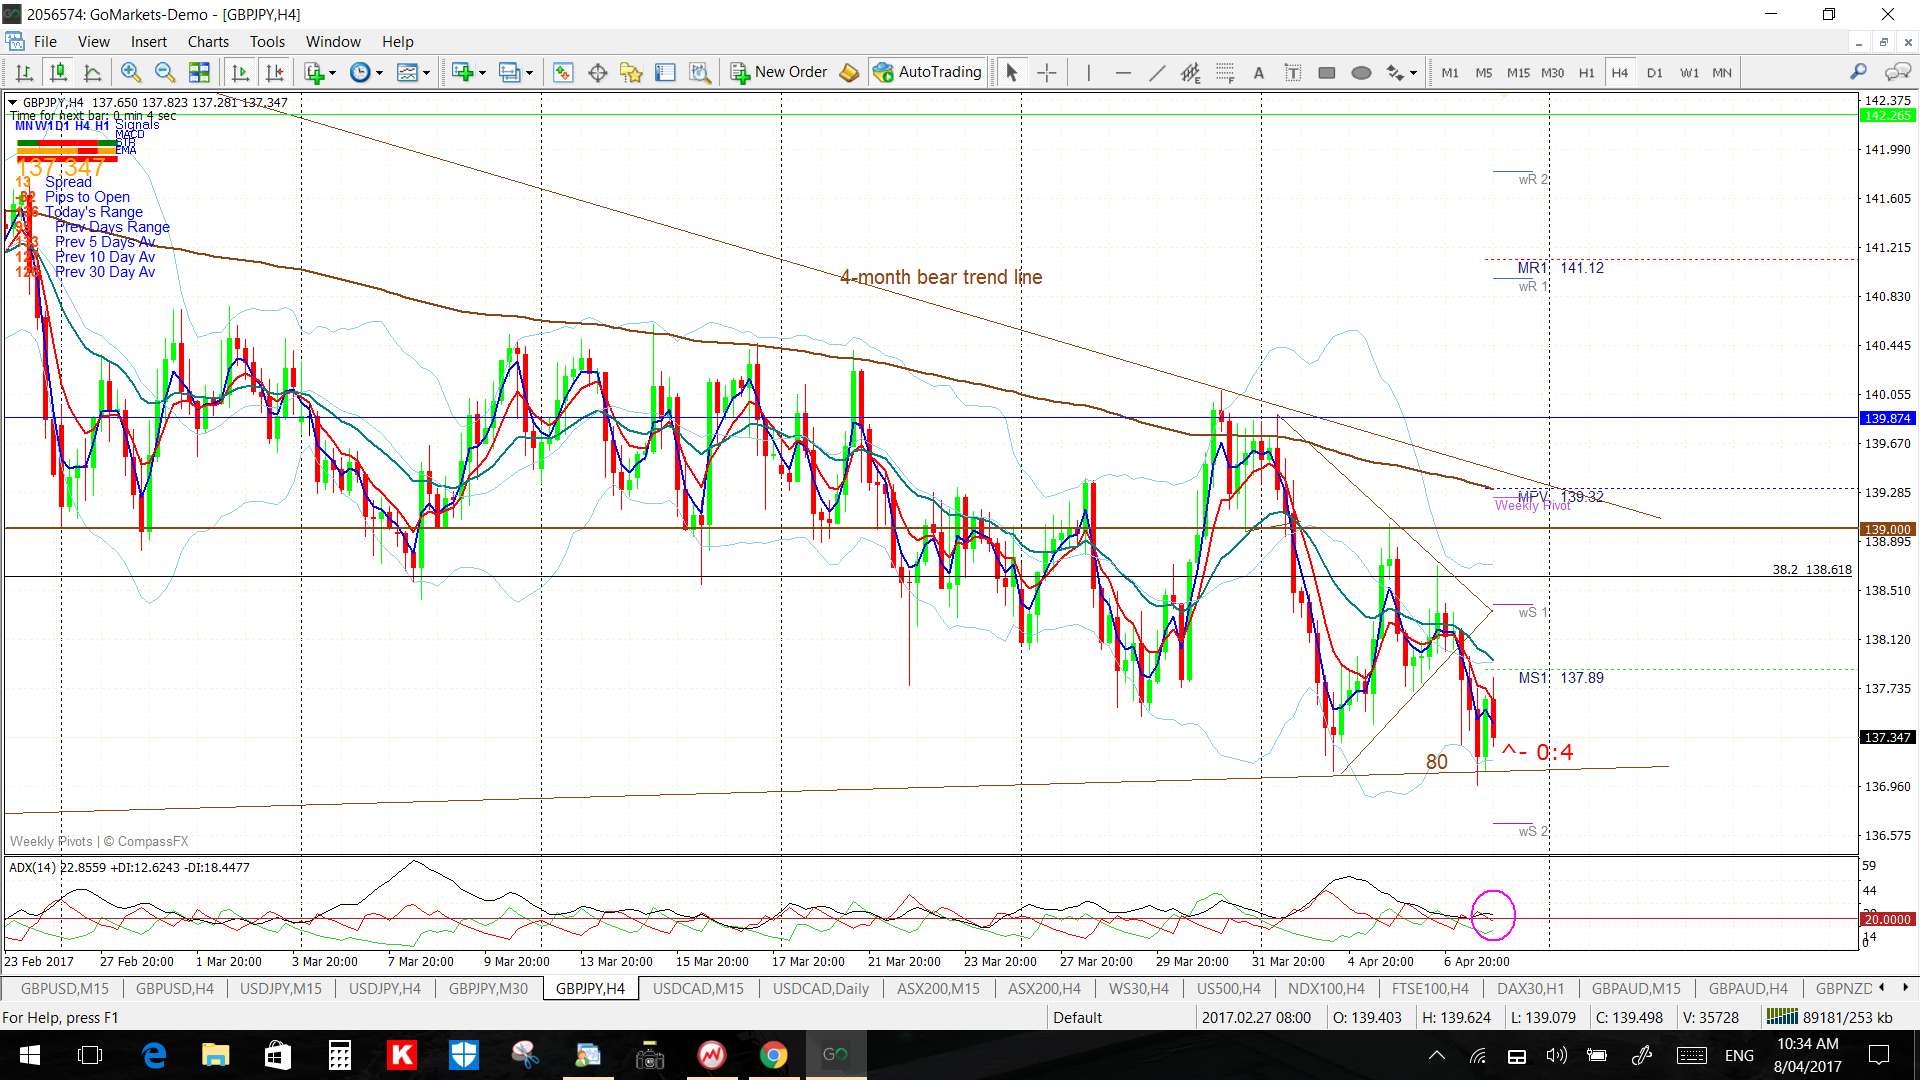
- GBP/JPY: 80 pips.
- GBP/USD: 75 pips.
Next week:
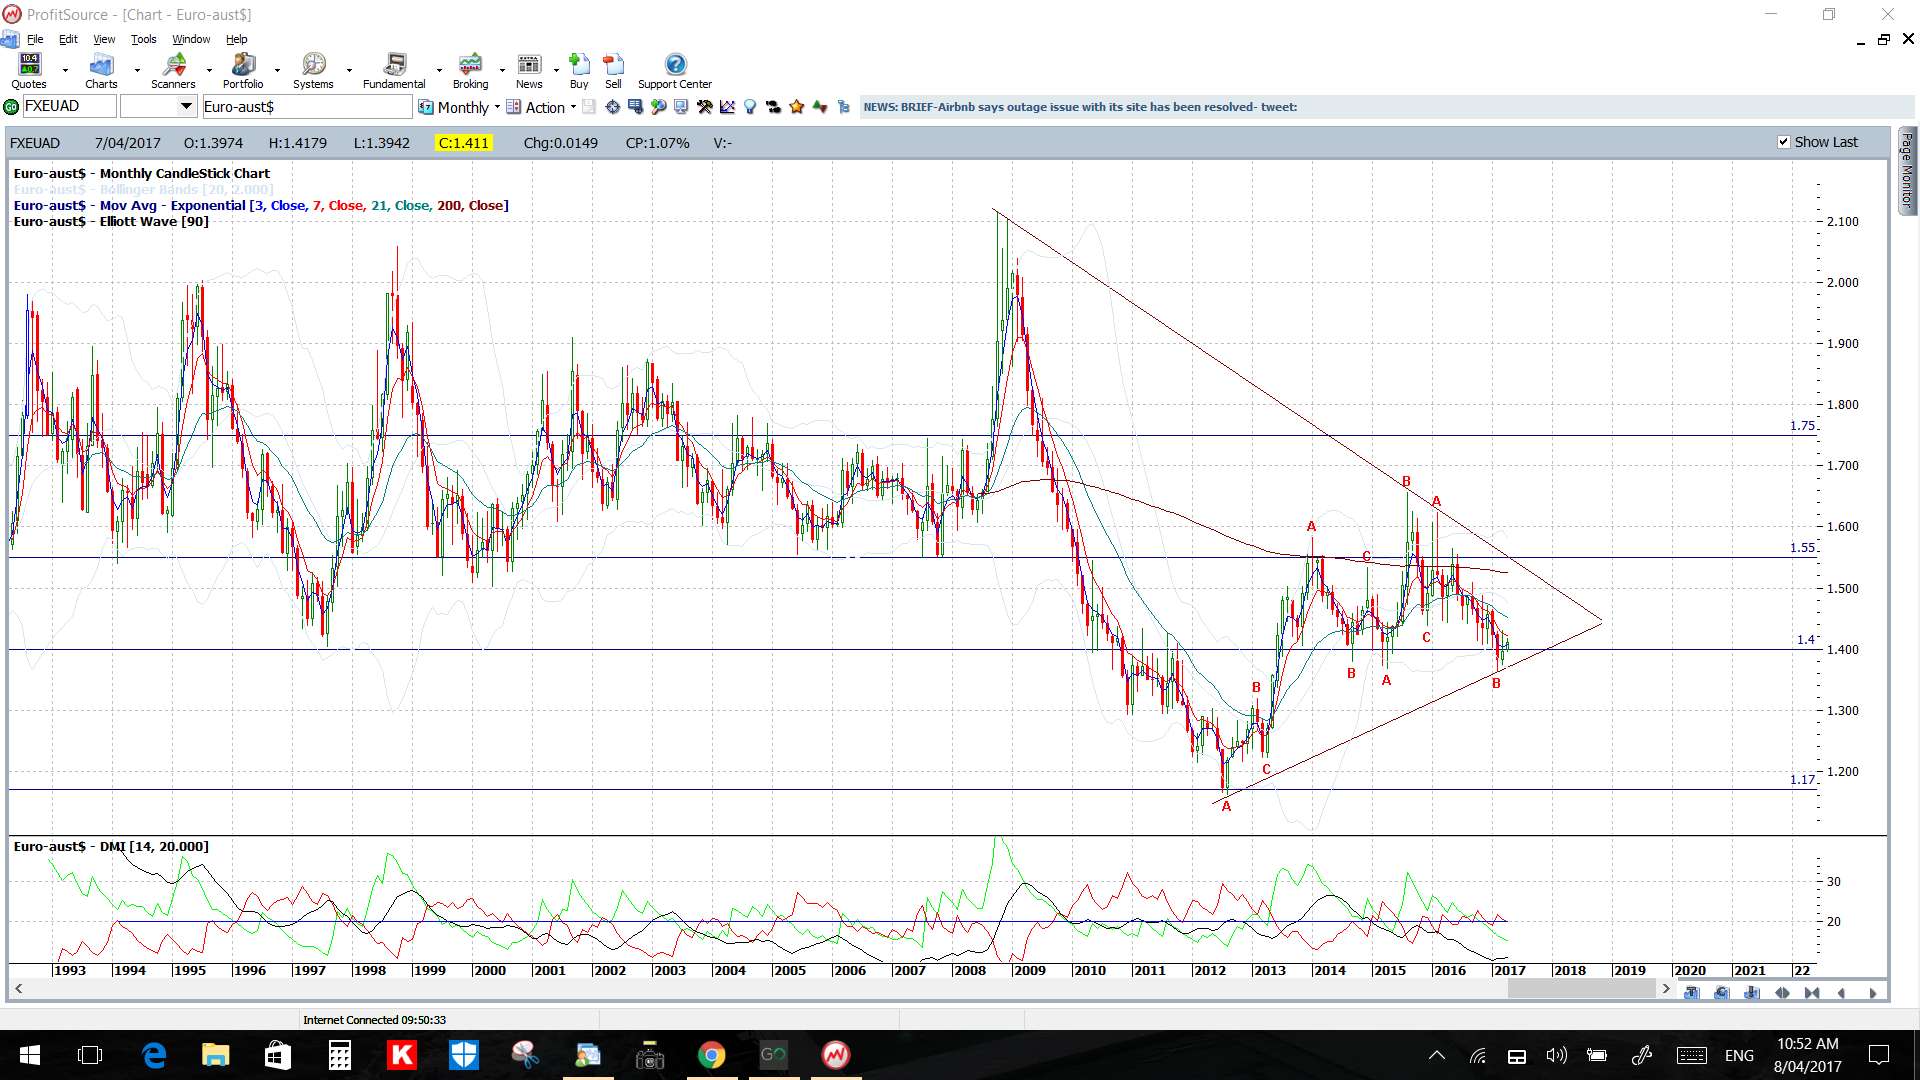
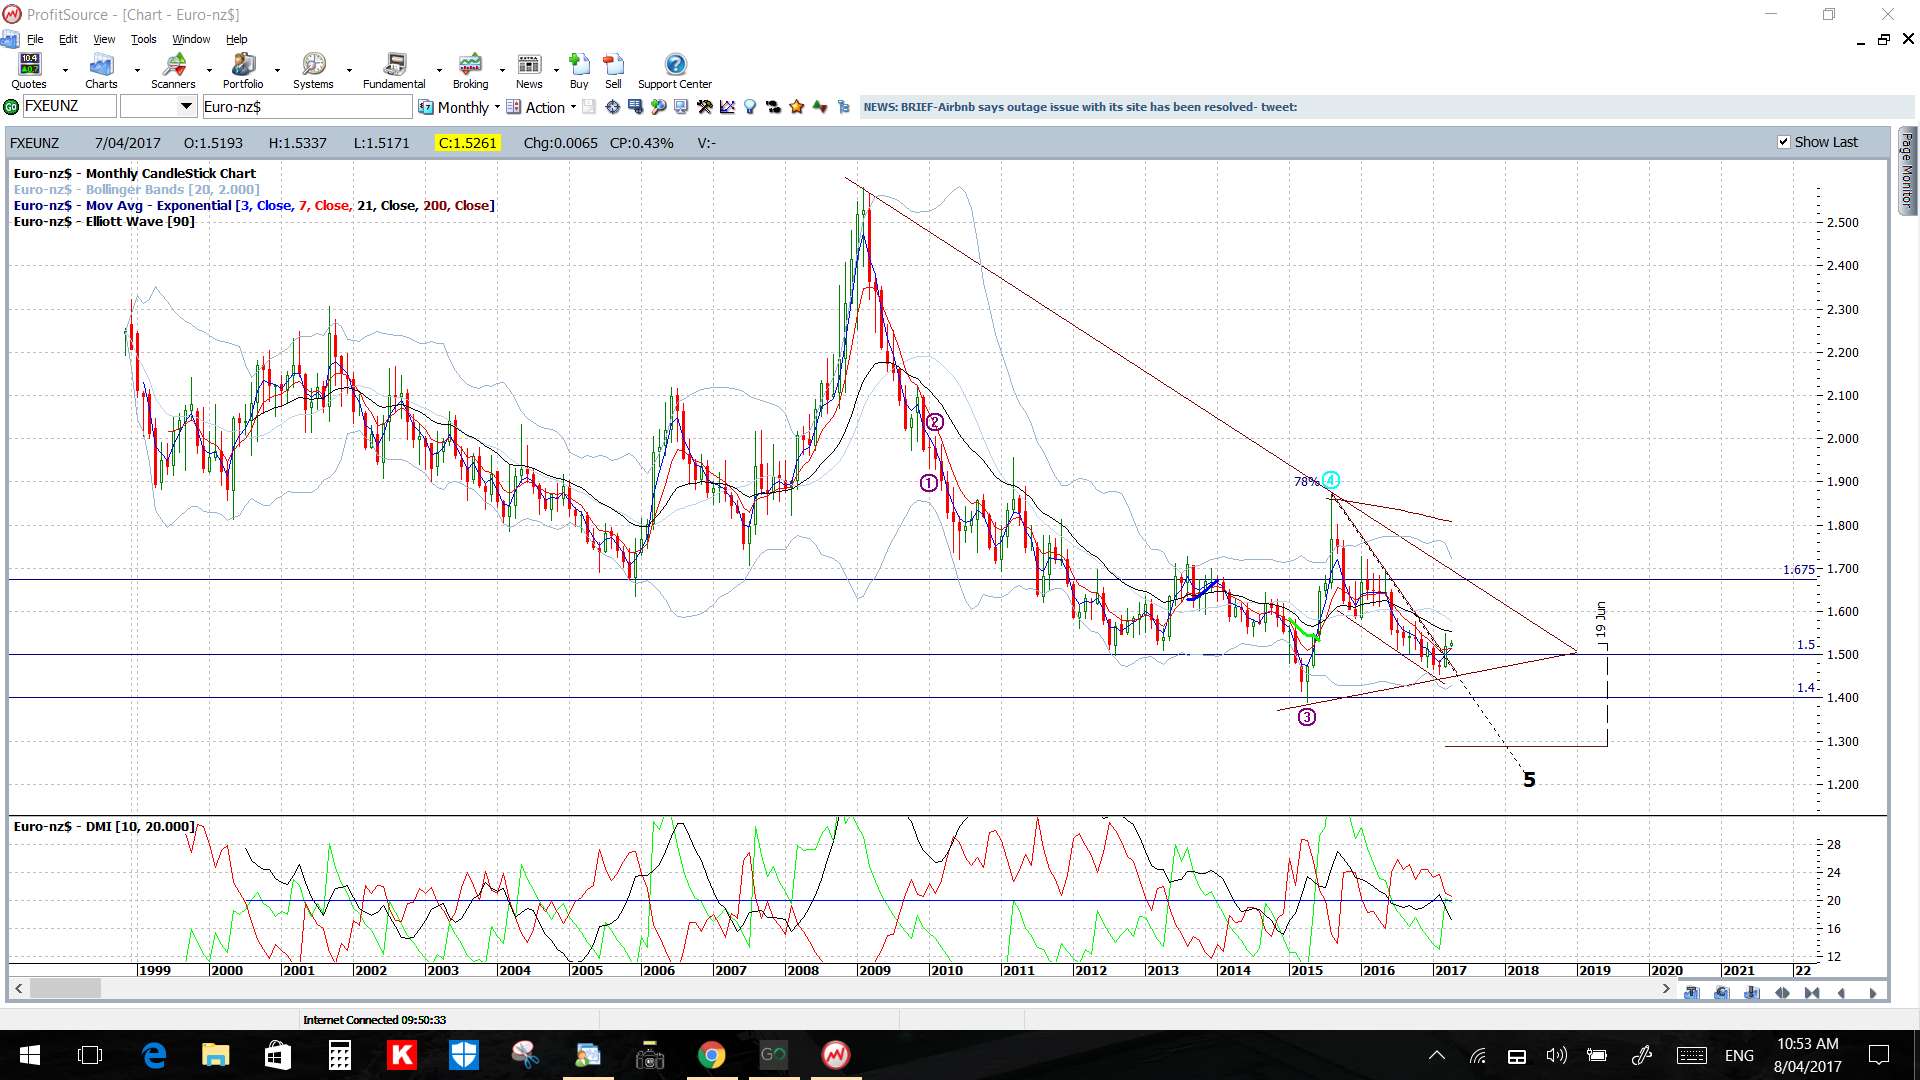
- US$: The US$ closed higher last week and I’m watching for any bullish follow-through with a review of the FX Indices found through thislink. The FX Indices are close to tipping into alignment for LONG US$ and SHORT EUR$ and, if this evolves, it would have implications for trading currency pairs. I would expect in this situation that the direct and indirect currency pairs, eg USD/JPY, EUR/USD, AUD/USD etc, might offer better trading opportunities and the cross pairs, eg GBP/AUD, EUR/NZD, might become more choppy.
- Gold & Silver: both precious metals are flirting near 6-year bear trend lines but the success or otherwise at these resistance zones might depend on whether the US$ keeps appreciating. Under normal circumstances, a stronger US$ would generally put pressure on these two but in heightened ‘risk-off’ periods, as was seen with the recent Syria situation, both entities may gain. Thus, watch geo-politics and the US$ with these two.
- TC Trigger: this continues to be of help with the breakout trades and updated information about this indicator can be found through thislink.
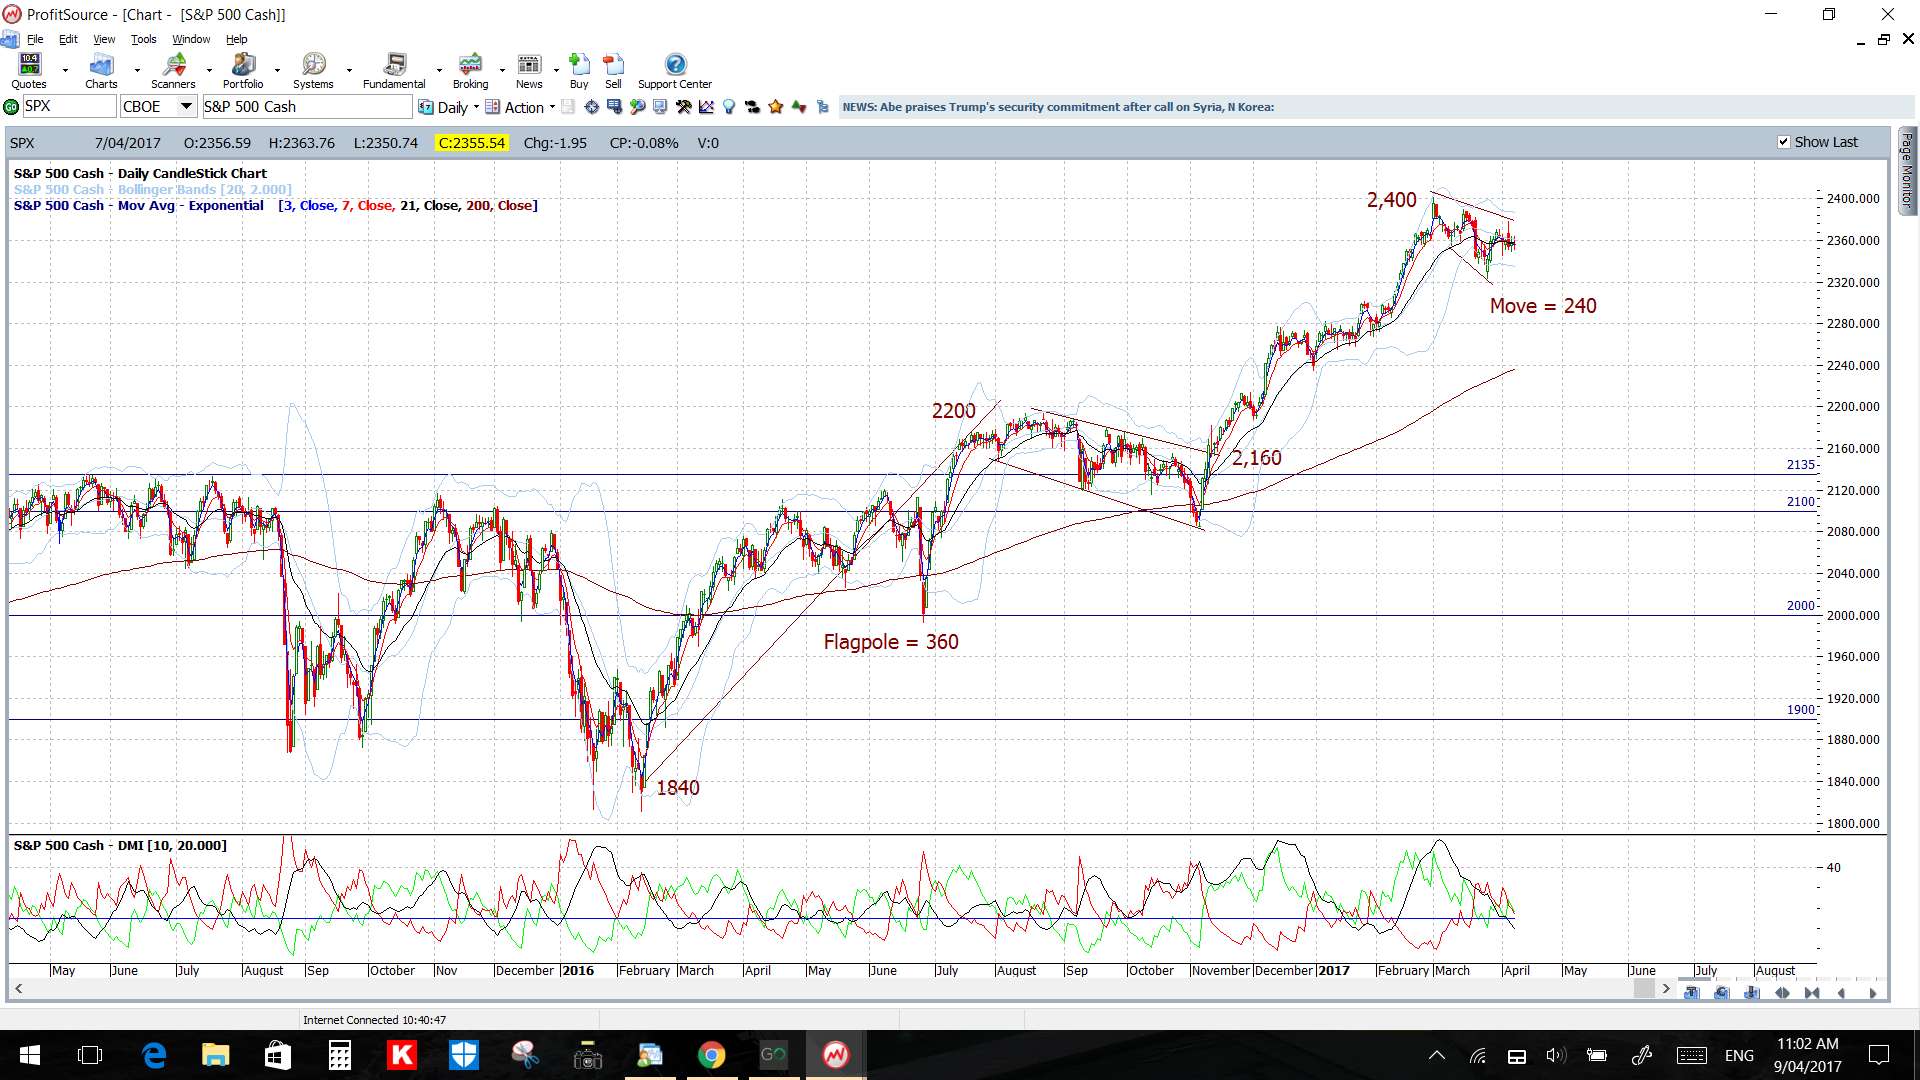
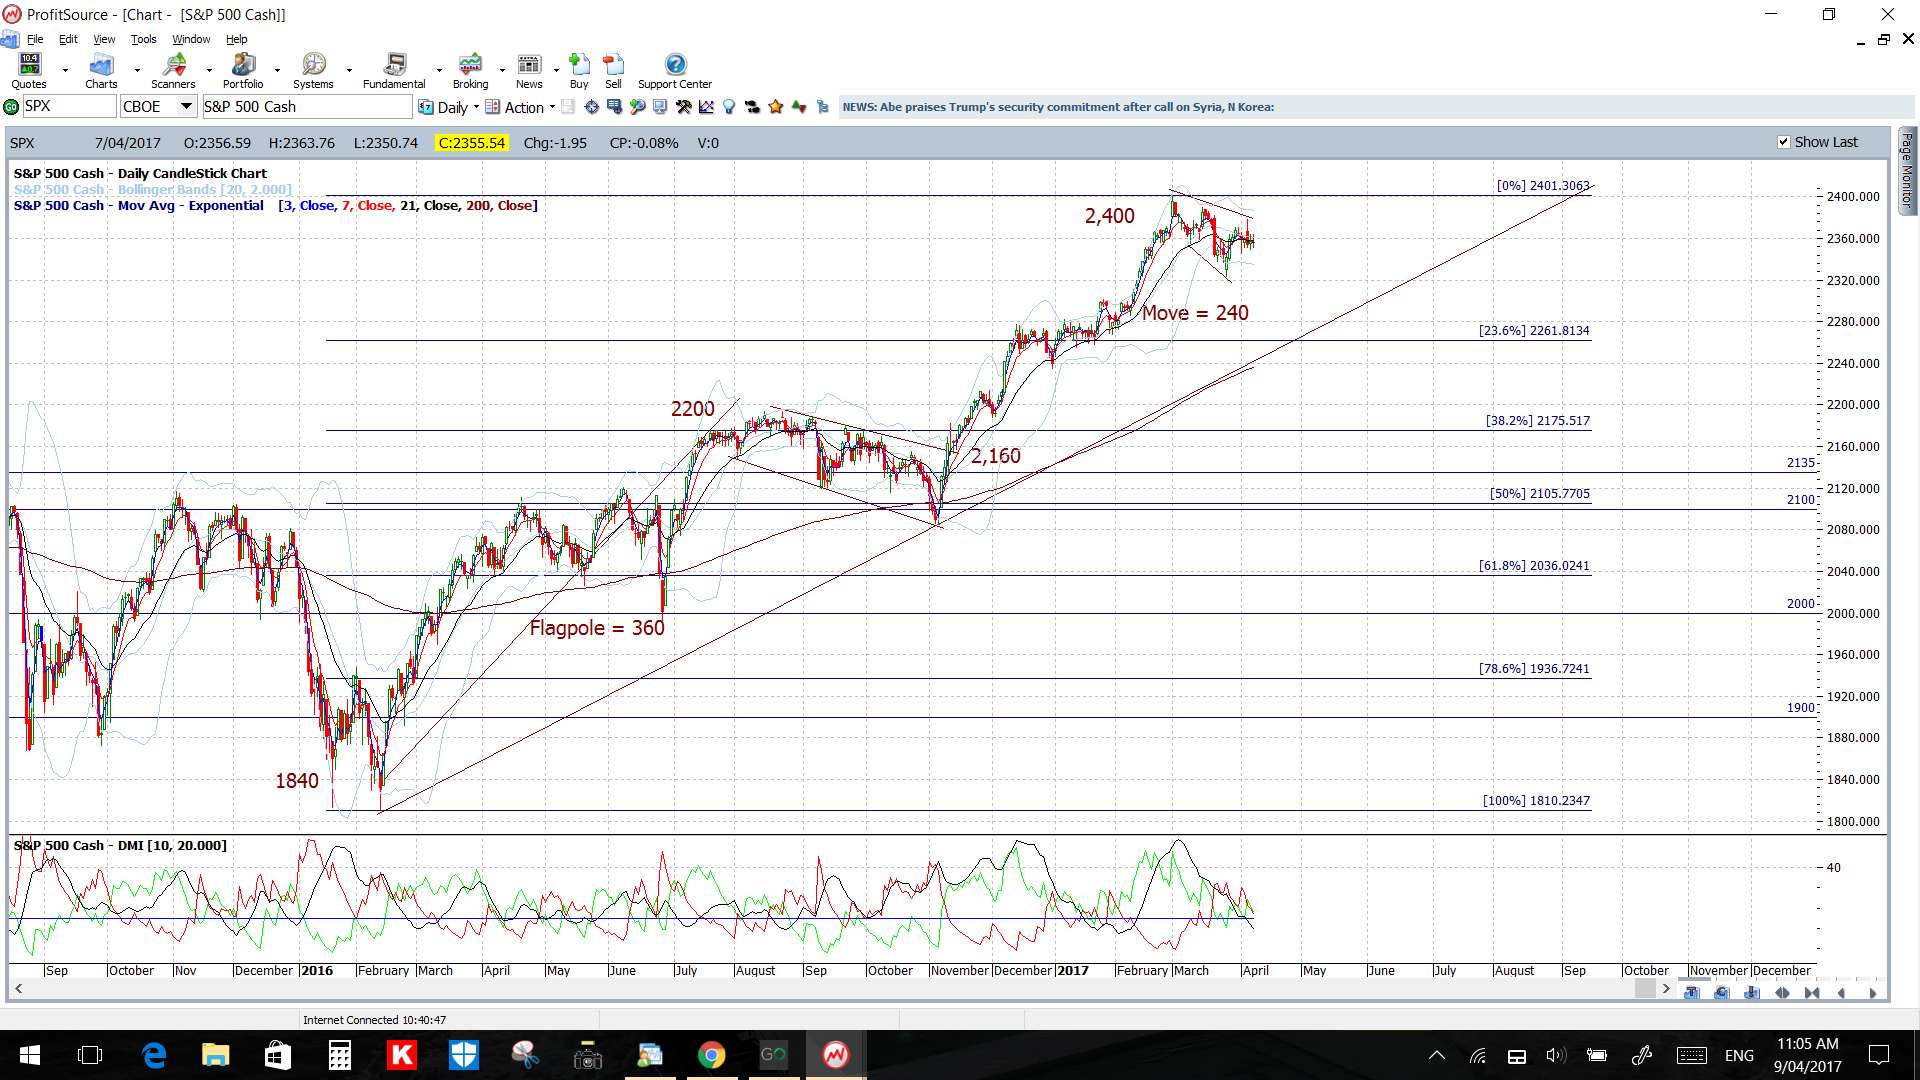
- S&P500: the last Bull Flag move has not completed but another consolidation Flag is forming. I note that a support trend line has been in play since the start of this year and that will gain in focus if risk aversion takes hold. Note how the 50% fib of this swing high move is down near previous S/R of 2,100 and this would be the target of any pullback move should this trend line be broken (click on charts to enlarge):
S&P500 daily:
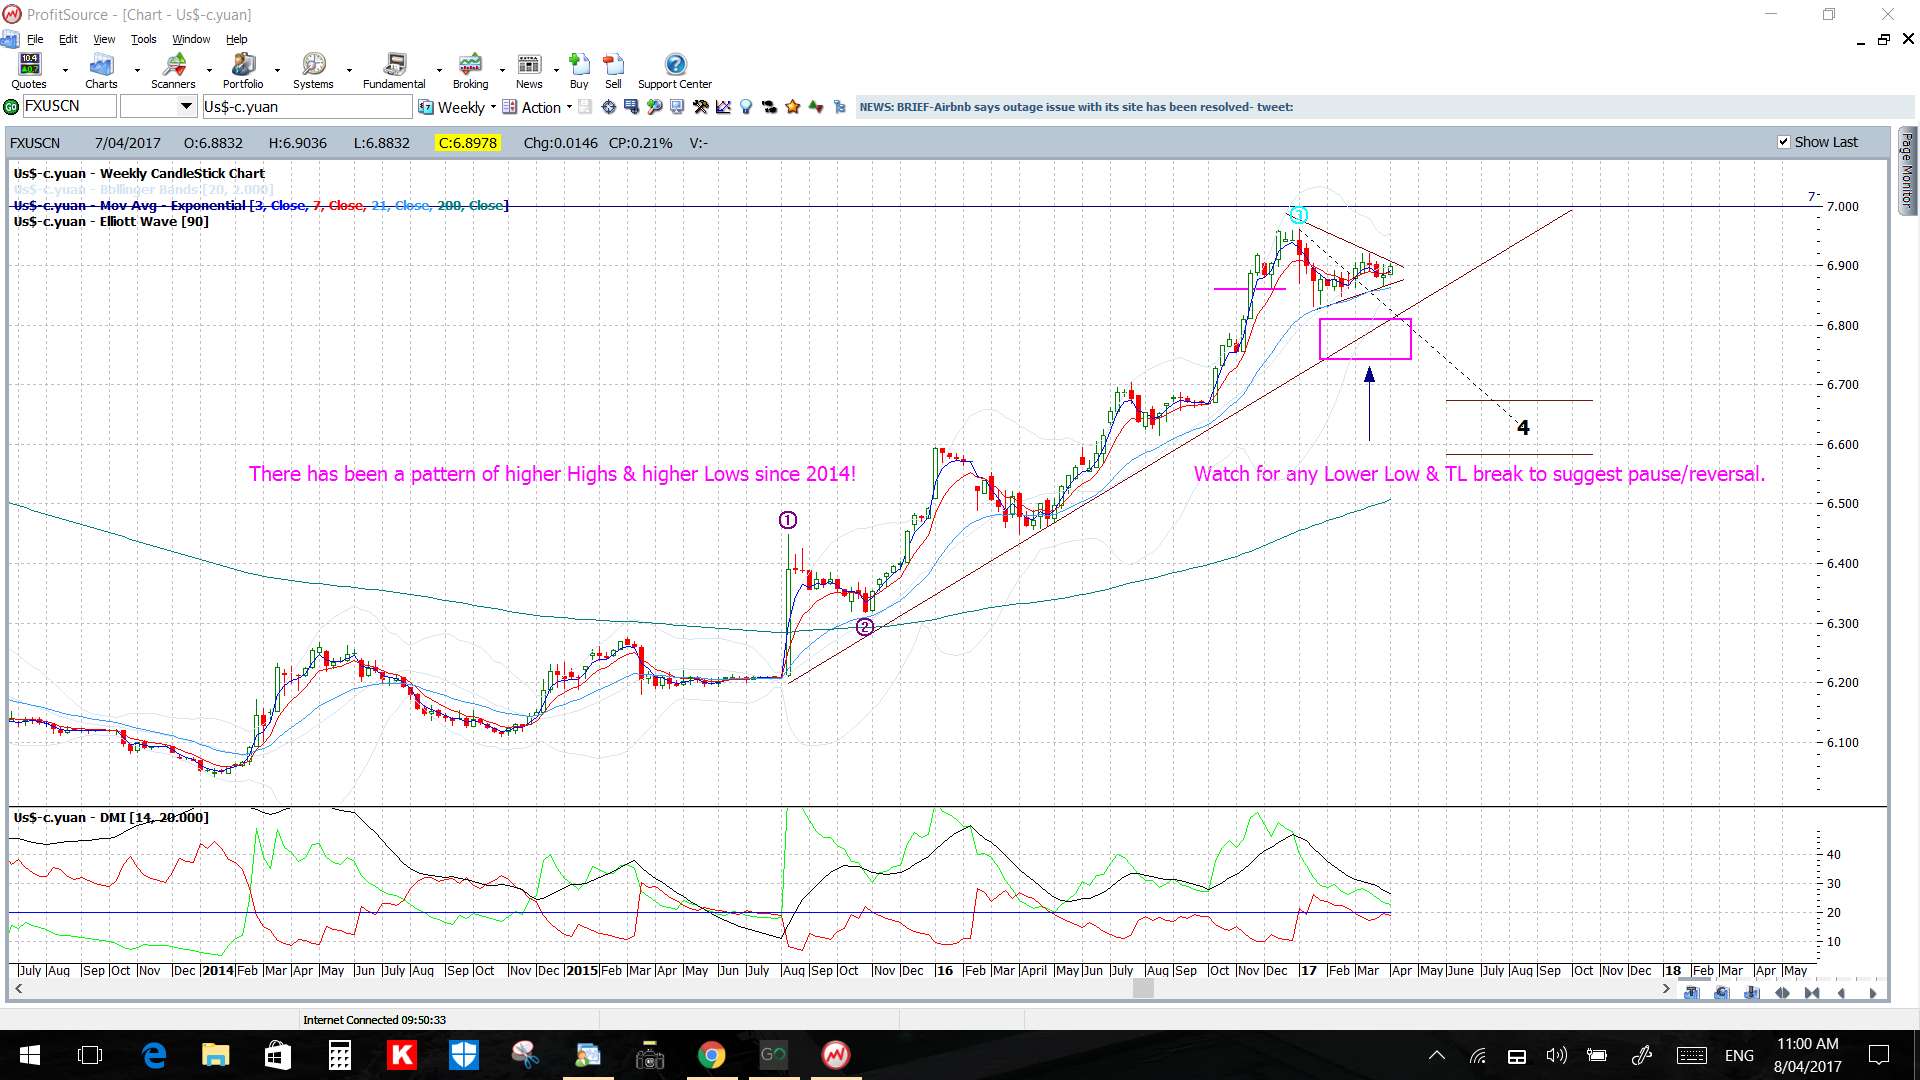
- Exotics: a few of the exotic pairs, USD/CNH, USD/MXN and USD/TRY, are at trading extremes in the wake of this renewed US$ strength and continuation there could tip these pairs into new trading ranges. This brings the possibility of lengthy new trends though so keep an eye on the US$ for clues.
- Easter Period: blog updates might be less frequent and brief over the next week with Easter.
Calendar:
- Mon 10th: USD Fed Chair Yellen speaks.
- Tue 11th: GBP CPI.
- Wed 12th: GBP Employment data. CAD BoC Rate Update & Press Conference.
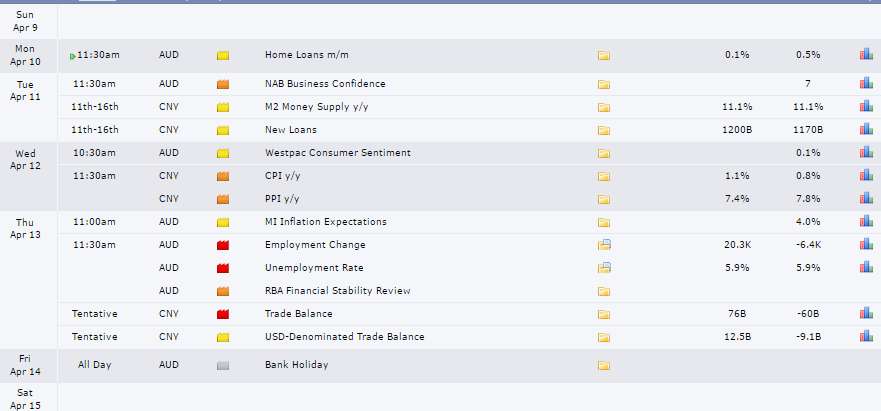
- Thurs 13th: AUD Employment data. CNY Trade Balance. CAD Manufacturing Sales. USD PPI, Weekly Unemployment Claims & Prelim UoM Consumer Sentiment.
- Fri 14th: Good Friday: AUD, NZD, EUR, CHF, CAD & GBP: Bank Holiday. USD CPI & Retail Sales.
Forex:
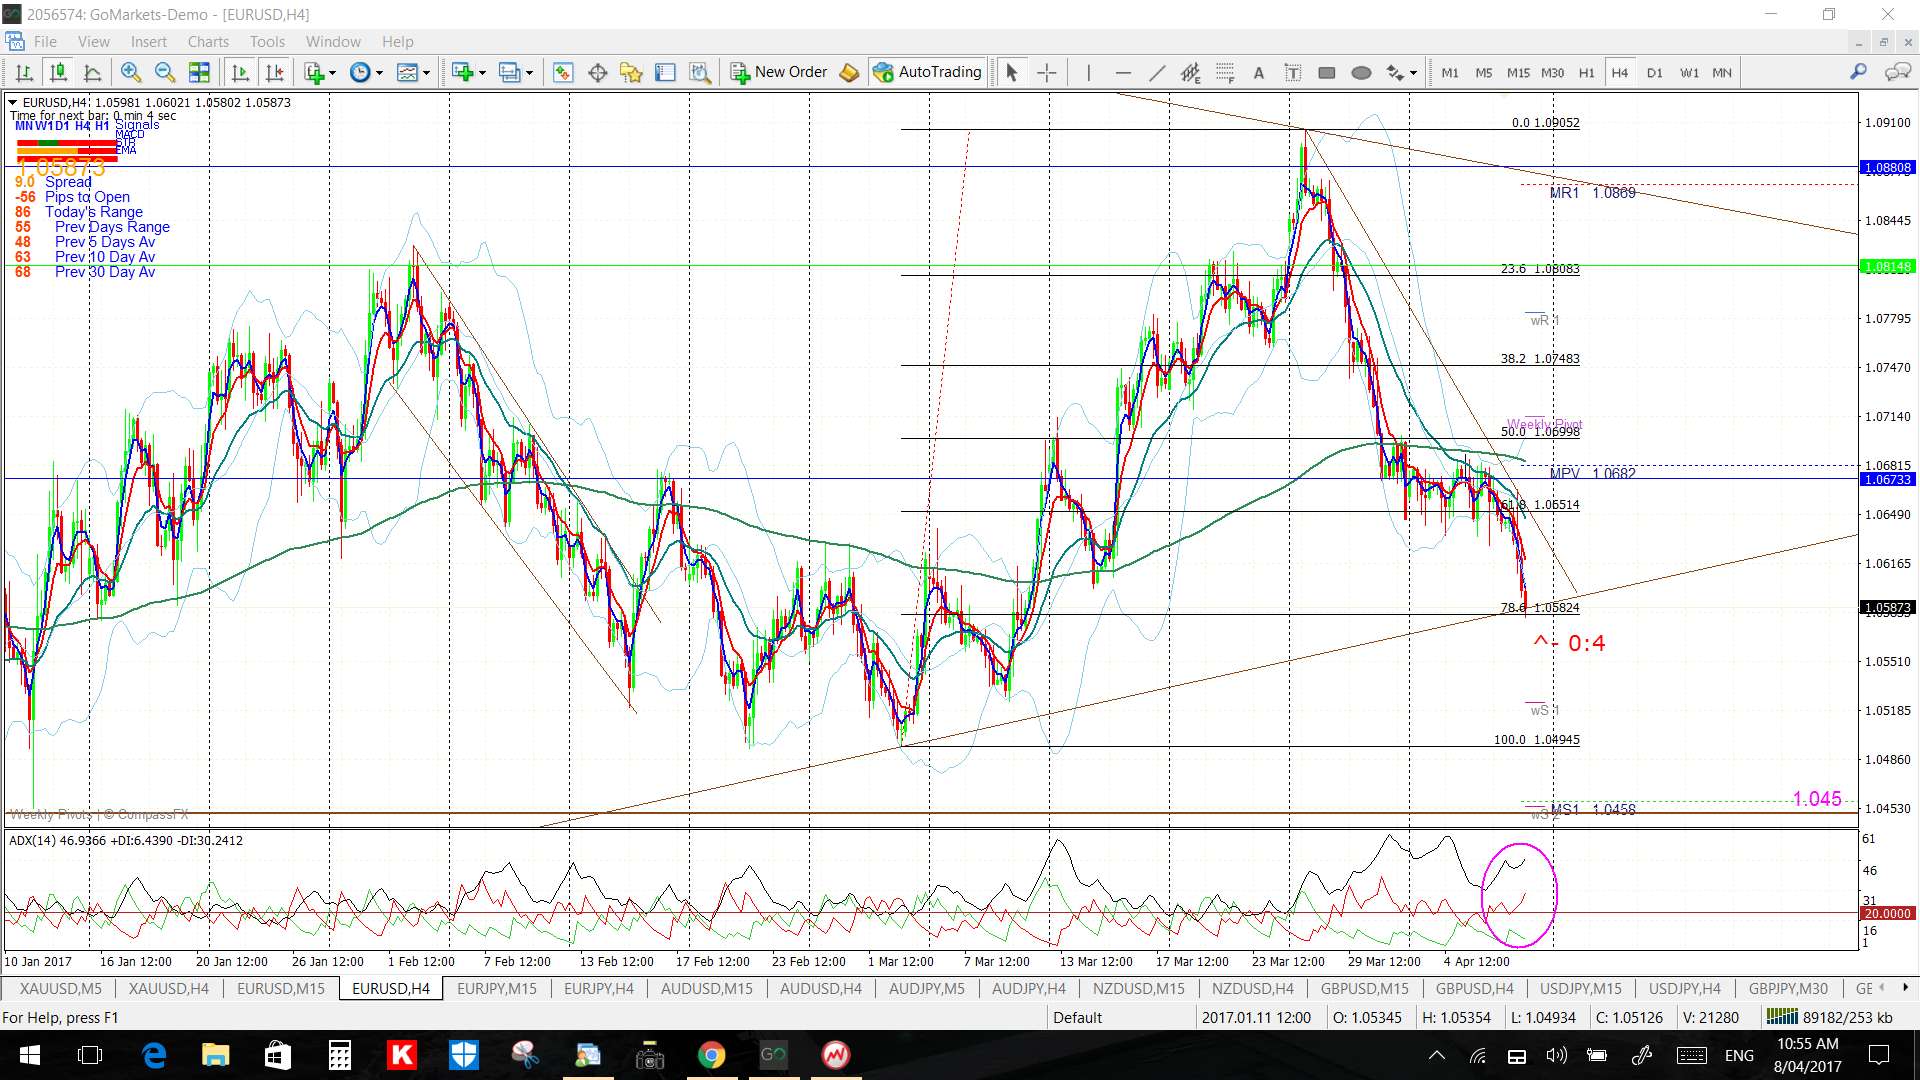
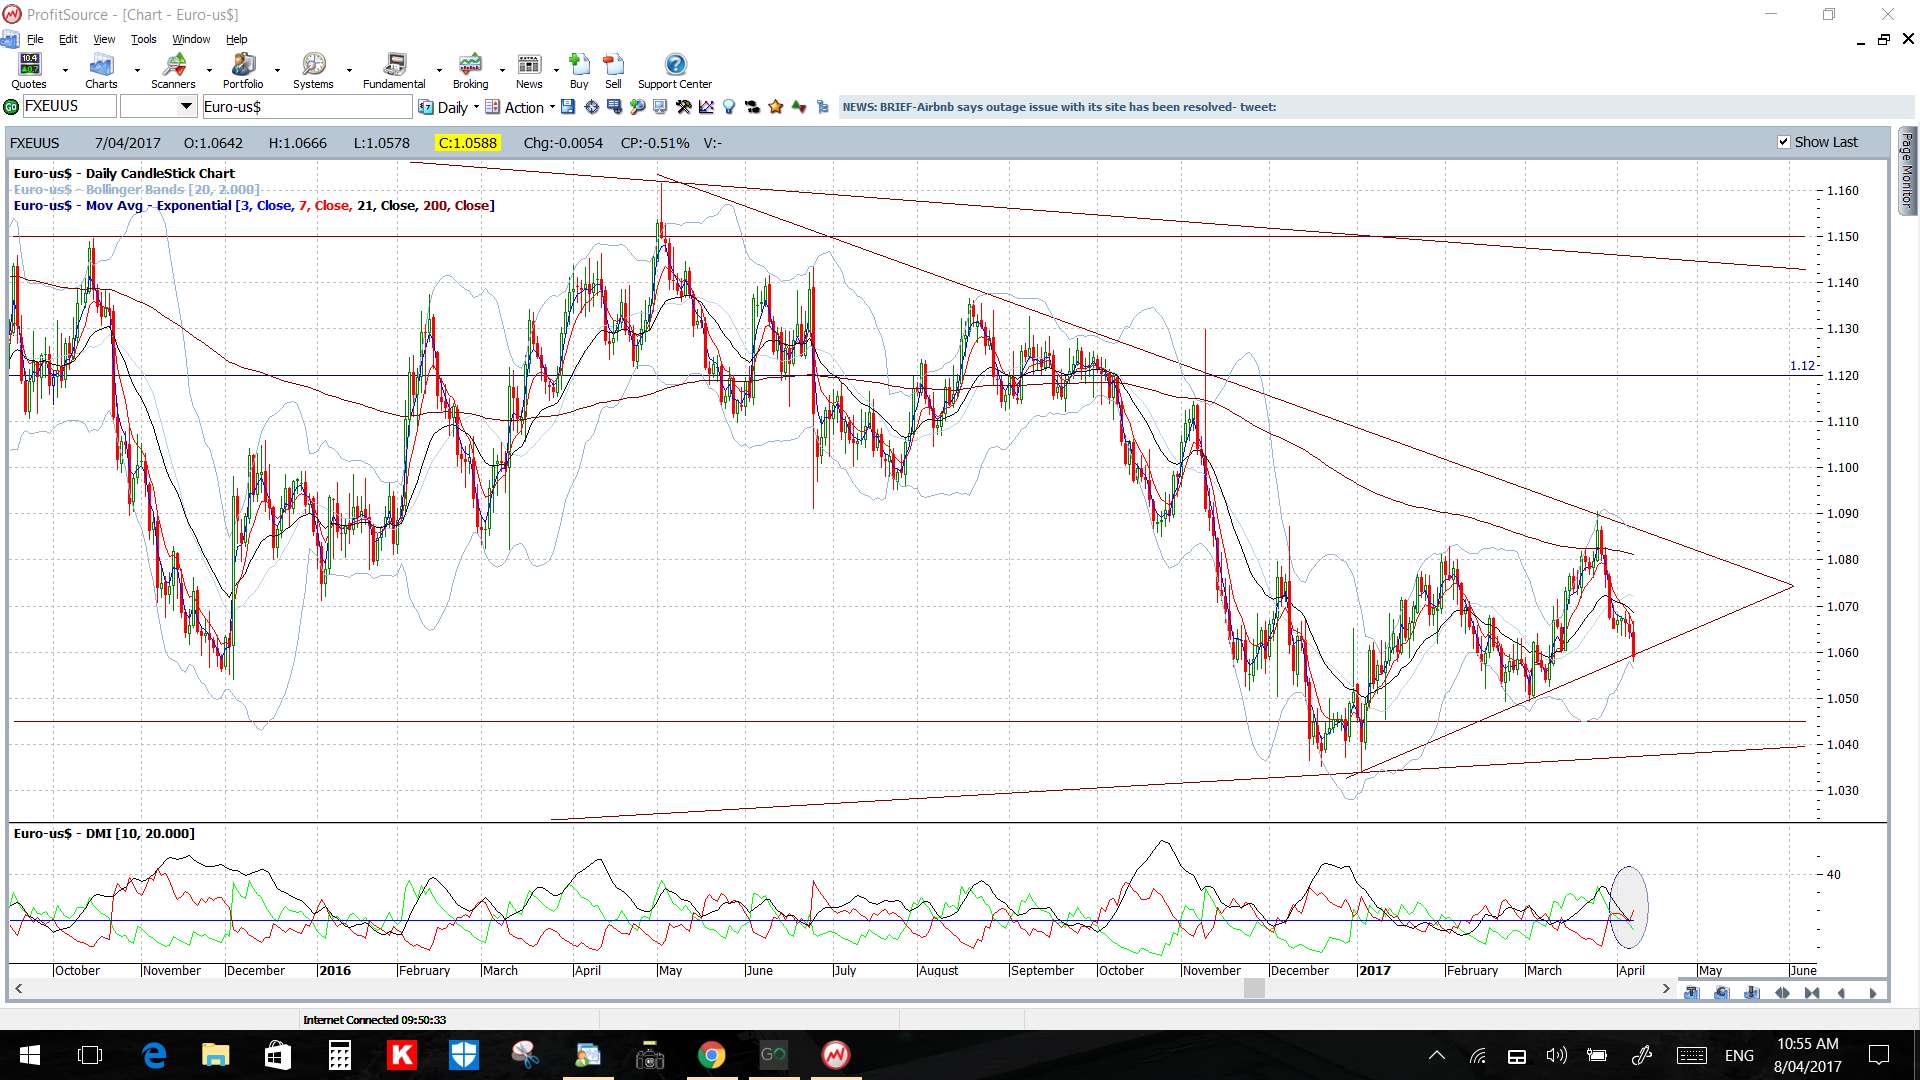
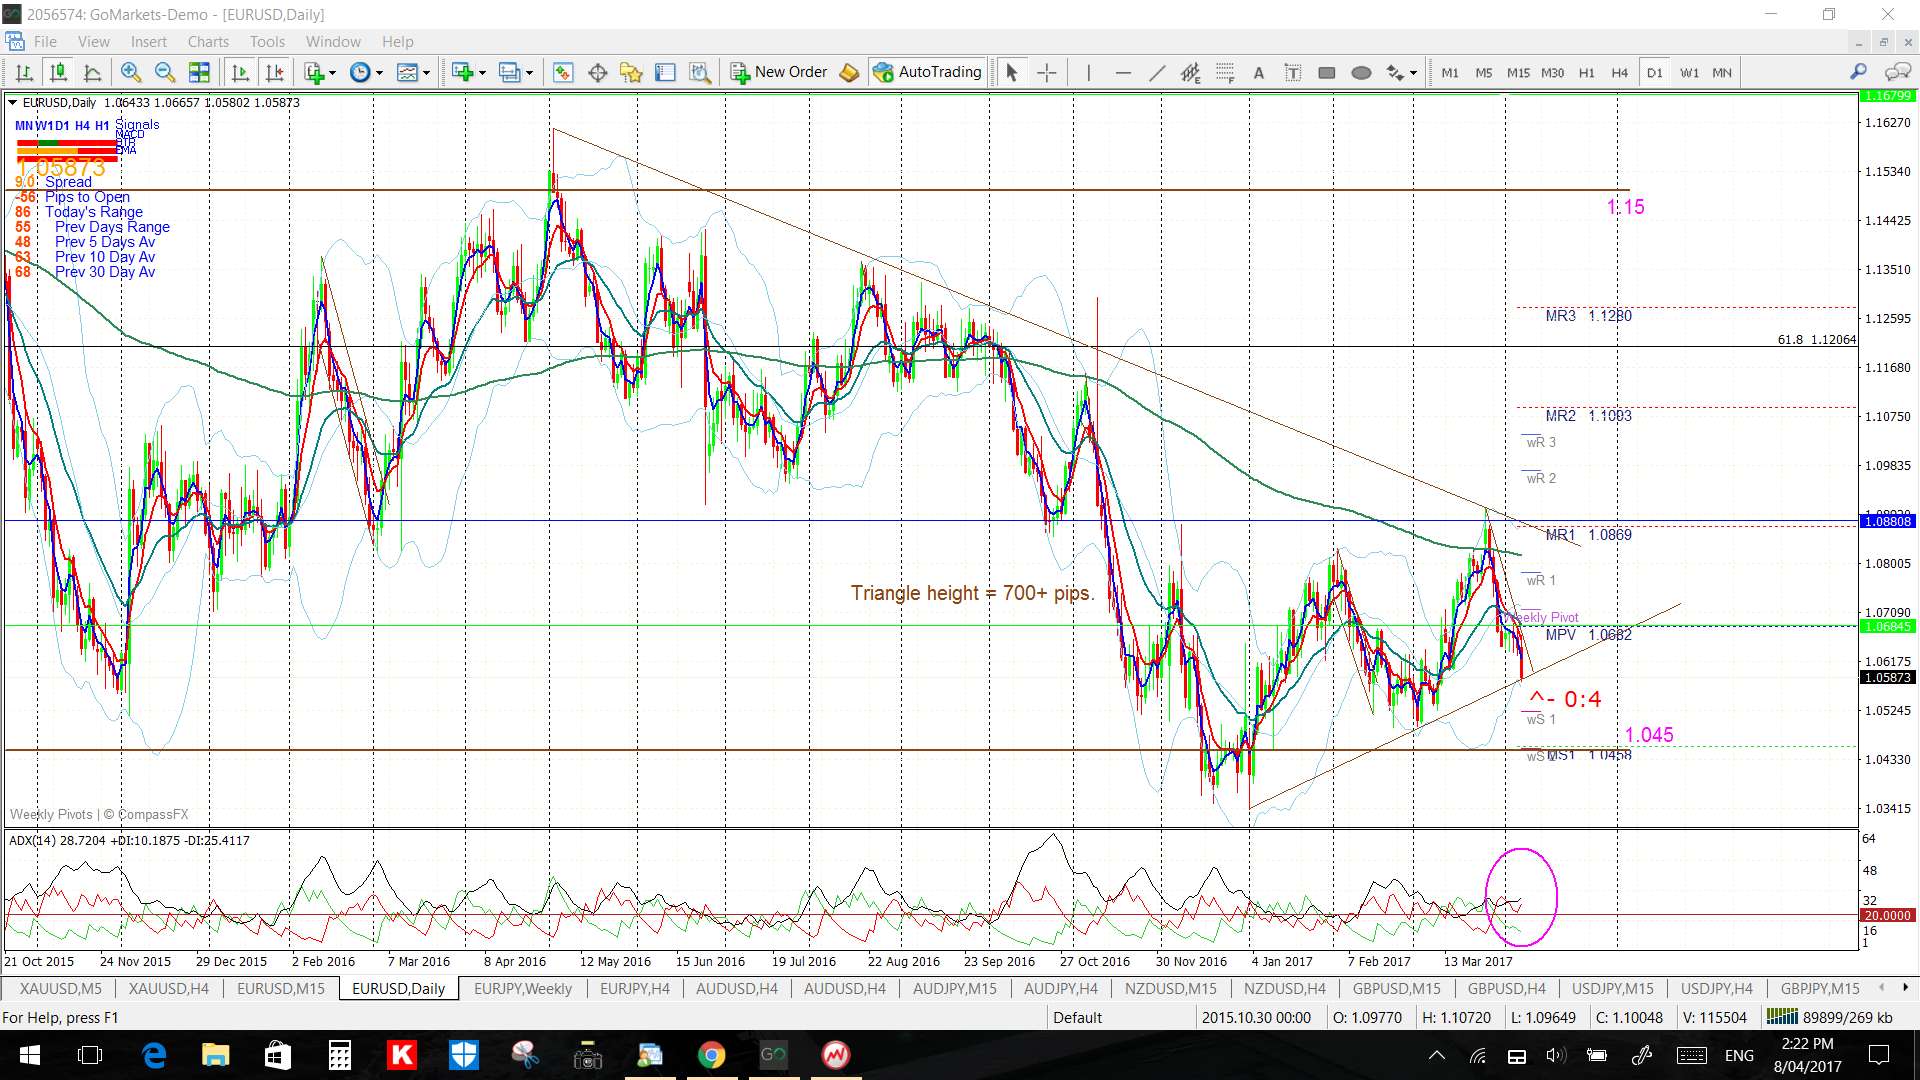
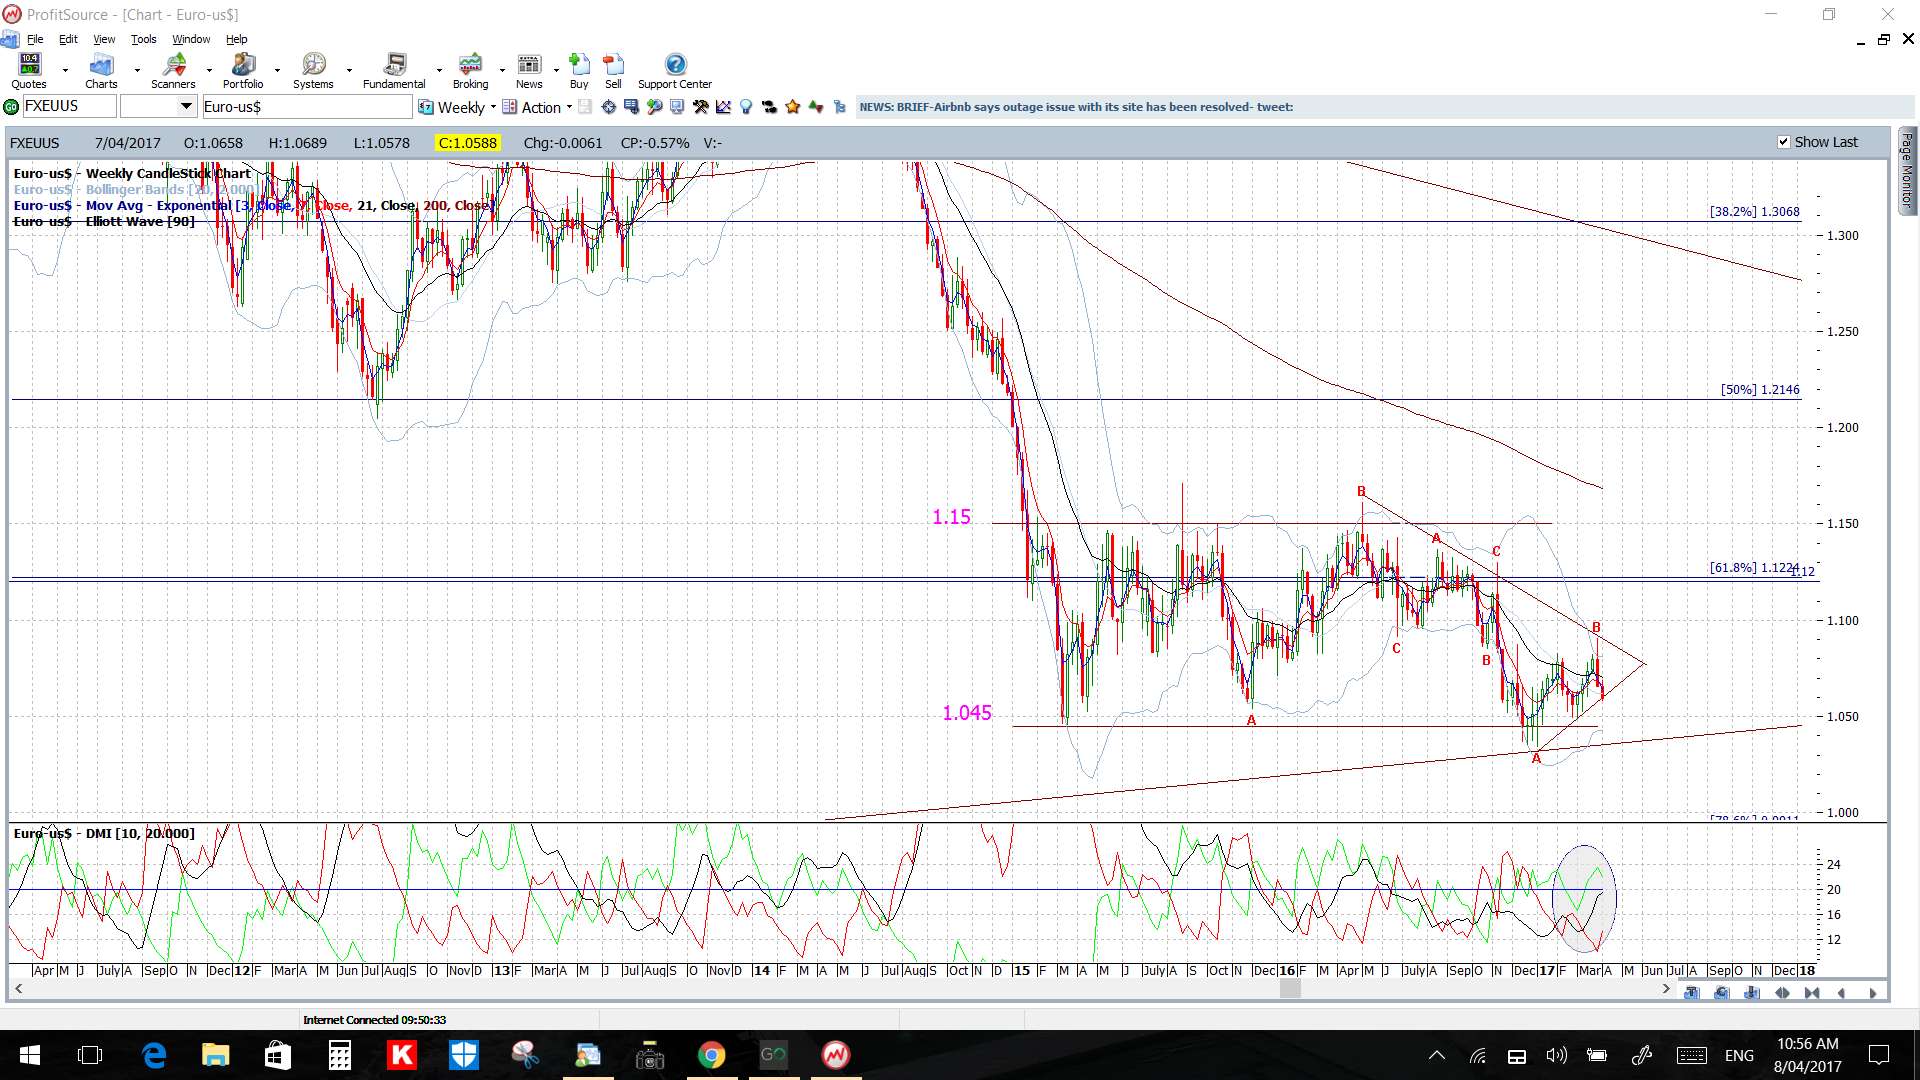
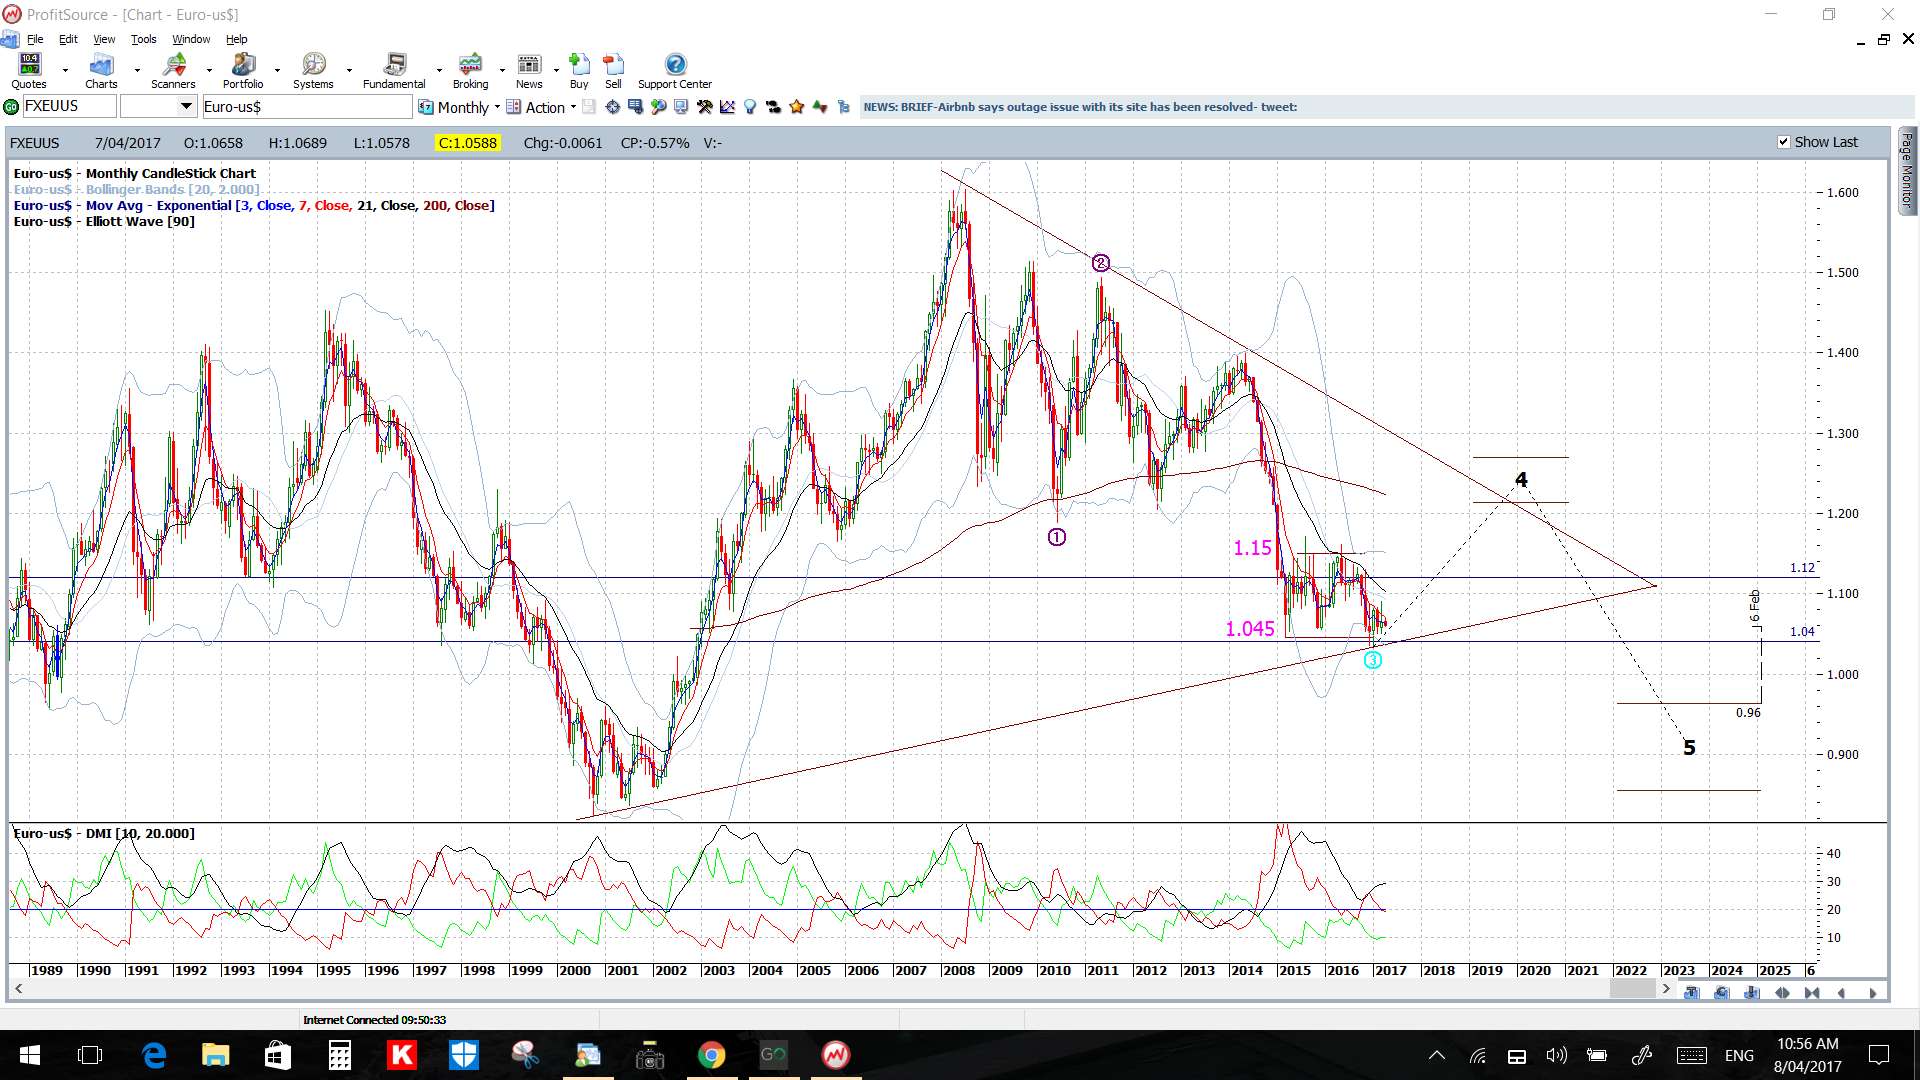
EUR/USD: The EUR/USD is trading within a daily chart triangle, given I have relaxed the lower trend line here a bit, and this will be the region to watch next week for any make or break activity.
For any bearish break I’ll then be watching for any test of the previous S/R level of 1.045. The daily chart triangle has a height of about 700 pips and so, if this breaks, technical theory would suggest the resultant move could be 700 pips so it is worth watching.
Price is below the 4hr Cloud and at the bottom edge of the daily Cloud.
The weekly candle was bearish.
There isn’t any high impact EUR news next week so this pair will more likely be at the mercy of US$ movement, thus, watch for any impact from US economic news.
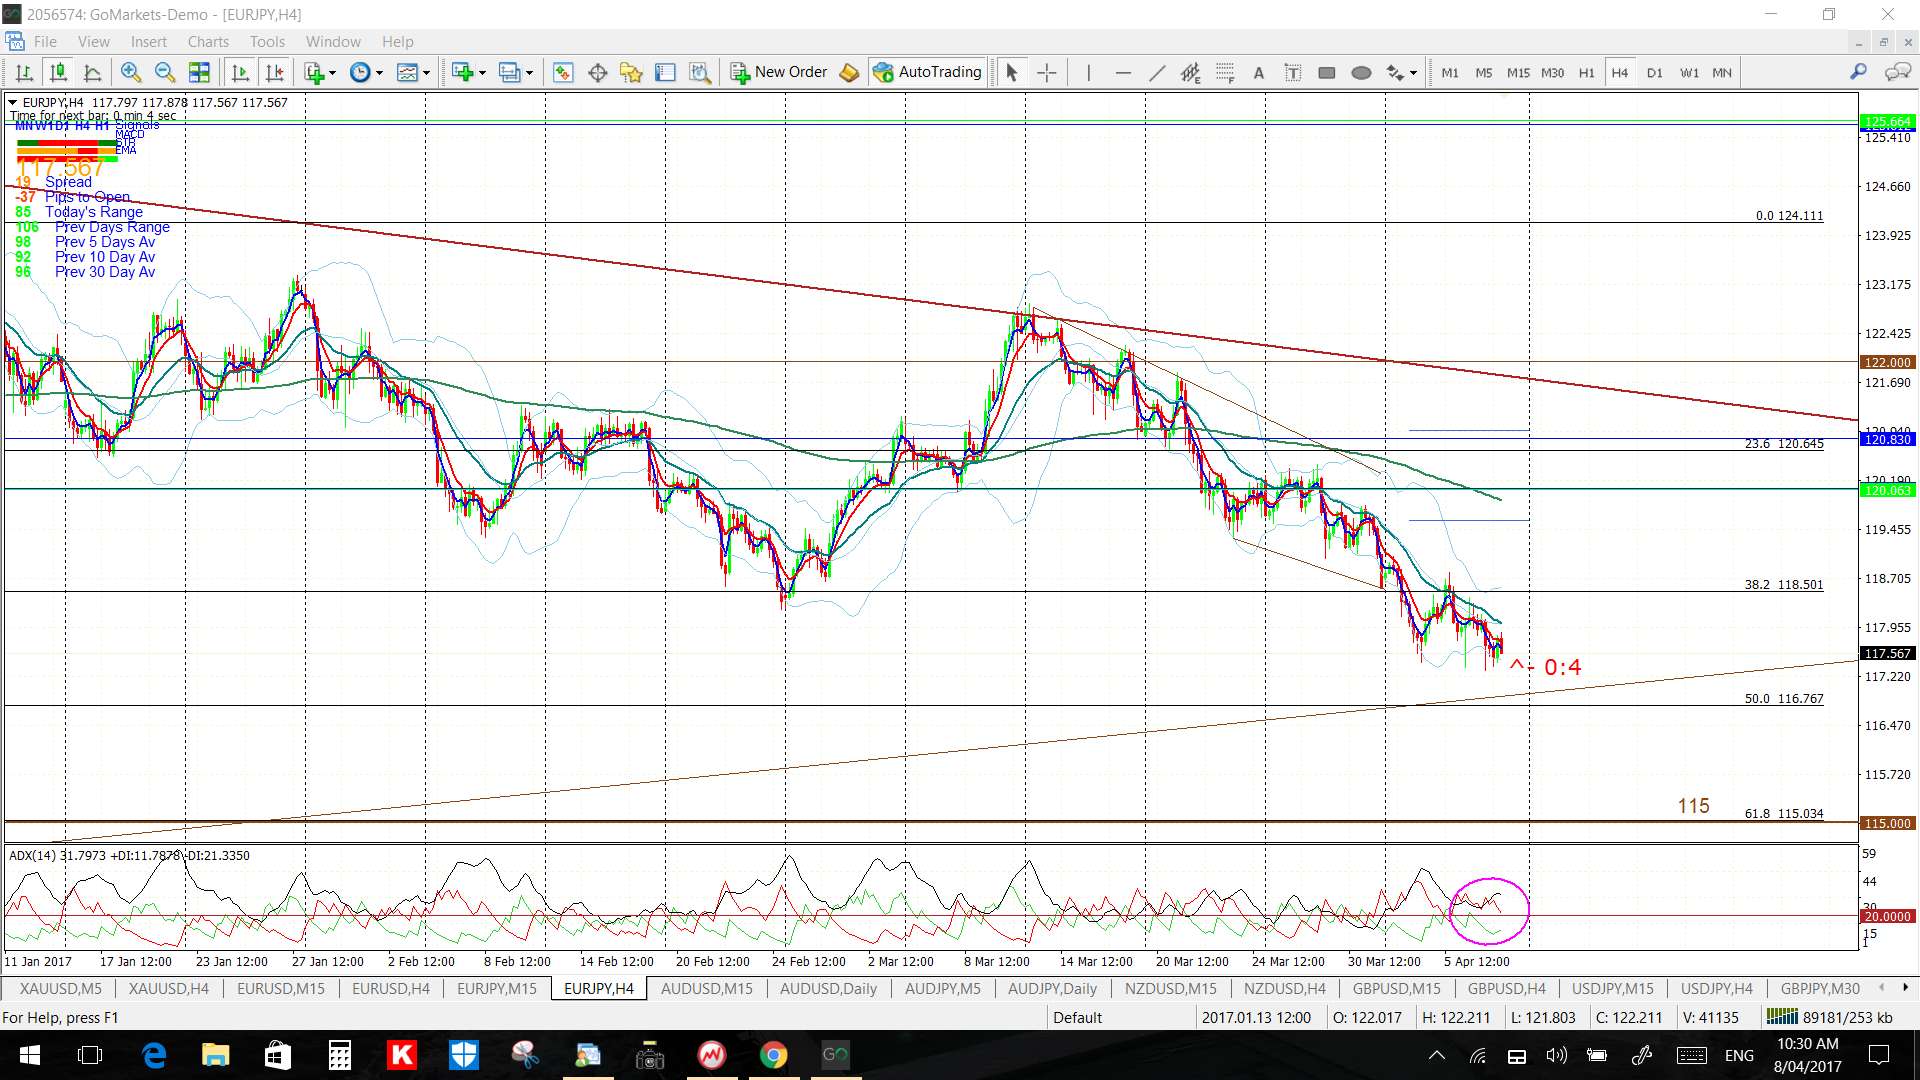
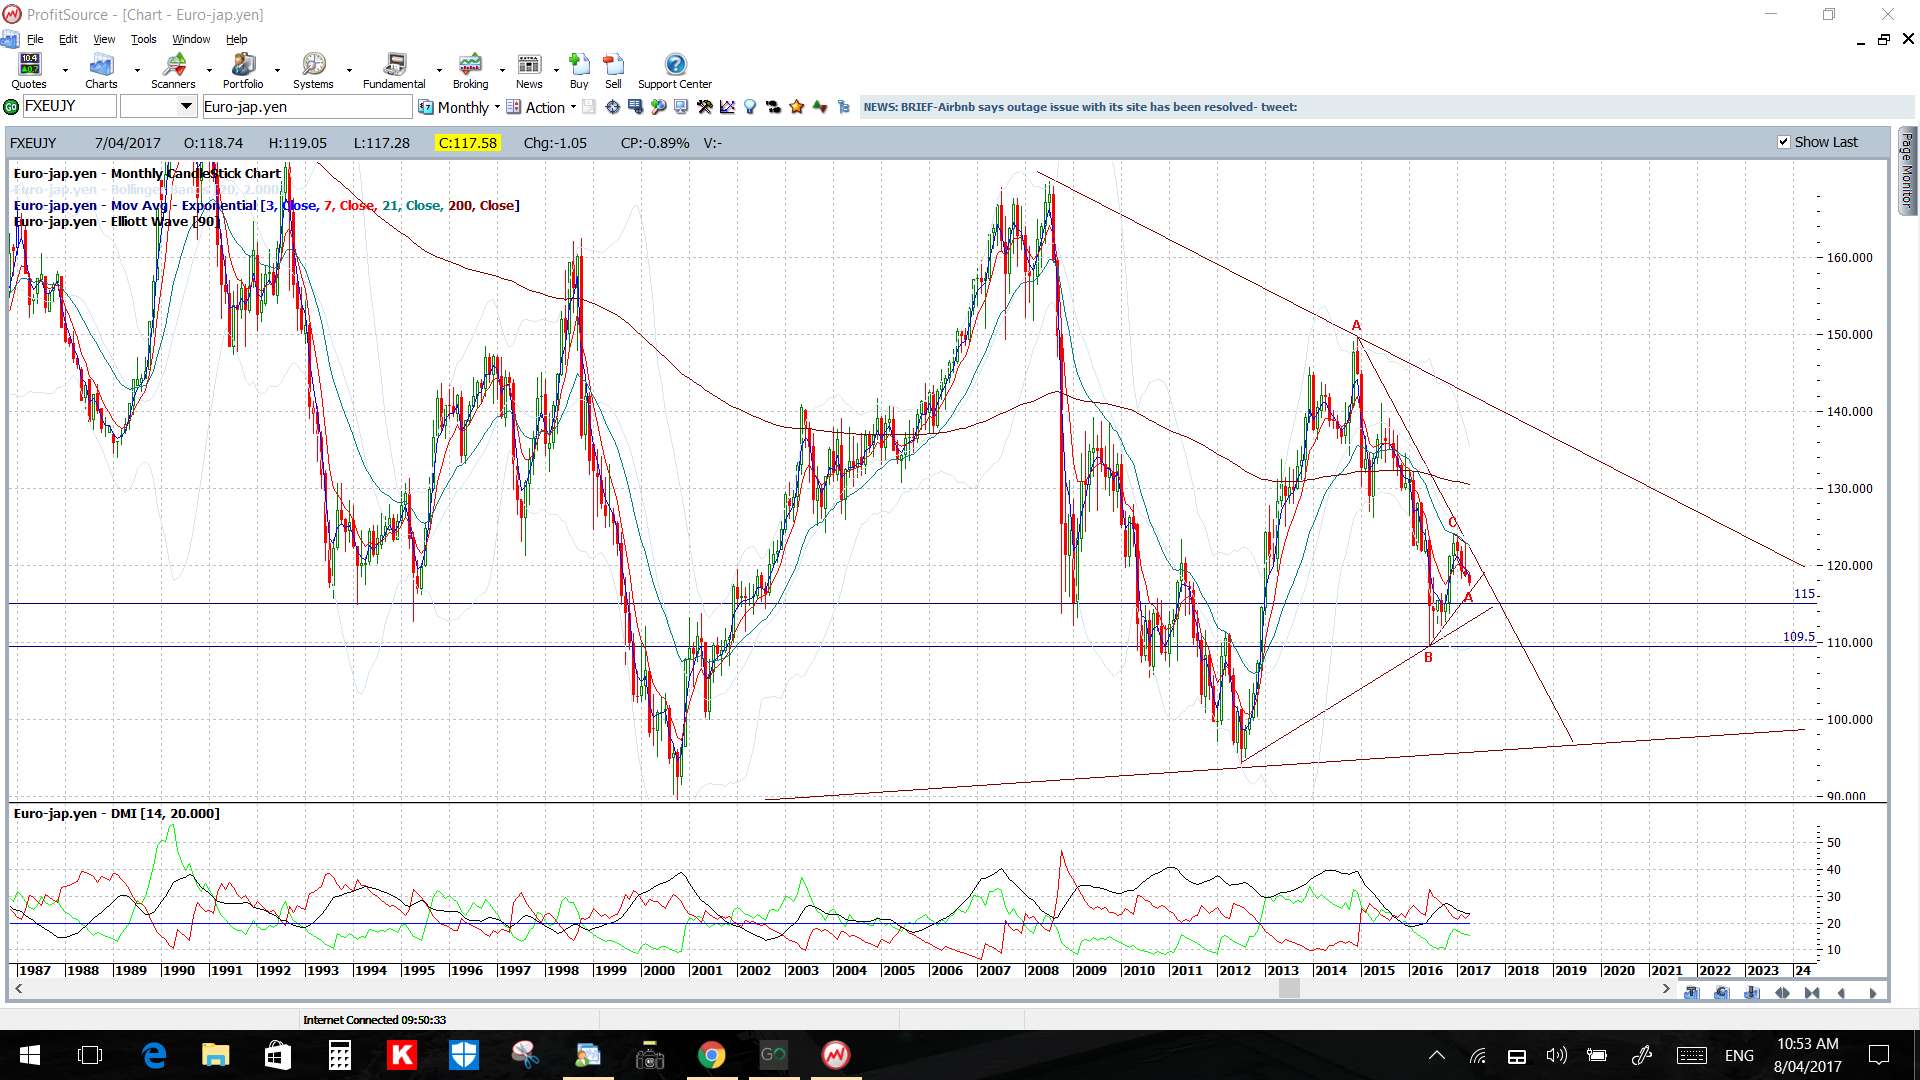
EUR/JPY: Price action has edged down towards a major support trend line that has been in play for almost a year and this will be the region to watch next week for any make or break activity.
Price is below the 4hr and daily Cloud.
The weekly candle was bearish.


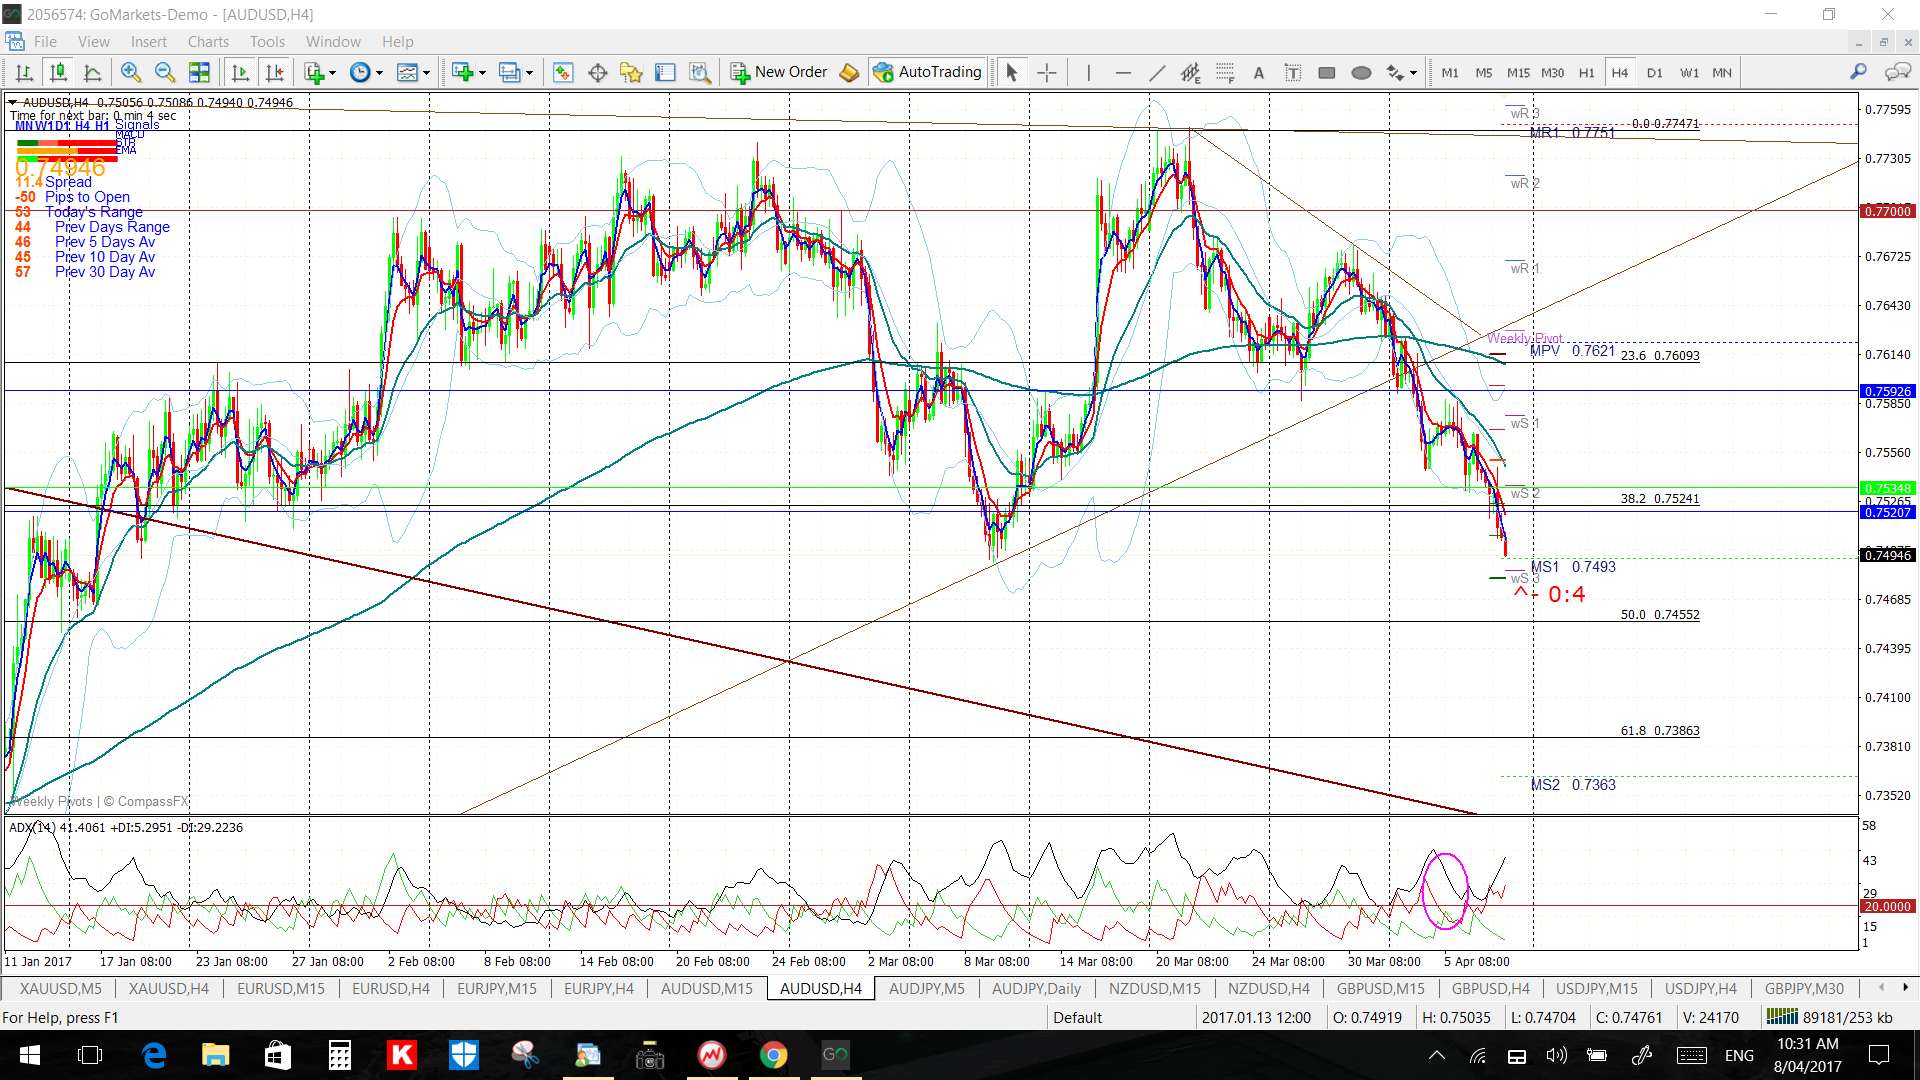
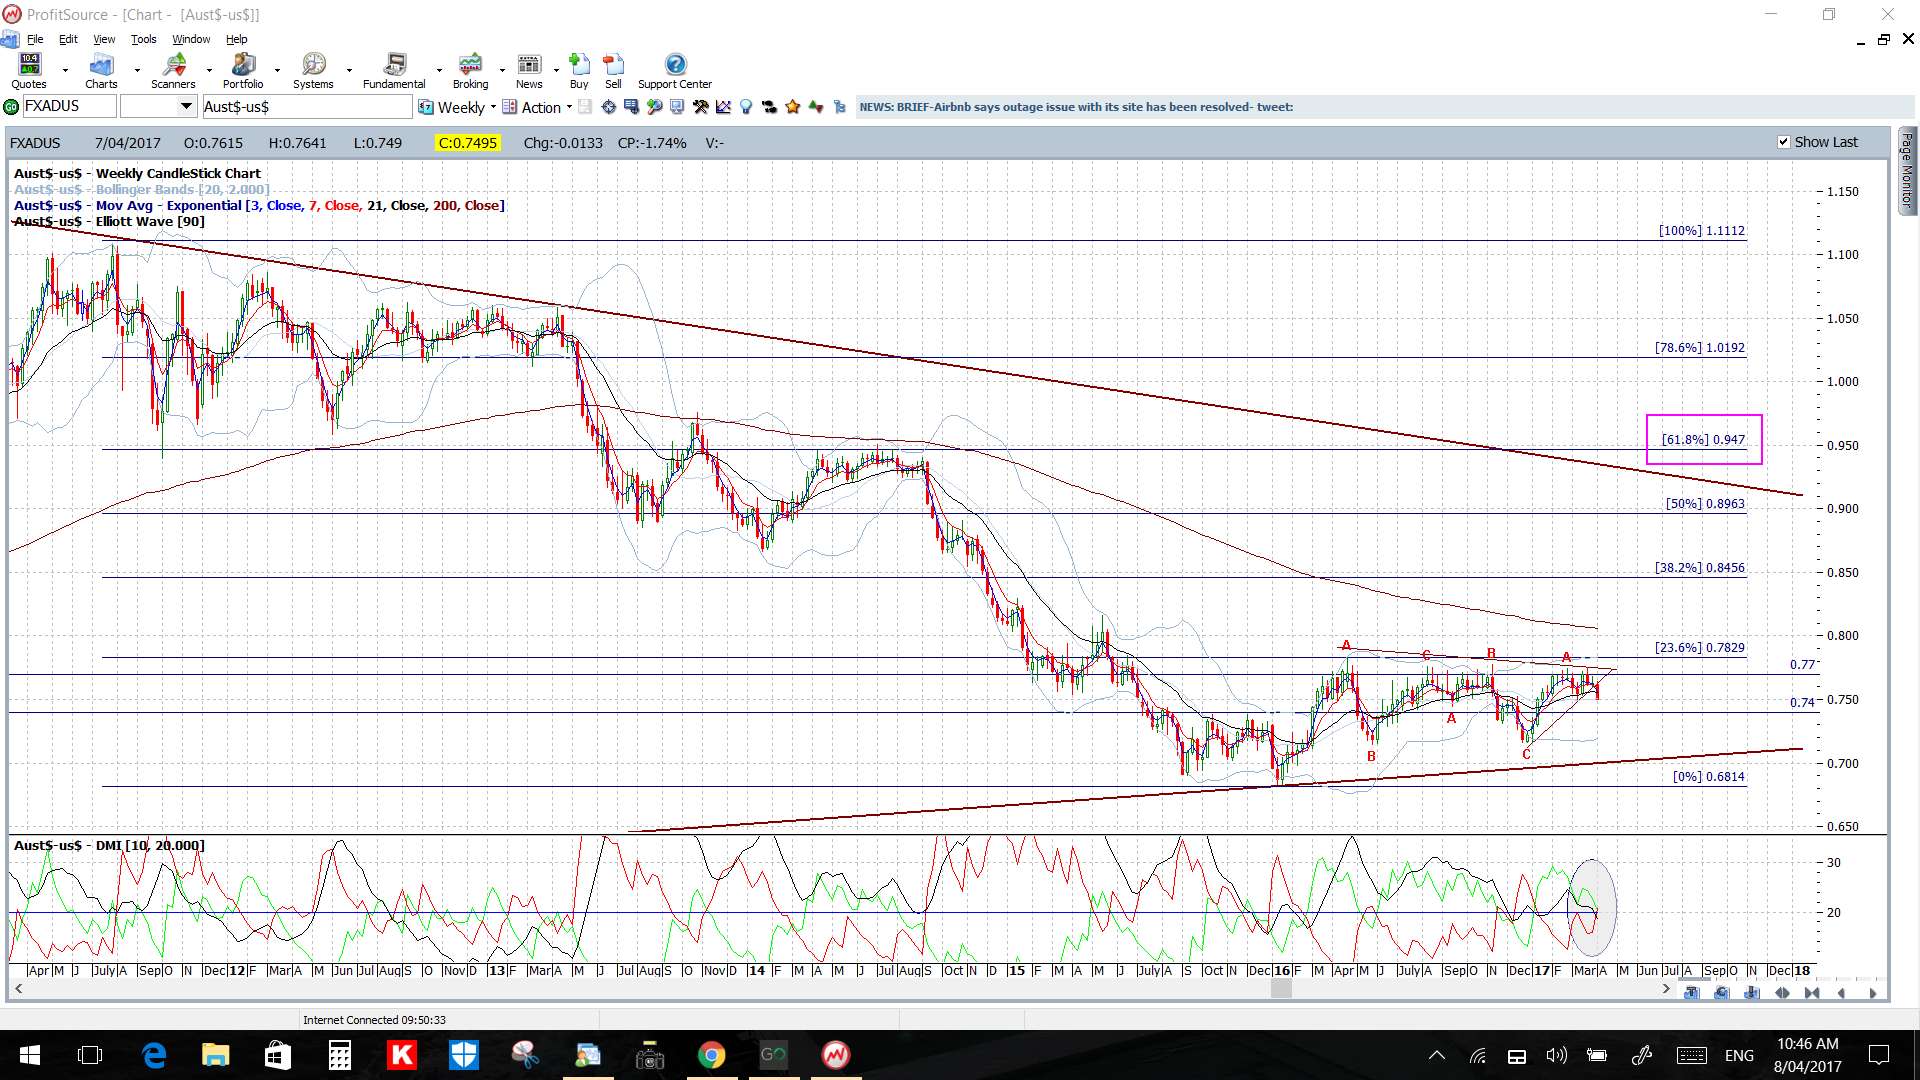
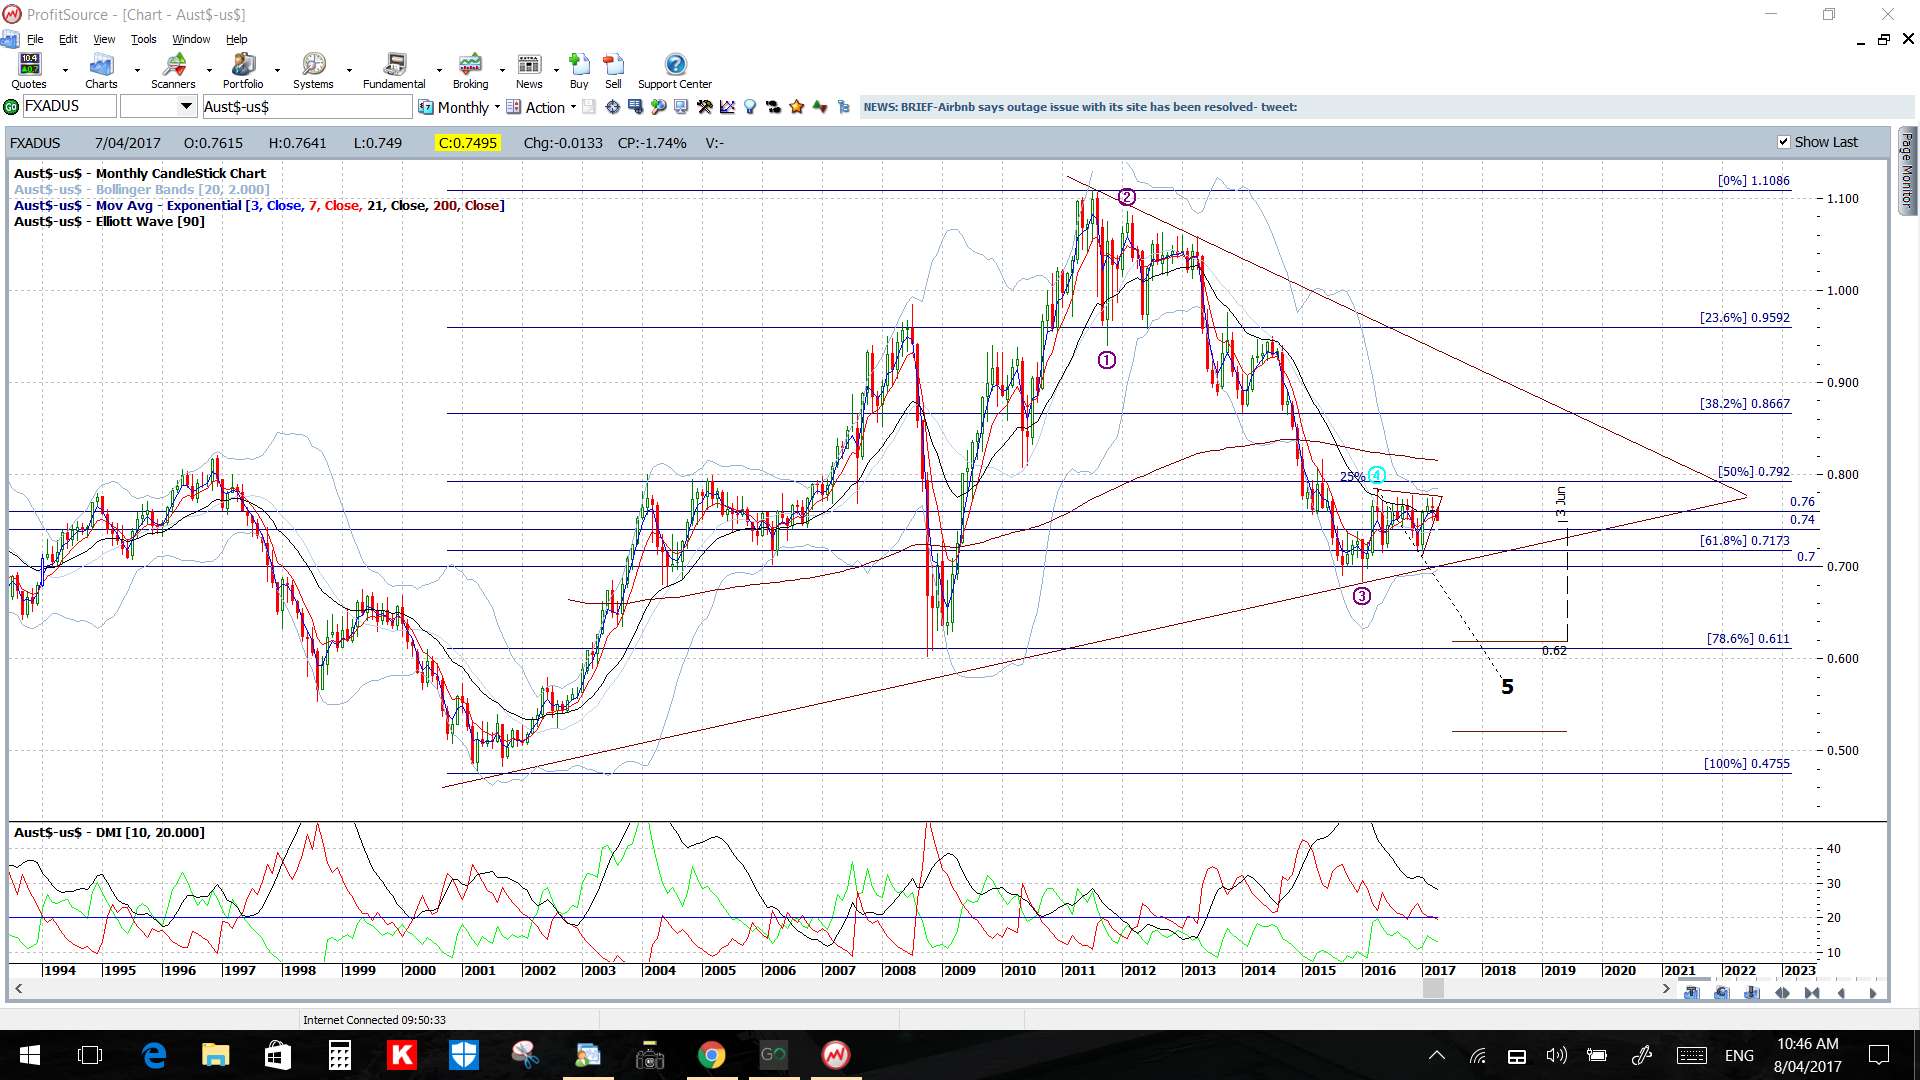
AUD/USD: The Aussie has been on the decline for the last three week and has held below a recently broken daily support trend line. I’m watching to see if price action might continue lower to test the 61.8% fib which is down near the key S/R region of 0.74. This will be the area to watch for any make or break in coming sessions. A break of that region would bring the monthly chart’s support trend line back into focus.
Price is below the 4hr Cloud but in the daily Cloud.
The weekly candle was bearish.
There is AUD Employment data and CNY Trade Balance, CPI and PPI data to monitor next week as well as all of the USD data:

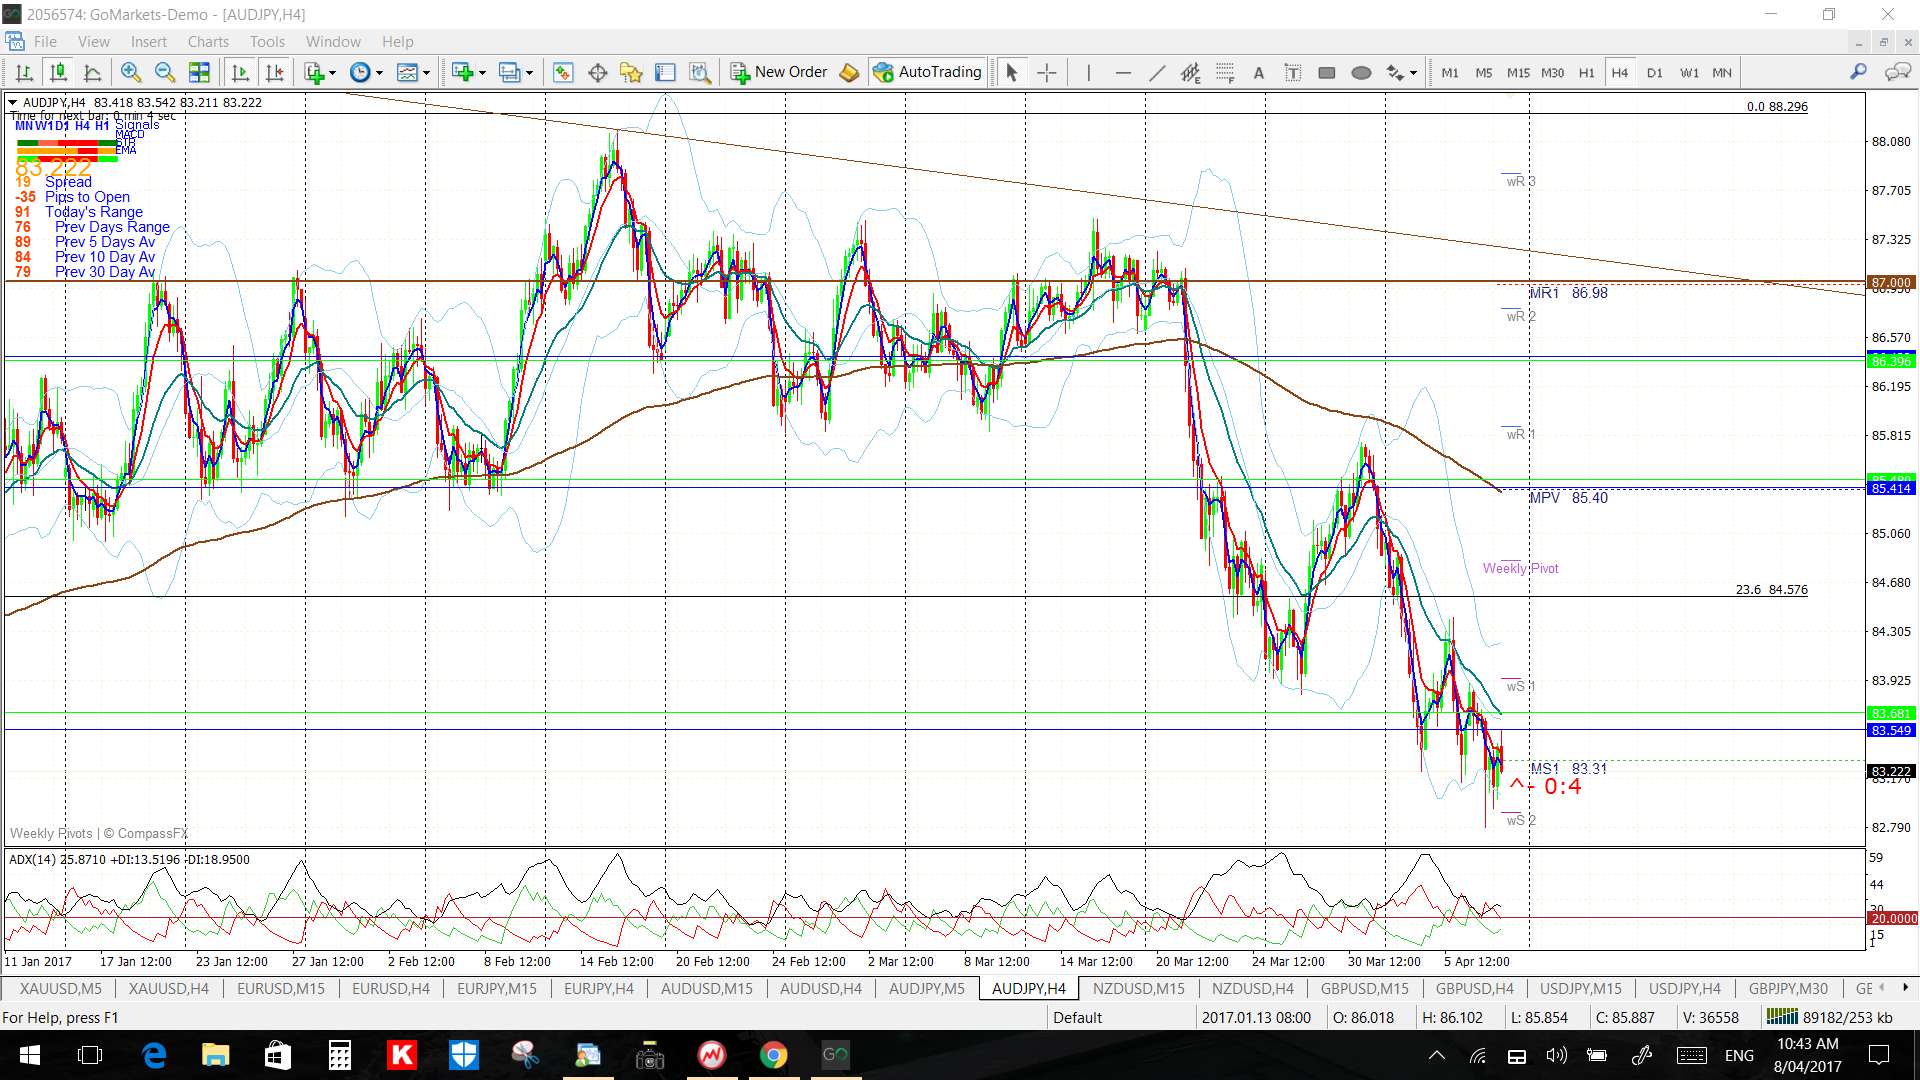
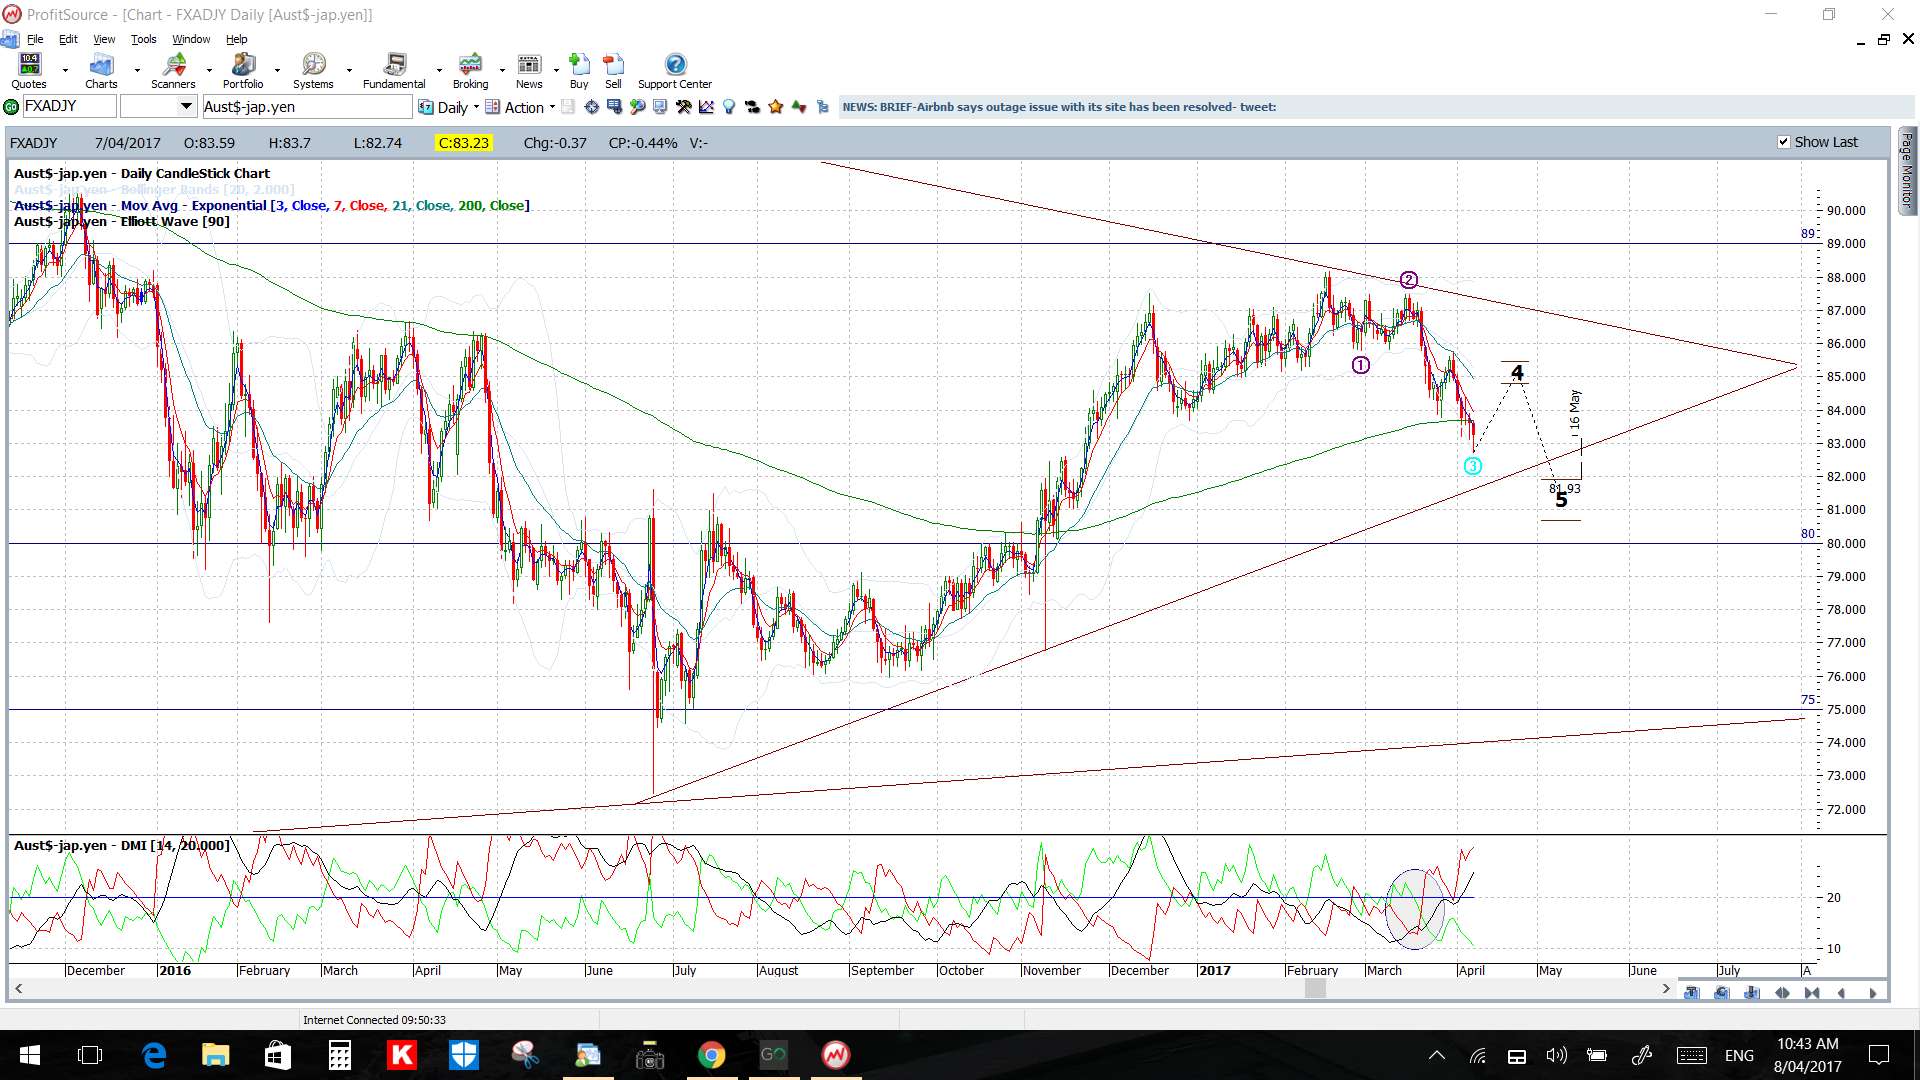
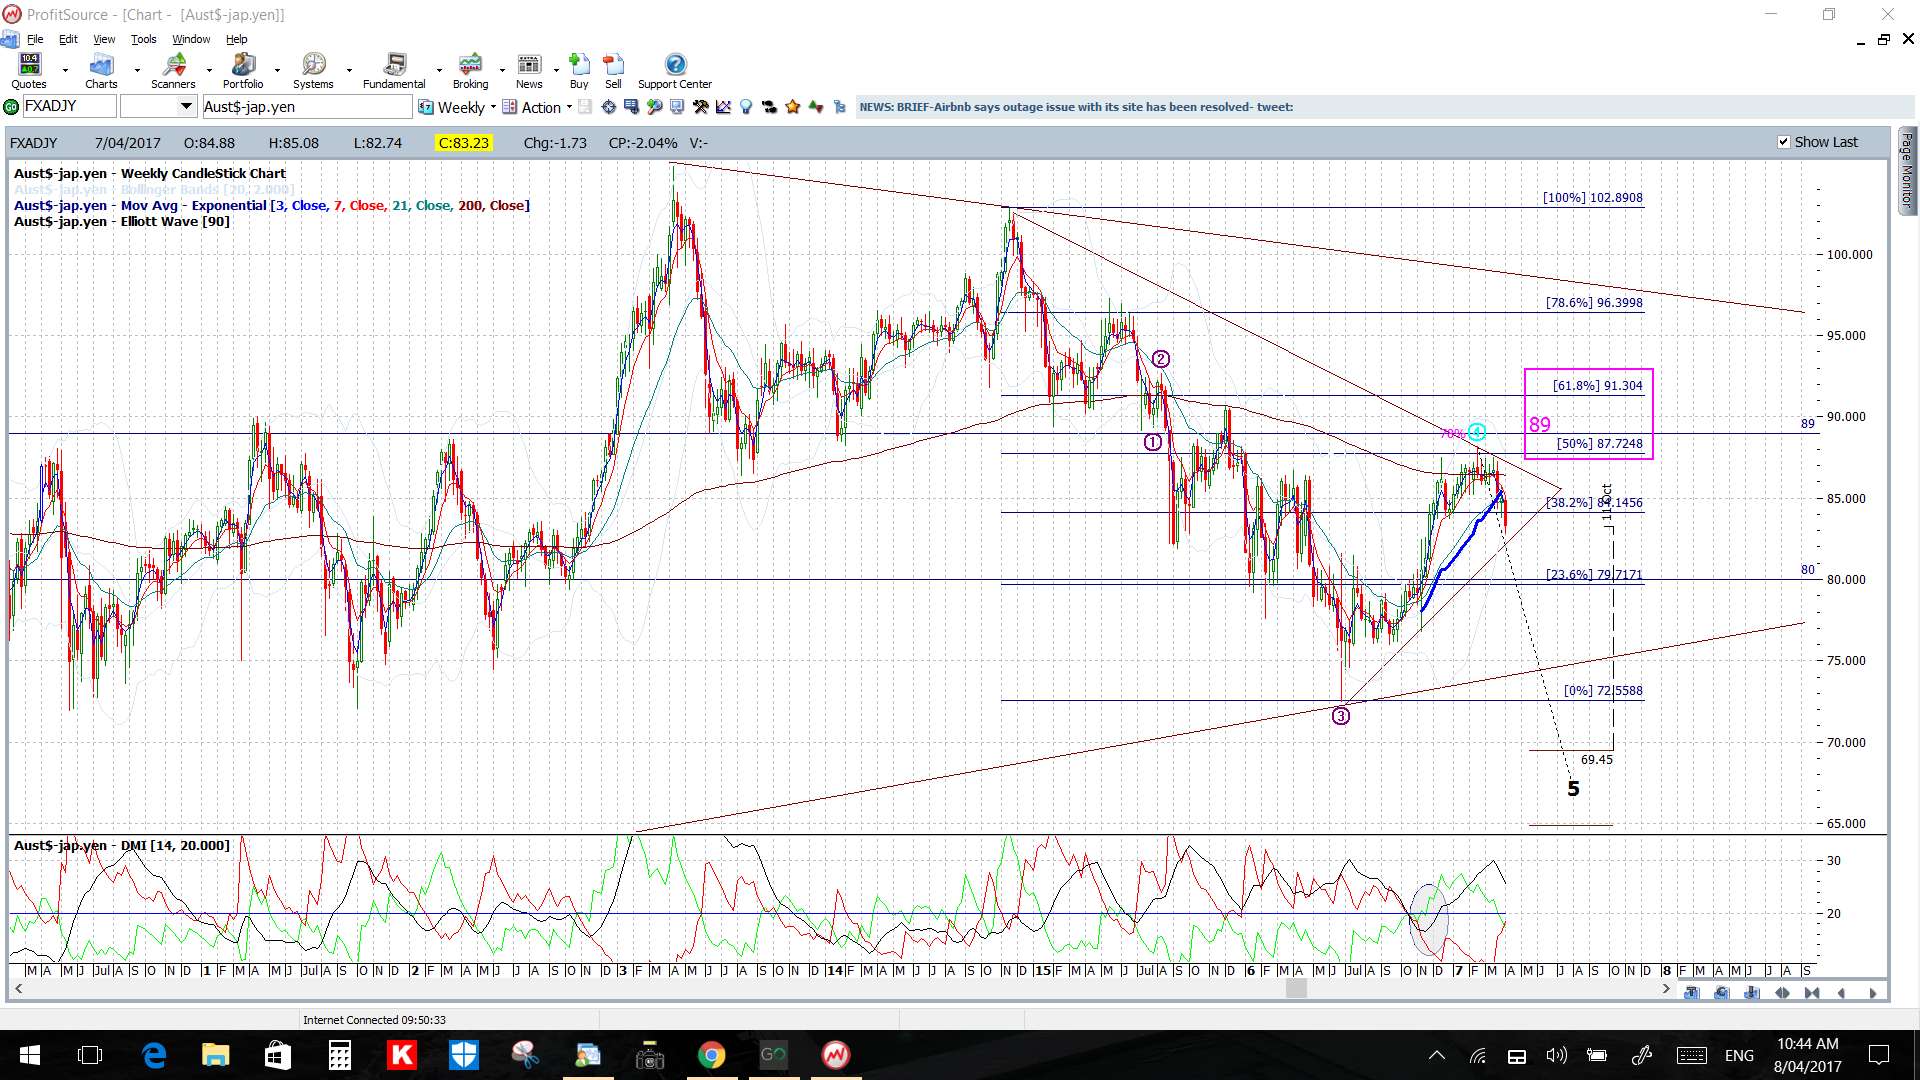
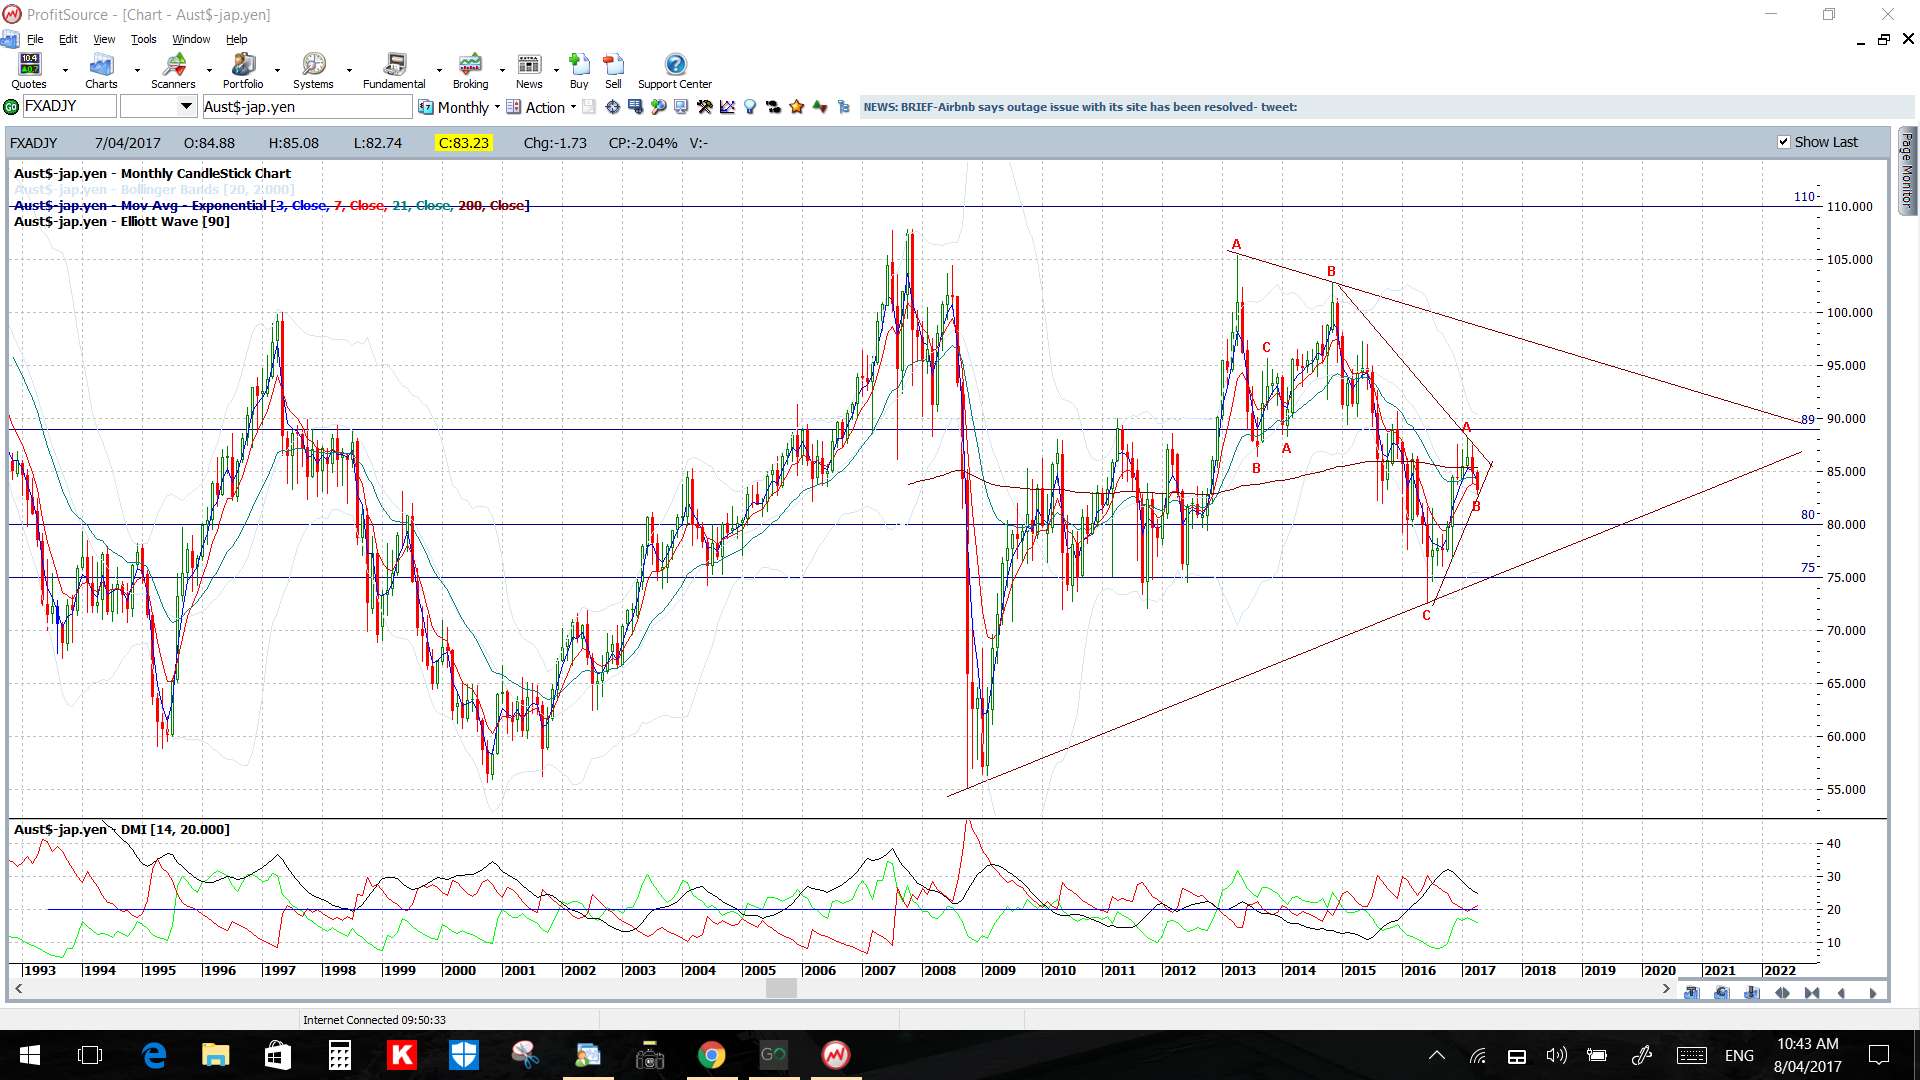
AUD/JPY: Price action is drifting down towards a major support trend line coming from a triangle on the weekly chart and this will be the region to watch for any make or break in coming sessions. I’d keep an eye on this pair for clues with stocks too as this pair often trades in tandem with them.
Price is below the 4hr and daily Cloud.
The weekly candle was bearish.
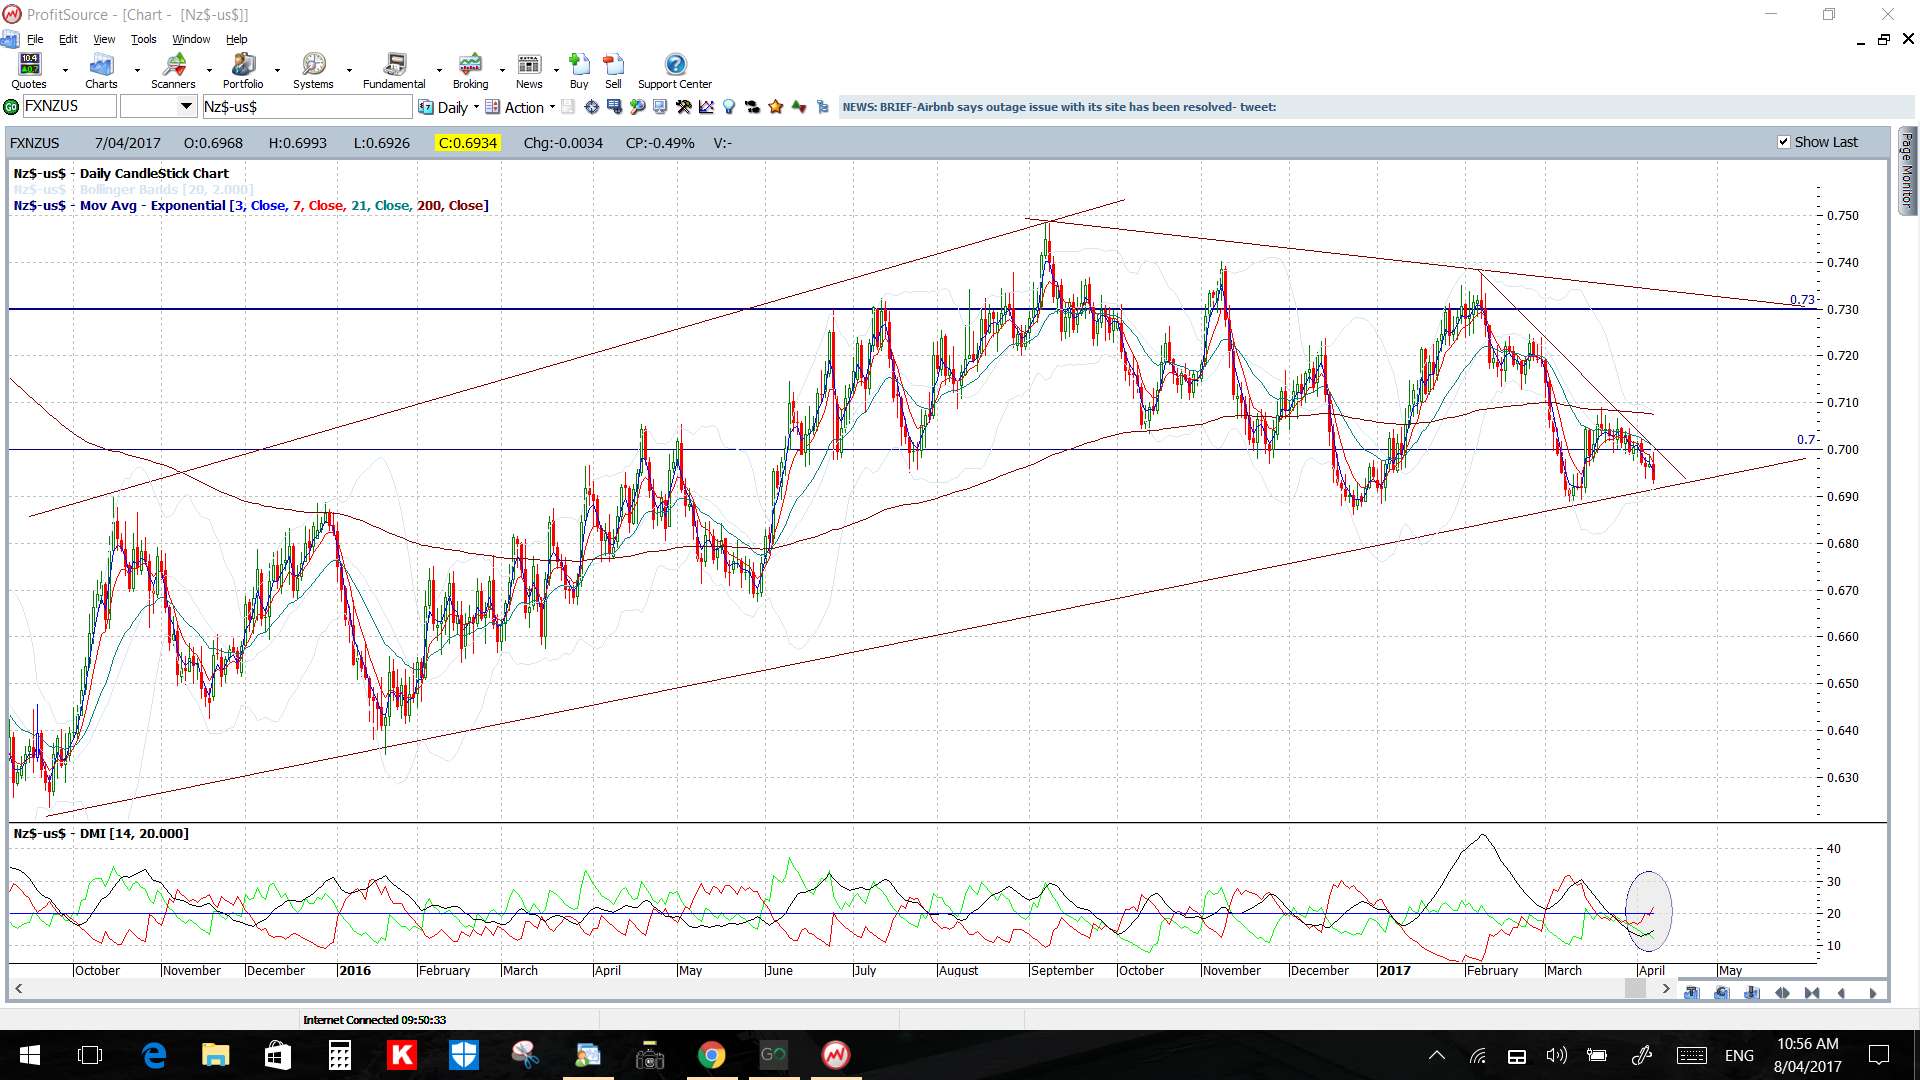
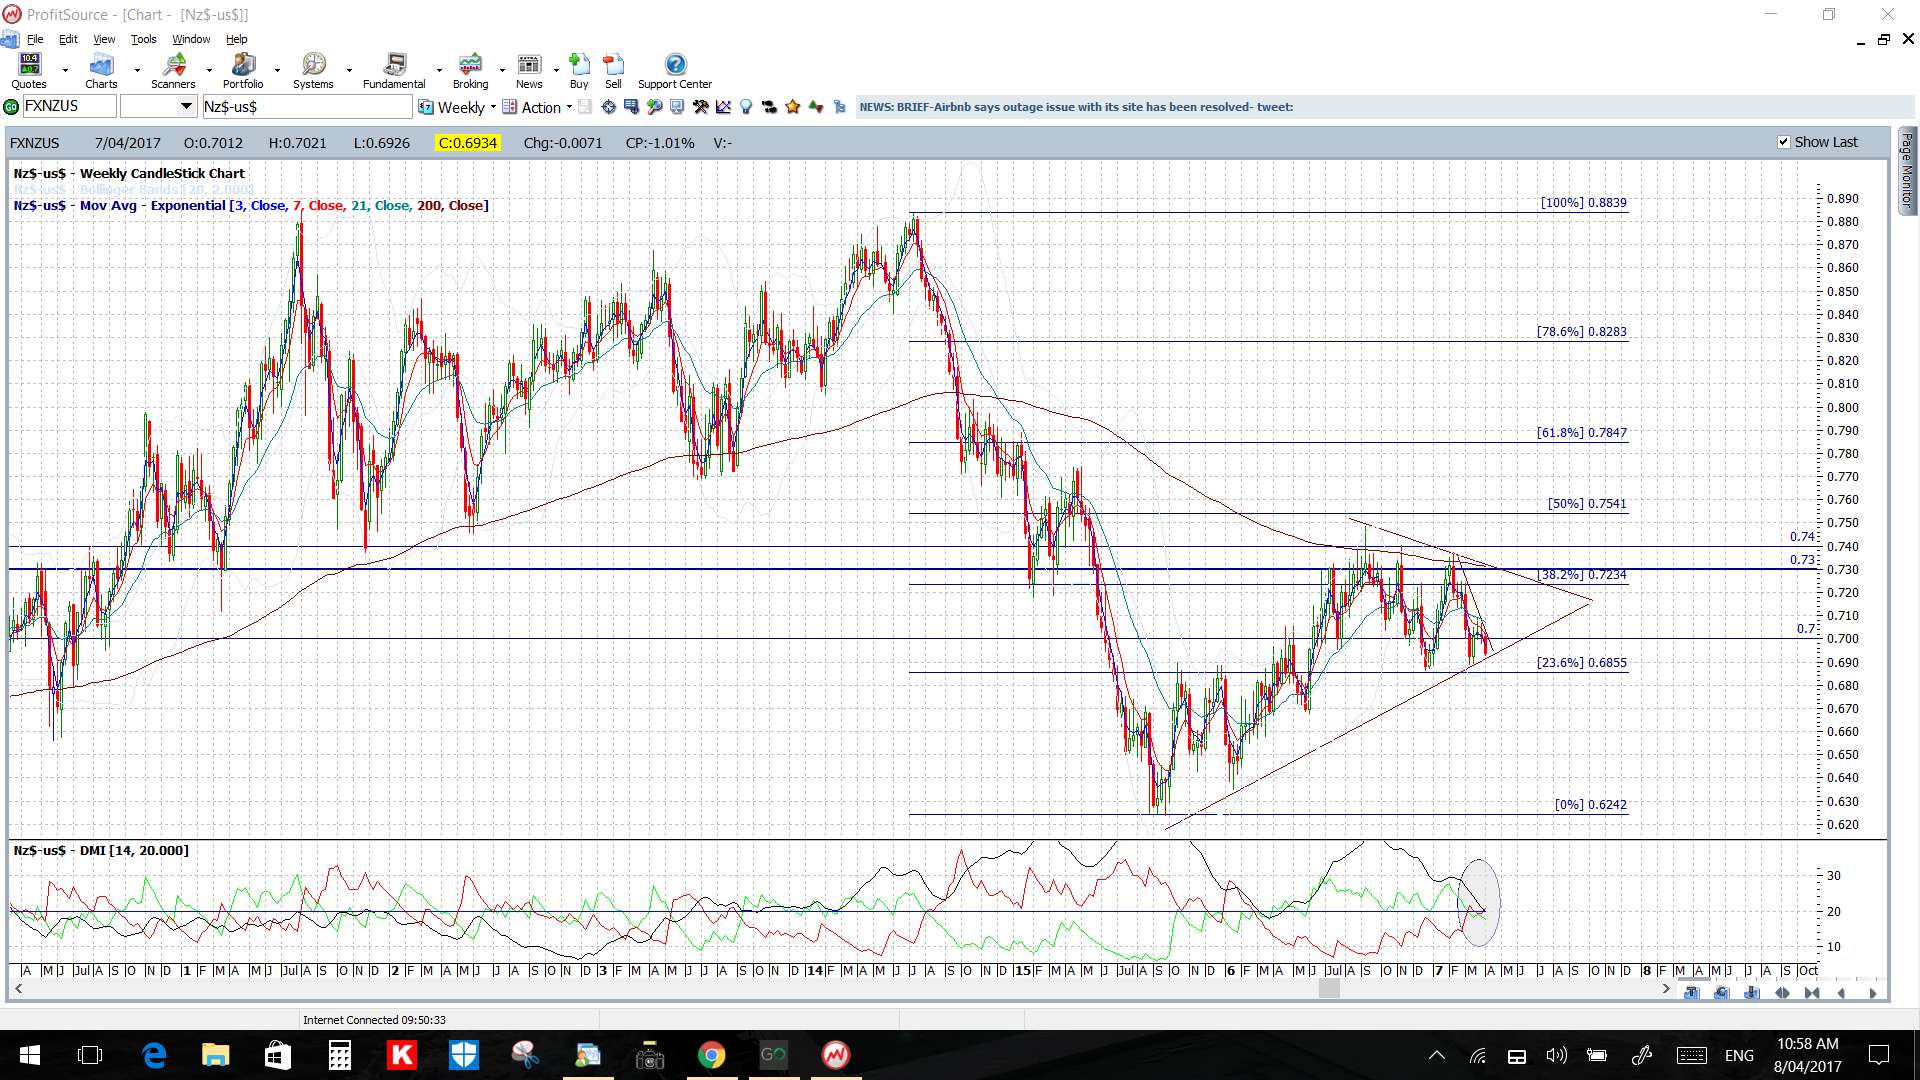
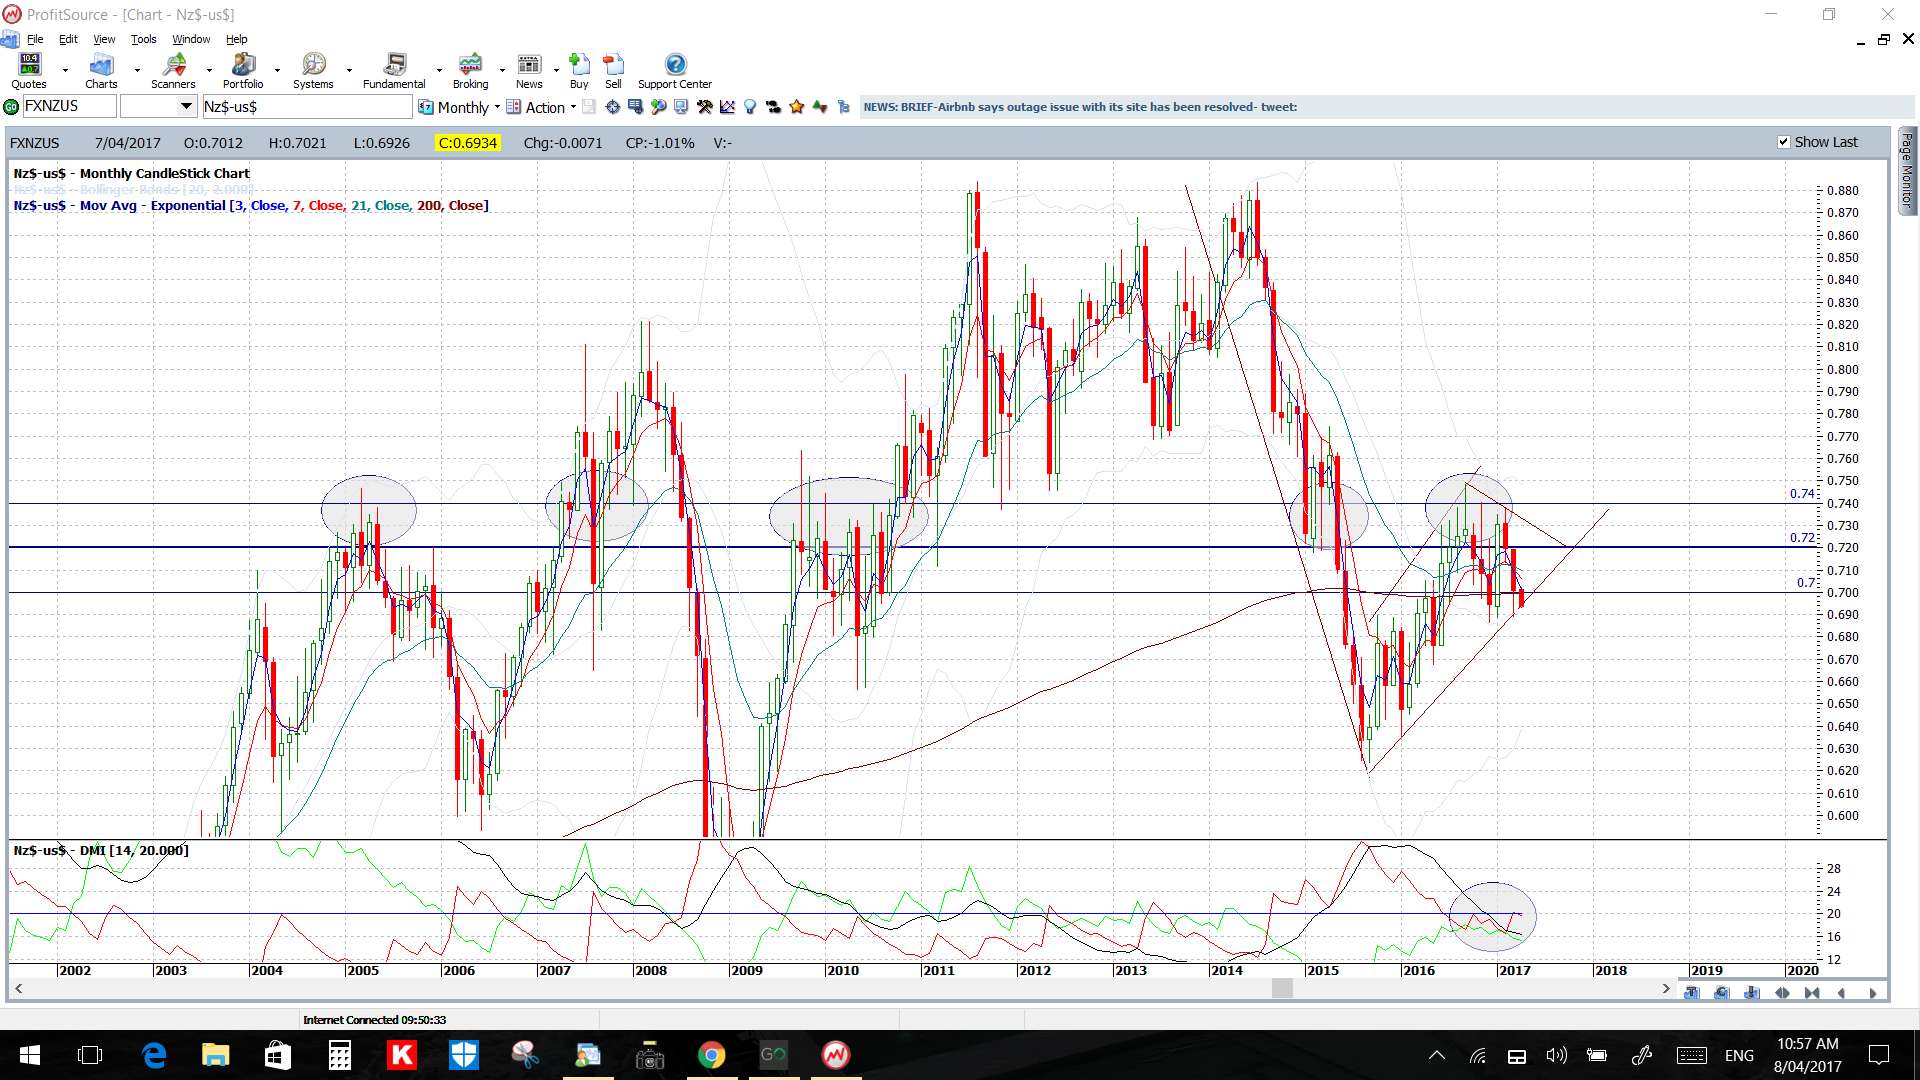
NZD/USD: The Kiwi drifted lower last week and has traded within a descending channel for the last two weeks. The 4hr, daily, weekly and monthly charts all show this pair drifting back towards a major support trend line and so this will be in focus next week for any make or breakactivity.
Price is below the 4hr and daily Cloud.
The weekly candle was bearish.
There is no high impact NZD data but I suspect this pair will be more at the mercy of US data.

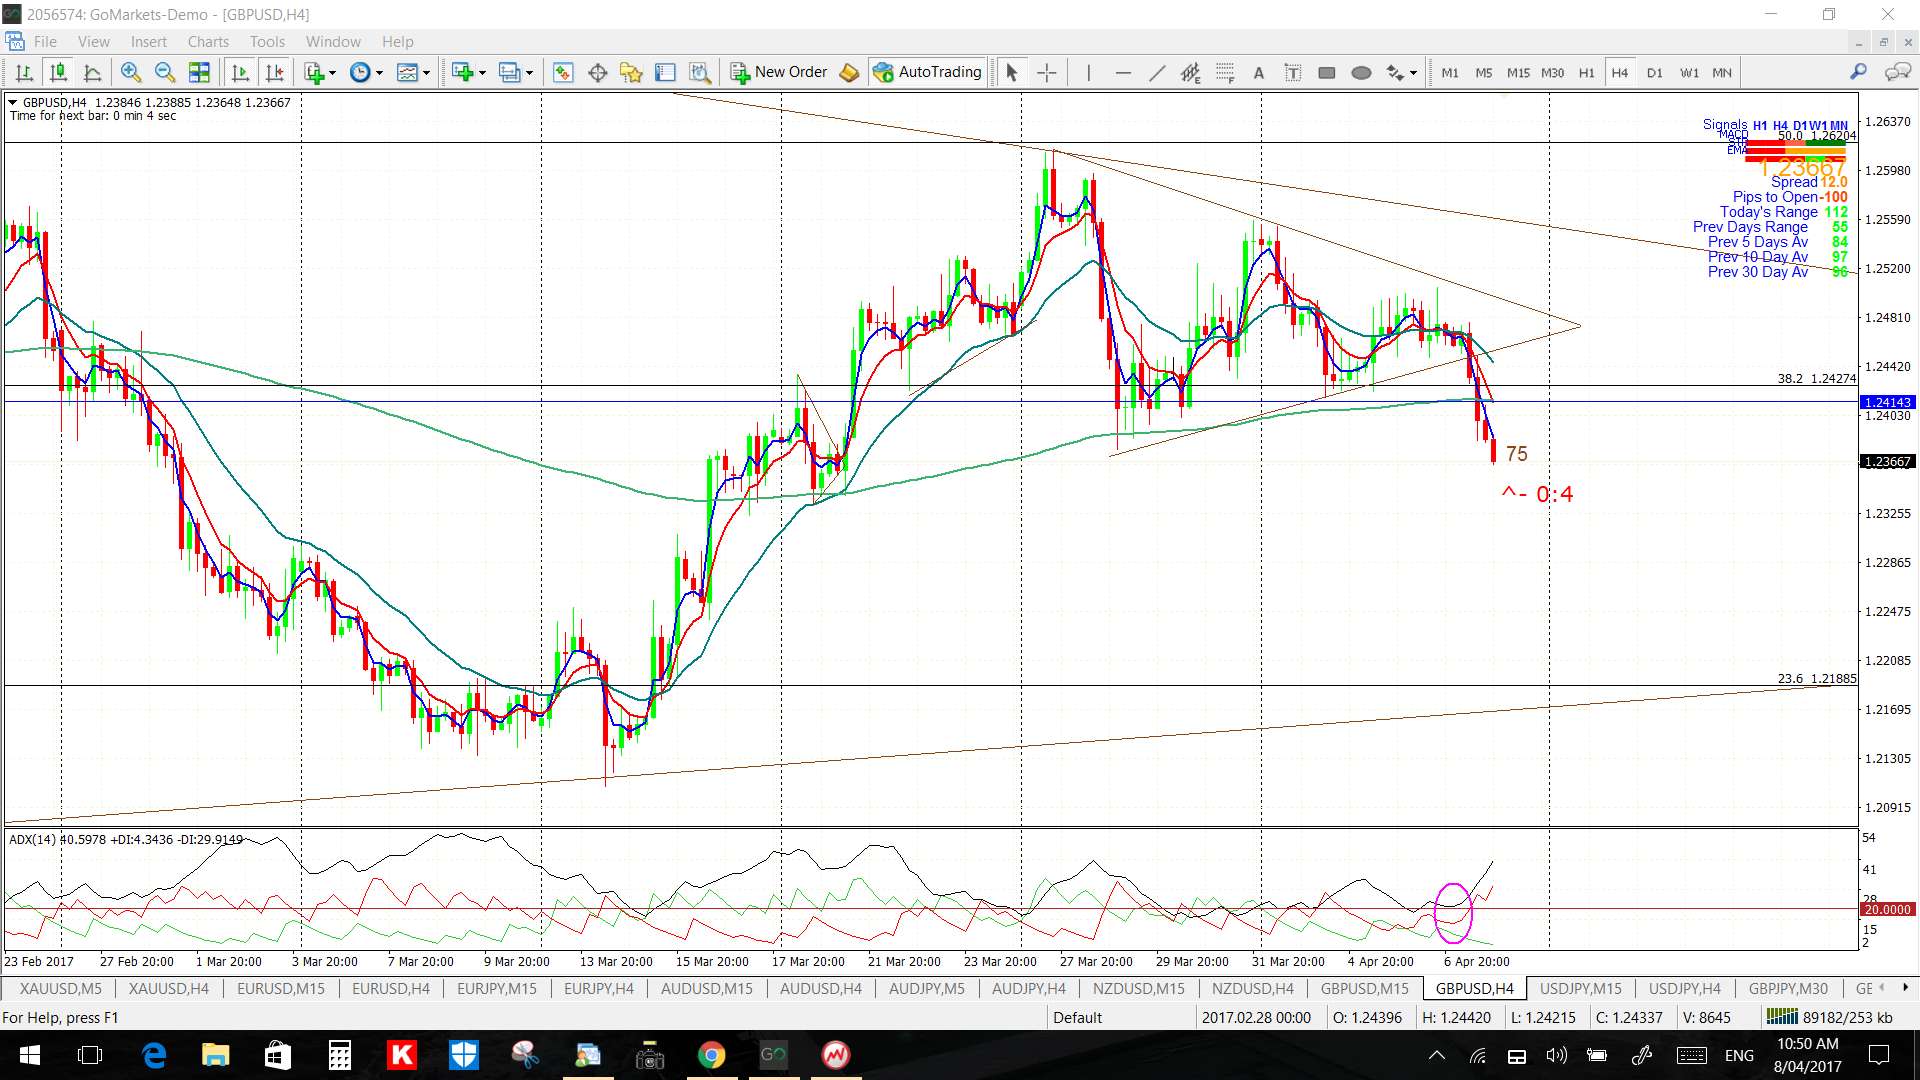
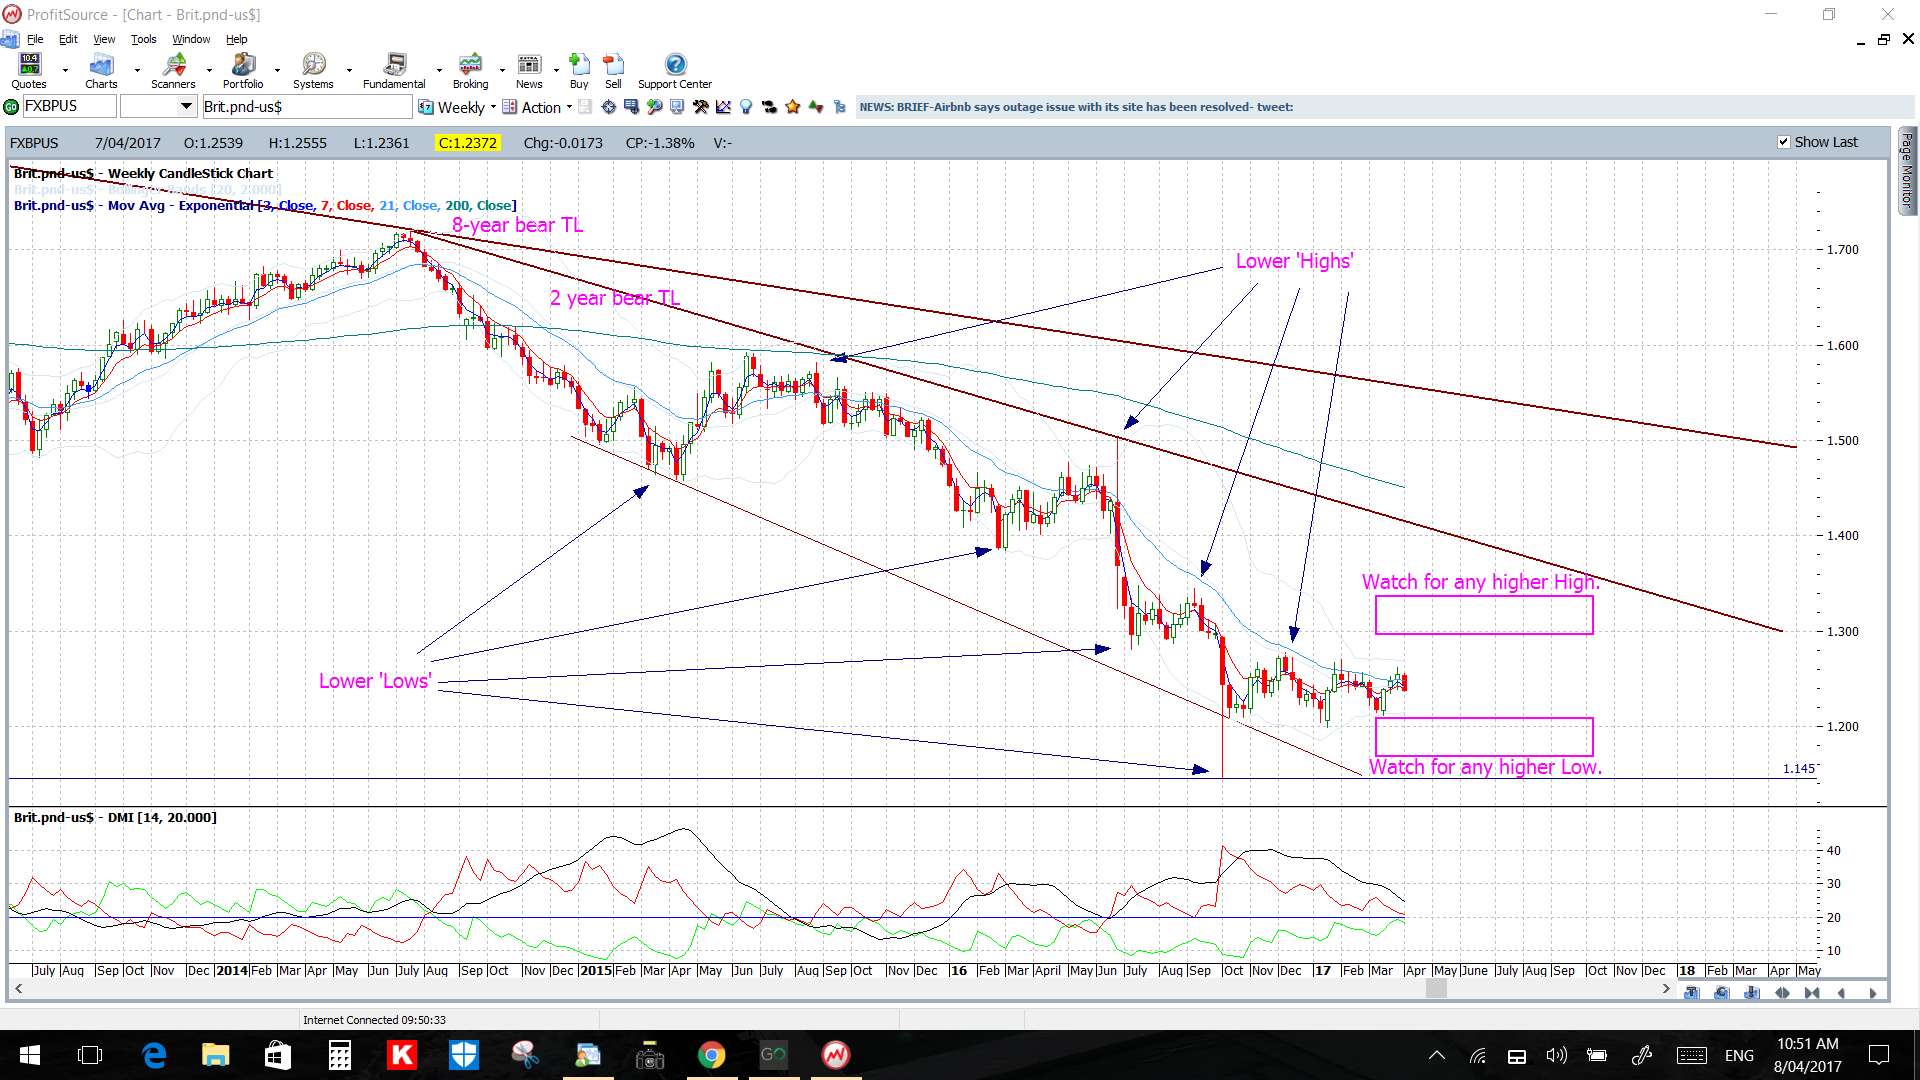
GBP/USD: I have adjusted the daily chart triangle trend lines here given price action failed to deliver any bullish follow-through. Last week’s data was a bit of a miss and seems to have foiled the previous breakout:
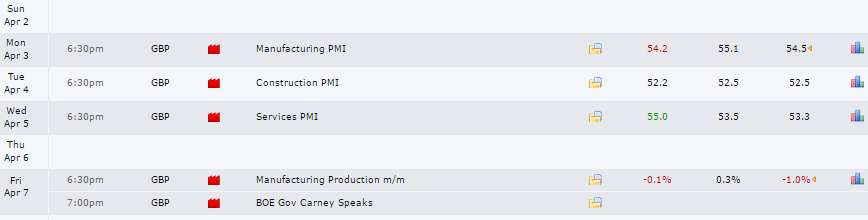
The 4hr chart shows that a smaller triangle breakdown triggered on Friday and so I’ll be watching to see if bearish sentiment continues and takes price down to test the daily chart’s triangle support trend line. I note the 61.8% fib is before this though at 1.23 and so I’ll be watching this level for any reaction as well.
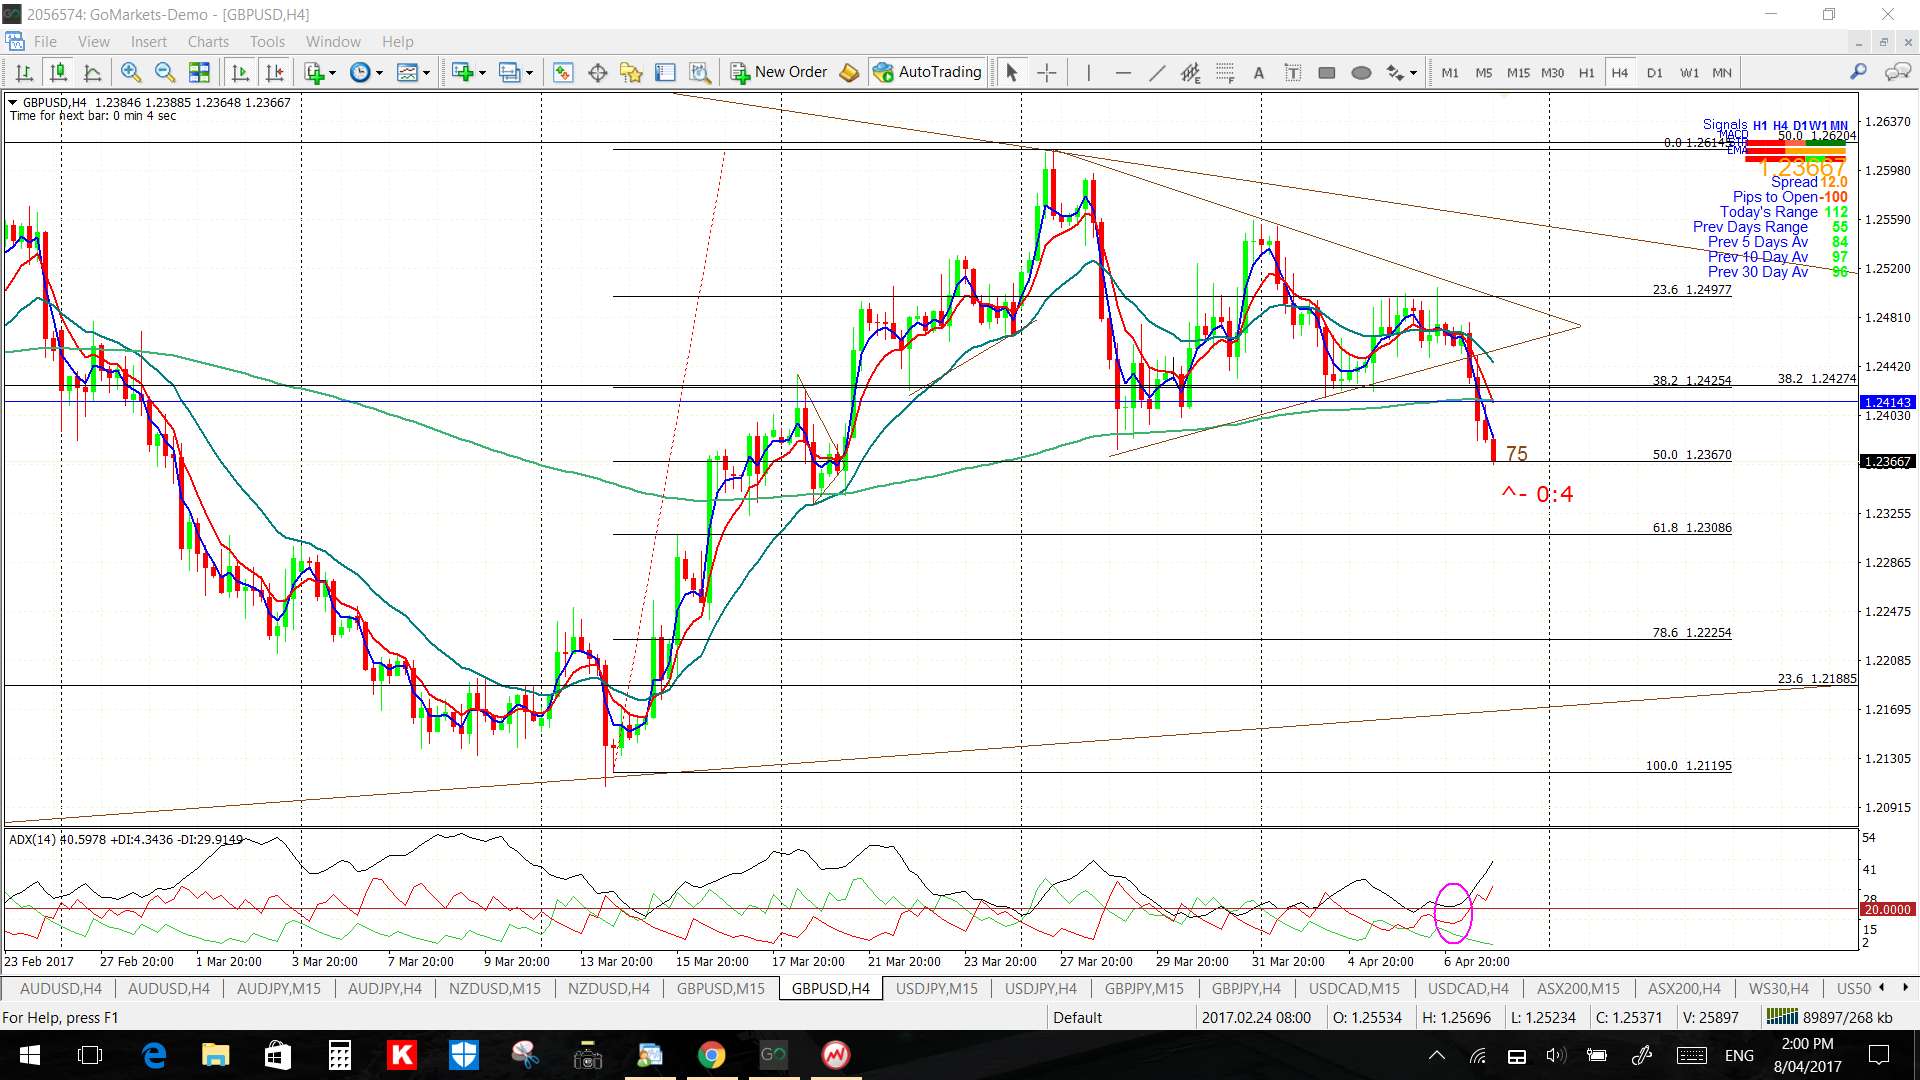
Note on the weekly chart how price action has failed to carve out any new higher ‘HIGH’ or higher ‘LOW’ to break the pattern of the recent downtrend; we’re still just going sideways on declining momentum! I suspect something will have to give sooner or later though.
Price is below the 4hr Cloud but in the daily Cloud.
The weekly candle was bearish and, essentially, ‘engulfing’.
There is GBP CPI and Employment data to navigate in this shorter Easter week:


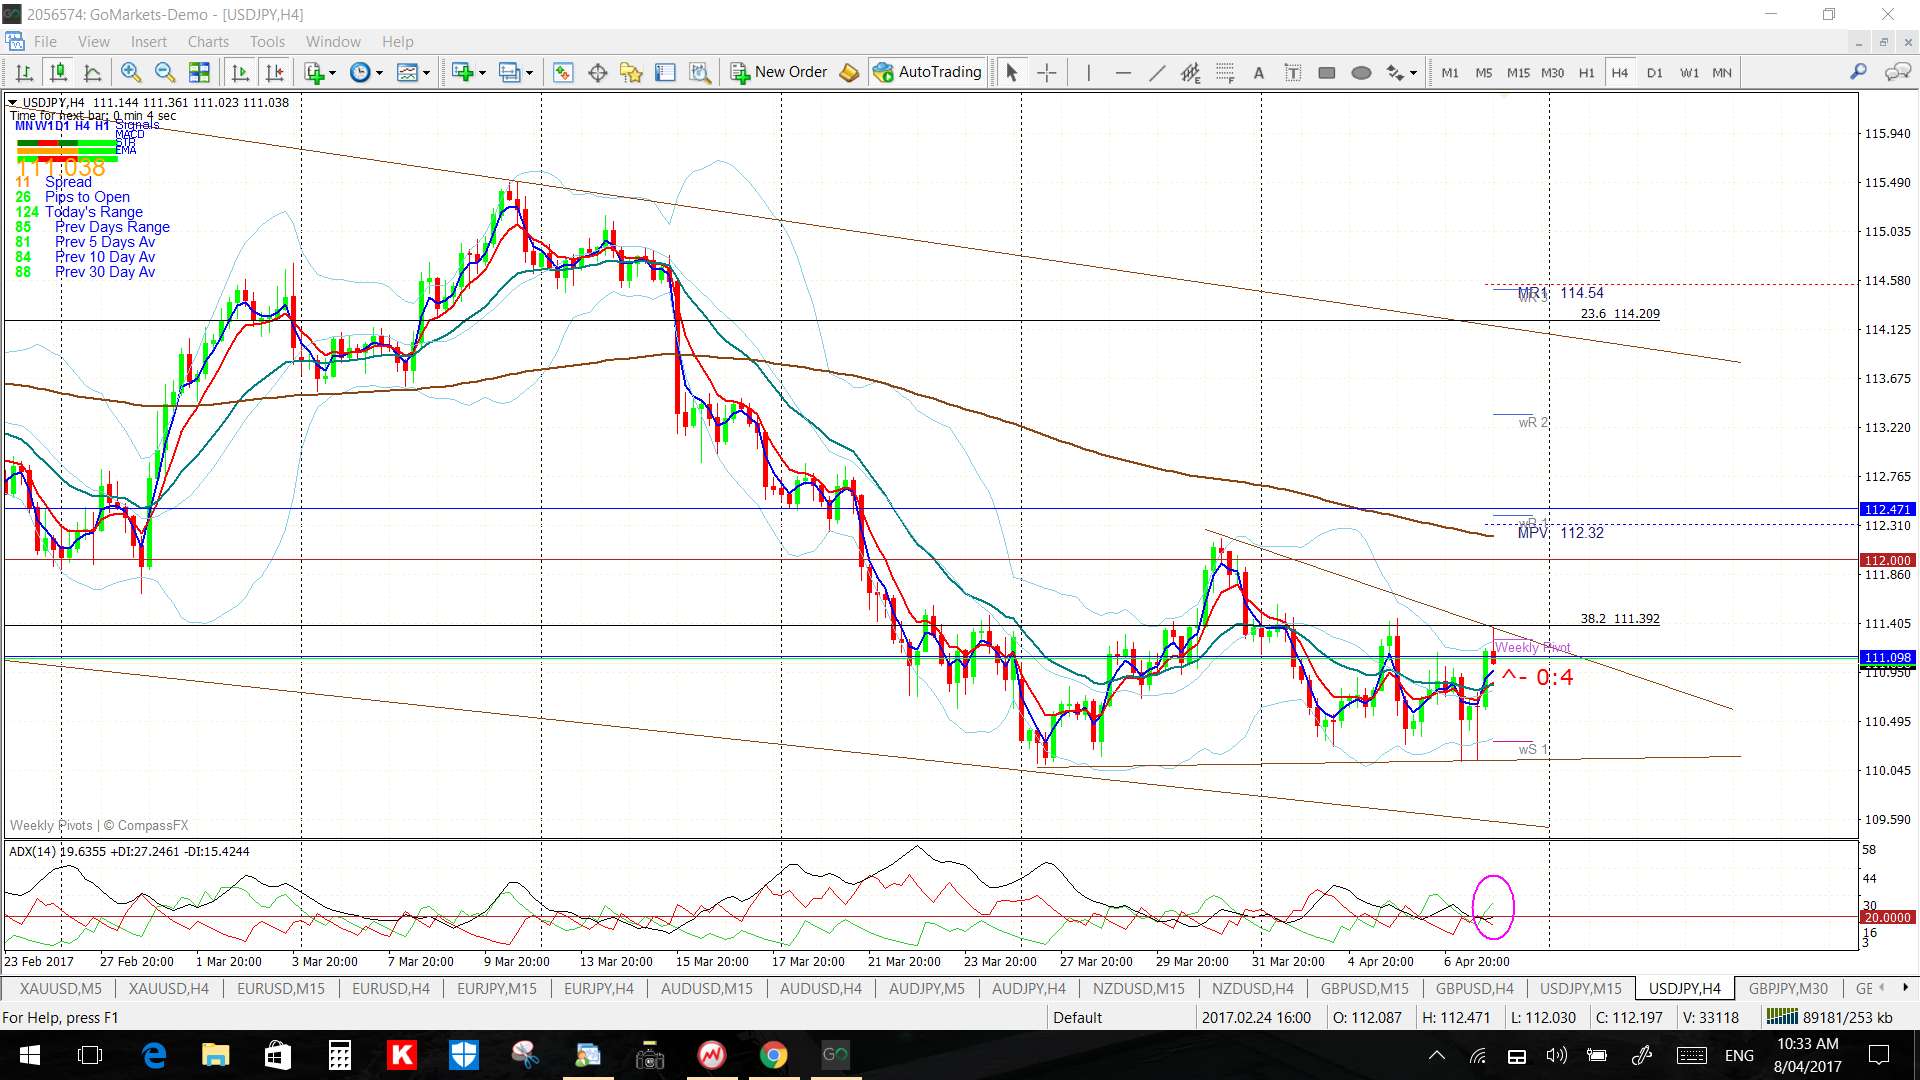
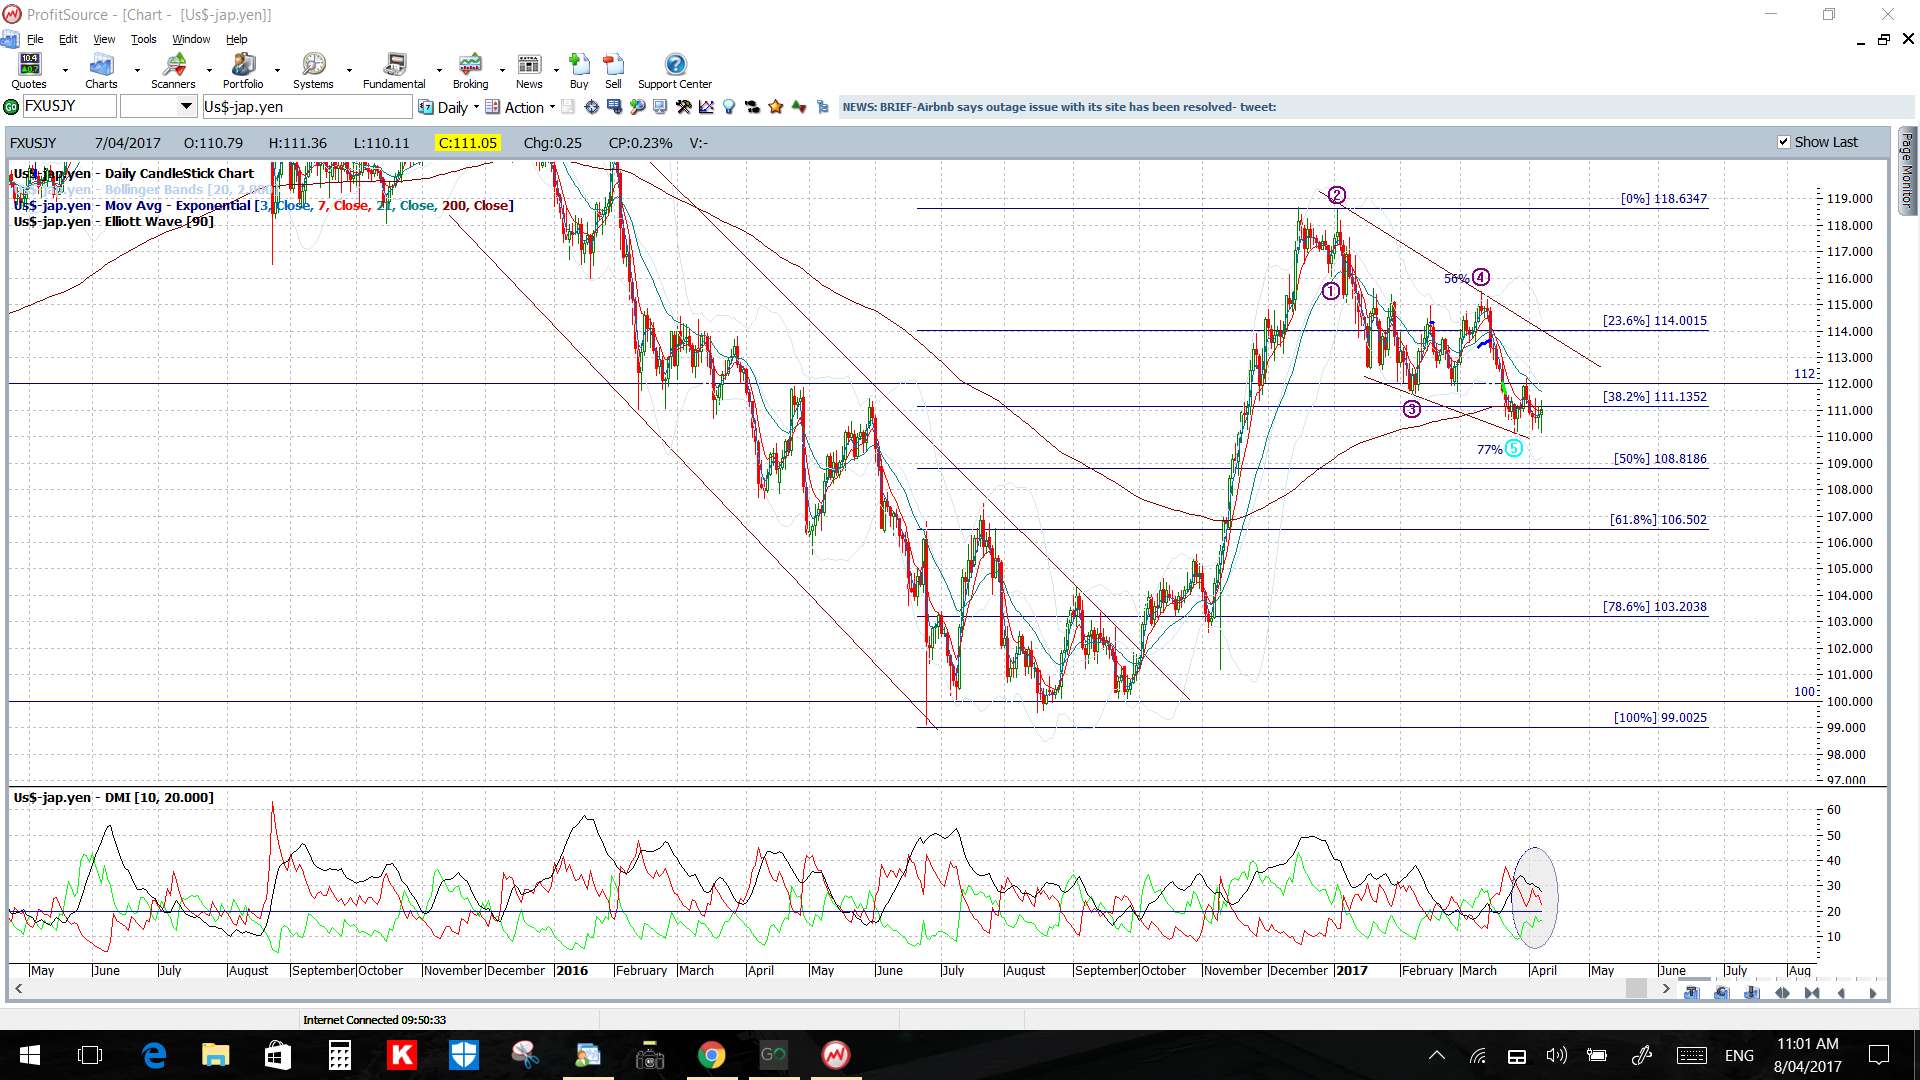
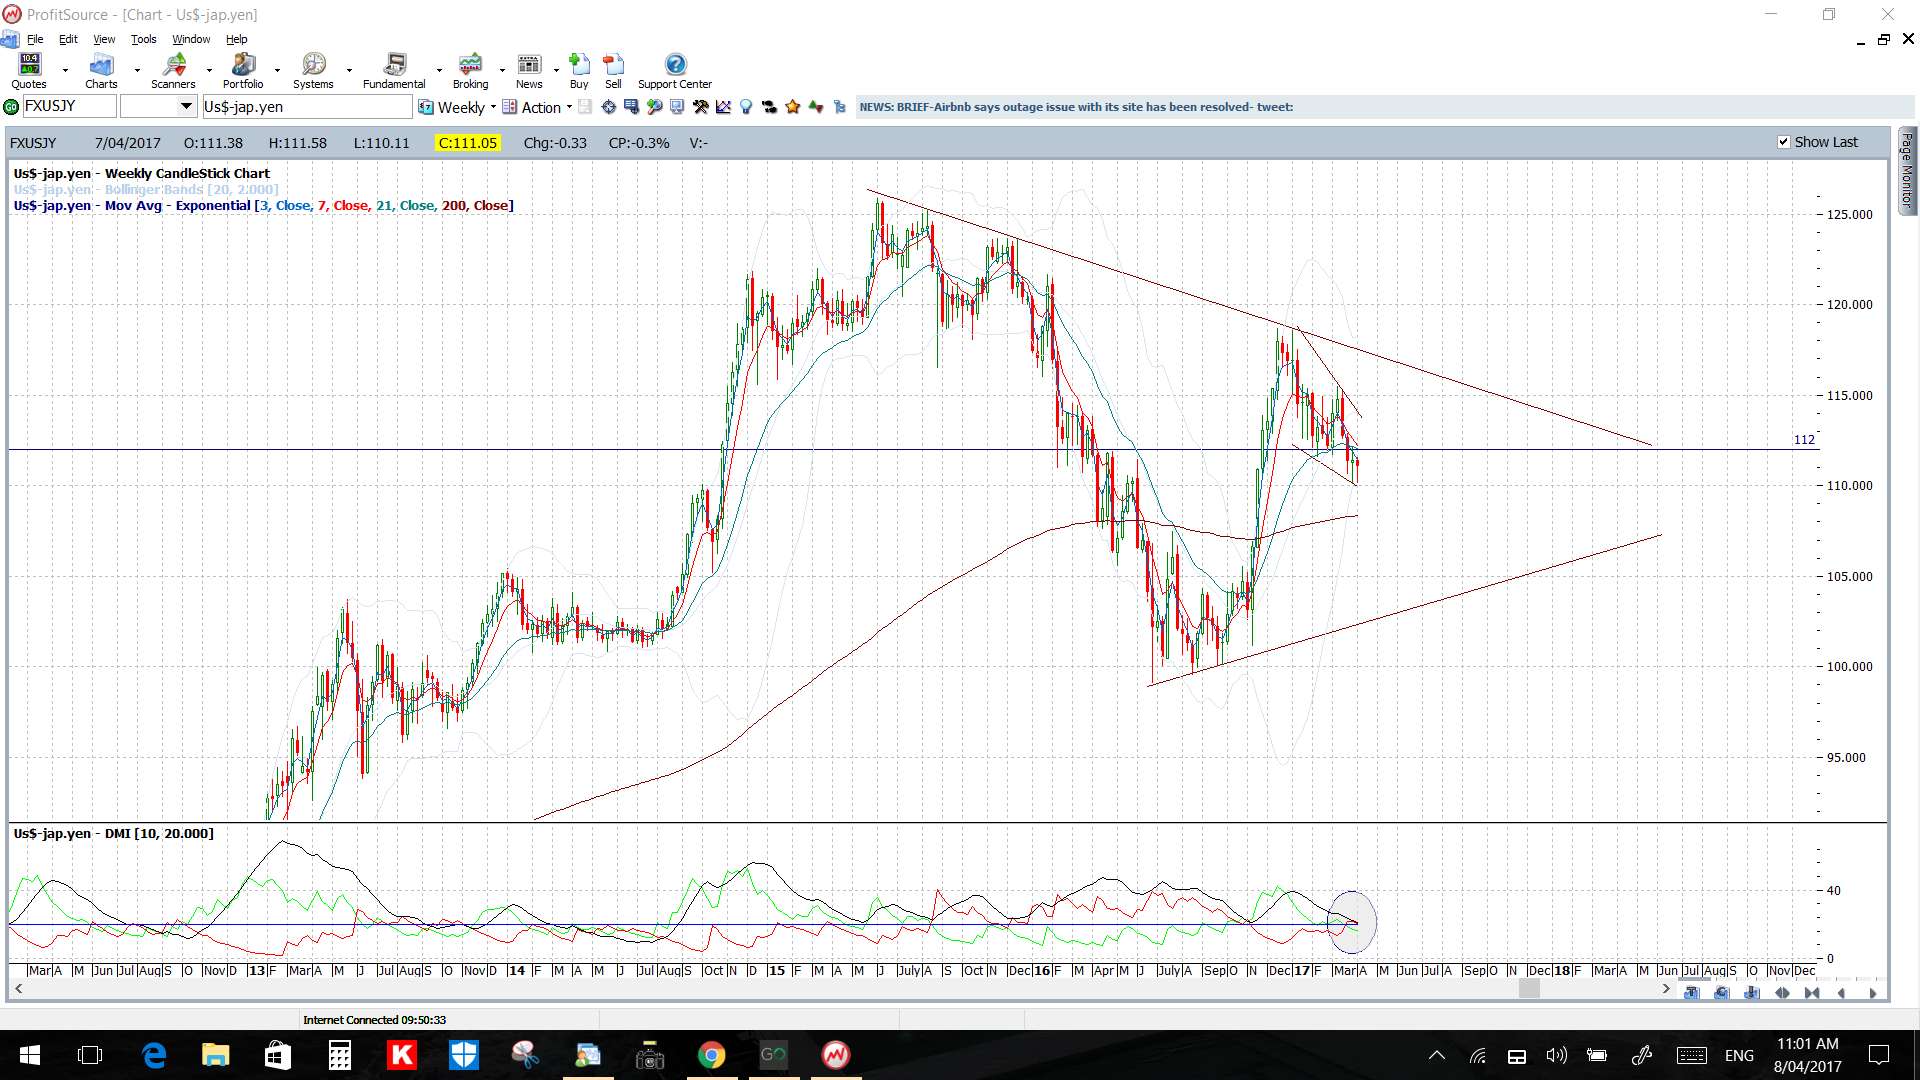
USD/JPY: Price continues within a triangle on the 4hr chart but note that this is set within a larger wedge on the weekly chart giving traders multiple trend lines to watch next week for any make or break activity.
Price is below the 4hr and daily Cloud.
The weekly candle was small and bearish with a long lower tail.
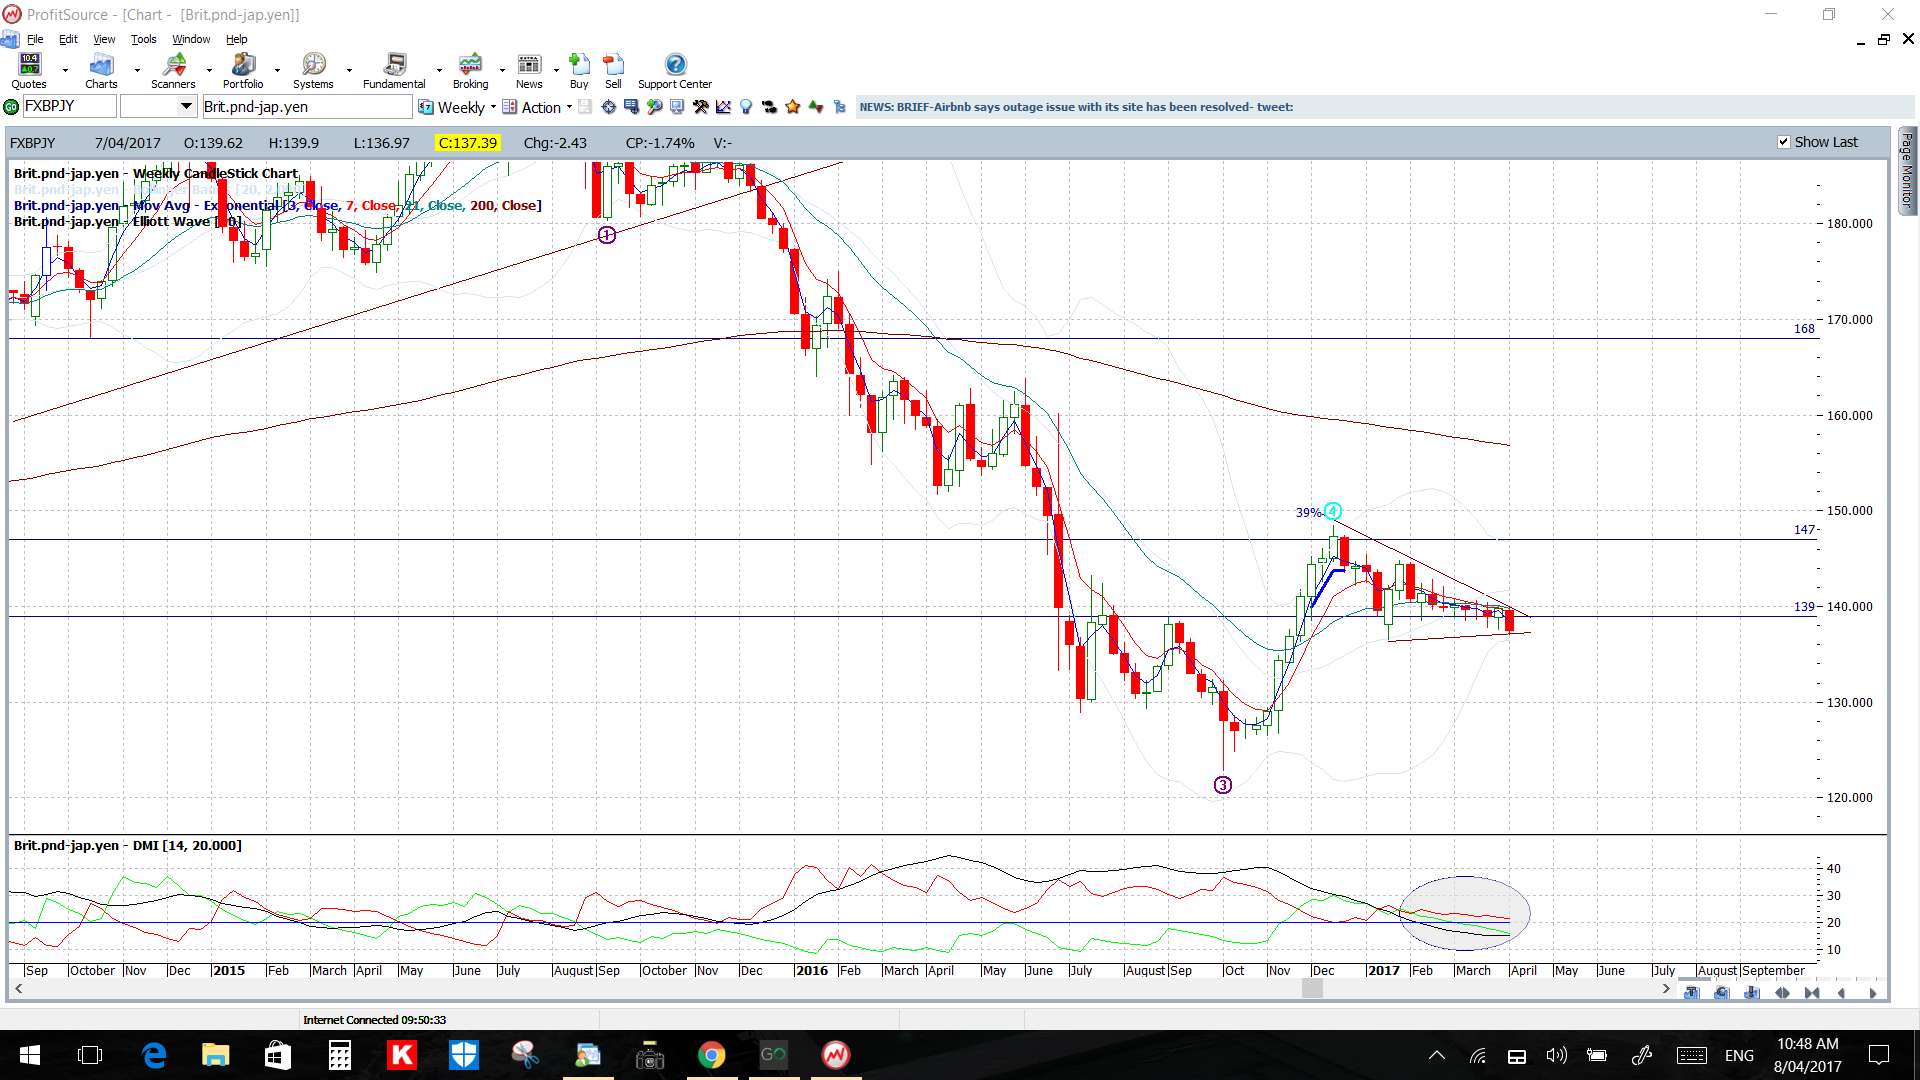
GBP/JPY: I’m still watching the daily/weekly chart wedge trend lines for any momentum-based breakout.
Price is below the 4hr and daily Cloud.
The weekly candle was a bearish, almost ‘engulfing’ candle.


GBP/AUD: Price action is trading under a daily chart wedge trend line and this has formed a triangle on the 4hr chart so watch these in the coming week for any make or break activity.
Price is above the 4hr Cloud but in the daily Cloud.
The weekly candle was a bullish coloured ‘Spinning Top’ reflecting some indecision.

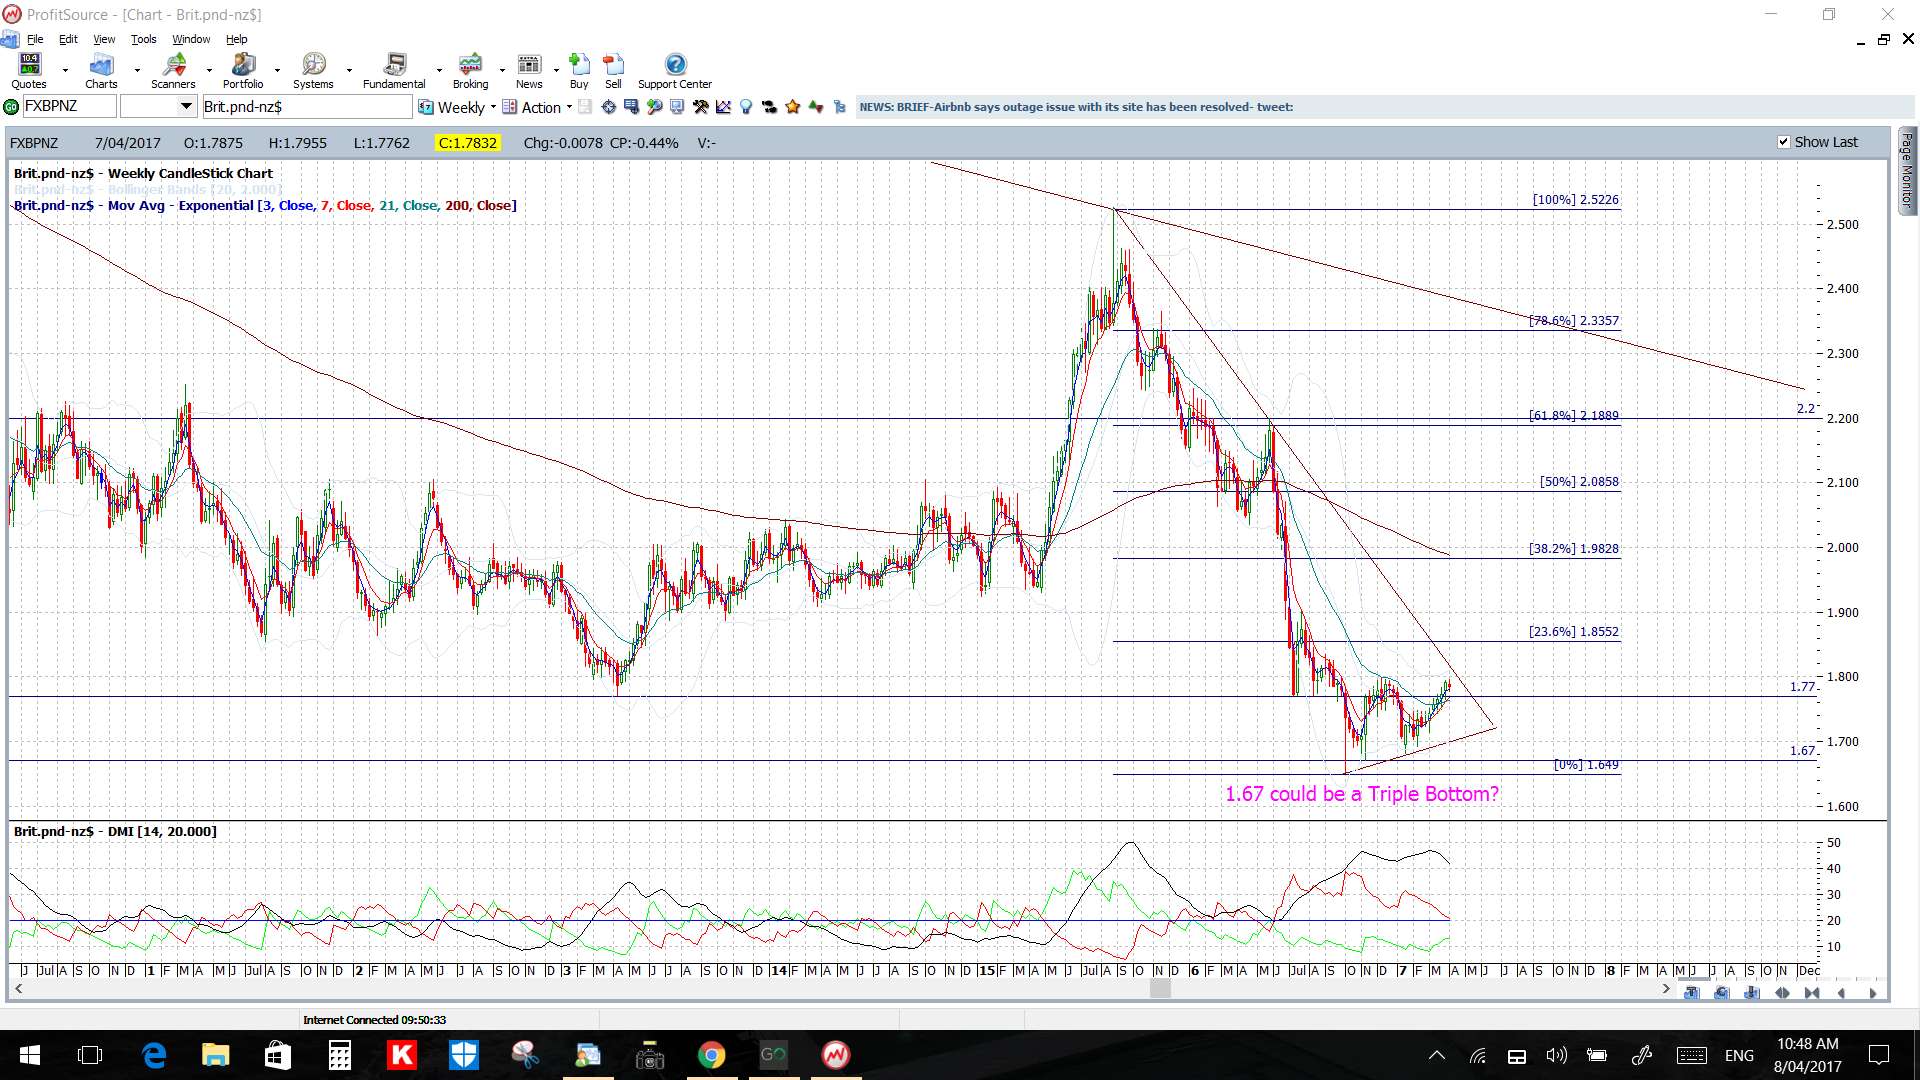
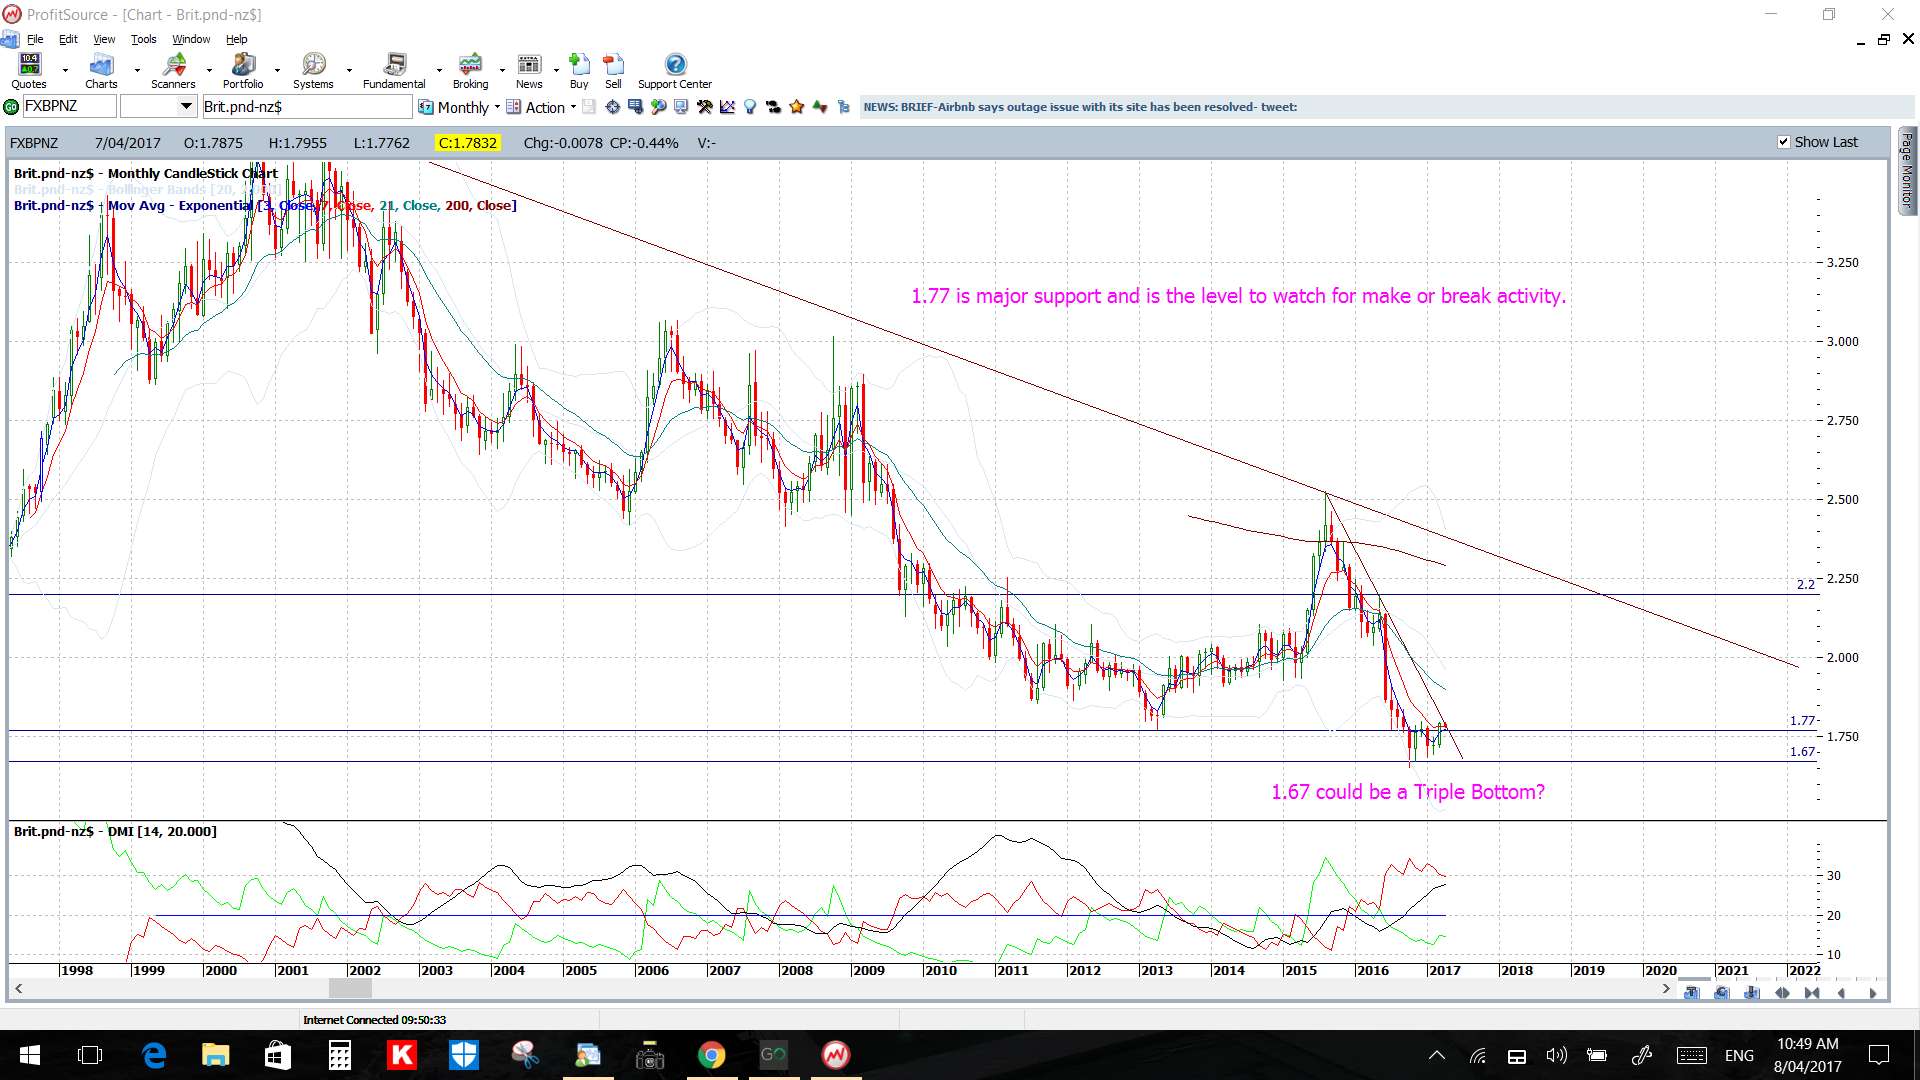
GBP/NZD: The GBP/NZD has struggled this week but that isn’t too surprising given an almost 2-year bear trend line is just above current price. There is also the issue that 1.77 is a major level which was broken last week and so some further test of this key S/R region would not surprise.
Price is below the 4hr Cloud but above the daily Cloud.
The weekly candle was a small bearish candle but this follows six weeks of small bullish candles. Seems that a bit of indecision remains in vogue here!

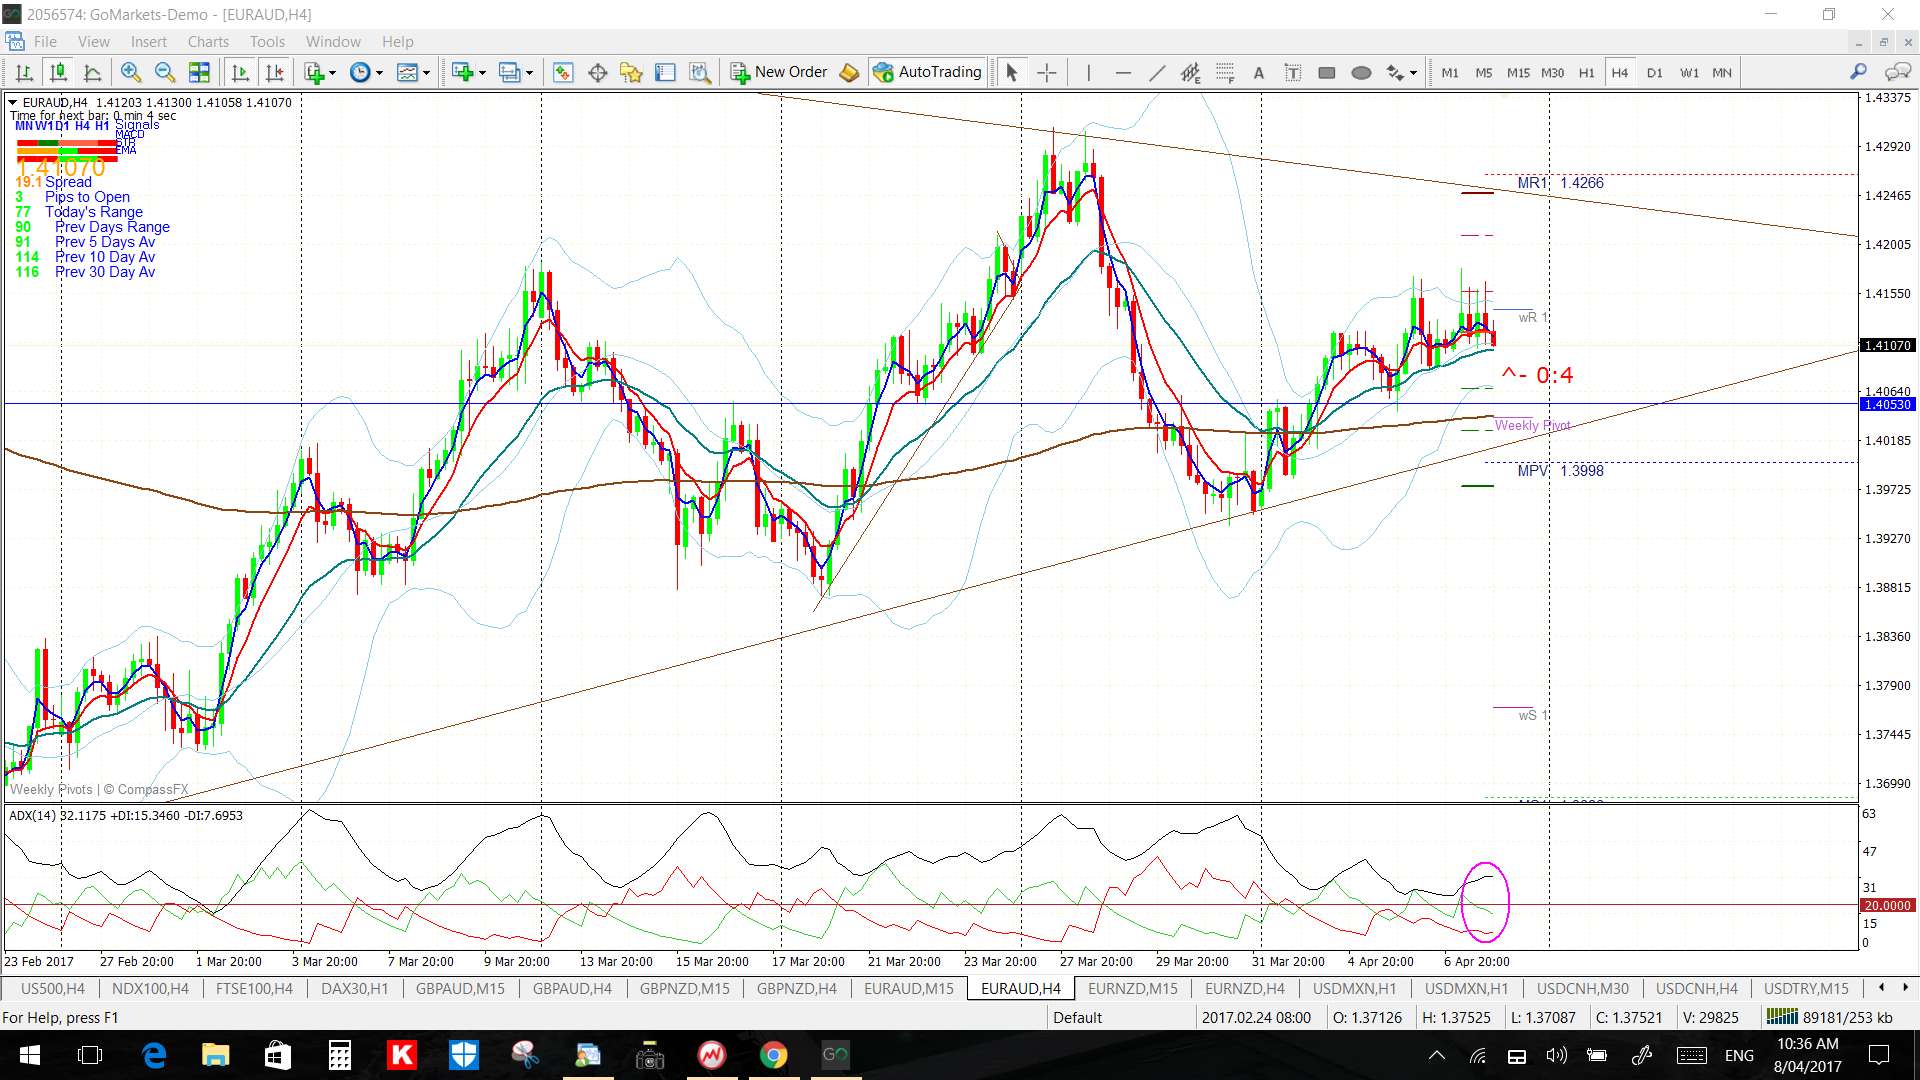
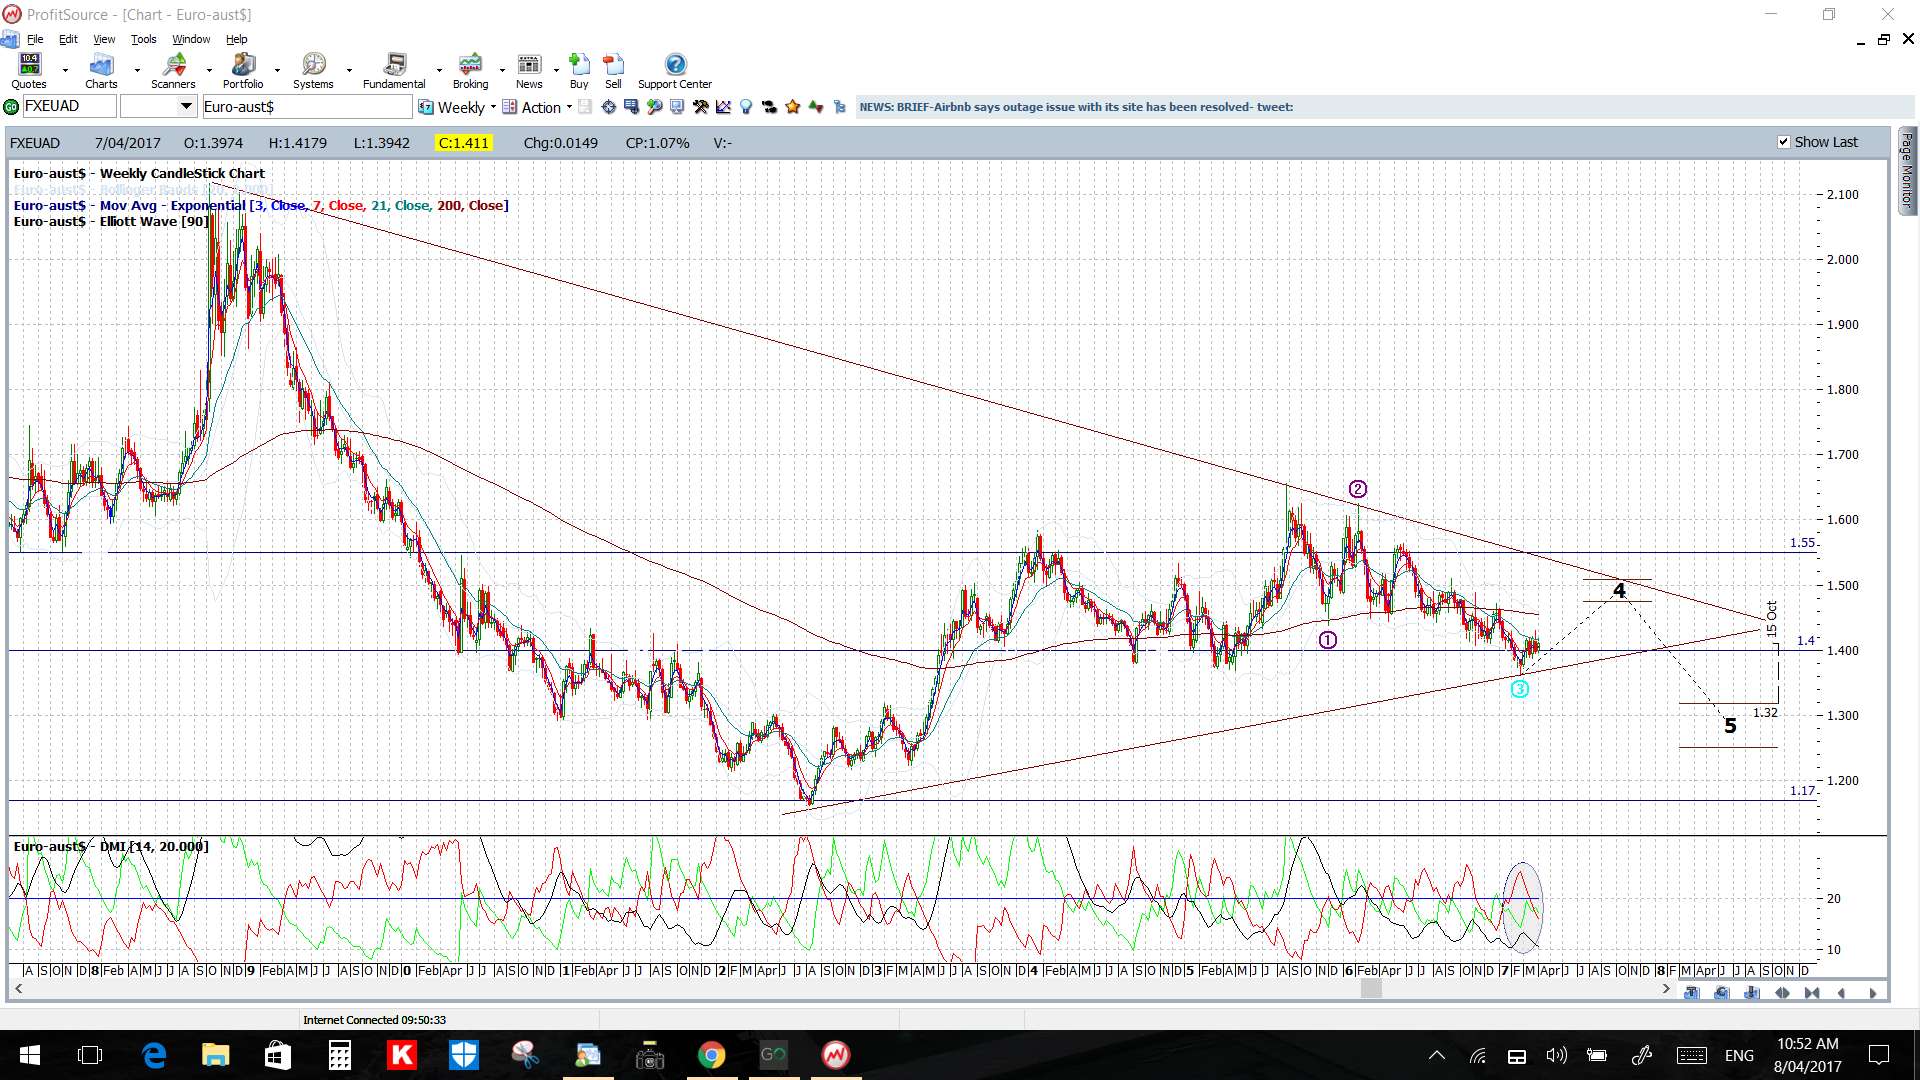
EUR/AUD: The EUR/AUD remains in a daily chart triangle that is set within a larger weekly chart triangle giving us trend lines to watch for anymake or break activity. Note, also, how price has not moved too far away from the key S/R region of 1.40.
Price is in the 4hr and daily Cloud.
The weekly candle was a bullish coloured ‘Inside’ candle reflecting indecision.
EUR/NZD: The EUR/NZD has essentially been chopping sideways for the last four weeks following the earlier major bullish breakout from the monthly chart’s descending wedge pattern. Some thinking time here then does not surprise me.
There is a wedge on the 4hr chart to watch next week for any make or break activity.
Price is below the 4hr Cloud but above the daily Cloud.
The weekly candle was a small bullish coloured ‘Inside’ candle reflecting indecision.


USD/CNH: This pair broke out of a 4hr chart triangle last week and price has now edged up to a daily chart wedge trend line so this will be the region to watch next week for any make or break activity.
Price is above the 4hr and daily Cloud.
The weekly candle was bullish.

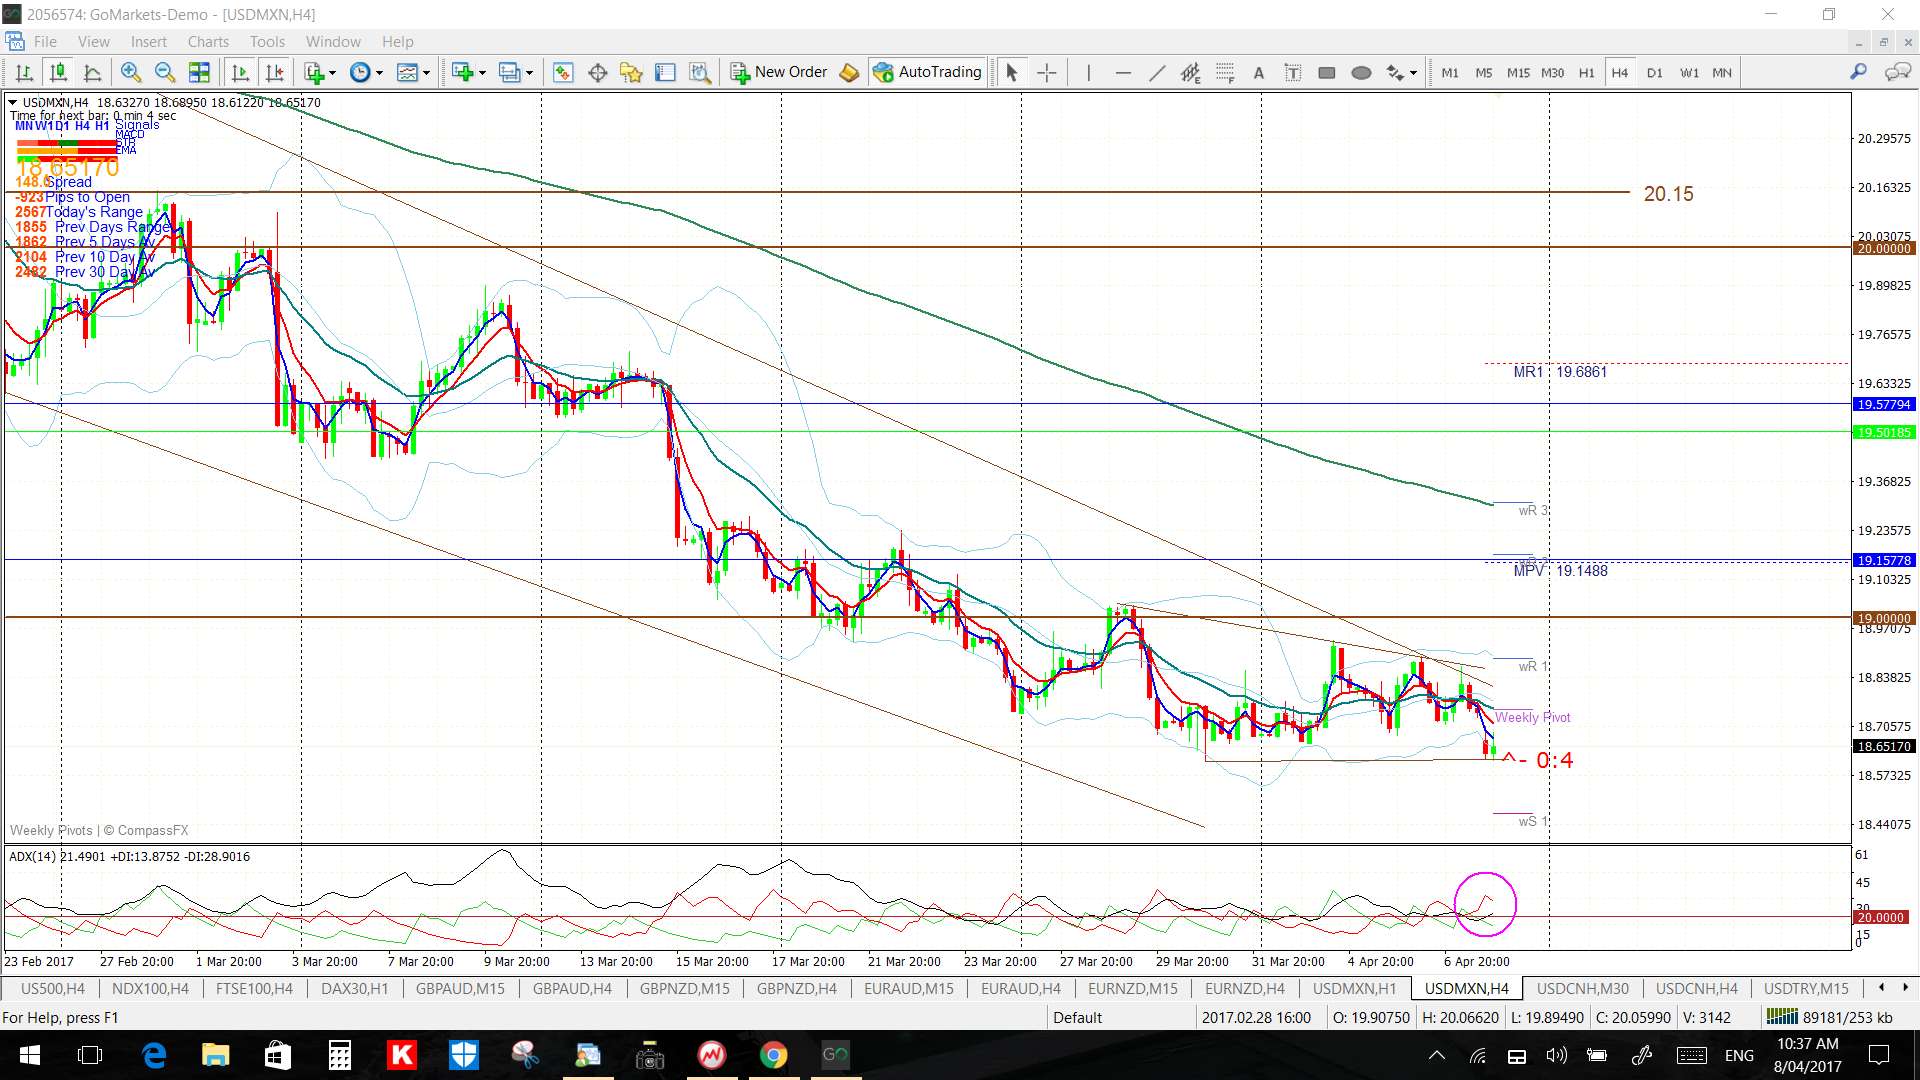
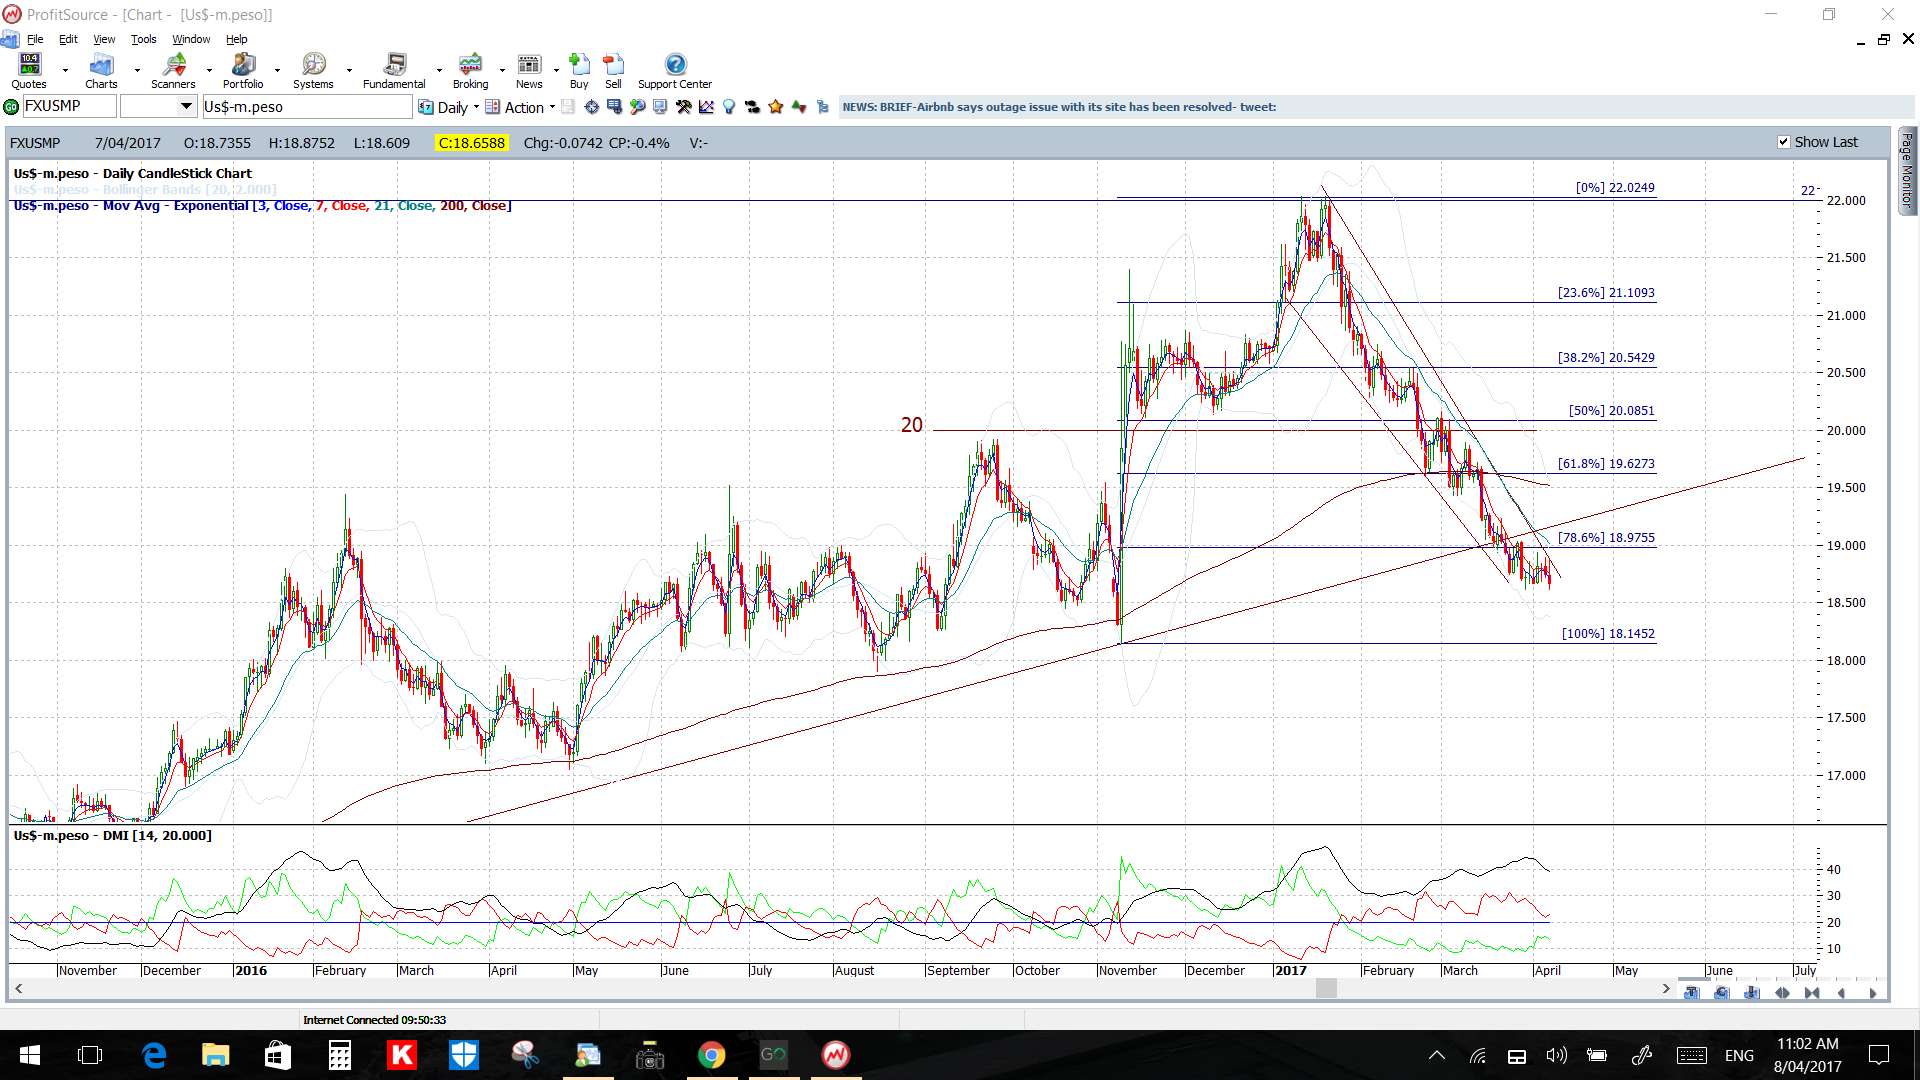
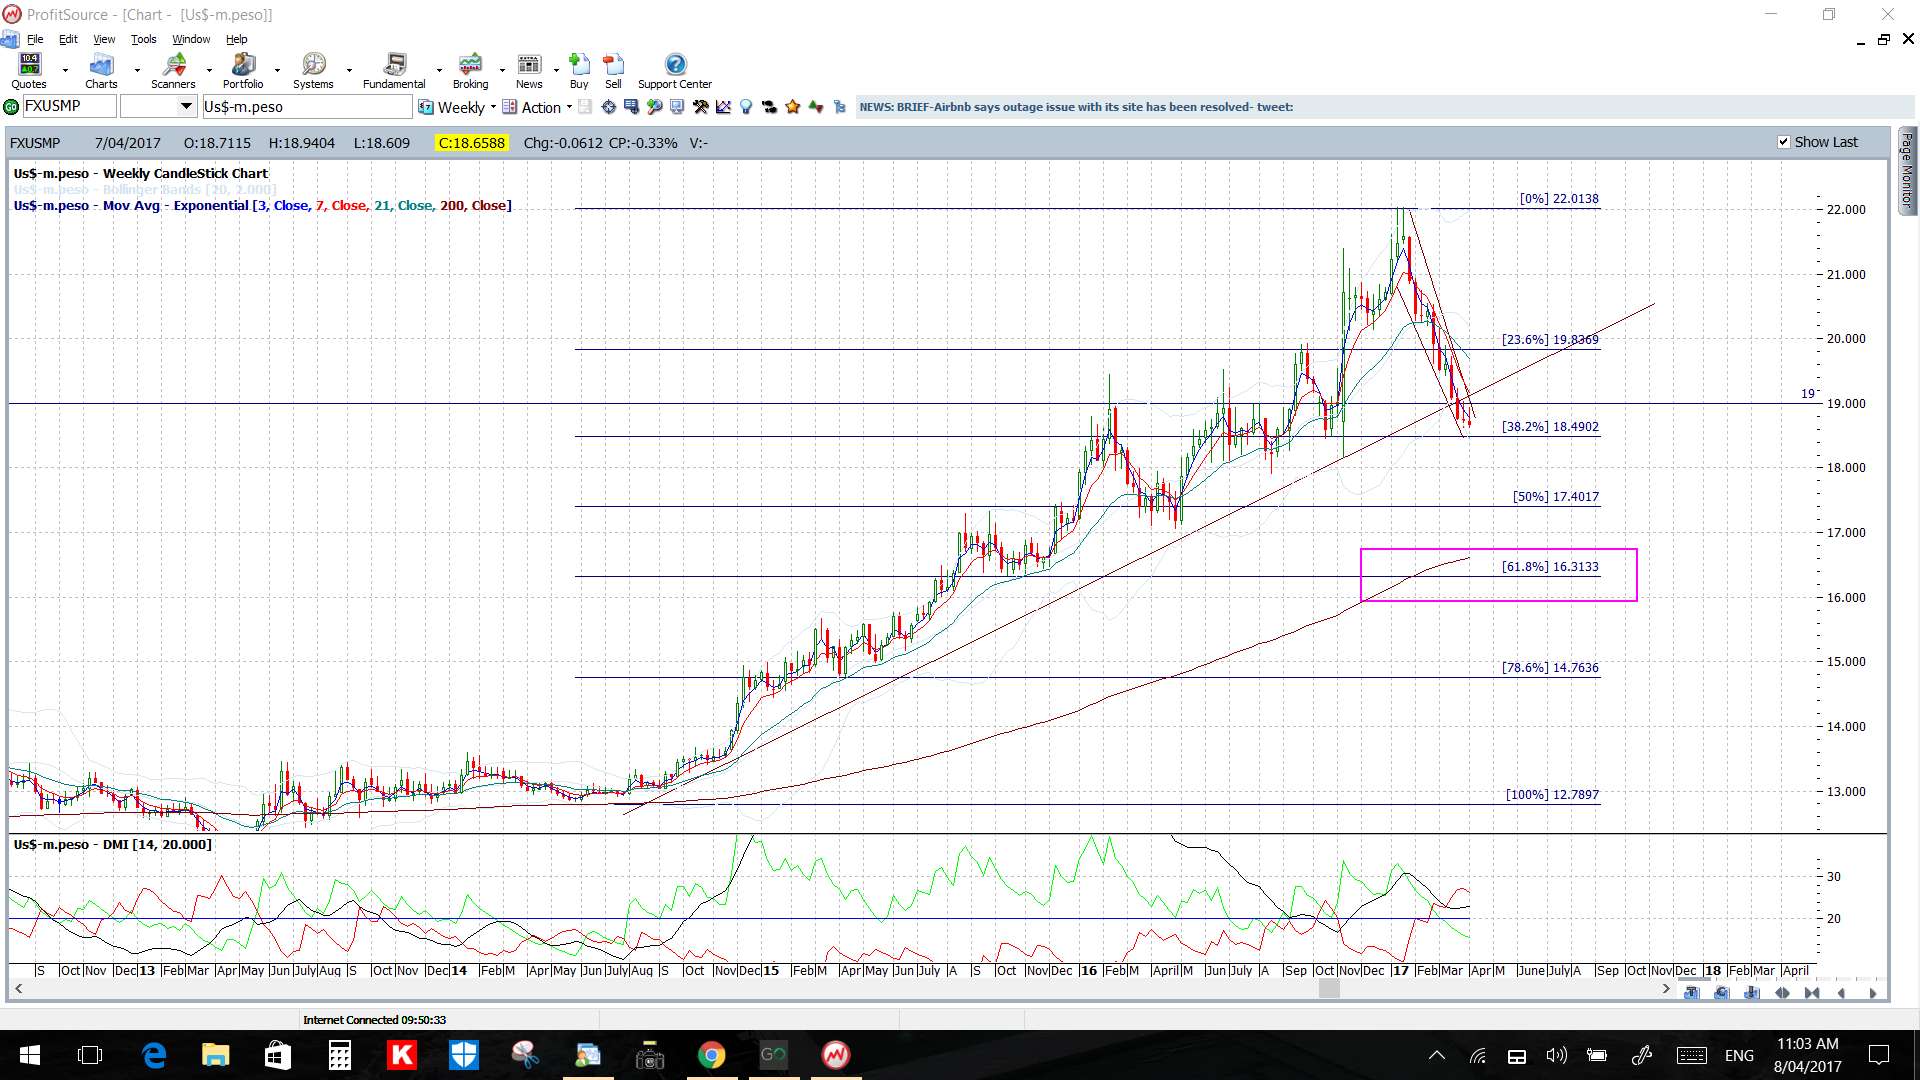
USD/MXN: Price remains in a descending trading channel, albeit a slightly adjusted one, but still below the broken weekly chart support trend line and below the key 19 level.
This broken trend line and 19 juncture will be in focus this week in light of strengthening efforts on US$ and success there could tip this pair back above this demarcation zone. Thus, watch this region carefully for any renewed pressure. I’ve noted a wedge on the 4hr chart giving traders trend lines to watch next week for any make or break activity and this is located just under the key 19 level.
Price is below the 4hr and daily Cloud.
The weekly candle was small and bearish with a long upper shadow.
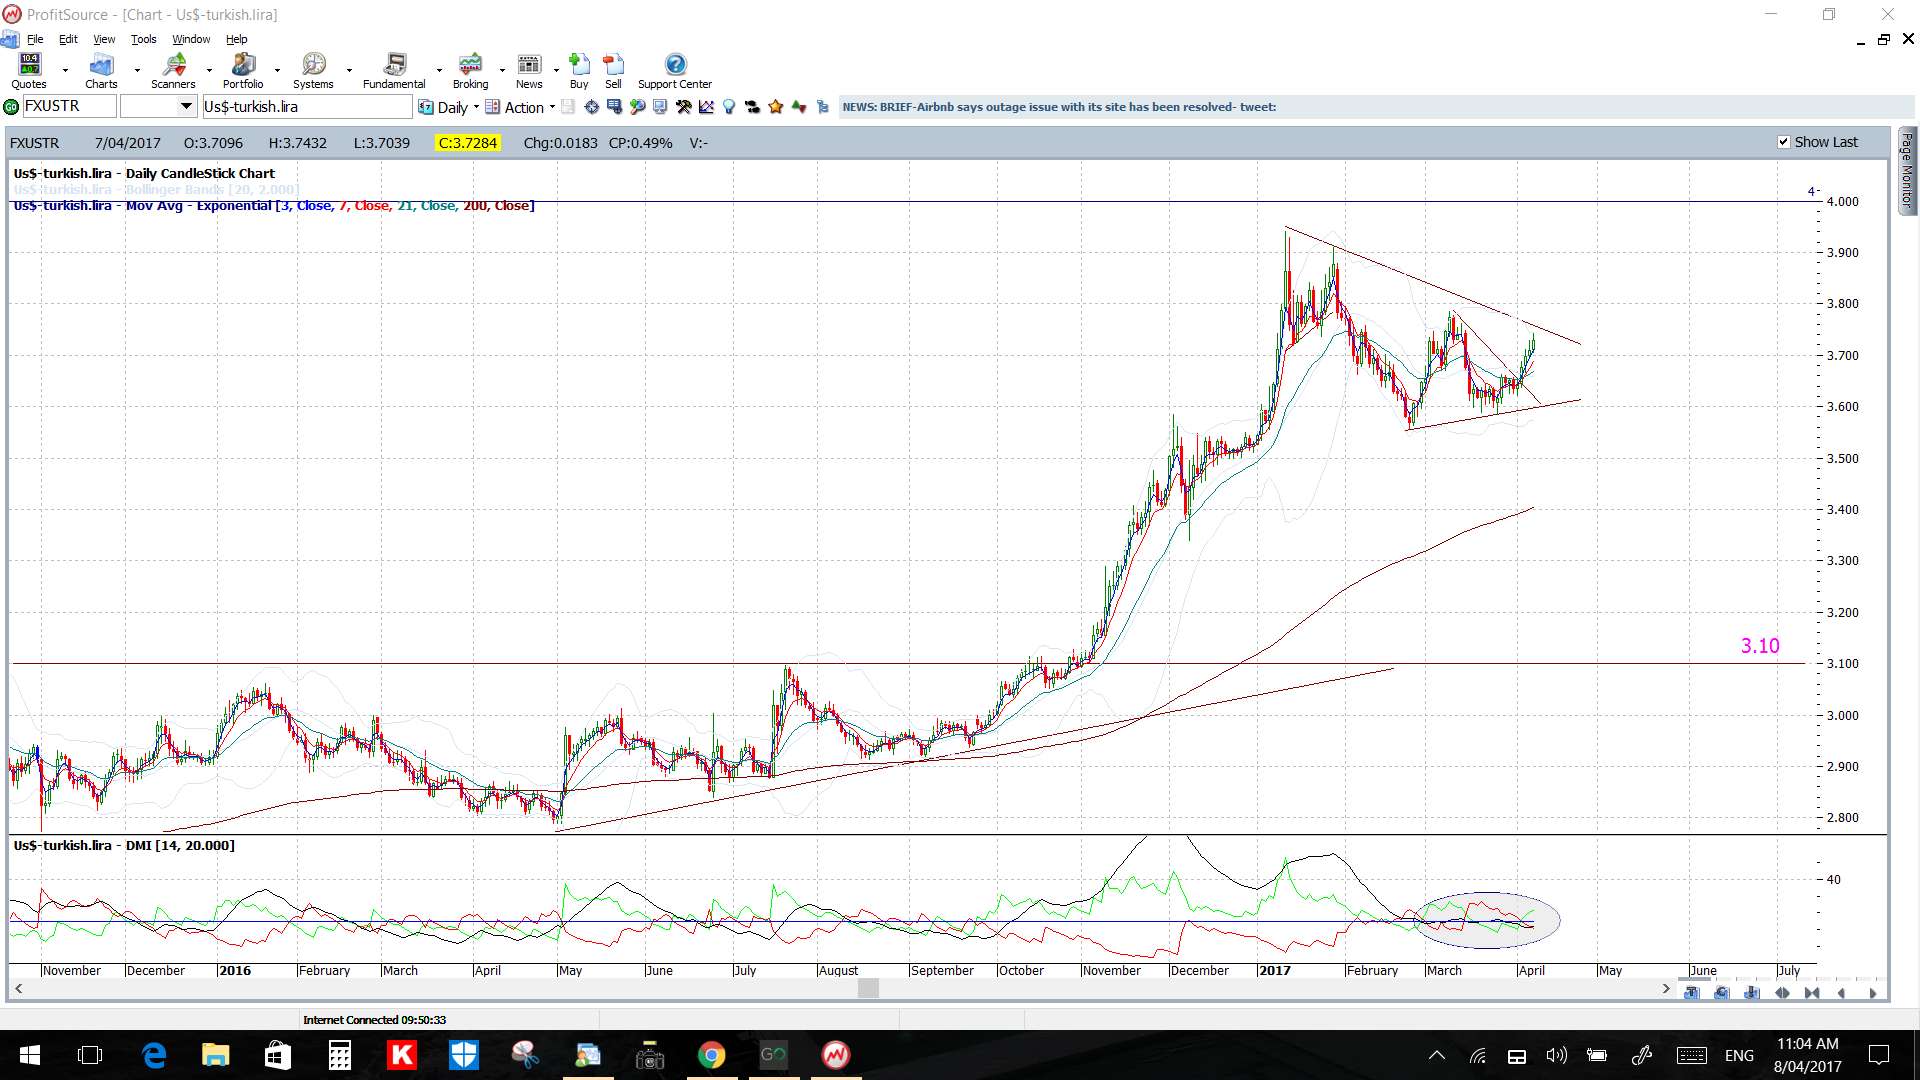
USD/TRY: This would have to be one of the better trend line breakout trades for the week! The 4hr chart I posted in my w/e analysis from last week is shown below with the trend lines in play to watch for any potential breakout:
This is how the chart finished up for the week! Some 1,000 pips later with price action now up at a daily chart bear trend line:
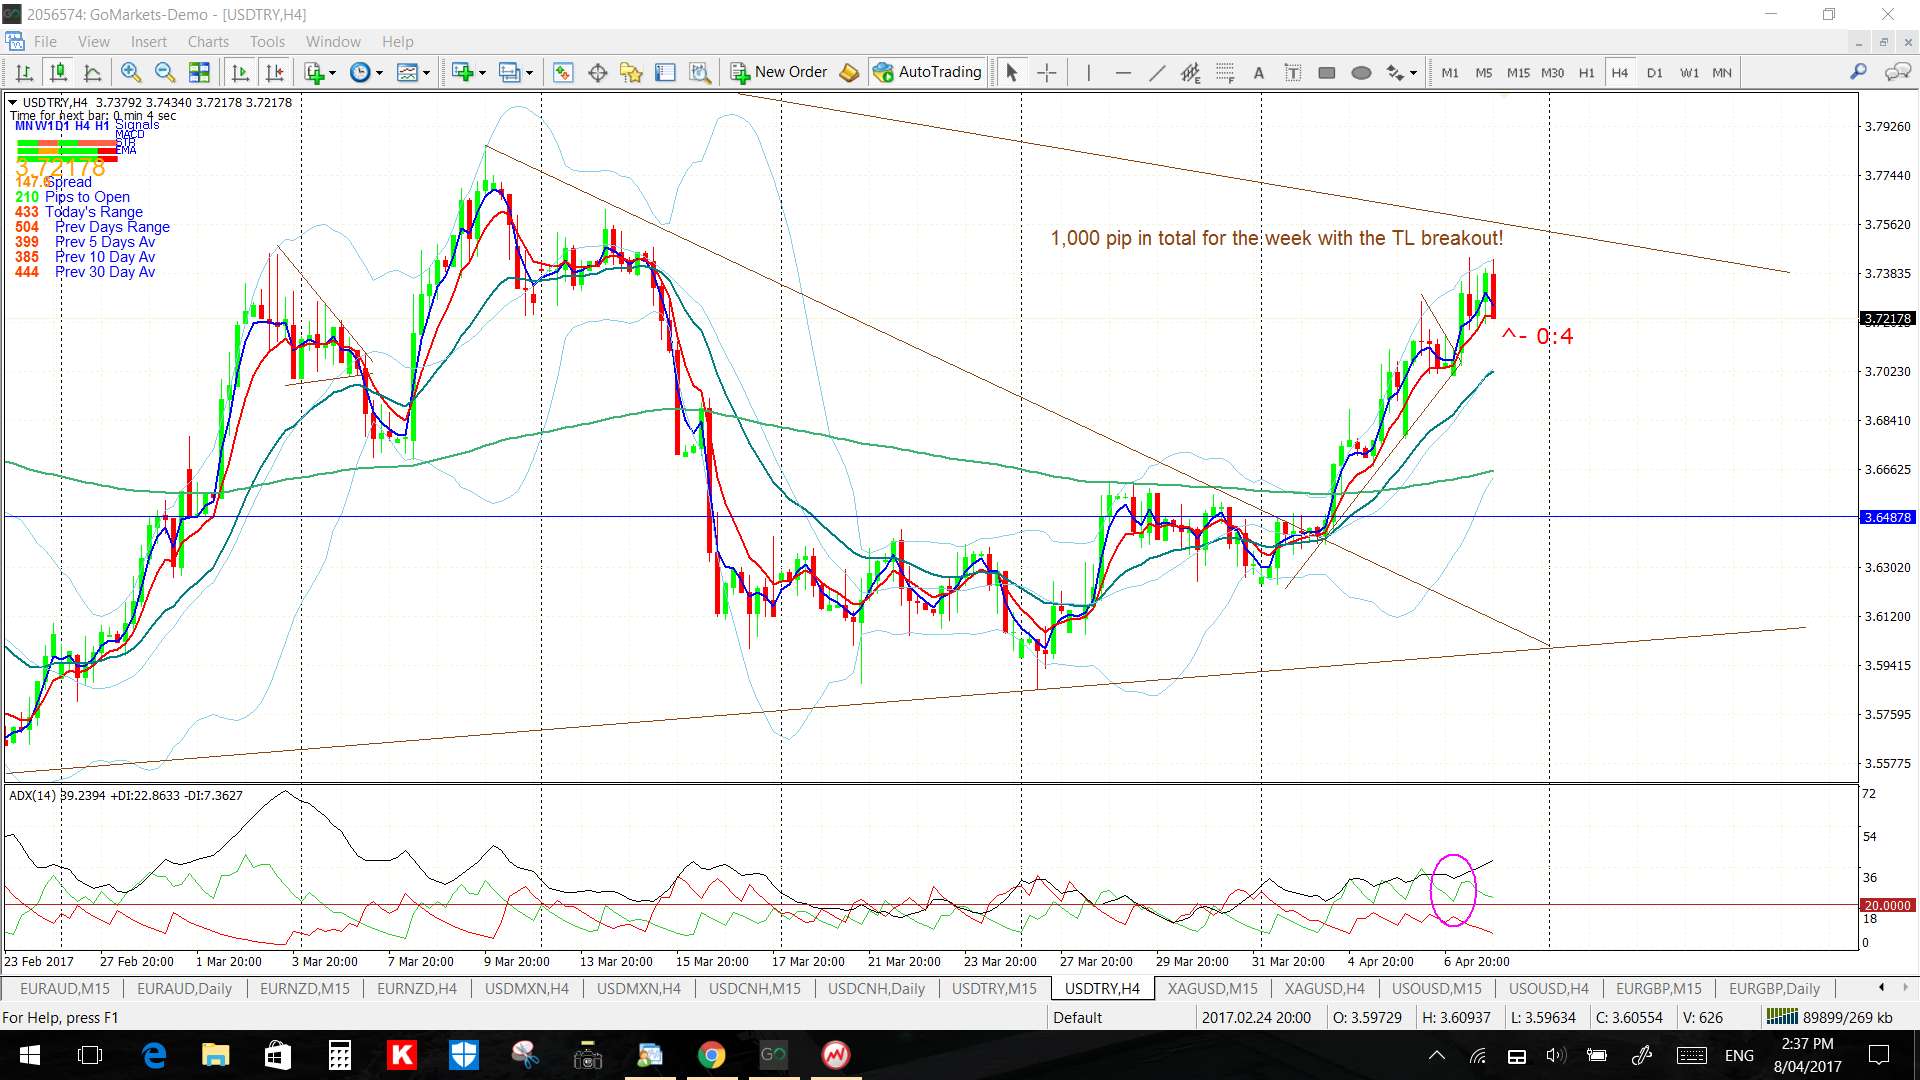
Price is above the 4hr Cloud and at the top edge of thin daily Cloud.
The weekly candle was bullish.
The Turkish Referendum is on next Sunday April 16th and I wrote a separate article about this on Thursday which can be found through this link.
I would expect price to be rather choppy with the Referendum but watch the daily chart’s Flag trend lines for any make or break activity.

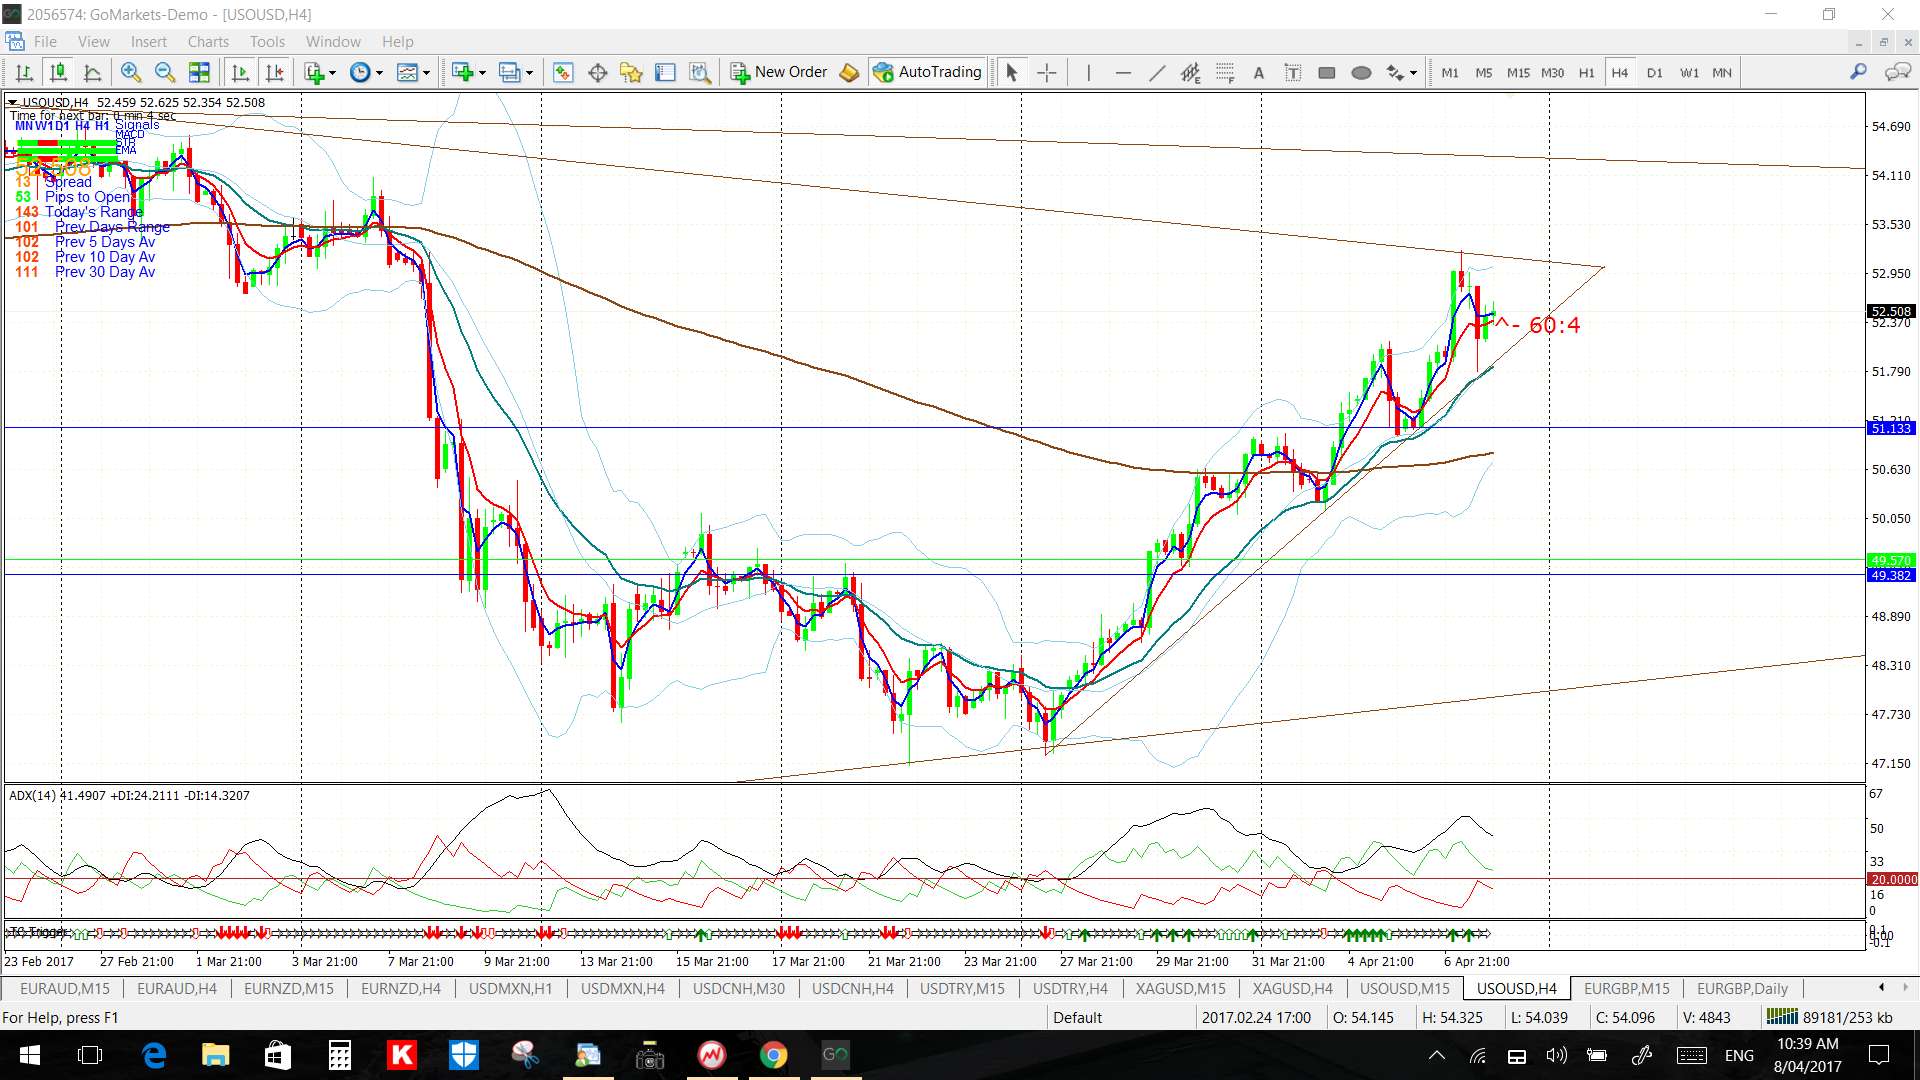
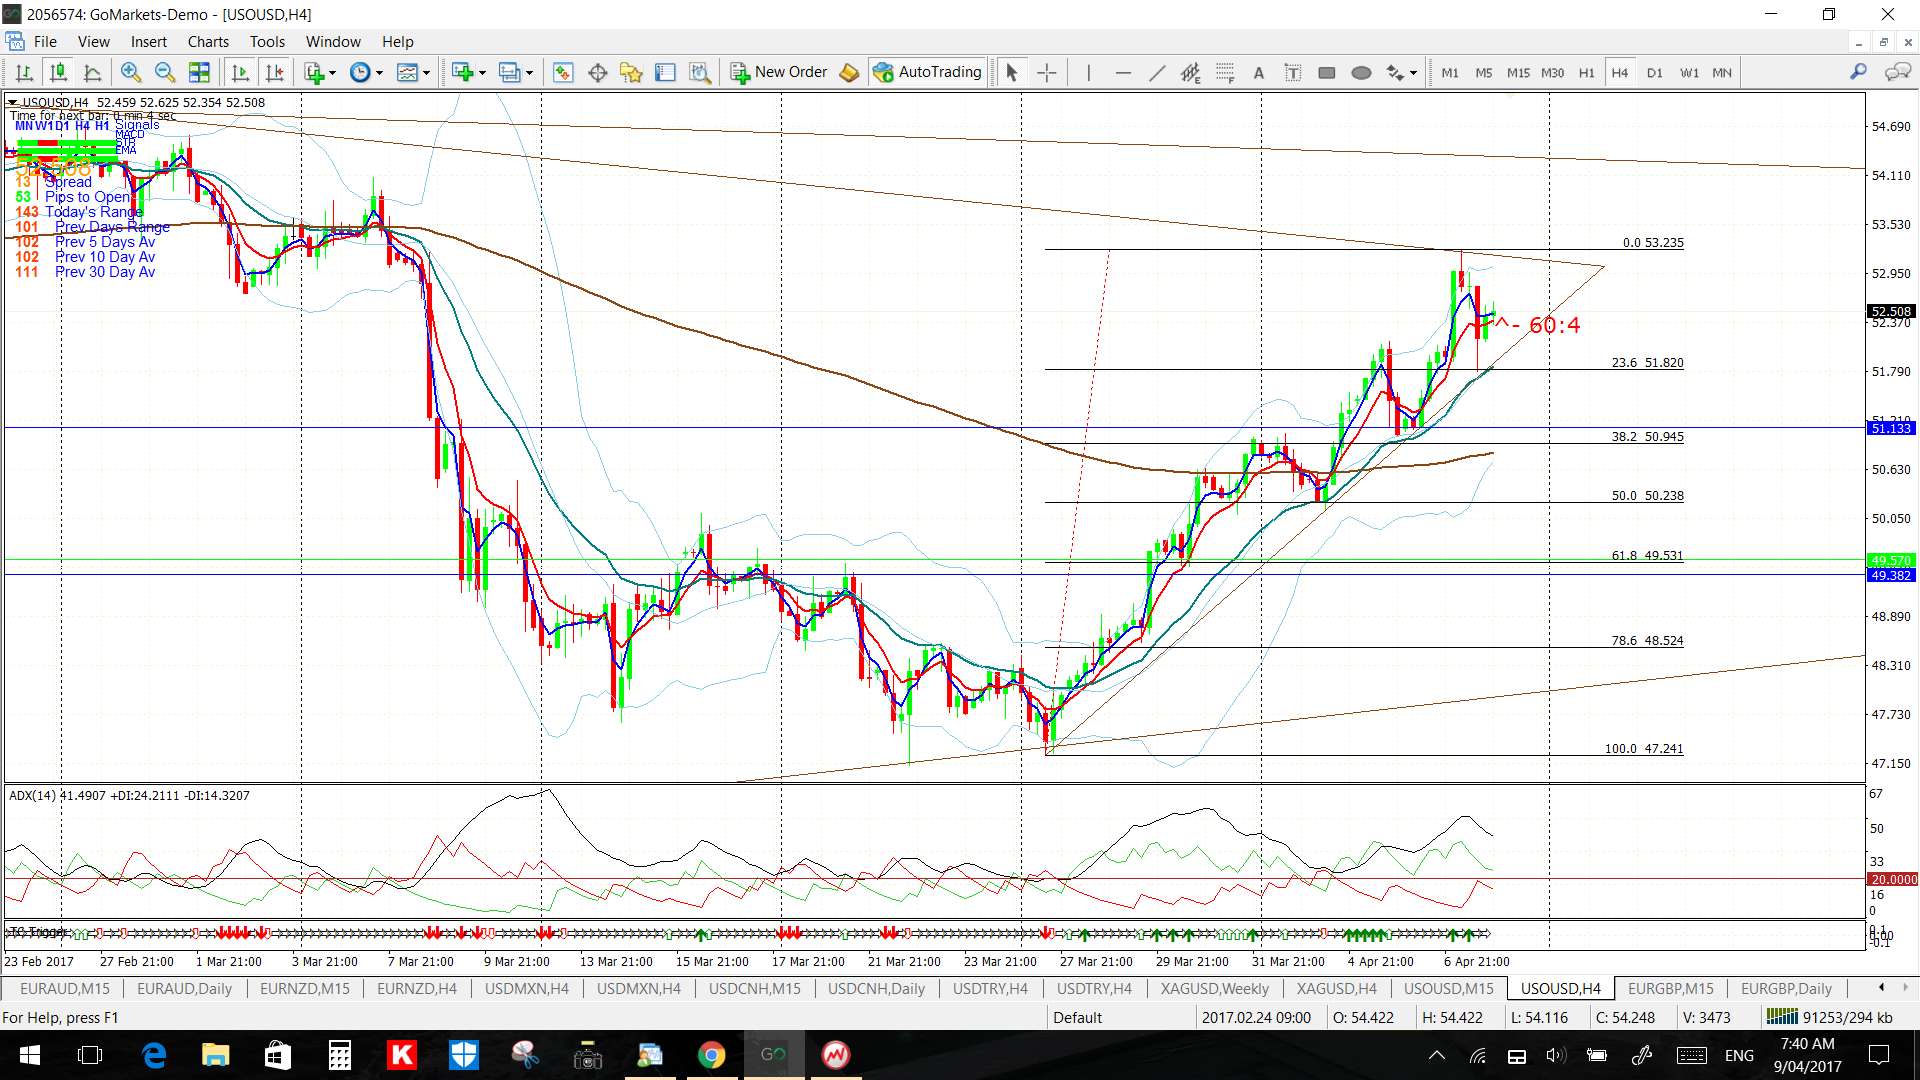
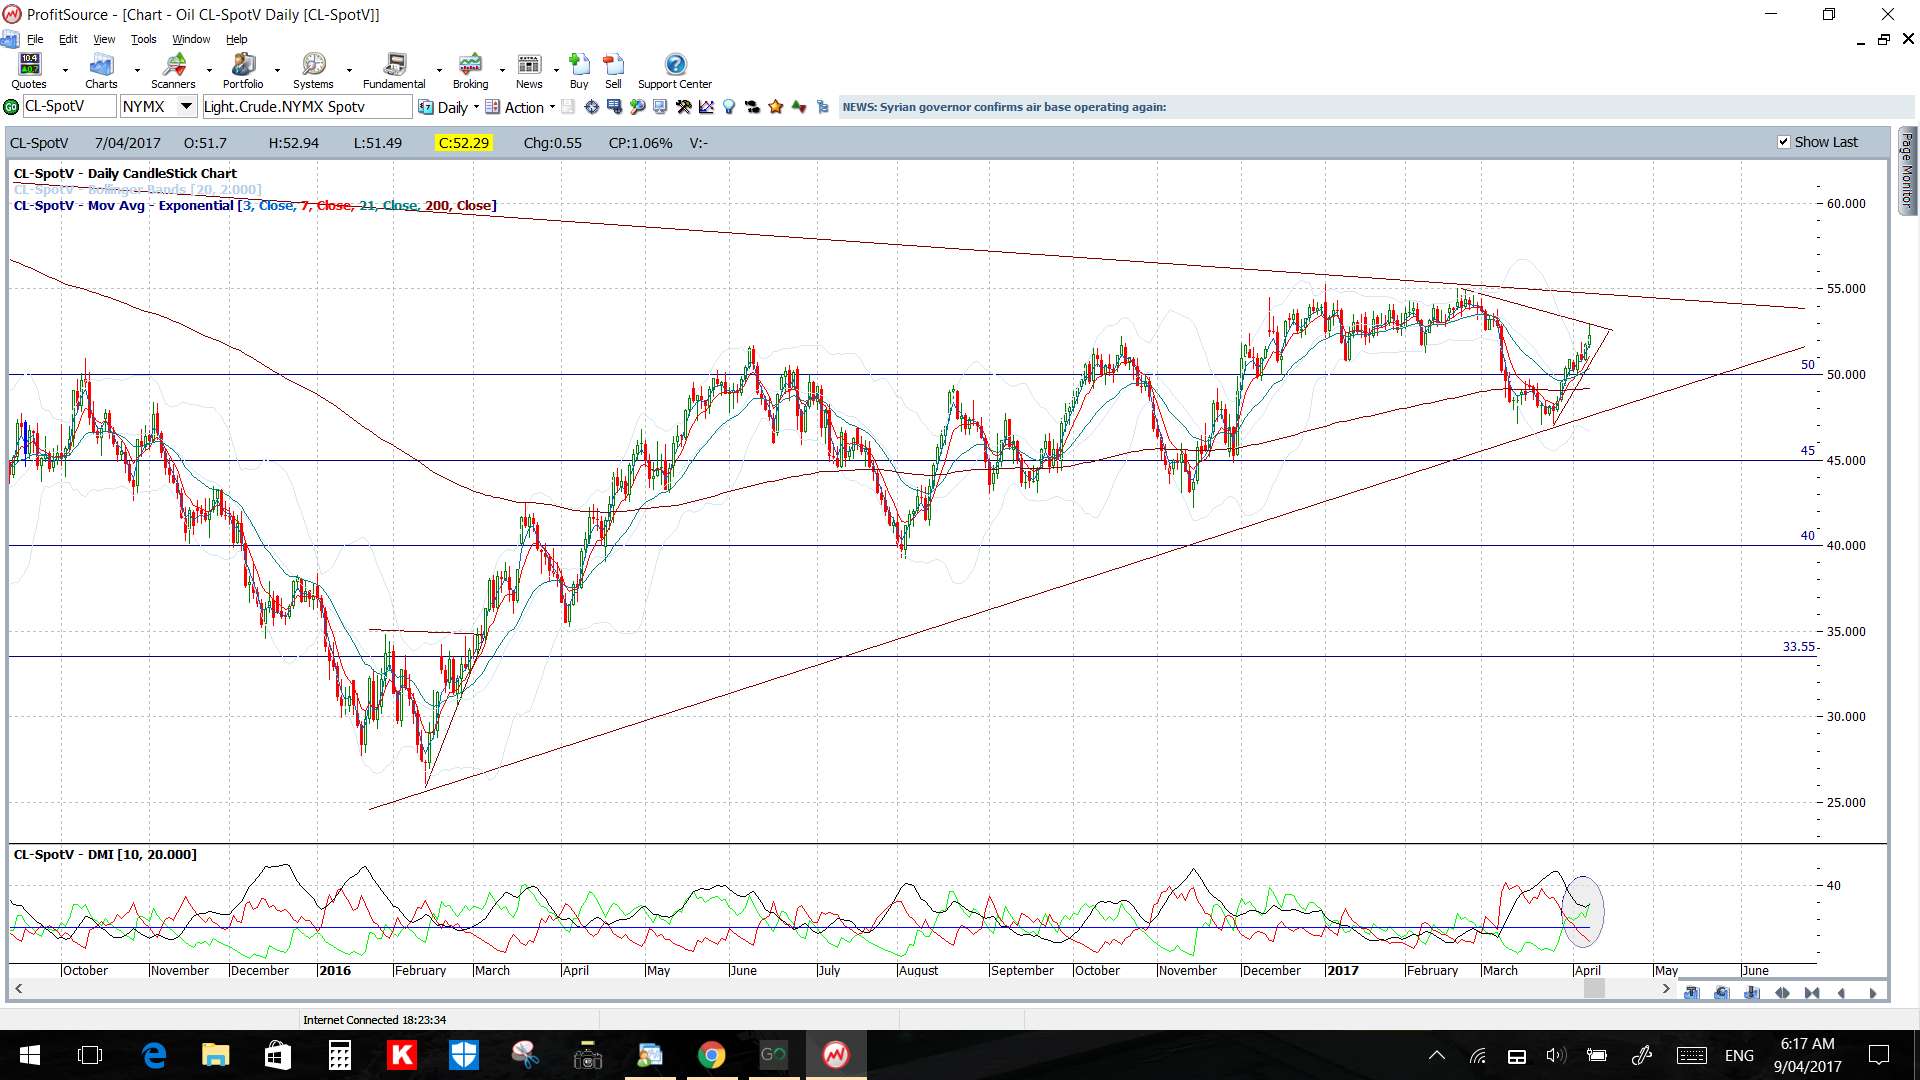
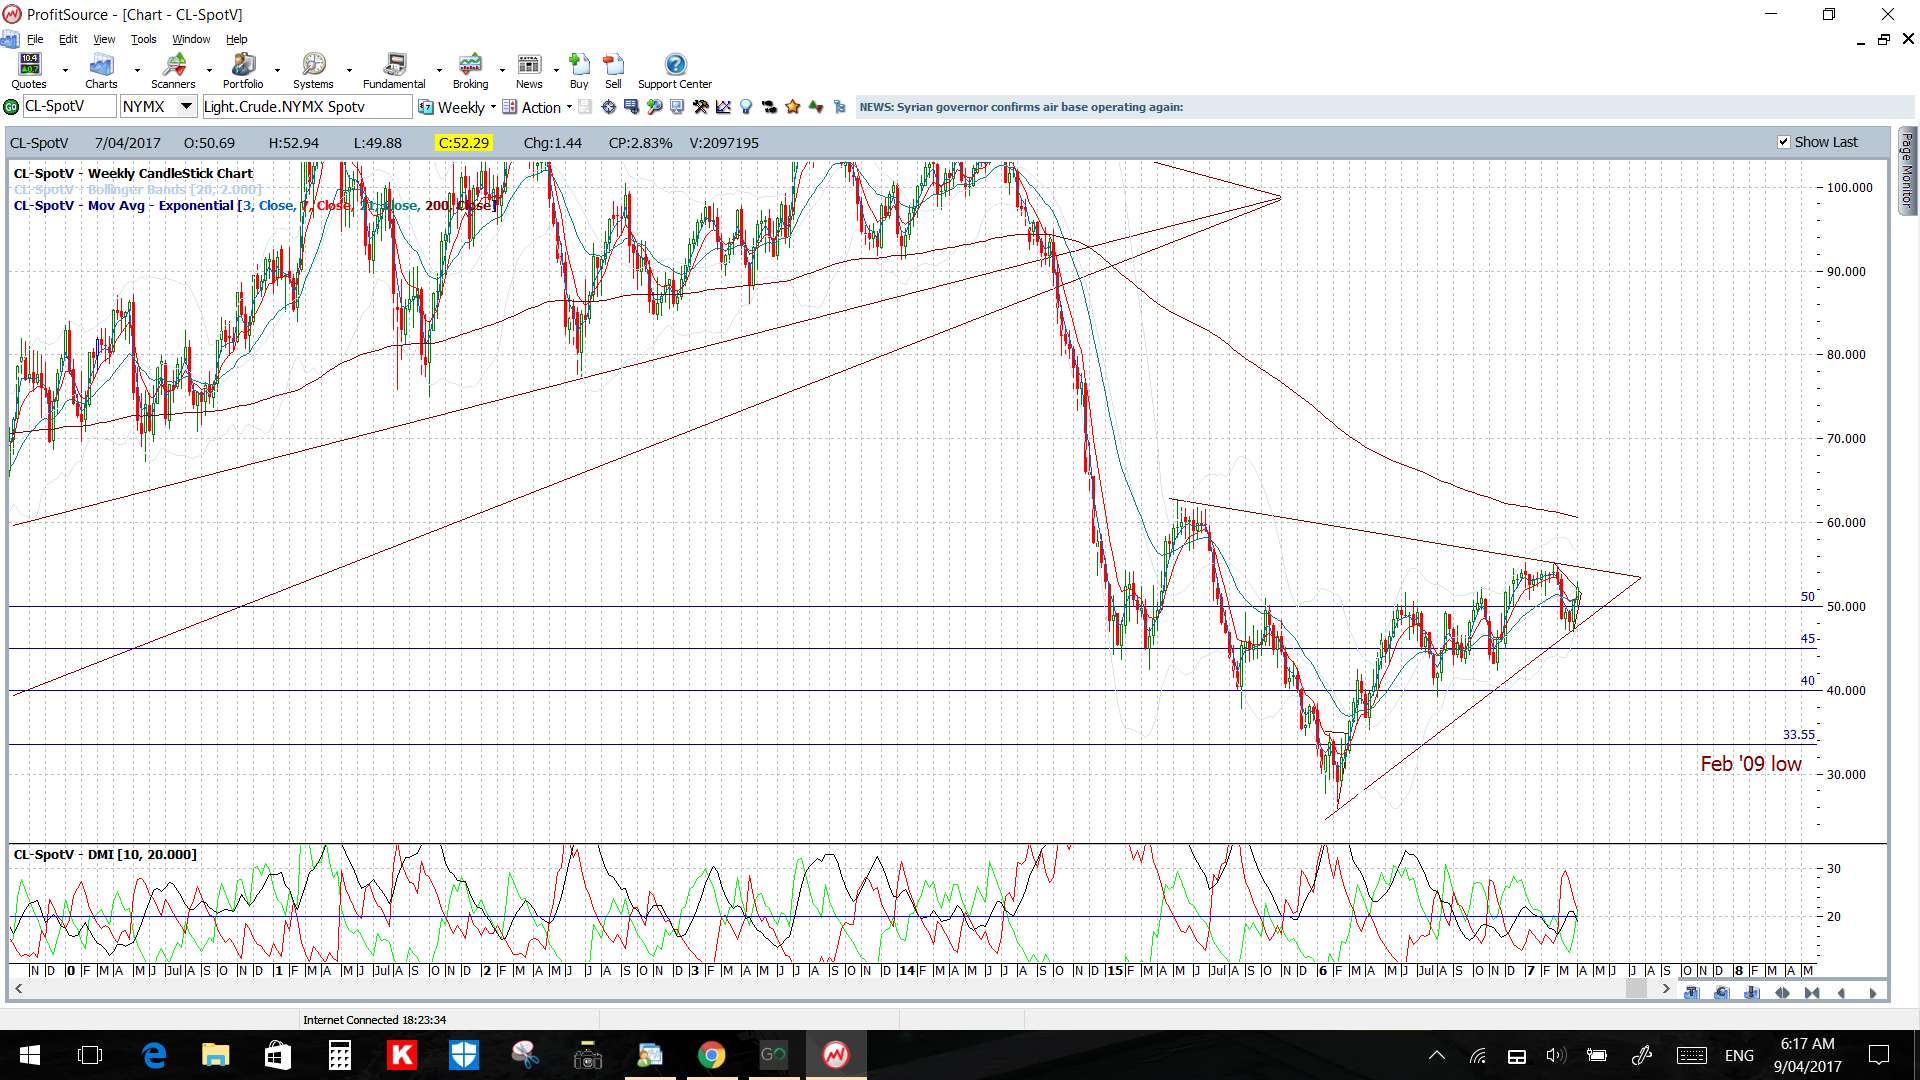
Oil: Despite the recent bullish run on Oil, there are consolidation patterns to be seen on almost every time frame chart. Thus, watch trend lines for any momentum-based trend line breakout.
Any continued US$ strength could put the 4hr chart’s recent support trend line under pressure so keep an eye on that. I note that the 61.8% fib of this recent swing high move is down near the $50 S/R level ad so that would be the target for any bearish trend line breakdown.
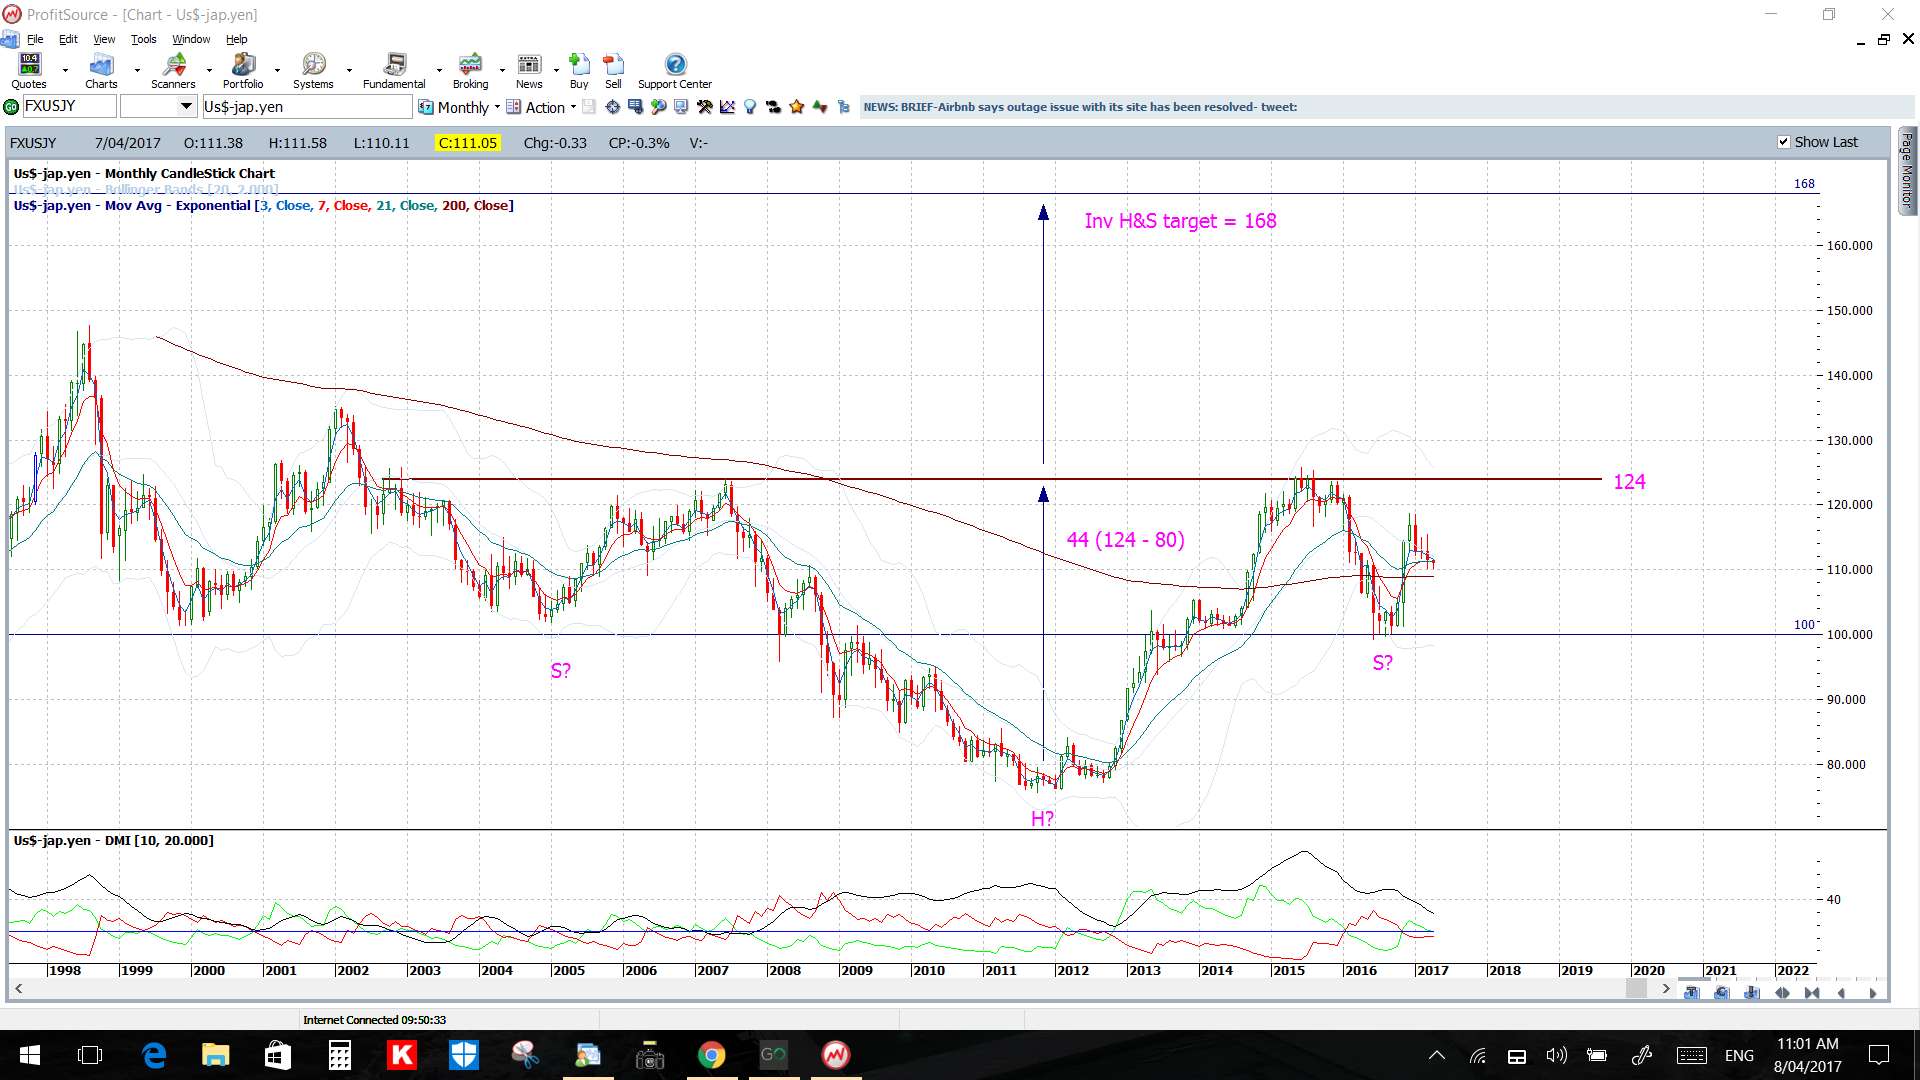
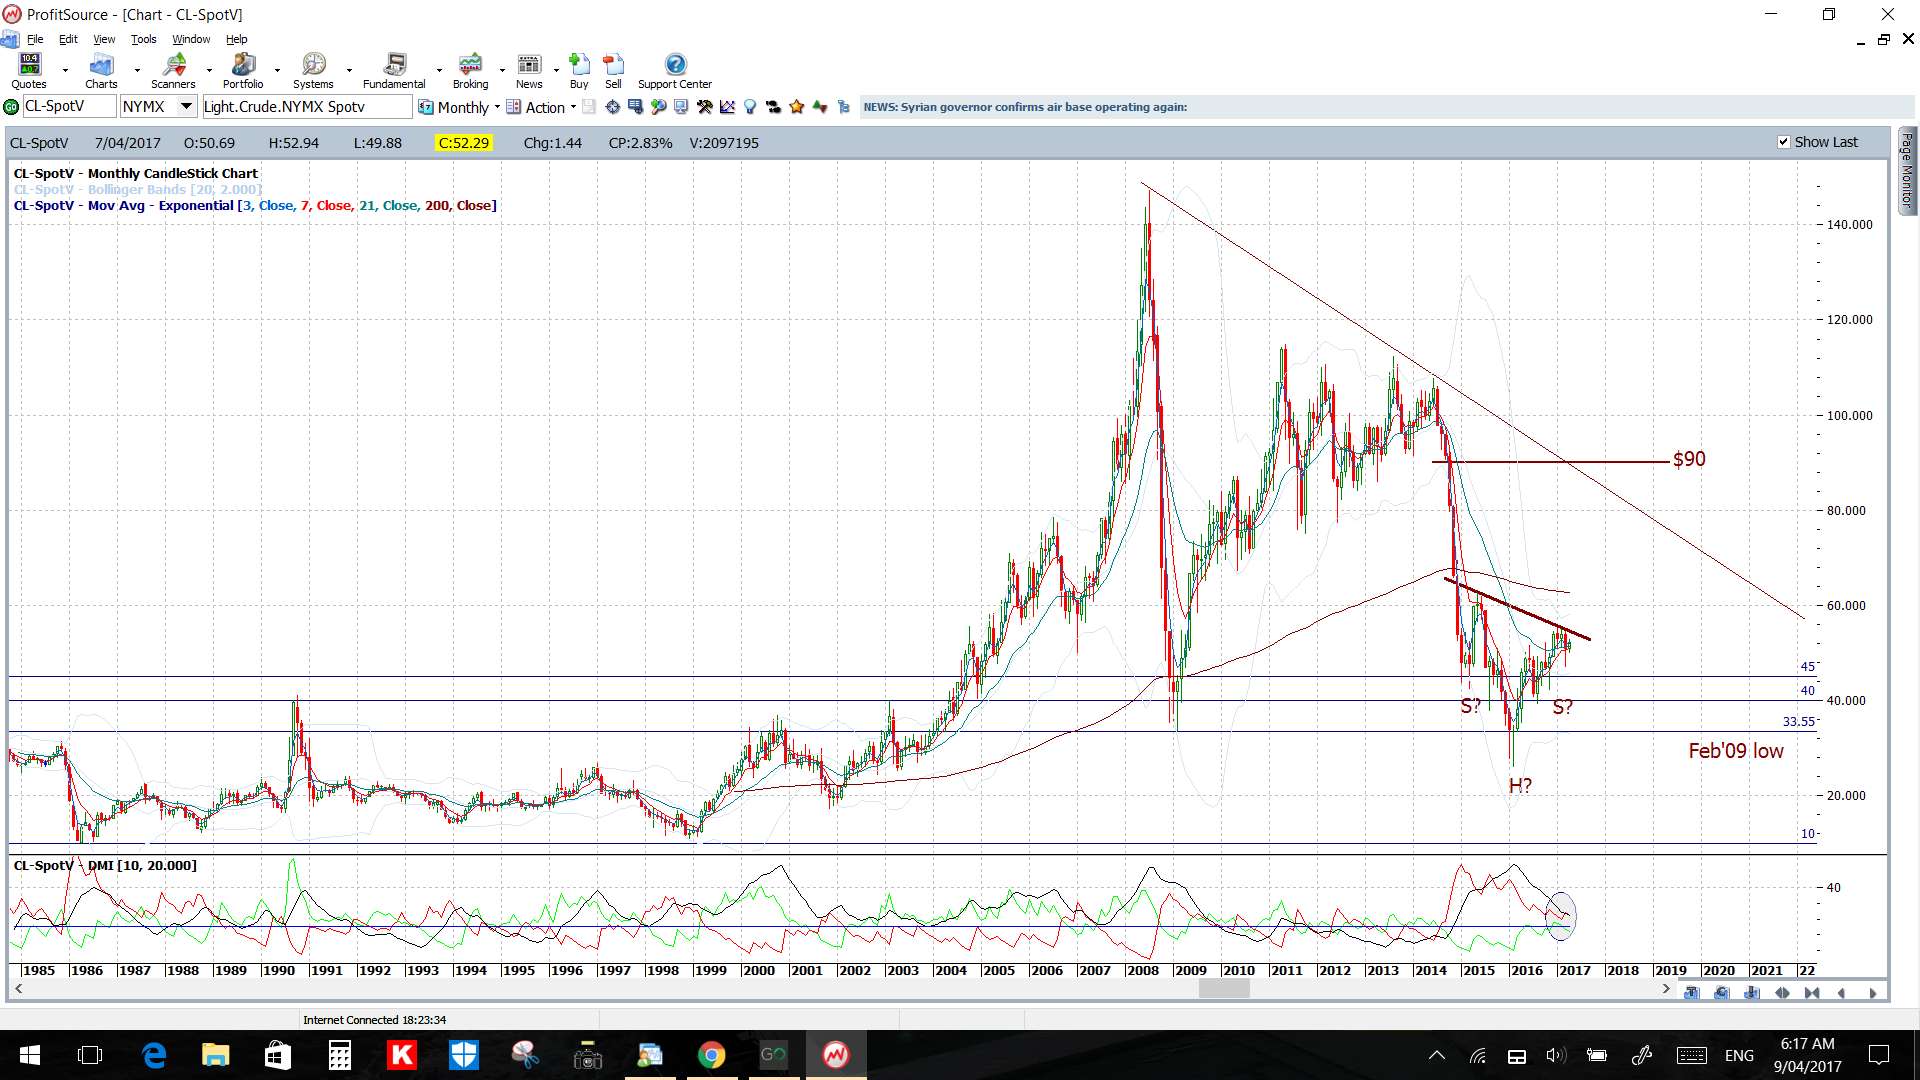
Check my recent article to read about the monthly chart’s Inverse H&S and potential $90 target.
Price is above the 4hr Cloud but just below thin daily Cloud.
The weekly candle was bullish.
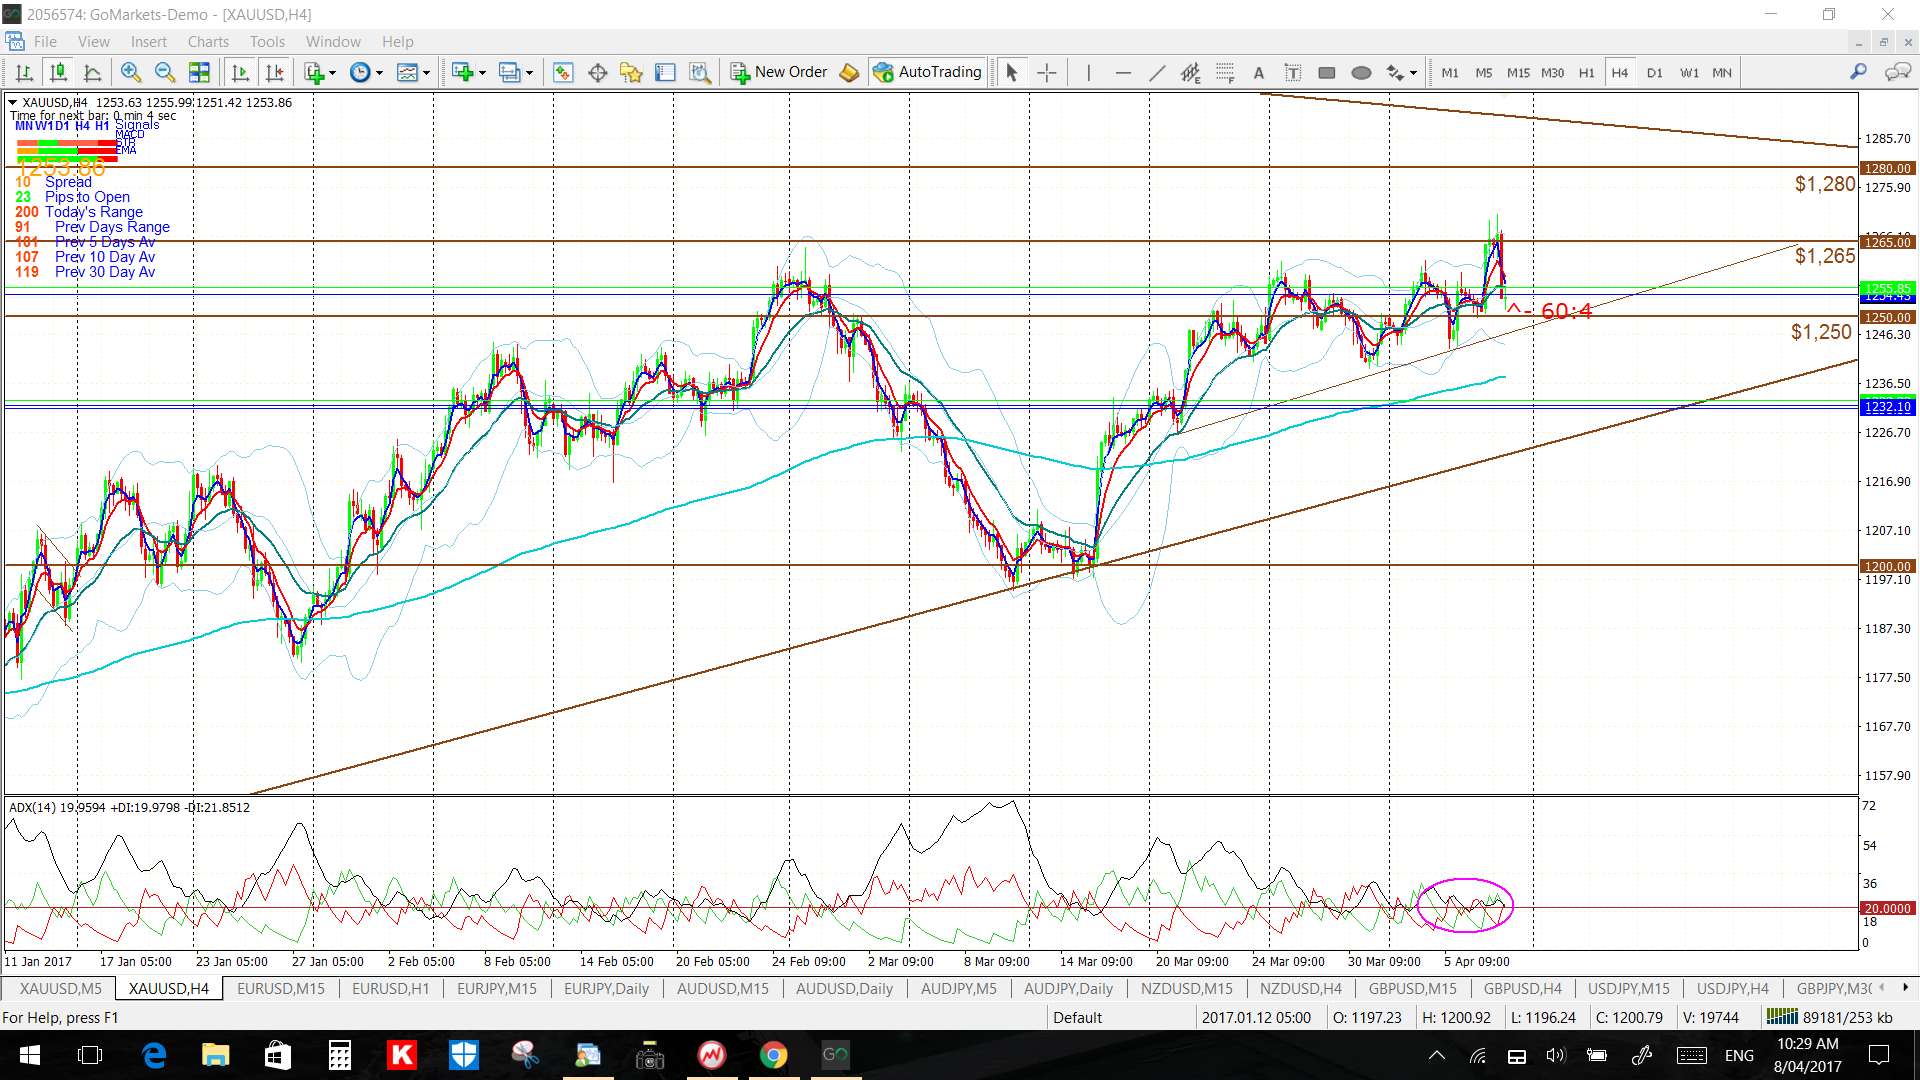
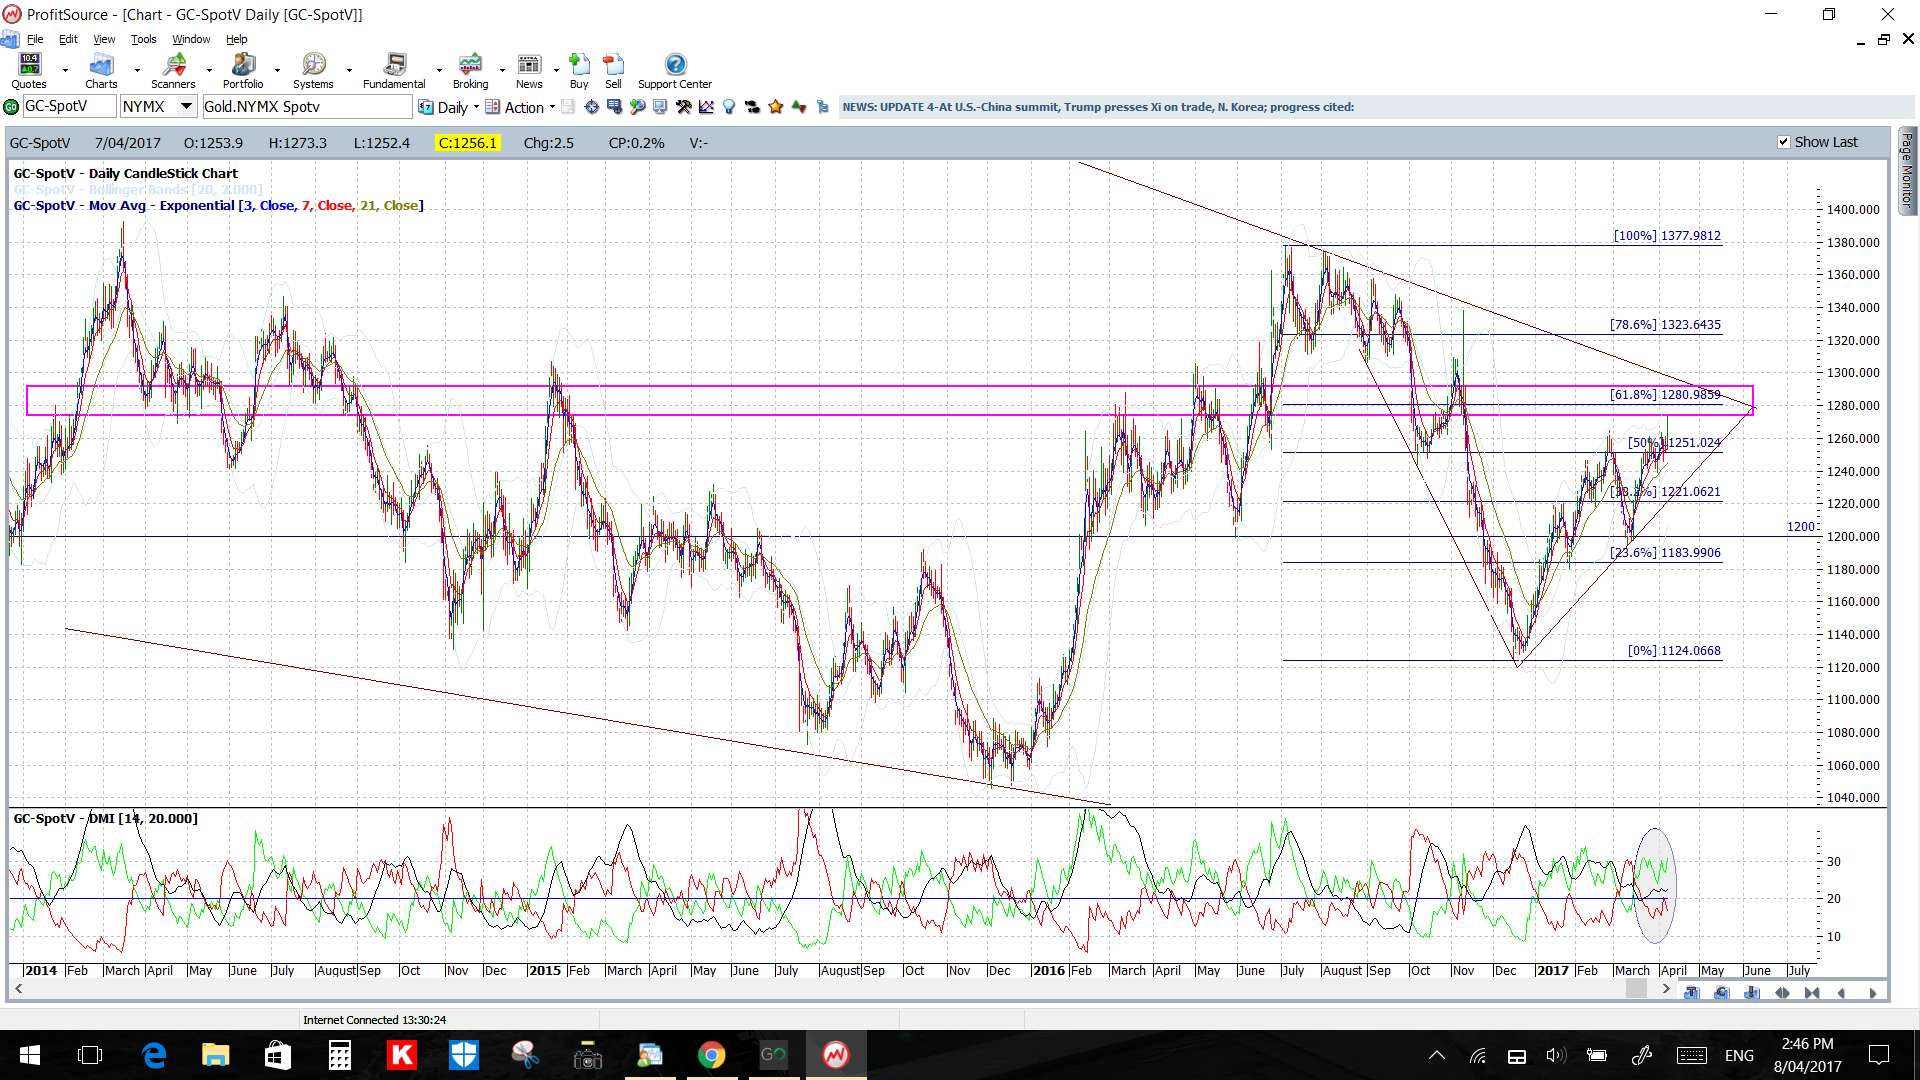
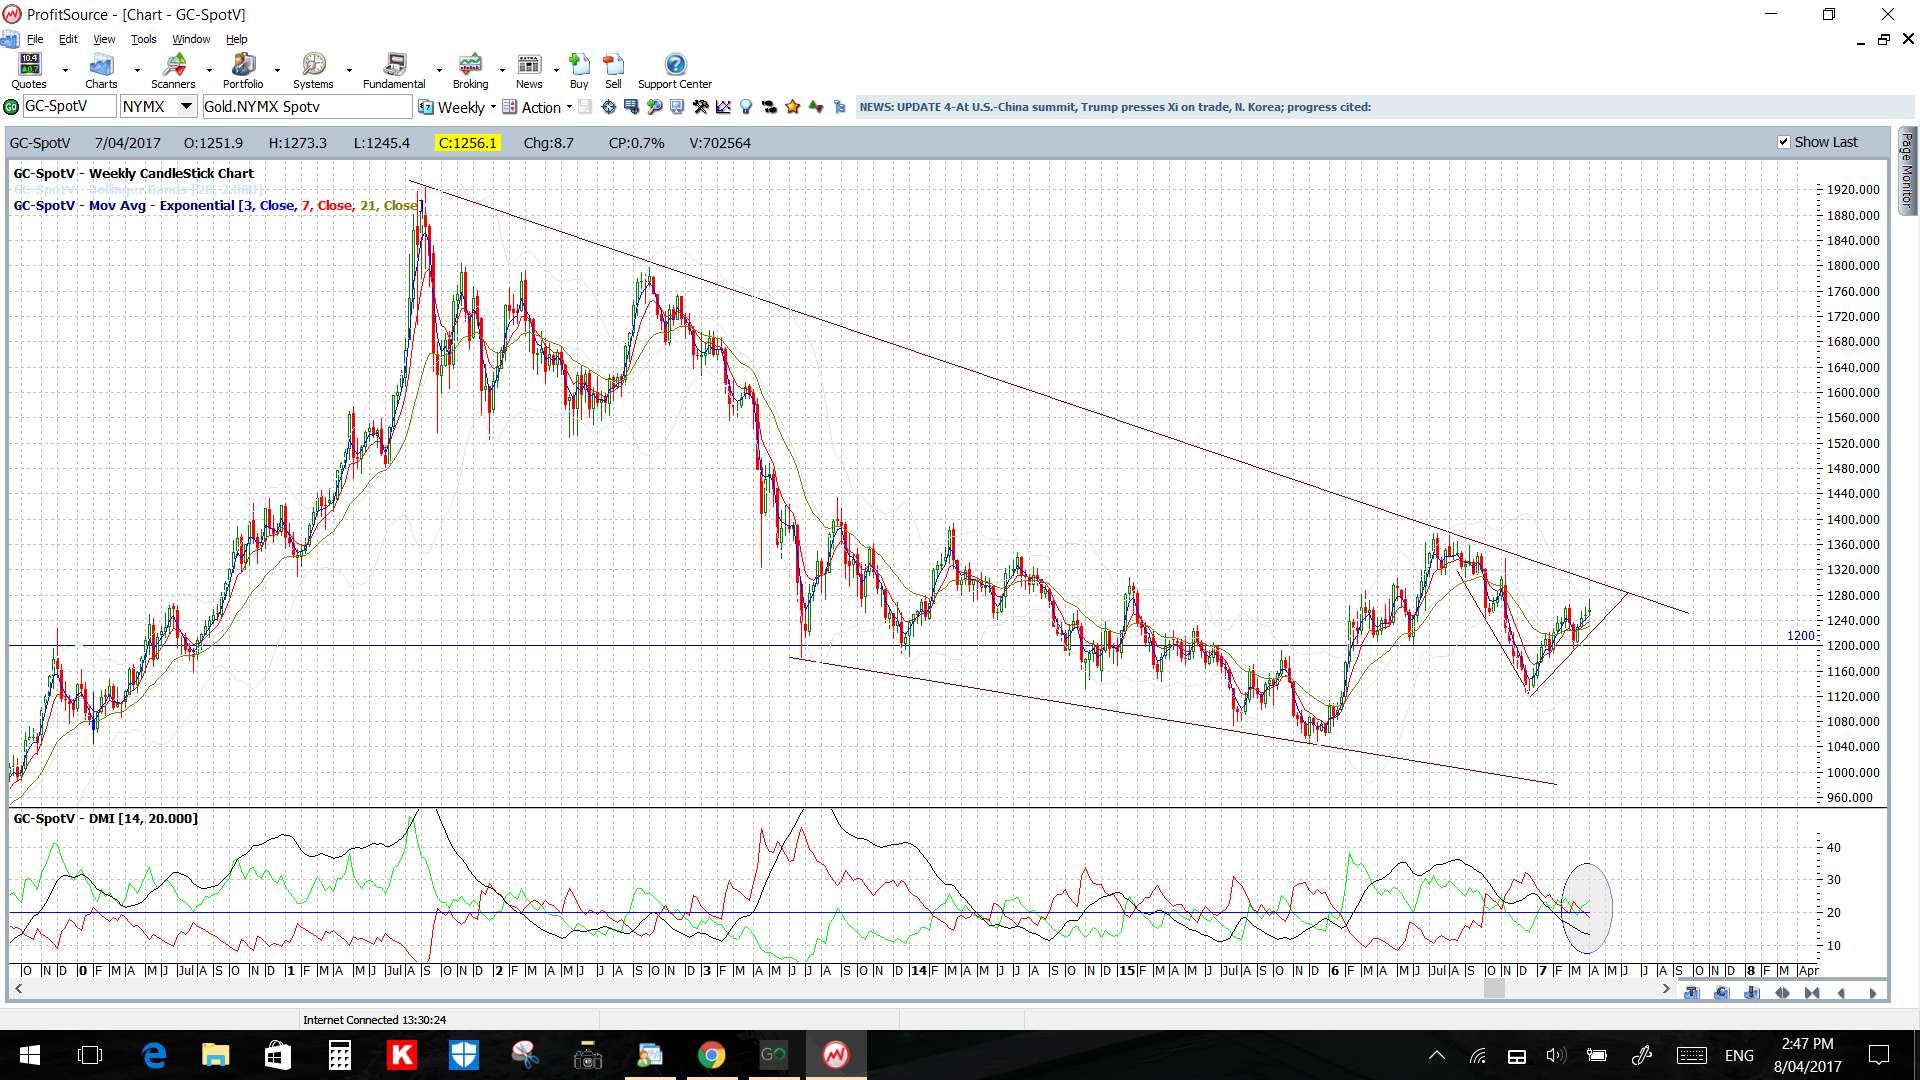
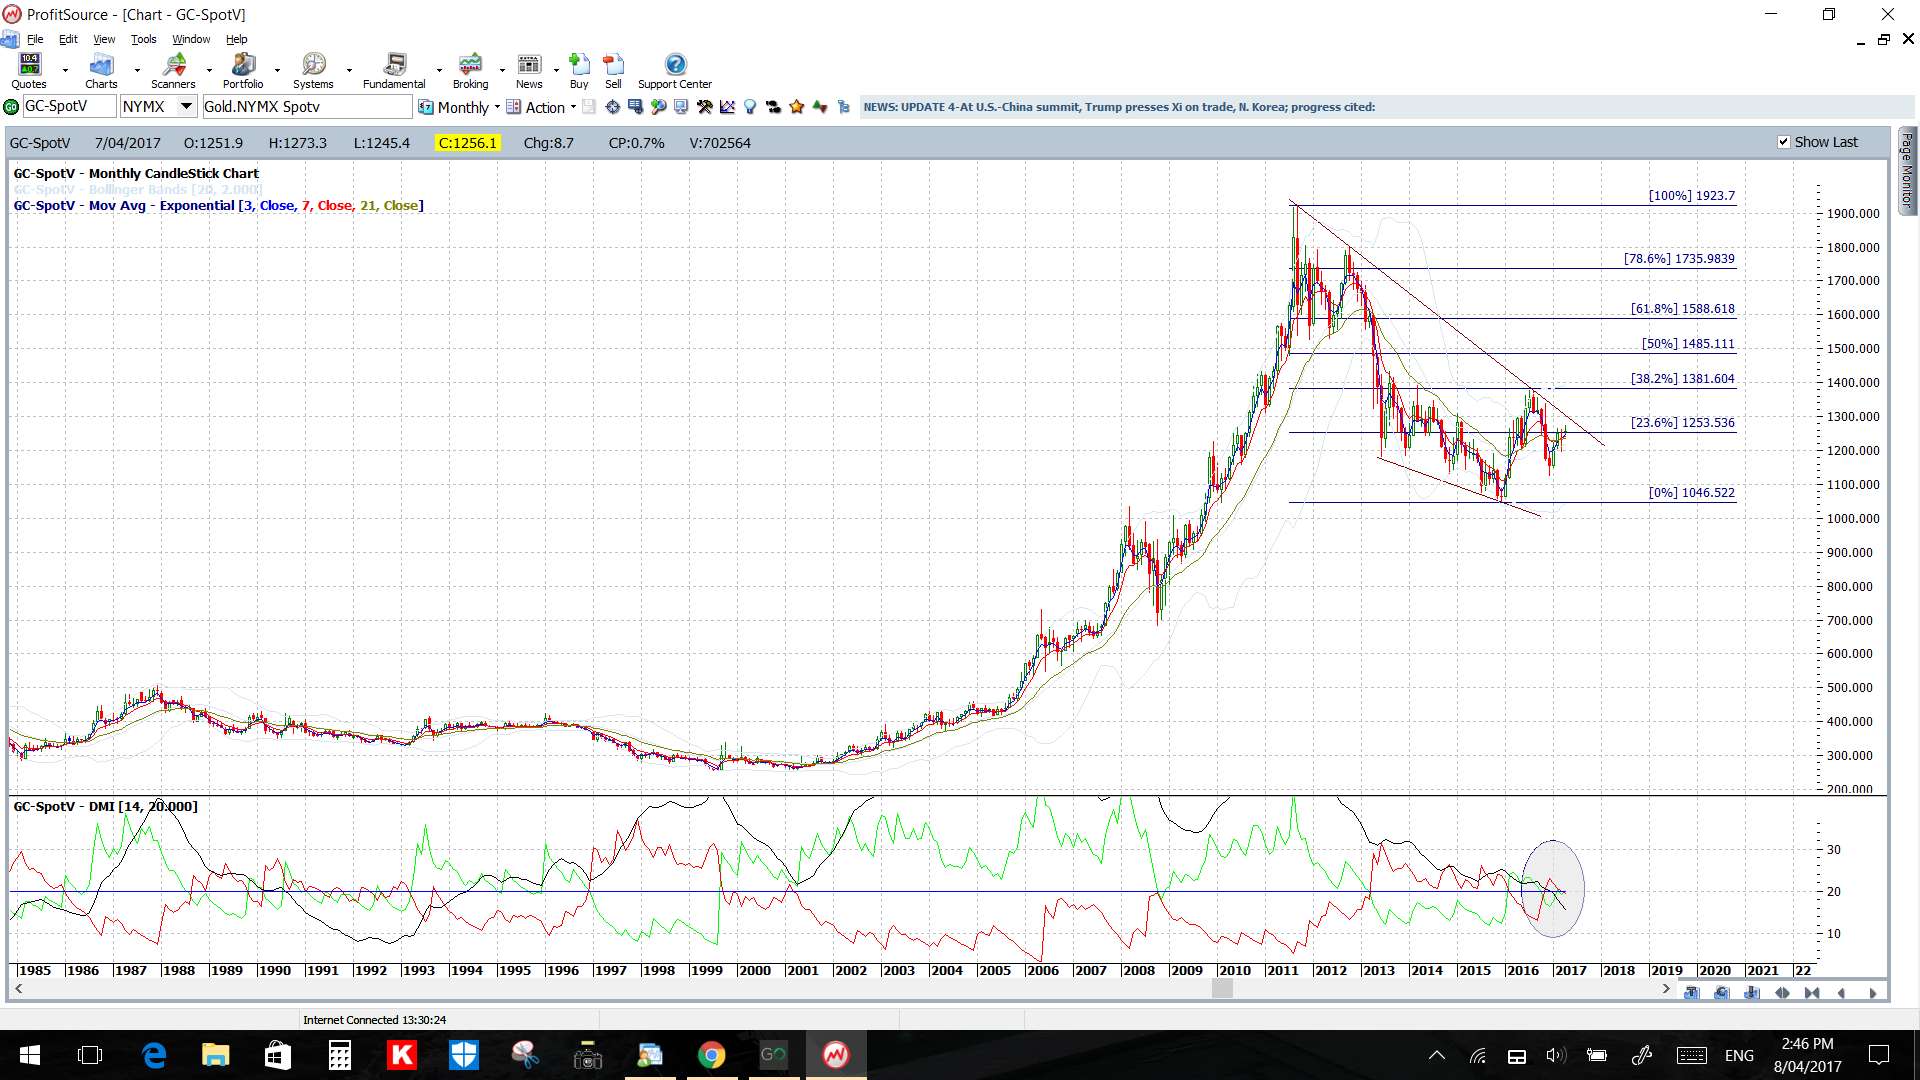
Gold: Gold had another bullish week but closed off the highs and below the S/R region of $1,265. There is more significant resistance just above this region though with the 6-year bear trend line that intersects near the $1,280 level. Thus, price action could be choppy whilst it negotiates this major S/R region but I’ve got trend lines on the 4hr chart to help identify and make or break move.
I suspect Gold’s next move might be at the mercy of the US$ and so I’ll be watching the US$ index as well for clues as to which way it might be next heading:
- A strengthening US$: would usually put pressure on Gold.
- A weakening US$: would likely underpin Gold.
The caveat here being that in heightened periods of geo-politics both Gold and the $US generally experience Flight to Safety activity.
Gold has been on a bullish run since last December and so some further pause would not be out of order, even if there is to be longer-term bullish continuation. I note on the daily chart that any 50% fib would bring price back to the $1,200 S/R region and I would keep that area in mind with any pullback and break of trend line support.
Price is above the 4hr and daily Cloud.
The weekly candle, like last week, was a bullish coloured ‘Spinning Top’ reflecting indecision.
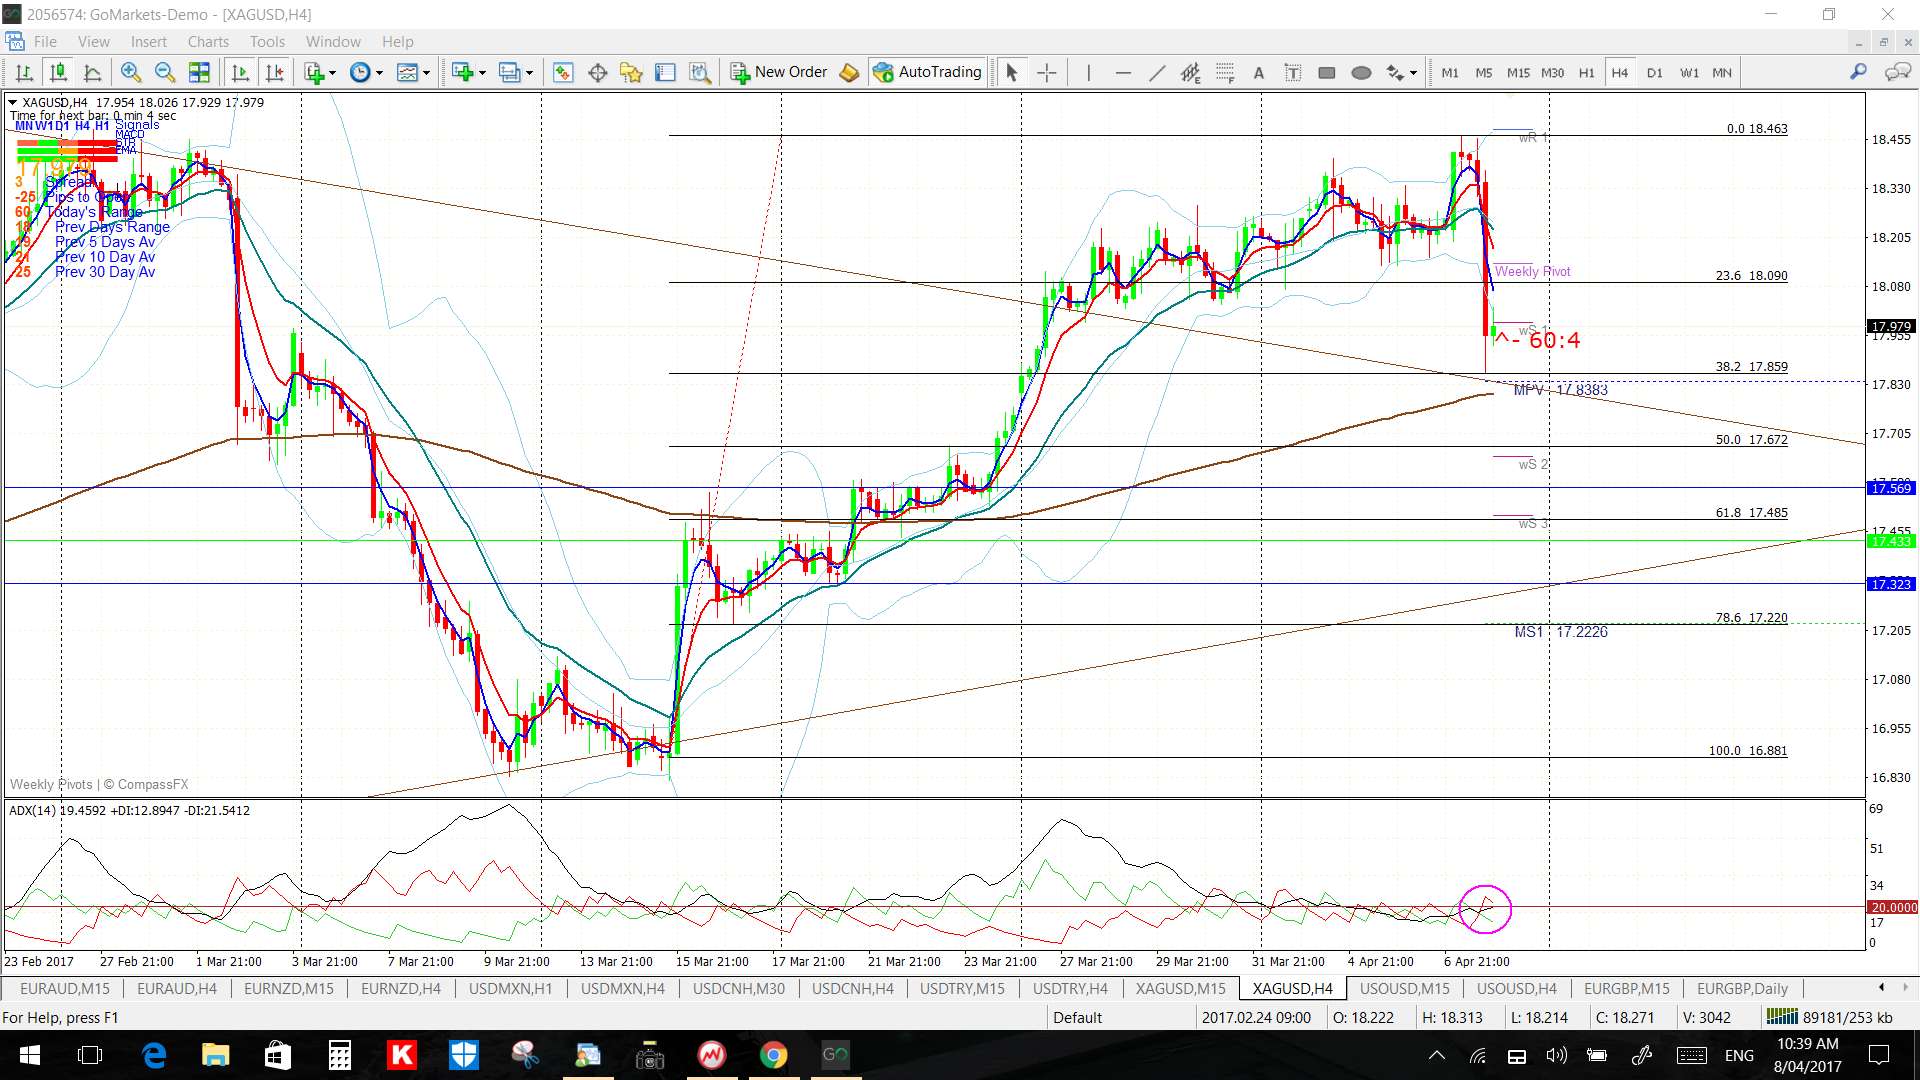
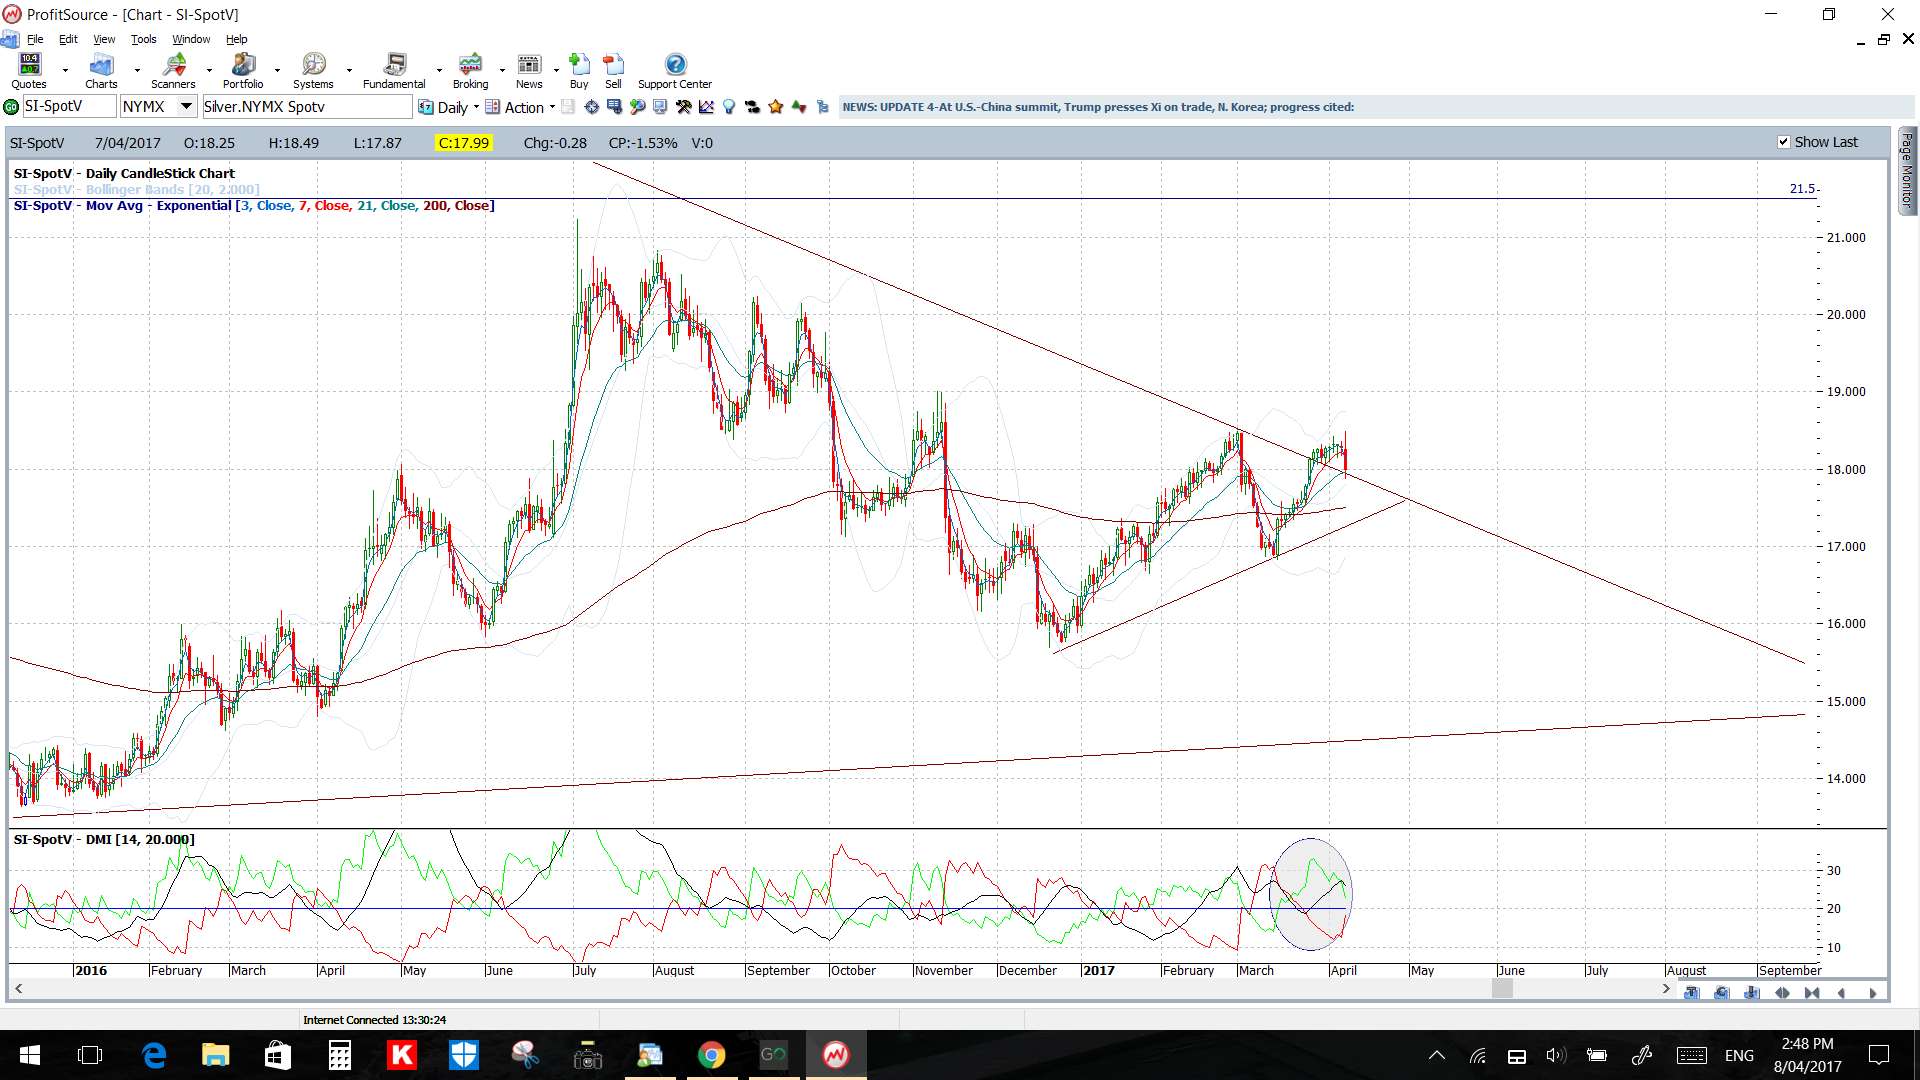
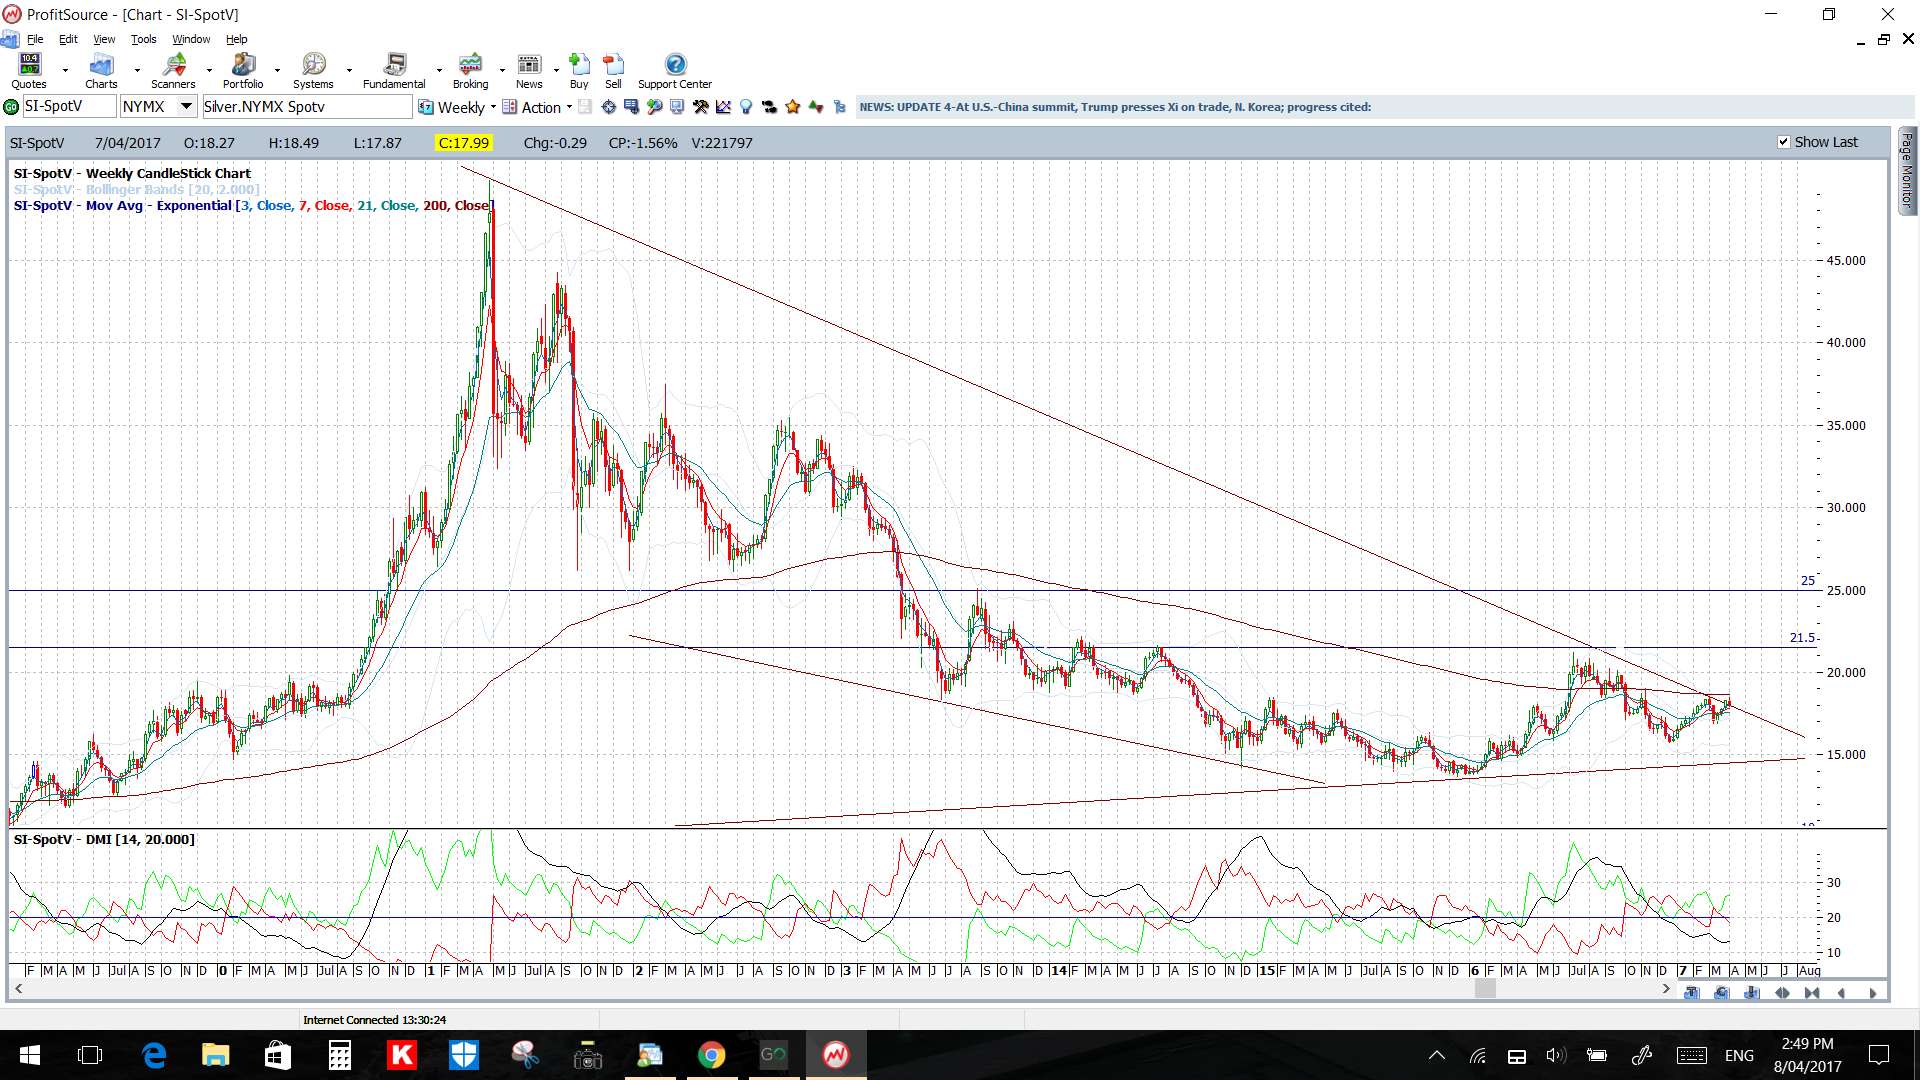
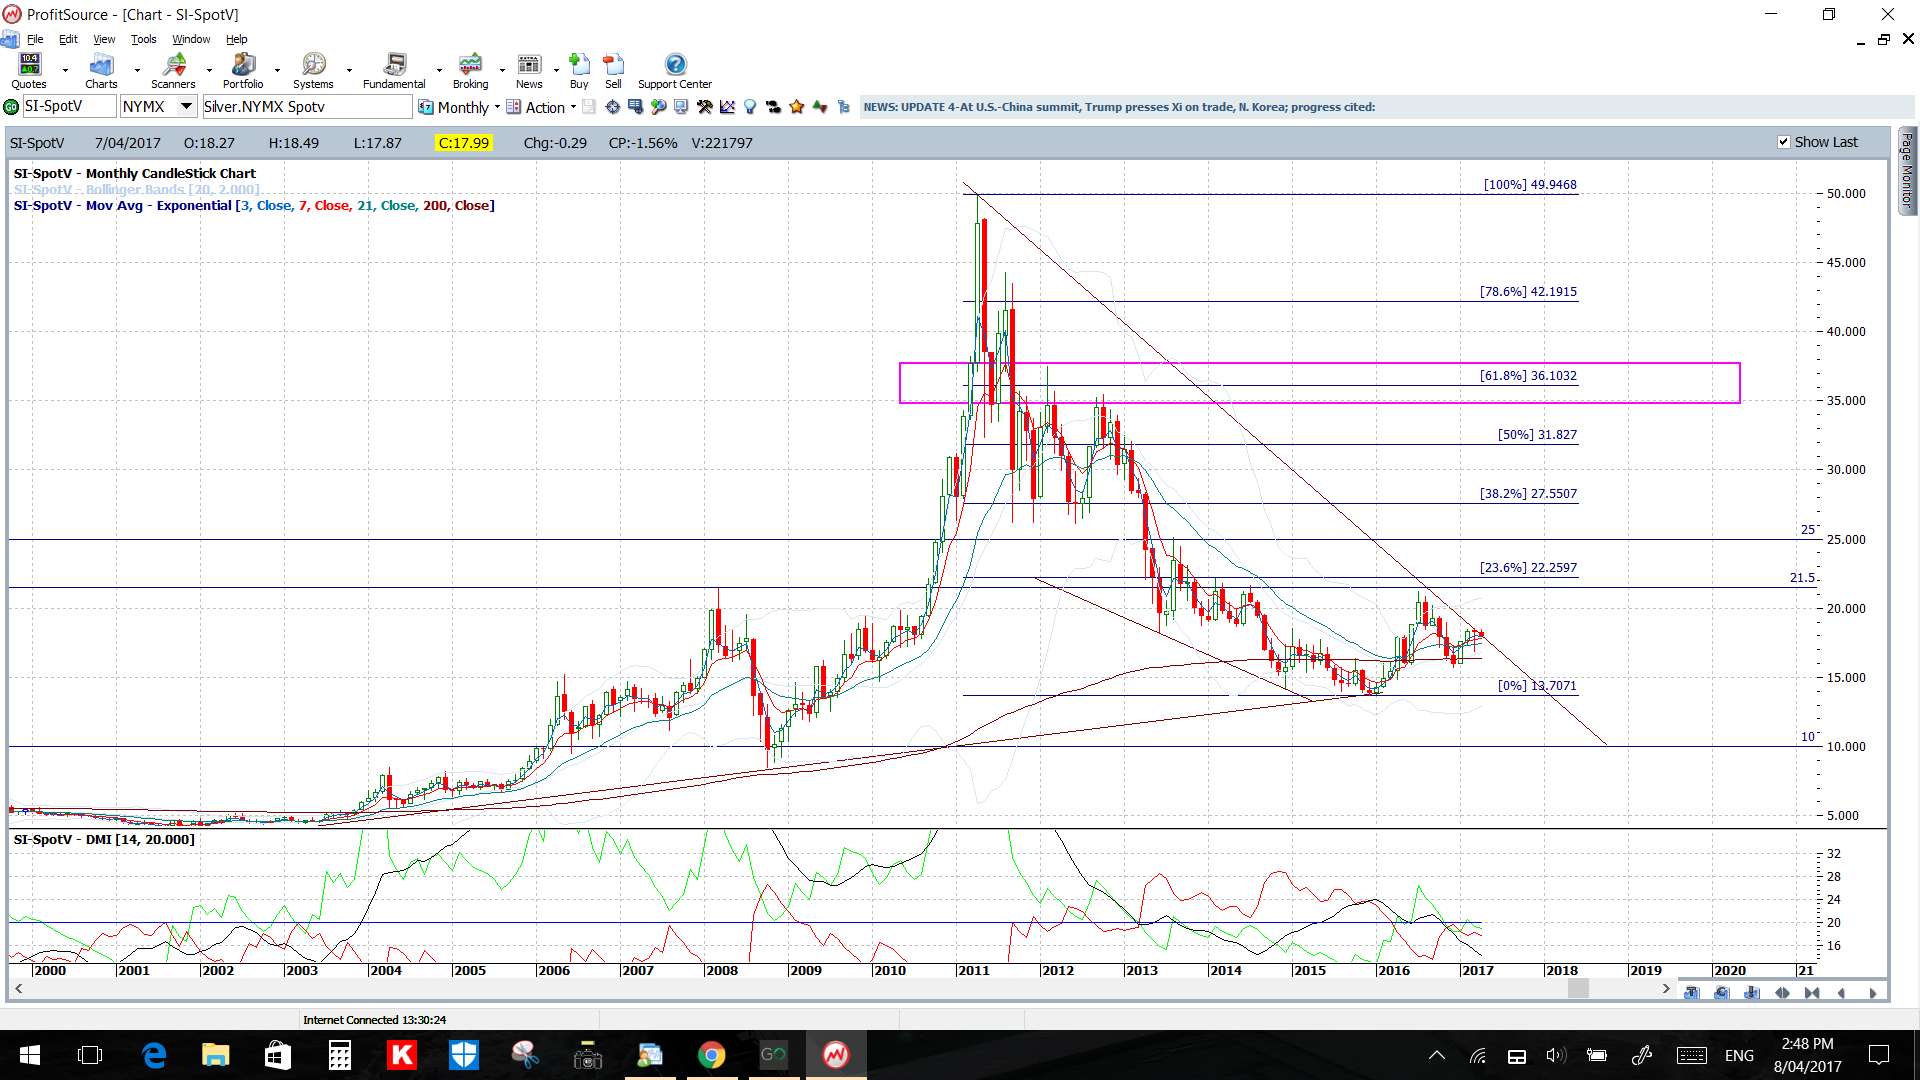
Silver: Silver had held up rather well since breaking the major 6-year bear trend line but it pulled back on Friday when the US$ got some of its mojo back. Note how price has pulled back to test this broken trend line in alignment with classic technical breakout theory and this will be the major region to watch for any make or break activity in coming sessions. Traders will remember that despite this earlier trend line breakout, last month’s candle was a bearish-reversal ‘Hanging Man’ that pointed to the possibility of weakness here at this major S/R zone.
Silver is in the 4hr Cloud but above the daily Cloud.
The weekly candle was a bearish coloured ‘Inside’ candle reflecting ‘indecision’.
Source: tradecharting.com