Next week: Trend line breakout trades continue to offer profitable trading opportunities so keep an eye on the charts posted here and throughout the week for potential candidates. The US$ still holds the key to the next move with many currency pairs and a review of the index can be found through this link.
Last week: It was a relatively quiet start to last week but there were a number of charts that were tracked for trend line breakouts that went on to deliver pips. These breakout trades are summarised below and include links to the charts:
The following breakout trades all kicked in over my Thursday night and the charts with breakout moves can be found through this link.
- Gold: this b/o kept going and yielded up to 130 pips.
- GBP/USD: triangle b/o gave 50 pips.
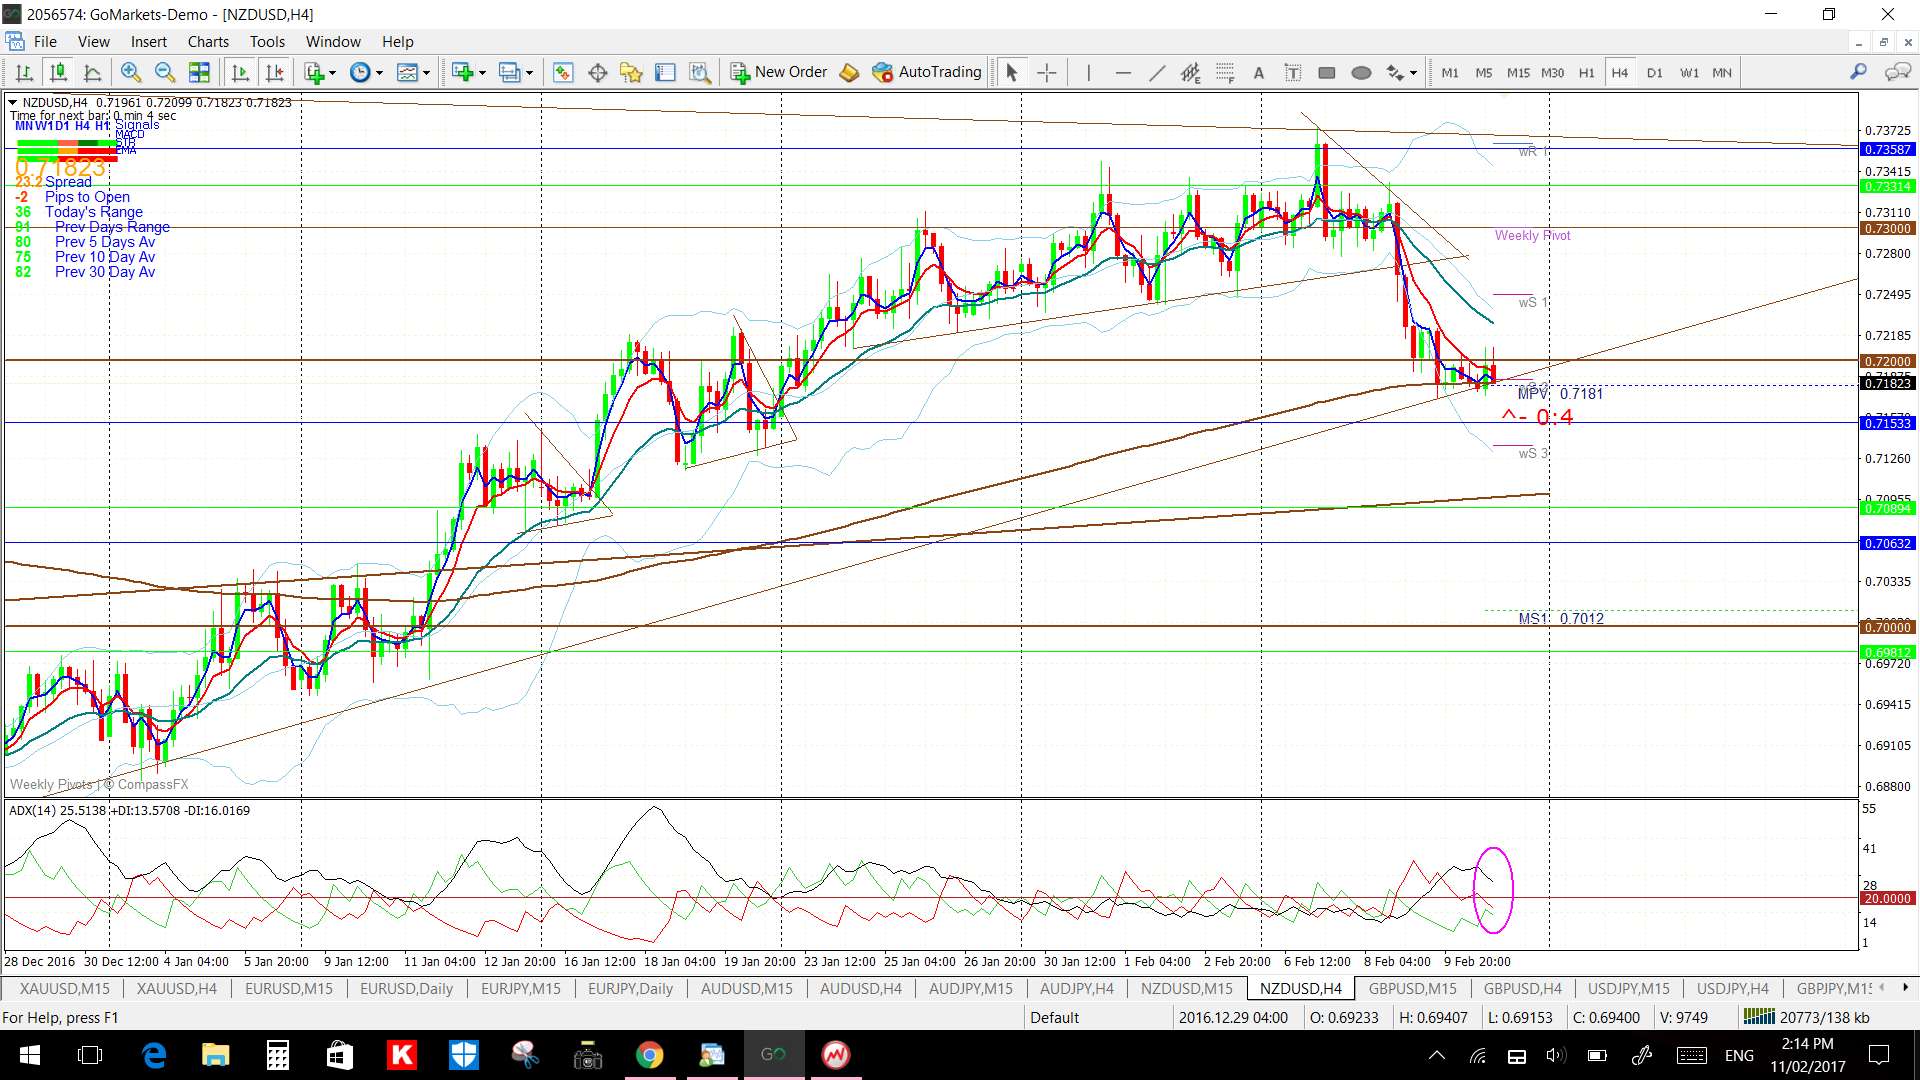
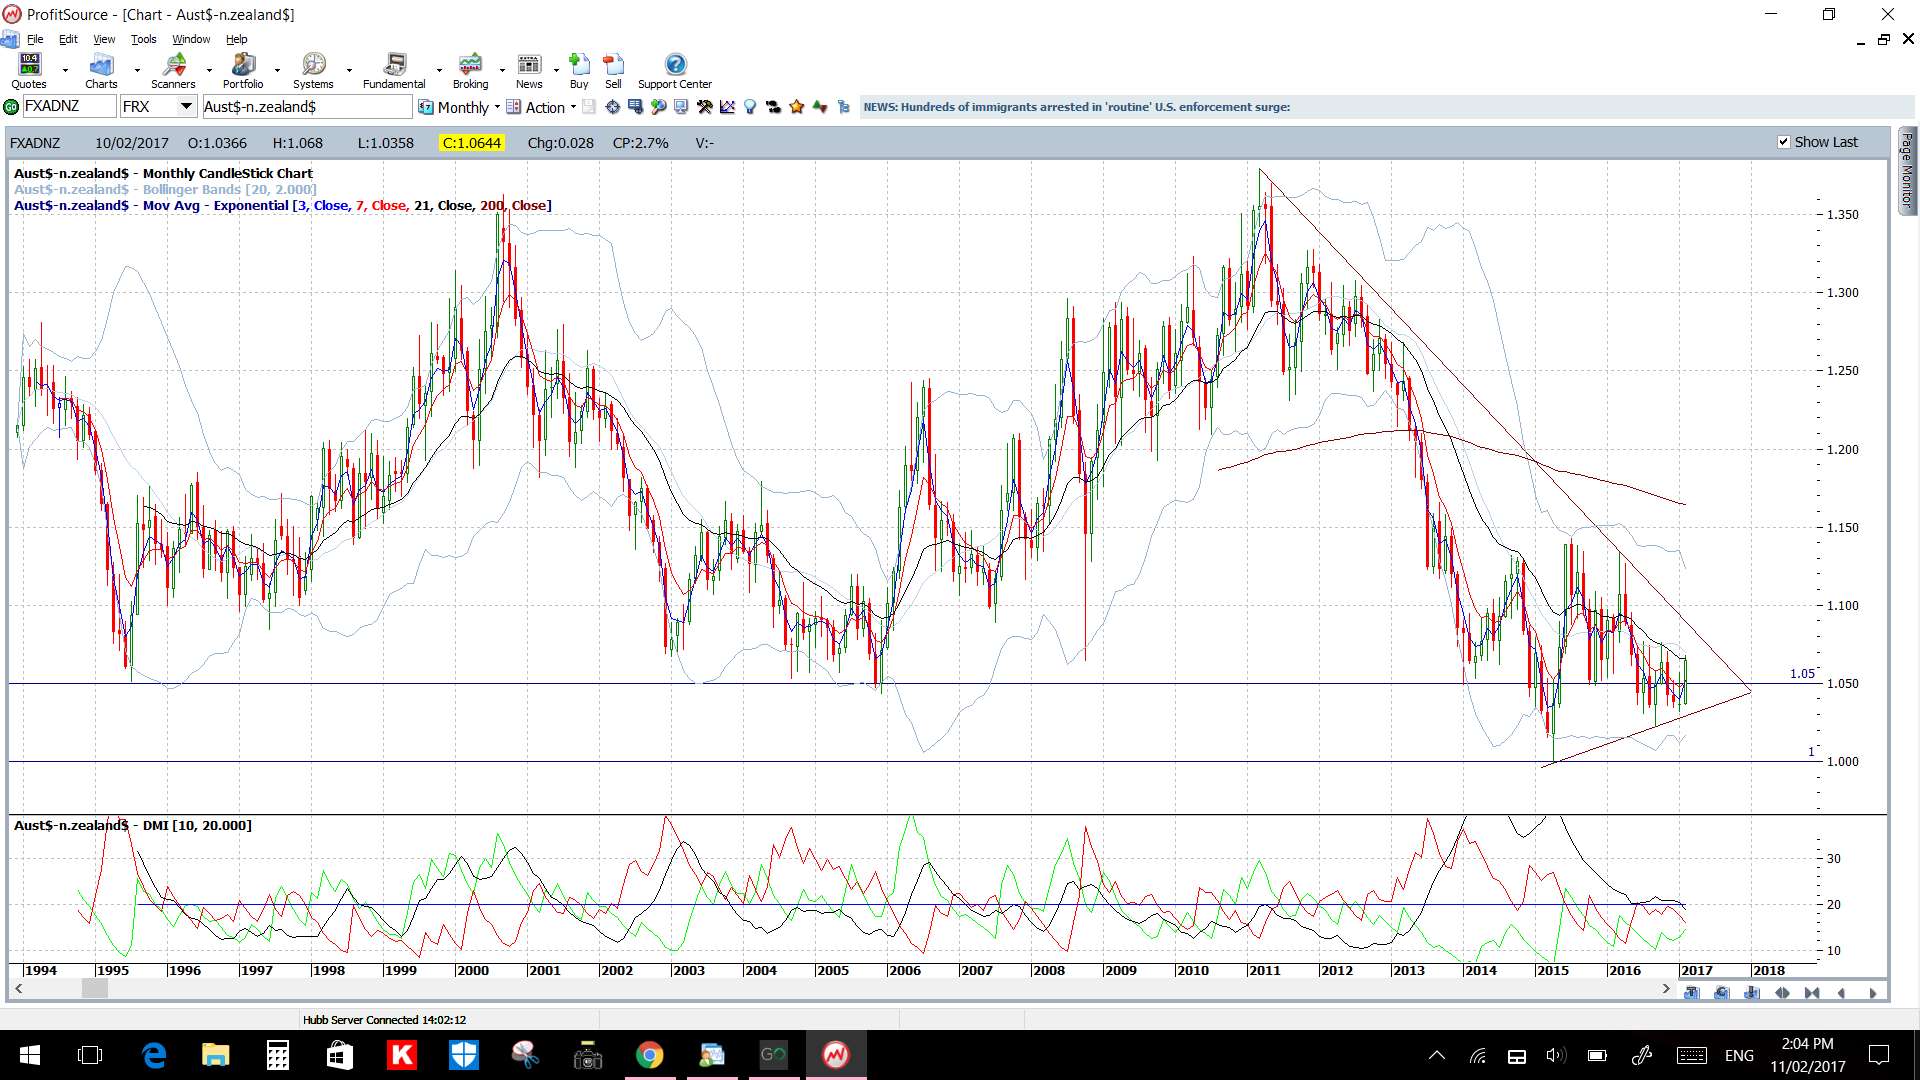
- NZD/USD: 80 pips.
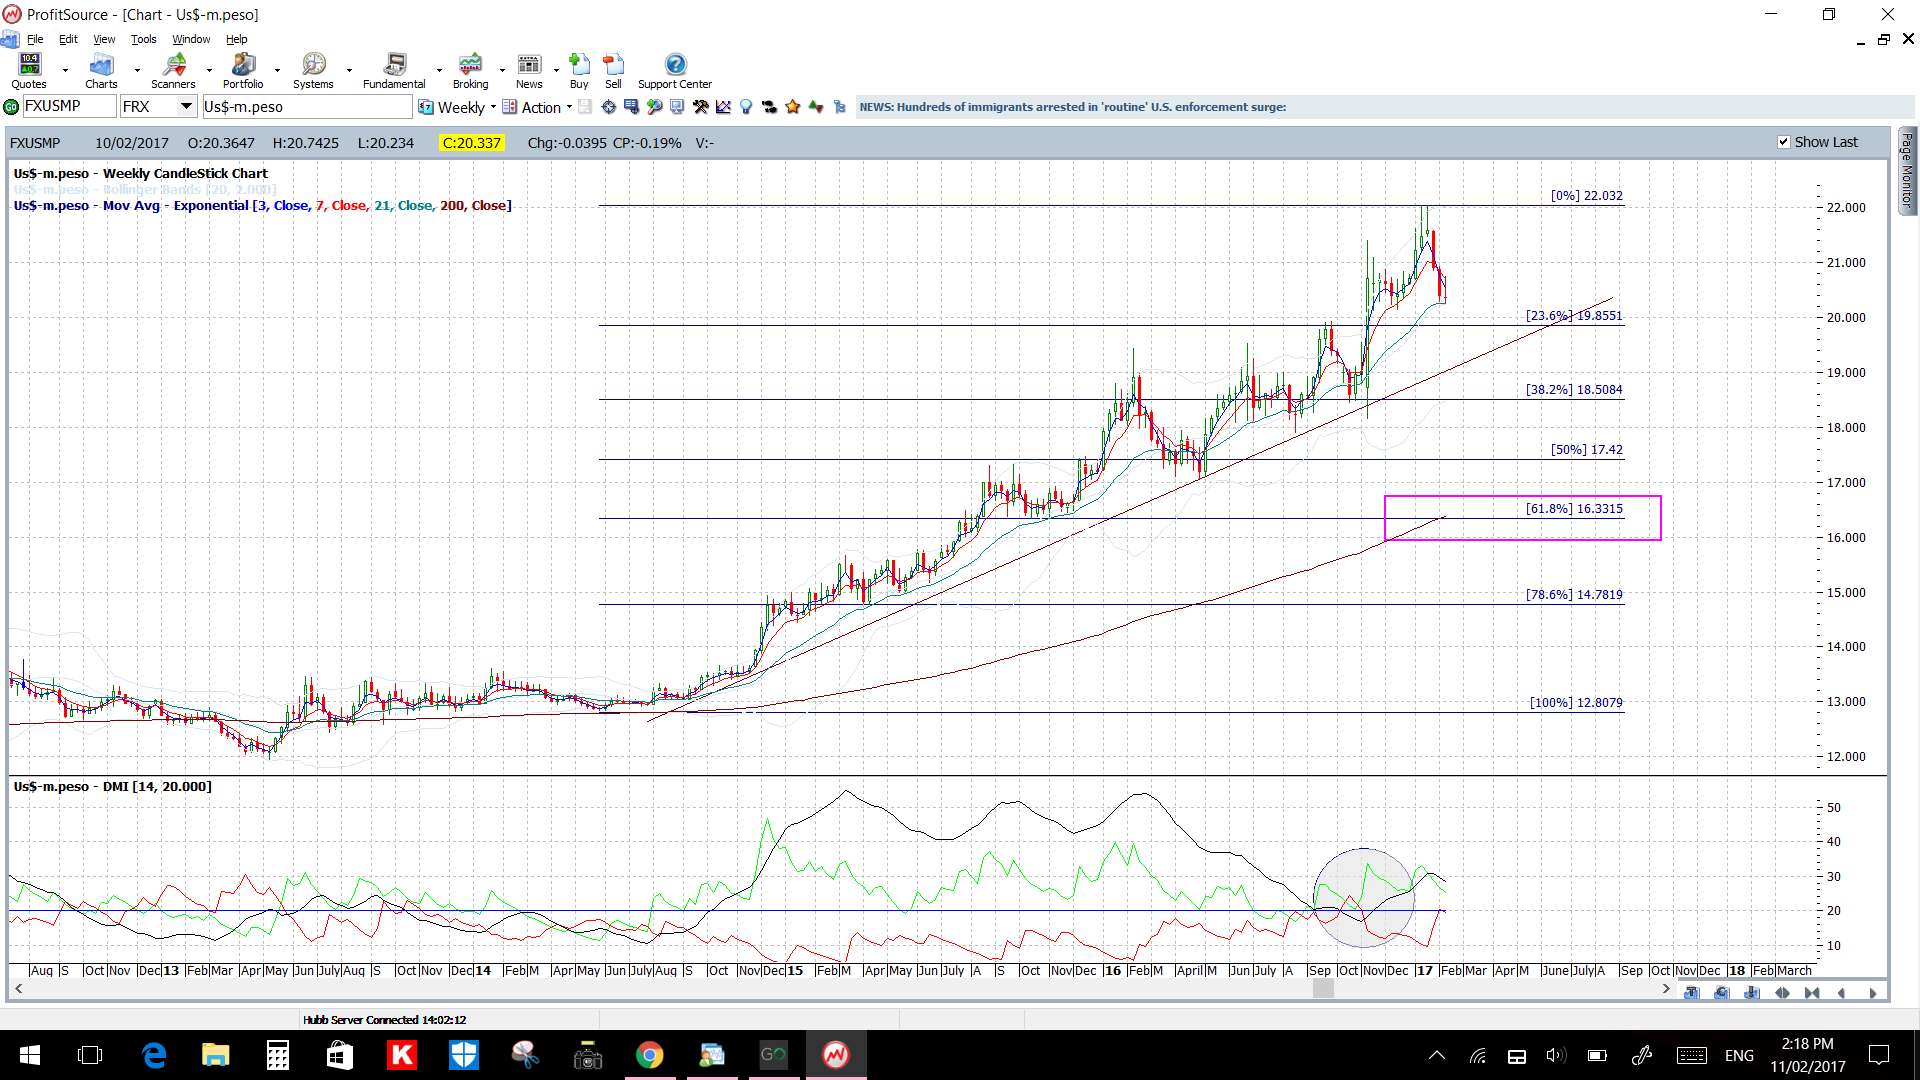
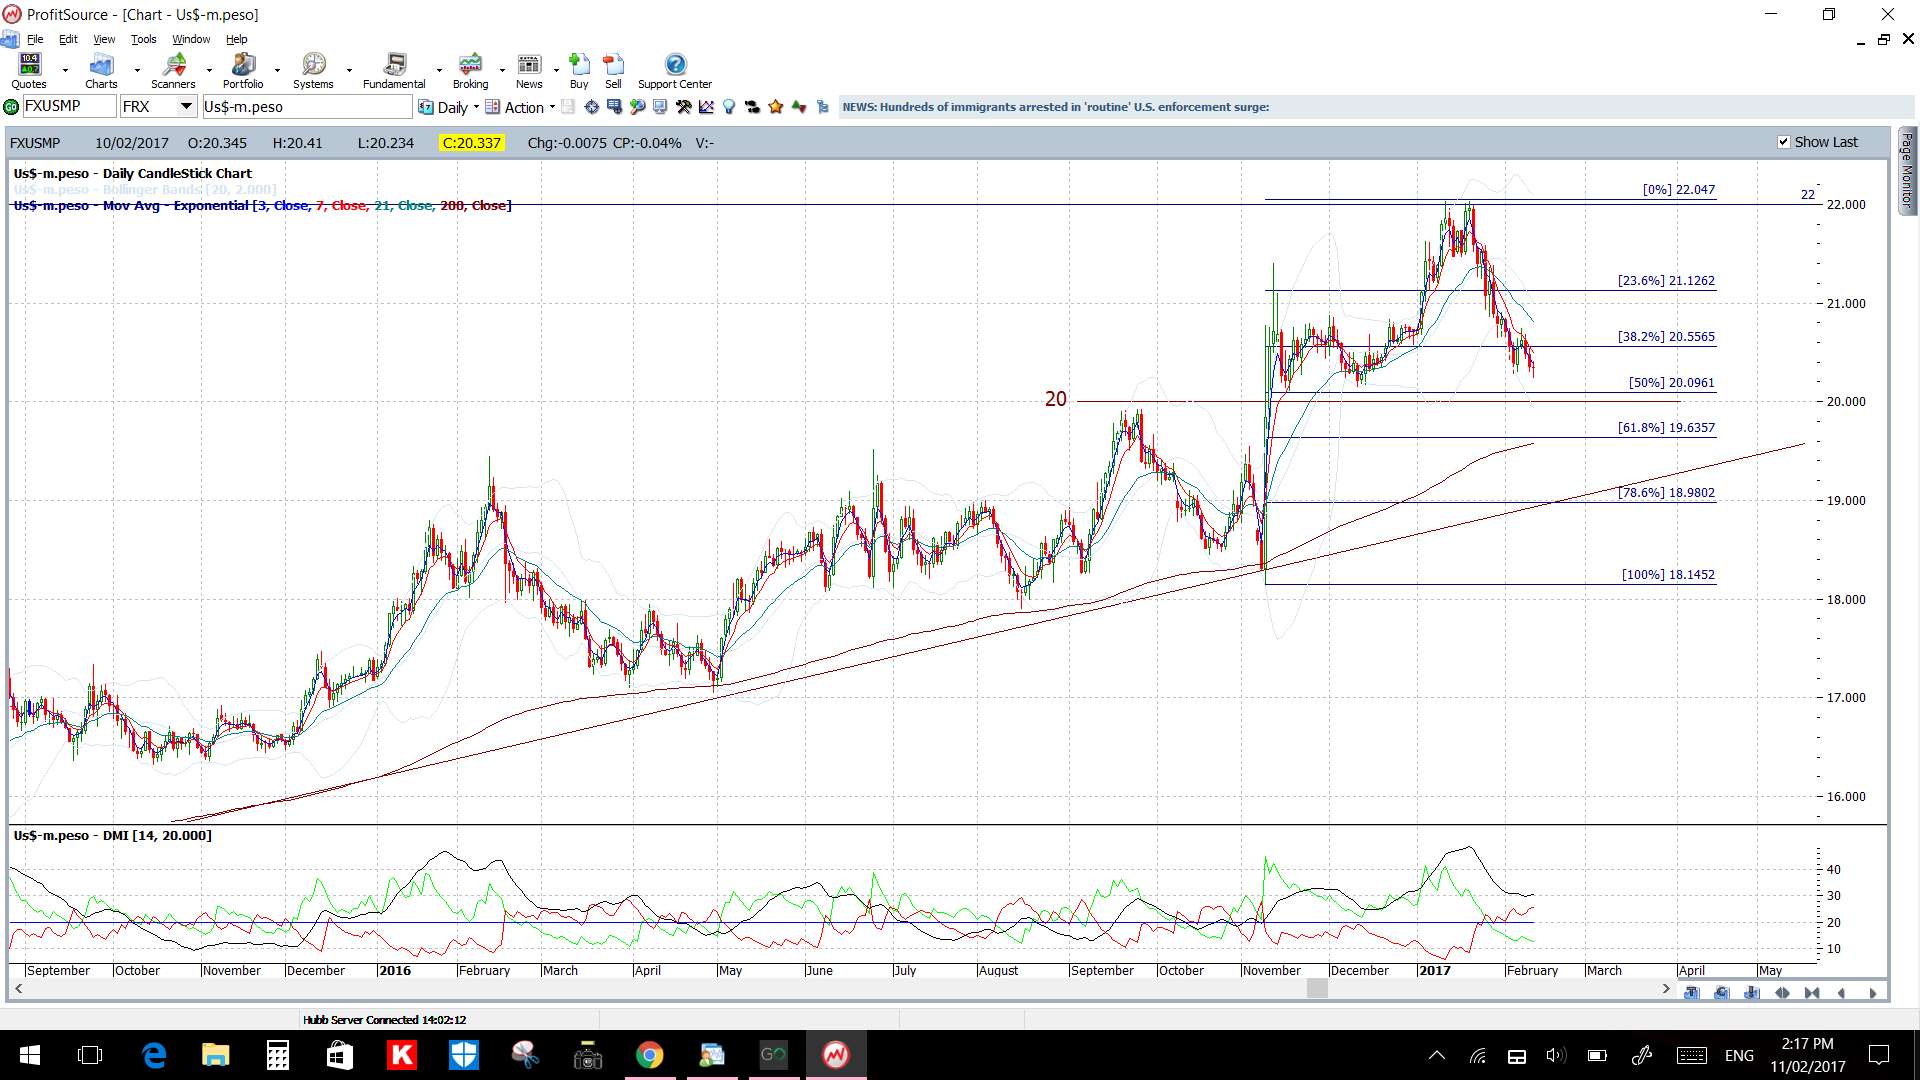
- USD/MXN gave 400 pips.
- USD/CNH: gave 170 pips.
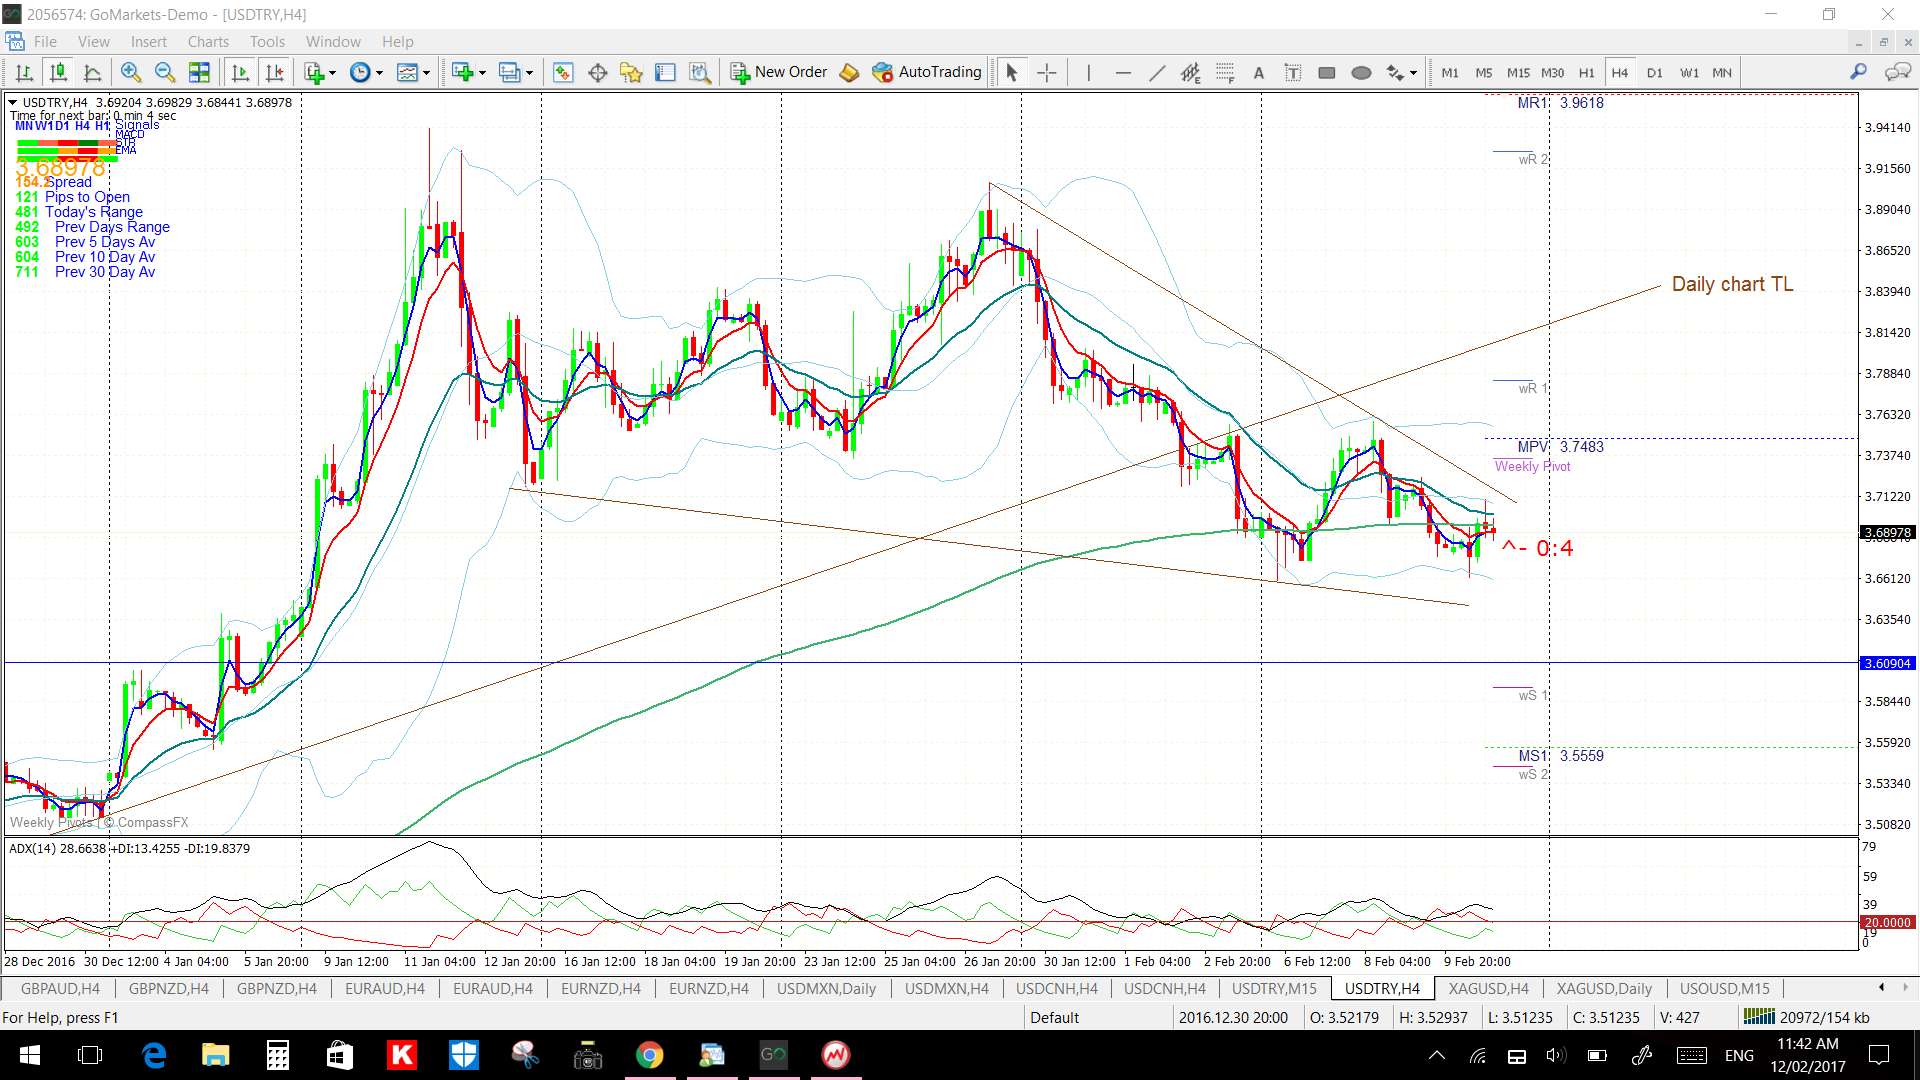
- USD/TRY gave 290 pips.
The following indices were tracked as well that night and gave significant breakout moves:
- DJIA gave 1,50 points.
- S&P500 gave 16 points.
Calendar:
- Mon 13th: JPY Prelim GDP.
- Tue 14th: CNY CPI & PPI. EUR German Prelim GDP. GBP CPI. USD CPI & Fed Chair Yellen speaks.
- Wed 15th: GBP Employment data. CAD Manufacturing Sales. USD CPI, Retail Sales, Crude Oil Inventories & Fed Chair Yellen testifies.
- Thurs 16th: AUD Employment data. USD Building Permits, Philly Fed Manufacturing Index & Weekly Unemployment Claims.
- Fri 17th: NZD Retail Sales. GBP Retail Sales.
Some other charts shaping my perspective:
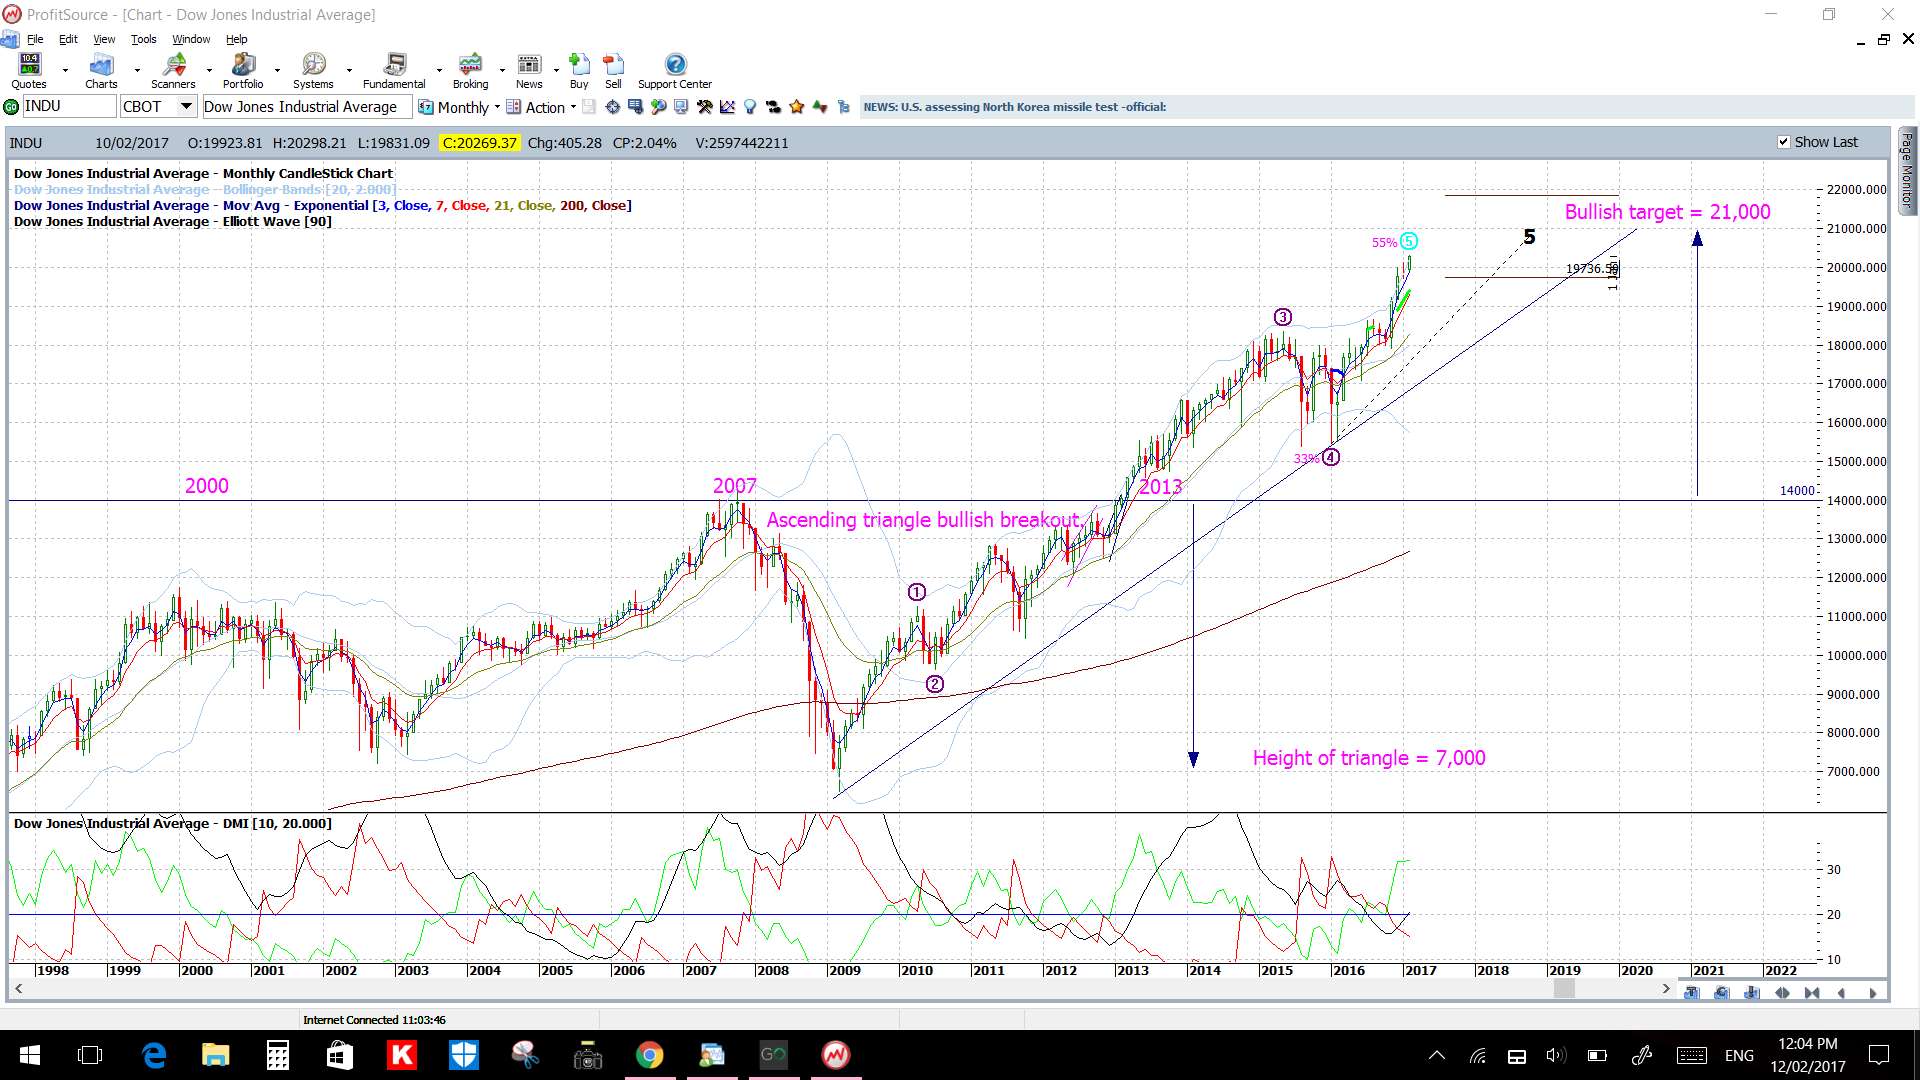
DJIA monthly: price is close to the bullish target I’ve had on my charts for the last few years!
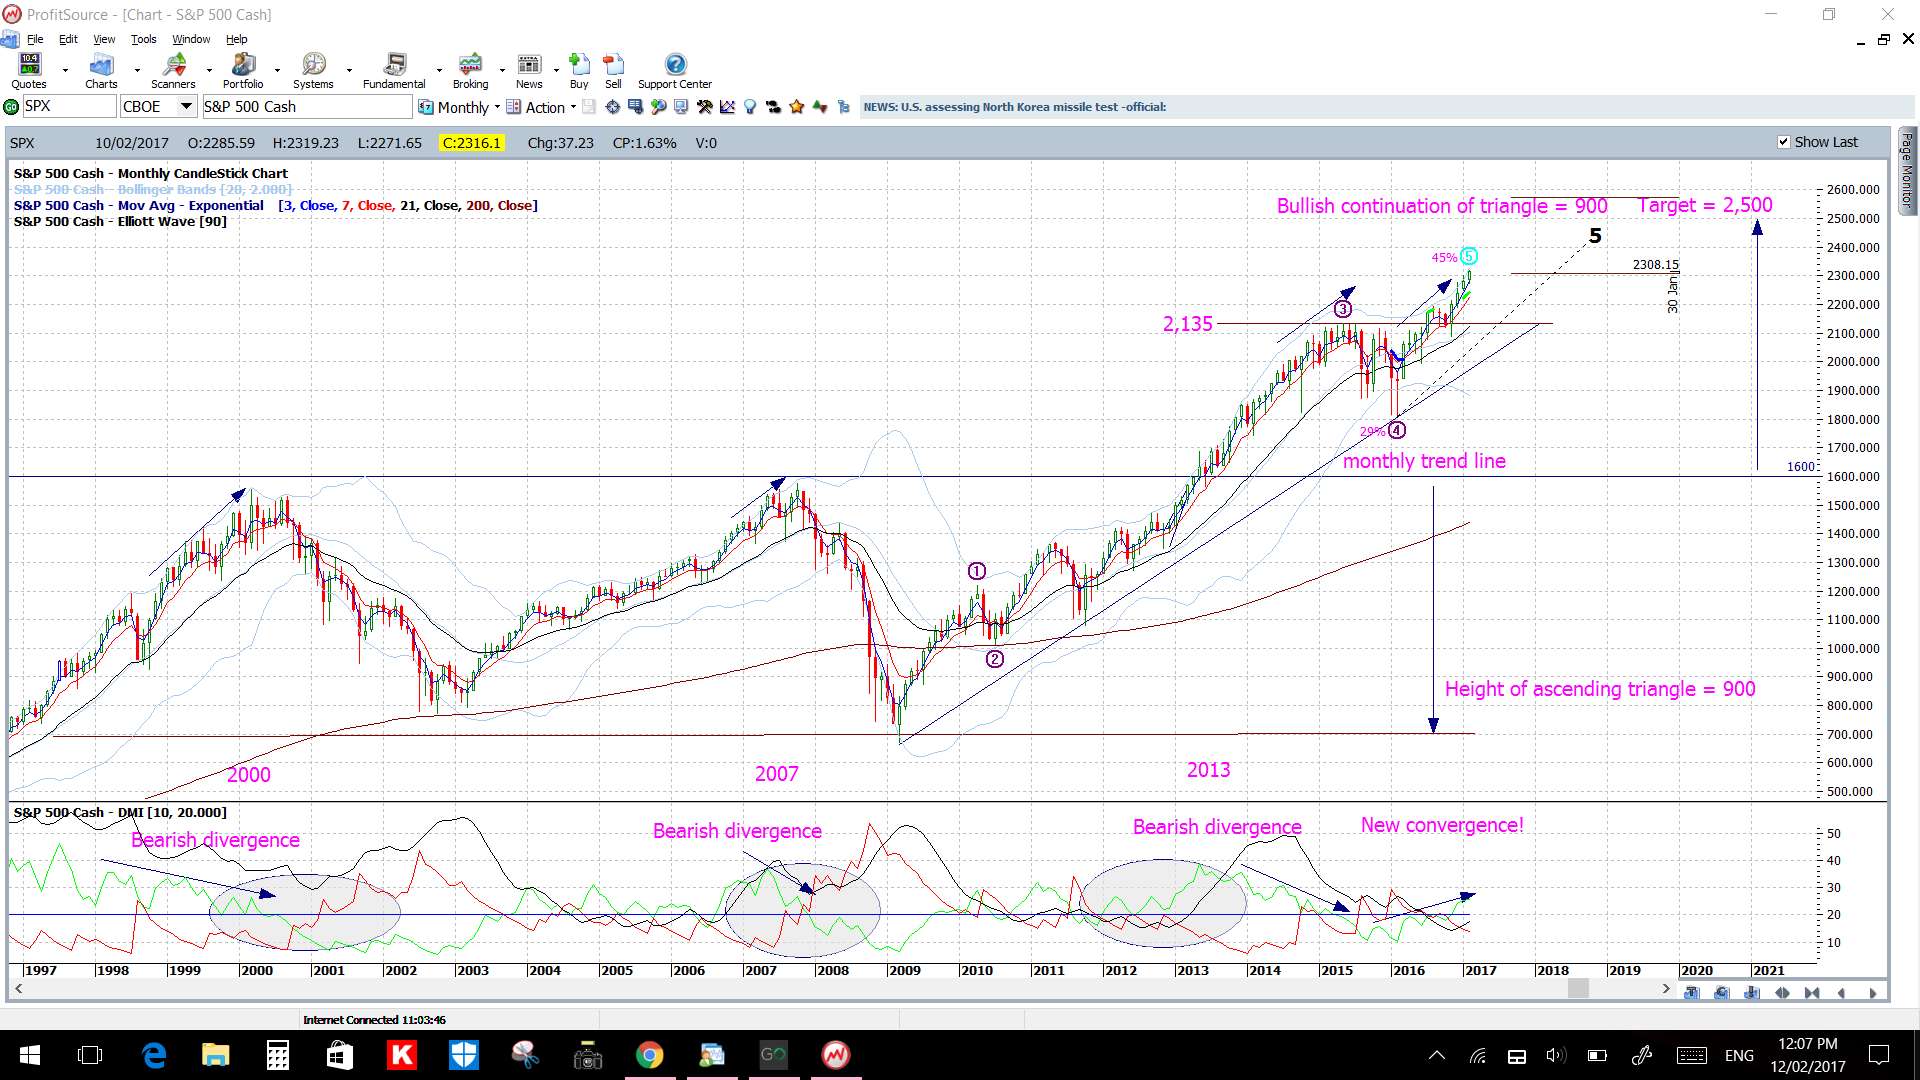
S&P500 monthly: ditto here:
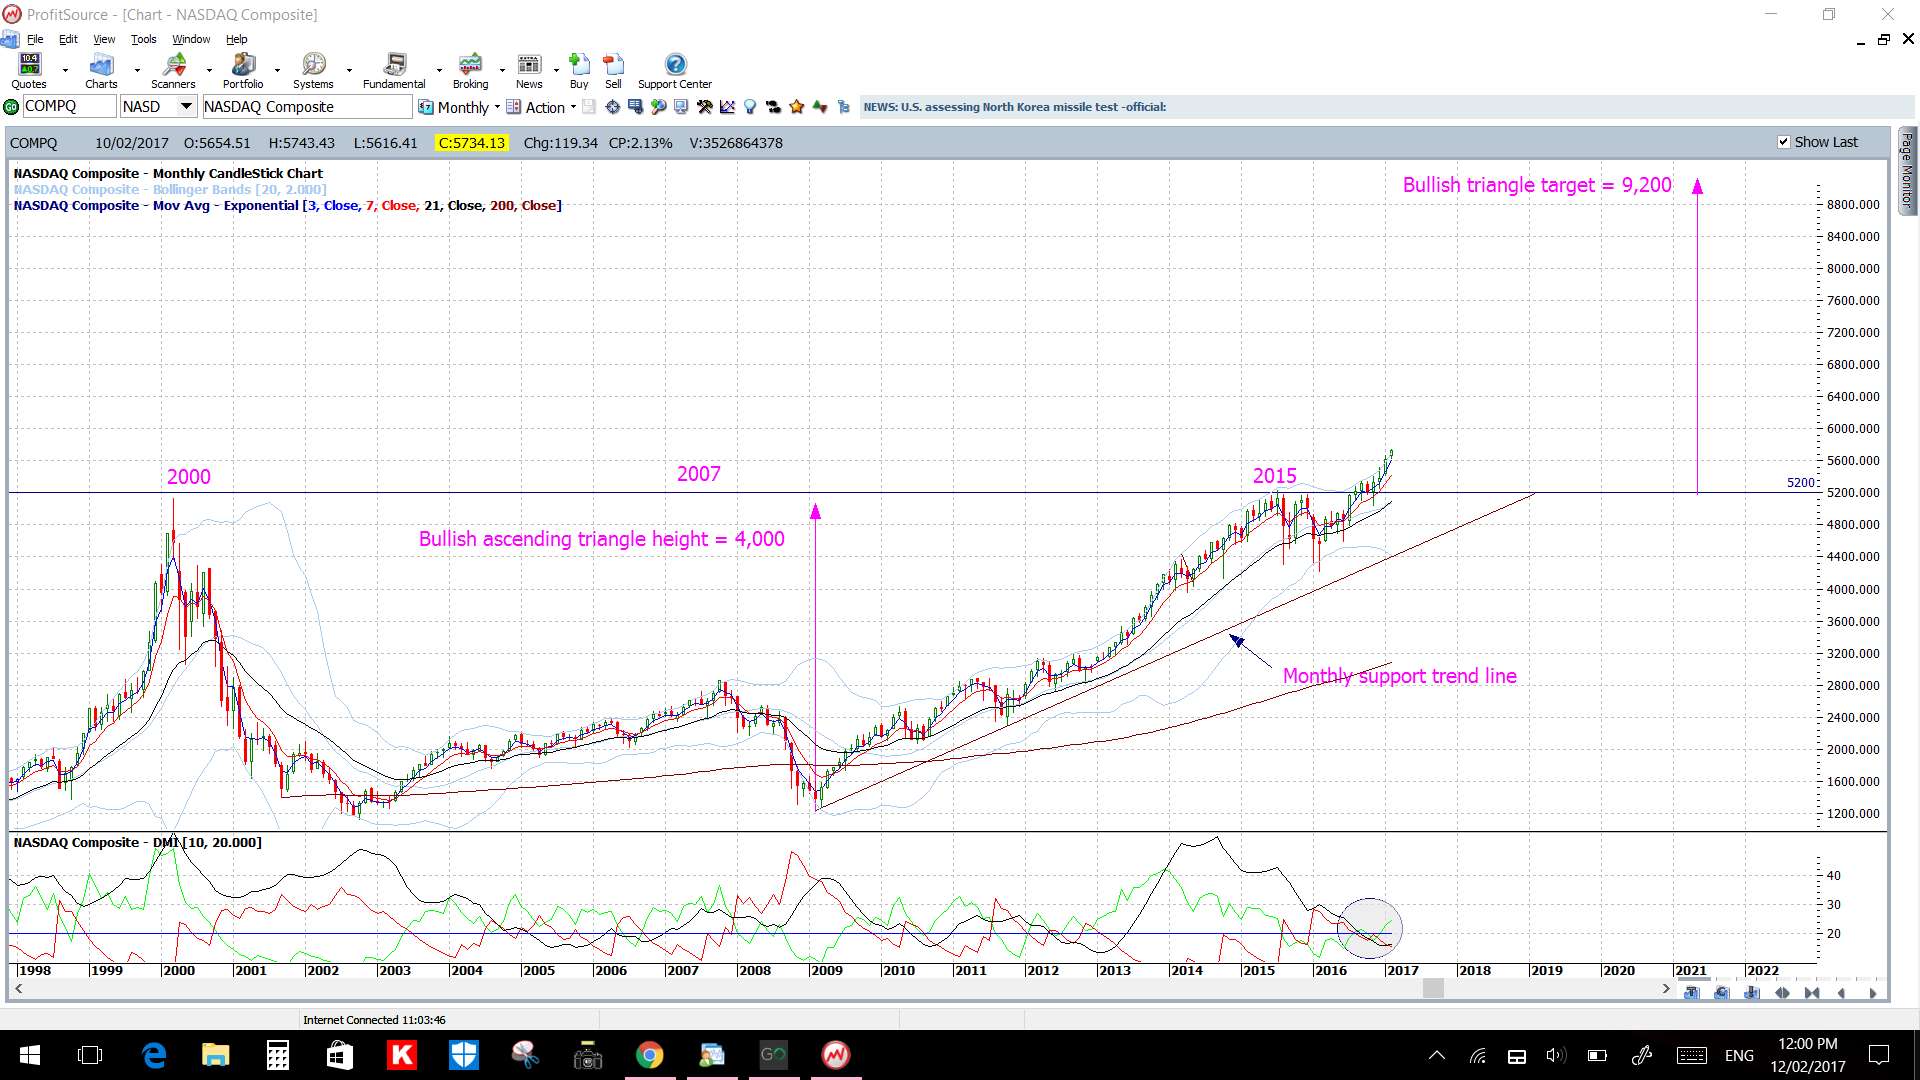
NASDAQ monthly: slow to the party but about to kick off?
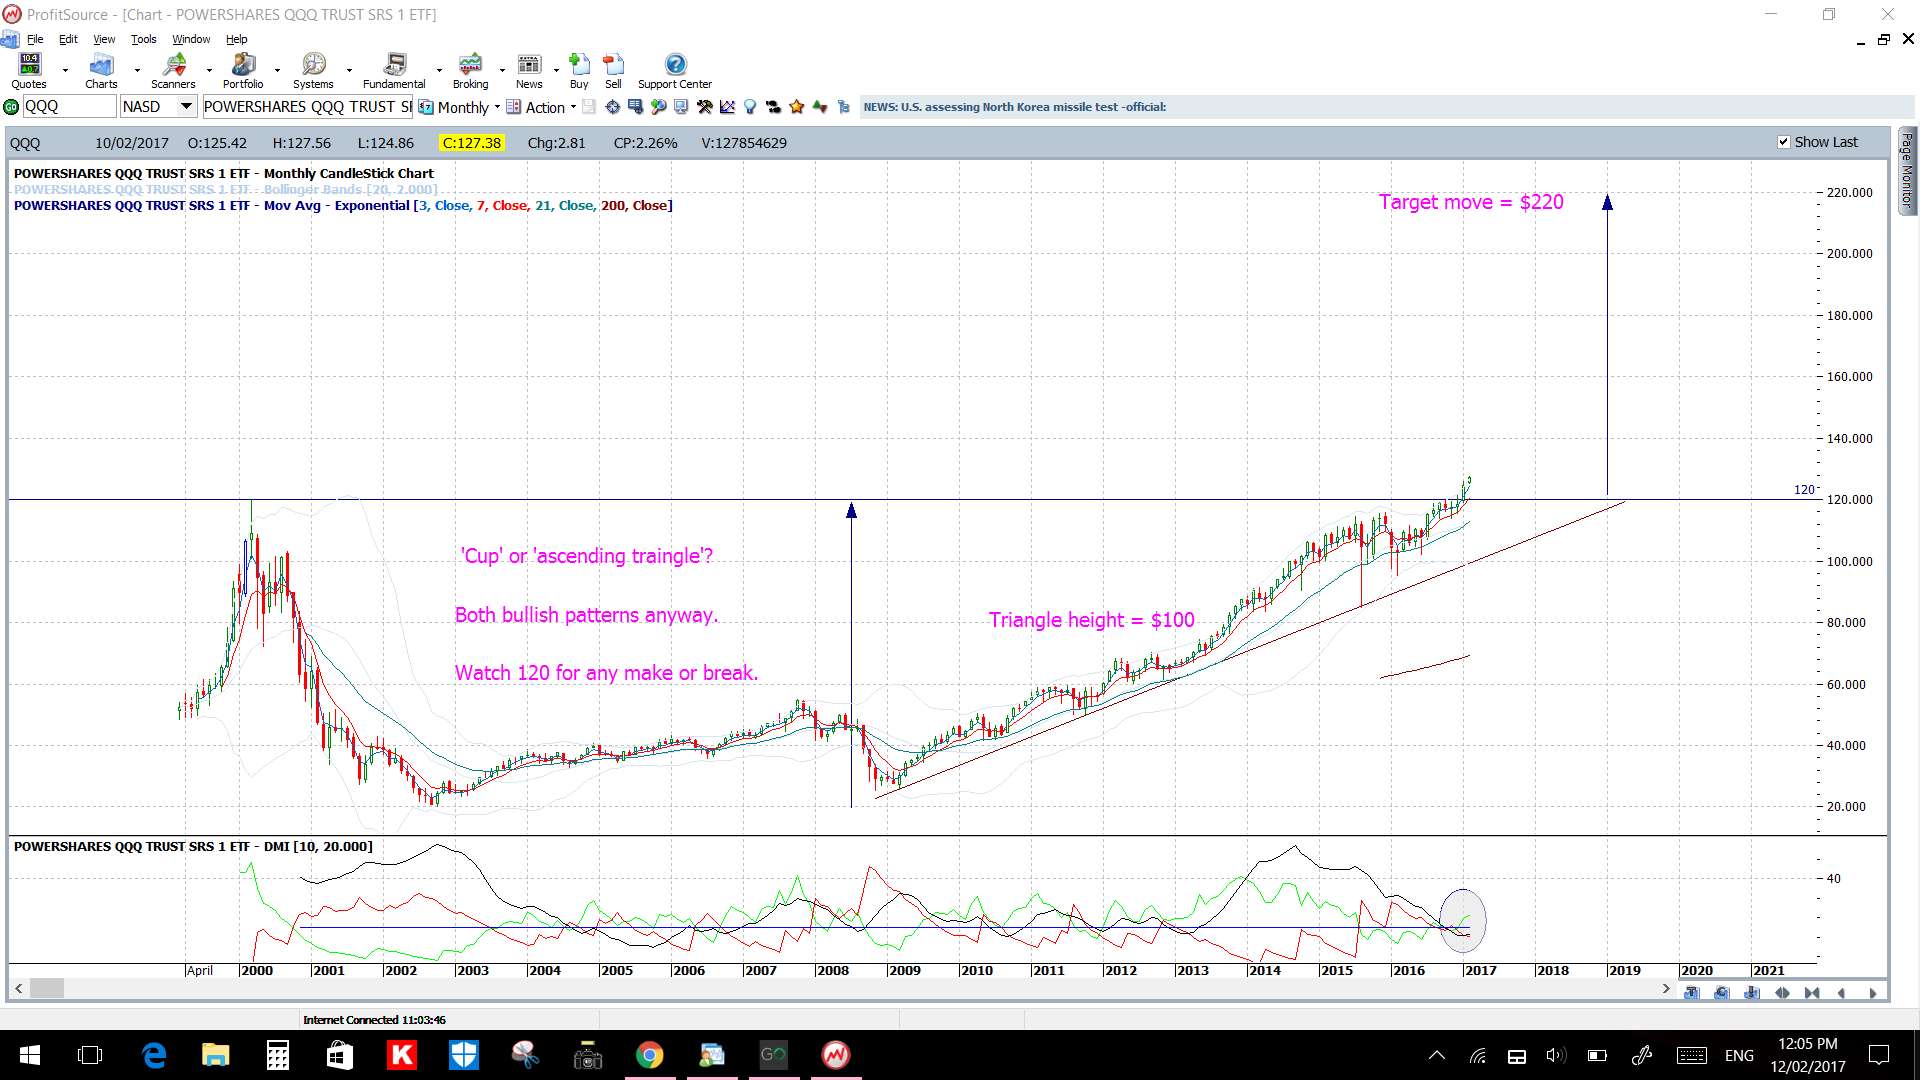
QQQ monthly: NASDAQ ETF:
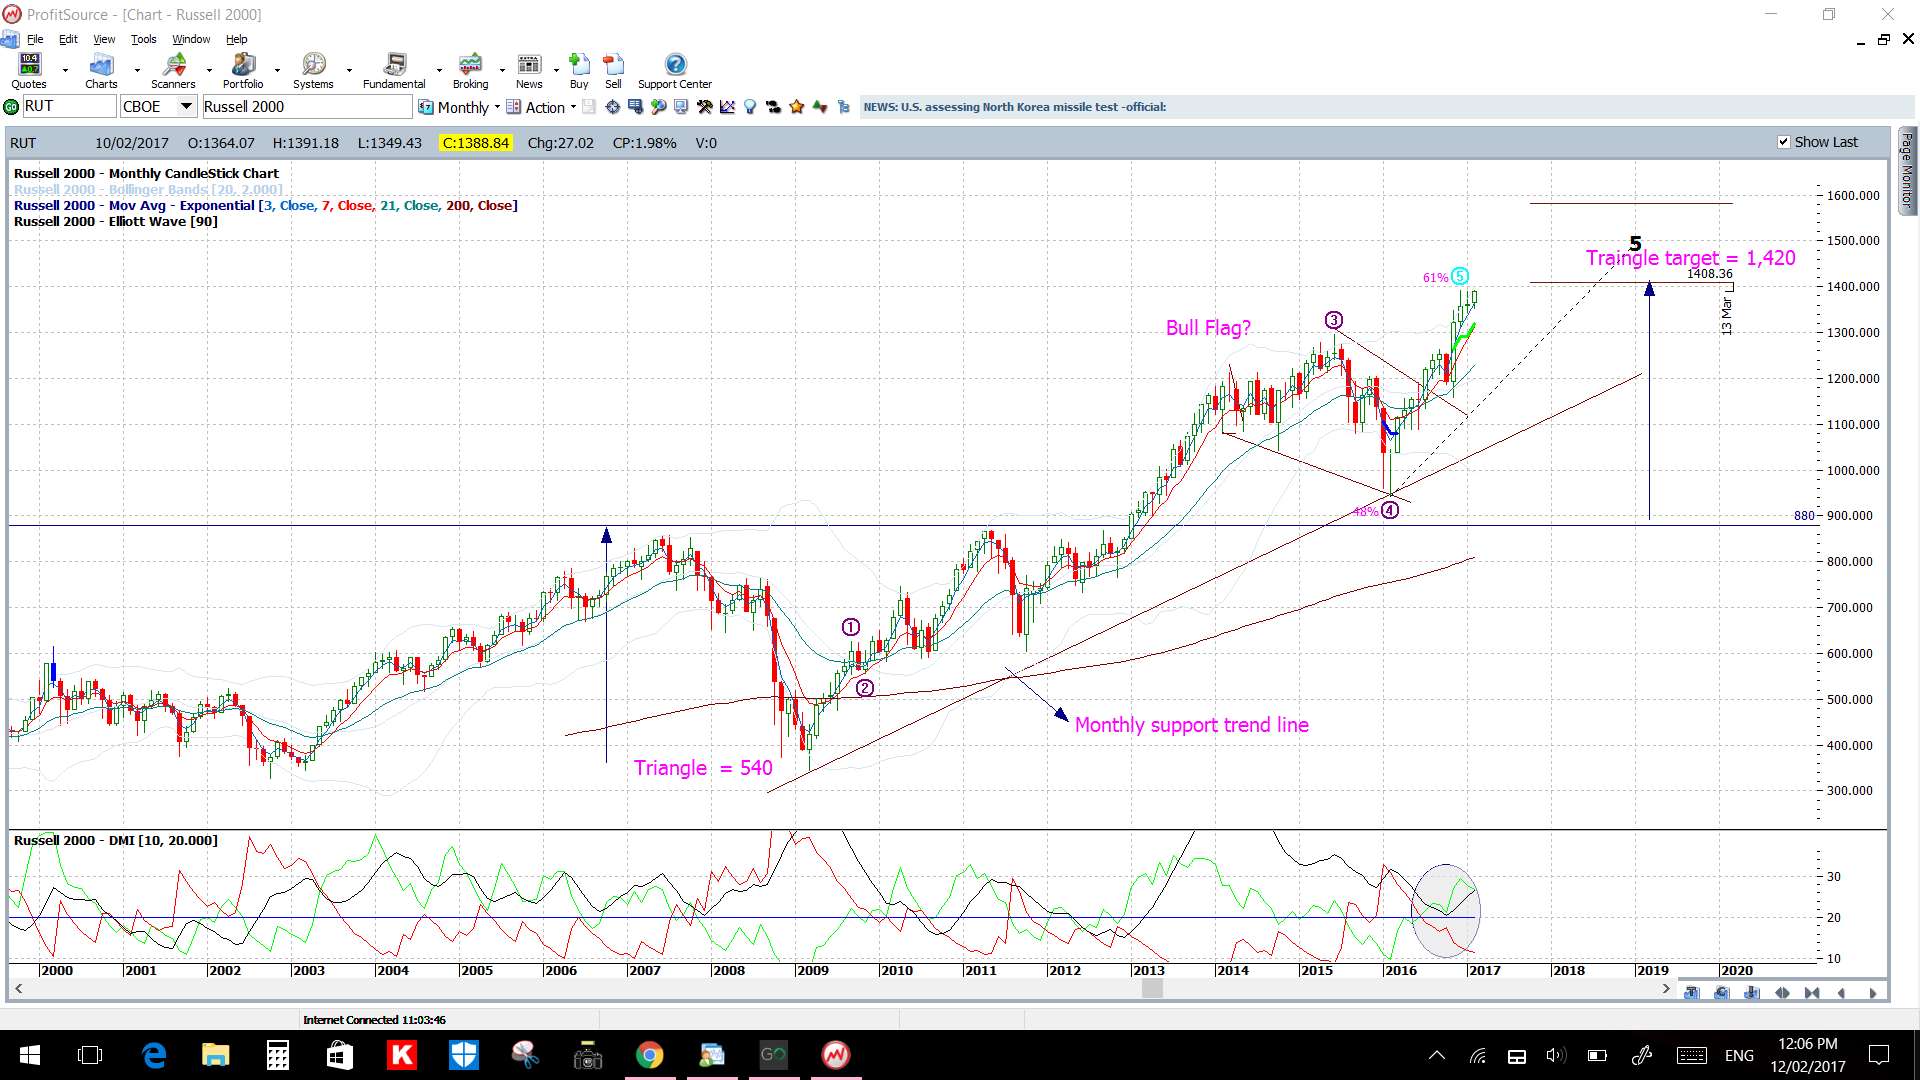
Russell 200 monthly: price is close to the bullish target I’ve had on my charts for the last few years!
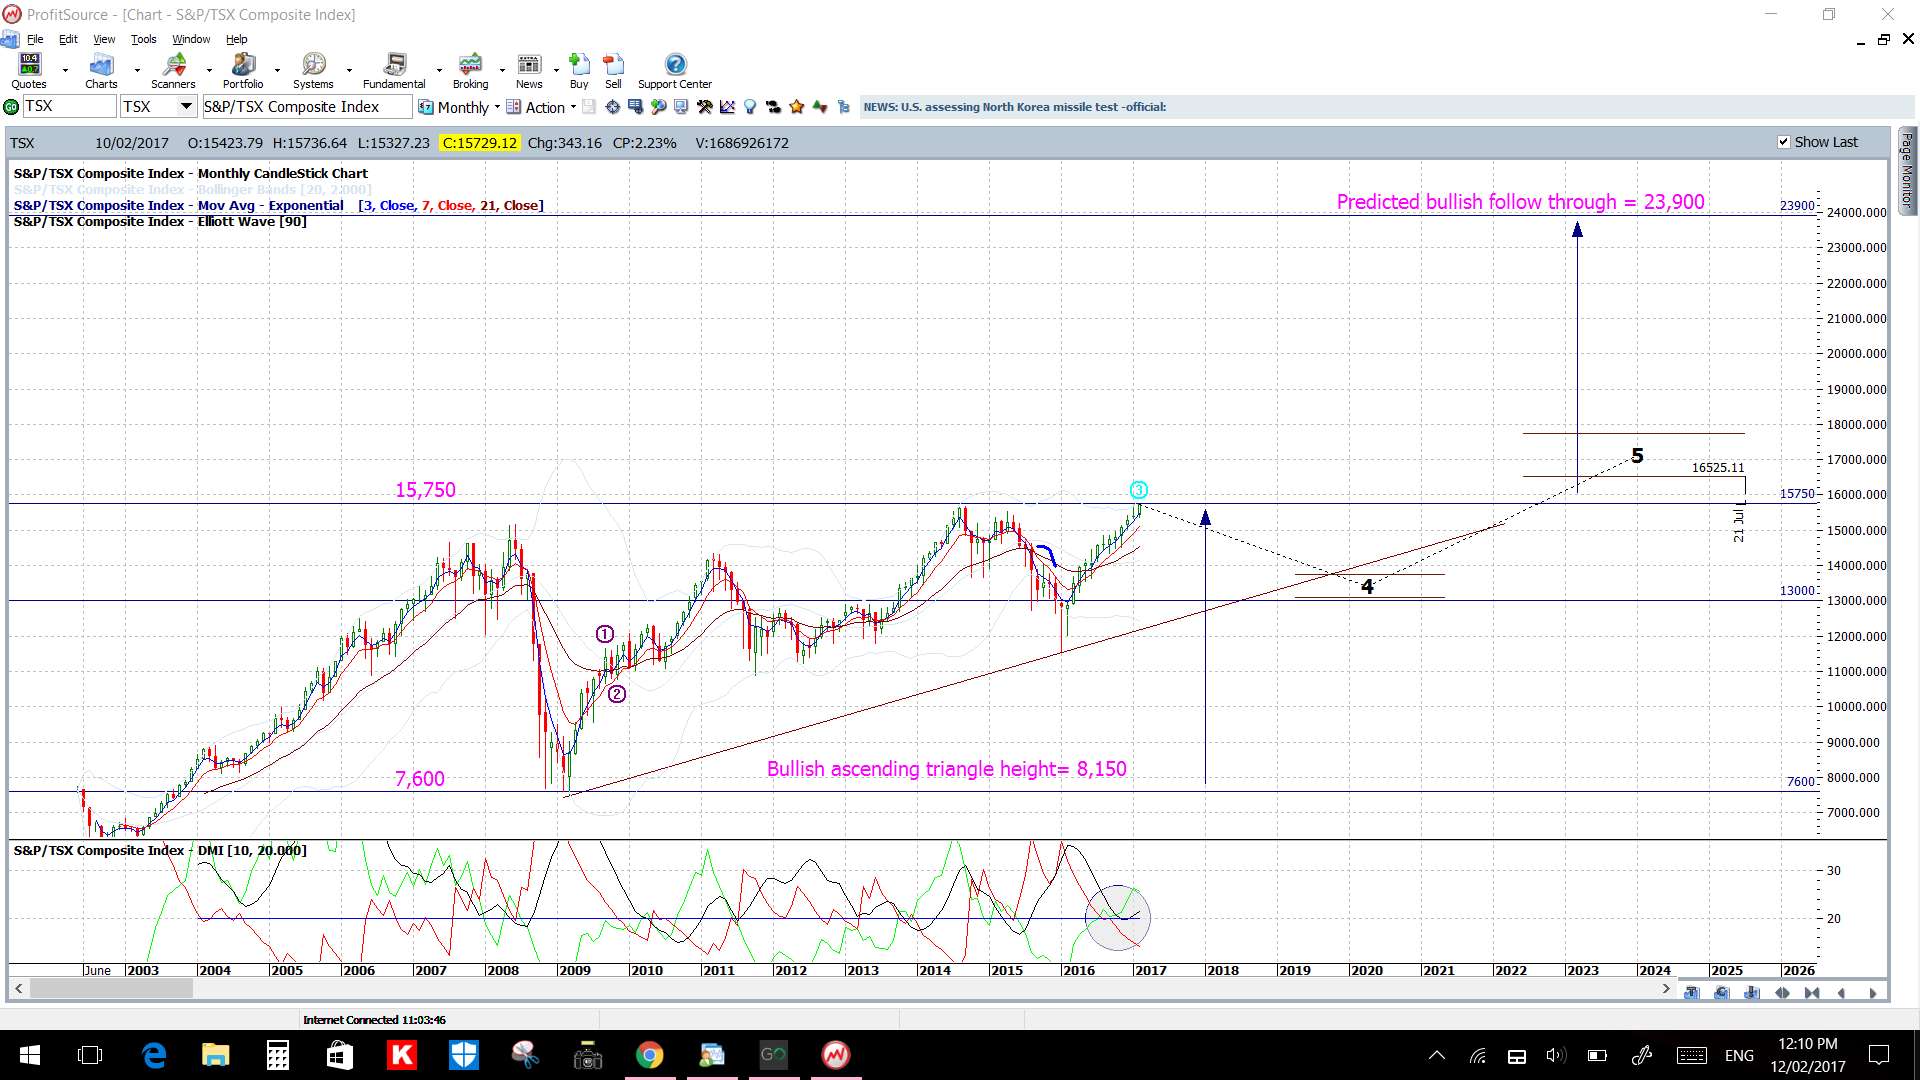
Canada’s TSX monthly: about to take off?
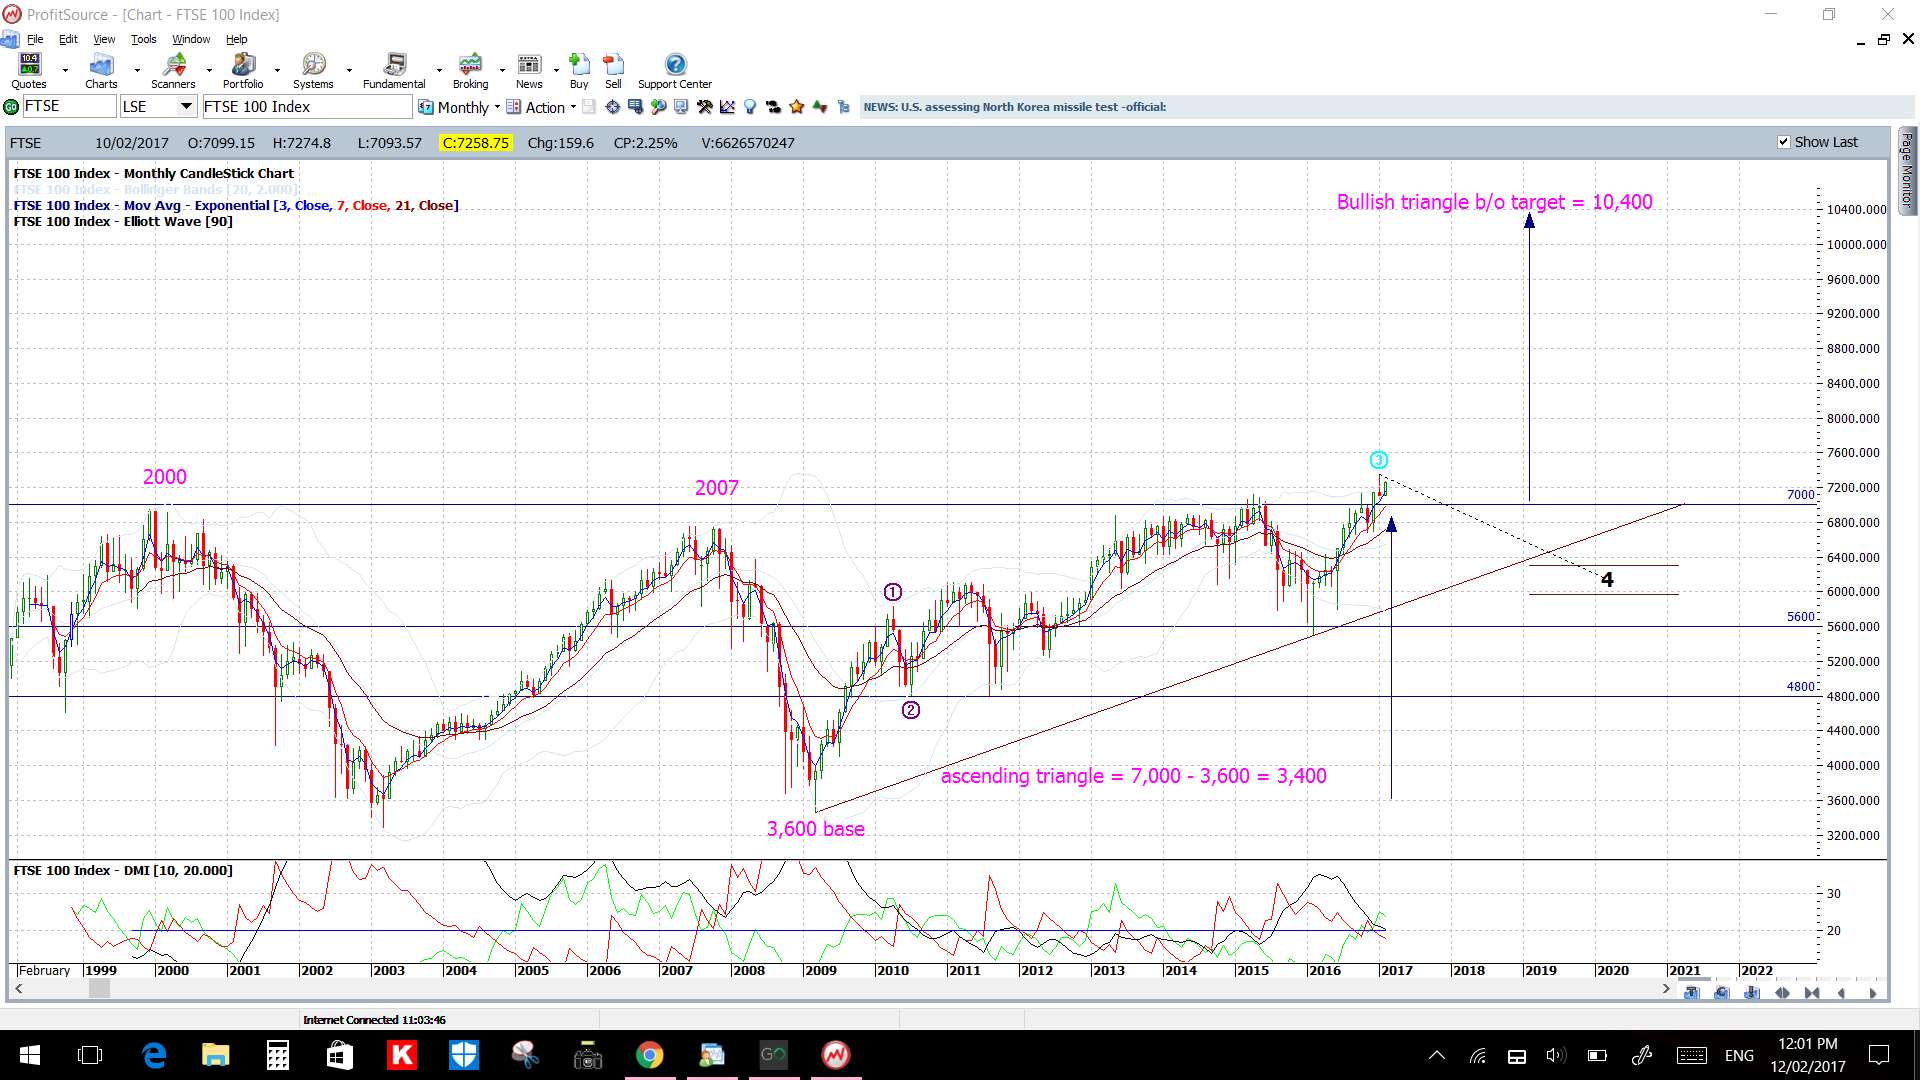
FTSE monthly: here too?
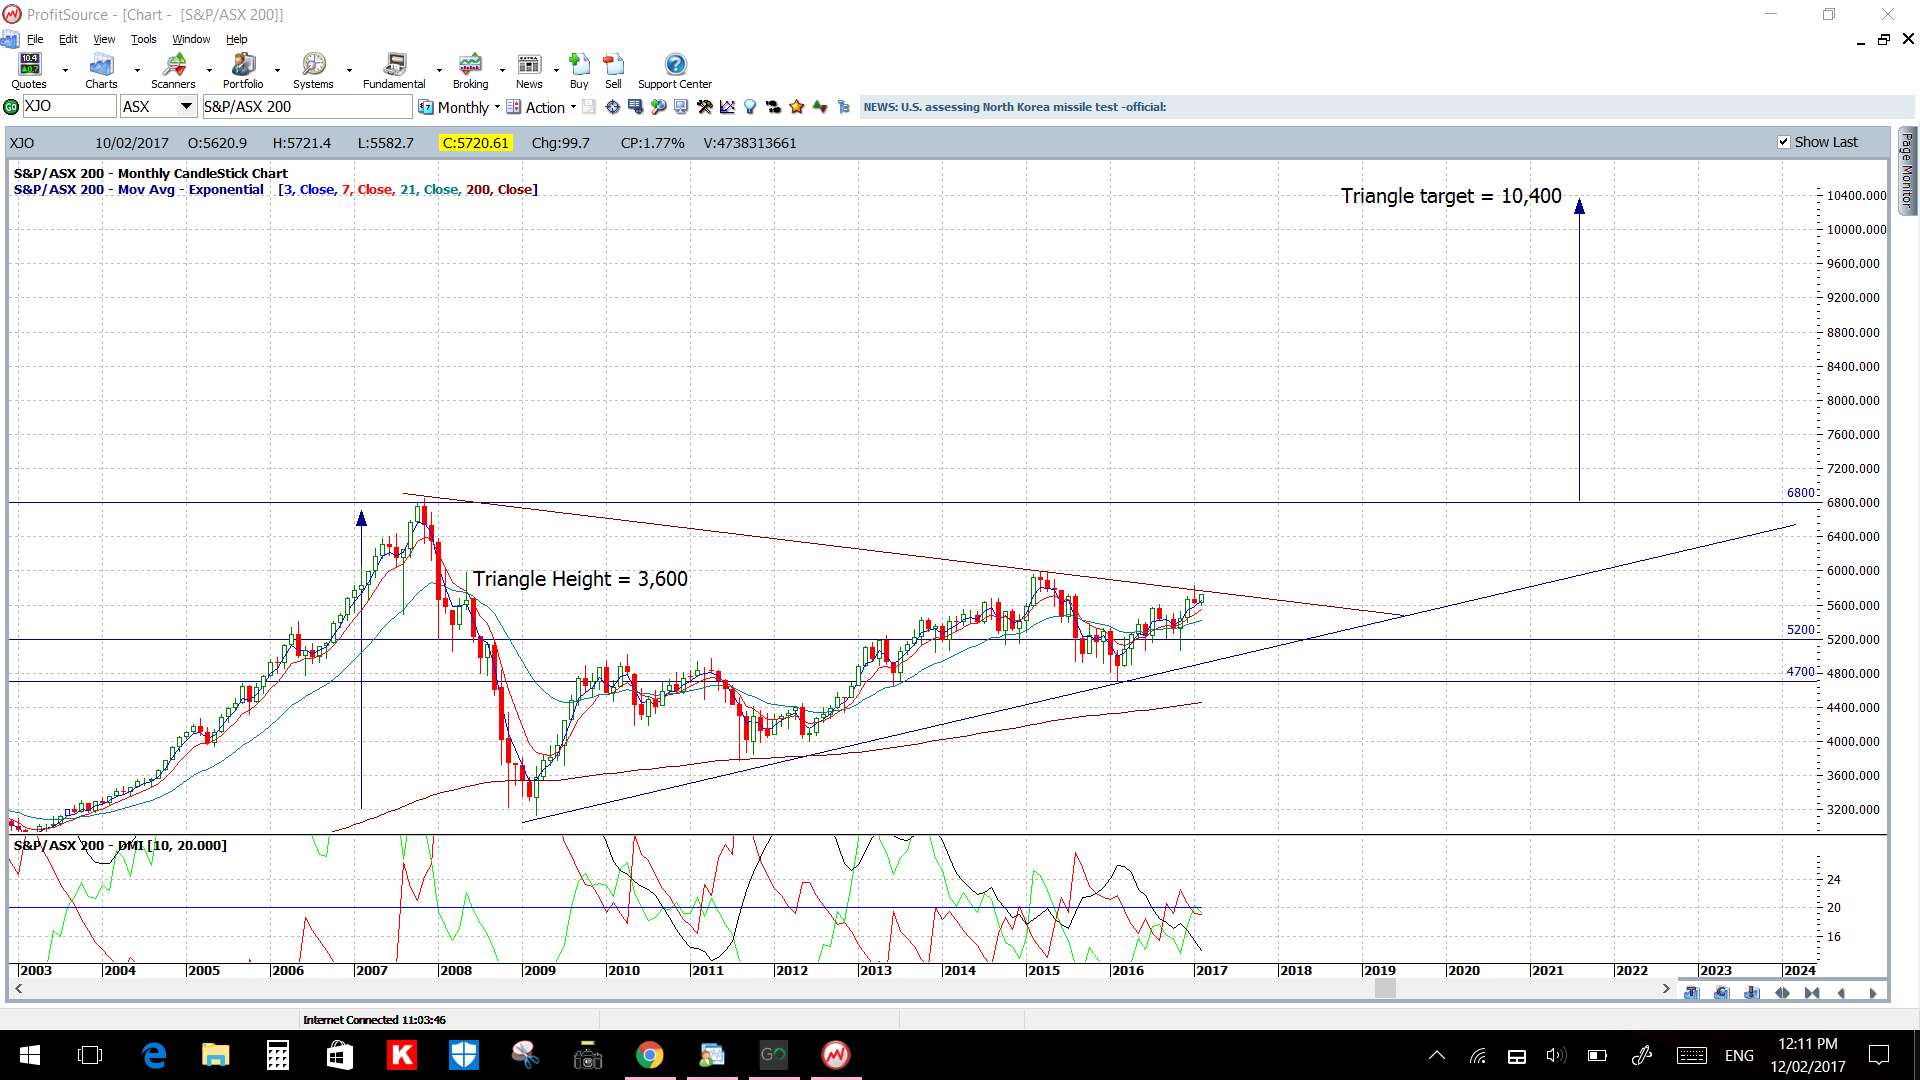
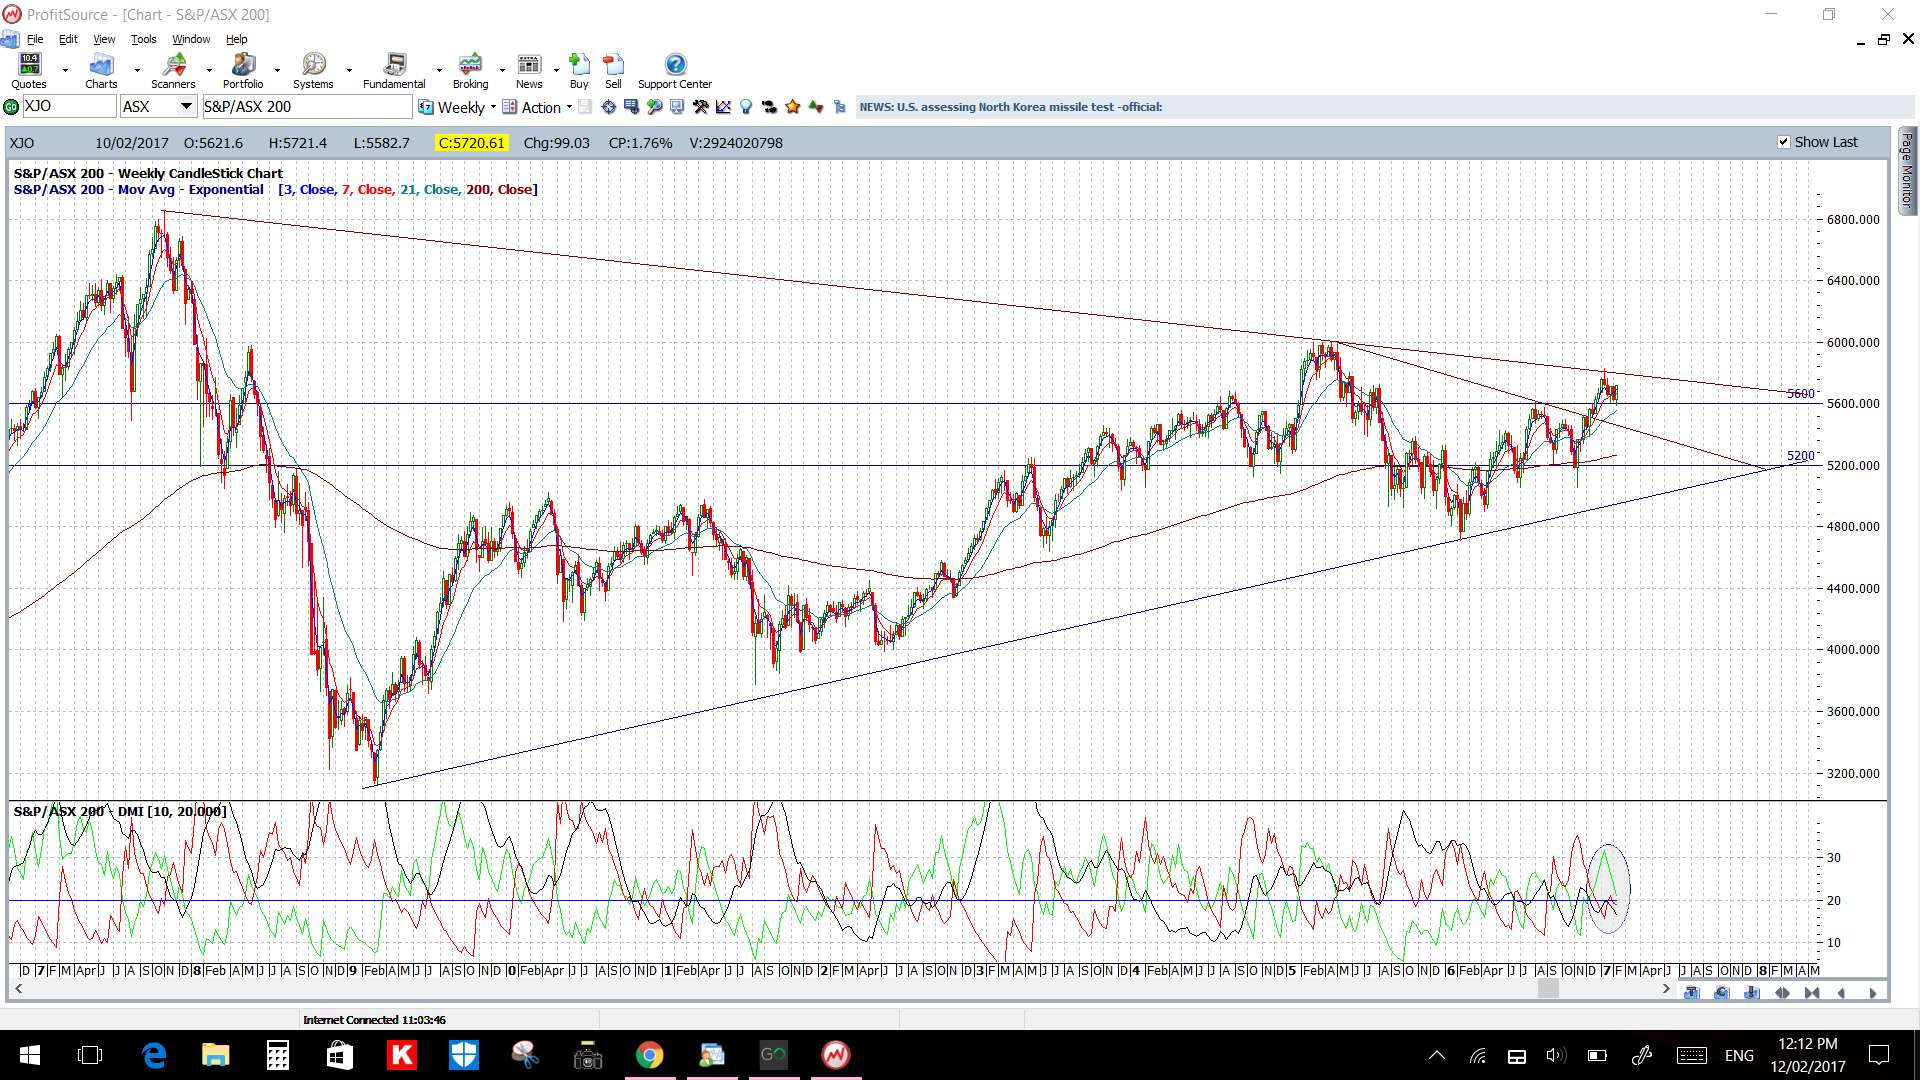
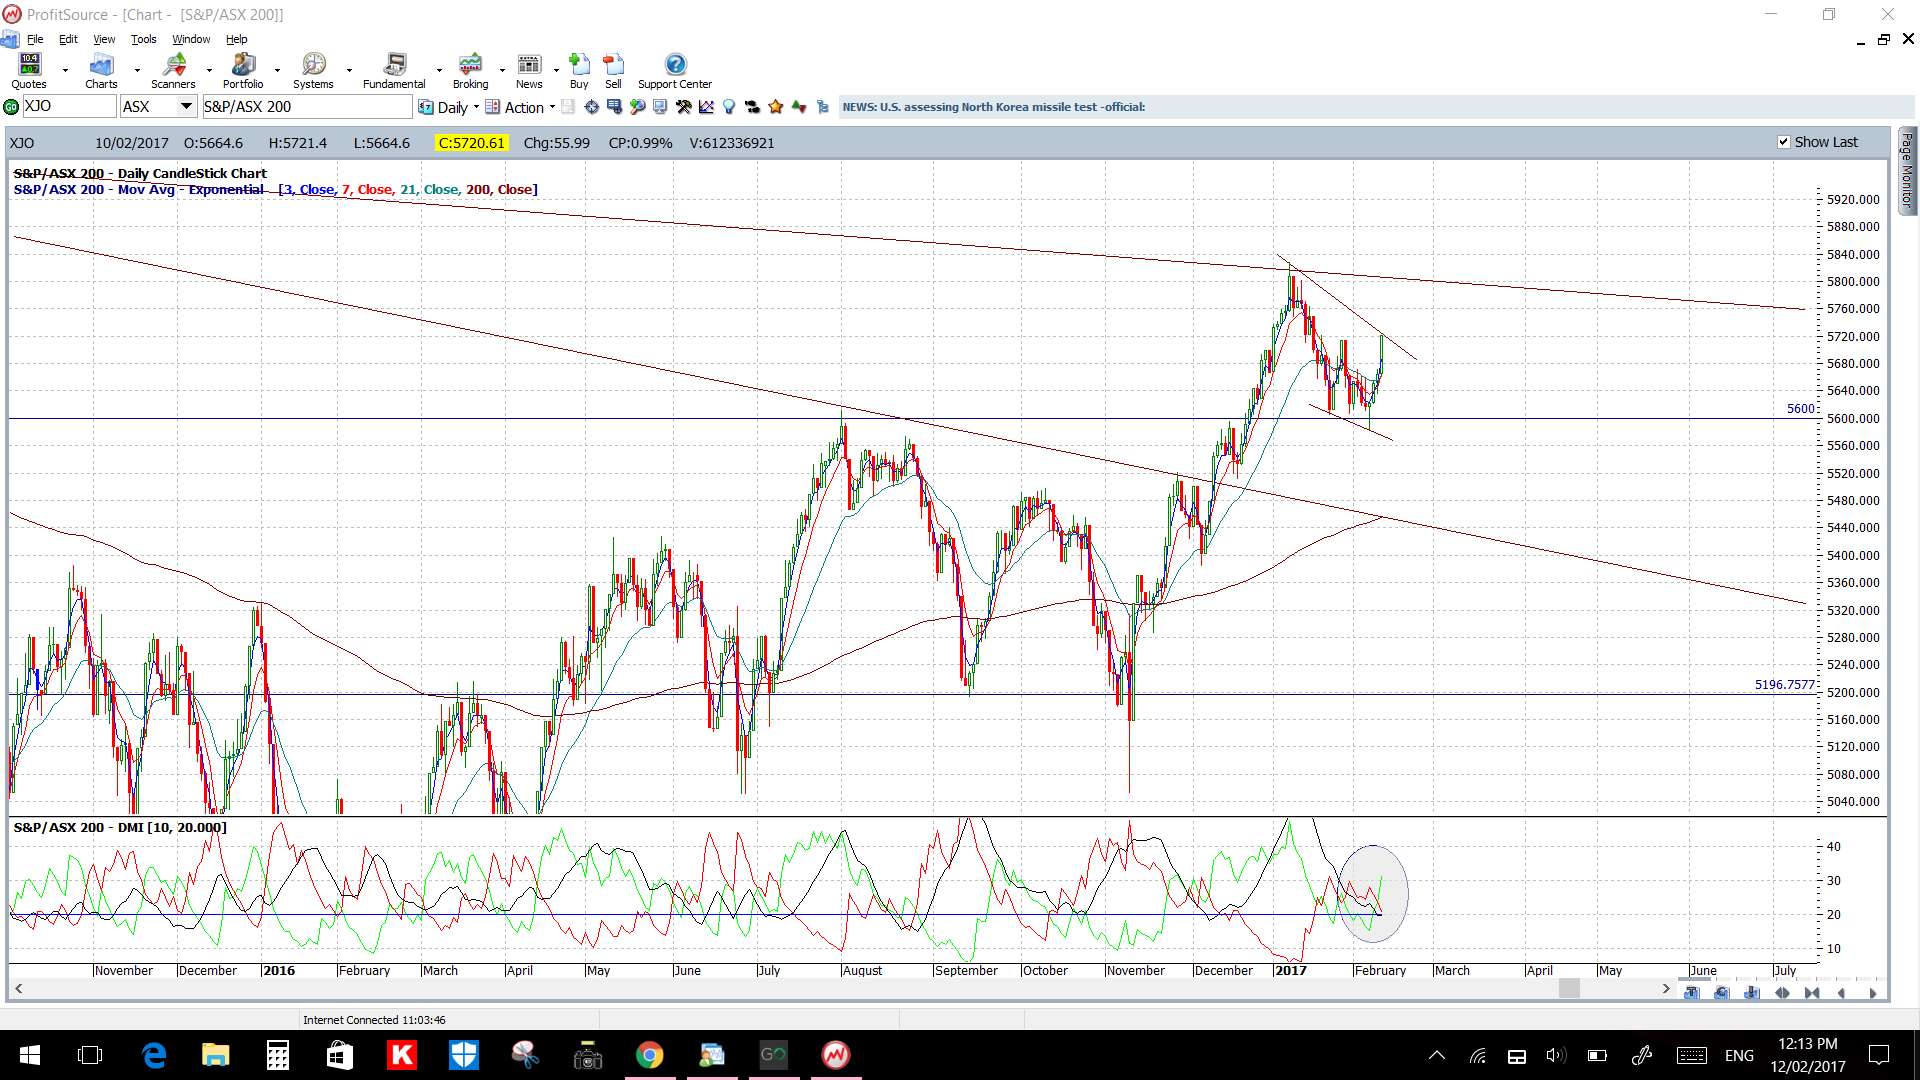
ASX-200: the Aussie top 200 index has been consolidating under a 10 year bear trend line but, to me at least, it looks like it has been forming up in a Bull Flag. I’ll be keenly watching these Flag trend lines in coming sessions:
XJO monthly:
XJO weekly:
XJO daily: this looks Bull Flag like to me:
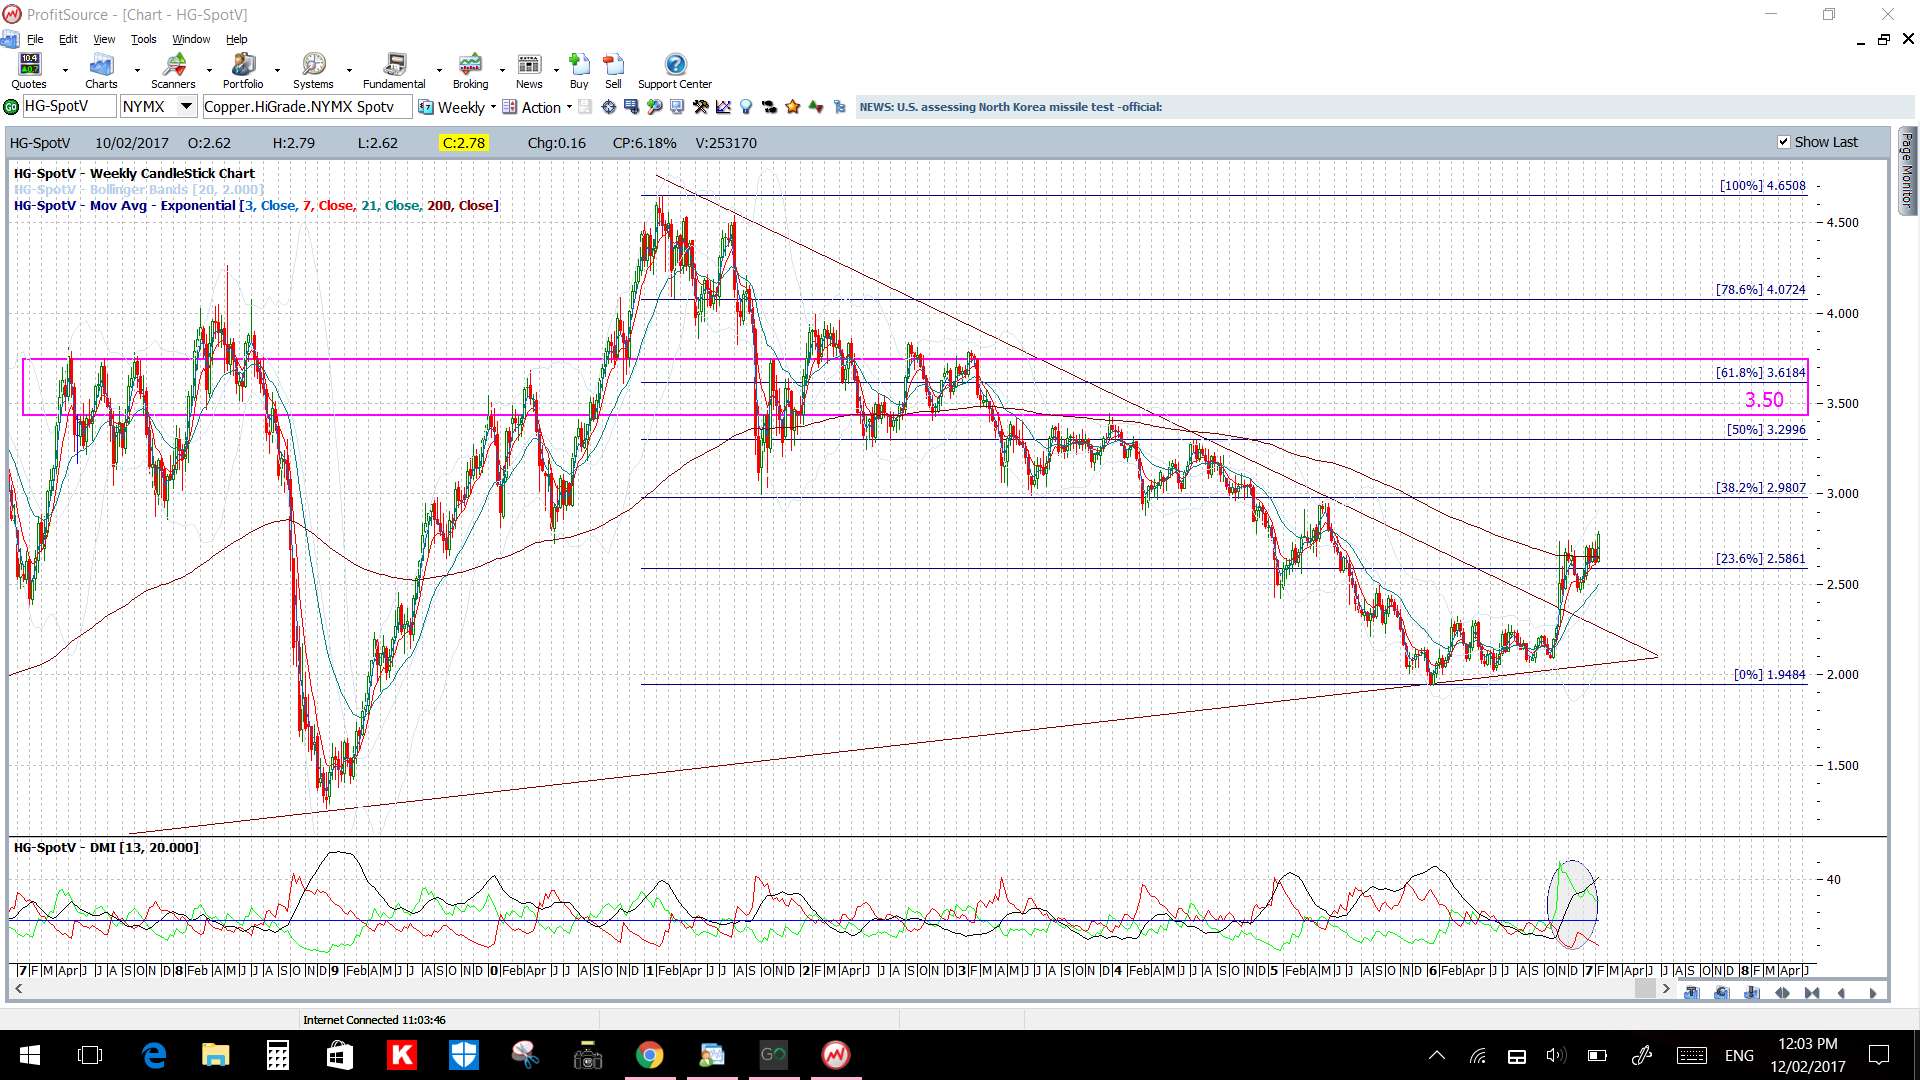
Copper weekly: still looking bullish and my target is 3.50 up near the 61.8% fib:
Forex:
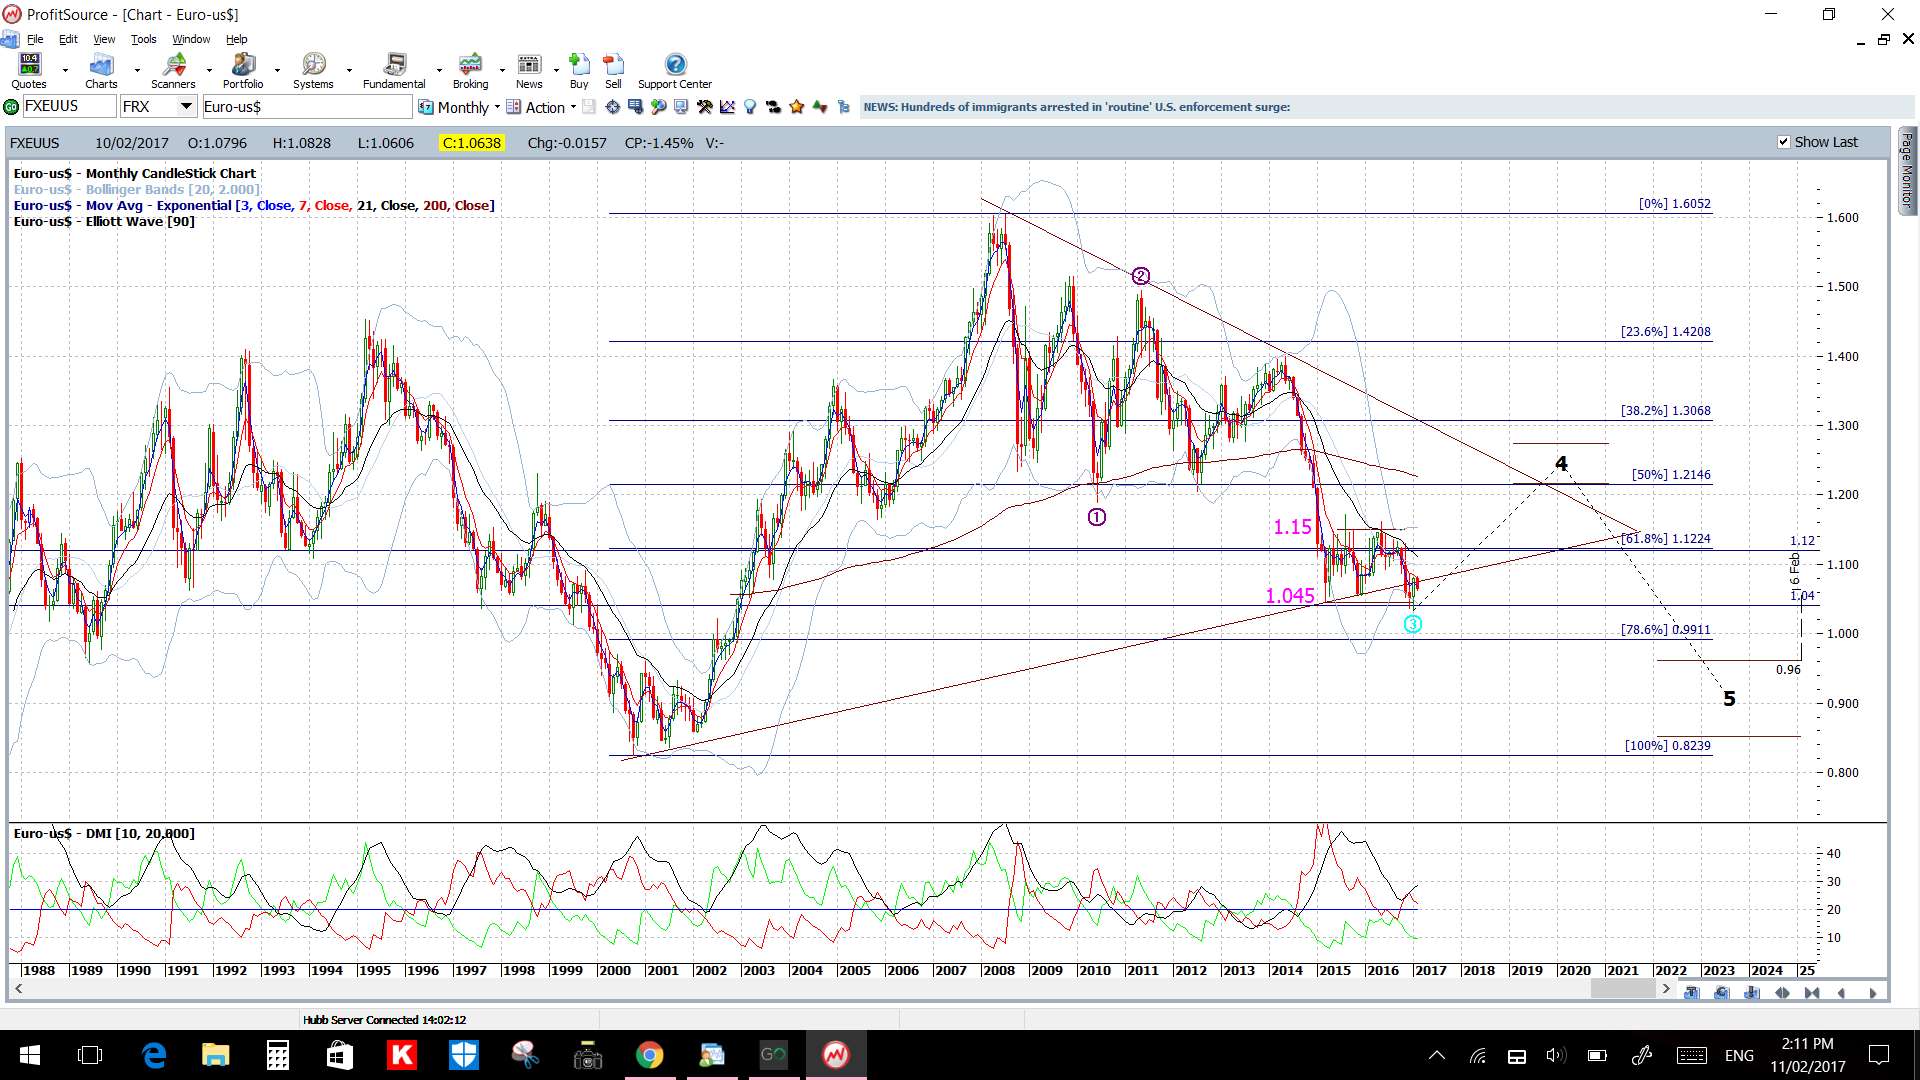
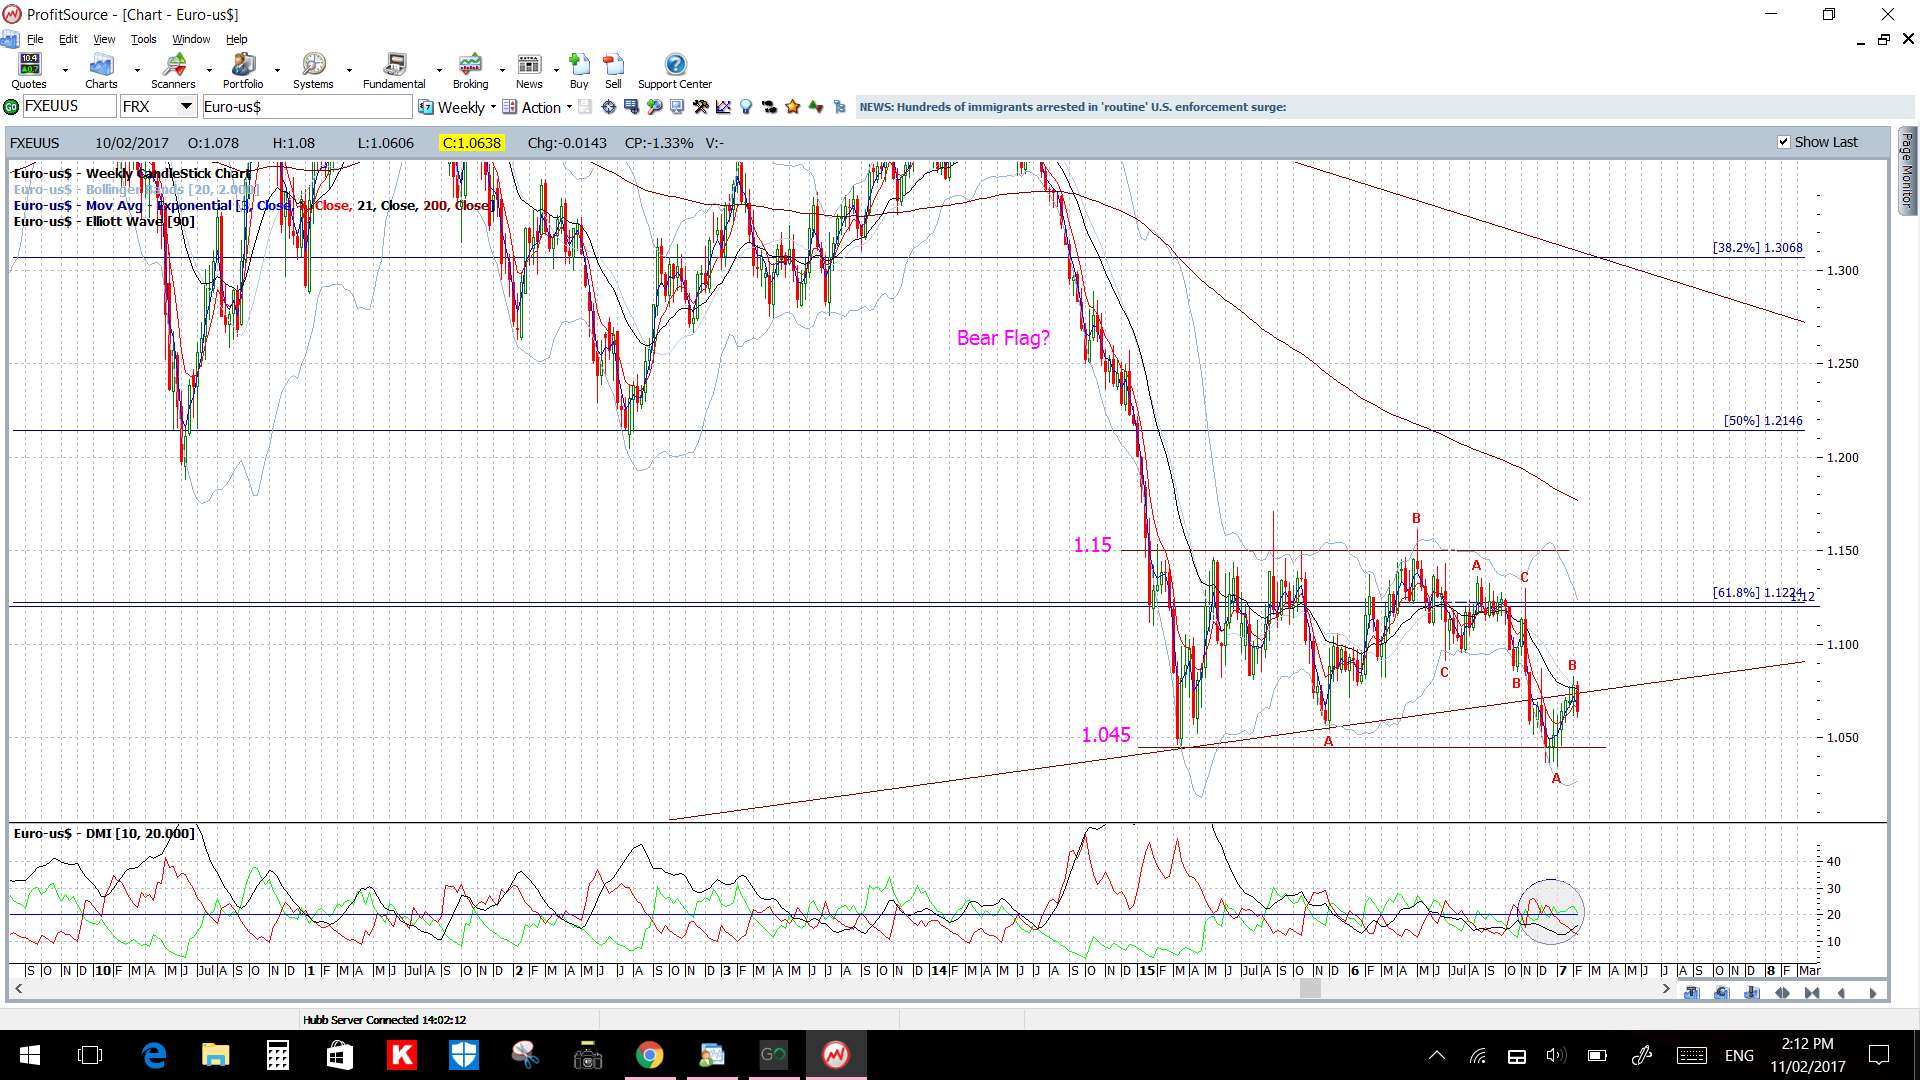
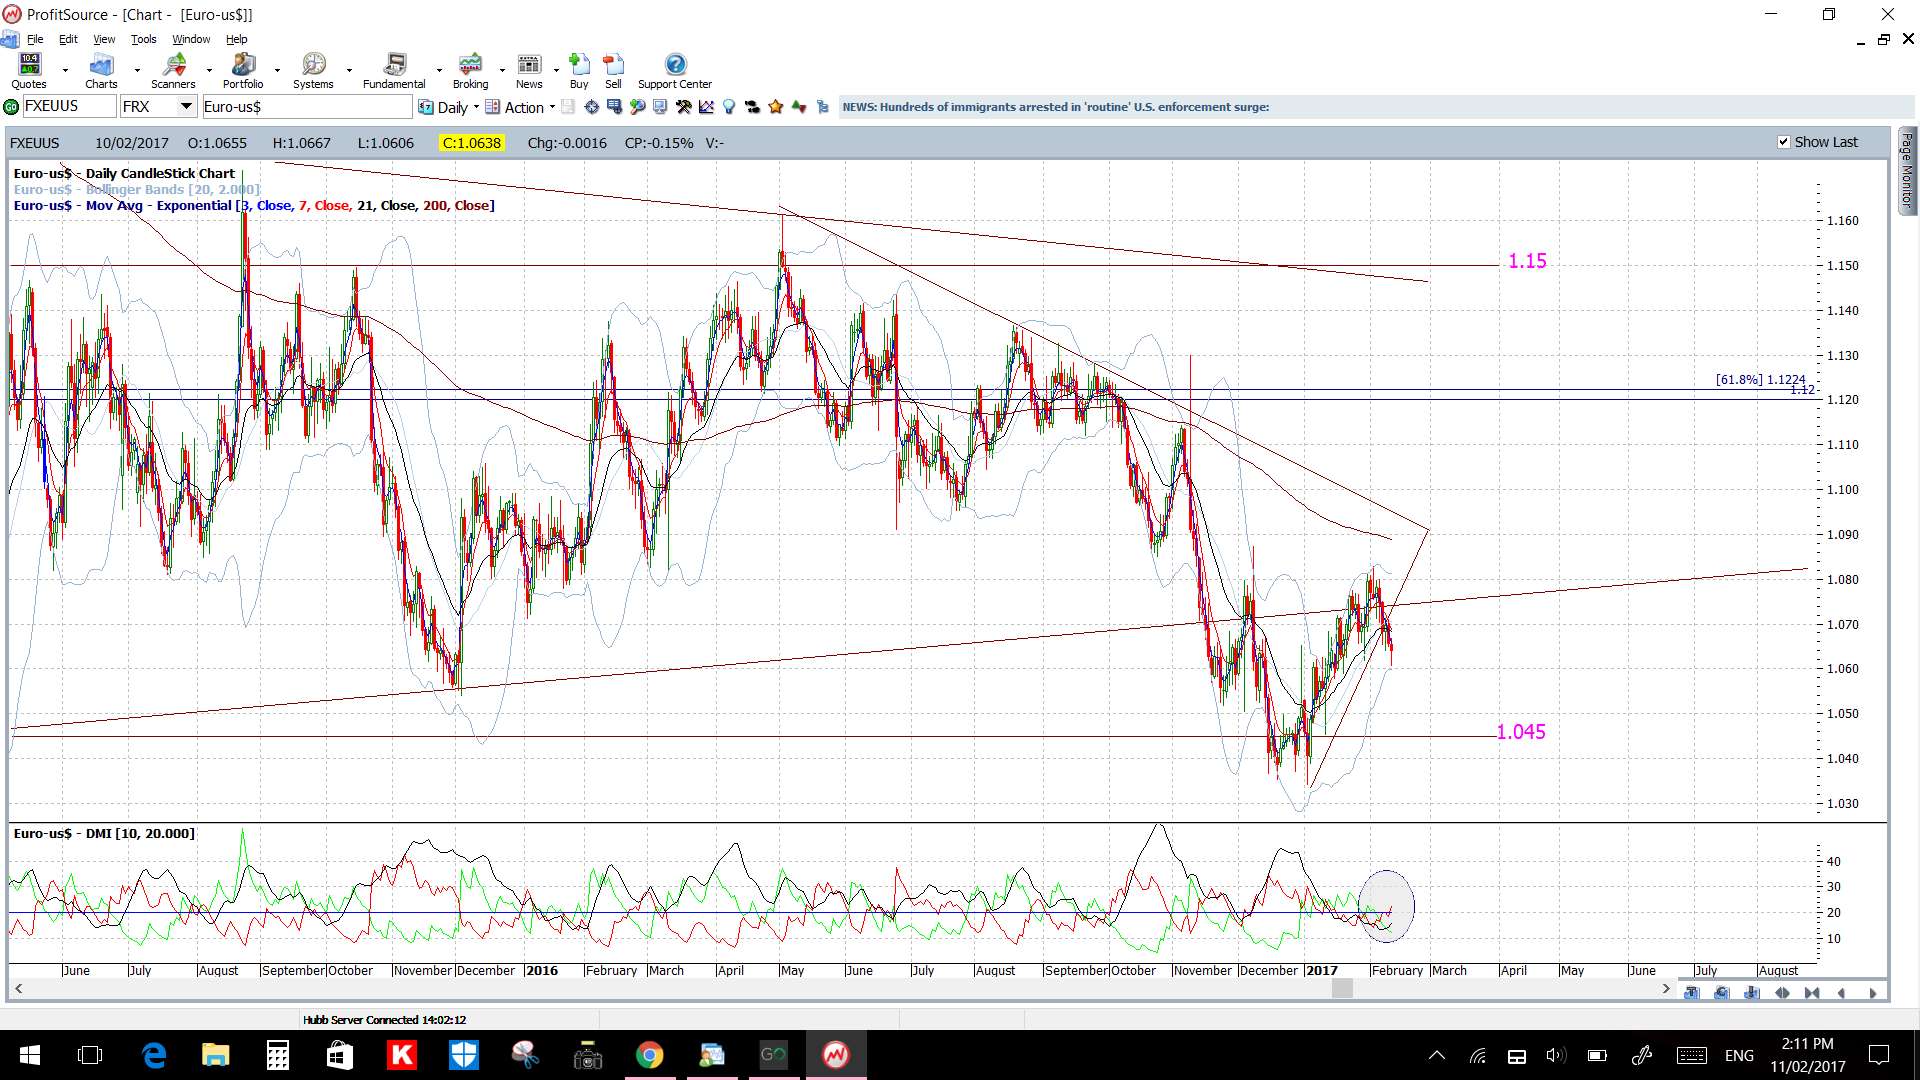
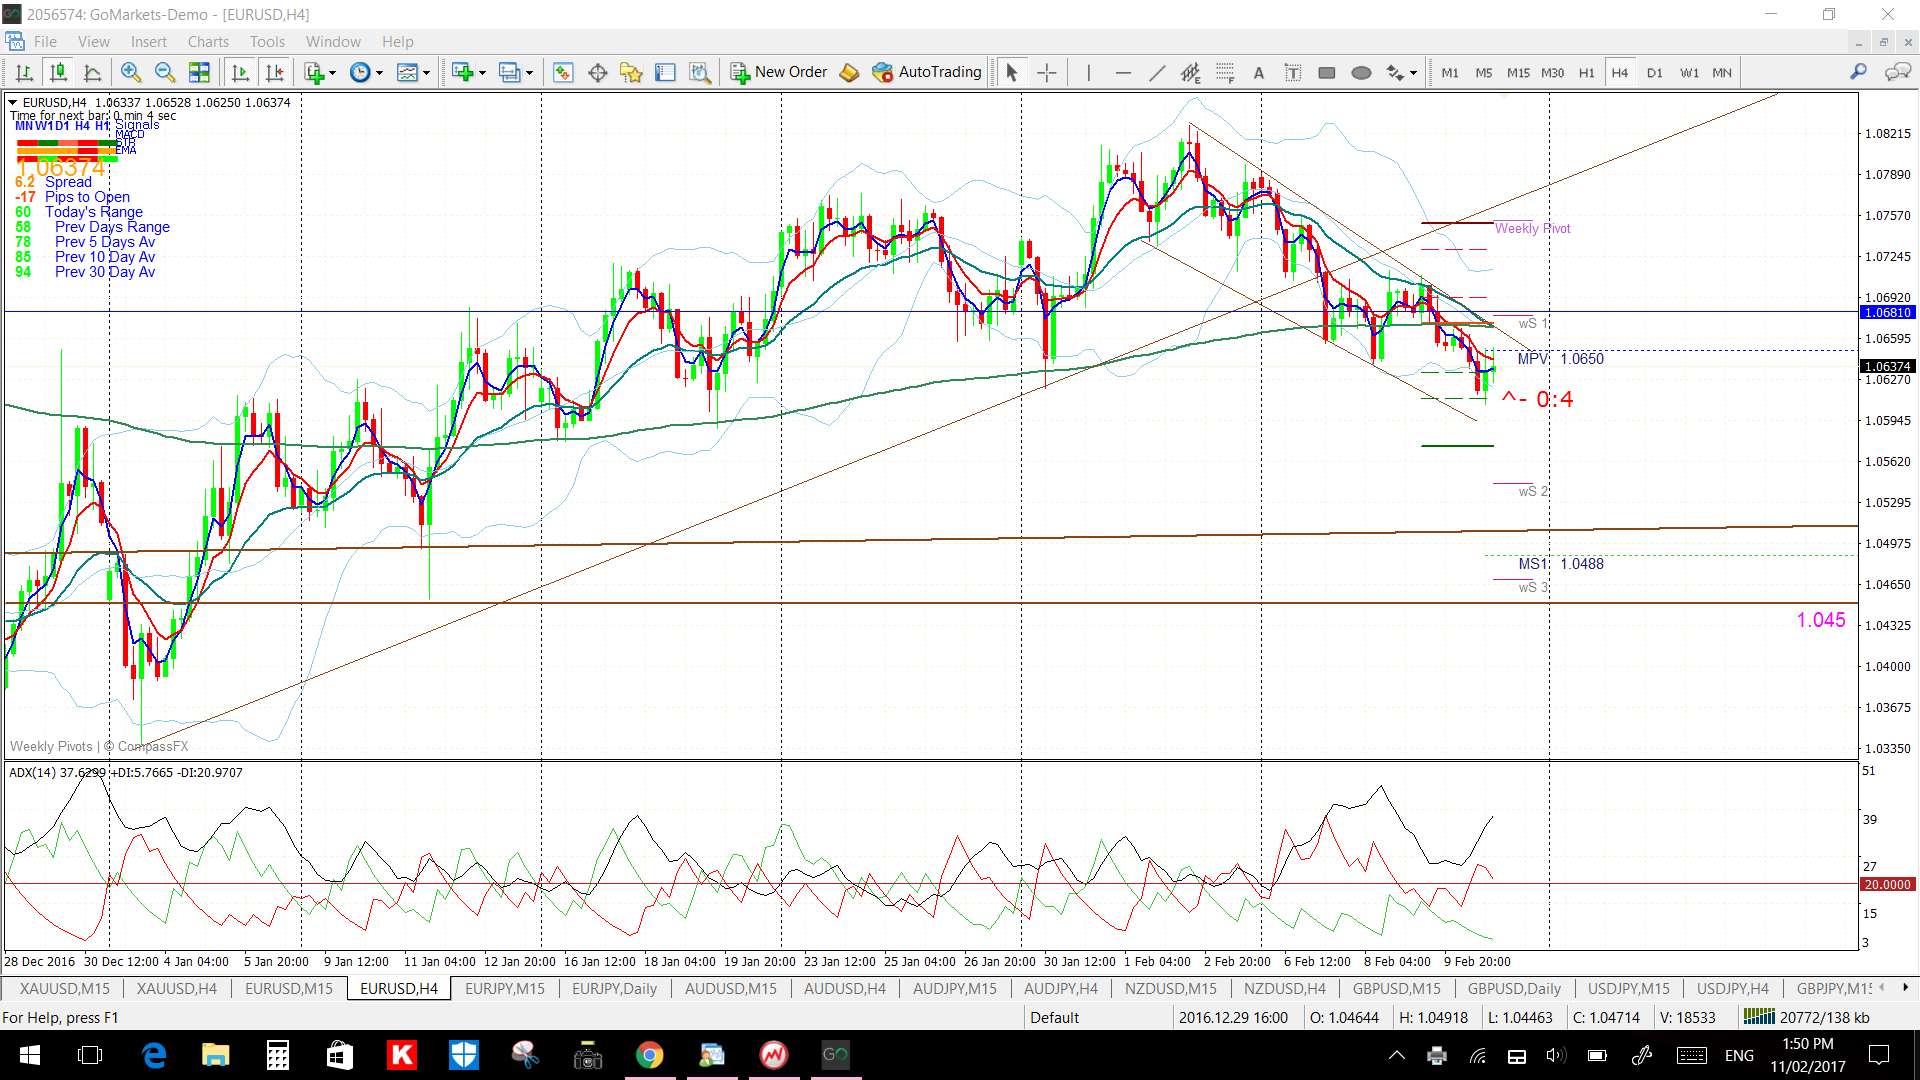
EUR/USD: A daily support trend line was broken last week but the pullback has formed up in what could evolve into a Bull Flag and so I’m watching these Flag trend lines for any make or break activity. Any bearish continuation might bring the SR level of 1.045 back into focus.
Price is below the 4hr Cloud but in the daily Cloud.
The weekly candle was bearish.
The only high impact EUR data this week is from German GDP, although there is a lot of second-tier data, but watch also for impact from all of the US data items.
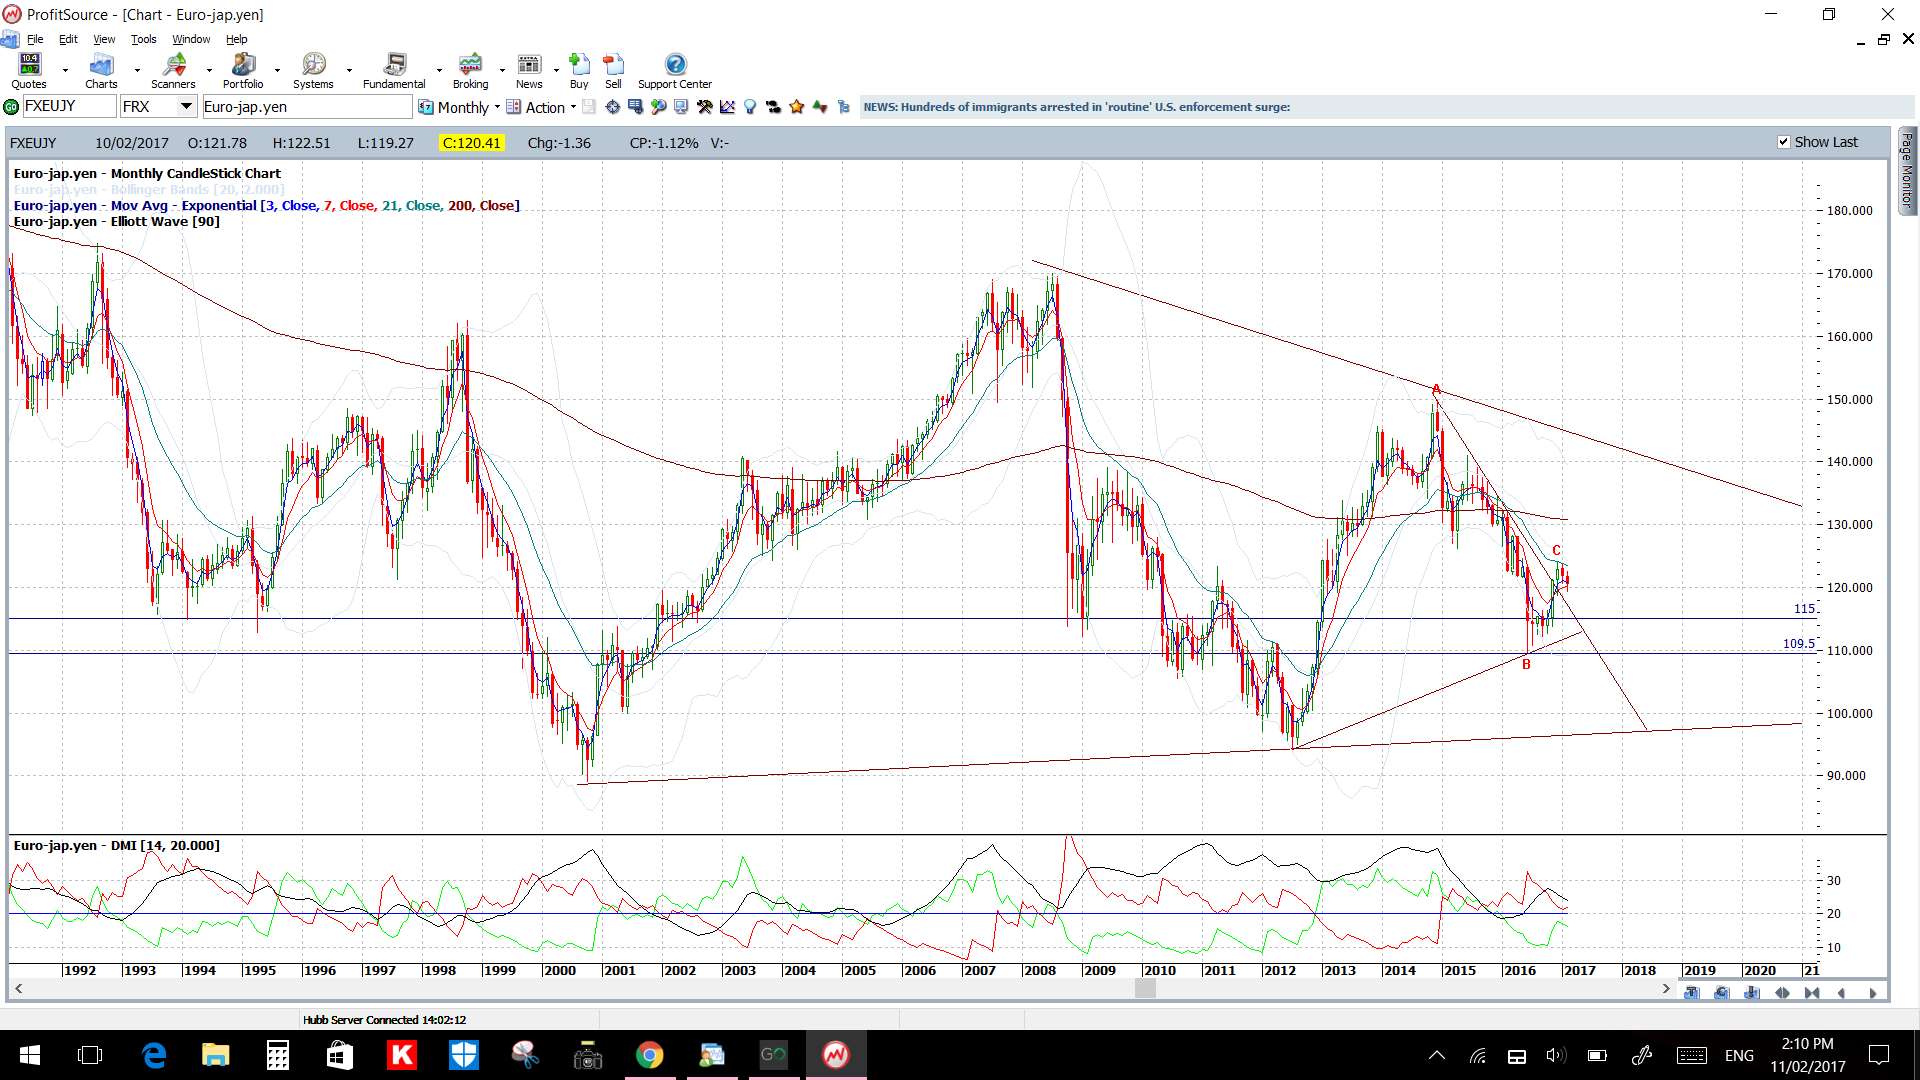
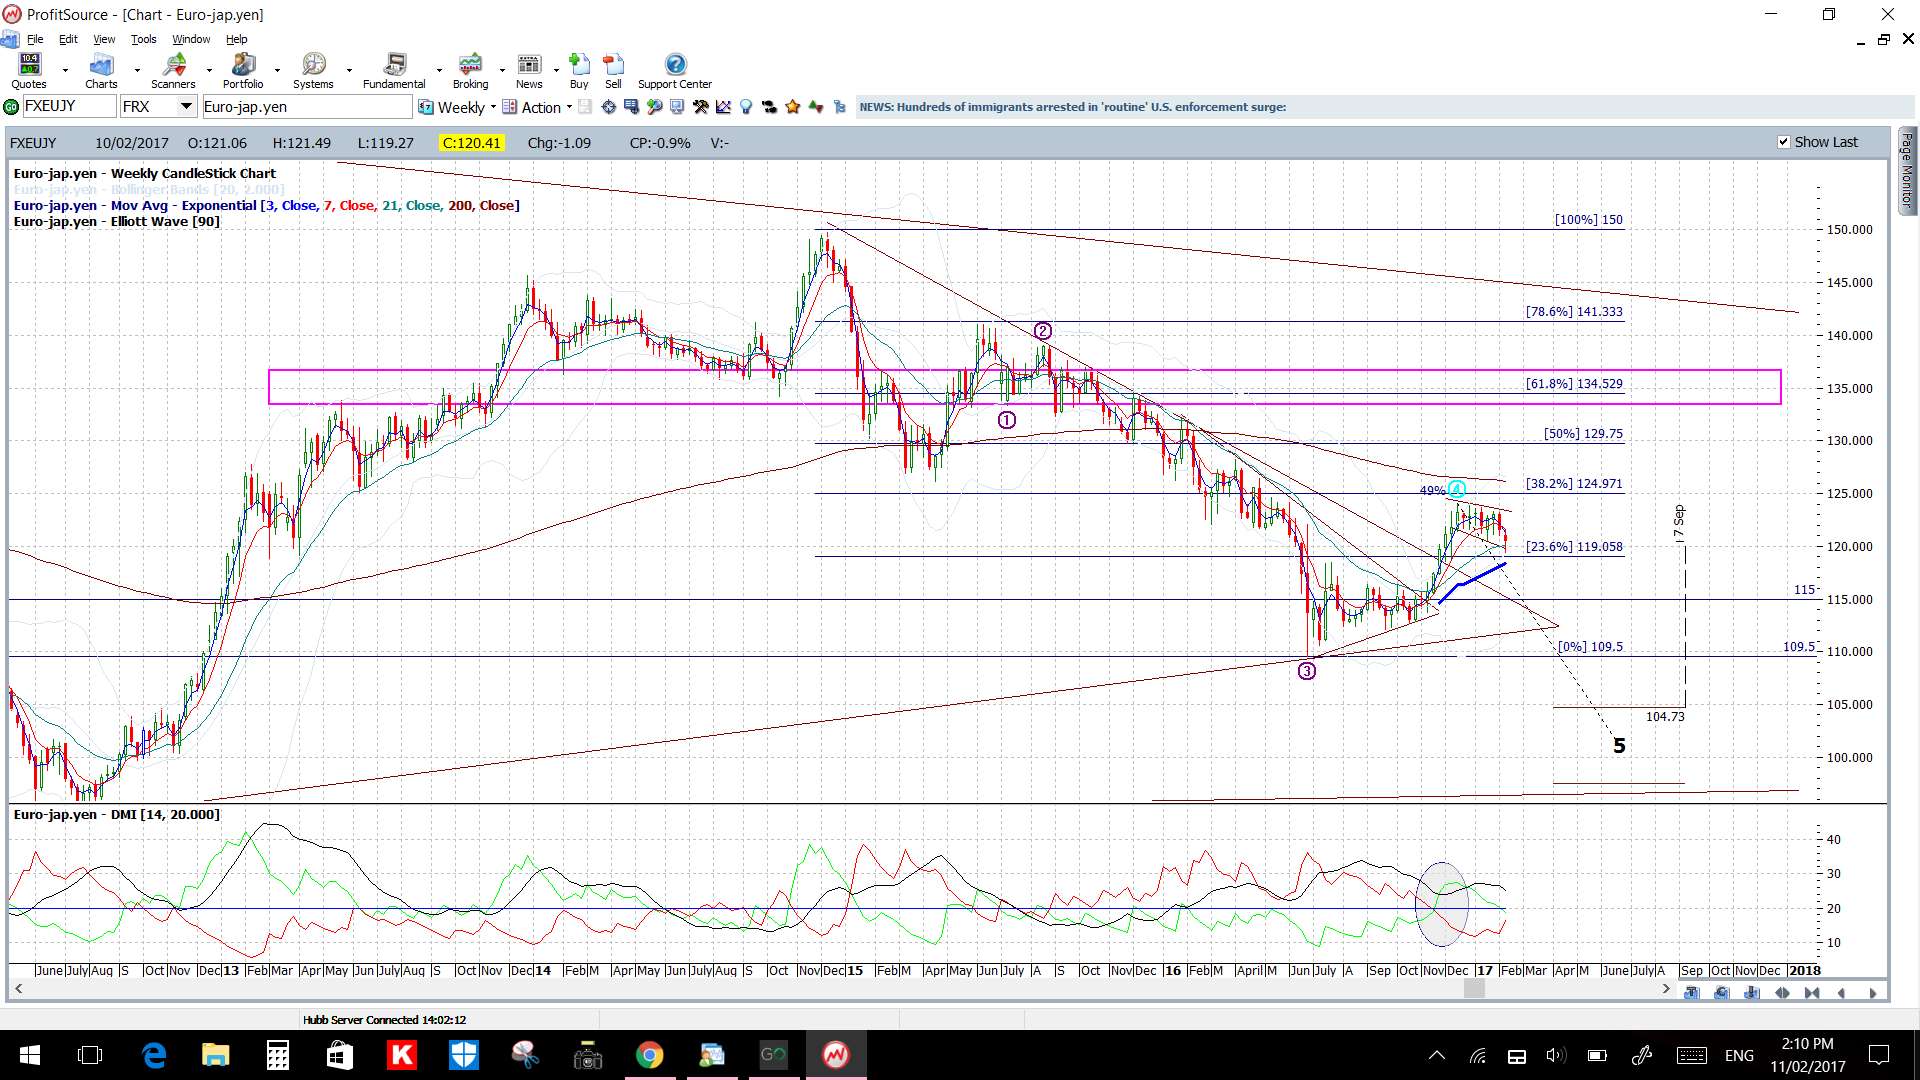
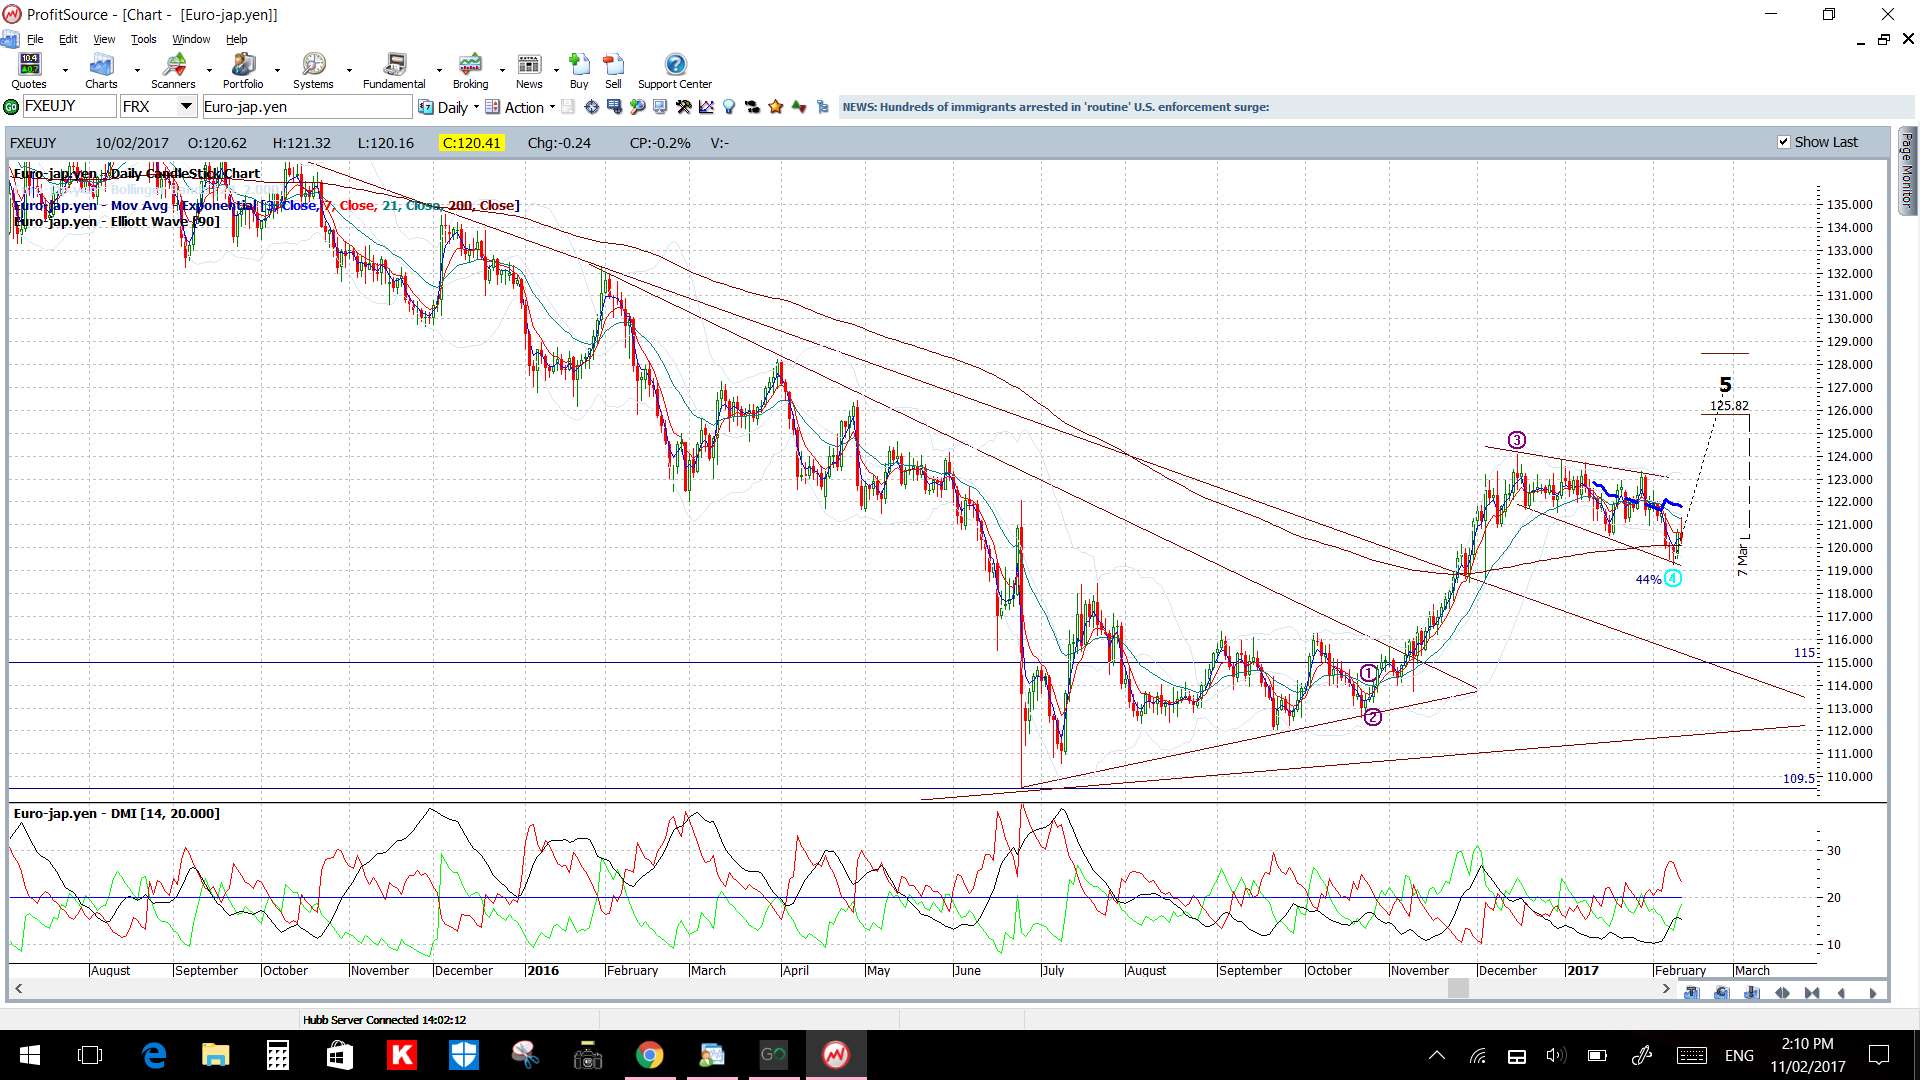
EUR/JPY: This pair seems a bit messy to me; it had looked like a Flag was breaking down but there wasn’t much in the move. Thus, I’ve adjusted the trend lines but I’m not overly confident with anything here right now.
Price is below the 4hr Cloud but in both the daily and weekly Cloud so my unease seems validated!
The weekly candle was bearish.
The only high impact EUR data this week is from German GDP and there is JPY Prelim GDP but watch also for impact from all of the US data items.
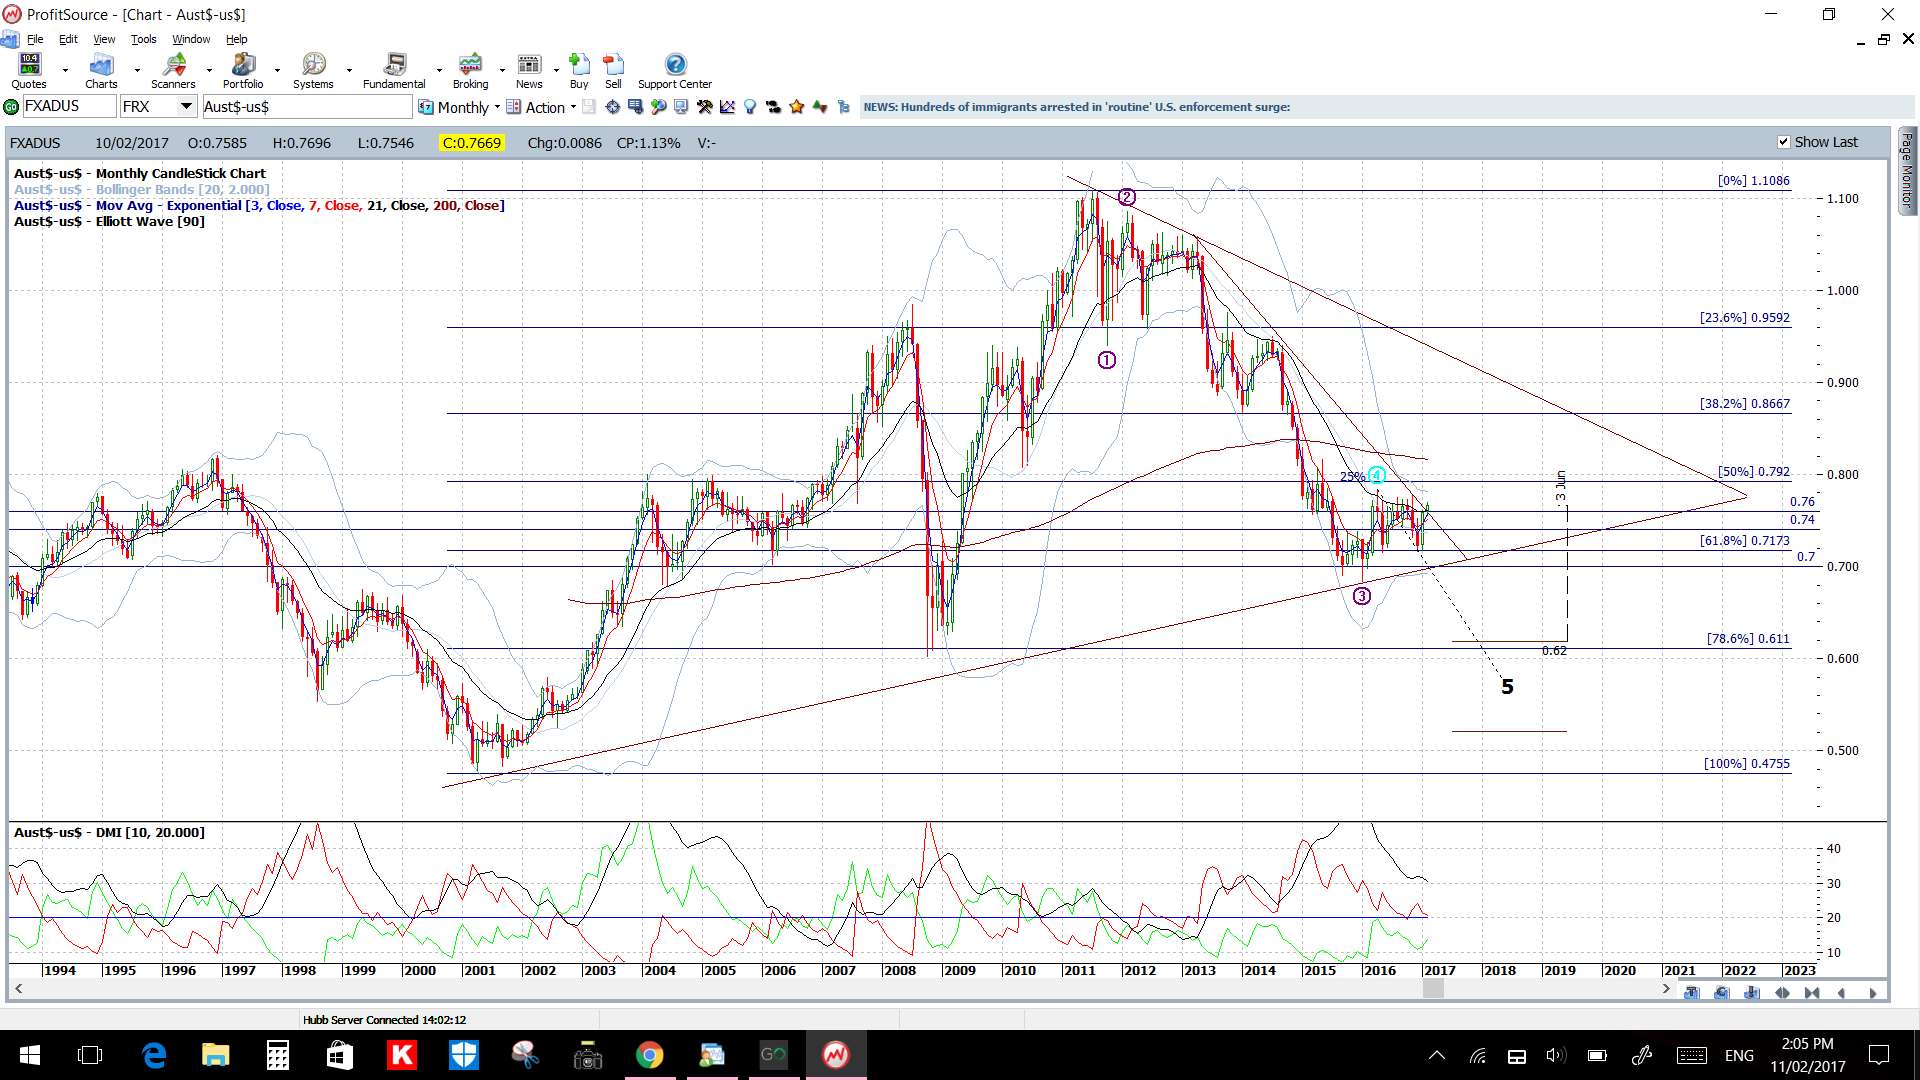
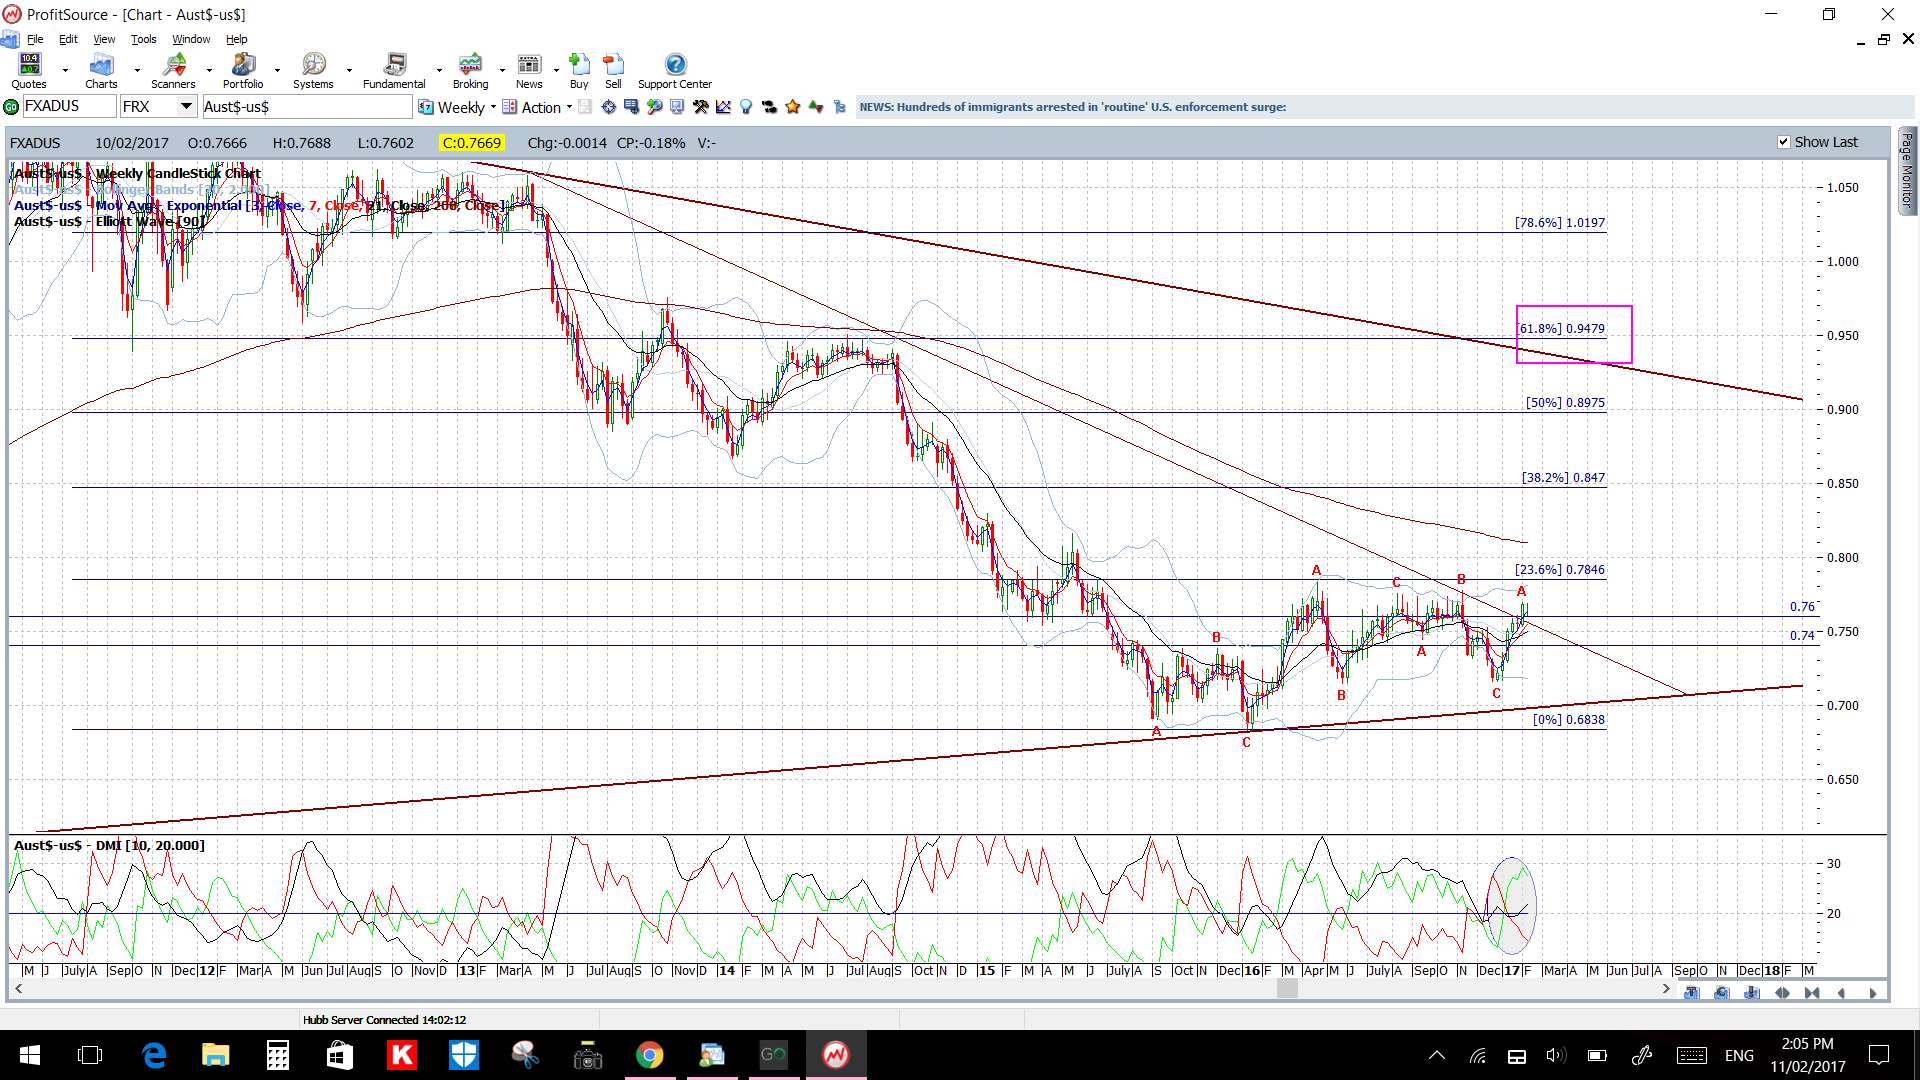
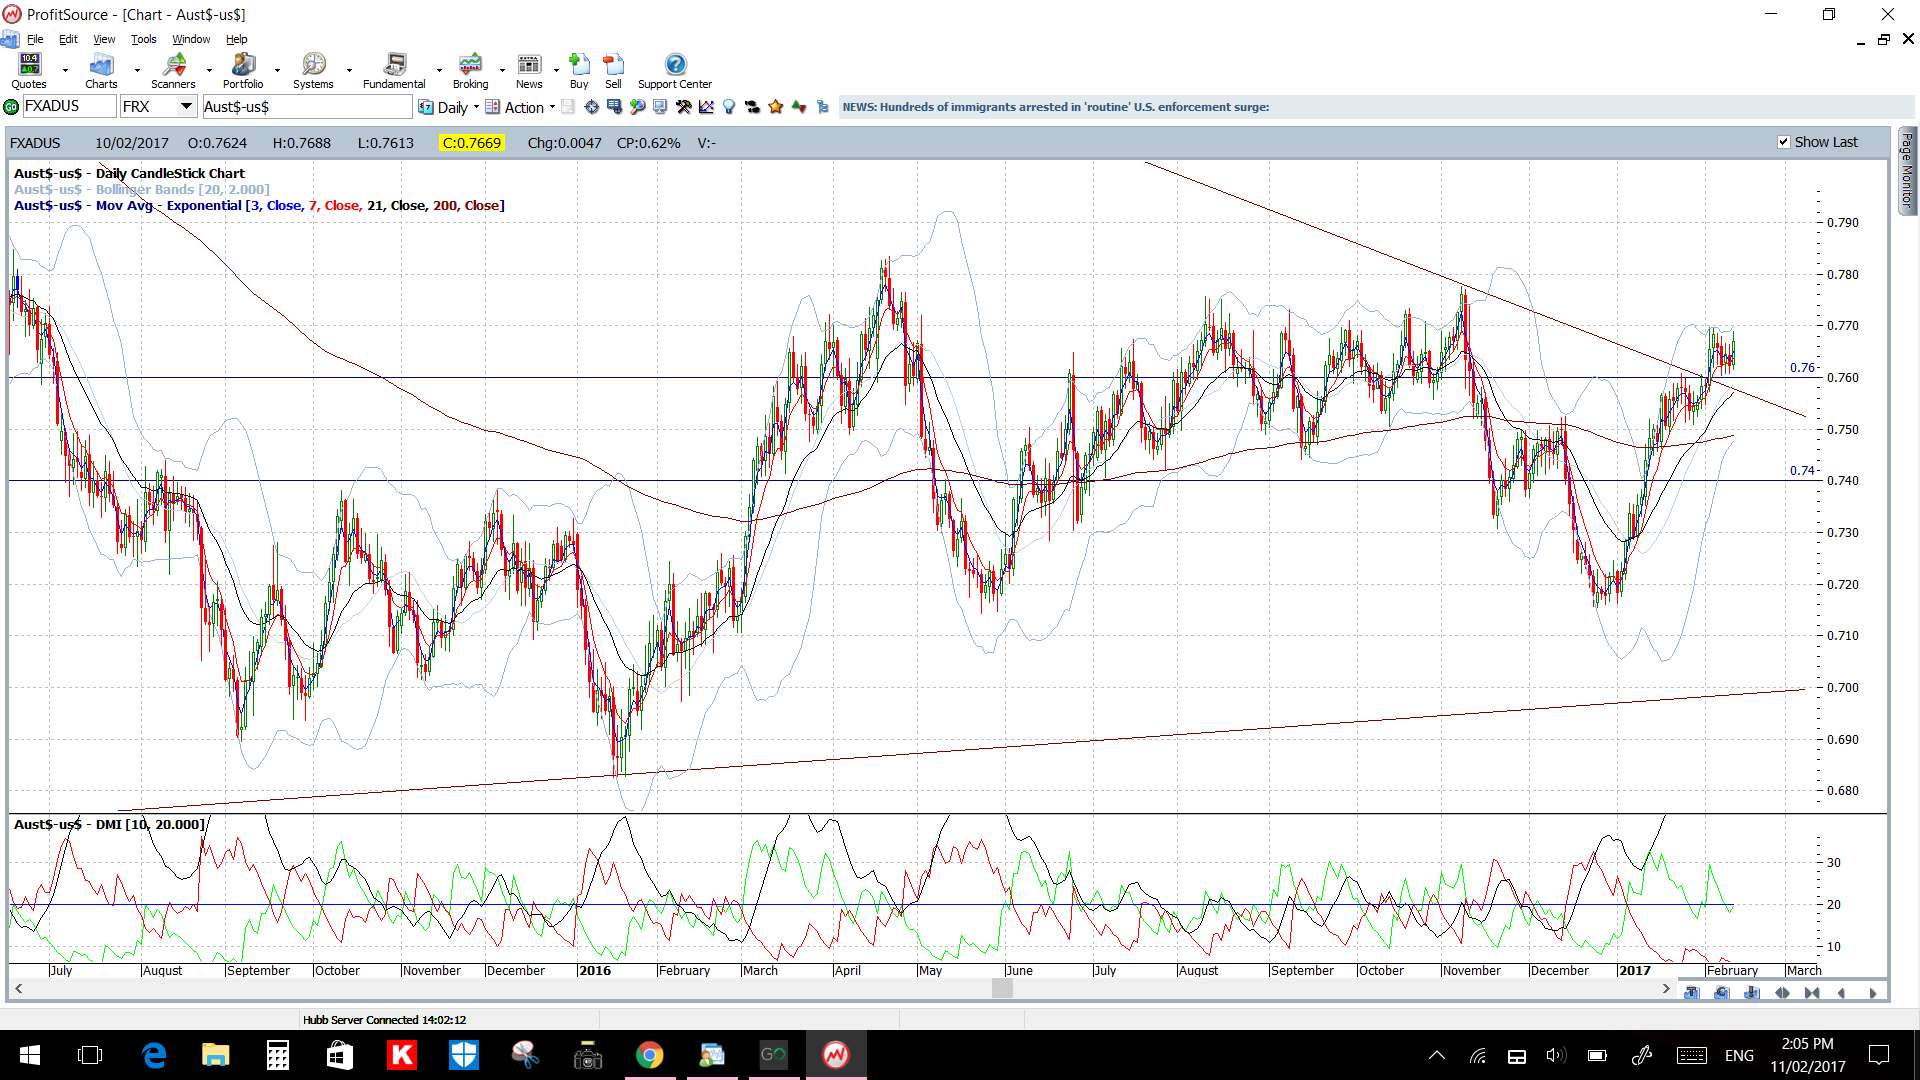
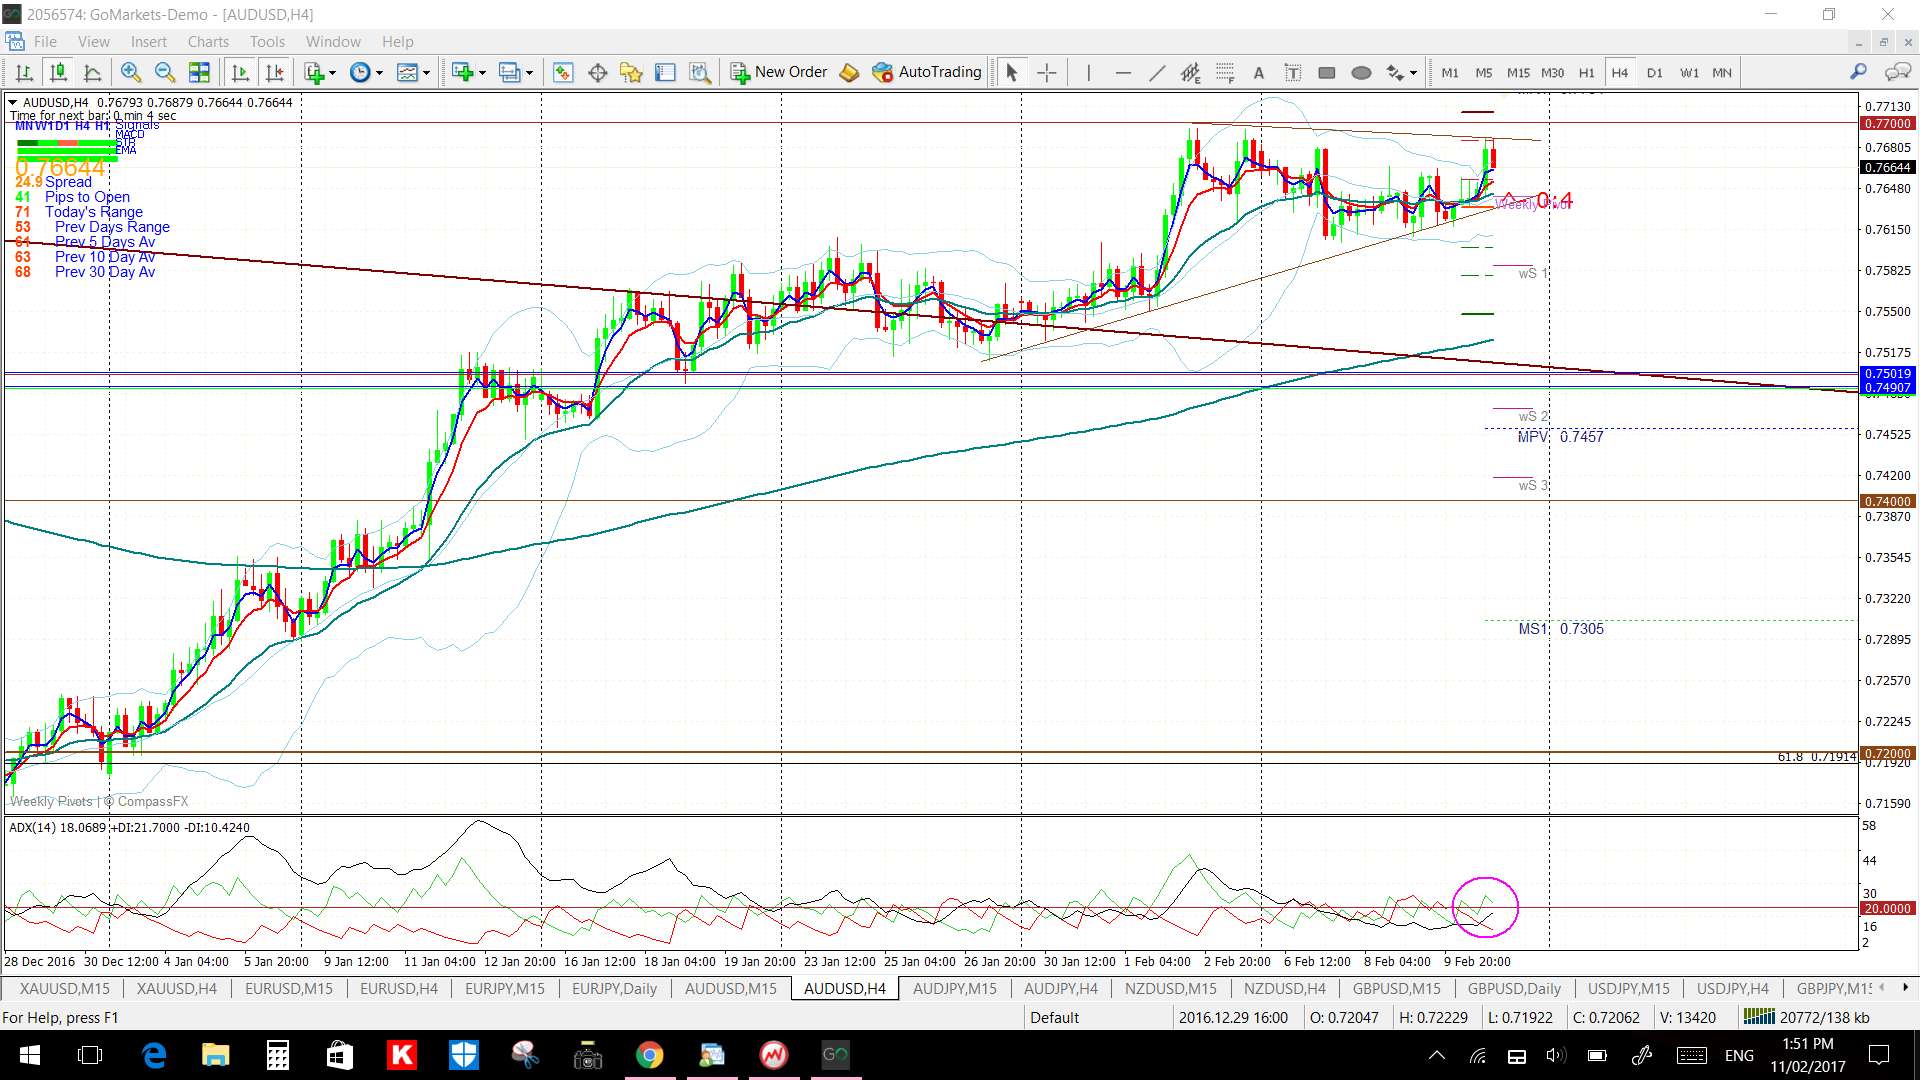
AUD/USD: The Aussie continues to consolidate under the 0.77 S/R level and this remains the one to watch next week for any make or break activity.
The Aussie is above the 4hr, daily and weekly Cloud but closed with a bearish coloured indecision-style Doji.
The only high impact AUD data next week is AUD Employment data on Thursday but keep an eye on all of the US data and CNY CPI as well.
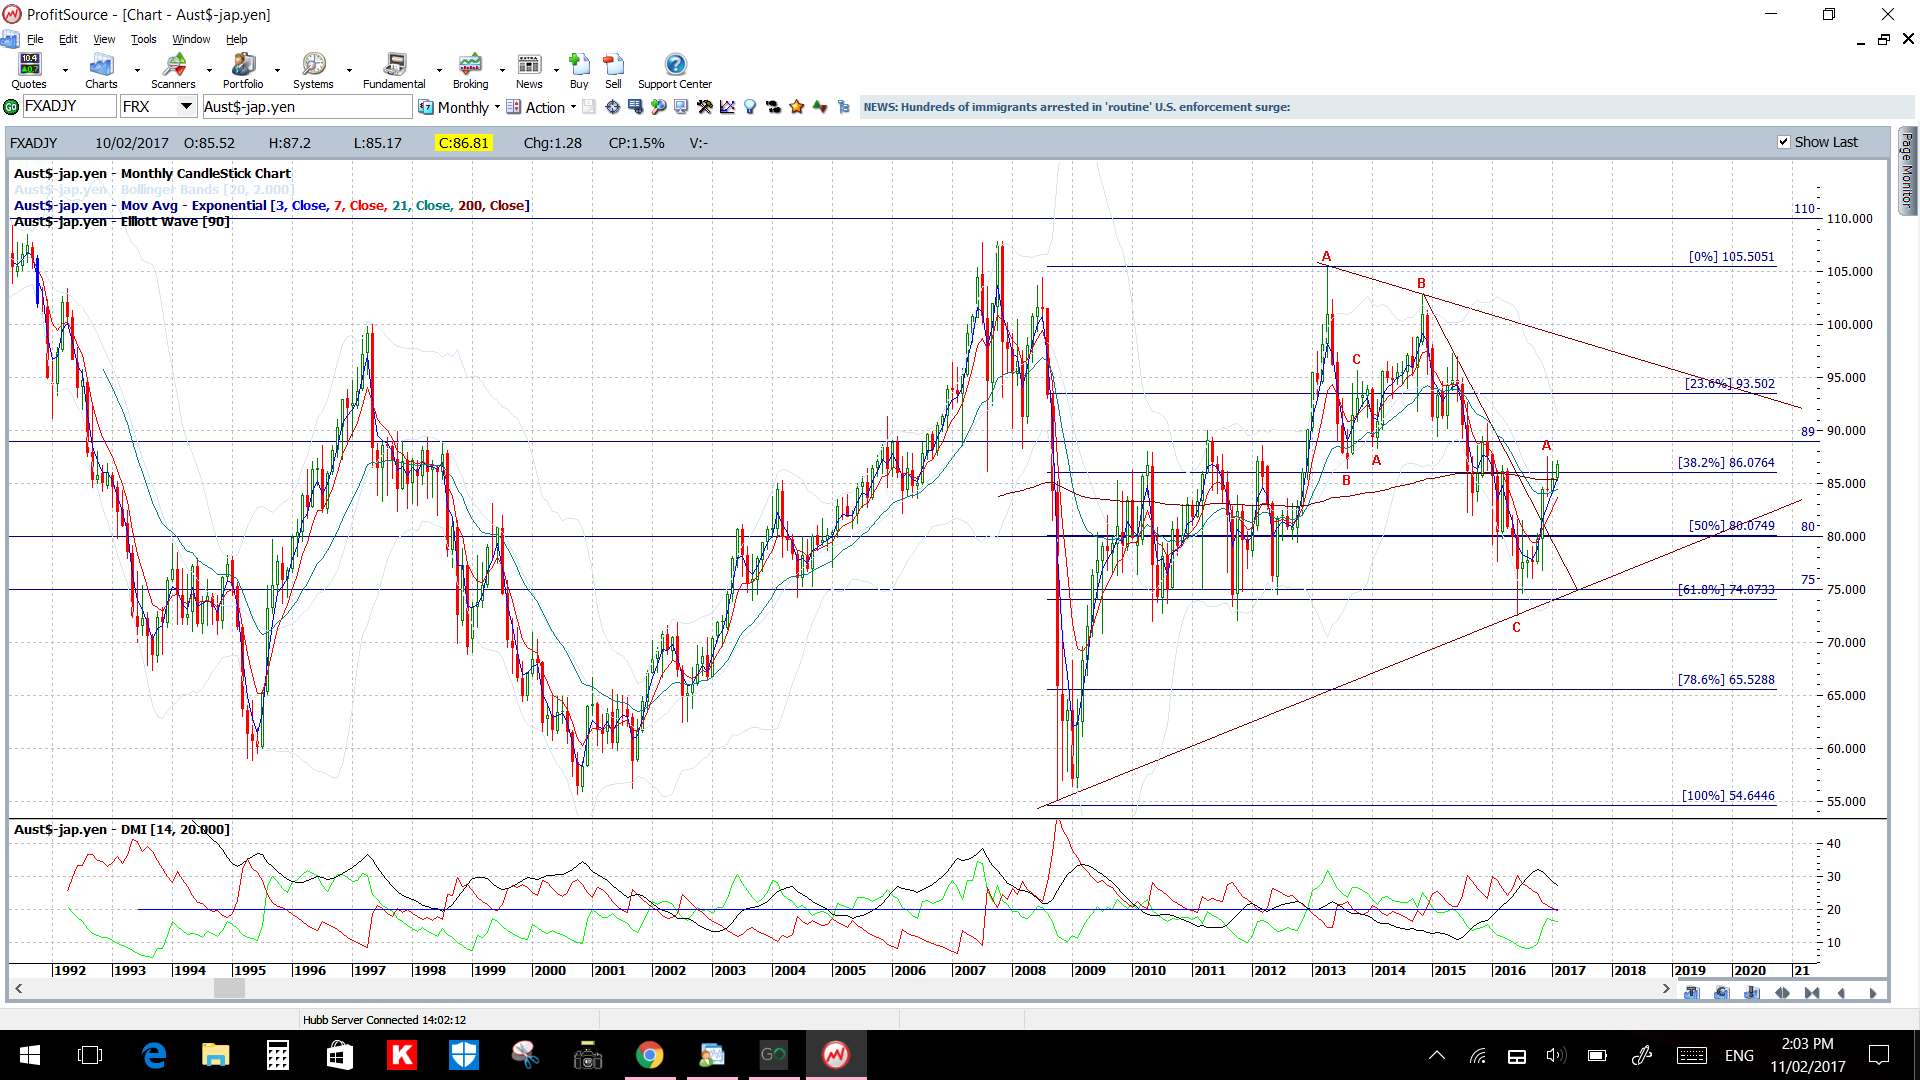
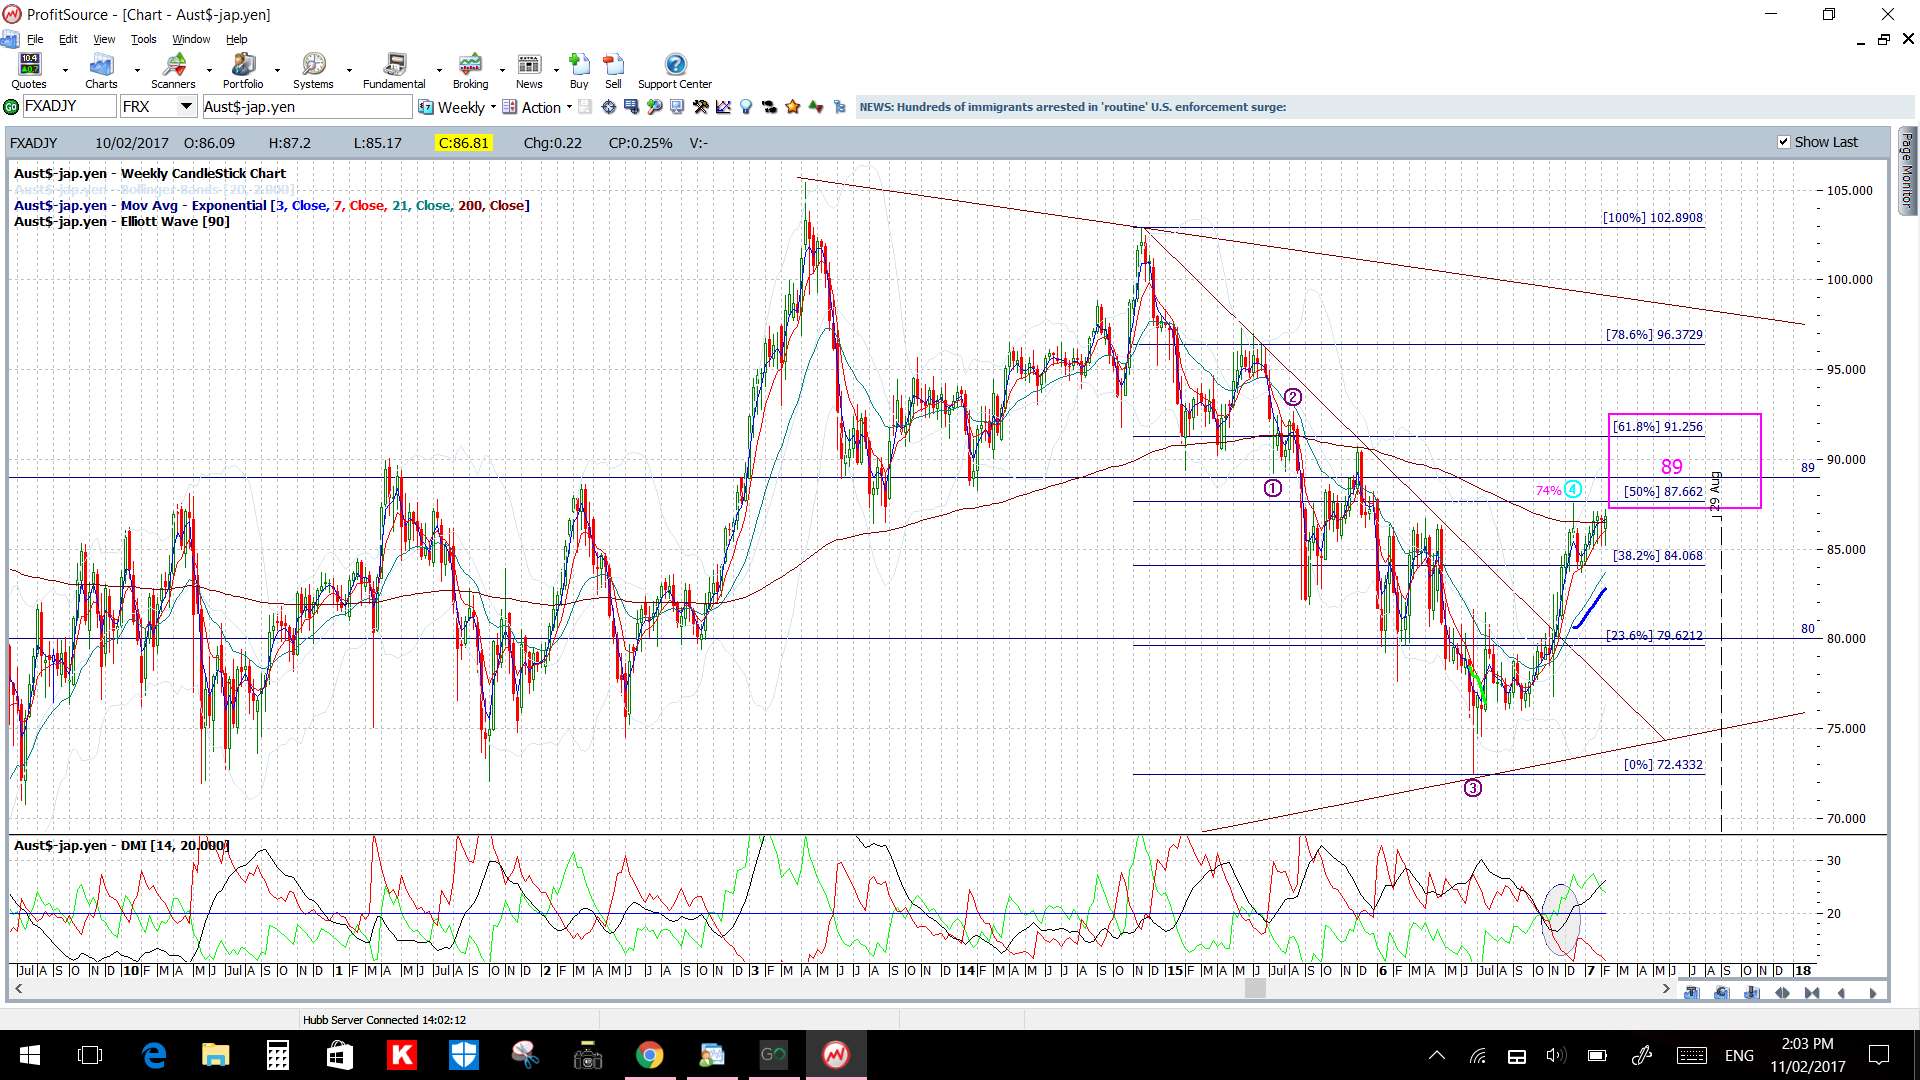
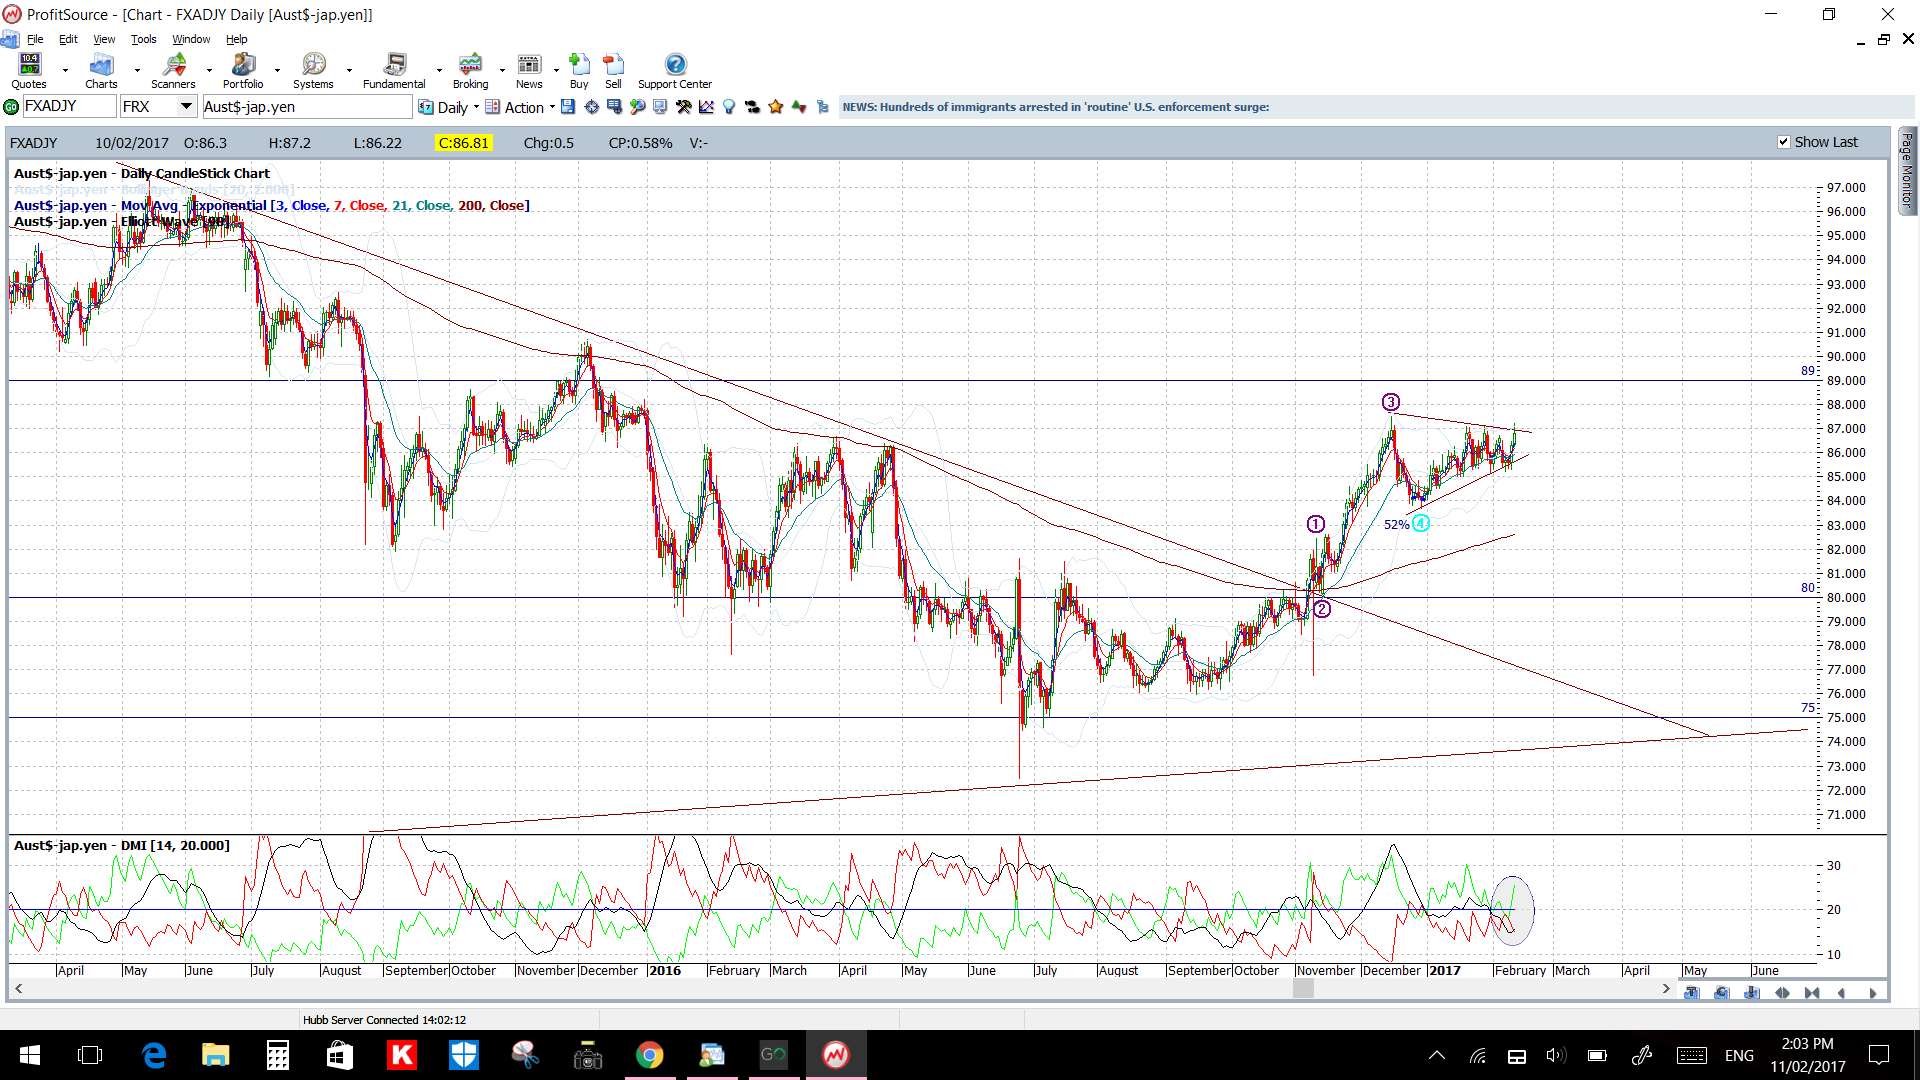
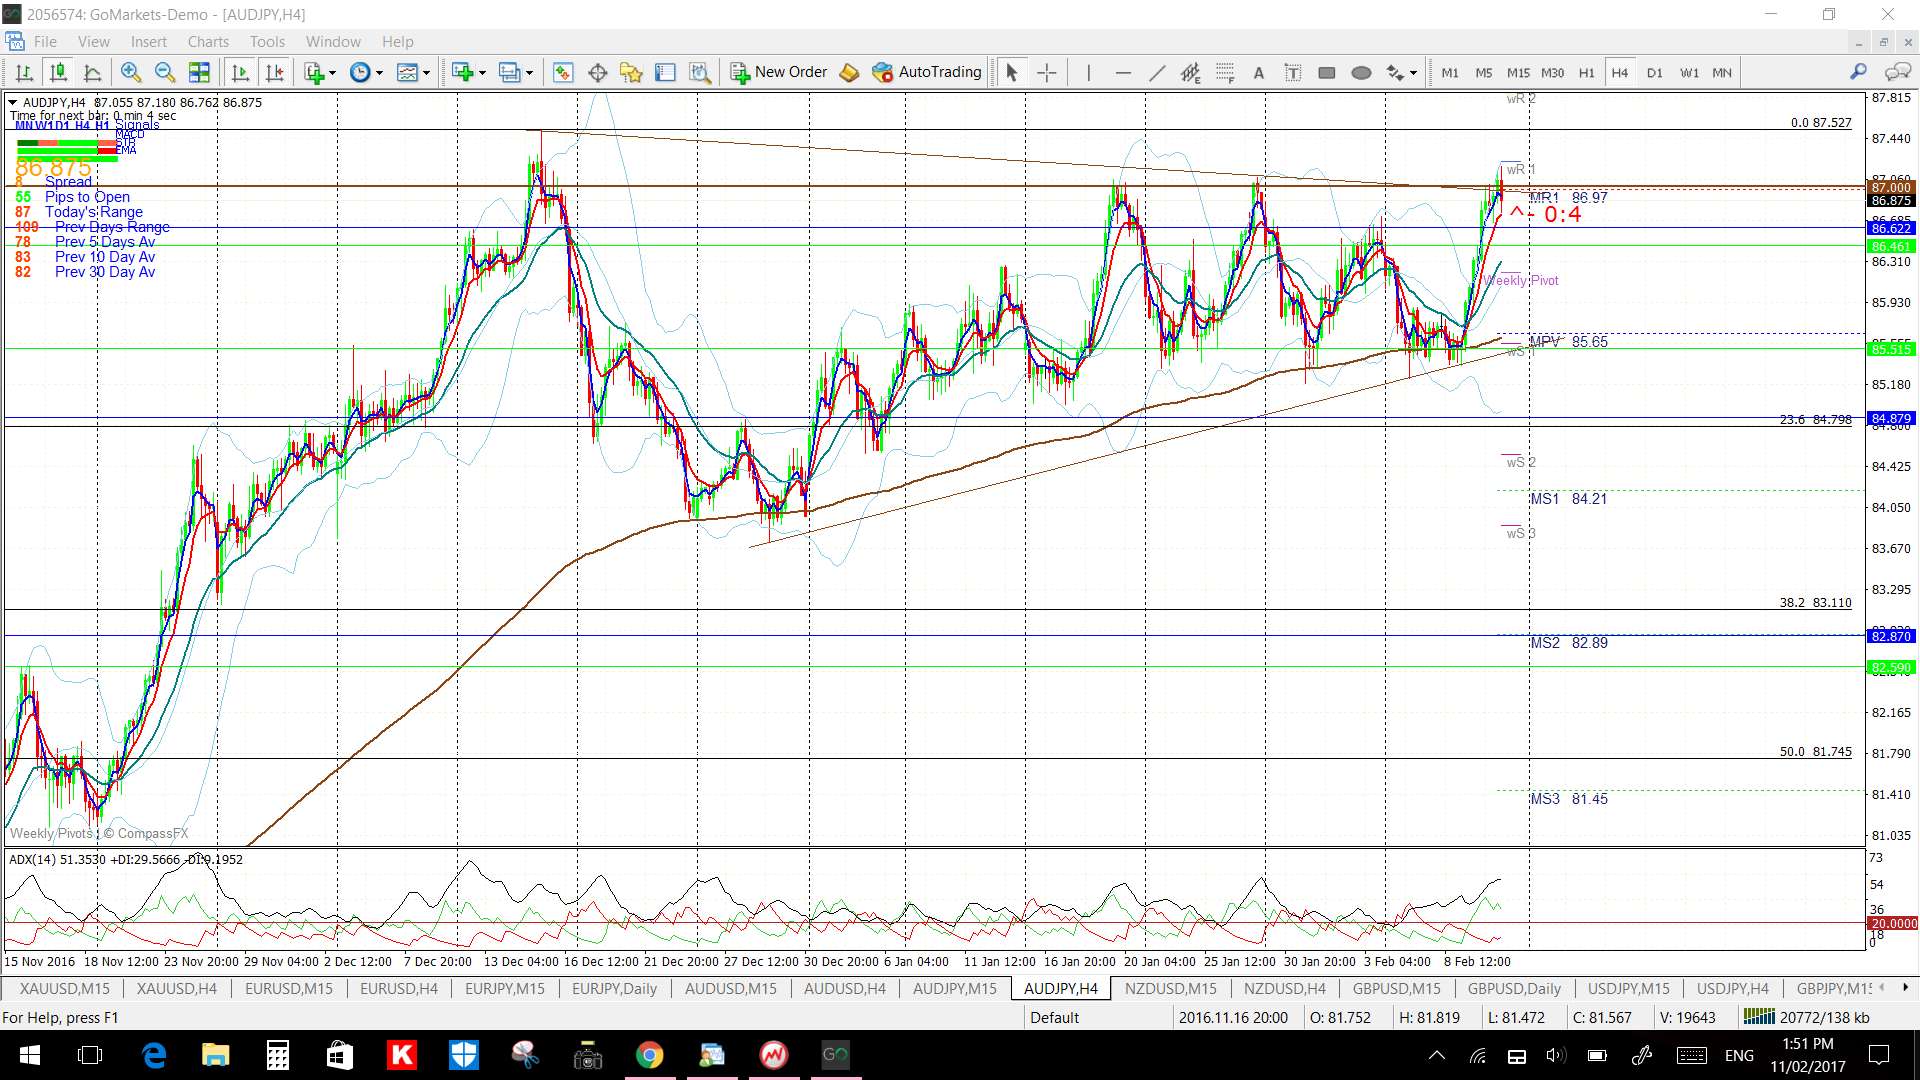
AUD/JPY: The AUD/JPY has been consolidating within a triangle under the 87 level for the last 10 weeks. It took a peek over this level late last week but dipped back below for the weekly close. The 87 remains in focus next week and, after that, the 89 might come under scrutiny again. The latter being a long-term S/R level best seen on the monthly chart although it has been in focus on my weekly chart for some time as well given it’s the 61.8% fib of the last swing low move.
Keep an eye on the 87 and 89 levels next week especially if stocks continue to remains strong as the A/Y is closely correlated to the S&P500.
The A/J is above the 4hr, daily and weekly Cloud and closed with a bullish, almost engulfing’, weekly candle.
The only high impact AUD data next week is AUD Employment data on Thursday but keep an eye on all of the US data and CNY CPI as well.
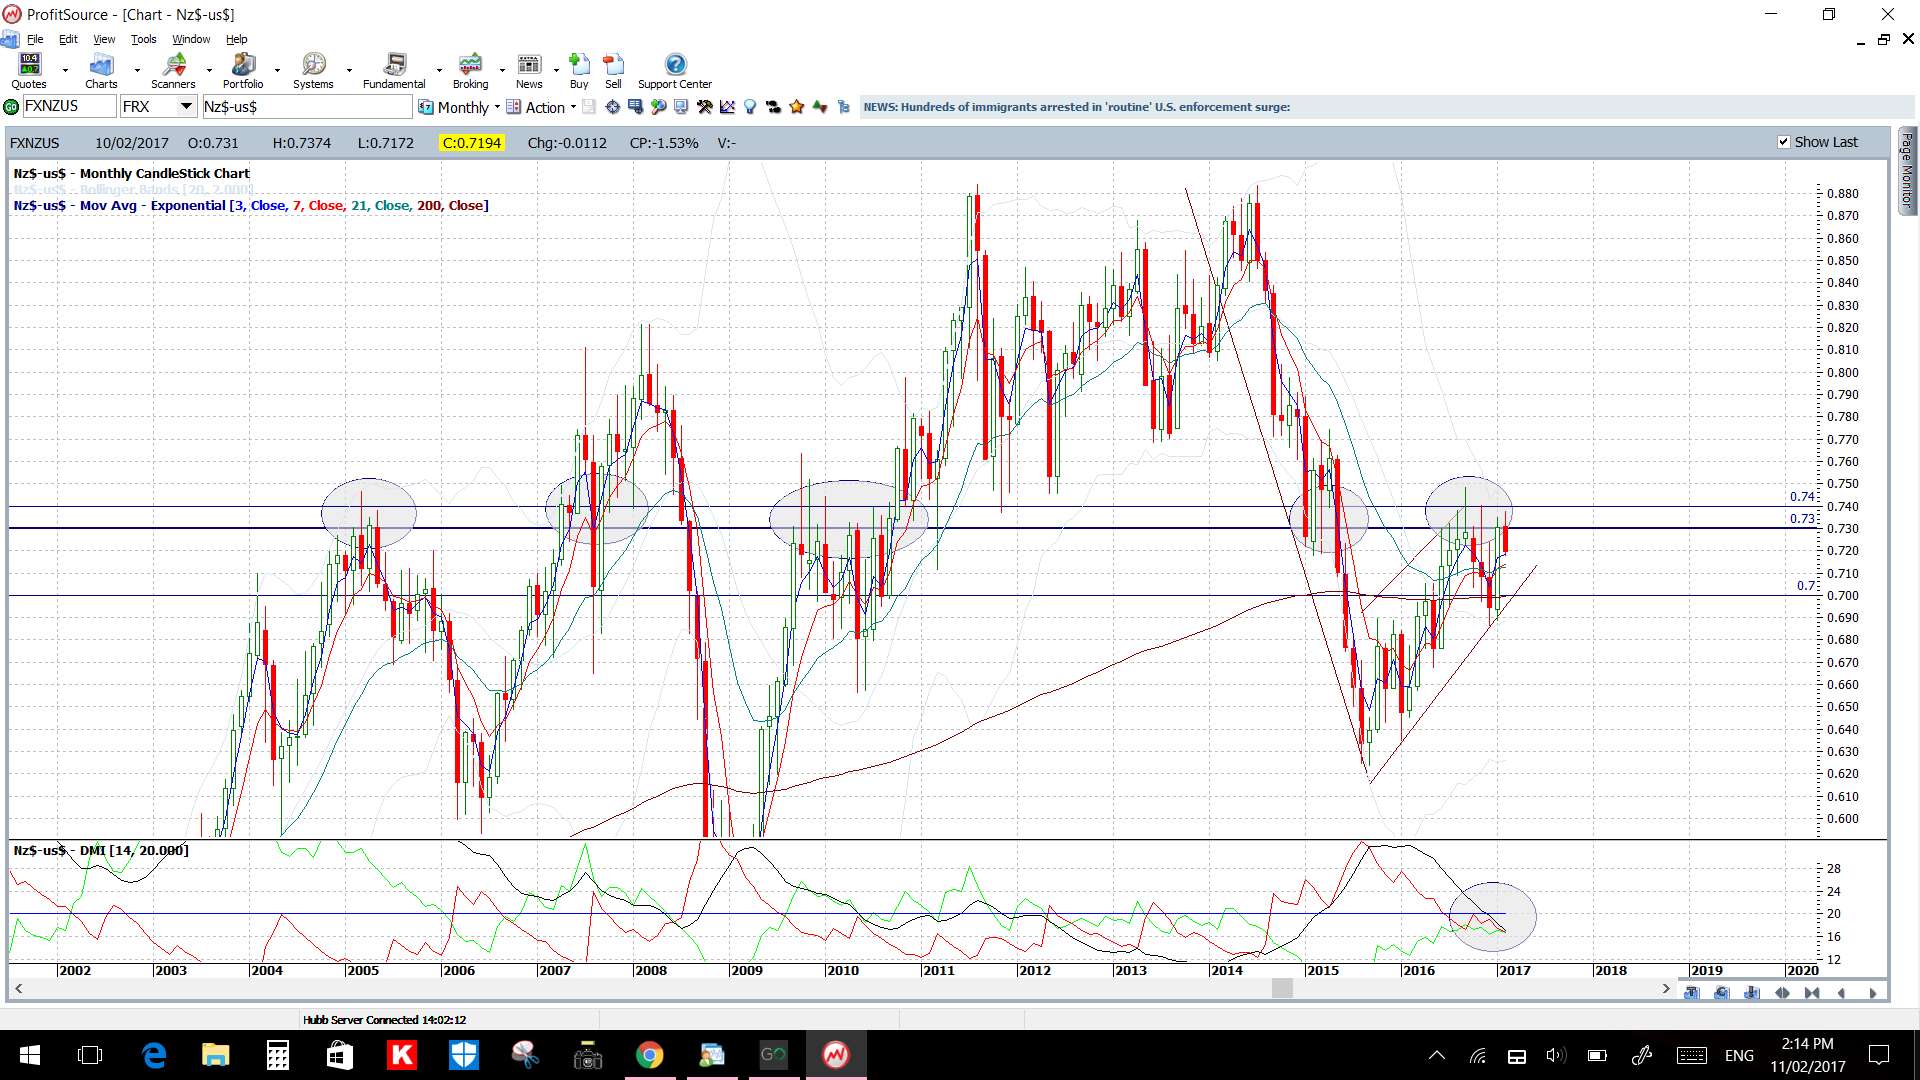
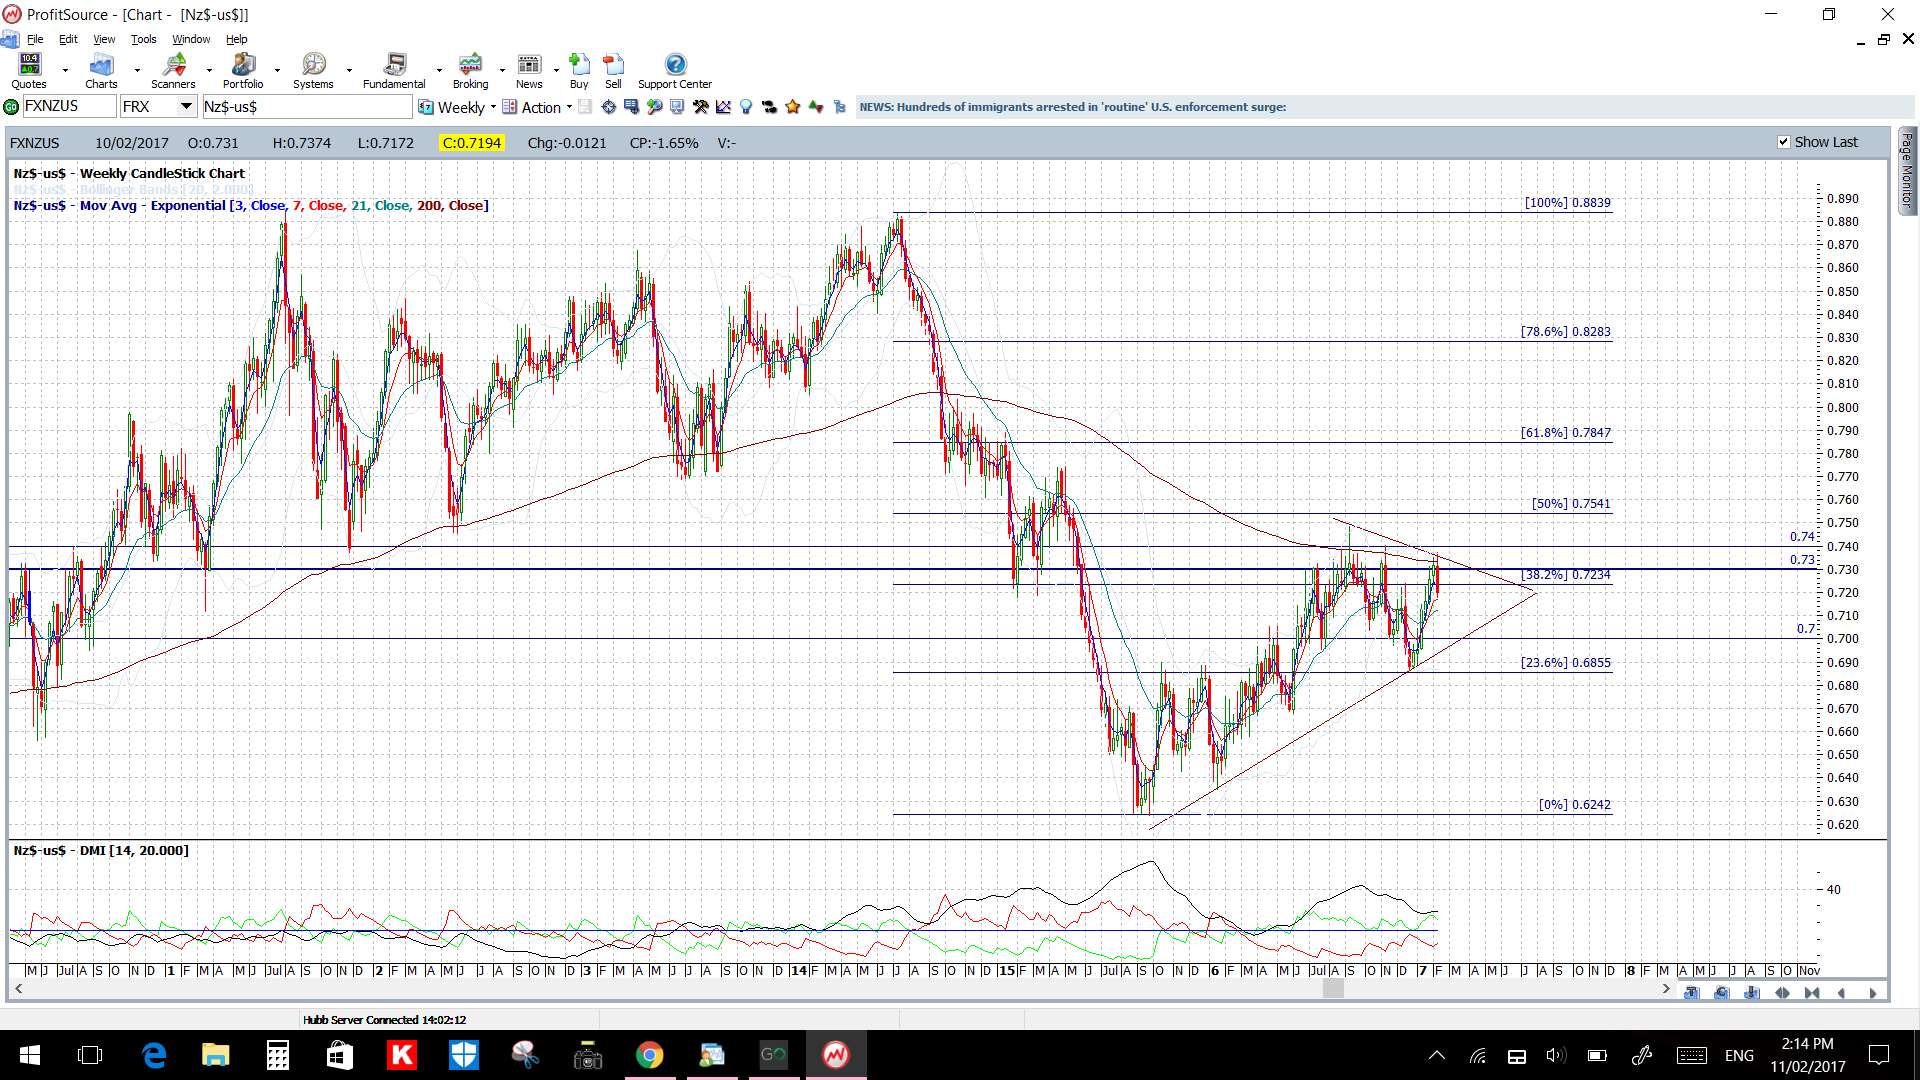
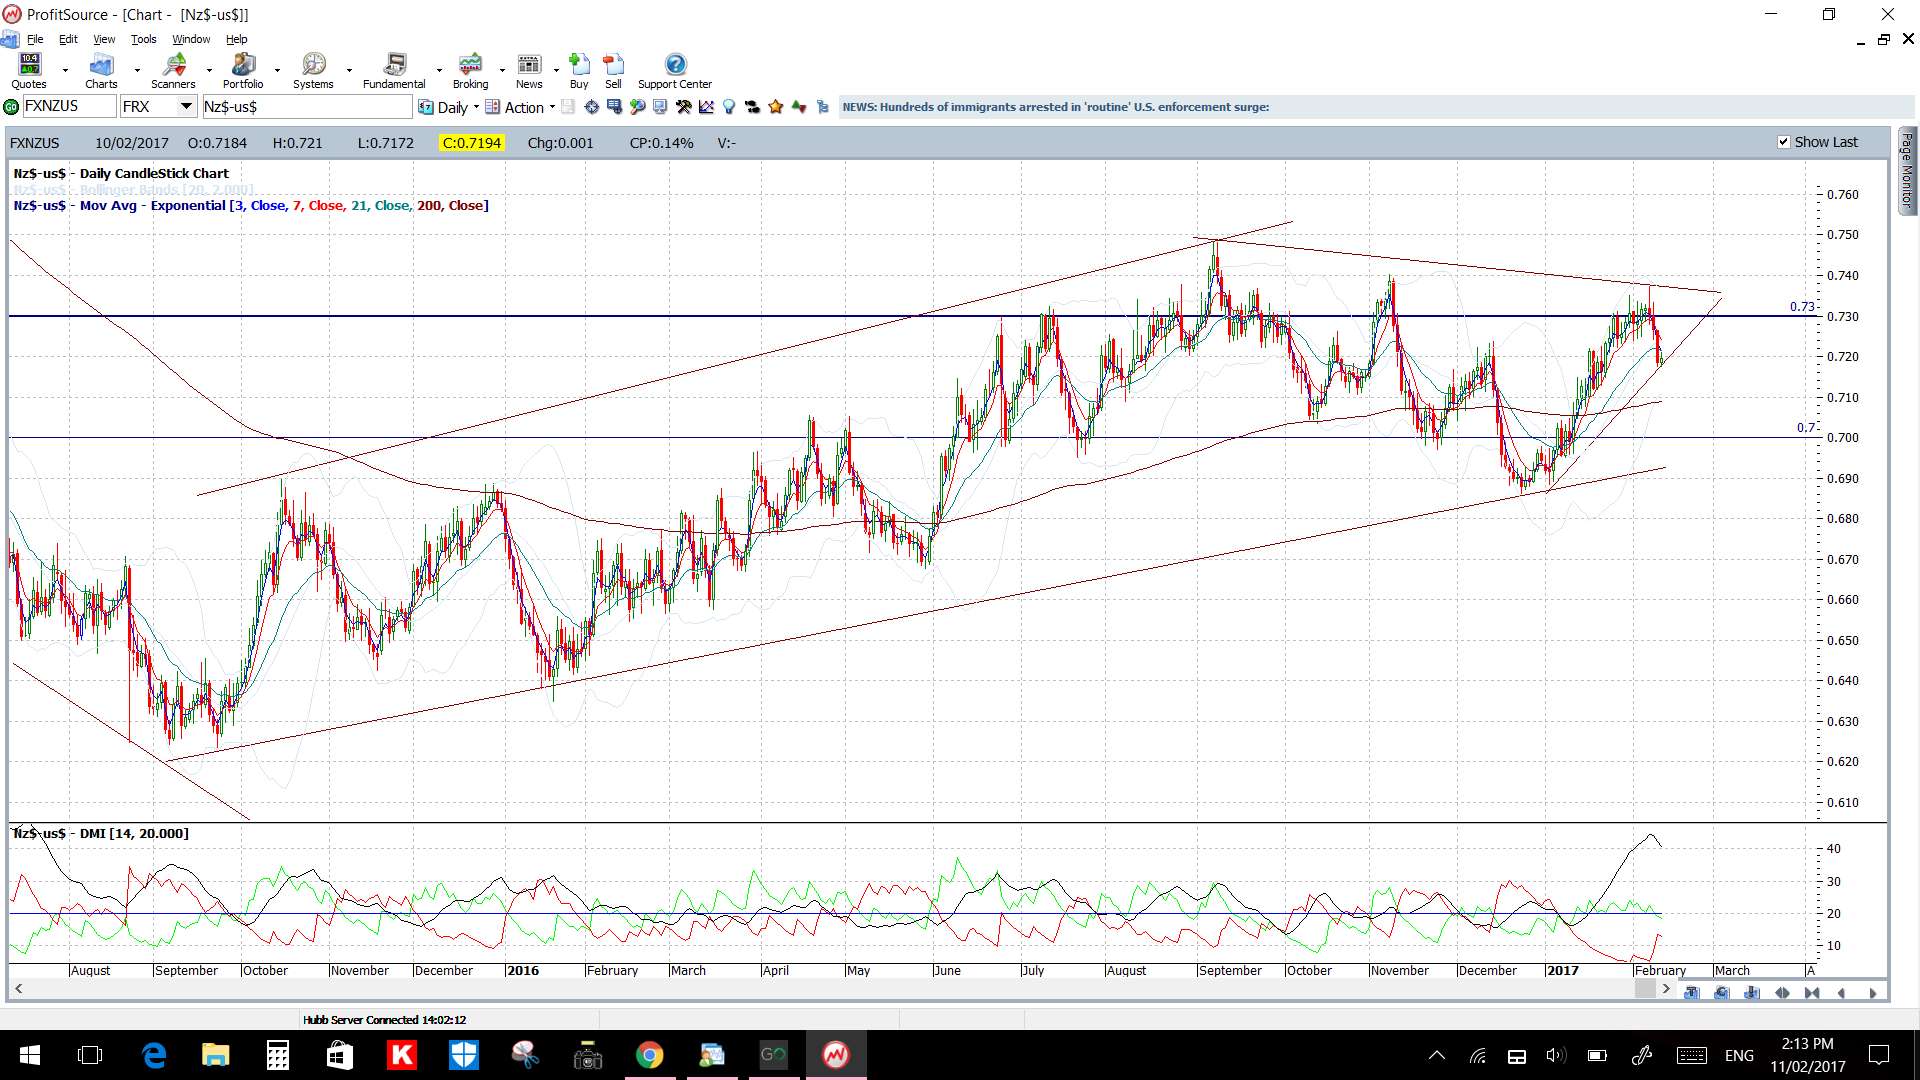
NZD/USD: Price respected 0.73 resistance and broke down through the 4hr chart’s triangle last week in a move that gave up to 80 pips. It also closed below the psychological 0.72 level but this action has formed up within a larger daily-chart triangle giving us further trend lines to watch for any momentum-based breakout move.
Price is below the 4hr Cloud but above the daily Cloud.
The weekly candle was large and bearish.
There is NZD Retail Sales and all of the US data to monitor here this week.
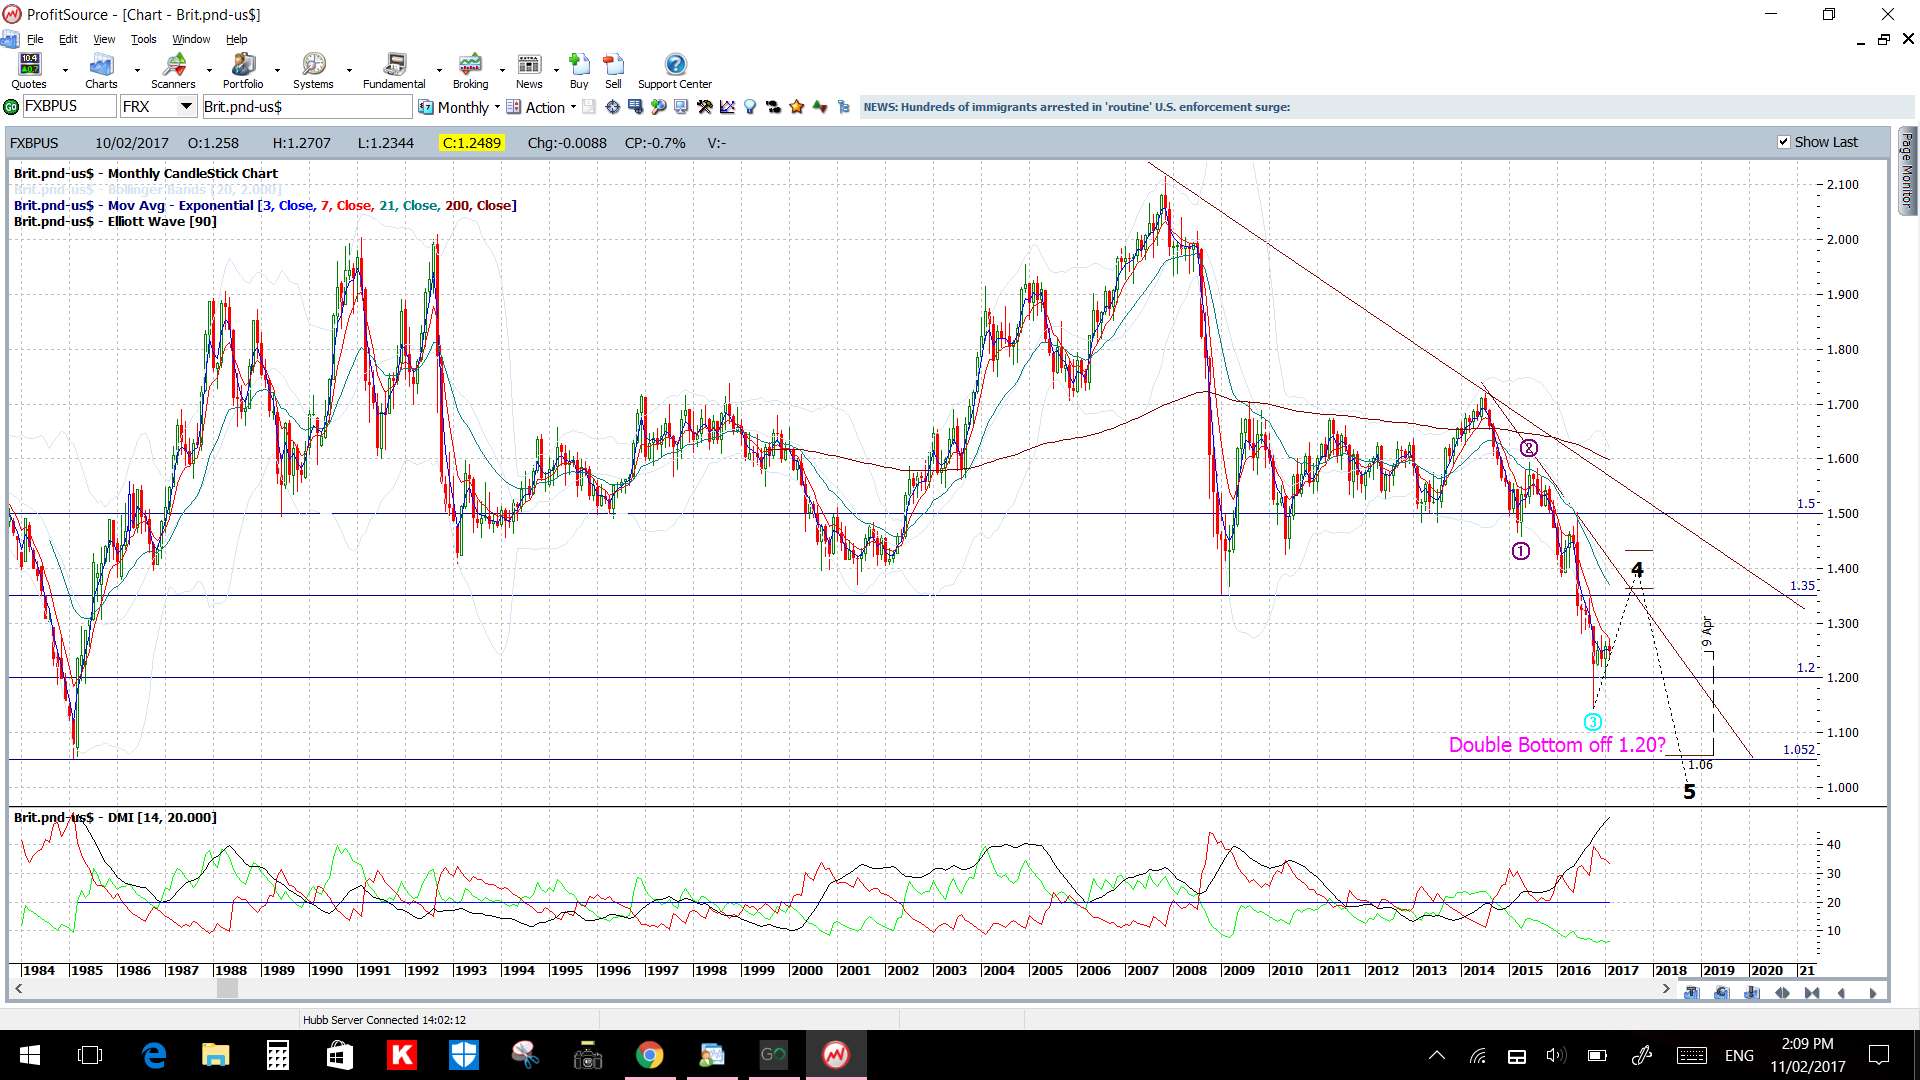
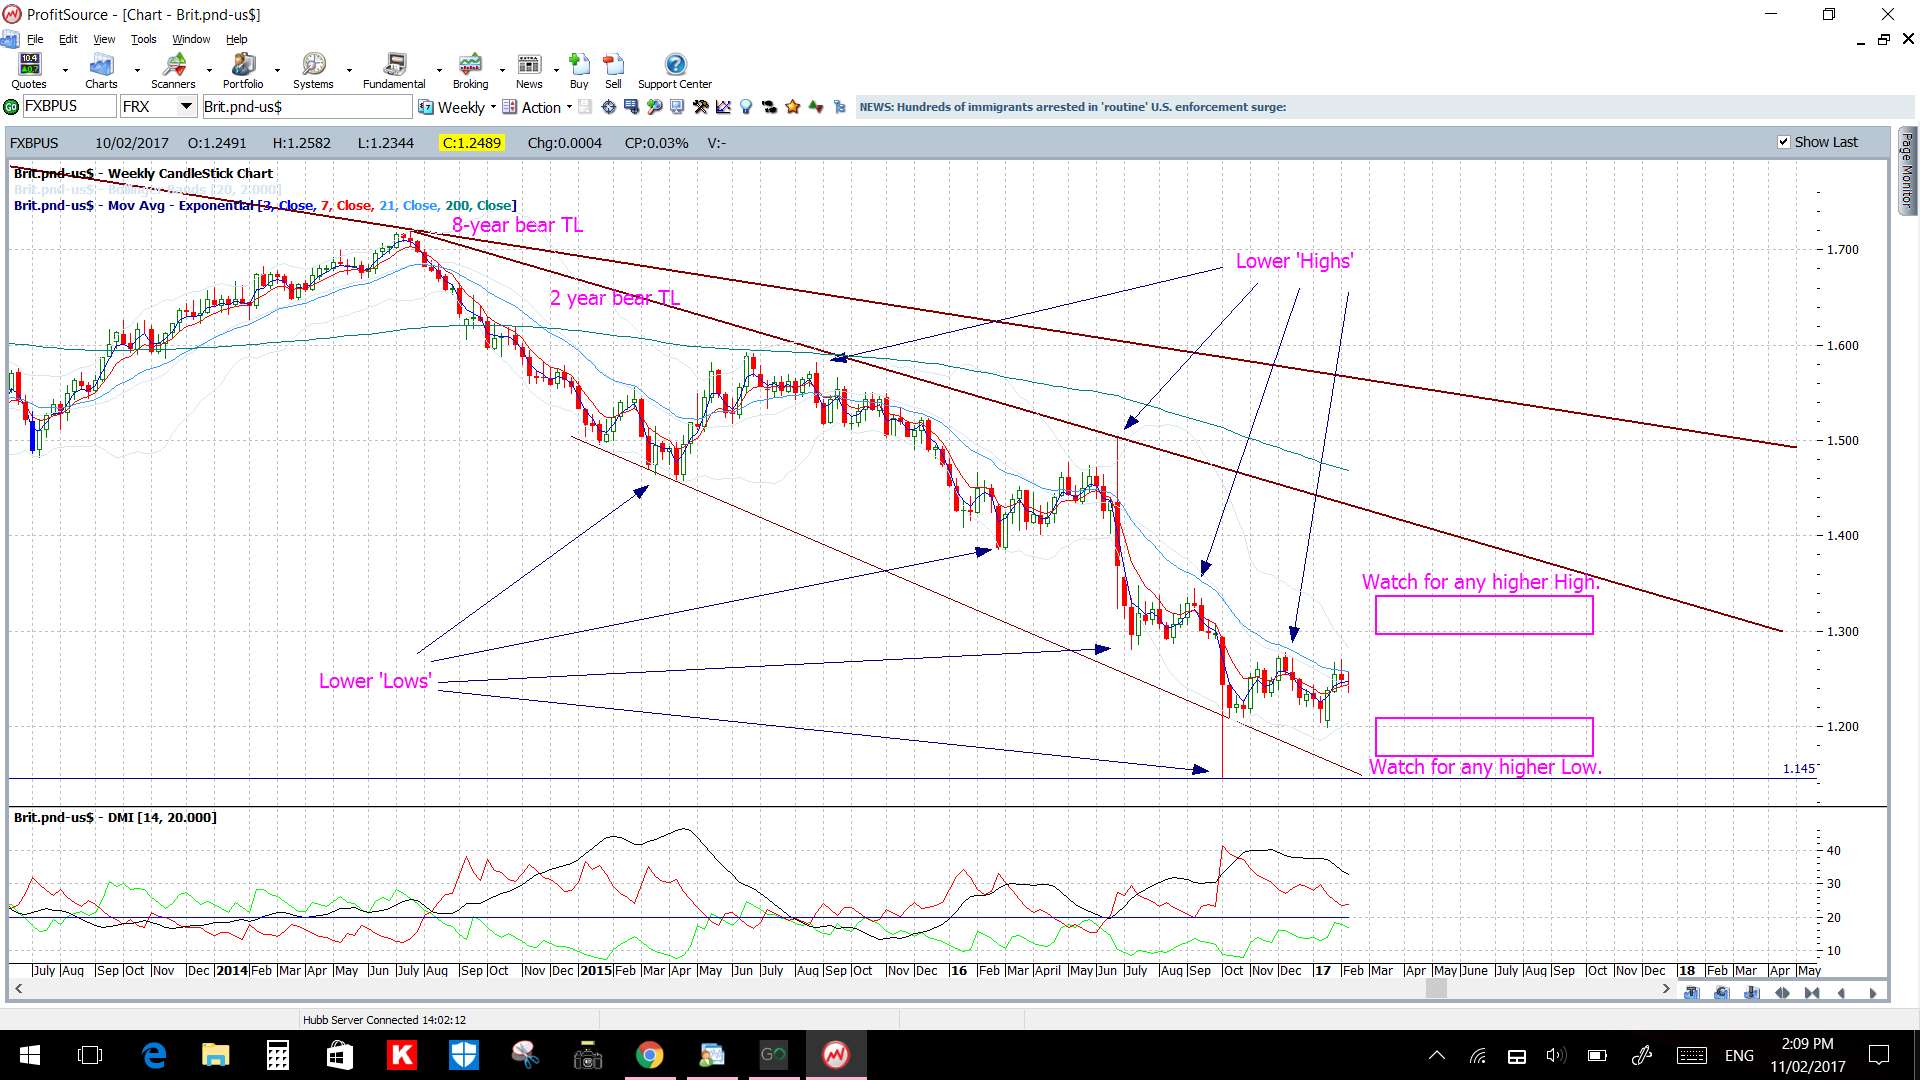
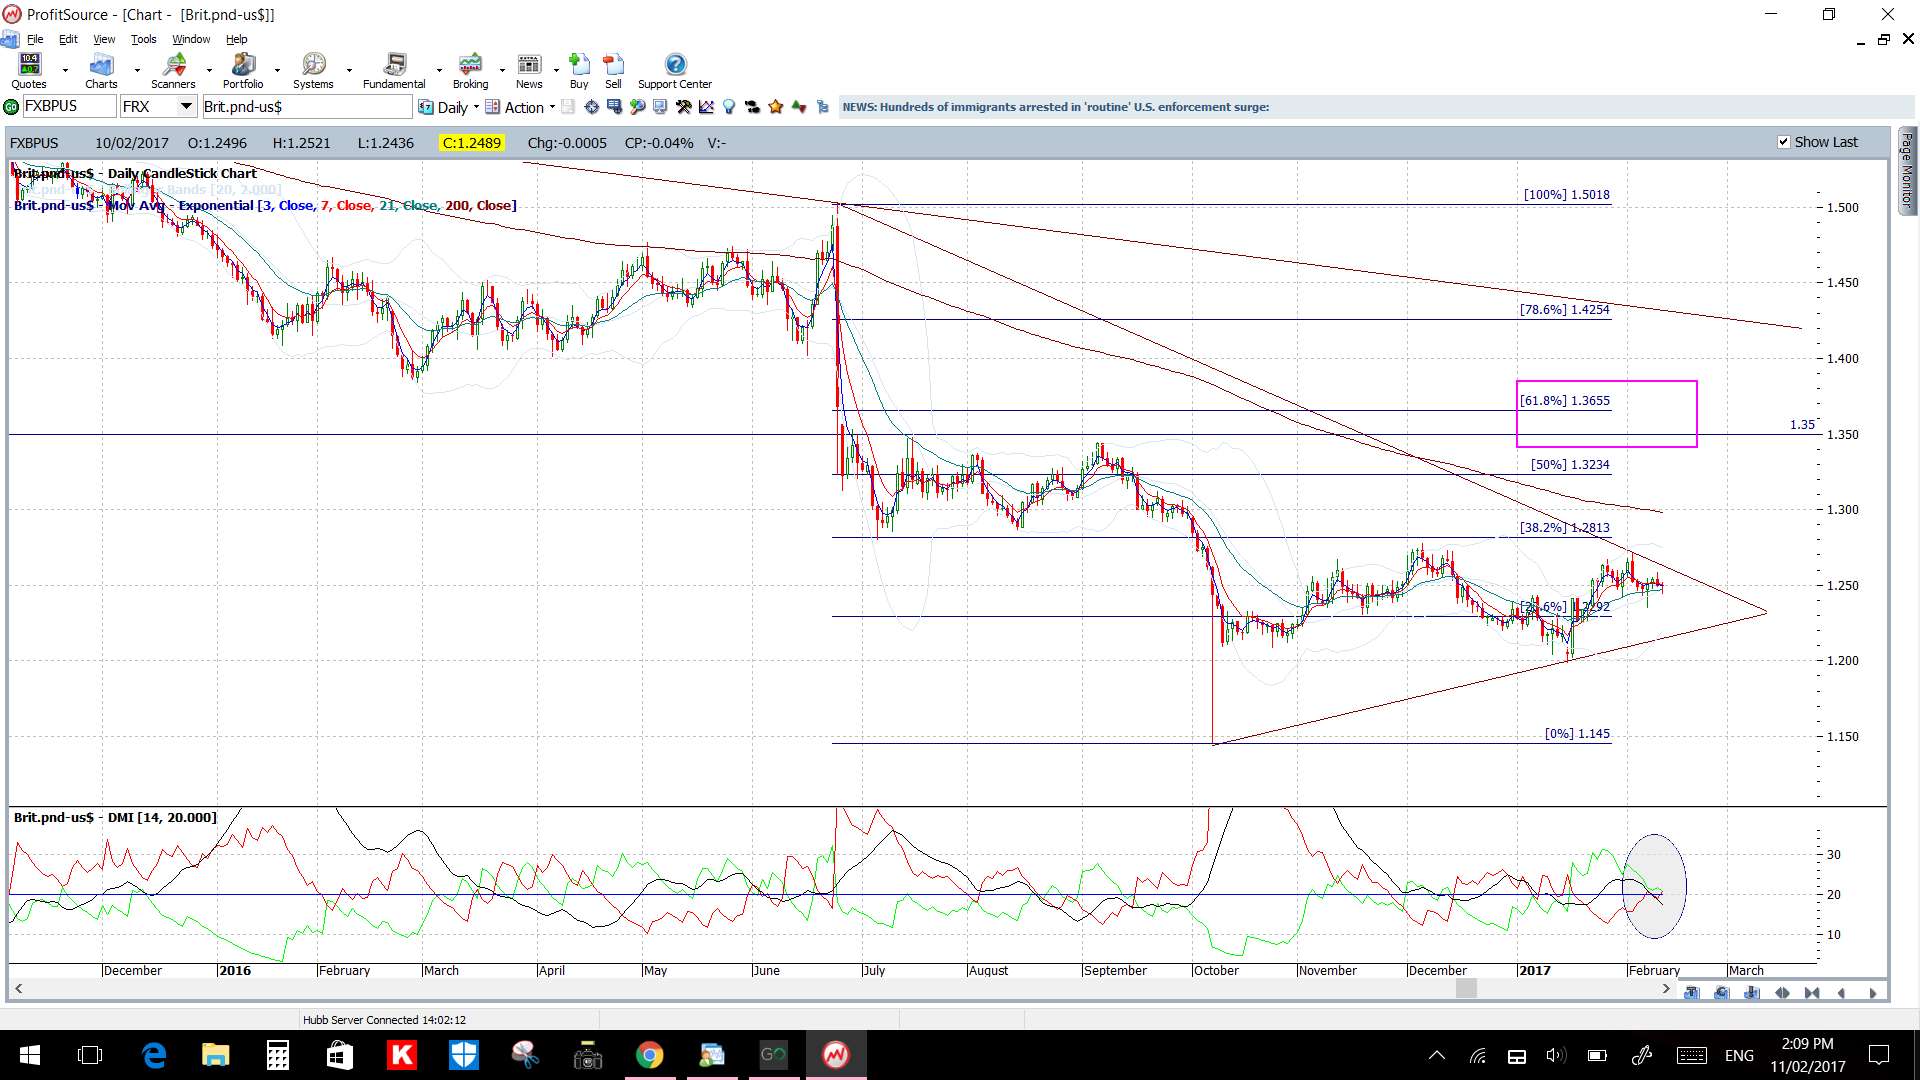
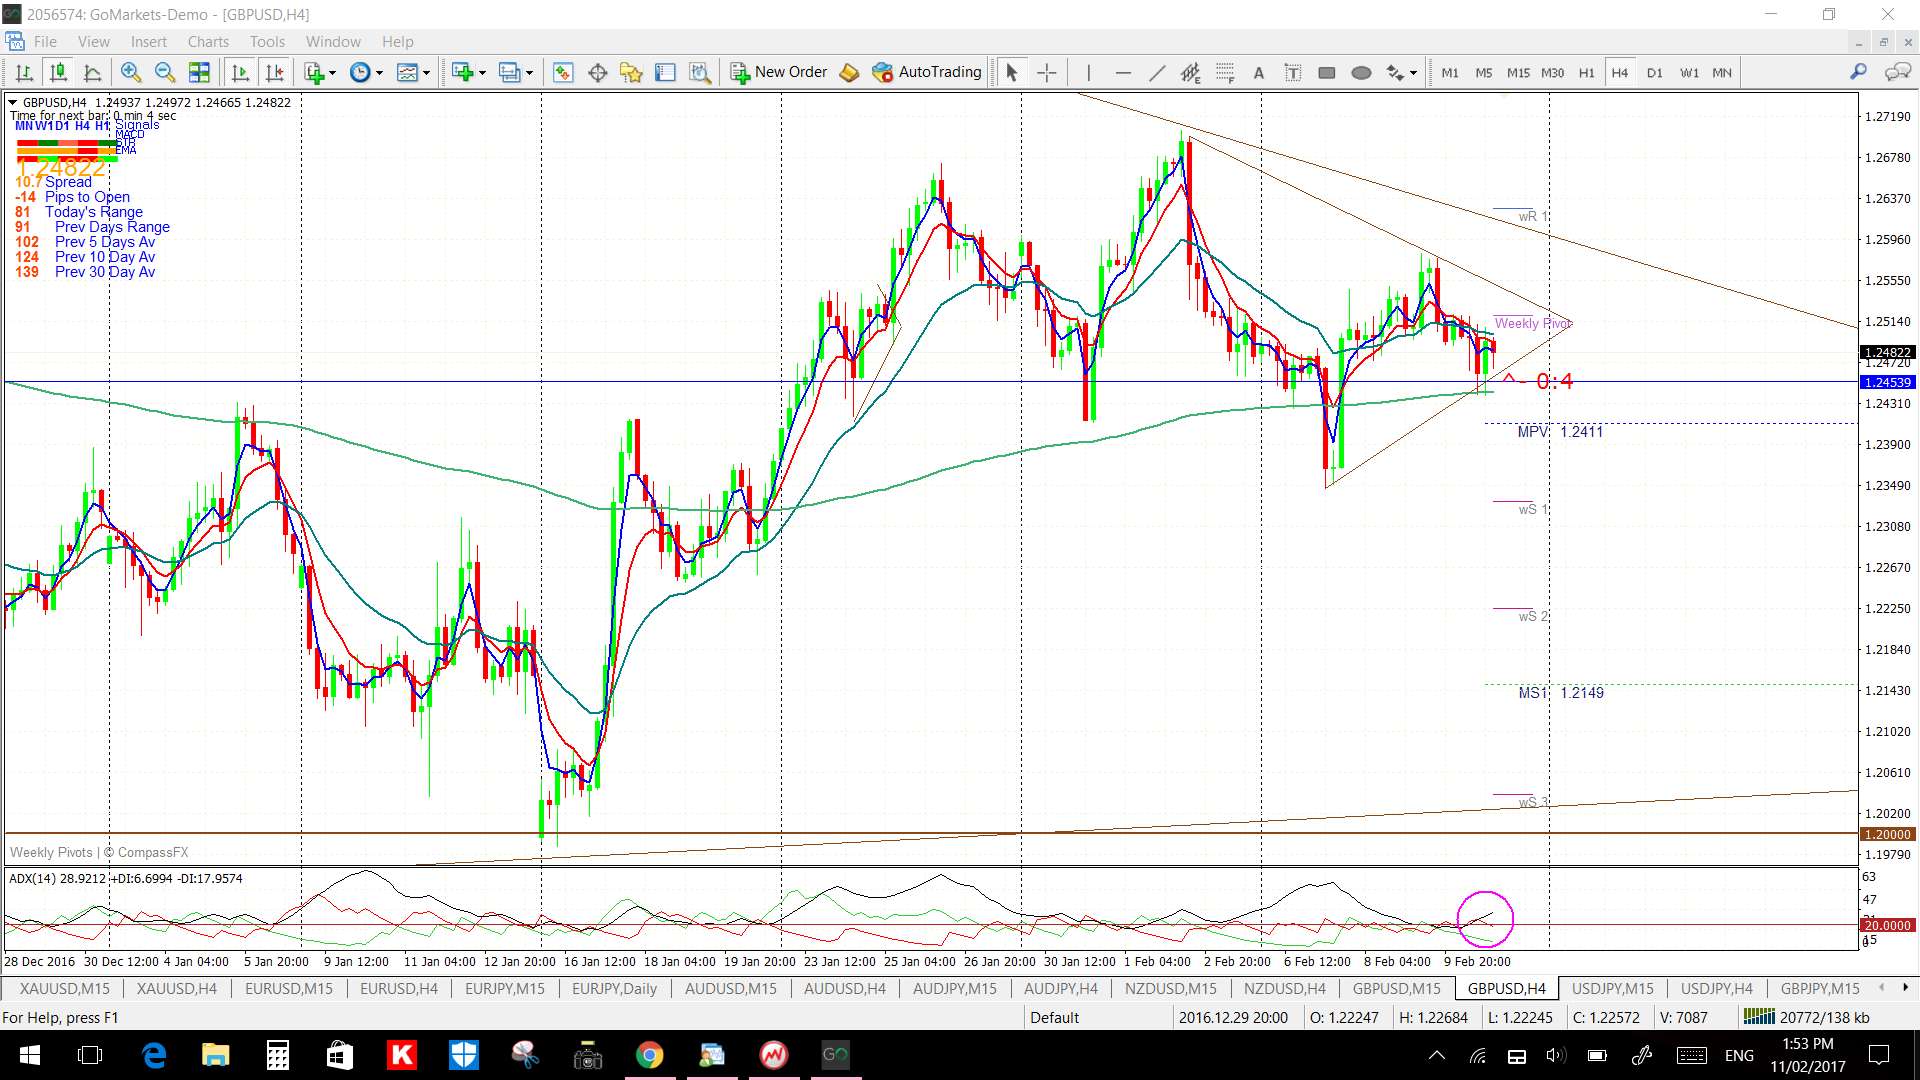
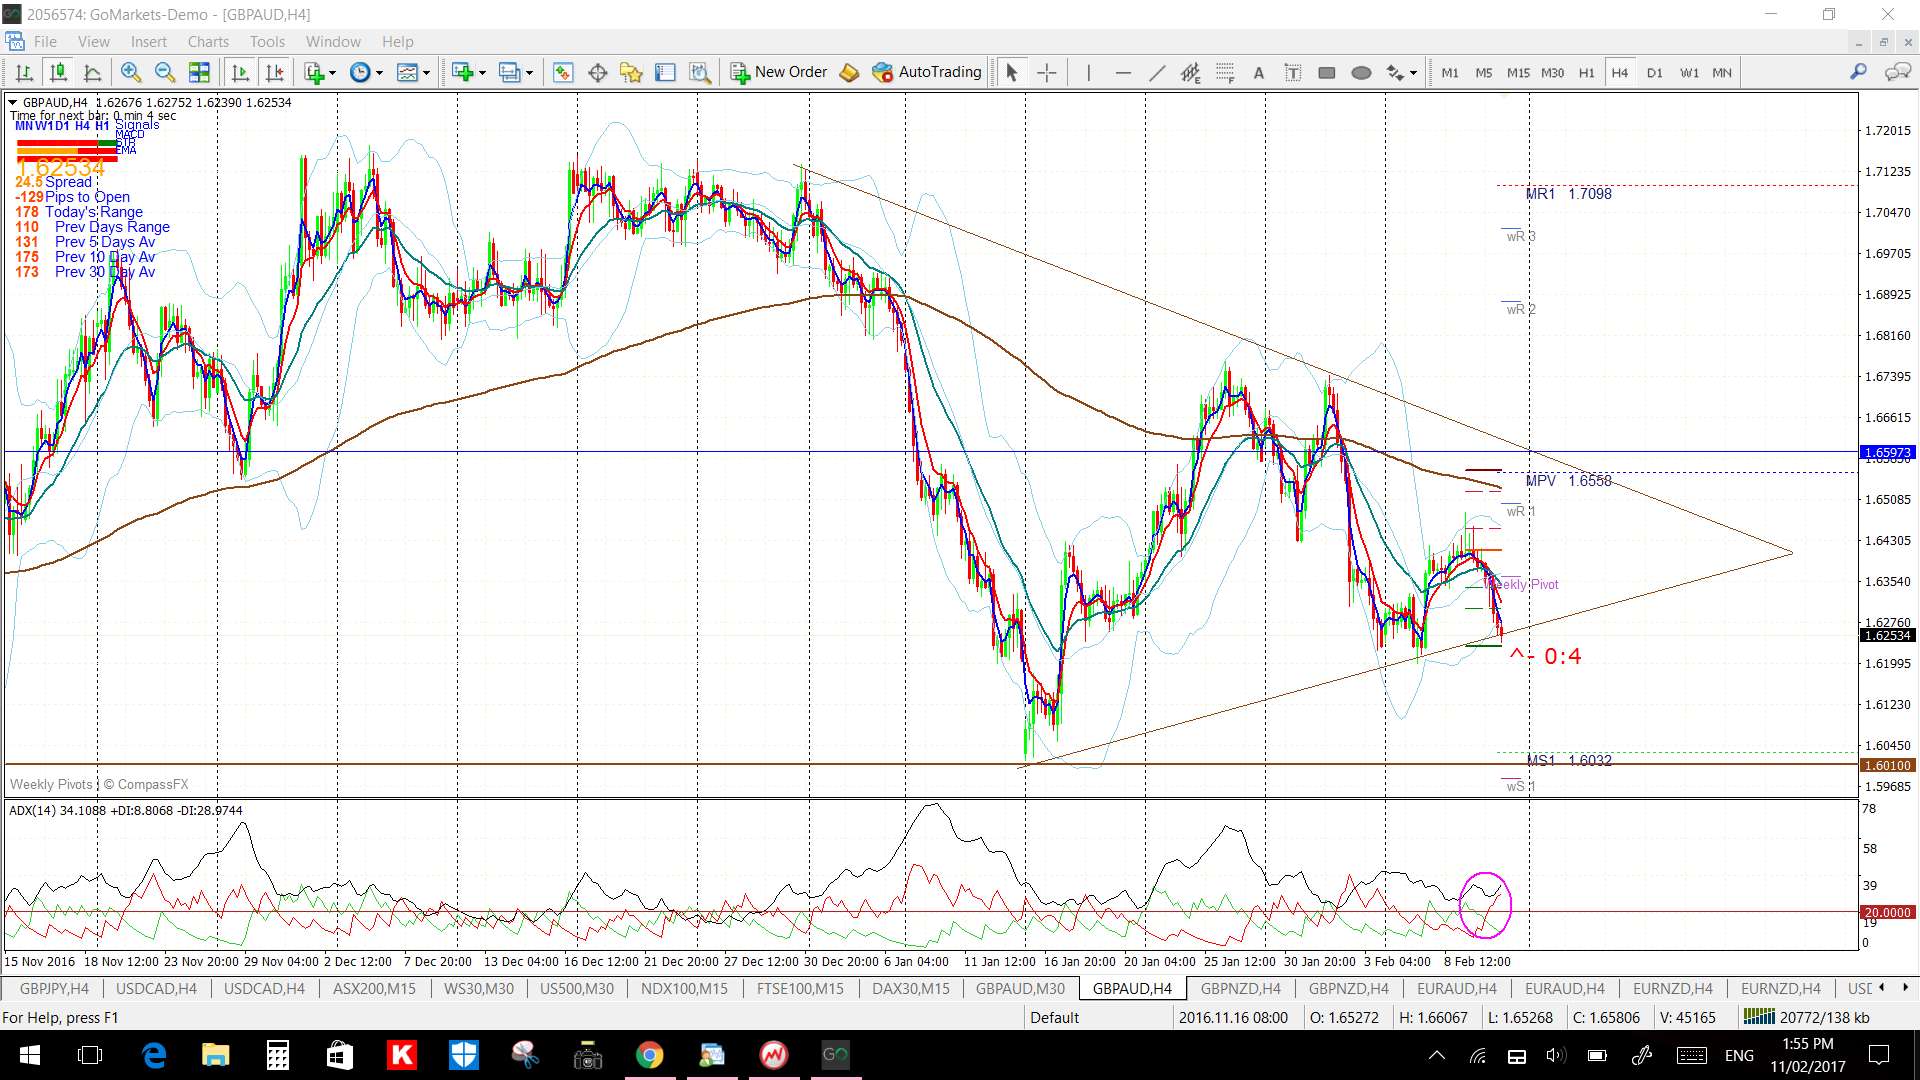
GBP/USD: The Cable continues to trade within a daily chart triangle above the 1.20 support level but there is a smaller triangle to monitor on the 4hr chart as well.
Price is just below thin 4hr Cloud and just above thin daily Cloud so a relatively unencumbered breakout move either way could easily evolve. The weekly candle closed a bullish coloured Doji reflecting this delicate balance.
There is a bit of GBP data this week with CPI, Employment and Retail Sales and there is all of the US data.
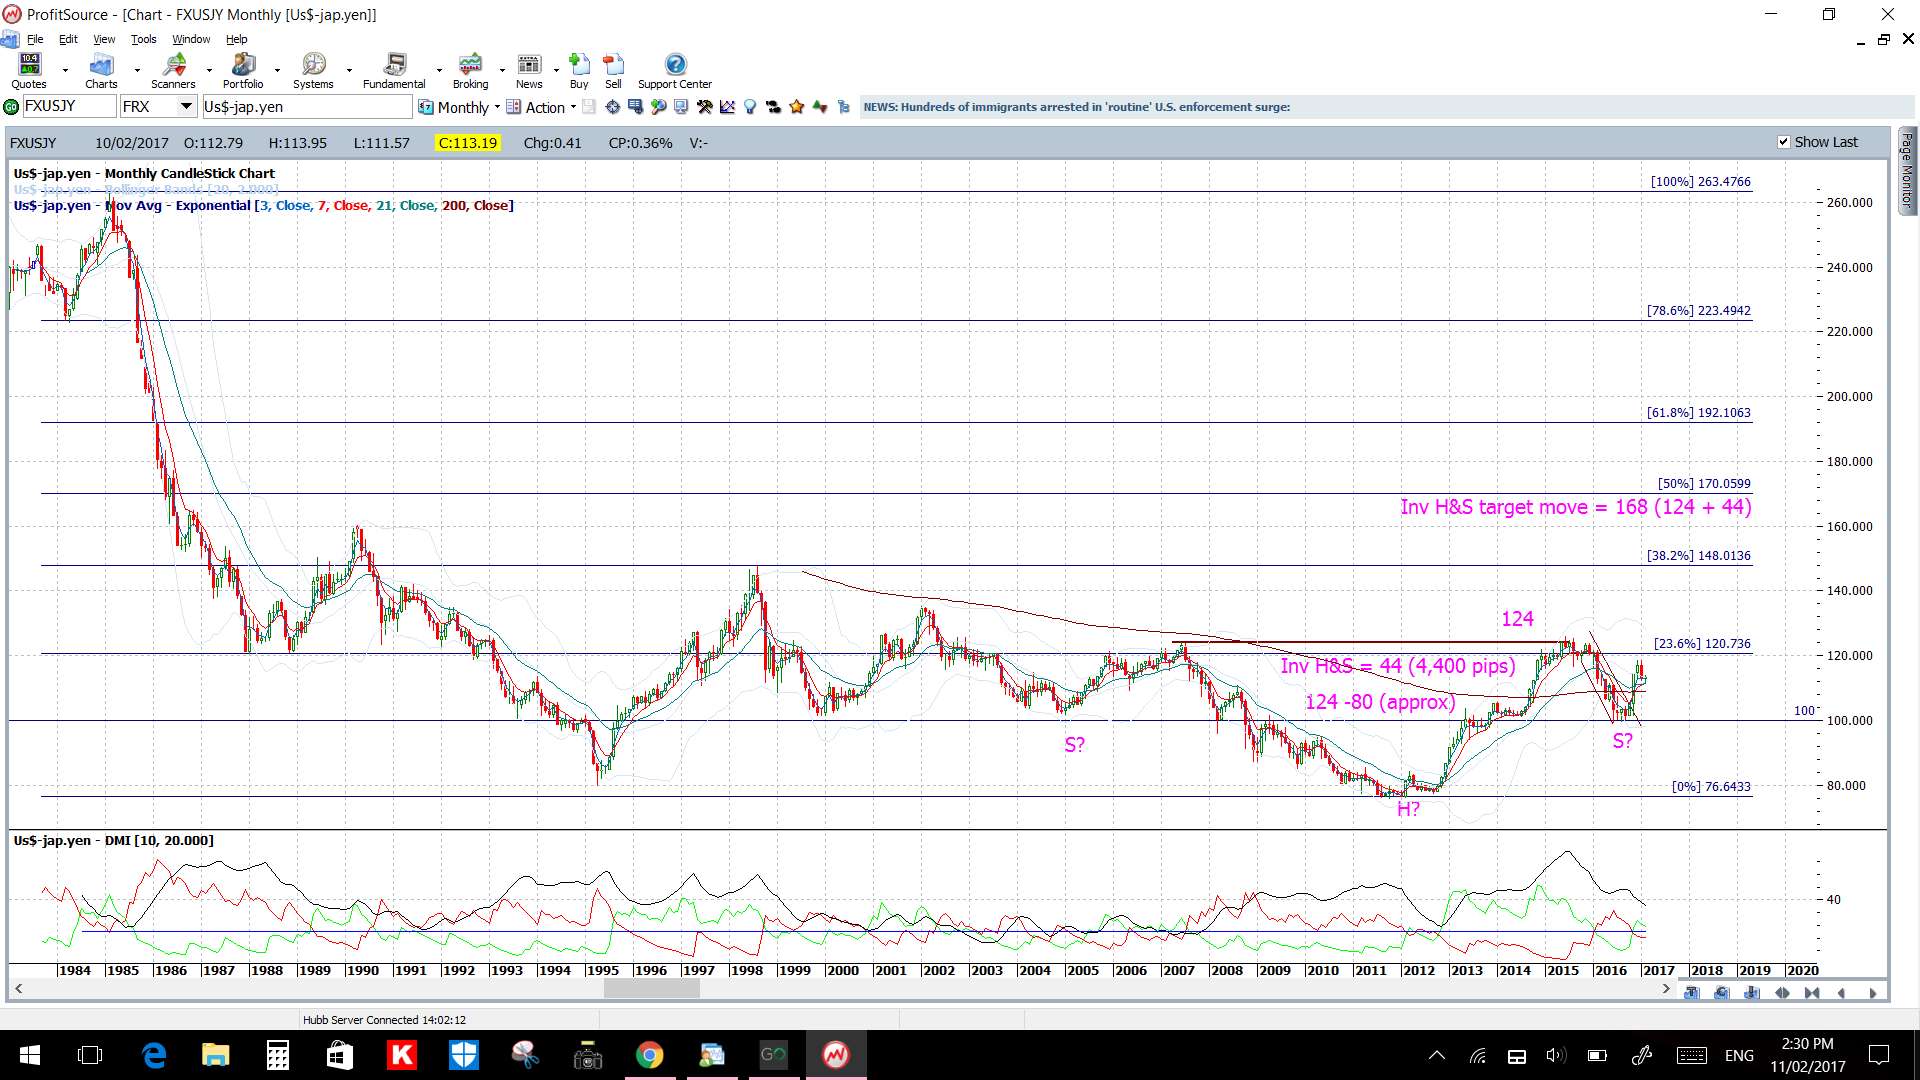
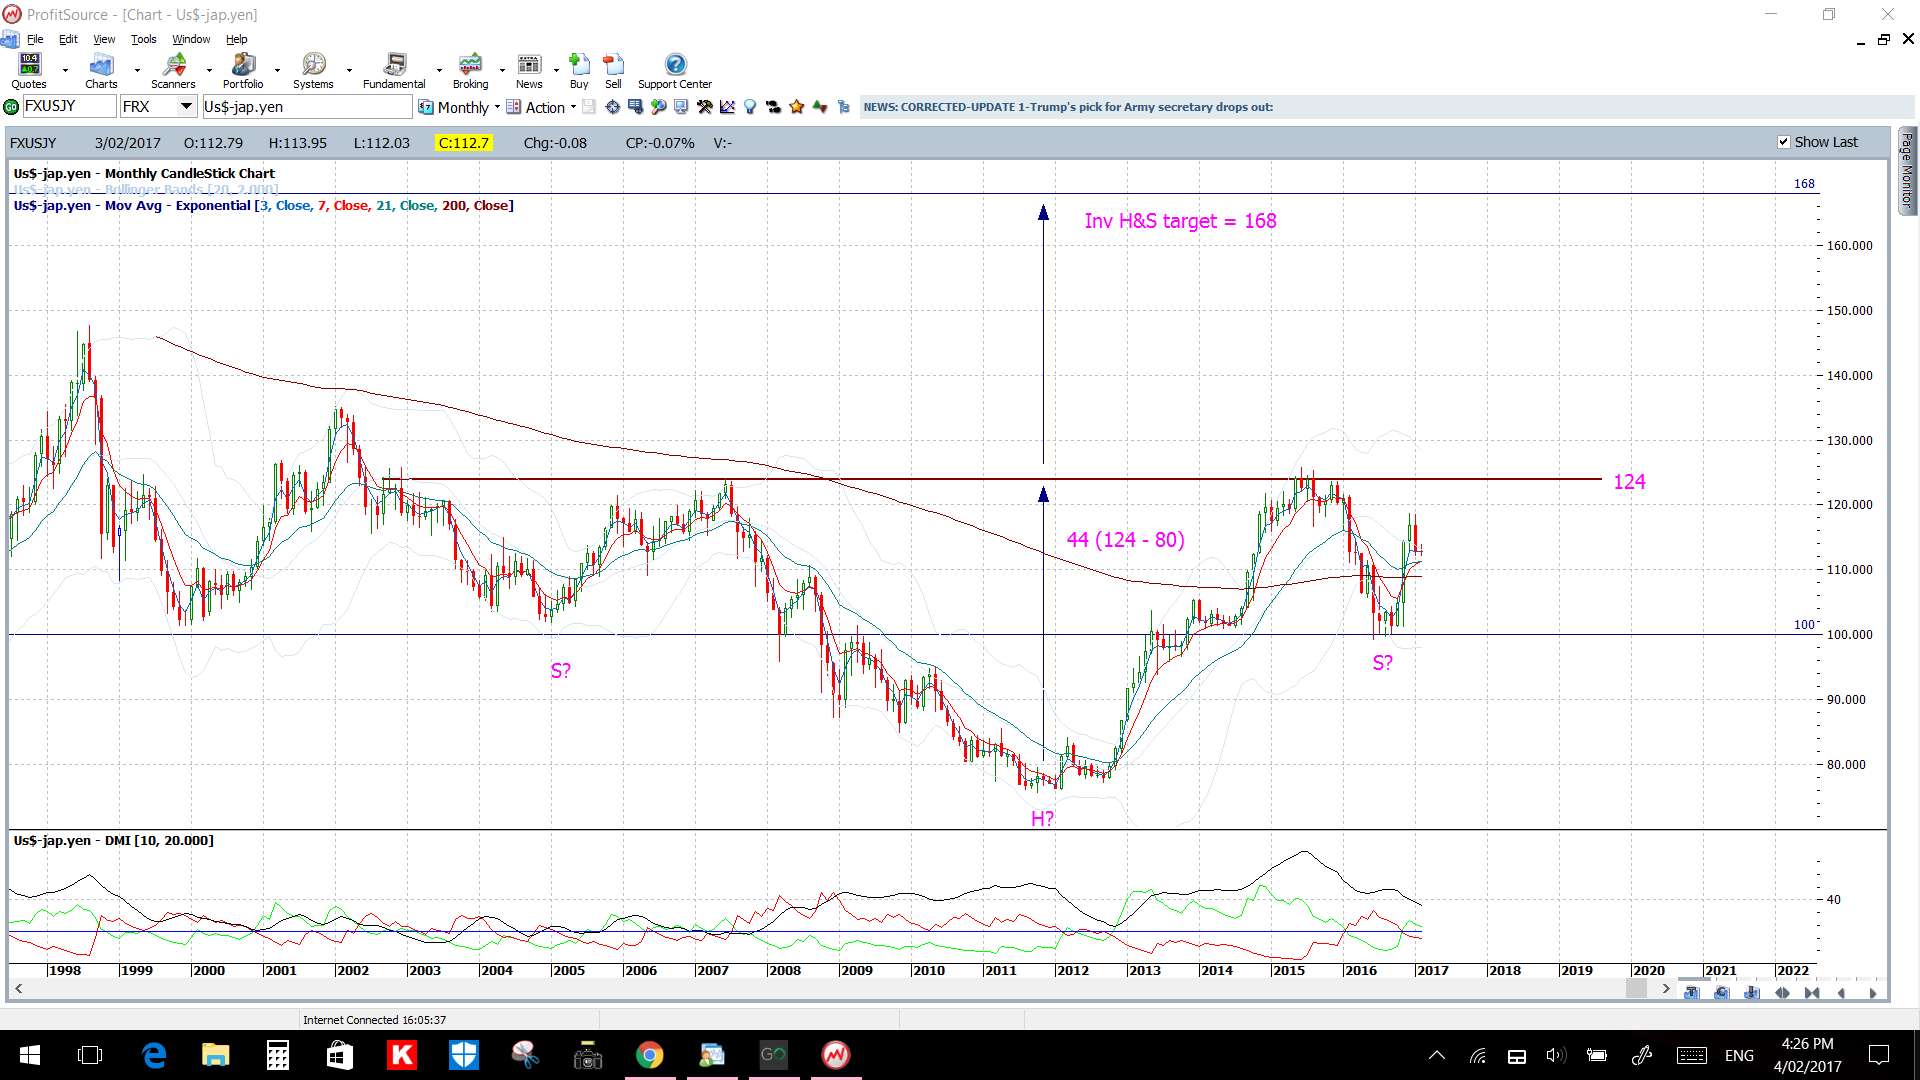
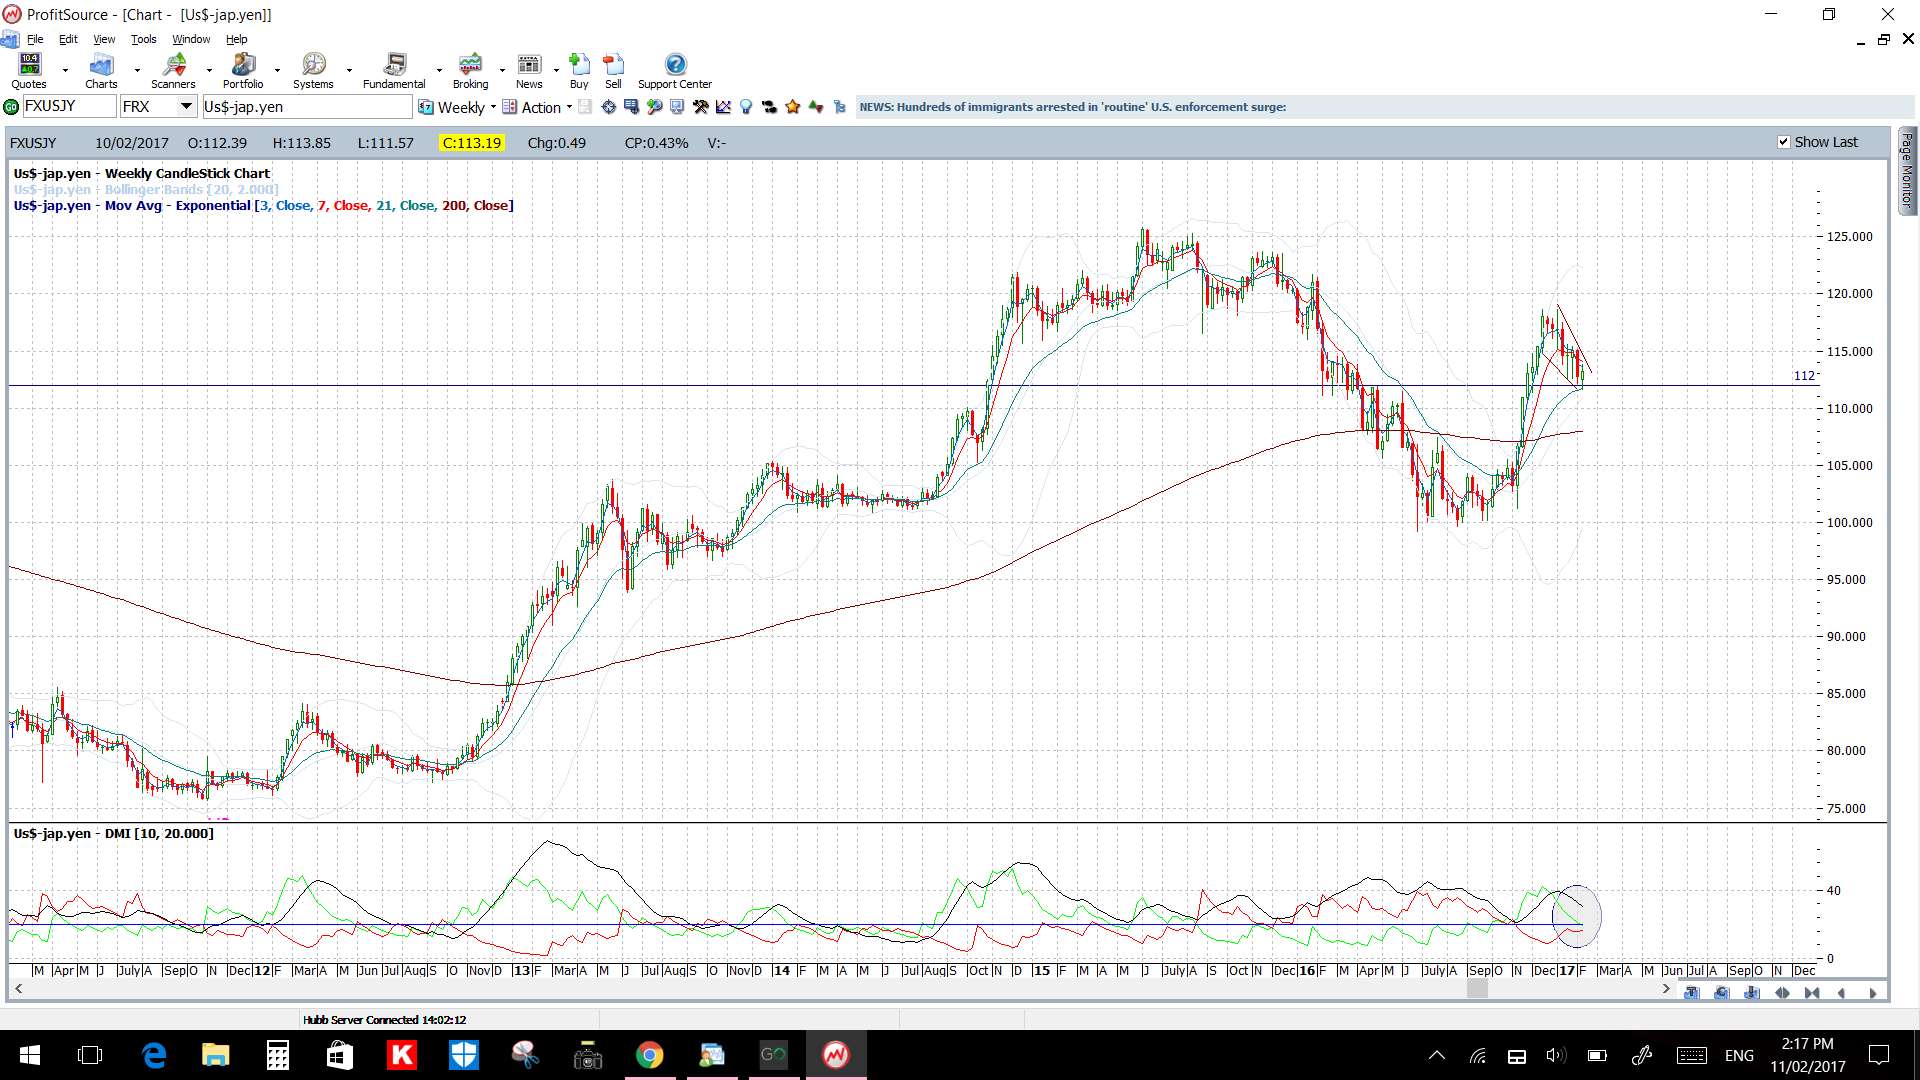
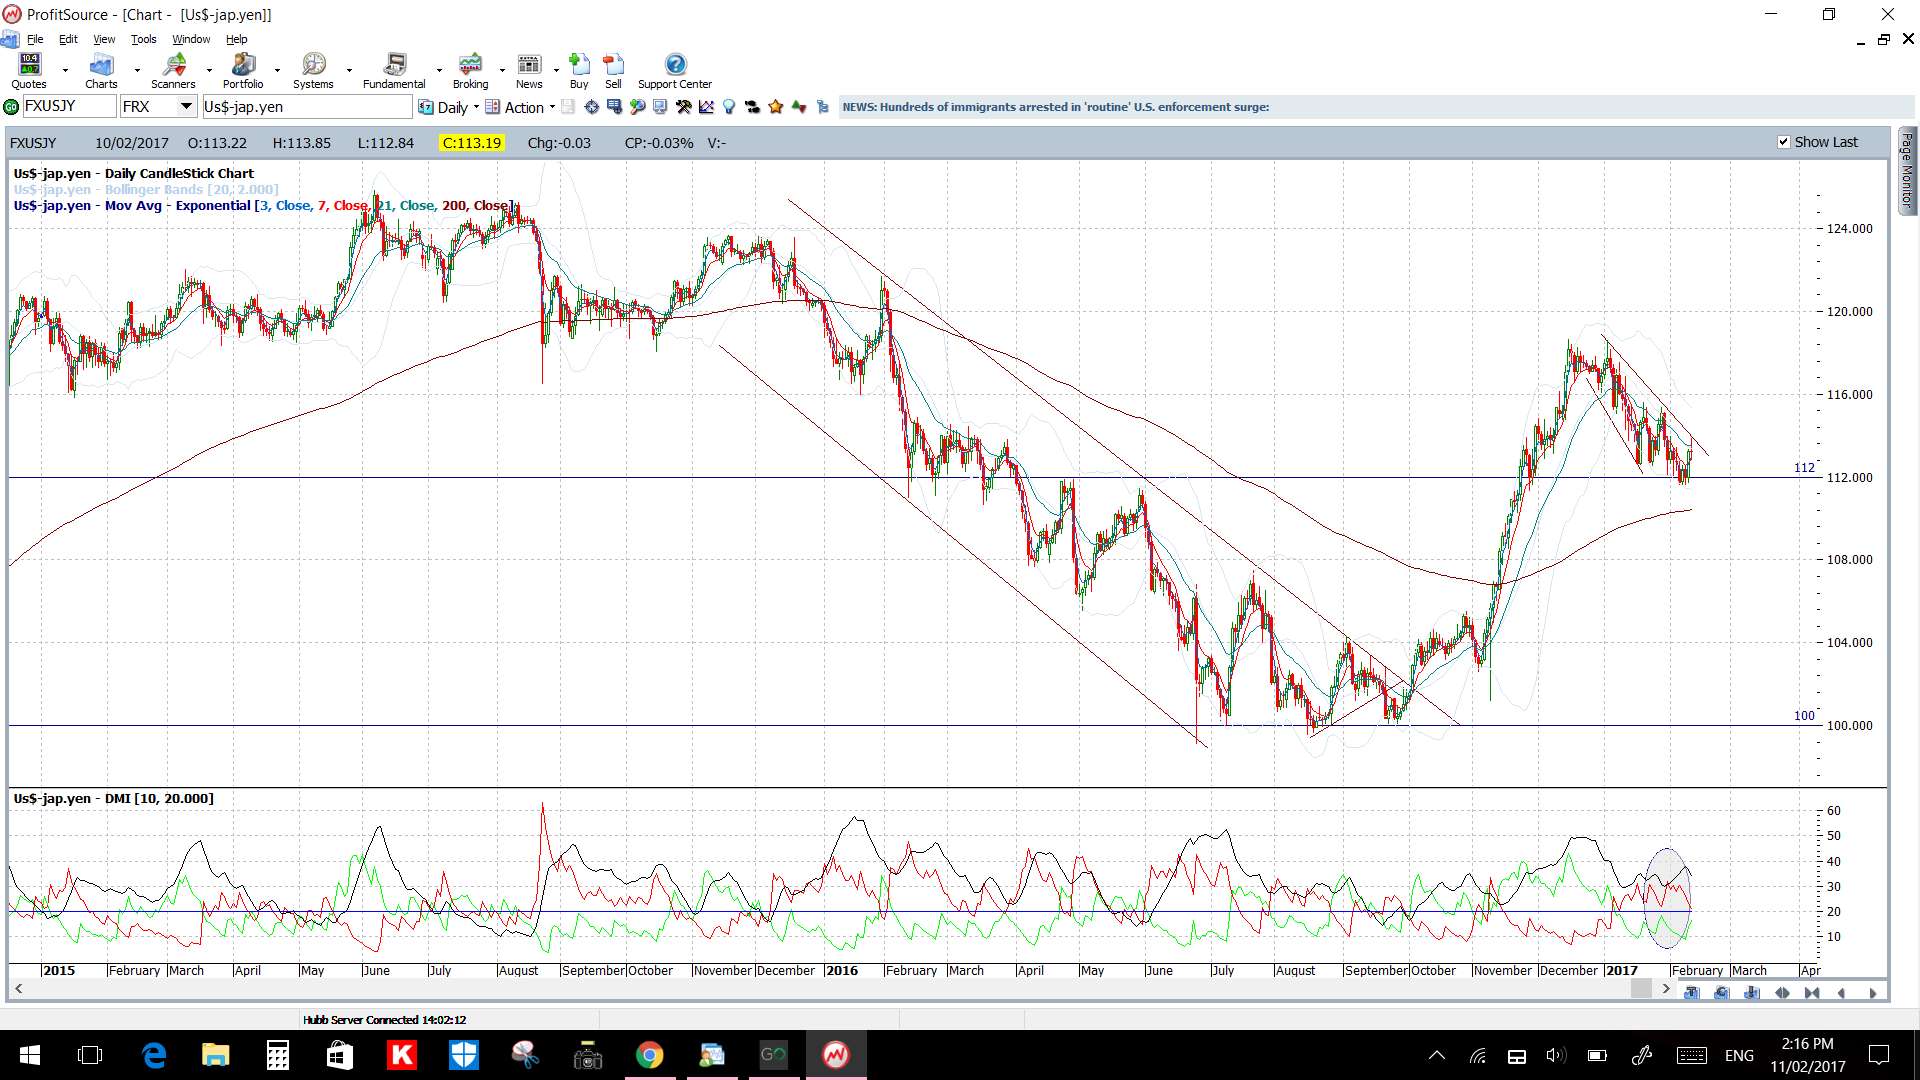
USD/JPY: The U/J continues consolidating within what looks, to me at least, like a bullish-reversal descending wedge. Price tested the upper level here last week but failed to keep going and so the trend lines have been adjusted giving us new levels to watch for any momentum-based make or break activity.
Price is in both the 4hr and daily Cloud so this choppiness might continue.
The weekly candle was a bullish-coloured ‘Inside’ candle reflecting this indecision.
There is JPY CPI to monitor as well as all of the US data.
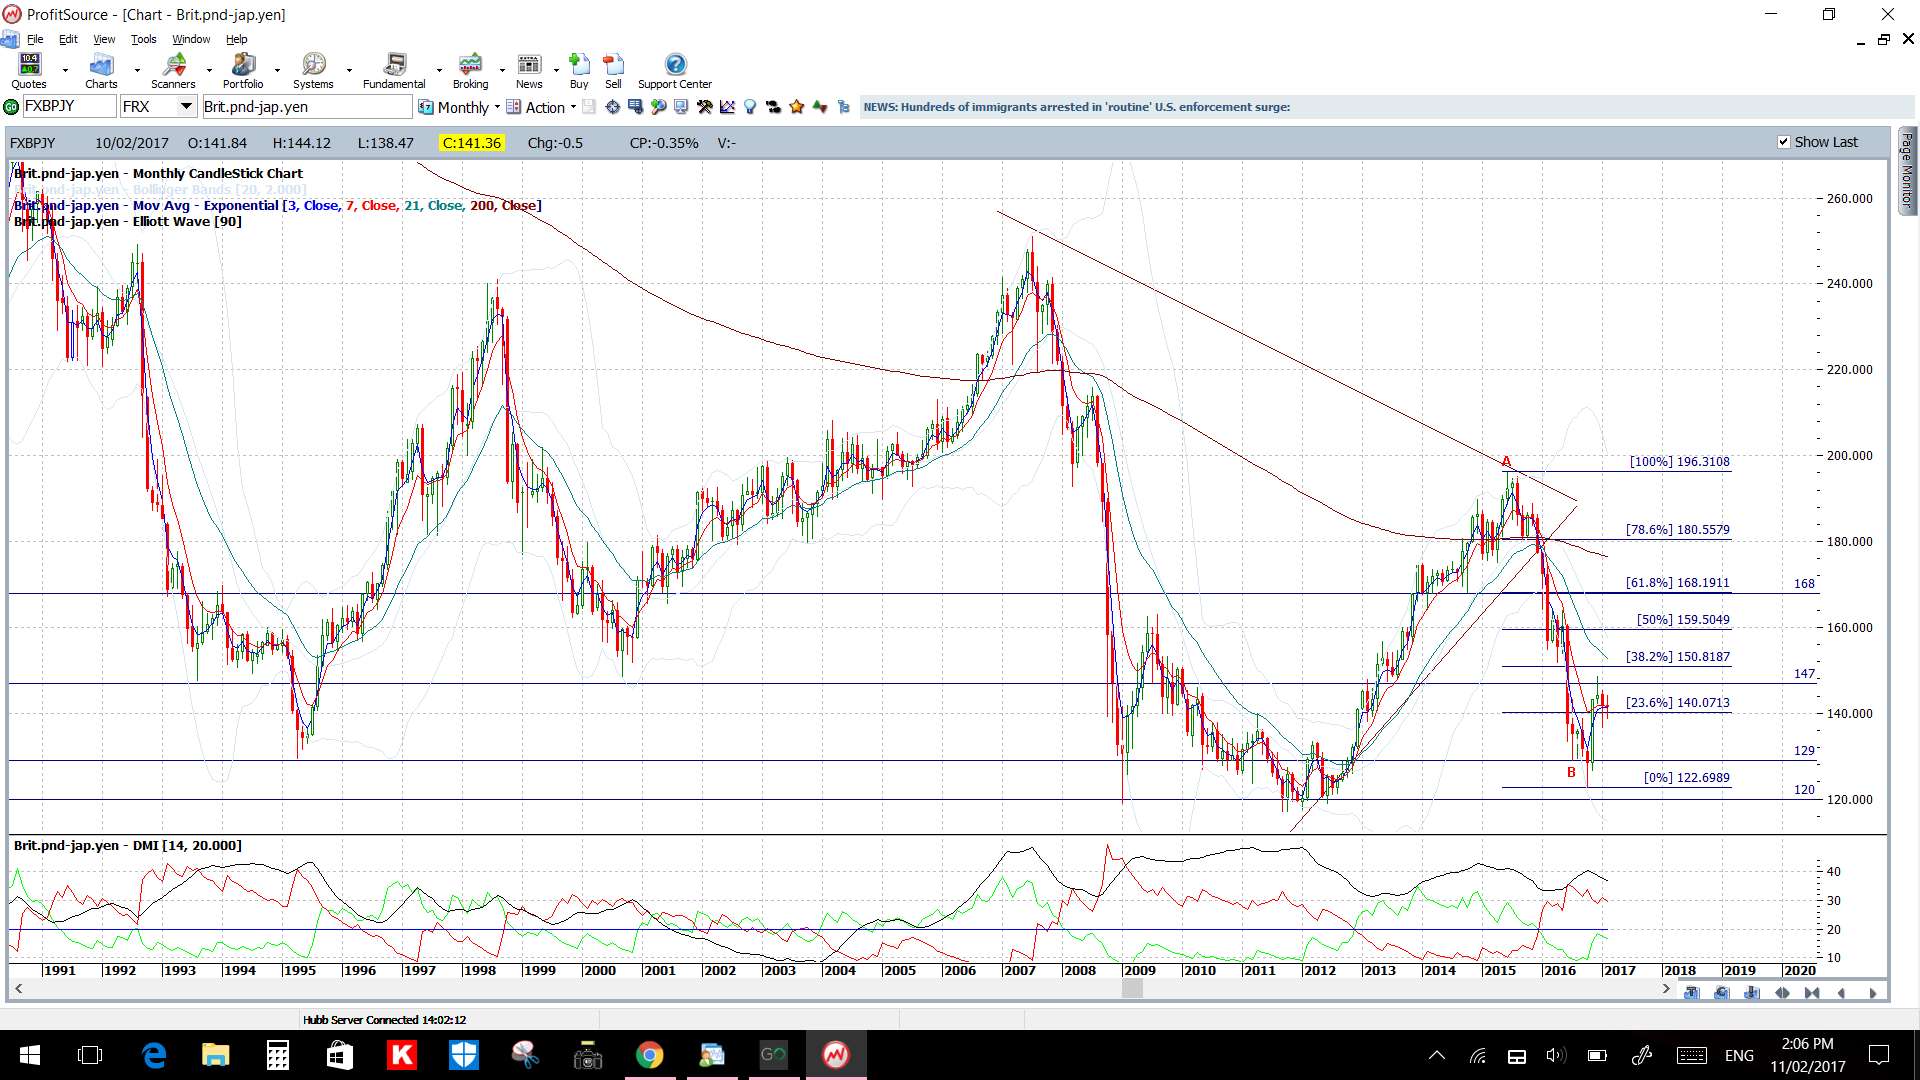
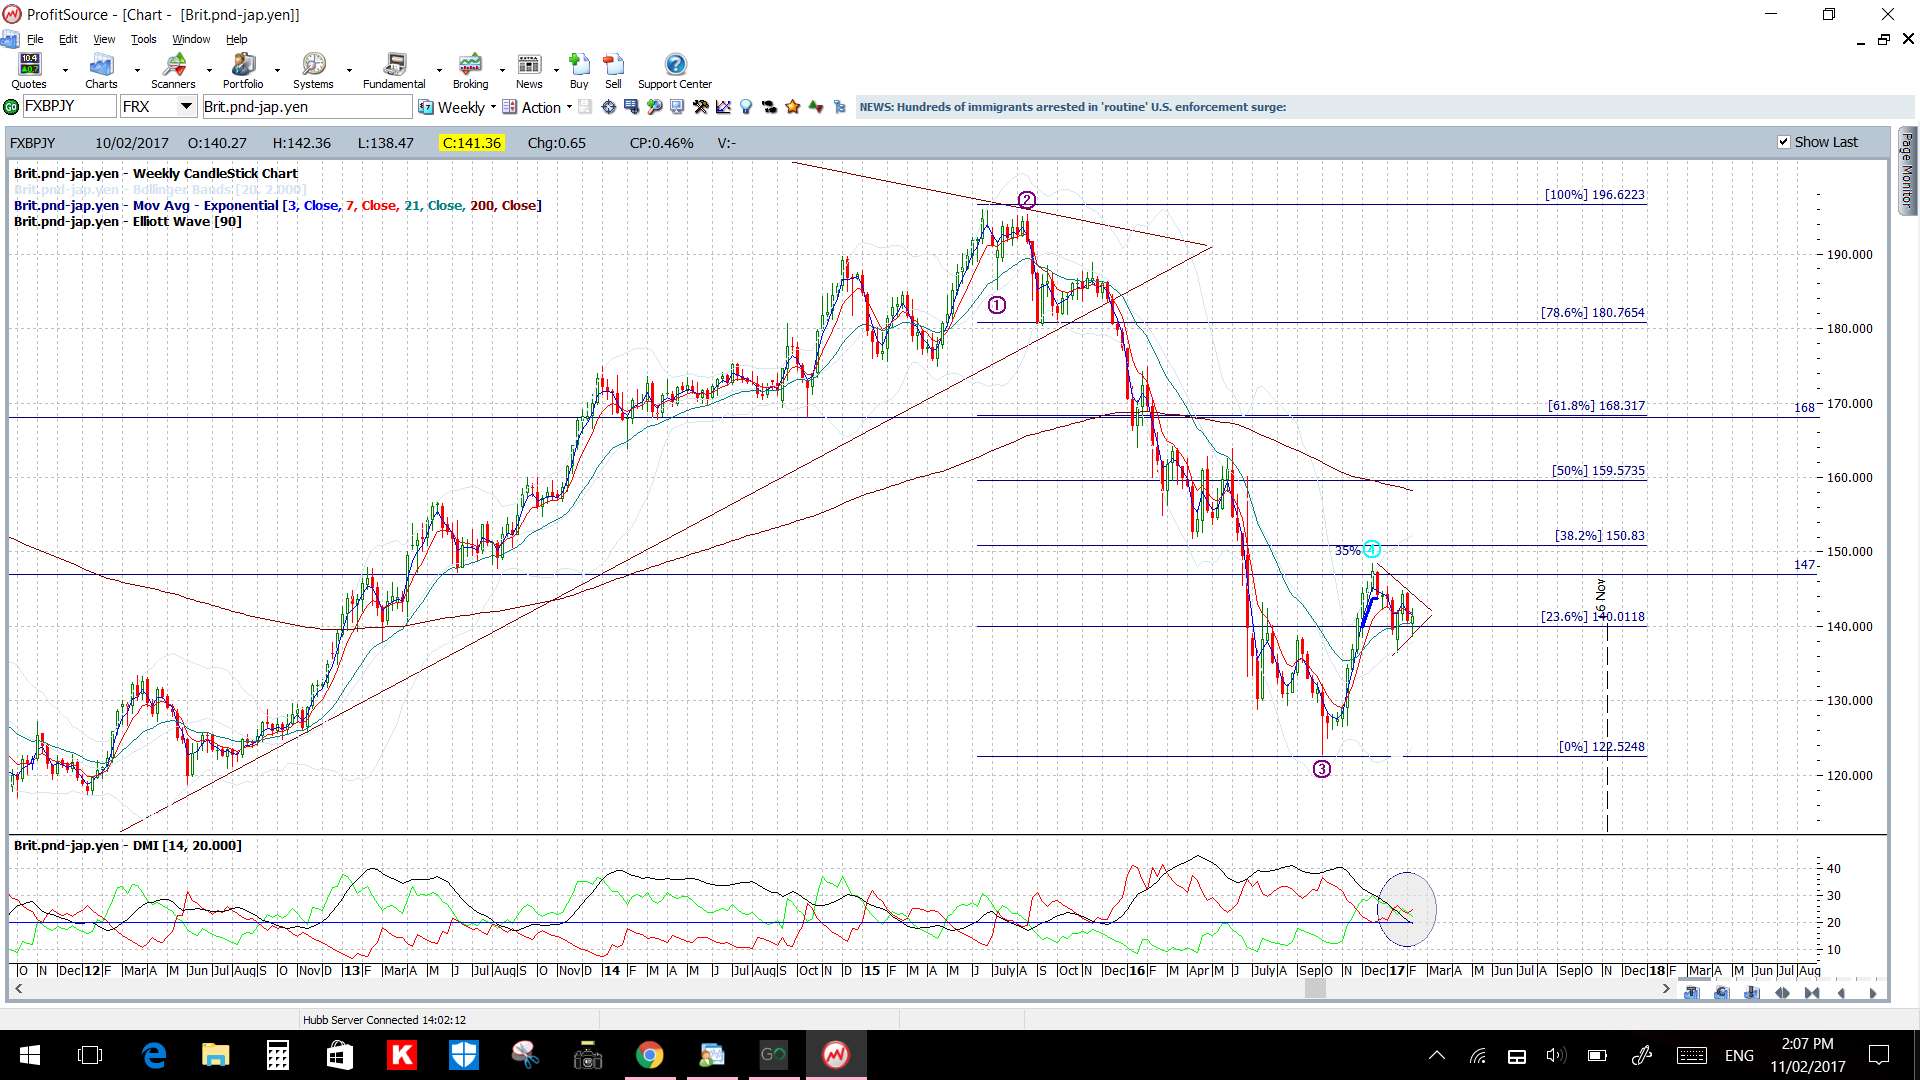
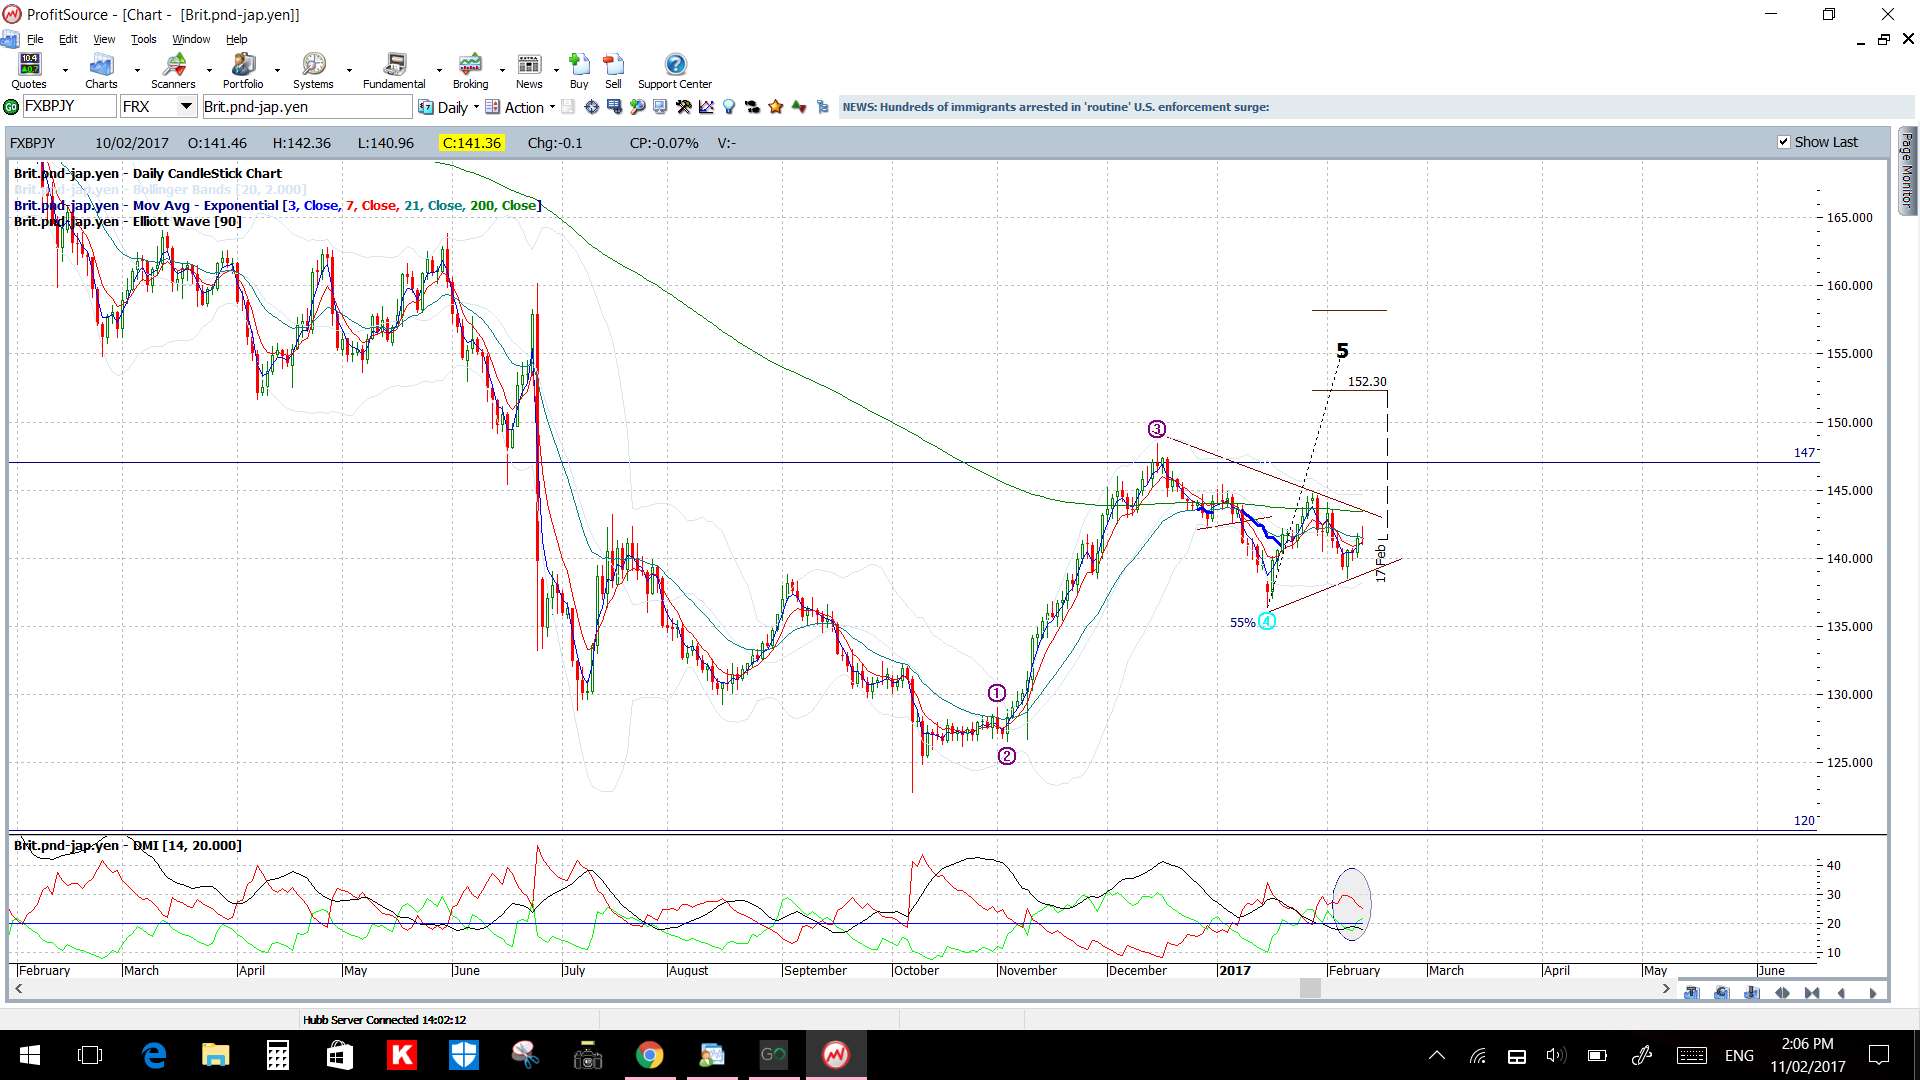
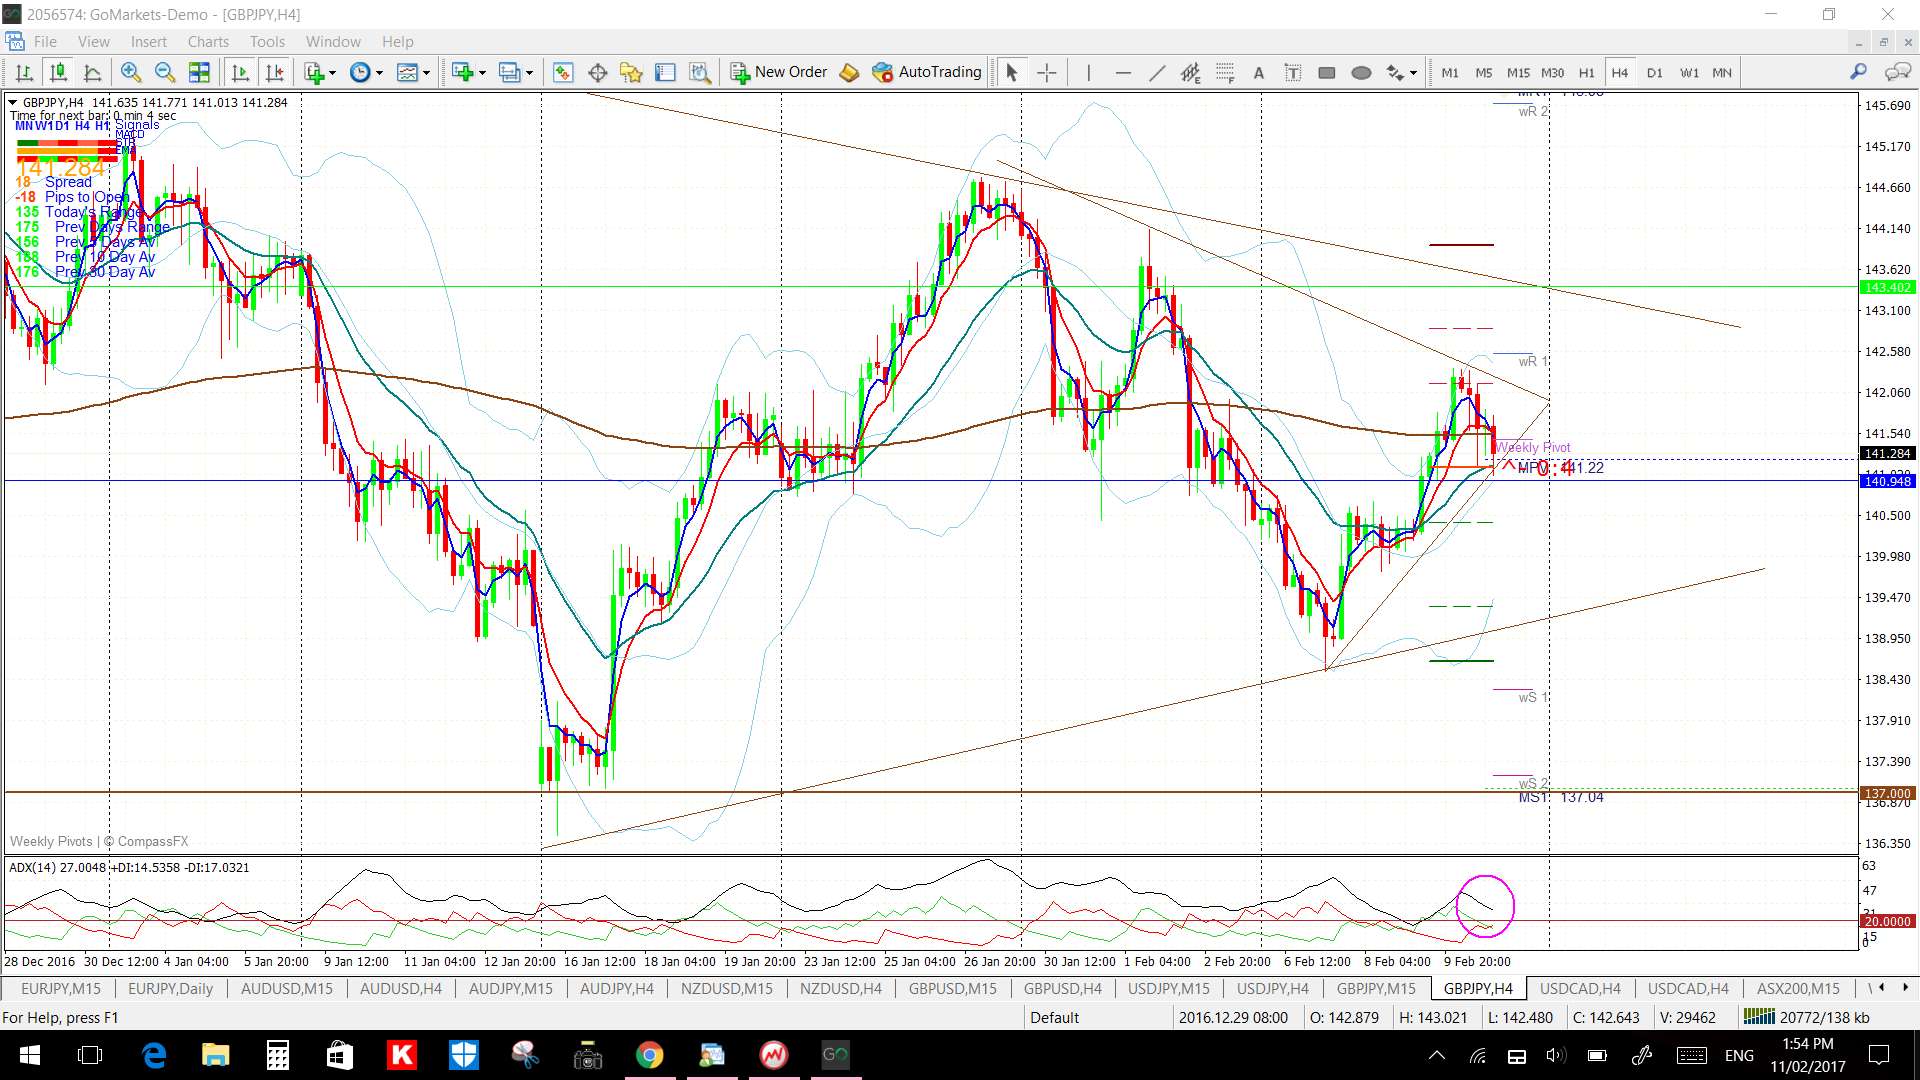
GBP/JPY: This pair continues to consolidate within a daily chart triangle under the 147 S/R level; a level best seen on the monthly chart. There is also now a 4hr chart triangle set within this larger daily triangle so watch all trend lines for any make or break activity.
Price action is in the 4hr and daily Cloud so might remain choppy for a while. The weekly candle closed as a bullish coloured ‘Spinning Top’ reflecting some indecision.
There is a bit of GBP data this week with CPI, Employment and Retail Sales and there is JPY CPI to monitor as well as all of the US data.
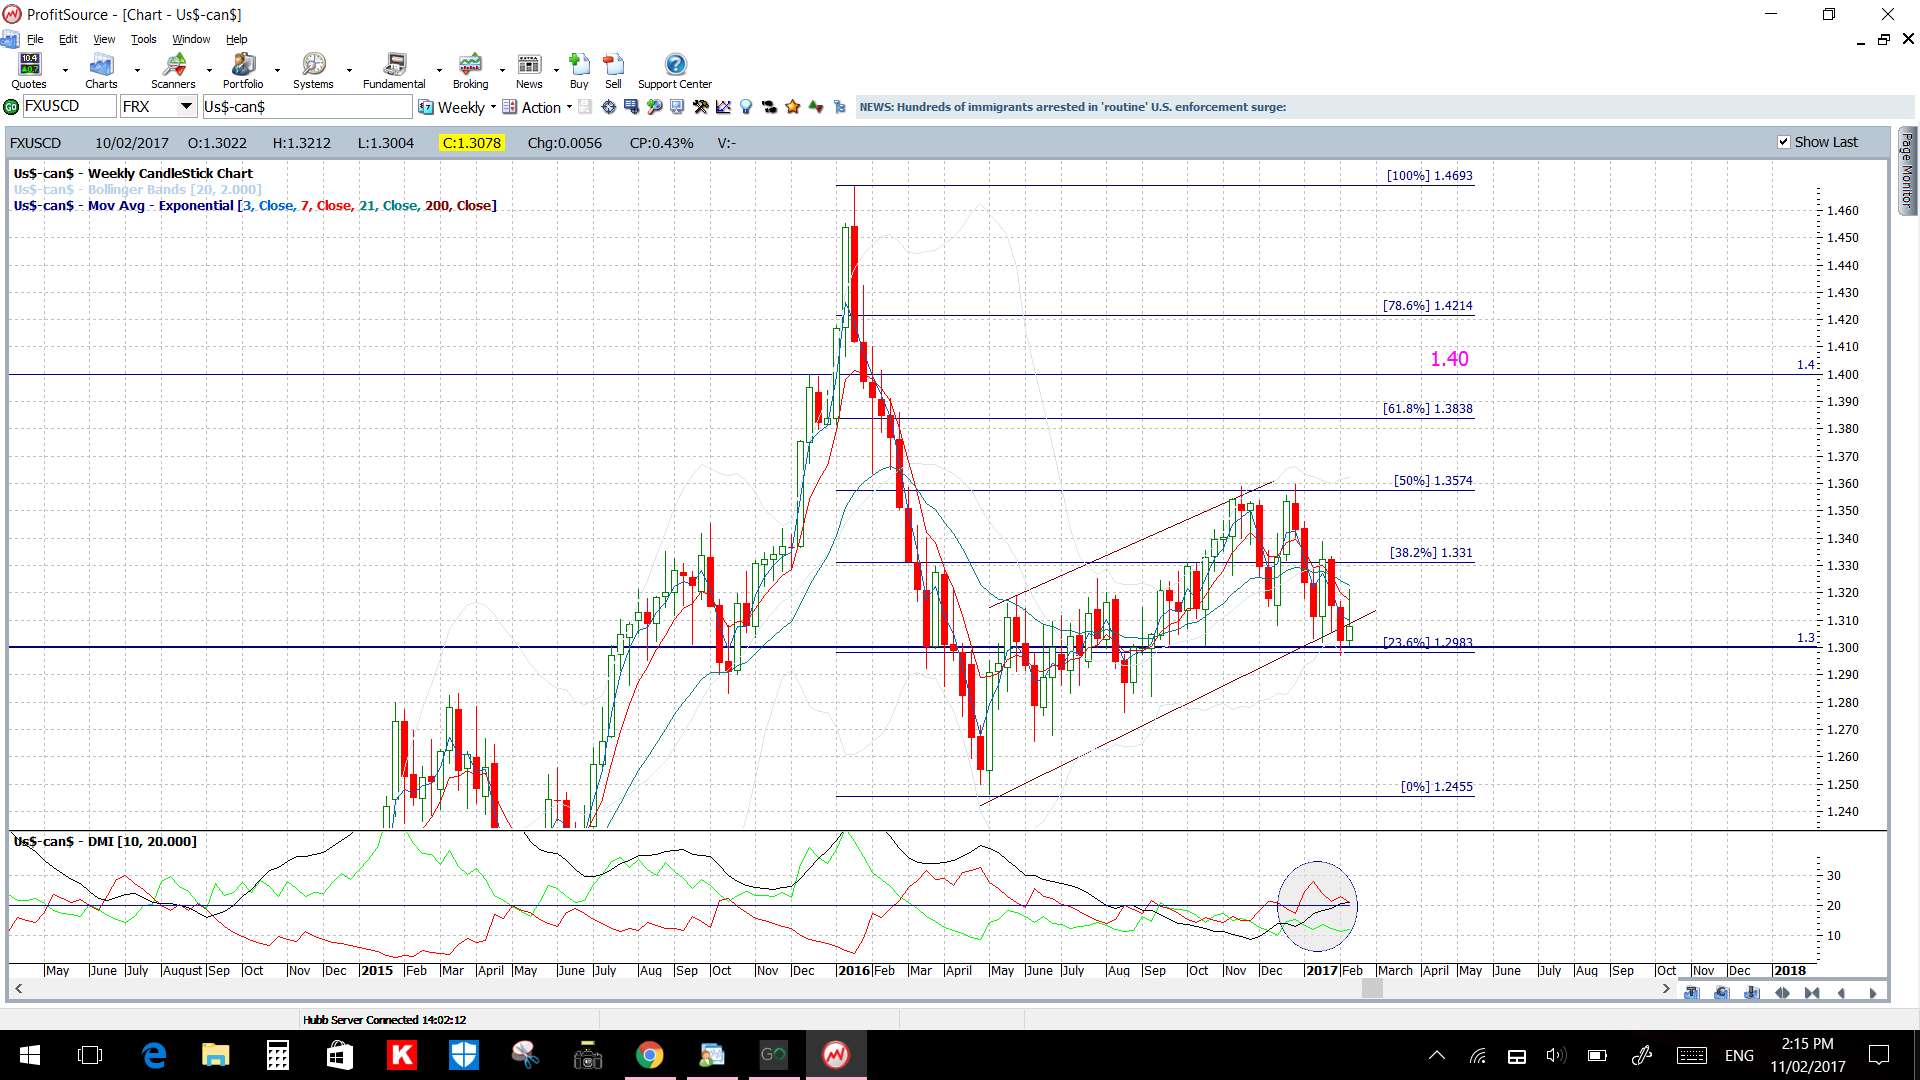
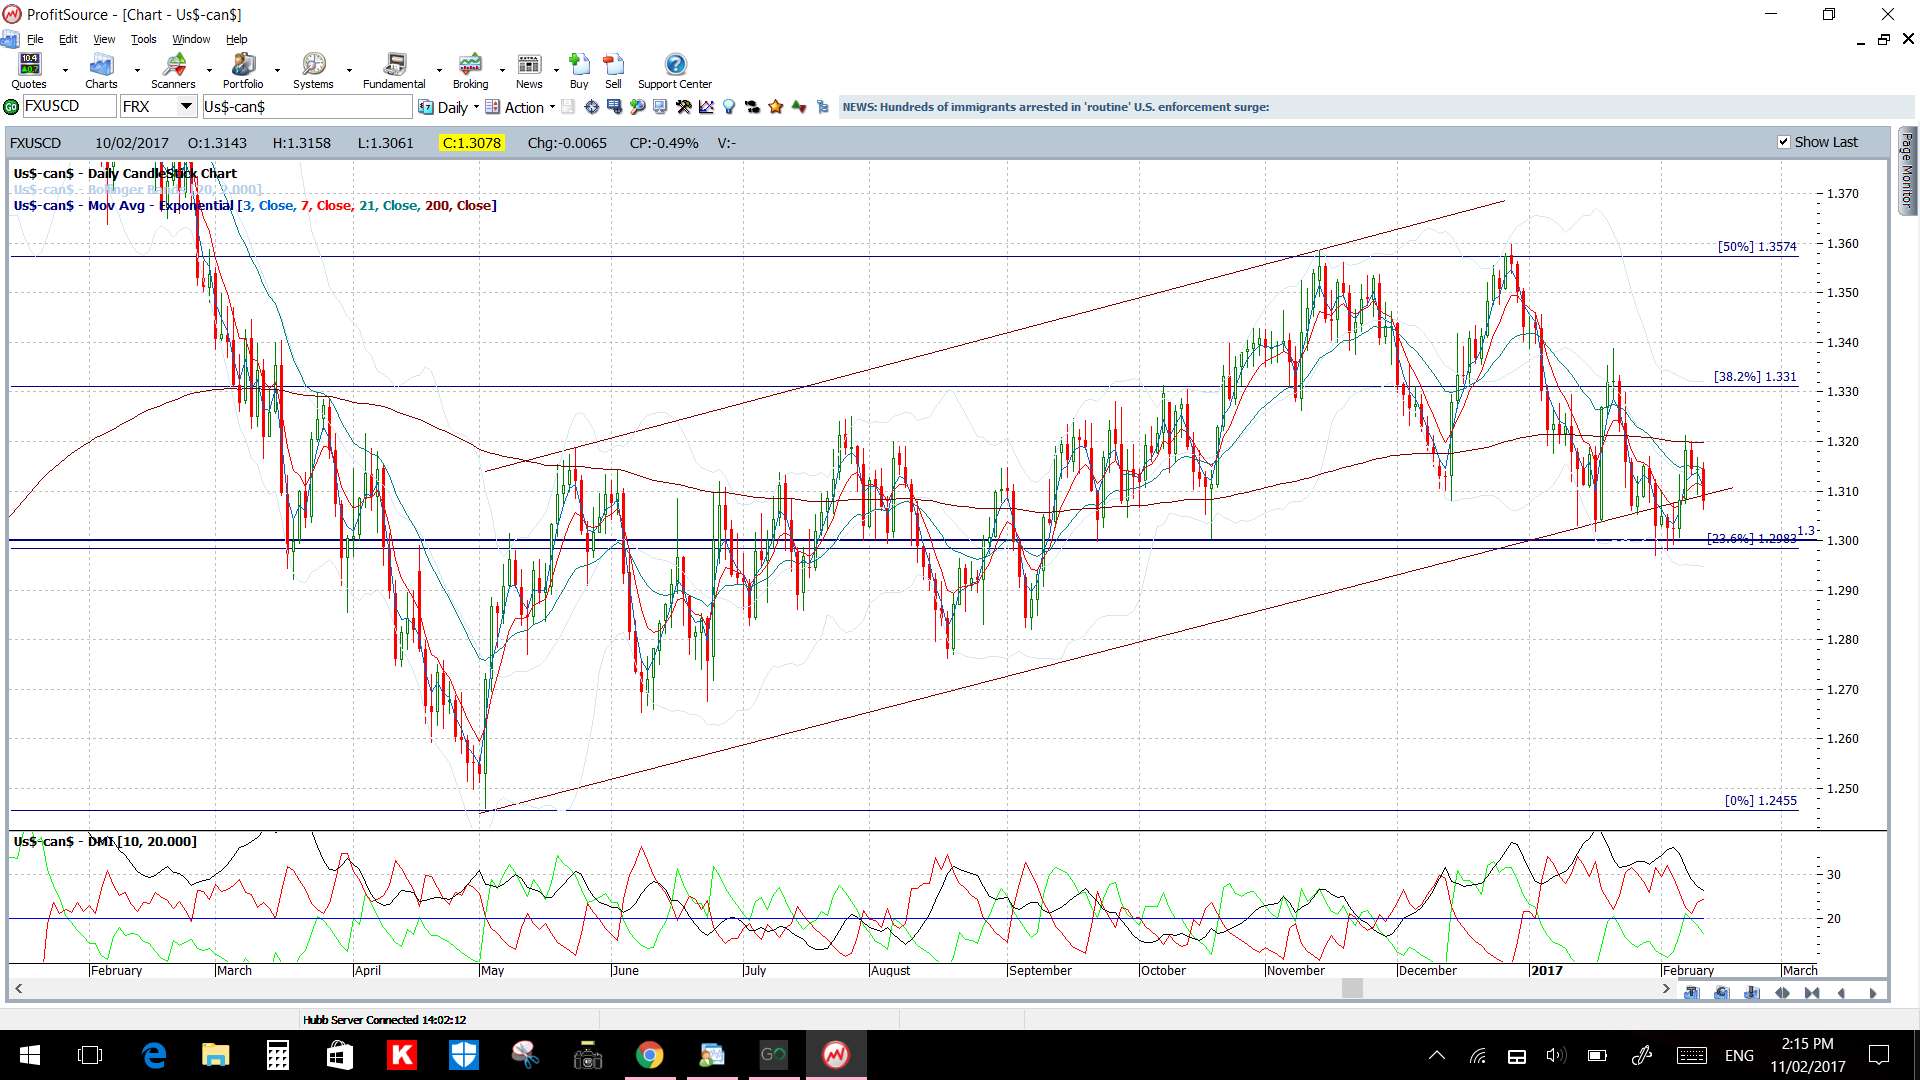
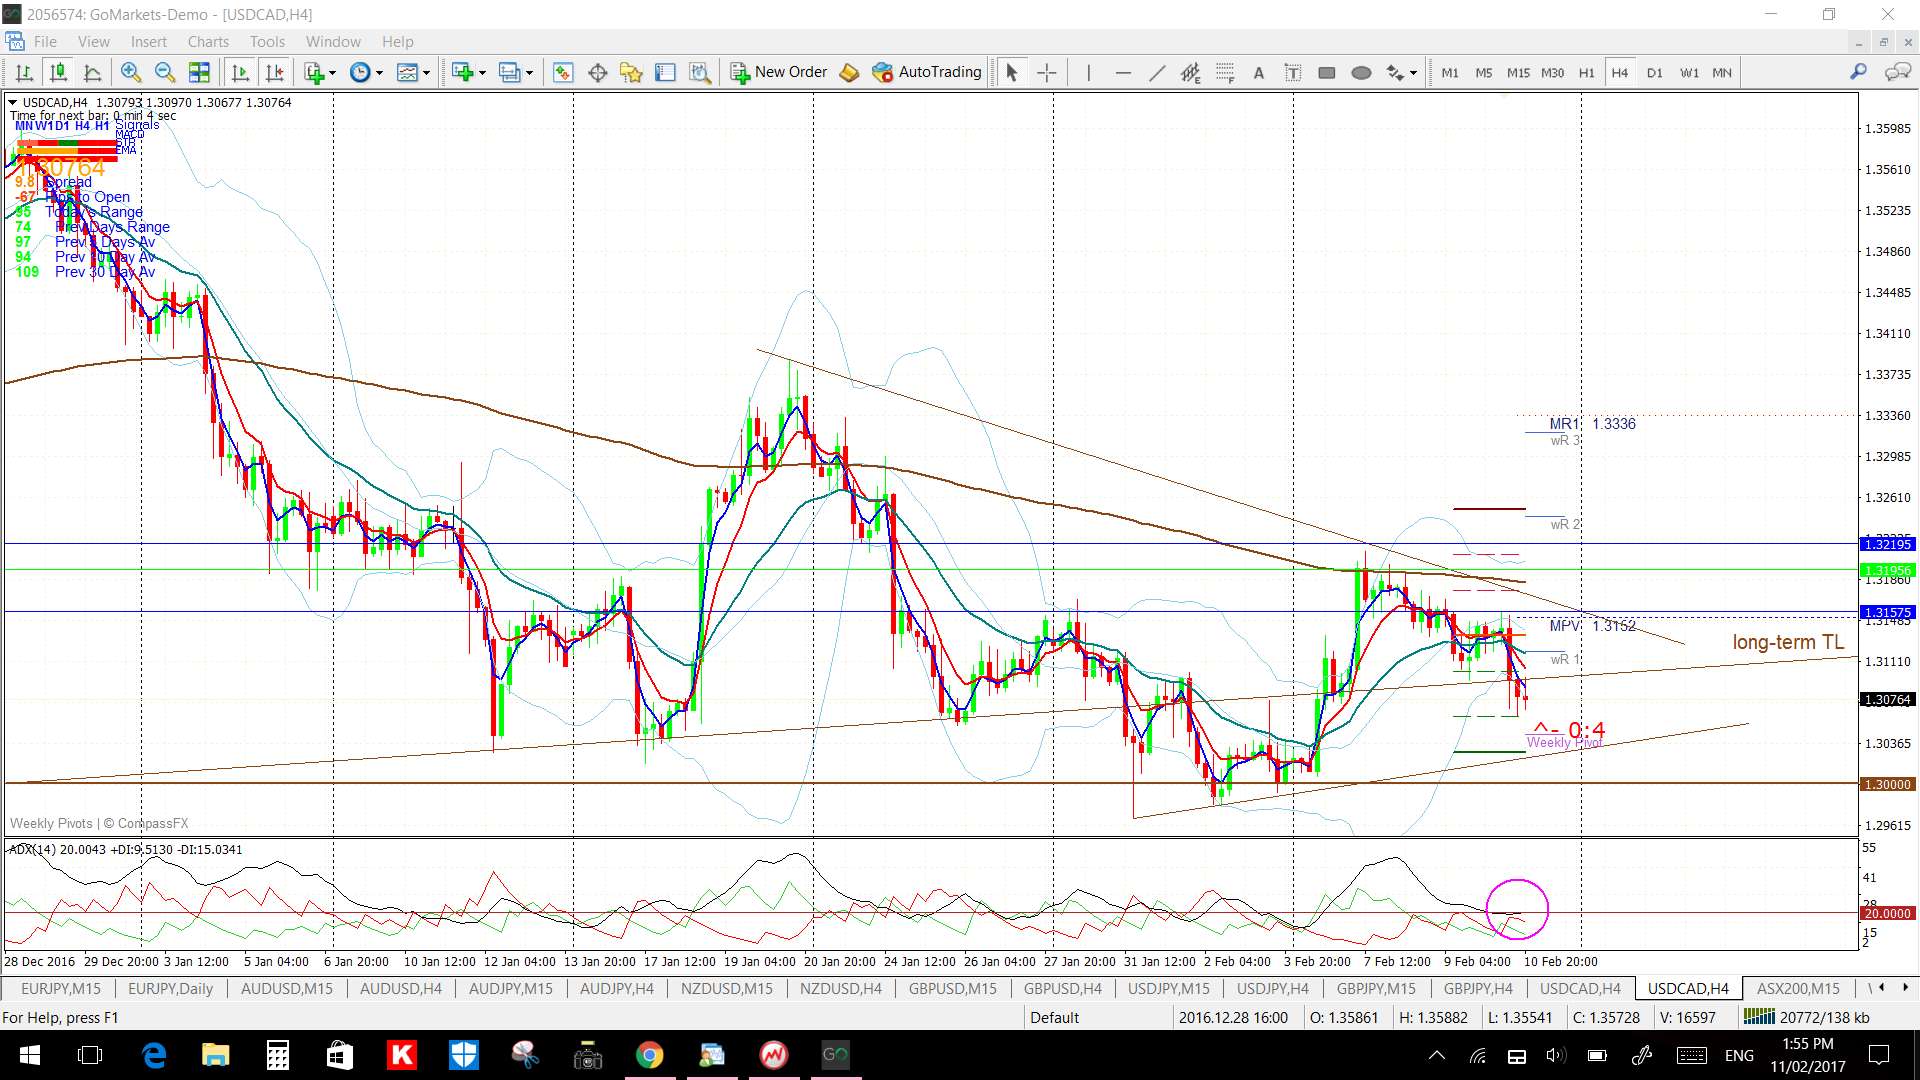
USD/CAD: The USD/CAD is consolidating within a 4hr triangle above the major 1.30 S/R level and this follows on from the break below the long-term trading channel and monthly chart triangle.
Price is only just above thin 4hr Cloud and below the daily Cloud so a break of 1.30 could get this pair going. This remains the level to watch for any make or break activity.
The weekly candle closed as a bullish coloured ‘Inside’ candle reflecting this indecision.
There is CAD Manufacturing Sales data and all of the US data to monitor this week.
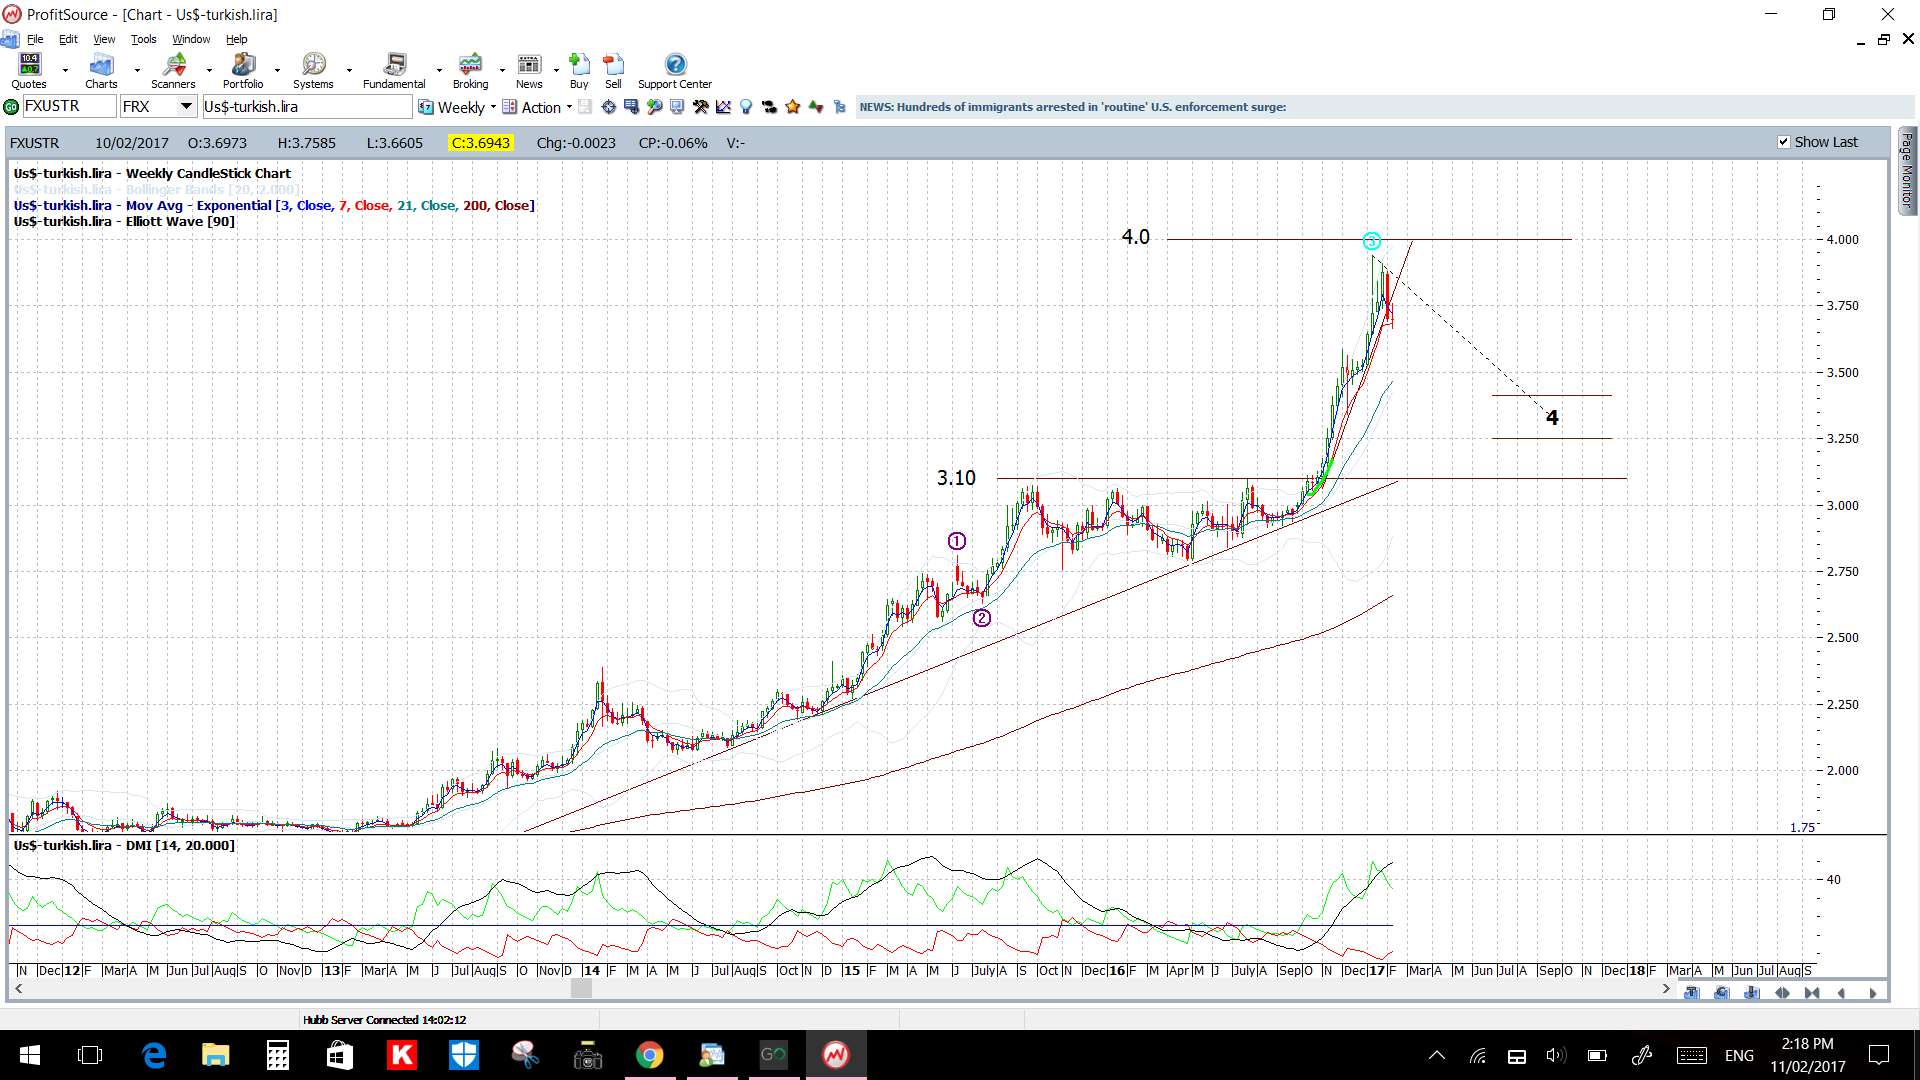
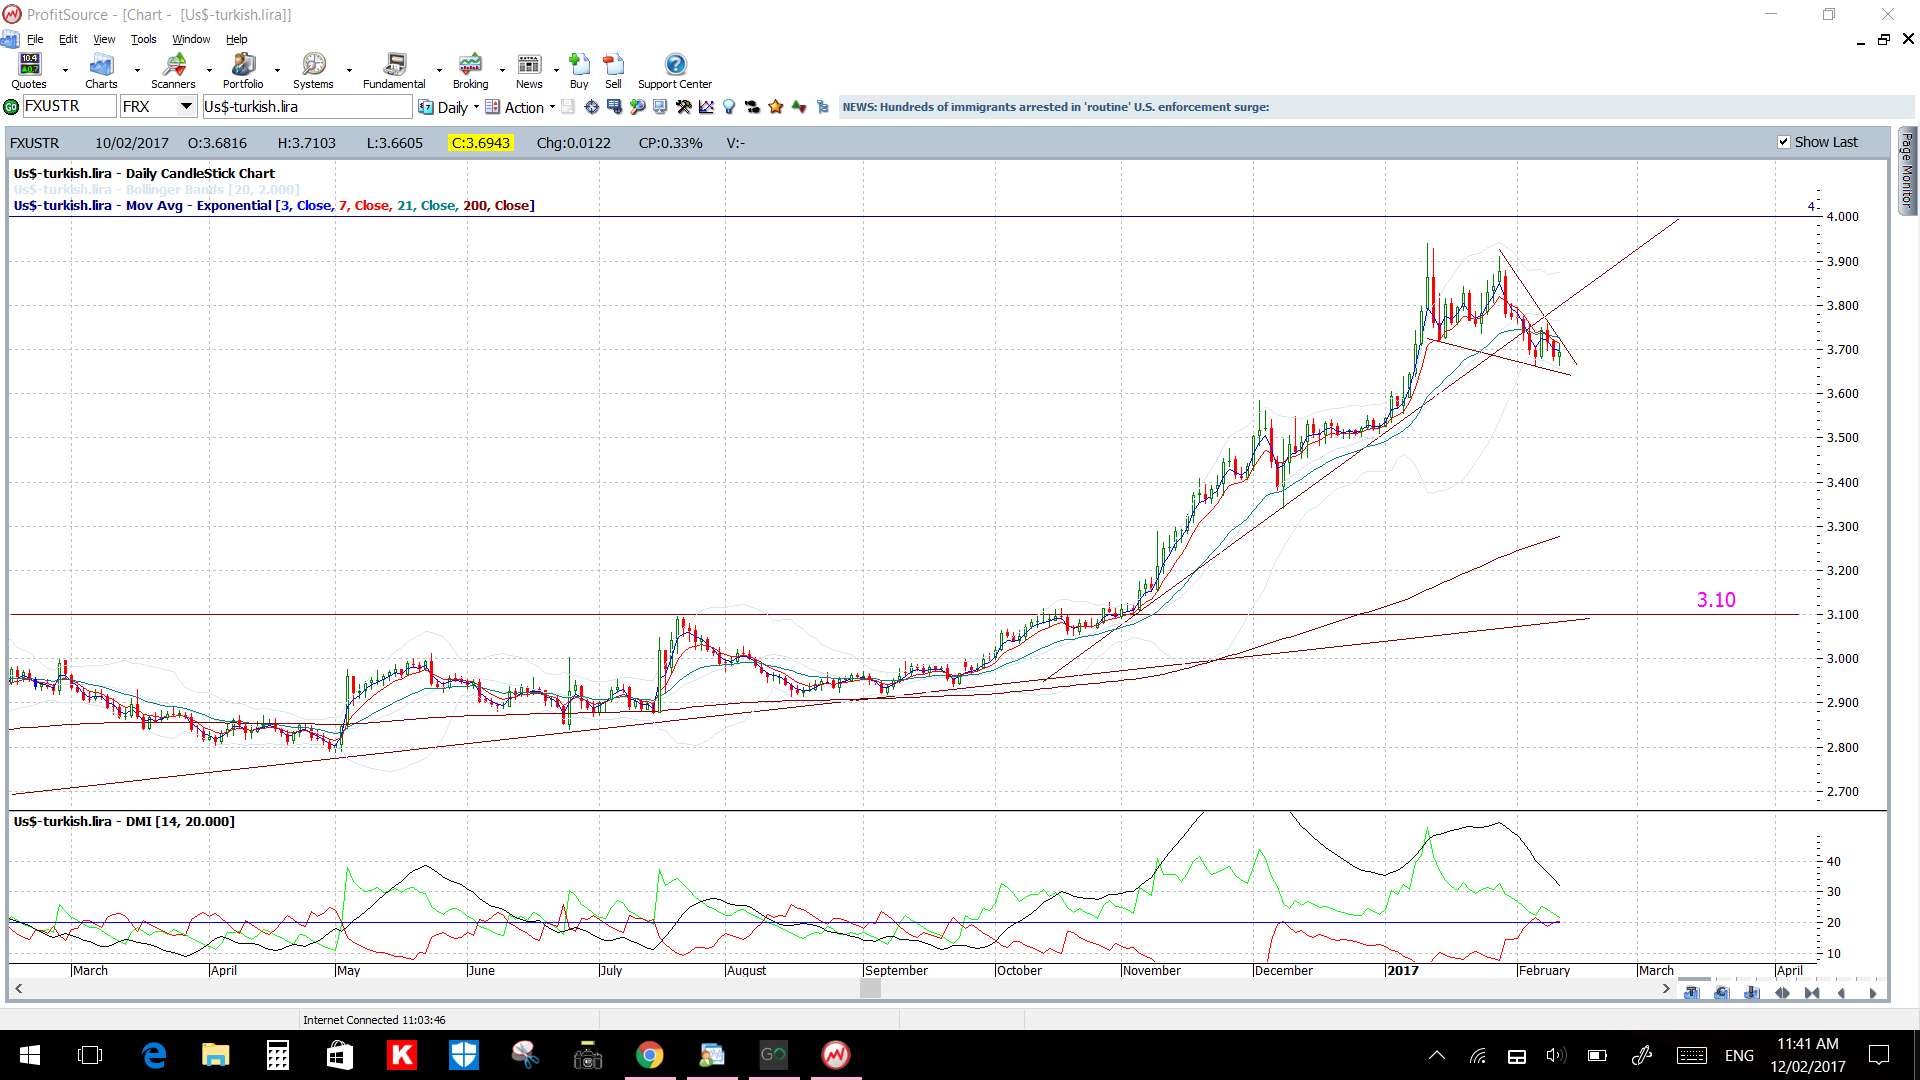
USD/TRY: The Turkish Lira continues to strengthen against the US$ but, whilst a support trend line has been broken, this price action also looks a bit Bull Flag like for now. Keep an eye on the Flag trend lines for any momentum-based make or break activity.
Price is blow the 4hr Cloud but above the daily Cloud.
The weekly candle closed a bullish coloured Doji reflecting this indecision.
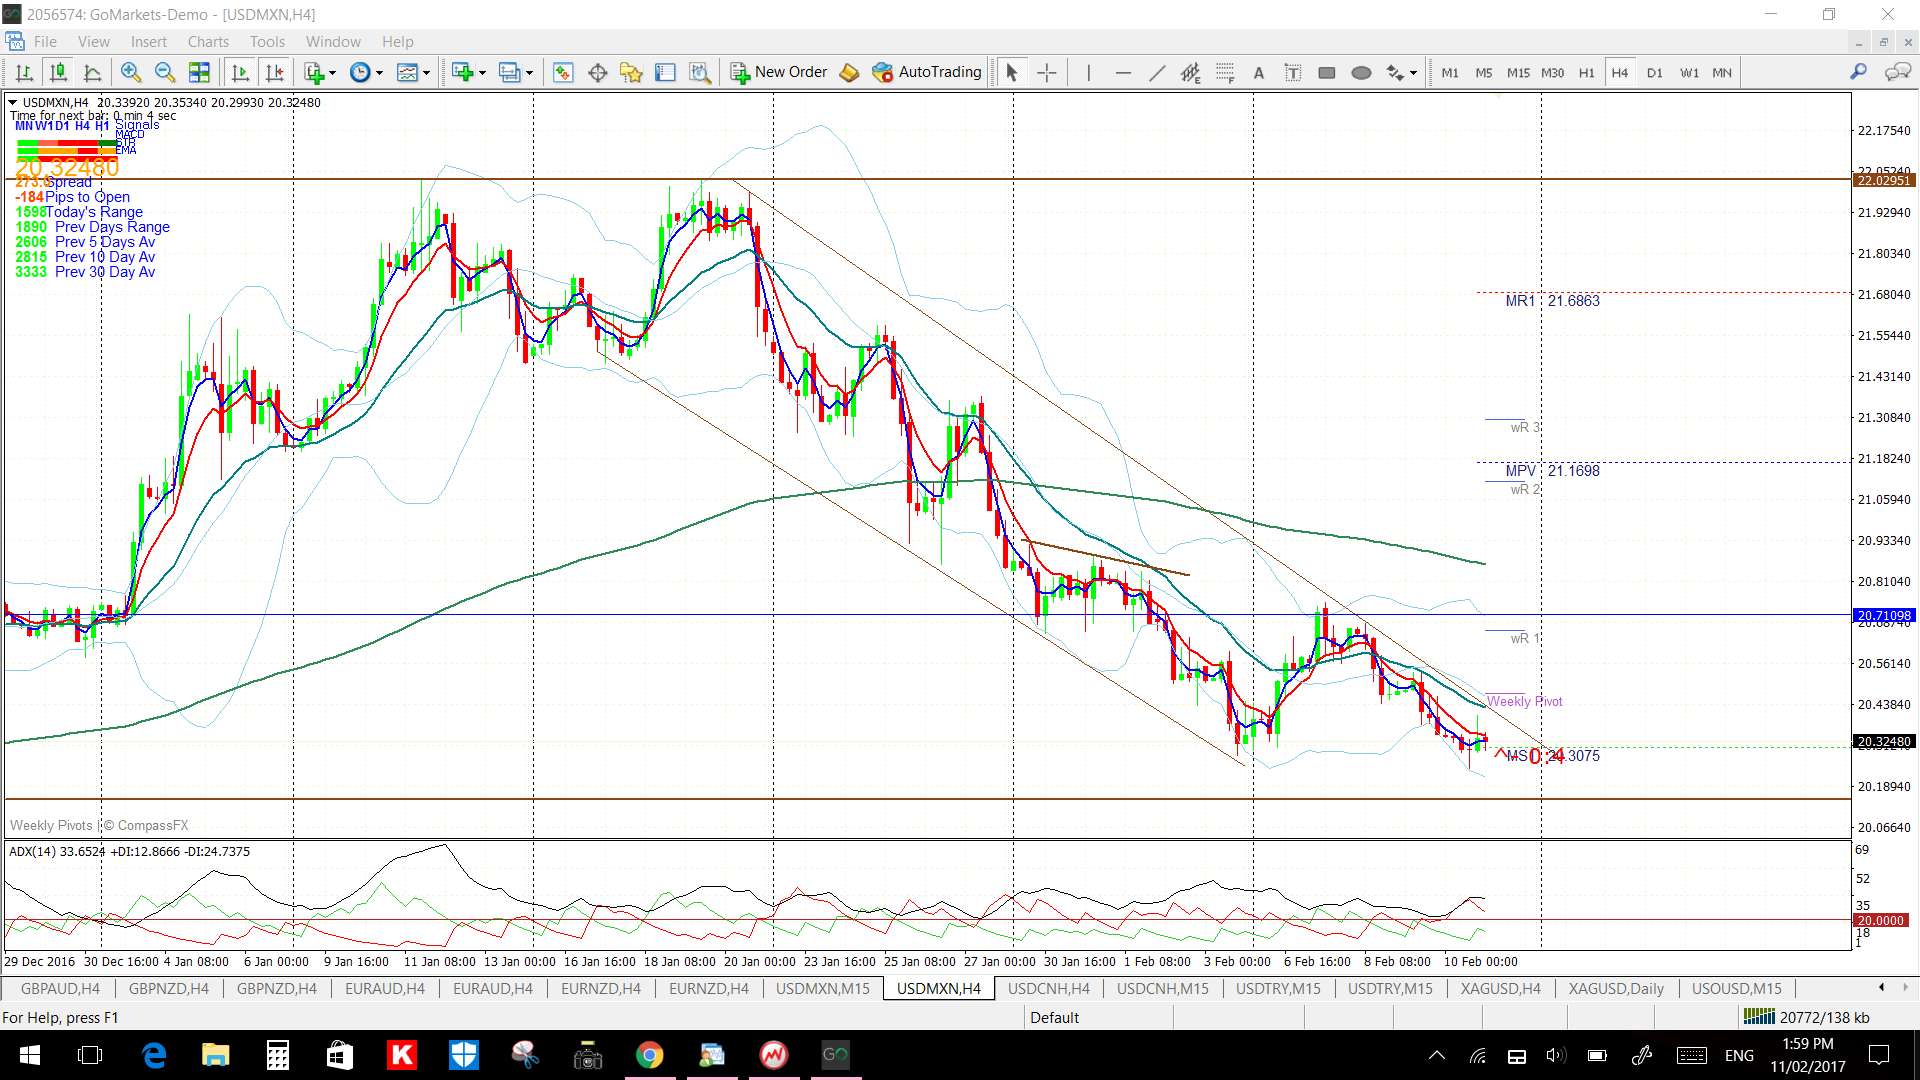
USD/MXN: Price pulled back a bit last week but a weekly support trend line remains in play here and the whole-number 20 level continues to be respected. I am still seeing price action trading within a descending trading channel on the 4hr chart so this is giving us trend lines to watch for make or break activity.
The Border Wall was back in the news over the w/e with further commentary fro US president Trump so this may impact price action in the coming week.
Price is below the 4hr Cloud but in the daily Cloud so choppiness may continue.
The weekly candle closed as a bearish coloured Doji reflecting indecision.
GBP/AUD 4hr: This pair is consolidating within a 4hr triangle giving us trend lines to watch for any momentum-based make or break activity.
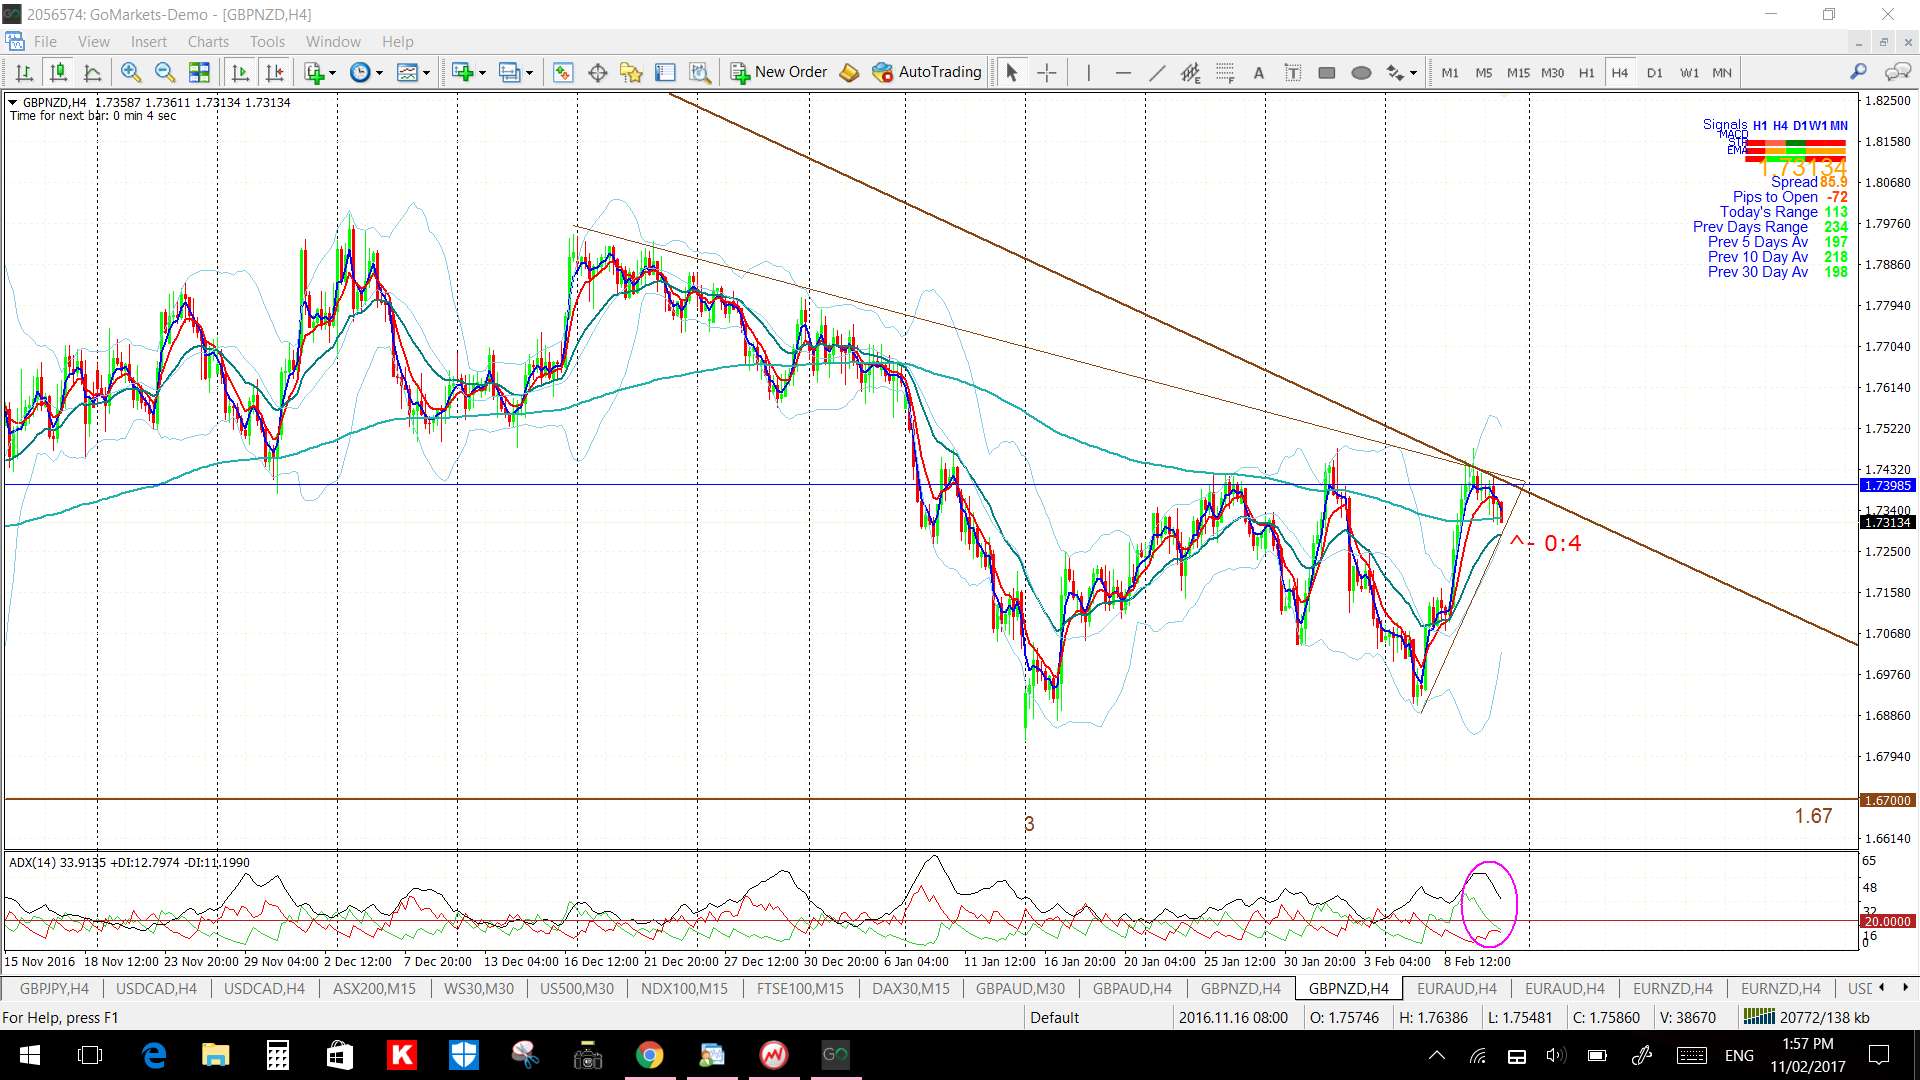
GBP/NZD 4hr: This pair is consolidating within a 4hr triangle, set within a larger daily-chart triangle, giving us trend lines to watch for any momentum-based make or break activity.
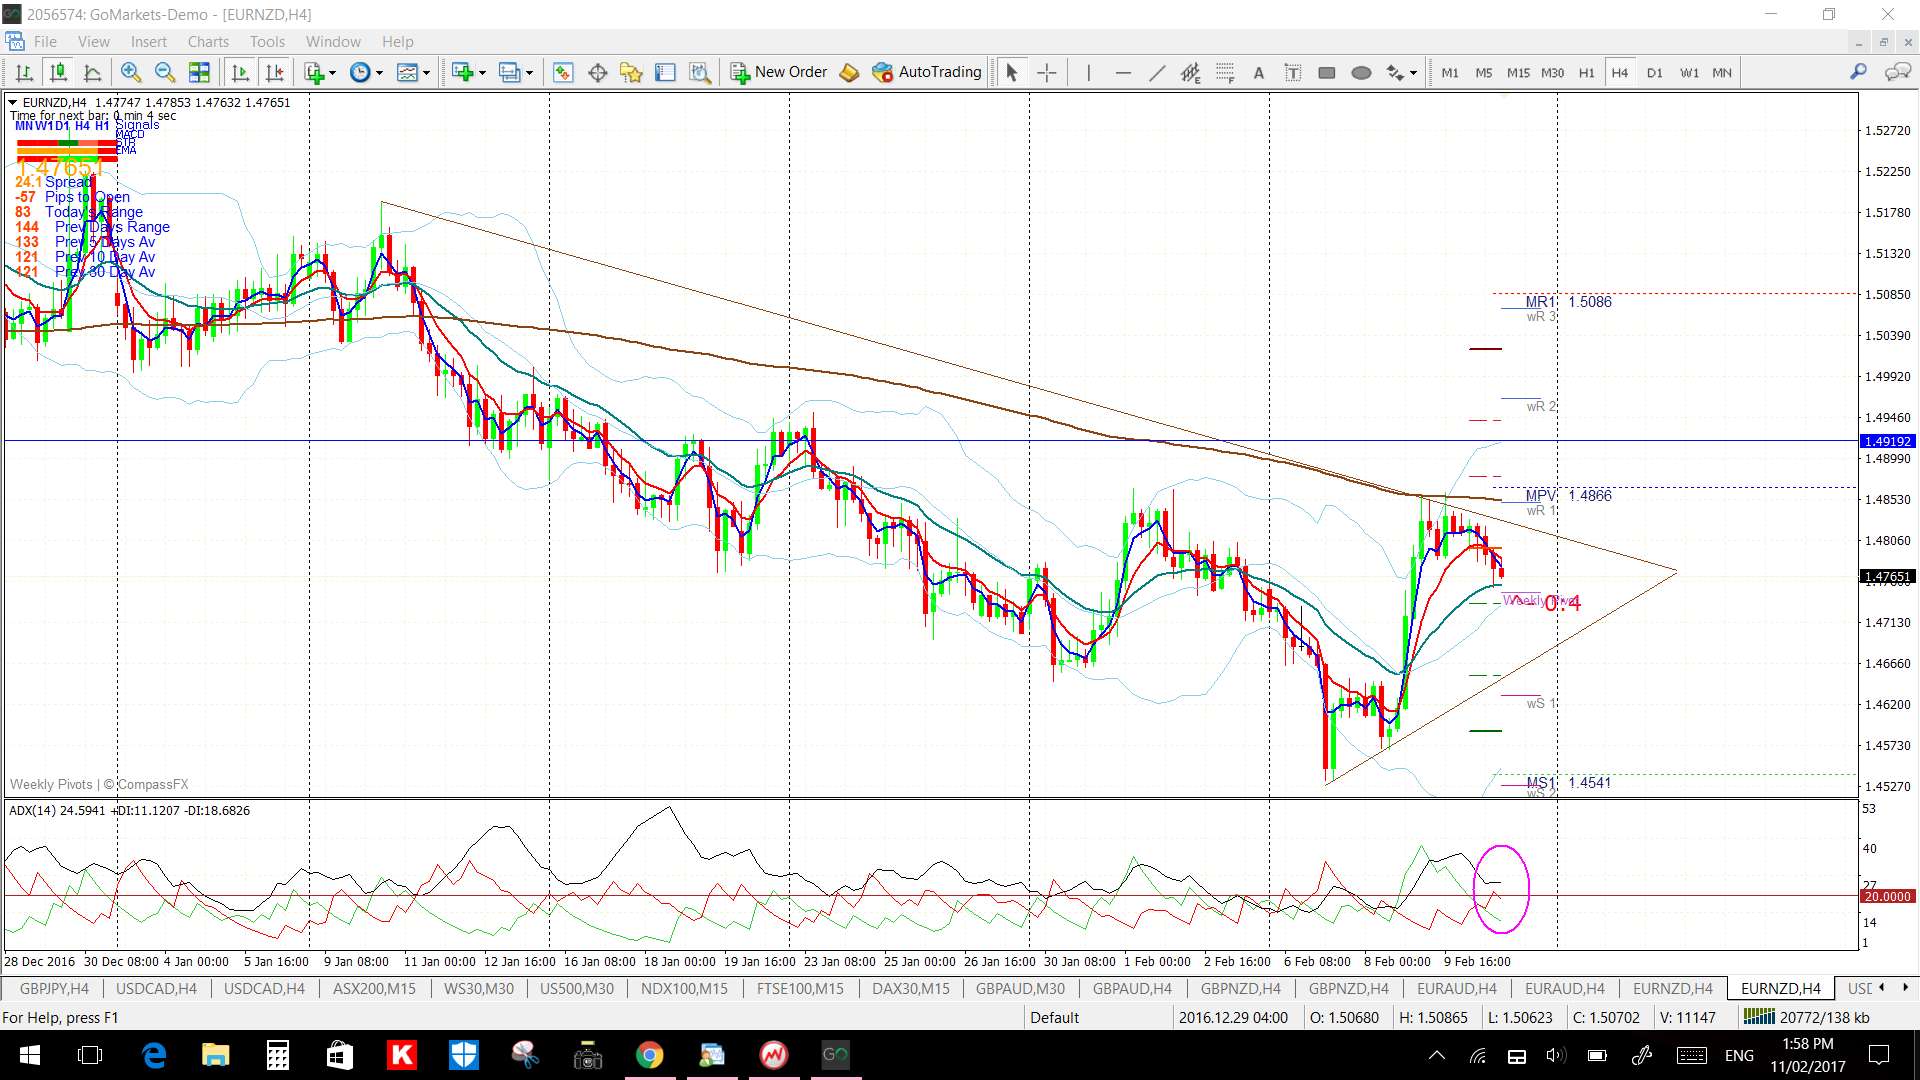
EUR/NZD 4hr: This pair is also consolidating within a 4hr triangle giving us trend lines to watch for any momentum-based make or break activity.
AUD/NZD monthly: I’m keeping an eye on this chart as price action drifts closer to the apex of the triangle and I’m on the lookout for any momentum-based trend line breakout.
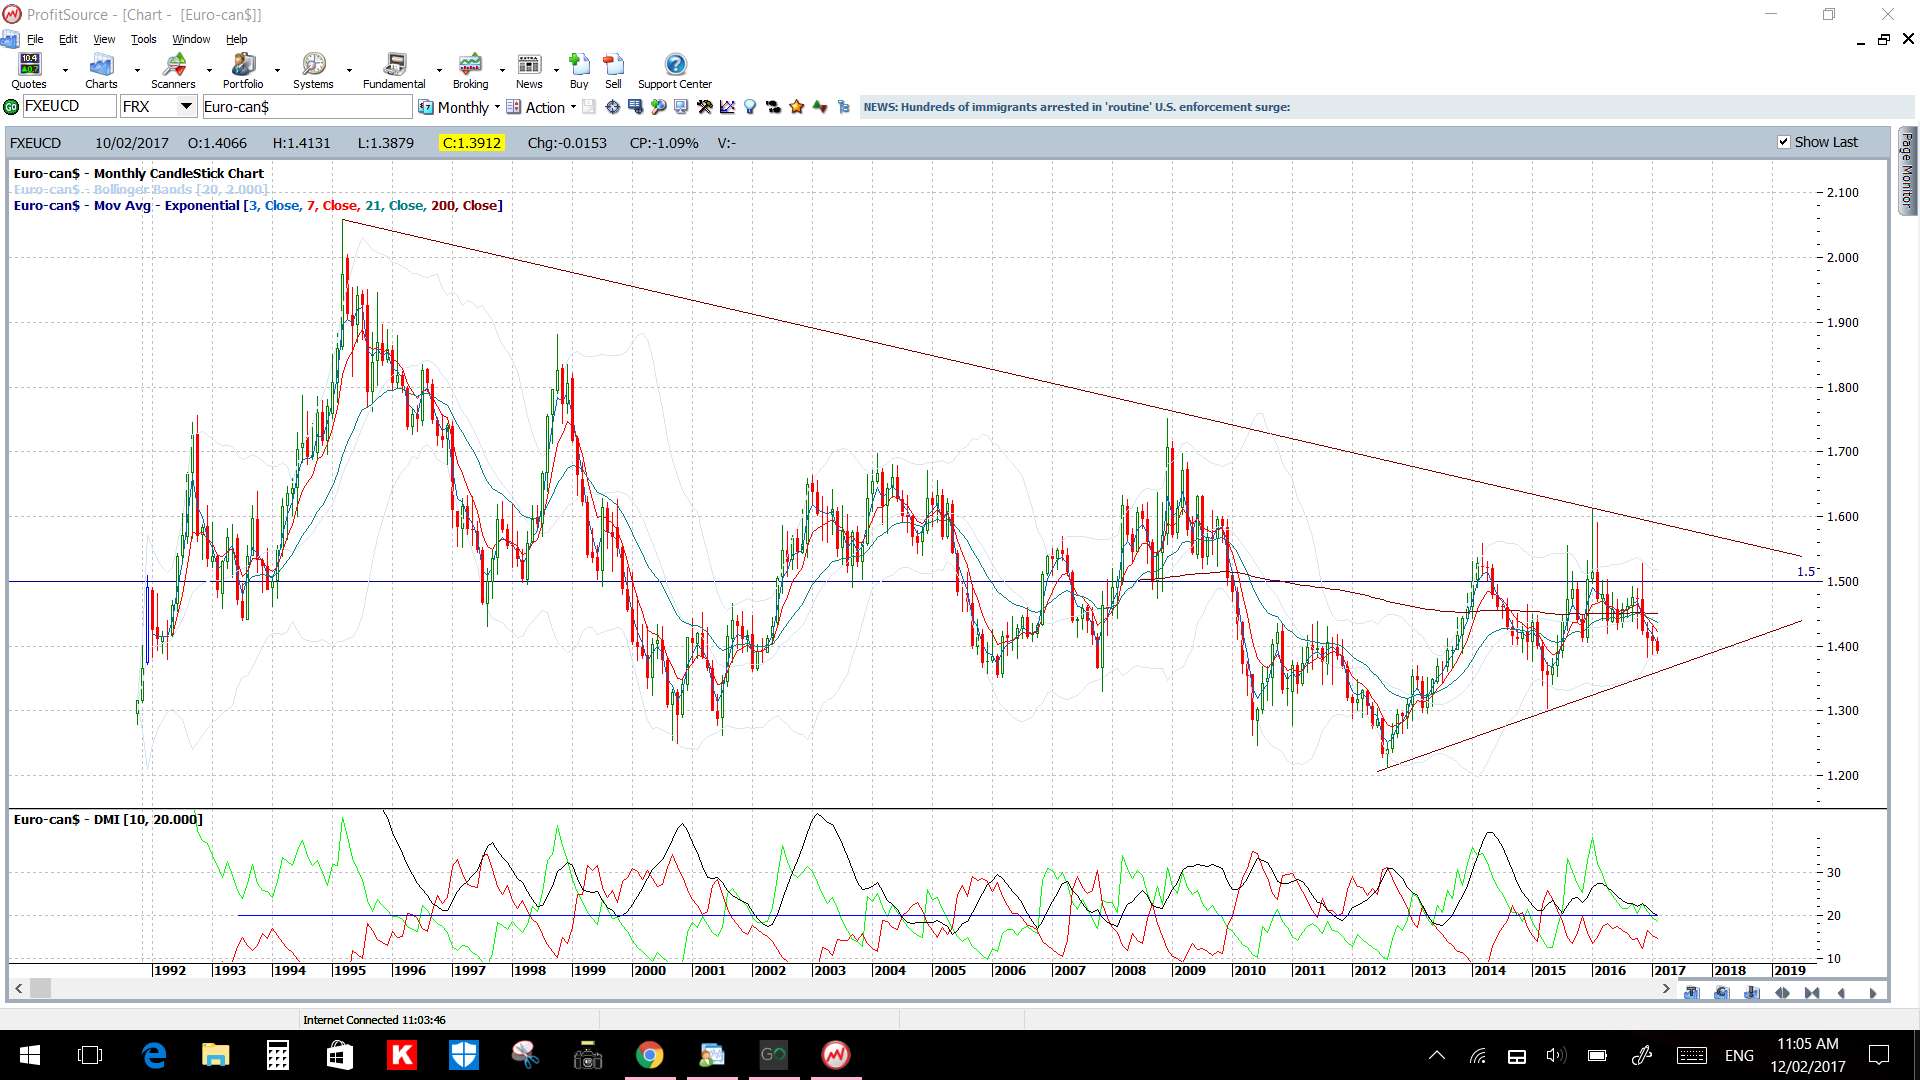
EUR/CAD monthly: I haven’t posted about this pair for some time now but it is drifting down to a significant trend line so has piqued my interest again:
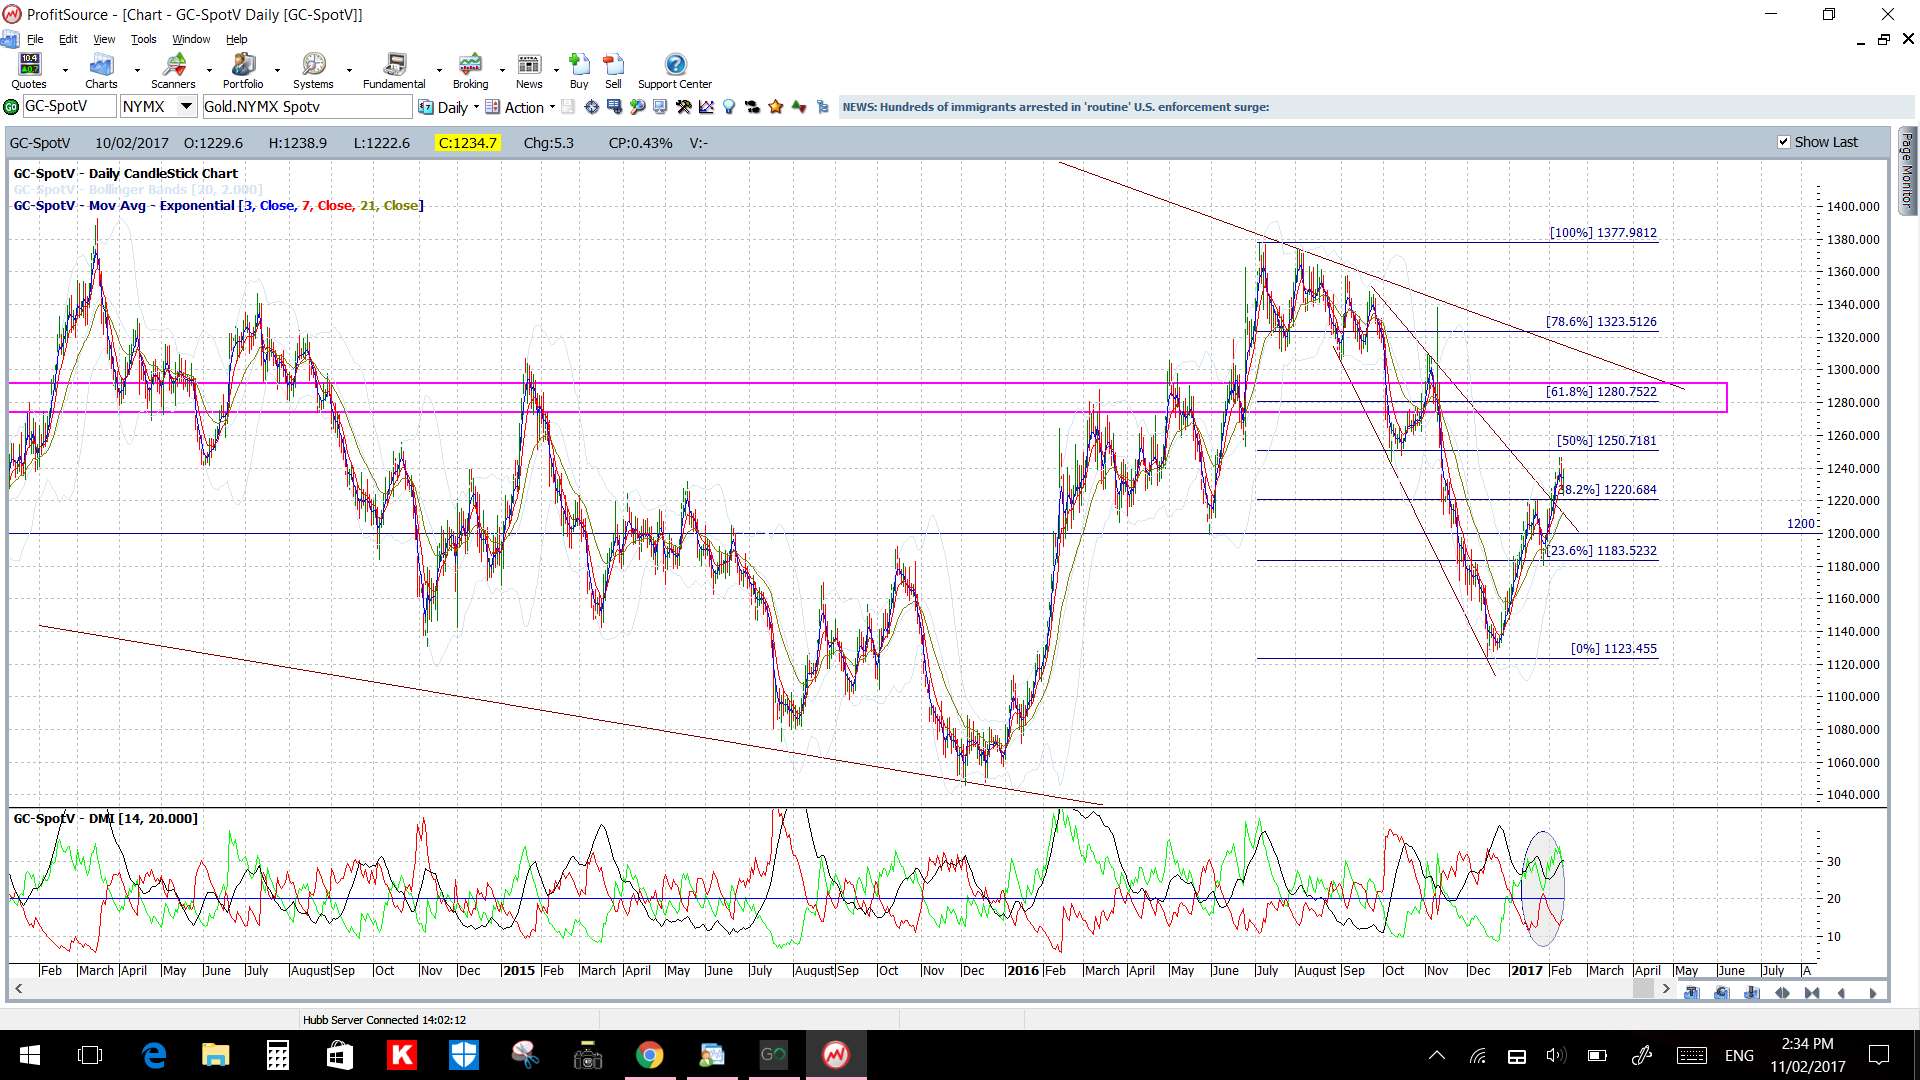
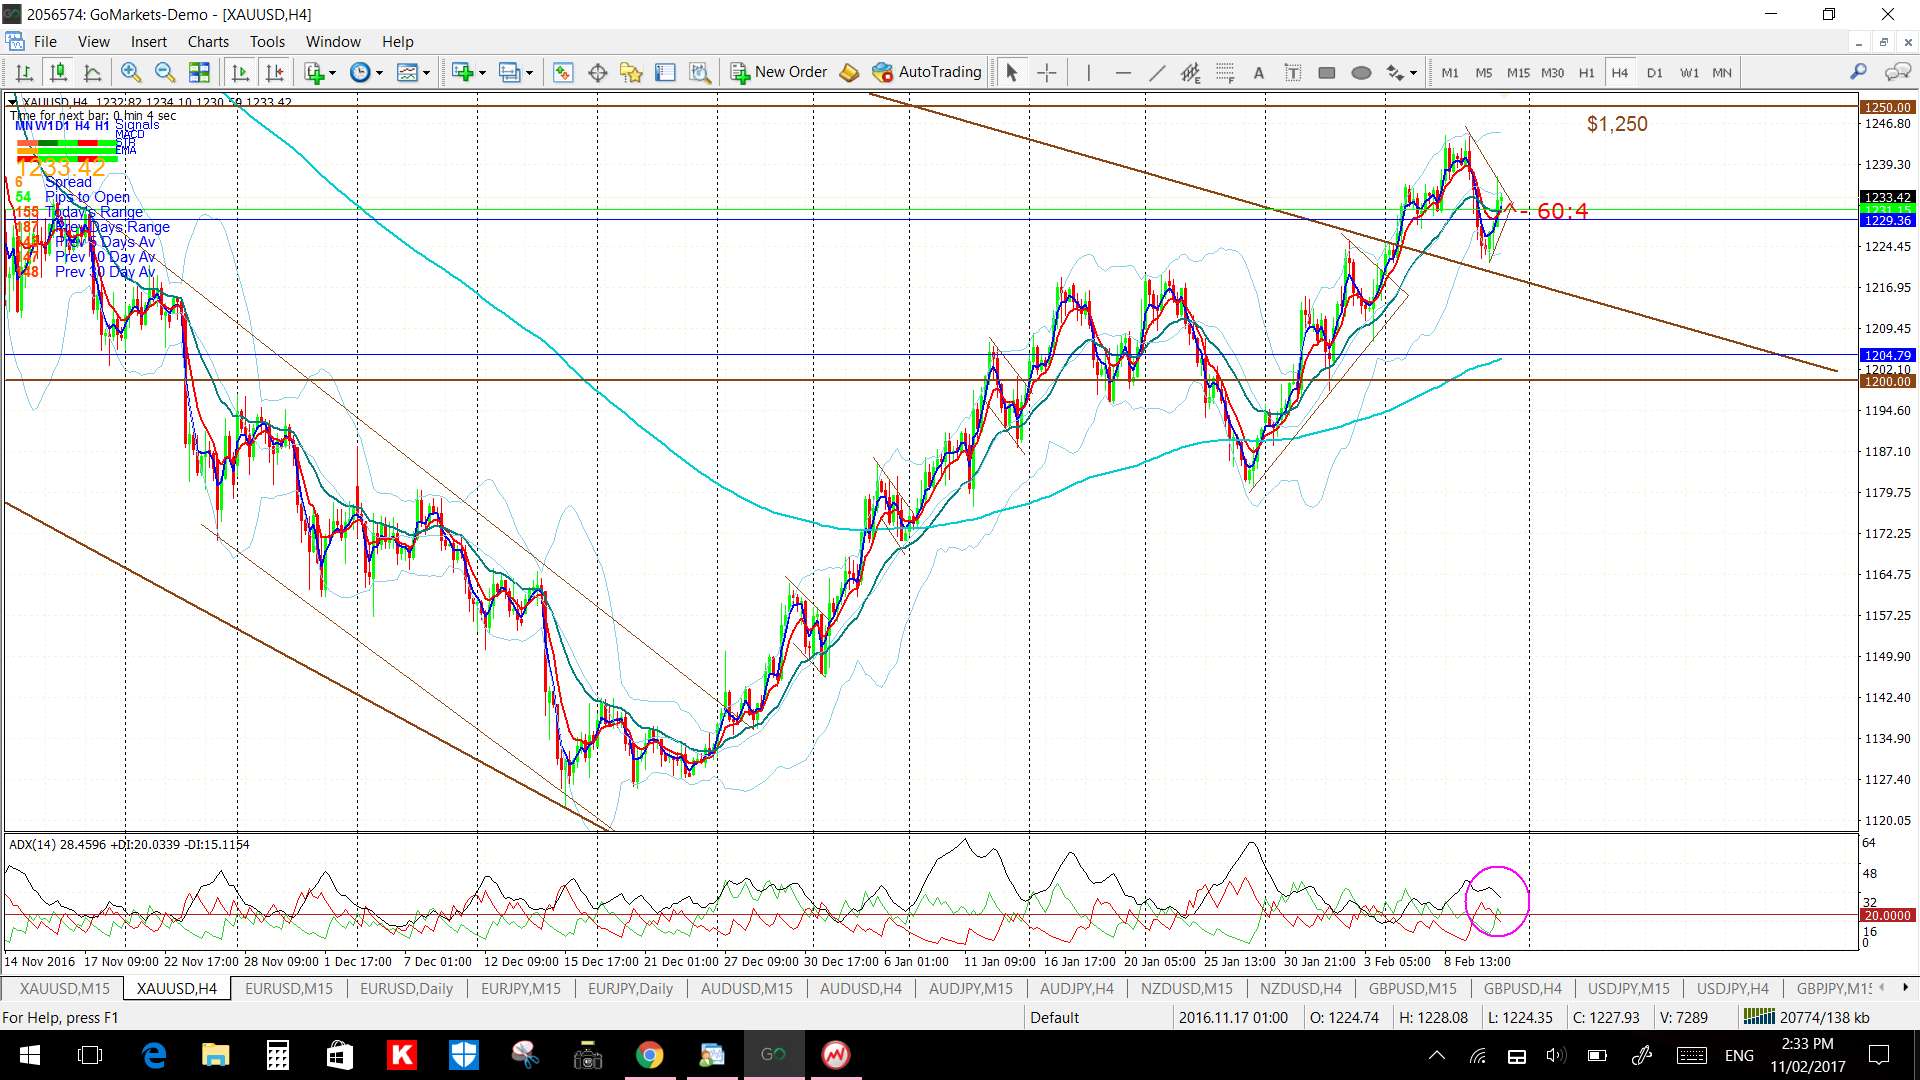
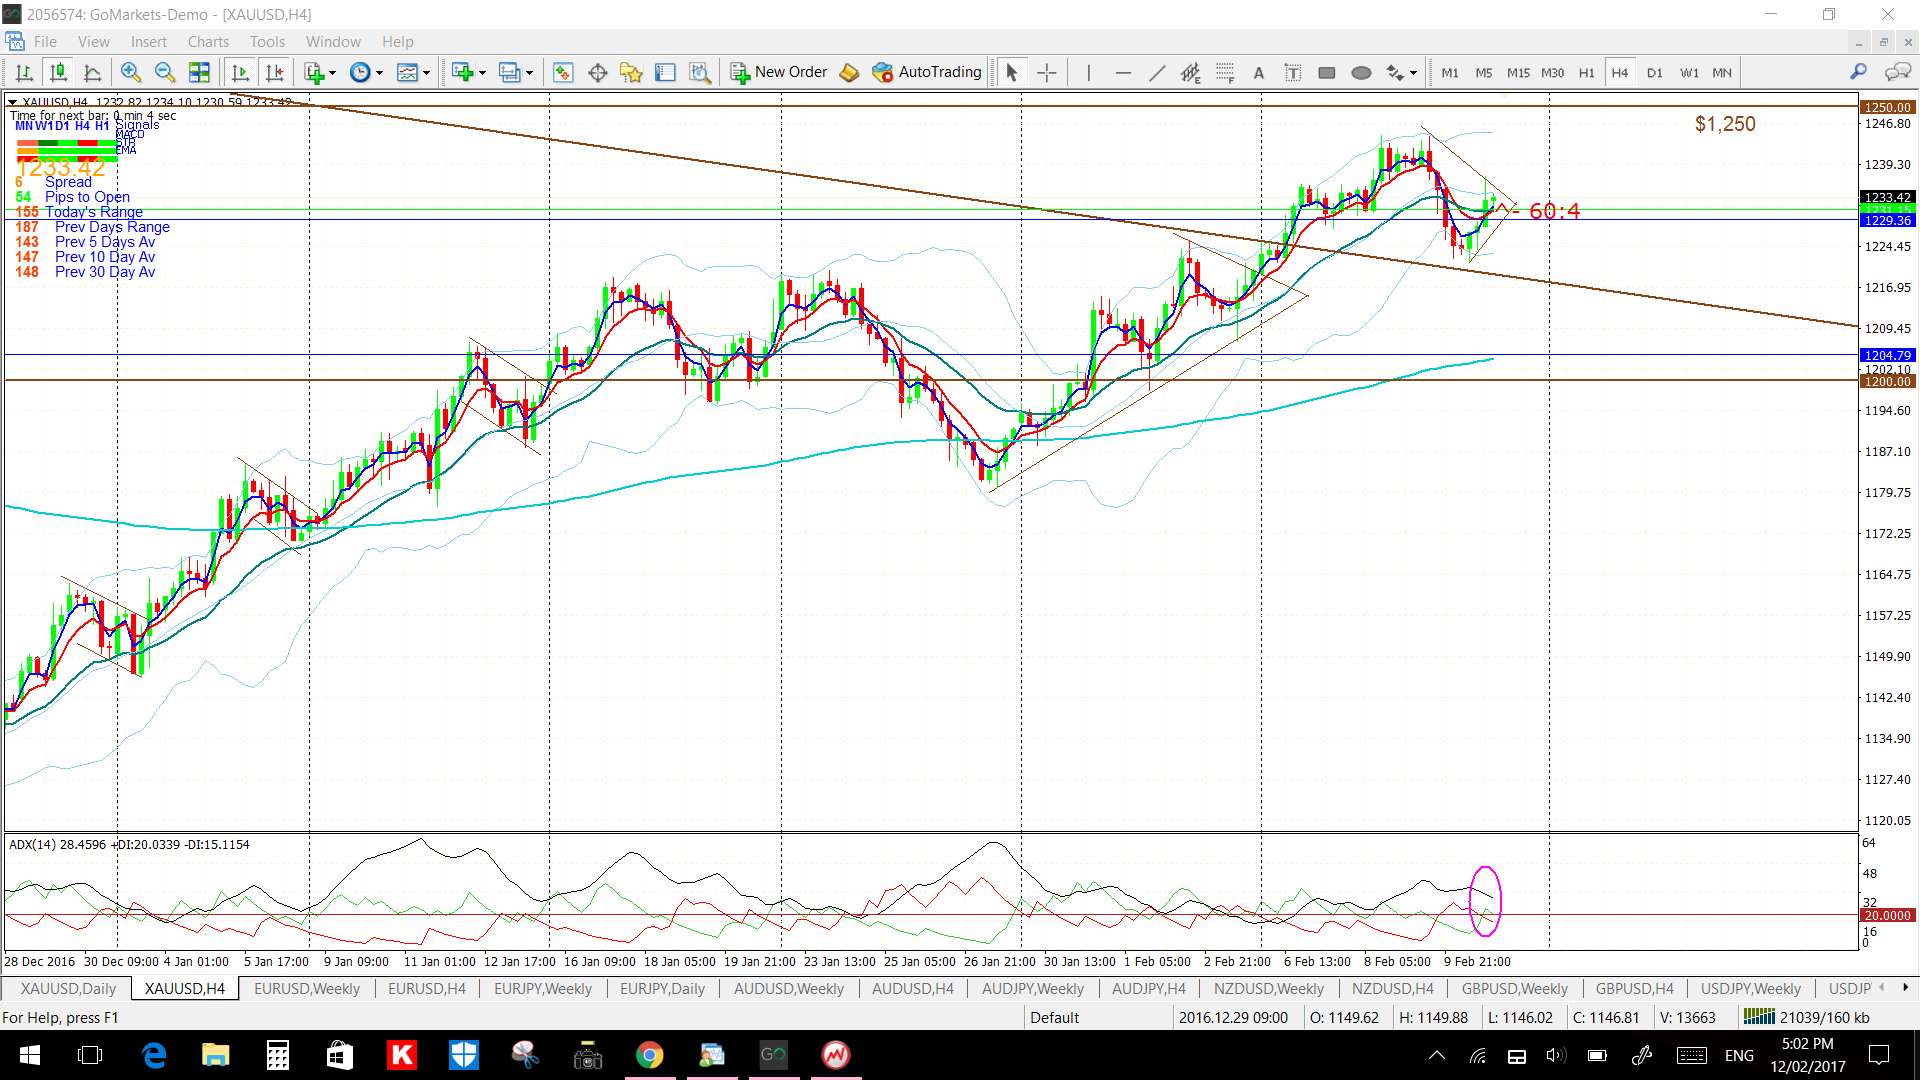
Gold: Price respected $1,250 resistance last week but, whereas I had thought it might pullback to test the $1,200 level, it simply pulled back to test the recently broken trend line from the daily chart’s wedge pattern.
Price is above the 4hr and daily Cloud and the weekly candle closed as a bullish candle.
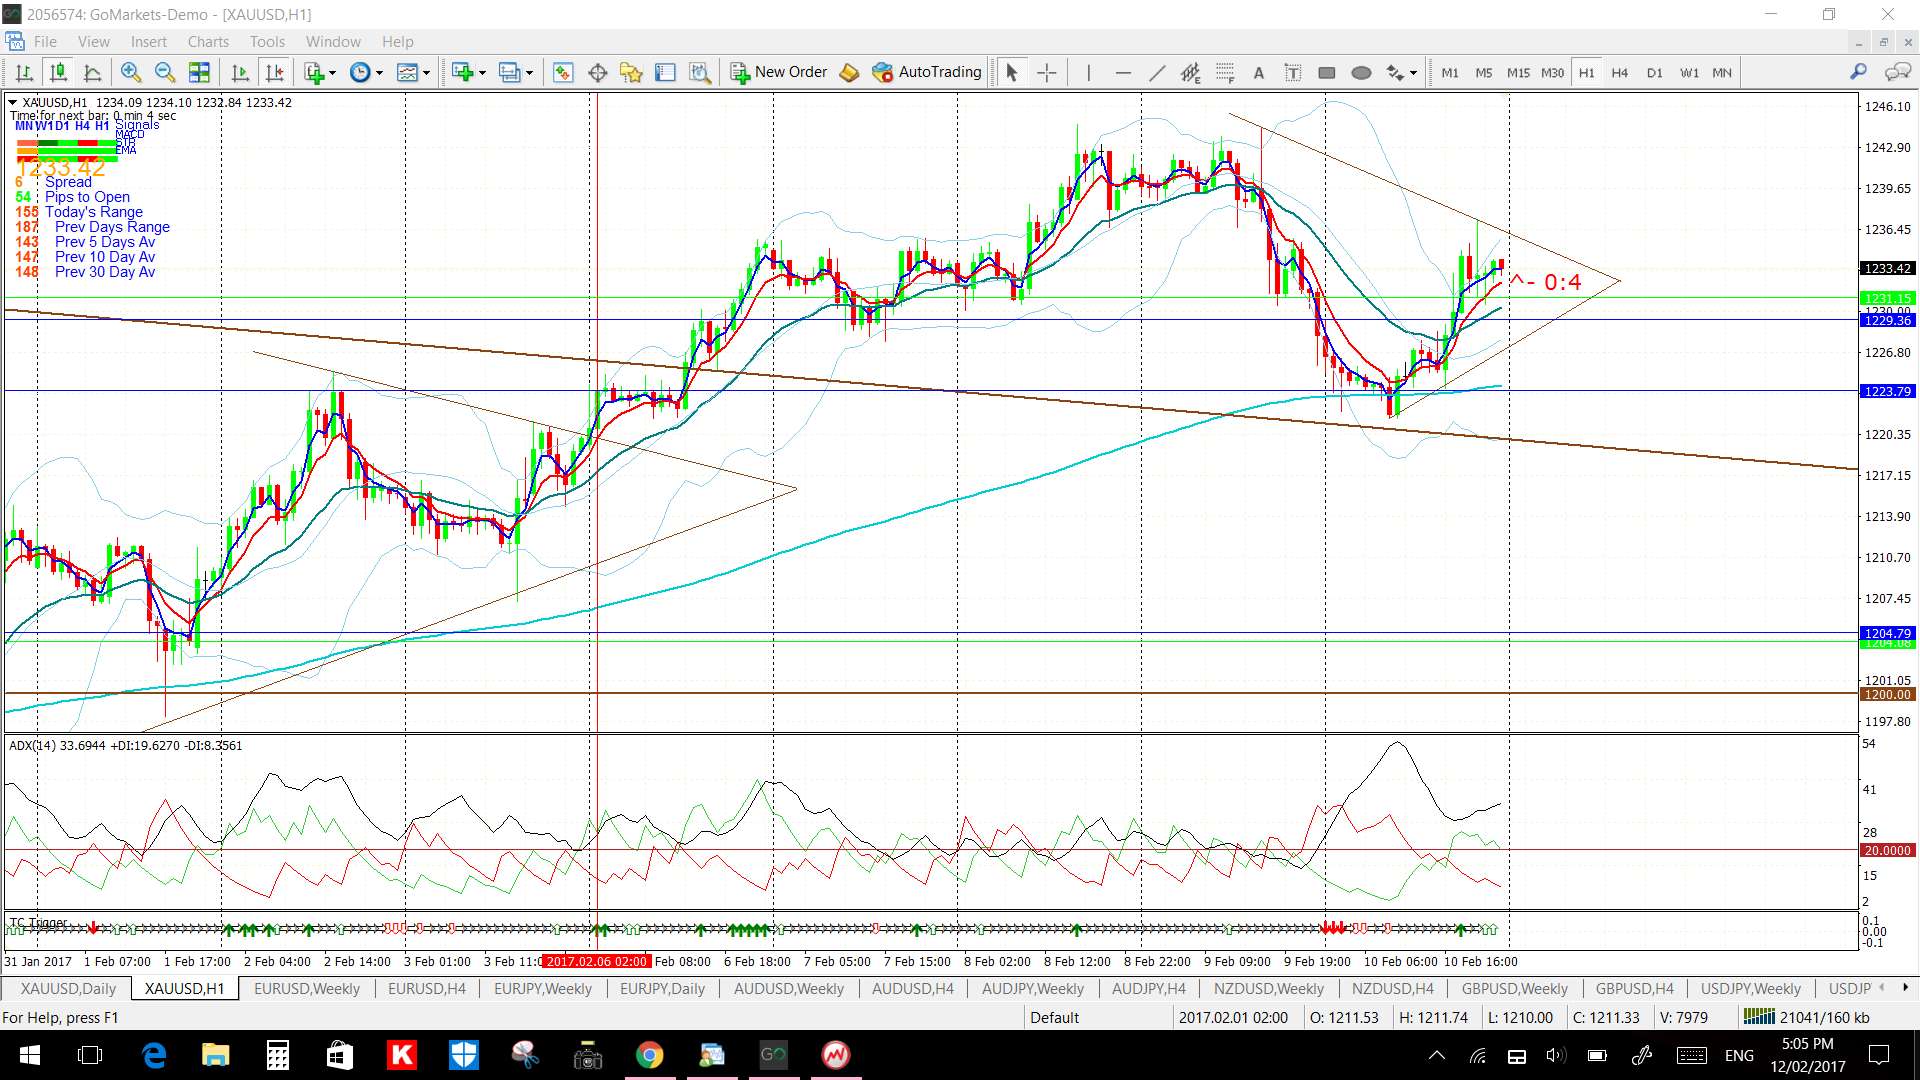
I’ve got a new triangle on the 4hr chart to monitor for any momentum-based breakout move. On this point, note the 60 minute chart below. Last week’s triangle breakout came early in the week and so I’ll be watching for any clear signals as early as Monday.
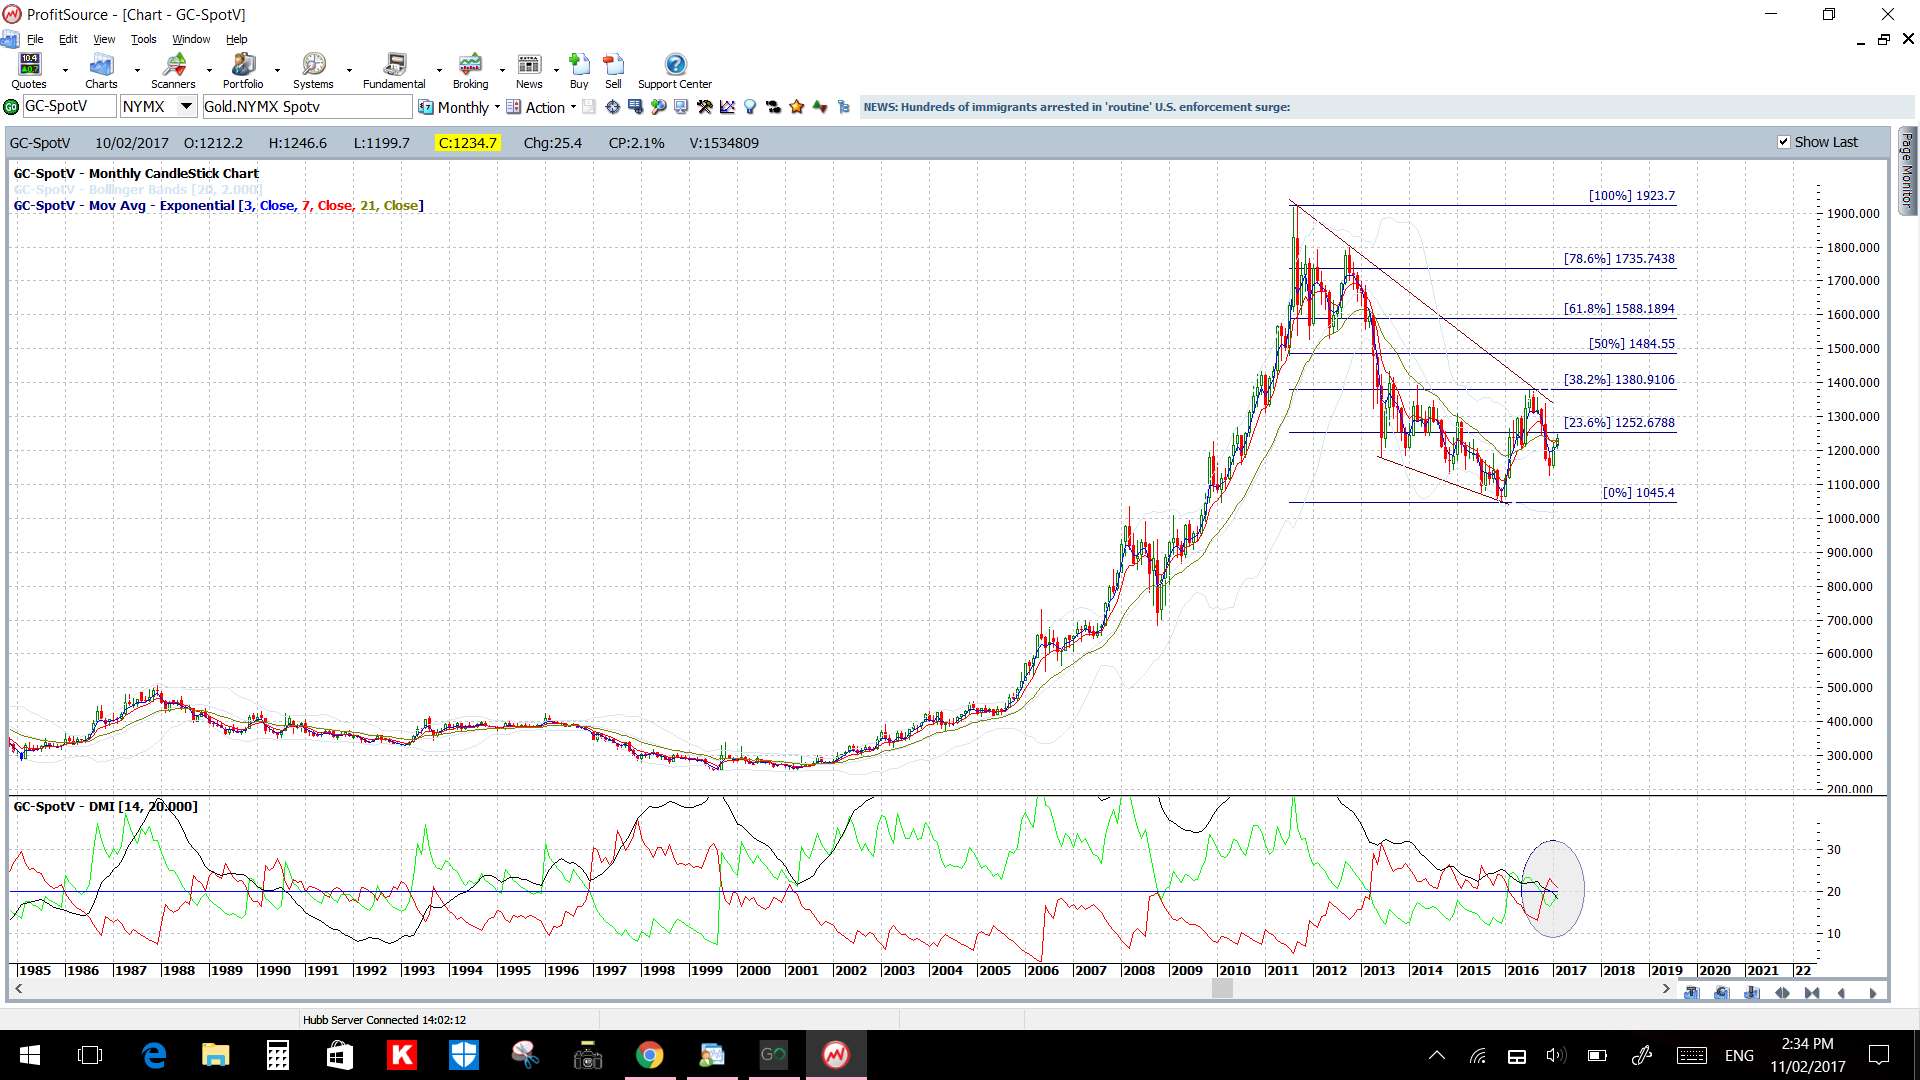
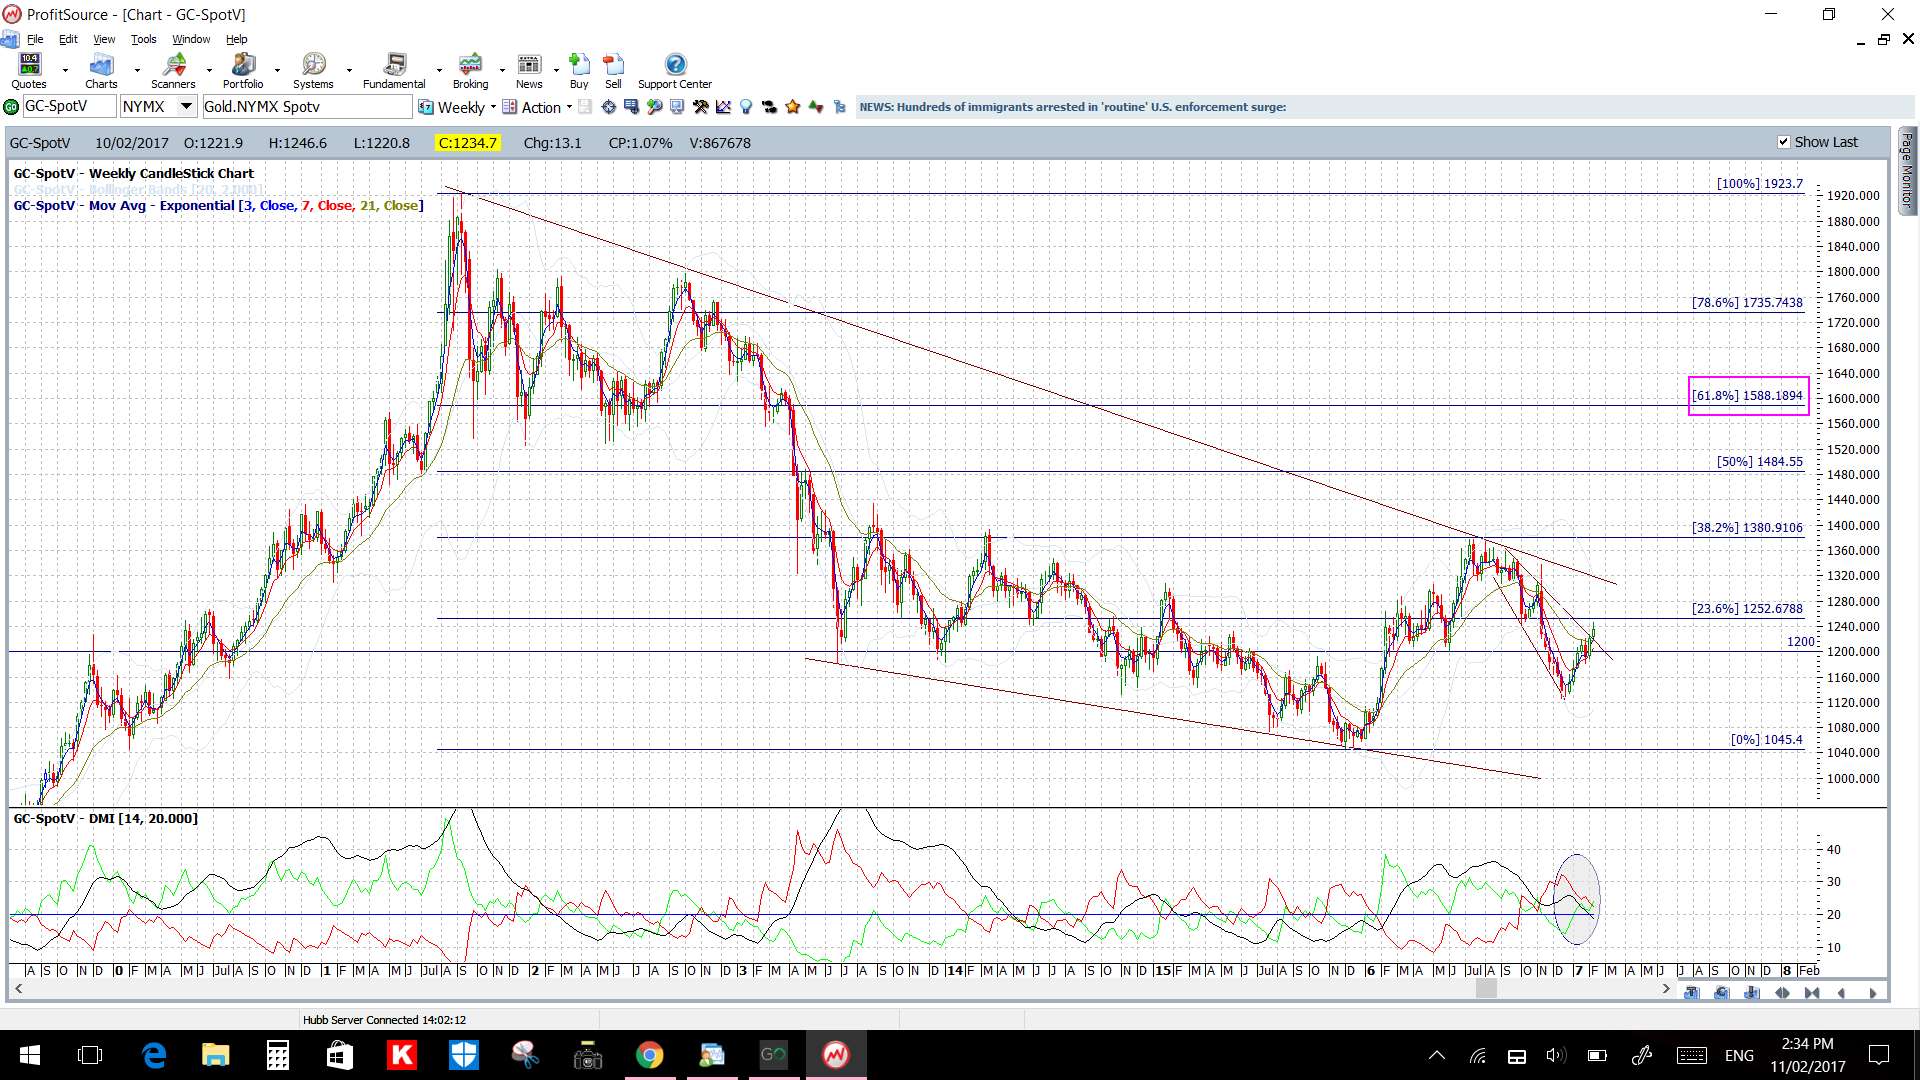
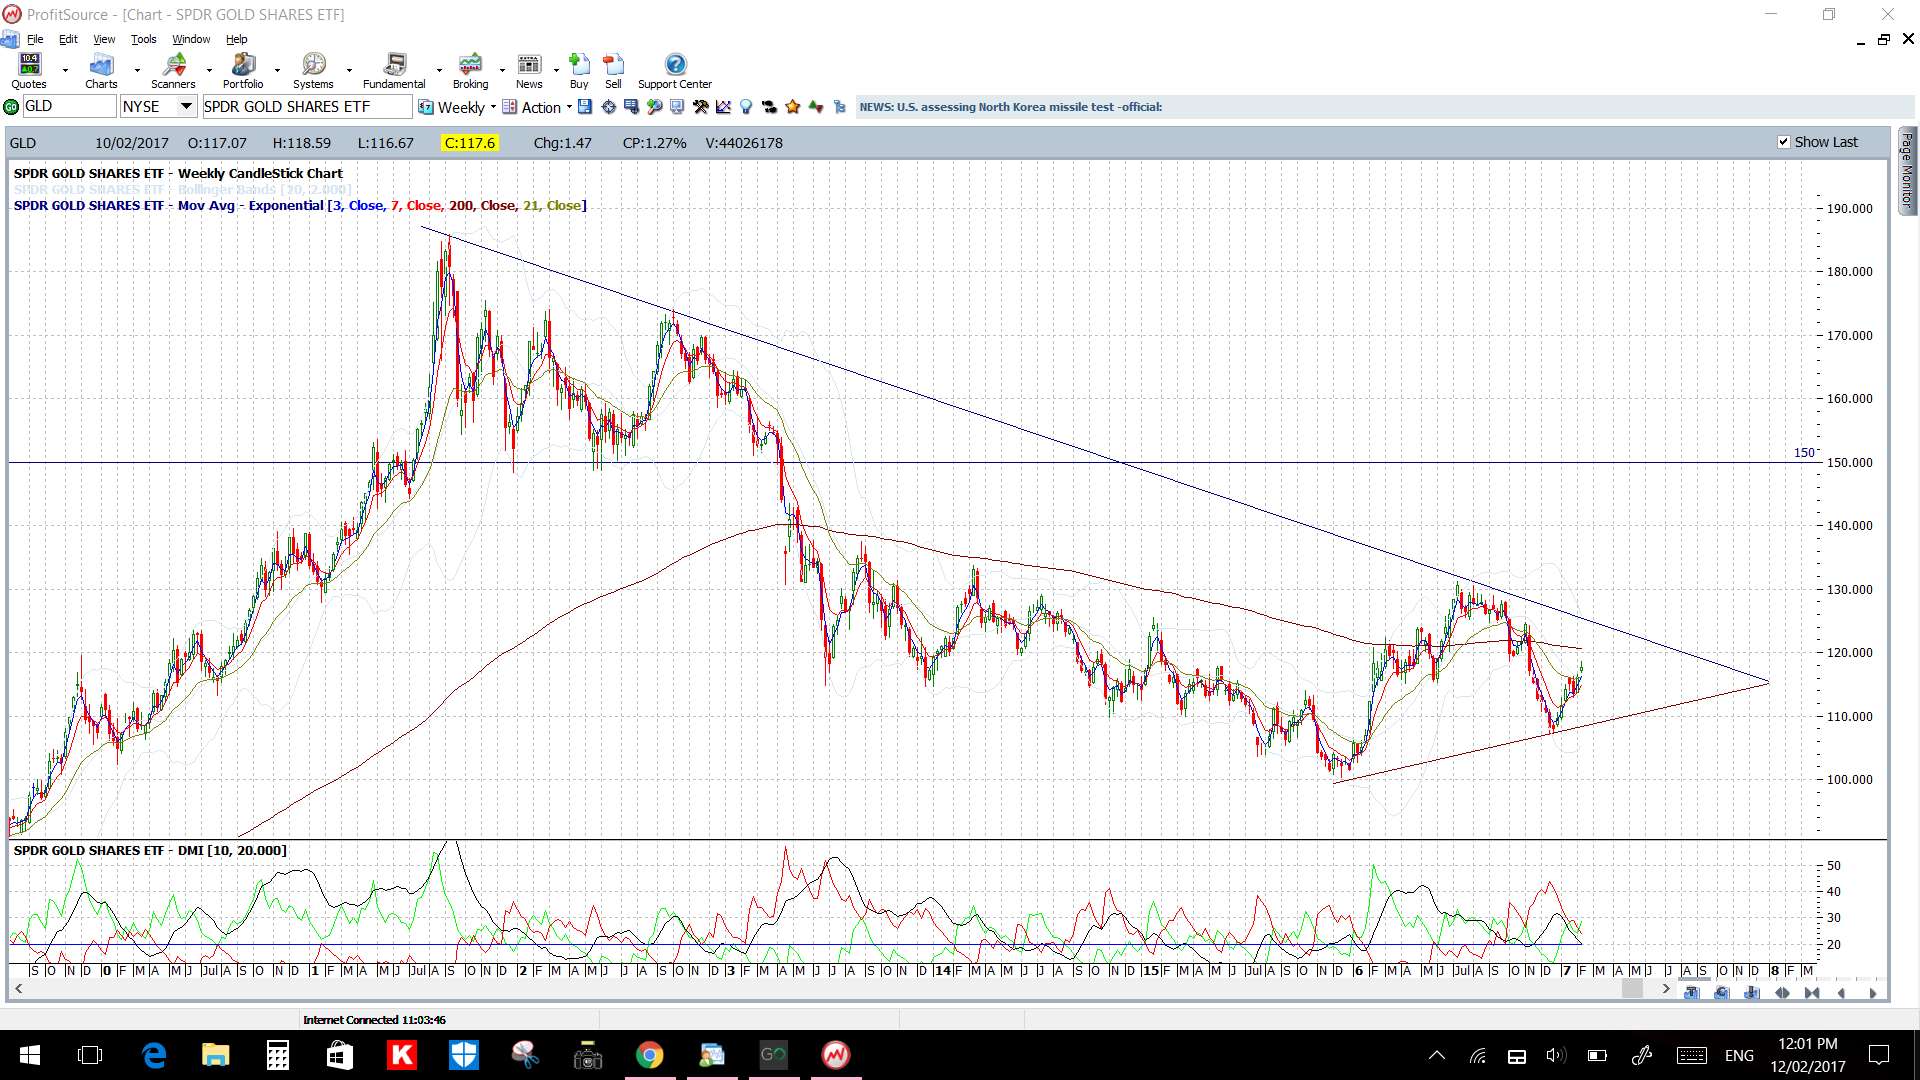
Keep an eye on this Gold shares ETF:
The post Forex next week. appeared first on Trade Charting.
The post Forex next week. appeared first on www.forextell.com.