I’ve just returned from holidays and looking over my charts but, really, pondering technical set-ups at the moment seems a rather futile concept in the wake of significant pending news about the Greek debt crisis. However, creature of habit that I am, here is what I’m seeing for now.
NB: This is only a brief update given I’m just back on home soil.
This week:
- Tuesday marks the end of the month and the half-year to further complicate trading this week.
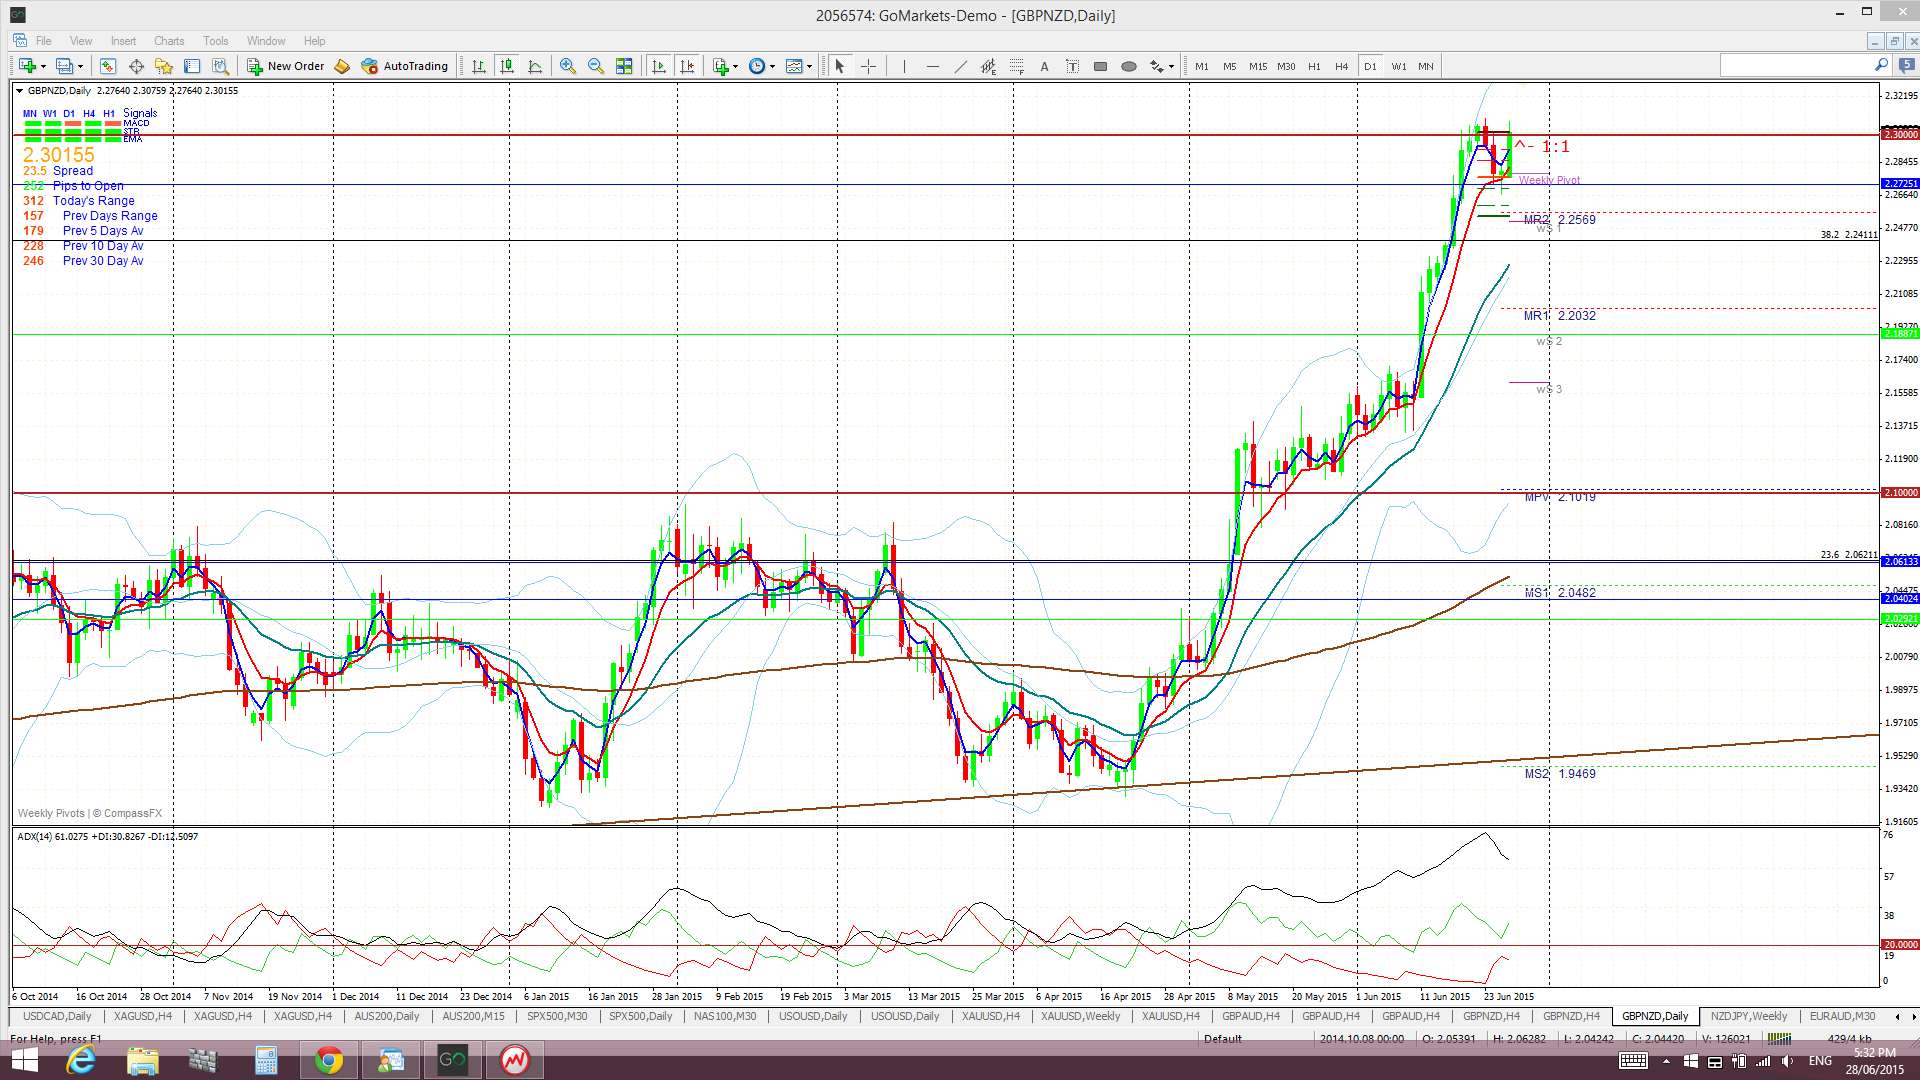
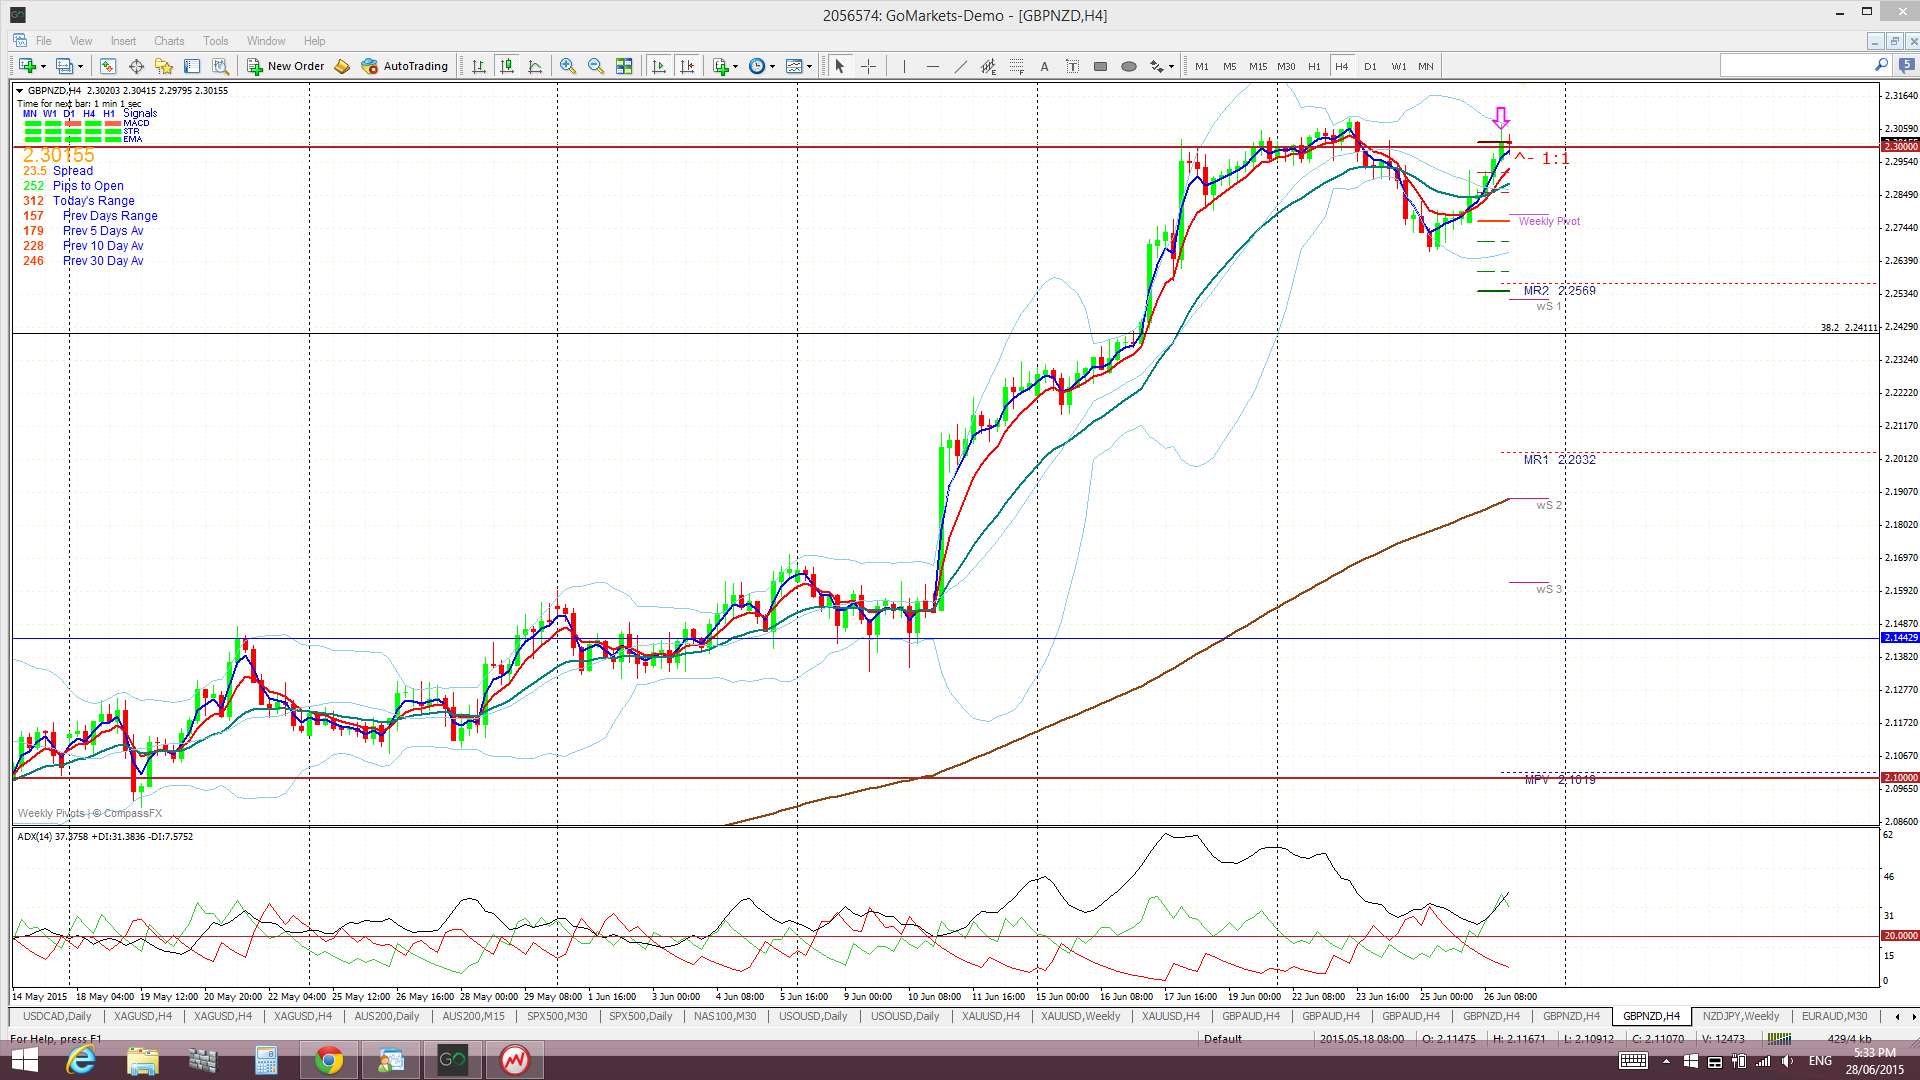
- GBP/NZD: this has put in an enormous 2,000 pip rally since breaking the key 2.10 area I had suggested was worth stalking. Watch to see where it close wrt 2.30 after Tues 30th though. A pull back to test 2.10 is not out of order.
- Check your trading calendars for currency-sensitive news items.
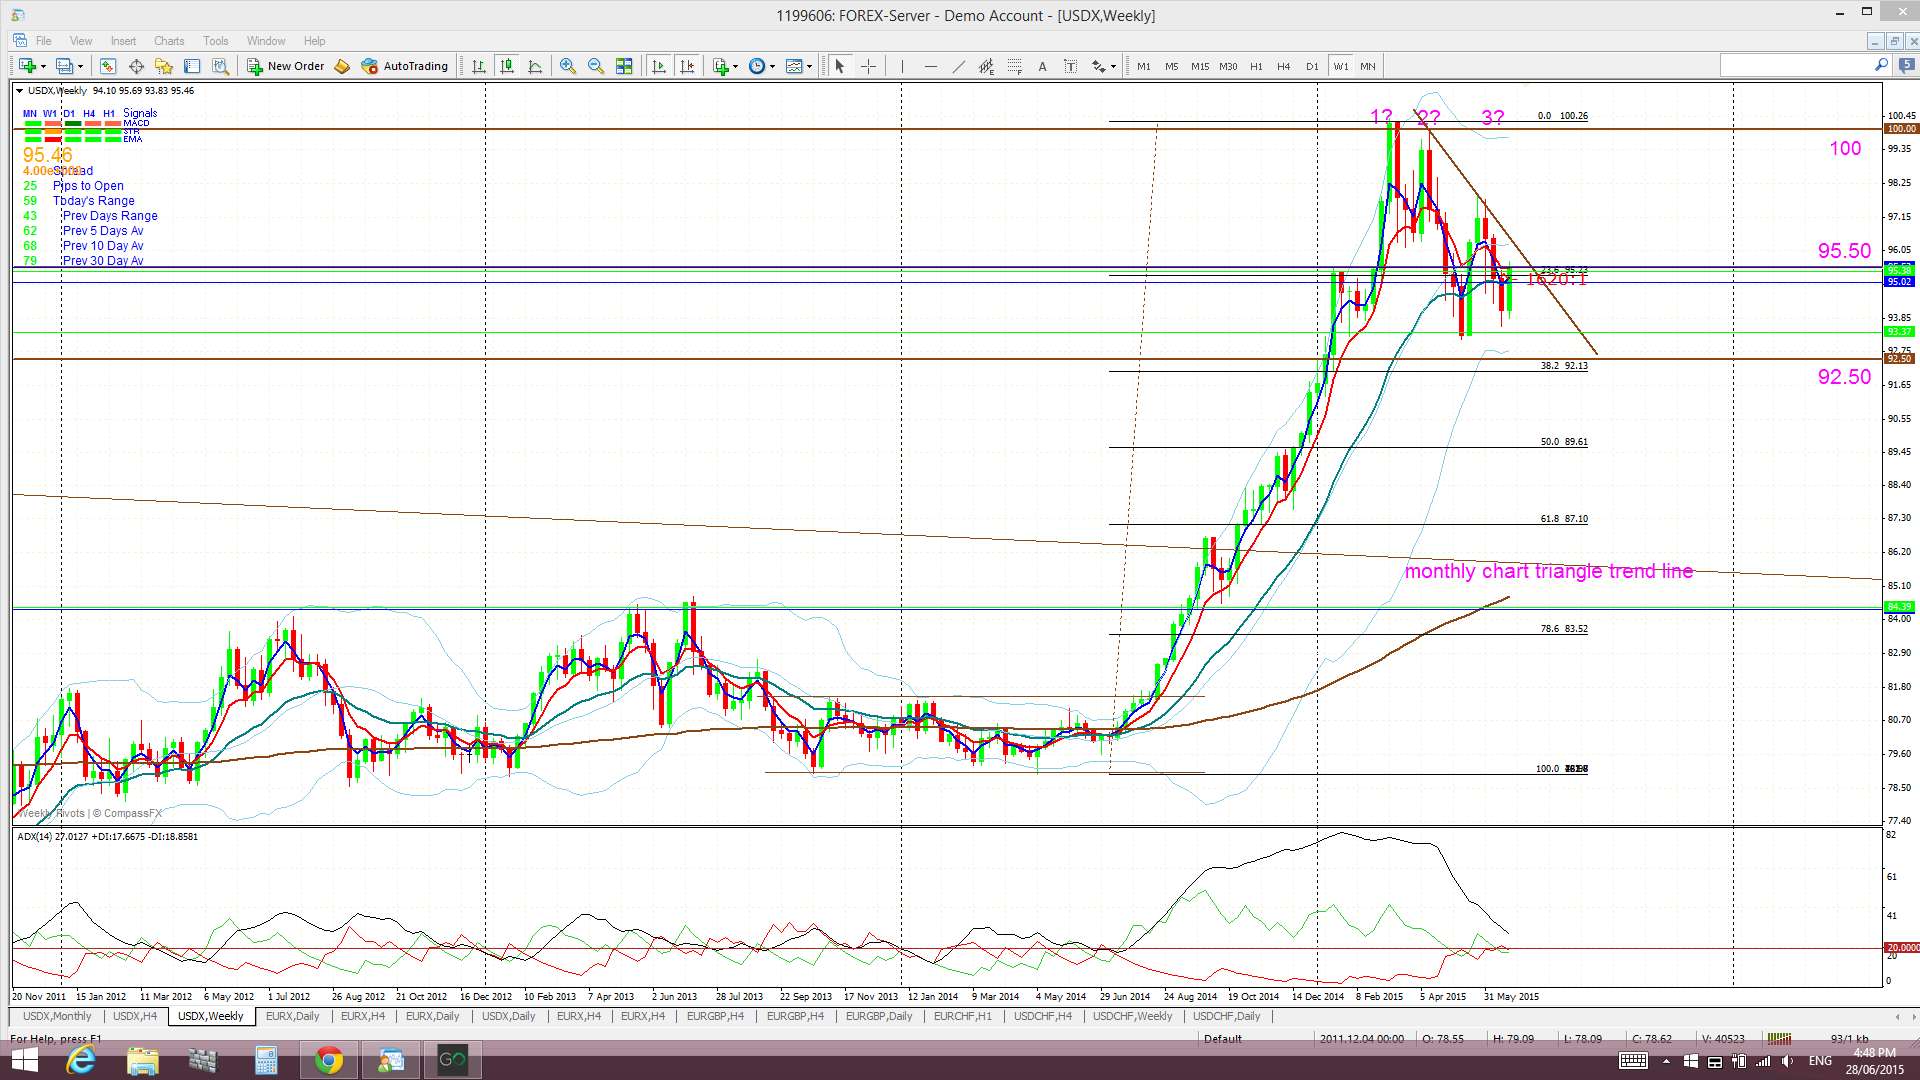
USDX weekly: whilst this still has a Bull Flag appearance I am waiting for a clear breakout from the recent 100-92.50 trading range before being confident of any clear new direction:
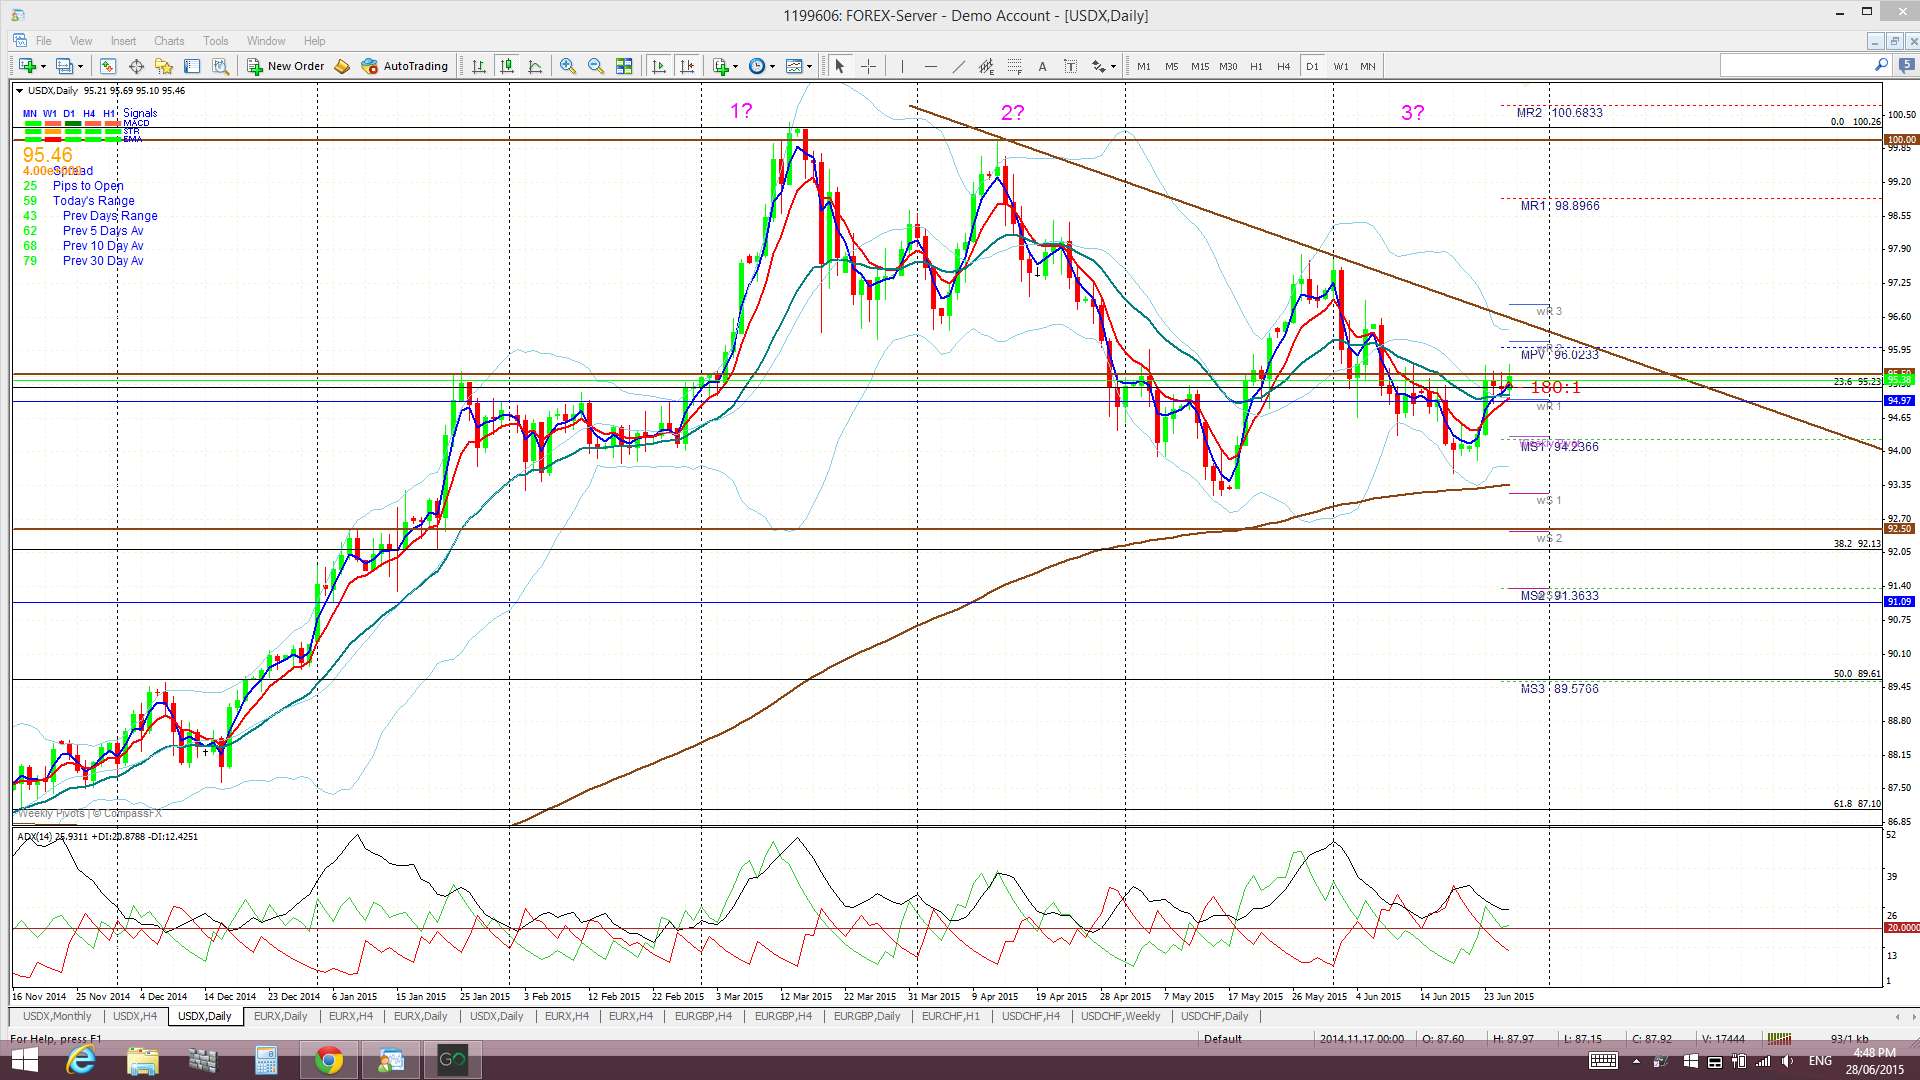
USDX daily: 95.50 had been giving this index some grief of late and continues to do so:
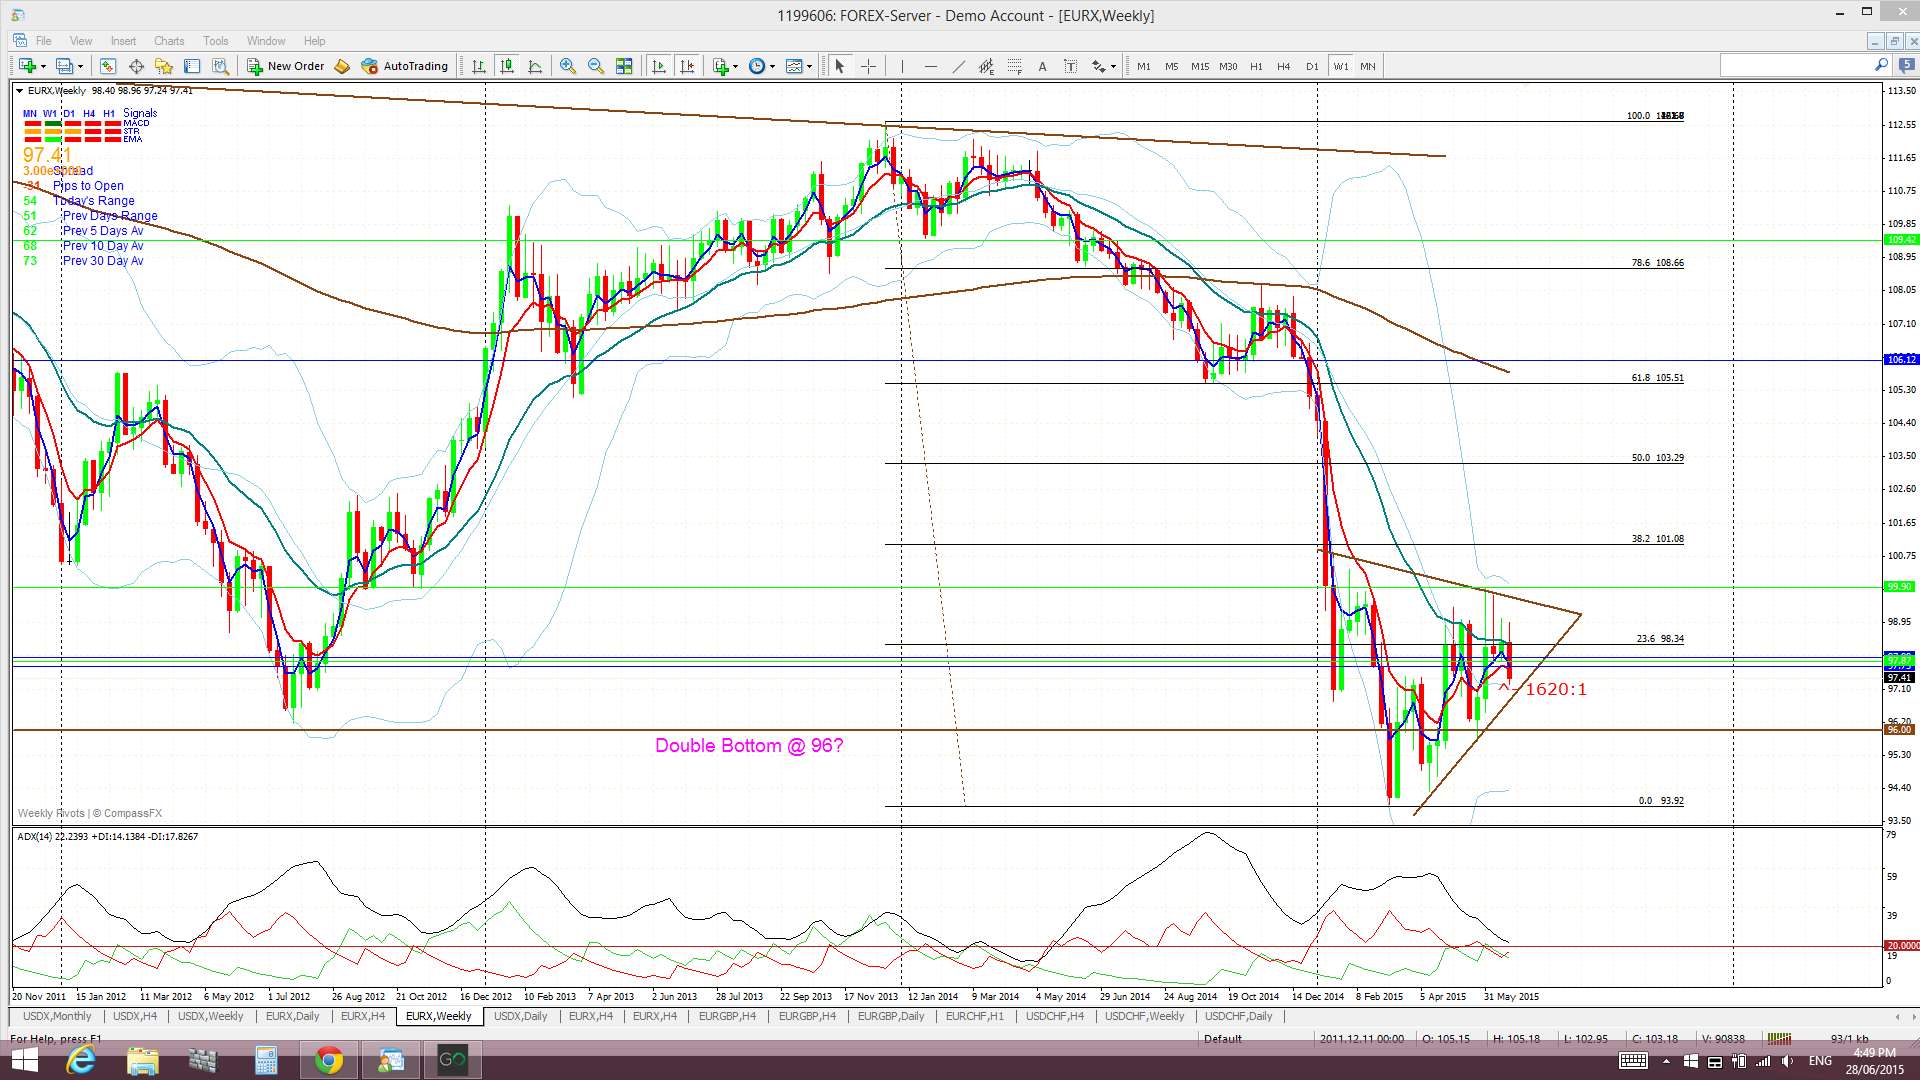
EURX weekly: this index is presenting with a potential Bear Flag view on the weekly chart to complement the bullish set-up on the USDX. The 96 region is strong ‘Double Bottom’ support though:
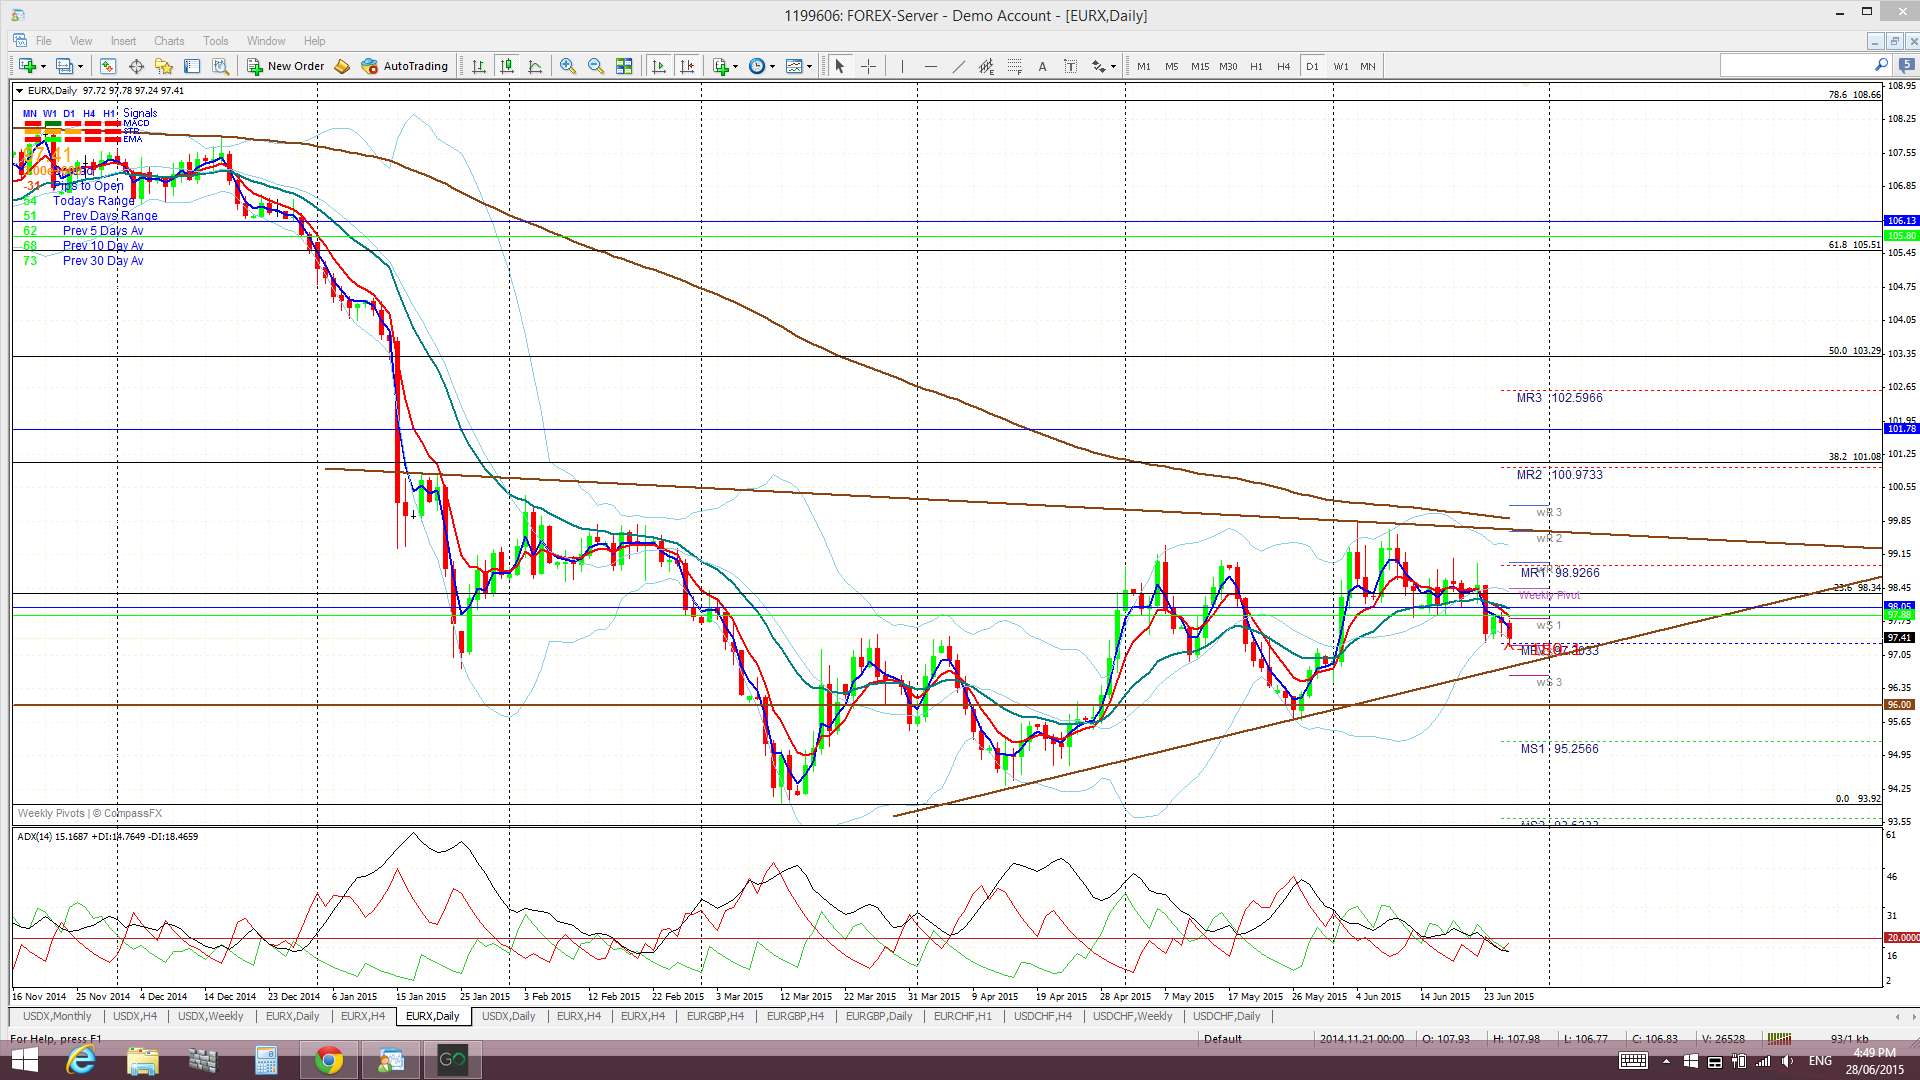
EURX daily: watch for ant triangle breakout:
FX Ichimoku Cloud: the USDX and EURX are trading either side of the Cloud on the 4hr and daily charts and are thus divergent suggesting further choppiness.
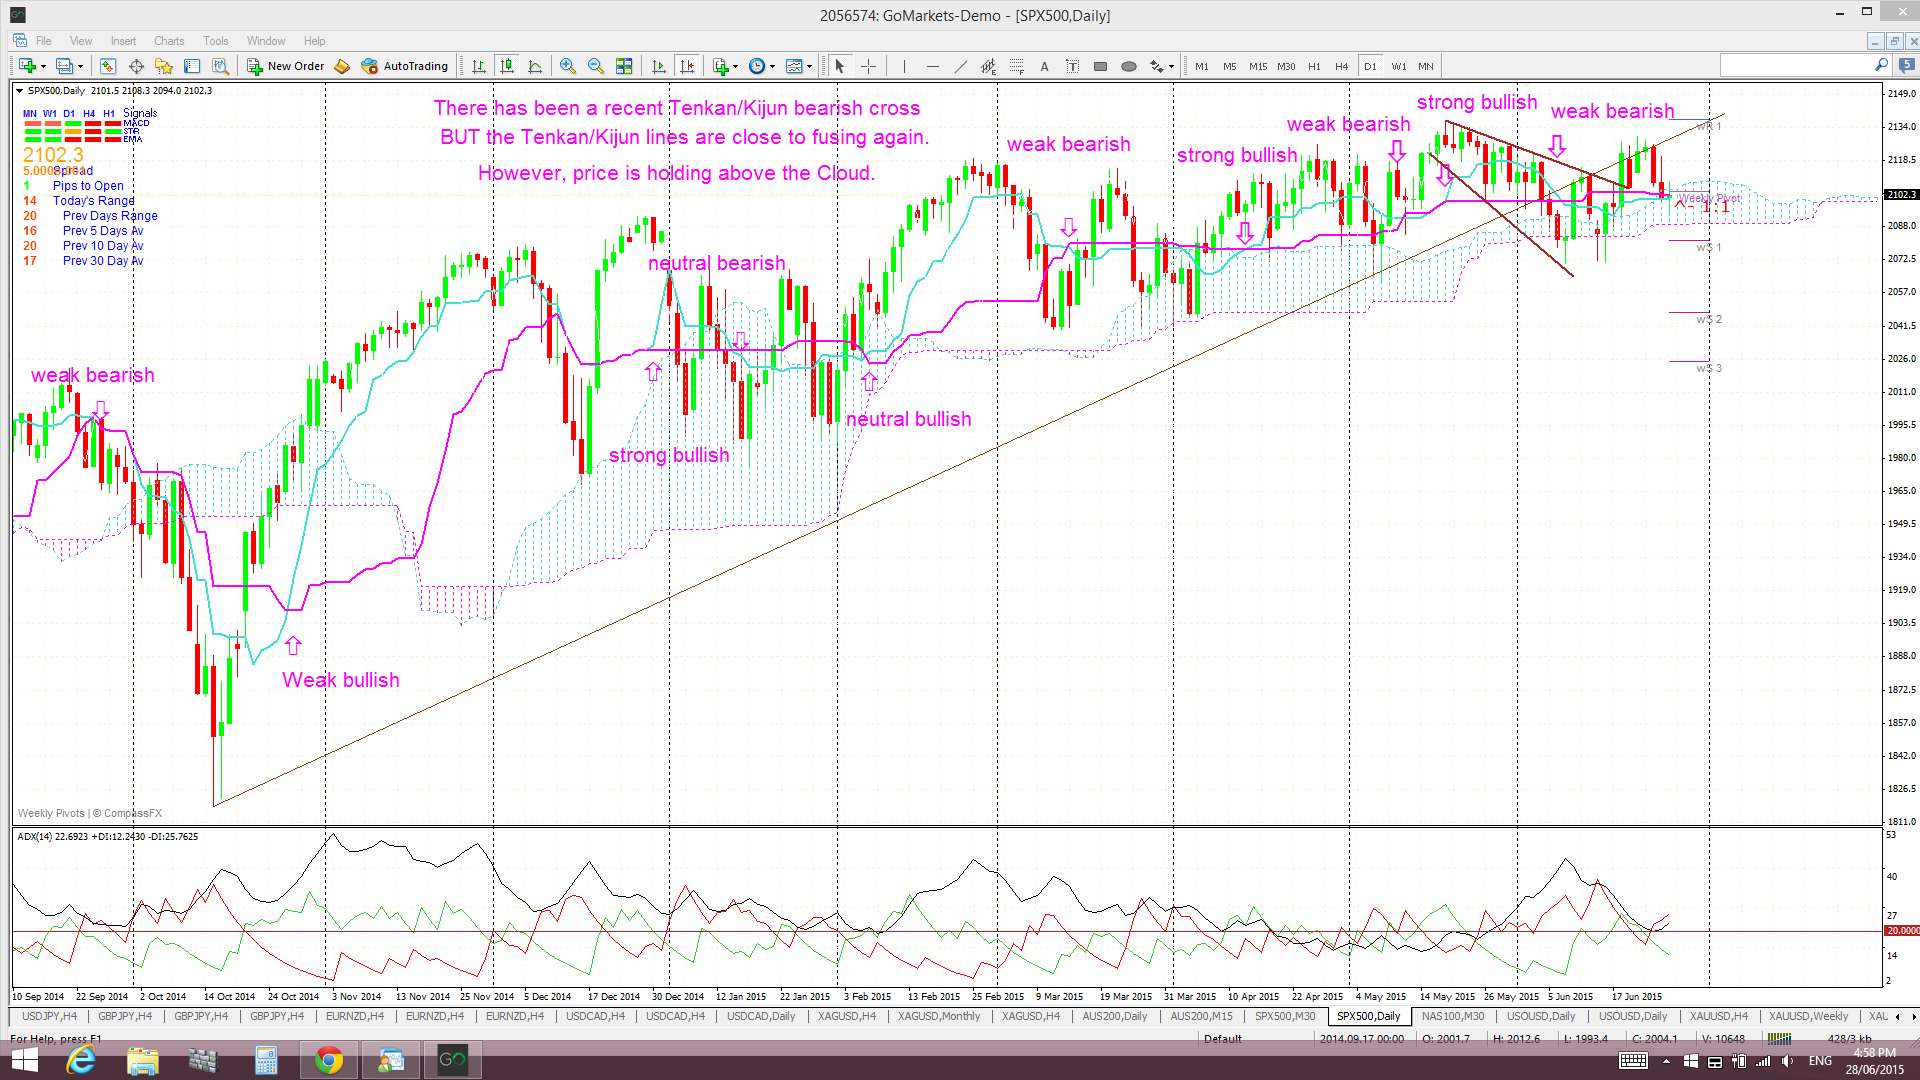
S&P500: holding above Cloud support:
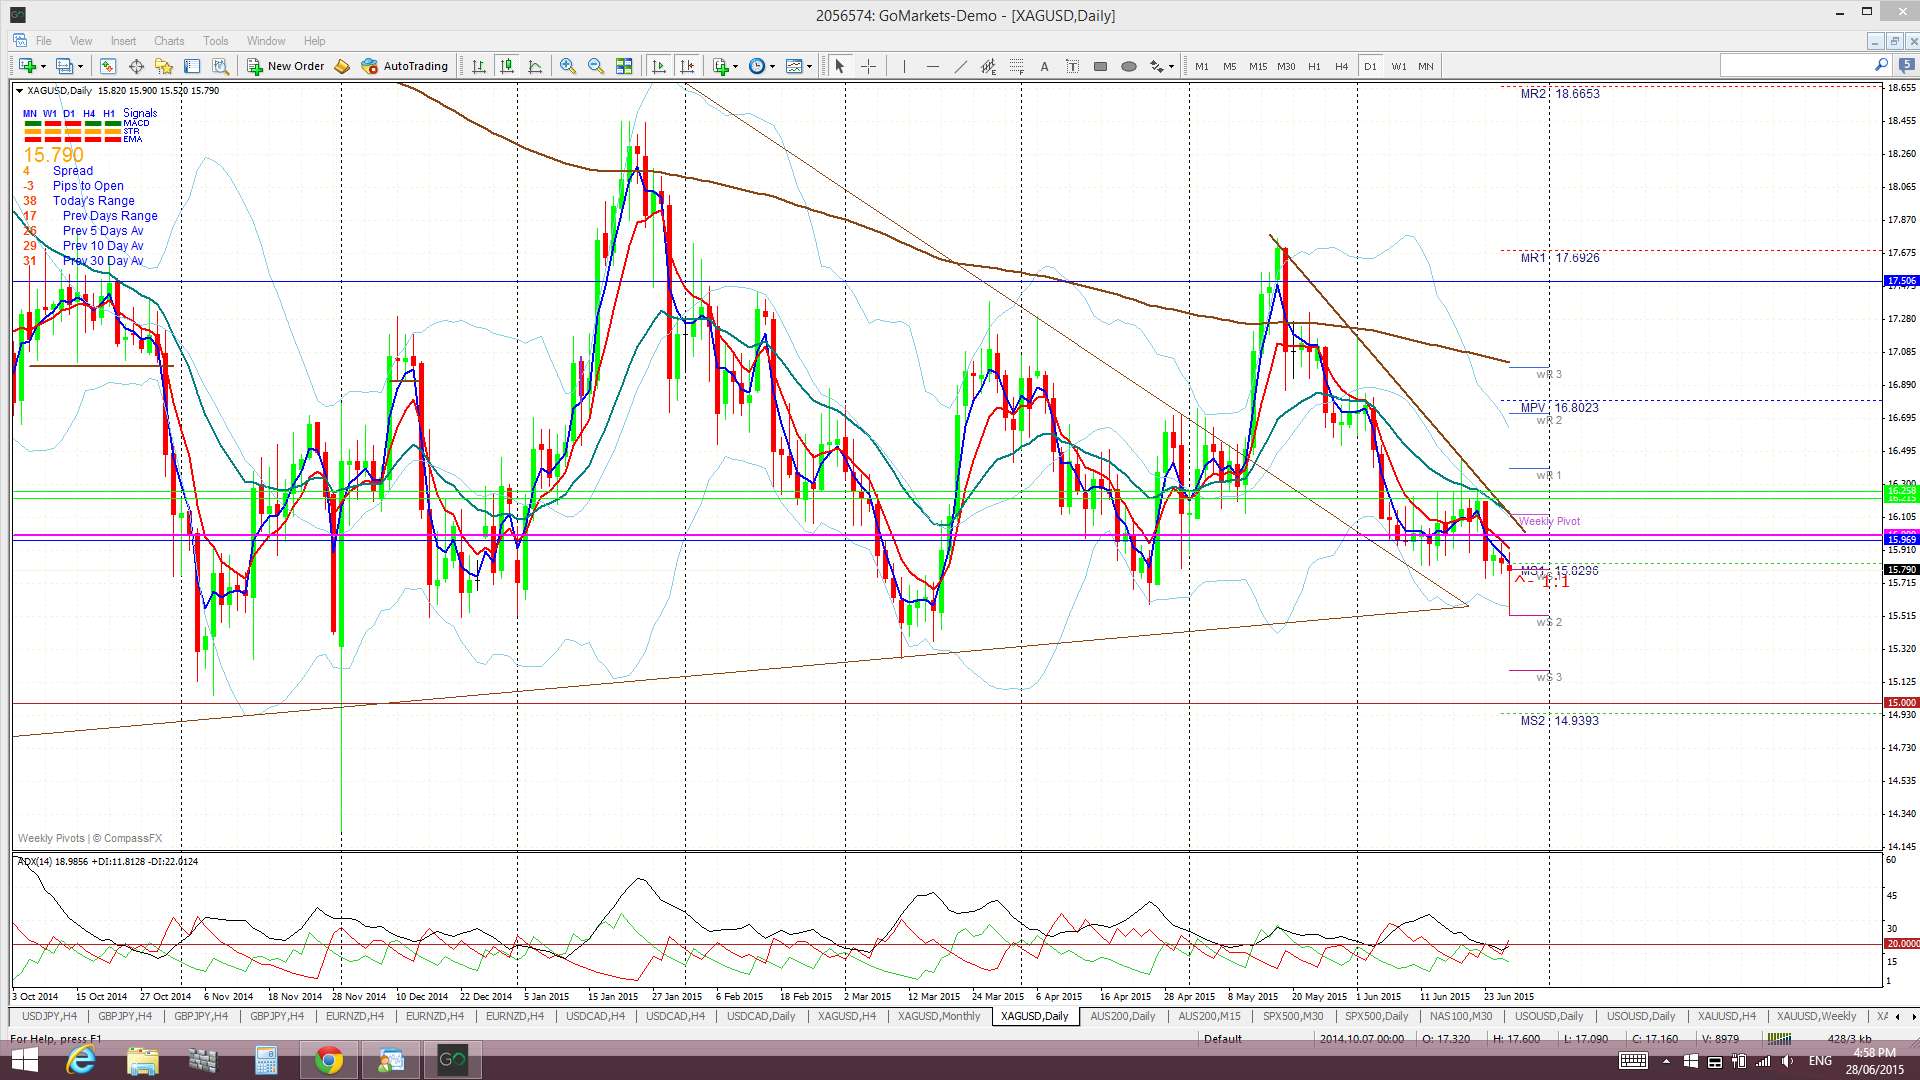
Silver: holding near $16 support. Watch for any move lower to test $15 support:
Silver daily:
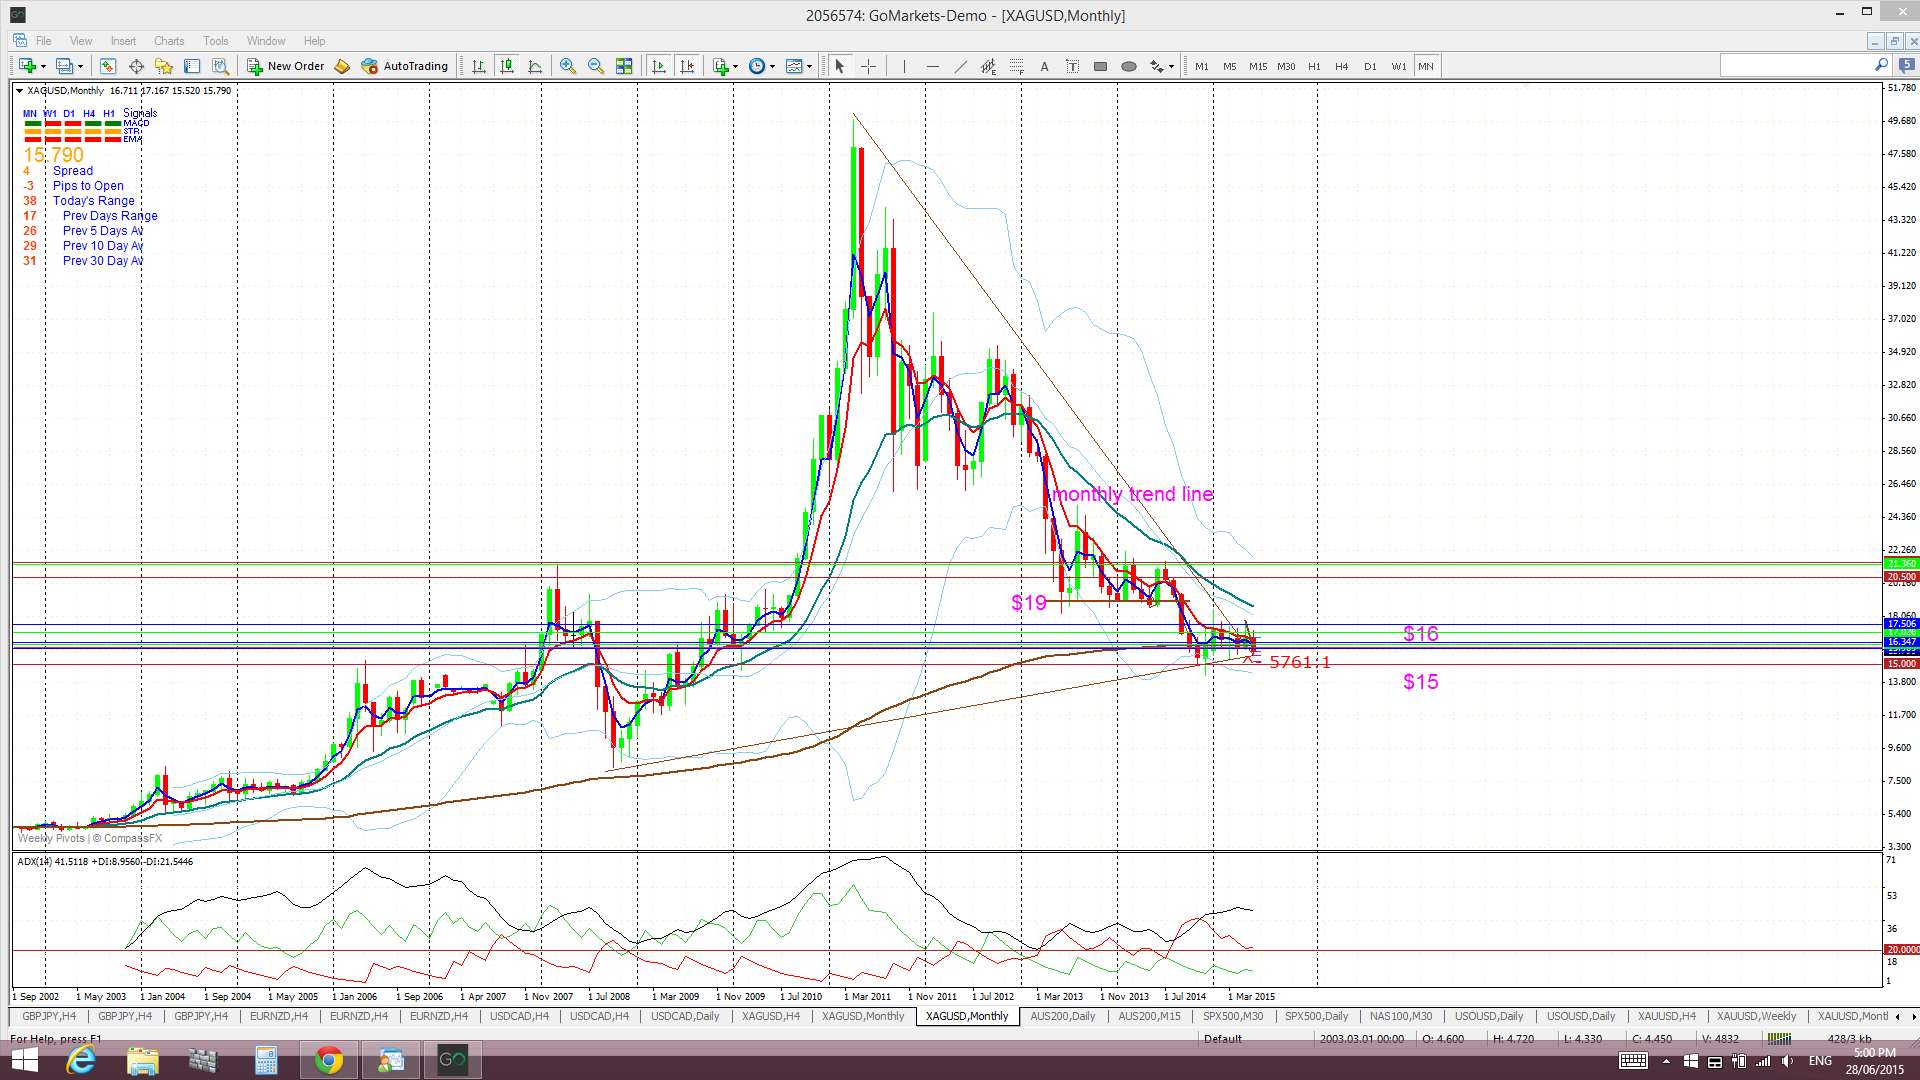
Silver monthly: the $15 is the next major support level:
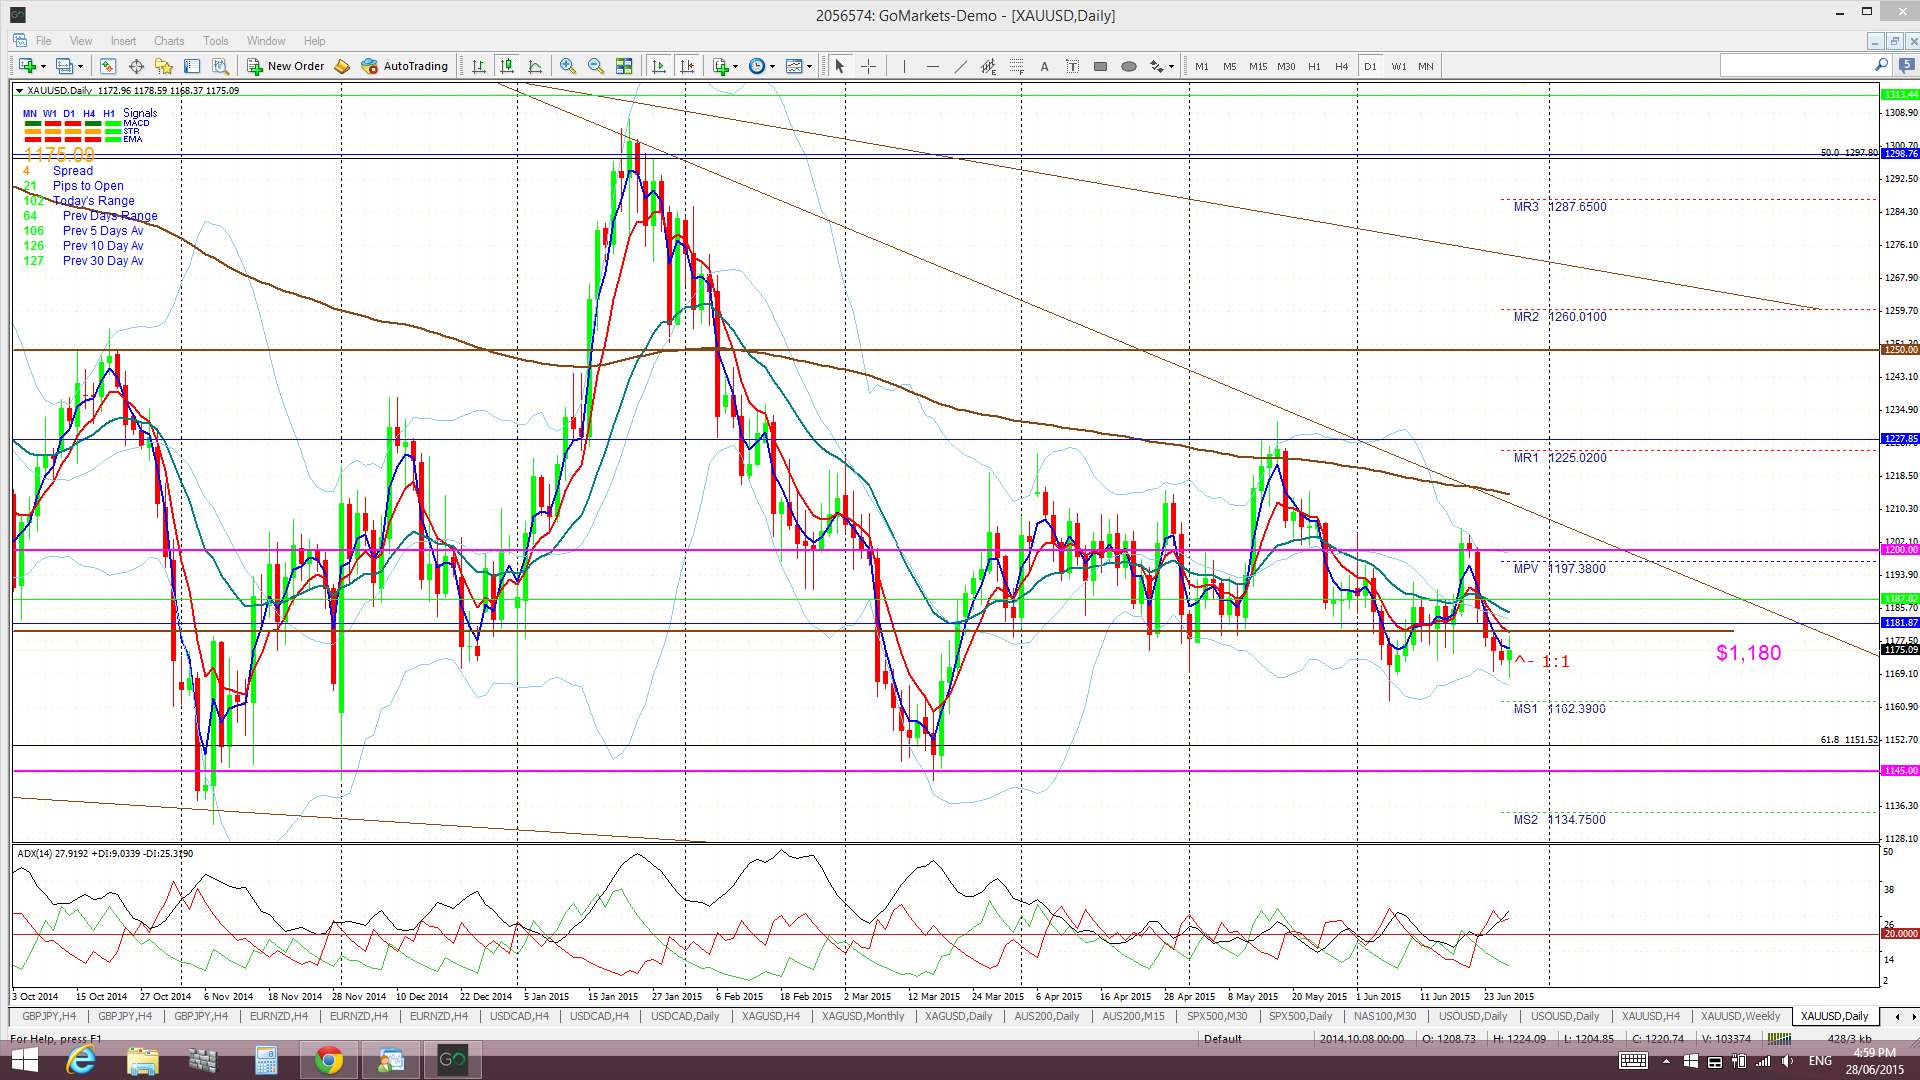
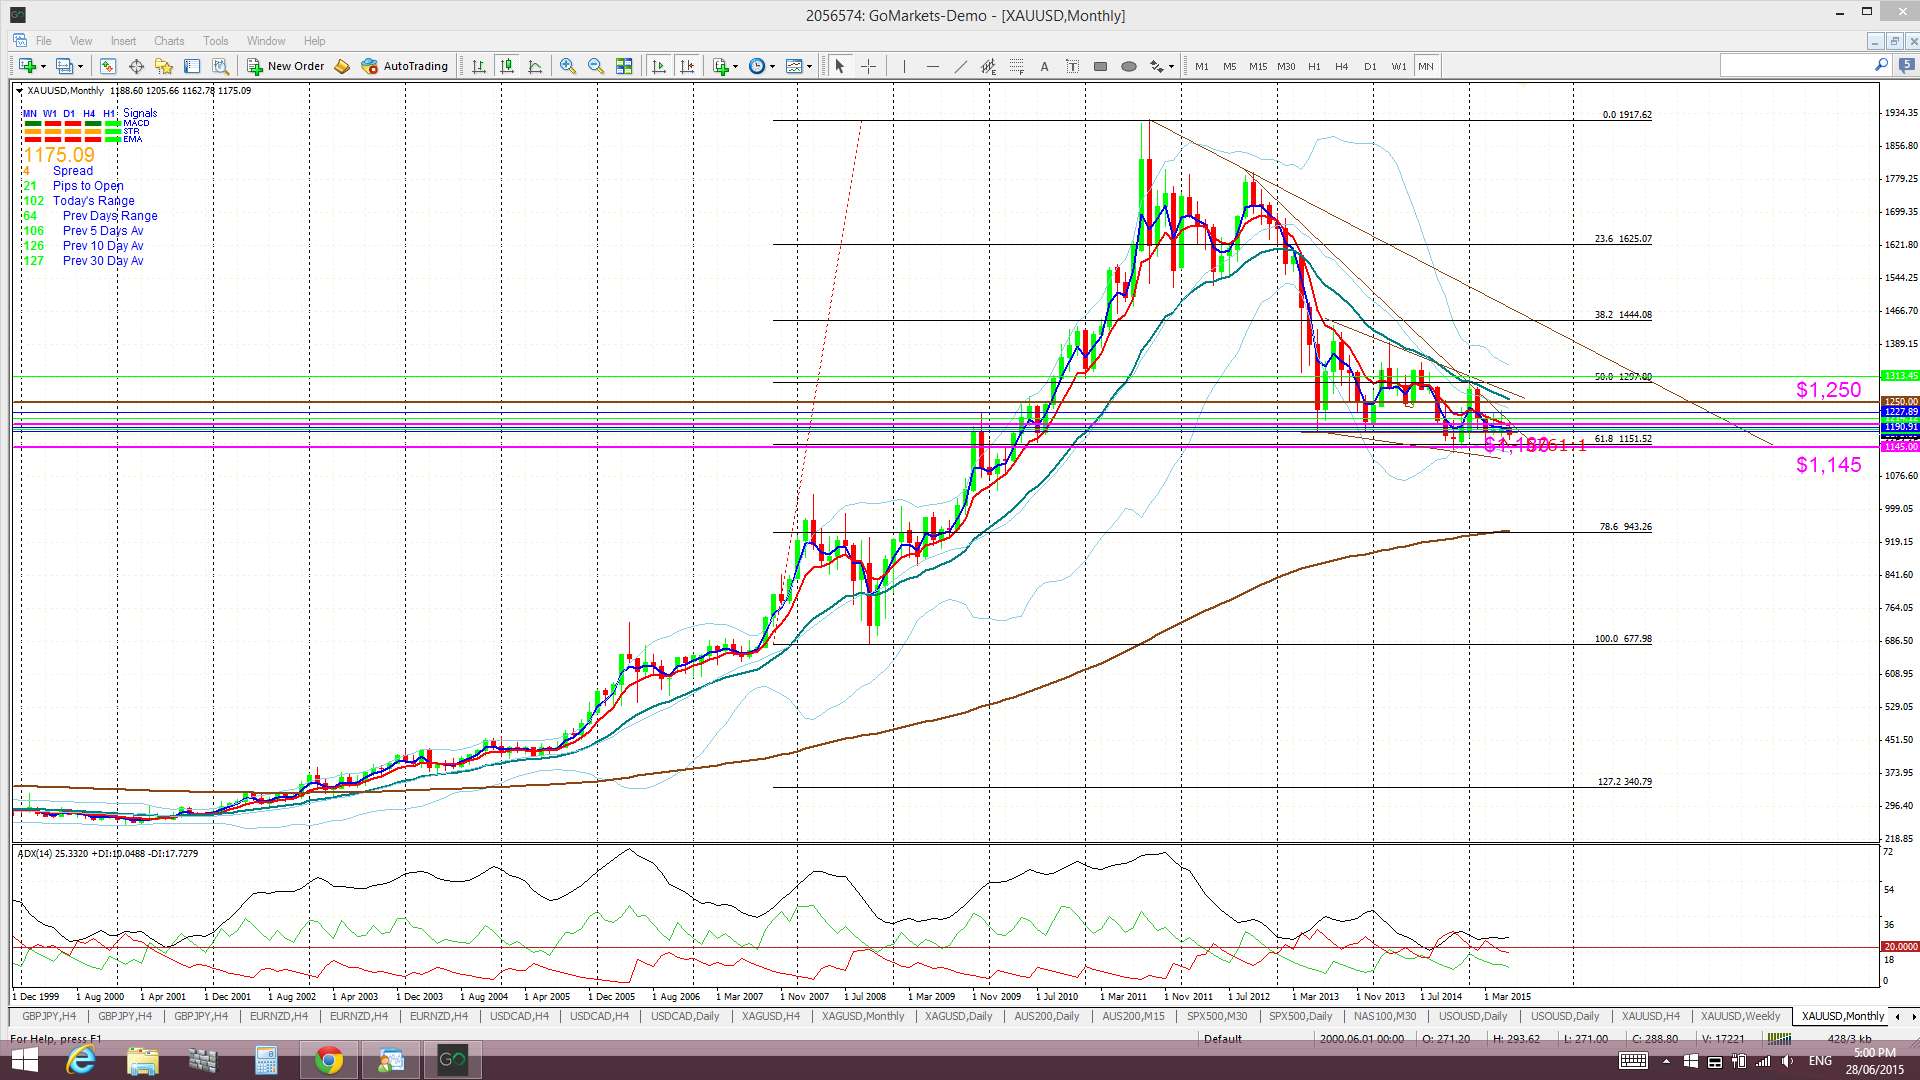
Gold: holding near $1,180 support for now. A Grexit may send this higher but any mover lower will bring the $1,145 level back into focus as this is major 61.8% fib support:
Gold daily: note how $1,180 has been quite a magnet:
Gold monthly: the $1,145 level is near the 61.8% fib level and both have been strong support over the last two and half years:
Forex:
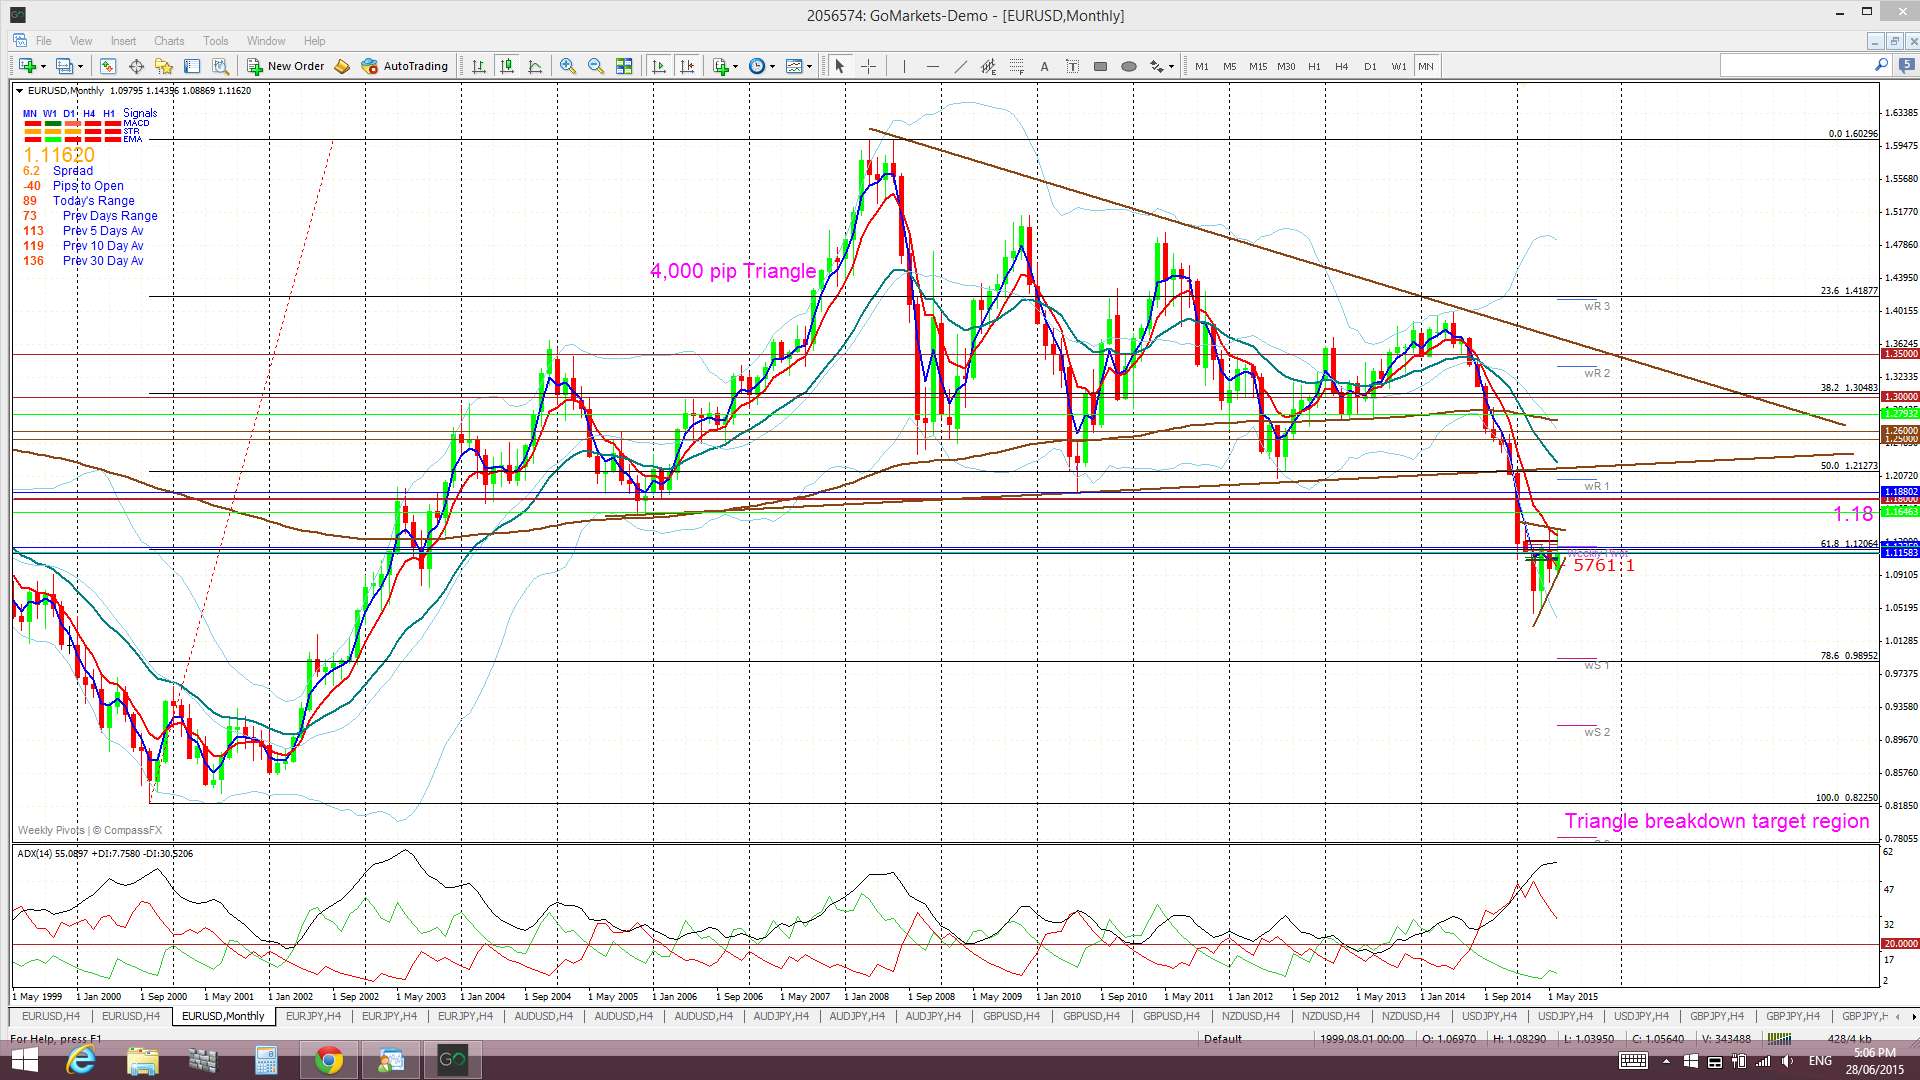
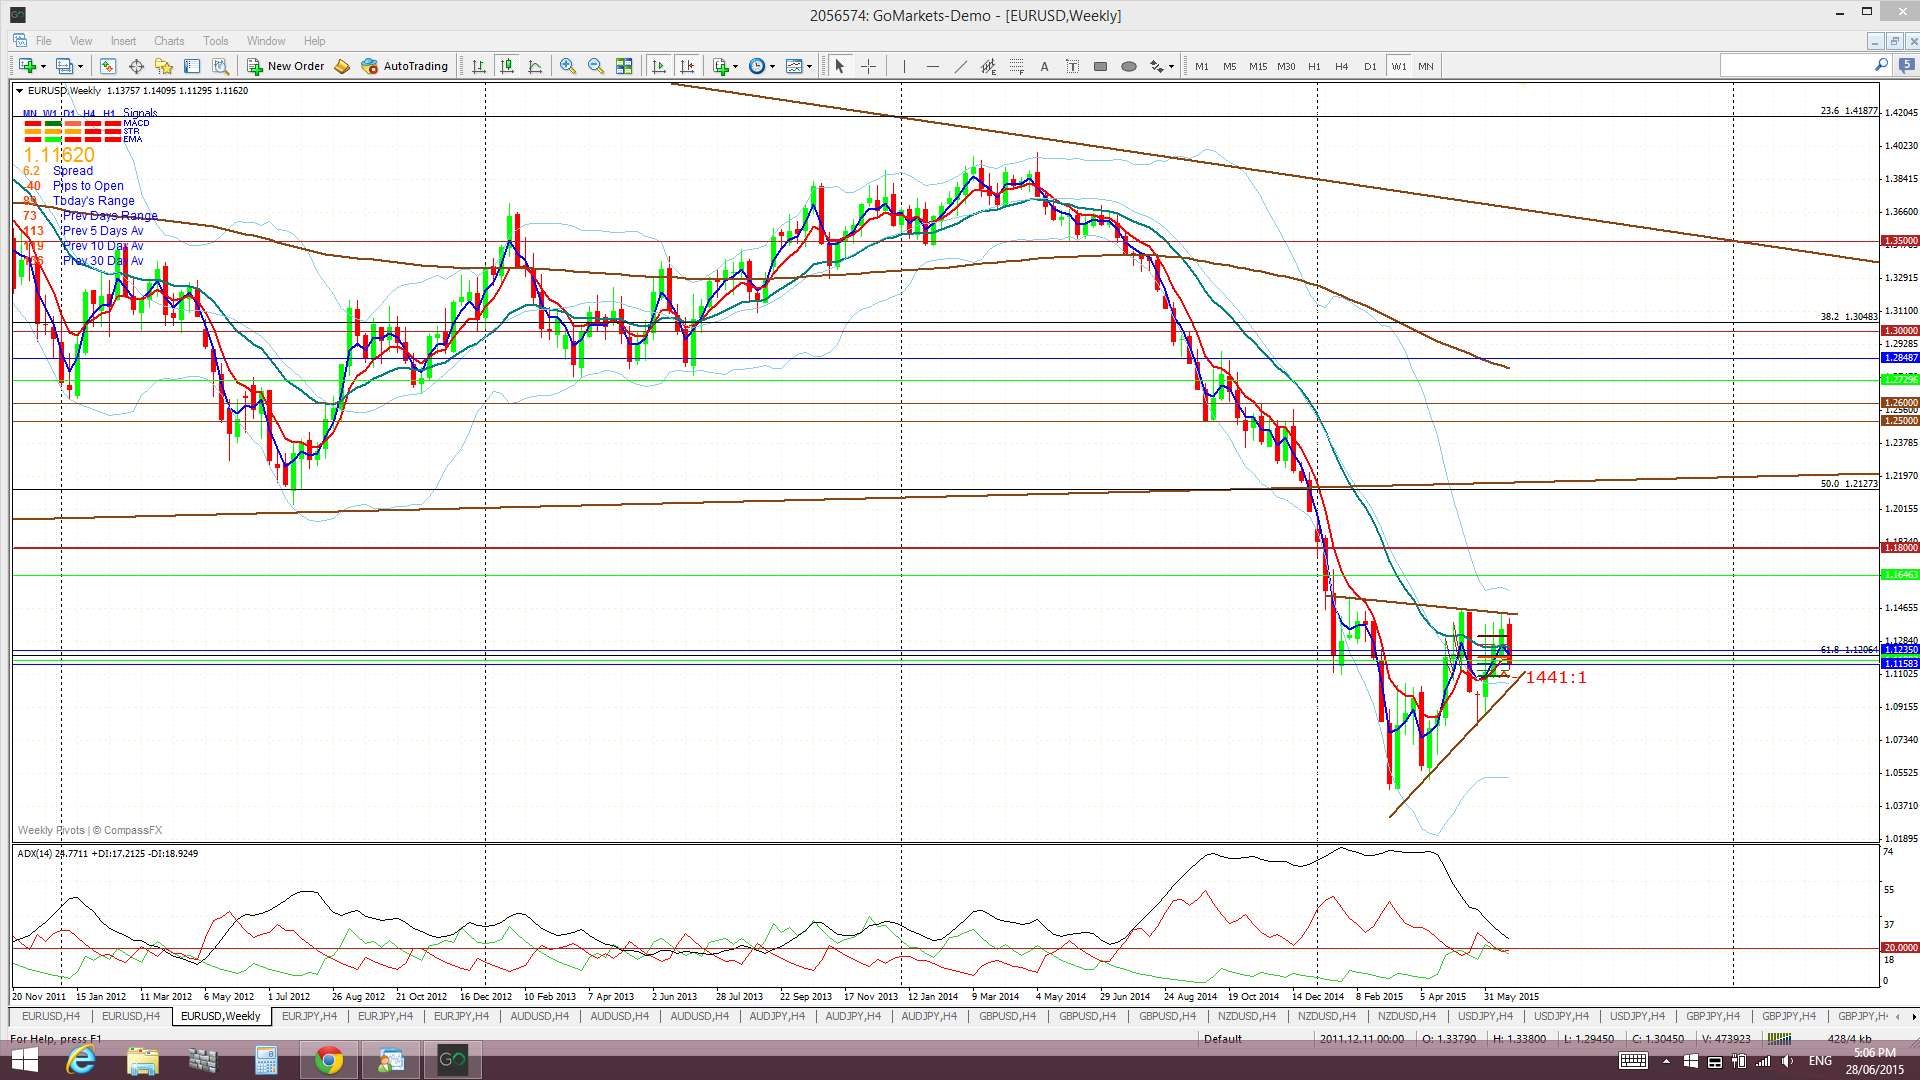
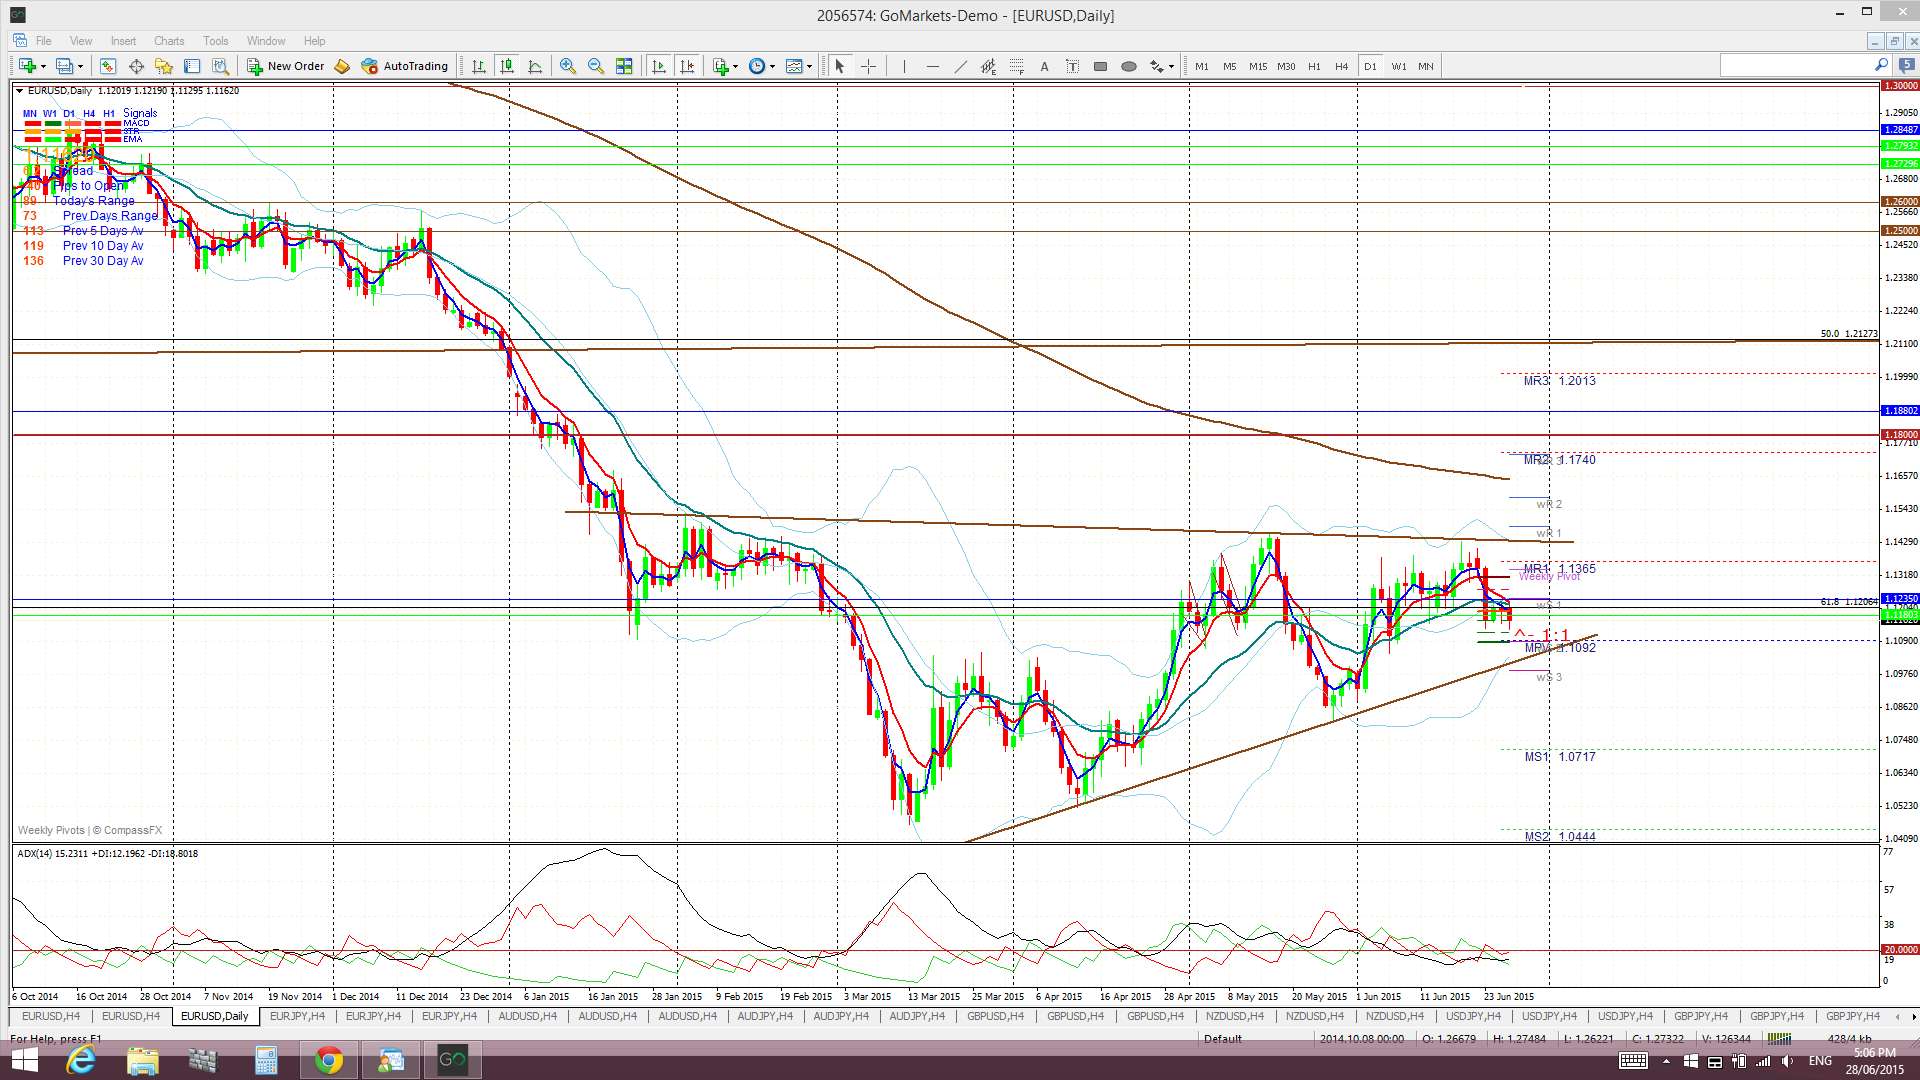
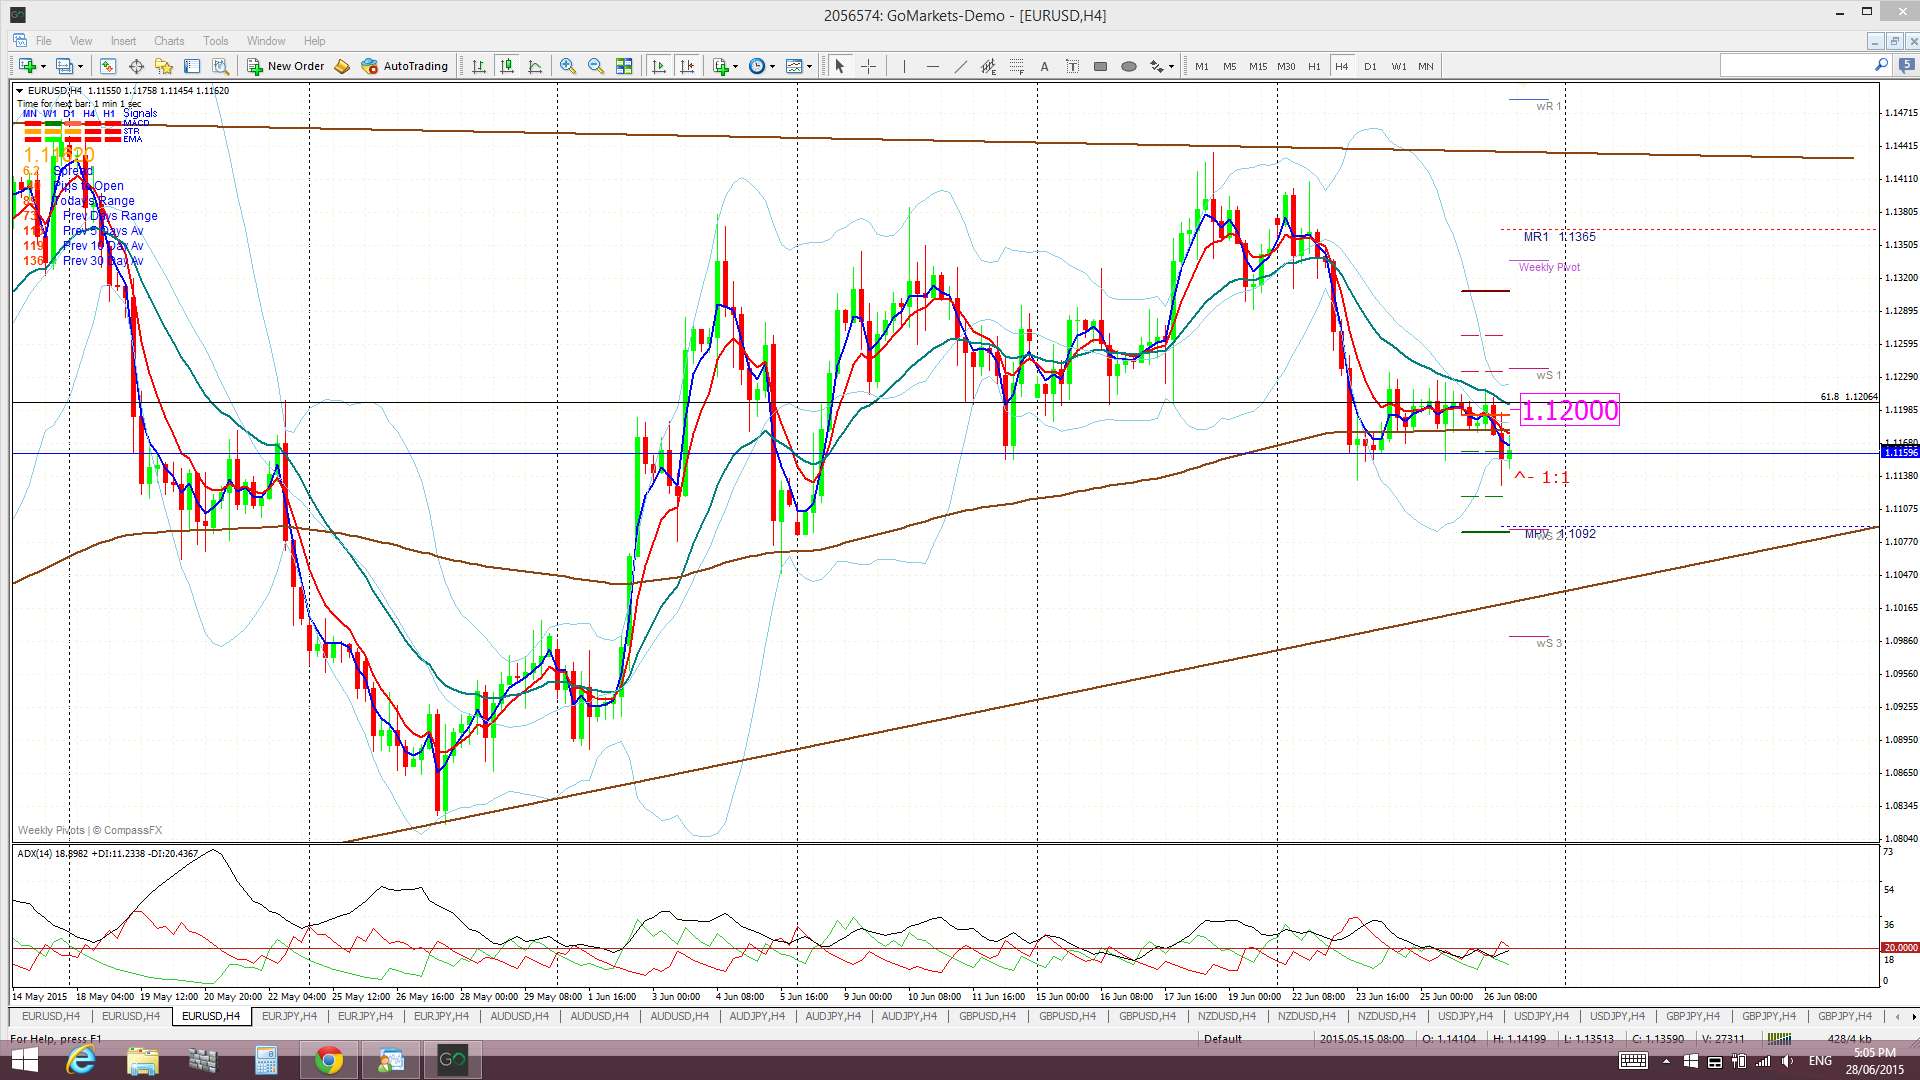
EUR/USD: remains triangle bound and hovering near the key 1.12 level but this triangle is giving the weekly chart a distinctive Bear Flag appearance. The 1.12 level is a major 61.8% fib support region on the monthly time frame. Watch for trend line breakouts for clues about the next directional move. Note the lack of momentum on the ADX for the 4hr time frame:
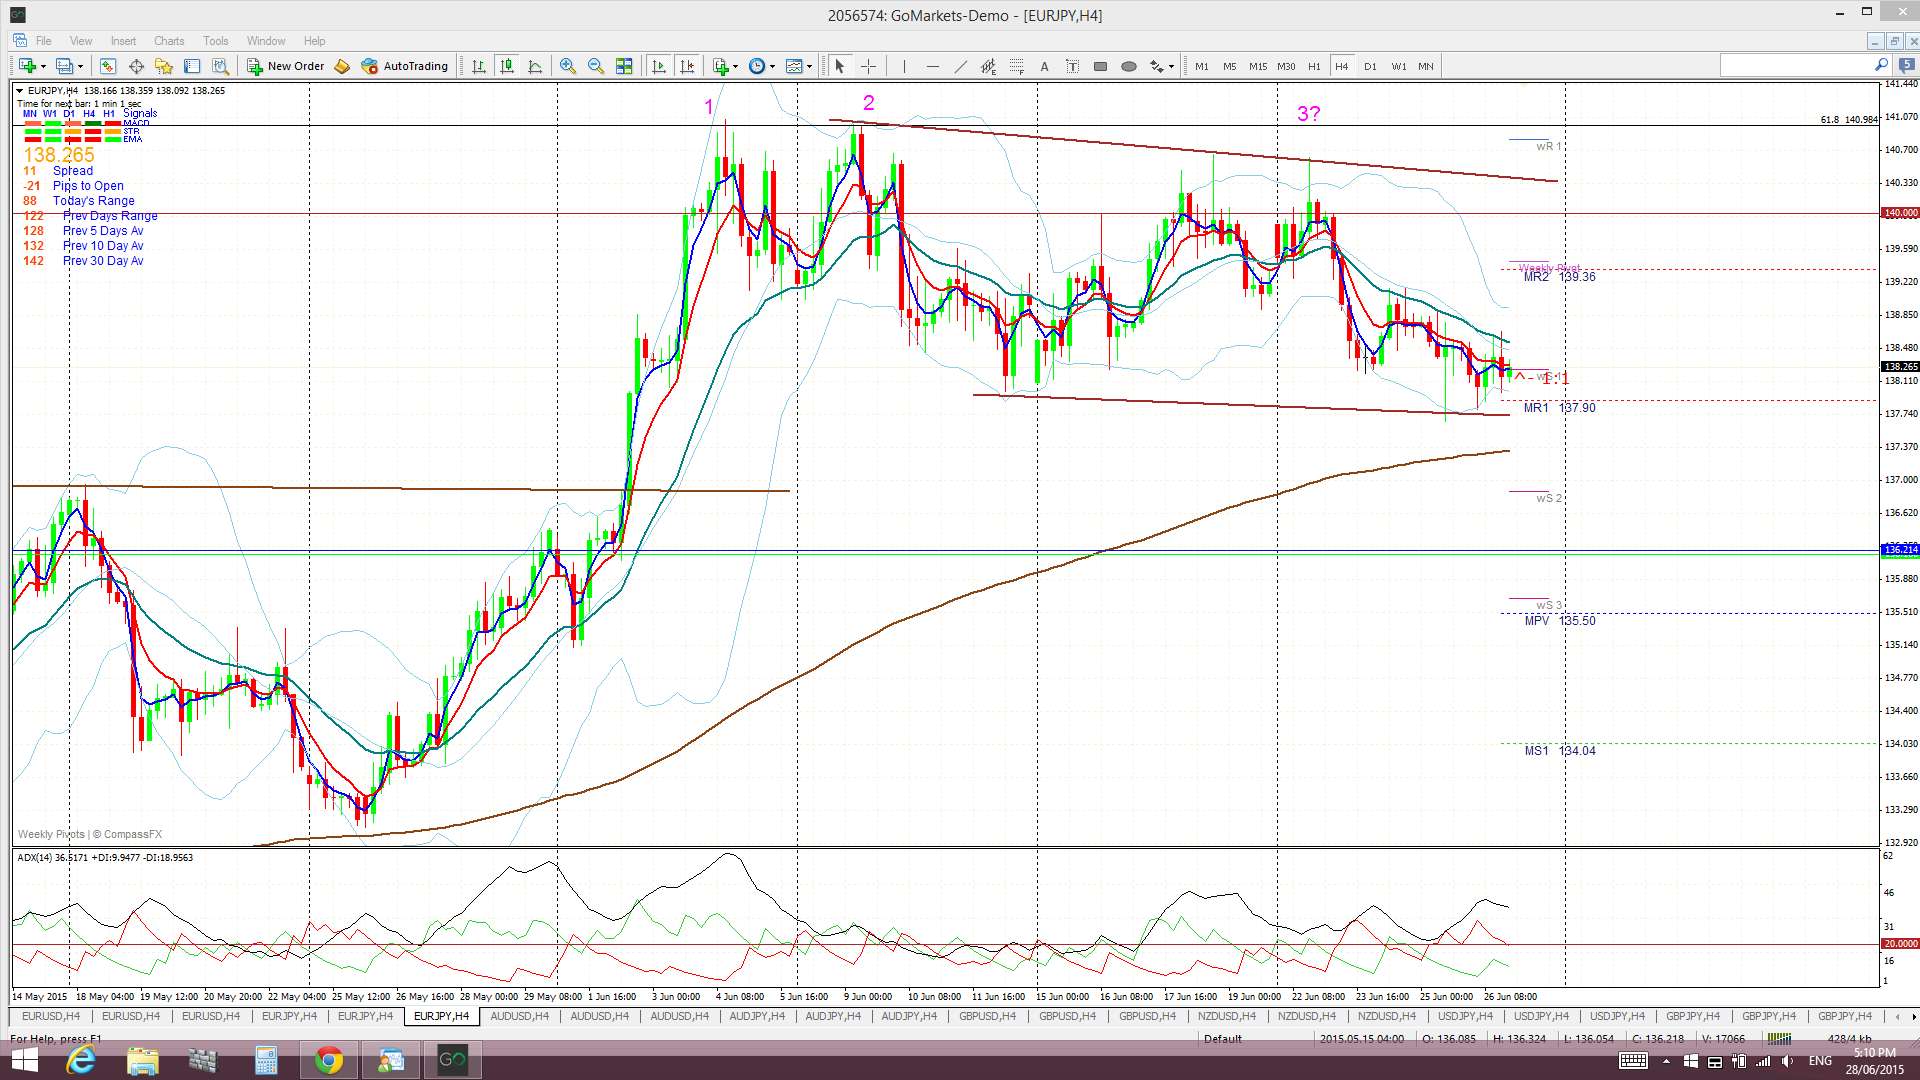
E/J 4hr: range bound here for now:
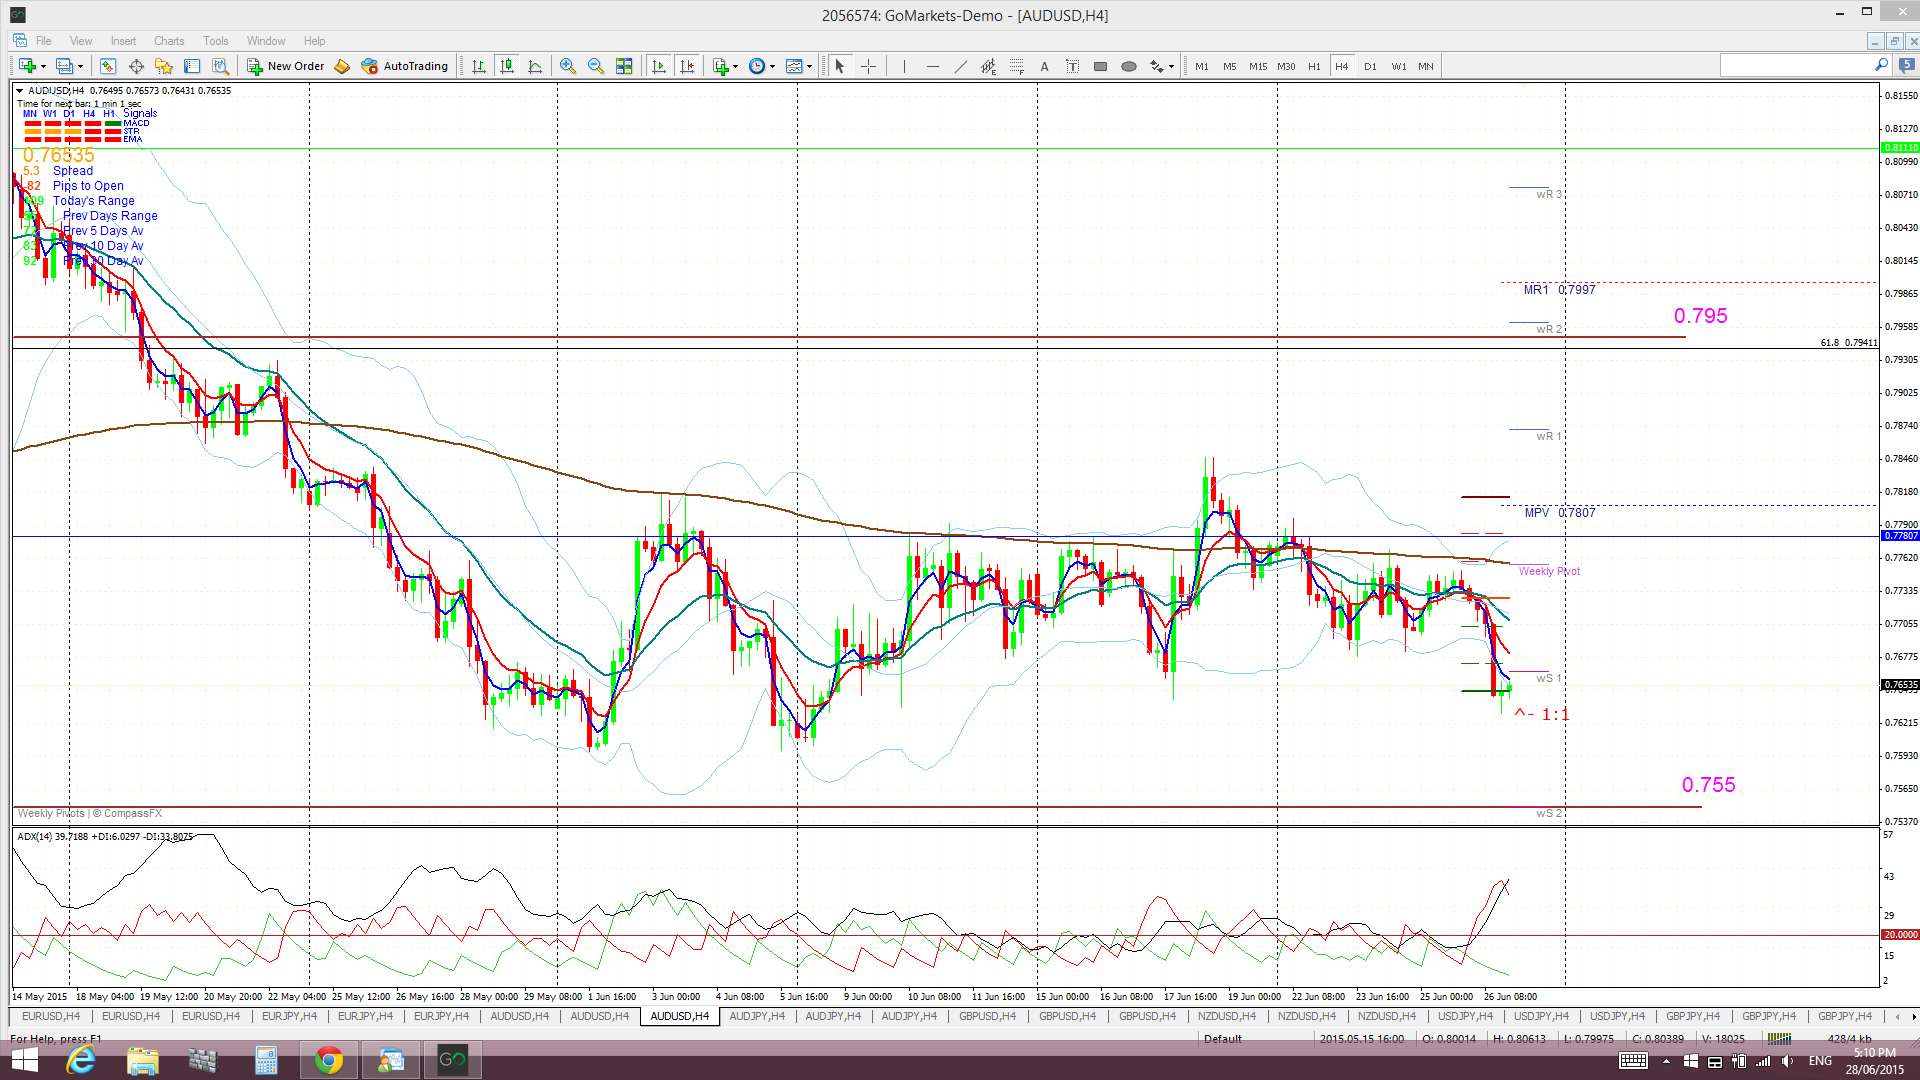
A/U 4hr: I missed a new TC signal here BUT I’d prefer to see a clear breakout from this 0.795 – 0.755 trading channel first:
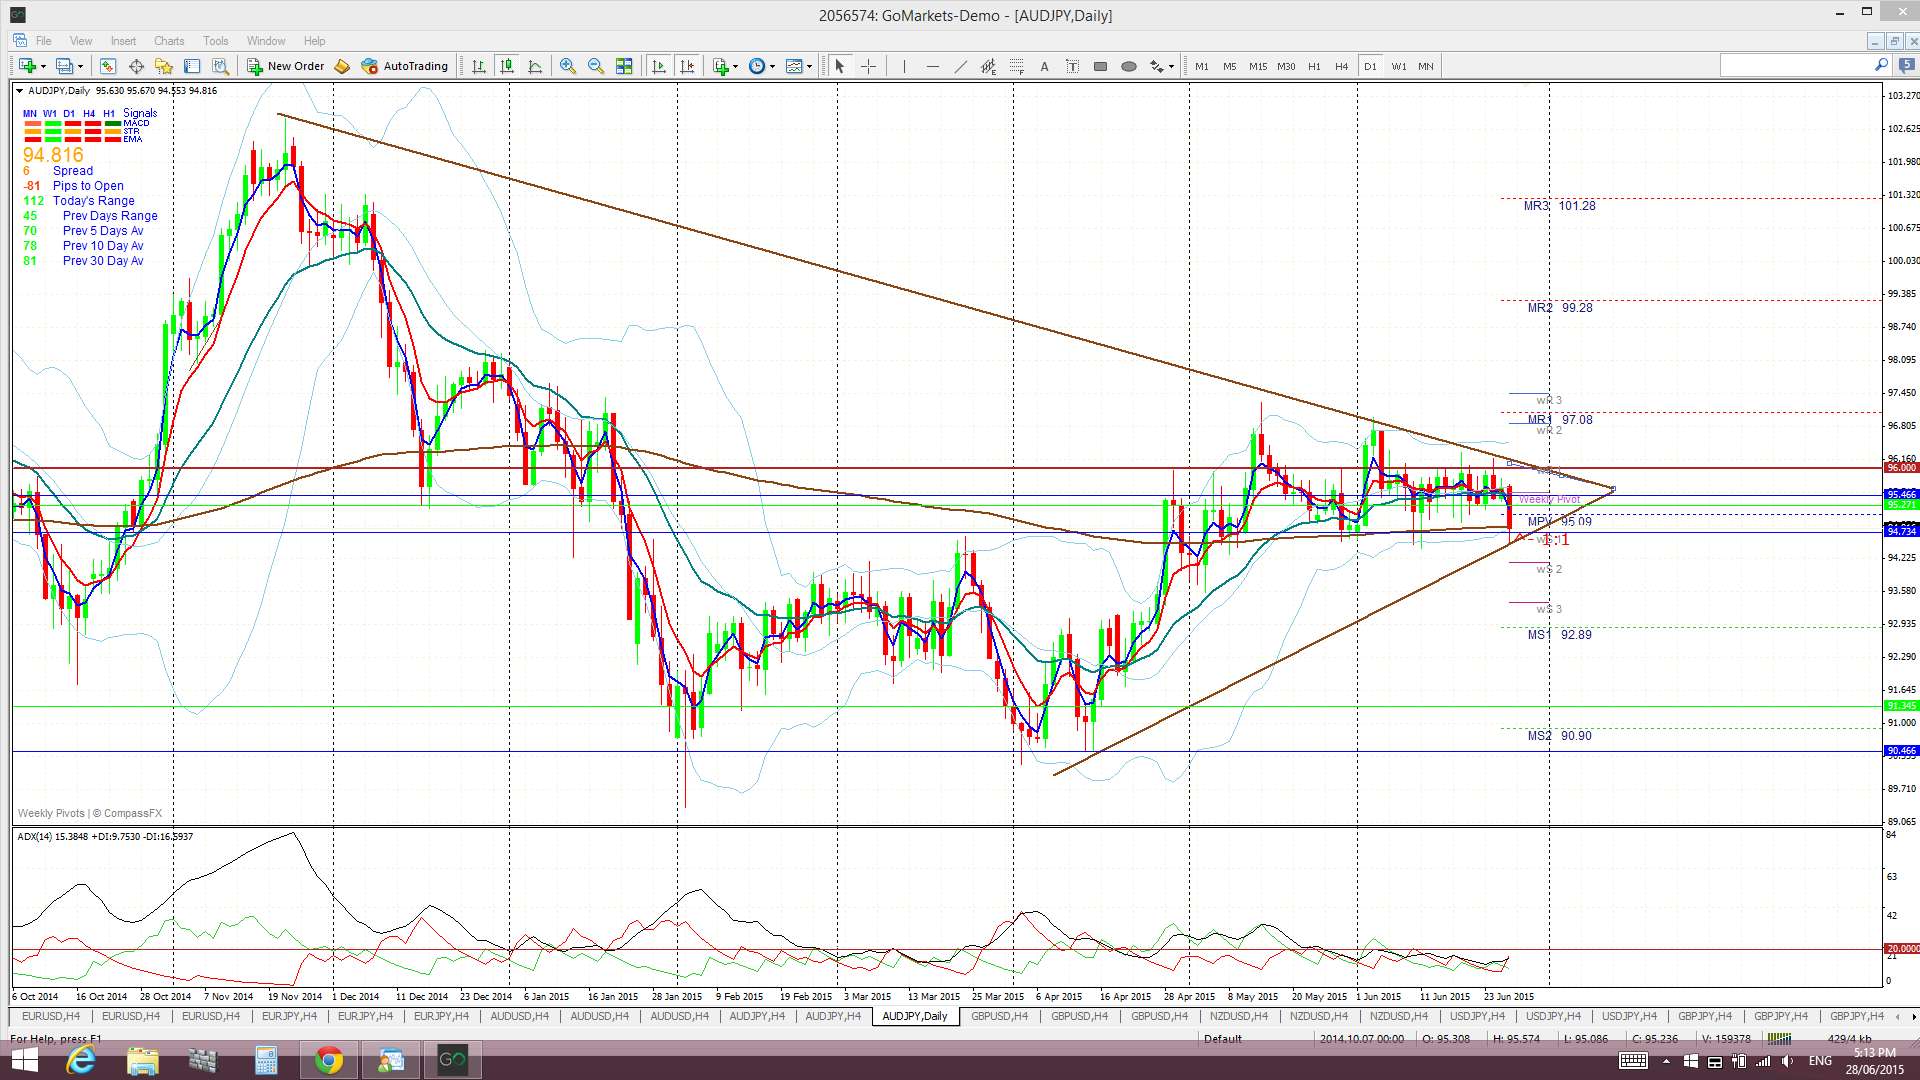
A/J daily: made a triangle break BUT without any momentum so…… skip it and adjust the trend lines:
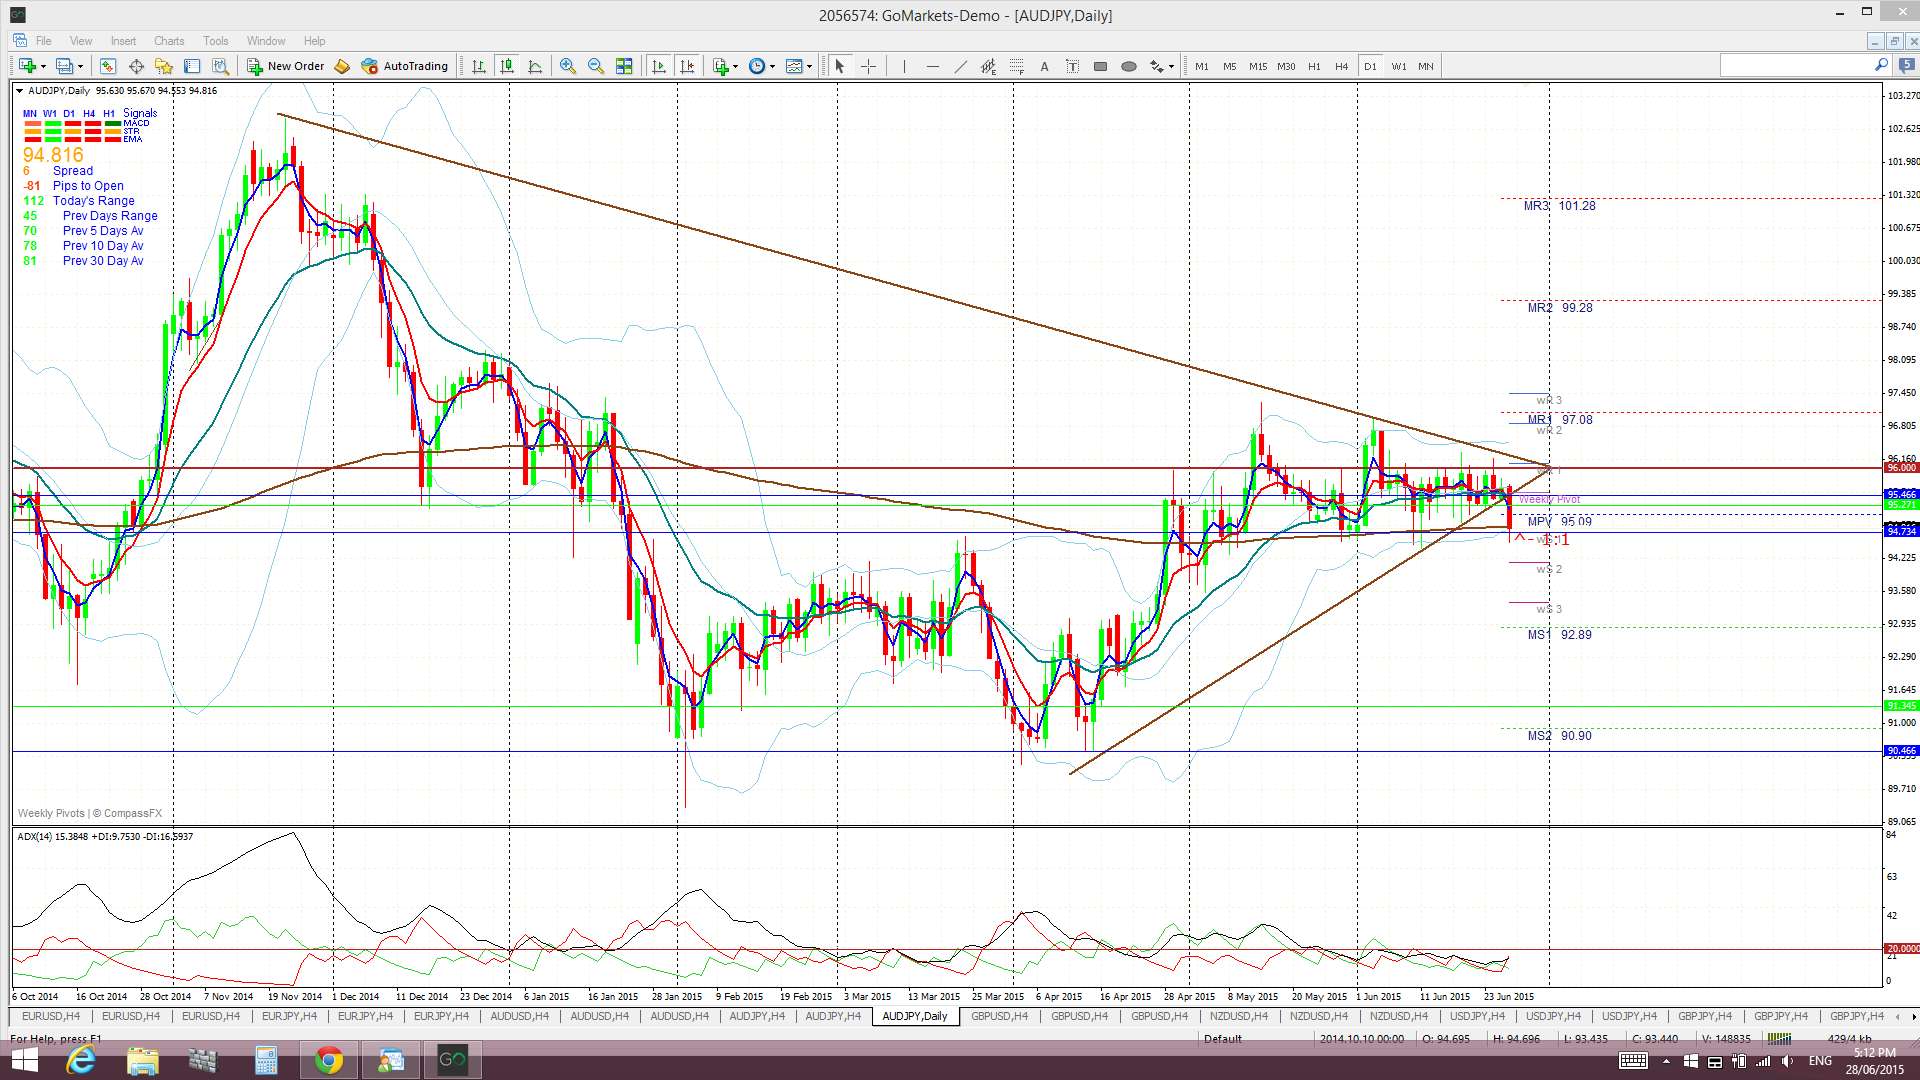
This then give a new triangle…watch for trend line breaks WITH momentum:
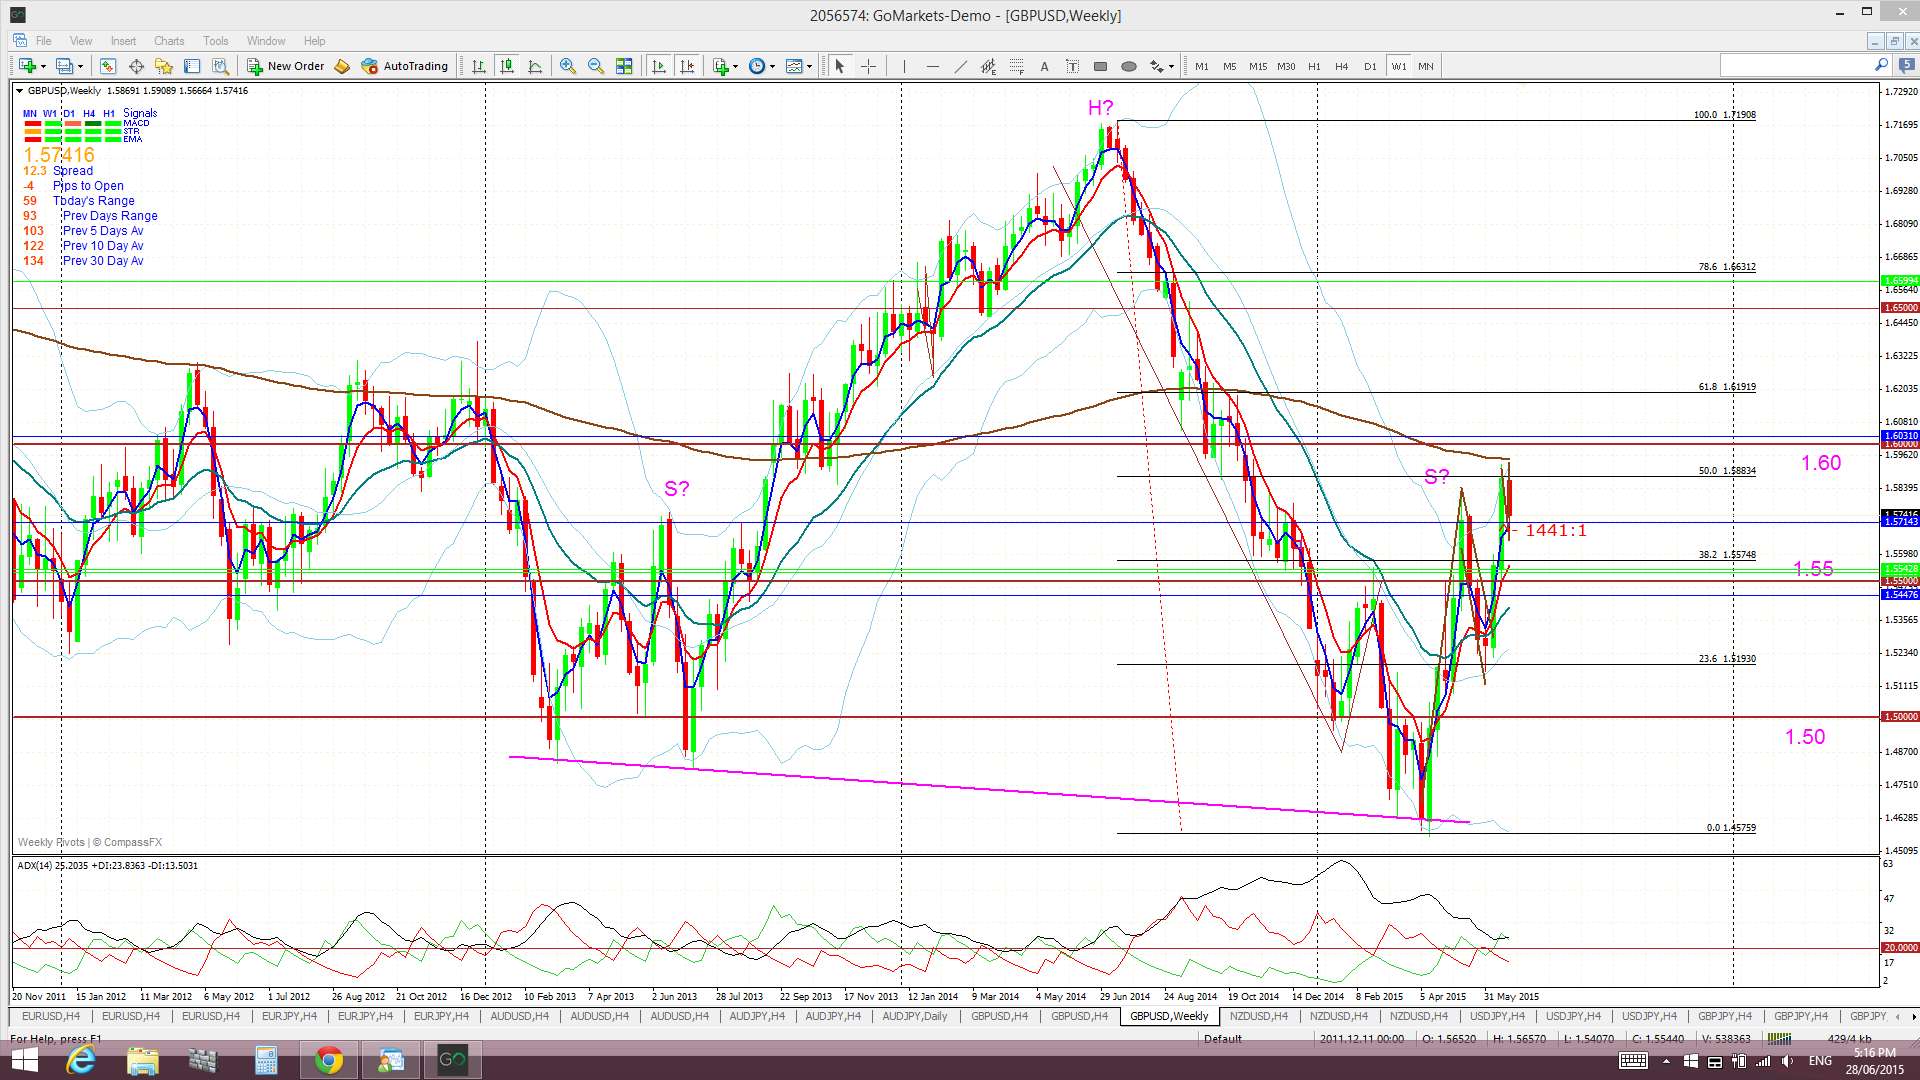
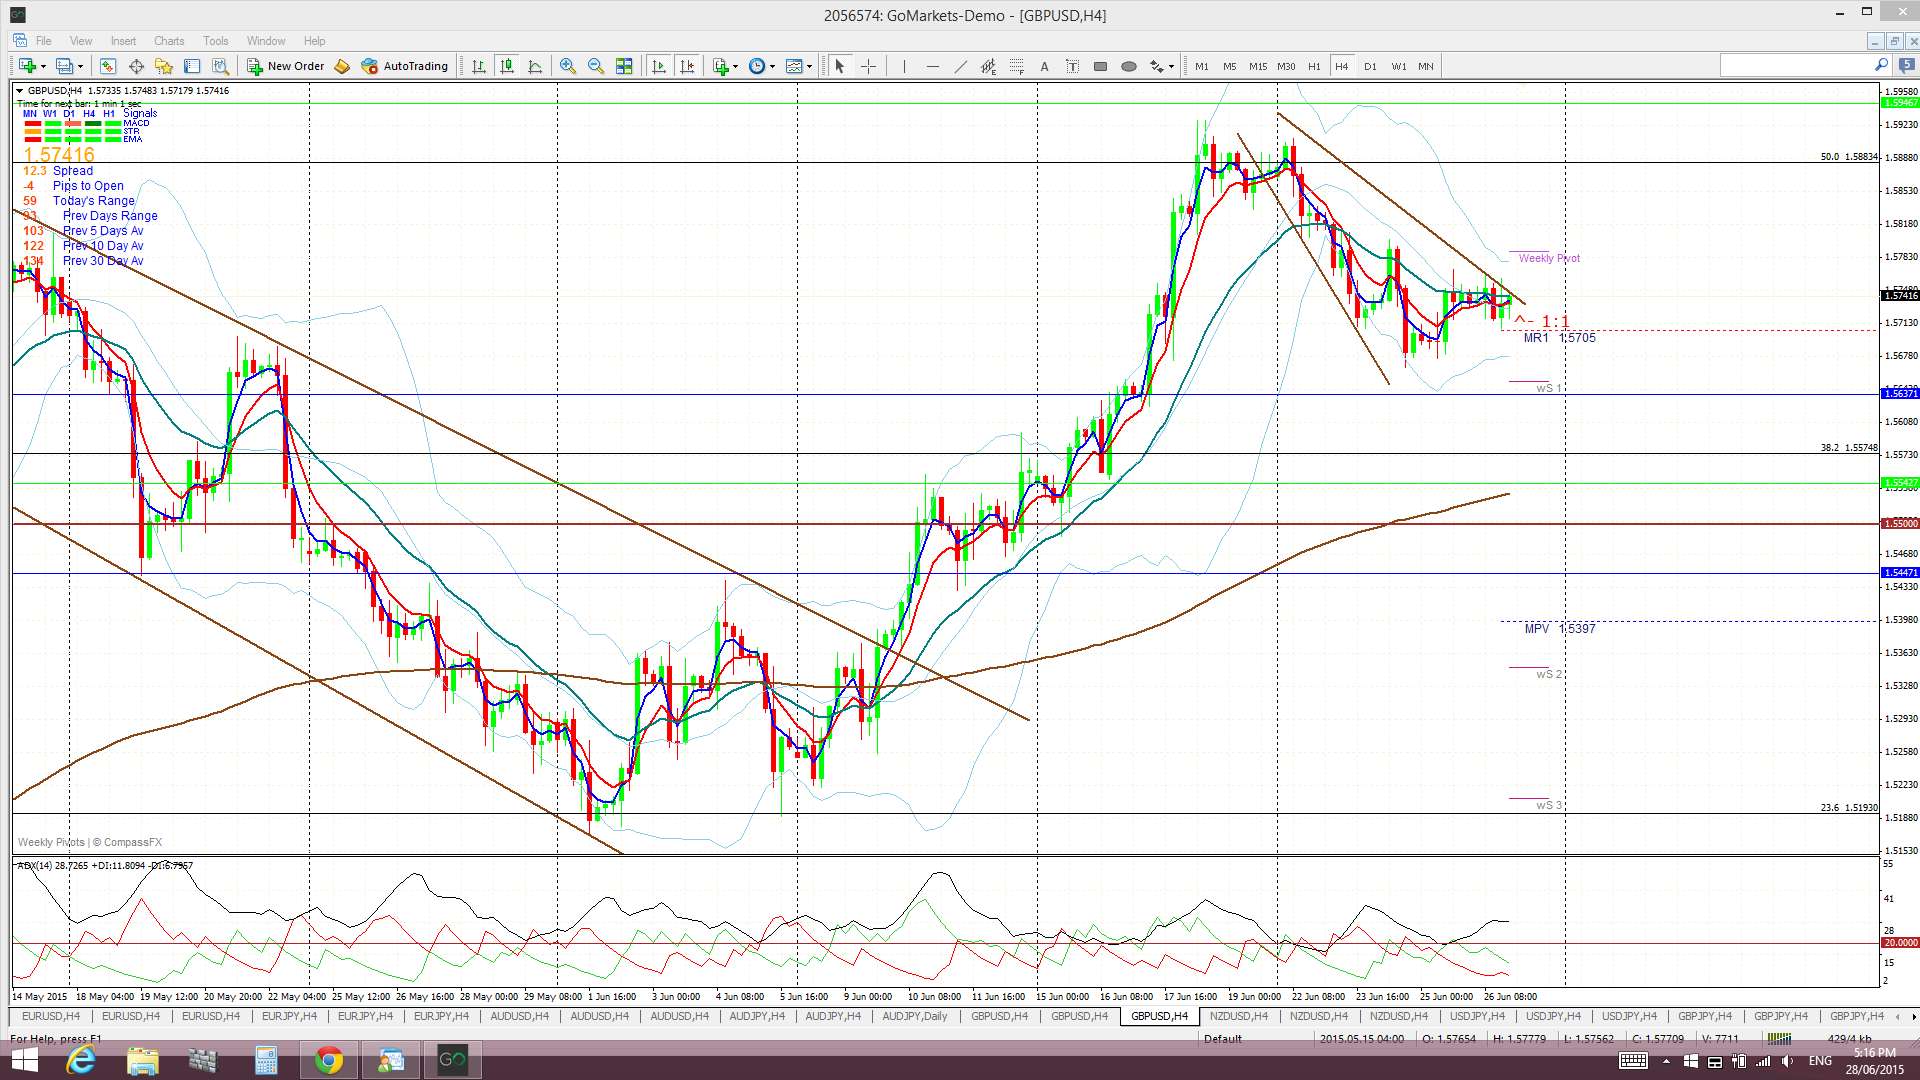
Cable: still looking like a bit like a ‘Bull Flag’ on the 4 hr chart. Note how this Flag is forming up under the 50% fib of the recent weekly chart swing low move:
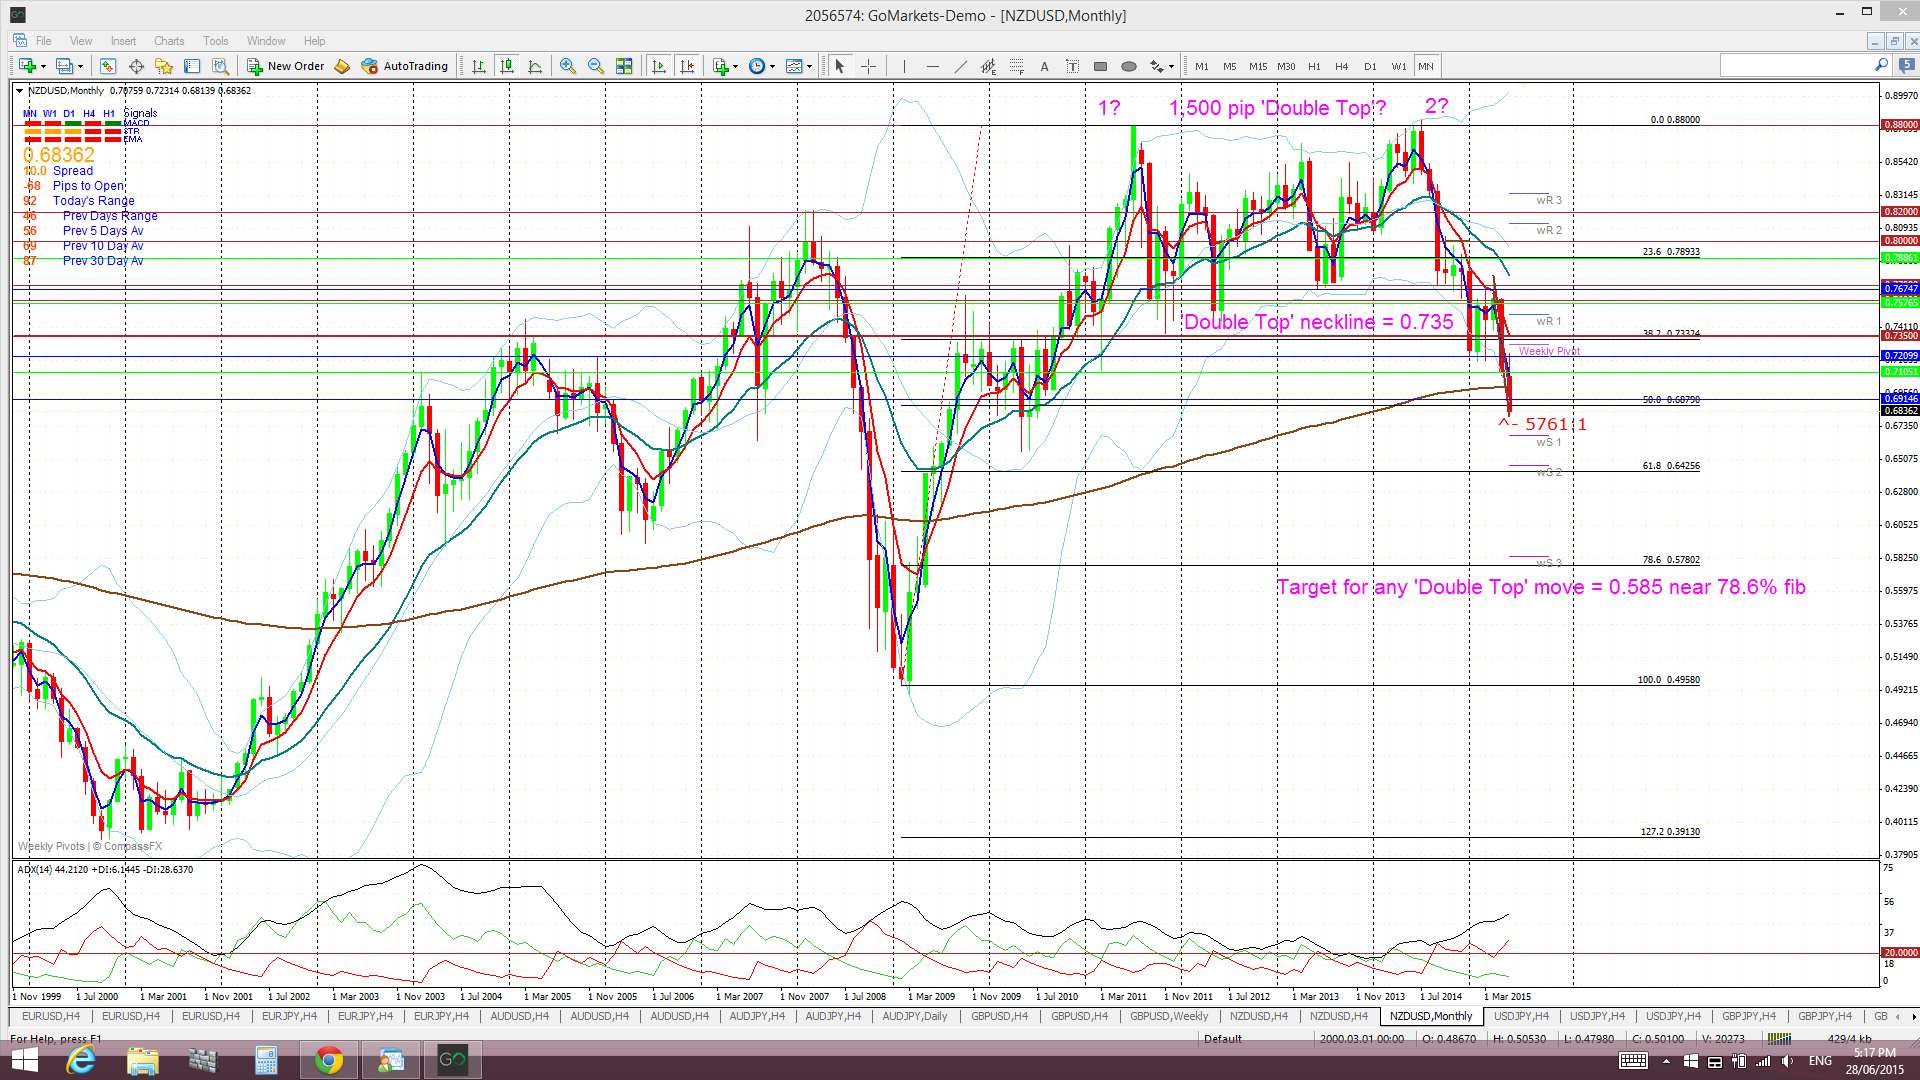
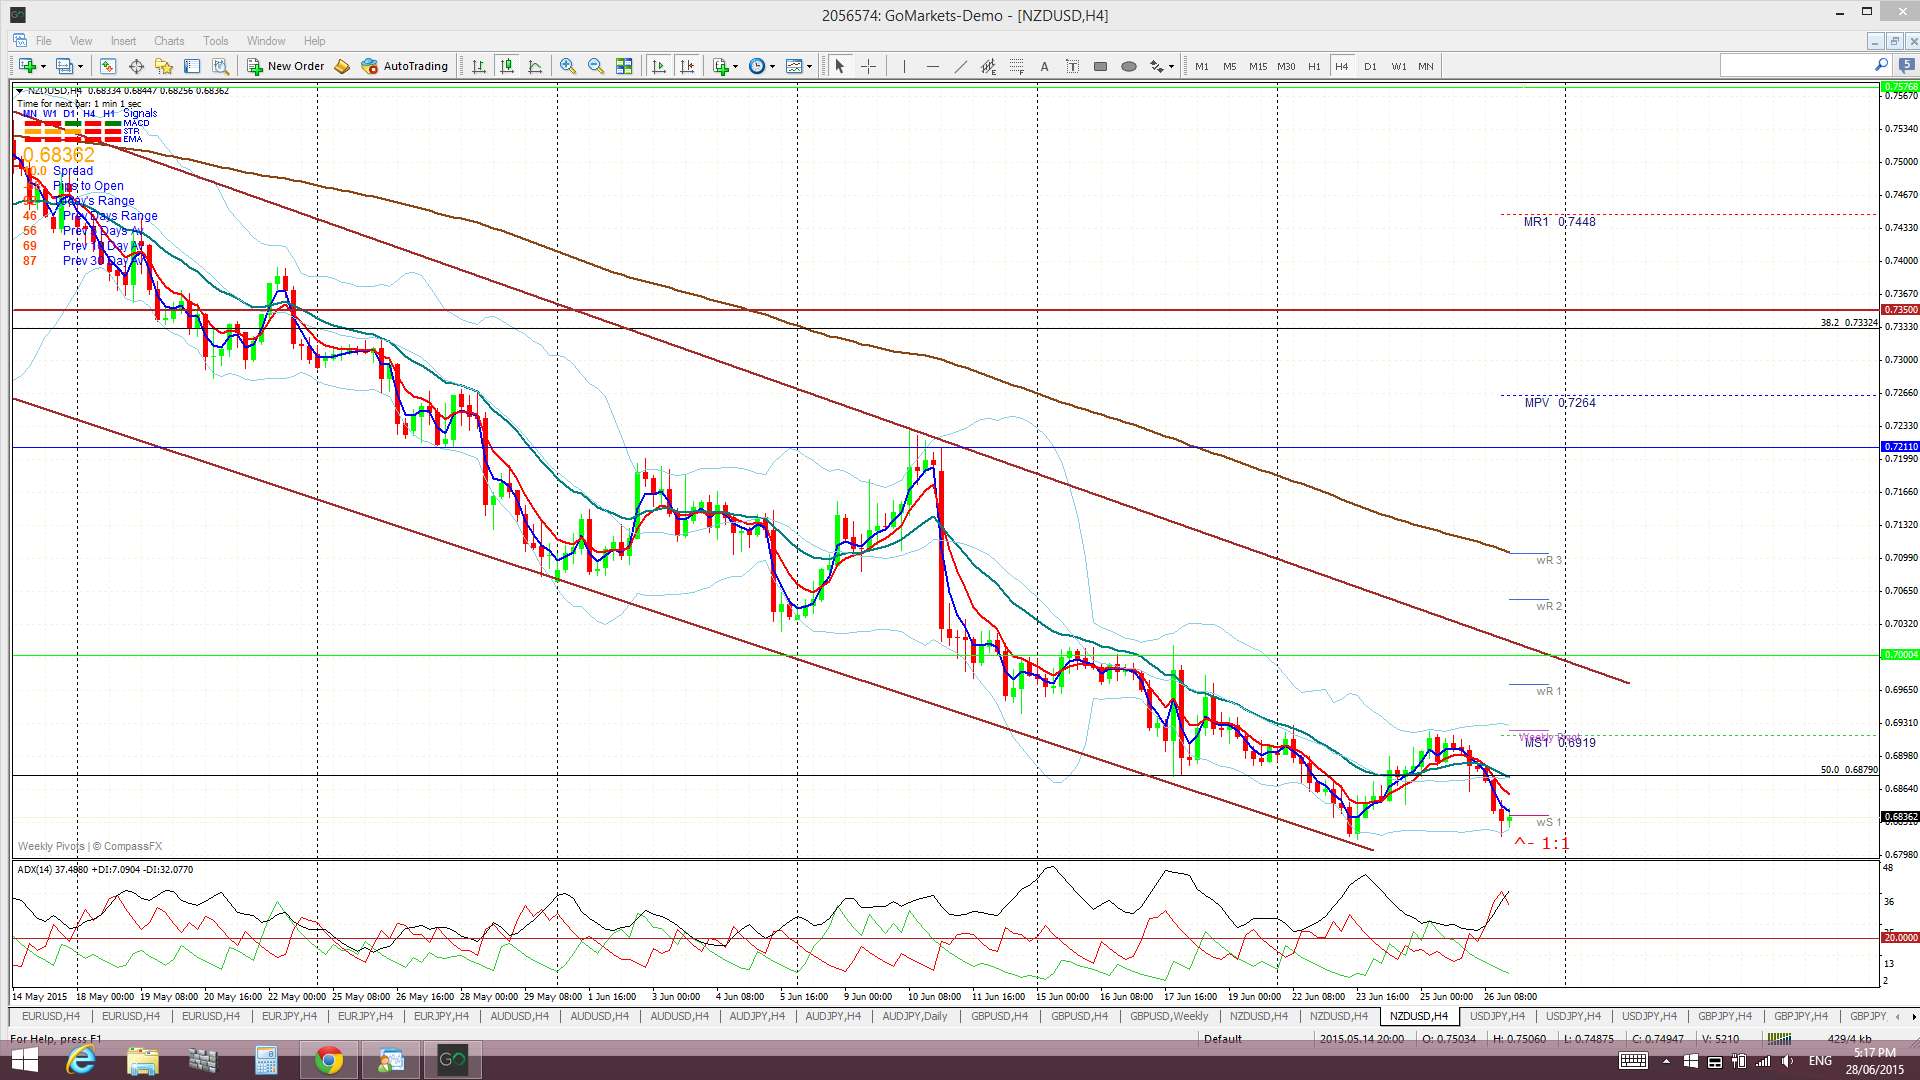
Kiwi: the monthly chart’s 50% fib remains a bit of a magnet to price action:
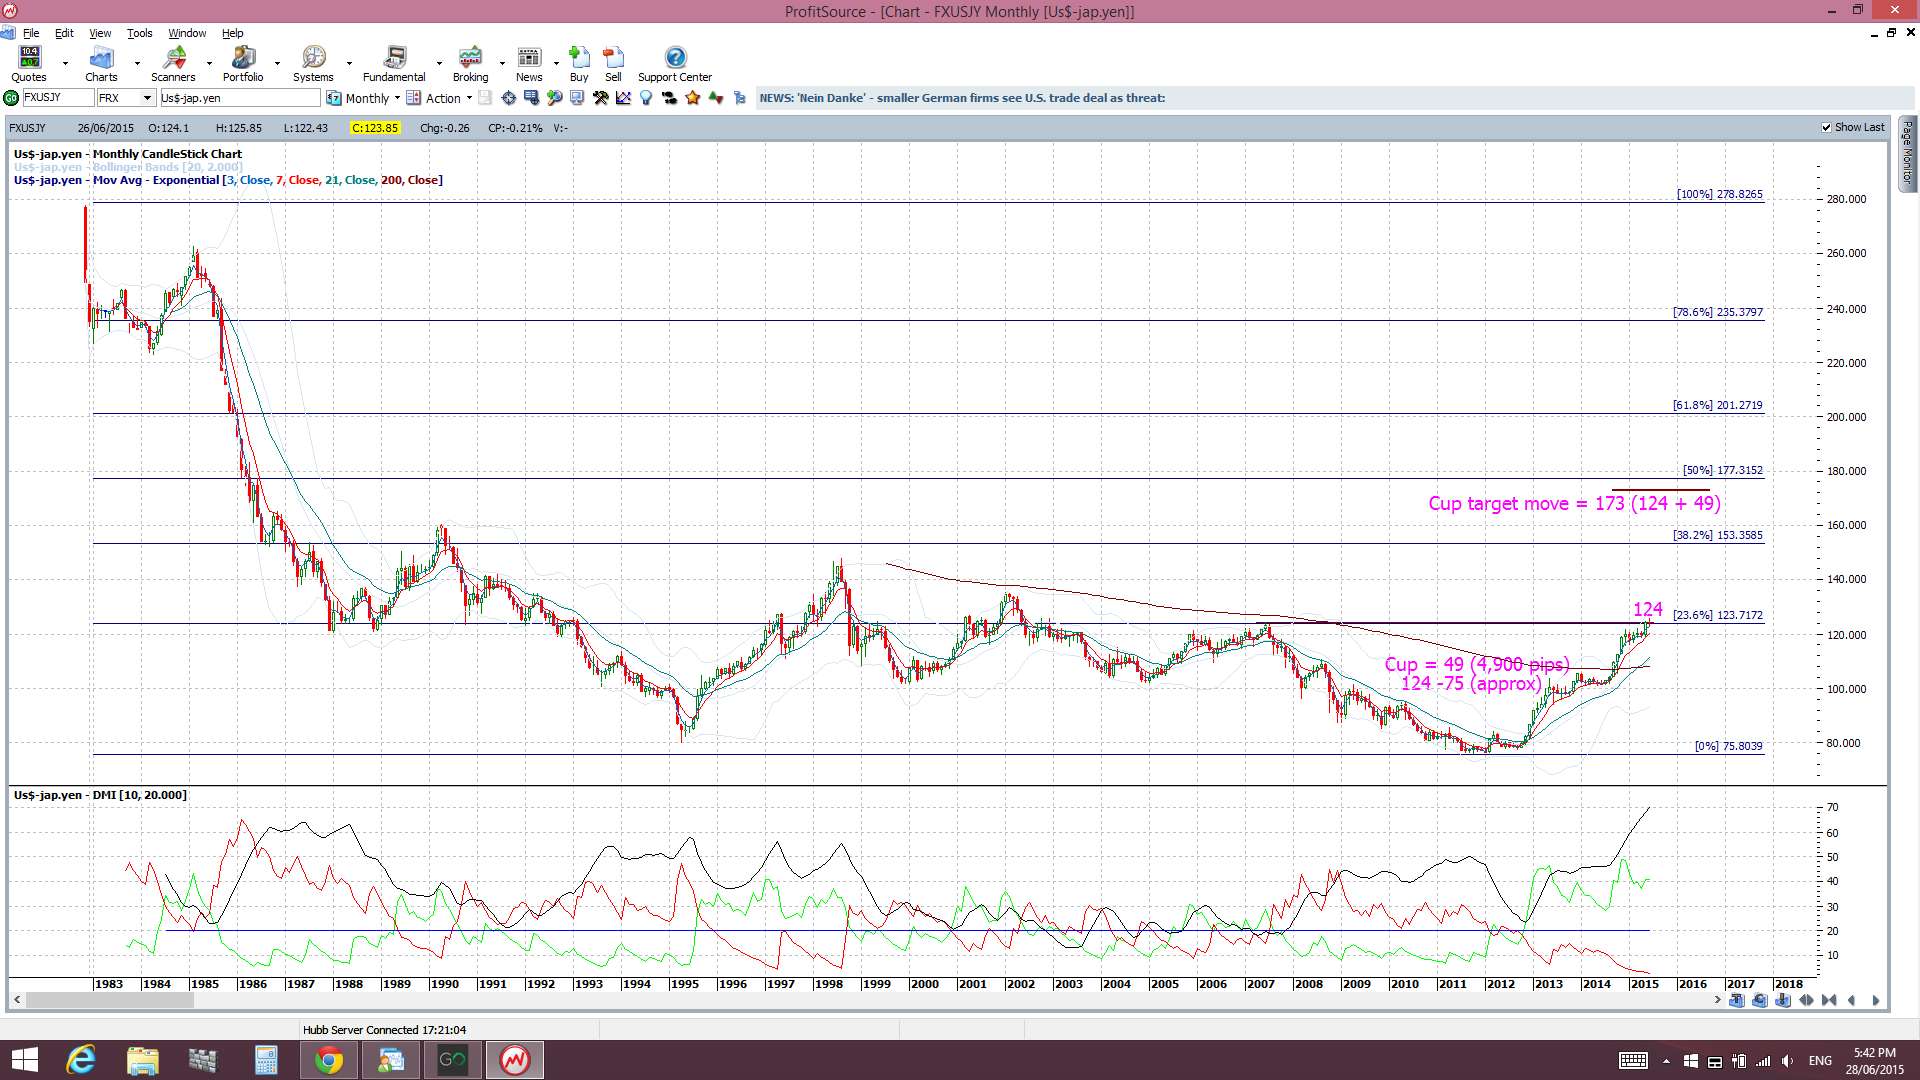
U/J: this closed just under 124 support. The monthly chart shows the significance of this key level:
U/J 4hr: closed just under 124:
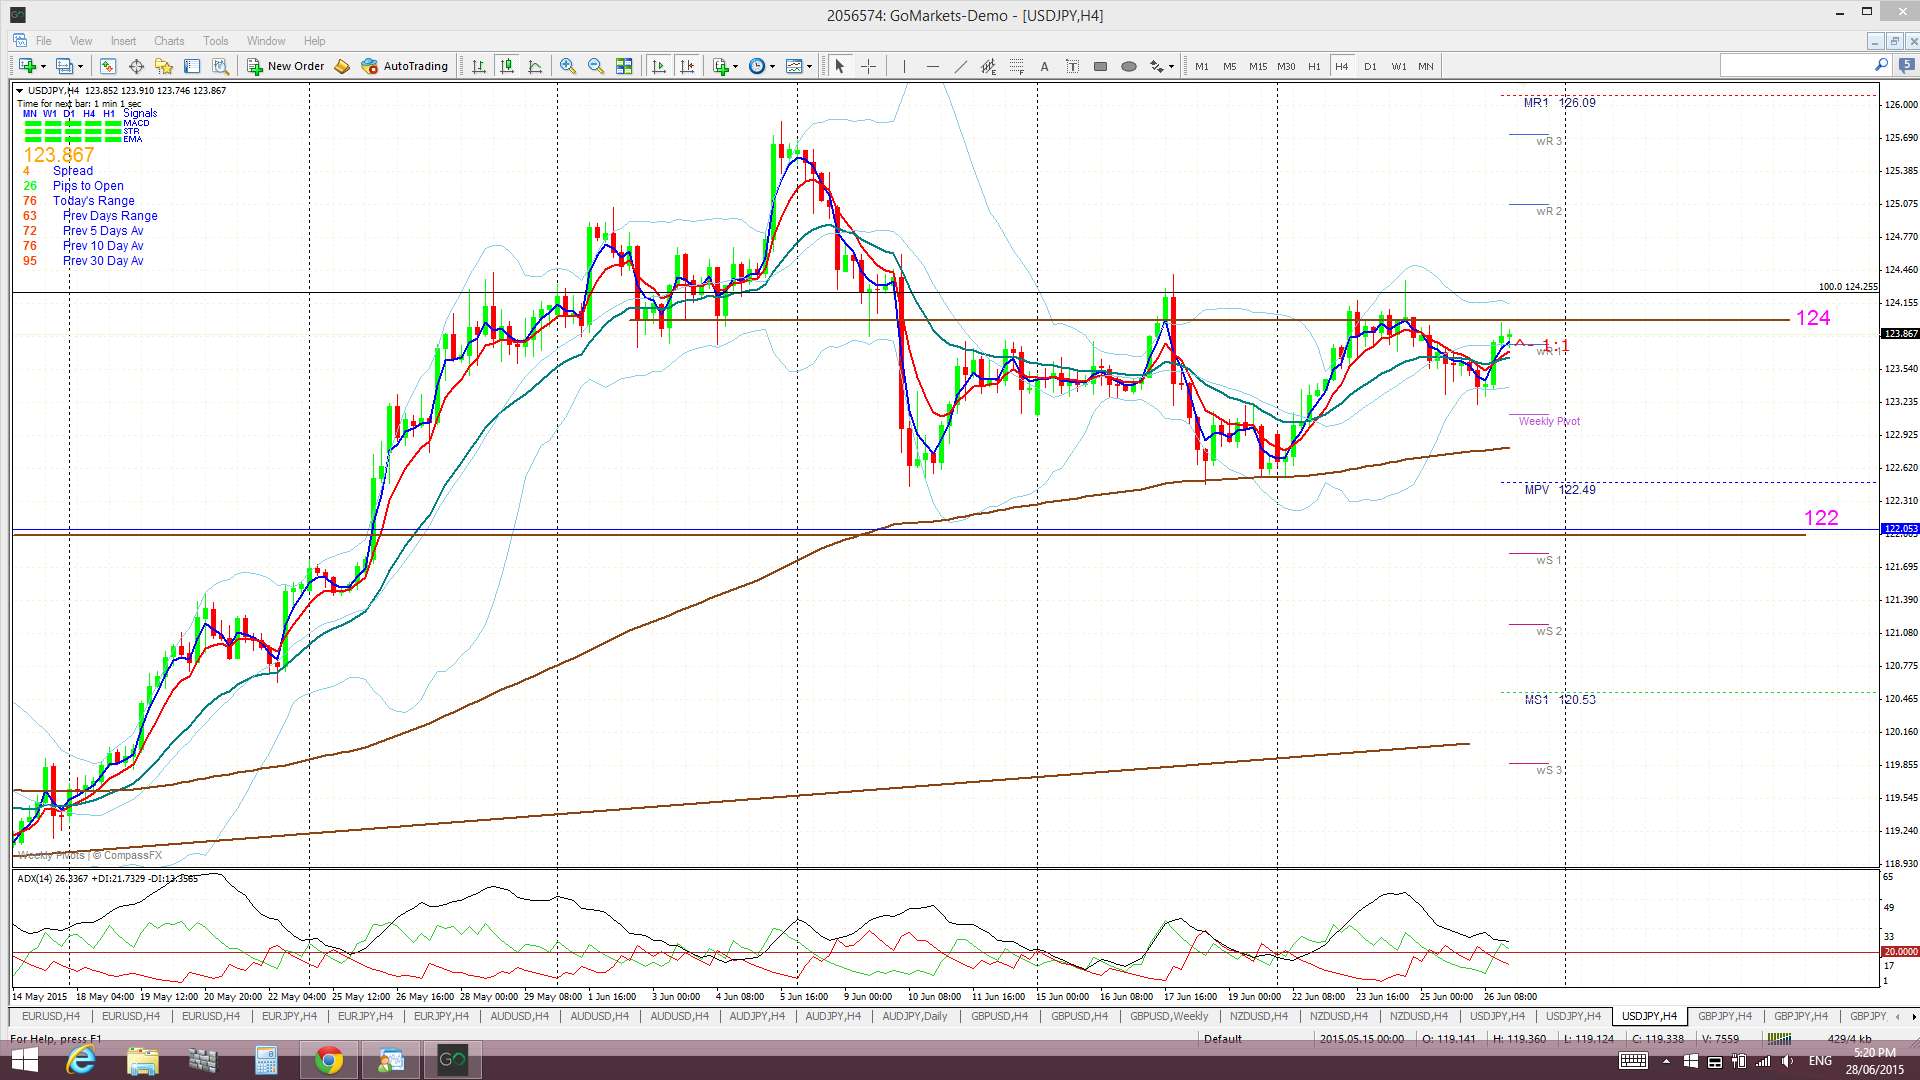
U/J monthly: this chart shows the significance of the 124 level:
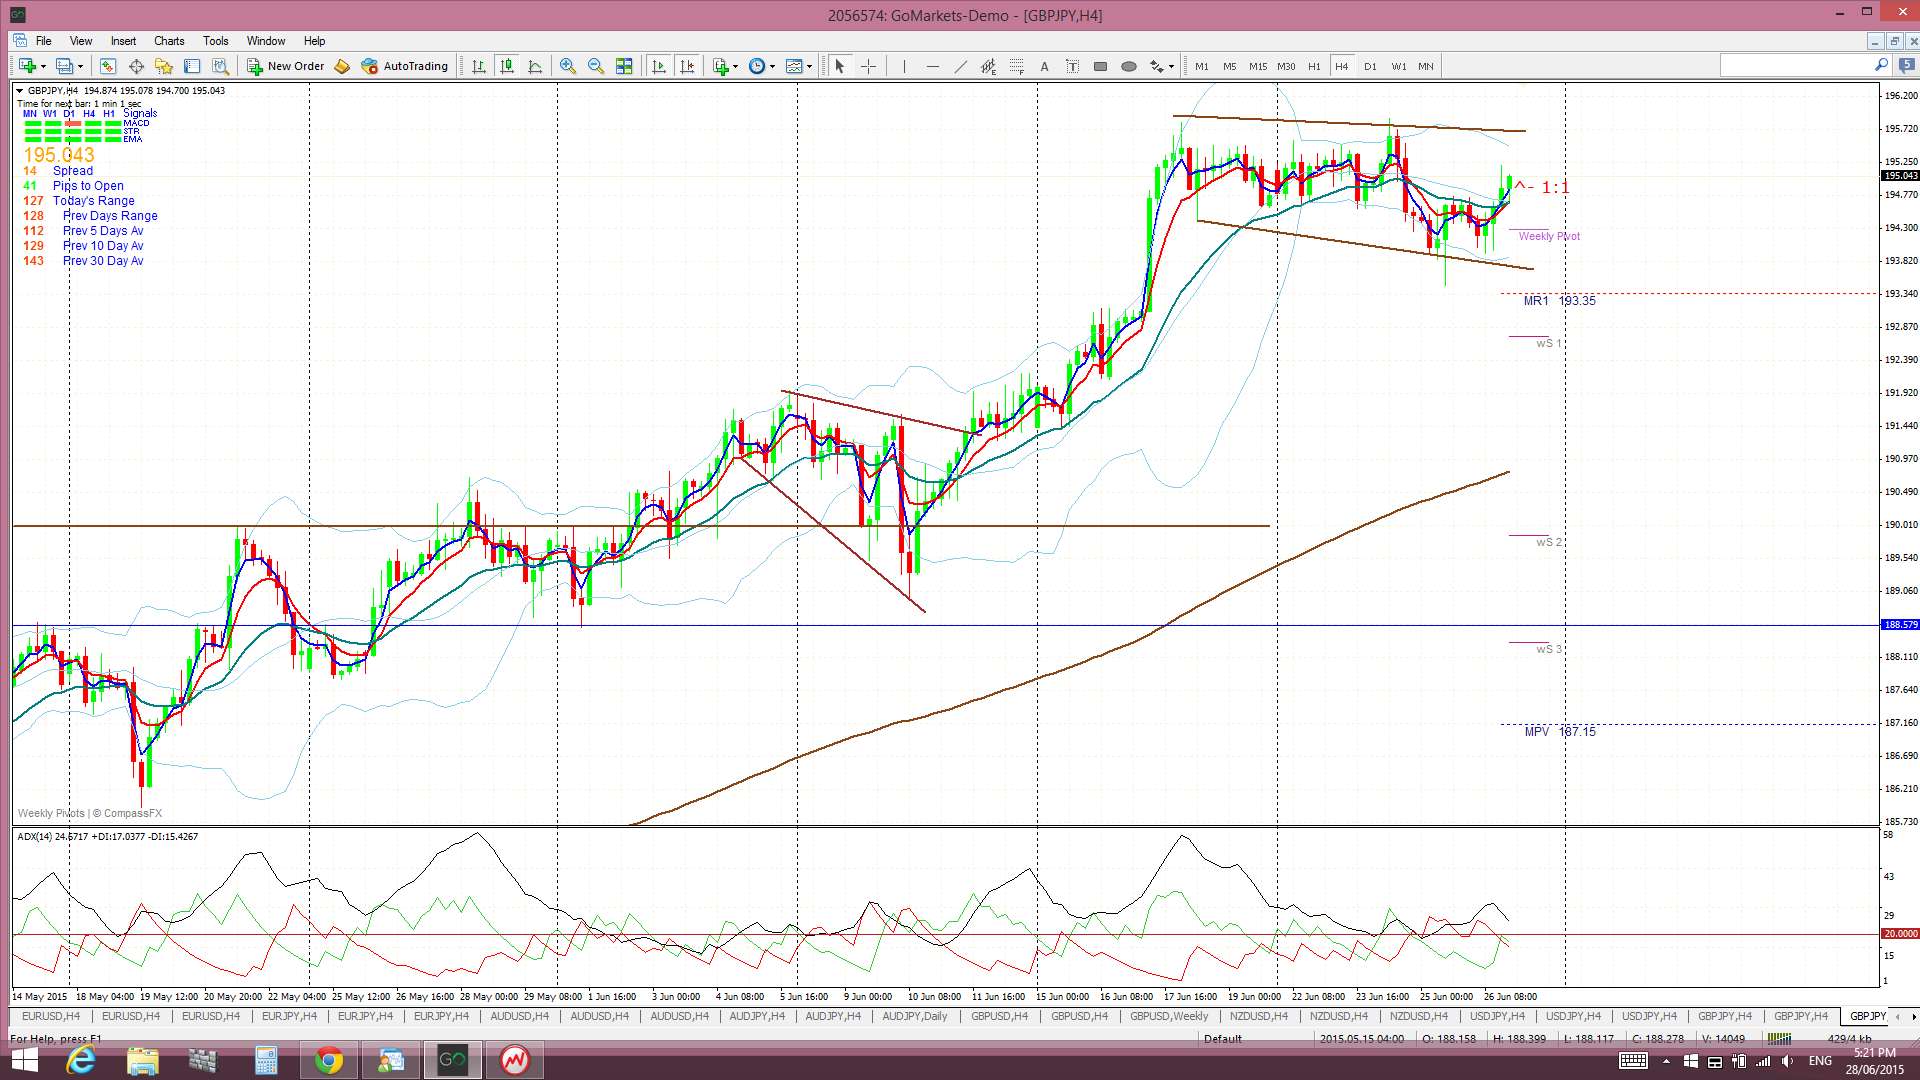
GBP/JPY 4hr: I’d prefer to see a momentum-based flag breakout here:
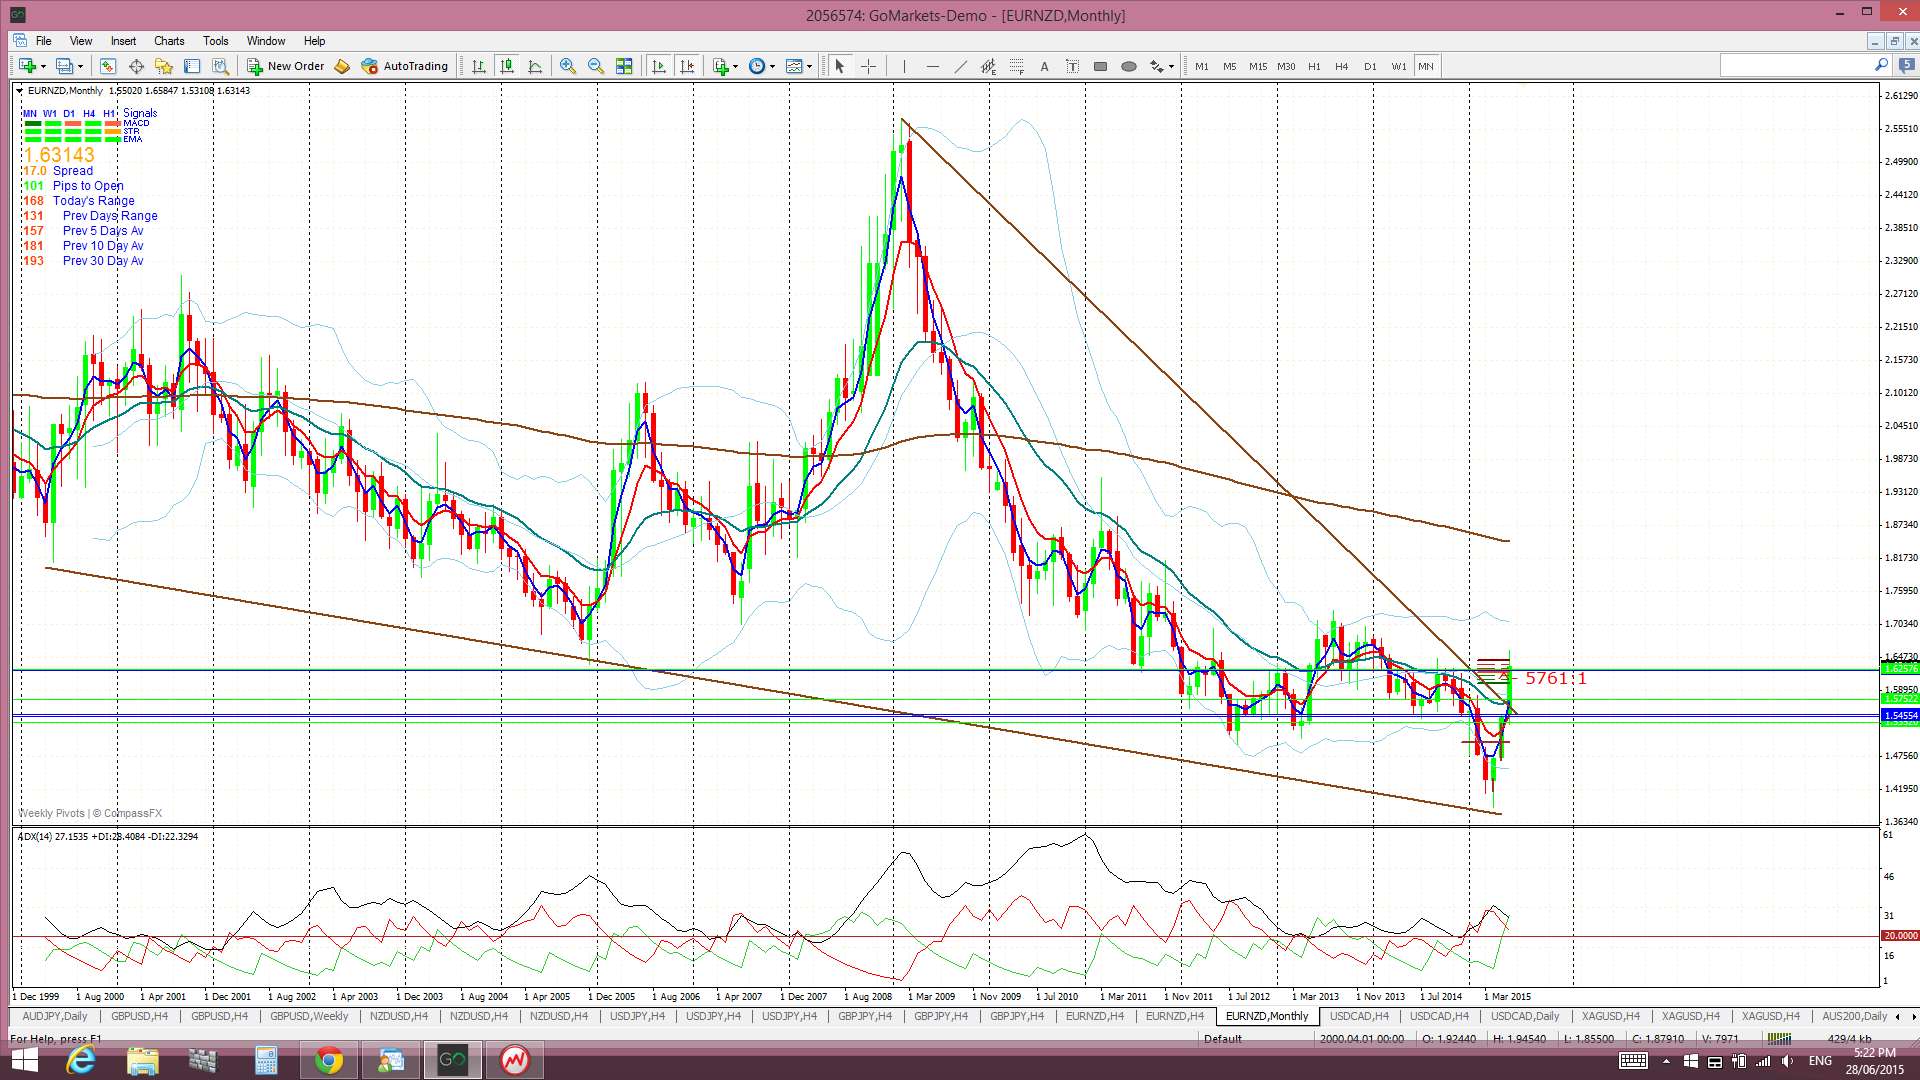
EUR/NZD monthly: the monthly candle will close off here after Tuesday. Technical theory would suggest that traders look for a test of the broken trend line before any potential continuation move higher. Something to keep in mind here given the significance of this potential monthly trend line break. Greek news could swing this chart in a heart beat though so watch to see where this closes after Tuesday 30th June:
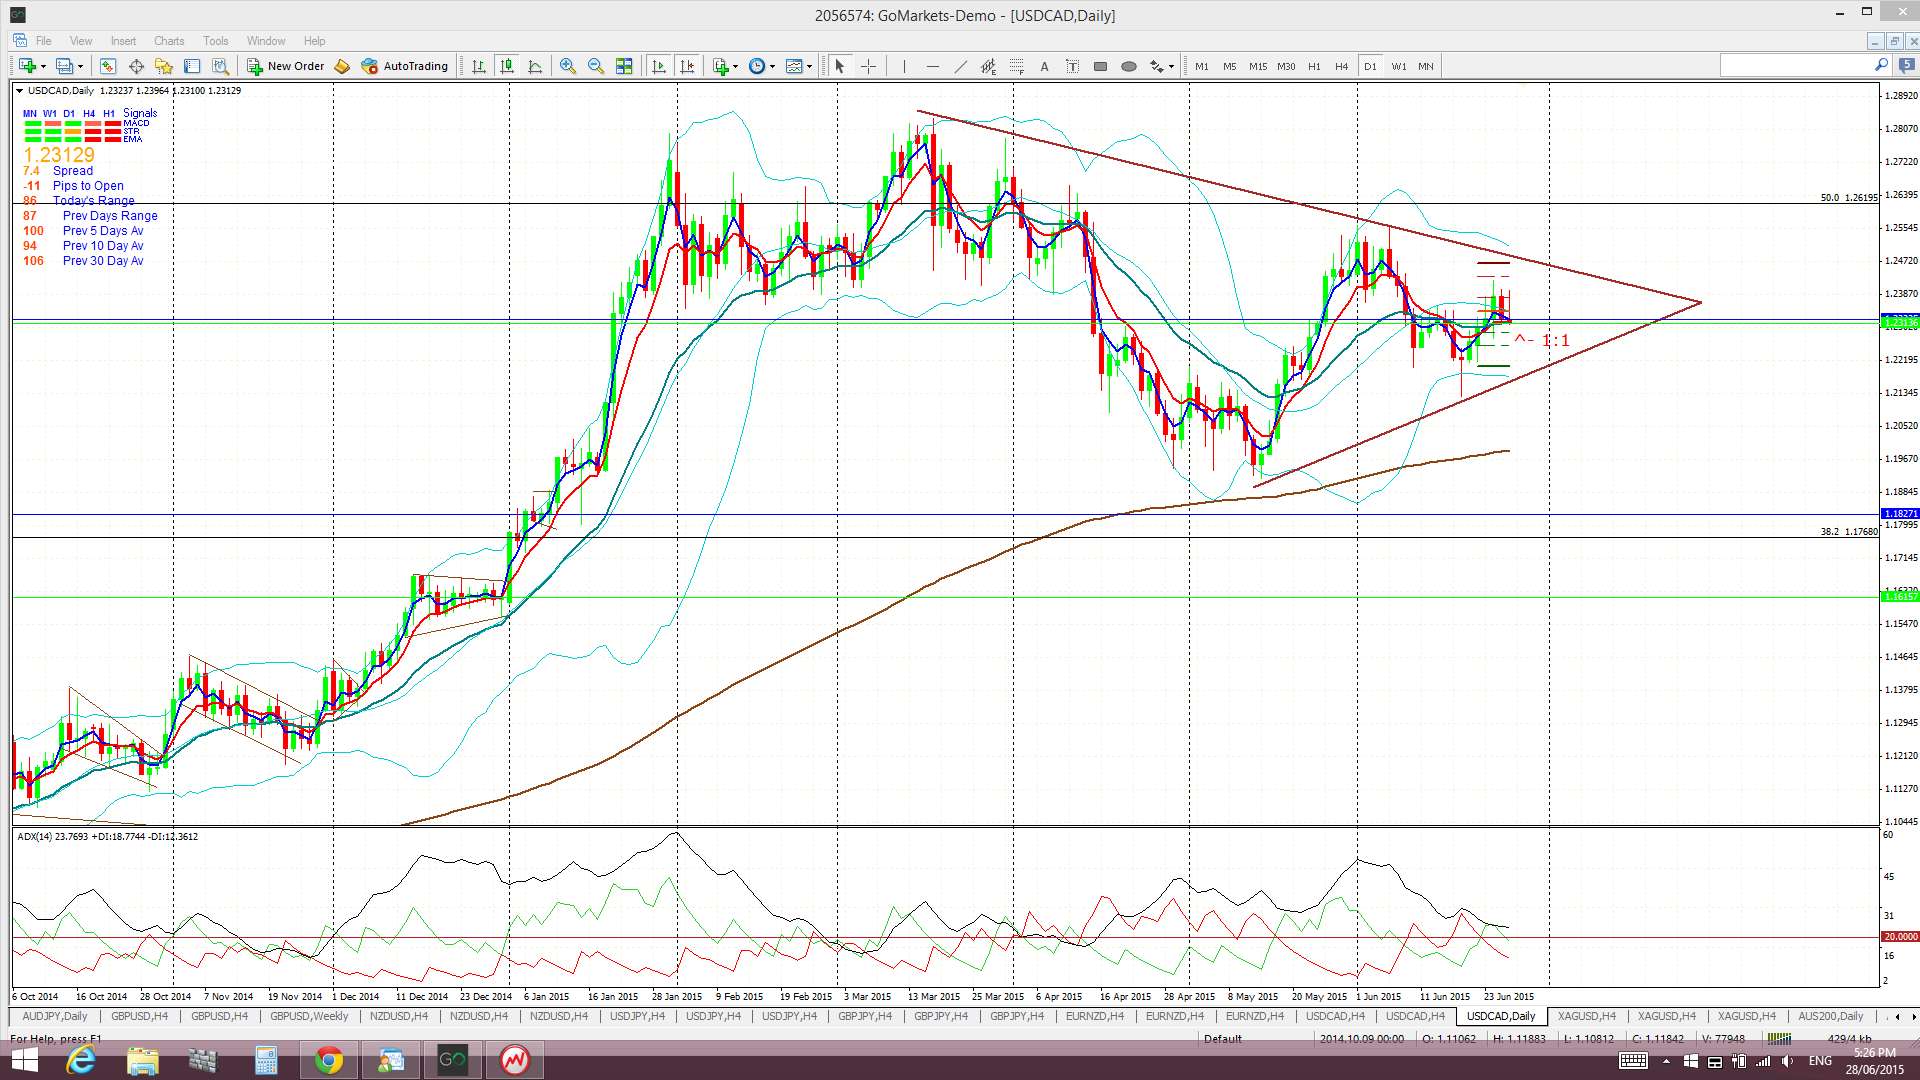
Loonie daily: triangle bound here, like the US$ index:
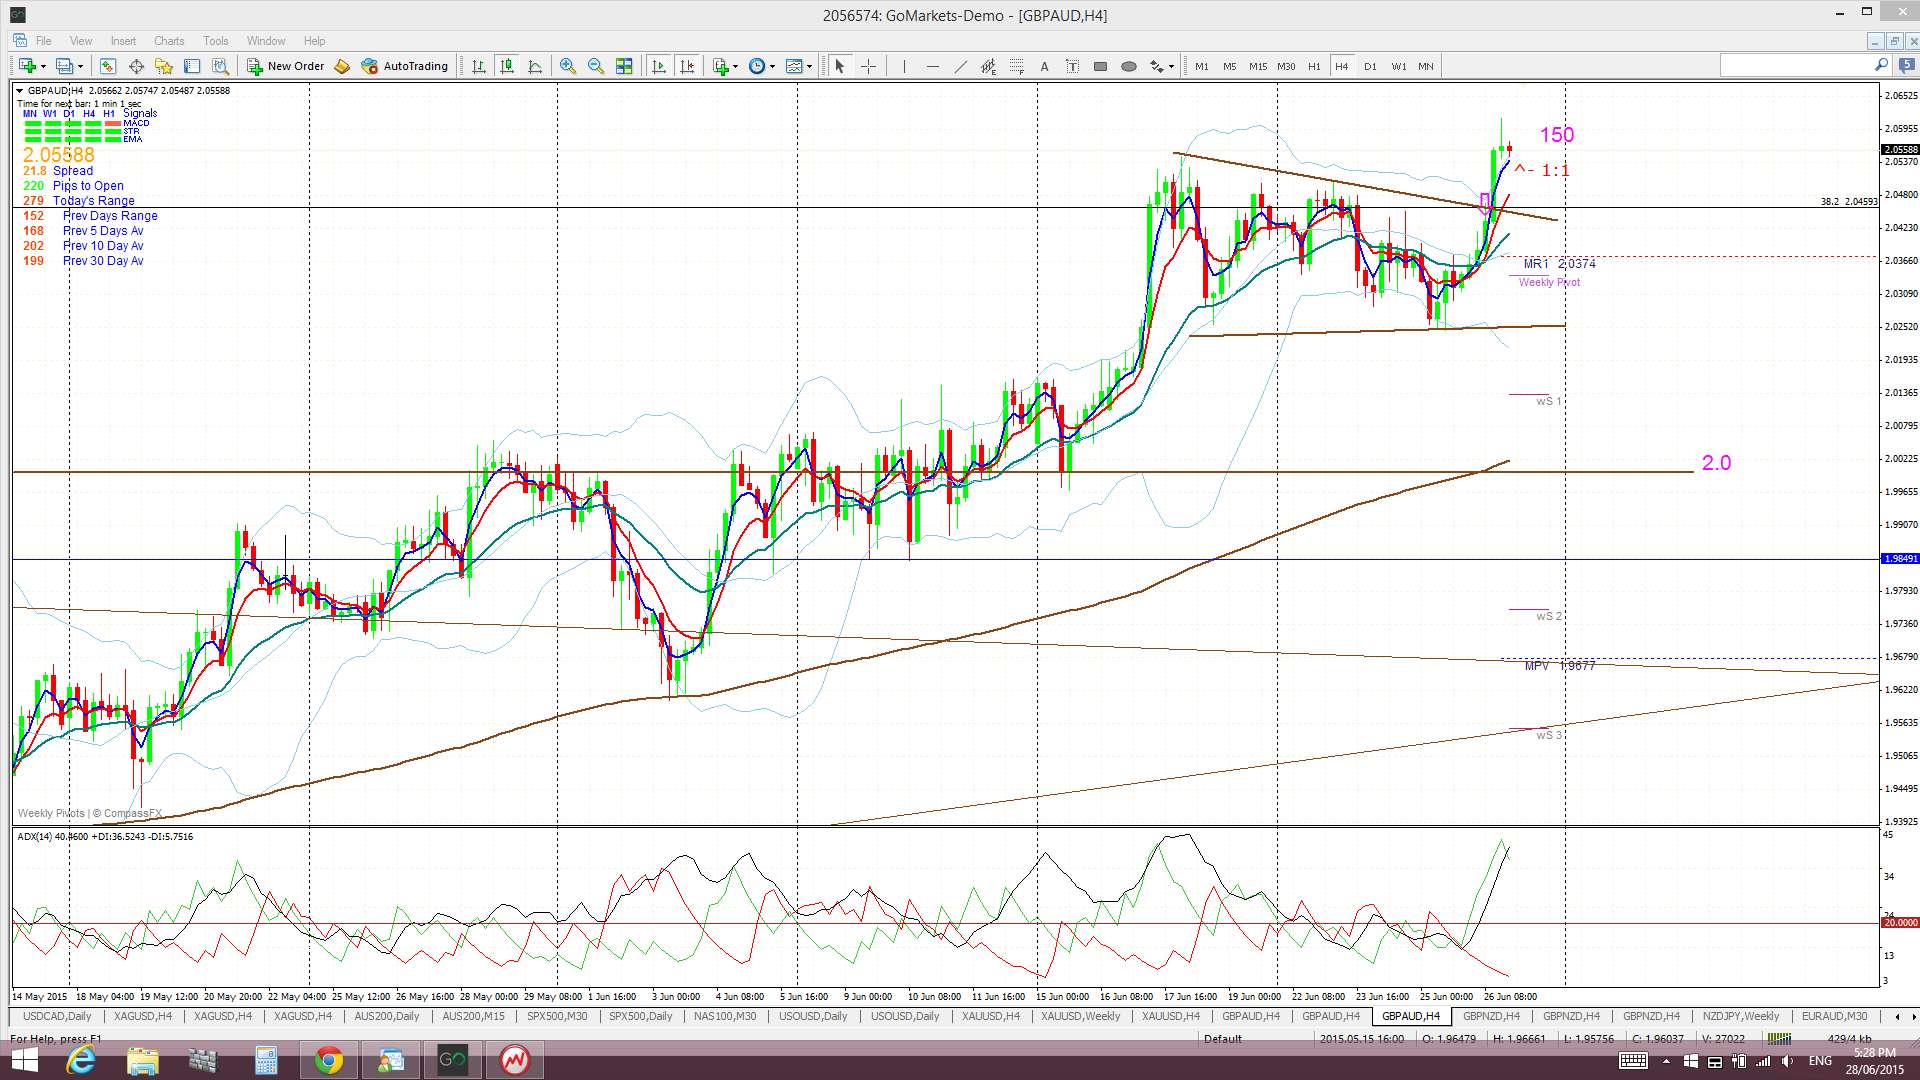
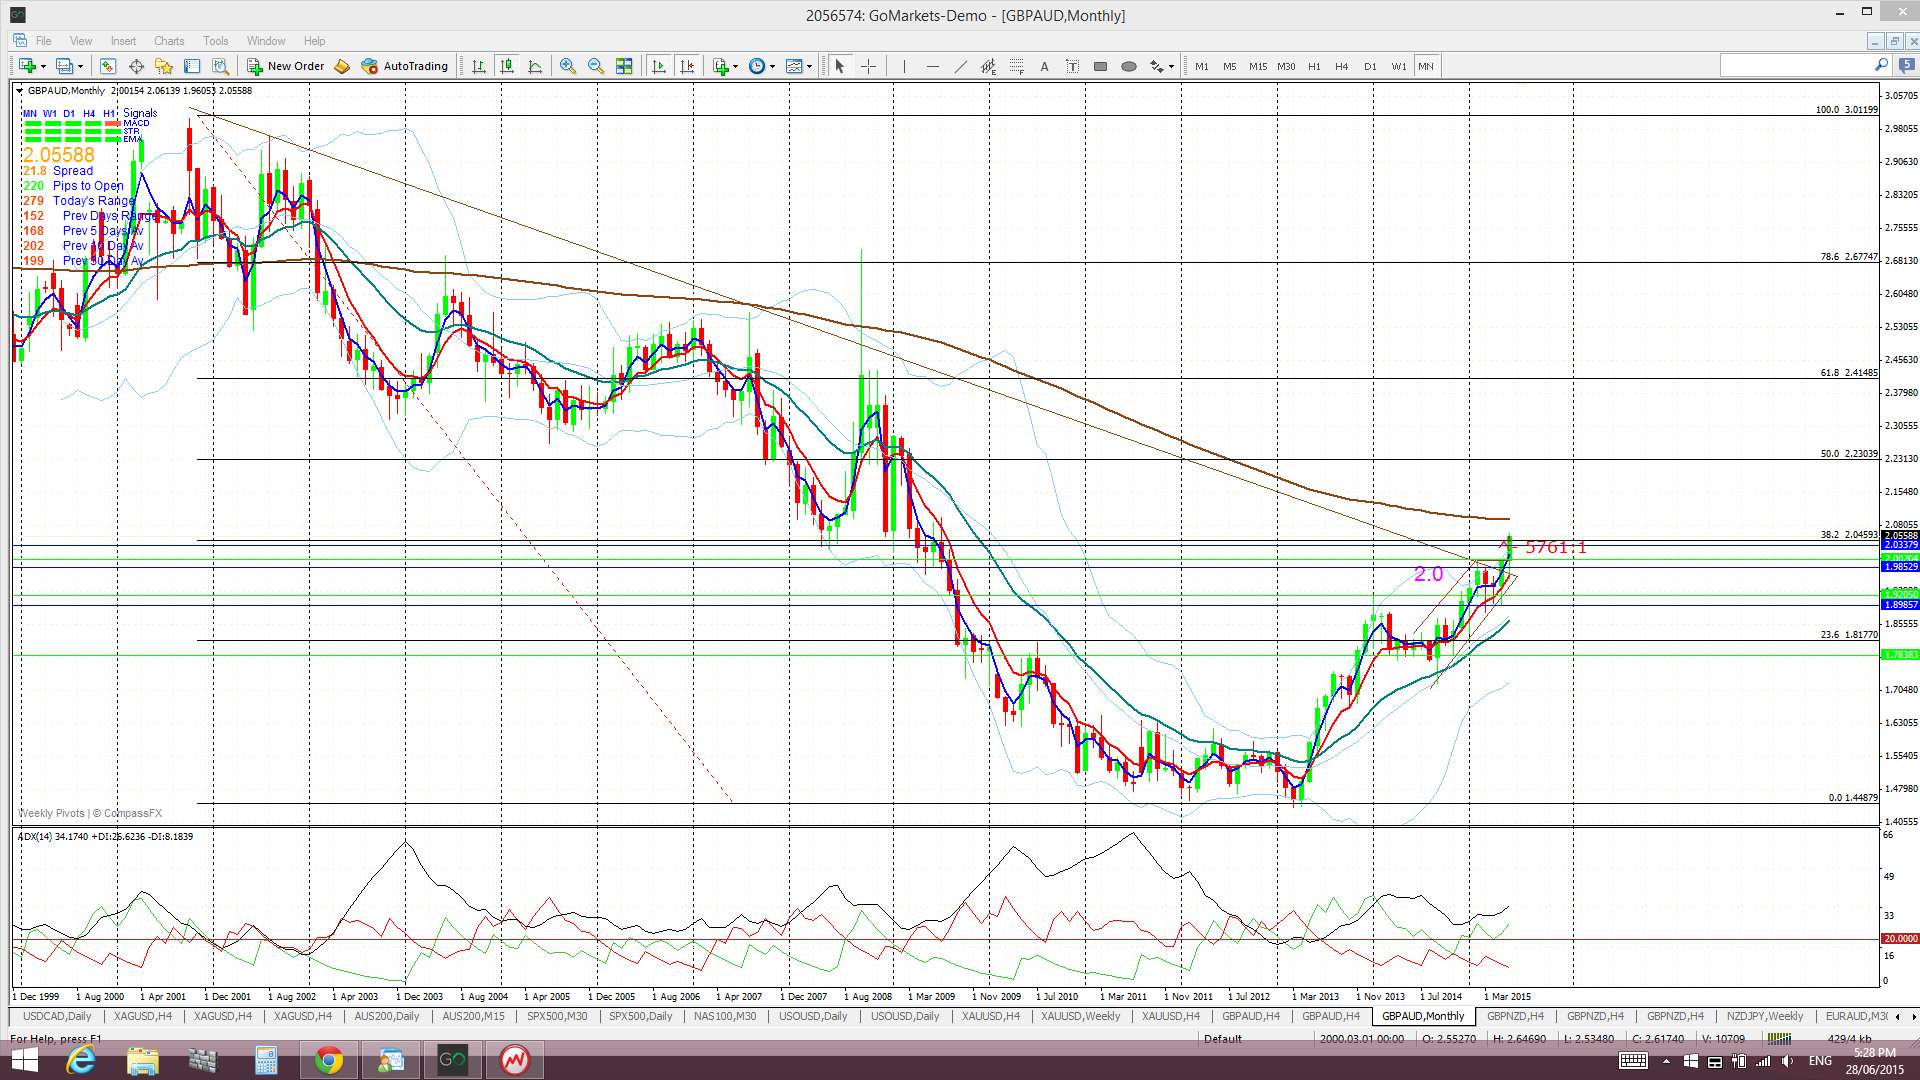
GBP/AUD: I missed a TC signal and channel breakout here that gave up to 150 pips. The monthly chart is more the issue though. There looks like there will be another hold above the recent monthly chart trend-line breakout. Monthly chart Fib levels might help identify bullish continuation targets:
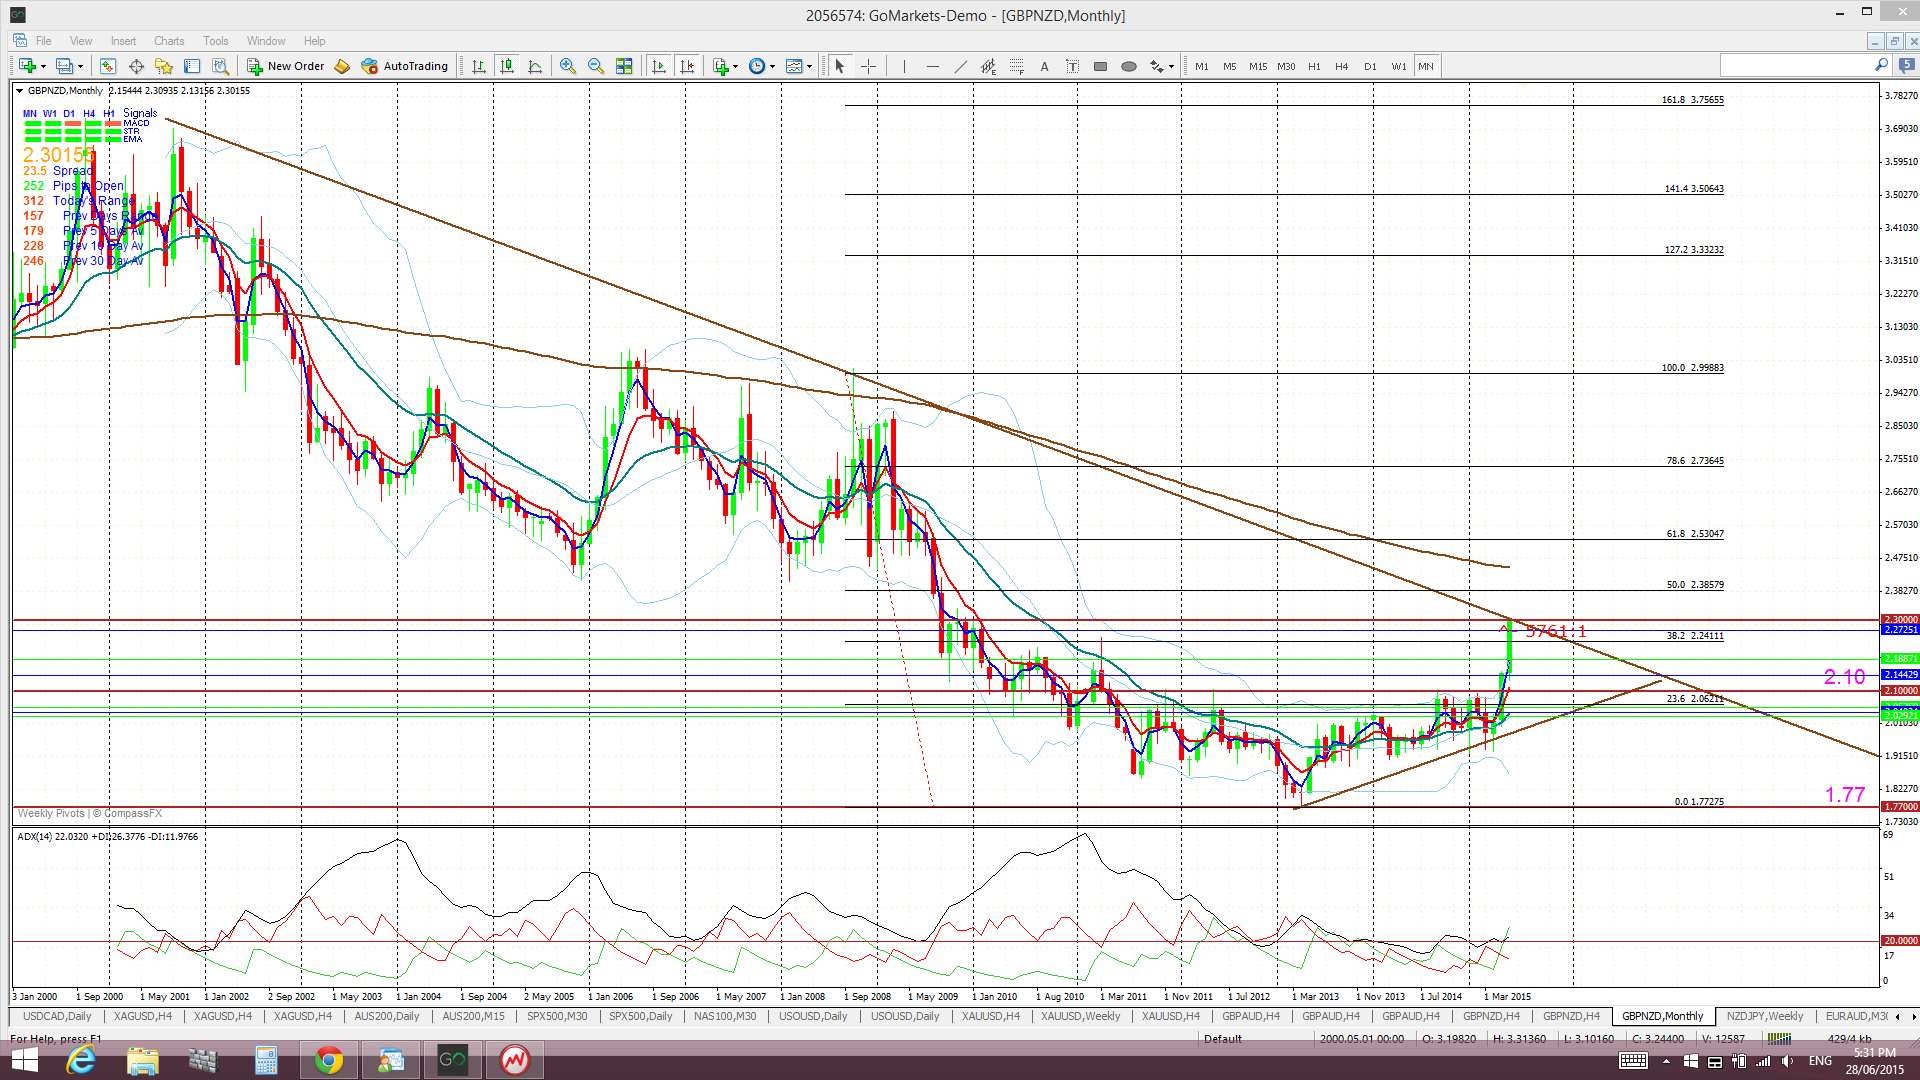
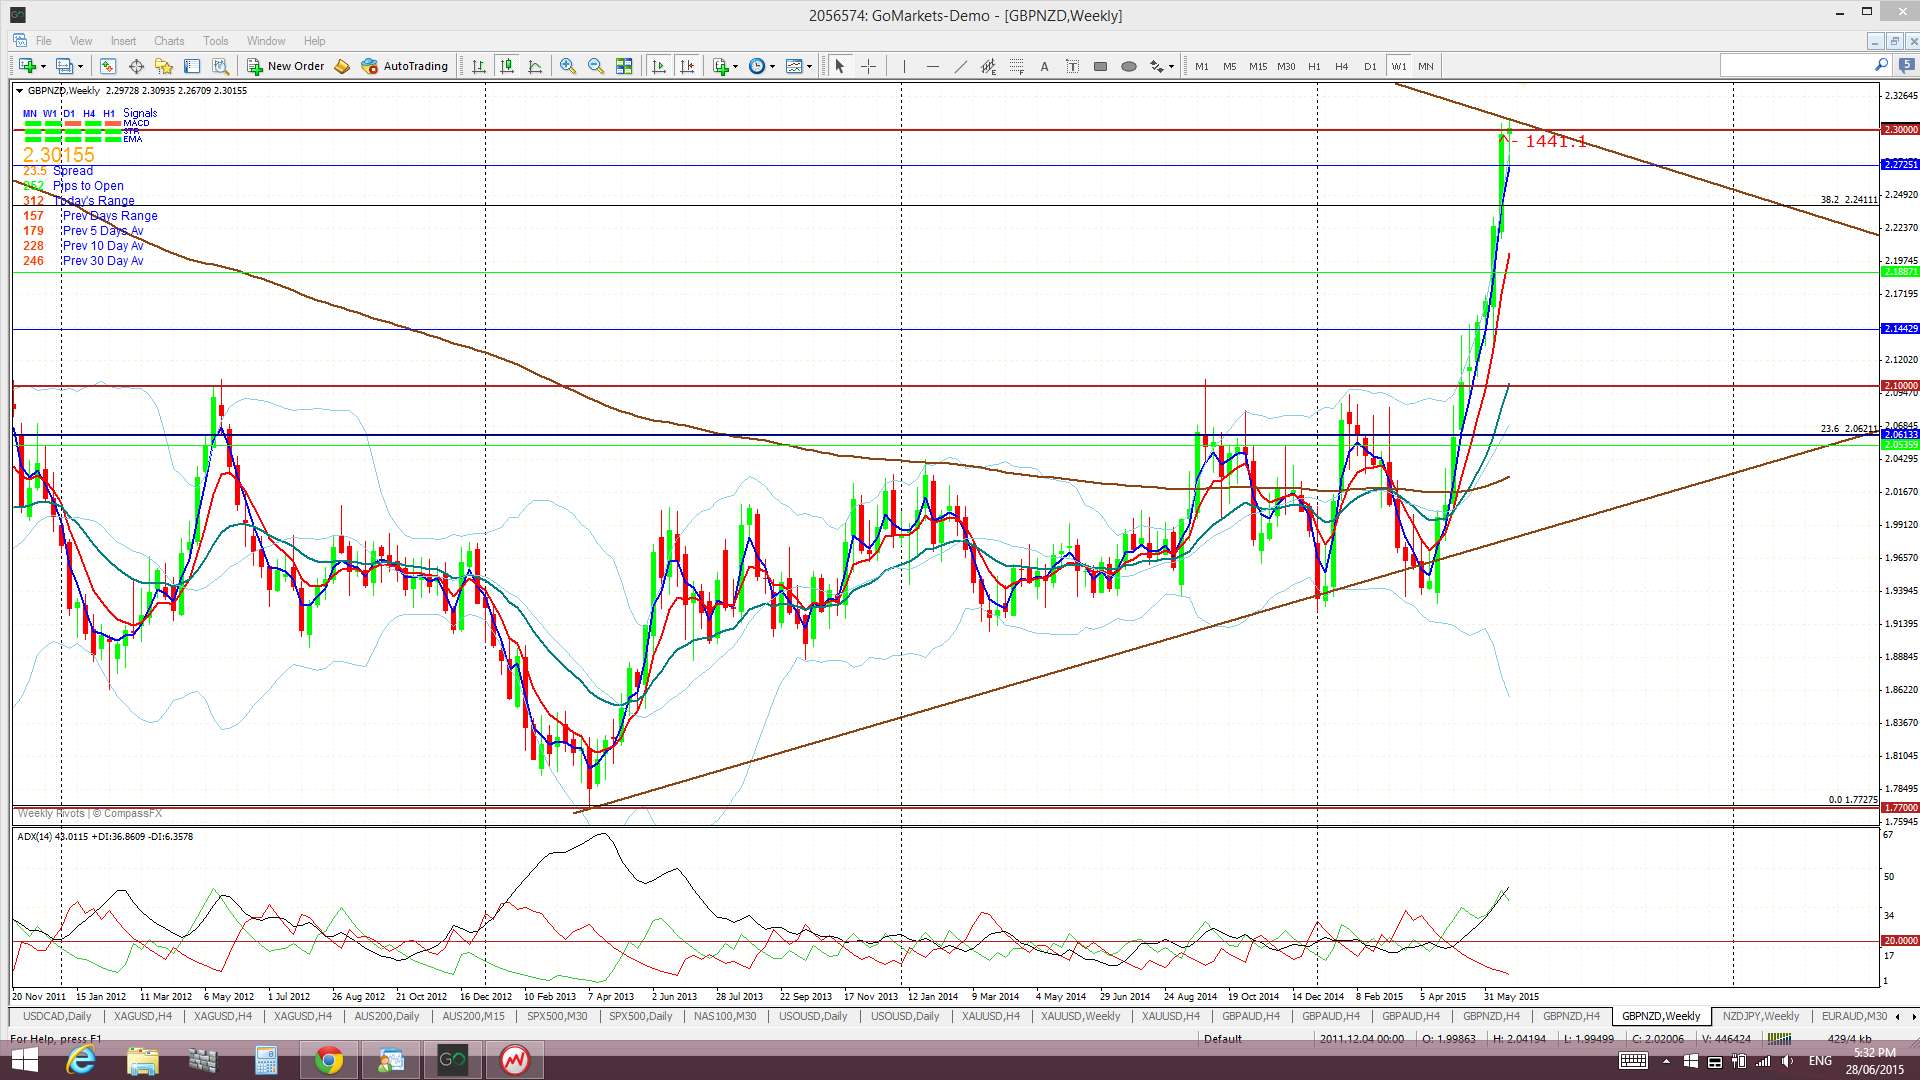
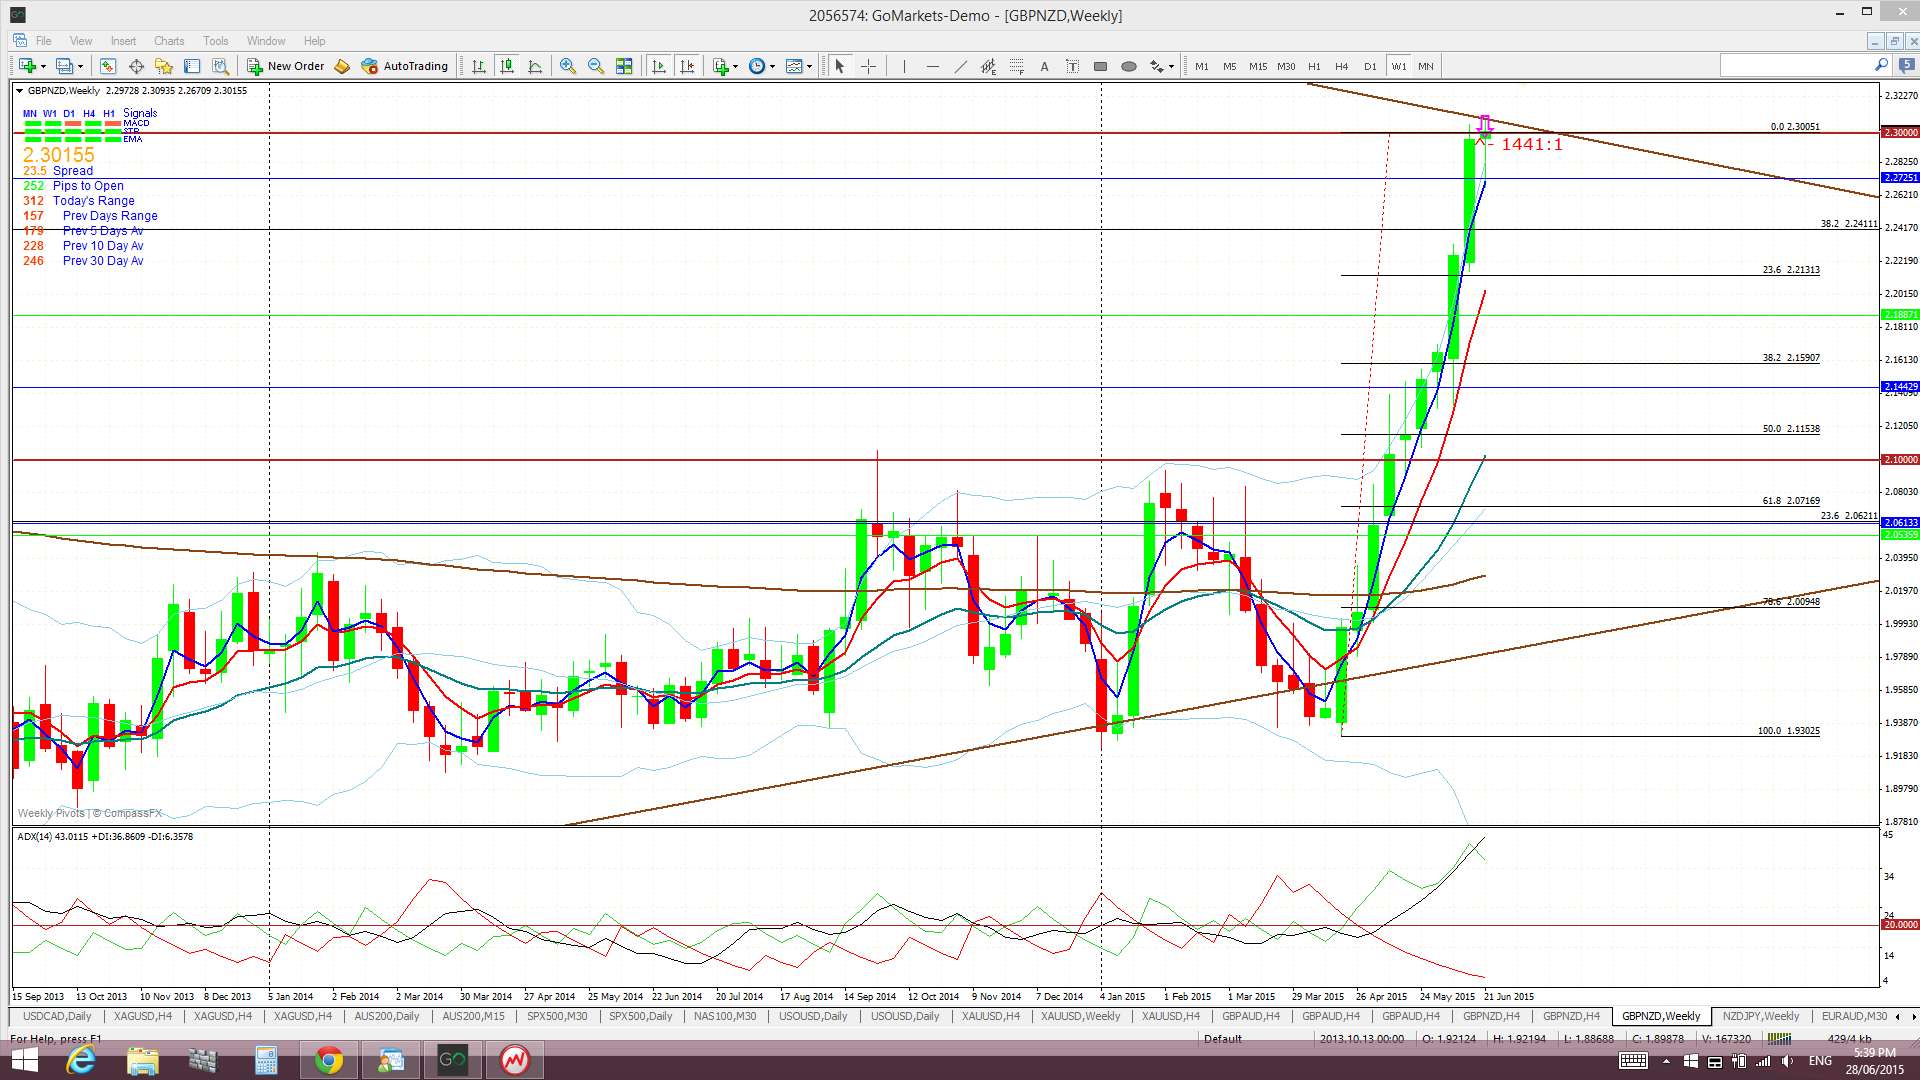
GBP/NZD: this has really rocketed since breaking above the 2.10 level and has now made a weekly close above the key 2.30 level. Add to this that it triggered a new TC signal late on Friday. However, price has yet to punch up through and make a monthly close above the monthly Cloud and the GBP/NZD could just as easily retreat from here if it fails to close above the key 2.30 level on Tuesday 30th. I’m waiting a bit with this one; the weekly chart shows eleven consecutive bullish candles and a pullback, to test the 2.10 level, would not at all surprise me. The 2.10 level falls between the 50% and 61.8% fib of the recent swing high move.
G/N monthly Cloud:
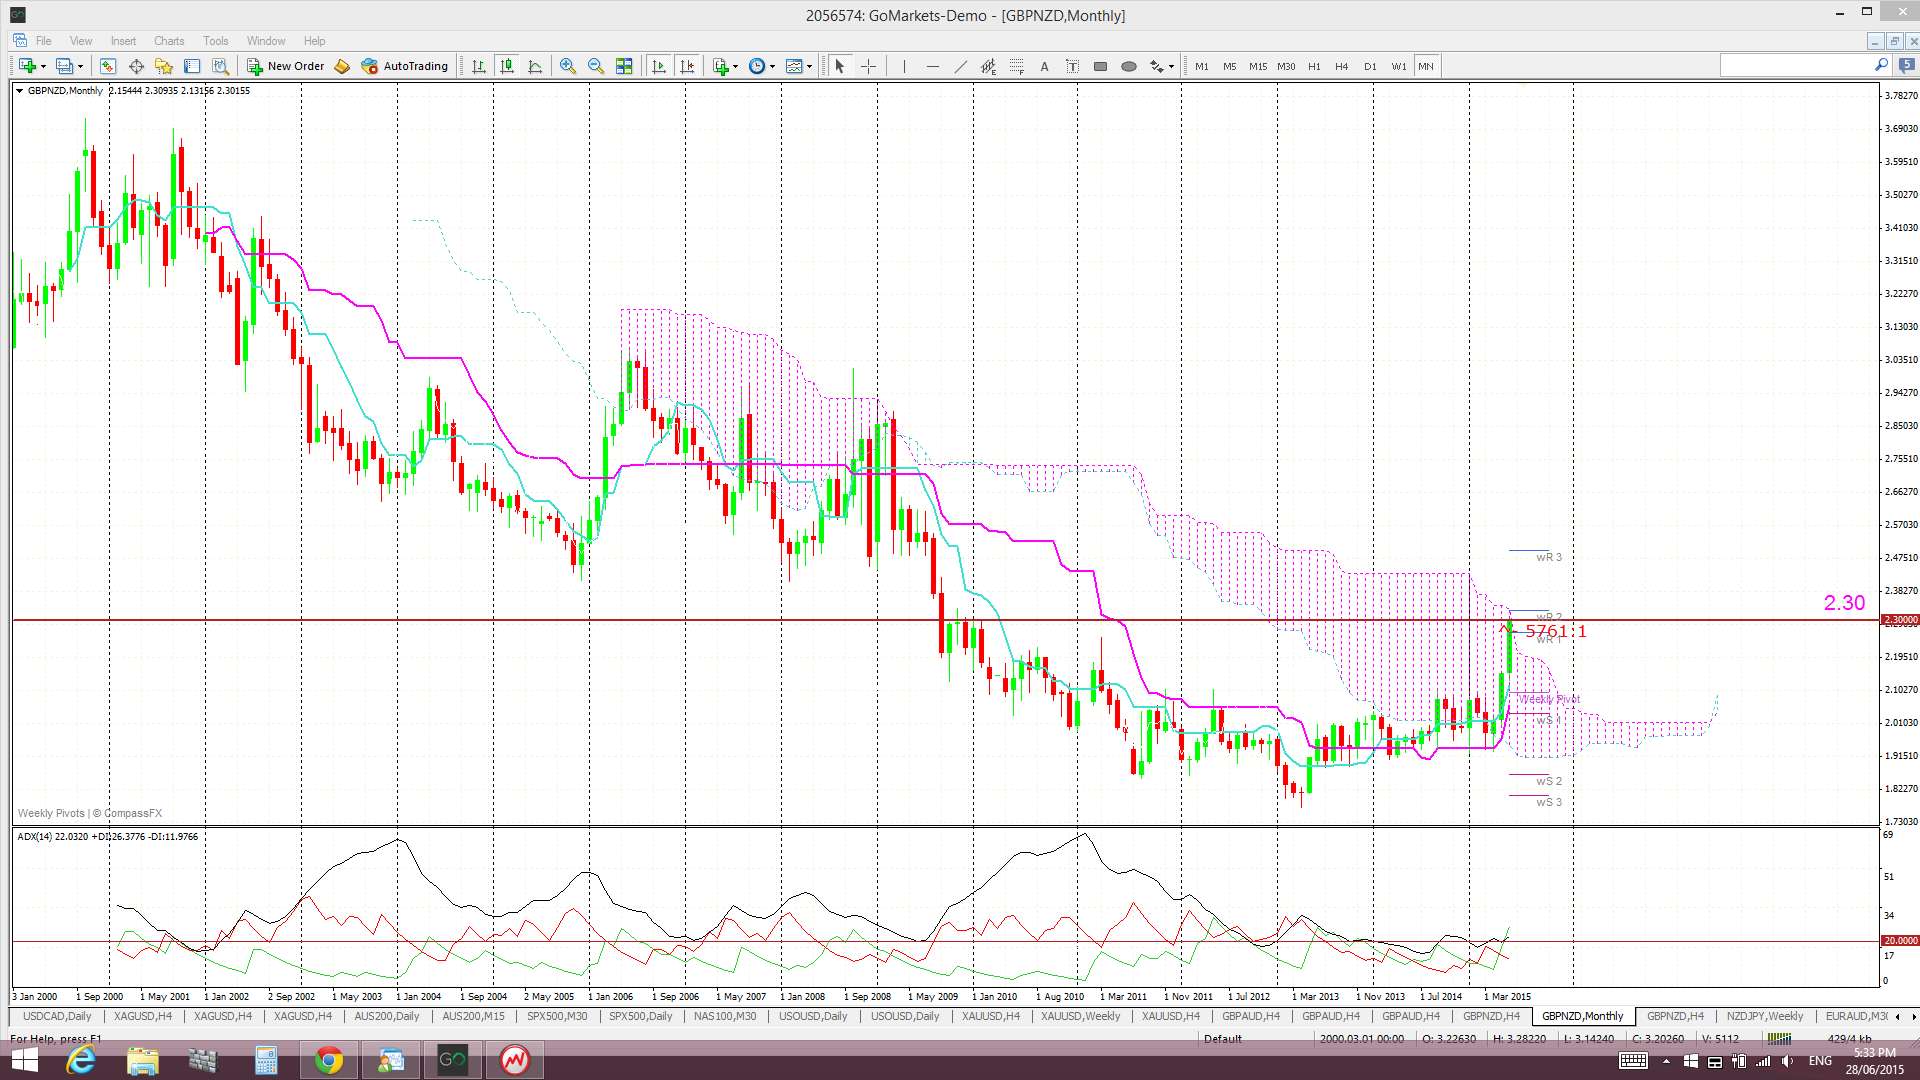
G/N monthly:
G/N weekly:
G/N weekly + fibs:
G/N daily:
G/N 4hr:
The post Fundamentals trumping Technicals for now. appeared first on www.forextell.com.