Last week: Much of the last two weeks, basically since the US Presidential Election, have been defined by US$ strength and this has shaped more of a risk-off style of behaviour across currency markets. US stocks have been more jubilant though and the ‘bellwether’ Russell 2000 closed at an all-time high. This divergence may be a signal in itself but I do think traders would be wise to wait and see if the US$ rally has the legs to keep going past the 100 breakout level.
This week:
US$: The US$ has made its first weekly close above the key 100 S/R levels in 12 months which is rather bullish, however, a second weekly close above this key S/R needs to be seen to underpin any breakout move. The path of many FX pairs, E/U, A/U, Cable, NZD/USD, depend heavily on which way the US$ heads from this crucial juncture at 100. A review of the FX Indices can be found through the following link.
Data: it is a relatively light week for data this week and Thursday is the Thanksgiving holiday in the USA so trading volumes might be lighter towards the end of the week.
Consolidation patterns: a few trading instruments continue to trade within longer-term consolidation patterns such as triangles or wedge patterns. These include: EUR/USD, AUD/JPY, AUD/USD, EUR/JPY, USD/CAD, AUD/NZD and Gold.
NZD/USD: Much depends on whether the US$ keeps steaming ahead but, if so, this could be bad news especially for the Kiwi. The NZD/USD has just broken down from a weekly wedge pattern and any continuation could signal the start of a significant Bear Flag move.
GBP: I’ve given GBP pairs a wide berth of late but it might be time to start considering these pairs again. The GBP/USD and GBP/JPY have made it back into the analysis this week with just a brief look at the GBP/NZD monthly chart as well.
Transports: Fedex and the transport ETF, IYT, have made bullish breakouts. This is generally regarded as a healthy signal for the economy.
Stocks and broader market sentiment:
The S&P500, NASDAQ, FTSE, TSX and Russell 2000 all printed bullish candles for the week with the Russell 2000 closing at an all-time high. I wrote an article yesterday with my thoughts on the S&P500 and this can be found through the following link.
I continue to watch out for further clues as to any new momentum move, long or short though! In particular I’m looking out for:
S&P500 daily chart: The index is above the recent 2,135 breakout level and the recent Bull Flag pattern still looks valid.

S&P500 weekly: The index closed with a bullish candle.

S&P500 monthly: The monthly candle is bullish and almost ‘Engulfing’ but there is over a week to go until this closes. It is still worth noting that the recent bearish divergence has faded.

S&P500 yearly: I do think that 1,600 is the new bottom of the trading range but when and if this might be tested again is something to keep in mind:

Russell 2000 Index: this small caps index is considered a US market ‘bellwether’ and continues to hold above the Flag supporting a bullish breakout. It has just printed a new weekly all-time high above the psychological 1,300 level.

VIX Index: The ‘Fear’ index printed a bearish weekly candle and is back below the 14 threshold level.

Copper Weekly: Copper has printed a bearish coloured ‘Spinning Top’ candle following last week’s large bullish triangle breakout candle. I would expect a test of this breakout trend line before any potential continuation though anyway.

Junk Bonds: this printed a bullish weekly candle following the recent bearish triangle breakout.

Oil: Oil continues holding above the 2009 low of $33.50 and printed a bullish, almost ‘Engulfing’, weekly candle although it is still below the key $50 threshold. Watch for any continuation with the bullish-reversal Inverse H&S pattern though as the target for this move is up near $70.

USO weekly: this triangle pattern is still worth watching for any potential breakout; up or down.

FDX weekly: is this the start of another lengthy bullish run? Note the uptick with bullish momentum:

IYT weekly: US Transport ETF: for this too? Momentum is ticking upward and trading volume is up as well:

Trading Calendar ‘High Impact’ data Items to watch out for:
- Mon 21st: nil
- Tue 22nd: EUR ECB Draghi speaks. CAD Core Retail Sales.
- Wed 23rd: NZD PPI & Retail Sales. JPY Bank Holiday. USD Core Durable Goods and Weekly Unemployment Claims.
- Thurs 24th: USD Thanksgiving Holiday, Crude Oil Inventories & FOMC Meeting Minutes. EUR German Ifo Business Climate.
- Fri 25th: GBP Second Estimates GDP.
FOREX:
EUR/USD: The E/U finally broke down through 1.07 support last week and this makes me think we could see a test of the 1.045 Lows before any potential bounce. The weekly chart shows that the EUR/USD has been consolidating in a horizontal range bound by the 1.15 and 1.045 levels for the last 20 months. The 1.06 level proved to be support for much of Friday but the weekly candle closed just below this whole-number level, however, this will be the level to watch for any make or break activity in coming sessions. It is worth keeping in mind that any pause with the recent 12-day US$ rally could offer some relief to this pair though.
Price is trading below the 4hr and daily Cloud.
The weekly candle closed as a bearish candle.
There is and ECB Draghi speech on Monday, some second tier EUR PMI data on Wednesday and then German Ifo Business Climate data on Thursday. Watch for impact from USD data as well.
- I’m watching for any new TC signal on this pair and the 1.06 and 1.045 levels.


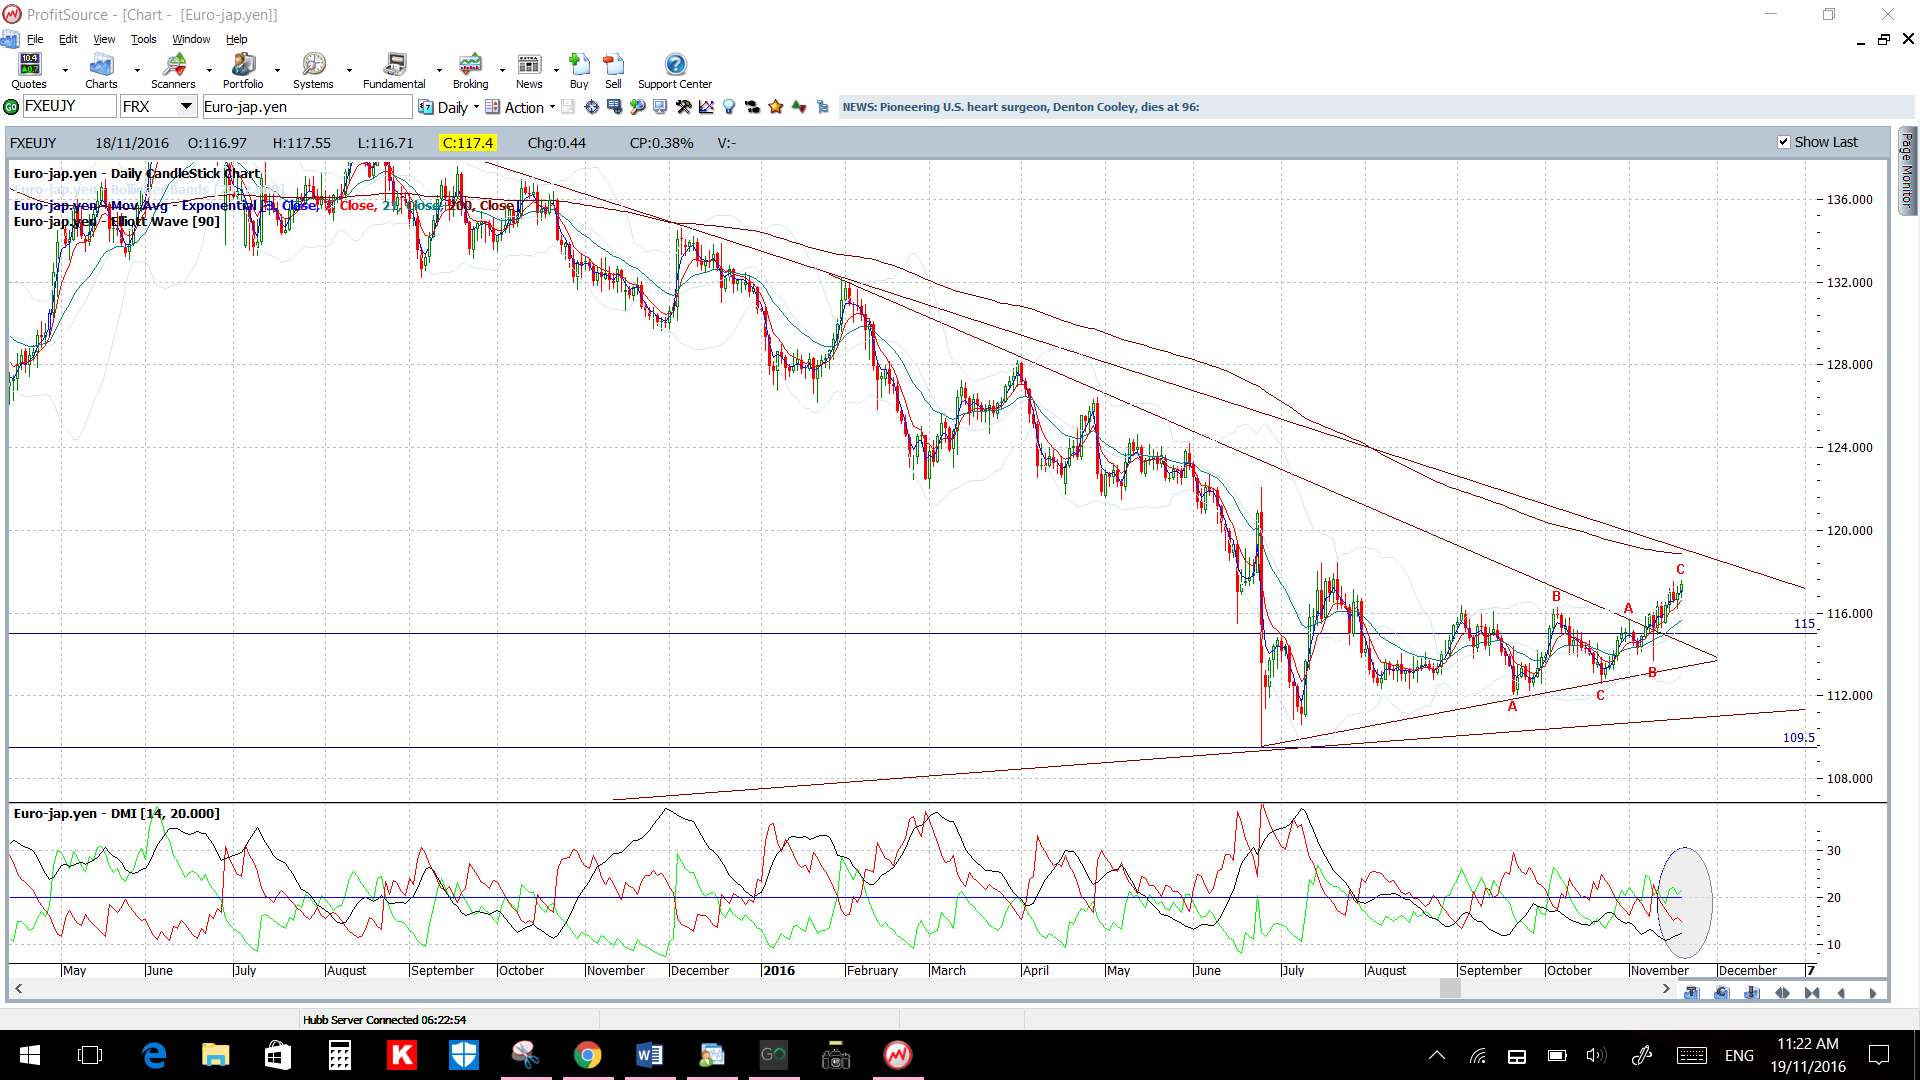
EUR/JPY: This pair continues consolidating under a 23-month bear trend line. The 115 level is lower down near the weekly chart’s 61.8% fib and looks to be support for now but this level could well be tested again before any potential bullish continuation. I do note, also, that 115 is near the 4hr chart’s 61.8% fib of the recent swing high move and so a pullback to test this level would not surprise.
Price is now trading above the Cloud on the 4hr and daily chart.
The weekly candle closed as a bullish candle.
There is and ECB Draghi speech on Monday, some second tier EUR PMI data on Wednesday and then German Ifo Business Climate data on Thursday. Watch for impact from USD data as well.
- I’m watching for any new TC signal on this pair, the 23-month bear trend line and the 115 level.


AUD/USD: I had mentioned last week that after the break of the recent support trend line to then watch for any break below the 0.75 level to possibly target the 0.72 level; the latter being the 61.8% fib of the daily chart’s recent swing high move. Price action closed the week near the 50% fib at the 0.735 area but the 0.72 remains in focus for any make or break activity in coming sessions.
Keep in mind that any pause with the recent 12-day US$ rally could offer some relief to this pair too.
Any break and hold below the 0.72 level though will bring the monthly chart’s support trend line into focus and this is down near 0.70.
Price is now trading below the Cloud on both the 4hr and daily charts.
The weekly candle closed as a large bearish candle.
There is no AUD data next week but watch out for USD data that includes Durable Goods, Oil Inventories, FOMC Meeting Minutes, Weekly Unemployment Claims and Services PMI data.
- I’m watching for any new TC signal on this pair and the 0.72 region.


AUD/JPY: This pair has now made another weekly-candle bullish hold above a 2-year bear trend line and I’m on the lookout for any continuation to test the previous S/R region of 89; a level that is between the weekly chart’s 50% and 61.8% fib levels. Traders need to keep an eye on how US stocks trend from here though as the AUD/JPY is fairly highly correlated here. Continuation with stocks would support the AUD/JPY but any pullback on stocks would probably trigger a similar move on this pair.
I am open to a pullback and, if this evolves, I ‘d look first for a test of the broken trend line and key 80 region near the 50% fib of the recent swing high move.
Price is trading above the Cloud on the 4hr and daily charts.
The weekly candle closed as a bullish candle with a long upper shadow.
There is no AUD data next week but watch out for USD data that includes Durable Goods, Oil Inventories, FOMC Meeting Minutes, Weekly Unemployment Claims and Services PMI data.
- I’m watching for any new TC signal on this pair and the 80 and 89 levels.


GBP/USD: I’ve given the Cable a wide berth over recent weeks given Brexit issues and the Flash Crash but I’m wondering if it might be time to reconsider this pair. The uncertainty surrounding the election of Trump and the impact this might have on looming elections through Europe means that the GBP might end up becoming a least-worst option.
The charts still look messy for now but the current monthly candle forming up on the Cable is a bullish-reversal ‘Inverted Hammer’ suggesting that some recovery, after 6 bearish monthly candles, might be trying to evolve. Anyway, I’ve included the charts as I’m seeing them for now and will watch to see how the November candle eventually closes.
Remember: The Cable has been trading under a bearish trend line for the last 8 years, since peaking at 2.1161 in Nov of 2007 (see monthly chart below). Price plunged during the following 2008 year with the Global Financial Crisis and bottomed near the whole-number region of 1.35. Price action chopped higher after that though and made another peak at 1.7191 in July 2014 but has traded lower since then. In fact, the recent Brexit vote result triggered further lows for the Cable down to the 1.28 whole-number region. This price action has resulted in another bear trend line, of 2 year duration, forming up since that 2014 peak.
Price is below the 4hr, daily, weekly and monthly Cloud.
The weekly candle closed as a bearish candle.
The only GBP ‘high impact’ data next week is Second Estimates GDP on Friday but watch out for impact from USD data here too that includes Durable Goods, Oil Inventories, FOMC Meeting Minutes, Weekly Unemployment Claims and Services PMI data.
- I’m just keeping an eye on this pair for now but note the daily/4hr chart triangle trend lines.


GBP/JPY: This particular GBP pair has piqued my interest due to the looming 12-month bear trend line that is just above current price. I note that this pair has been on a bit of a run of late so could be due a pause or even pullback. Any pullback would have me looking to the 4hr chart’s 61.8% fib down near the weekly 200 EMA and 130.50 region as this was also a recent S/R zone.
Price is trading above the Cloud on the 4hr and daily charts.
The weekly candle closed as a bearish candle.
The only GBP ‘high impact’ data next week is Second Estimates GDP on Friday but watch out for impact from USD data here too that includes Durable Goods, Oil Inventories, FOMC Meeting Minutes, Weekly Unemployment Claims and Services PMI data.
- I’m watching for any new TC signal on this pair and the bear trend line.


Kiwi: NZD/USD: I mentioned last week to watch for any break of the 14-month support trend line to possibly trigger a move down to the 61.8% fib near 0.67. Price broke the trend line last week but paused at the 0.70 level to see out the week. This 0.70 level will be the one to watch in coming sessions for any make or break activity. Keep in mind that any pause with the recent 12-day US$ rally could offer some relief to this pair too.
The break of this weekly support trend line is bringing the monthly chart’s Bear Flag back into focus though. This could trigger a bearish move of around 2,800 pips which, if it evolved, would drag price down to Lows not seen since 2001!
The NZD/USD is trading below the Cloud on the 4hr and daily chart.
The weekly candle closed as a bearish candle.
There is NZD Retail Sales and PPI data next week but also watch out for USD data that includes Durable Goods, Oil Inventories, FOMC Meeting Minutes, Weekly Unemployment Claims and Services PMI data.
- I’m watching for any new TC signal on this pair and the 0.70 level.


The Yen: USD/JPY: The USD/JPY has continued its upward bounce after testing the key 101.50 level and this move is supporting the monthly chart’s bullish-reversal ‘Inverse H&S’ pattern.
I noted during the week that this pair could be due a pause and that the 111 region might offer some resistance being previous S/R and near the 50% fib of the daily chart’s swing low move and note that the USD/JPY closed the week just below this psychological 111 level to see out the week!
NB: I have re-fibbed the daily chart now though to include the whole of the bearish move from the High set in June 2015 to the Low set in June 2016.
The US$ has been on a lengthy 12 day rally and any exhaustion pause could offer some pullback opportunity for the USD/JPY. Any pullback might target the 104 area as this is previous S/R and near the 4hr chart’s 61.8% fib of the recent swing high move.
Price is trading above the 4hr and daily Cloud but is butting up against the weekly Cloud, which is also resistance near the key 111 area, and this may help to give this pair some pause.
The weekly candle closed as a large bullish candle.
There is no JPY data next week but watch out for USD data that includes Durable Goods, Oil Inventories, FOMC Meeting Minutes, Weekly Unemployment Claims and Services PMI data.
- I’m watching for any new TC signal on this pair and the 111 and 104 levels.


USD/CAD: The USD/CAD printed an ‘Inside’ candle, albeit bullish coloured, but this still reflects Indecision and pretty much sums up how I am feeling about this pair at the moment. I can see that a bullish US$ could help take this pair up to at least 1.40, as this near the weekly chart’s 61.8% fib region, but the lack of weekly momentum is concerning. I’m beginning to think it might be safer to watch the monthly chart’s triangle pattern and to see if any momentum-based breakout is triggered from there.
Price is trading above the Cloud on the 4hr and daily chart.
The weekly candle closed as a small bullish ‘Inside’ candle.
There is CAD Retail Sales data next week but also watch out for USD data that includes Durable Goods, Oil Inventories, FOMC Meeting Minutes, Weekly Unemployment Claims and Services PMI data.
NB: USD/CAD traders need to keep an eye on Oil though as it has now broken the key $50 level and any hold above this level would help to support the CAD$ and keep pressure on the USD/CAD. Just FYI: I’m stalking a bullish-reversal ‘Inverse H&S on Oil with the ‘neck-line’ at $50 and the target at $70.
- I’m watching for any new TC signal.


EUR/AUD: The EUR/AUD remains below the monthly chart’s broken support trend line but above the 1.44 S/R level. Price action here has been choppy for the last two weeks but this is not surprising given this period has been one dominated by the US$ rally. Any pause with the US$ though might enable these cross pairs to develop some trending momentum though so this is worth watching for.
The daily chart shows that 1.44 has been recent support below this broken trend line and price had held below this key level again last week until Friday. I note on the weekly and monthly charts that the next major horizontal support layer is down at 1.40 and this is near the 50% of the recent swing high move. This might be a decent target if bearish momentum gets going at all as it is 400 pips away and so worth stalking!
Price is trading below the Cloud on the 4hr and daily charts.
The weekly candle closed as a bearish coloured Doji candle.
There is no AUD next week but watch for the ECB Draghi speech on Monday, some second tier EUR PMI data on Wednesday and then German Ifo Business Climate data on Thursday. Watch also for any impact from USD data as well.
- I’m watching for any new TC signal here and the 1.44 level.


EUR/GBP weekly: keep an eye out for any continuation down to the 0.80 region. The GBP has Brexit issues but European Union itself could have even bigger problems depending on how the looming elections unfold and this could help bring about a test of this 61.7% fib level on this pair.

AUD/NZD monthly: keep an eye on these trend lines for any breakout.

GBP/NZD monthly: watch where this November monthly candles closes with respect to 1.77.

USD/MXN weekly: still worth keeping an eye on this support trend line:

Silver: Silver remains below a recently broken 12-month support trend line but finished the week holding above the daily chart’s 61.8% fib of the last swing high move; just above $16.50.
Silver is trading below the 4hr and daily Cloud yet it remains above the weekly Cloud.
The weekly candle closed as a bearish candle.
- I’m watching for any new TC signal and the $16.50 level.


Gold: Gold also remains below a recently broken 12-month support trend line and spent much of last week trying to hold above the daily chart’s 50% fib of the last swing high move; just above $1,200.
Any break and hold below $1,200 would bring the 61.8% fib near $1,170 into greater focus.
Gold is trading below the Cloud on the 4hr and daily charts.
The weekly candle closed as a bearish candle.
- I’m watching for any new TC signal here and the $1,200 level.


The post FX: a different risk profile to US stocks. appeared first on Trade Charting.
The post FX: a different risk profile to US stocks. appeared first on www.forextell.com.