Last week: The TradeCharting system of waiting for momentum-based breakouts from congestion (technical) patterns continues to be most profitable, especially in the current market conditions. There are more chart patterns to monitor this week but caution is needed as the US$ rests at major support and any new make or break from this major level will impact the current mean reversion activity seen across many FX pairs.
Trend line breakout tally: these trades gave the following maximum pip movement and were profiled mid-week here, here and here:
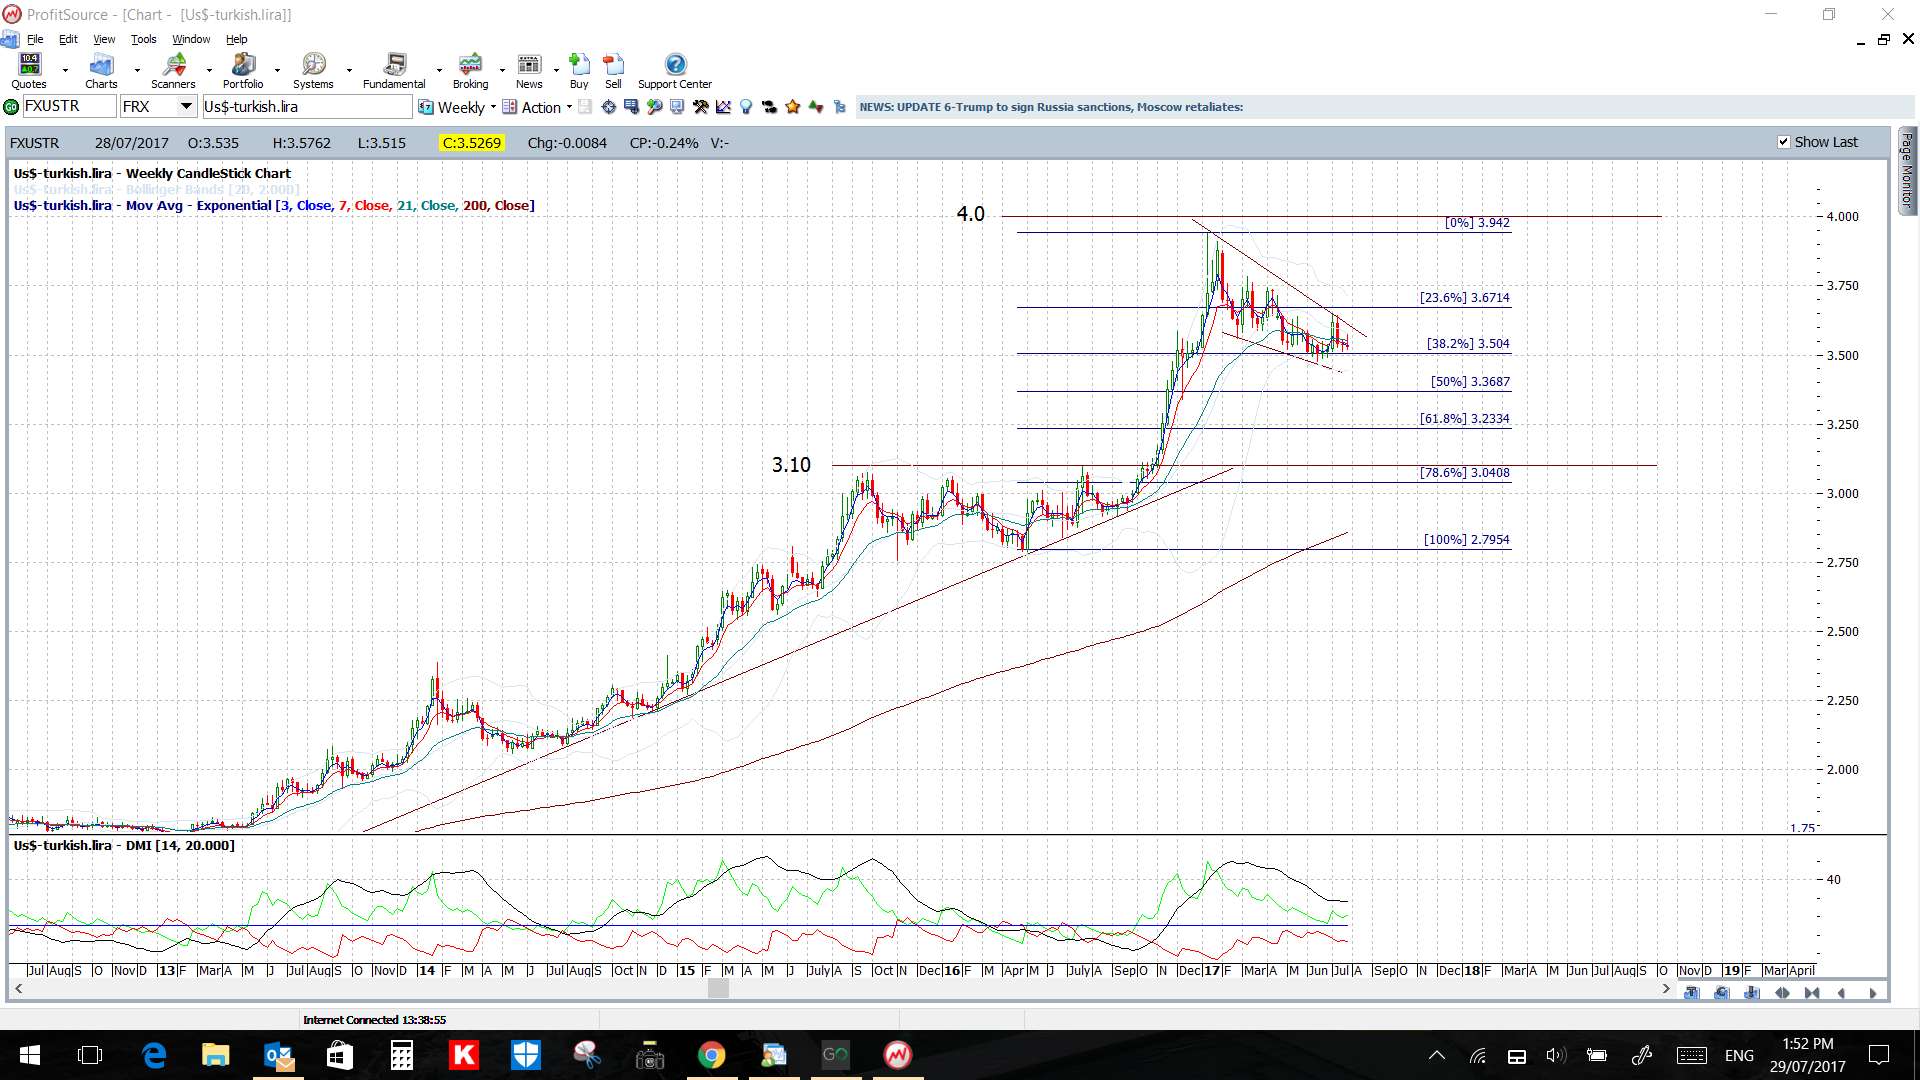
- USD/TRY: 400 pips.
- EUR/USD: 55 pips, 120 pips and 60 pips on Friday.
- USD/JPY: 55 pips.
- GBP/JPY: 150 pips.
- Gold: 50 pips and 100 pips on Friday.
- NZD/USD: 100 pips.
- AUD/USD: 100 pips.
- GBP/USD: 80 pips.
- USD/CNH: 200 pips noted on Twitter.
This week:
- US$: the US$ index is clinging to support and traders need to watch to say which way this trades from here. A review of the FX Indices can be found through this link.
- End of Month: Tuesday marks the start of August so watch for new monthly pivots.
- Data: there is a lot of data next week so watch your calendar but key events include the RBA & BoE interest rate updates and US NFP.
- Triangle breakouts: keep in mind that there are quite a few weekly chart triangle breakouts still in play with each being worth around:
- EUR/JPY: 2,000 pips with almost 1,000 pips yielded already.
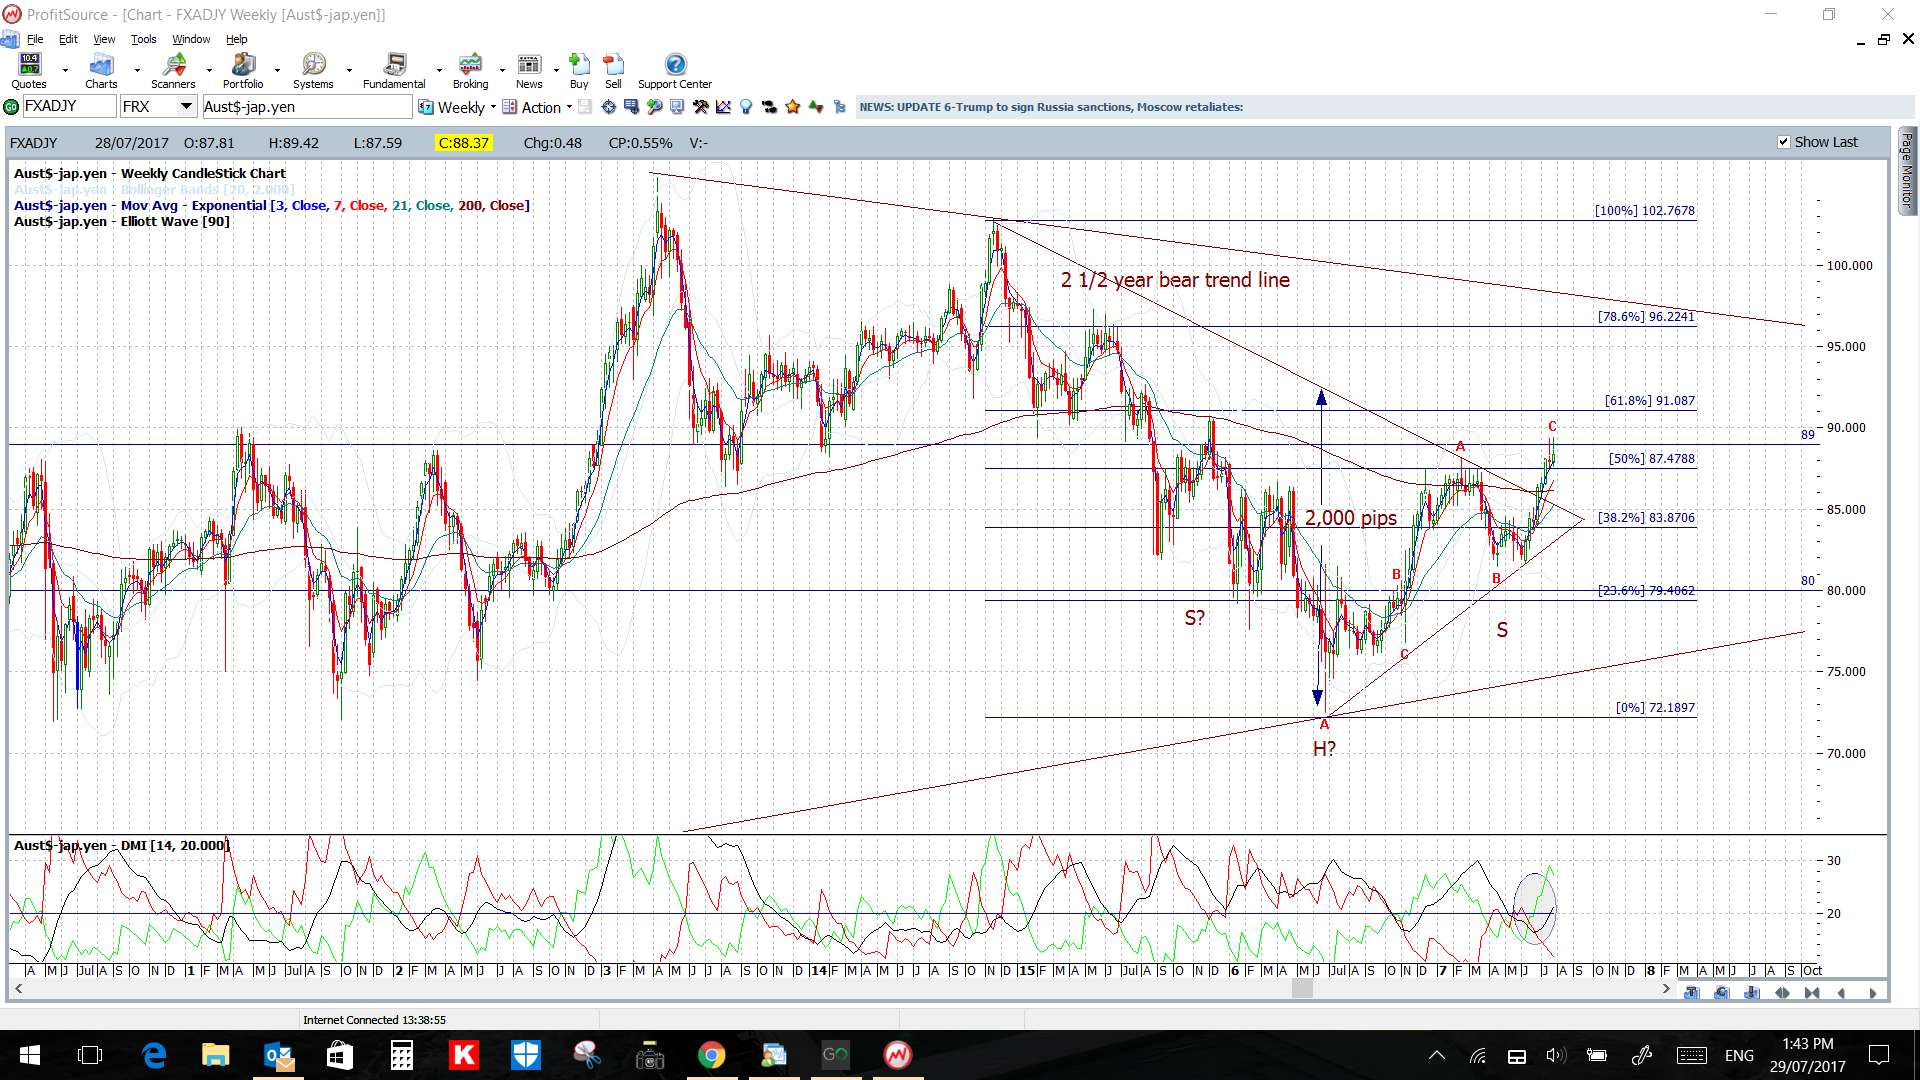
- AUD/JPY: 2,000 pips.
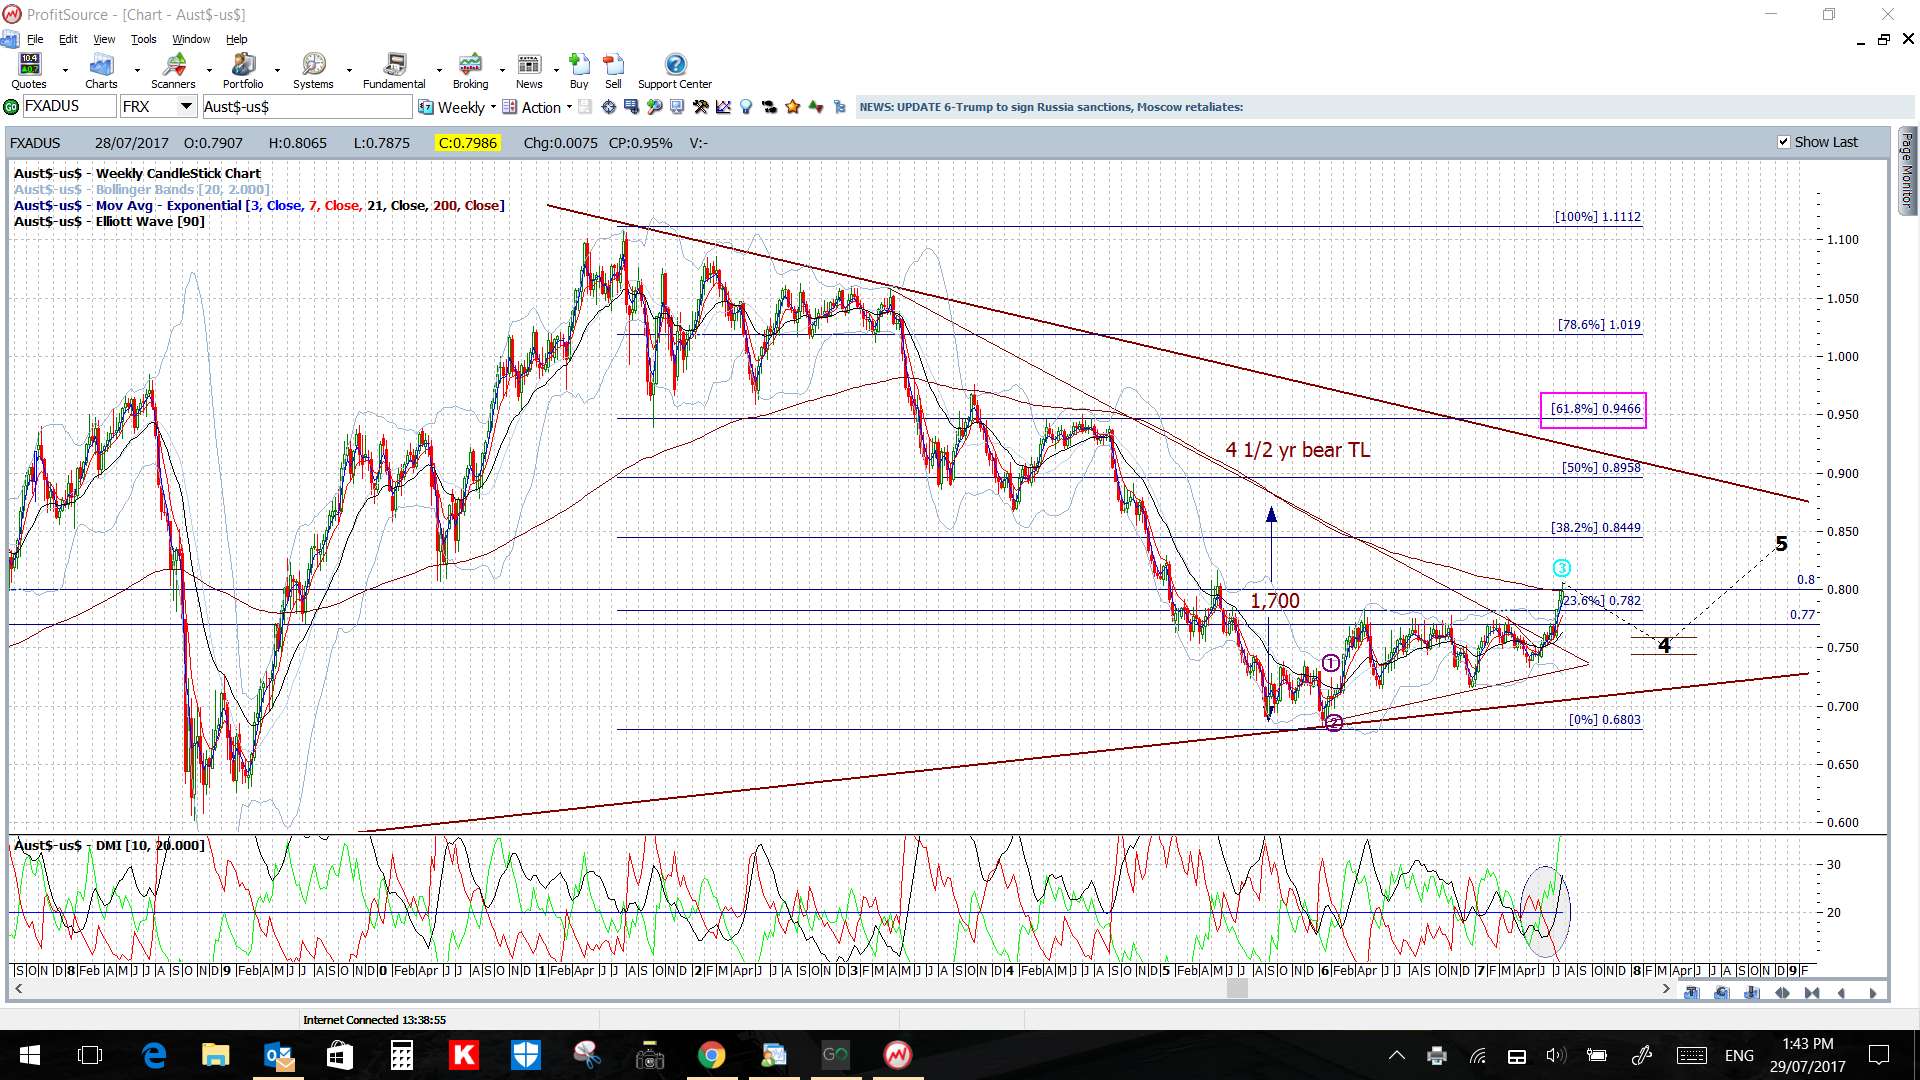
- AUD/USD: 1,700 pips.
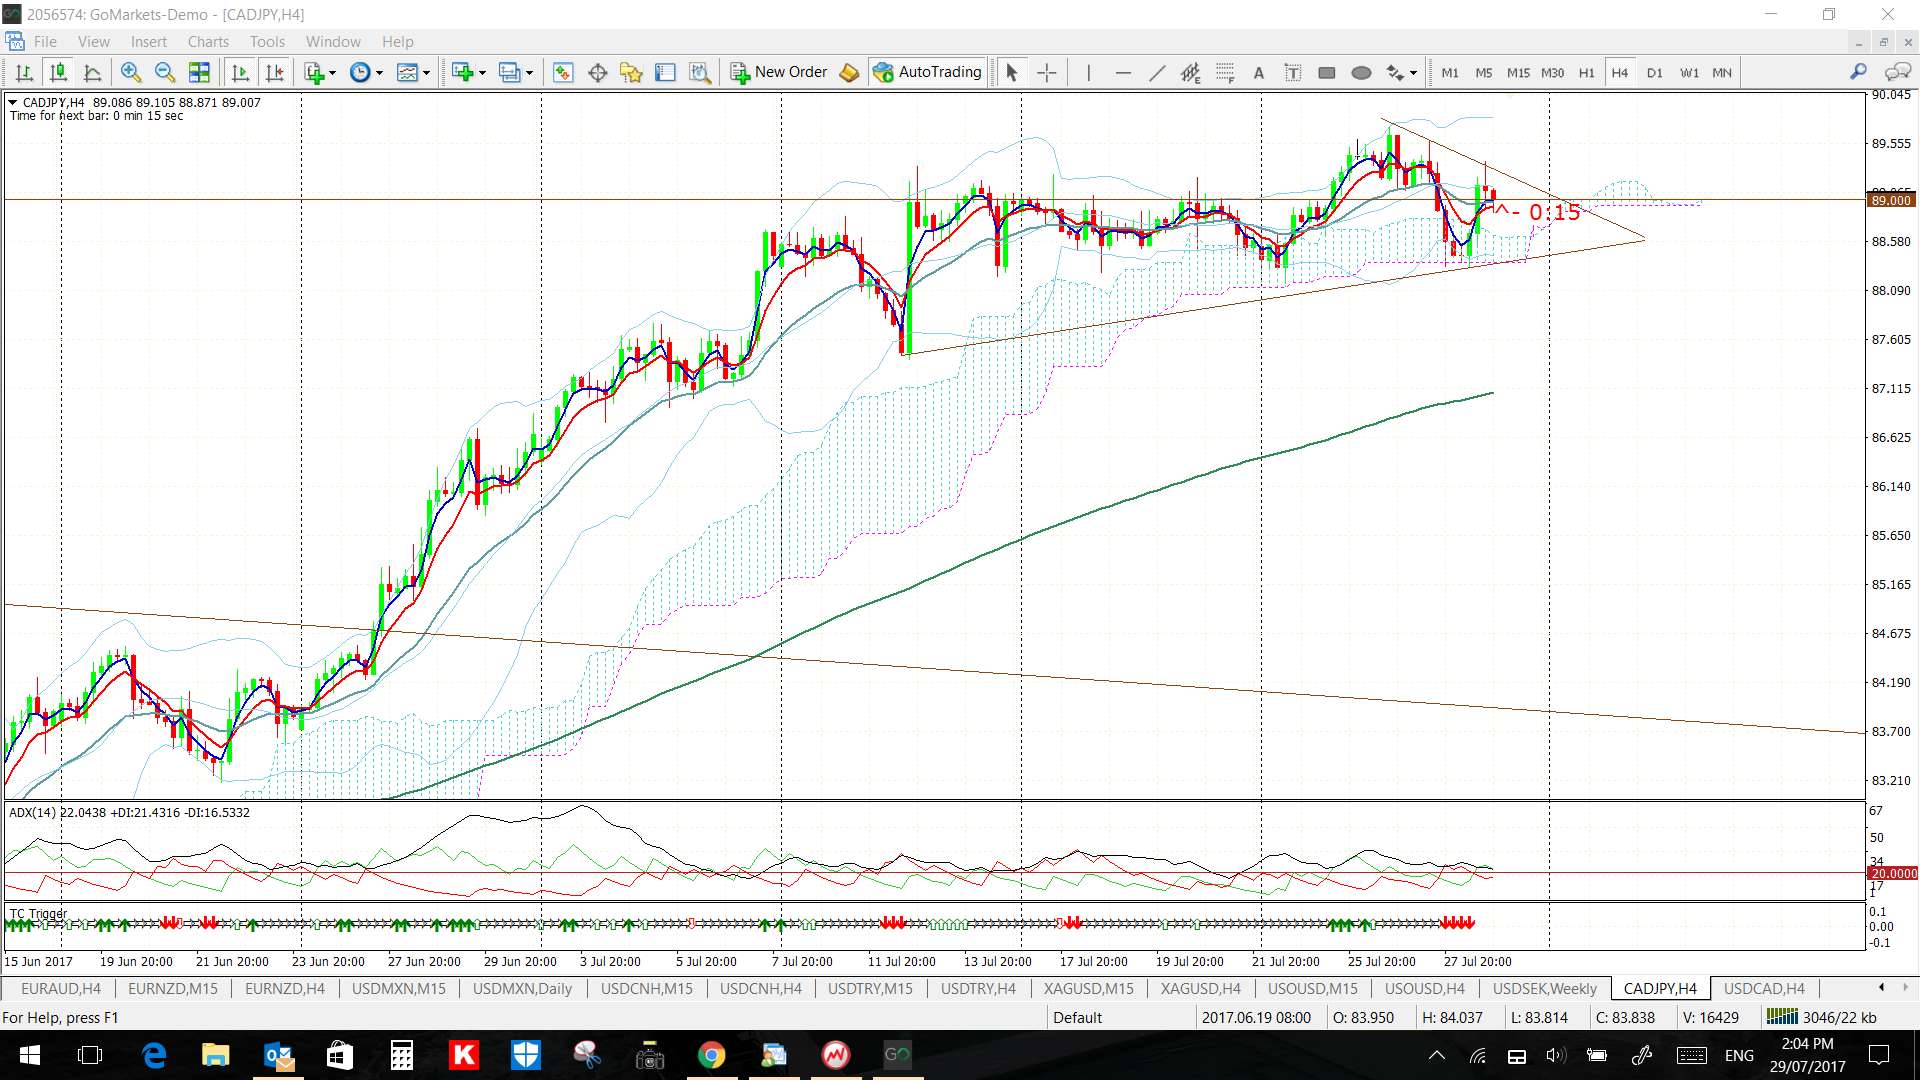
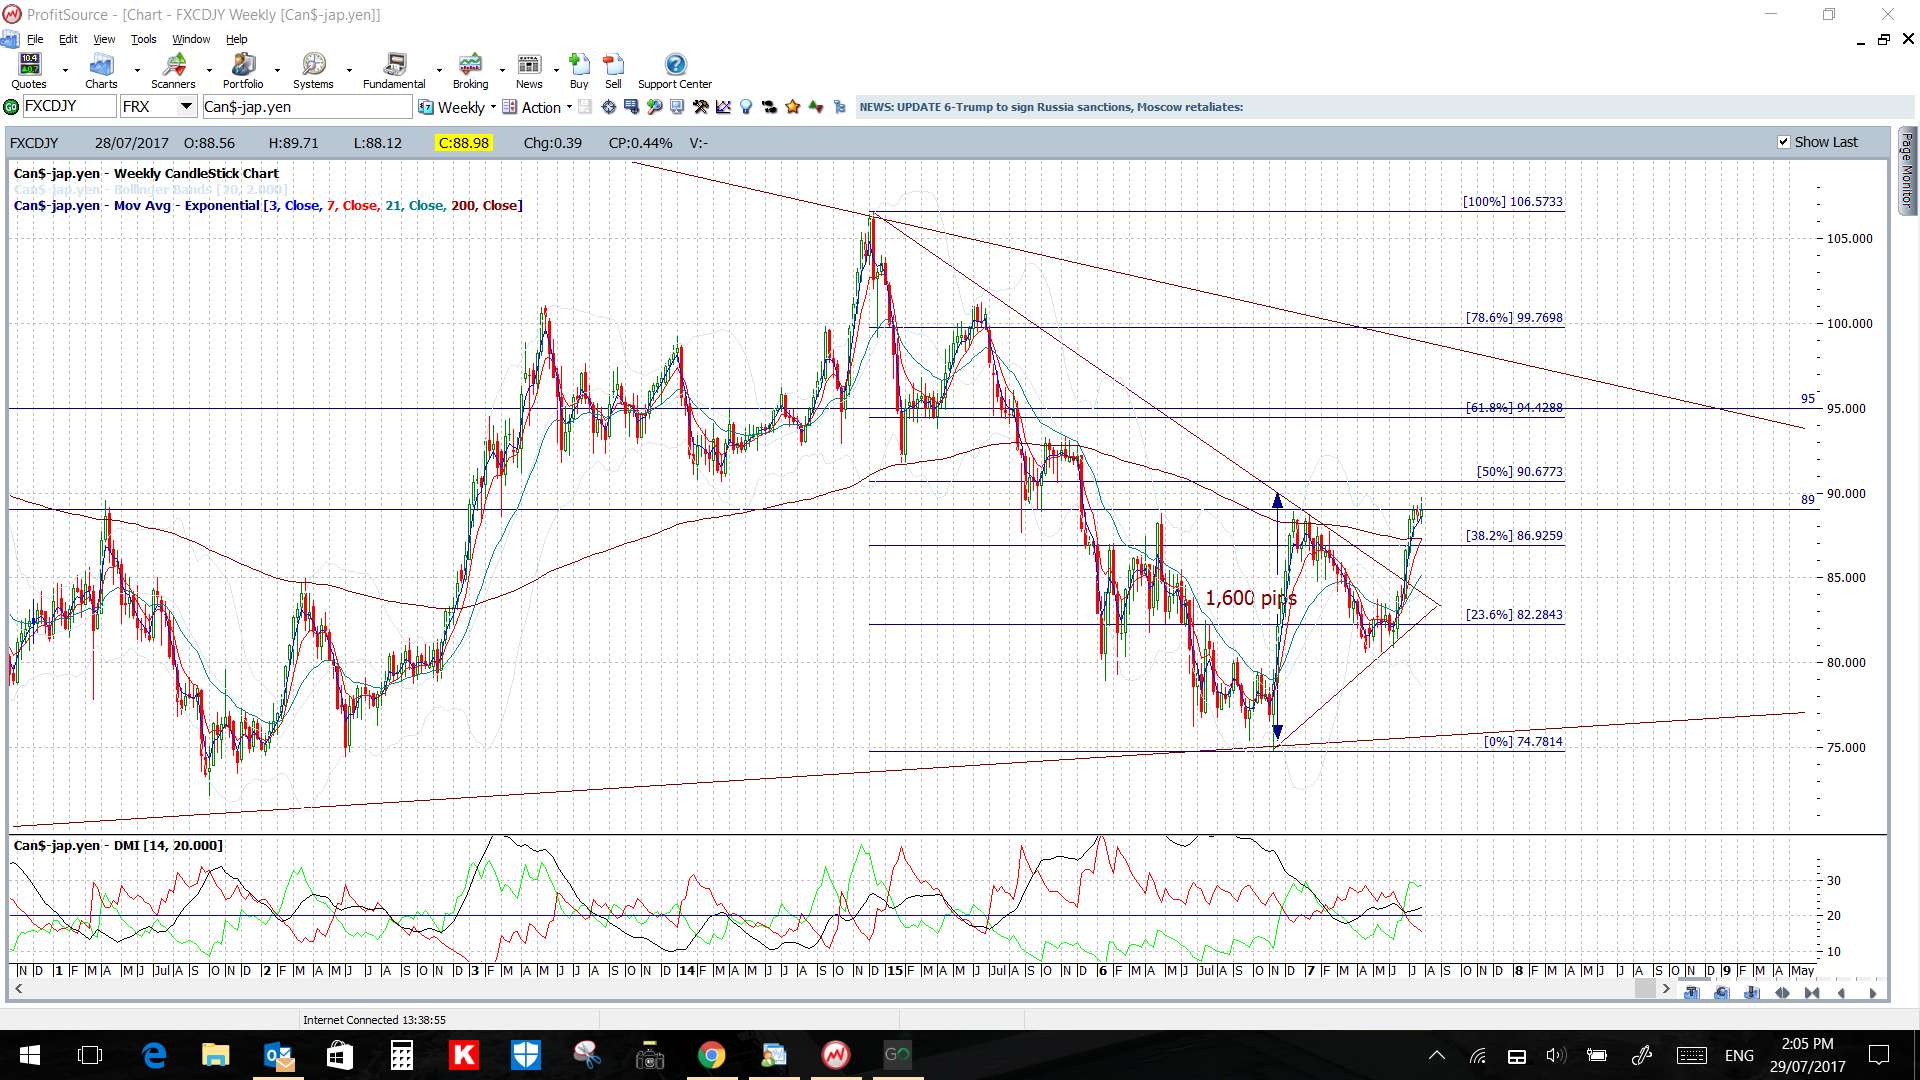
- CAD/JPY: 1,600 pips.
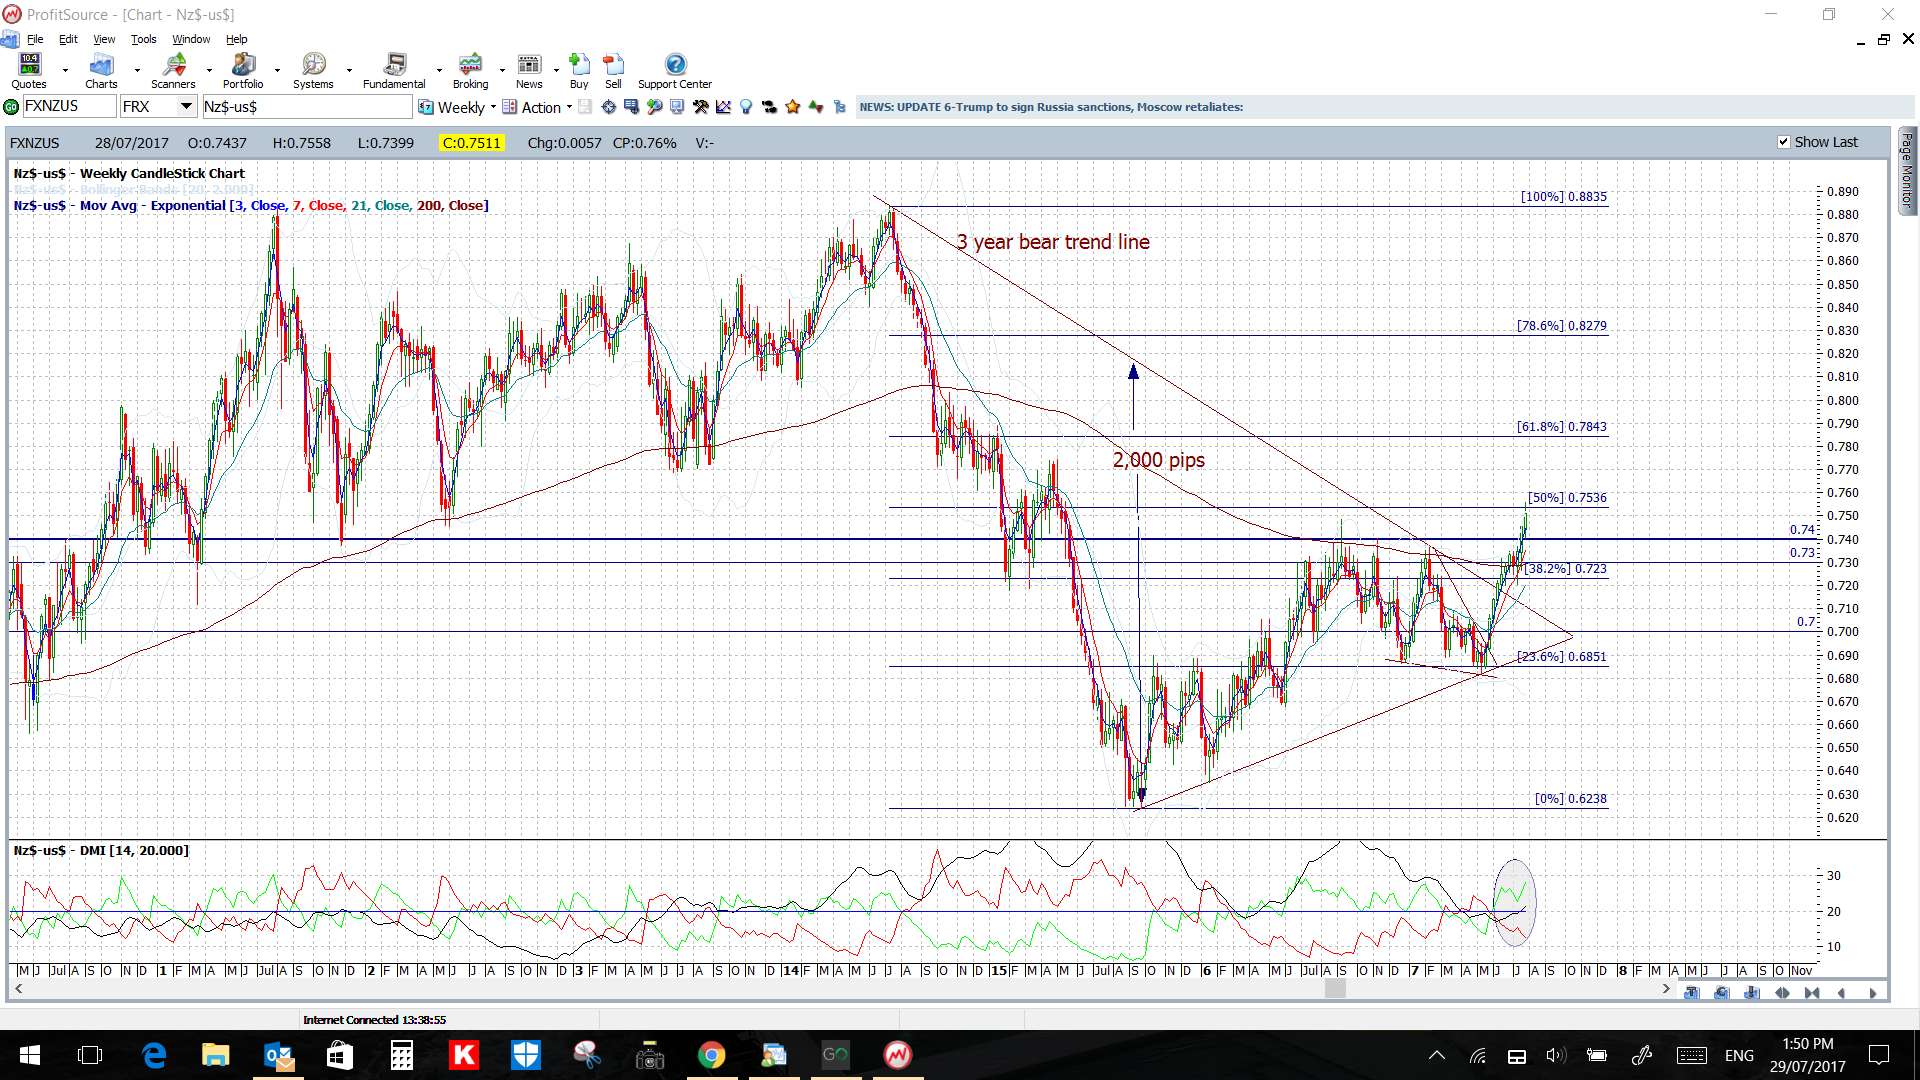
- NZD/USD: 2,000 pips.
- NB: this is just a brief update as I am away for the weekend.
Calendar:
- Mon 31st: CNY Manufacturing and Non Manufacturing PMI. NZD ANZ Business Confidence. GBP Inflation Report Hearings.
- Tue 1st: AUD RBA Interest Rate update. GBP Manufacturing PMI. USD ISM Manufacturing PMI.
- Wed 2nd: NZD Employment data. GBP Construction PMI. USD ADP NFP & Crude Oil Inventories.
- Thurs 3rd: AUD Trade Balance. GBP Services PMI, BoE Inflation Report, Rate update & BoE Gov Carney speech. USD Weekly Unemployment Claims & ISM Non-Manufacturing PMI.
- Fri 4th: AUD RBA Monetary Policy Statement and Retail Sales. CAD Employment data. USD NFP
Forex: For most pairs I have just shown the 4hr and weekly charts so keep an eye on these for any new trend line breakout activity.
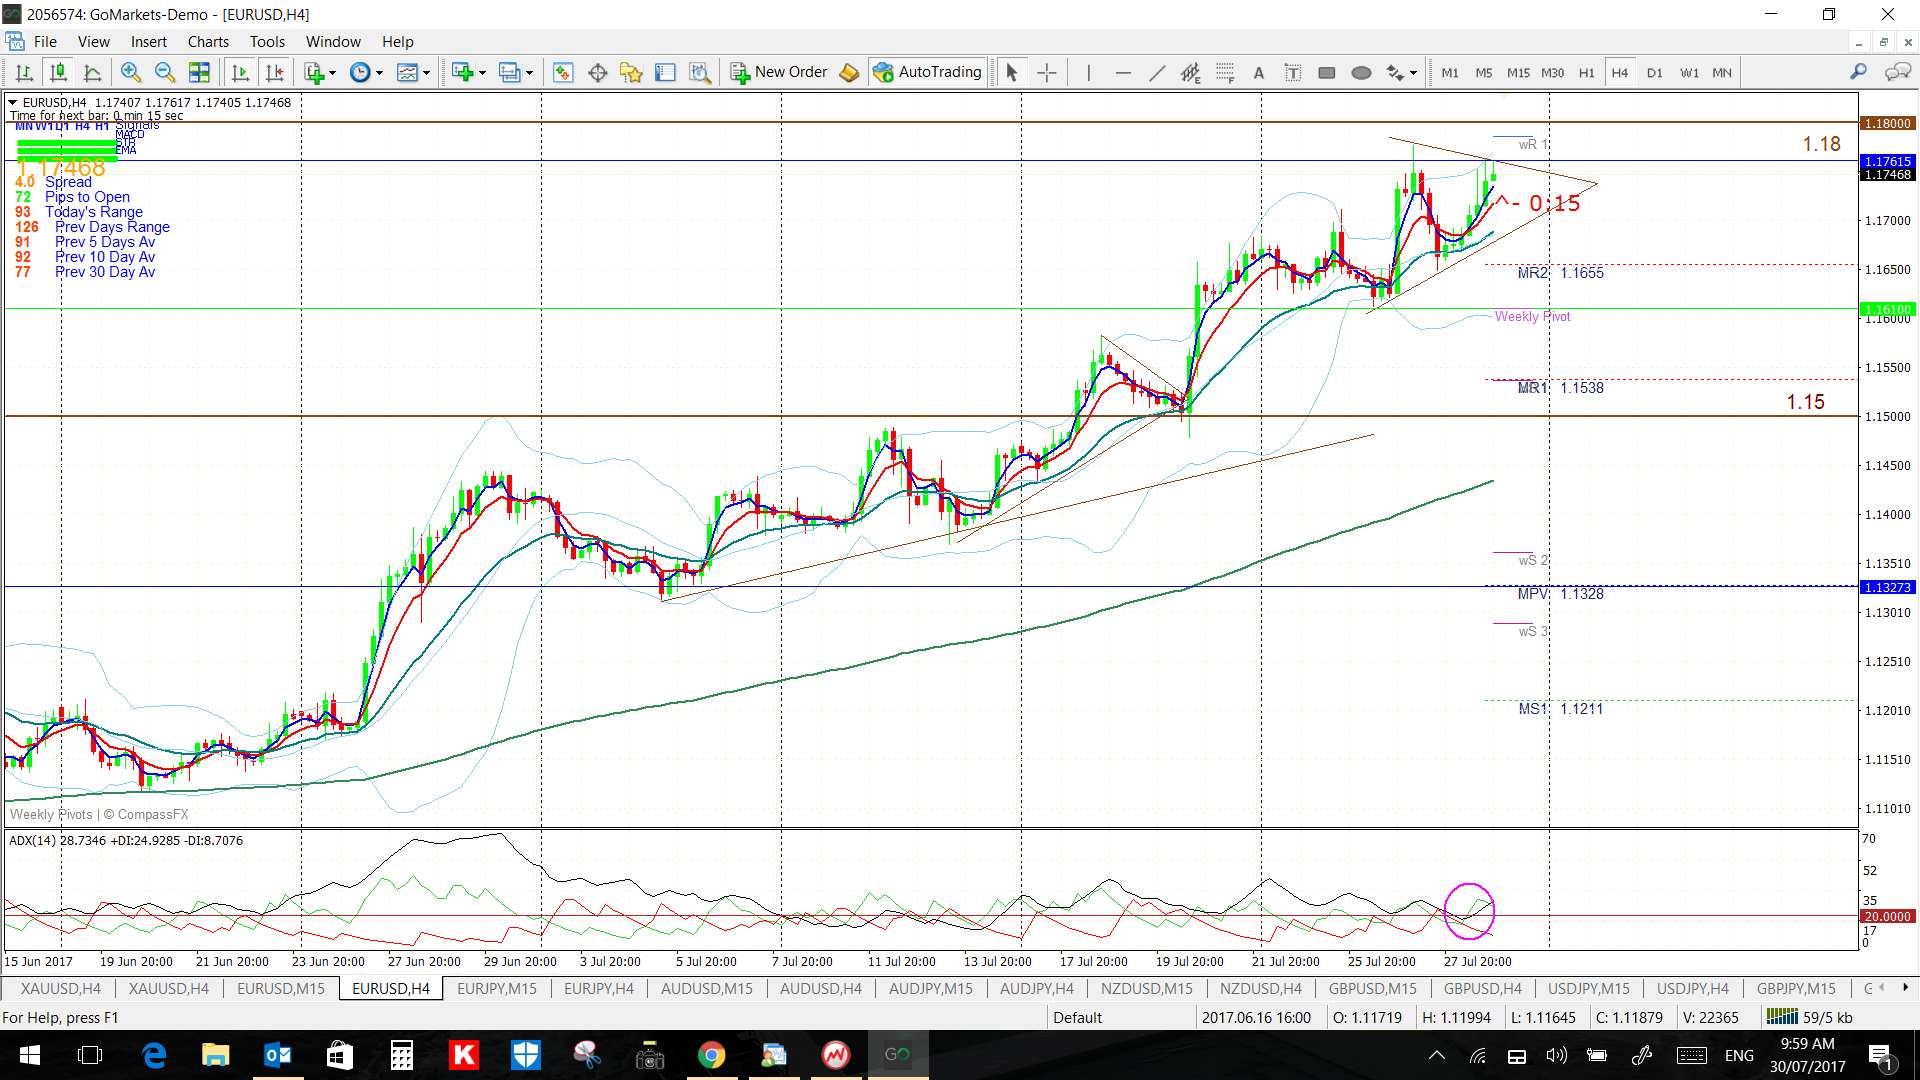
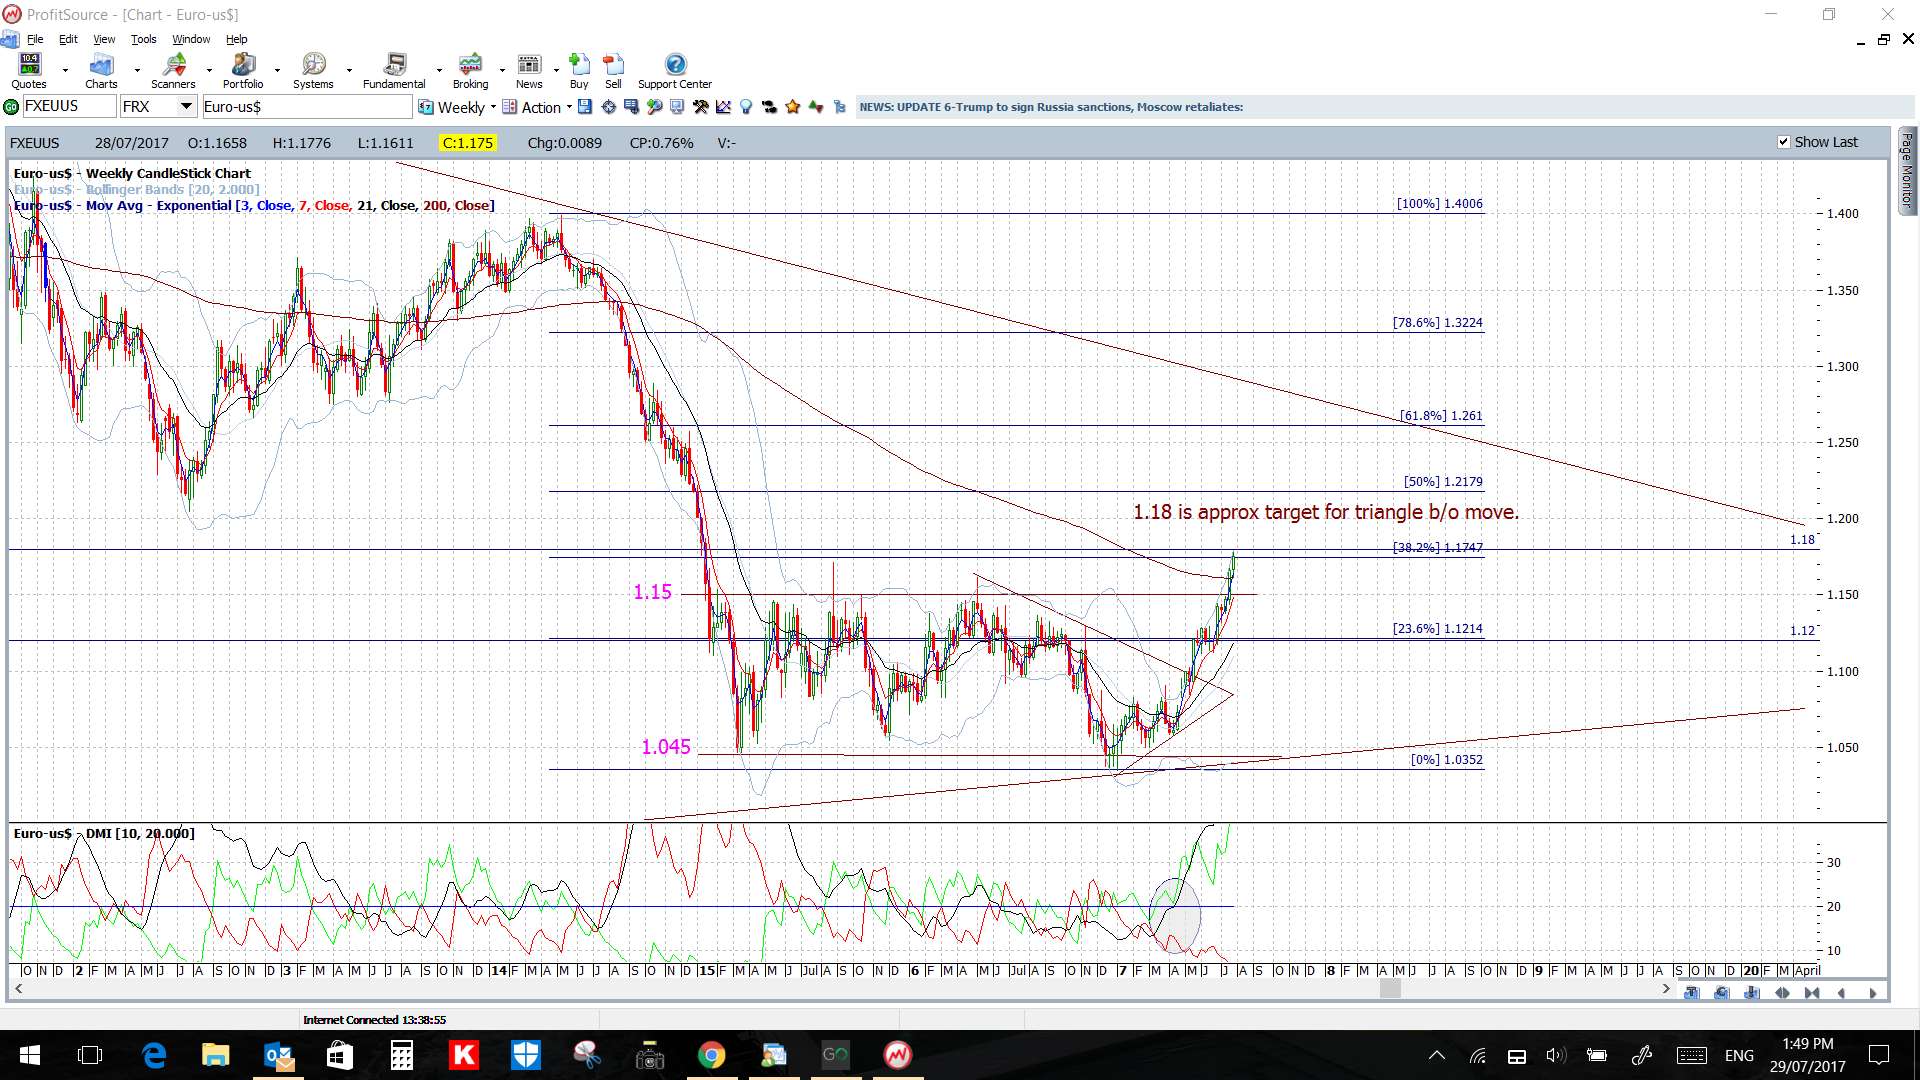
EUR/USD: the daily chart triangle breakout has almost peaked with about 750 pips delivered from a move worth up to 800 pips. The target for the daily triangle breakout move is up near 1.18 and this is near the upper edge of the trading range for this pair since the start of 2015 (shown on the weekly chart below). Thus, 1.18 will be the level to watch in coming sessions for any new make or break.
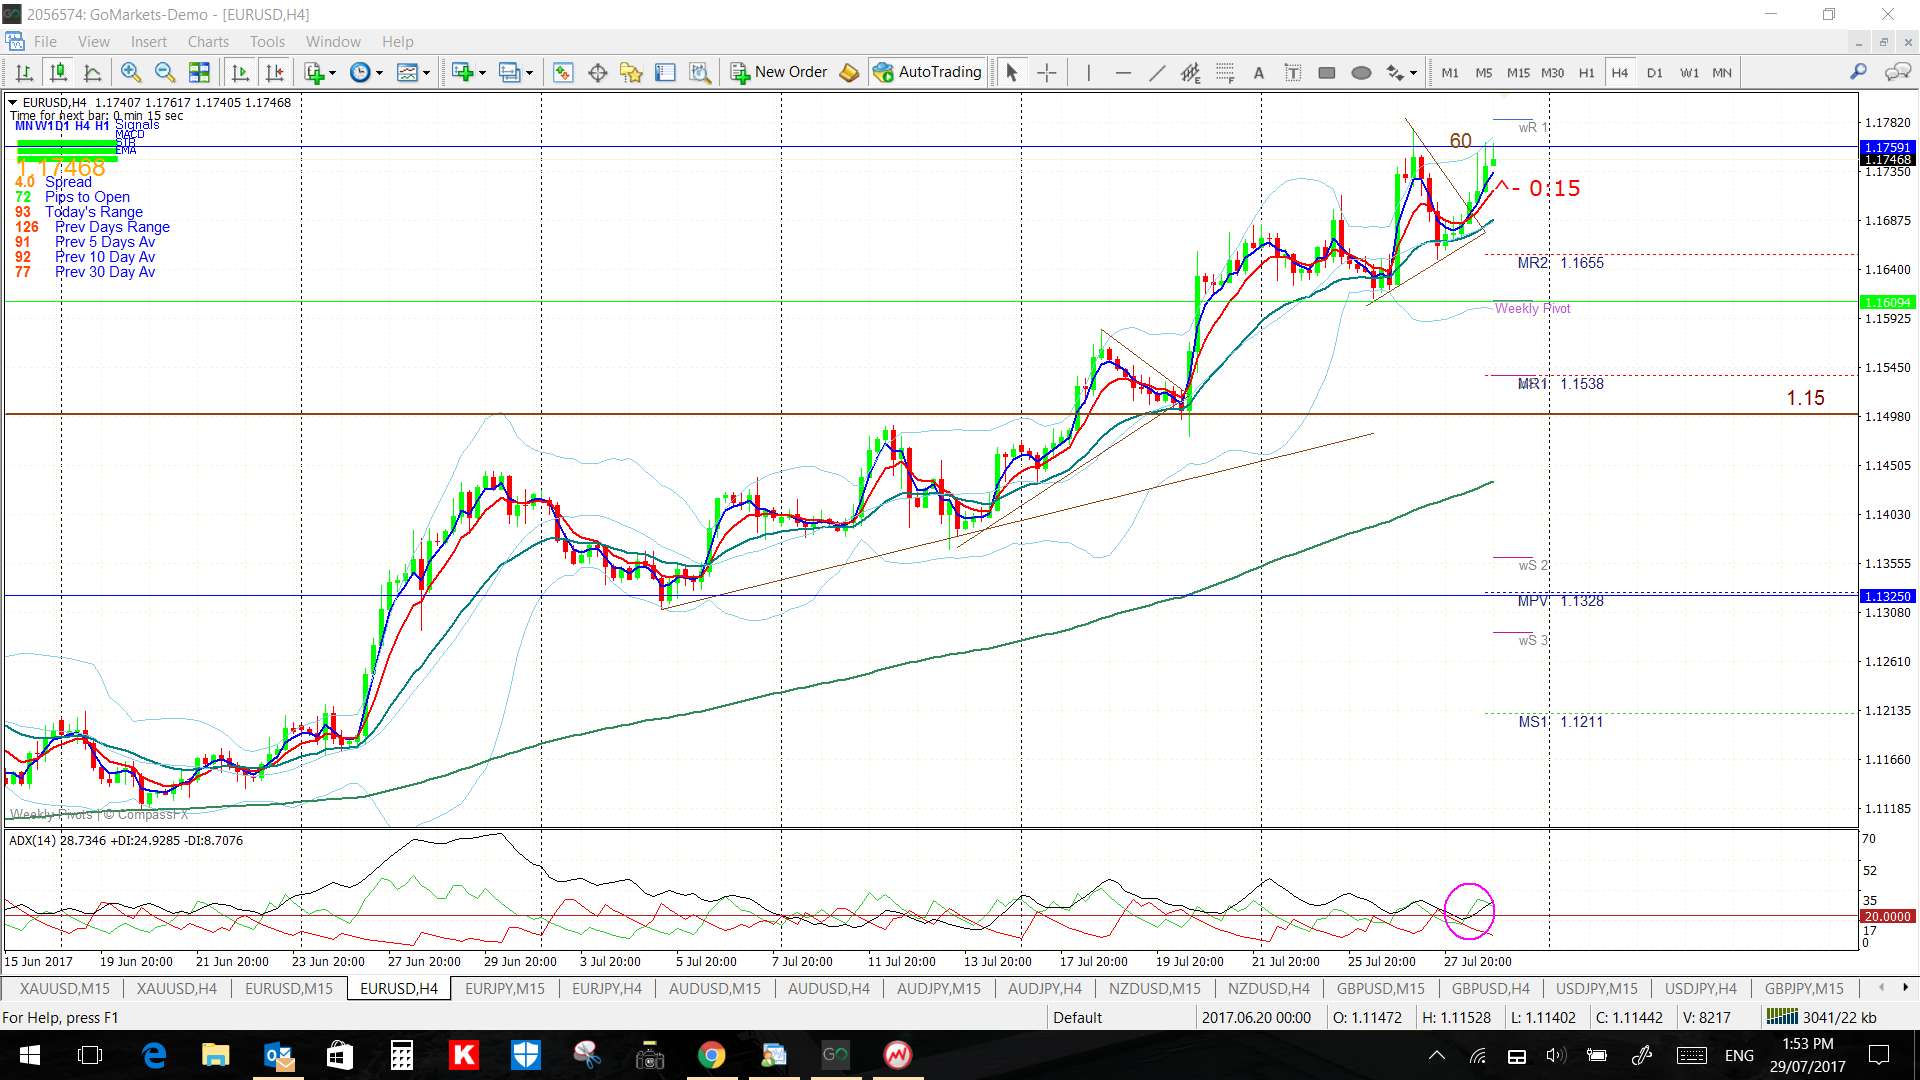
There was a 4hr chart trend line breakout here on Friday, as the chart’s below reveal, and I had Tweeted the revised chart on Friday prior to the move. This breakout also triggered a 15′ chart TC LONG signal for a 3 R trade:
EUR/USD 4hr: before and after the breakout:
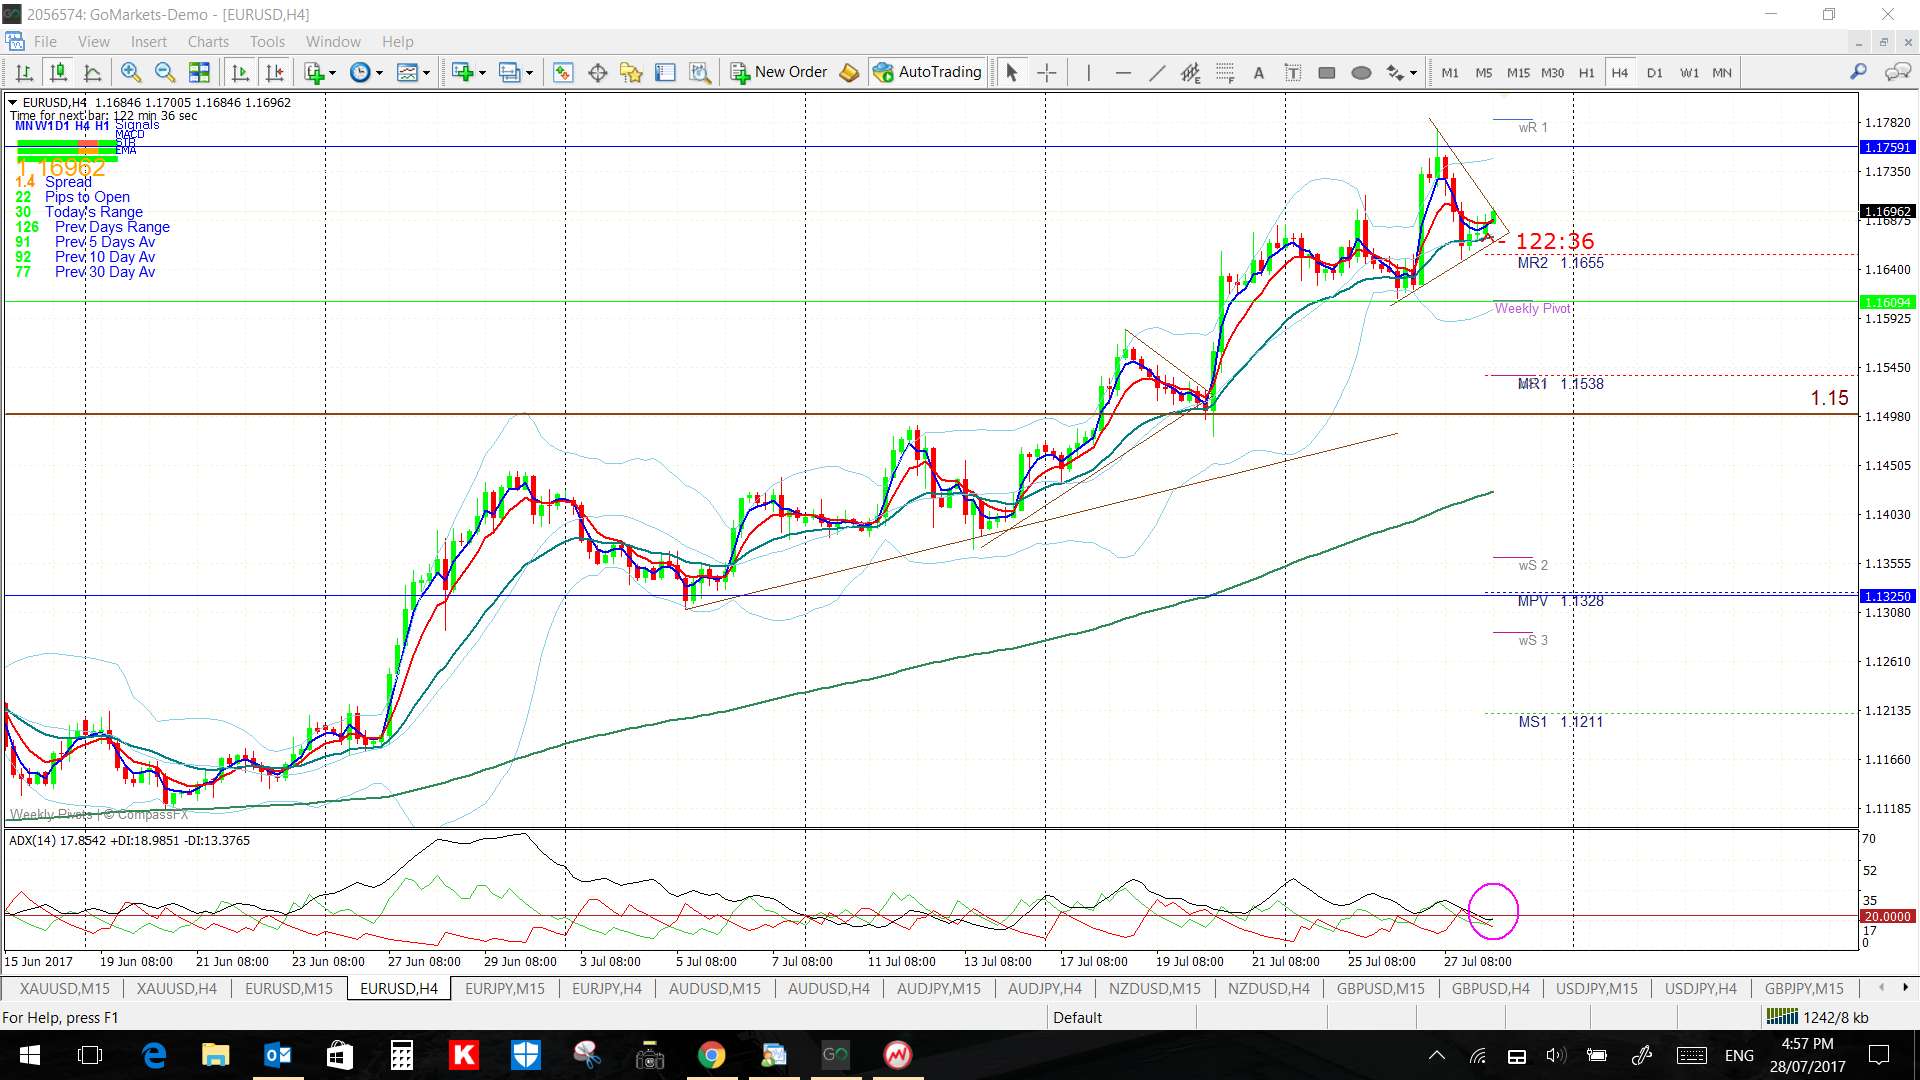
EUR/USD 15′: the 3 R TC LONG signal:

EUR/USD 4hr: the revised 4hr chart with new trend lines to monitor in the coming week. Note the major 1.18 level that is just above current price. The last close above this level was back in January 2015:
EUR/USD weekly: watch the 1.18 level for any new make or break:
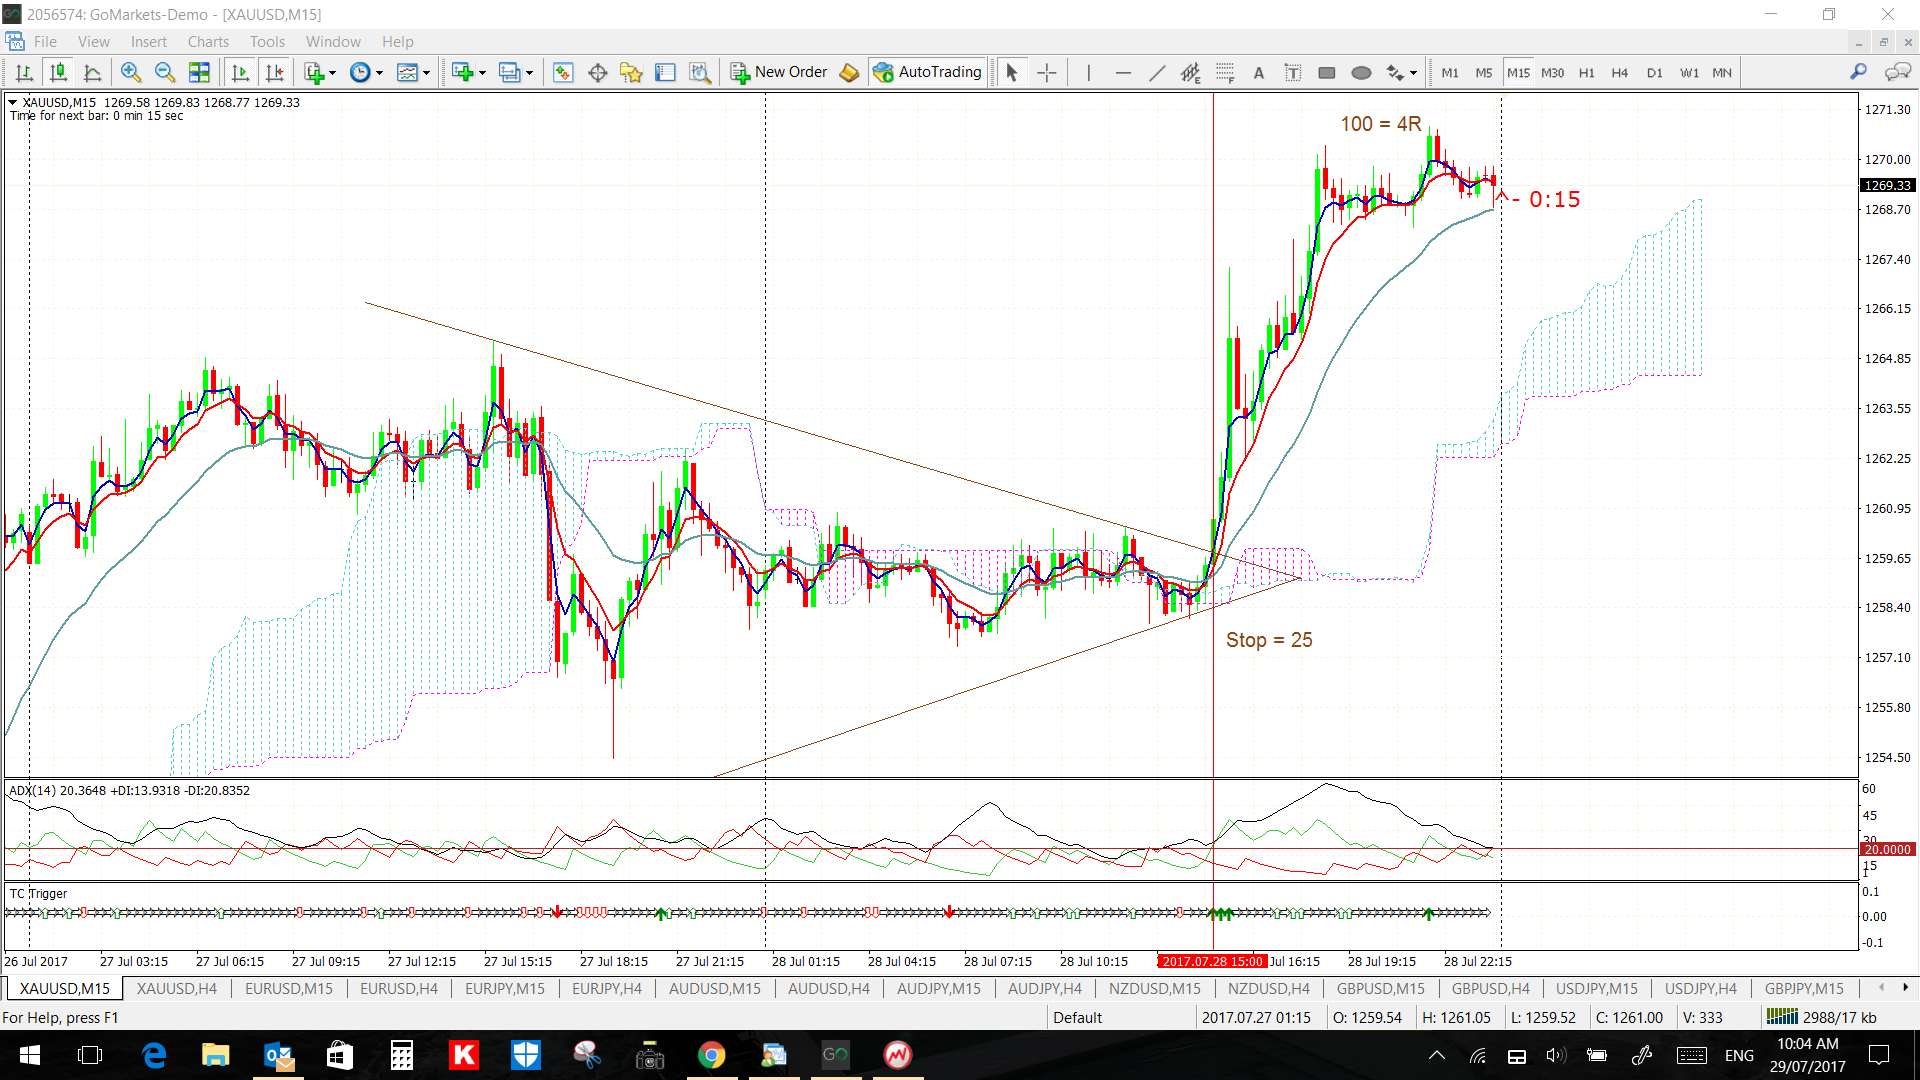
Gold: There was a 4hr chart trend line breakout here on Friday too, as the chart’s below reveal, with the set up being Tweeted prior to the move here as well. This breakout also triggered a great 15′ chart TC LONG ‘Optimal’ signal for a 4 R trade:
Gold 4hr: the breakout from Friday’s triangle:
Gold 15′: An Optimal TC signal with a NEW TC signal and a trend line break needing only a small Stop of 25 pips for a 4 R trade result. Ideal!
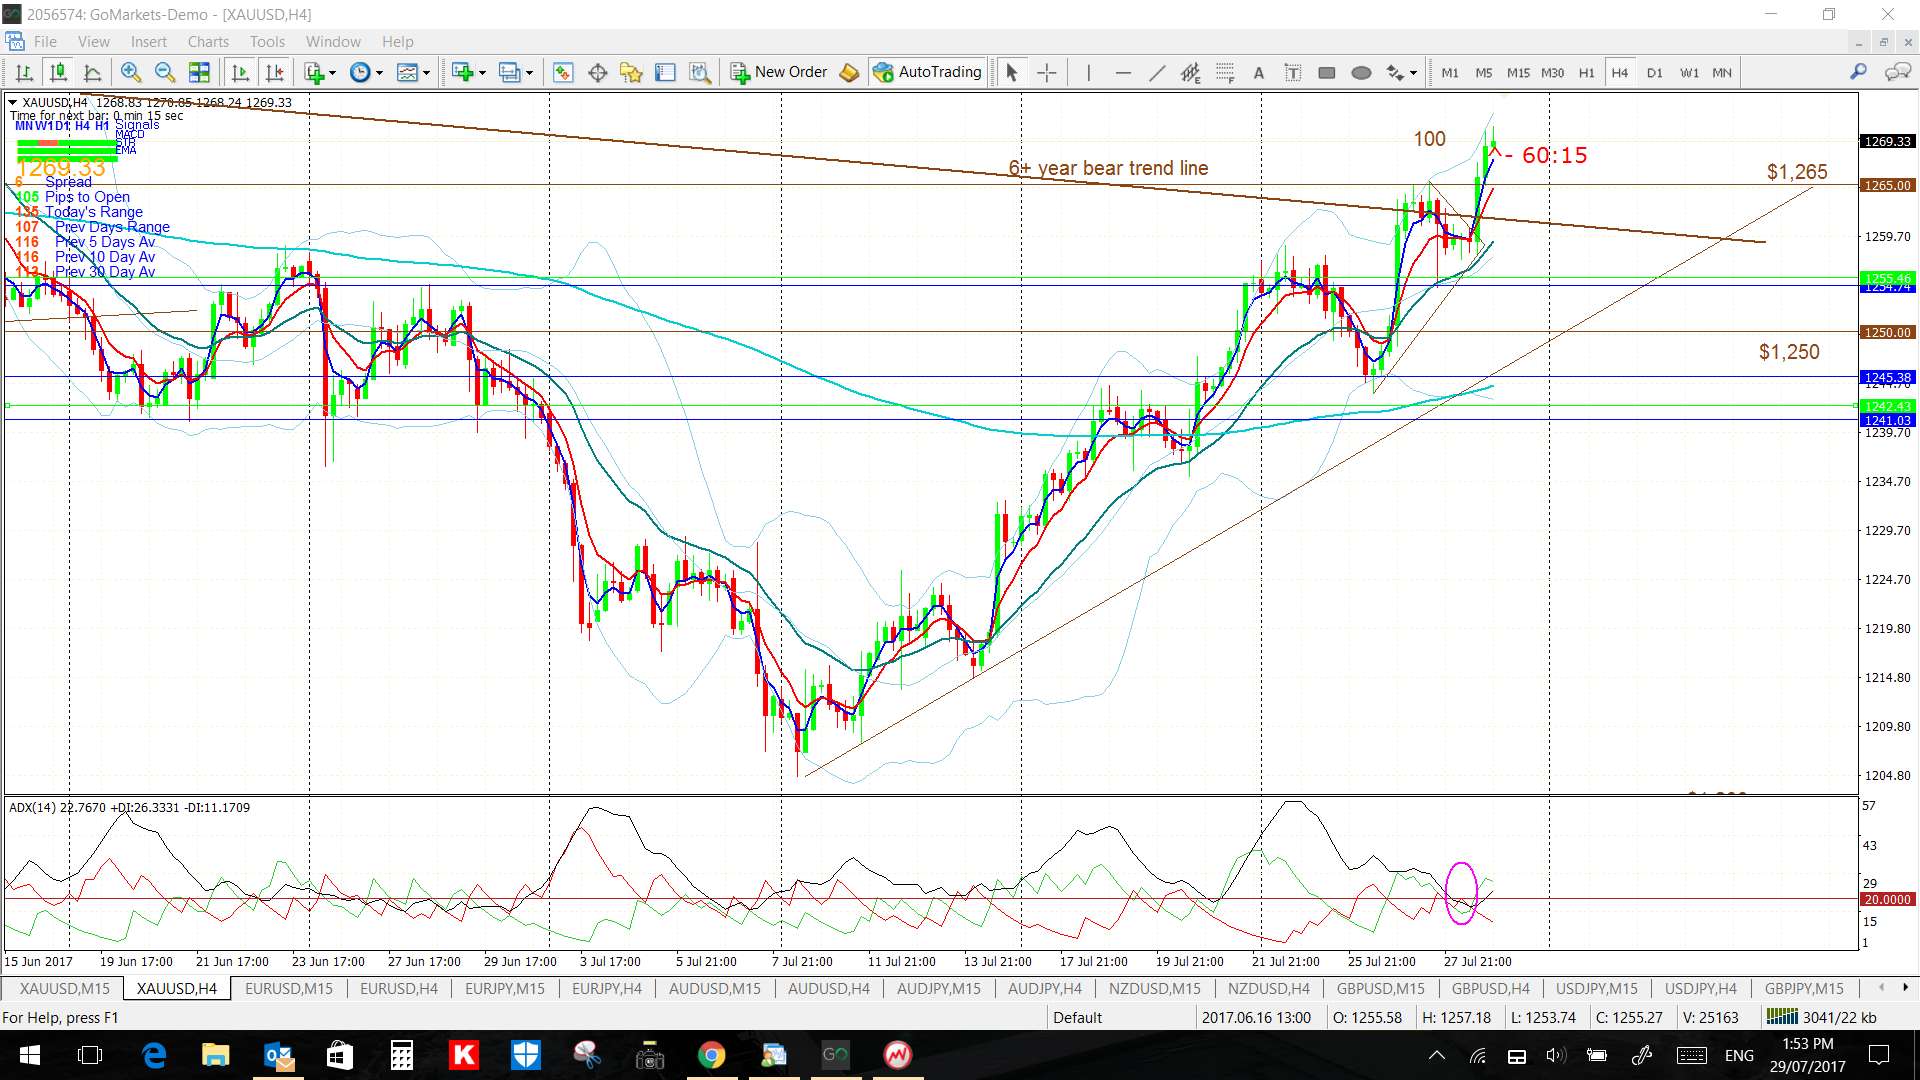
Gold 4hr: revised trend lines here. Note how I have relaxed the 6-year bear trend line to capture the recent 4hr chart high. Apologies for not doing this earlier!

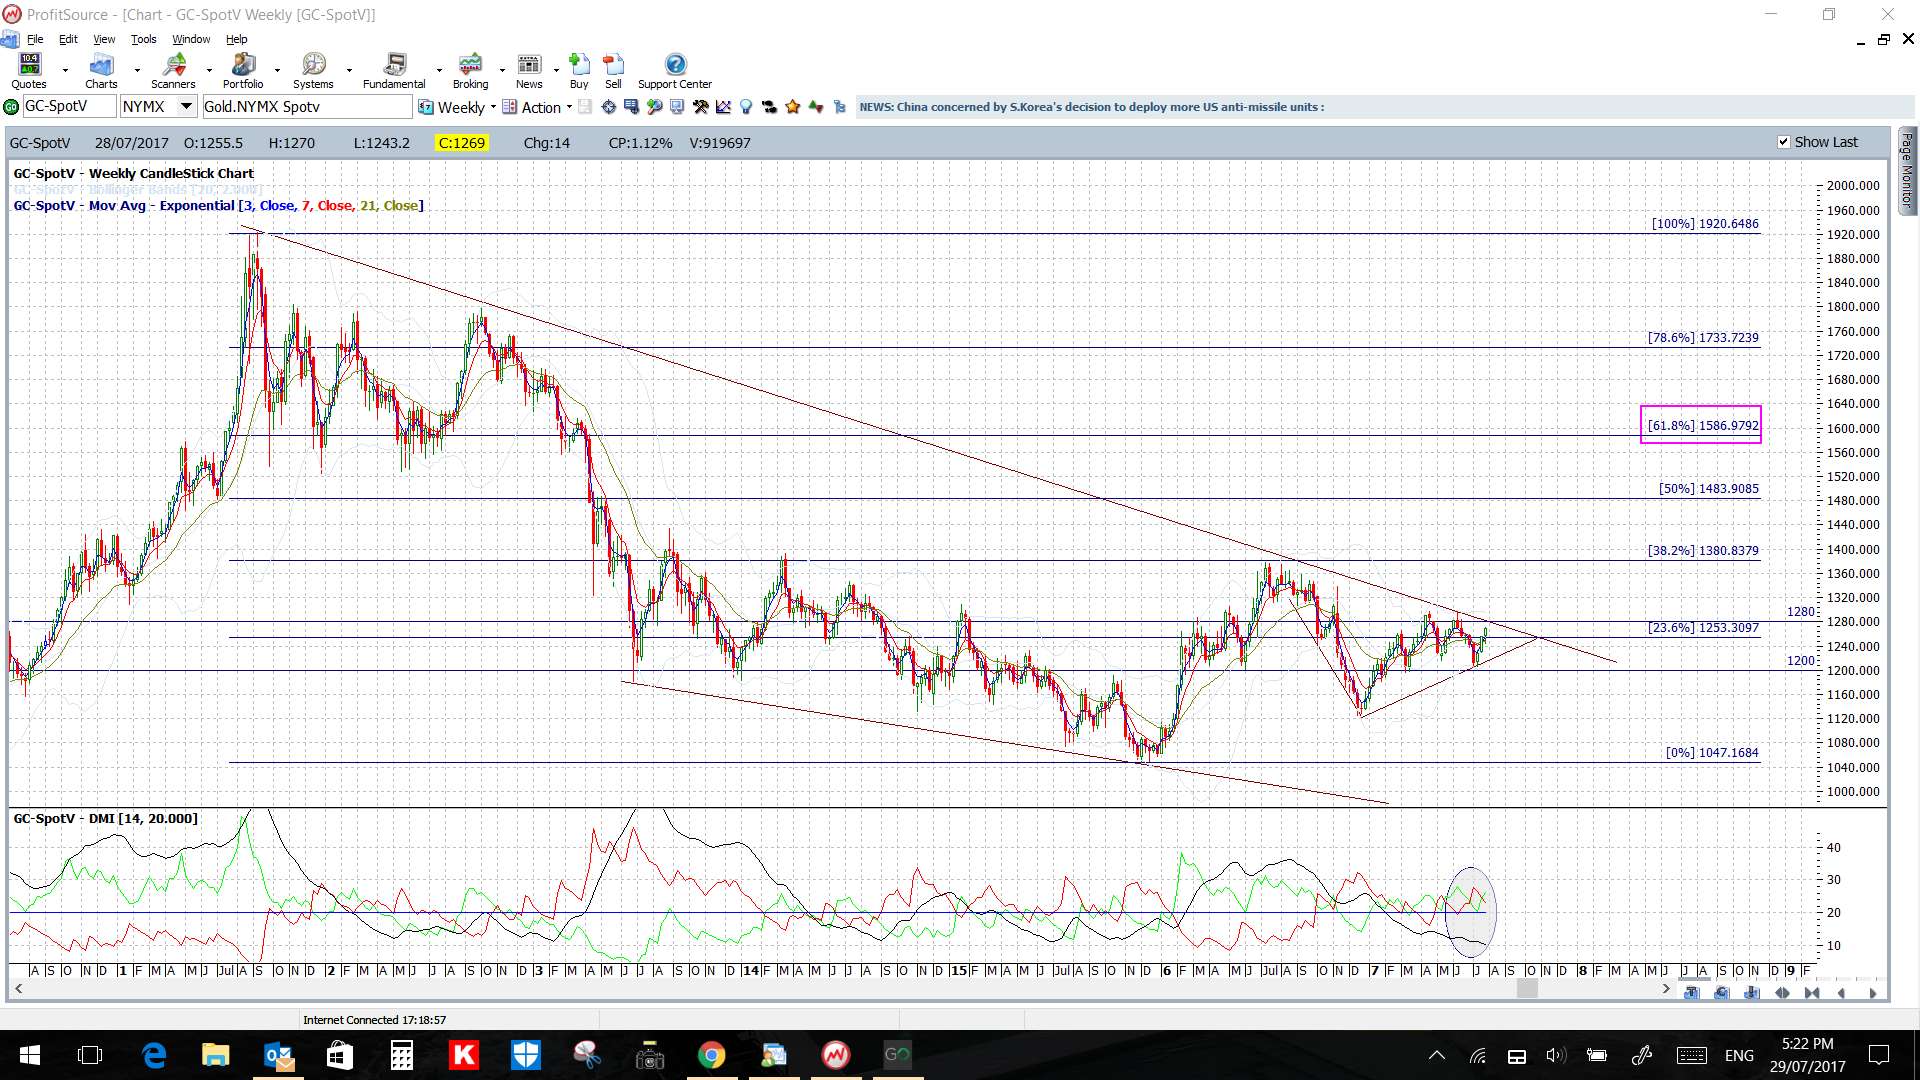
Gold weekly: a major 6-year bear trend line is just ahead of price action so keep an eye on this resistance zone in coming sessions.
EUR/JPY: keep an eye on the 4hr chart trend lines and the 130 level for any new make or break:


AUD/USD: keep an eye on the 4hr chart trend lines,the 0.80 level and the weekly 200 EMA for any new make or break.
Just as the US$ index is testing the support of the weekly 200 EMA that has been in play for over three years, the Aussie is testing the resistance of the weekly EMA that’s been in force here for a similar time. Any weekly close and hold above the 0.80 level will have me looking for a test of the weekly chart’s 61.8% fib up near 0.95:
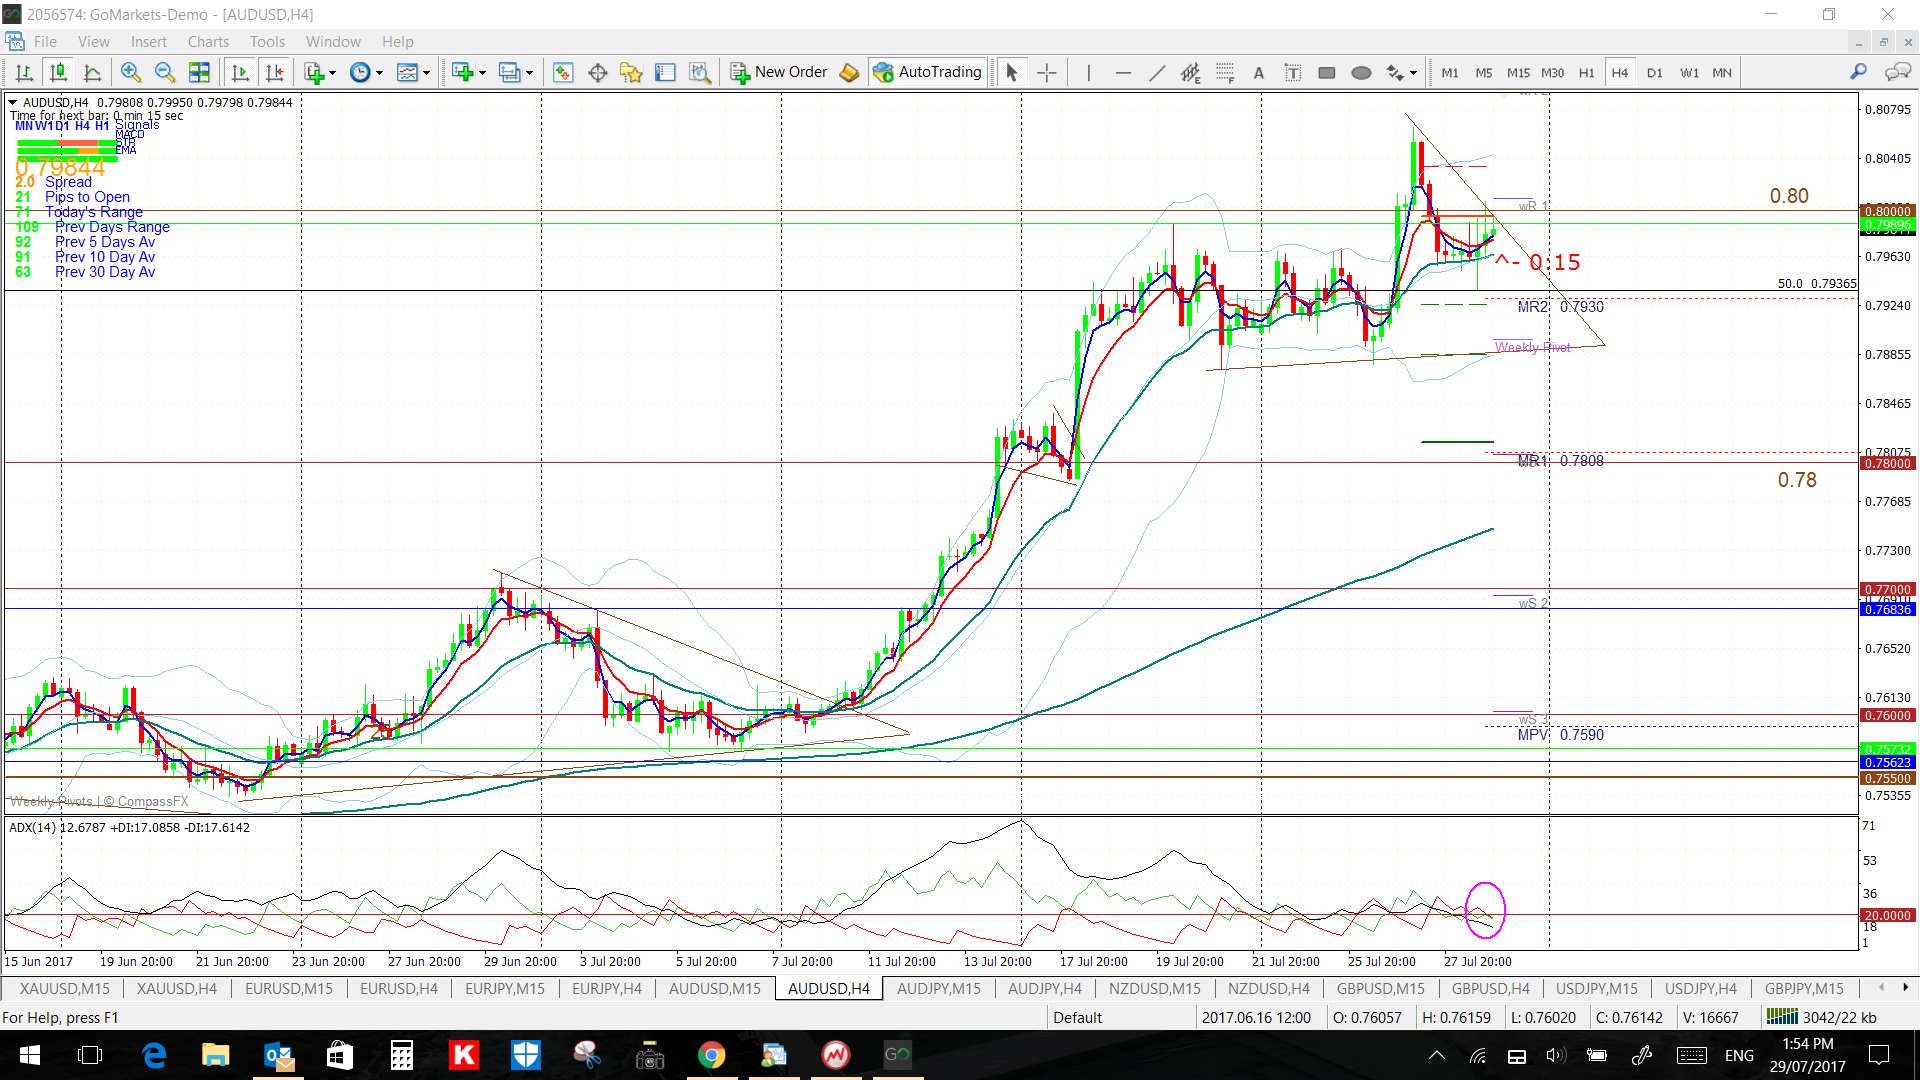
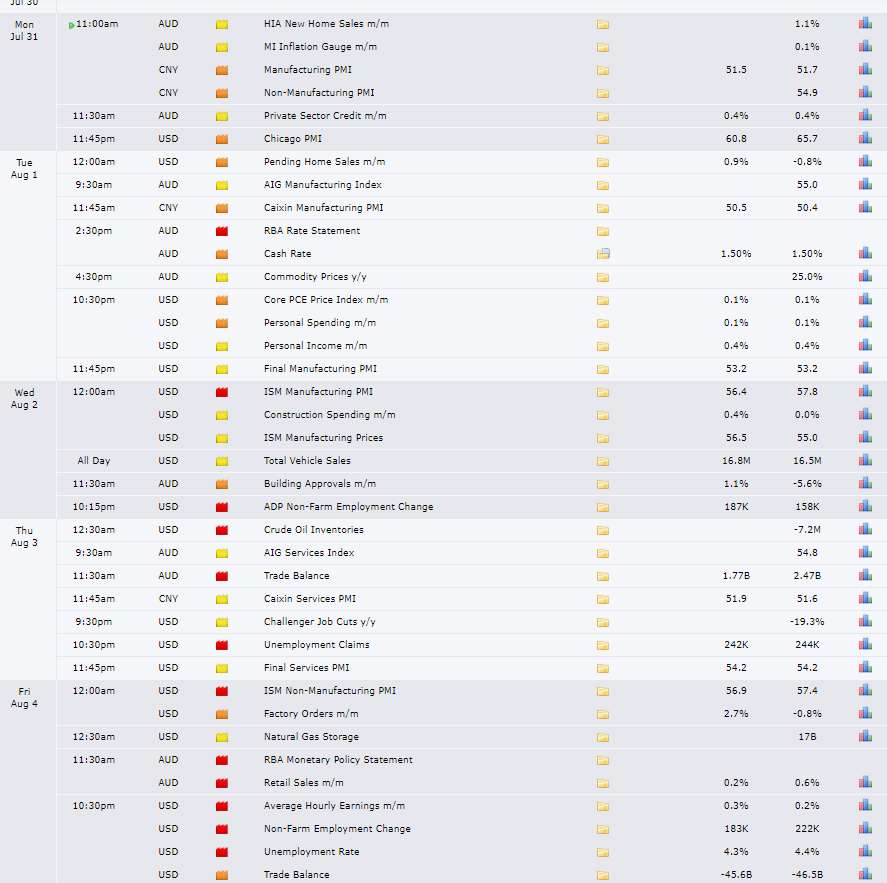
There is a lot of data to impact the Aussie this week as the calendar below shows. Tuesday’s RBA rate update will be a keenly watched event as will Friday’s NFP:
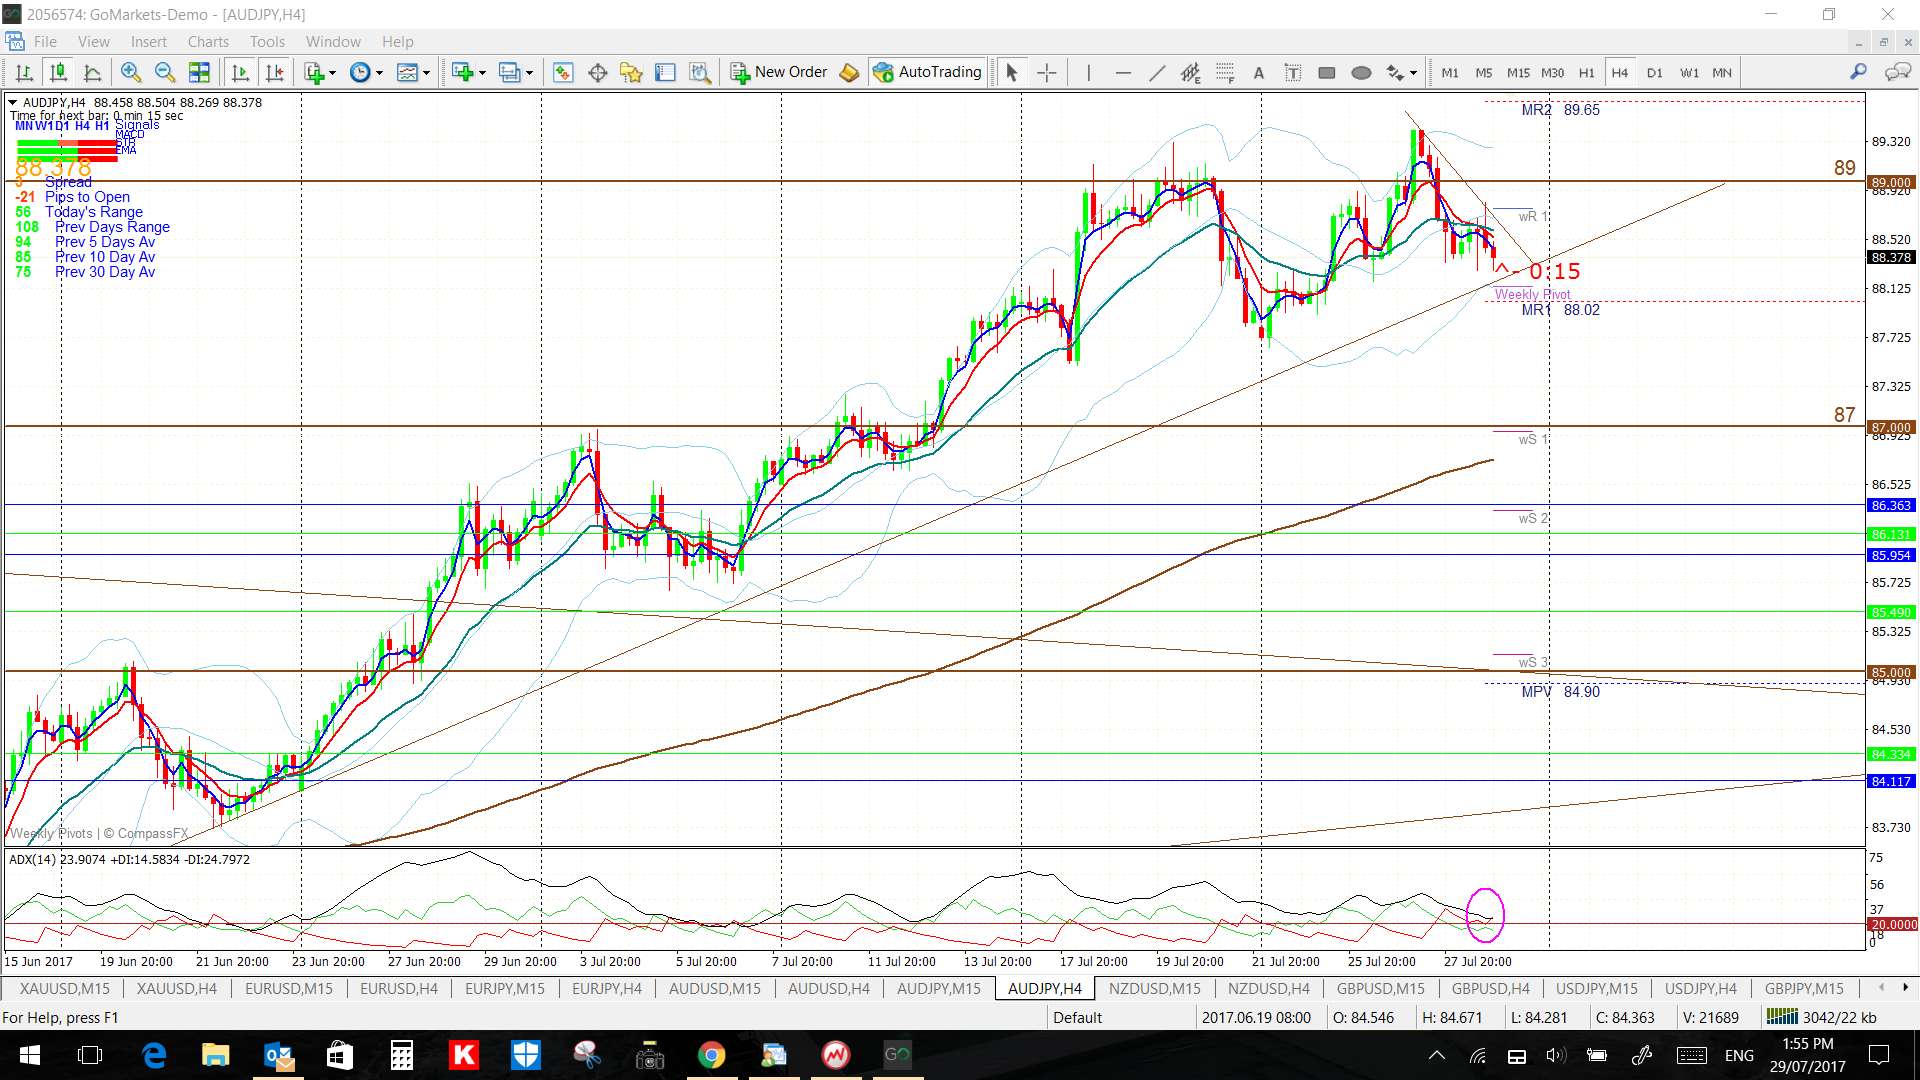
AUD/JPY: keep an eye on the 4hr chart trend lines and the 89 level for any new make or break:
GBP/USD: keep an eye on the 4hr chart trend lines and the 1.30 level for any new make or break.
I think this pair will head to test 1.35 if the US$ continues to weaken. Note the 3,000 pips triangle brewing on the weekly chart!

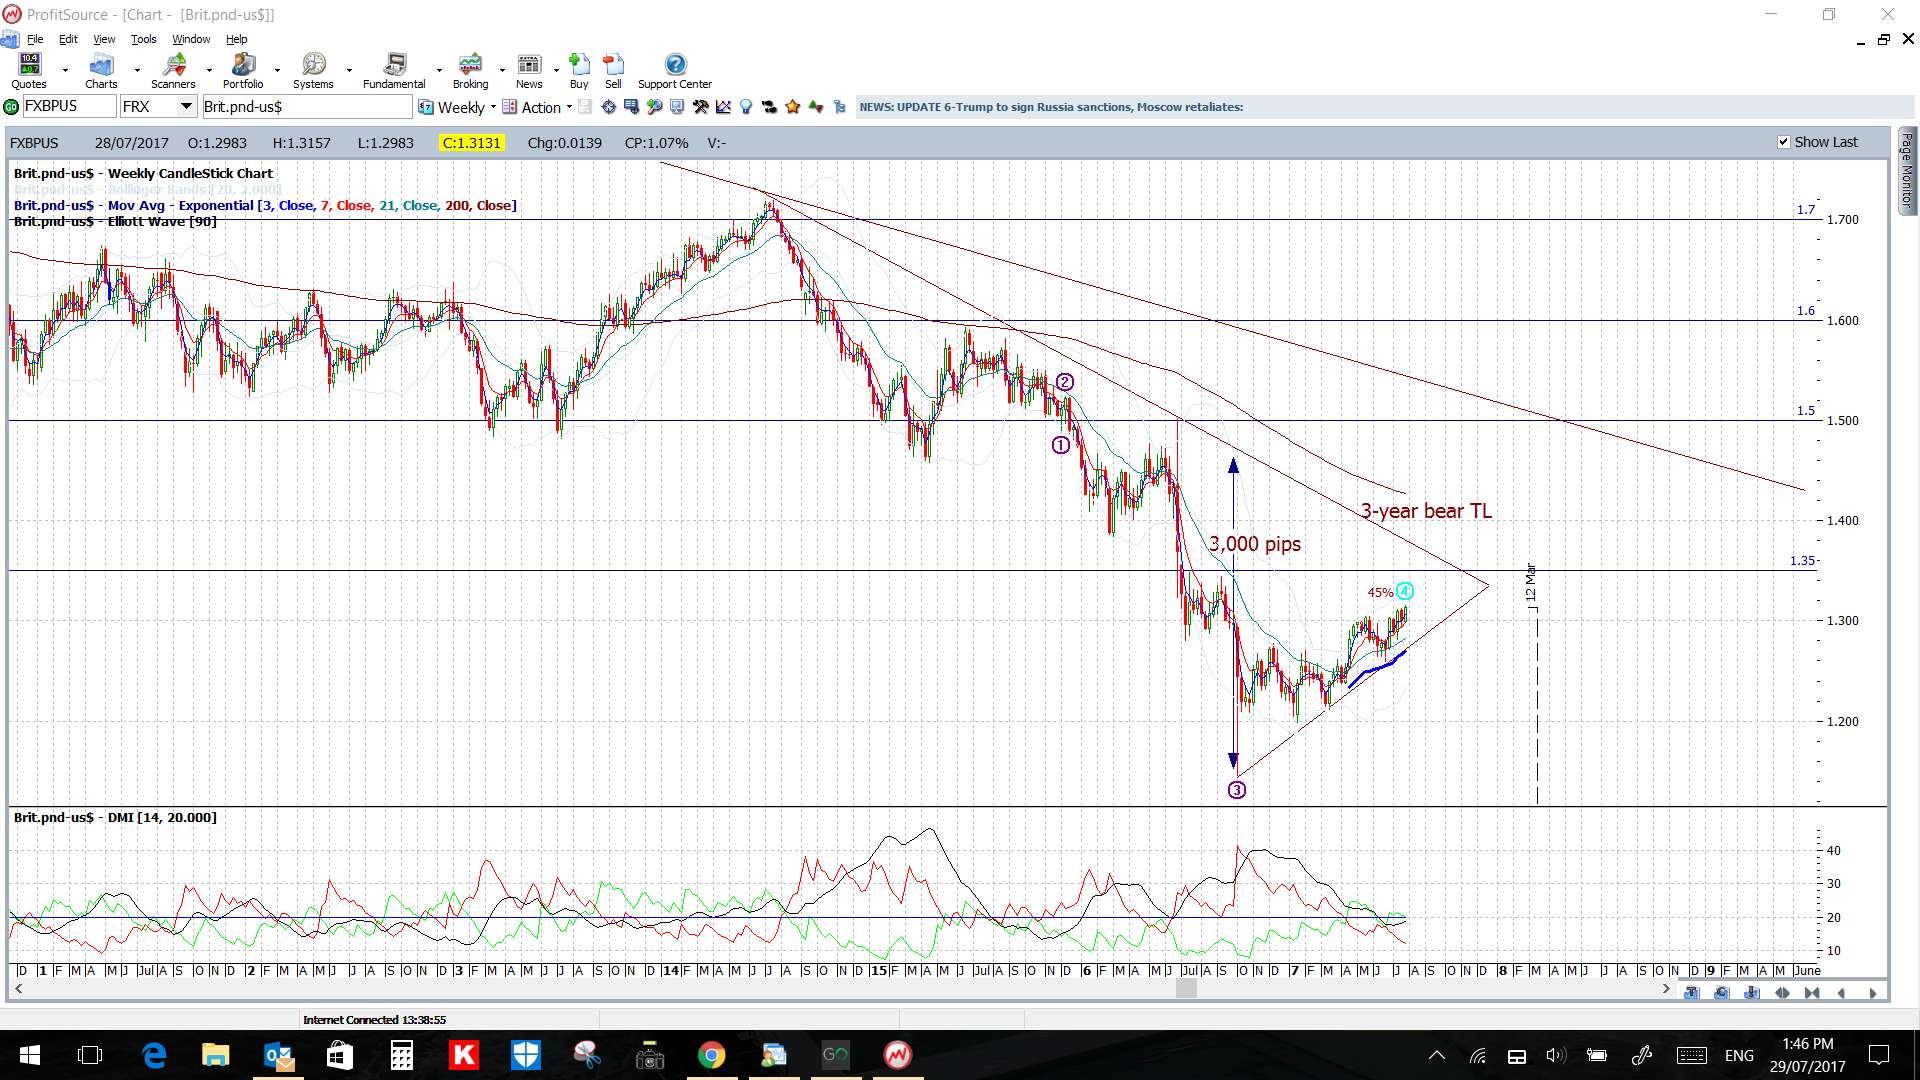
There is a lot of data to impact the Cable this week as the calendar below shows. Thursday’s BoE rate update will be a keenly watched event as will Friday’s NFP:

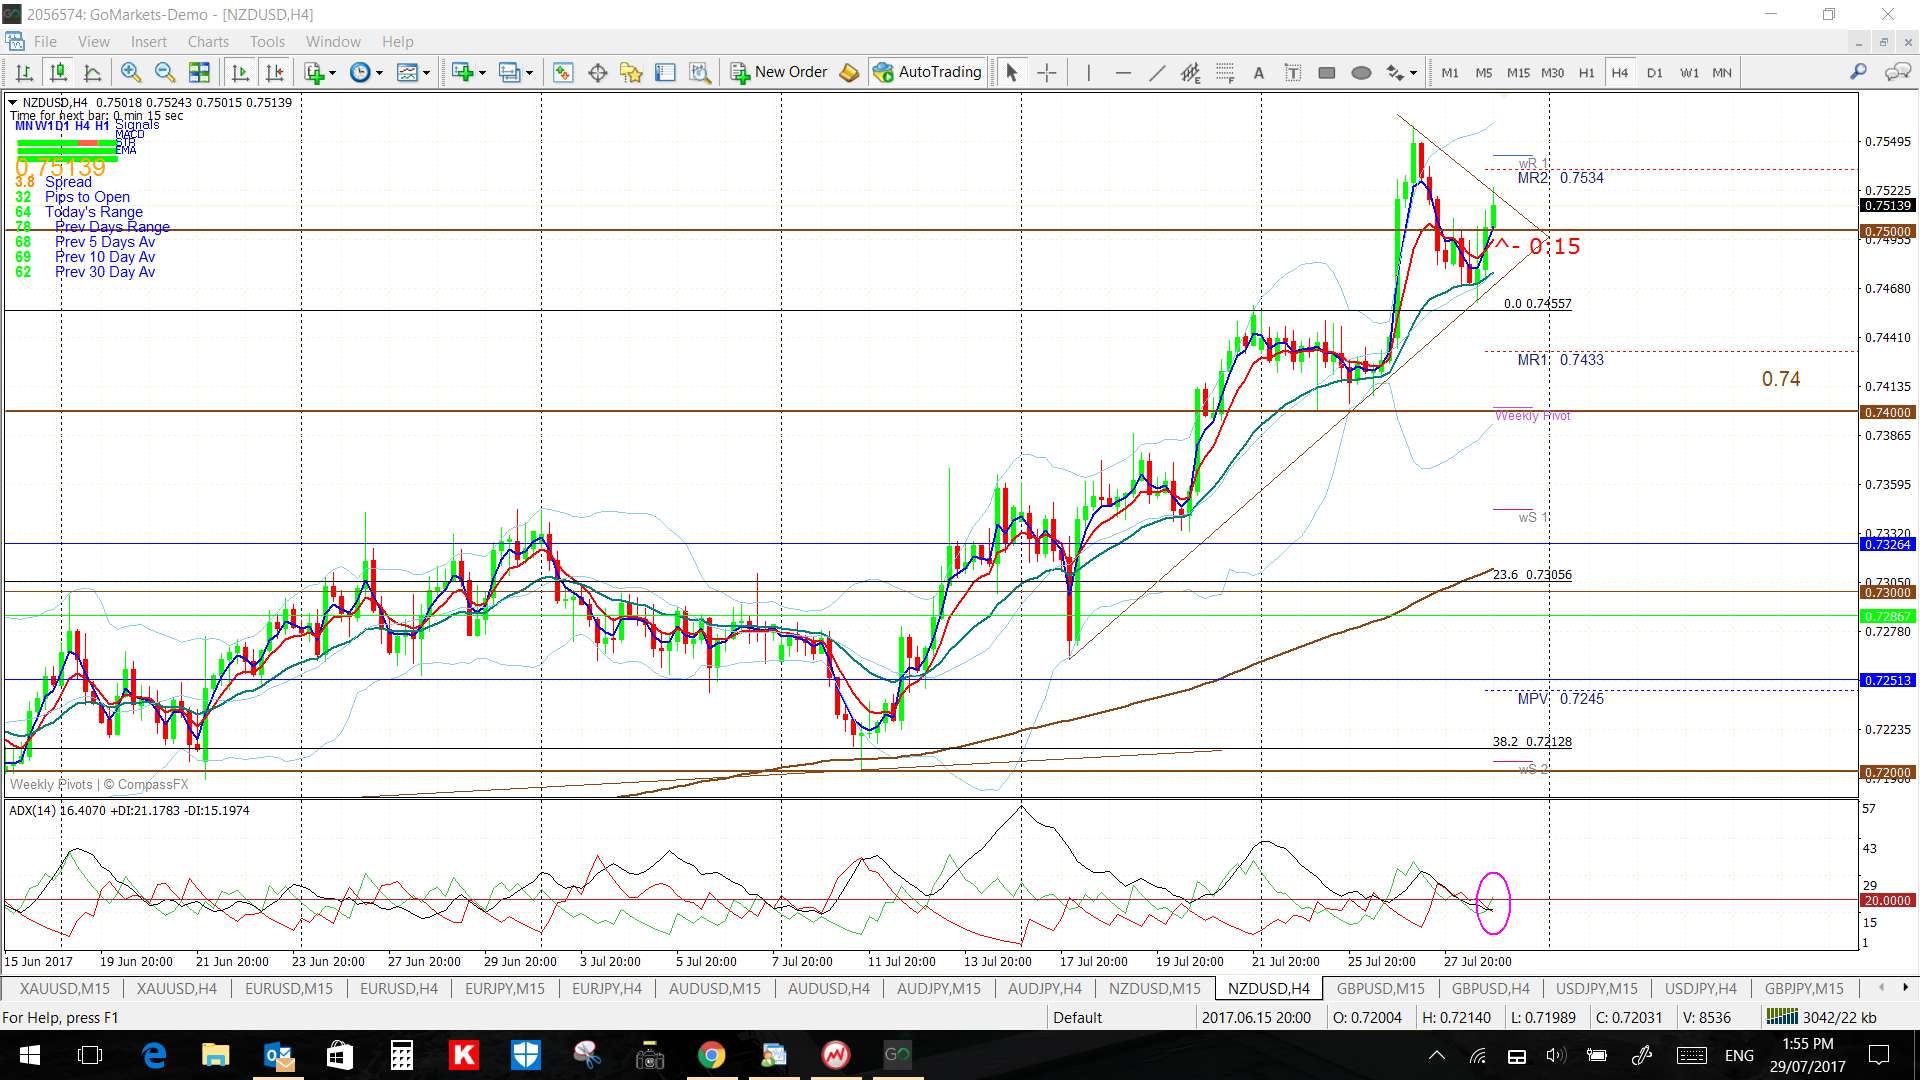
NZD/USD: keep an eye on the 4hr chart trend lines and the 0.75 level for any new make or break:
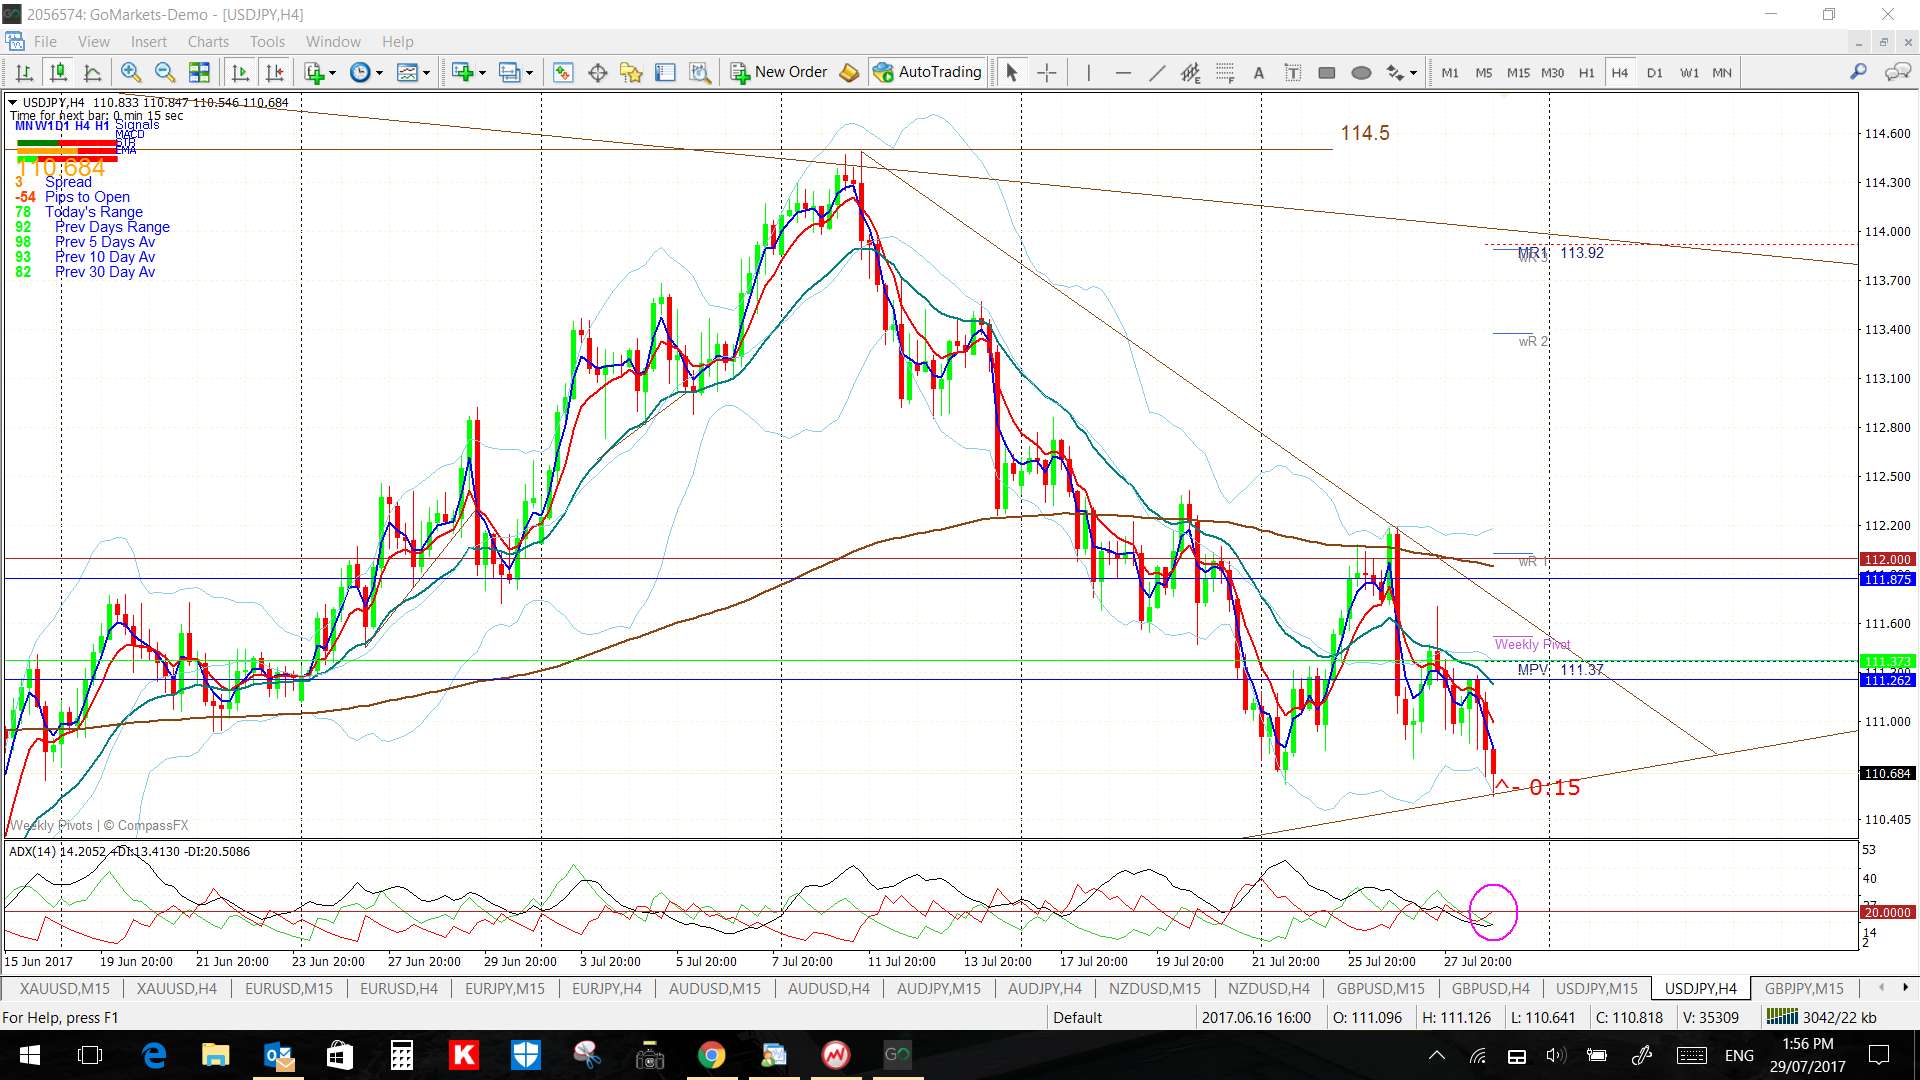
USD/JPY: keep an eye on the 4hr chart trend lines for any new make or break:

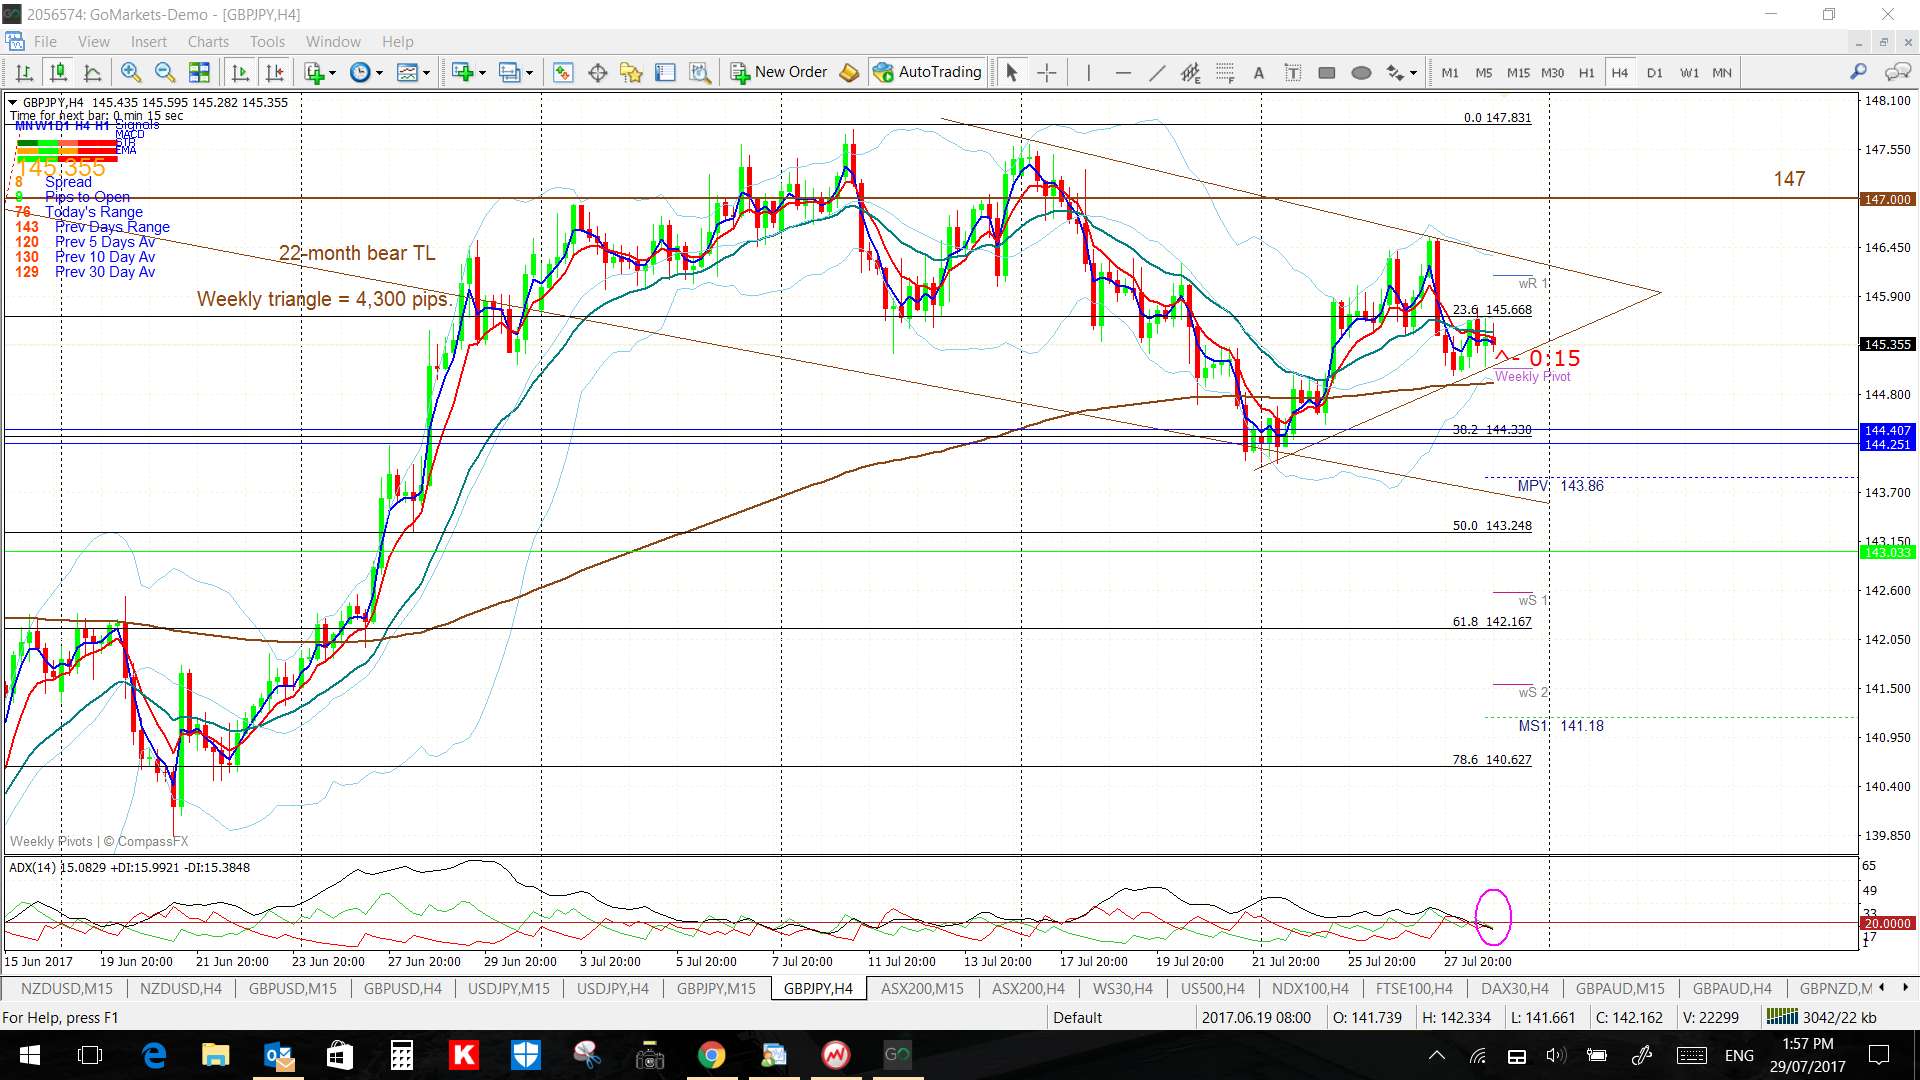
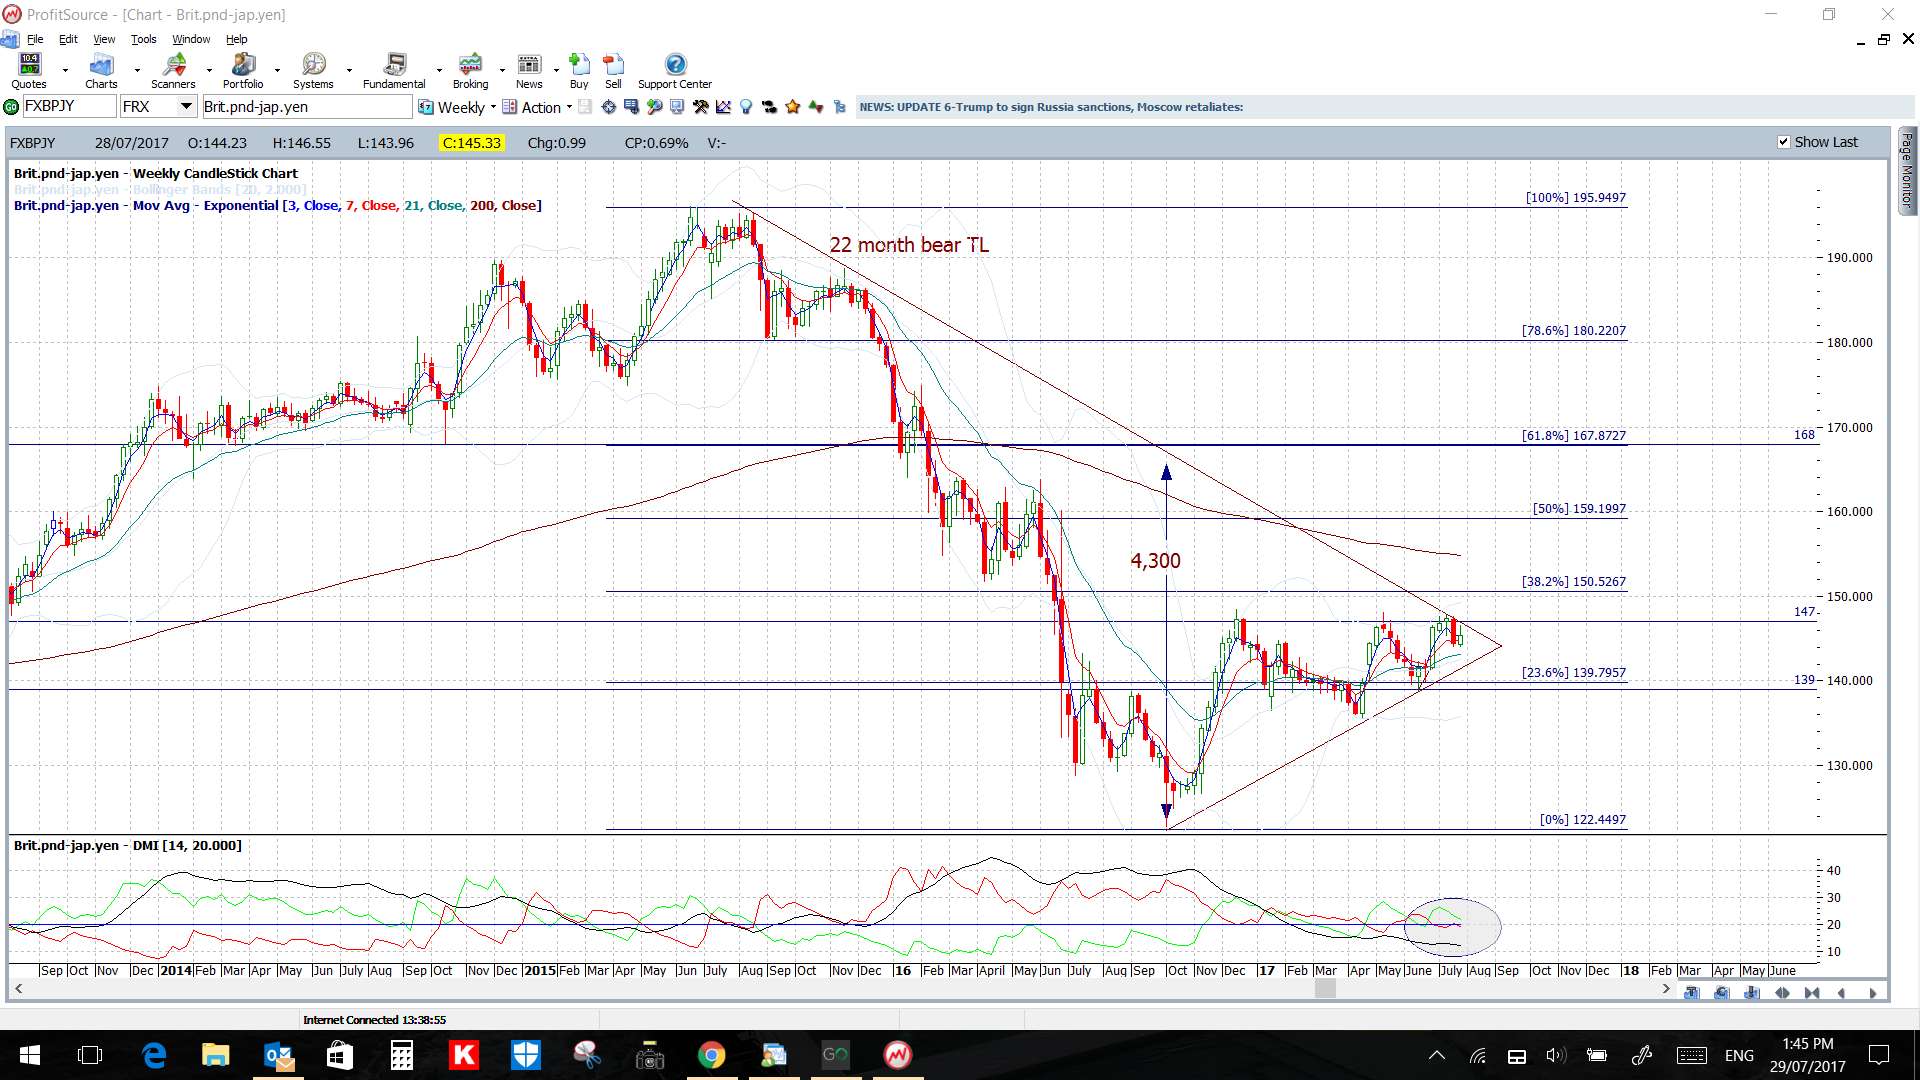
GBP/JPY: keep an eye on the 4hr chart trend lines and the 147 level for any new make or break.
Note the 4,300 pip triangle brewing still on the weekly chart:
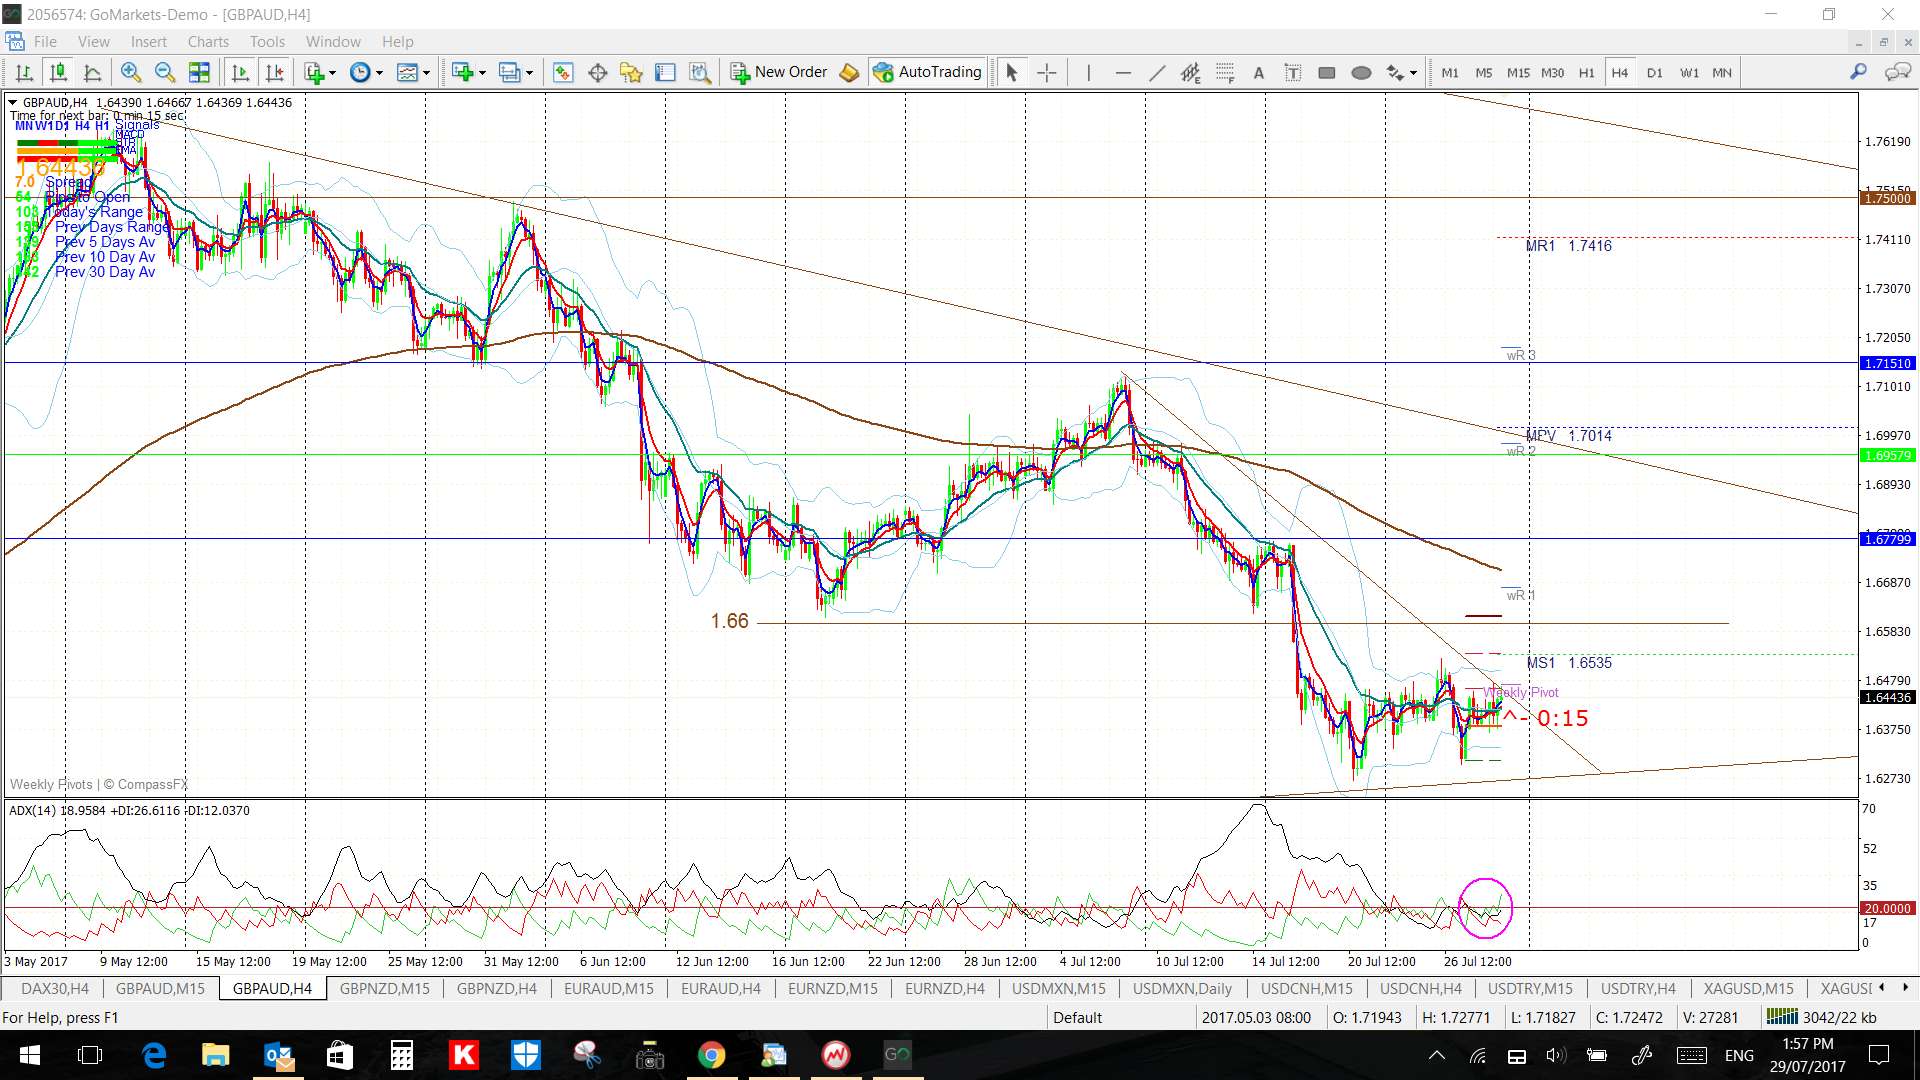
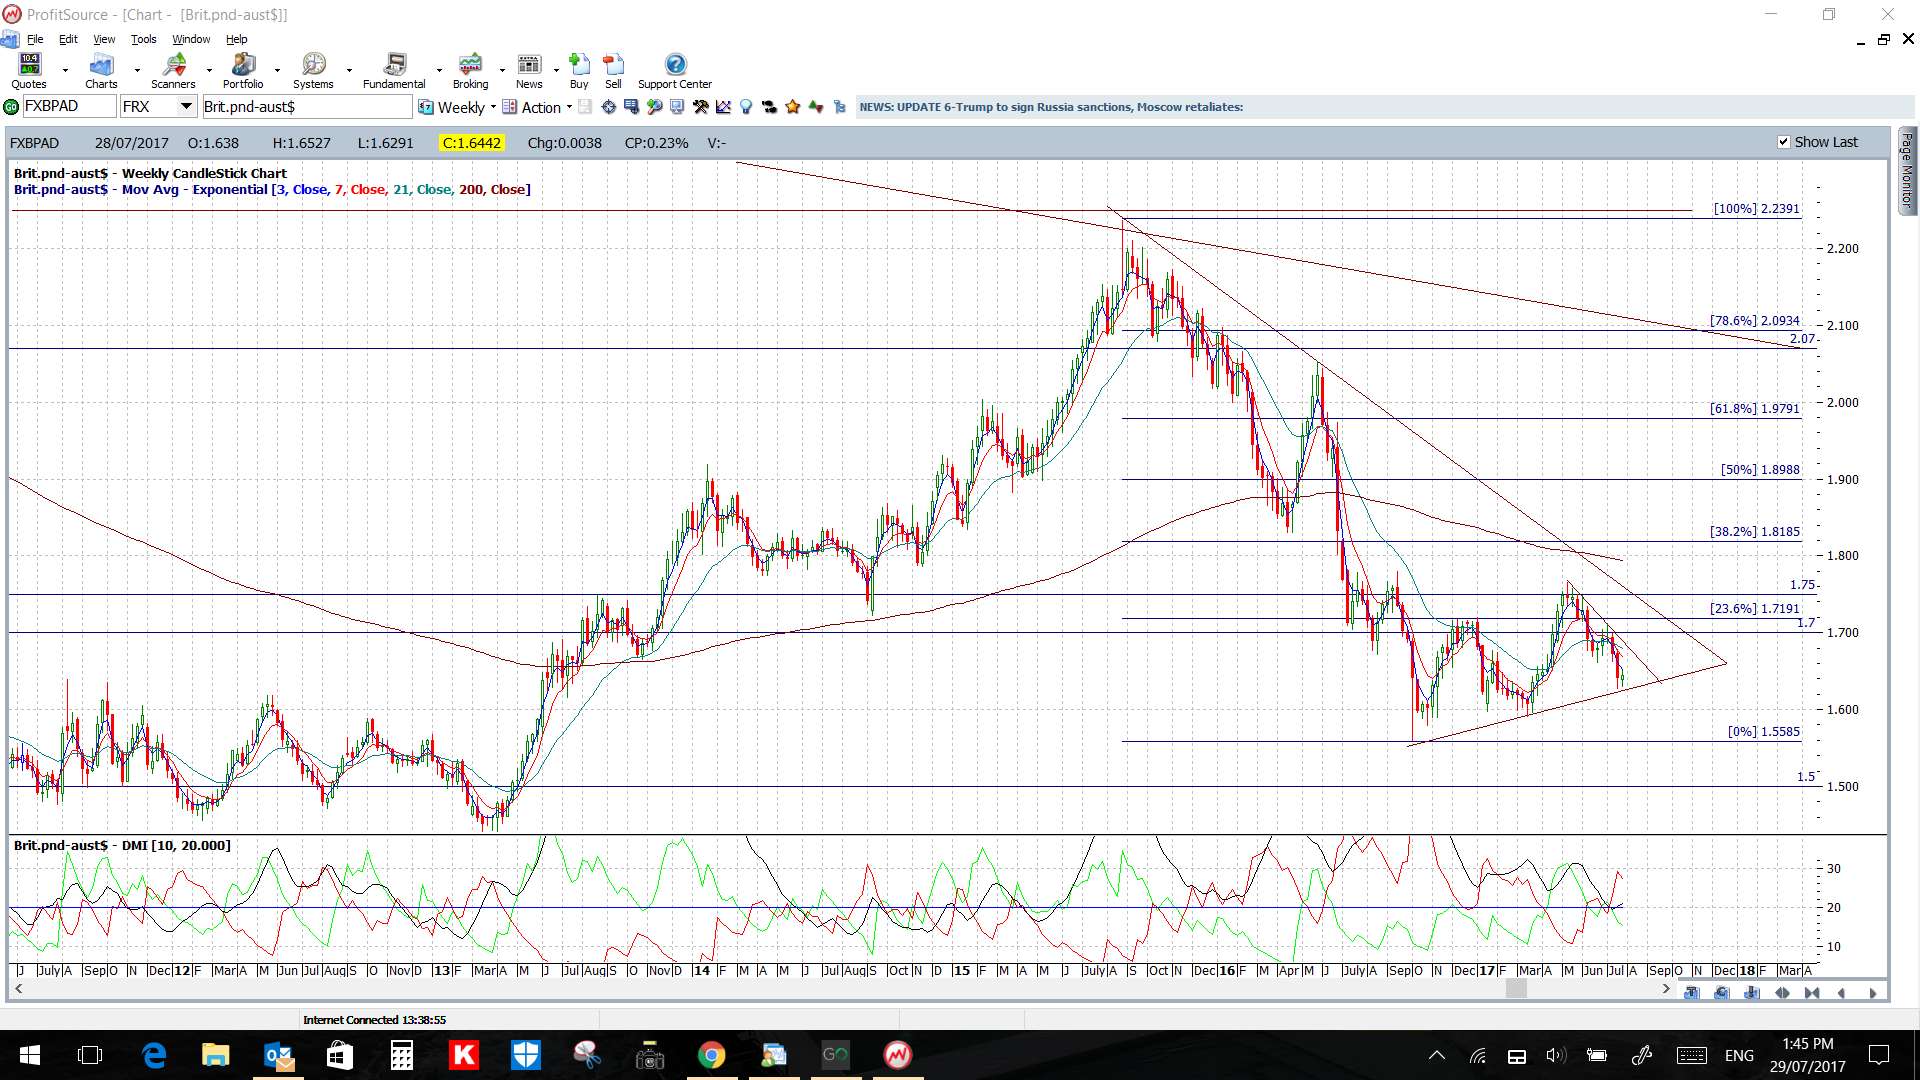
GBP/AUD: keep an eye on the 4hr chart trend lines for any new make or break:
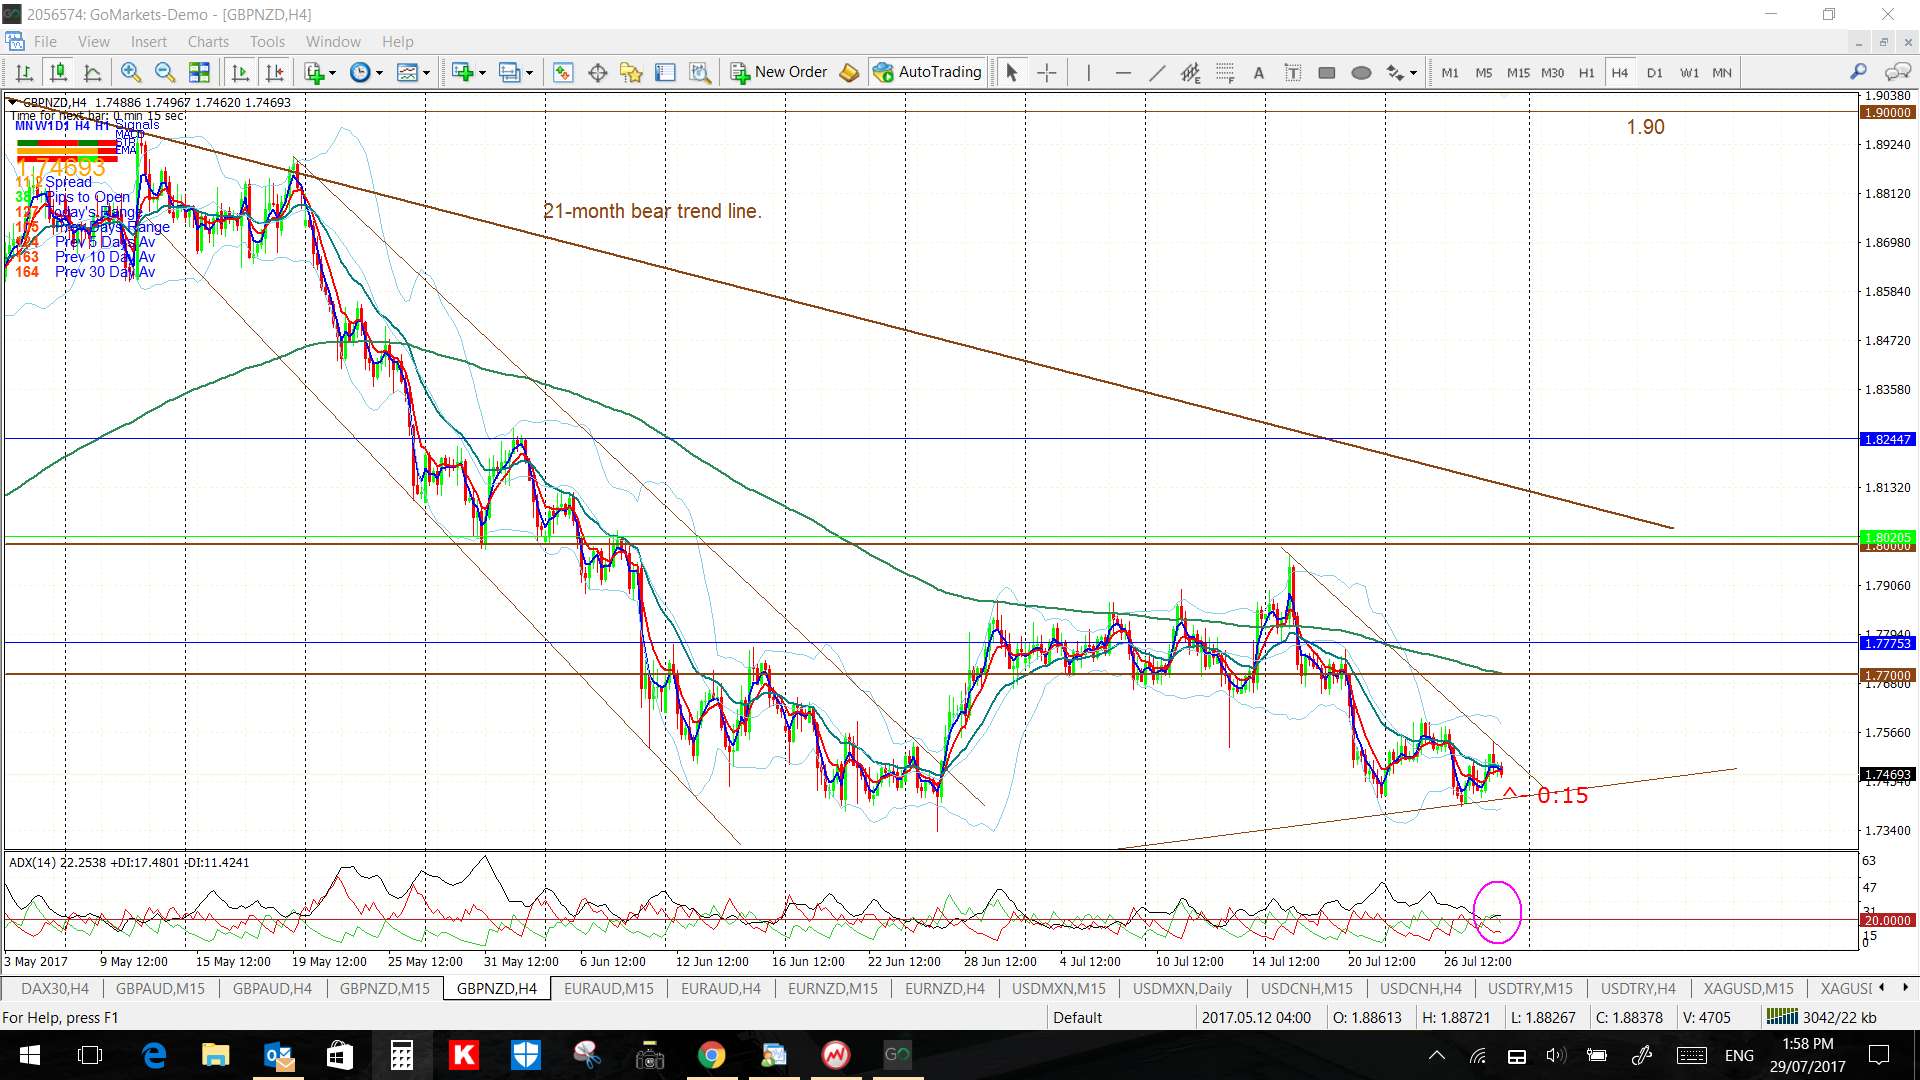
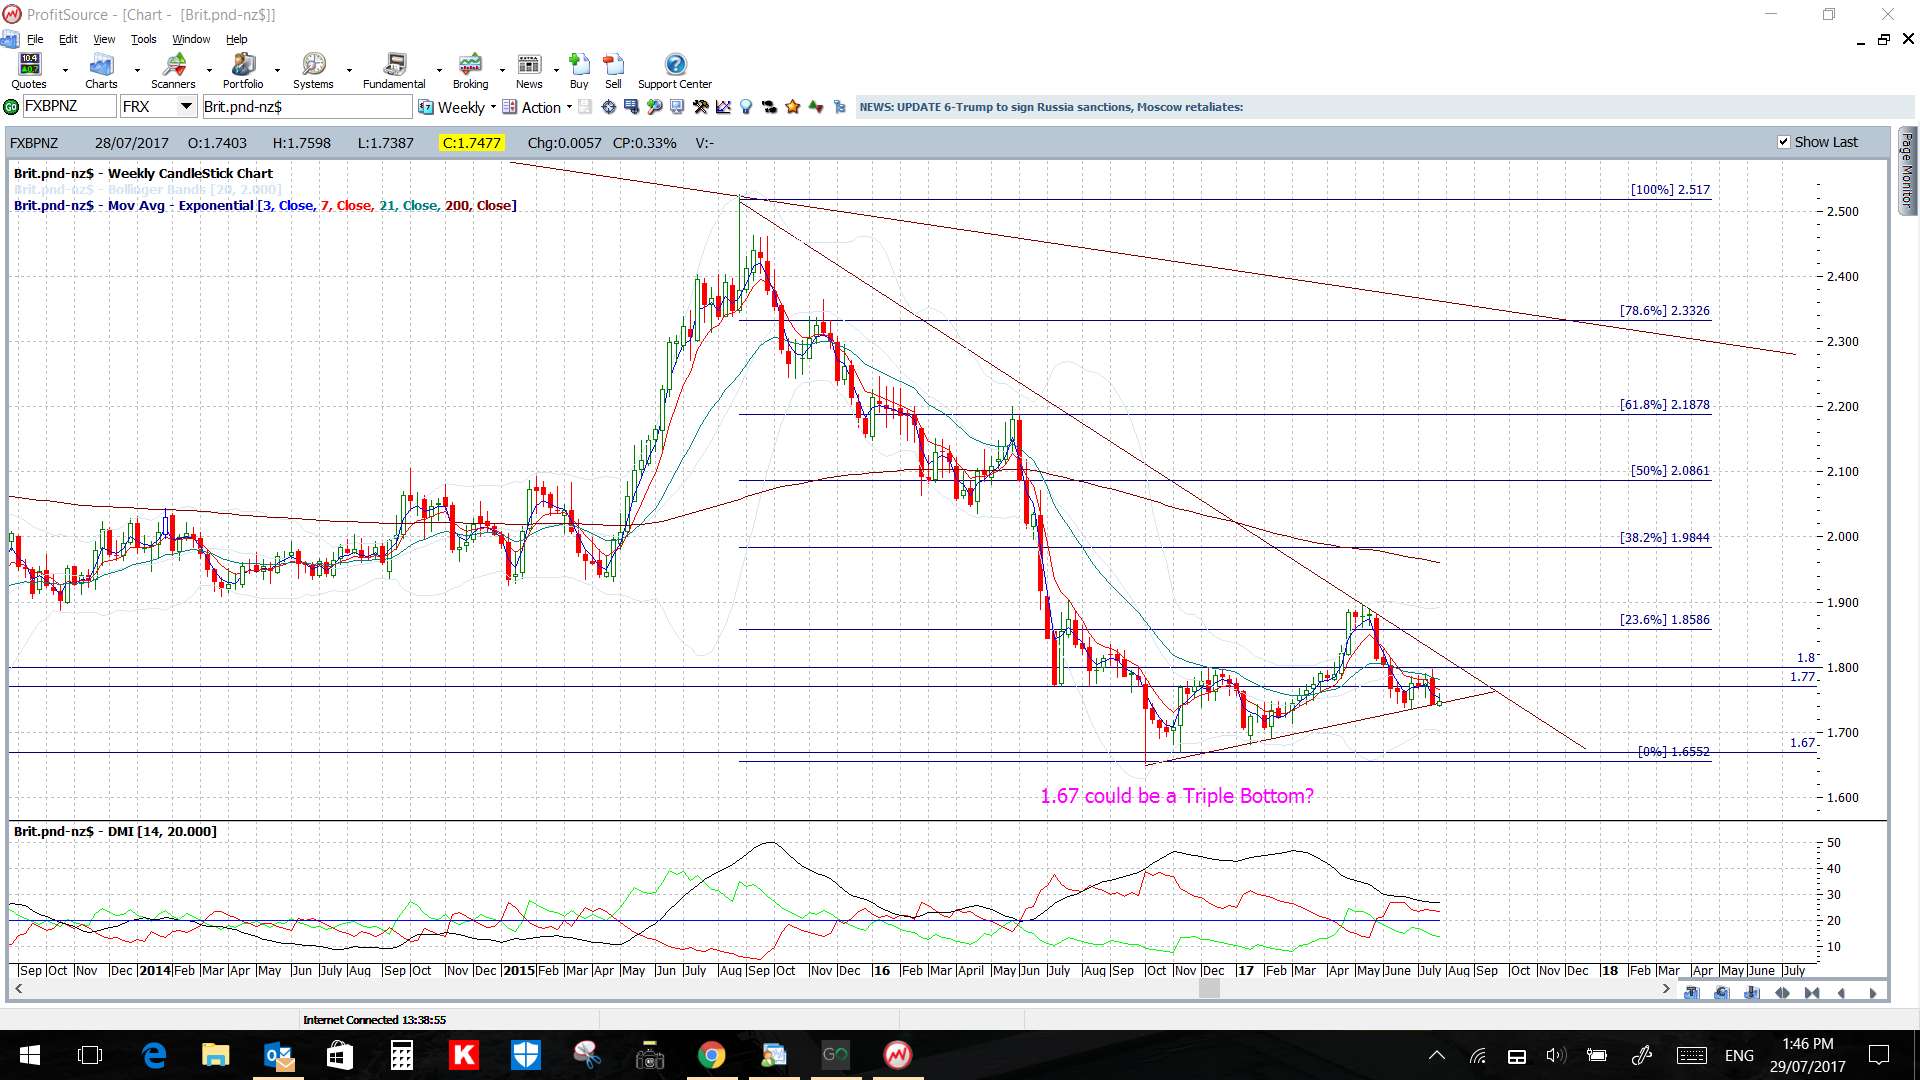
GBP/NZD: keep an eye on the 4hr chart trend lines for any new make or break:
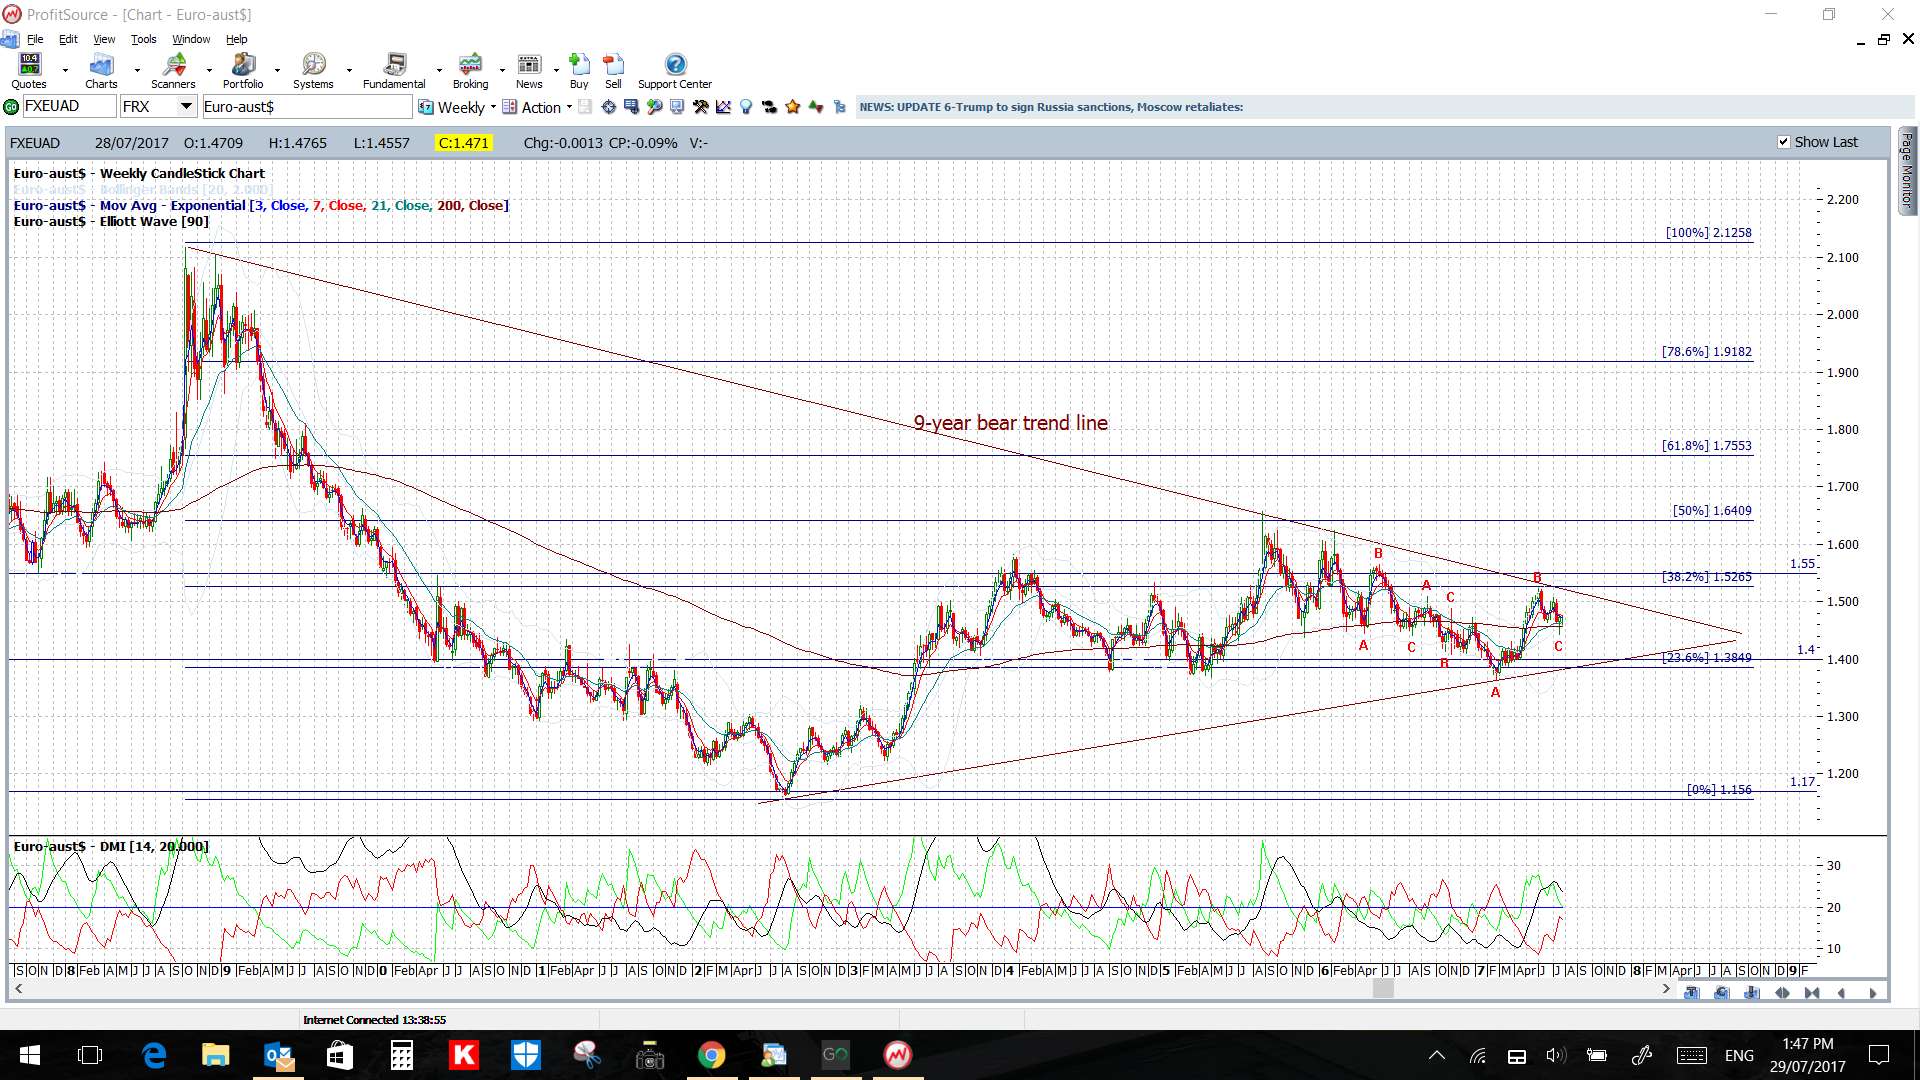
EUR/AUD: keep an eye on the 4hr chart trend lines for any new make or break:

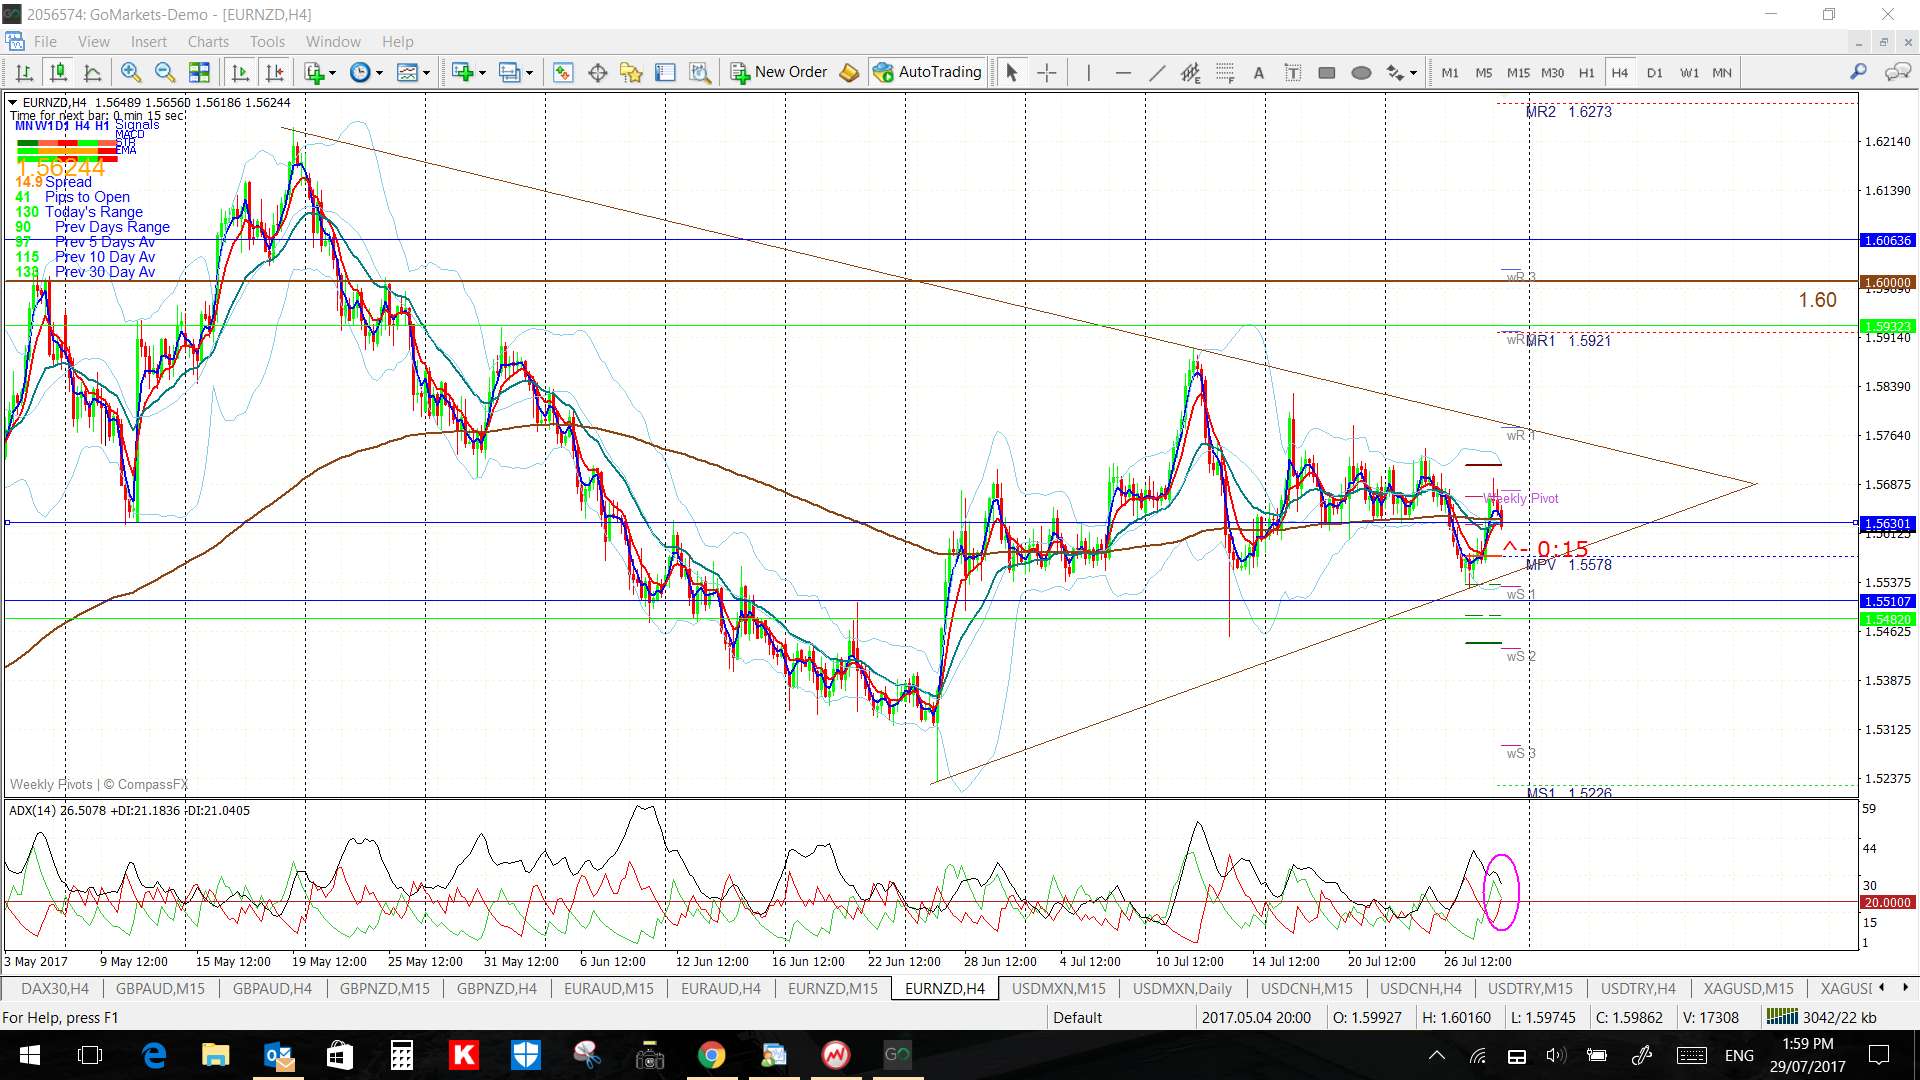
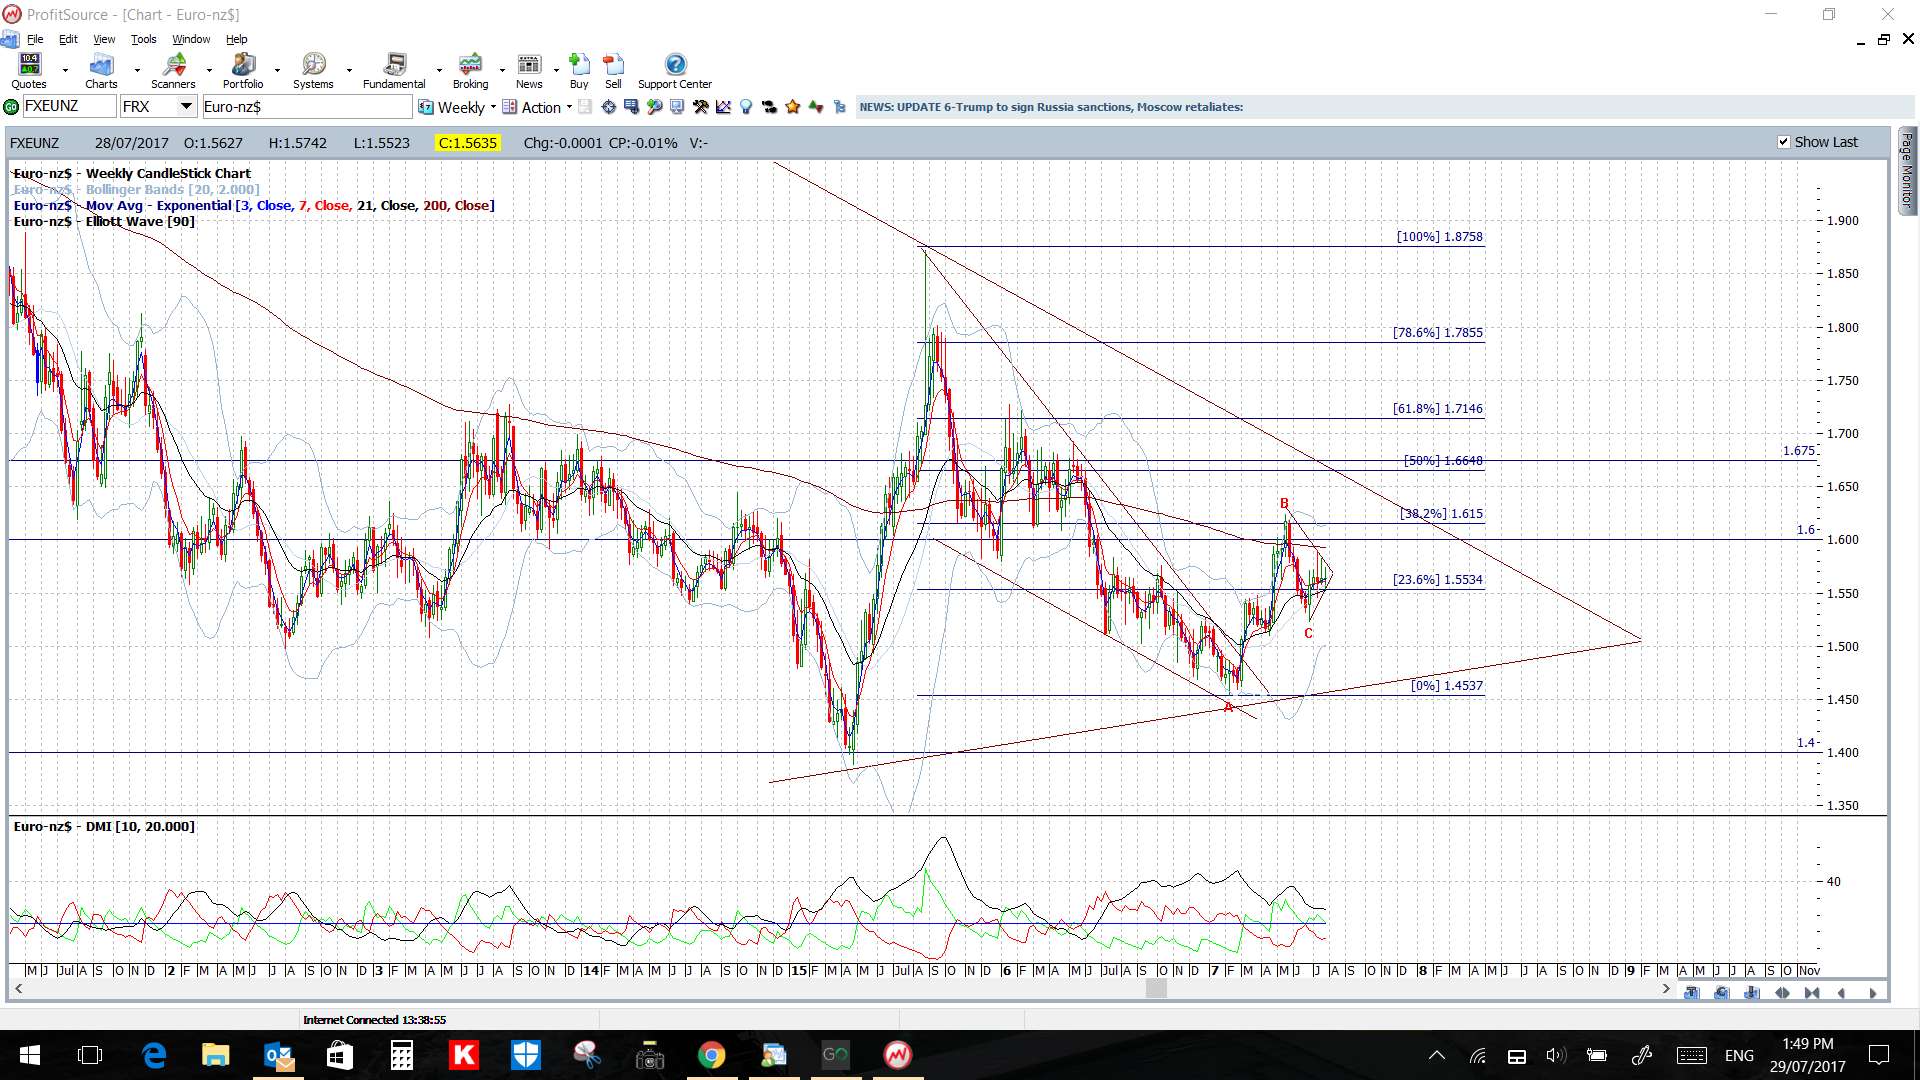
EUR/NZD: keep an eye on the 4hr chart trend lines for any new make or break:
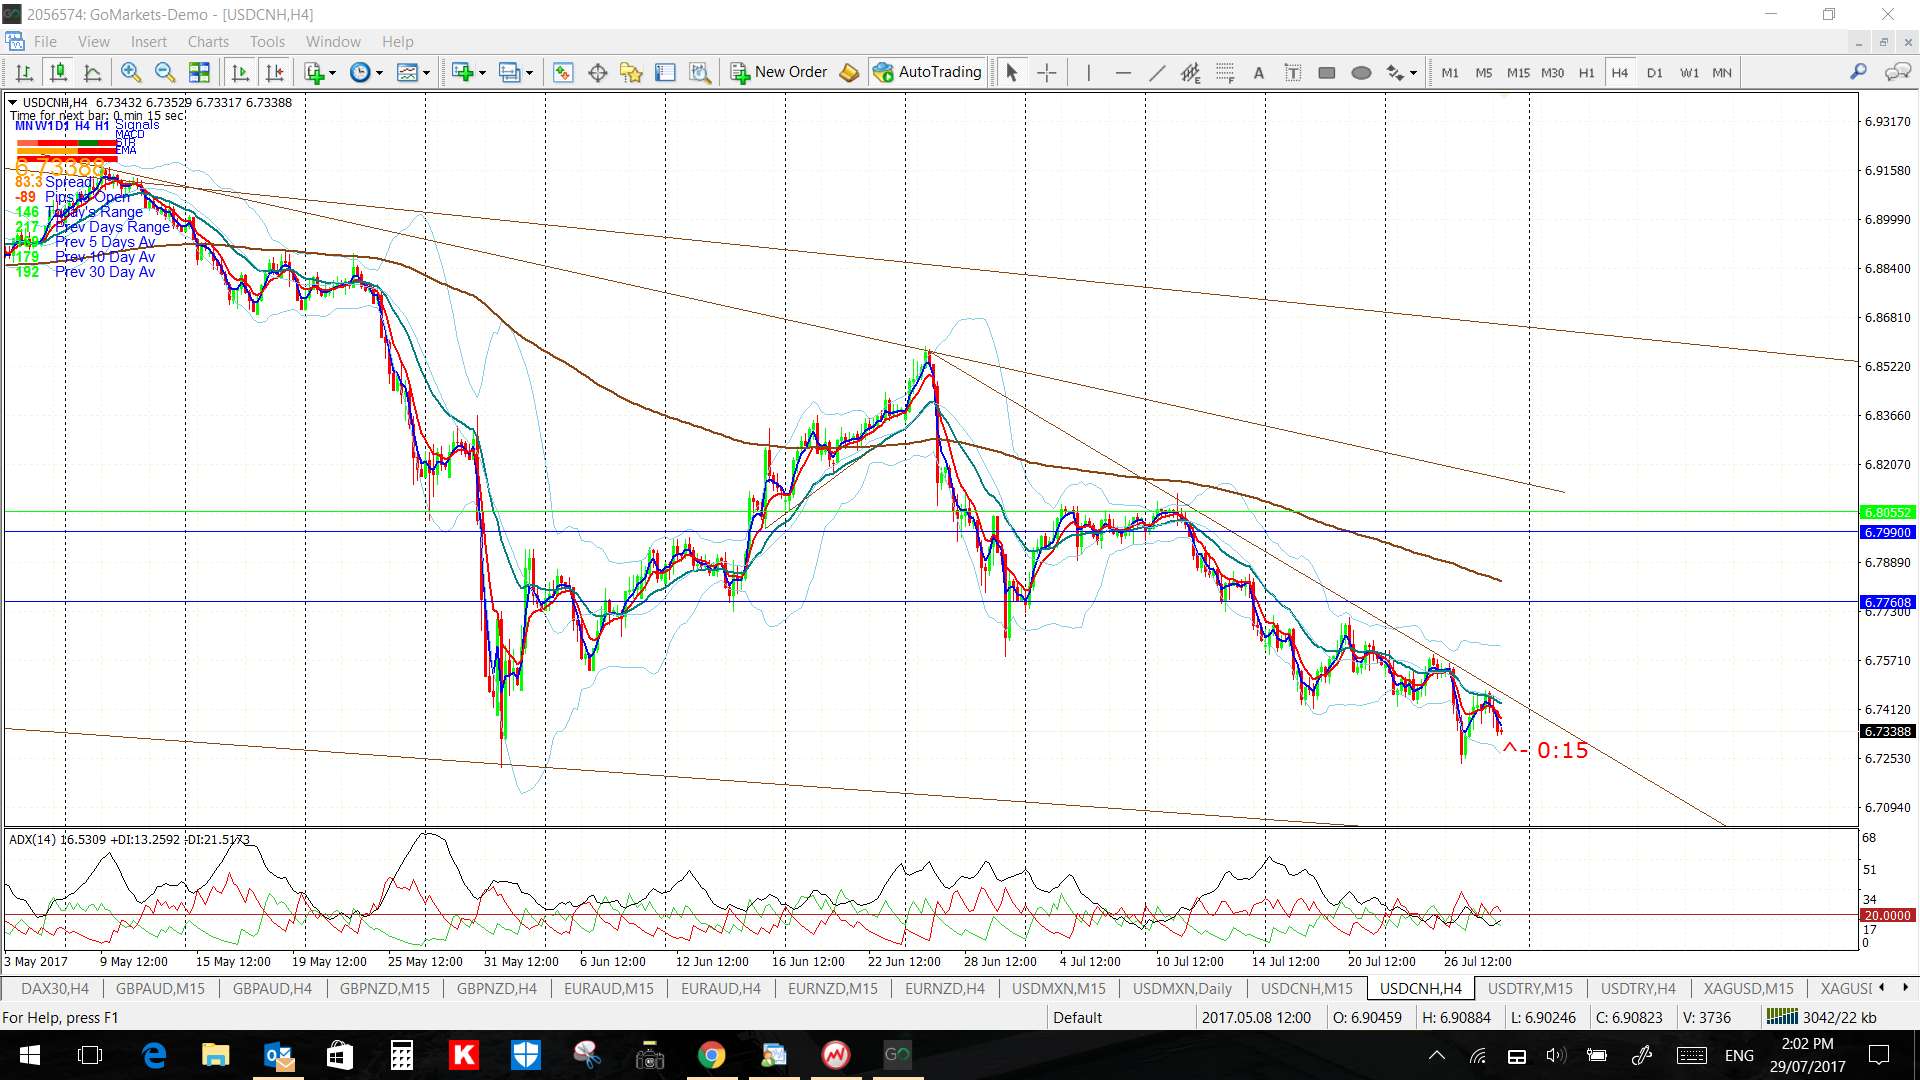
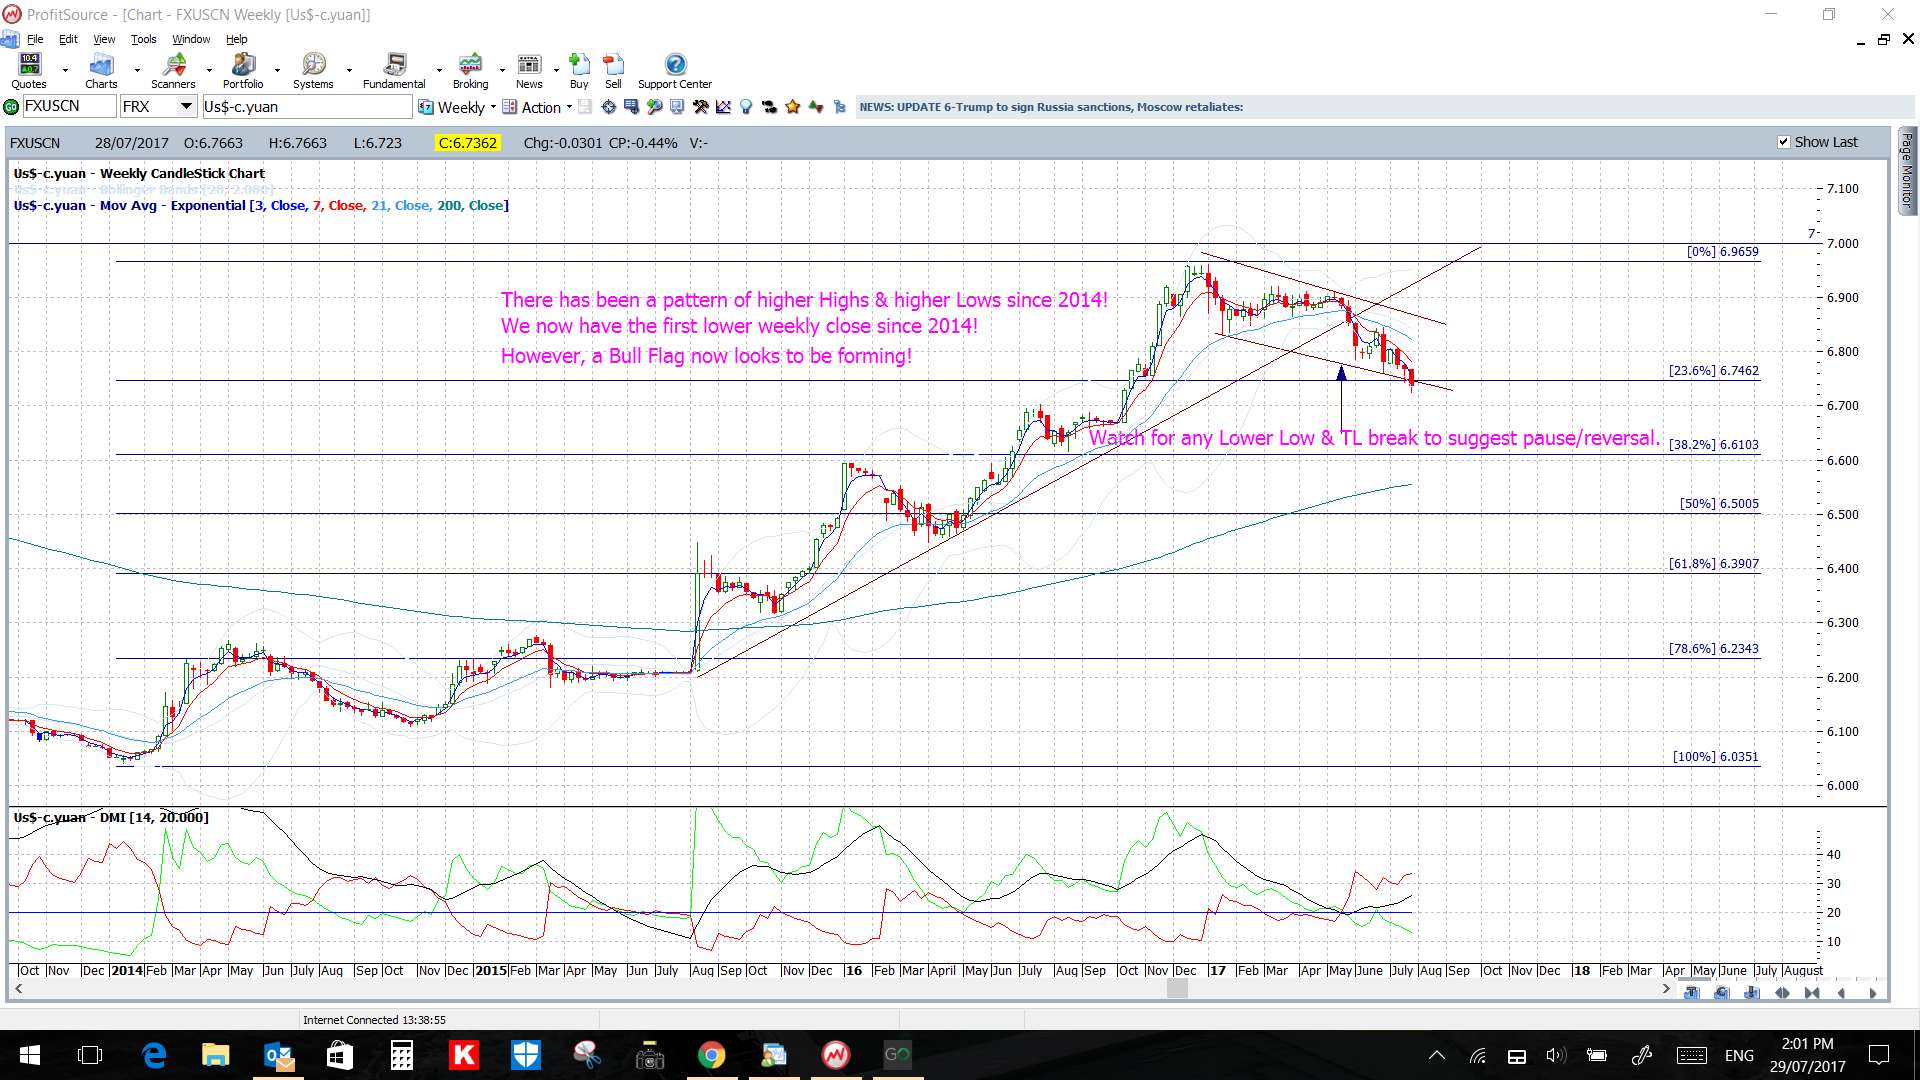
USD/CNH: keep an eye on the 4hr chart trend lines for any new make or break:
USD/TRY: keep an eye on the 4hr chart trend lines for any new make or break:

CAD/JPY: keep an eye on the 4hr chart trend lines and the 89 level for any new make or break:
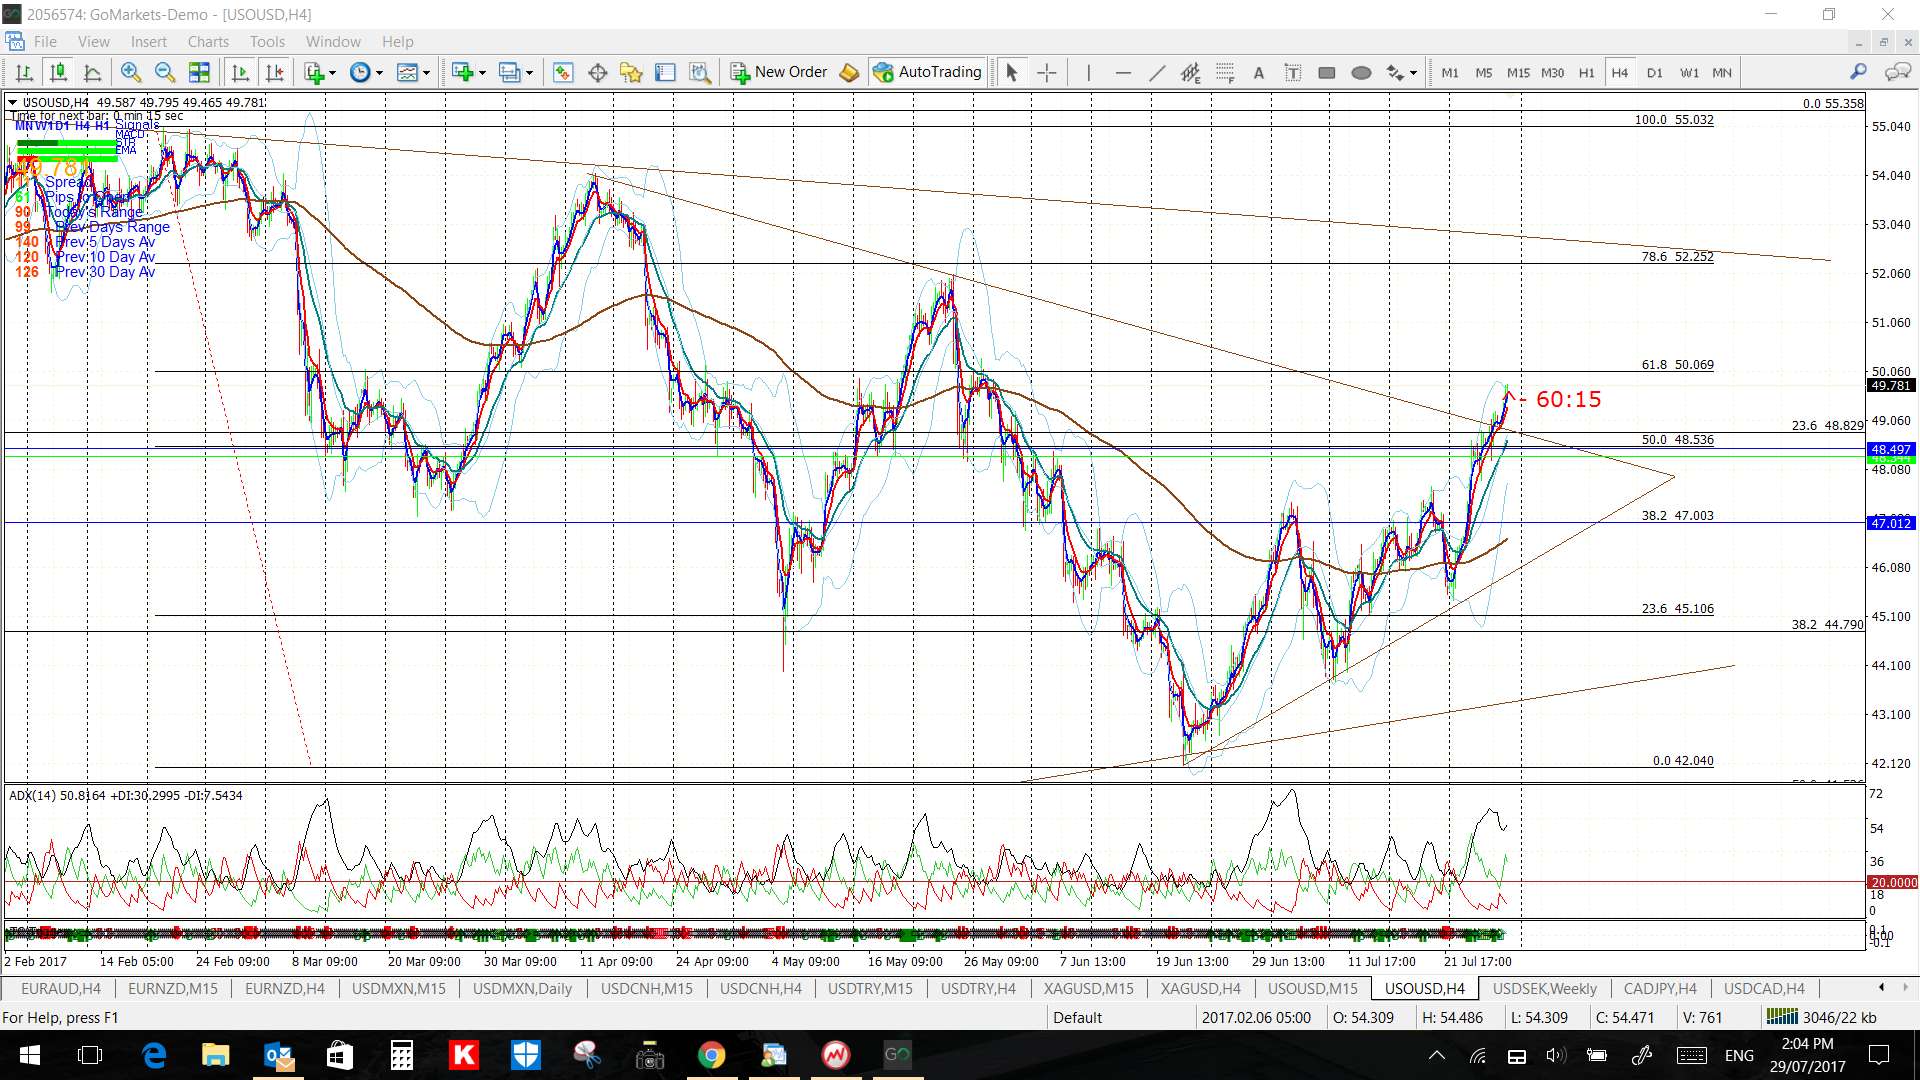
Oil: Oil has broken up and out from a recent 4hr chart triangle so watch for any continuation move up to test the next trend line; being the ‘neck line’ trend line derived from the weekly chart: