Last week: Trend line breakout moves continue to offer profitable trading opportunities but there were fewer that triggered last week compared to previous weeks. Yen strength characterised the end of last week and I’ll be watching to see if ‘flight to safety’ activity continues. Successful breakout trades were noted on the following:
- Gold: a b/o early in the week for 80 pips.
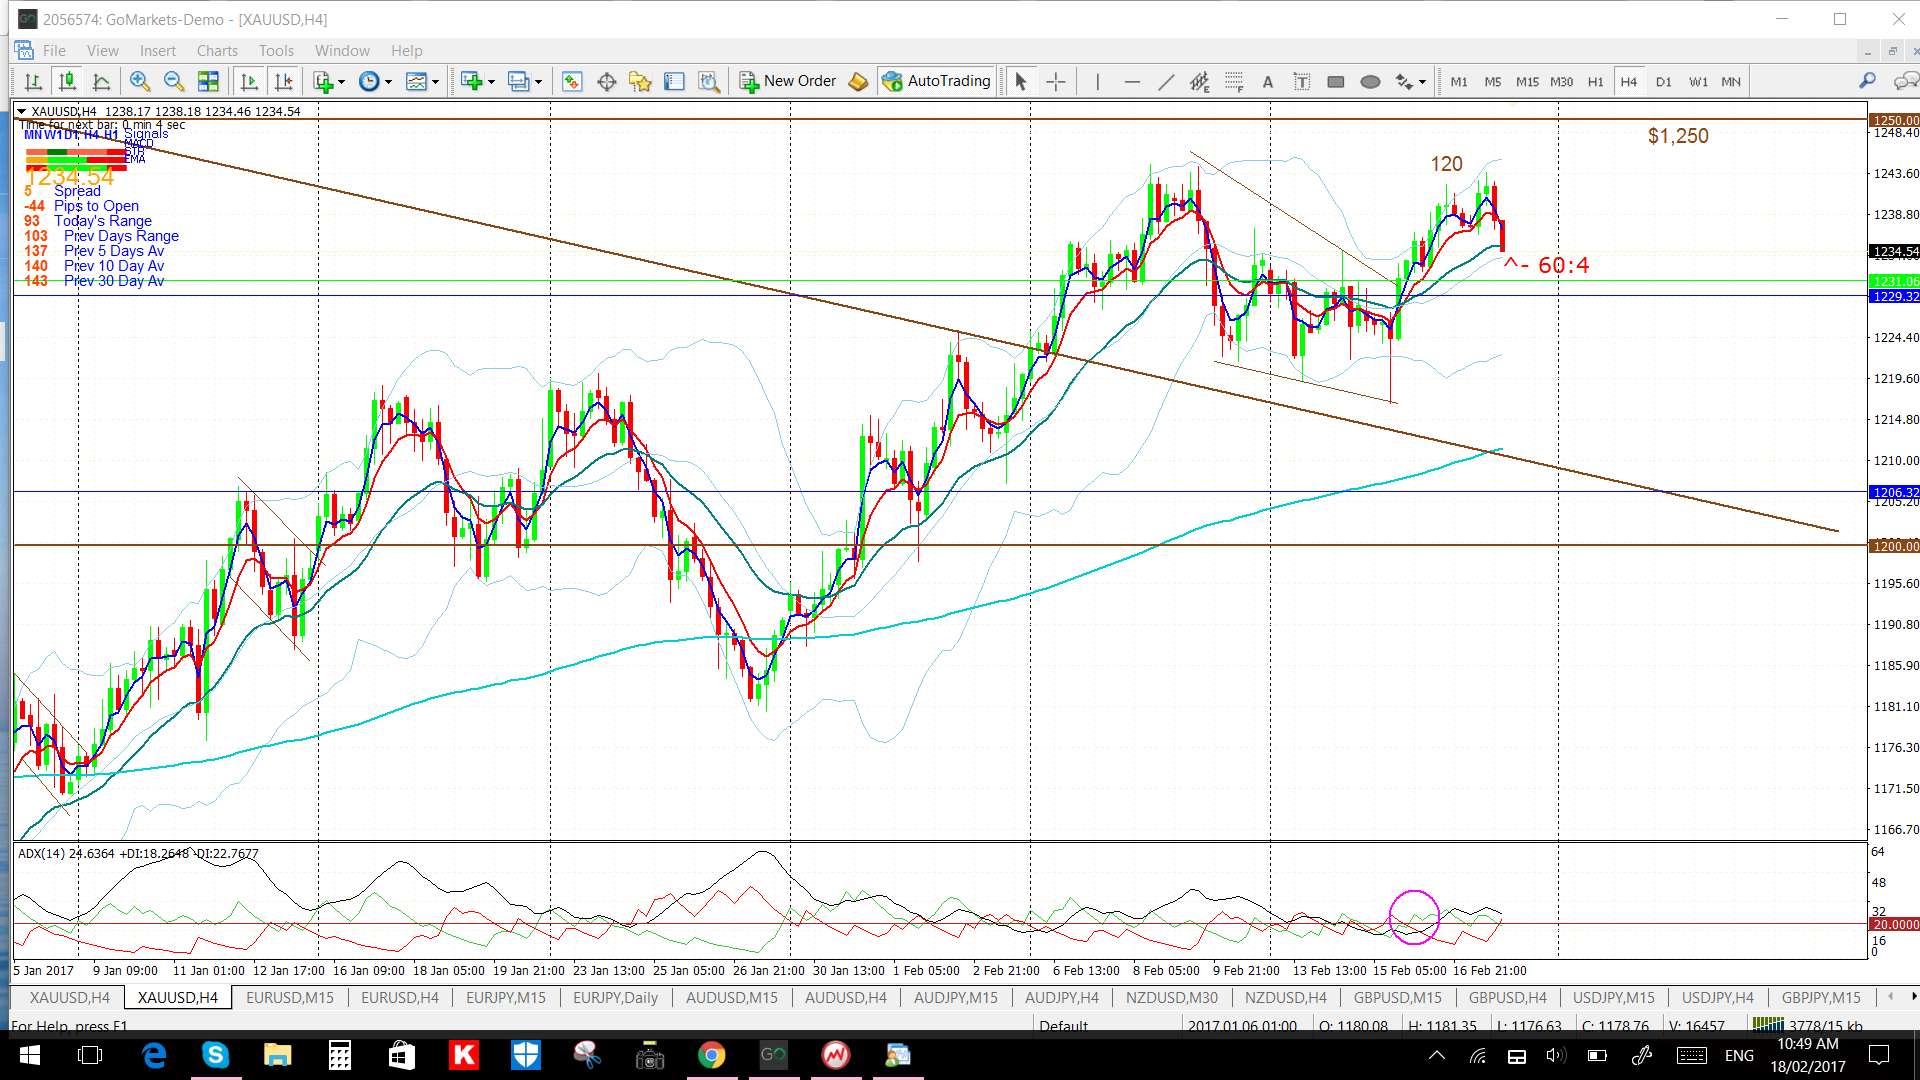
- Gold: another b/o later in the week for 120 pips before reversing (see chart later in this post).
- EUR/USD: for 70 pips.
This week:
Monday: is a holiday in the US with Presidents’ Day.
US$: range-bound activity on the US$ index is keeping many currency pairs choppy. A review of the US$ index can be found through this link.
Indecision candles: there were a lot of indecision-style candles printed last week which, given the state of the US$ index, isn’t surprising. There were:
- Spinning Top candles printed on the GBP/JPY, GBP/USD, NZD/USD and the EURX.
- Doji candles printed on the AUD/USD, EUR/USD, USD/CAD, Gold and the USDX.
USD/TRY: this pair is shaping up for a potential wedge breakout and well worth watching. It is often noted that the best trends come after periods of sideways congestion and this wedge has been in play for over 5 weeks. A review of this pair can be found through the following link.
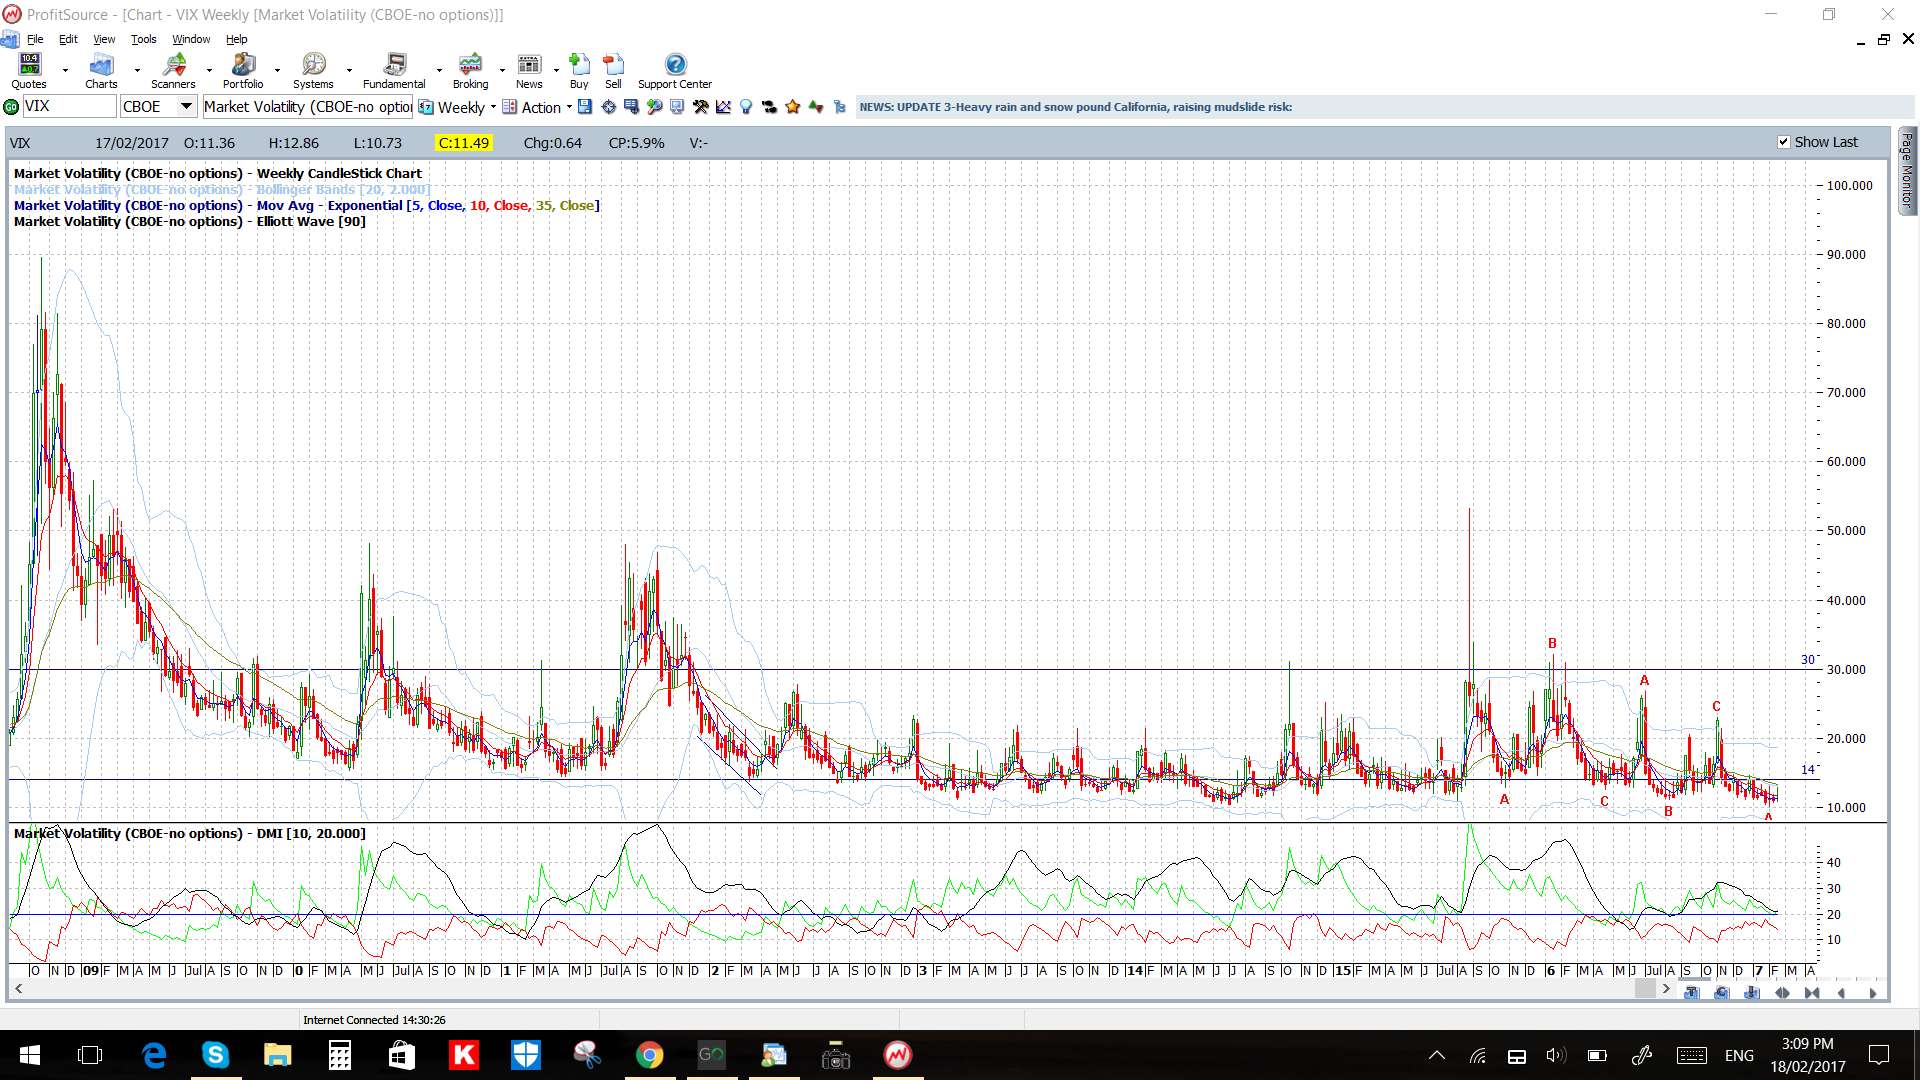
VIX: The fear index is still trading at a low level:
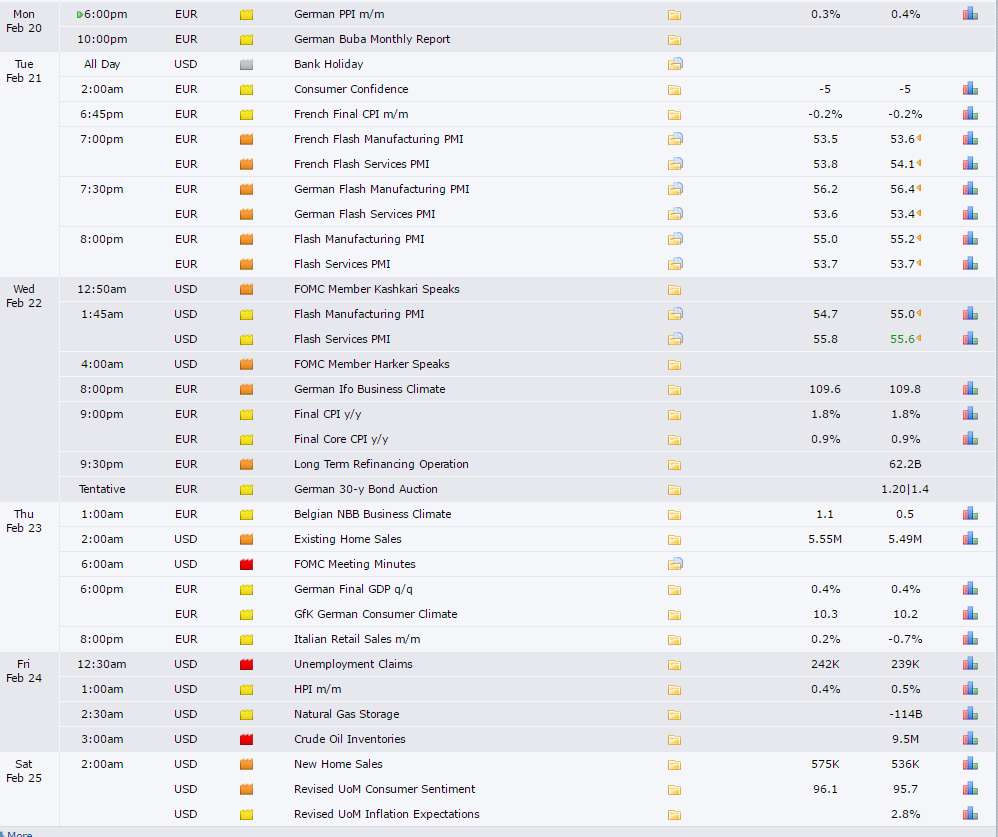
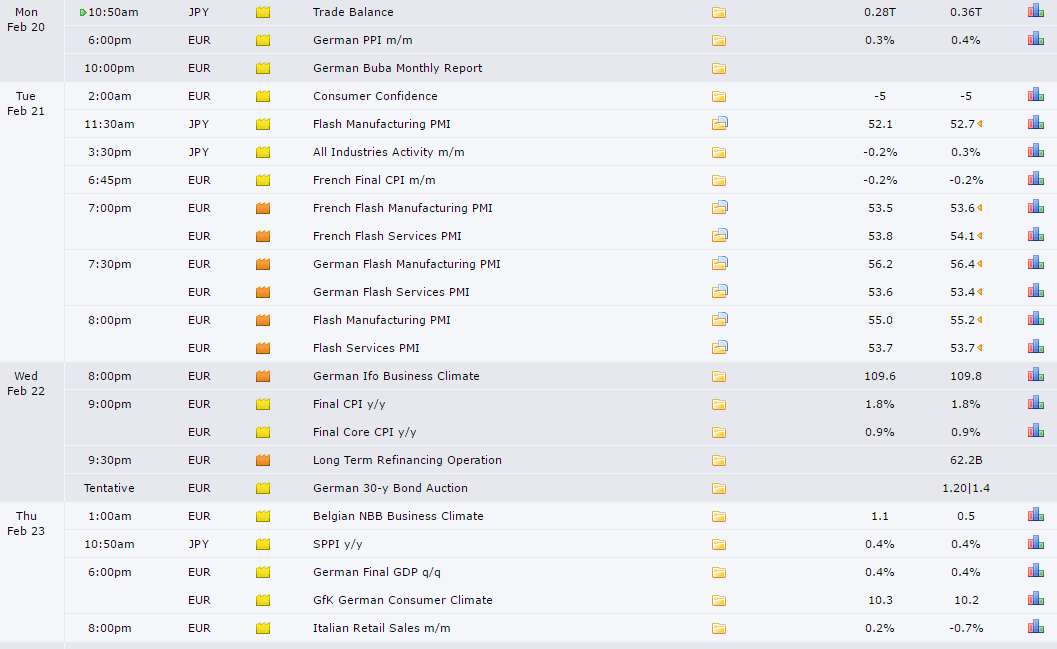
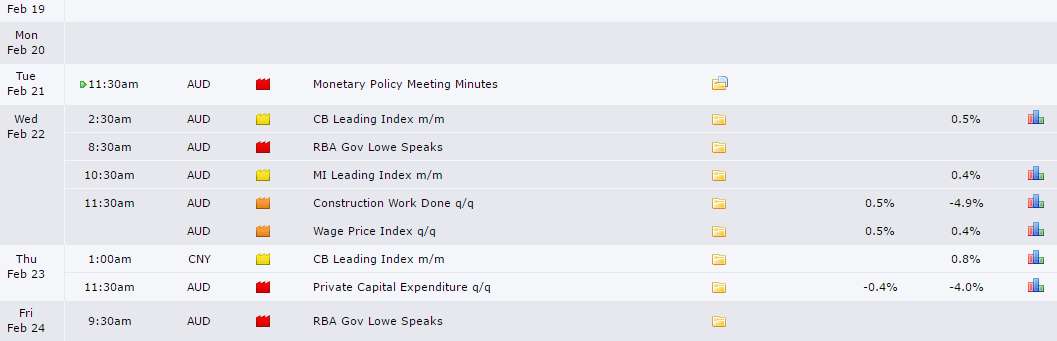
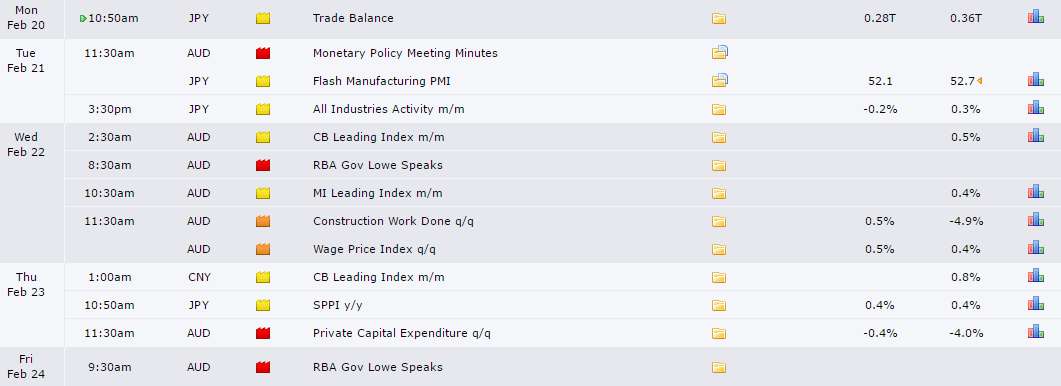
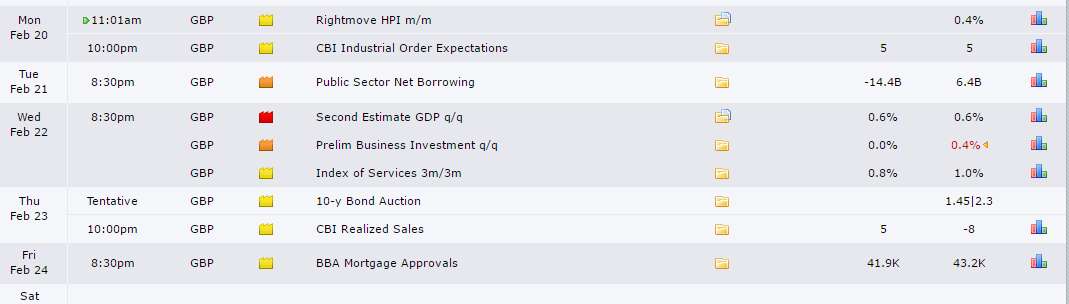
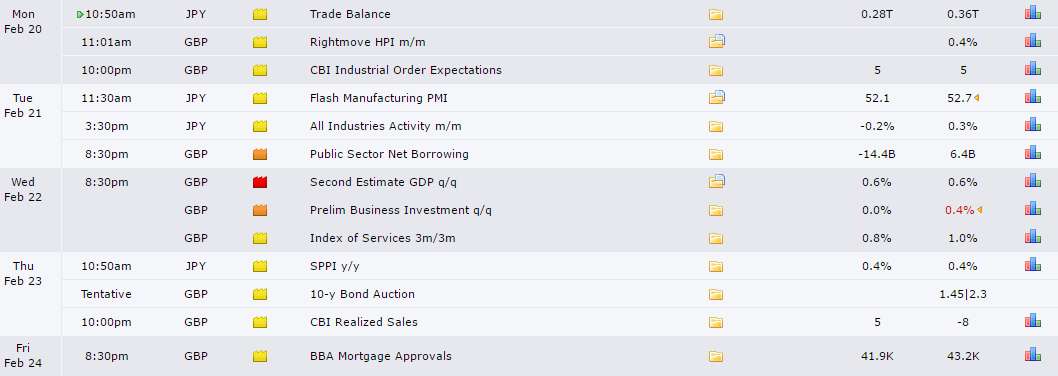
Calendar: High Impact data items to monitor:
- Mon 20th: USD Bank Holiday. NZD PPI.
- Tue 21st: AUD Monetary Policy Meeting Minutes. NZD GDT Price Index (lots of second tier EUR PMIs)
- Wed 22nd: AUD RBA Gov Lowe speaks. GBP Second Estimates GDP. CAD Retail Sales. USD FOMC Meeting Minutes.
- Thurs 23rd: AUD Private Capital Expenditure. USD Weekly Unemployment Claims & Crude Oil Inventories.
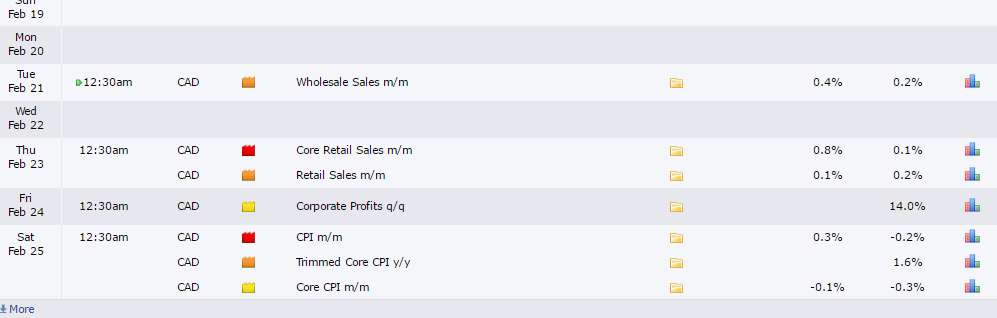
- Fri 24th: AUD RBA Gov Lowe speaks. CAD CPI.
Forex:
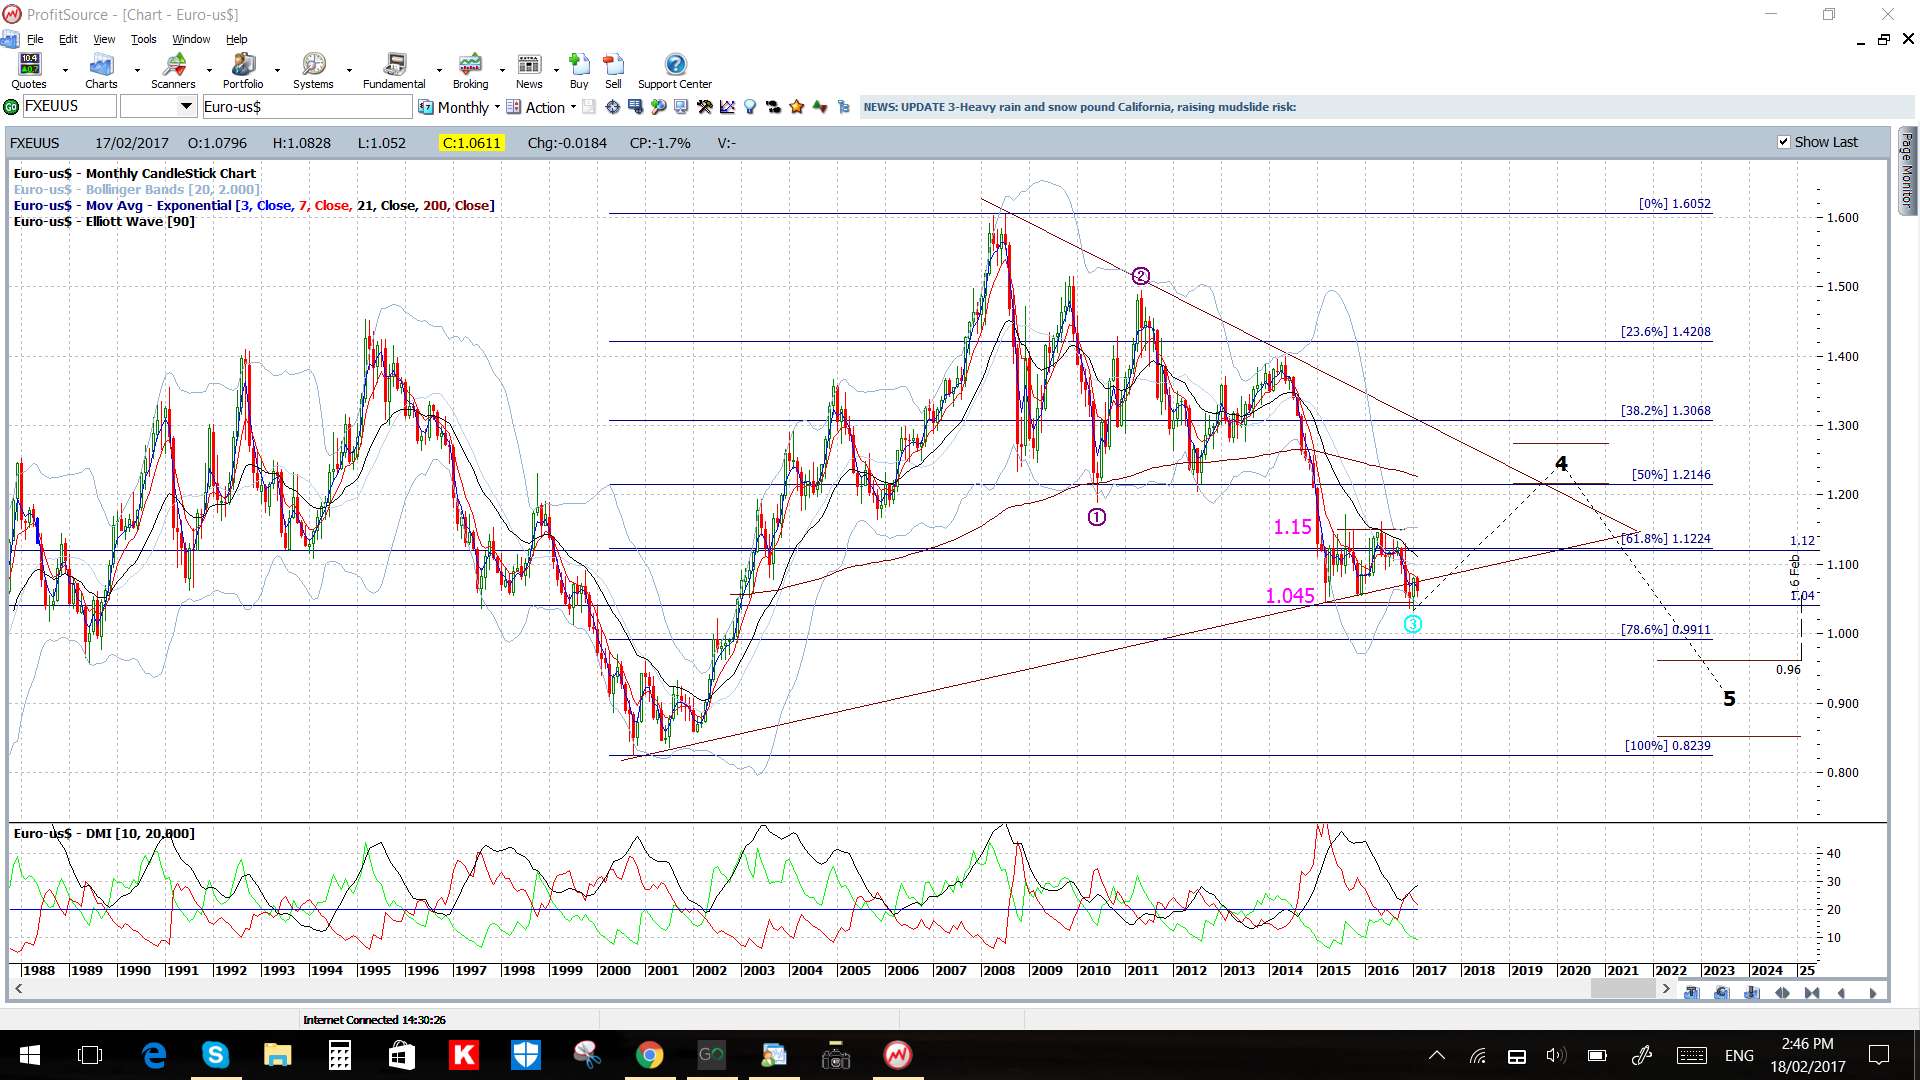
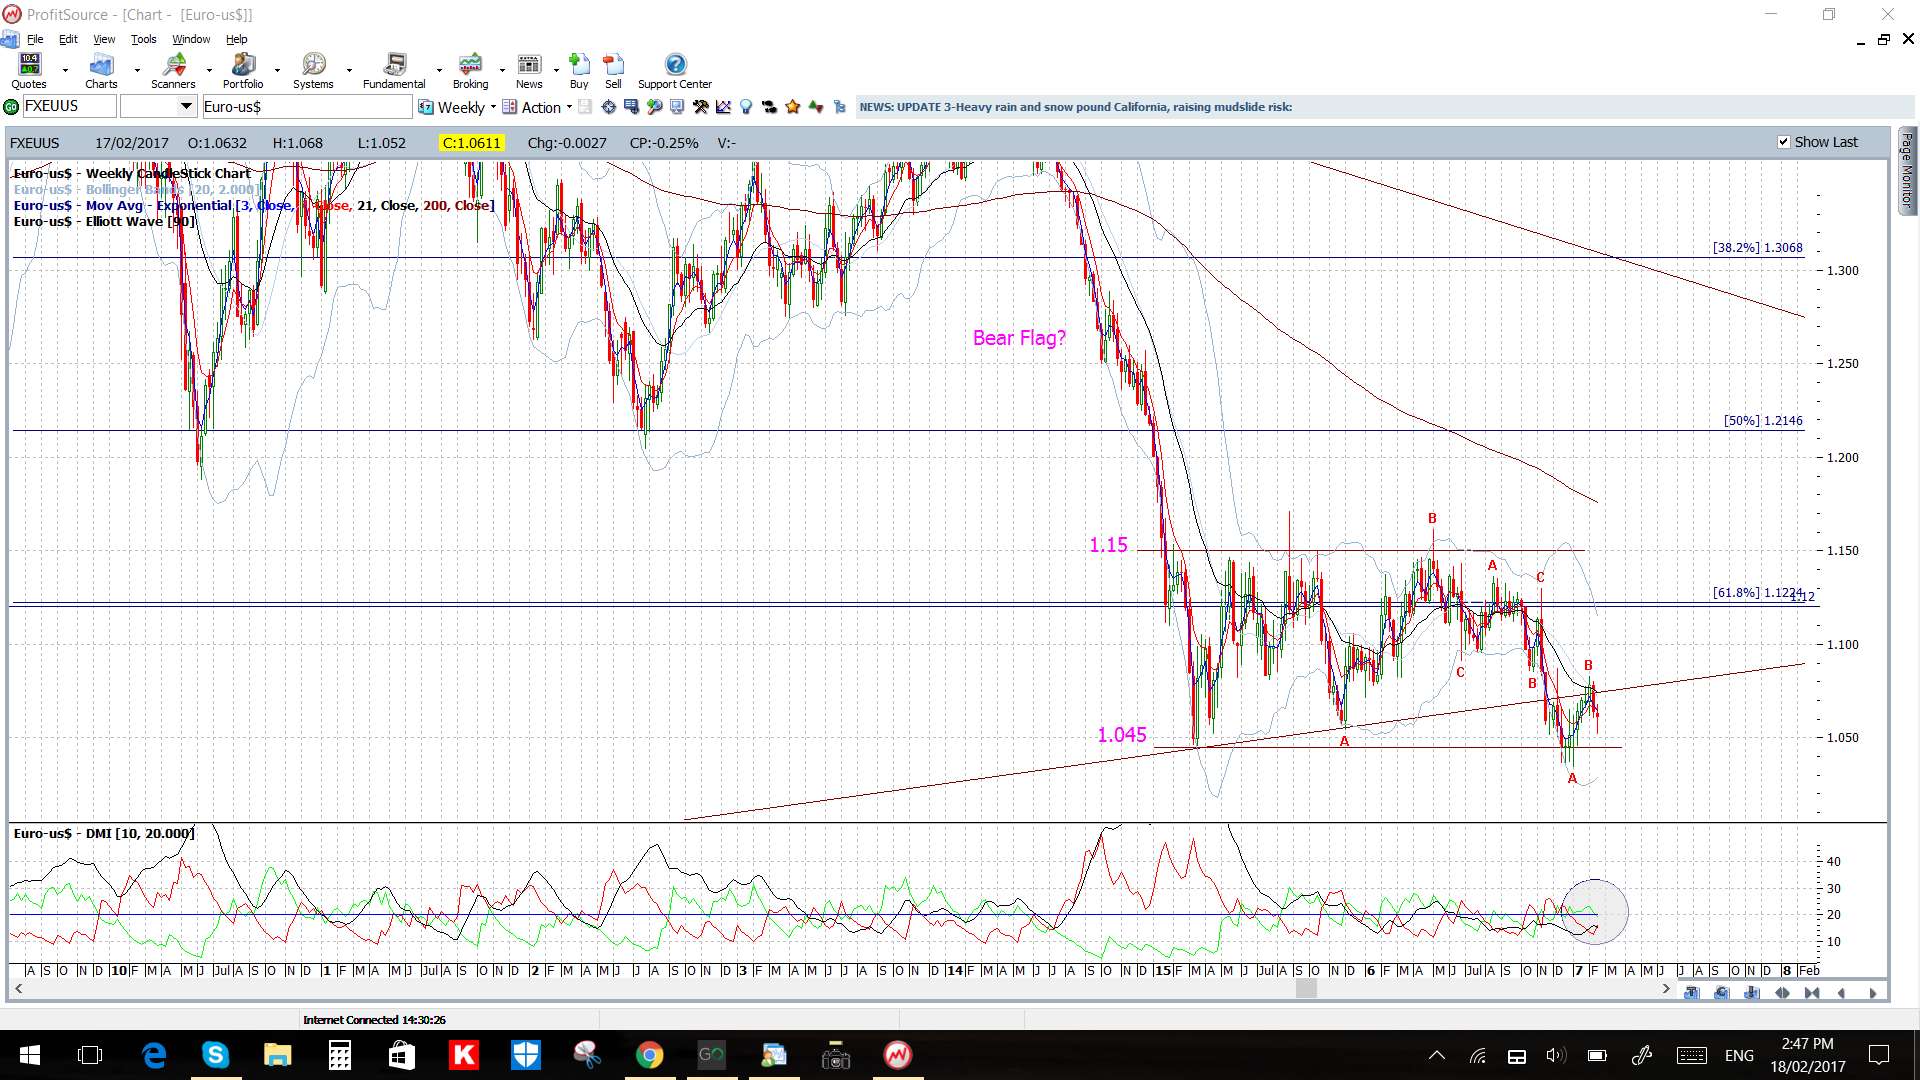
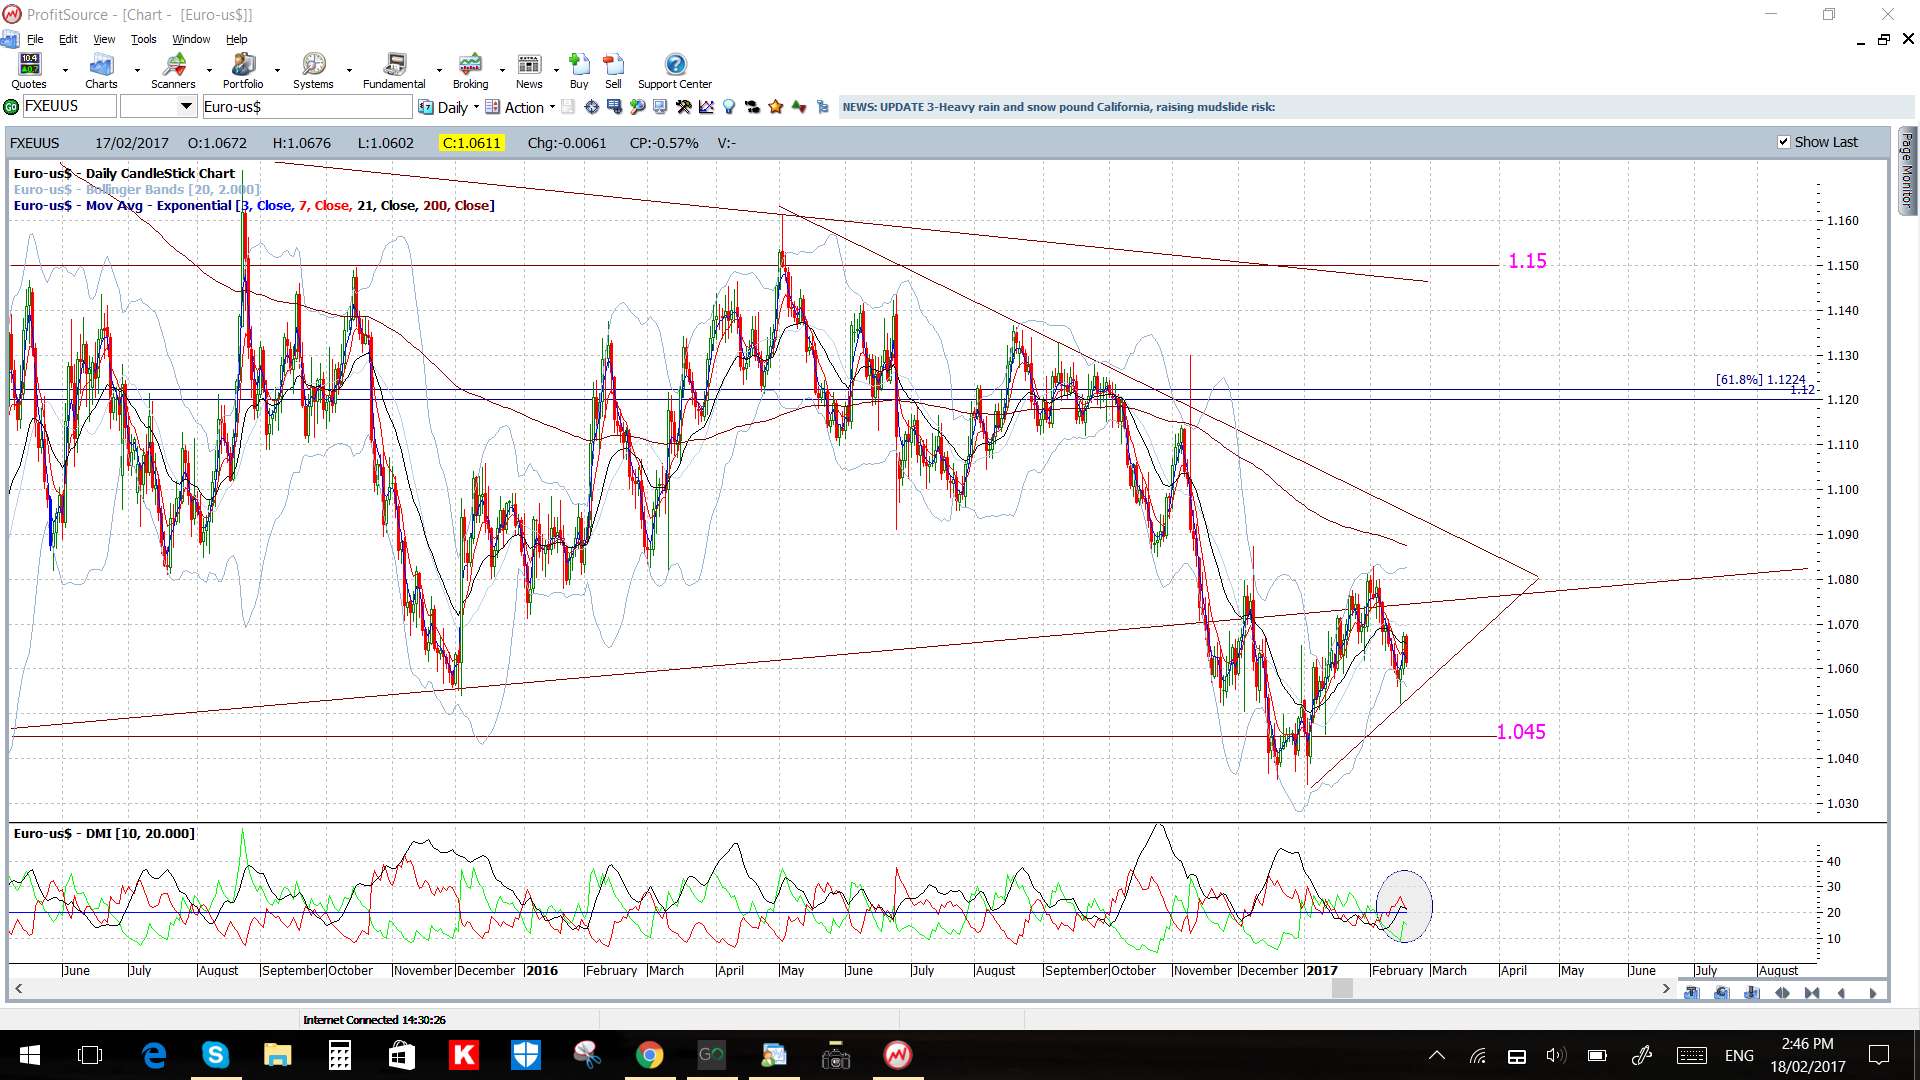
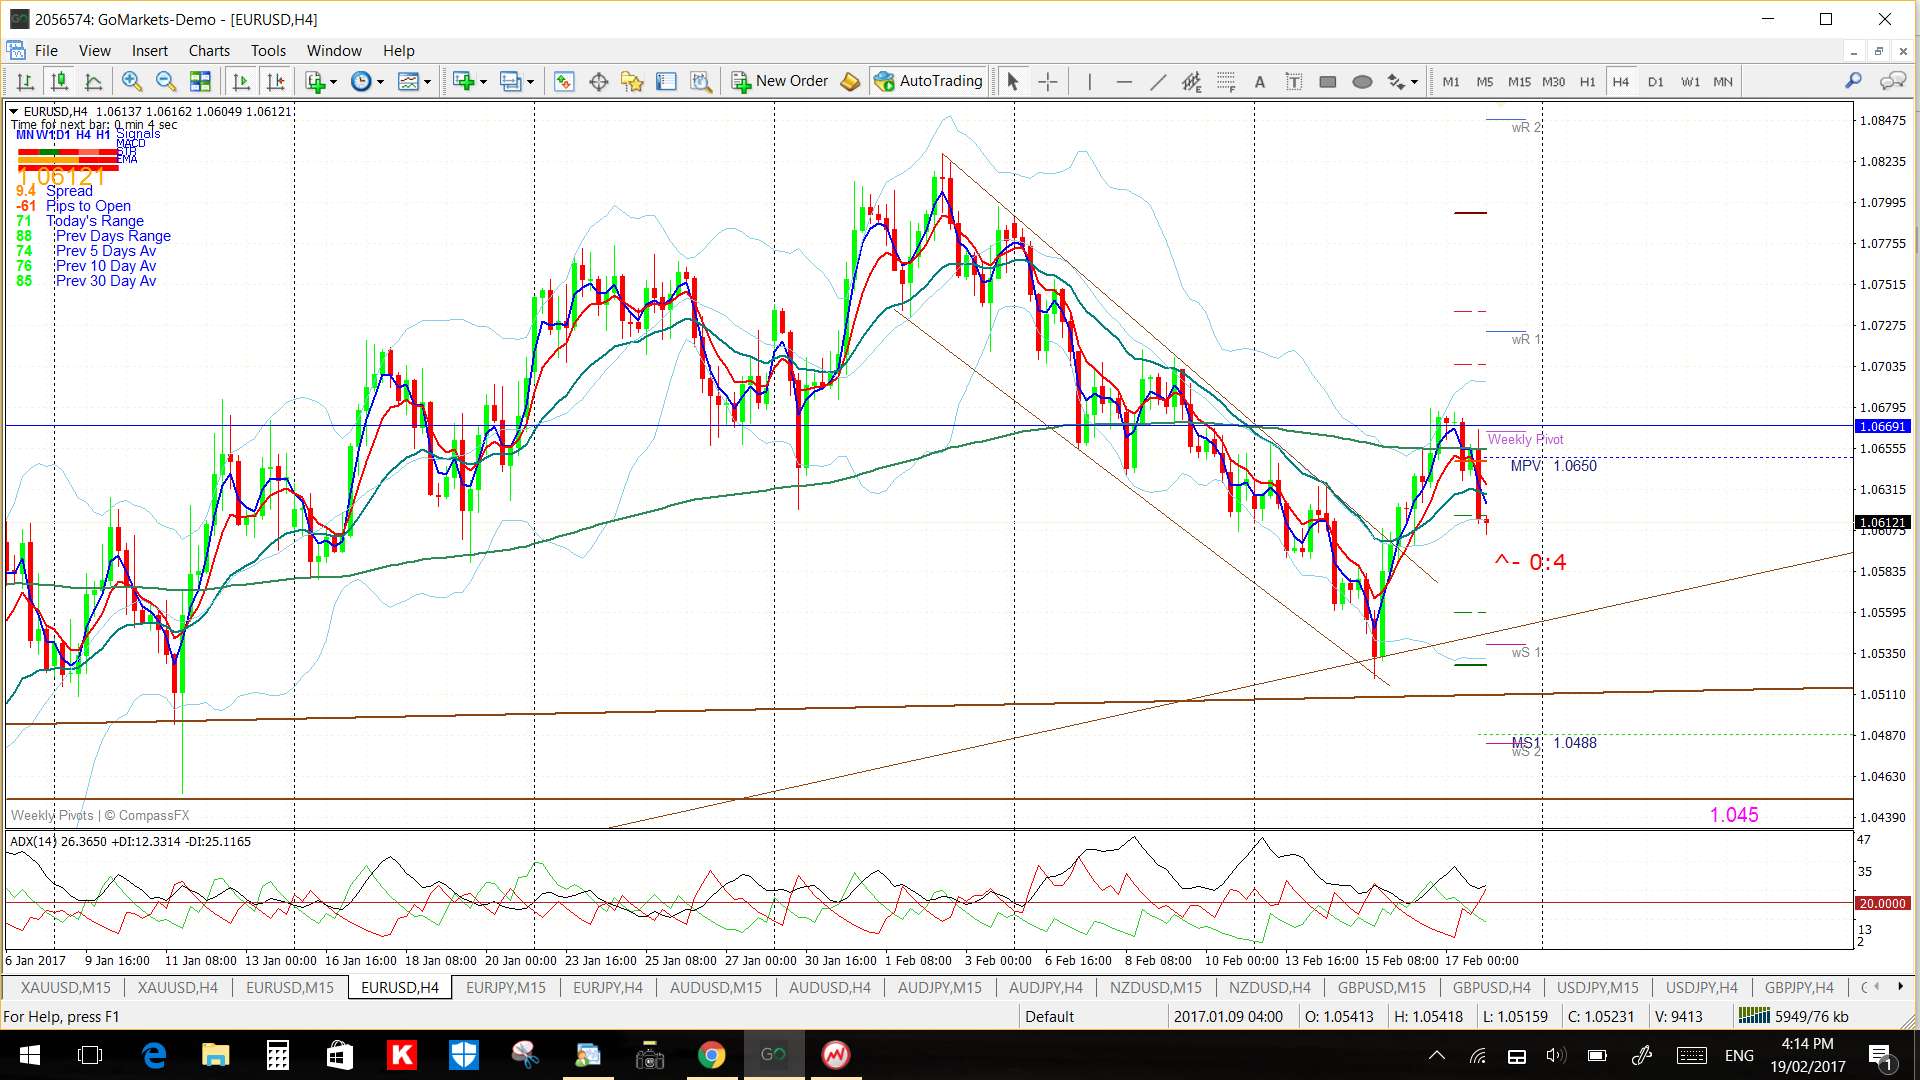
EUR/USD: This pair has pretty much been trading at the mercy of US$ flows and is back within a daily chart triangle.
Price is below the 4hr Cloud but in the daily Cloud.
The weekly candle closed as a bearish coloured Doji reflecting indecision.
There isn’t any high impact EUR data and there are just a few items for the US$, however, there is a lot of second and third tier data:
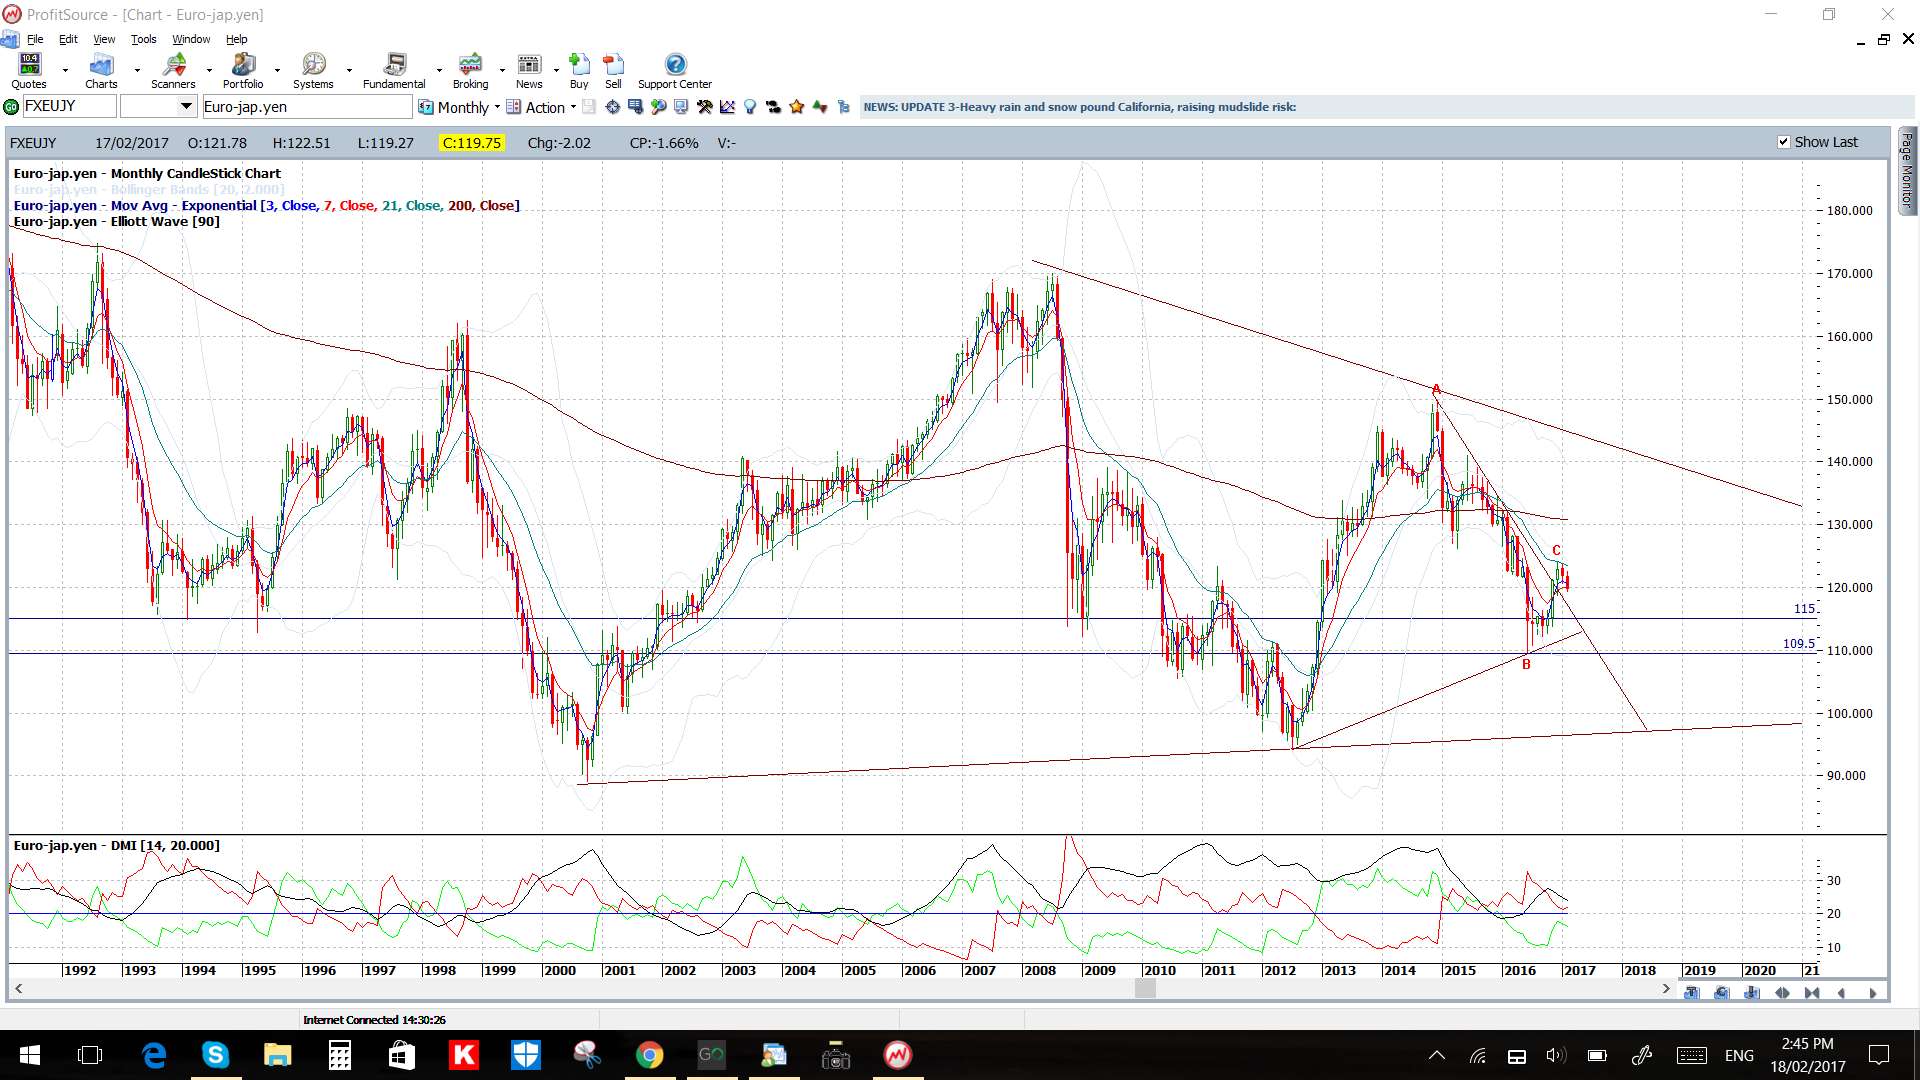
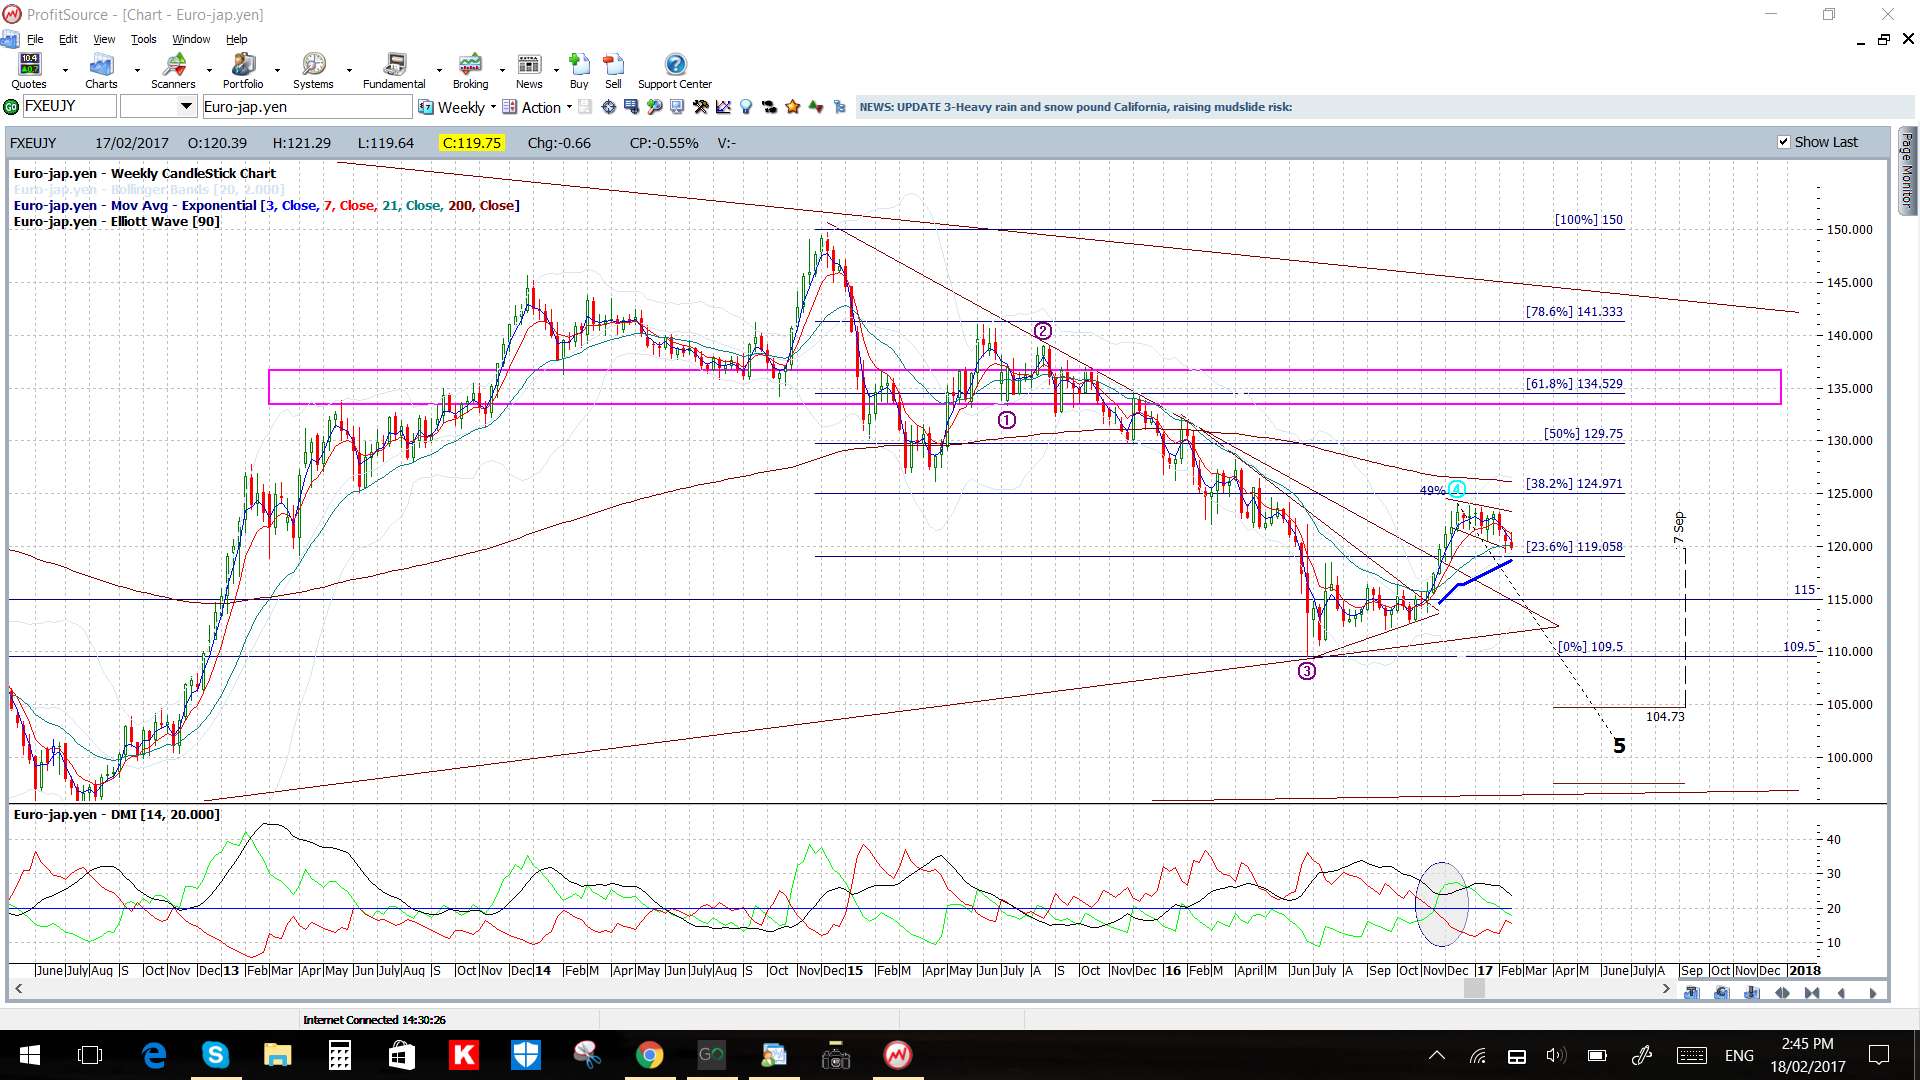
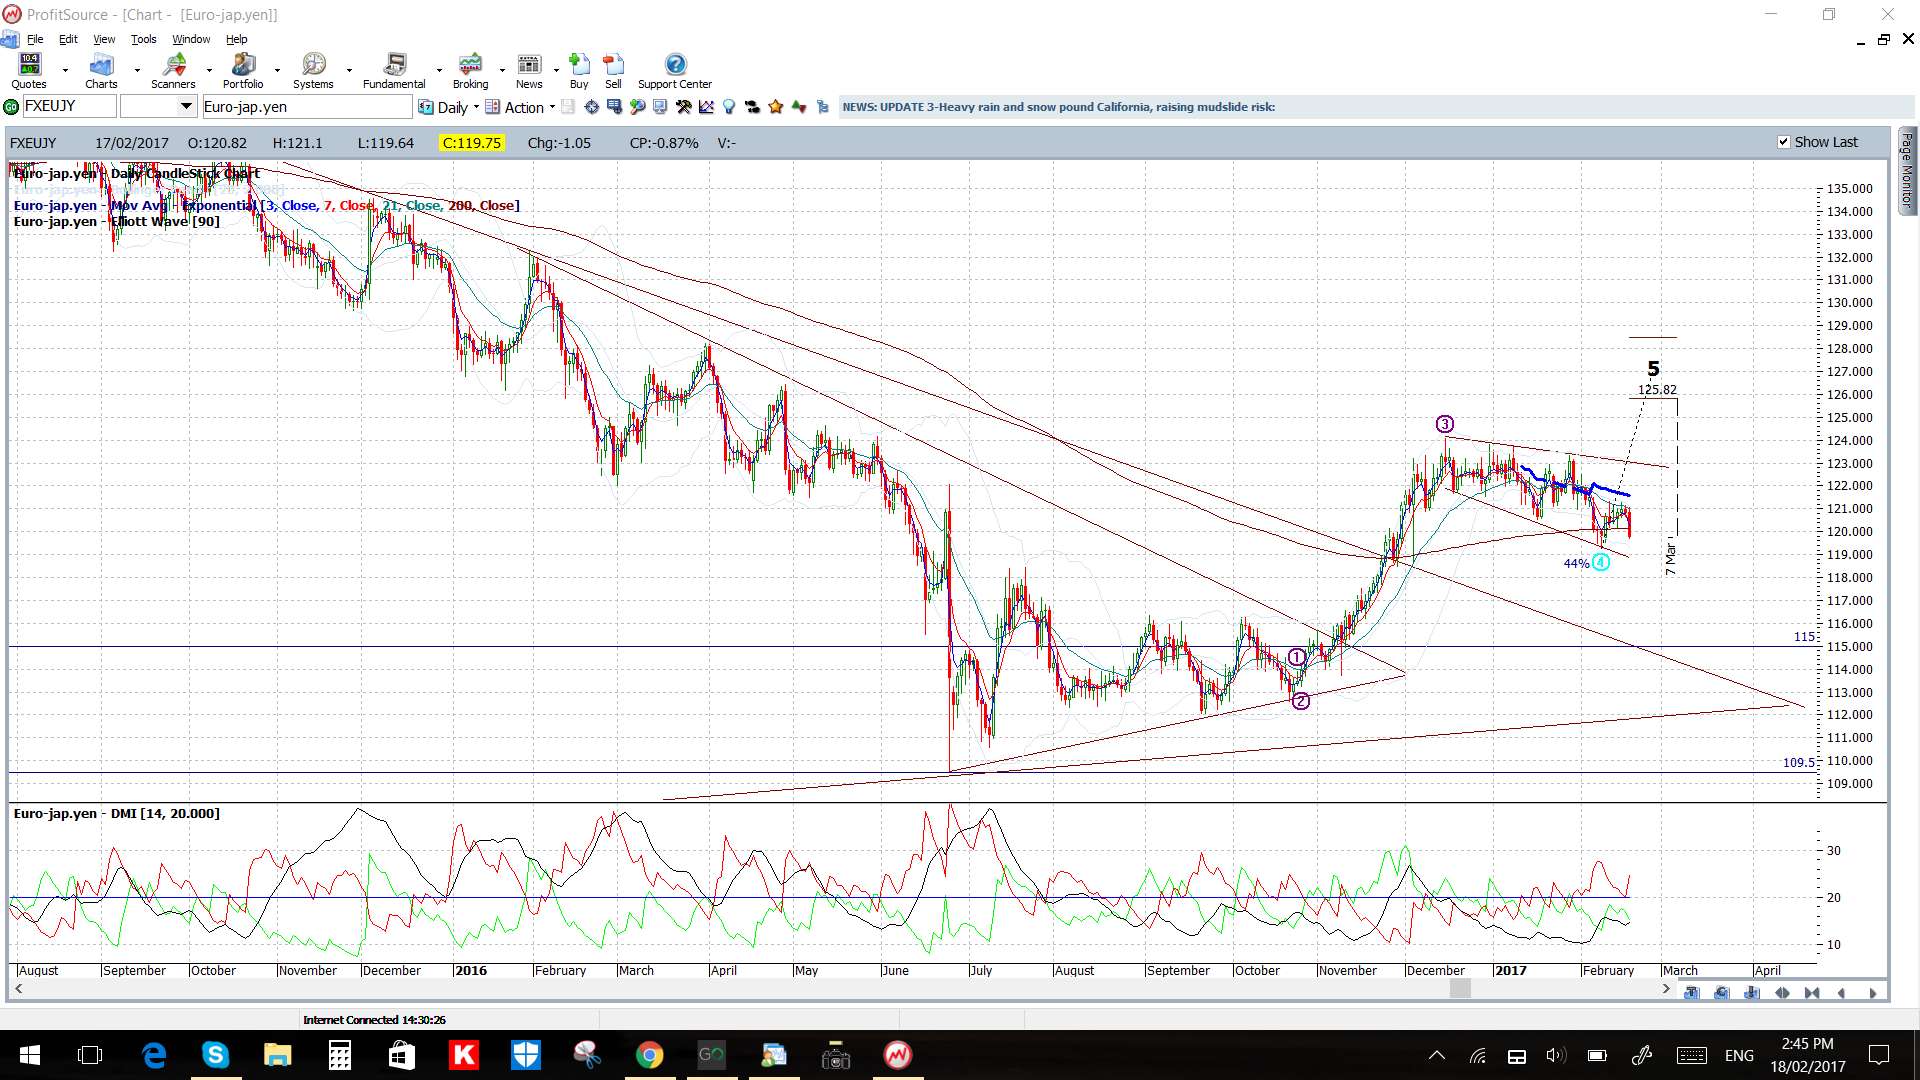
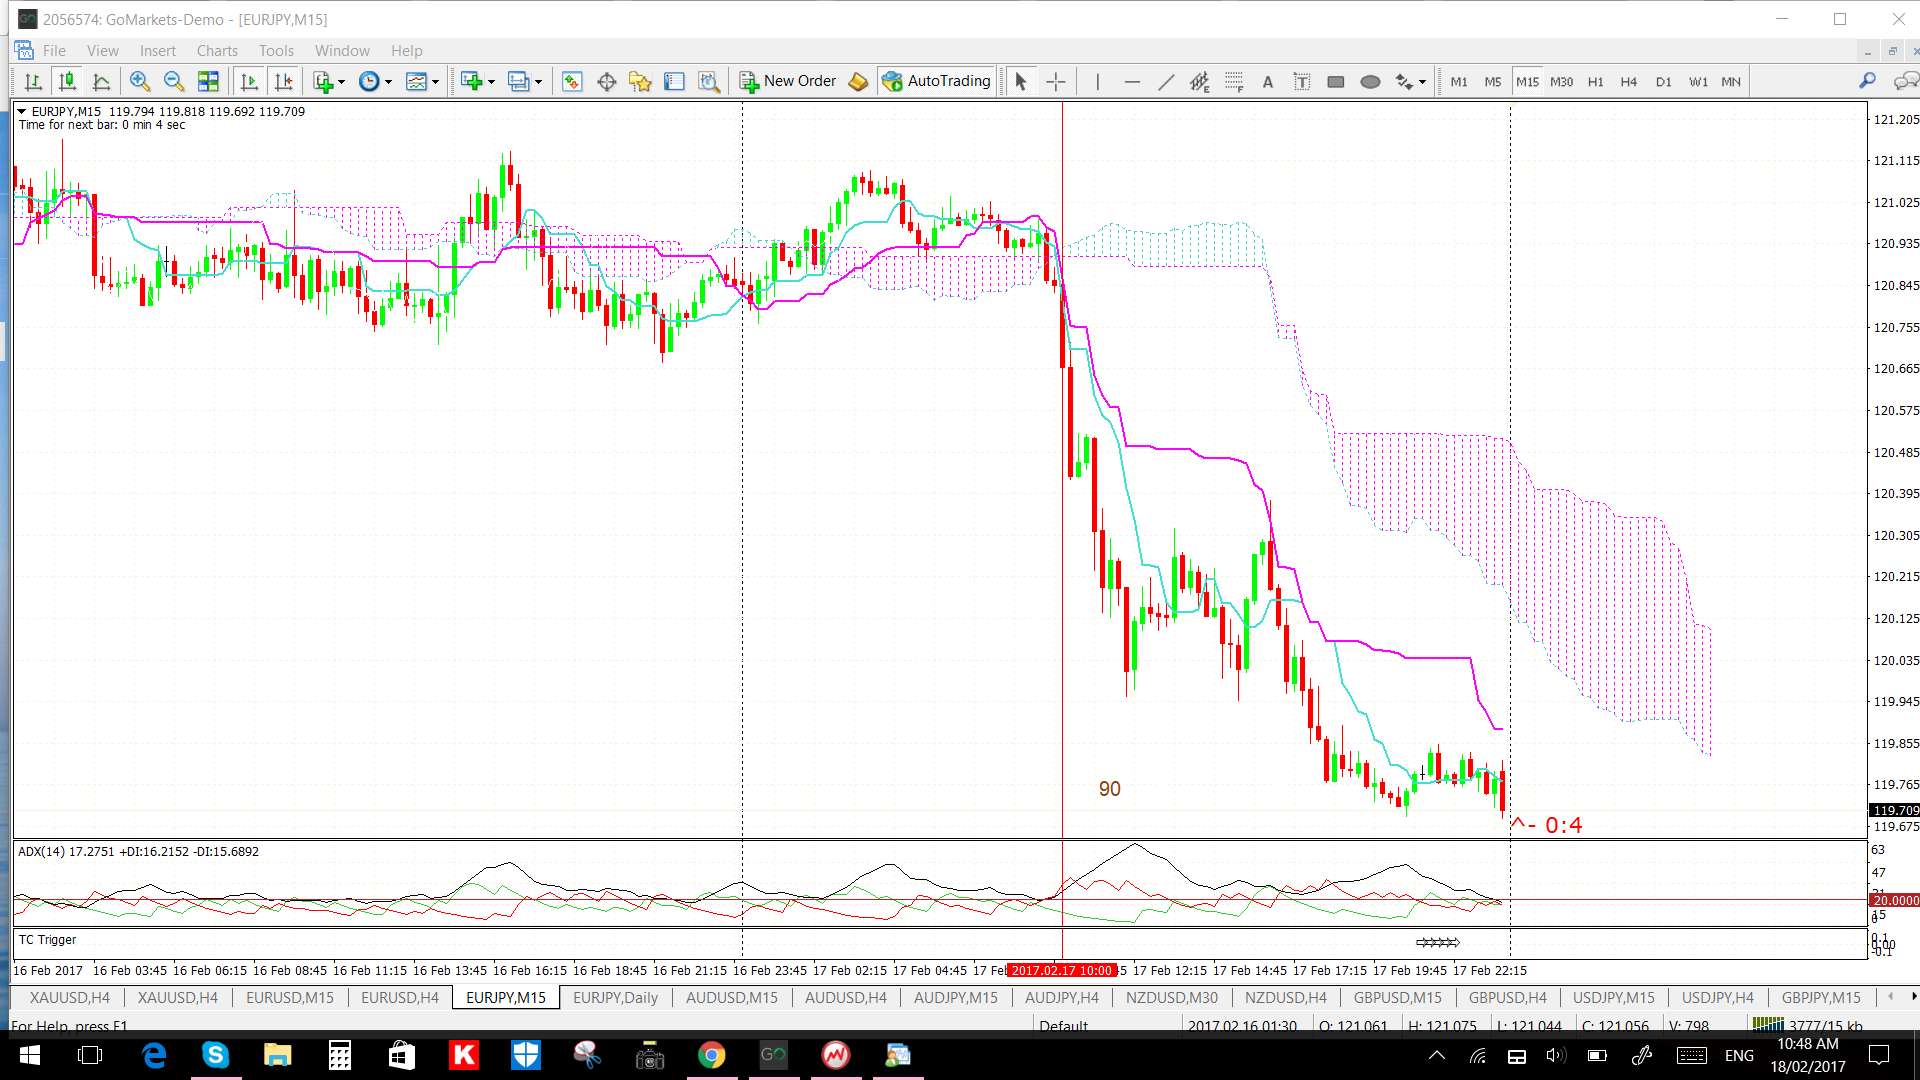
EUR/JPY: I’m still struggling with this pair as it continues to chop along sideways within a wide trading band making up a broadening wedge. However, Friday’s Yen strength did trigger a great 15 min chart trend trading opportunity.
The EUR/JPY is trading below the 4hr Cloud but in the daily Cloud.
The weekly candle was bearish.
There are no high impact data items to impact this pair but lots of second and third tier items:
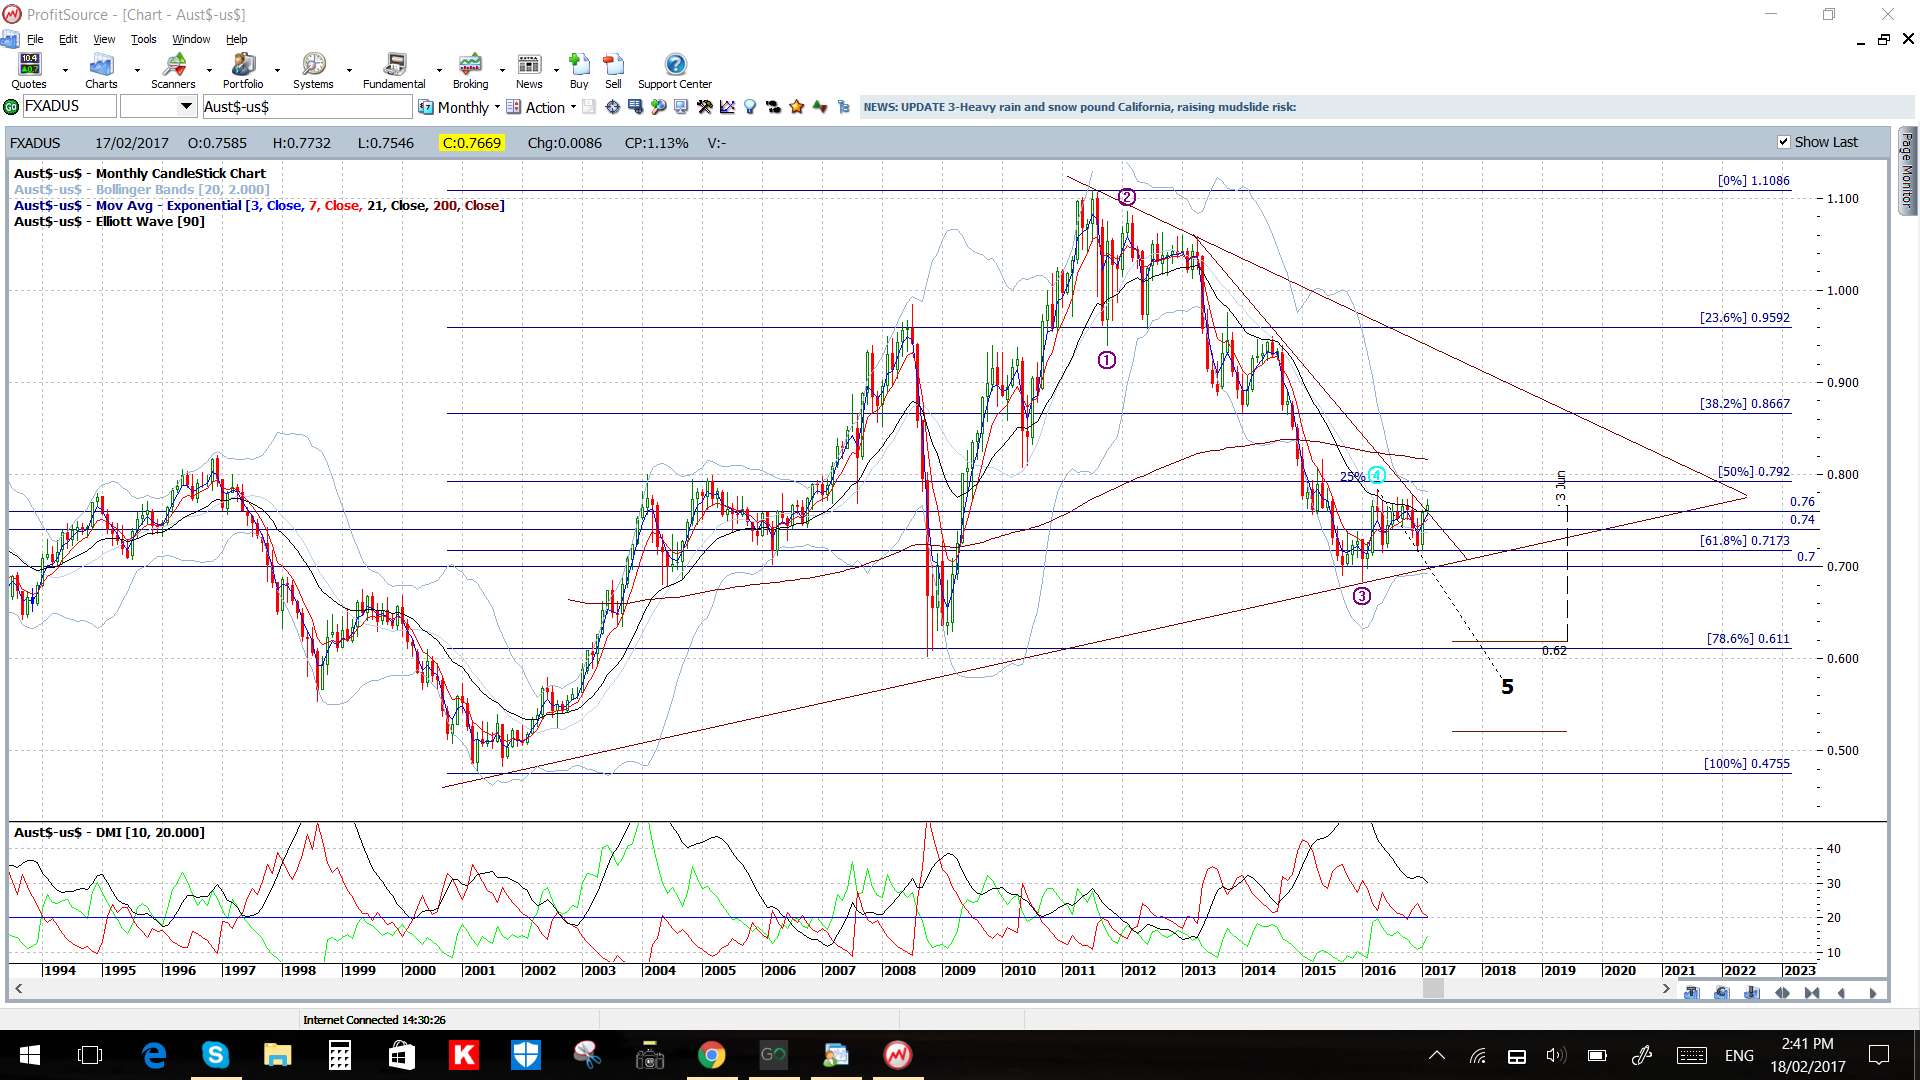
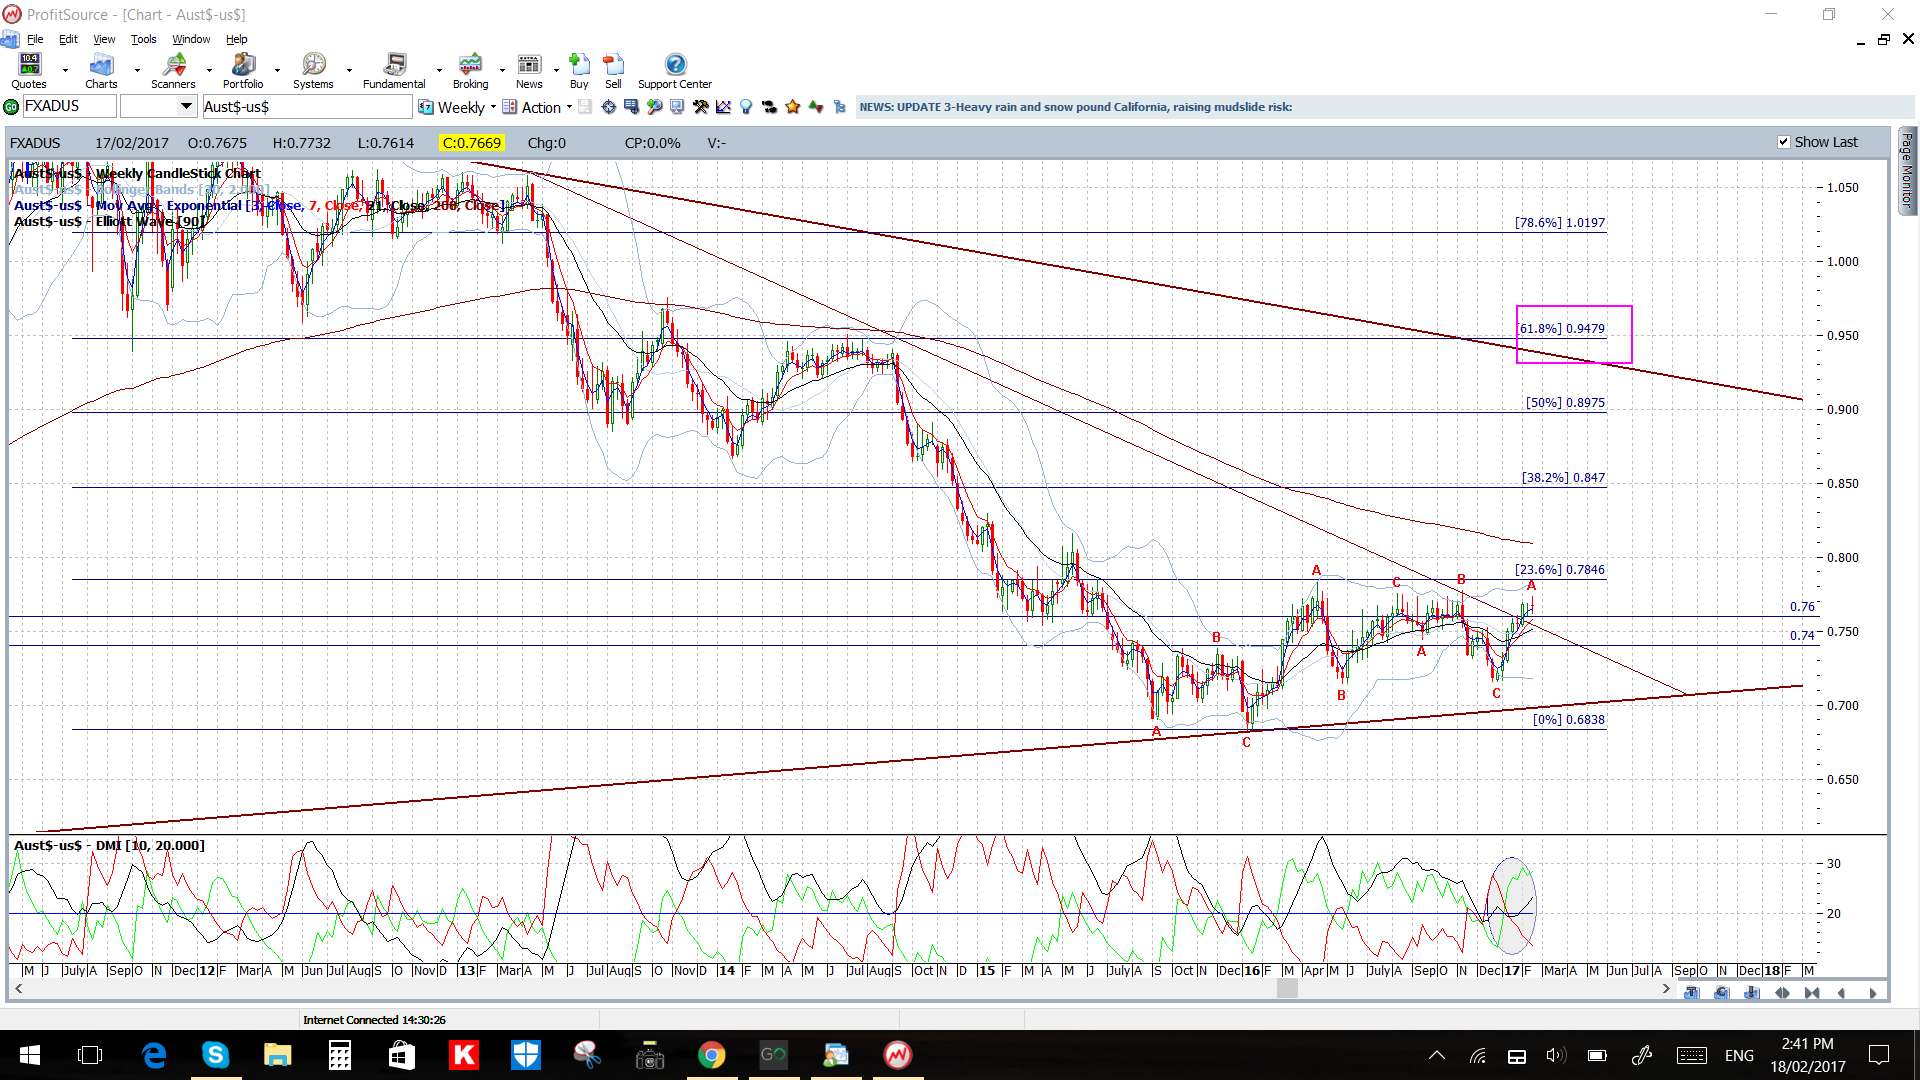
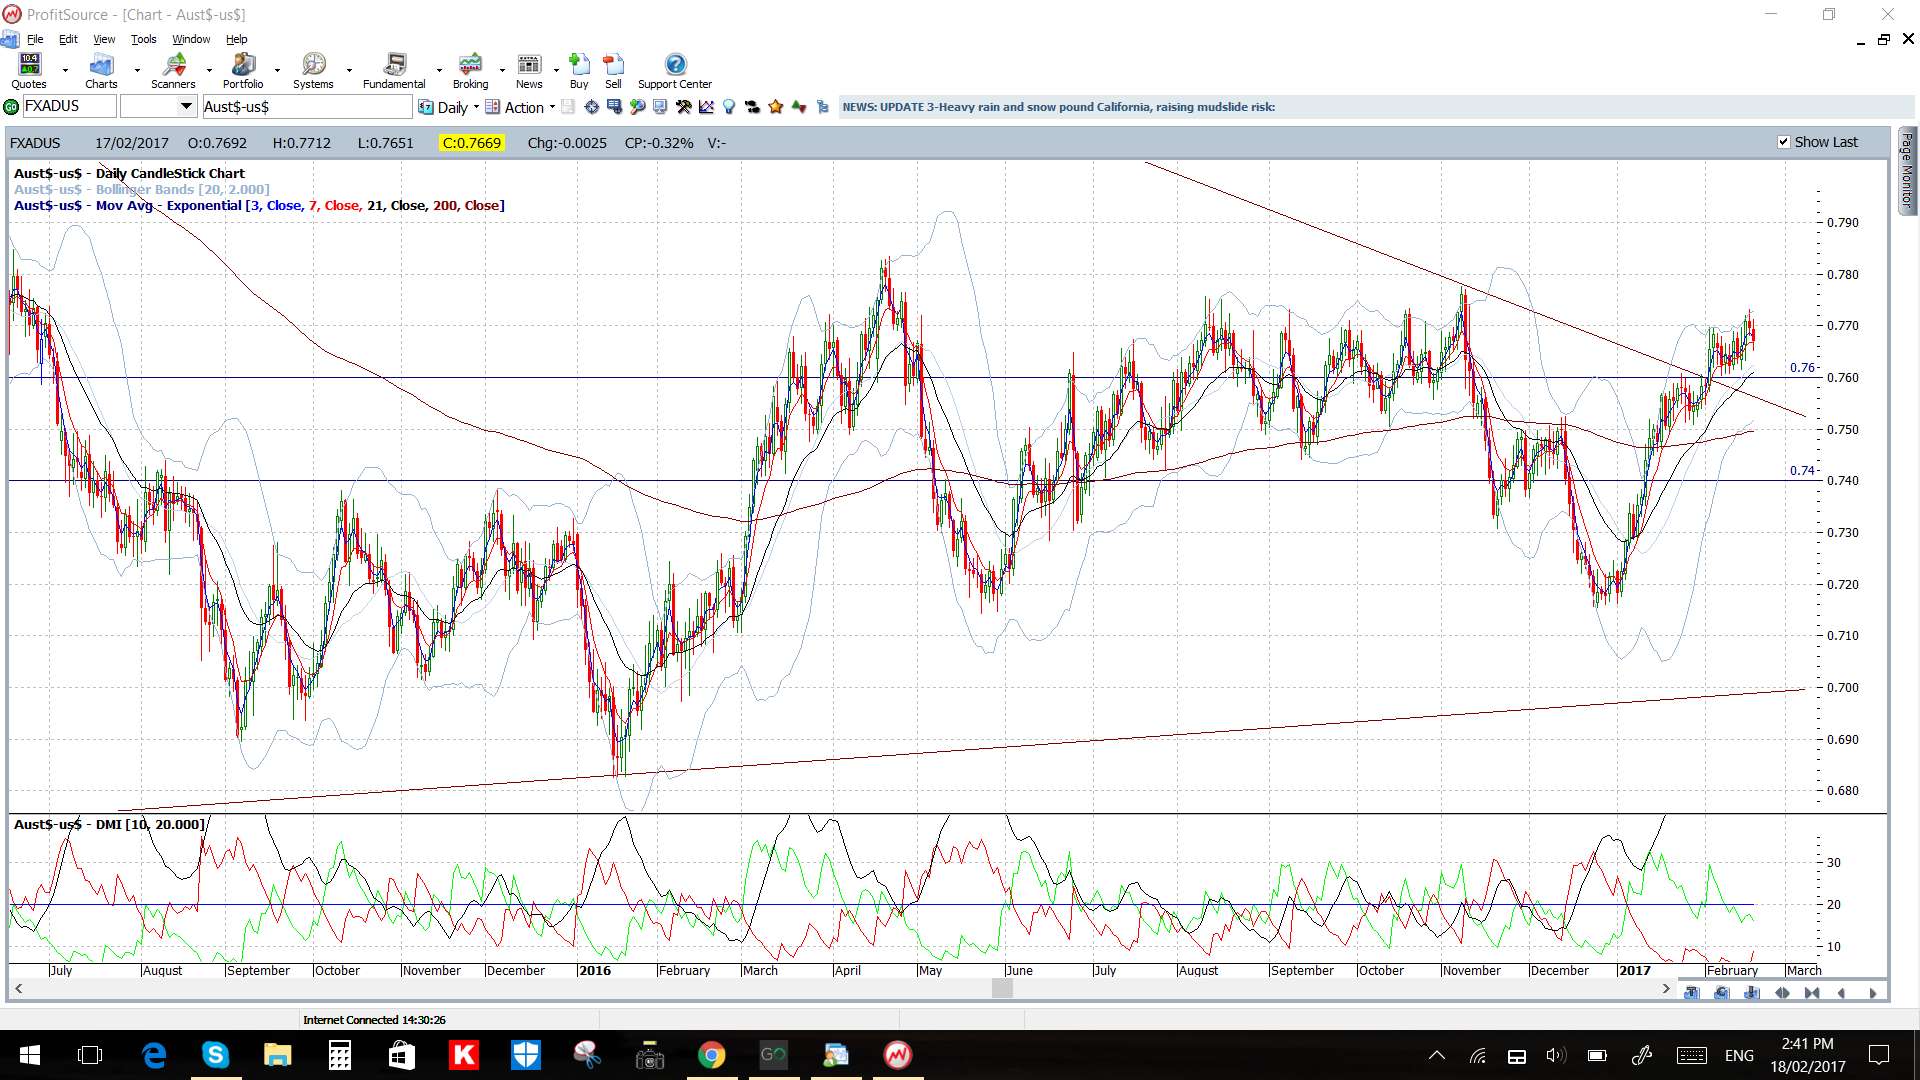
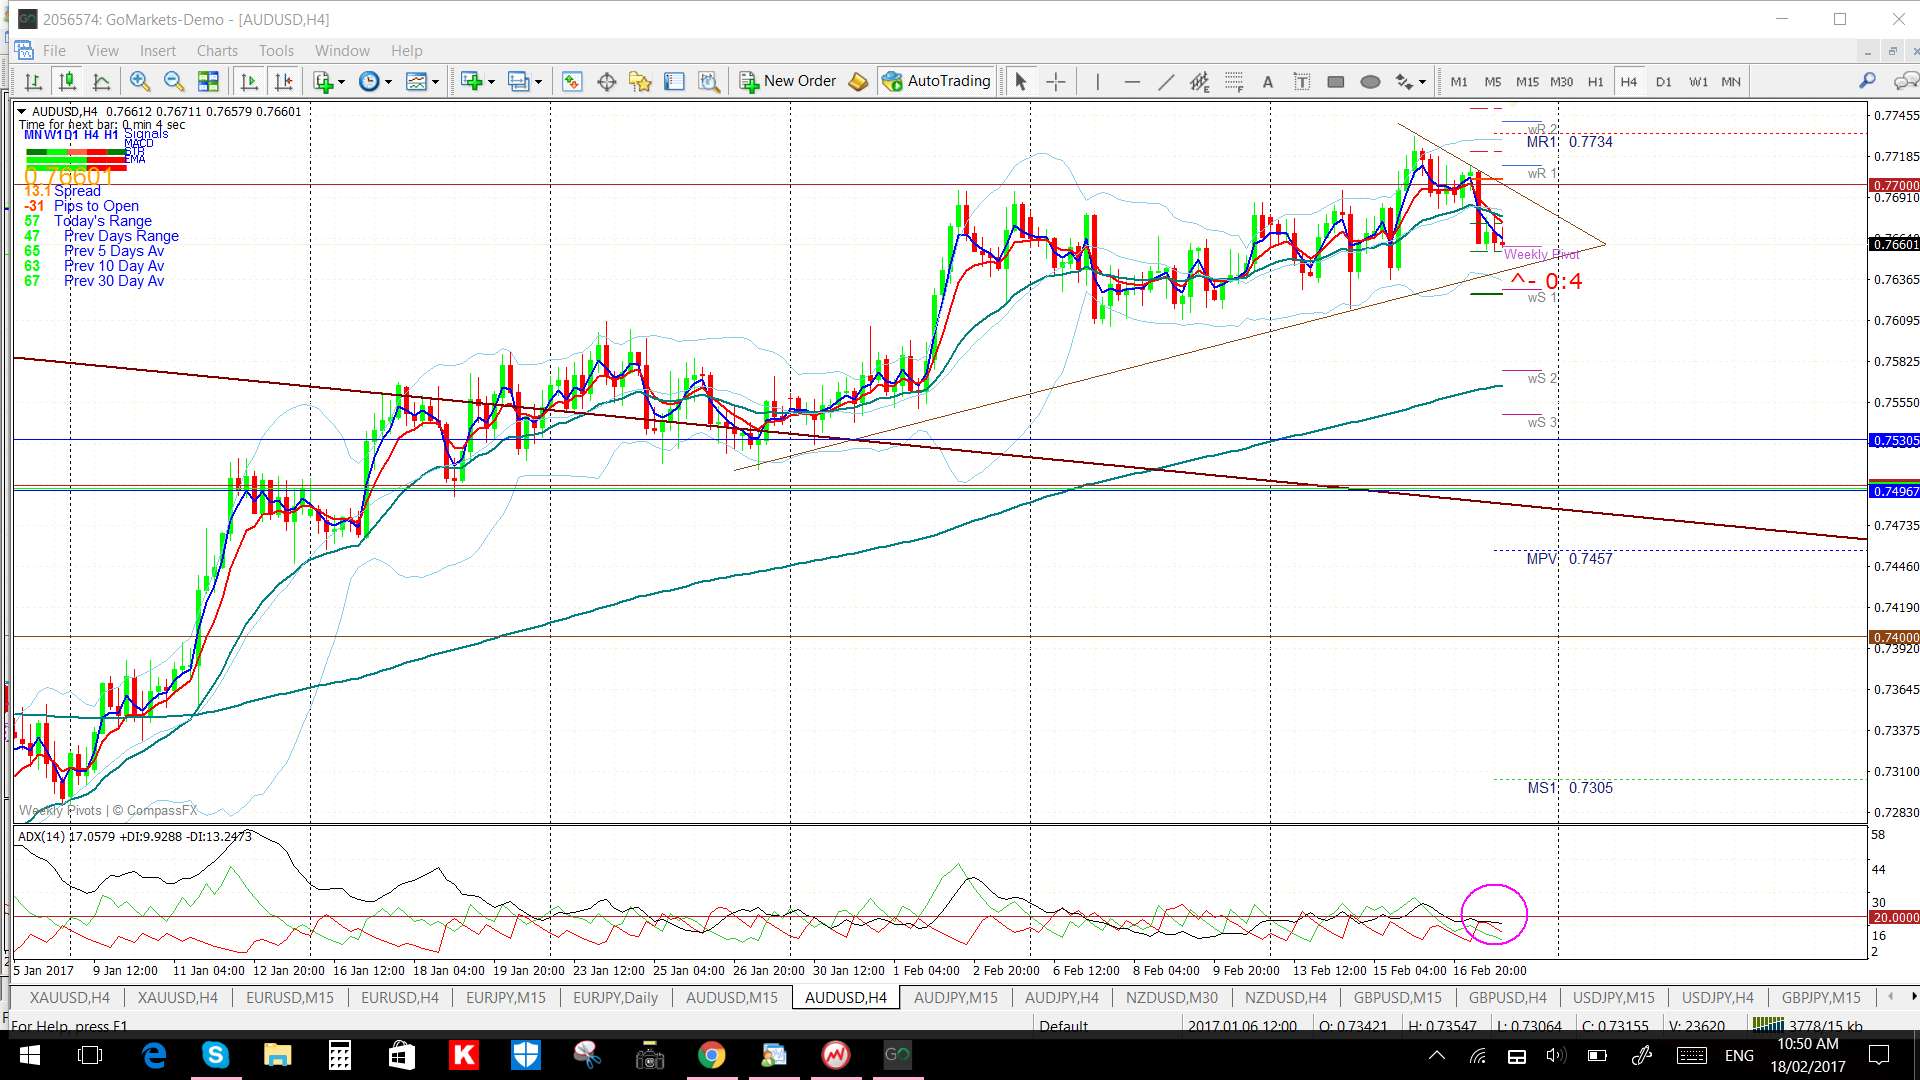
AUD/USD: Price action is still struggling around the 0.77 level and is back to trading within a triangle around this S/R level. The fate of the US$ might determine the next move here so keep an eye on that index.
- Bullish targets: the weekly chart’s 61.8% fib near 0.95.
- Bearish targets: the daily chart’s 50% & 61.8% fibs near 0.745 and 0.74.
The Aussie is above the 4hr and daily Cloud.
The weekly candle closed as an indecision style Doji.
Watch out for impact from the following data items:
- I’m watching the 4h chart triangle around the 0.77 level.
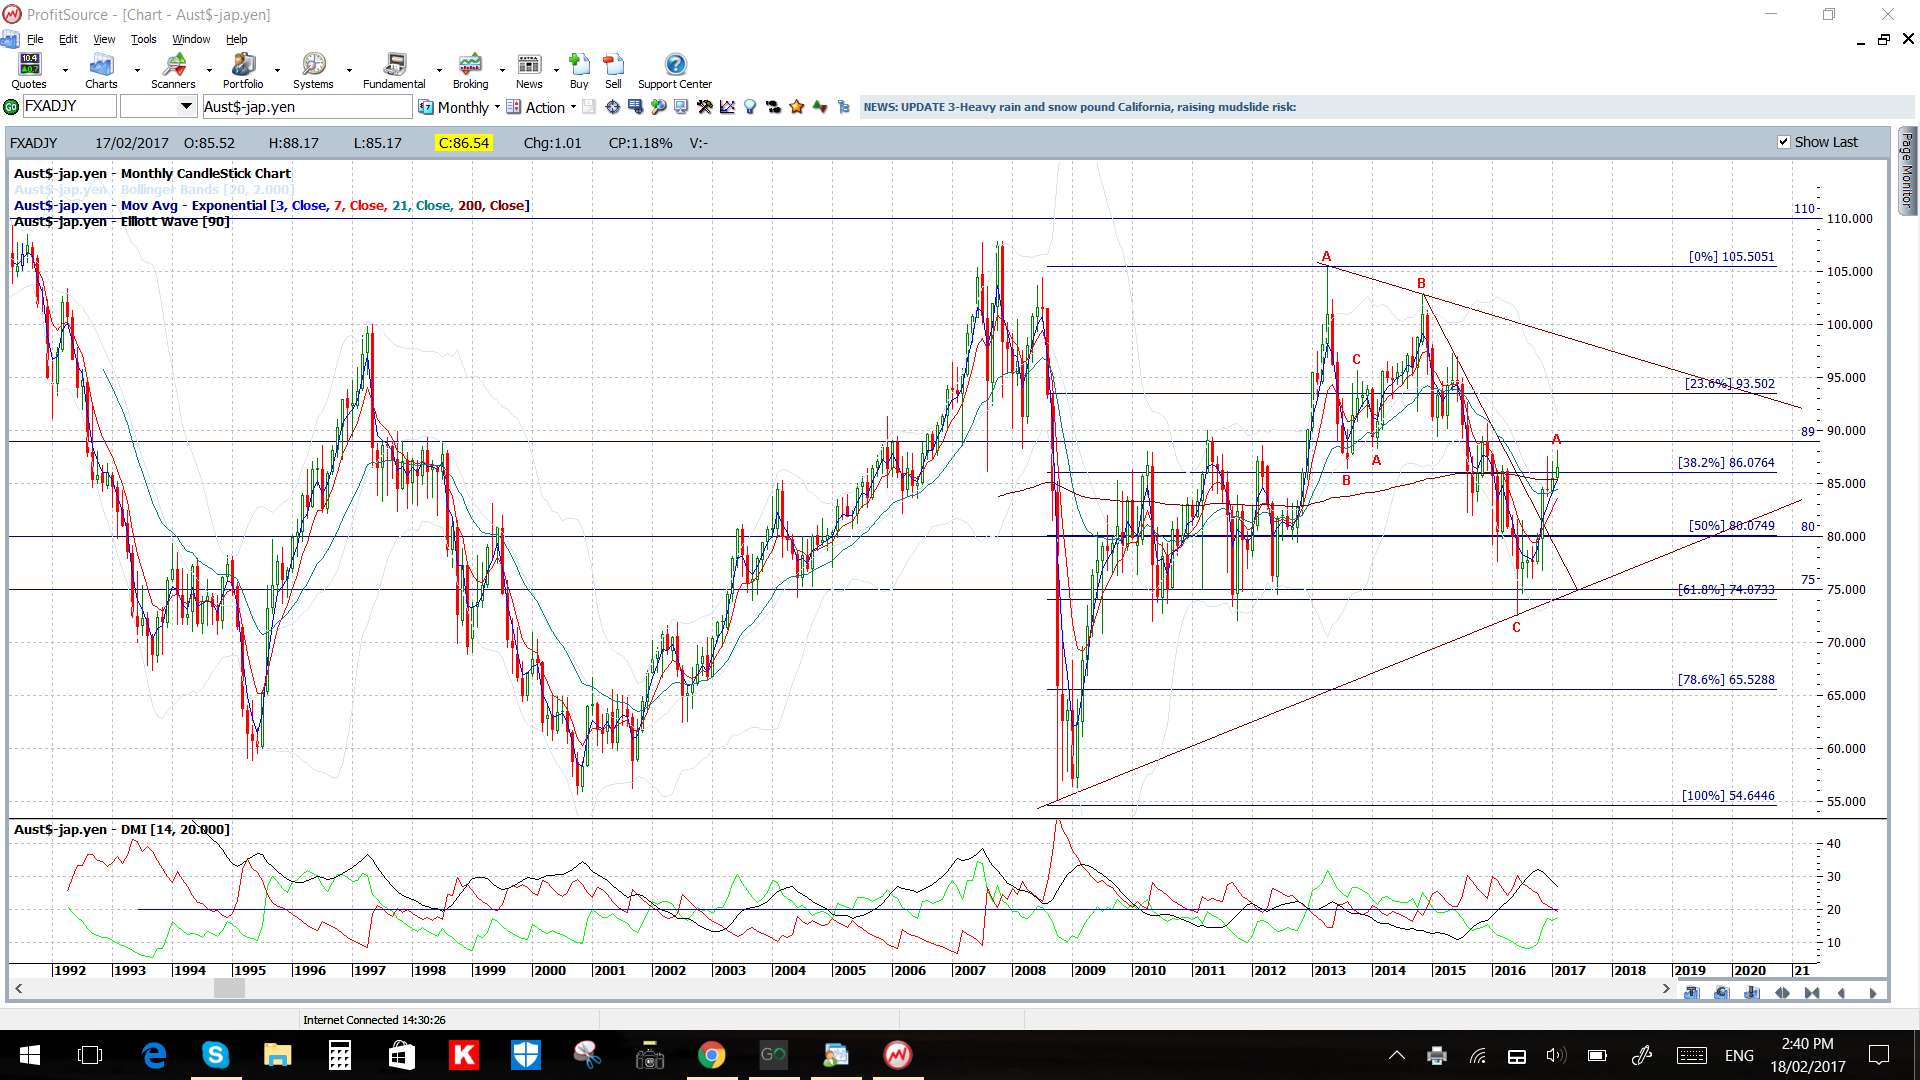
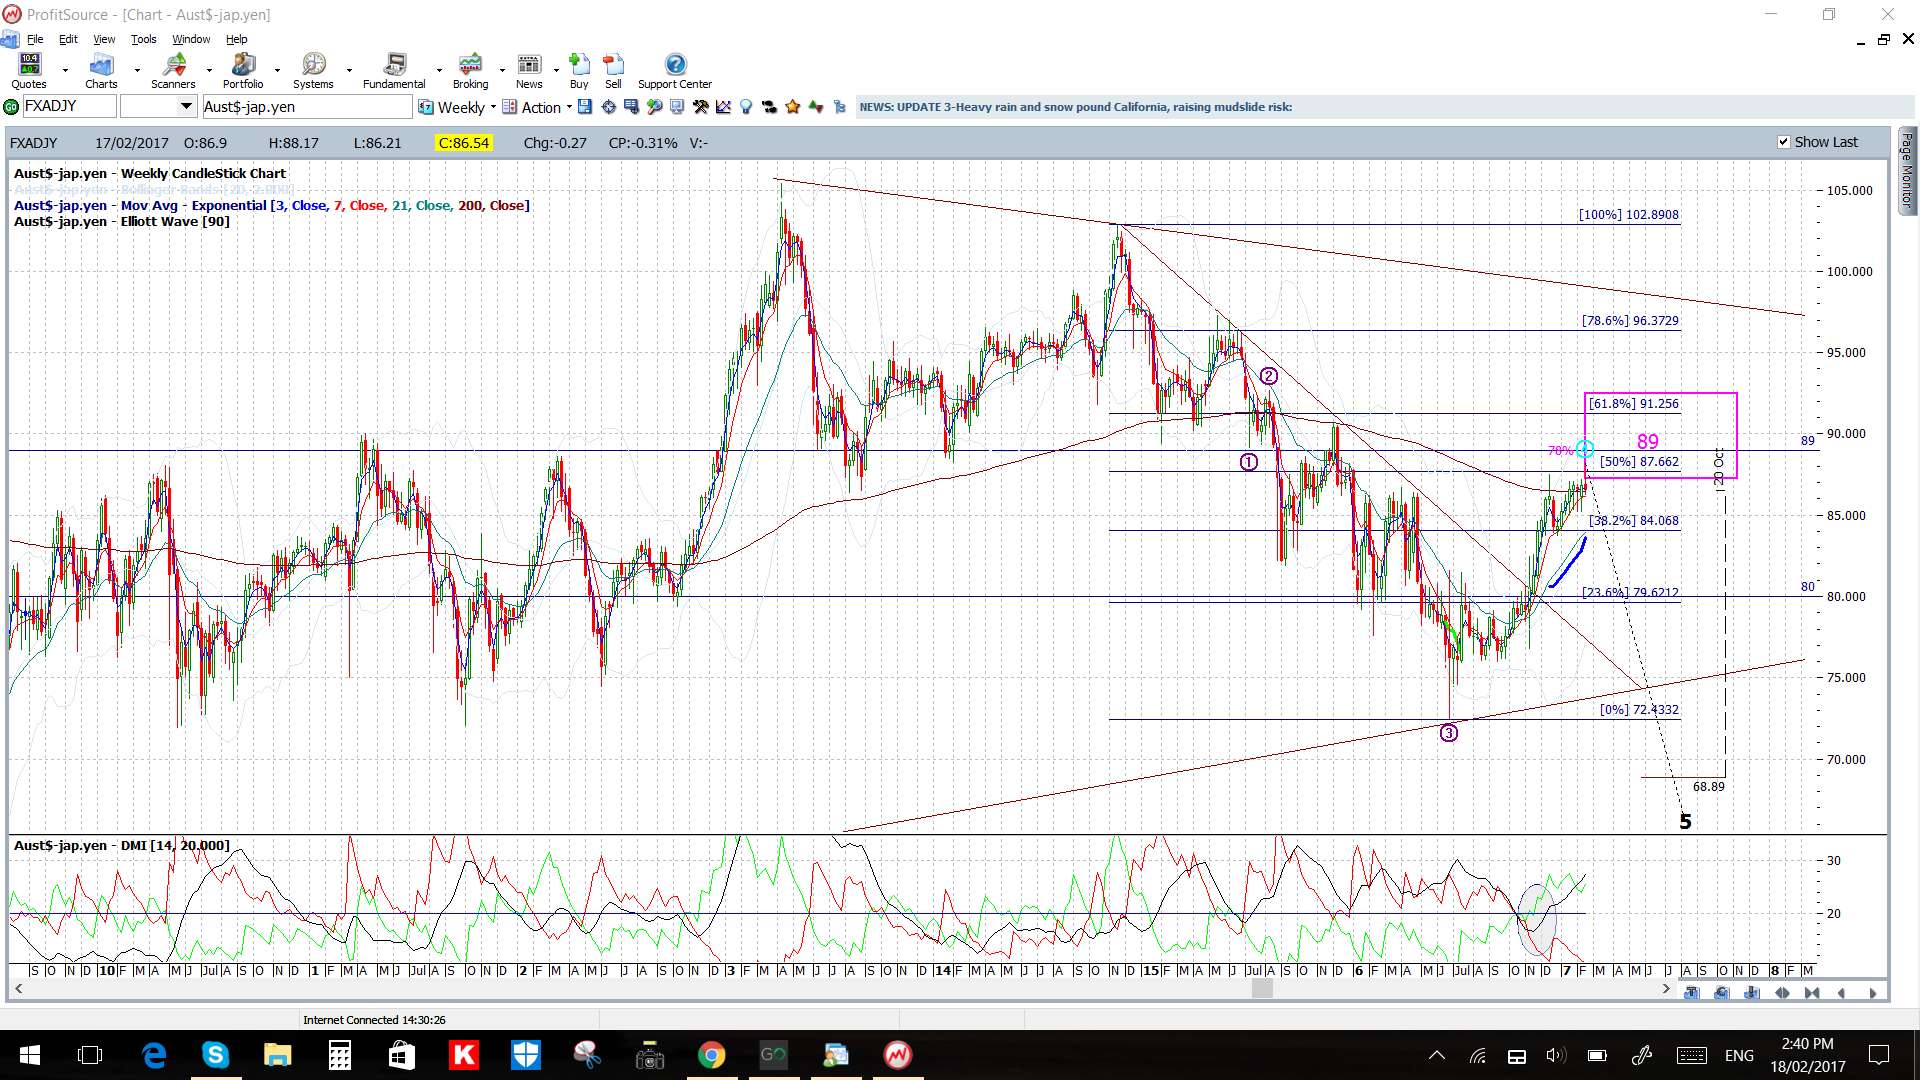
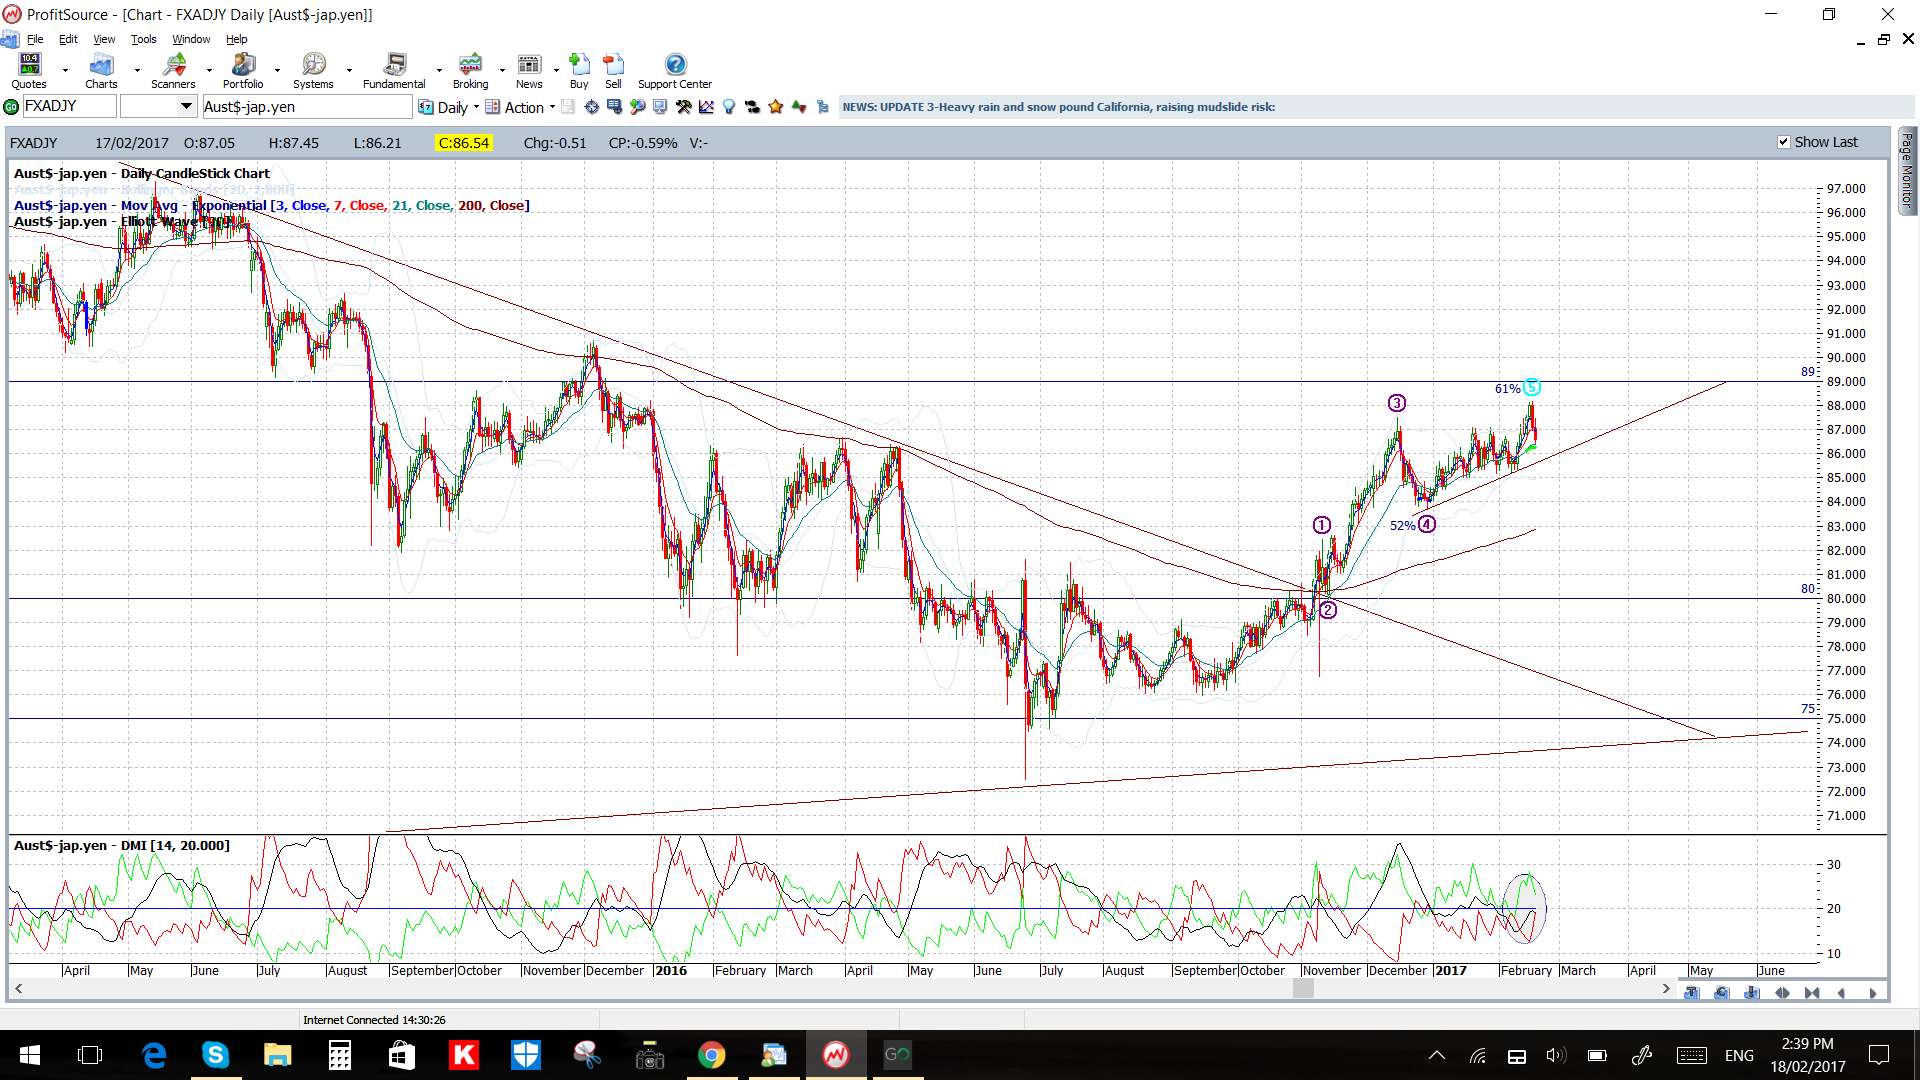
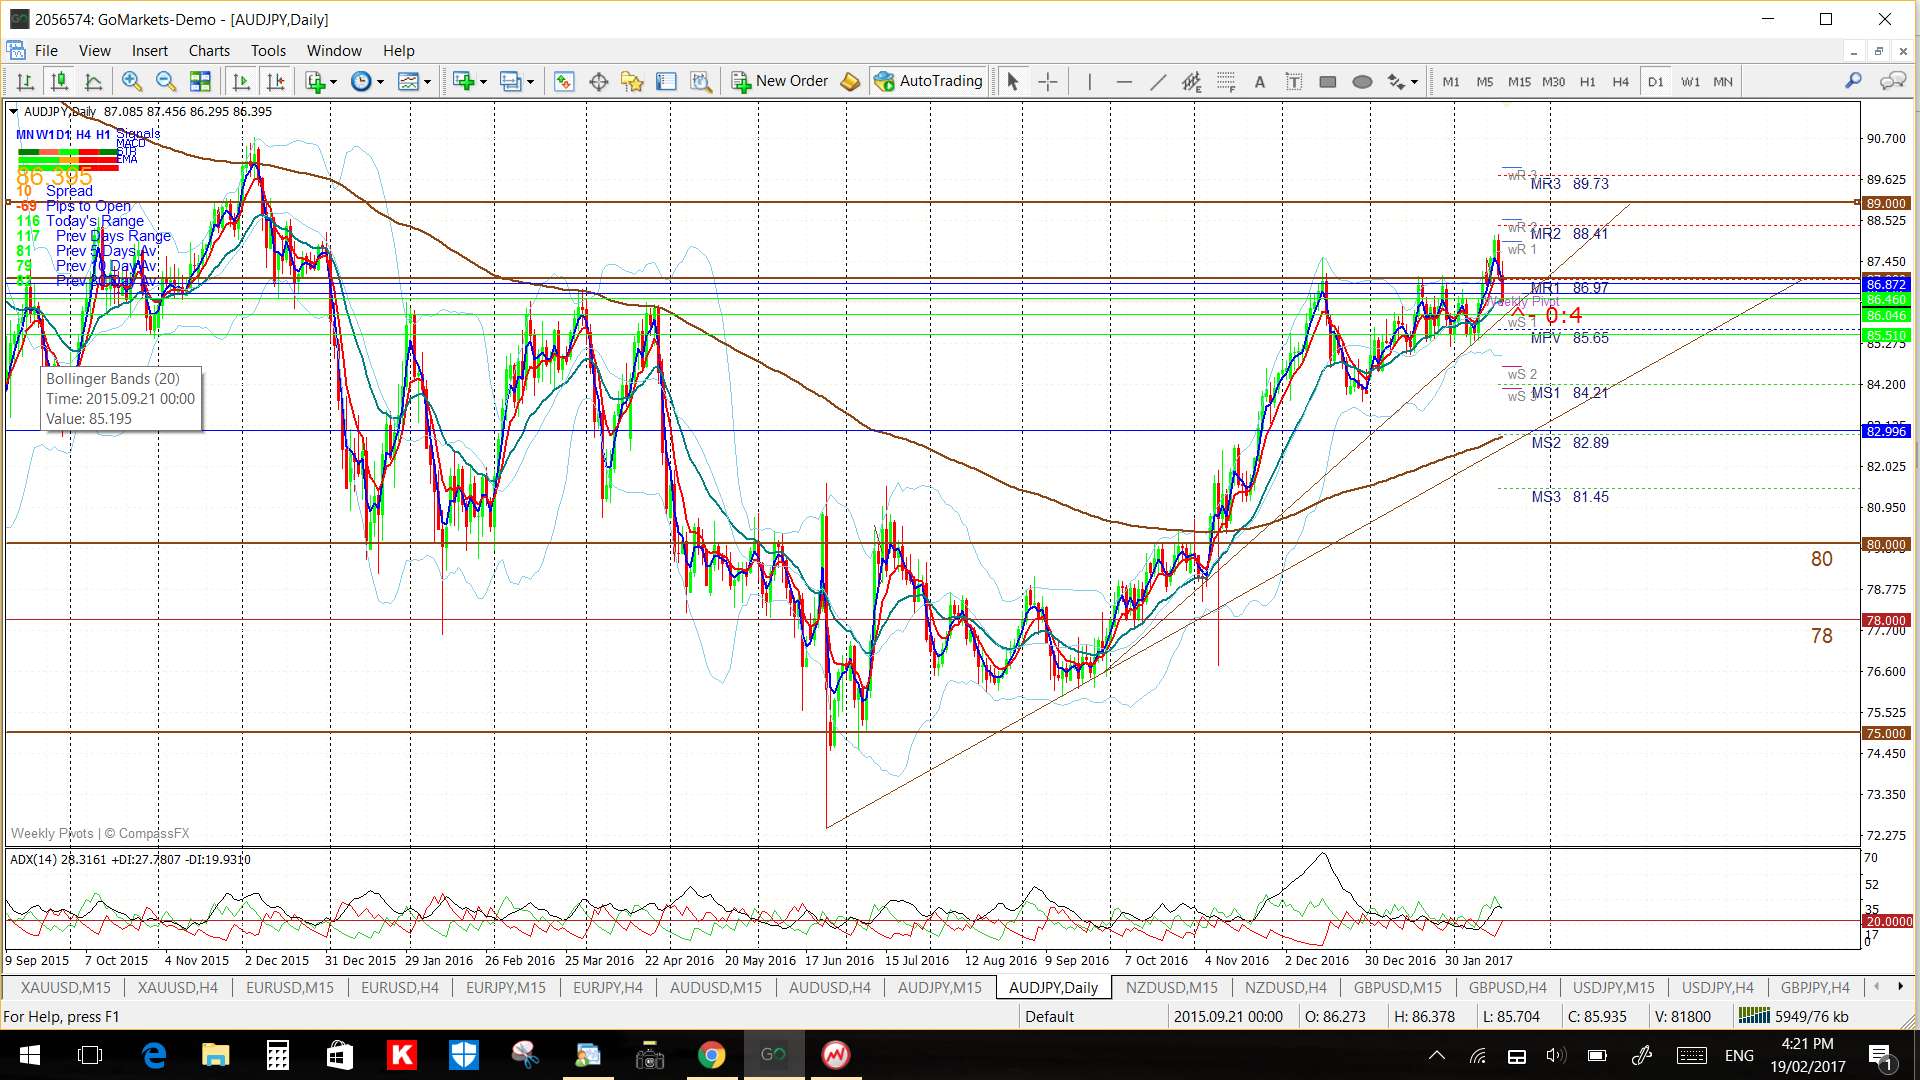
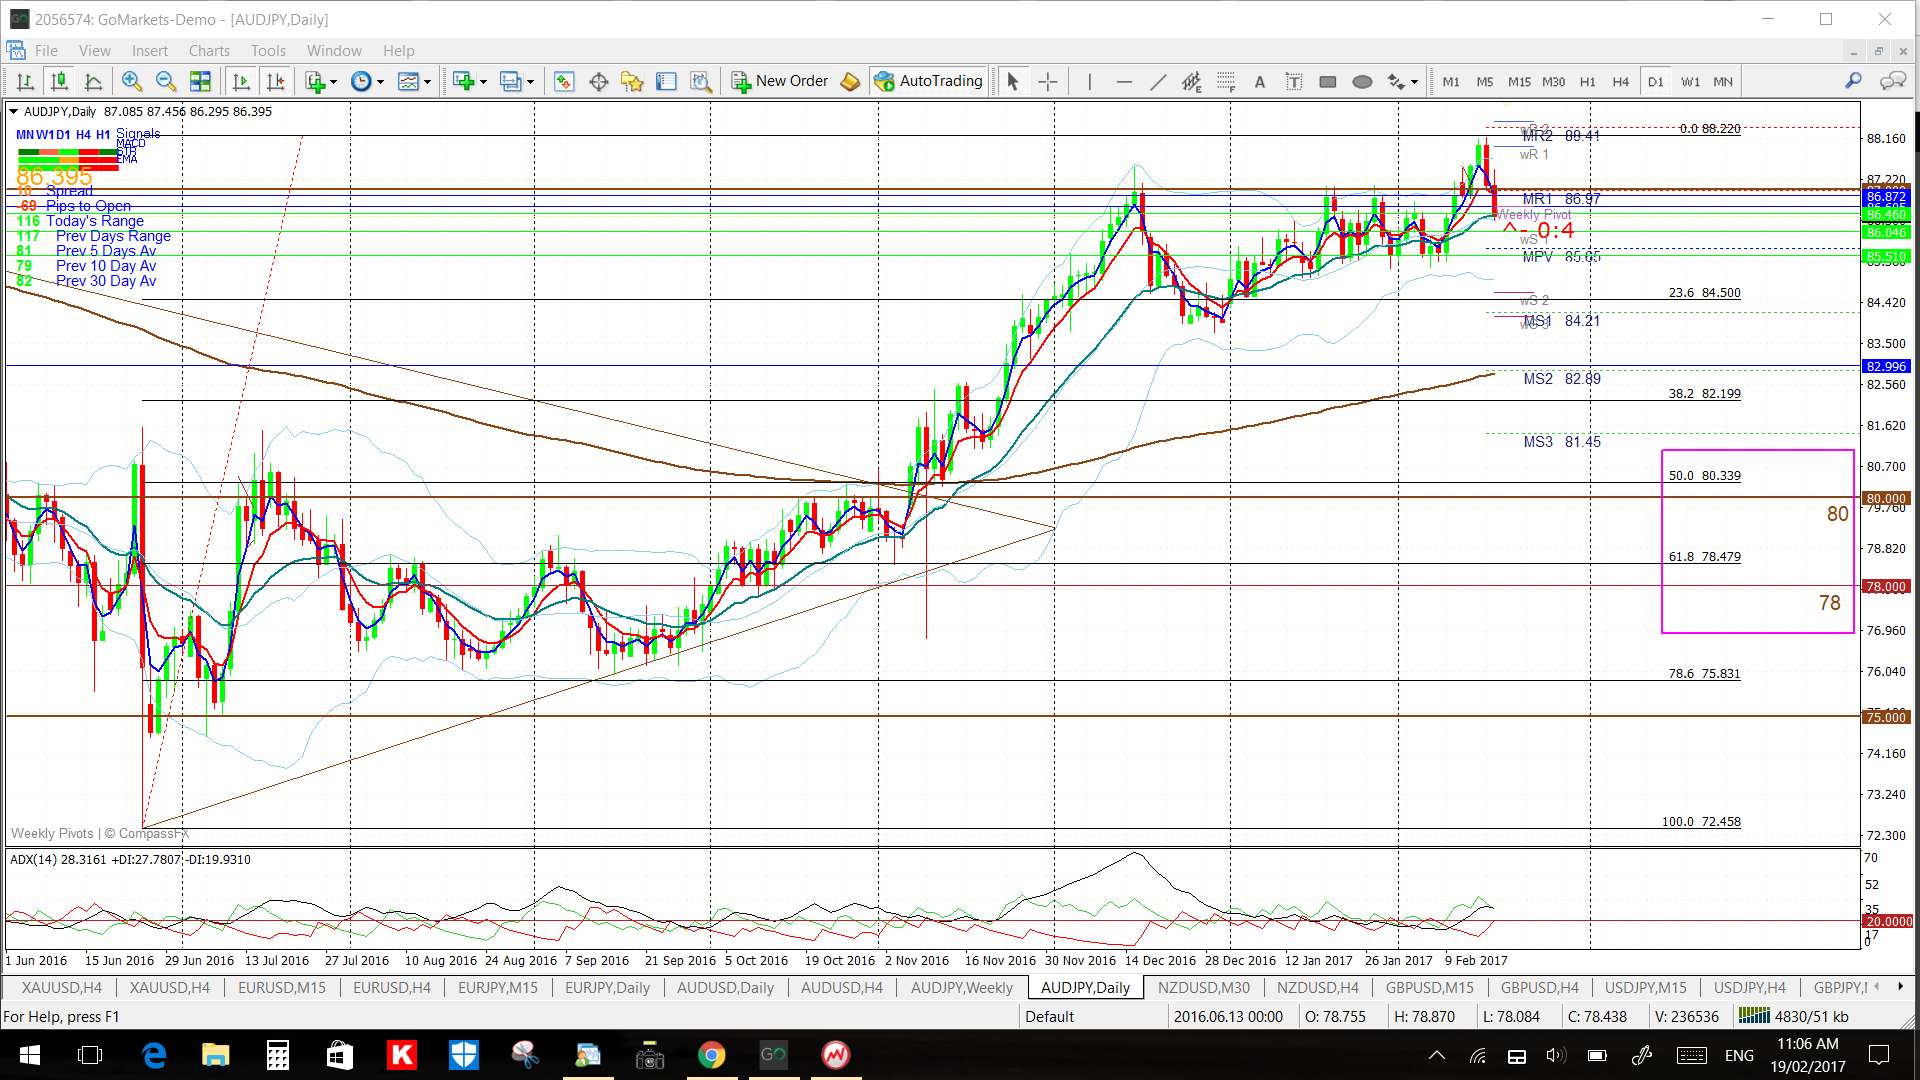
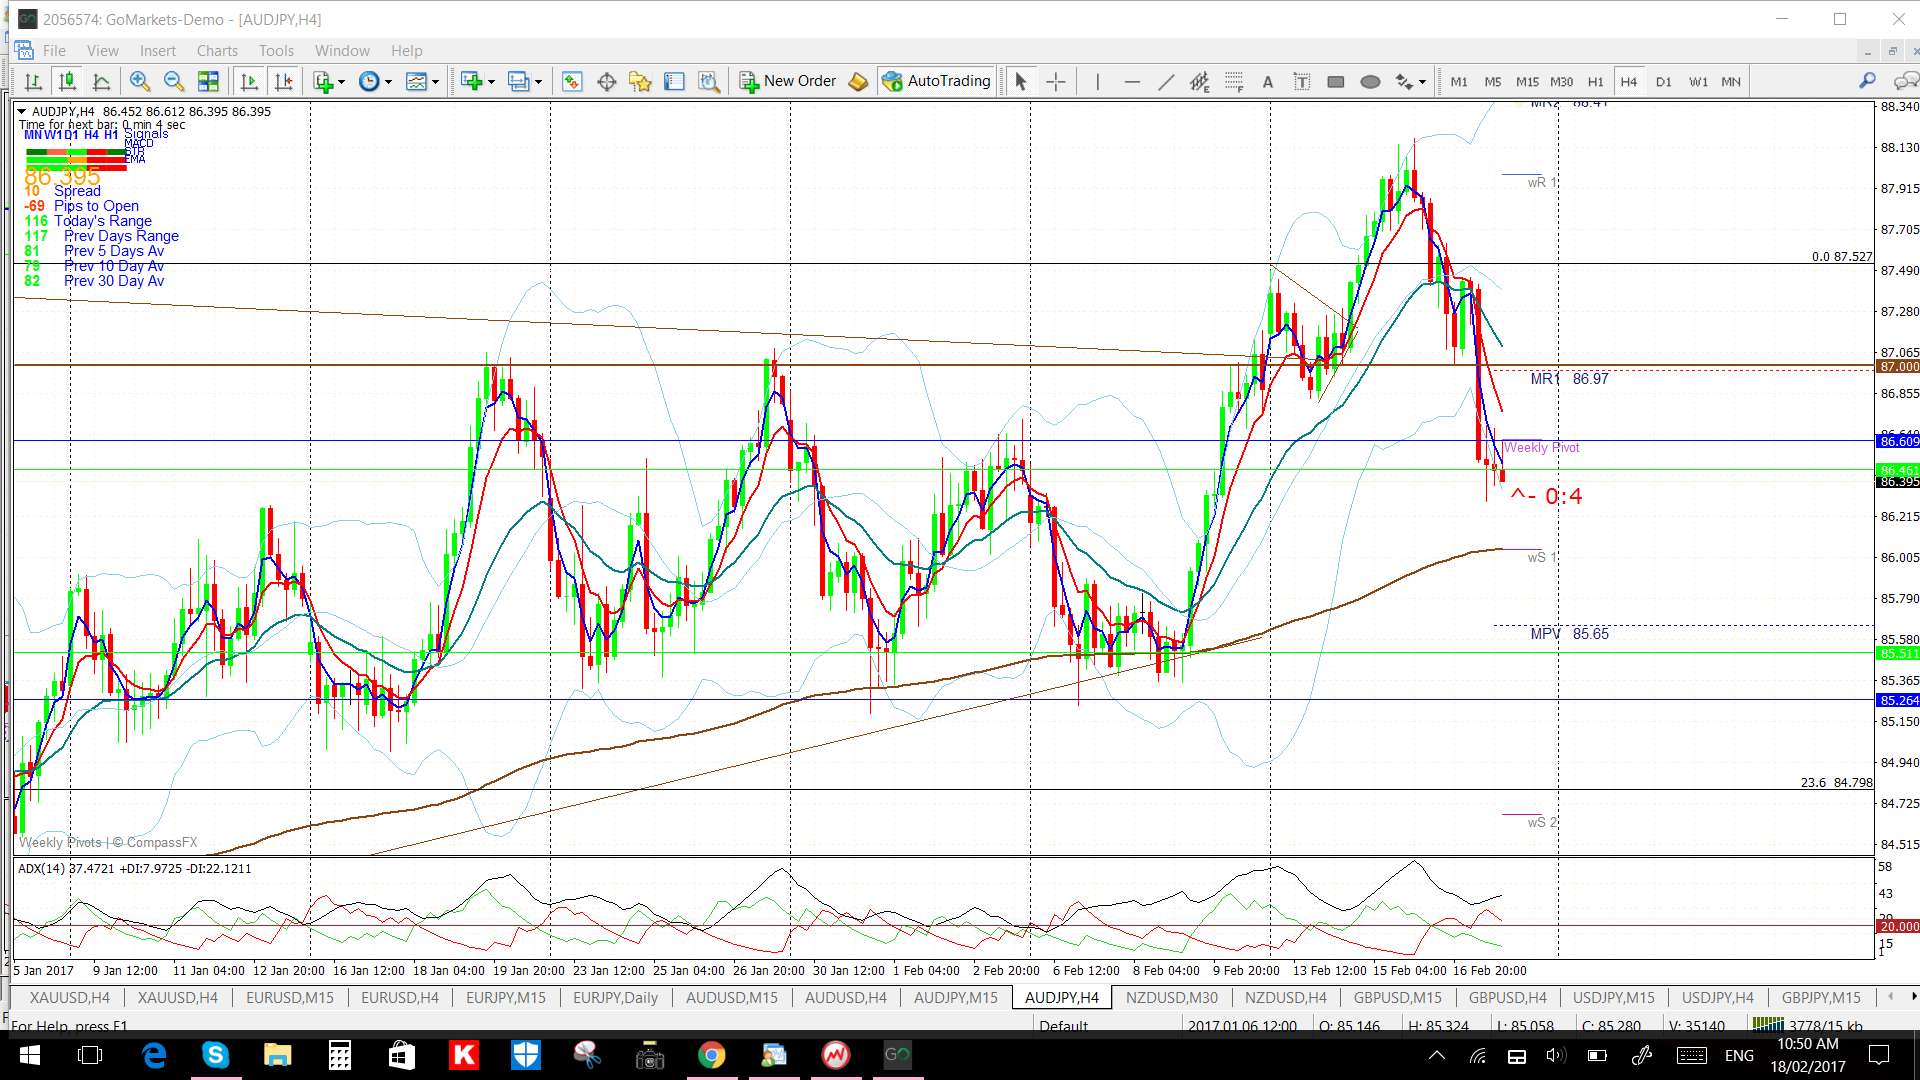
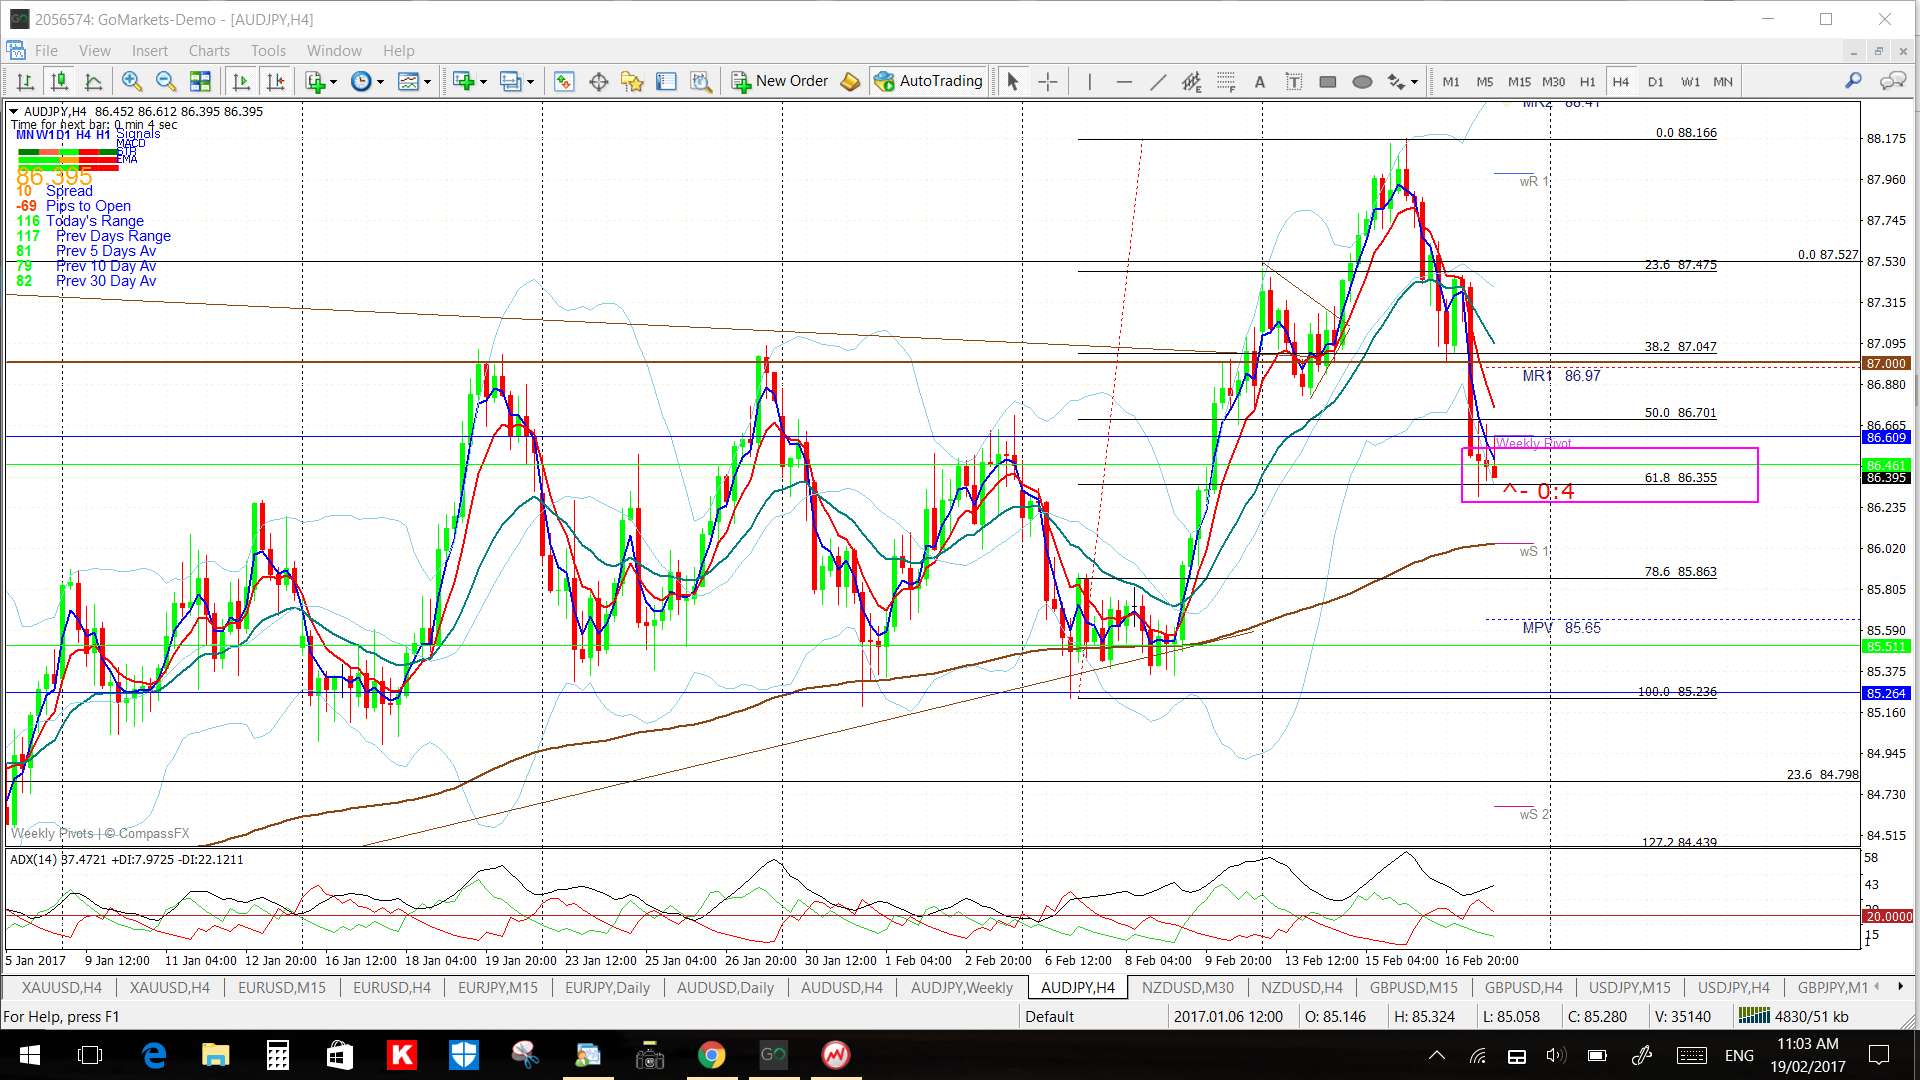
AUD/JPY: Last week’s Yen strength halted the upward momentum with this pair and it pulled back to close below the 87 S/R level. However, if you look at the 4hr chart’s last swing high move then you can see price is still above the 61.8% fib, 200 EMA and 86 level. Also, the condensed daily chart below shows price is still respecting two support trend lines so use these as a guide as well.
Any close and hold below the 86 whole number level near these items might help traders gauge whether this pullback move has more to go. If so, this would have me looking at the daily chart’s 50 and 61.8% fibs as these are near the 78 and 80 S/R levels.
The weekly candle was bearish.
Price is in the 4hr Cloud but above the daily Cloud.
Watch out for impact from the following data items:
- I’m watching for any make or break at the 86 level.
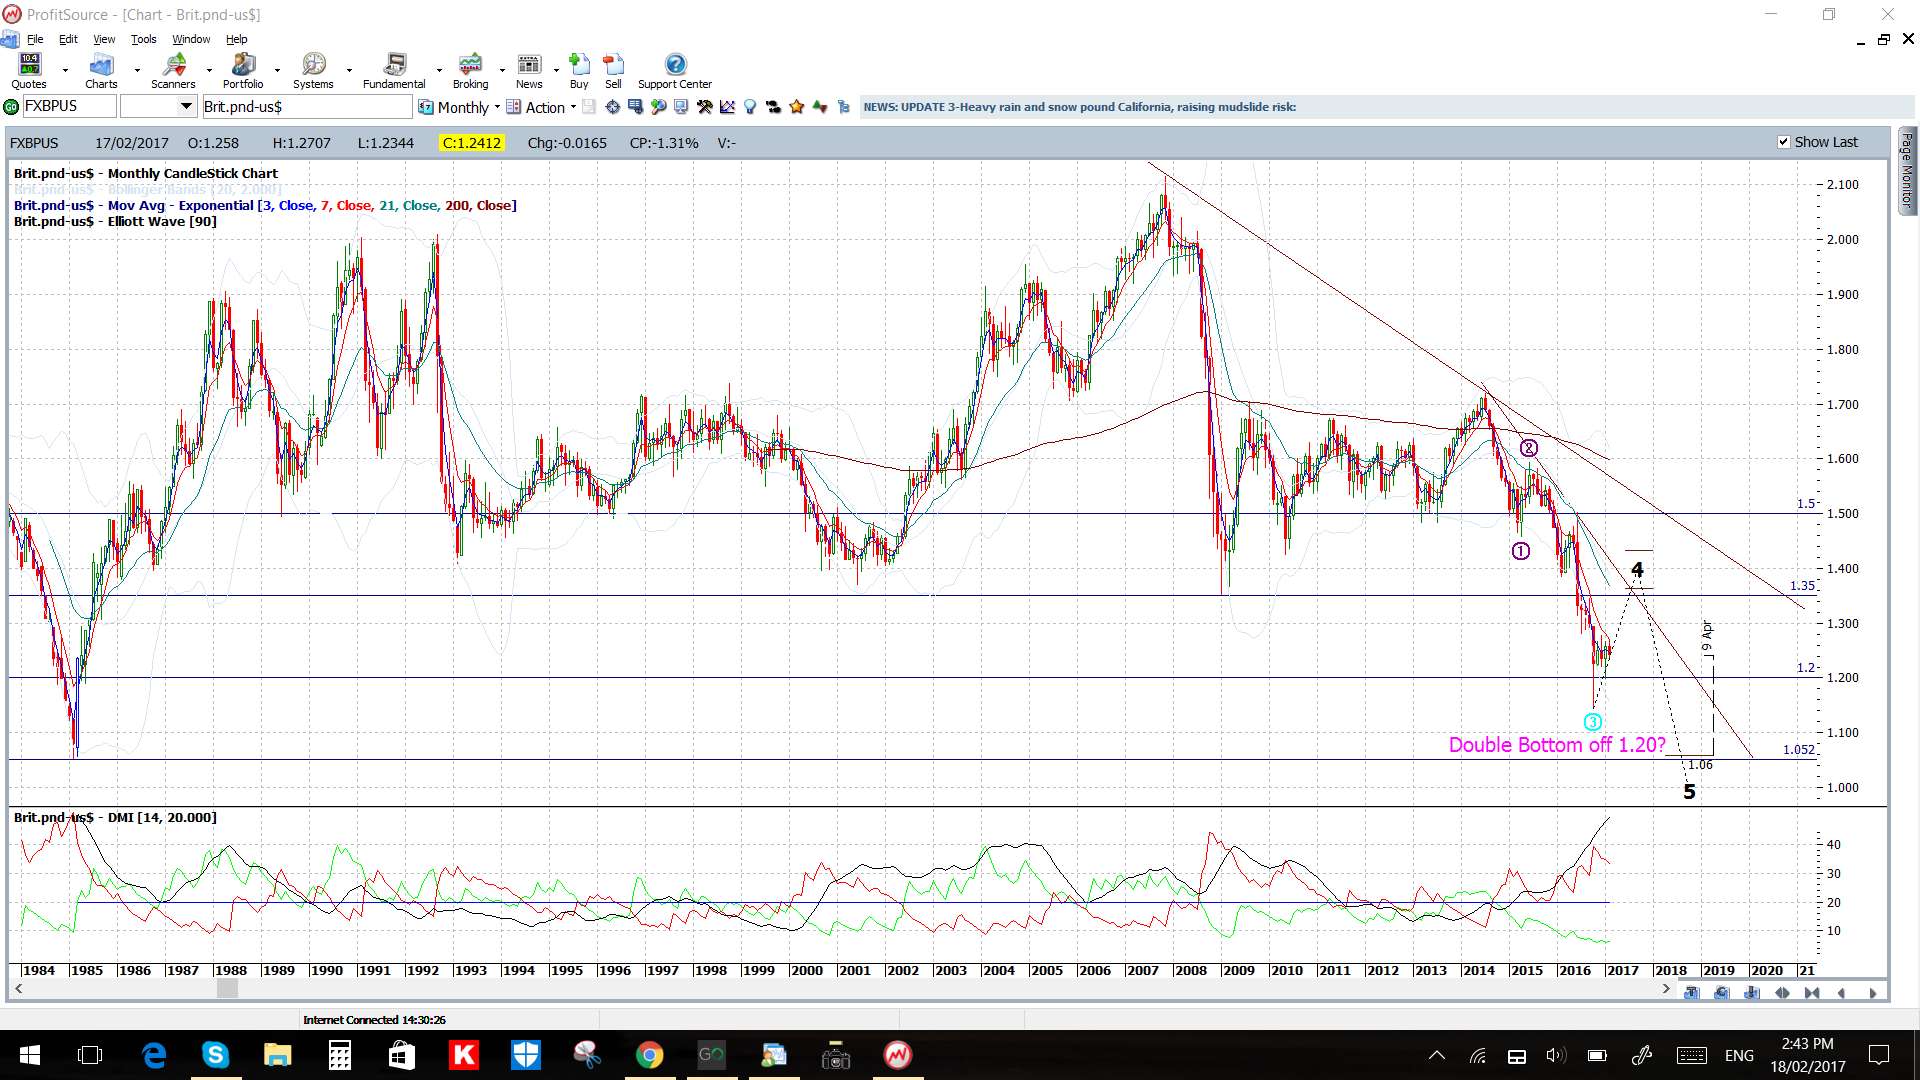
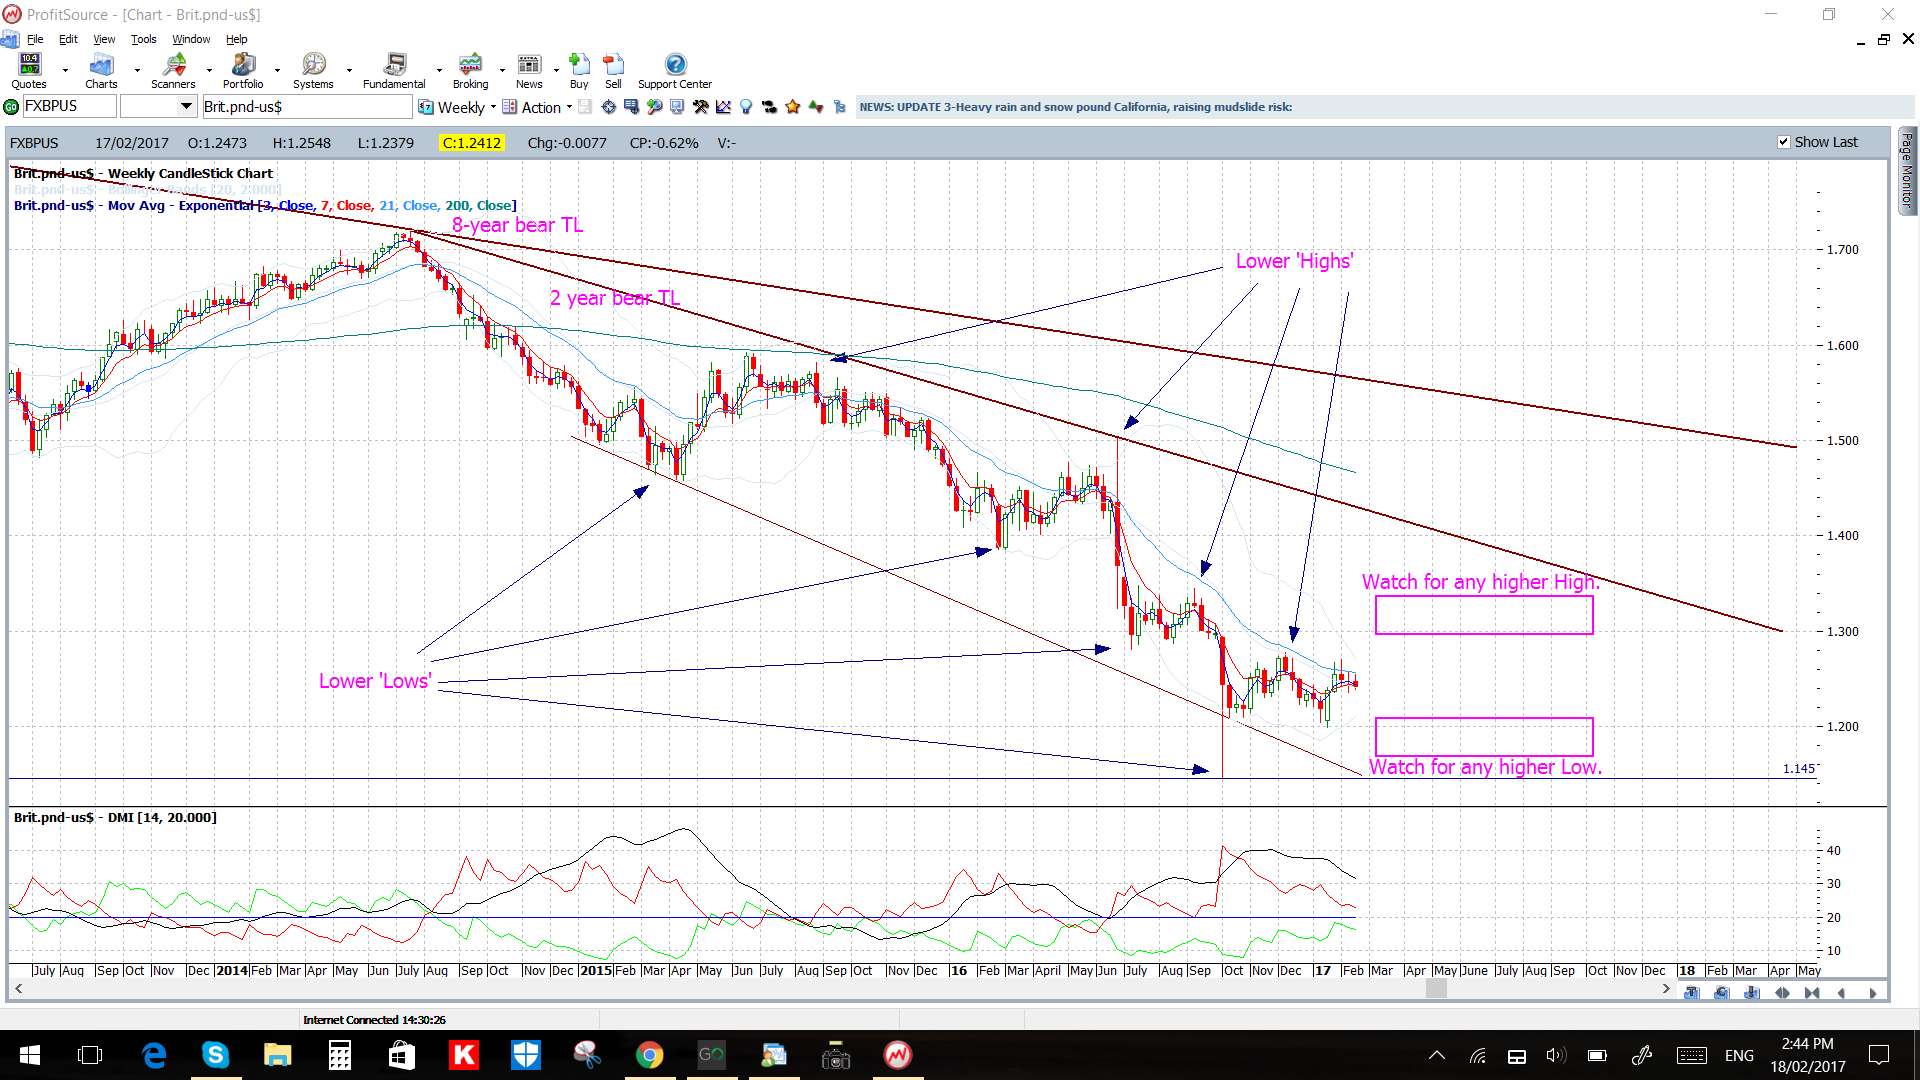
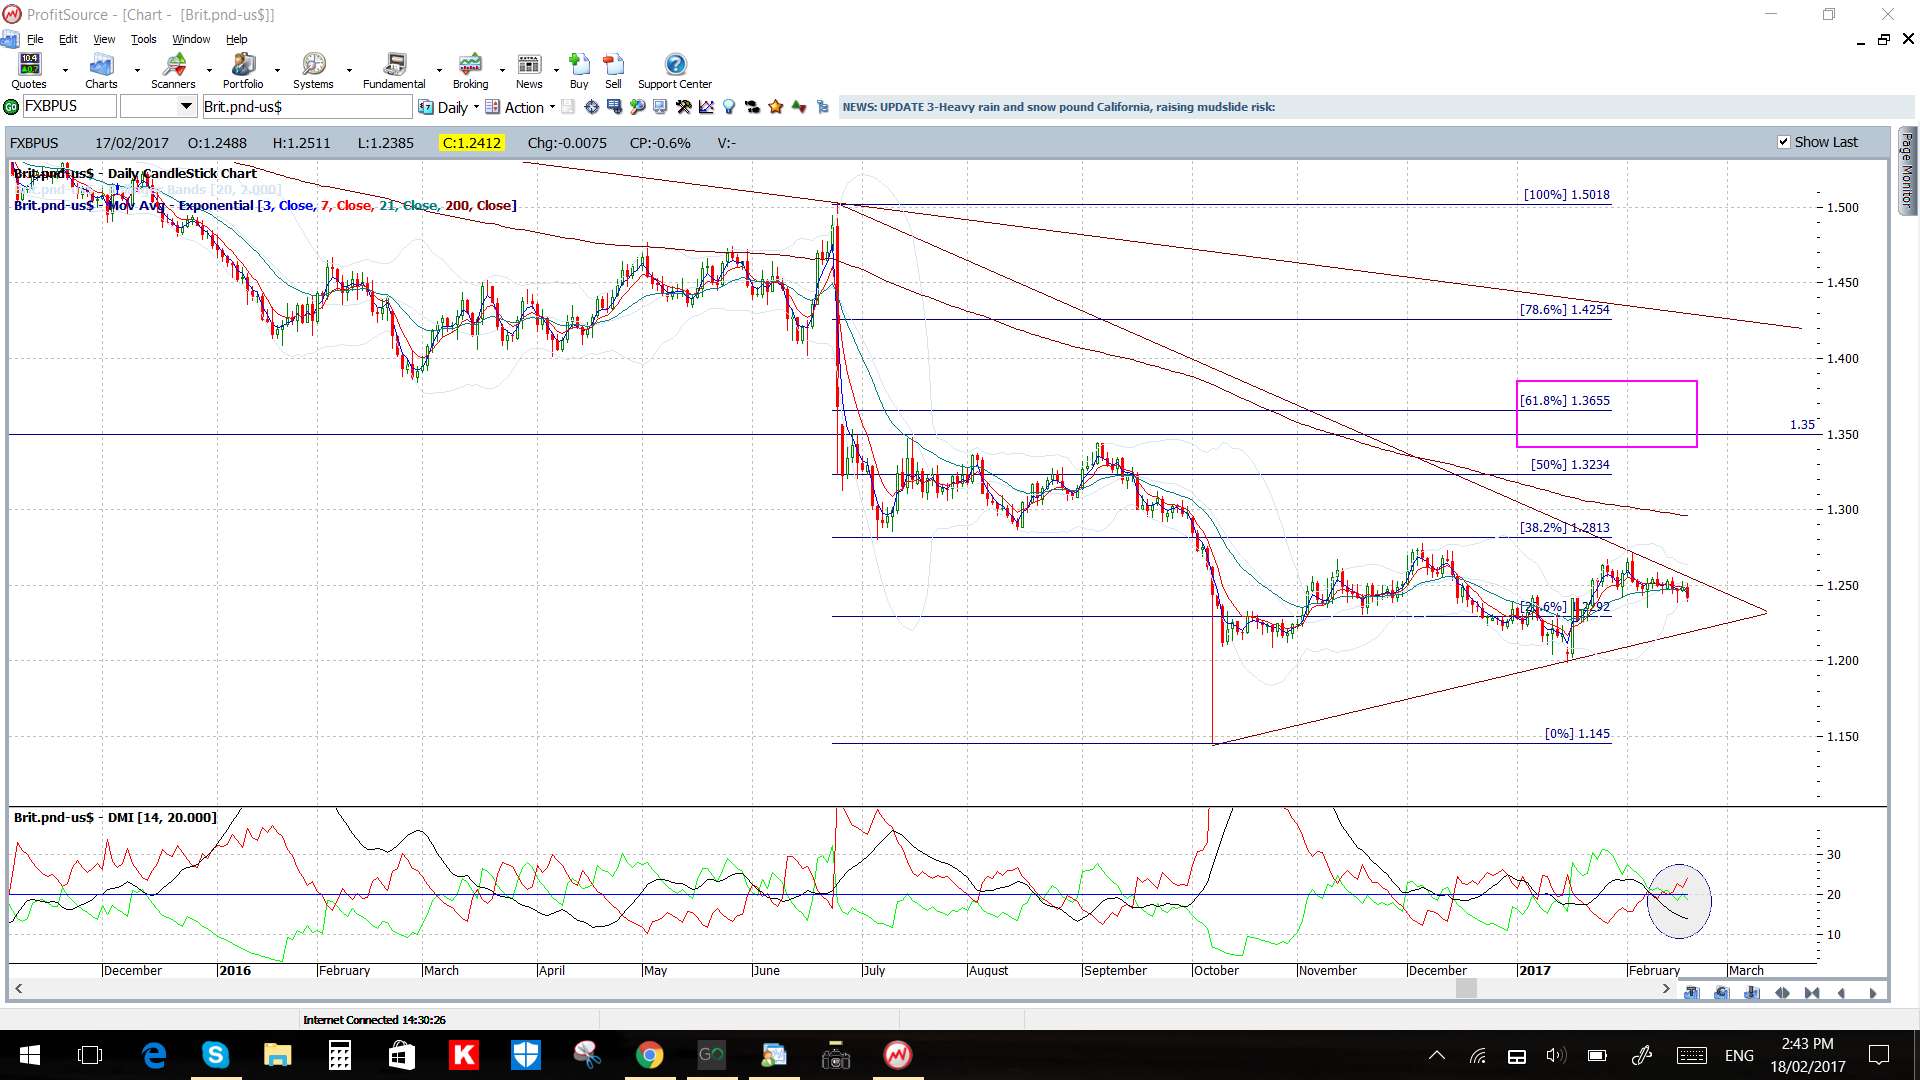
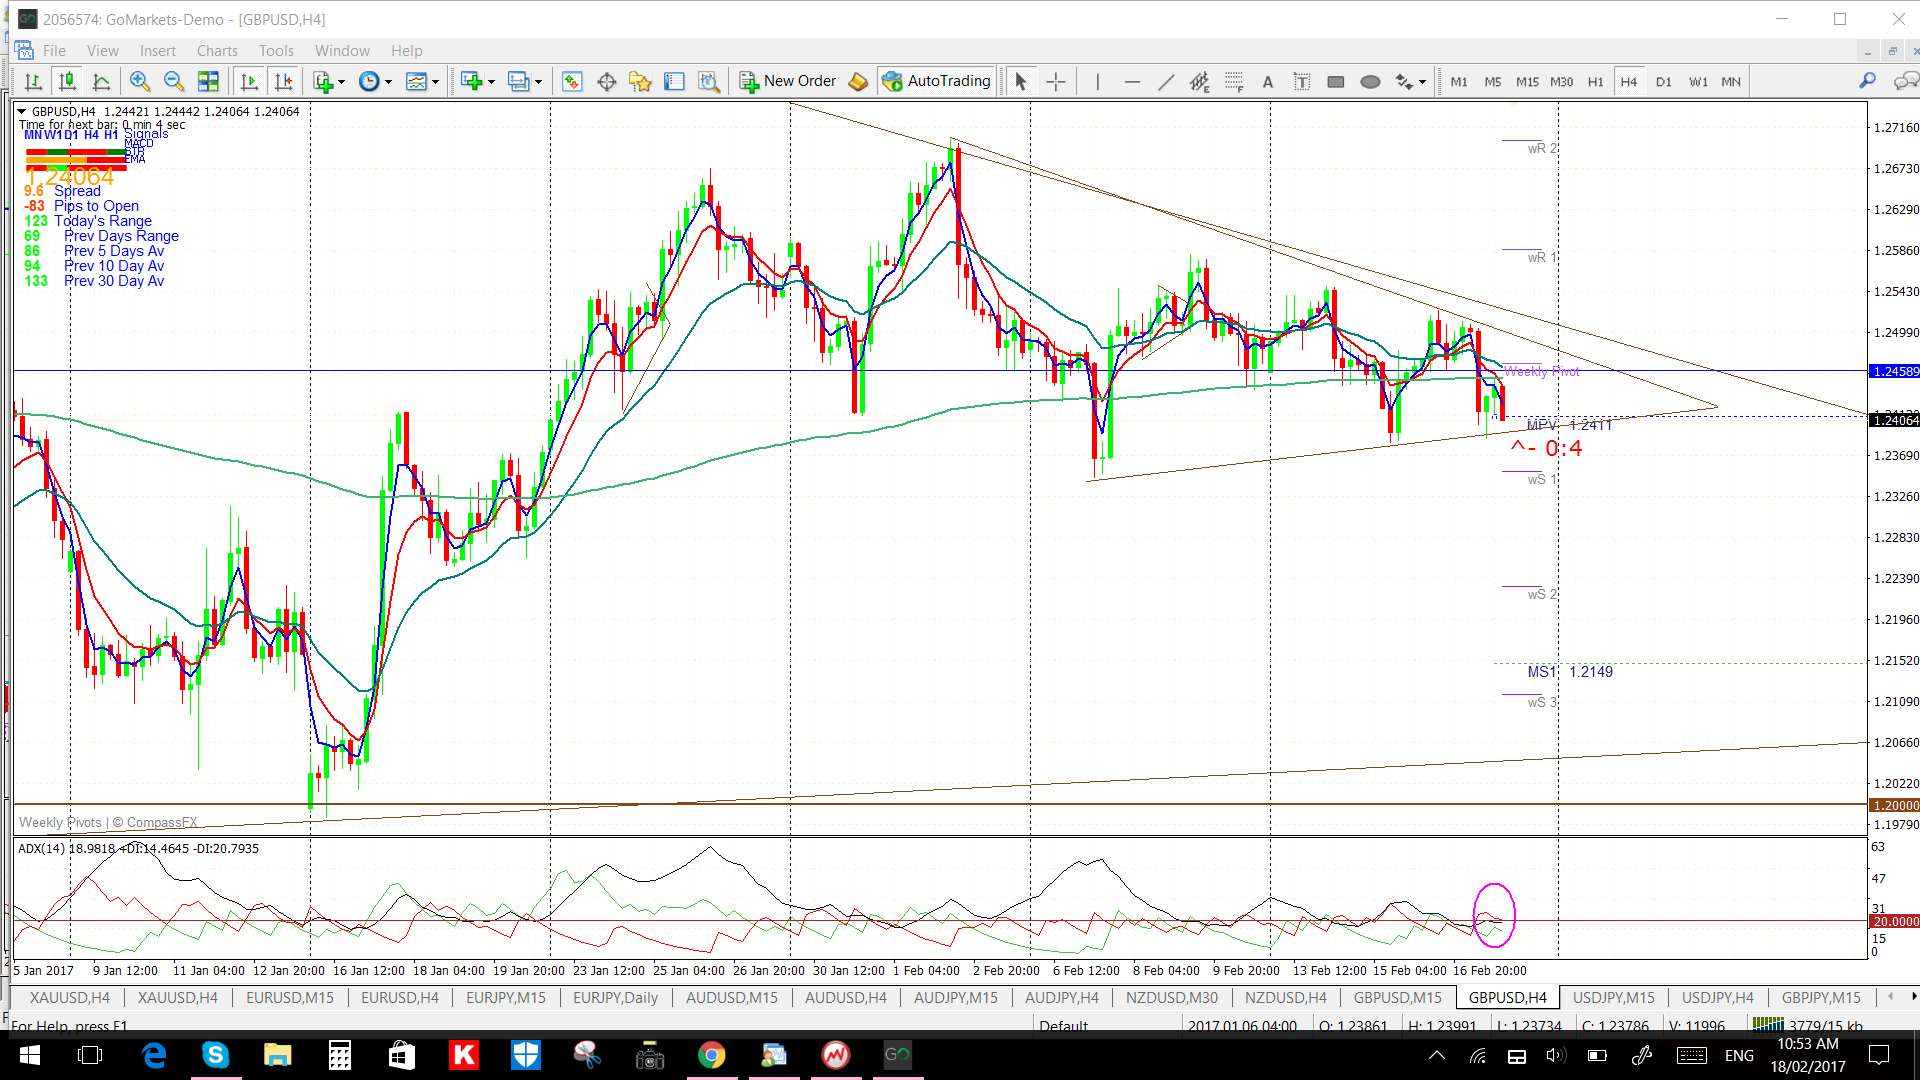
GBP/USD: This pair continues consolidating within a triangle on both the daily and 4hr chart time frames.
The Cable is below the 4hr Cloud but above the daily Cloud.
The weekly candle closed as a bearish coloured ‘Spinning Top’ reflecting indecision.
There isn’t much GBP data this week but keep an eye on these items:
- I’m watching the 4hr and daily chart’s triangle trend lines.
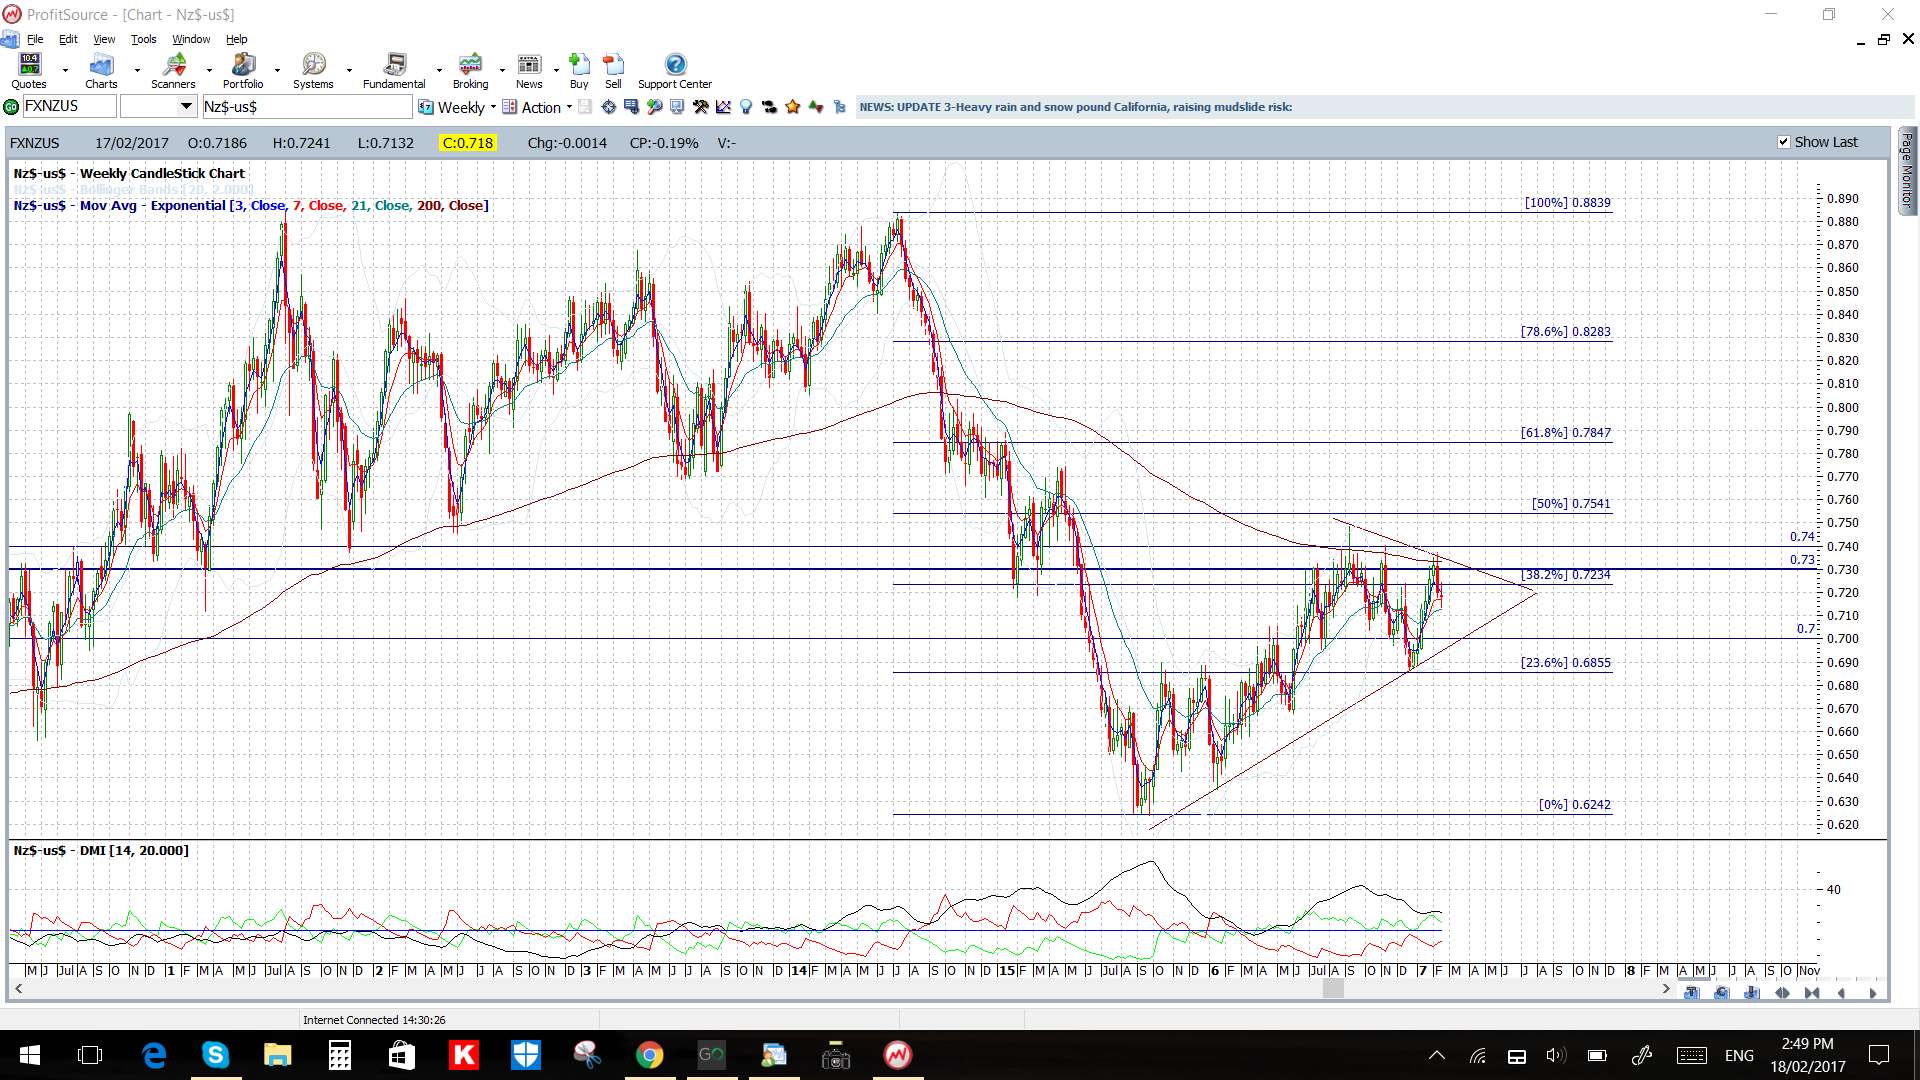
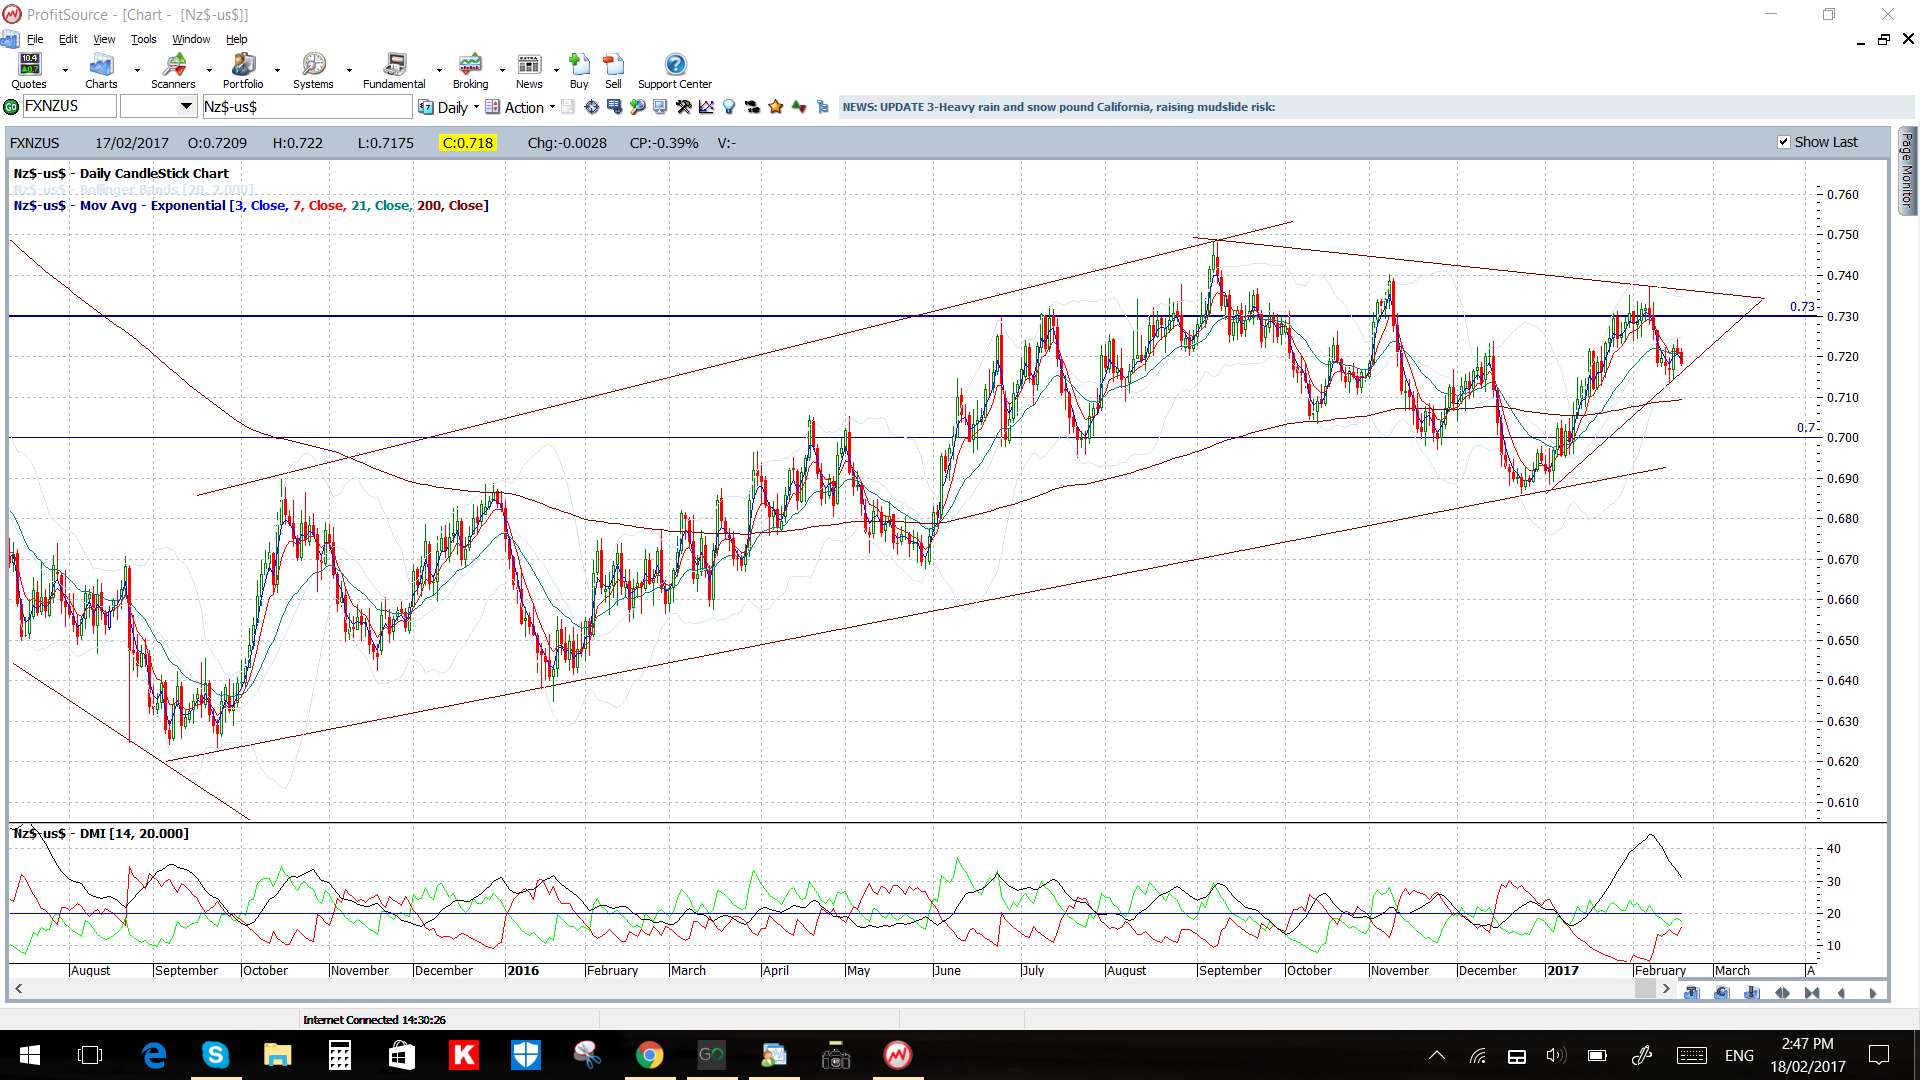
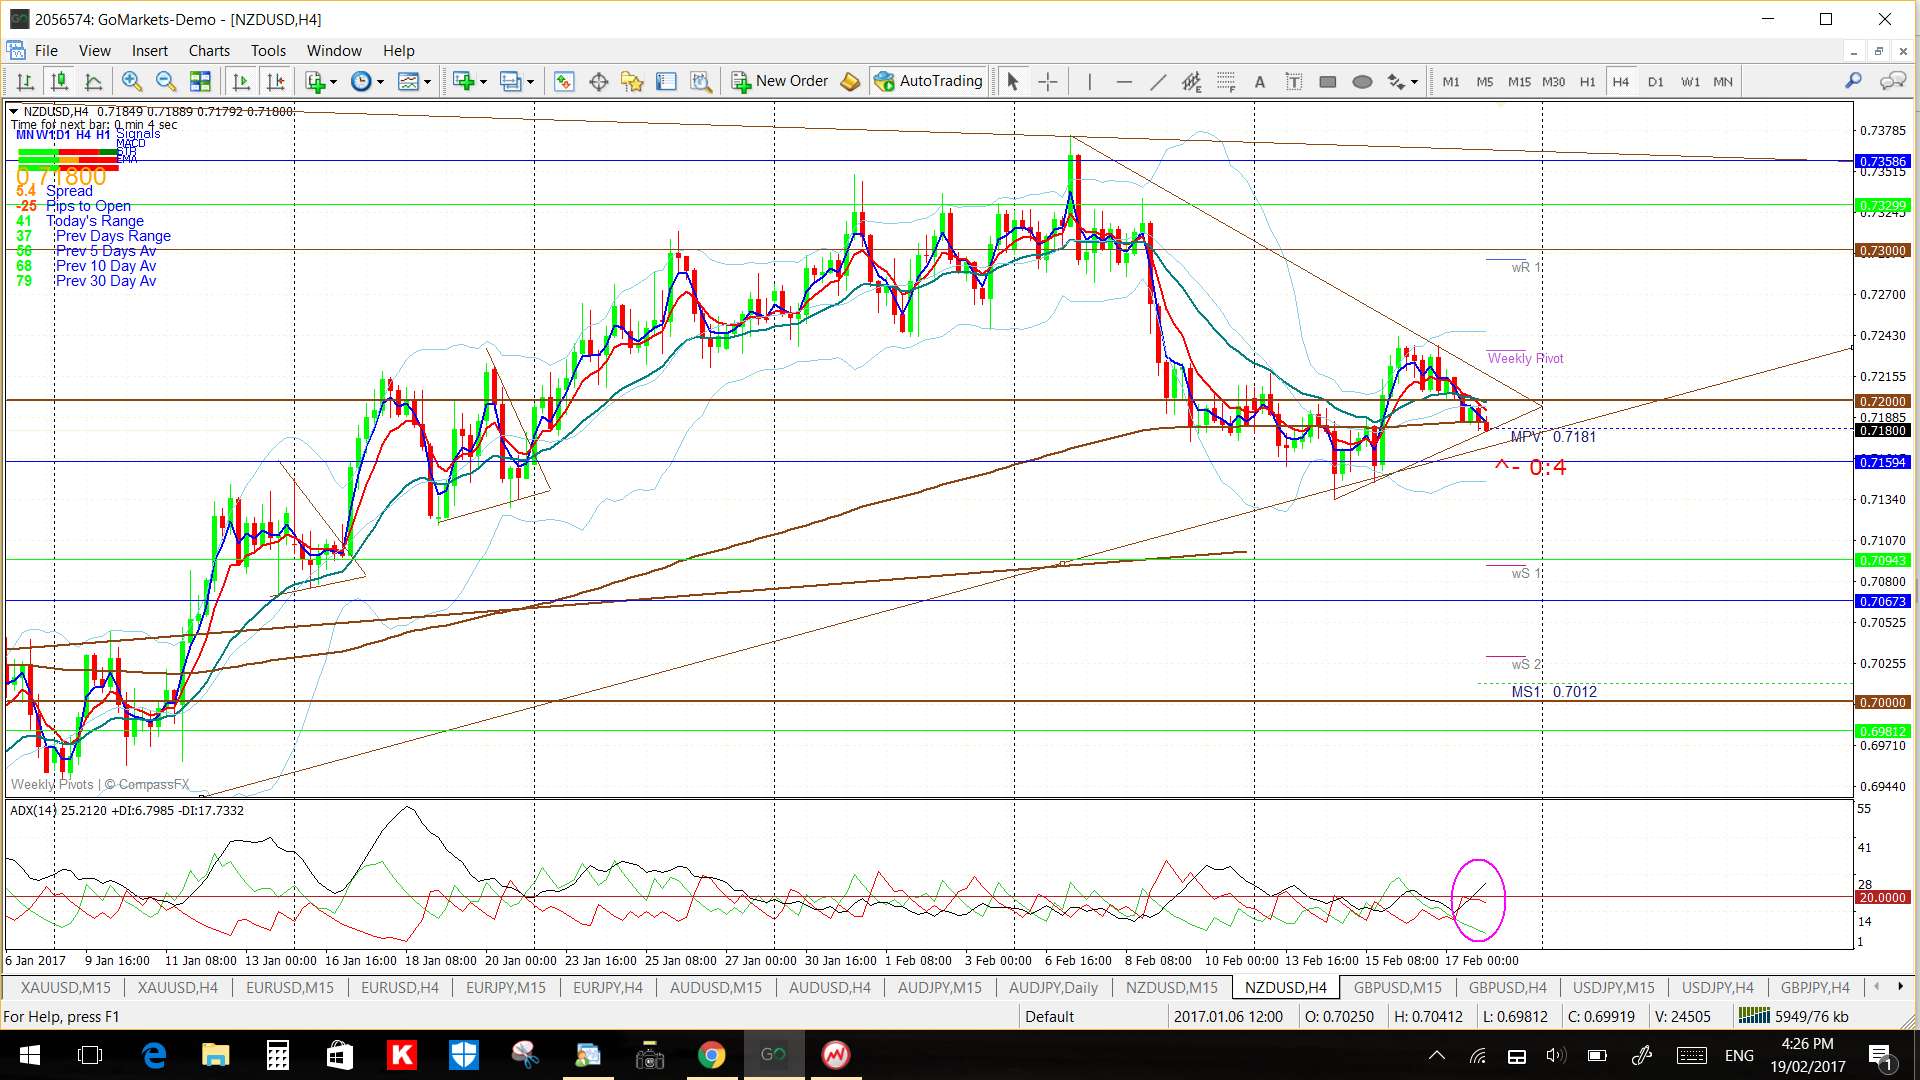
NZD/USD: This pair is trading within a 4hr chart triangle under the 0.73 and 0.74 S/R levels and this is set within a larger, weekly chart triangle.
The Kiwi is trading below the 4hr Cloud but above the daily Cloud.
The weekly candle closed as a bearish coloured Spinning Top reflecting indecision.
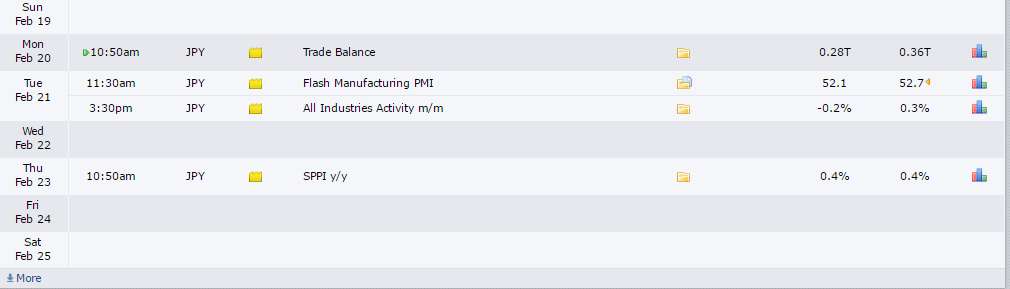
There are a couple of high impact NZD data items with PPI first up on my Monday morning:
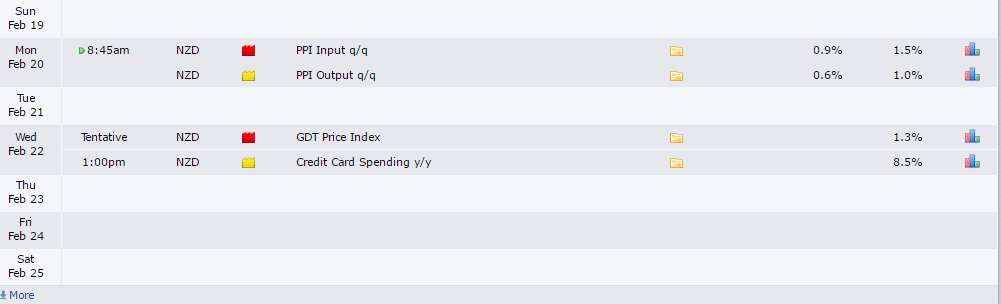
- I’m watching the 4hr chart’s triangle trend lines and 0.73 / 0.74 levels.

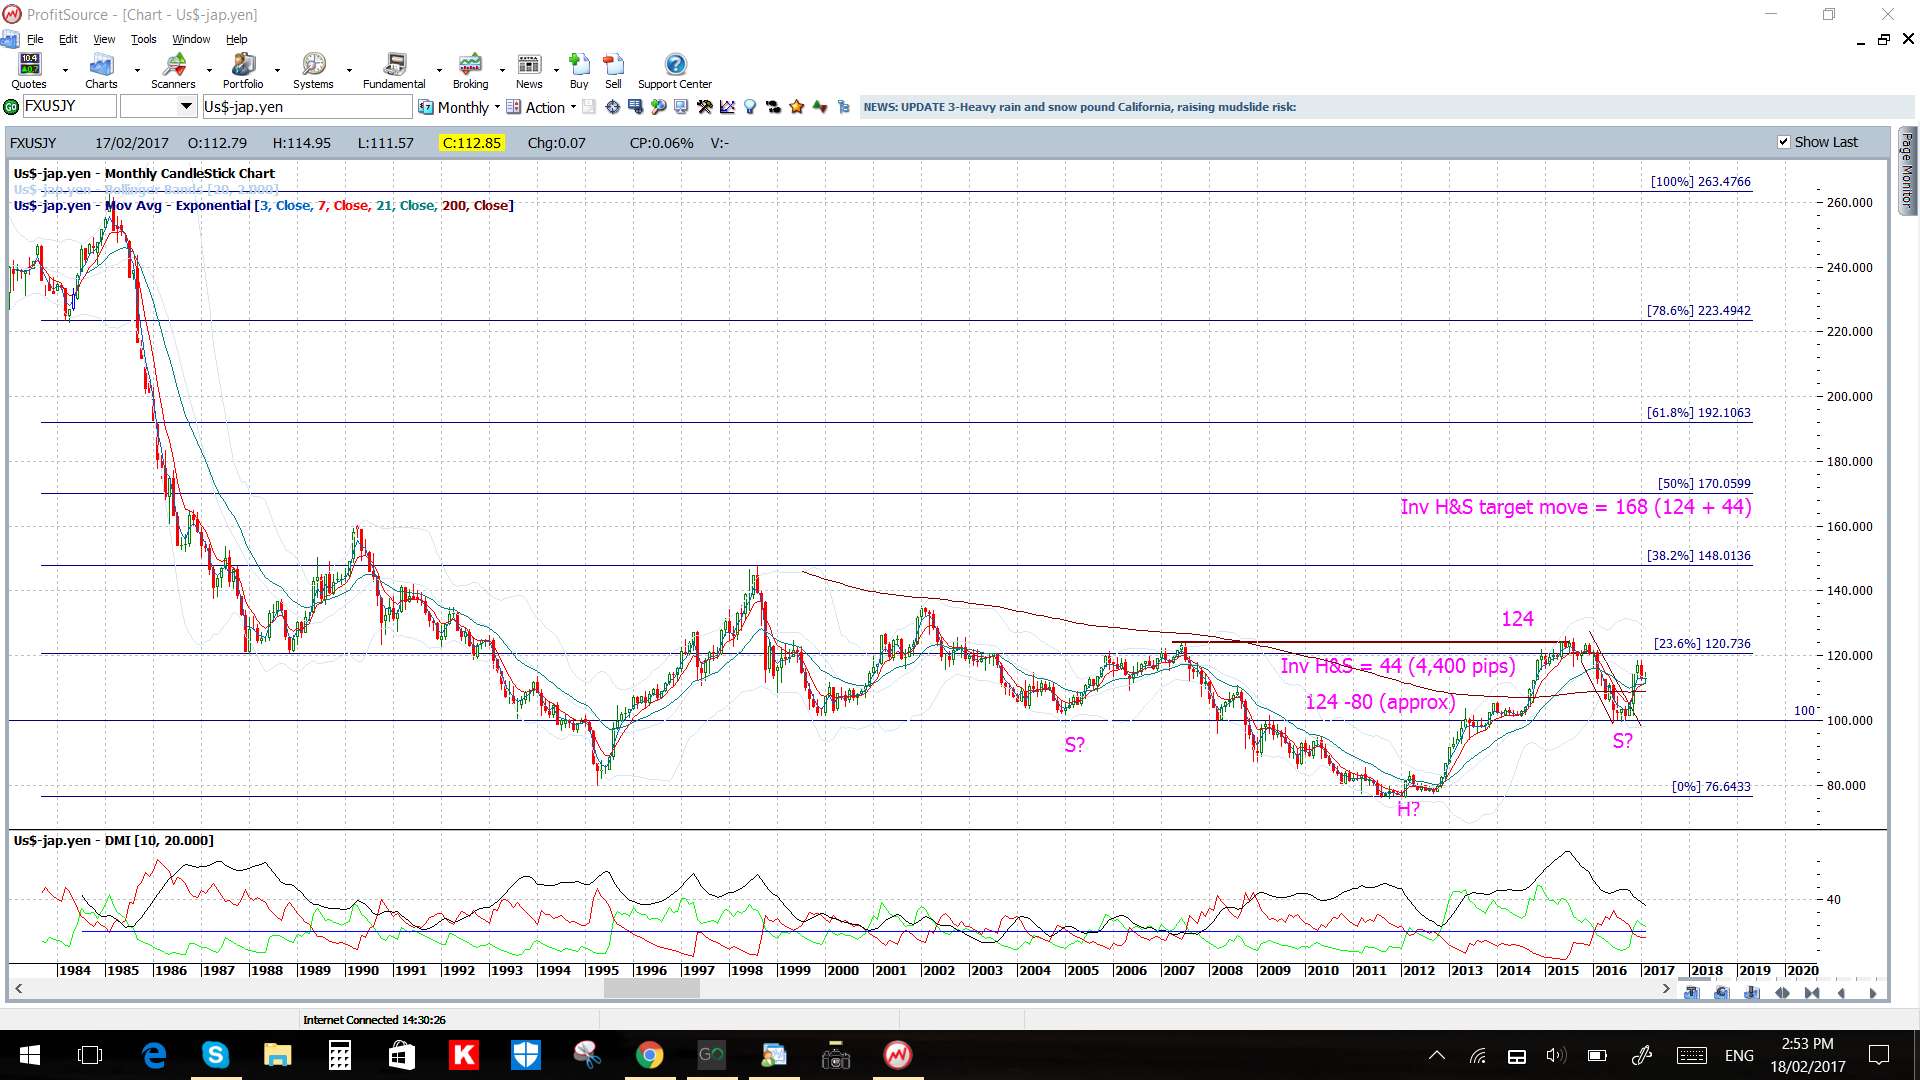
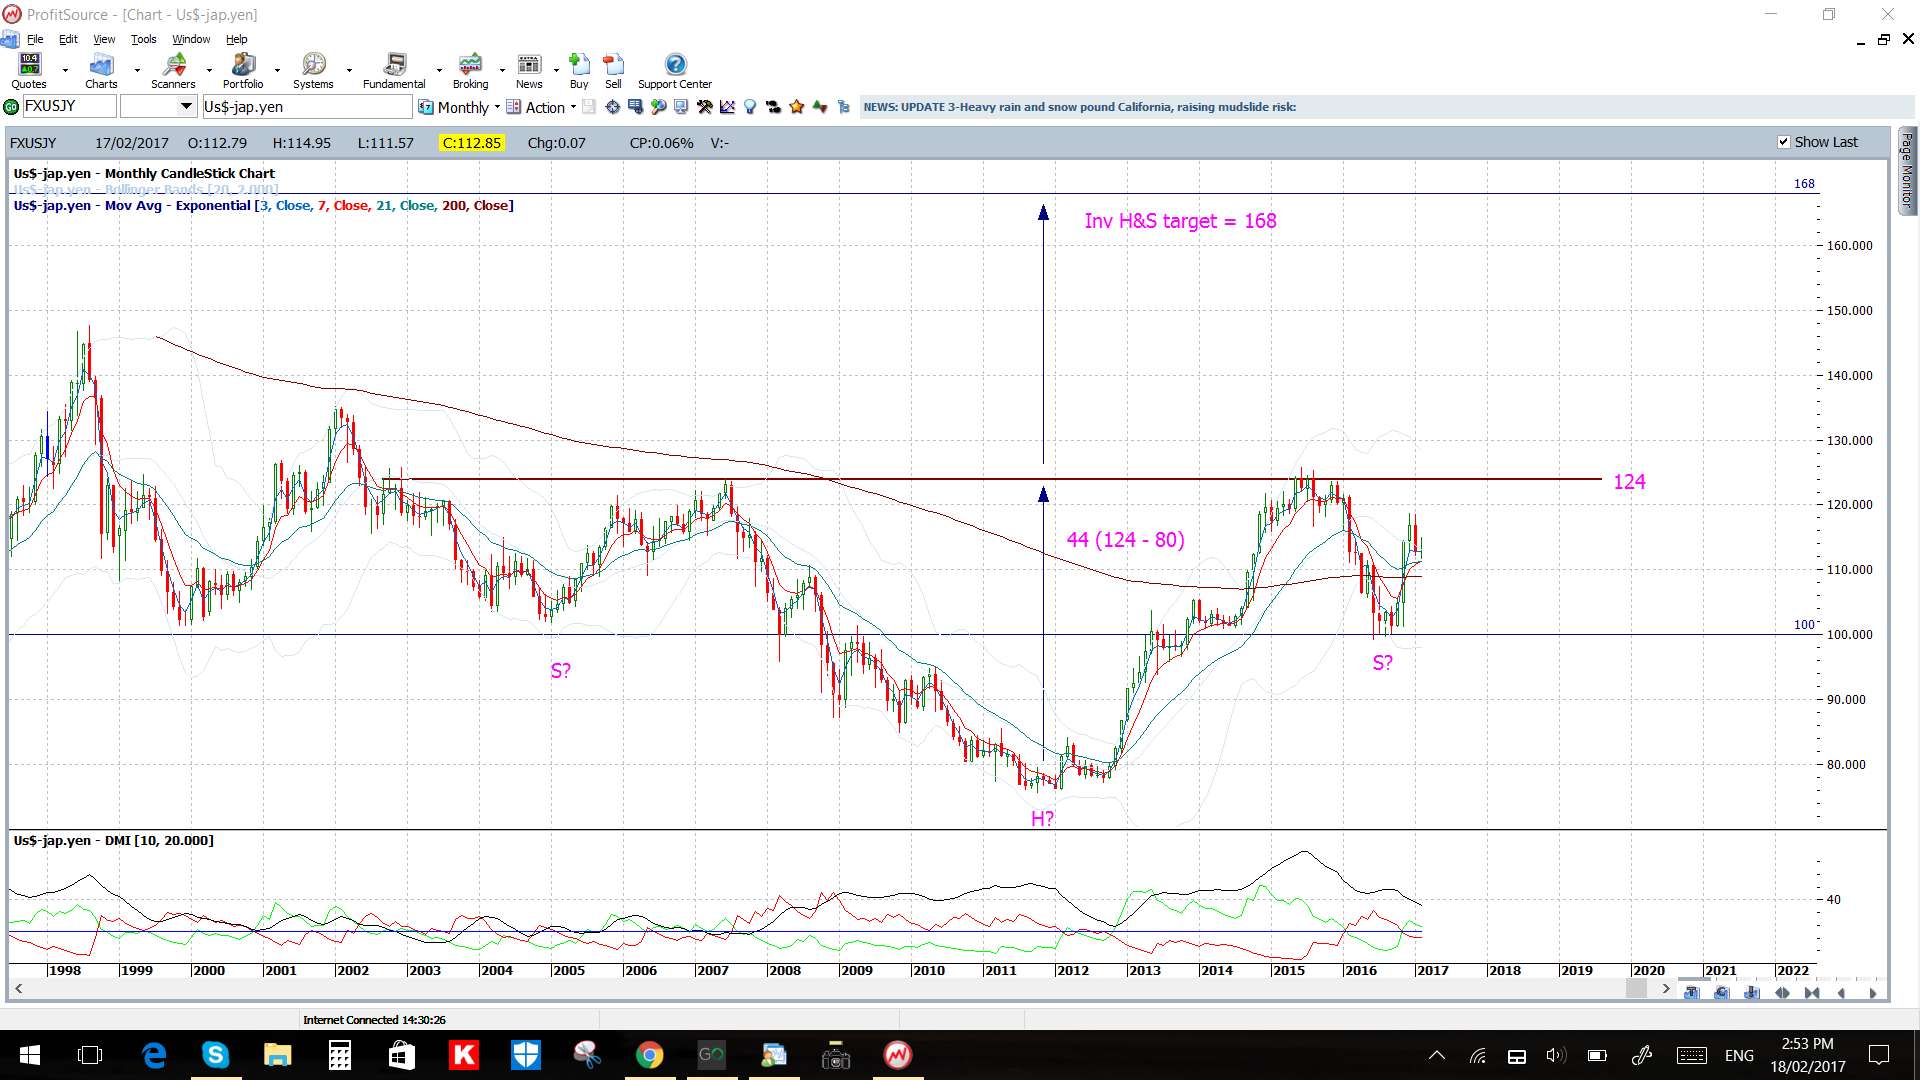
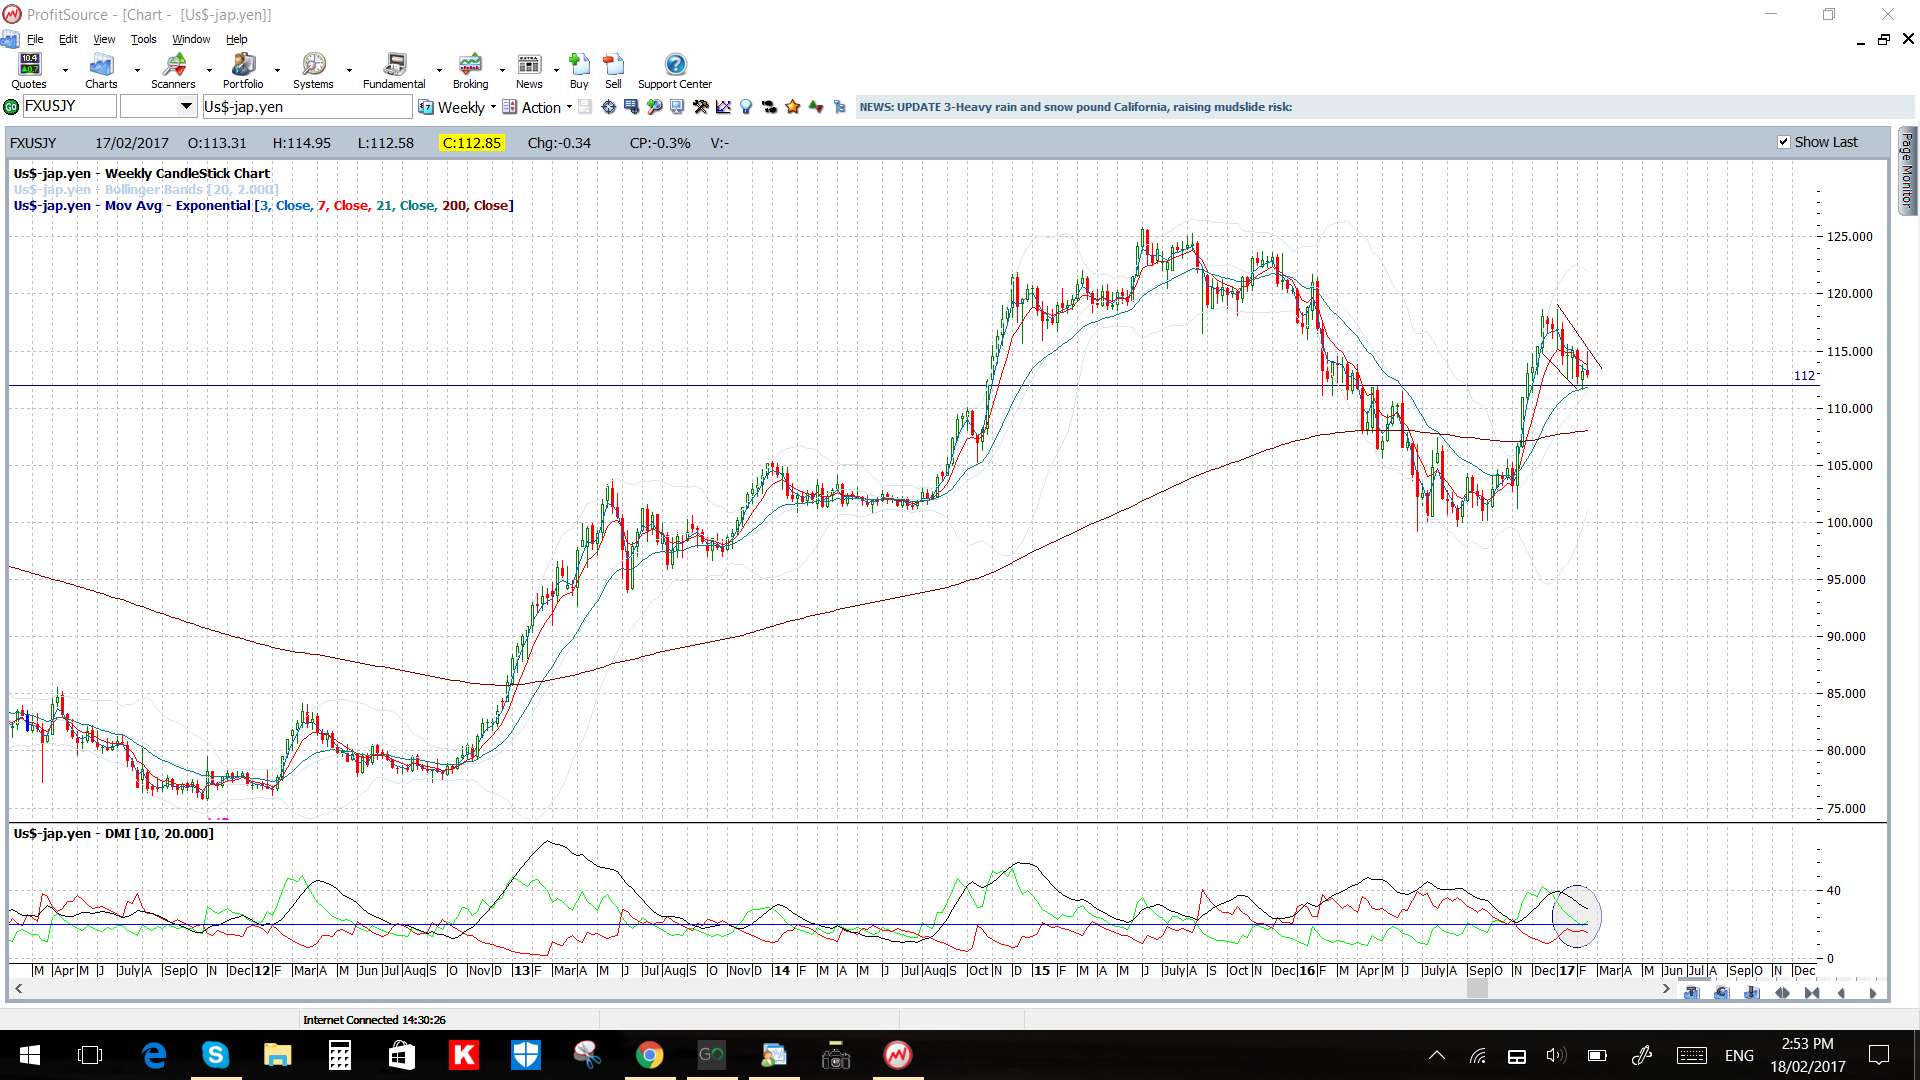
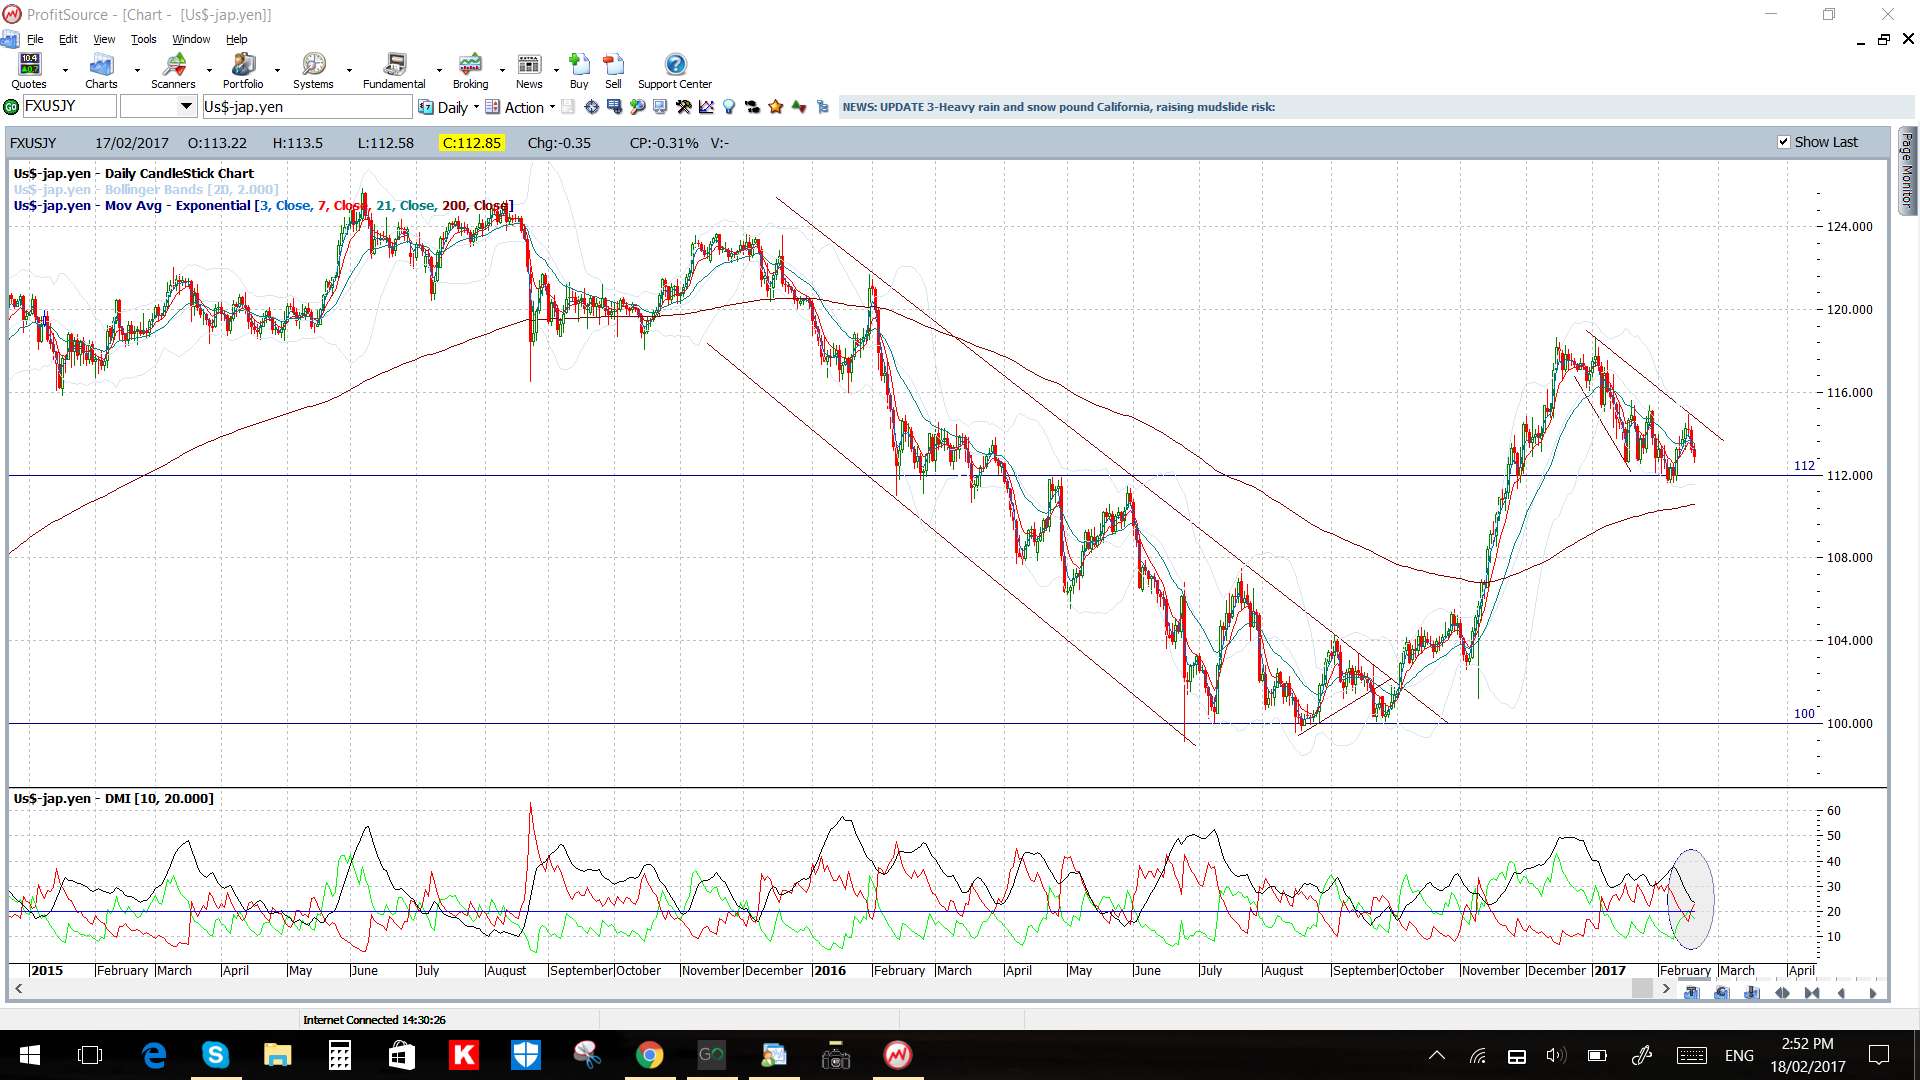
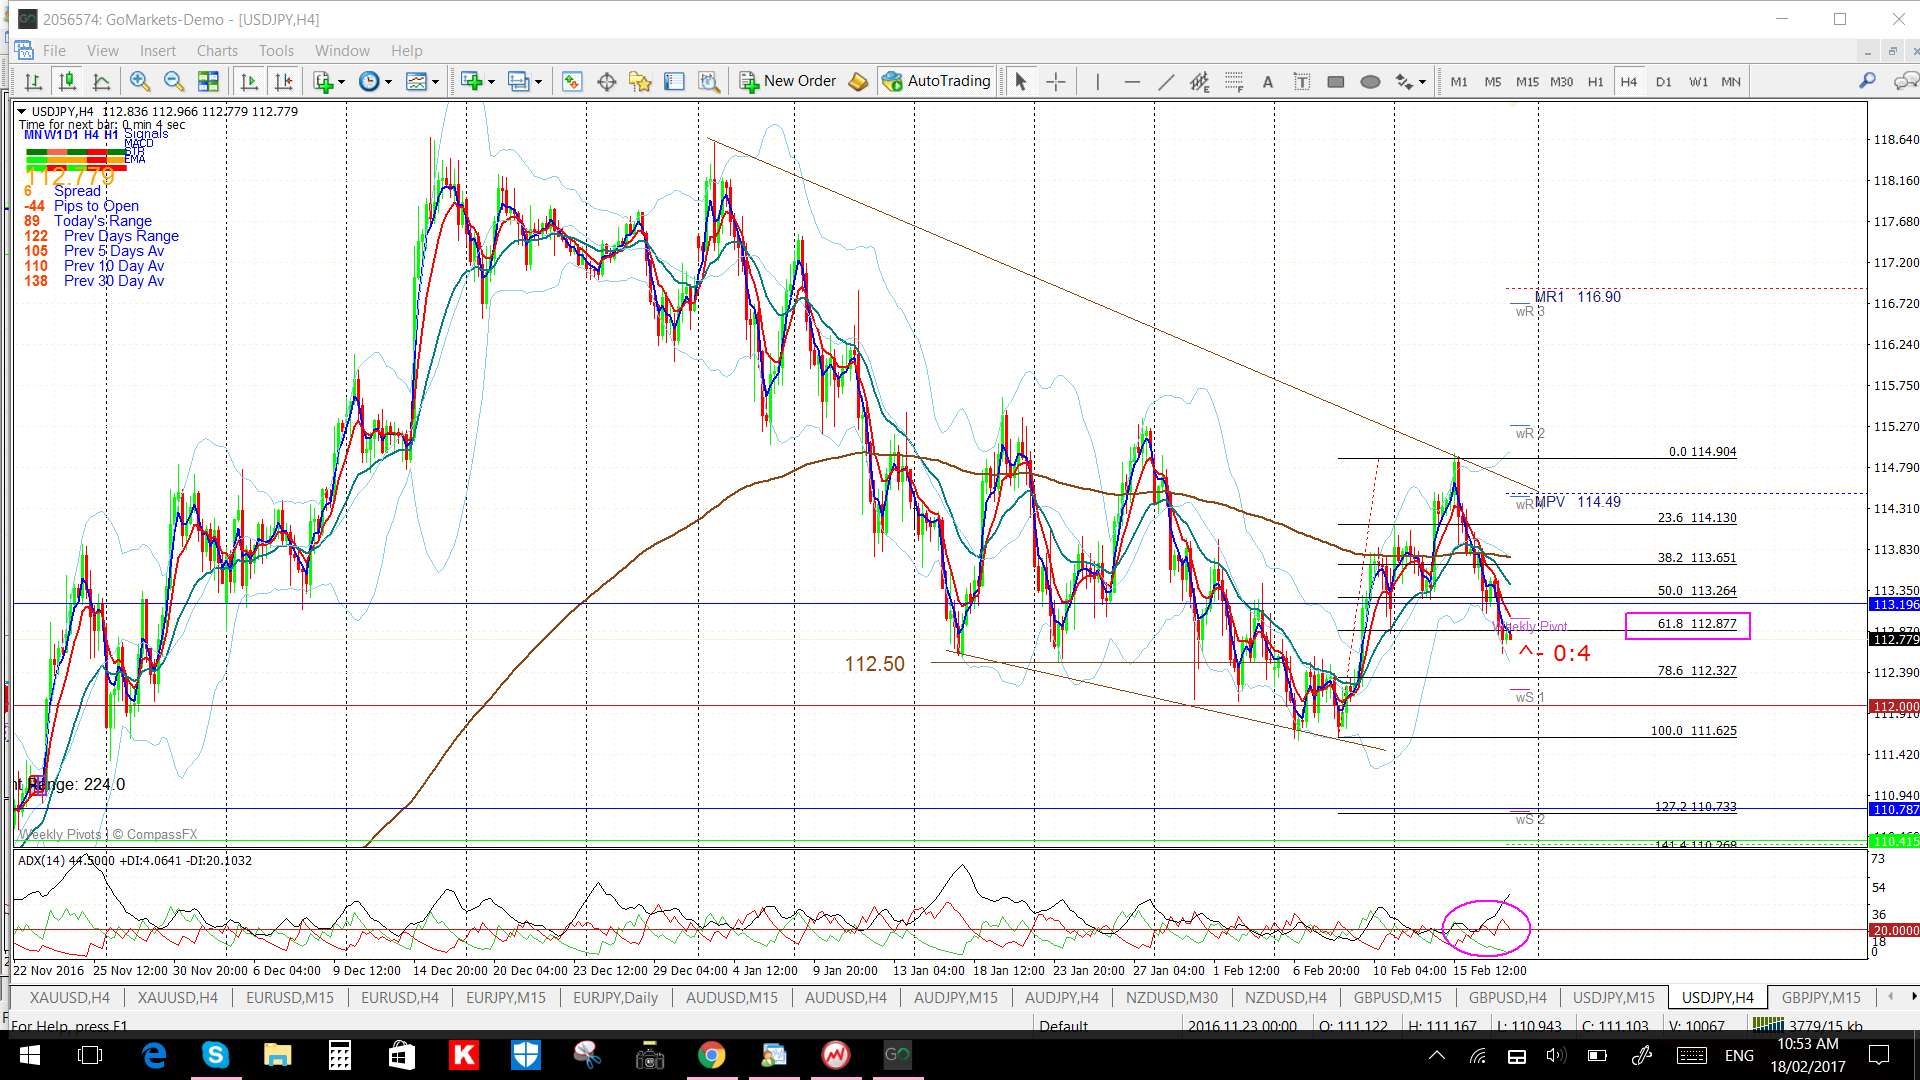
USD/JPY: Last week’s Yen strength resulted in this pair pulling back and it closed below the 61.8% fib of the recent swing high move. This move brings the 112.50 and 112 levels, as recent S/R, back into focus.
Price is just below the 4hr Cloud but in the daily Cloud.
The weekly candle was bearish.
There are only a few third tier JPY data items but keep an eye on all of the US data as well:
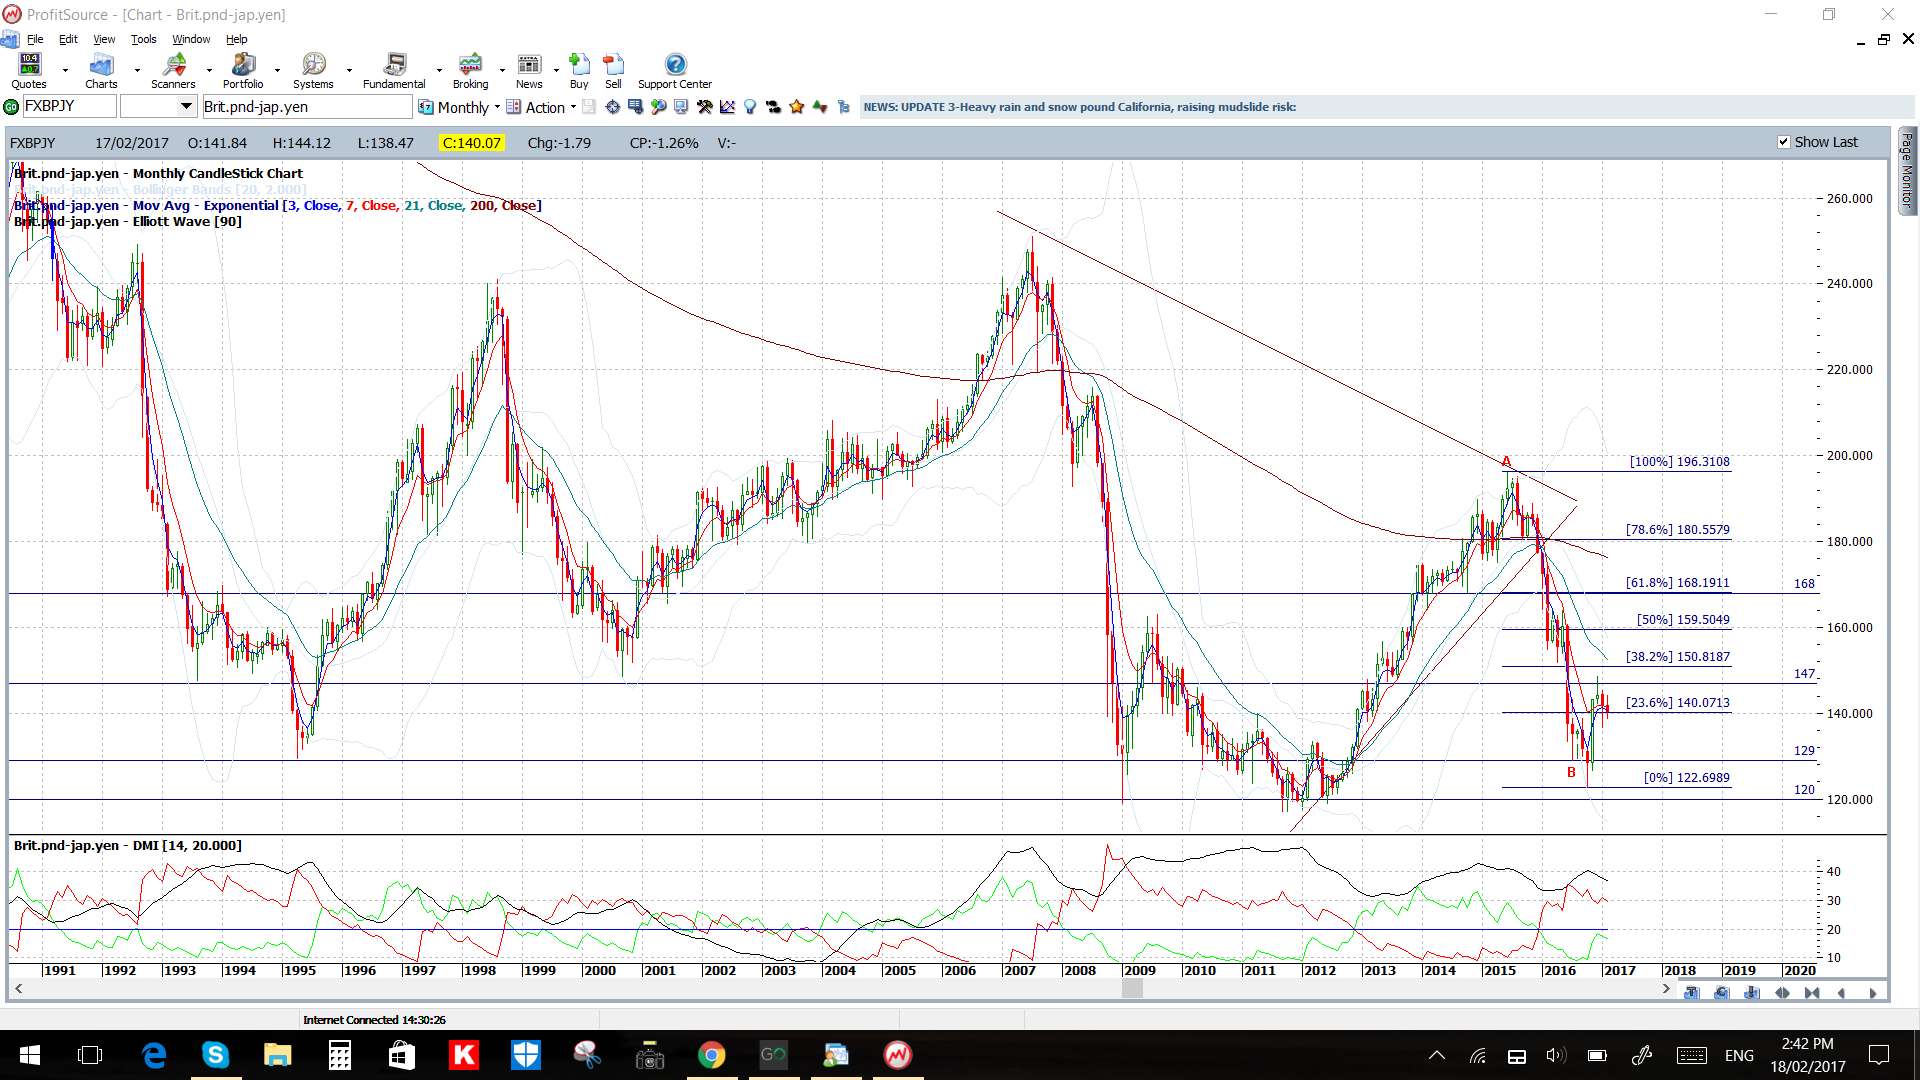
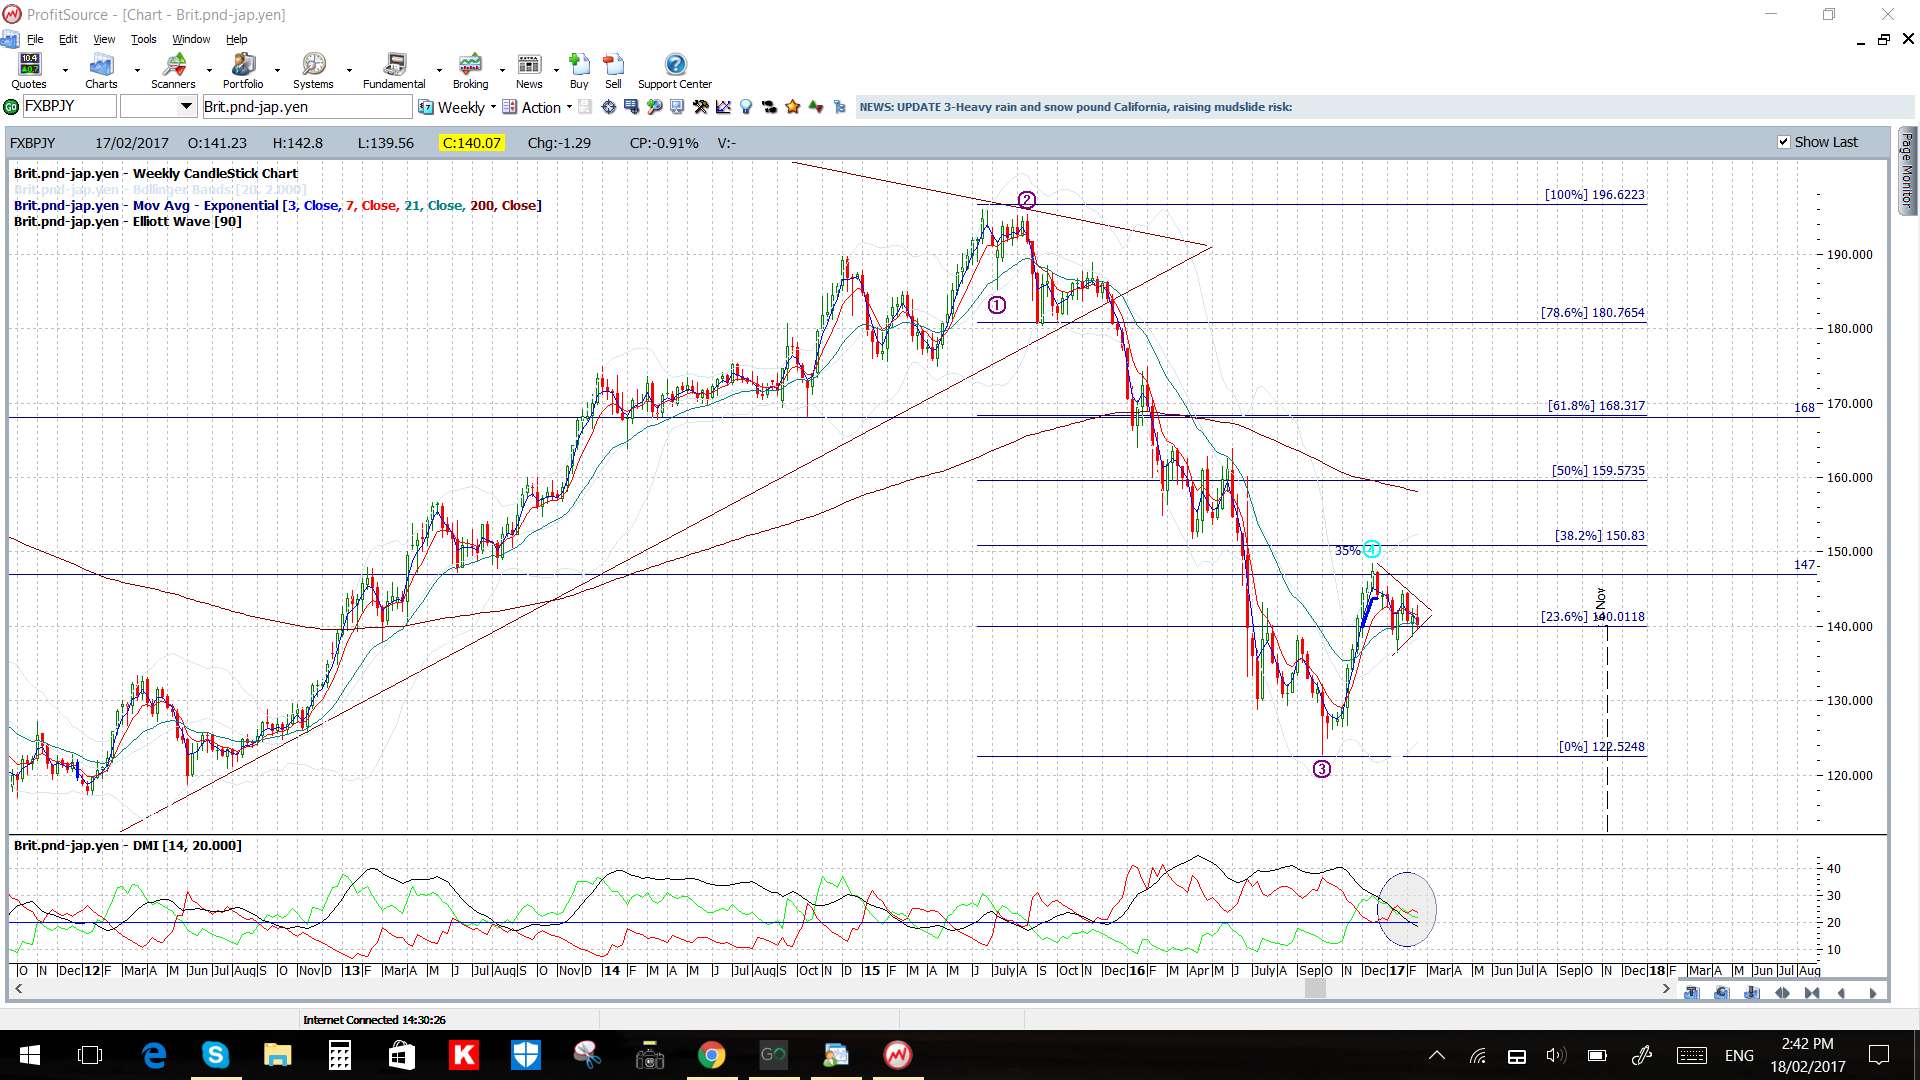
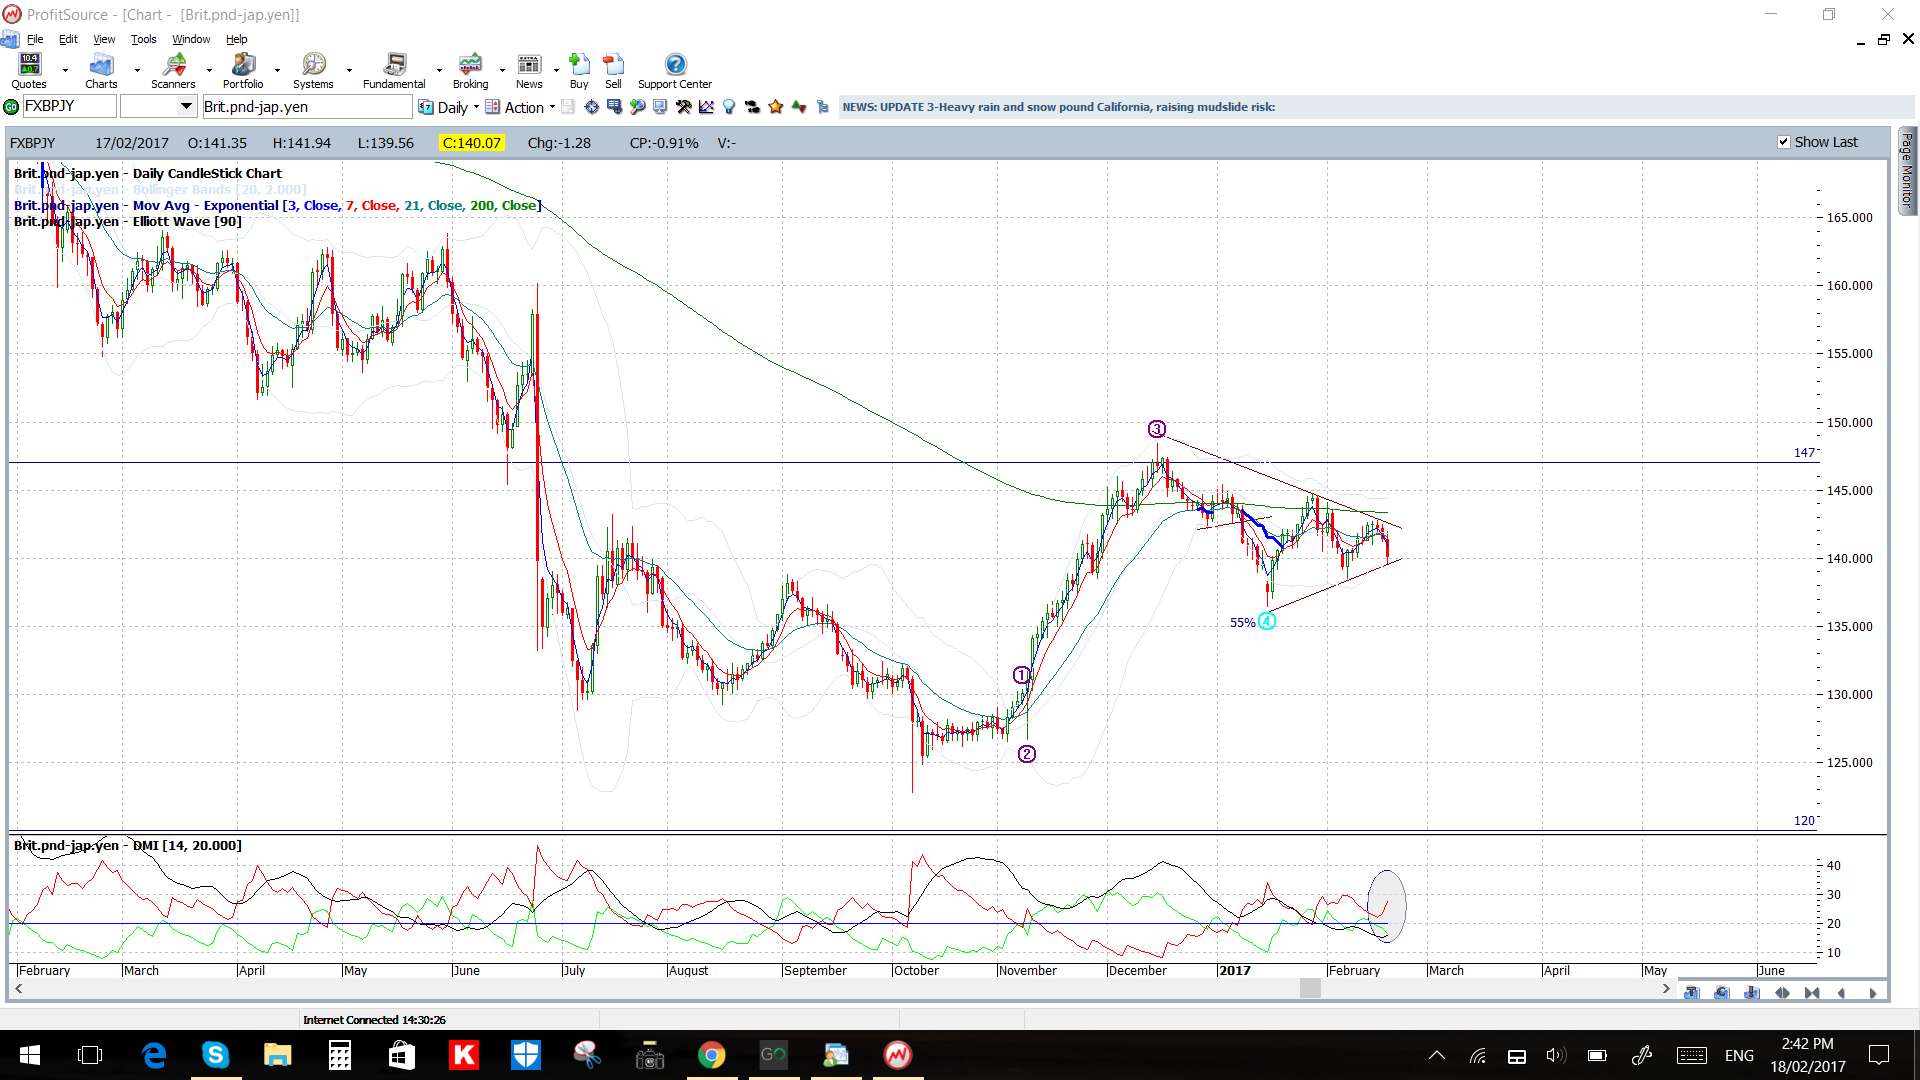
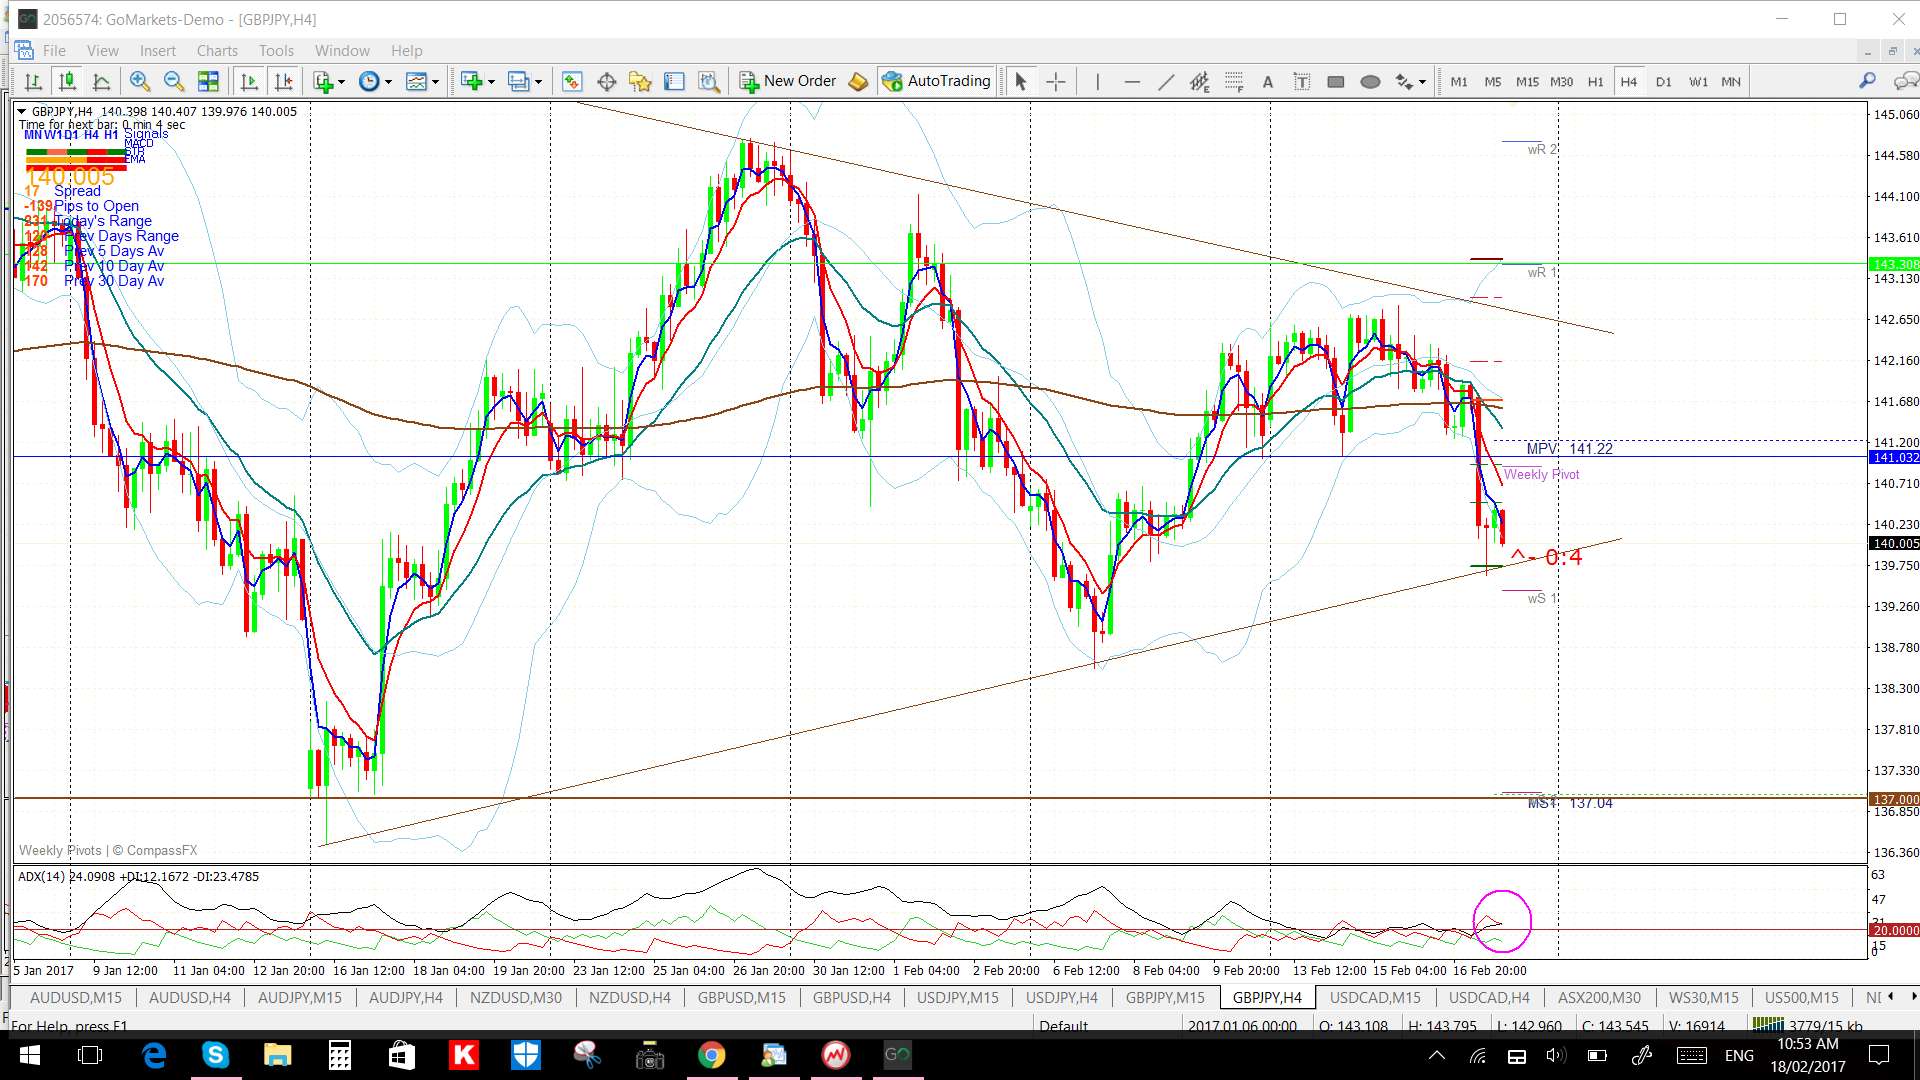
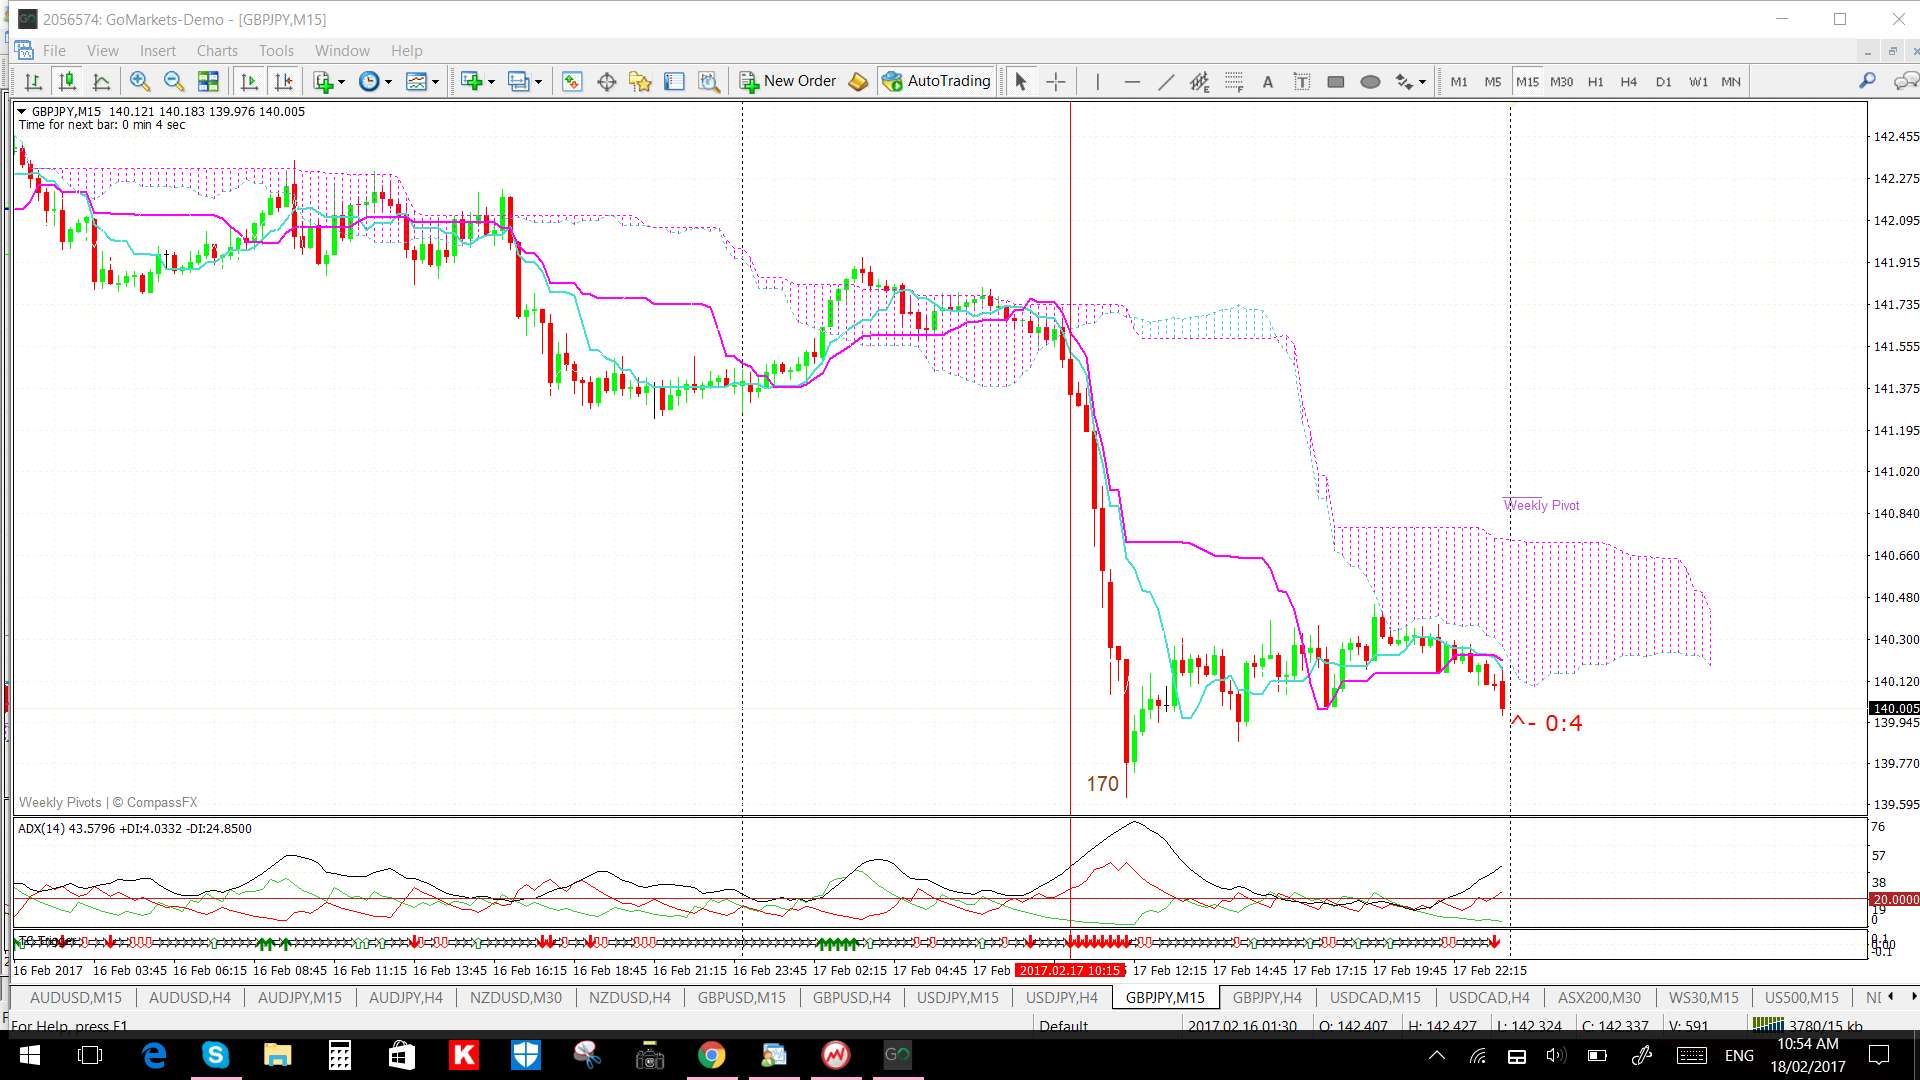
GBP/JPY: Yen strength resulted in this pair pulling lower bit it is still trading within a symmetrical triangle under the 143 S/R region.
- A bullish b/o will have me looking up to the 143 S/R level.
- A bearish b/o will have me looking to the 137 S/R level.
This was another pair that gave a great potential SHORT trade off the 15 min charts using my algo on Friday.
Price is below the 4hr Cloud but in the daily Cloud.
The weekly candle was a bearish coloured Spinning Top candle.
Watch out for impact from the following data items:
- I’m watching the triangle trend lines.
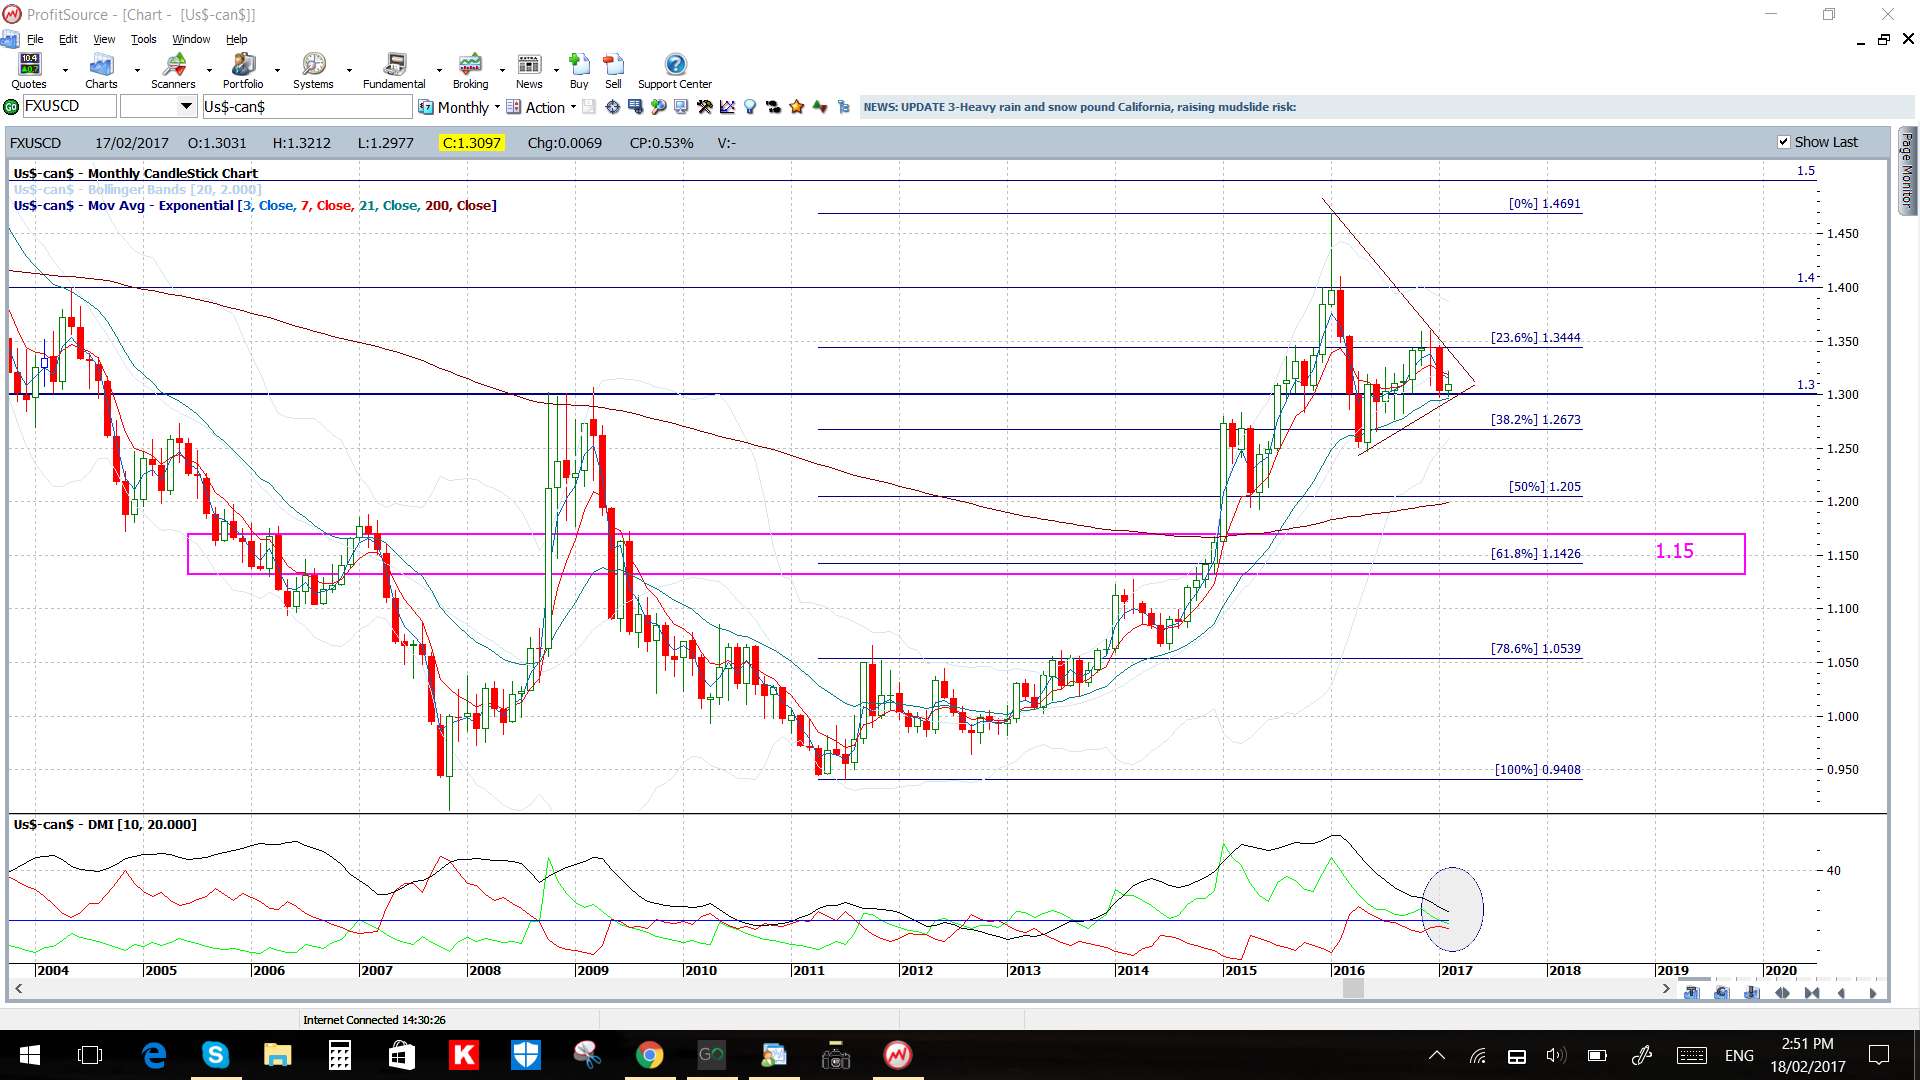
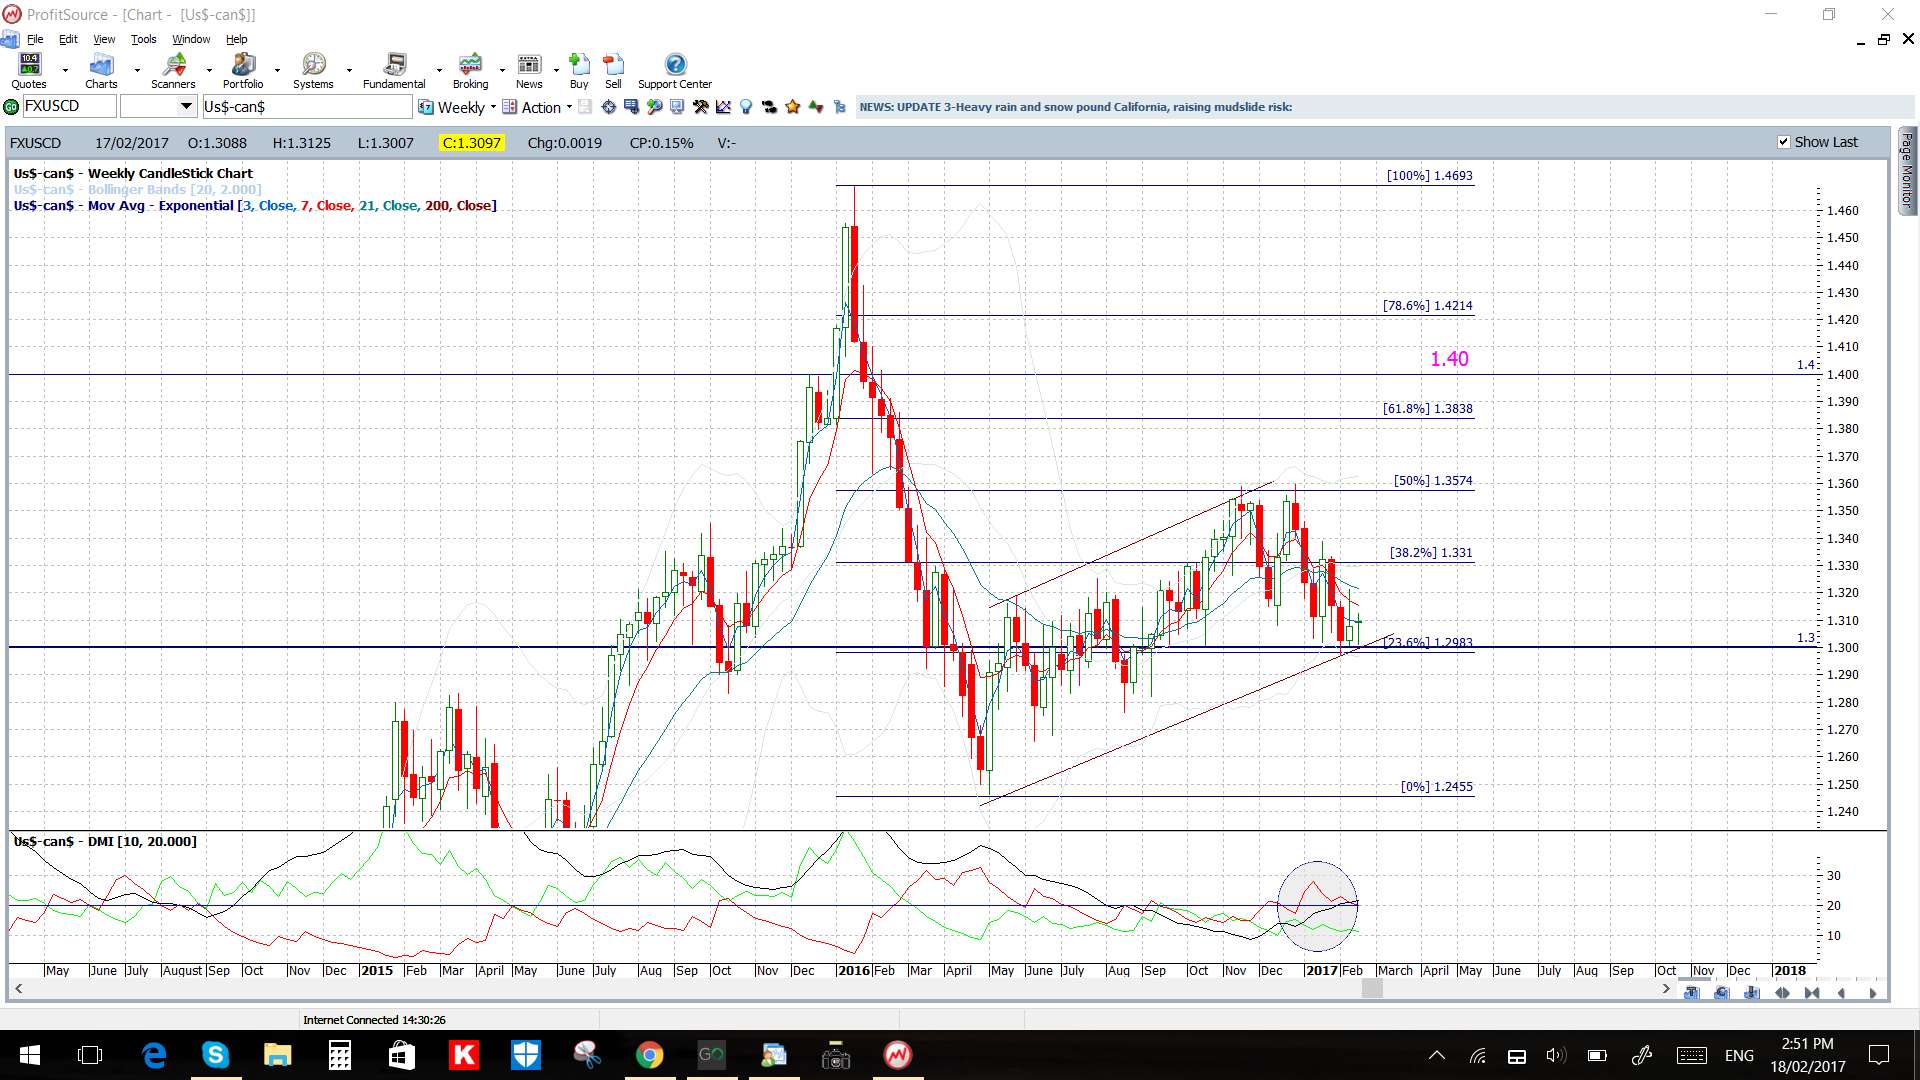
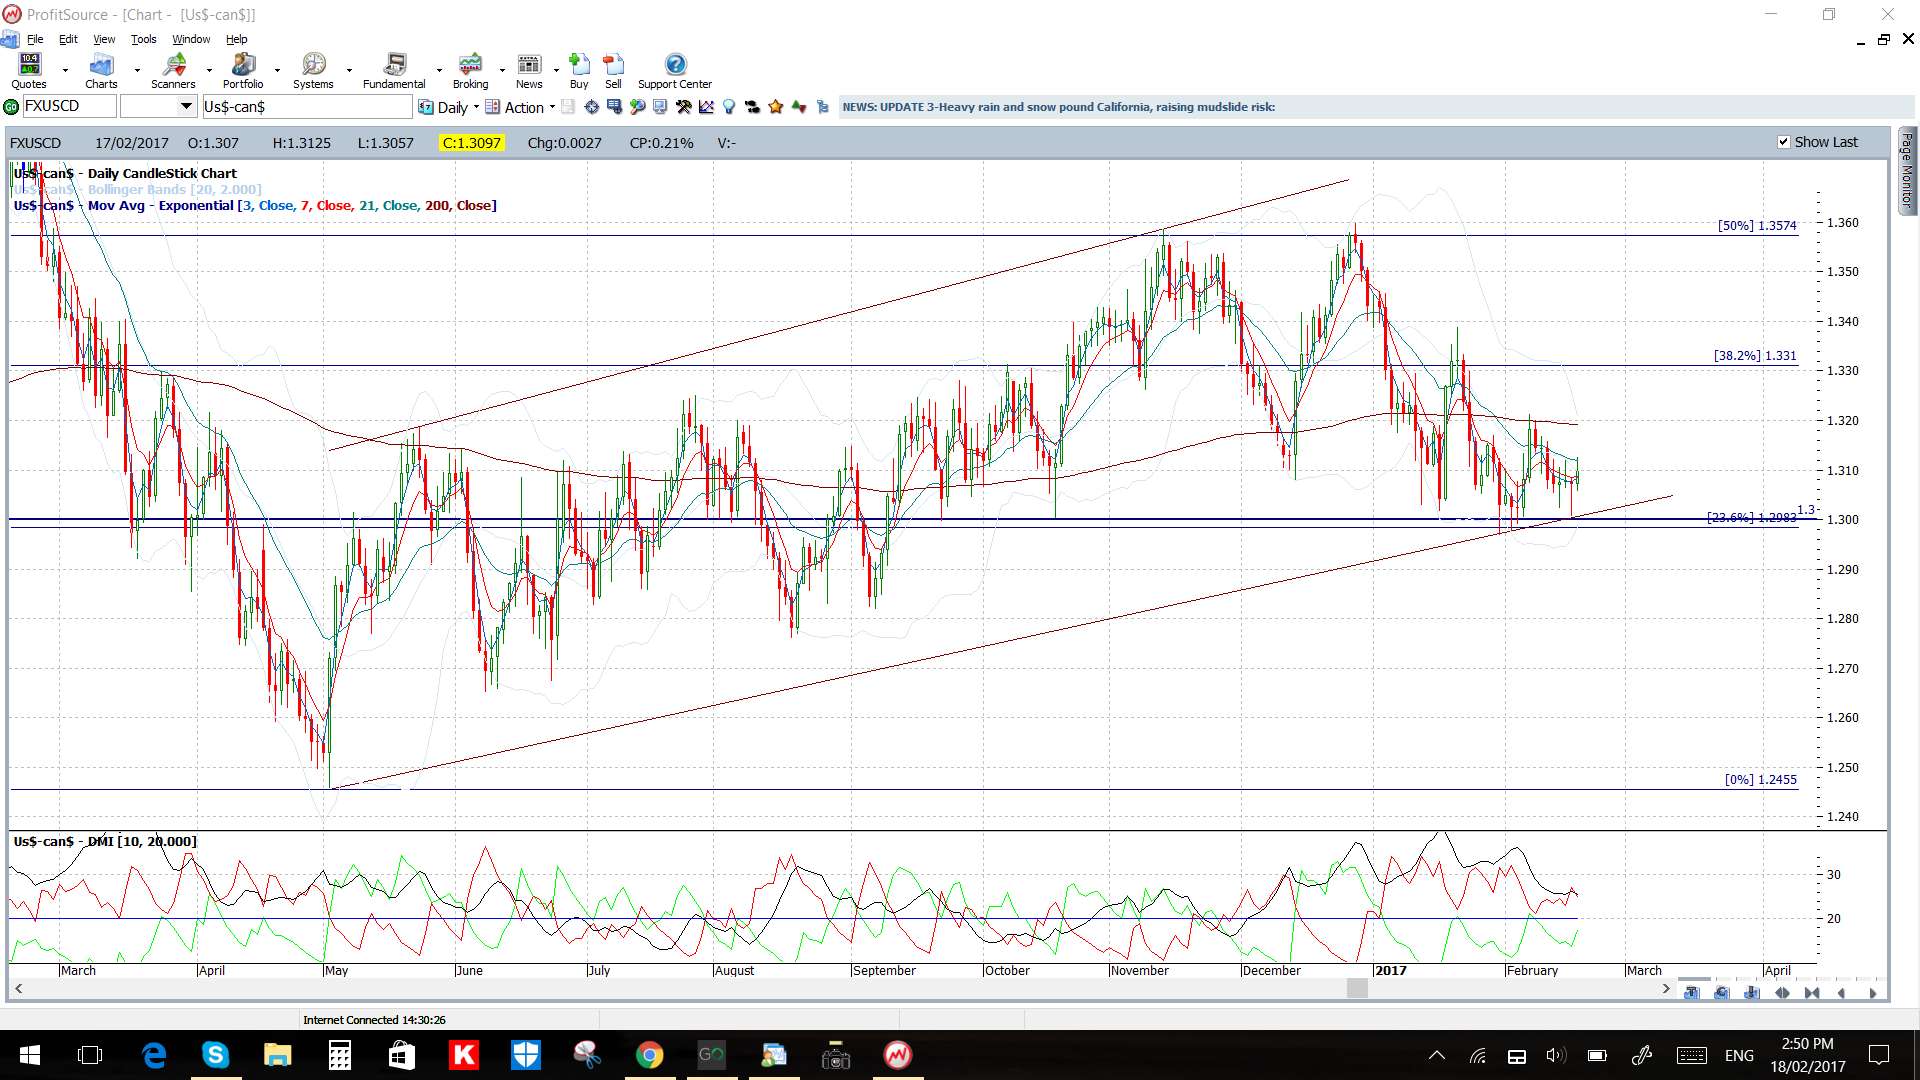
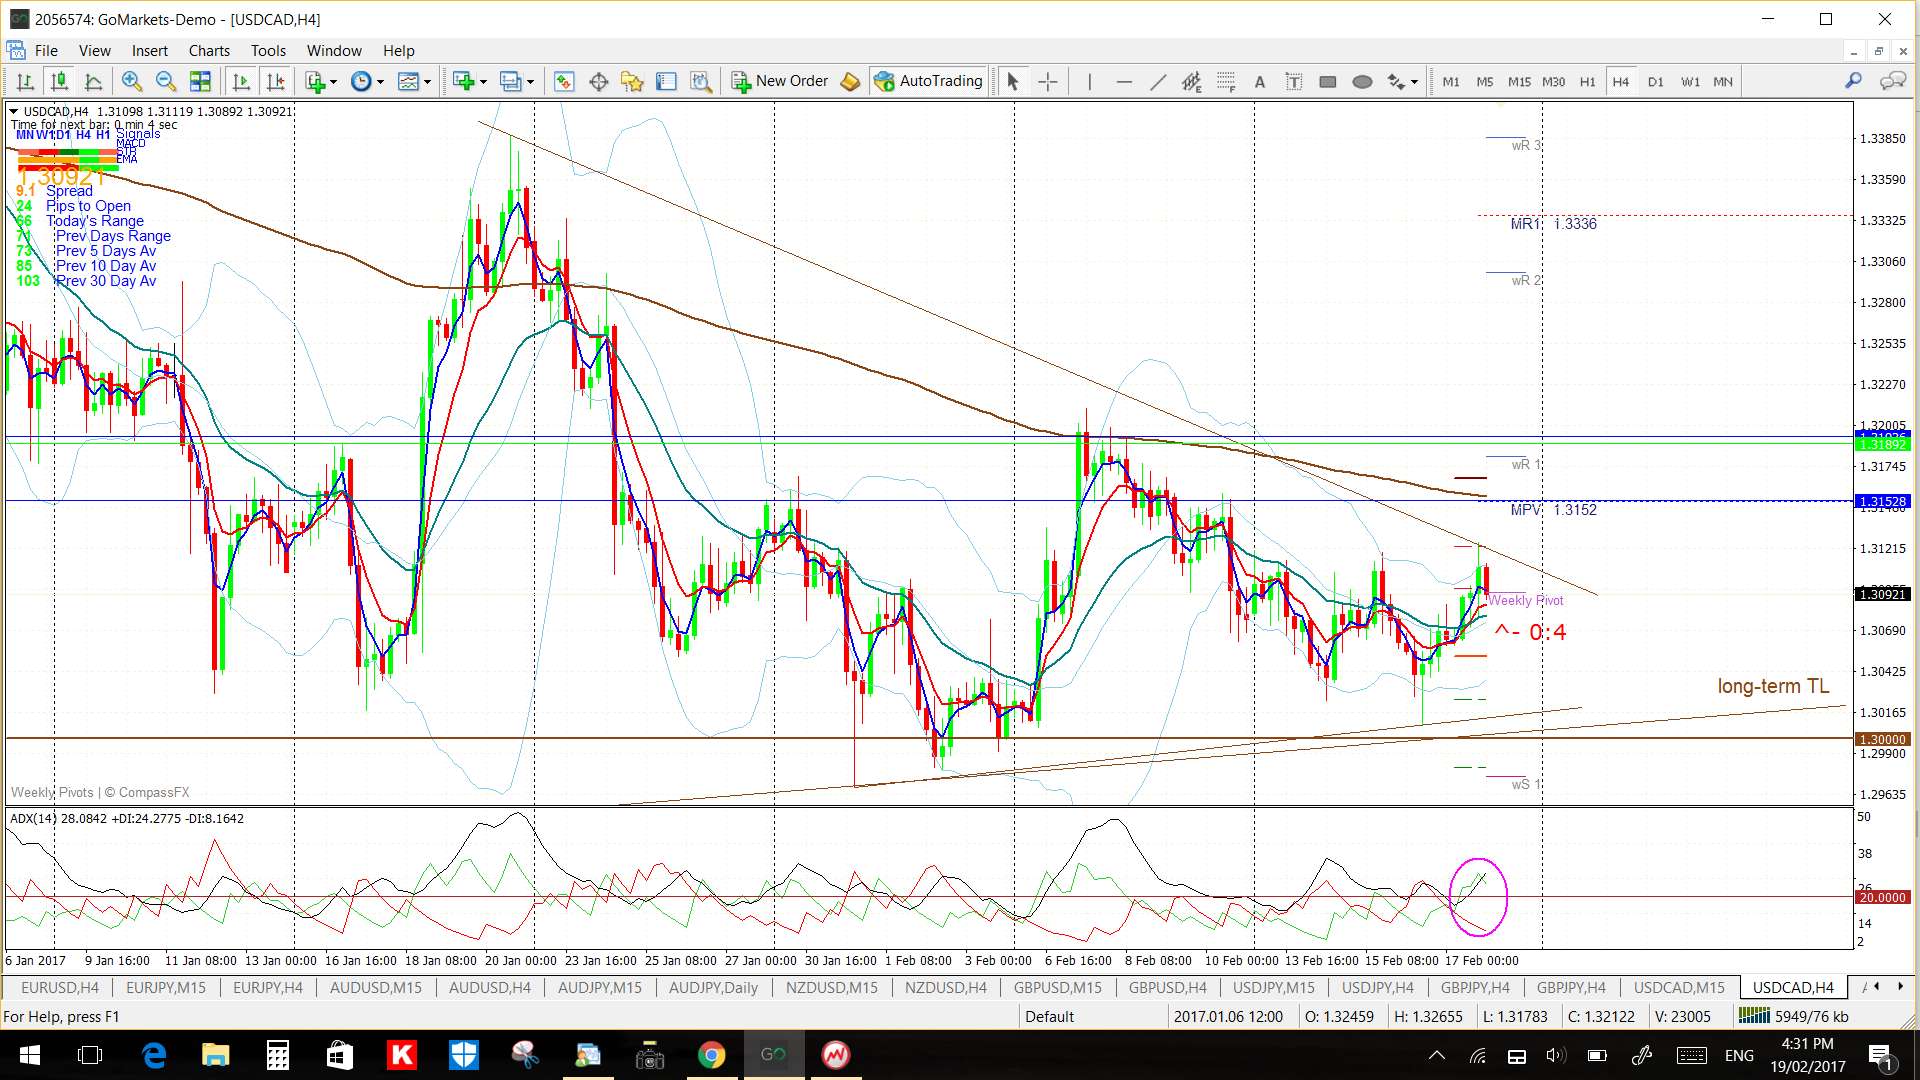
USD/CAD: This pair continues to dig in above the major S/R level at 1.30. I have adjusted the weekly chart’s wedge trend line and the monthly chart’s triangle to reflect this latest support.
There is a smaller triangle on the 4hr chart that I’m watching for any trend line breakout.
Price is just below the 4hr Cloud and below the daily Cloud which is bearish.
The weekly candle was a bullish coloured Doji reflecting indecision.
There is some high impact data for the CAD$ this week:
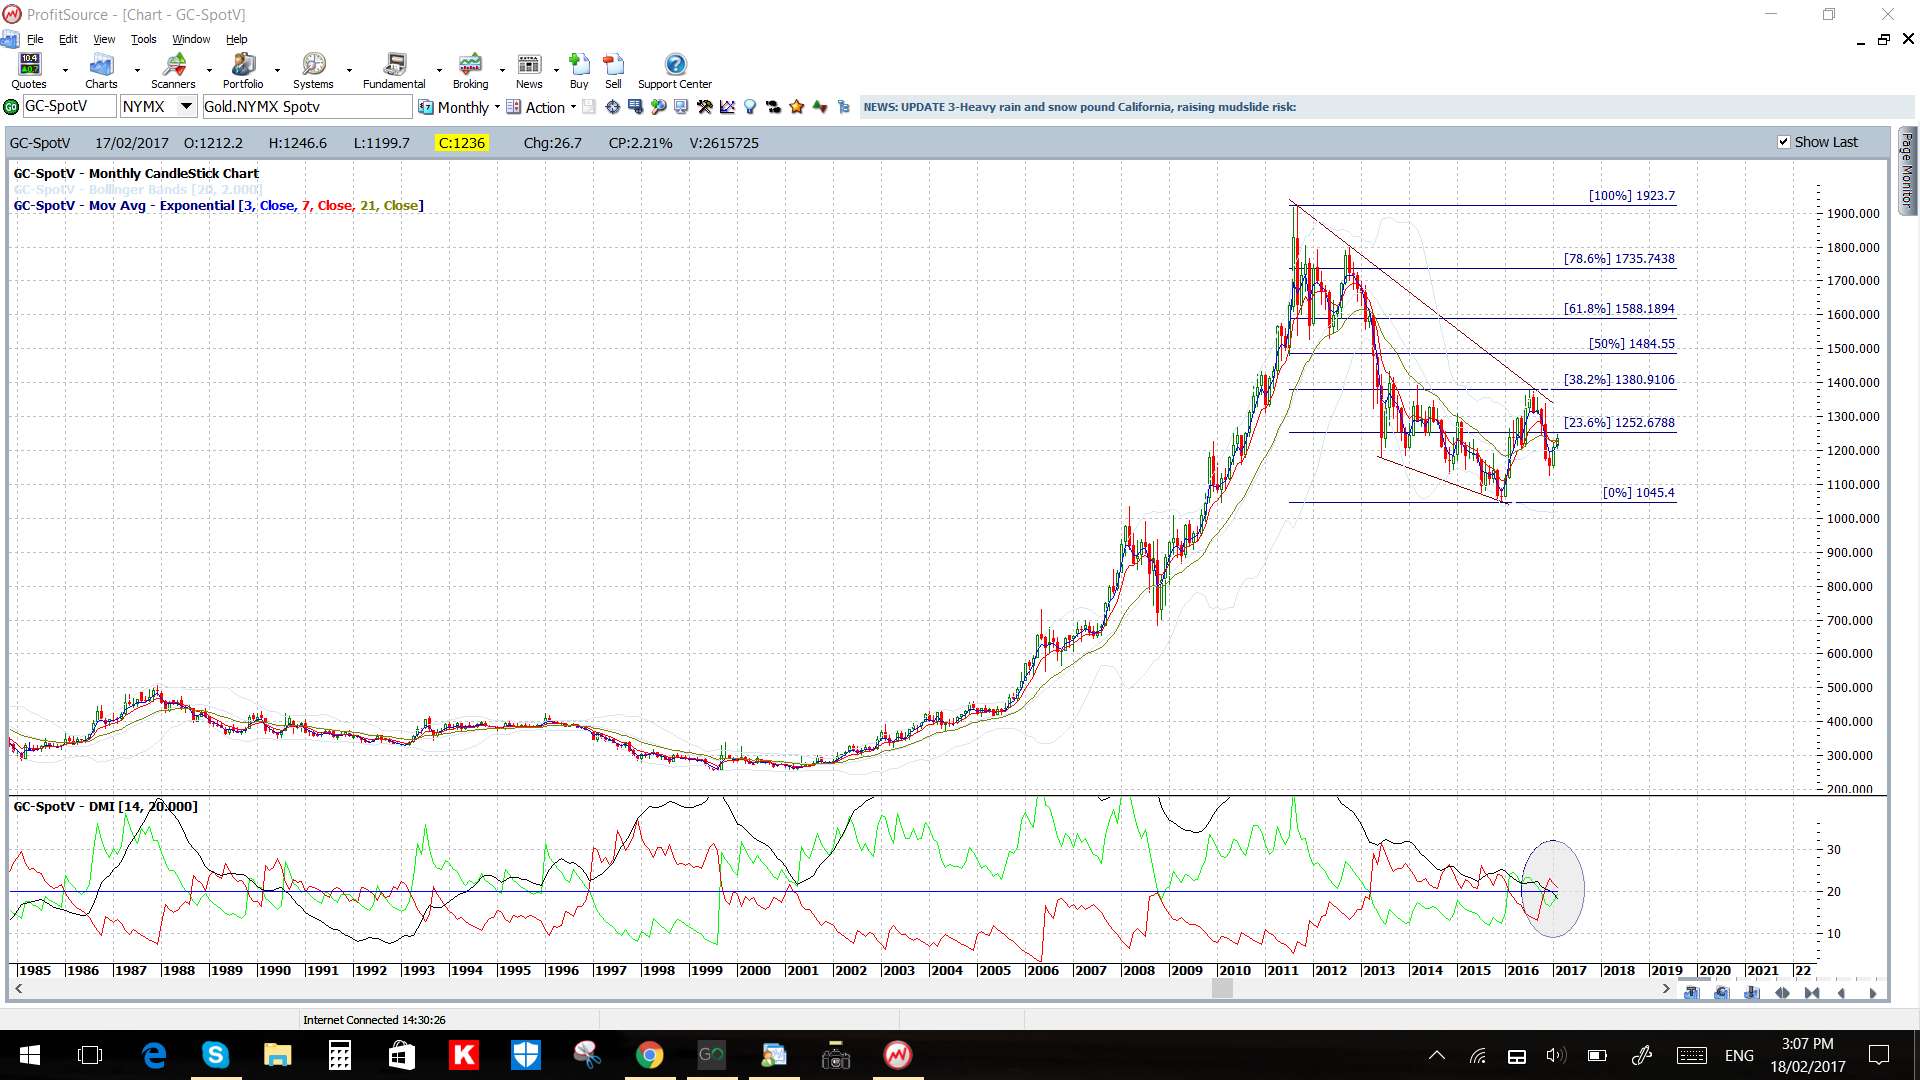
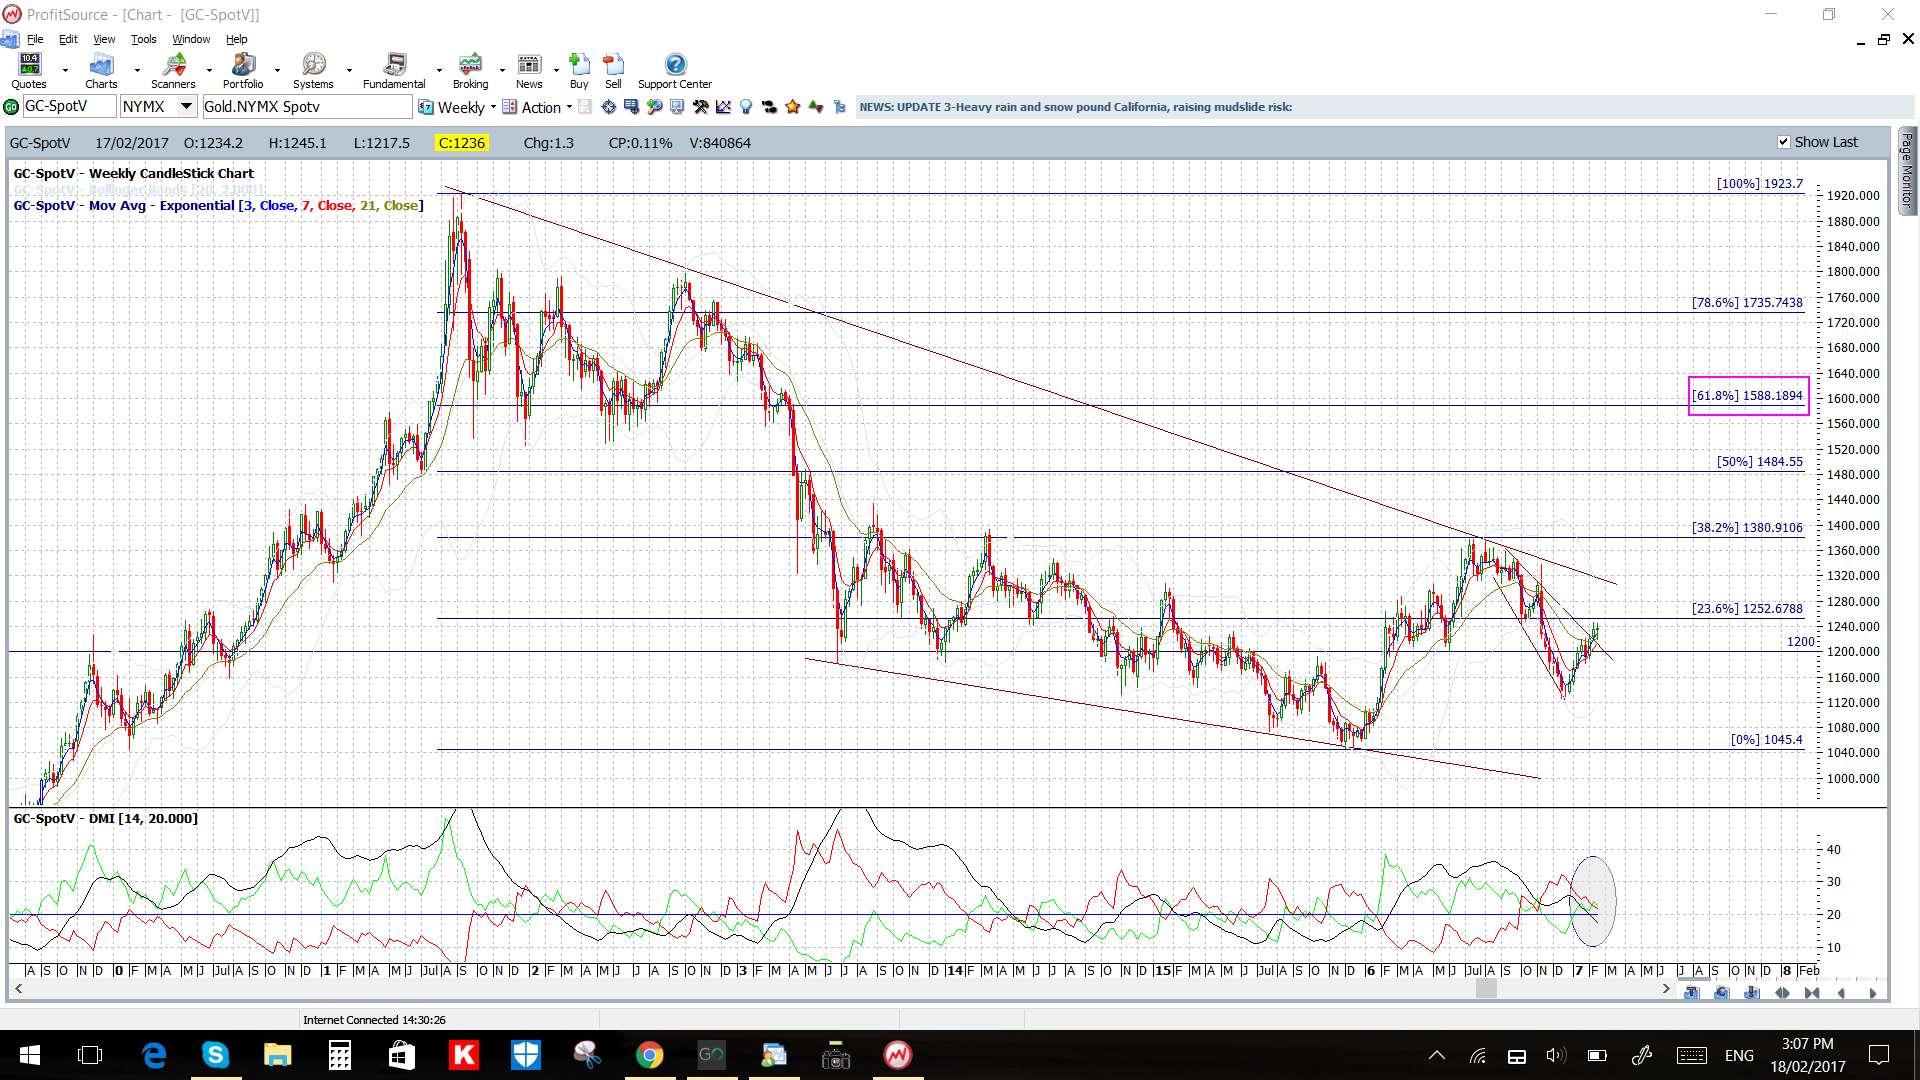
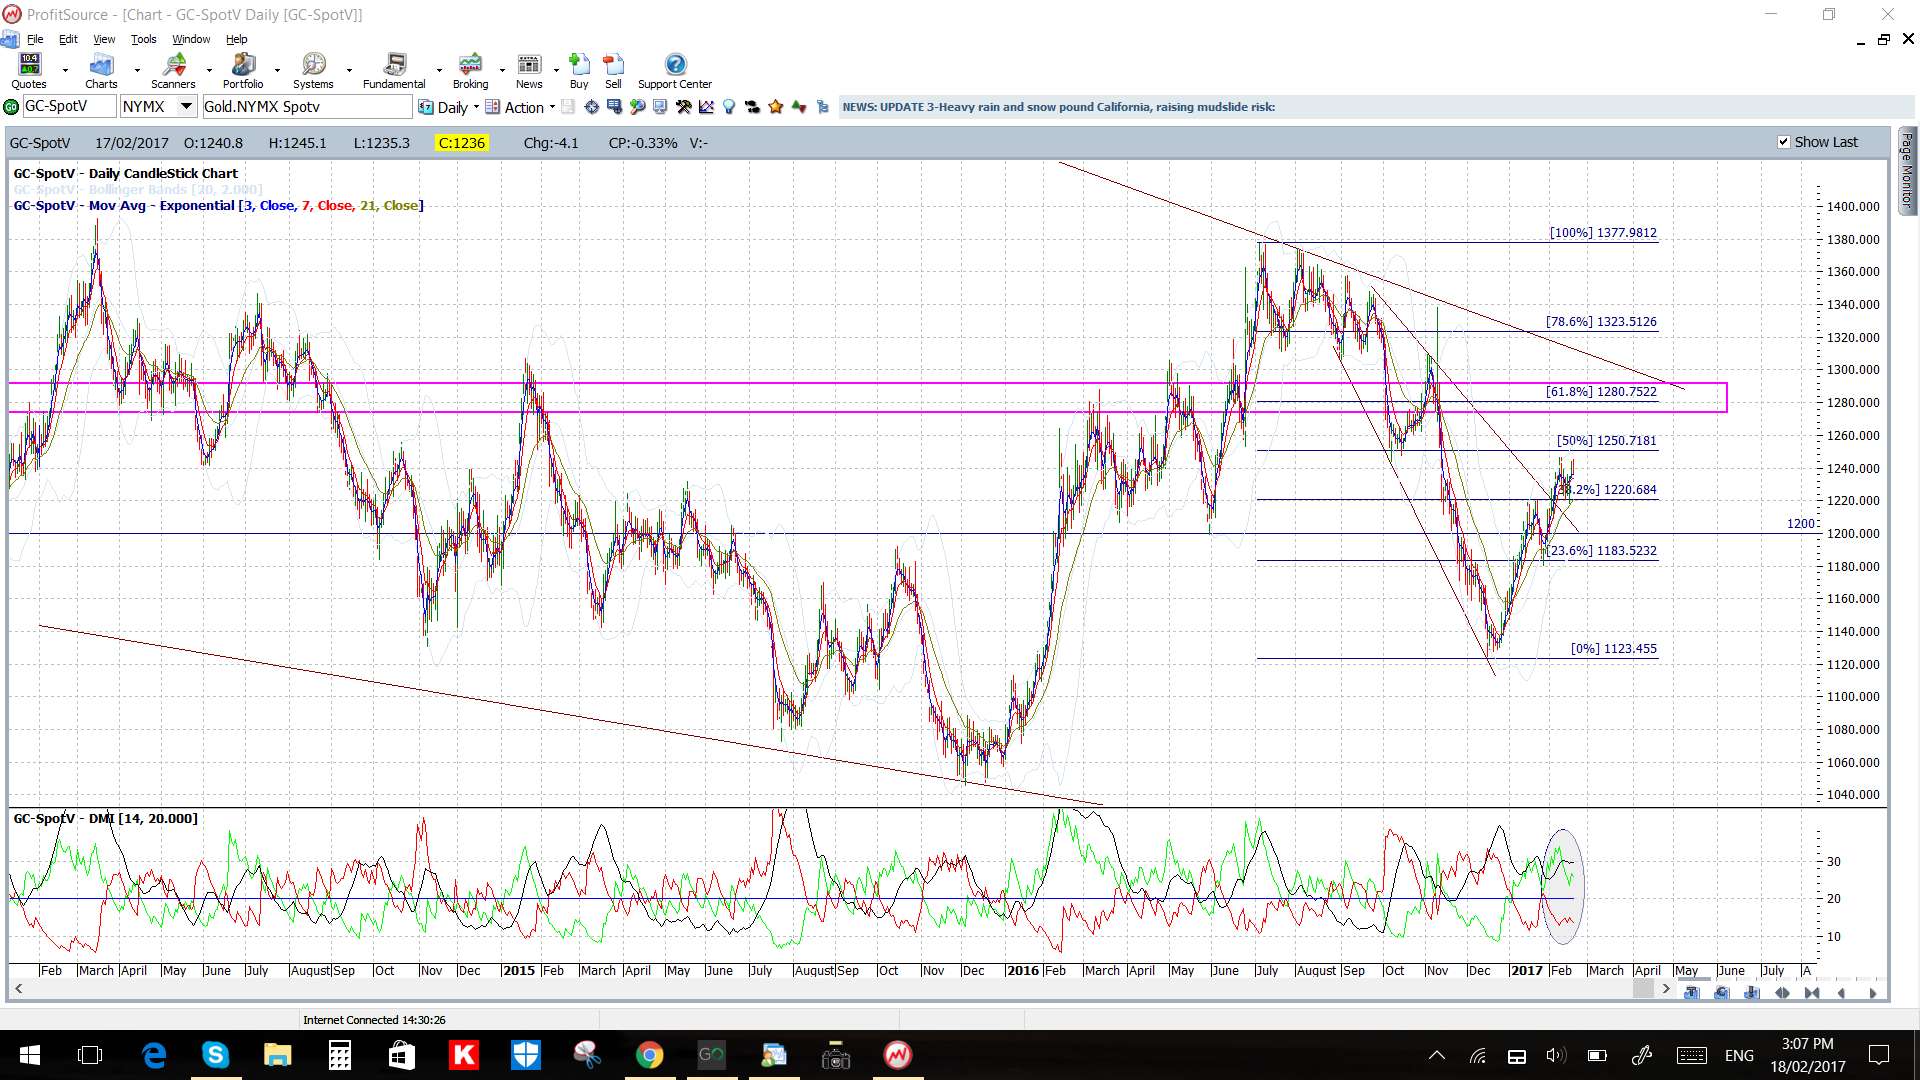
Gold: Last week Gold broke up and out from a 4hr chart wedge to give a move worth 120 pips but the $1,250 S/R level remains as heavy resistance with the subsequent pull-back giving the 4hr chart a ‘Double Top’ appearance.
Price remains above the 4hr Cloud and daily Cloud for the time being which is bullish.
The weekly candle closed as a bullish coloured Doji reflecting indecision.
- I’m watching the $1,250 level.
Others:
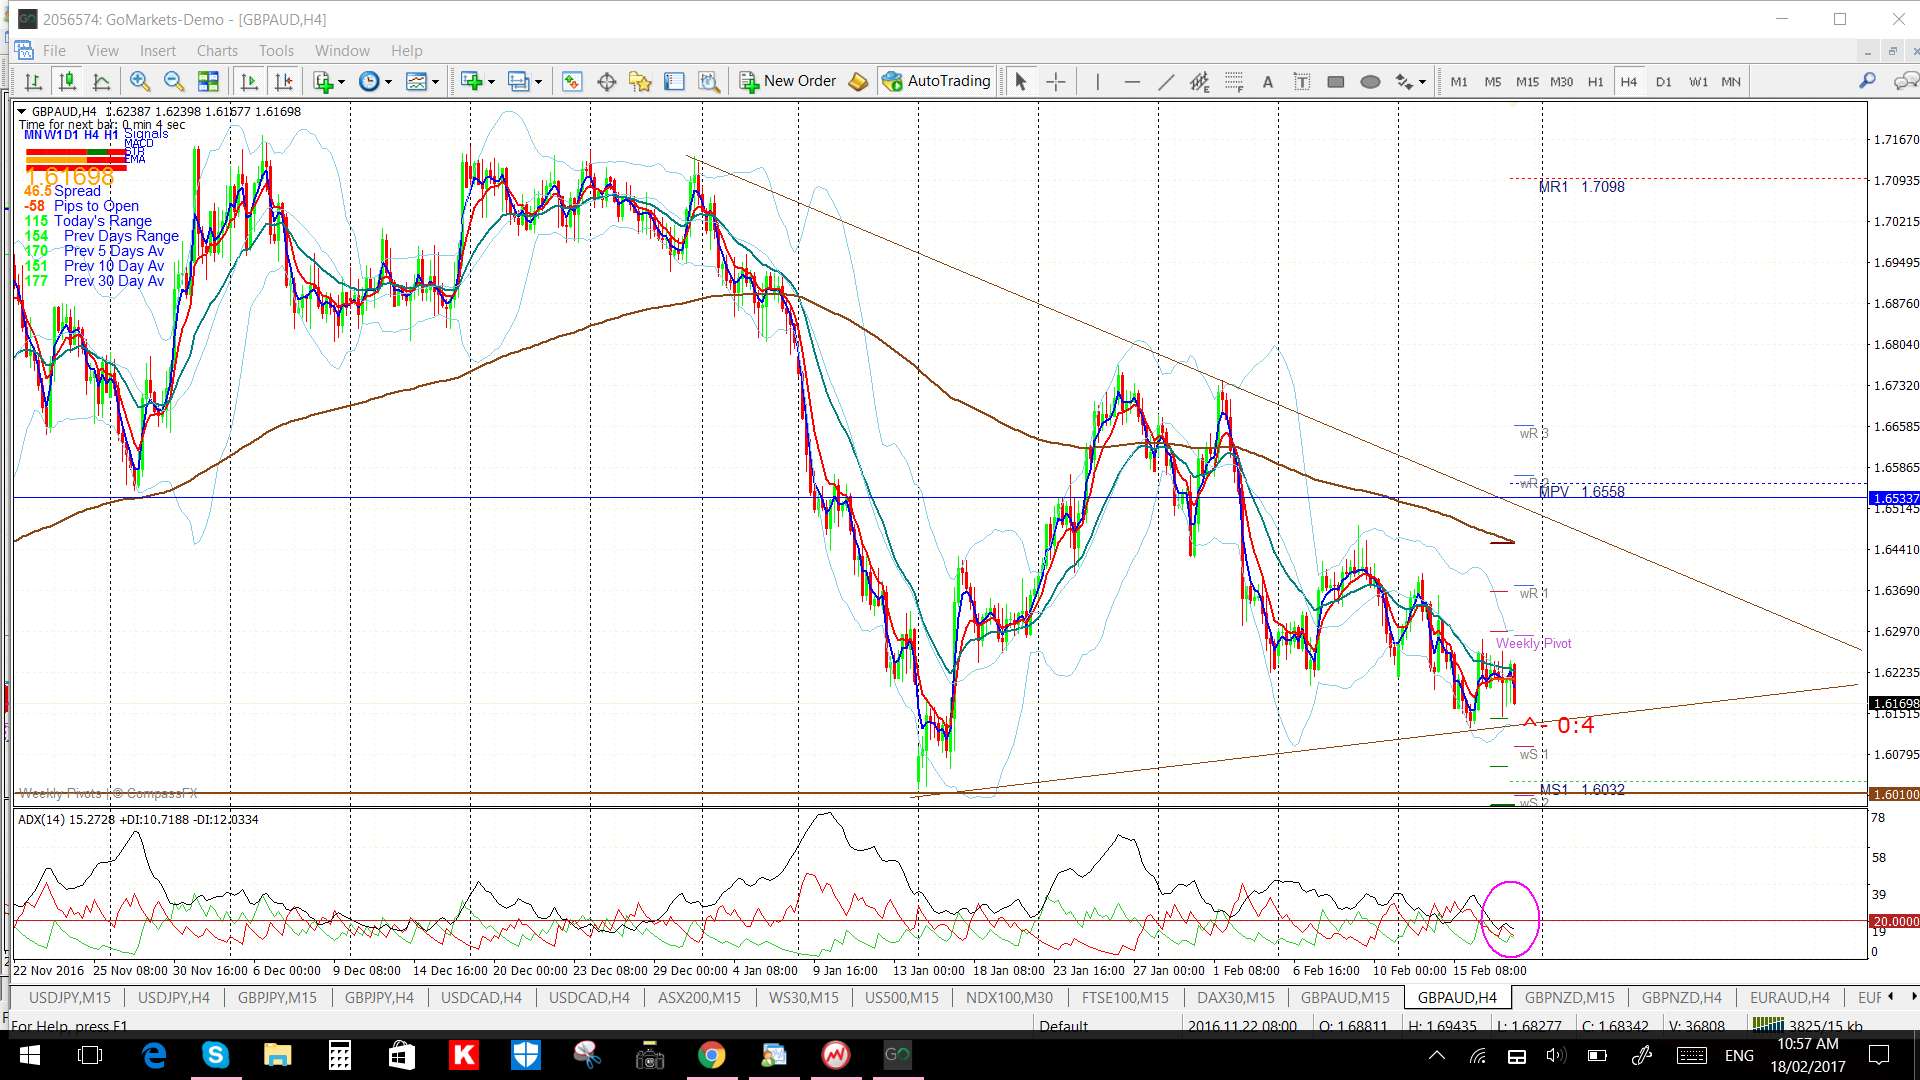
GBP/AUD 4hr: keep an eye out for any momentum-based trend line breakout:
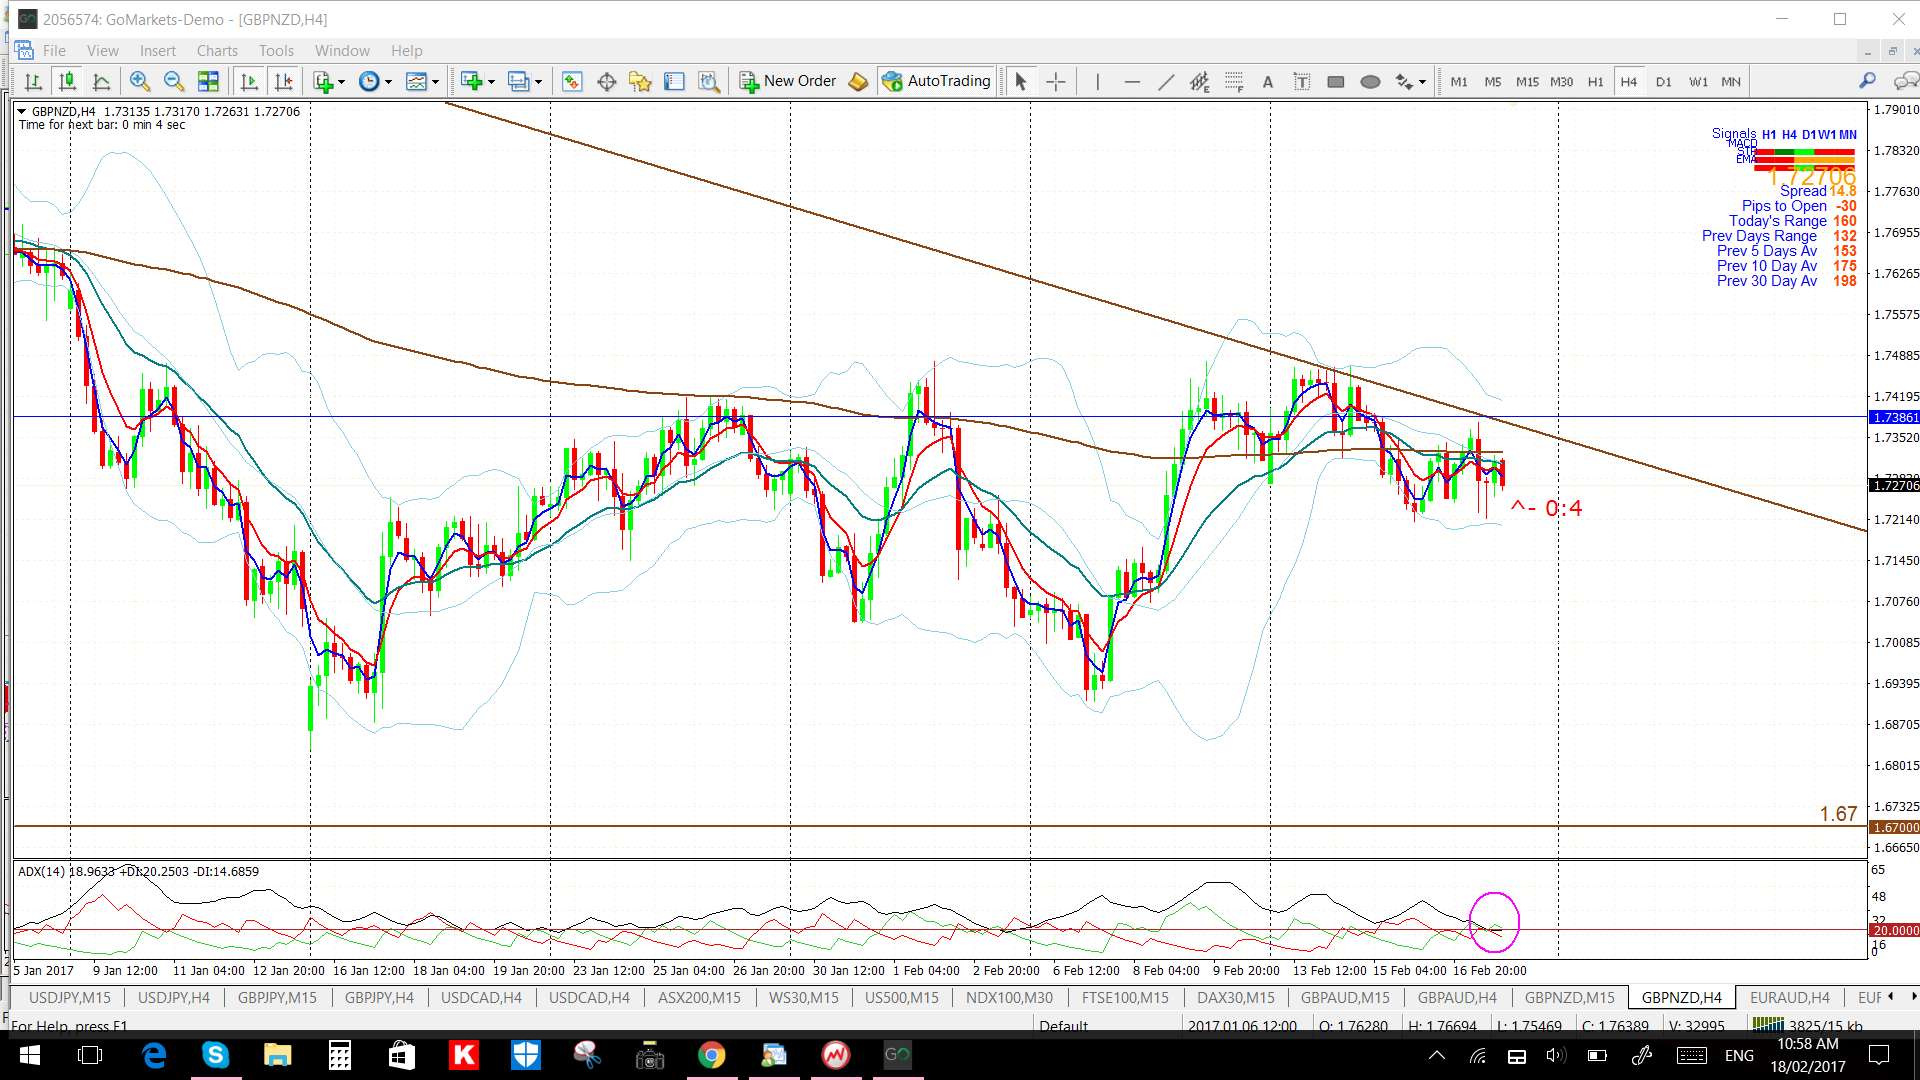
GBP/NZD 4hr: keep an eye out for any momentum-based trend line breakout:
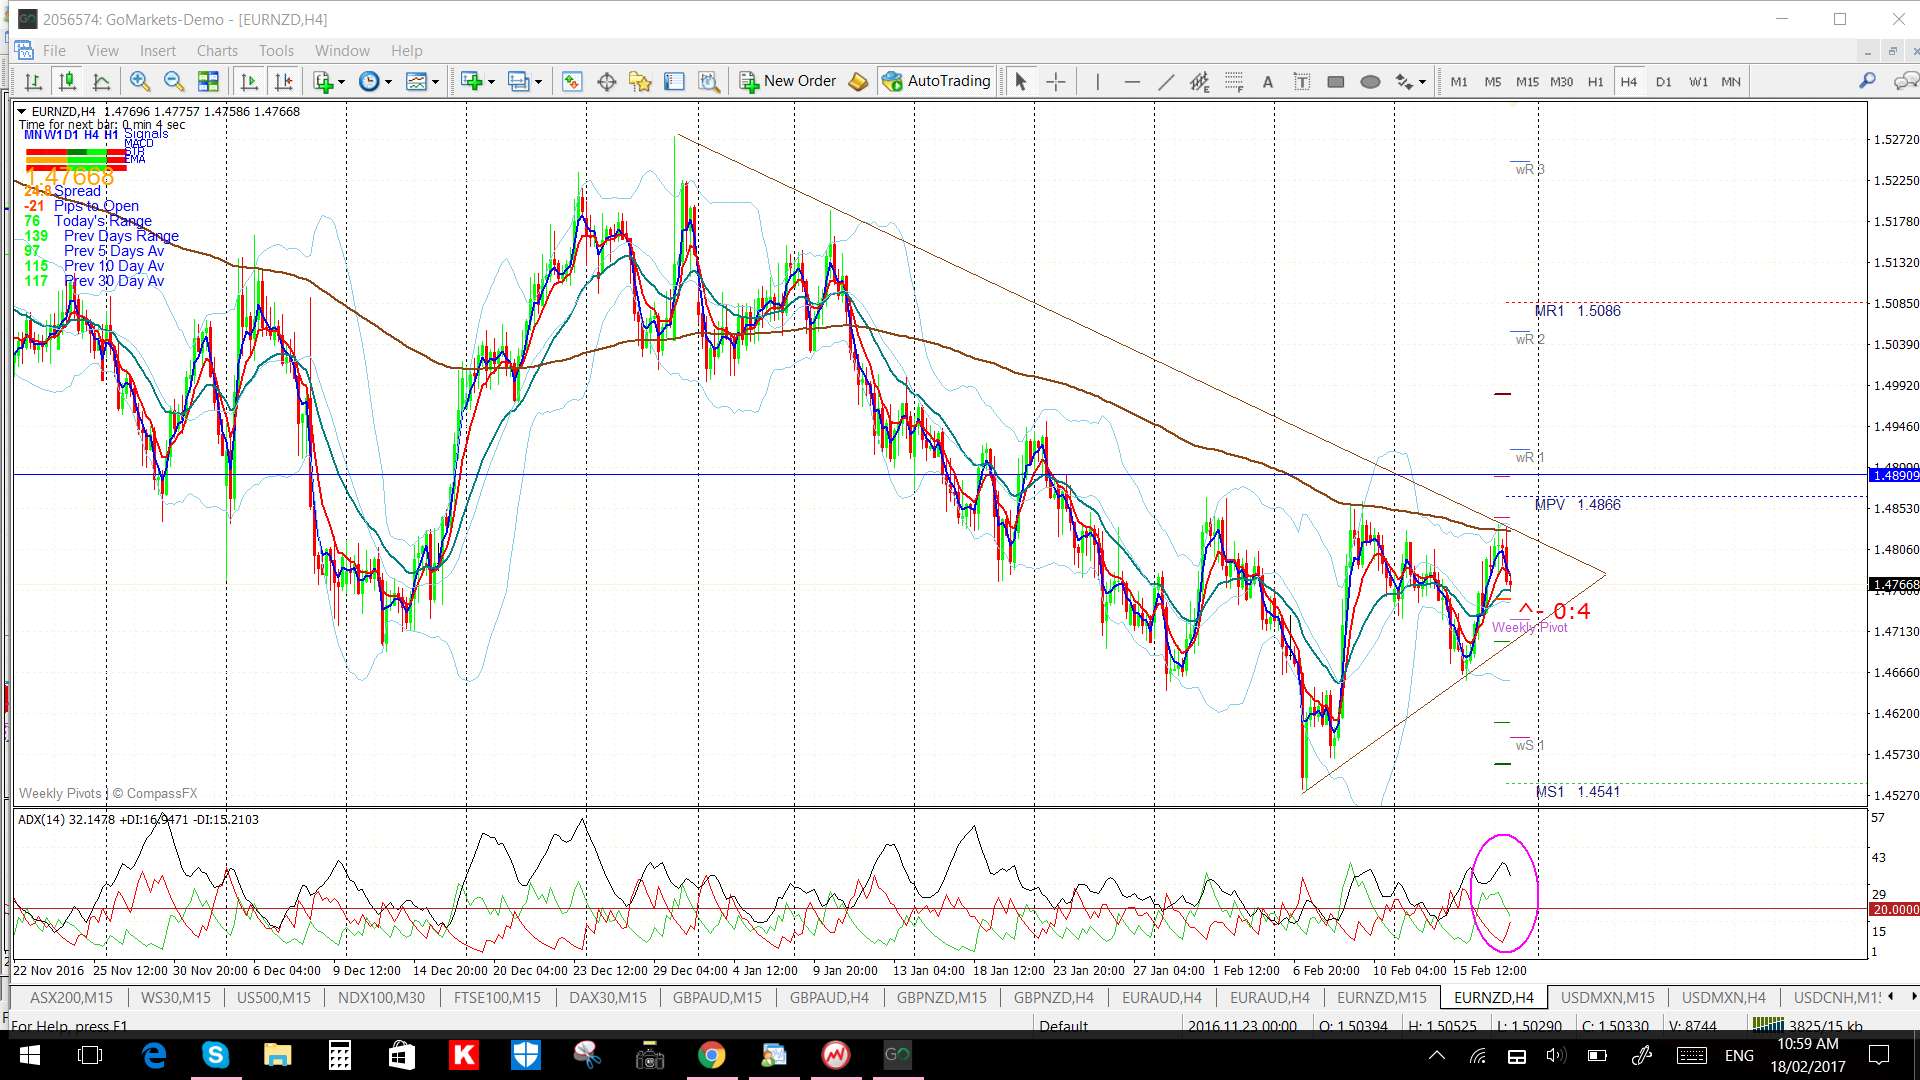
EUR/NZD 4hr: keep an eye out for any momentum-based trend line breakout:
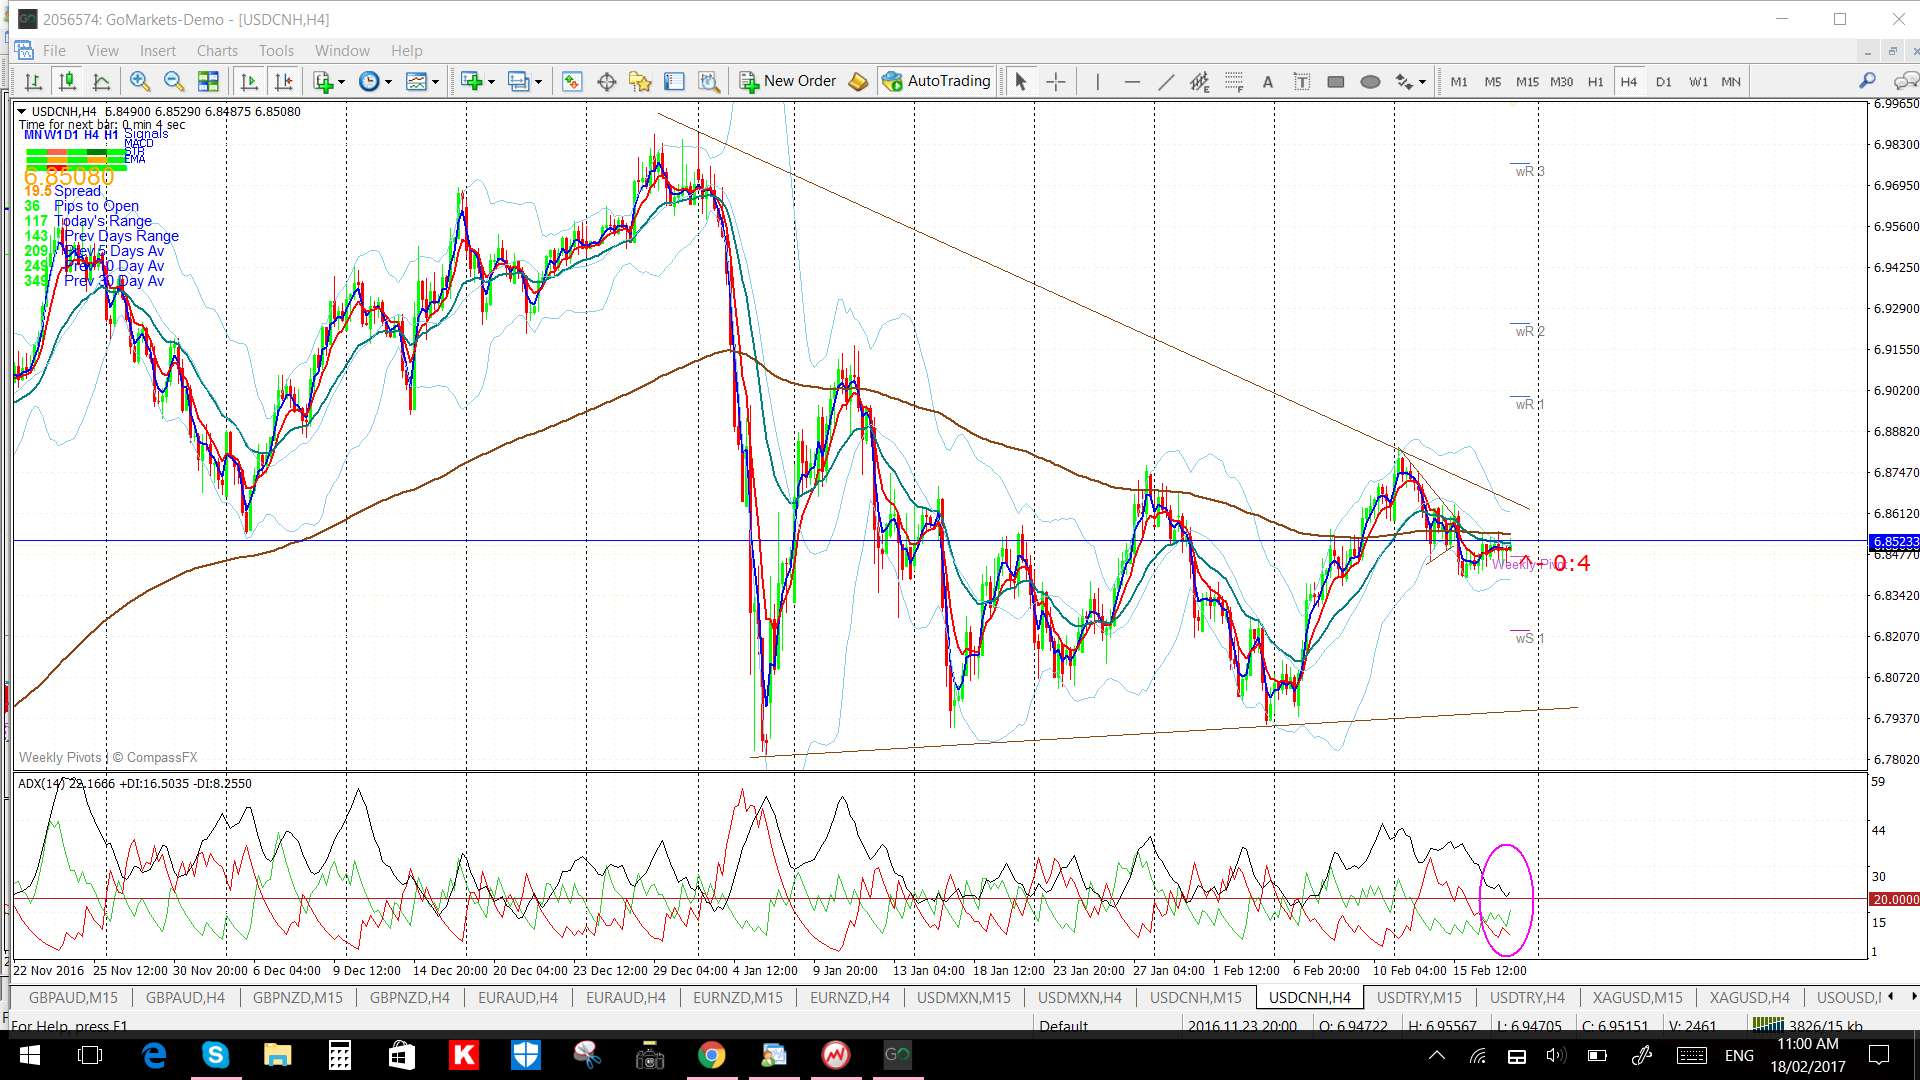
USD/CNH 4hr: keep an eye out for any momentum-based trend line breakout:
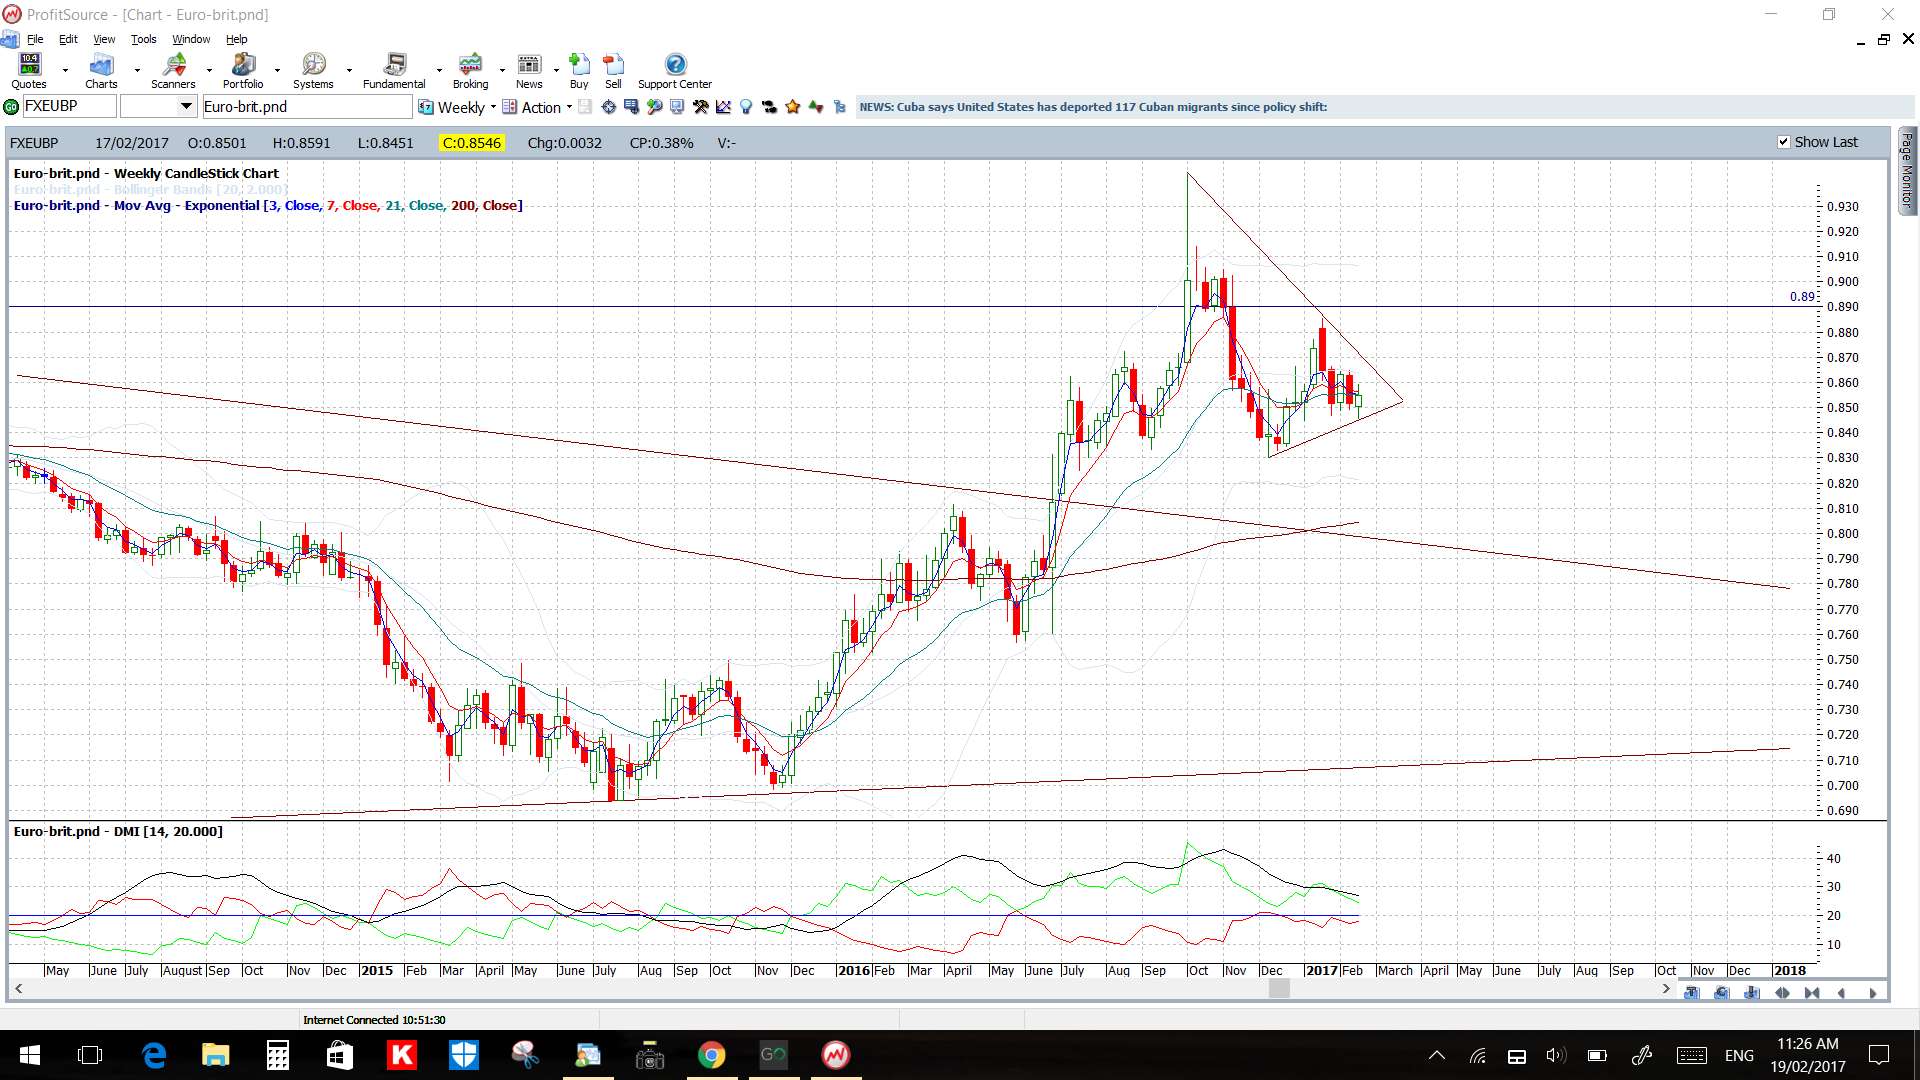
EUR/GBP weekly: some trend lines to watch:
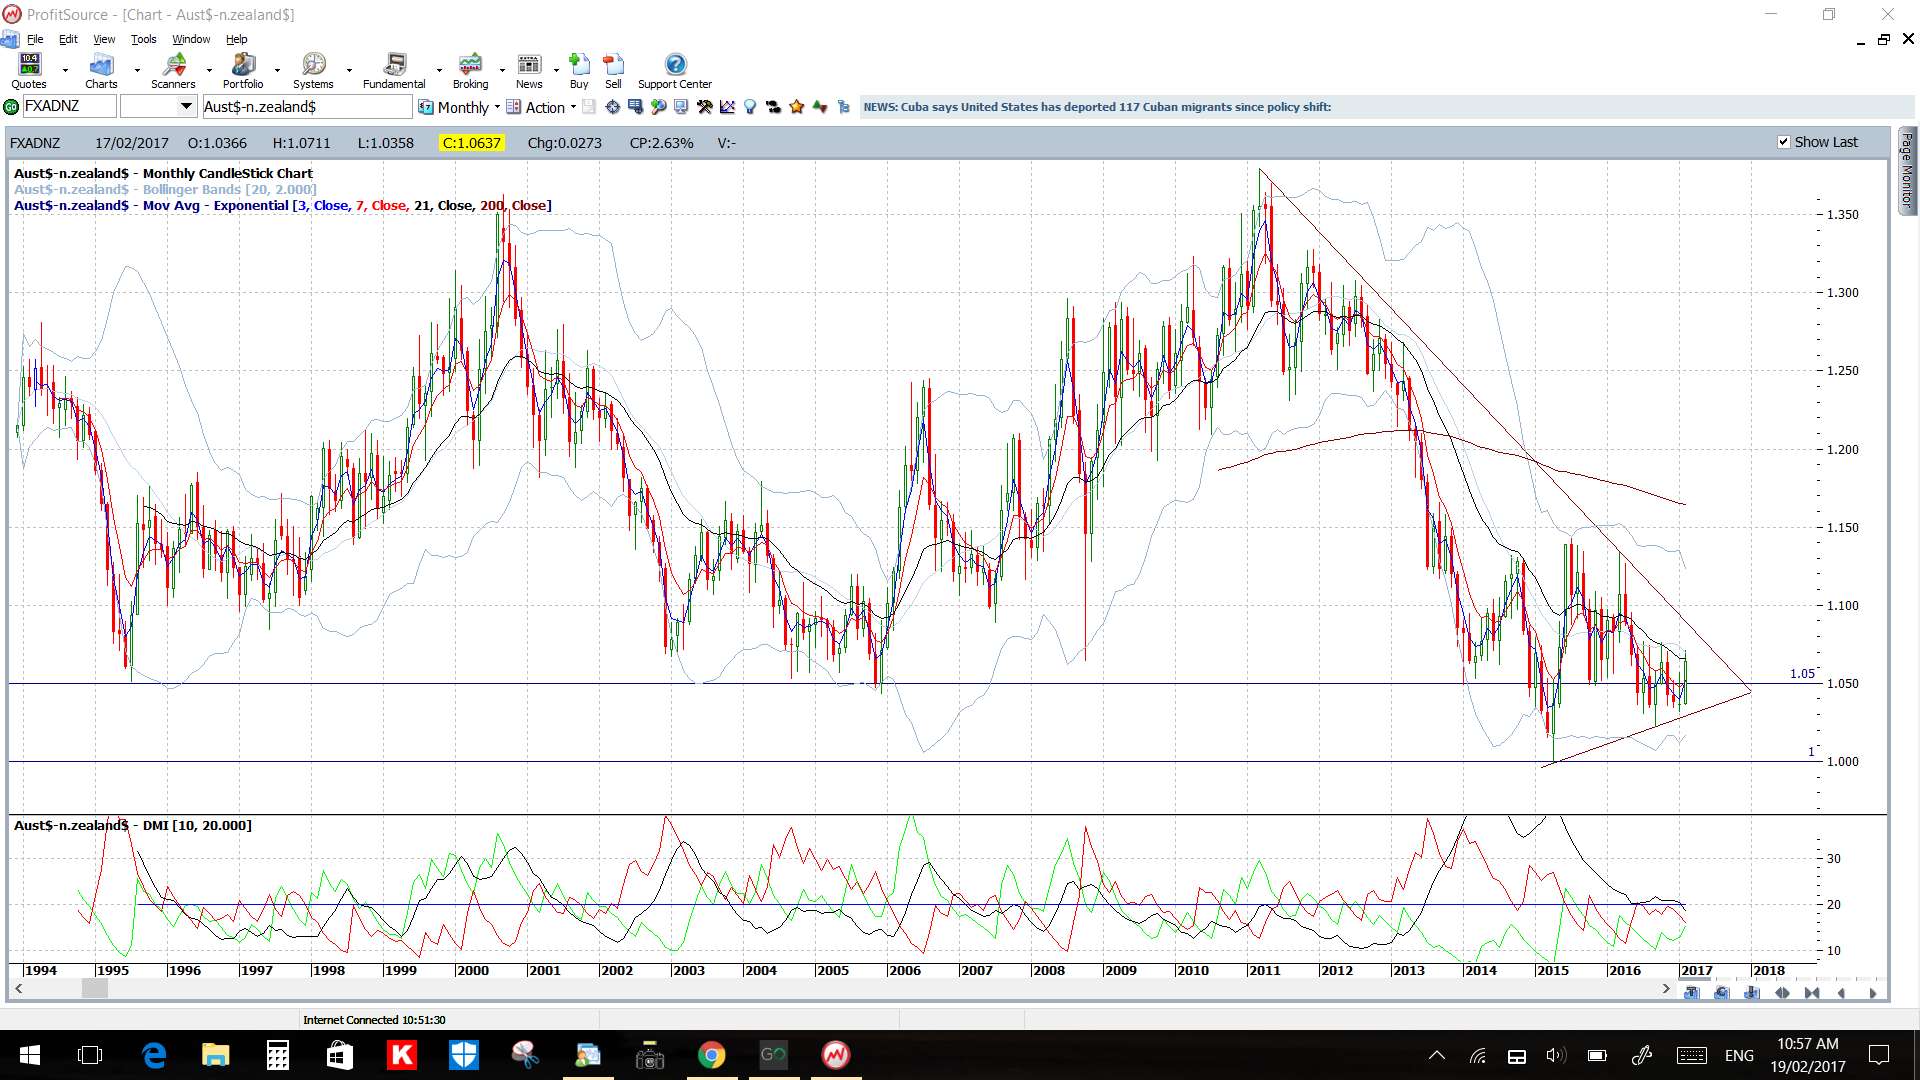
AUD/NZD monthly: here too!
The post FX: lots of indecision weekly candles. appeared first on Trade Charting.
The post FX: lots of indecision weekly candles. appeared first on www.forextell.com.