Trend line breakout tally: these trades gave the following maximum pip movement and were profiled mid-week here, here,here and here :
- Gold: 240 pips and 160 pips.
- Silver: 40 pips.
- USD/JPY: 90 pips.
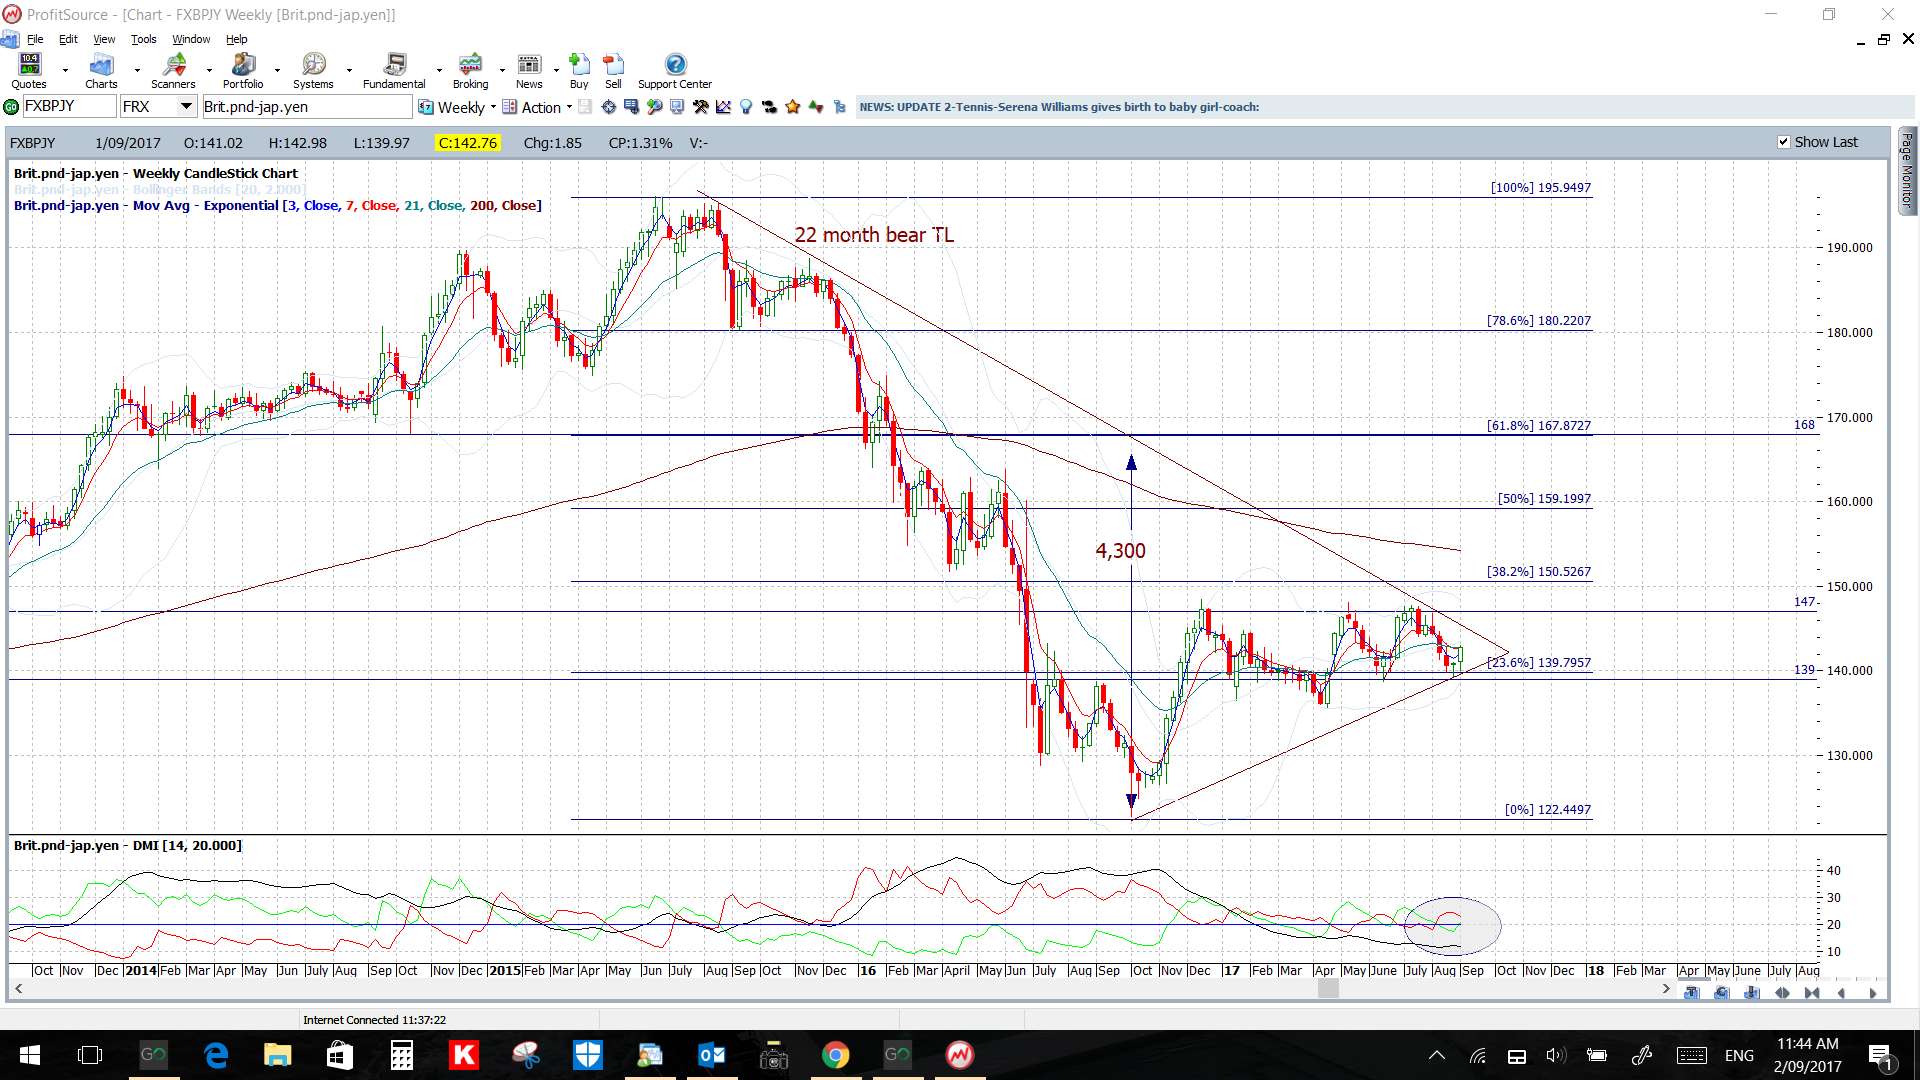
- GBP/JPY: 150 pips.
- AUD/USD: 40 pips.
- EUR/NZD: 100 pips.
- AUD/NZD: 100 pips.
- EUR/AUD: 100 pips: on Friday.
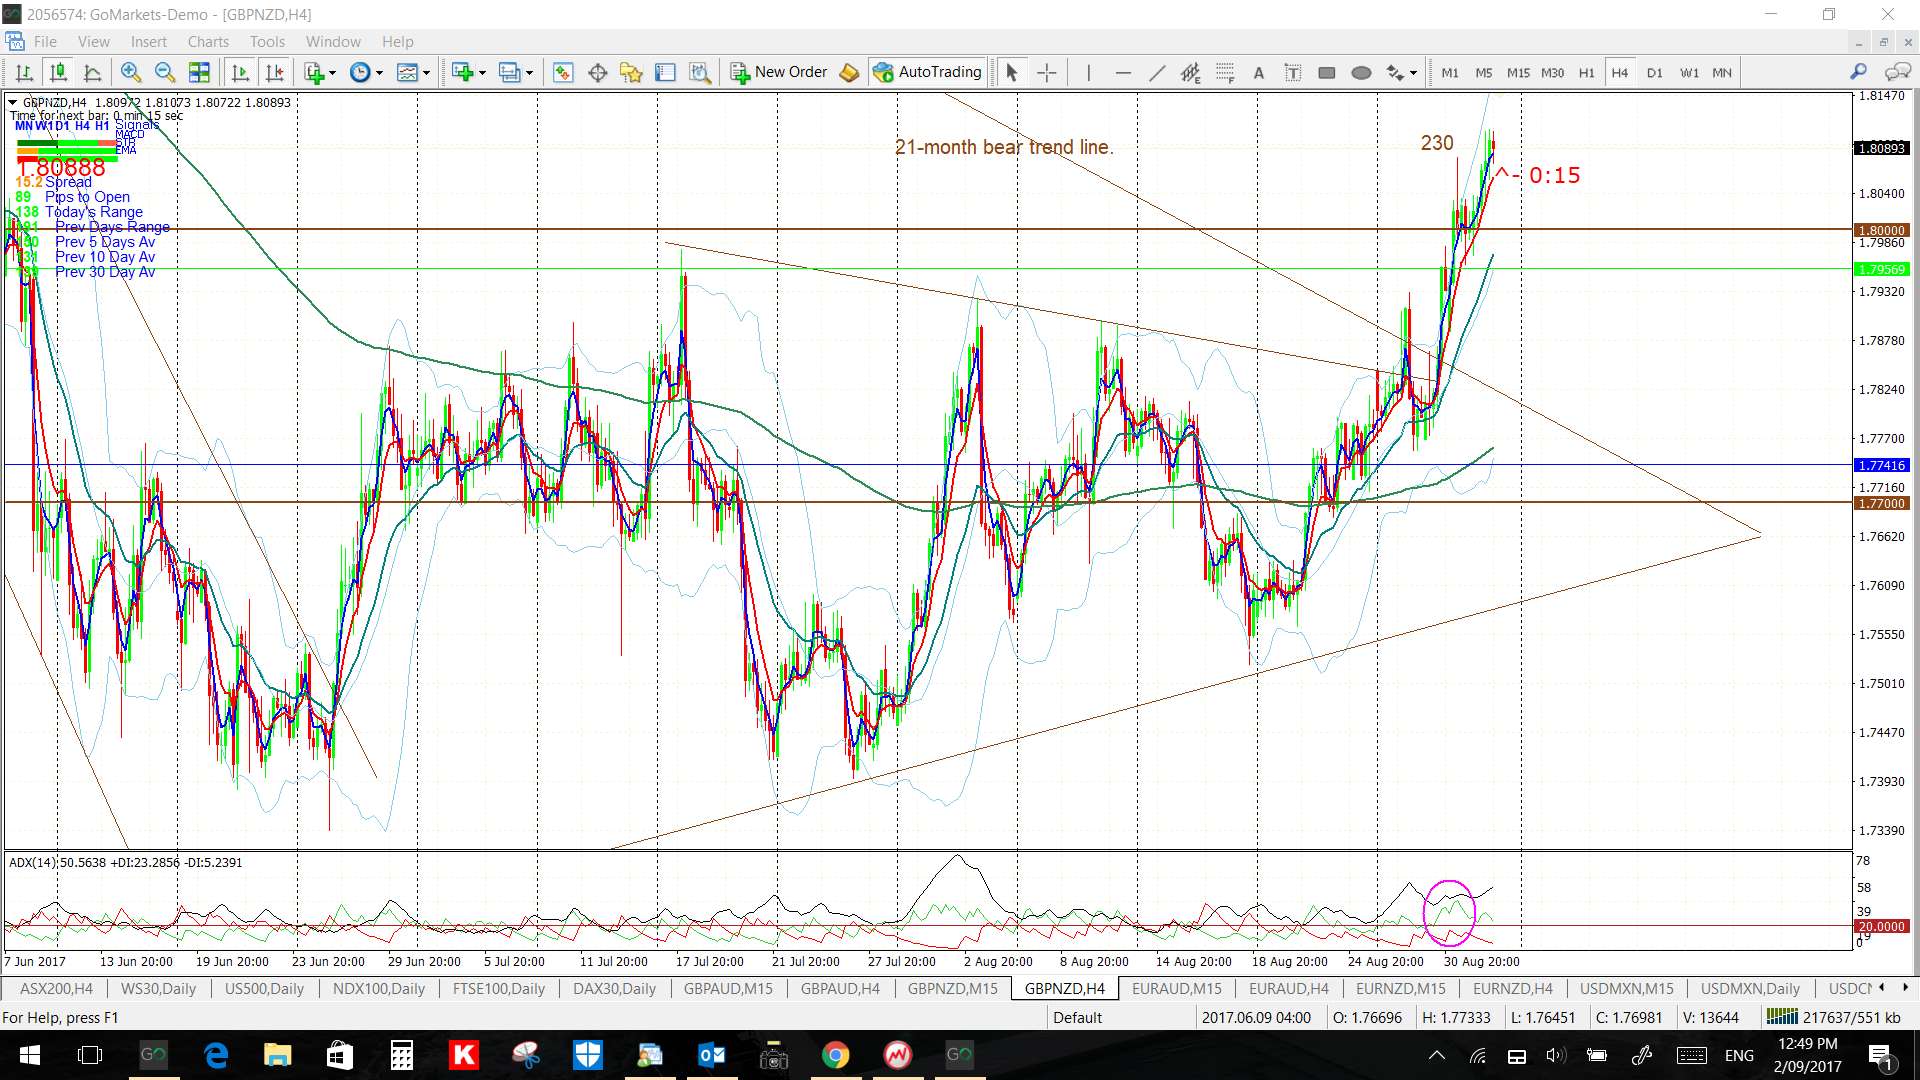
- GBP/NZD: 230 pips.
This week:
- US$: the US$ index closed higher for the week and looks to be trying to dig in at the 92.50 support level. A review of the FX Indices can be found through this link.
- Monday: is a Bank Holiday for Labor Day in the USA and Canada so it might be a slow day.
- Data: there are three Central Bank rate updates: RBA (AUD), BoC (CAD) and ECB (EUR).
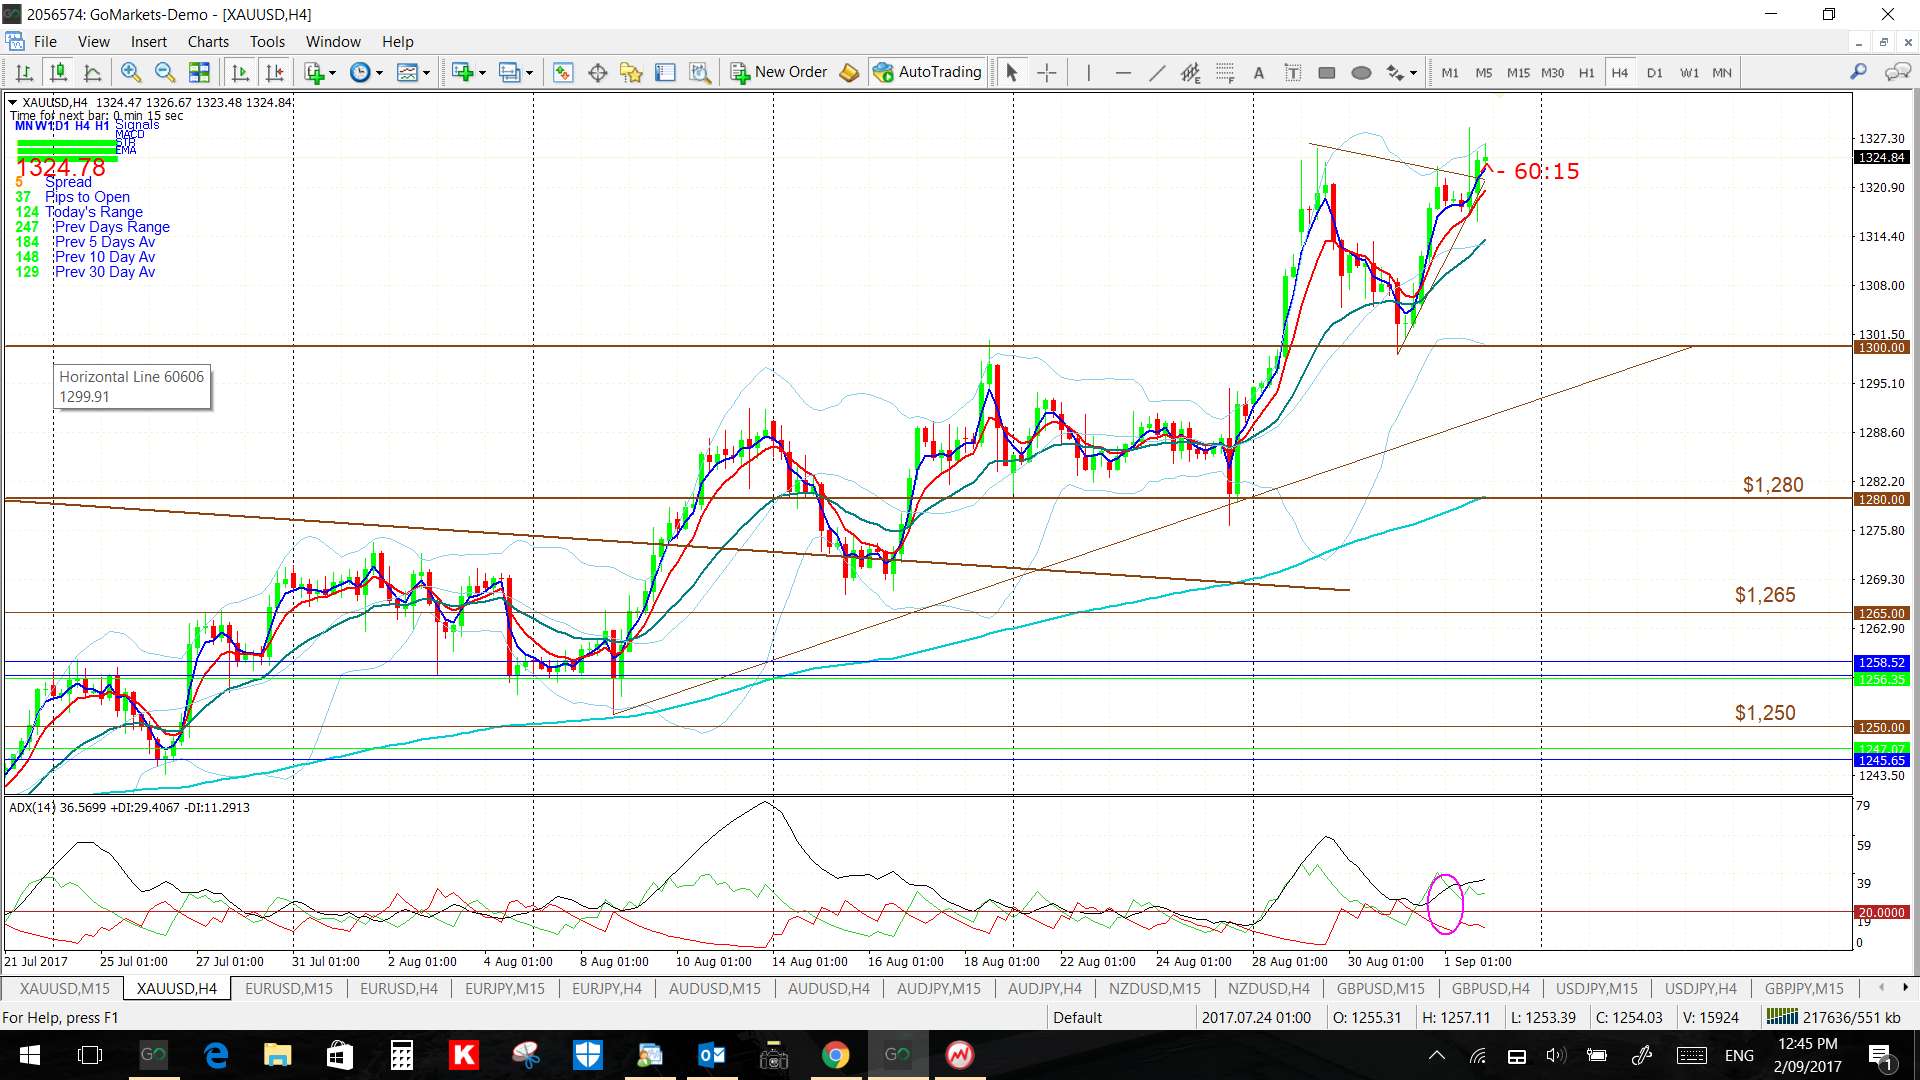
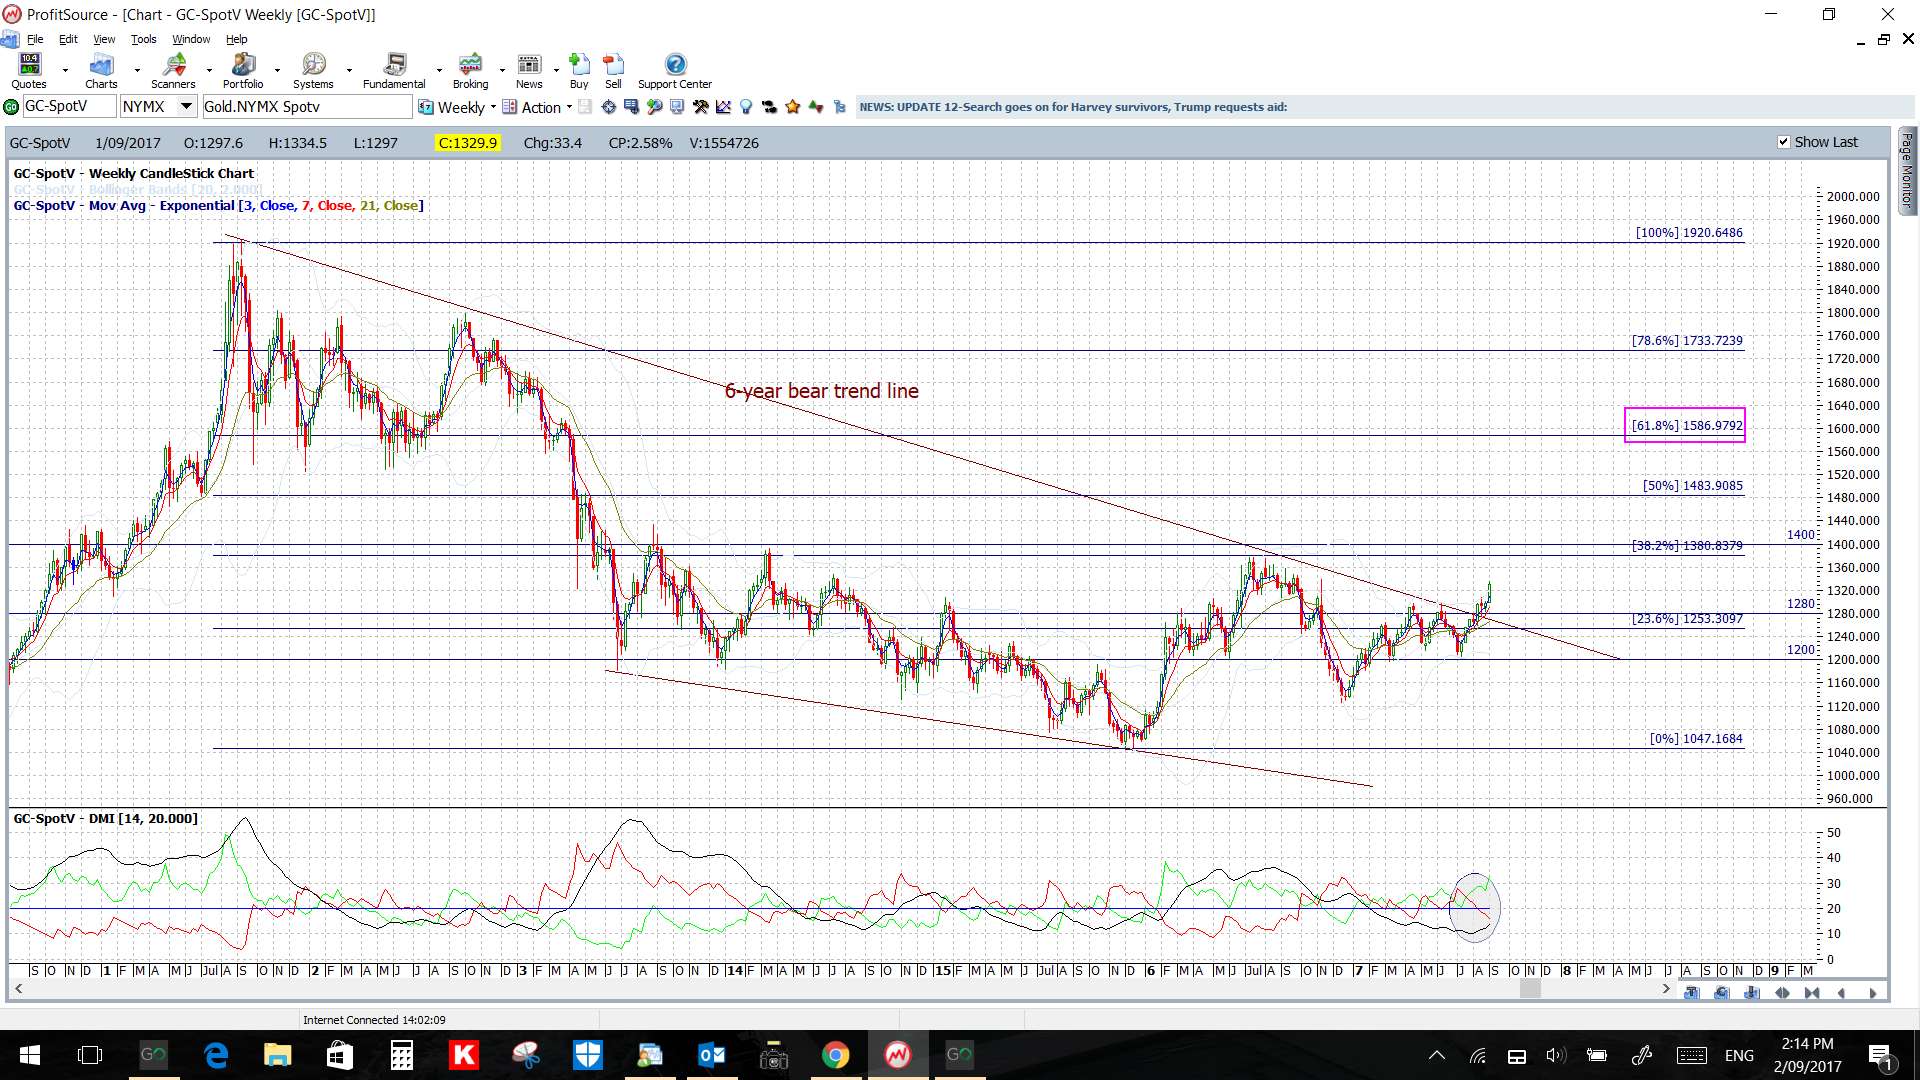
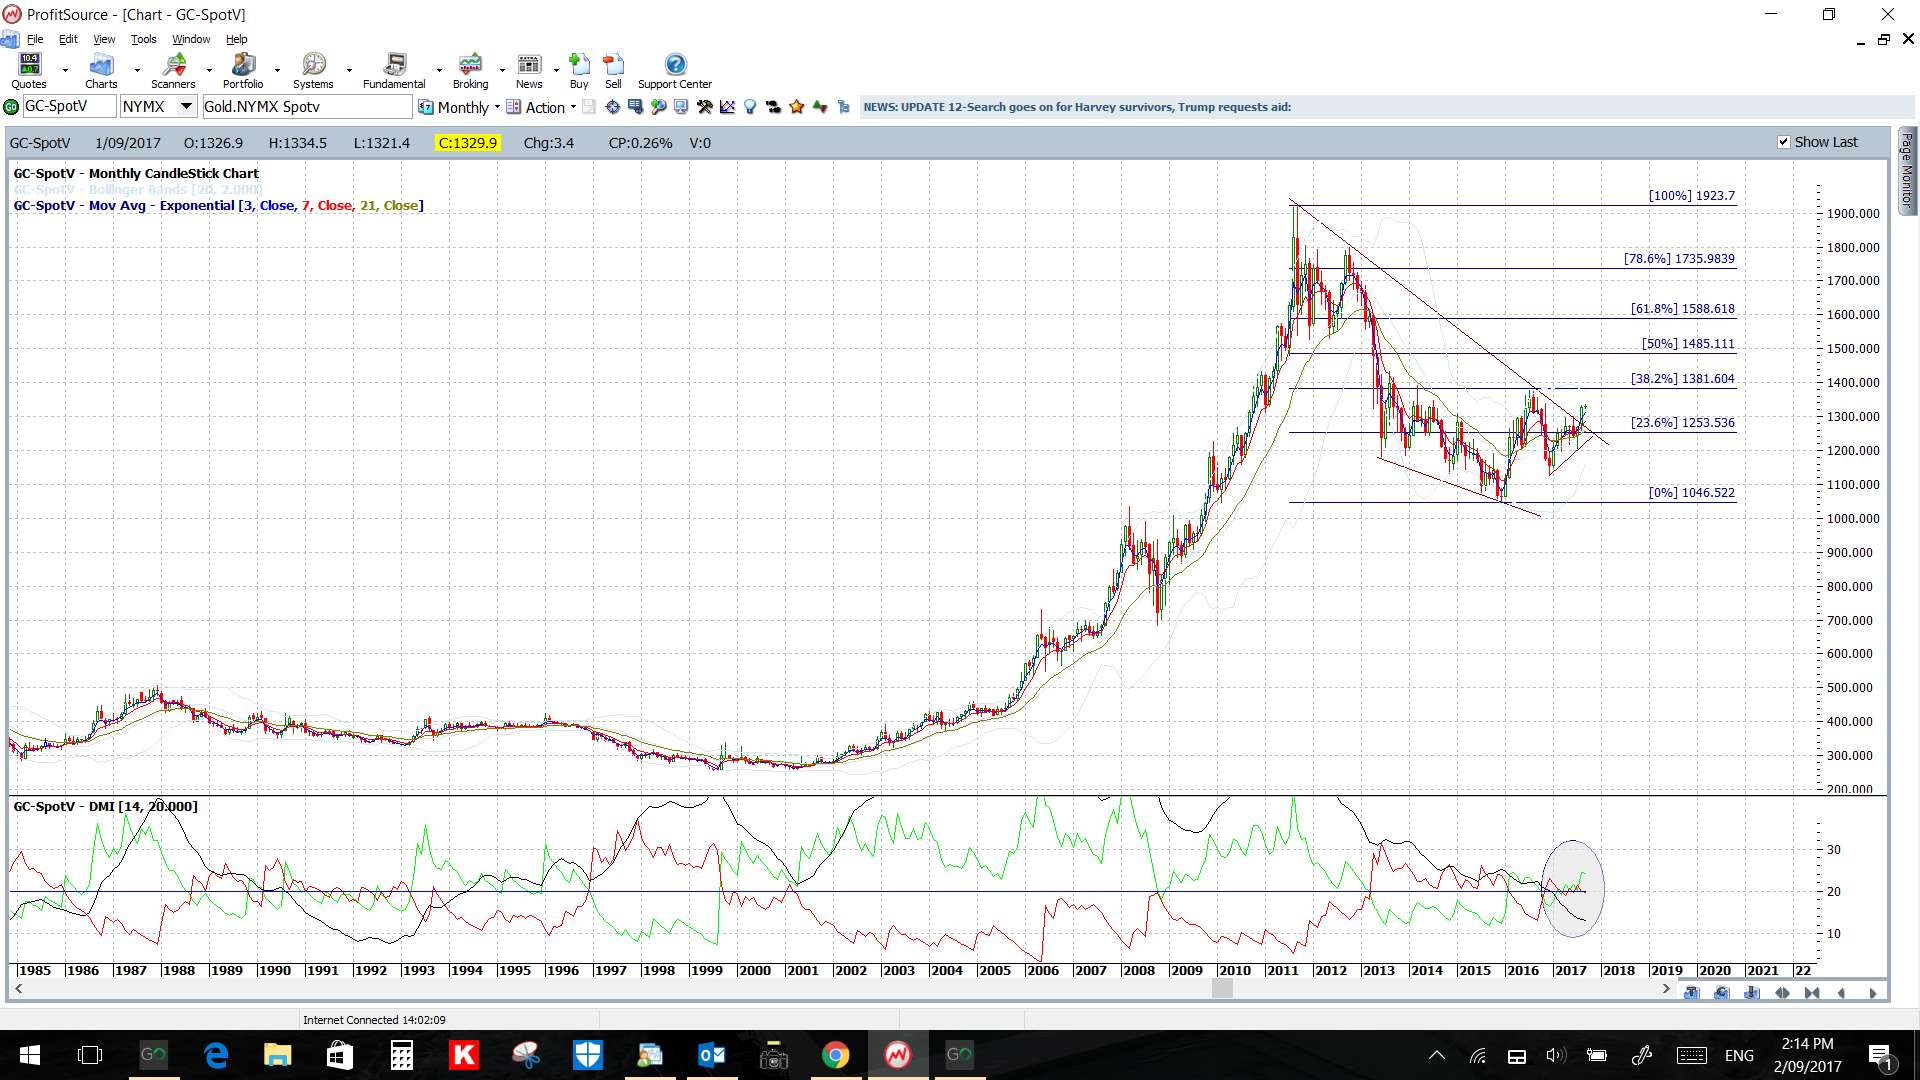
- Gold: is holding up above the recently broken 6-year bear trend line and the key $1,300 level. The monthly chart shows what looks like a classic ‘Bull Flag’ pattern evolving. Watch for any hold above this region to target the whole-number $1,400 level.

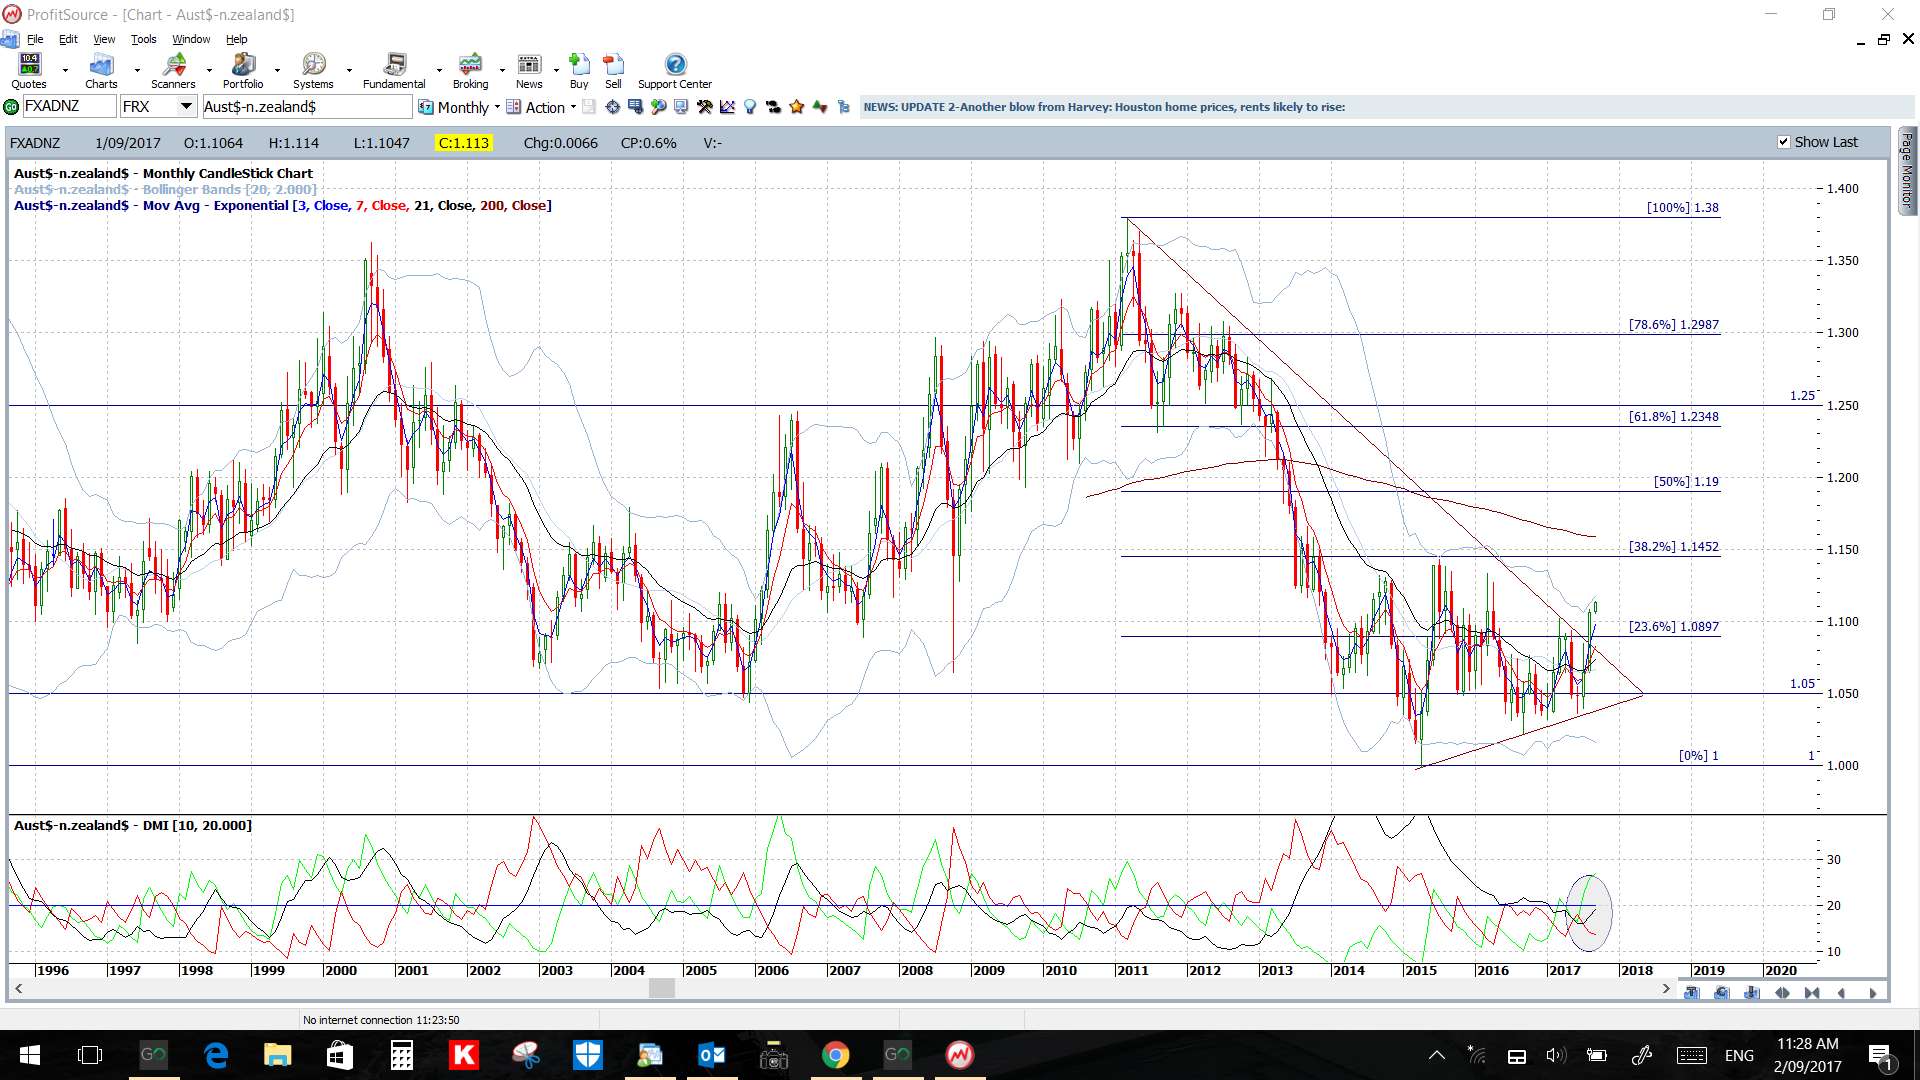
- AUD/NZD: this has now broken up and out from the monthly chart triangle and this has evolved with increasing bullish momentum. Watch for any test of the broken trend line though before possible continuation:
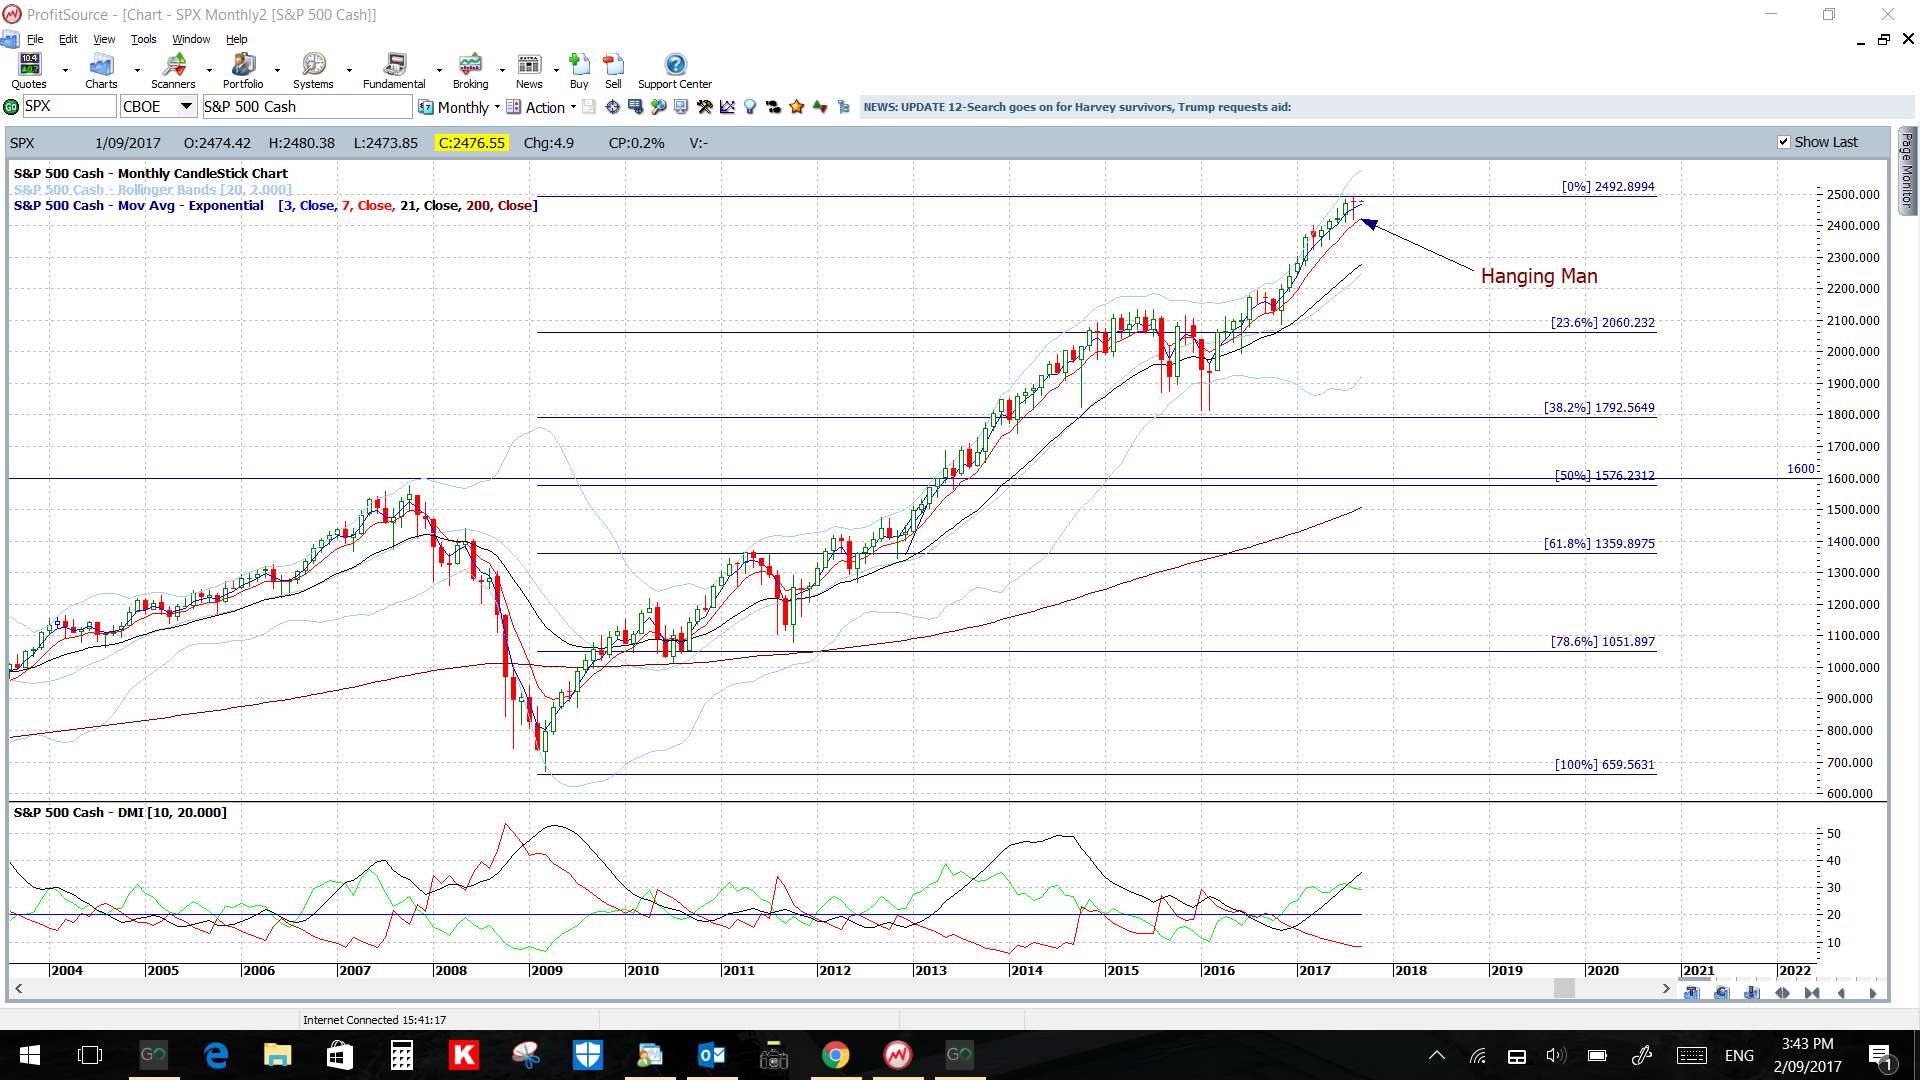
- S&P500: the S&P500 printed a bearish reversal ‘Hanging Man’ monthly candle for August. I’m watching for any healthy pause or pullback and note the 50% fib of the last swing high move is back down near the 1,600 breakout level. Please read the post found through this link for more information here.
- NB: this is a brief update given ATAA trade meeting commitments on Saturday and family commitments on Sunday.
Calendar:
- Mon 4th: GBP Construction PMI. USD & CAD Bank Holiday.
- Tue 5th: AUD RBA Rate update. GBP Services PMI & Inflation Report Hearings.
- Wed 6th: AUD GDP. CAD Trade Balance & BoC Rate update. USD ISM Manufacturing PMI.
- Thurs 7th: AUD Retail Sales and Trade Balance. EUR ECB Rate update & Press Conference. USD Crude Oil Inventories.
- Fri 8th: CNY Trade Balance. GBP Manufacturing Production. CAD Employment data. AUD RBA Gov Lowe speaks.
Forex:
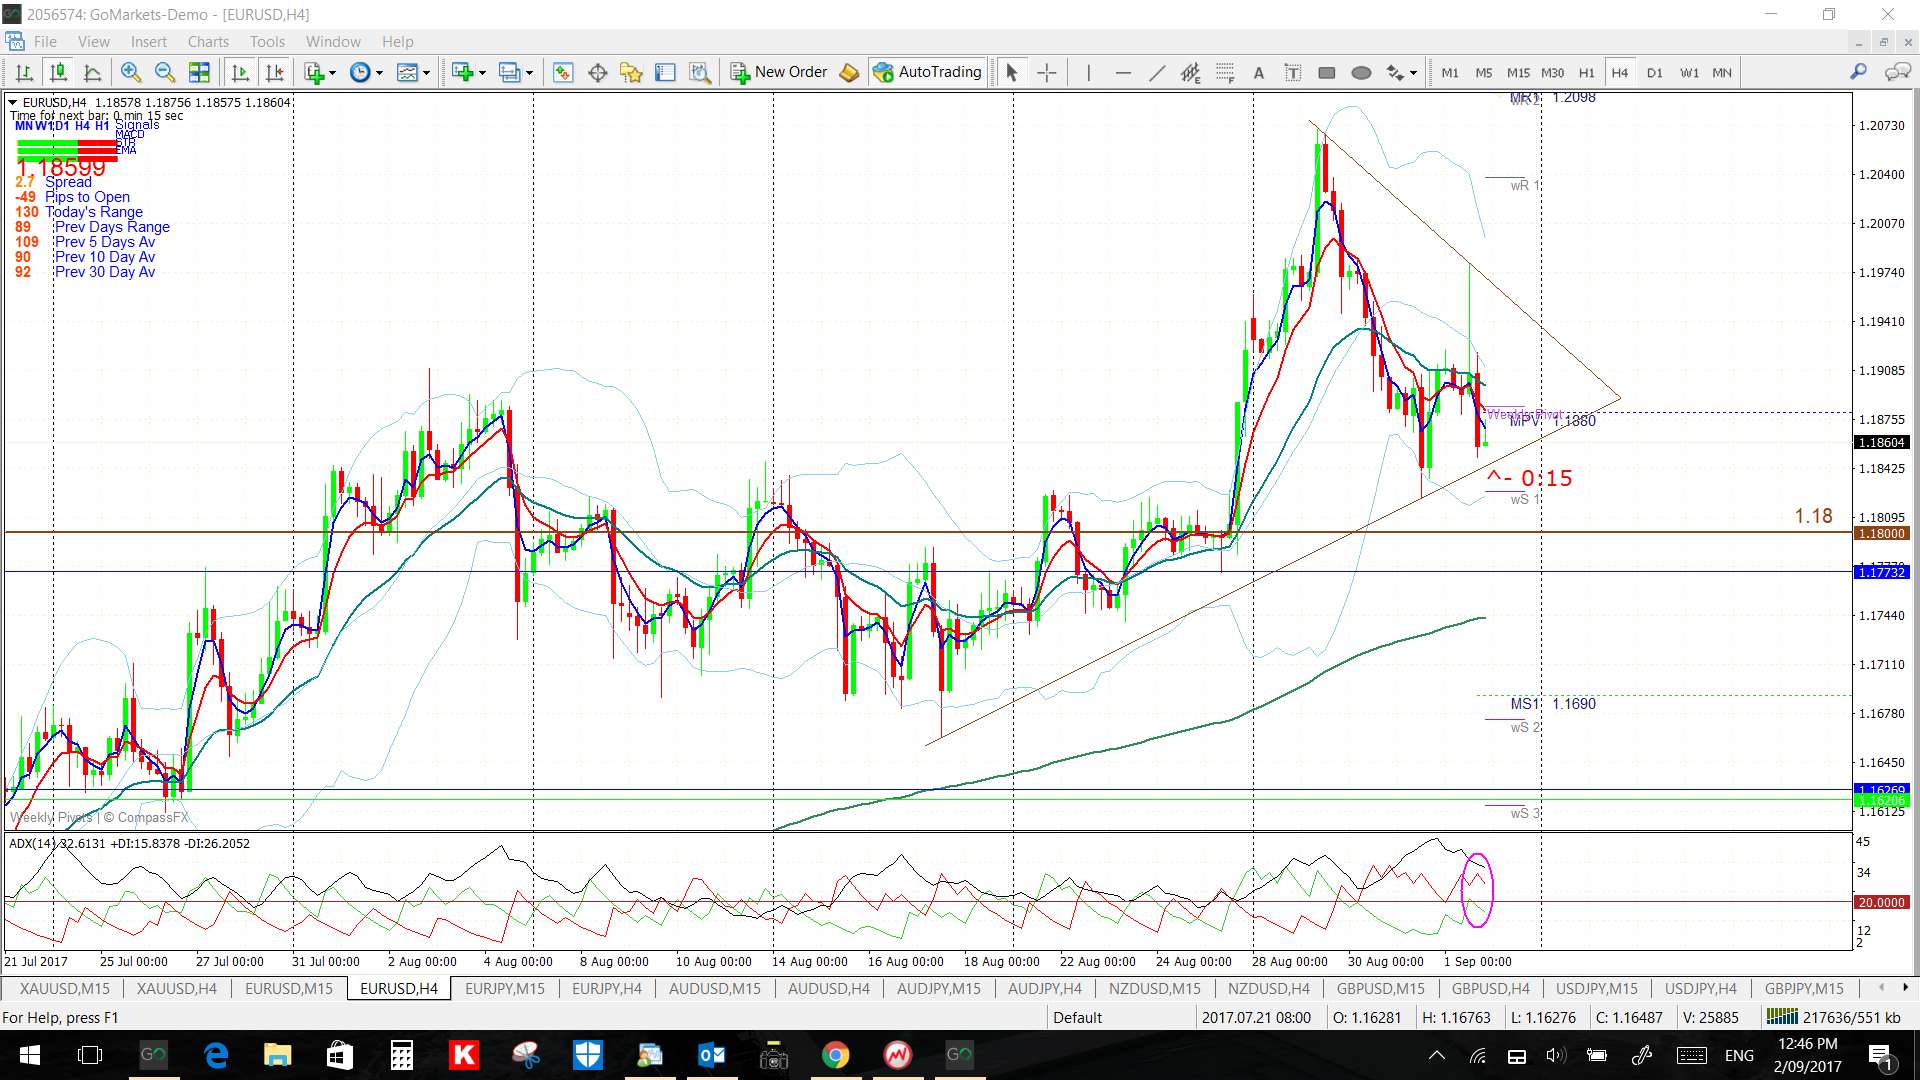
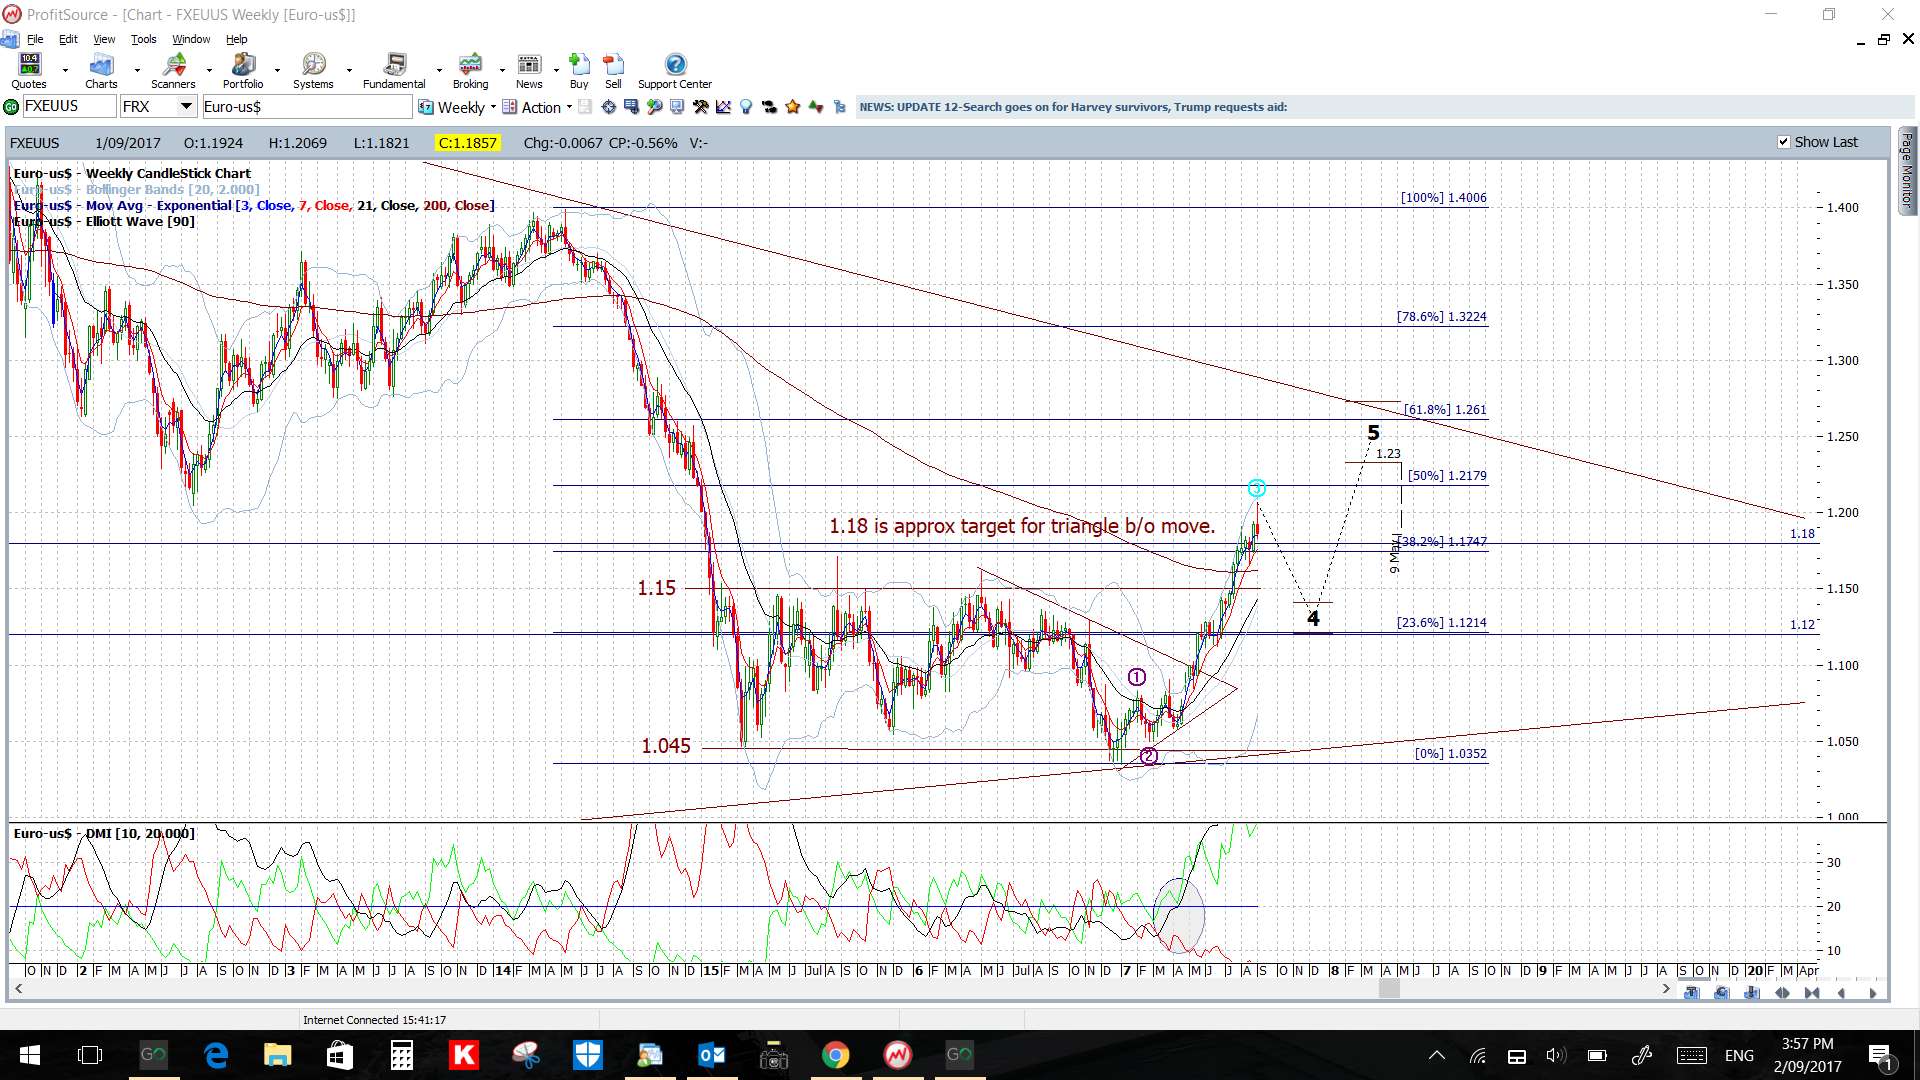
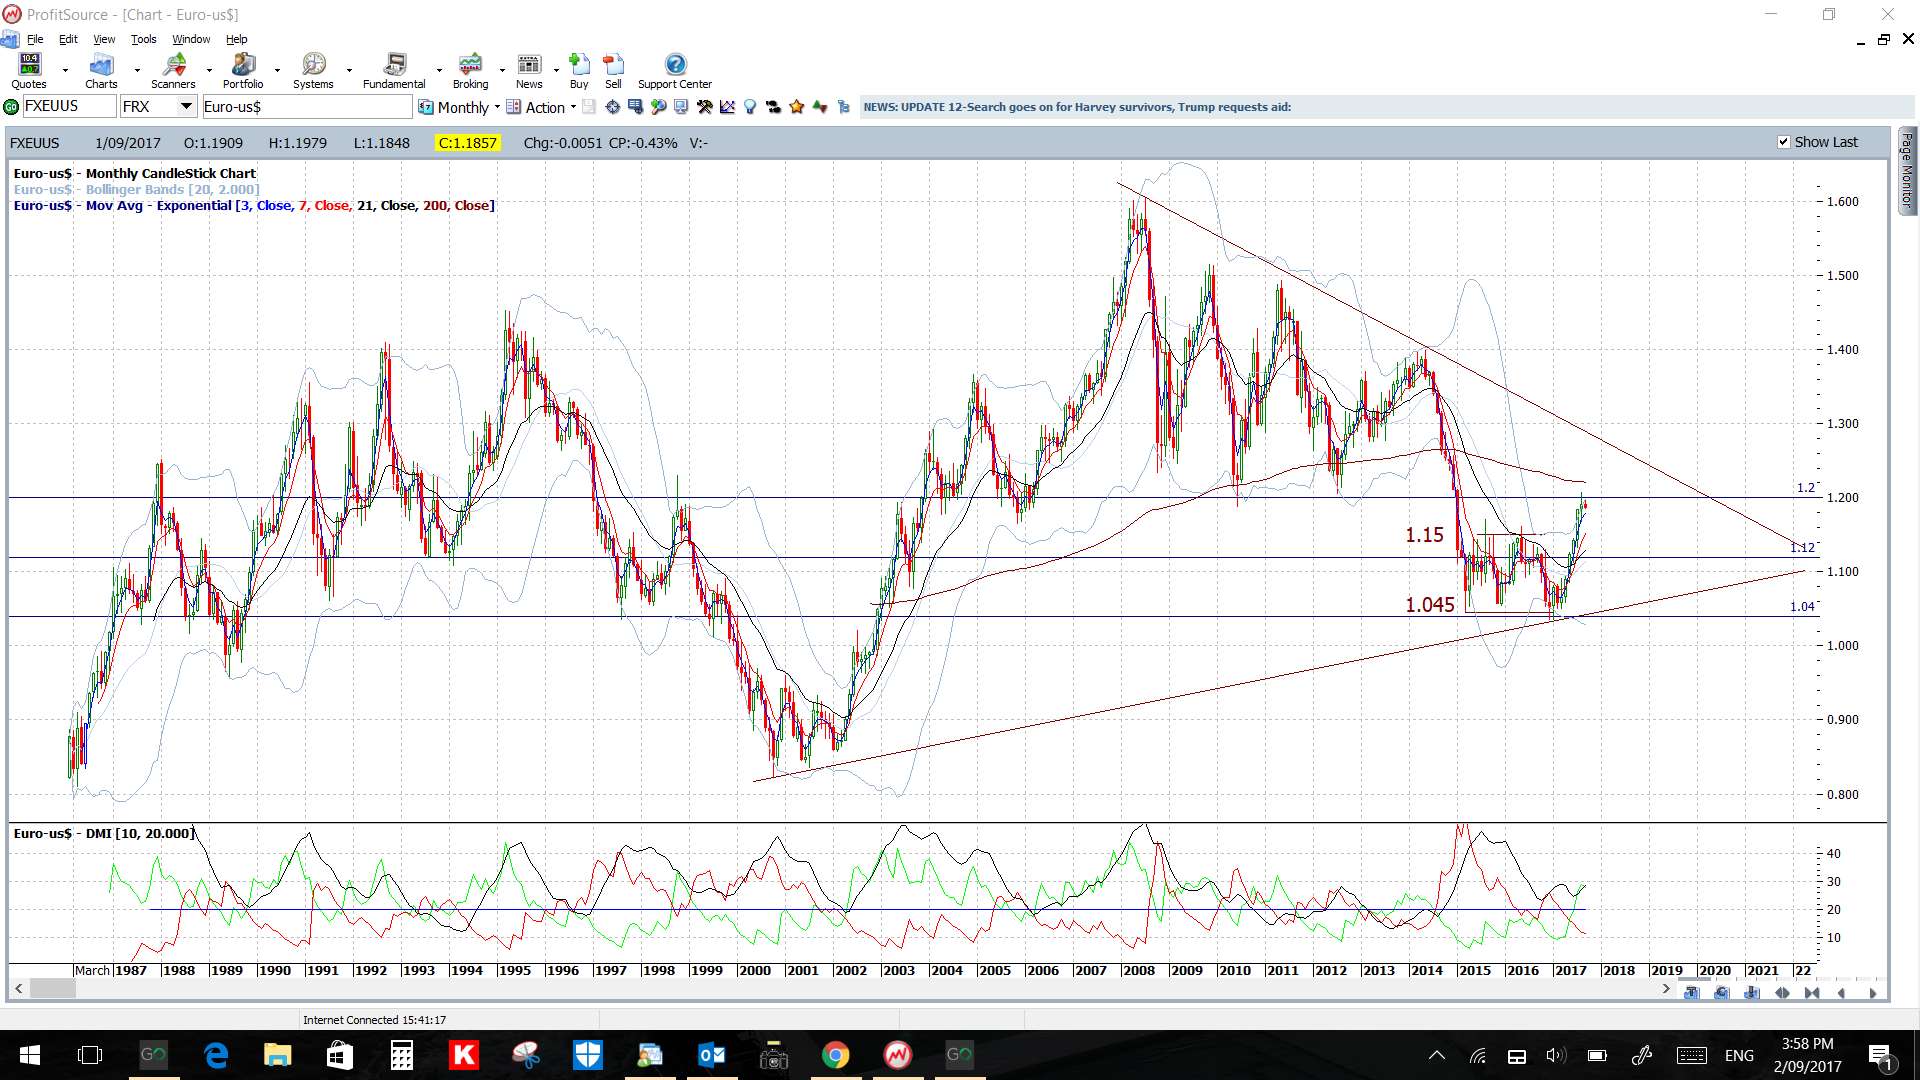
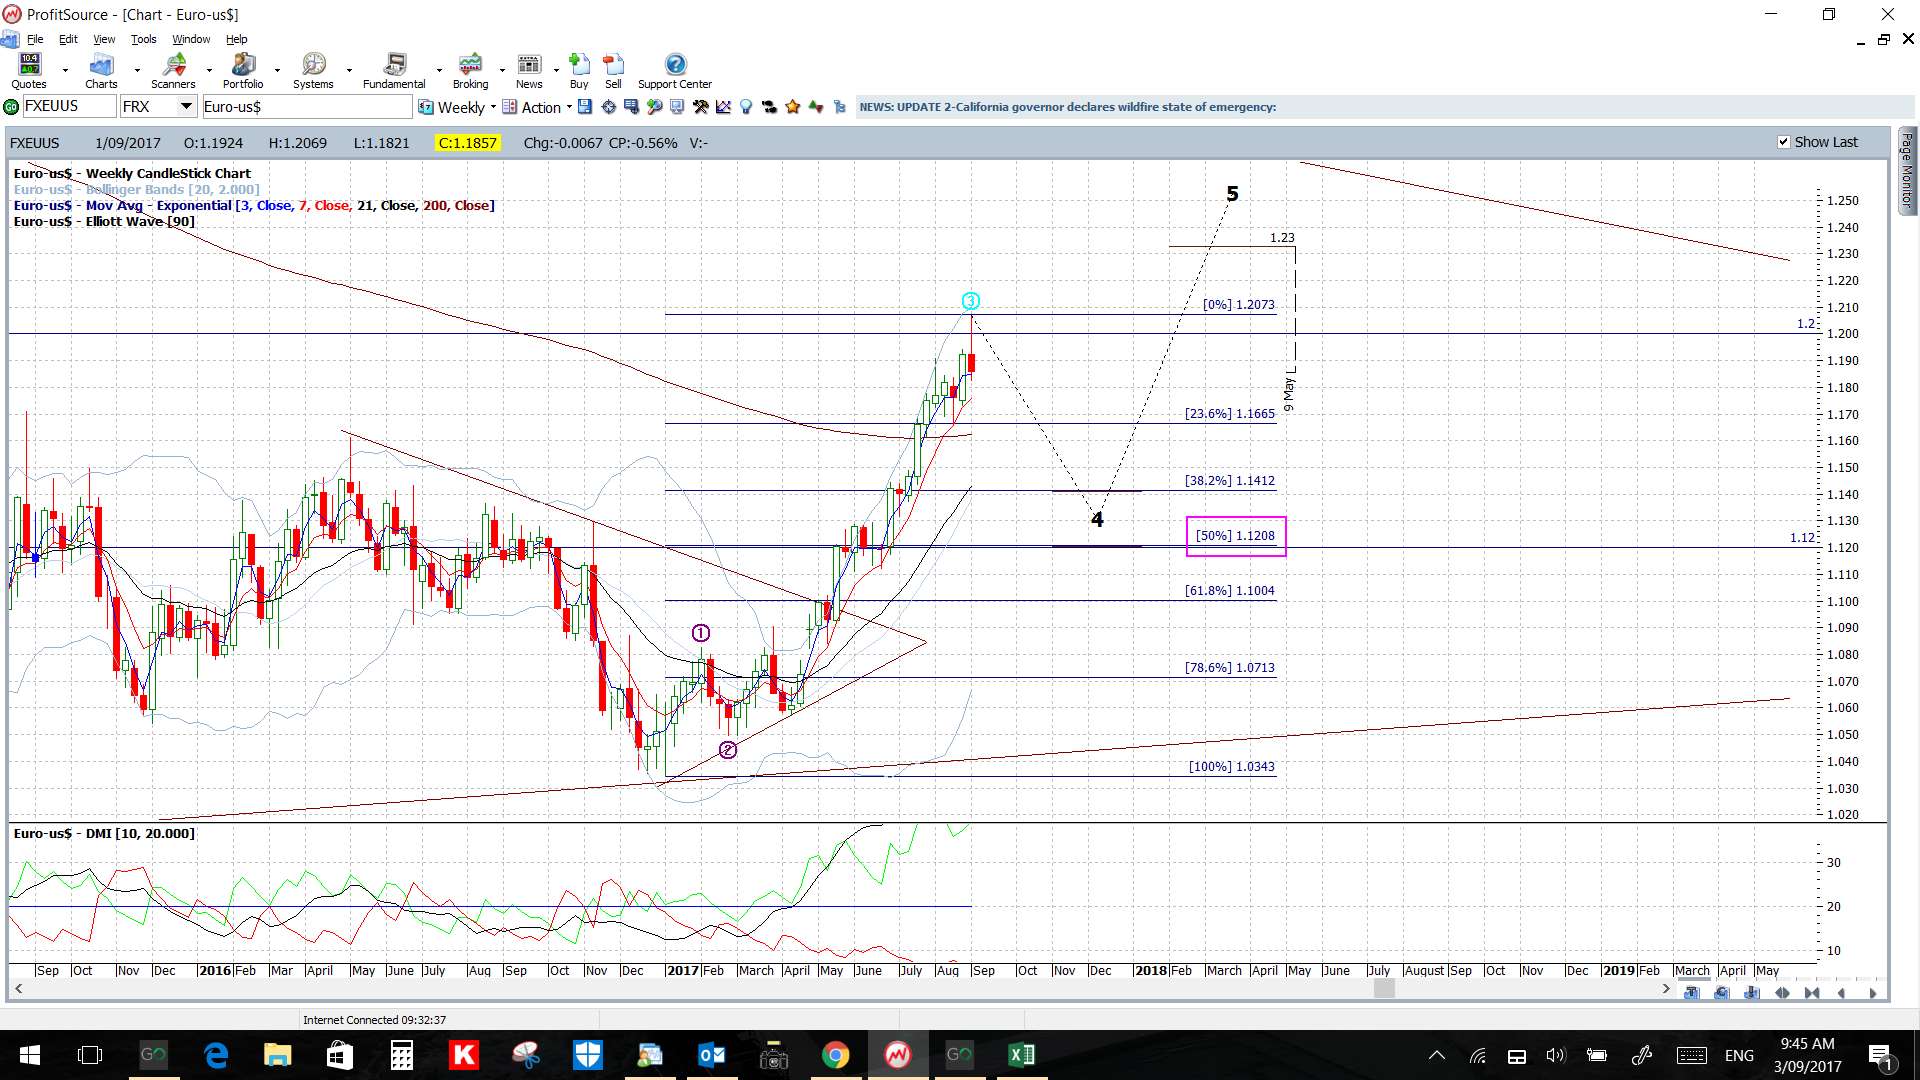
EUR/USD 4hr: The EUR/USD is consolidating in a triangle above 1.18 S/R. Be careful with this pair ahead of and with this week’s ECB rate update though; watch the triangle trend lines for any new breakout. The next main resistance level looks to be the whole-number 1.20 level (see monthly chart). Any respect of this major resistance level could see price action pause or eve pullback somewhat after this lengthy bull run. A 50% retracement of this recent swing high move is down near the major 1.12 level so would be one target to monitor with any pullback. FWIW: the weekly candle does have a bit of a bearish-reversal ‘Shooting Star’ look to it.
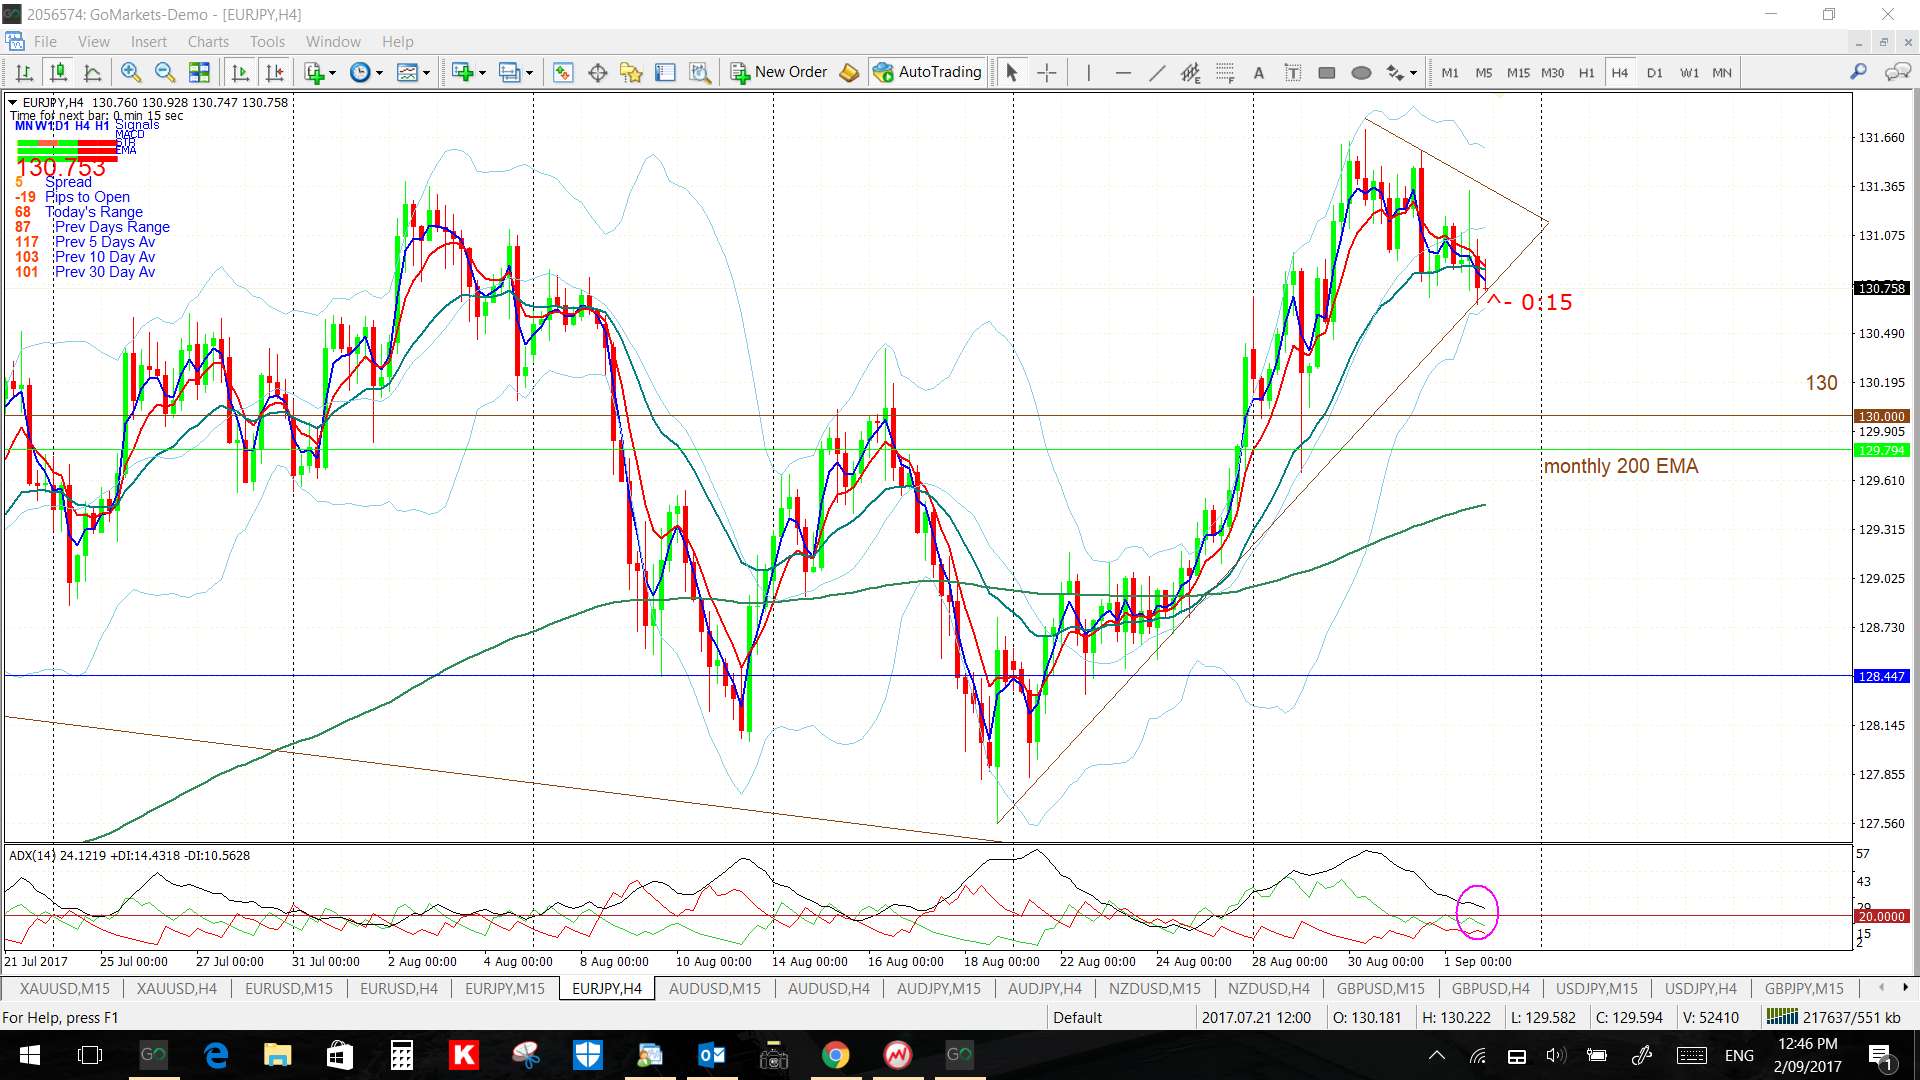
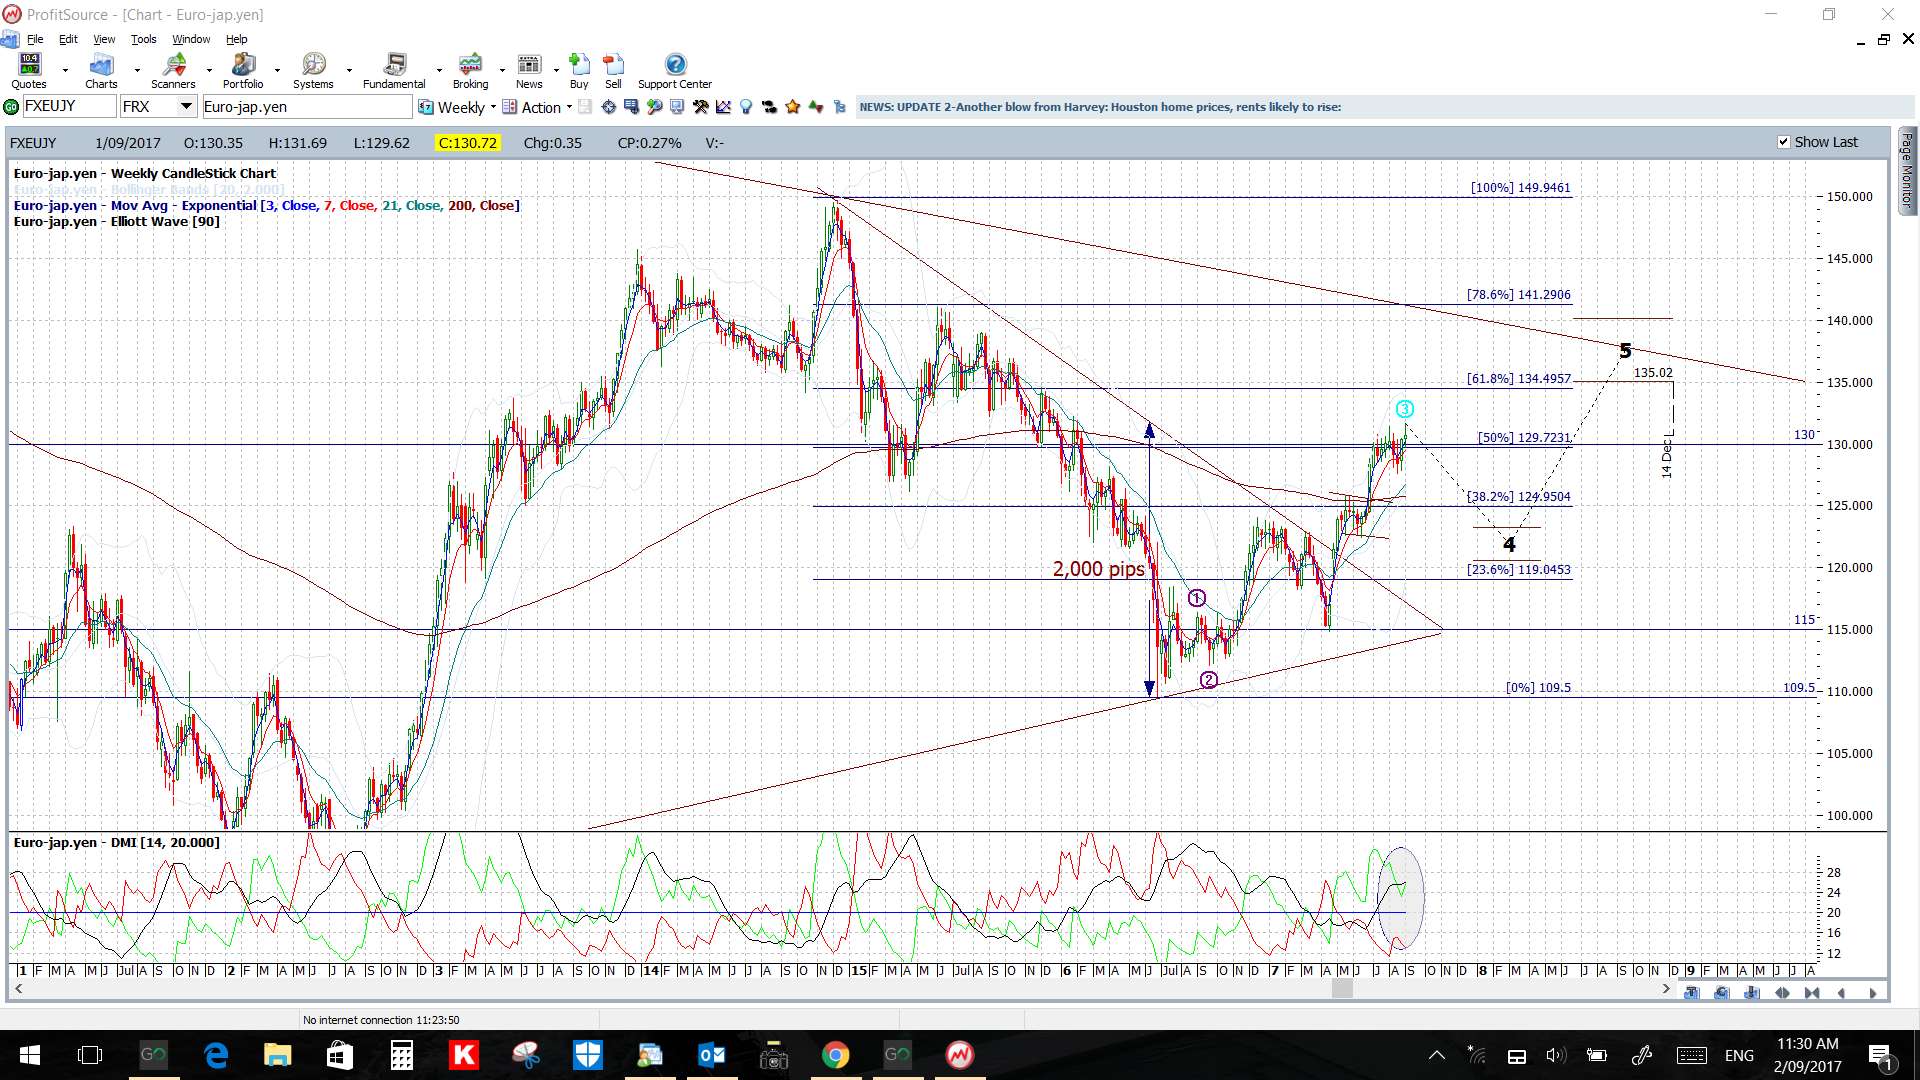
EUR/JPY: this pair is consolidating in a triangle above 1.30 S/R and printed an indecision-style ‘Spinning Top’ candle for the week.
Watch the triangle trend lines for any new breakout. Be careful with this pair ahead of and with this week’s ECB rate update.
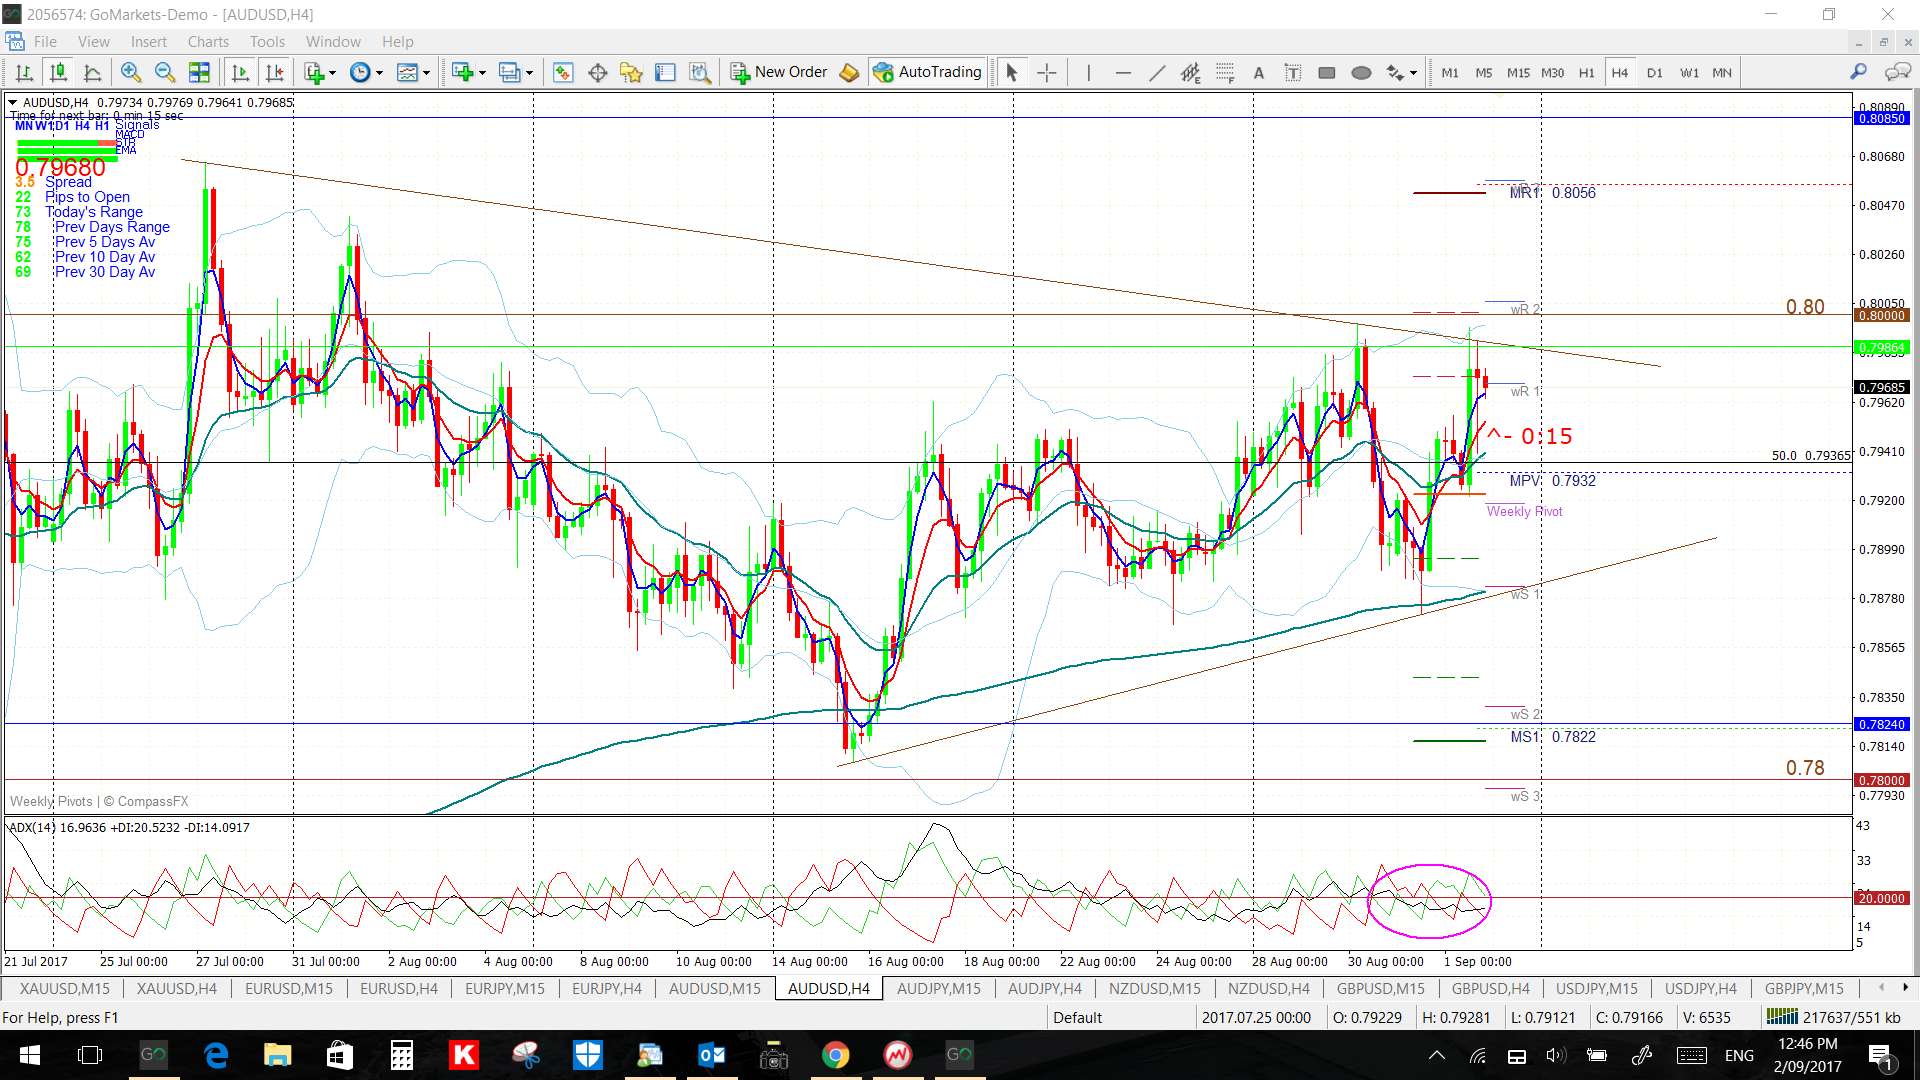
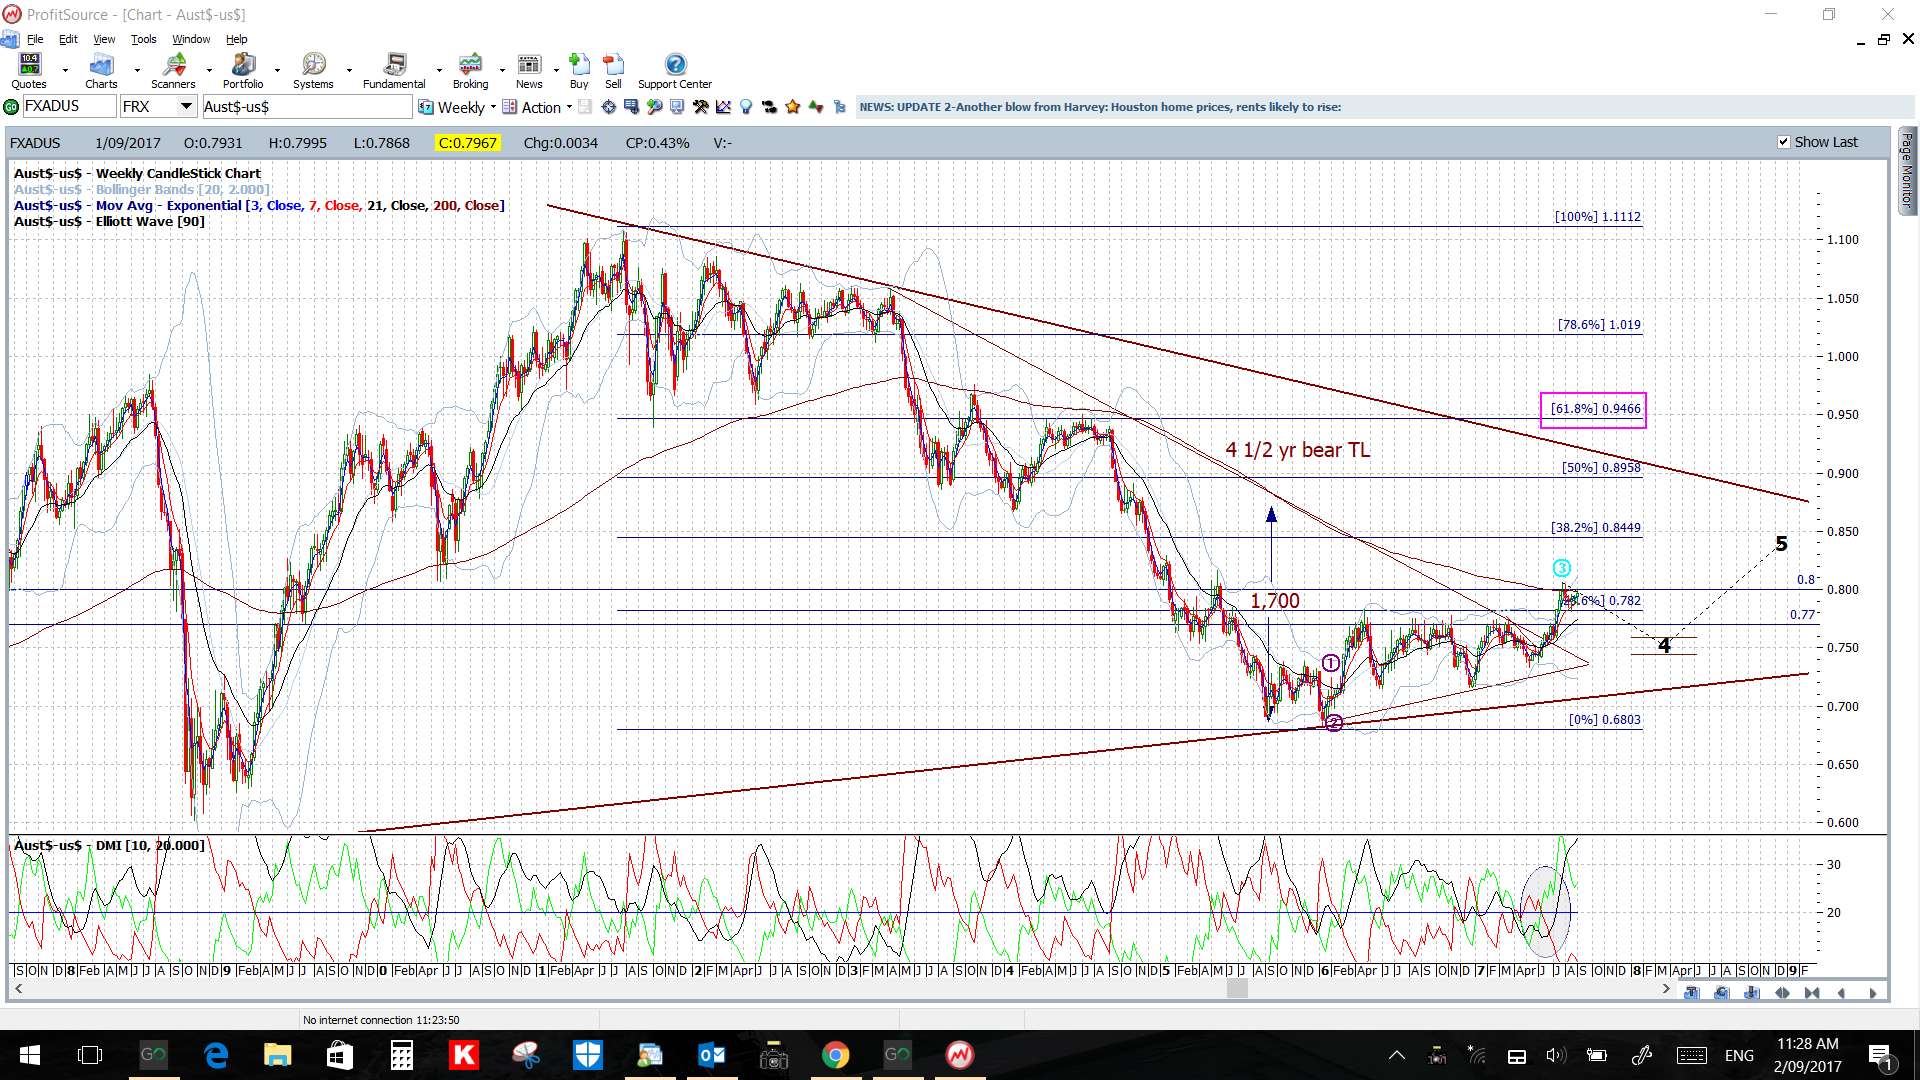
AUD/USD: this pair is consolidating in a triangle below 0.80 S/R. Watch the triangle trend lines for any new breakout. Be careful with this pair ahead of and with this week’s RBA rate update, AUD Retail Sales, AUD Trade Balance data and the RBA Gov Lowe speech.
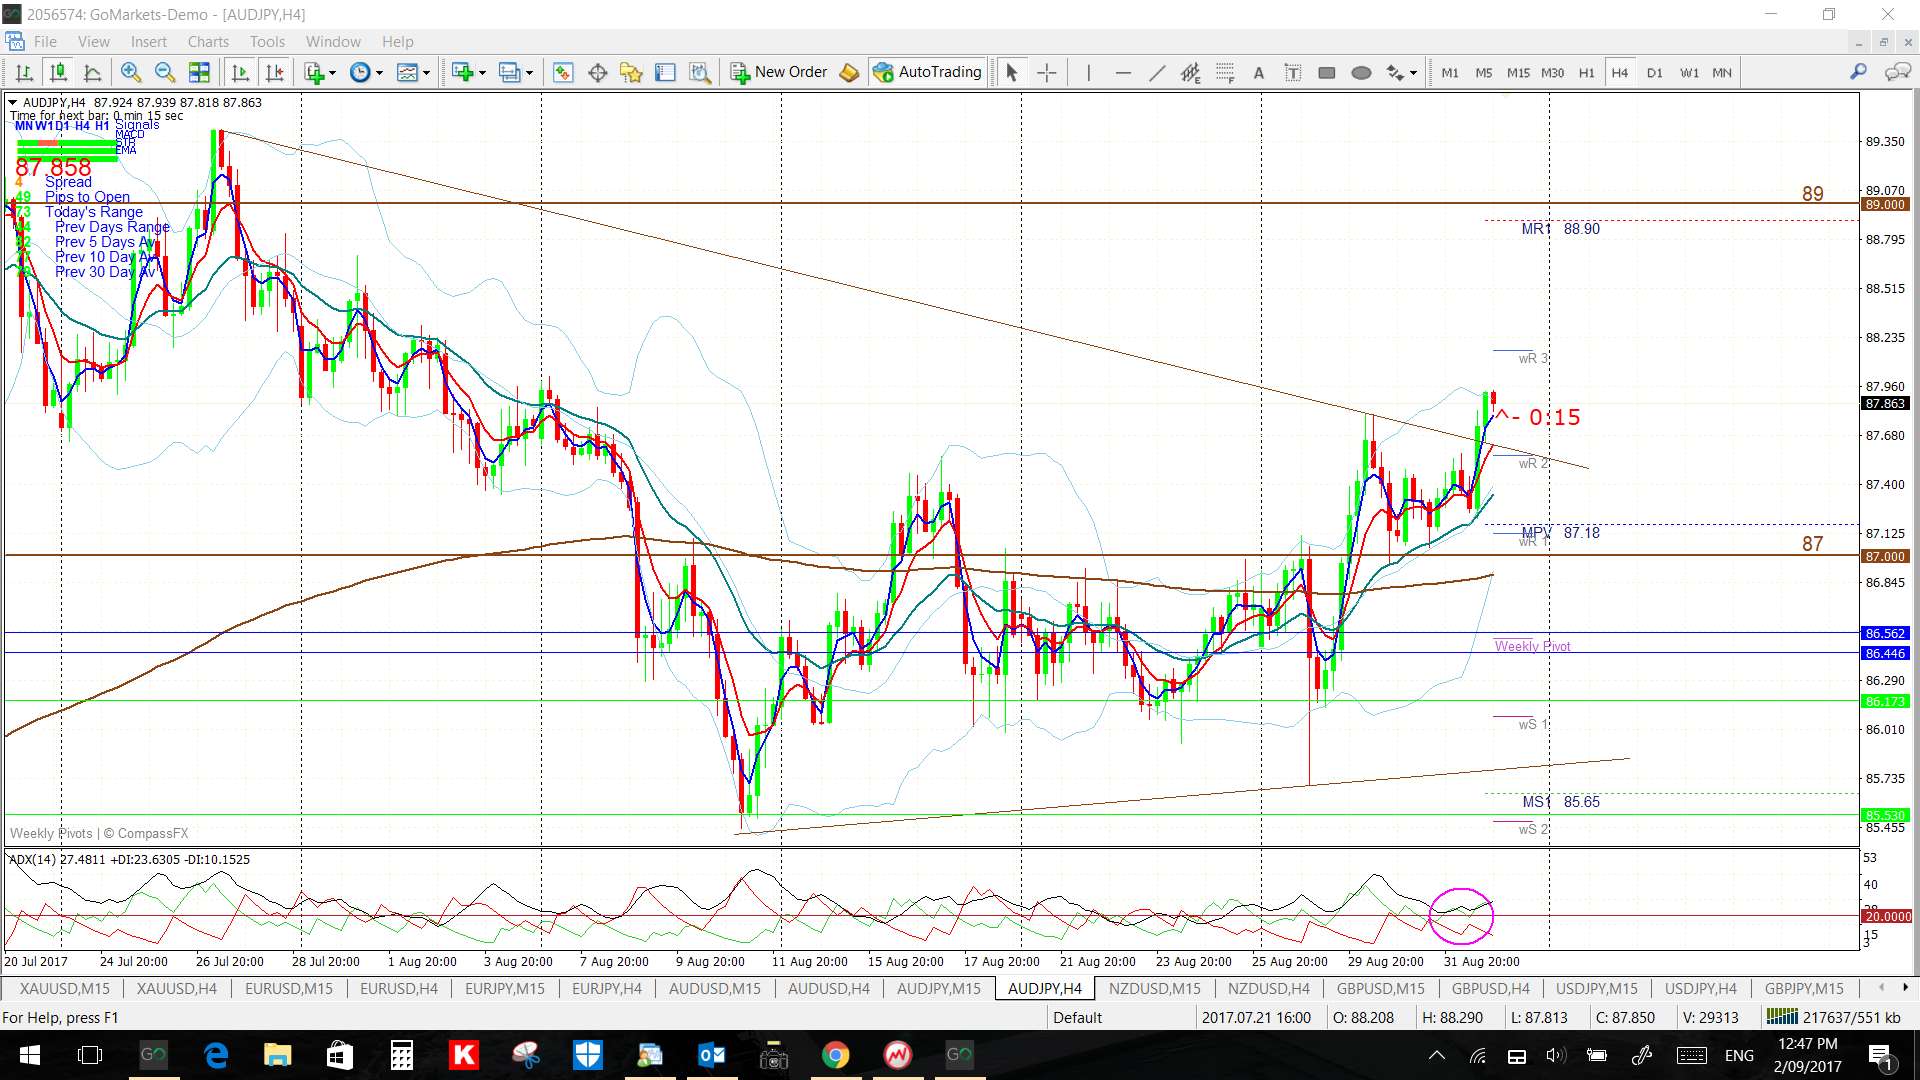
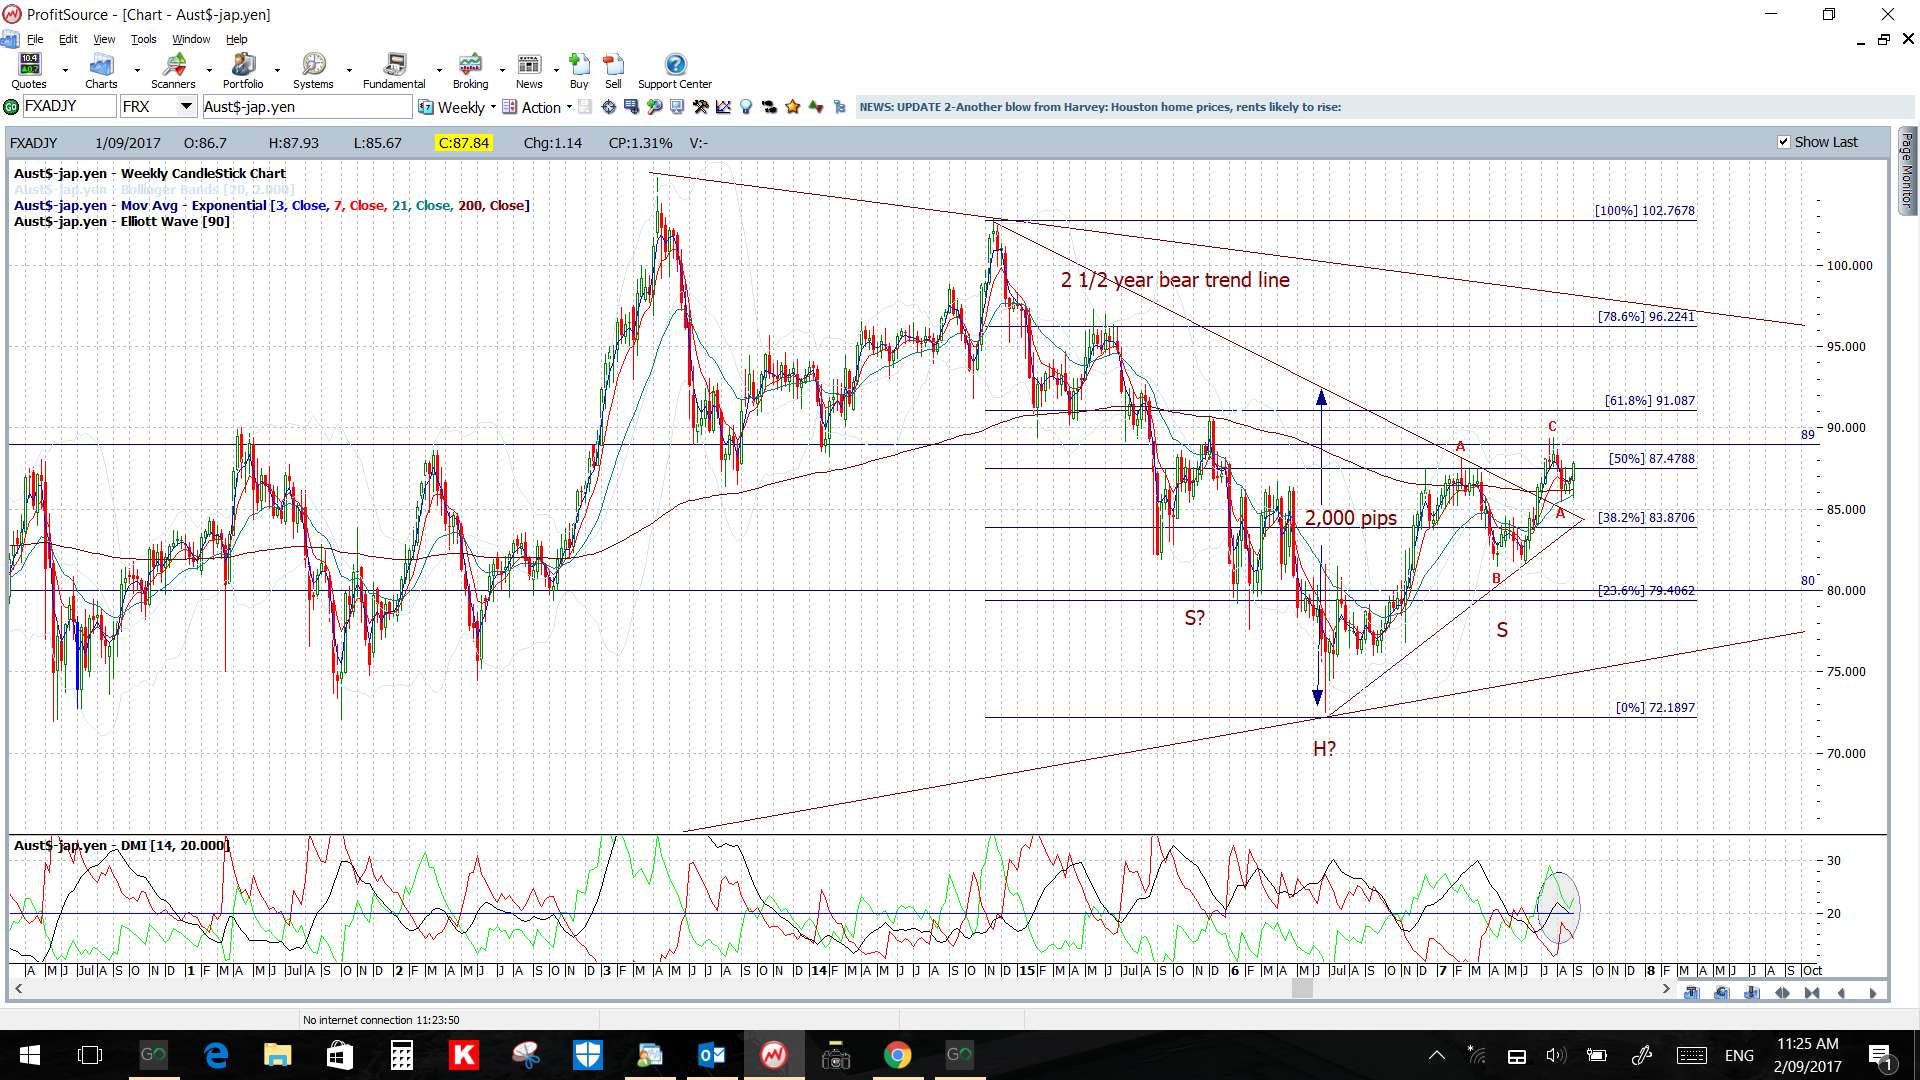
AUD/JPY: this pair is consolidating in a wedge below 0.89 S/R. Watch the wedge trend lines for any new breakout. Be careful with this pair ahead of and with this week’s RBA rate update, AUD Retail Sales, AUD Trade Balance data, the RBA Gov Lowe speech and CNY Trade Balance.
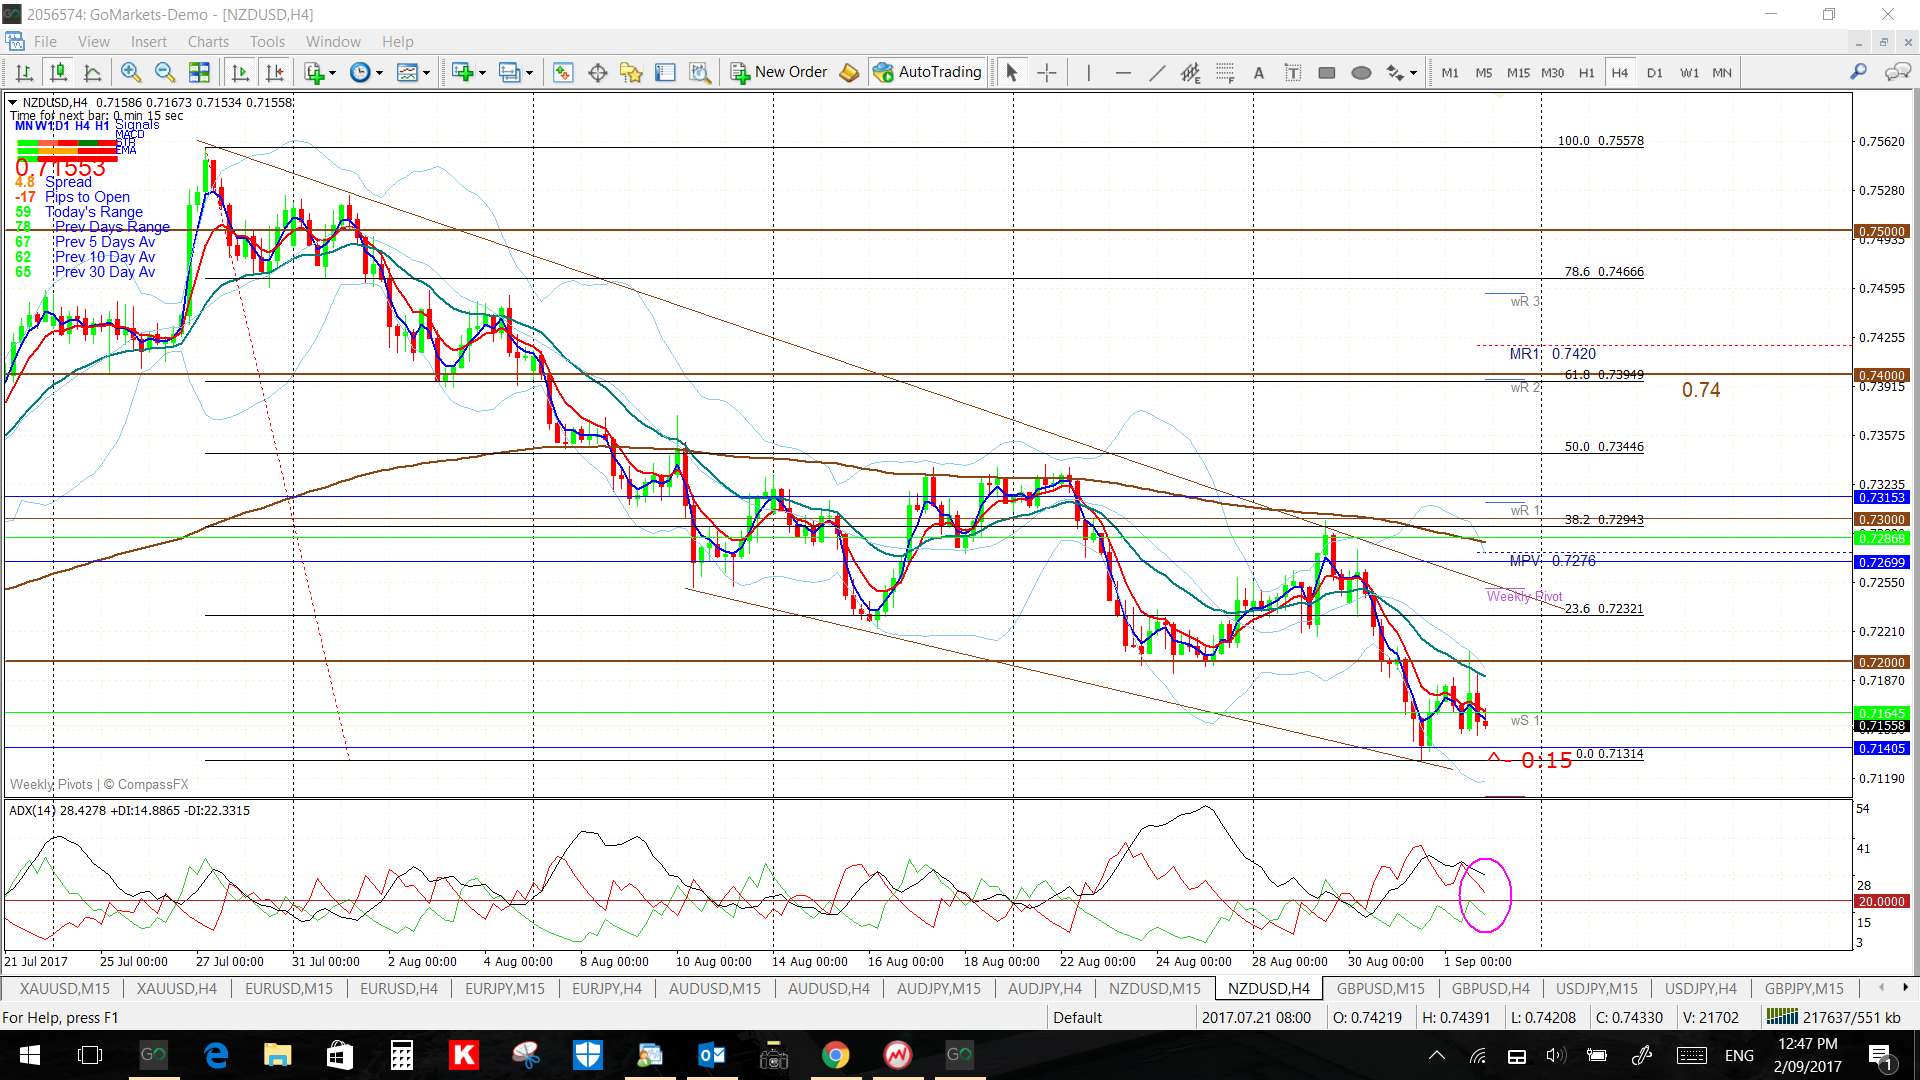
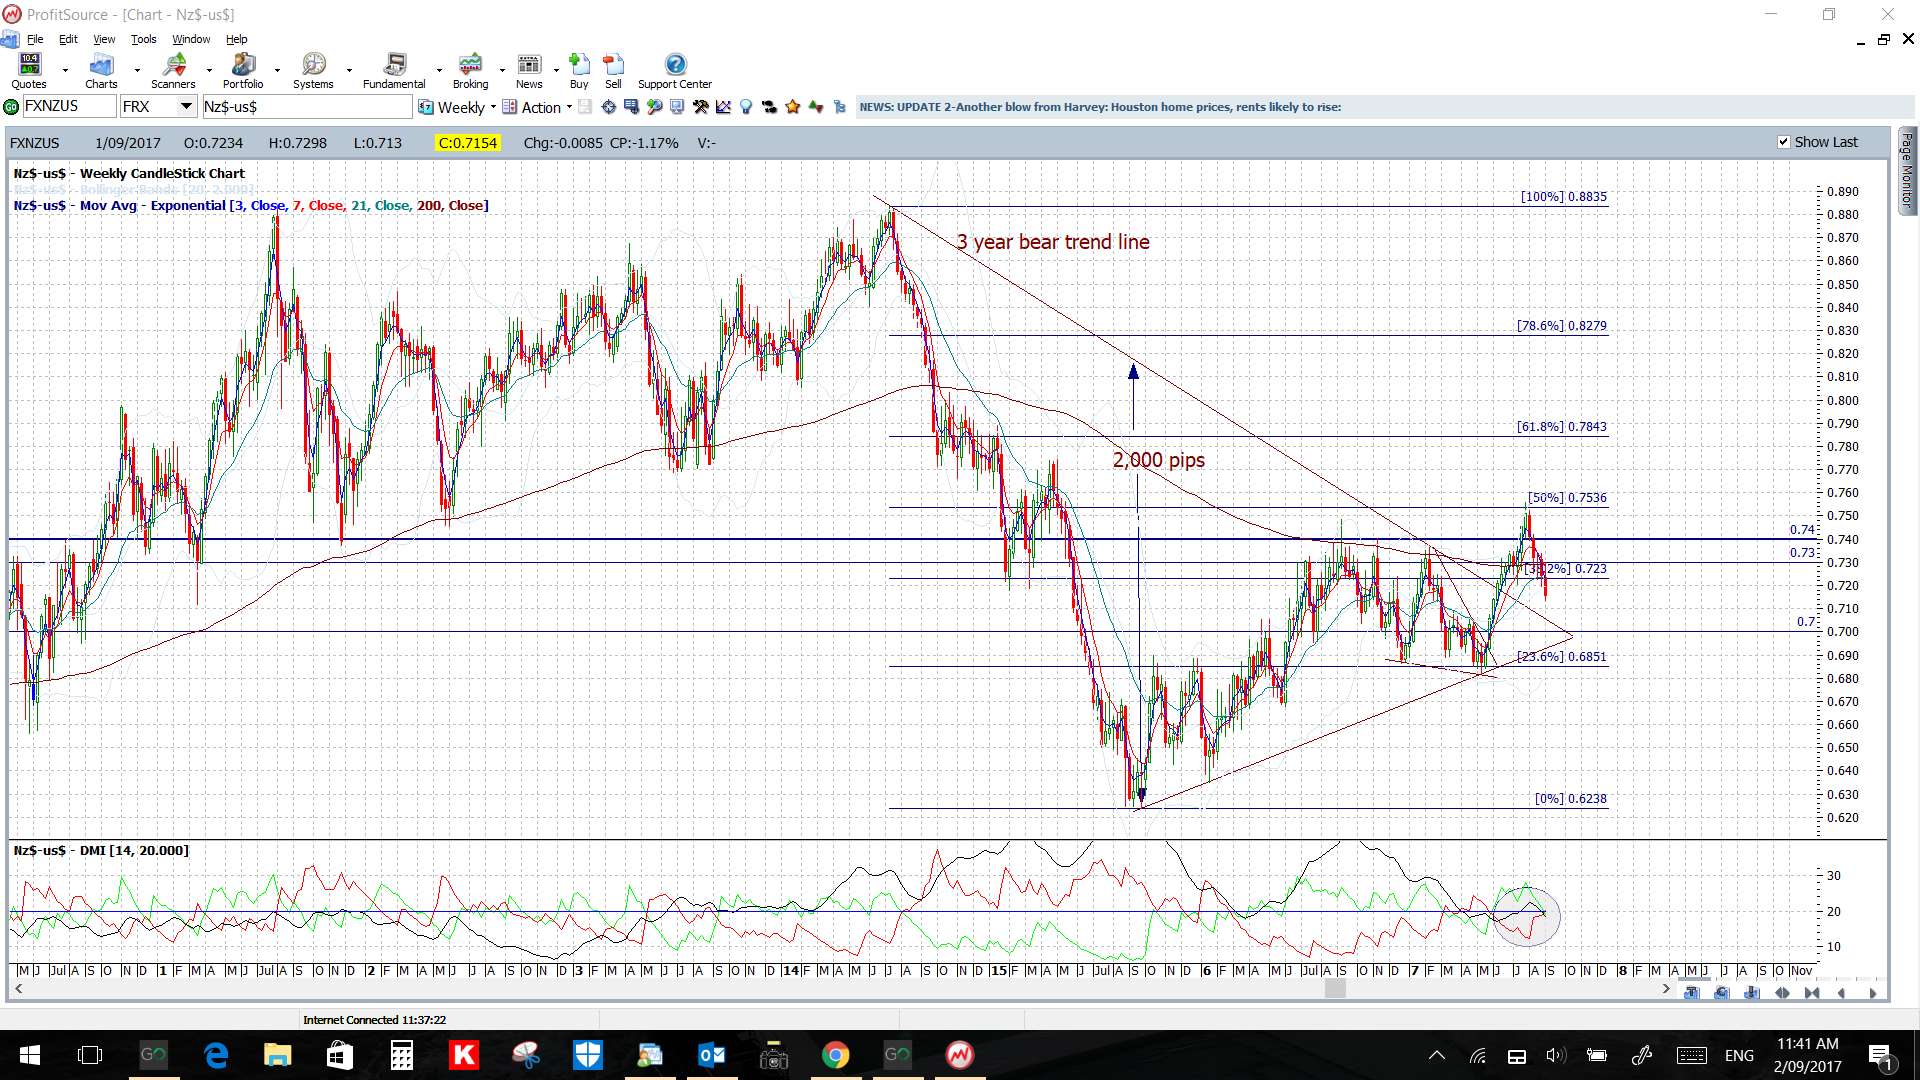
NZD/USD: this pair is consolidating in a channel below 0.72 S/R. Watch the channel trend lines and 0.72 / 0.71 levels for any new breakout. The Kiwi printed a large bearish candle for the week.
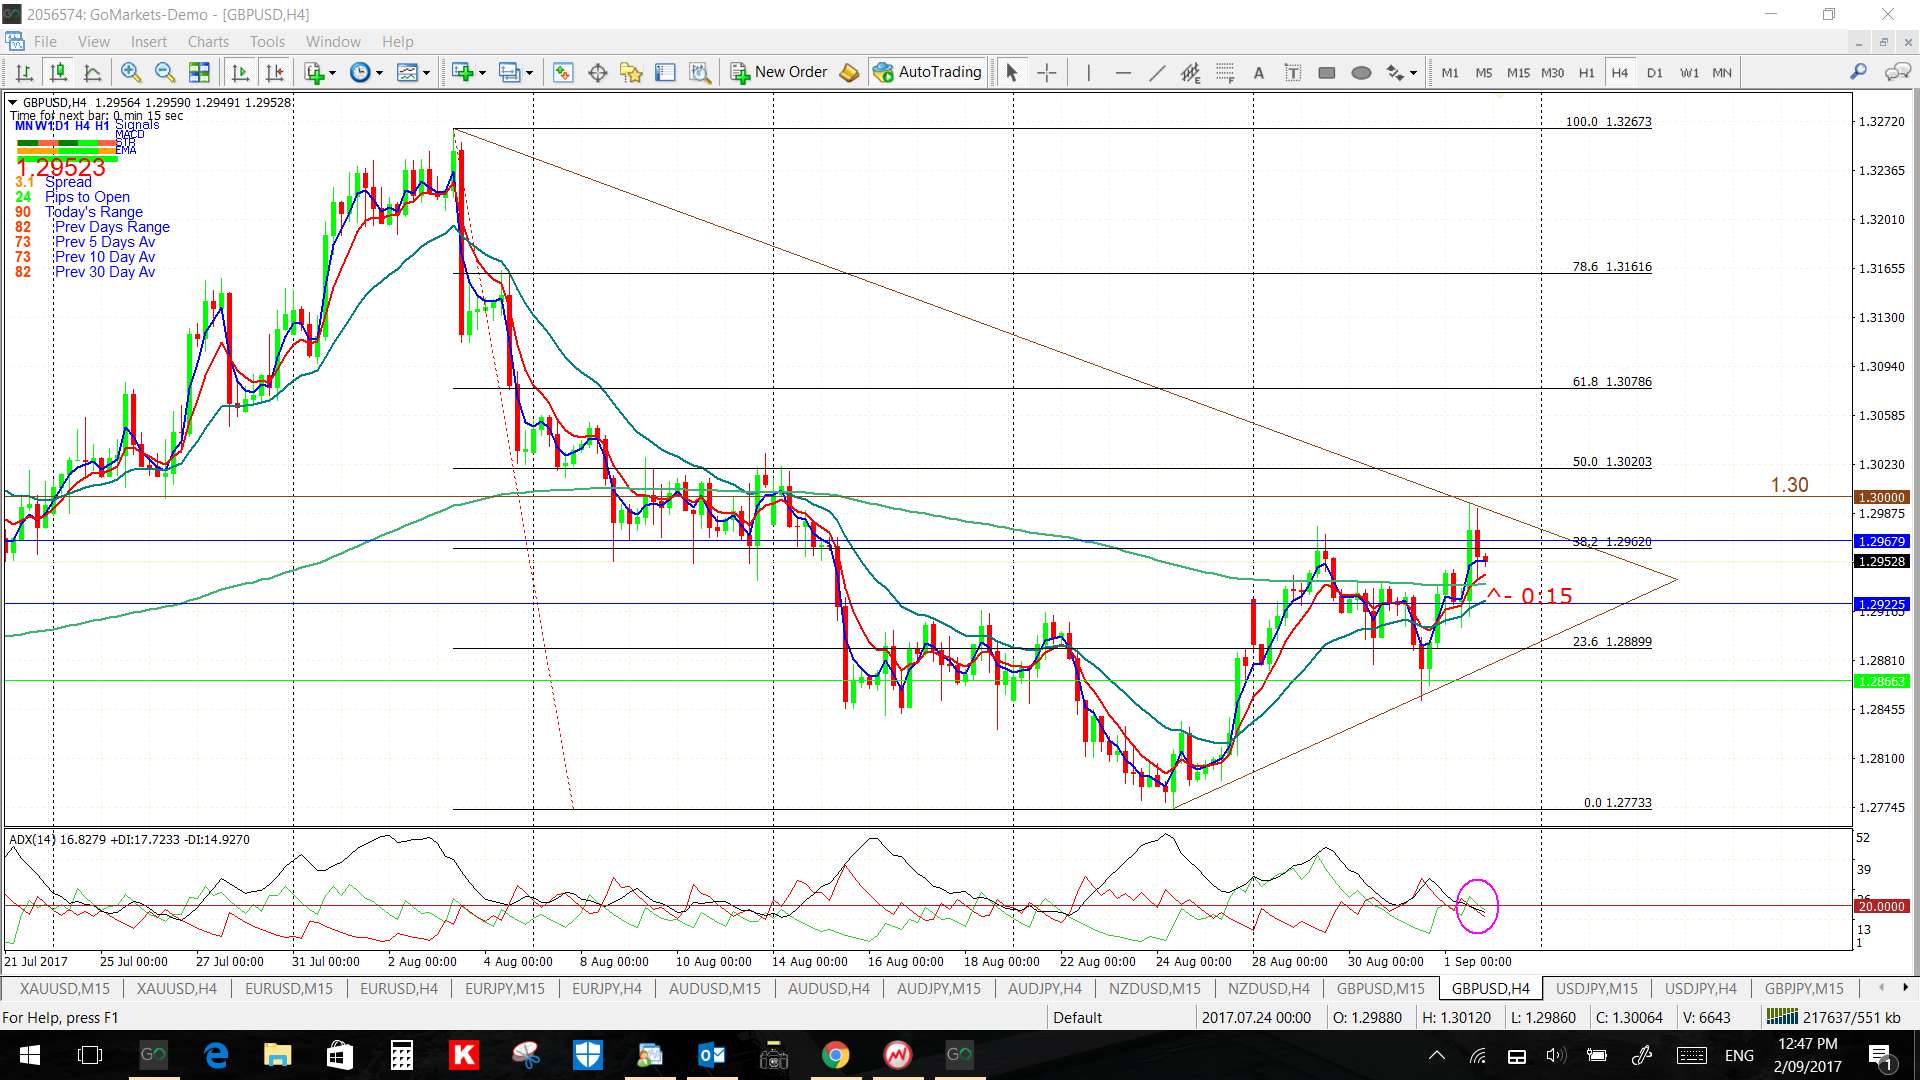
GBP/USD: this pair is consolidating in a triangle below 1.30 S/R so watch the triangle trend lines for any new breakout. The Cable printed an indecision-style ‘Spinning Top’ candle for the week.
Be careful with this pair ahead of and with this week’s GBP Construction PMI, GBP Services PMI, GBP Manufacturing Production data as well as all of the US data.

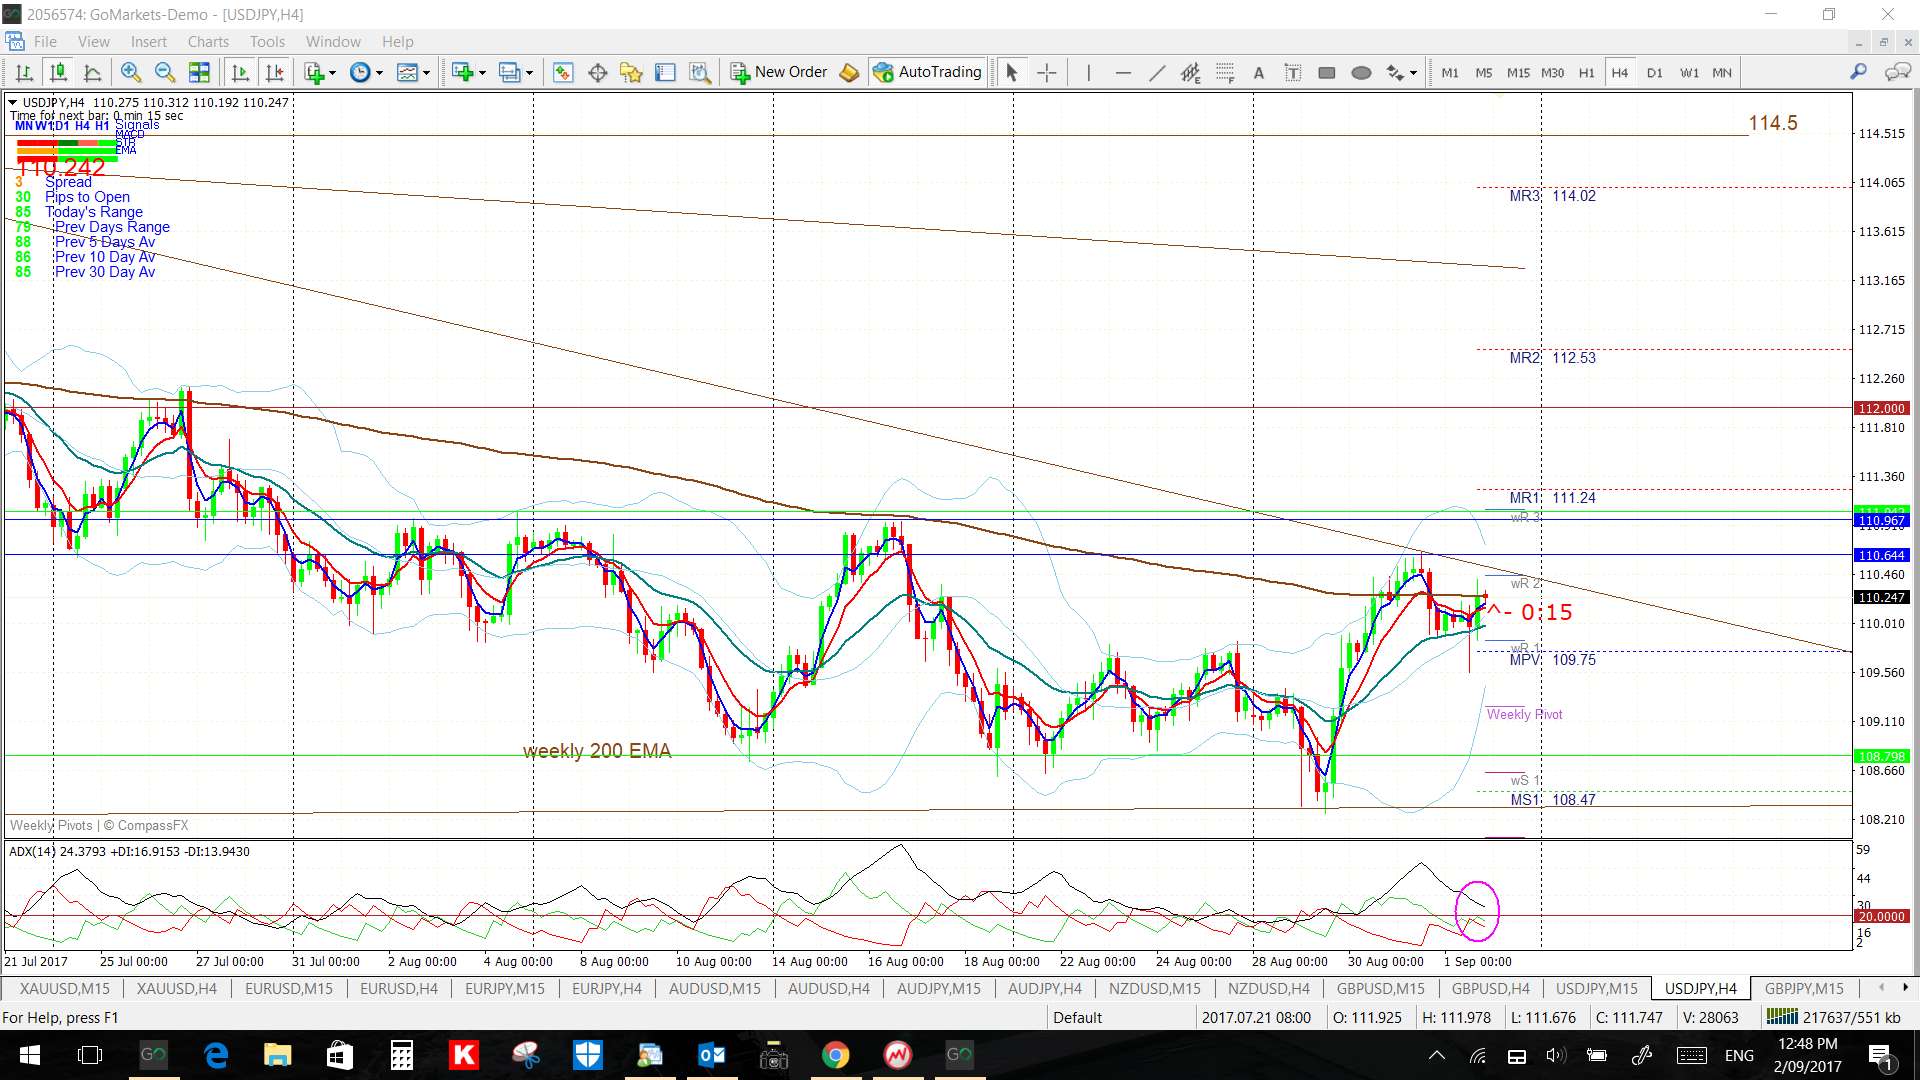
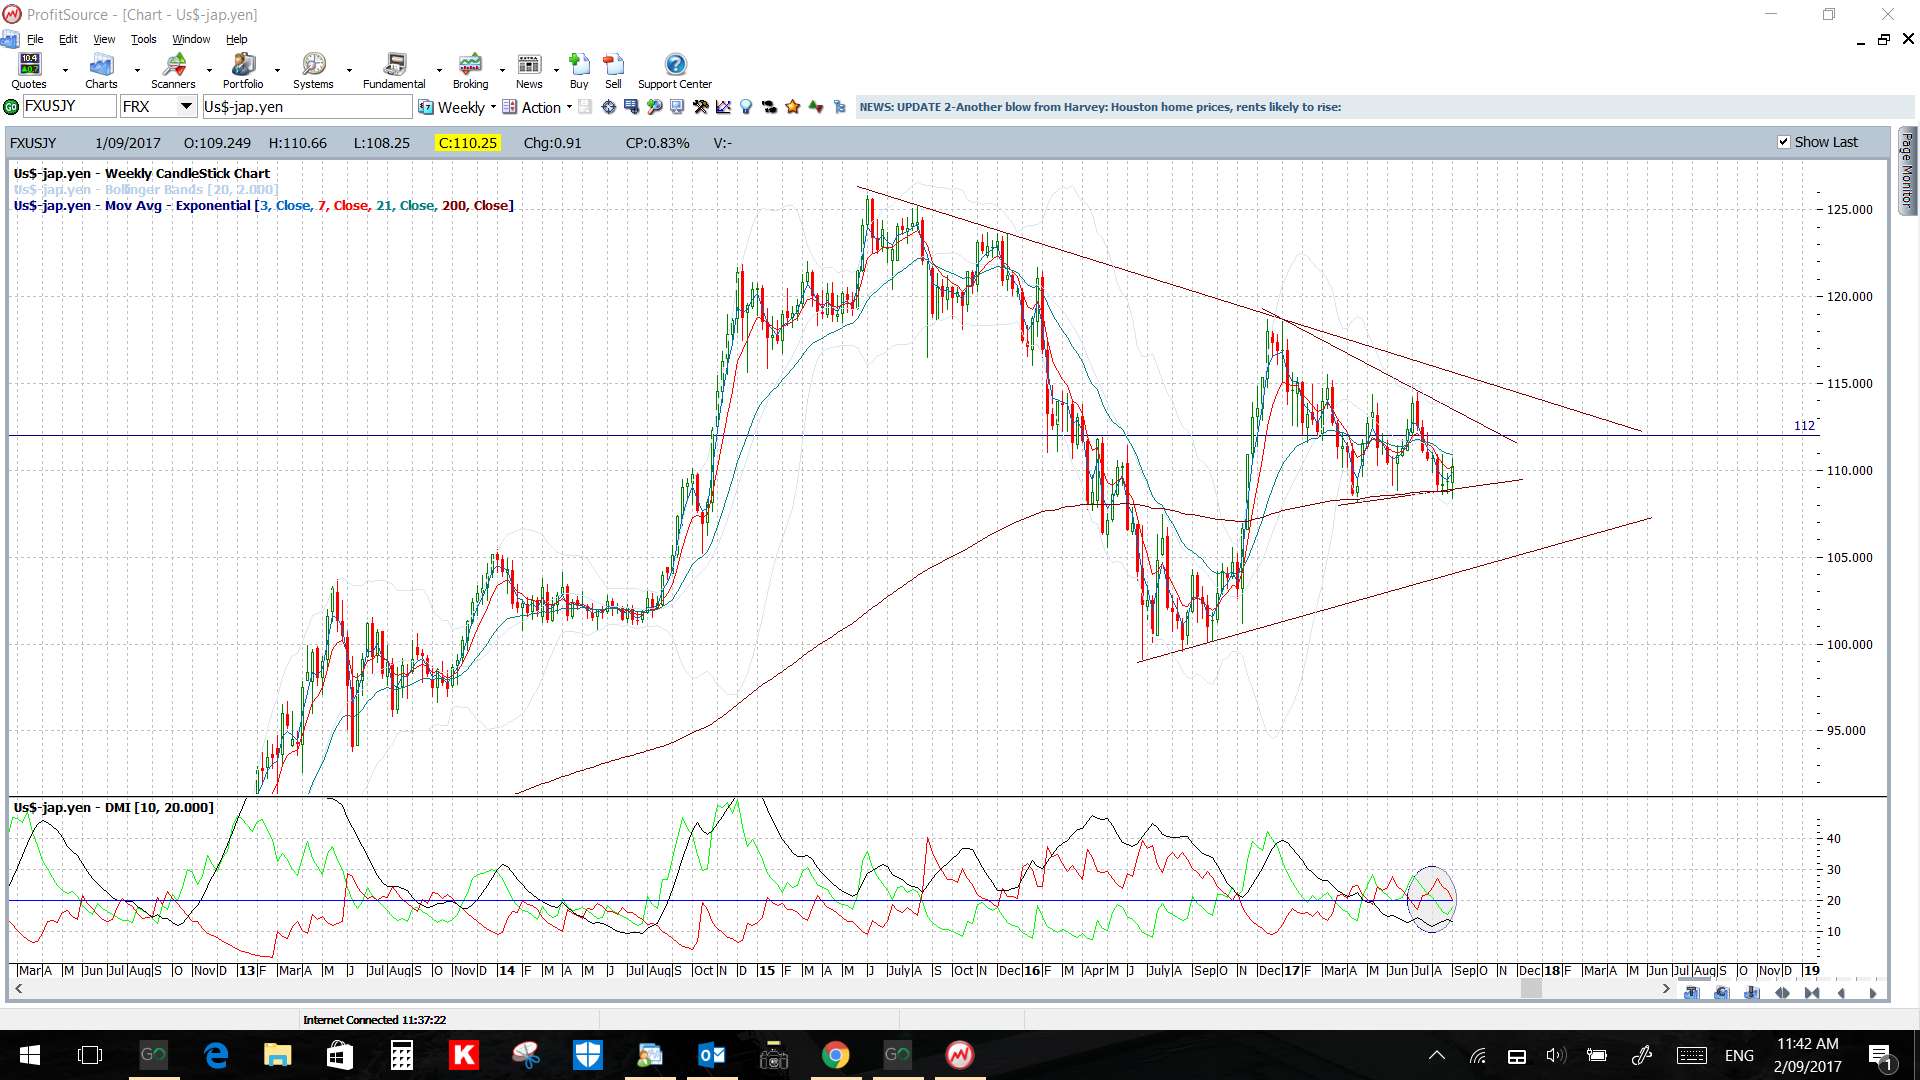
USD/JPY: this pair has been going sideways for the last 5 weeks. Watch the trend lines for any breakout.
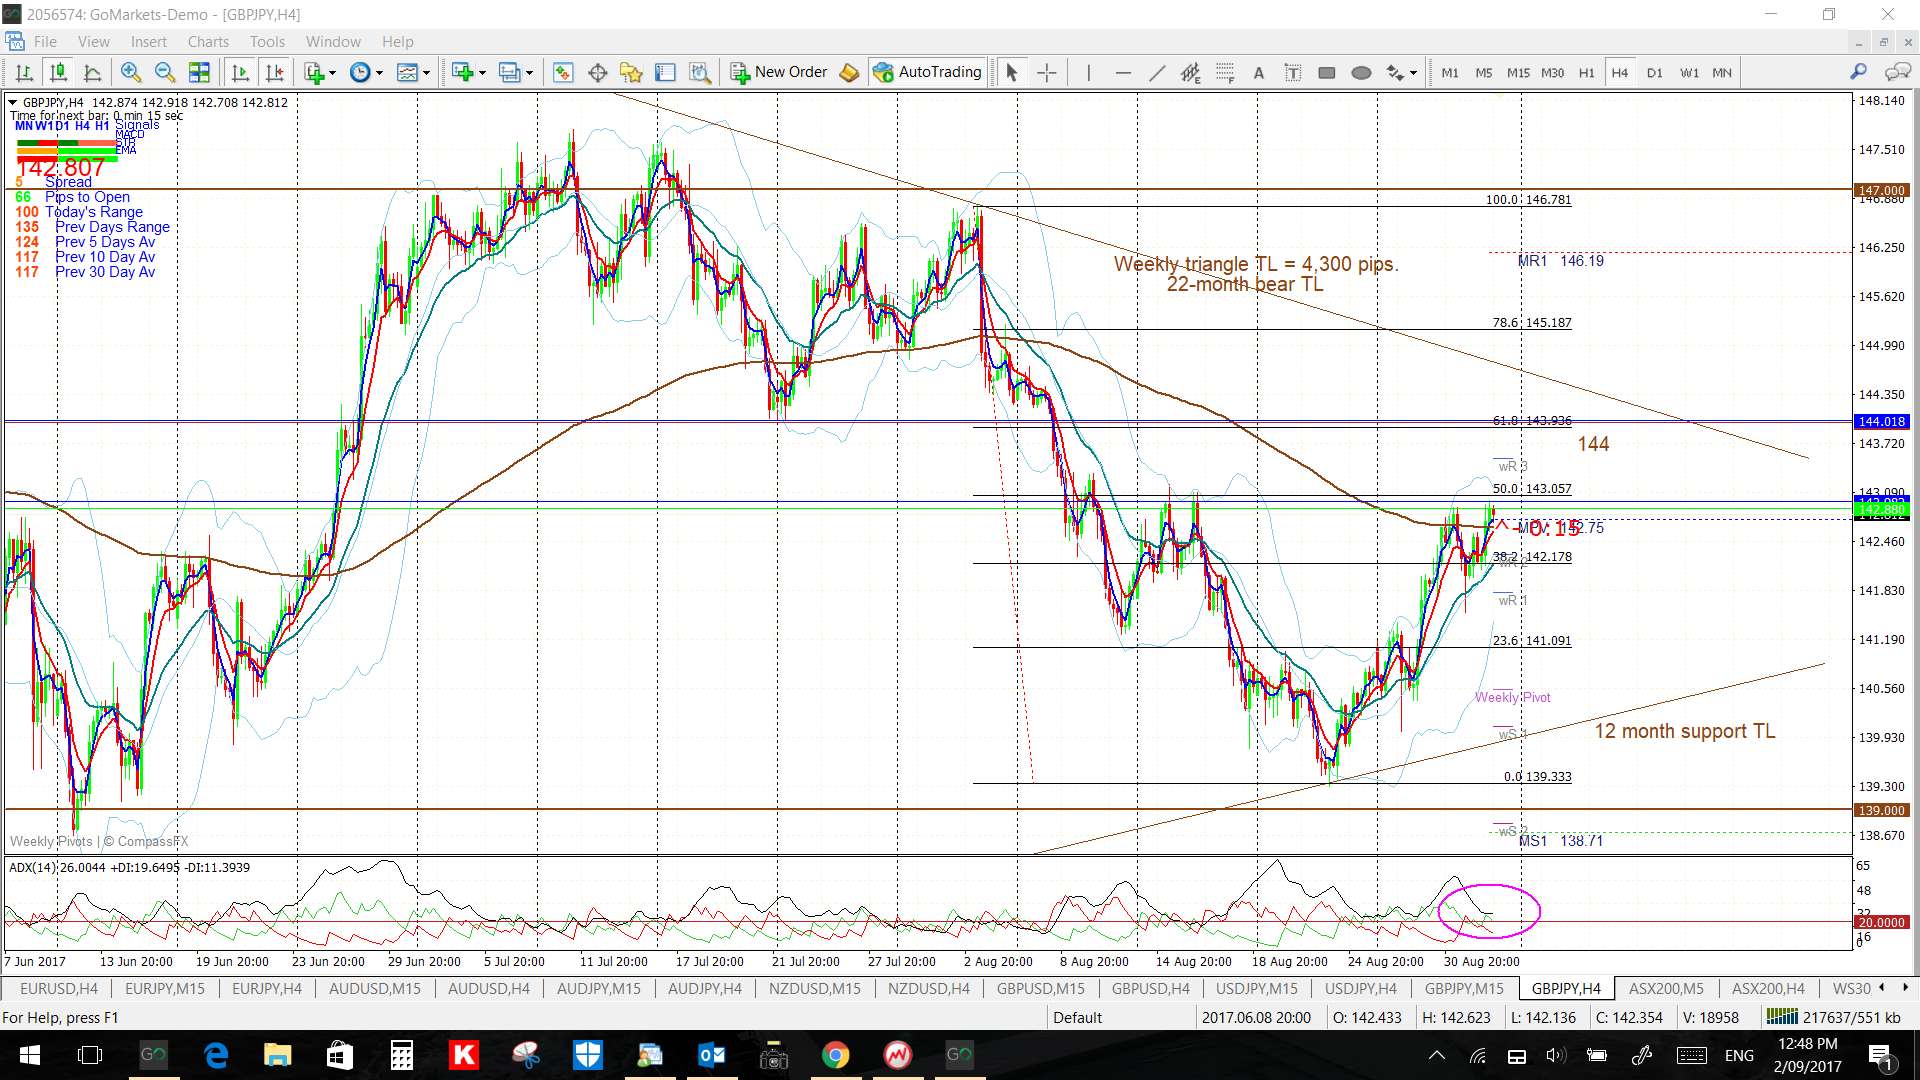
GBP/JPY: this pair is consolidating in a revised triangle below 144 S/R so watch the triangle trend lines for any new breakout. Be careful with this pair ahead of and with this week’s GBP Construction PMI, GBP Services PMI, GBP Manufacturing Production data as well as all of the US data.
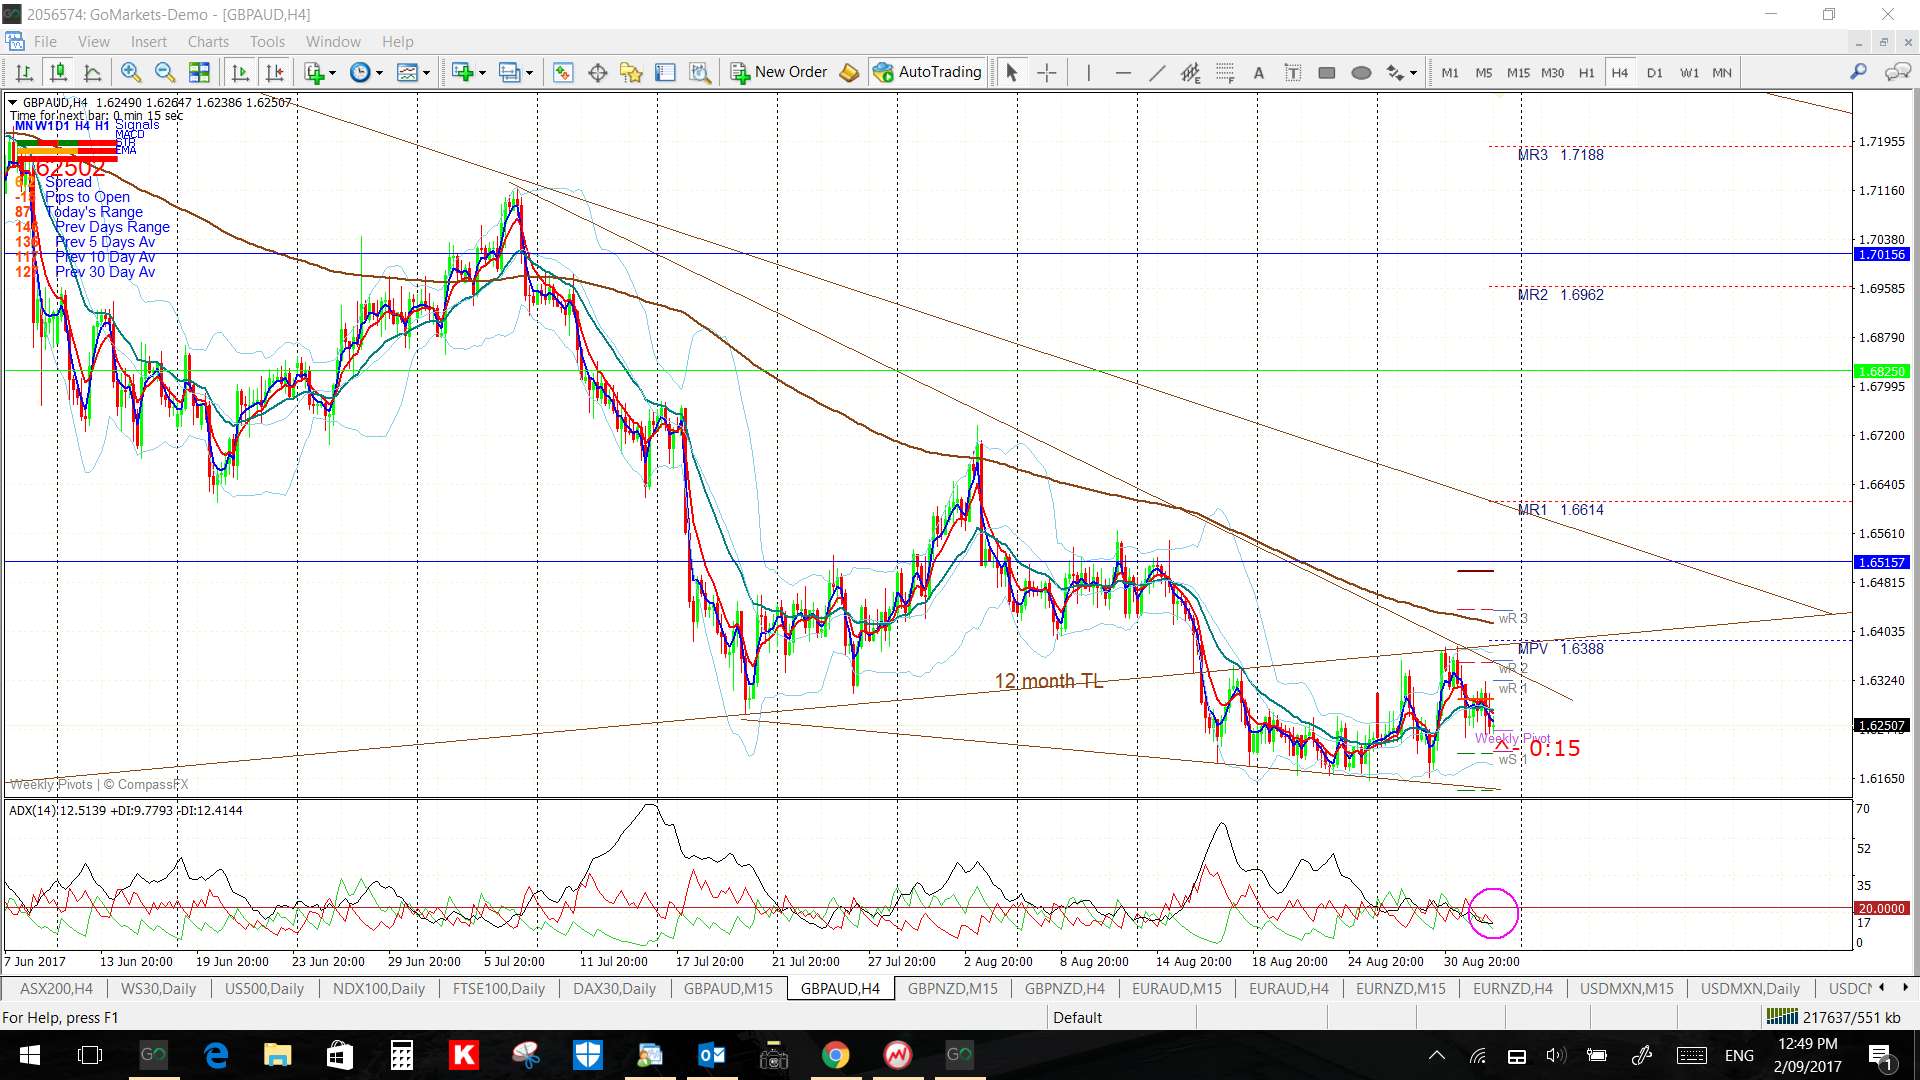
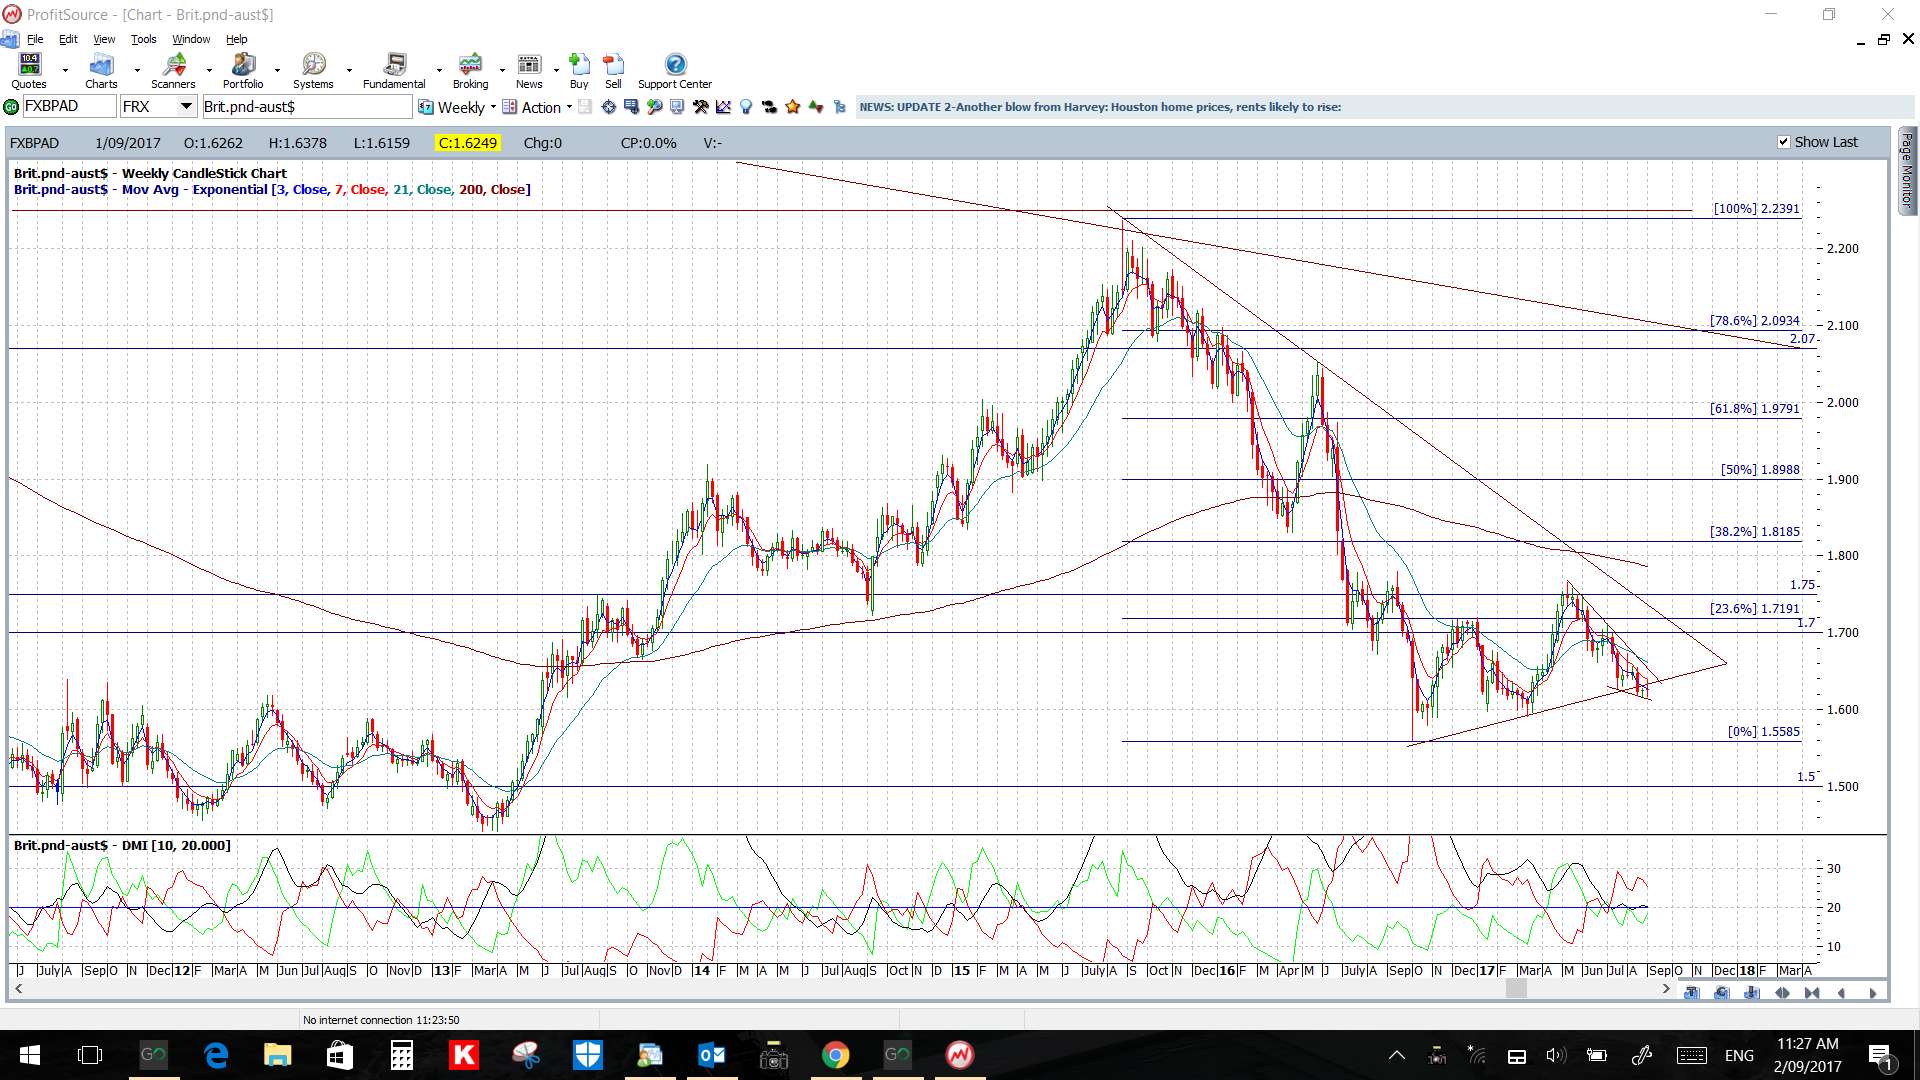
GBP/AUD: this pair is consolidating in a descending wedge near a major 12 month support trend line and printed an indecision-style ‘Spinning Top’ candle for the week. Watch the wedge trend lines for any new breakout.
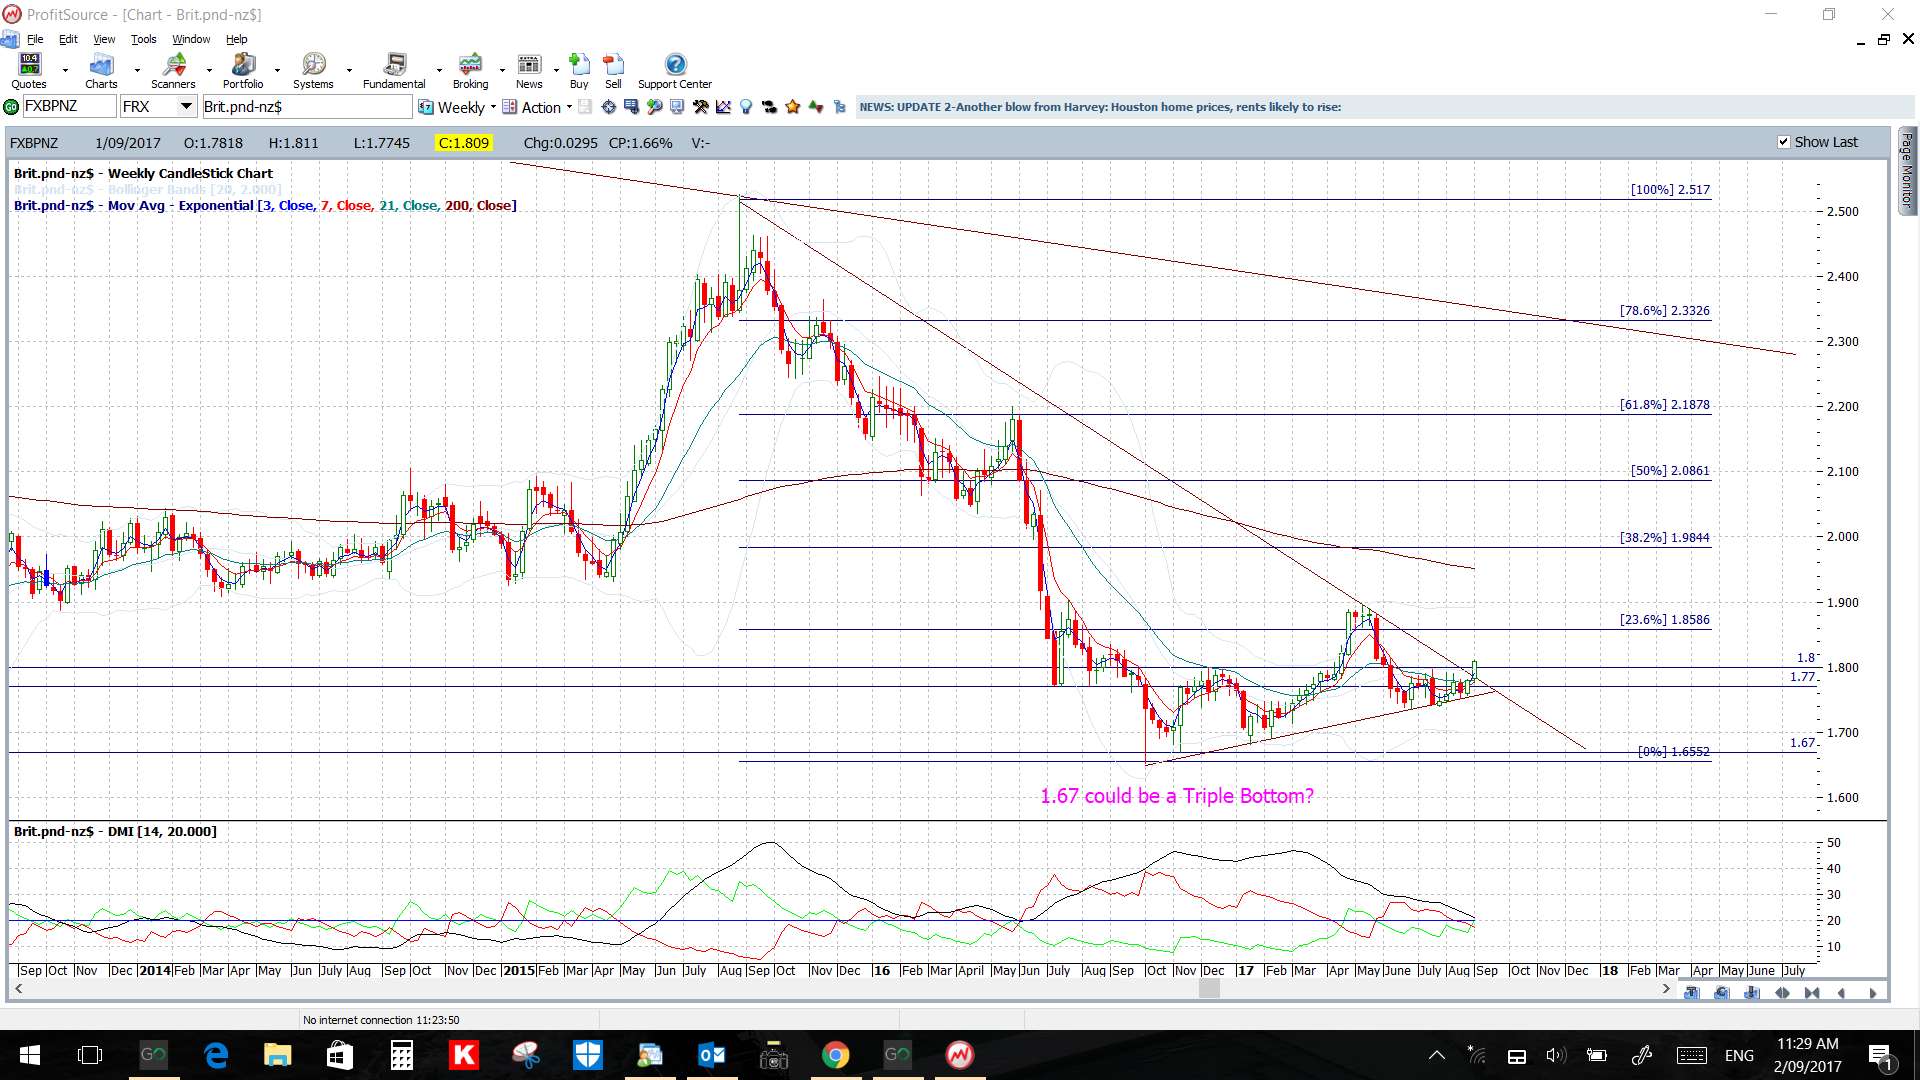
GBP/NZD: this pair looks like it is on for some mean reversion with the break back above the 21 month bear trend line. It printed a large bullish weekly candle to take out this major trend line resistance. Watch for any further test and hold of 1.80 to underpin this mean reversion move:
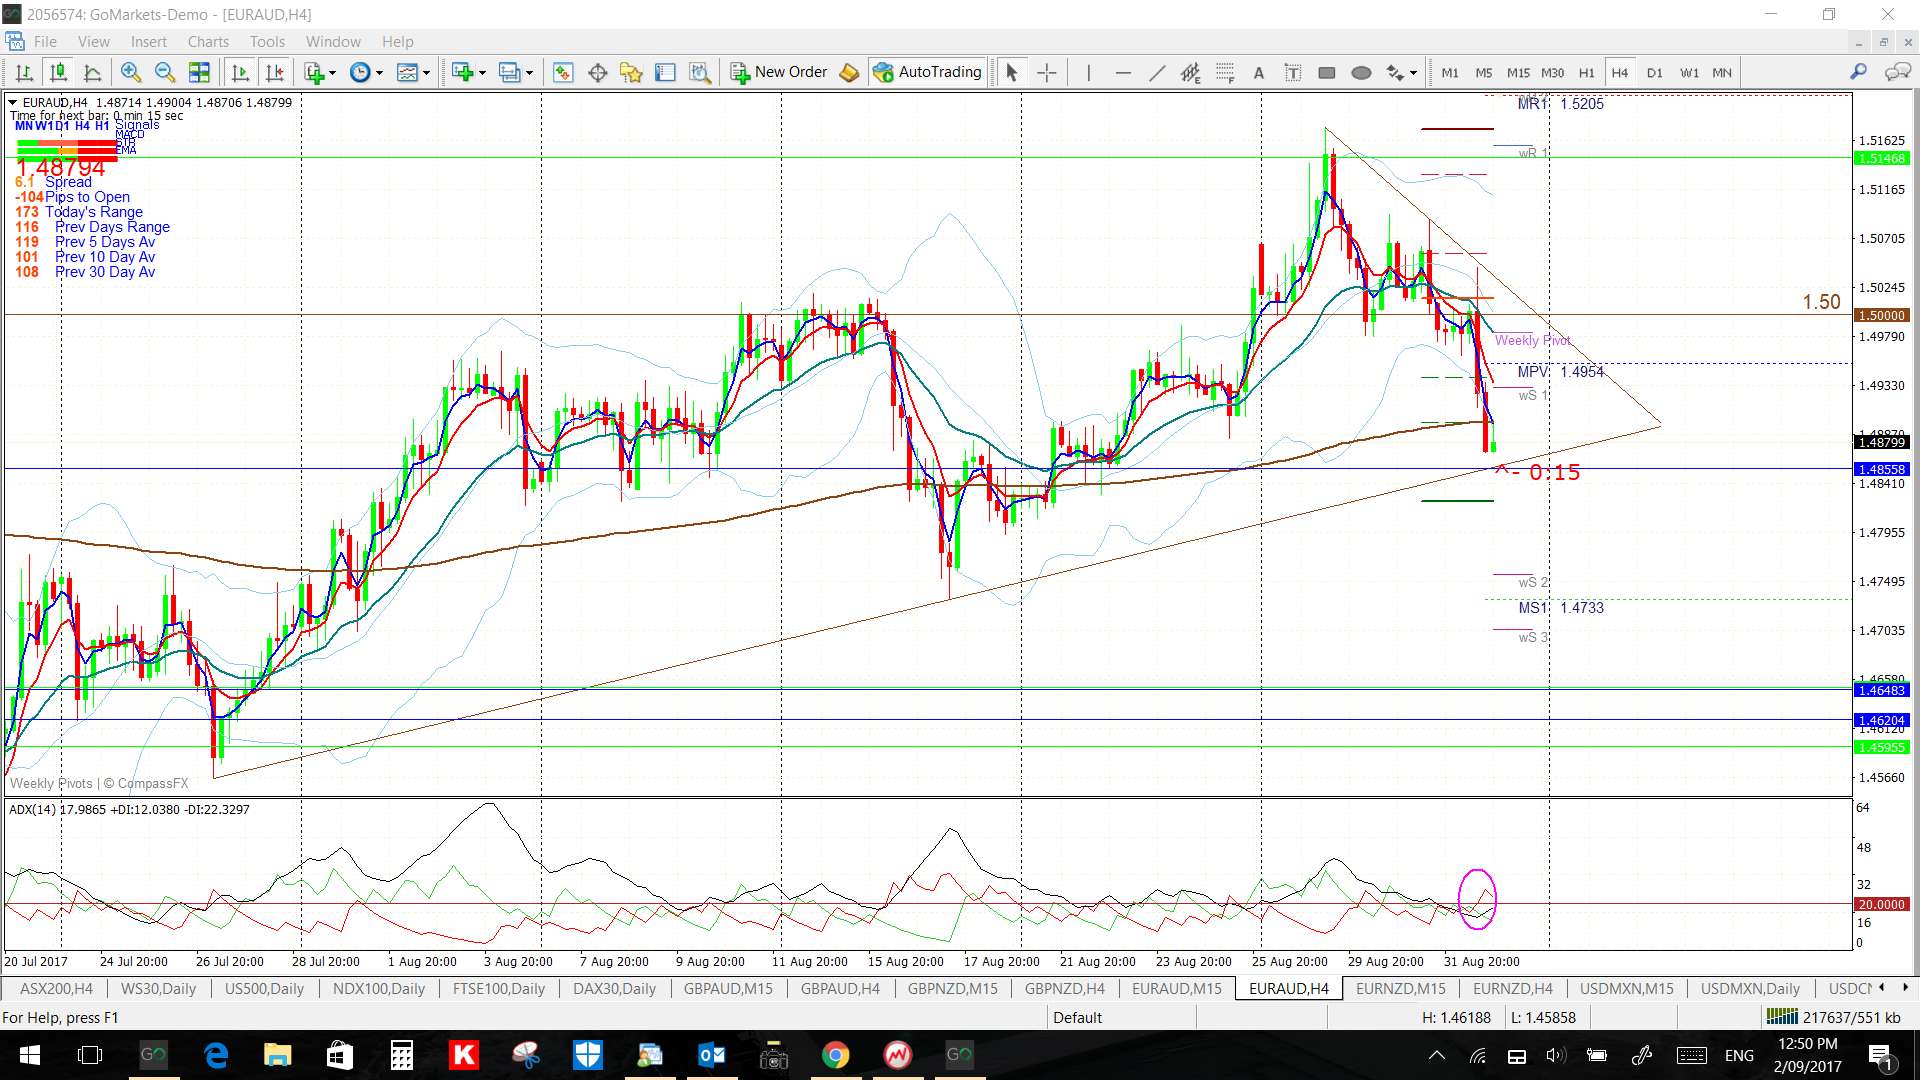
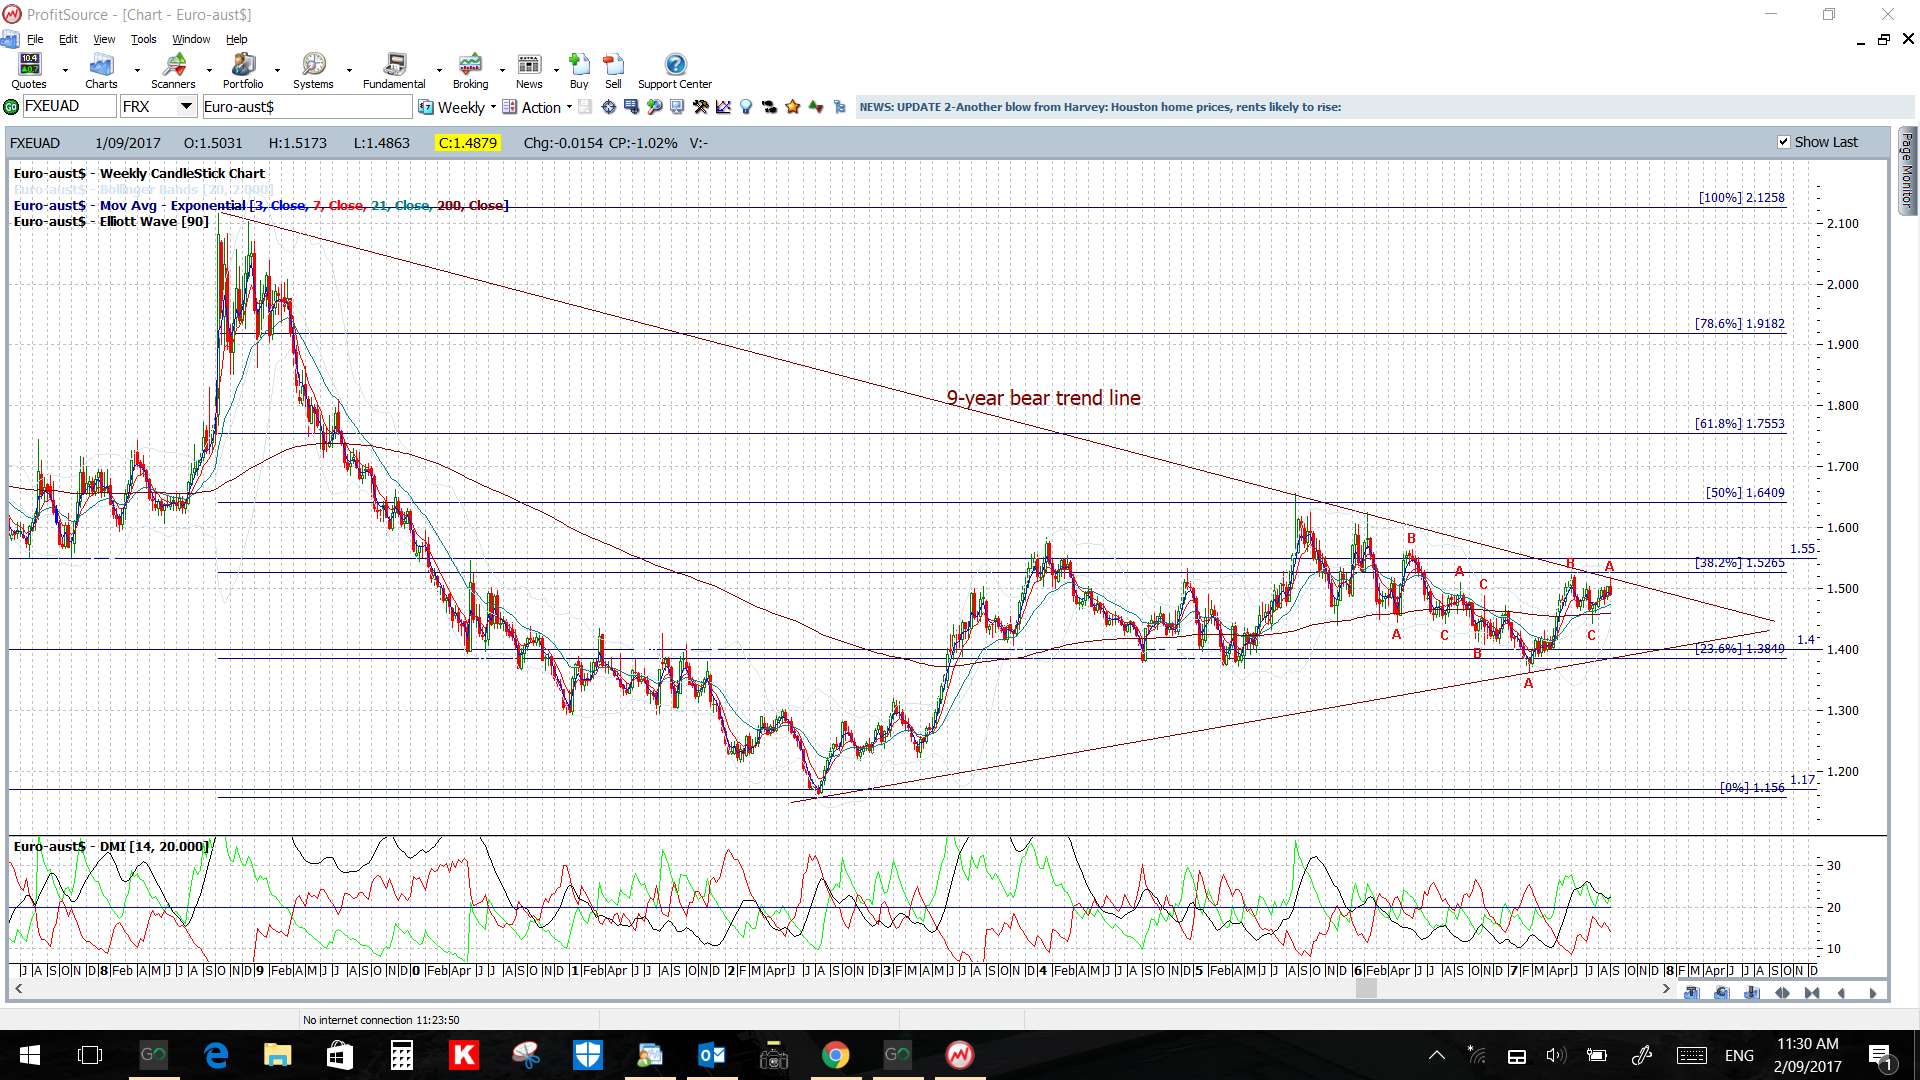
EUR/AUD: this pair remains in a weekly chart triangle but note the revised 4hr chart triangle trend lines for any new breakout clues.

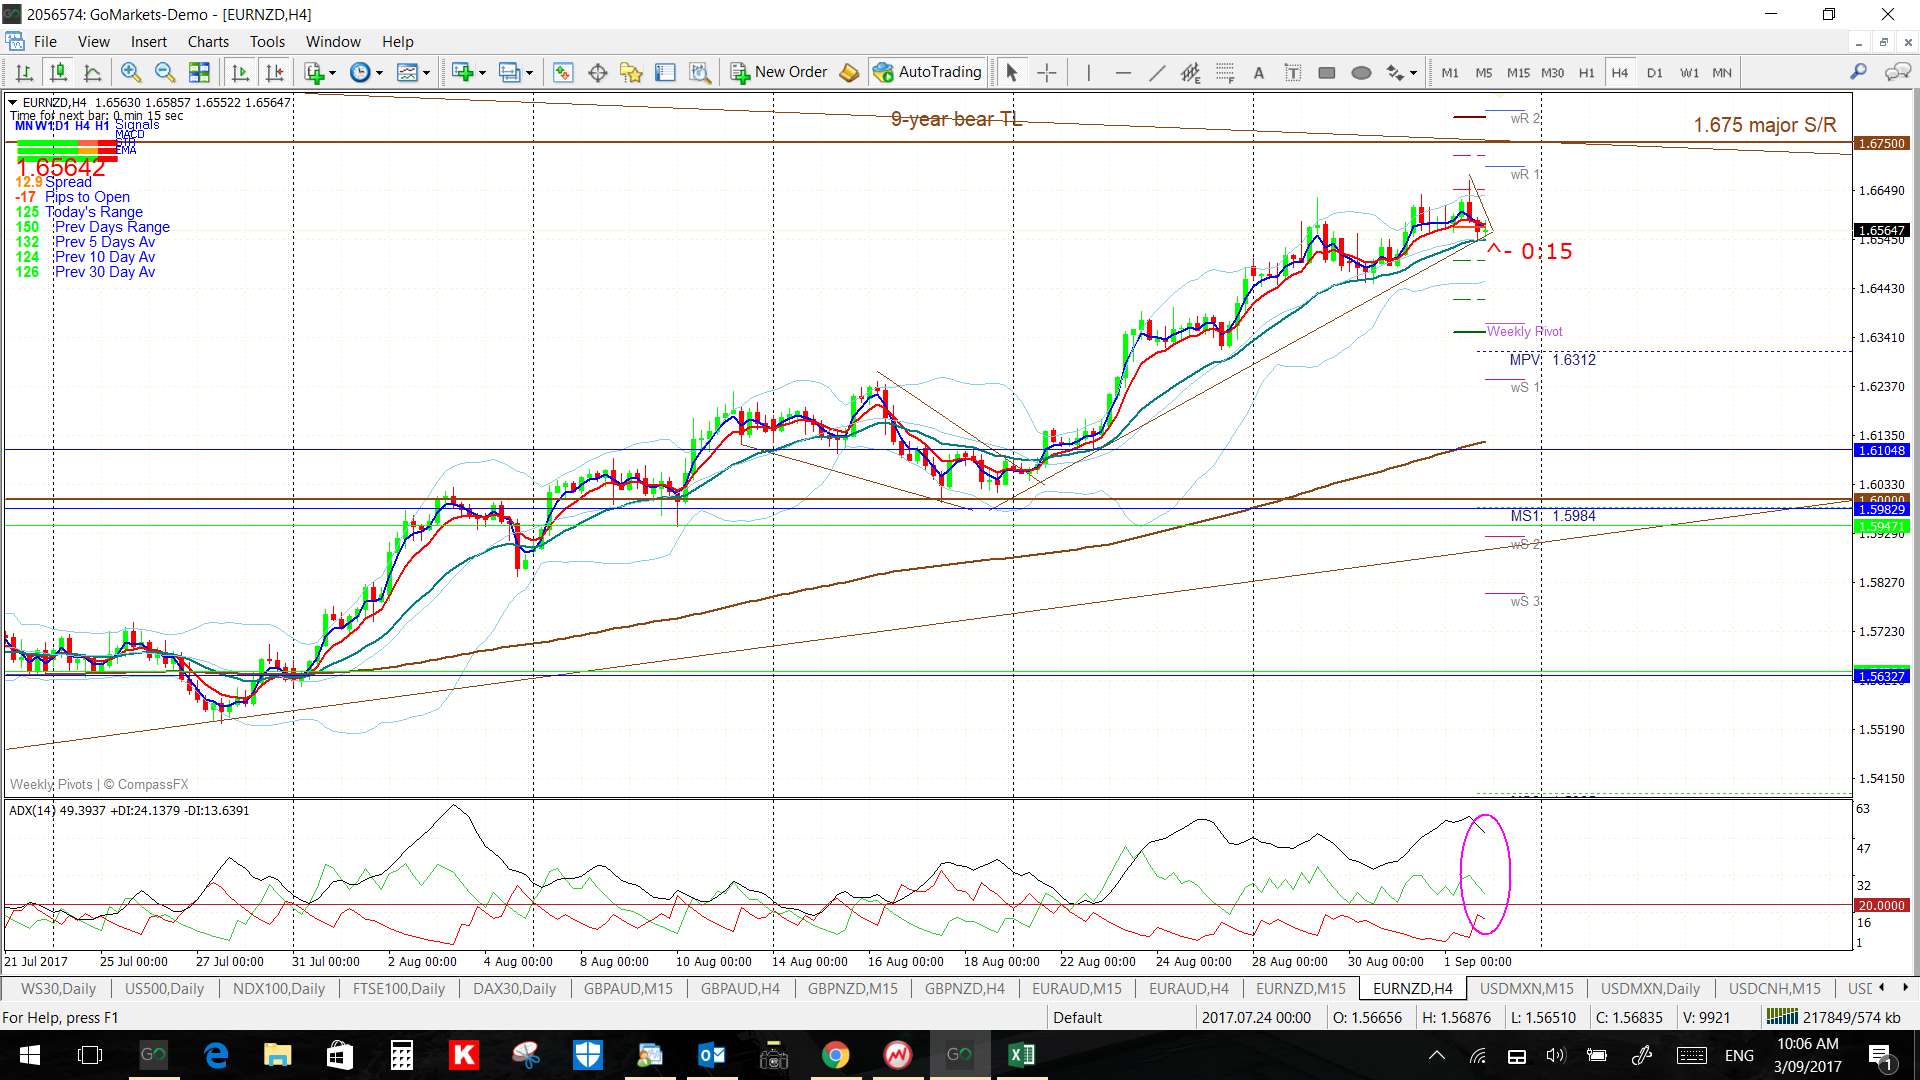
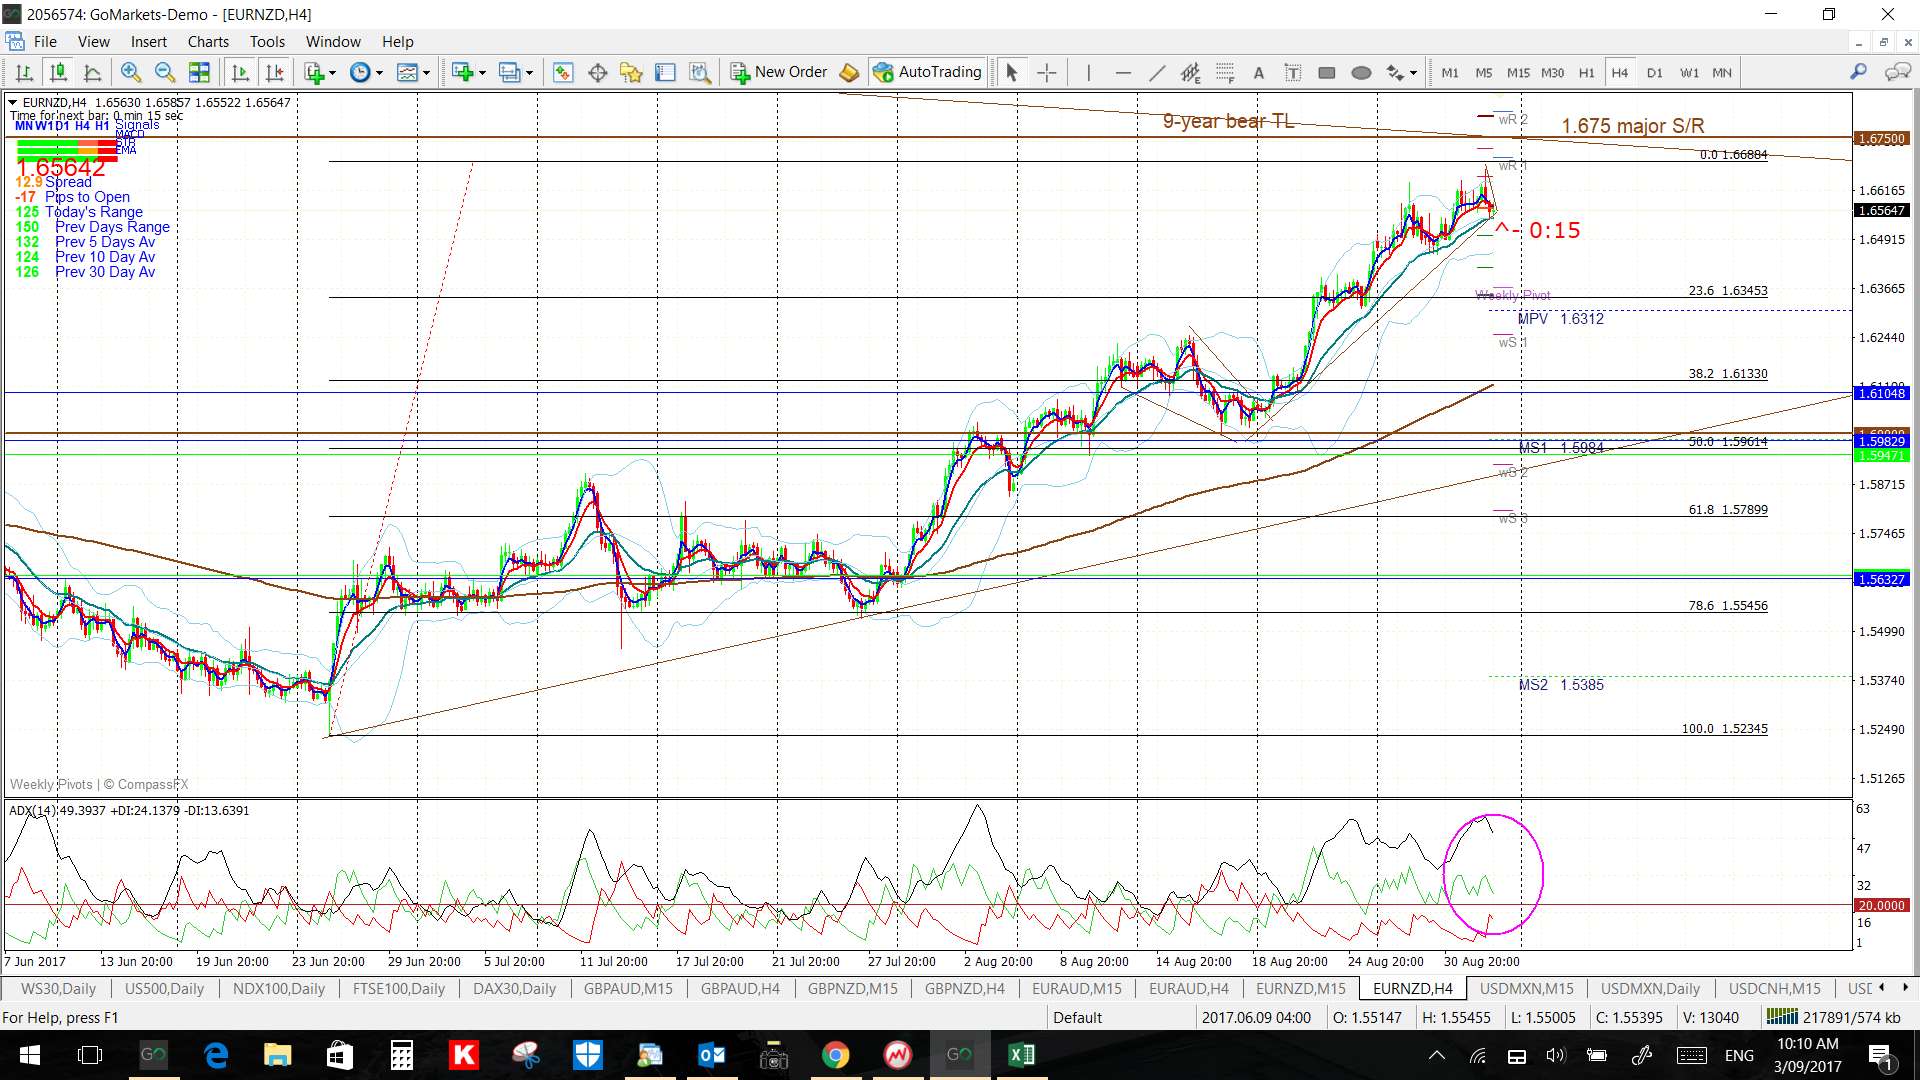
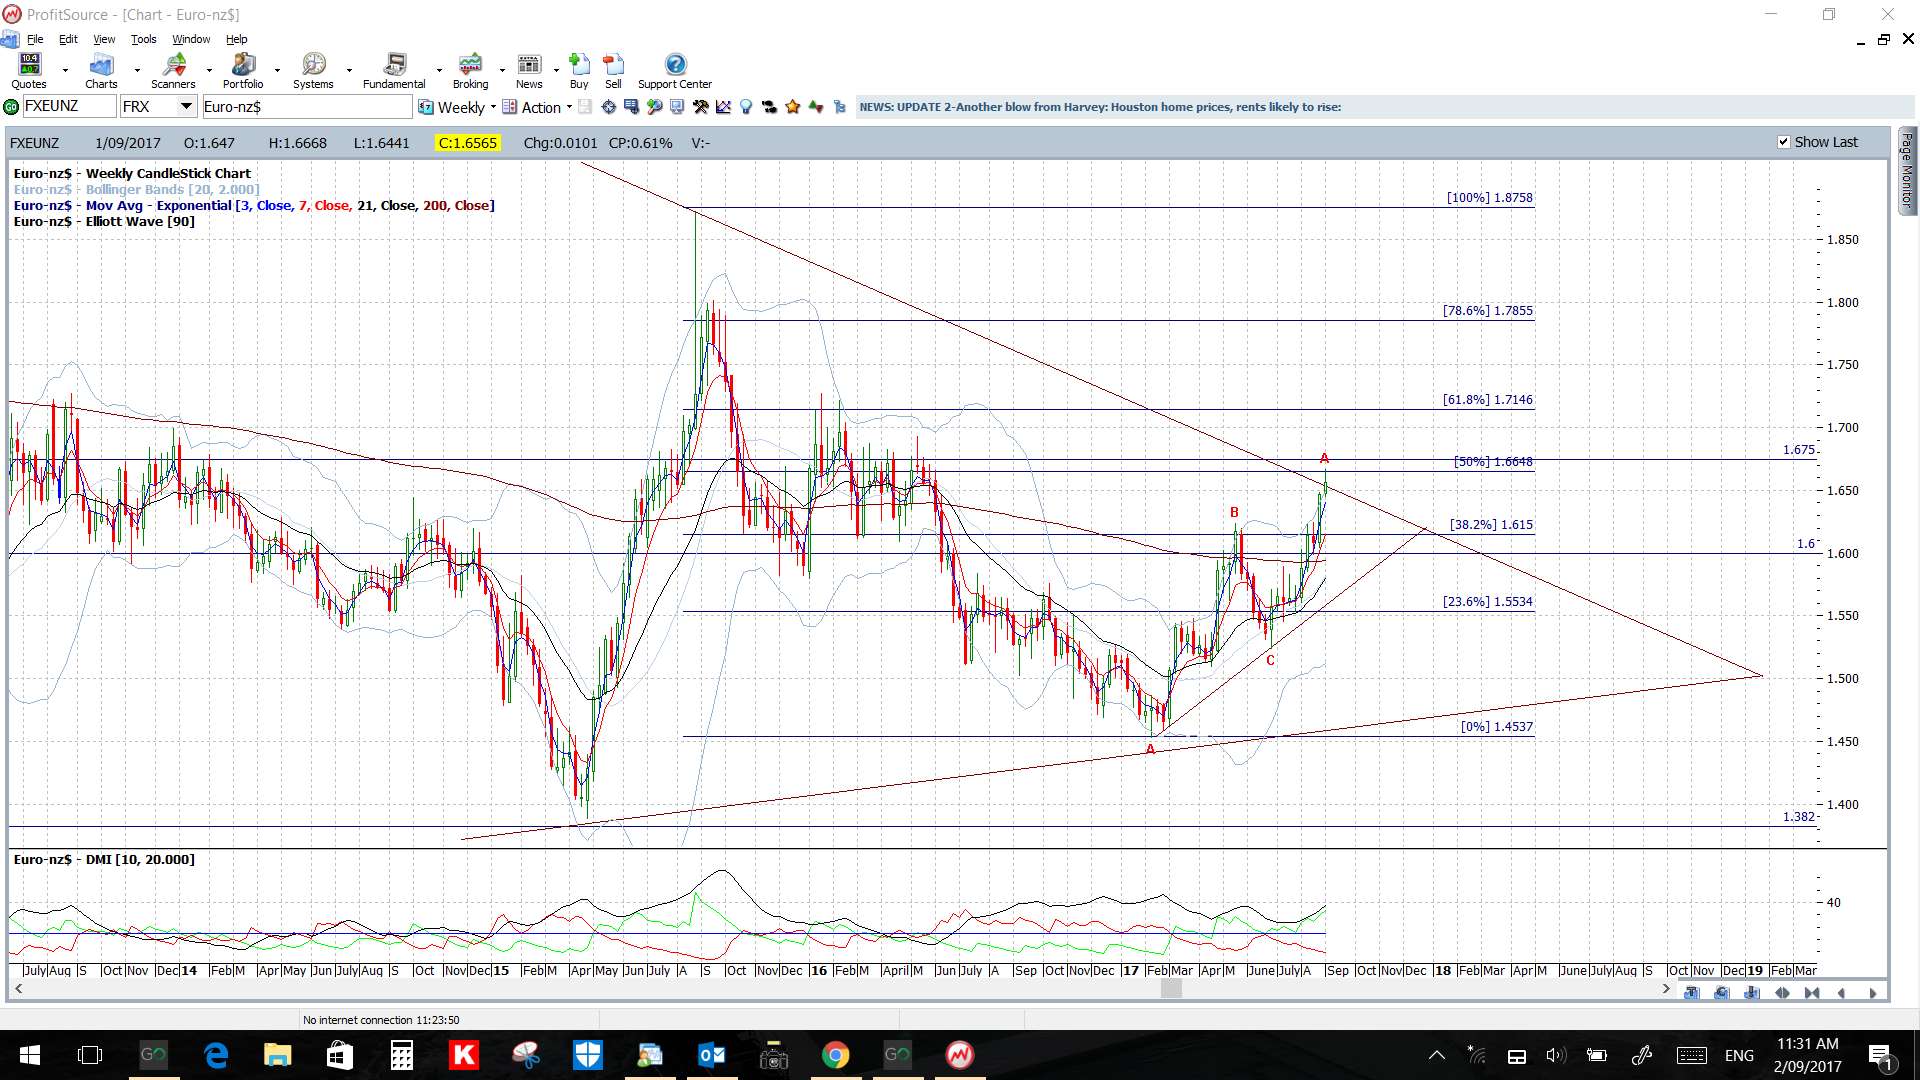
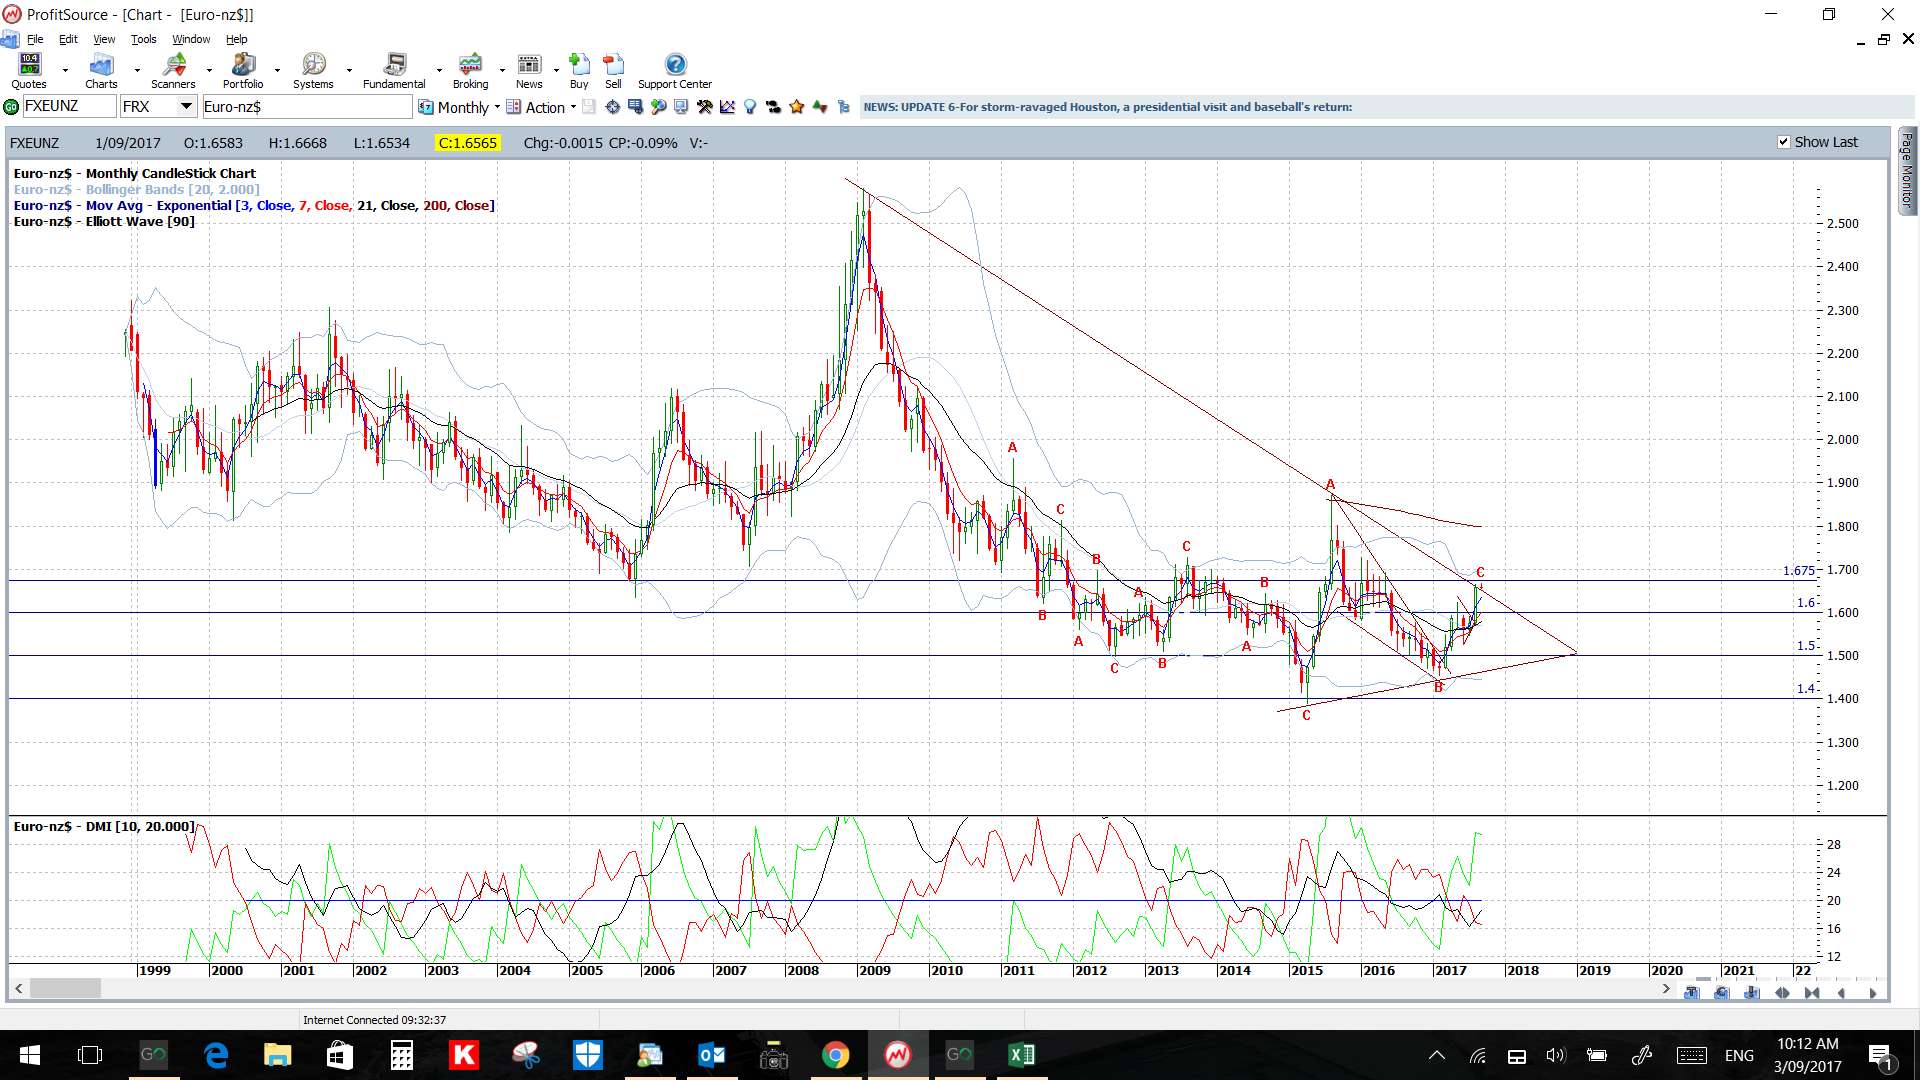
EUR/NZD: this pair is consolidating below a 9-year bear trend line and the long-term S/R level of 1.675 and, not surprisingly, printed an indecision-style ‘Spinning Top’ candle to close out the week.
Watch the 4hr chart’s triangle trend lines, the 9-year bear trend line and major 1.675 S/R level for any new make or break. Any pullback would have me looking to the 4hr chart’s 50% fib as this is near 1.60 S/R.
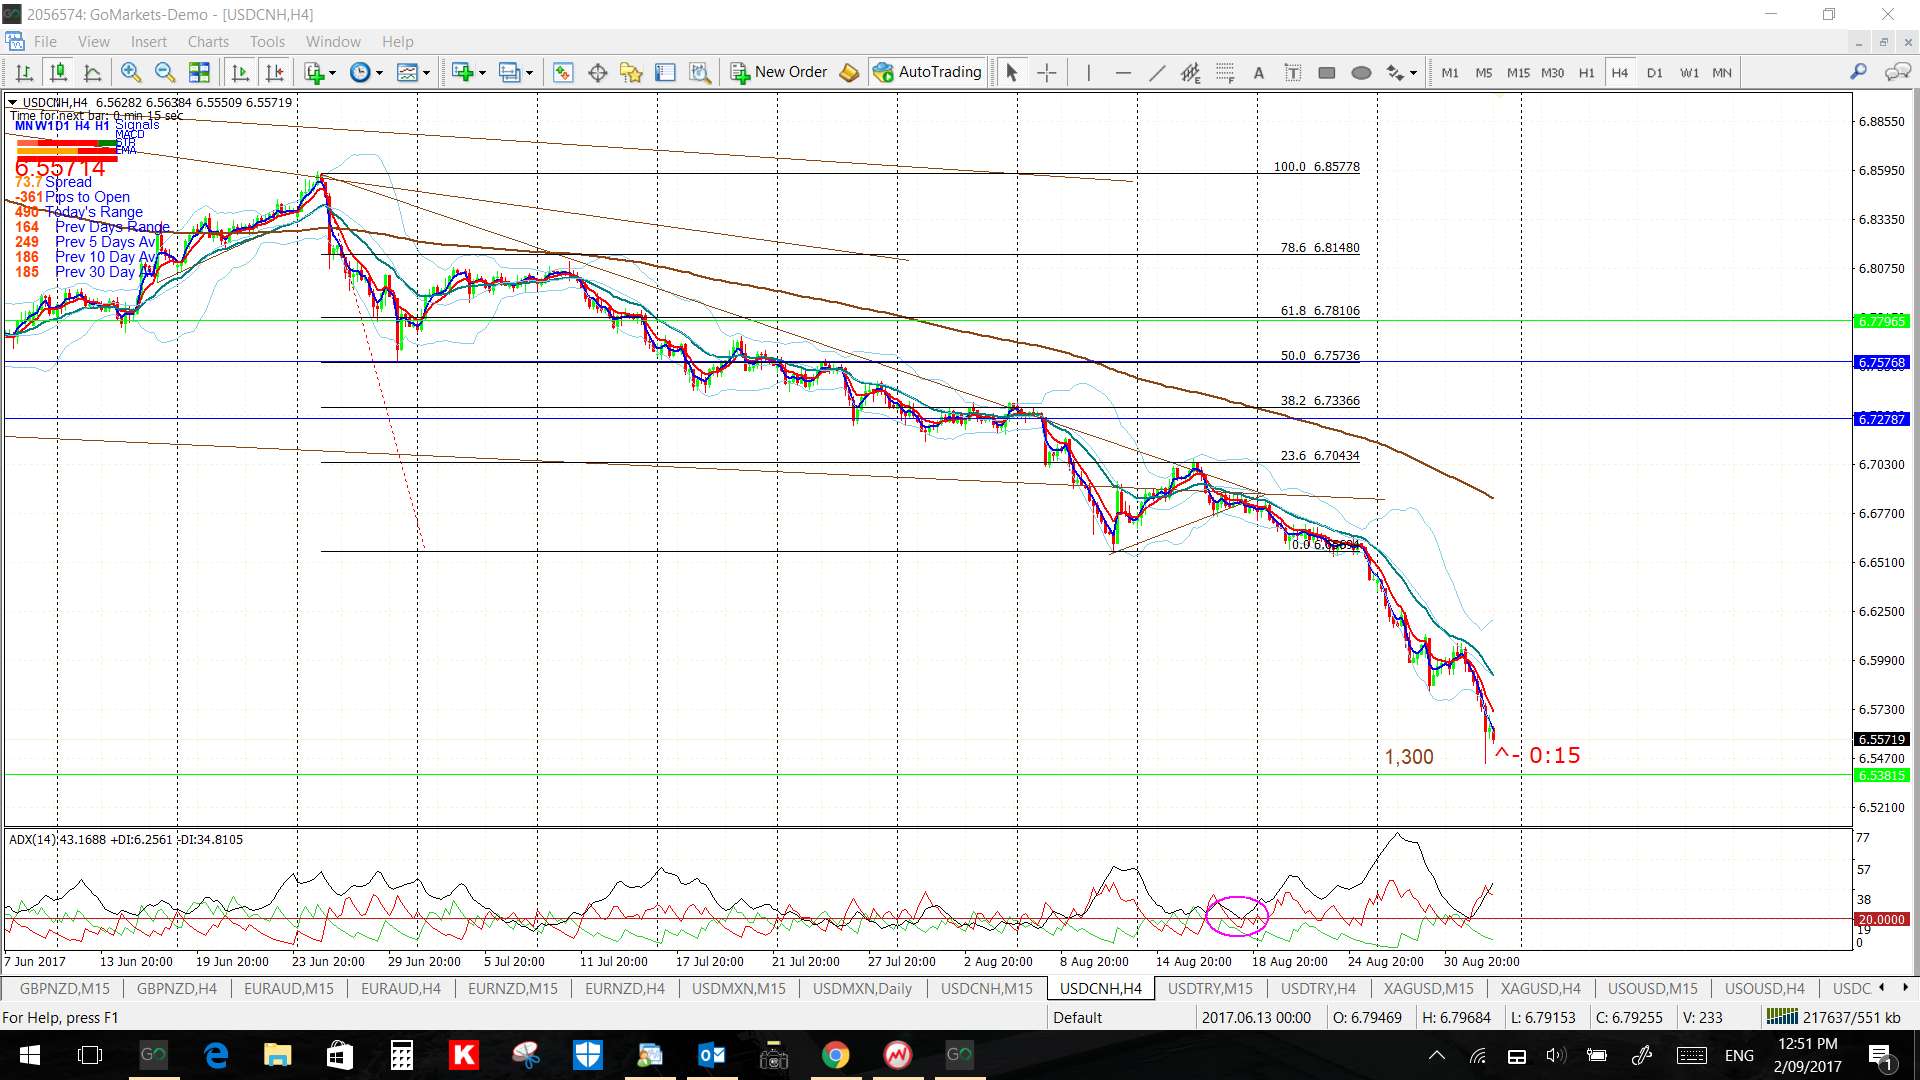
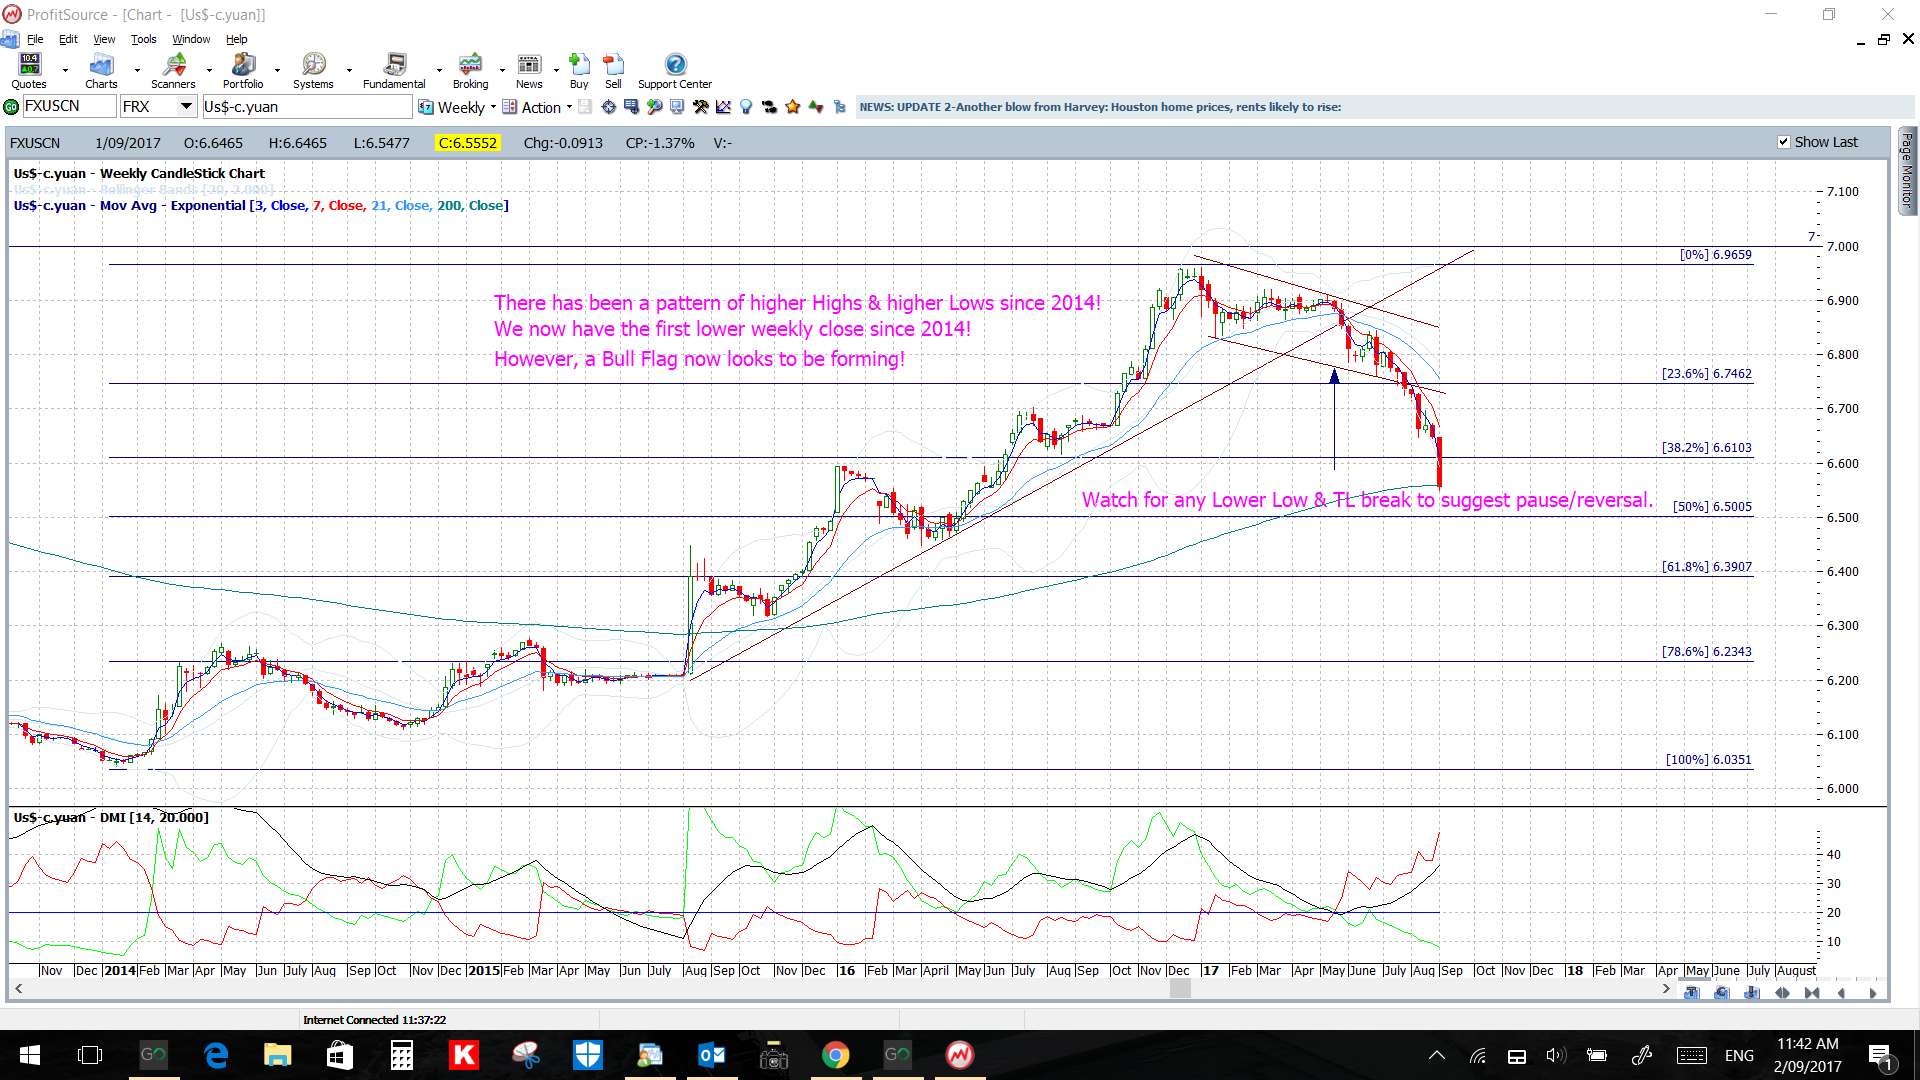
USD/CNH: this is in ‘falling knife’ mode:
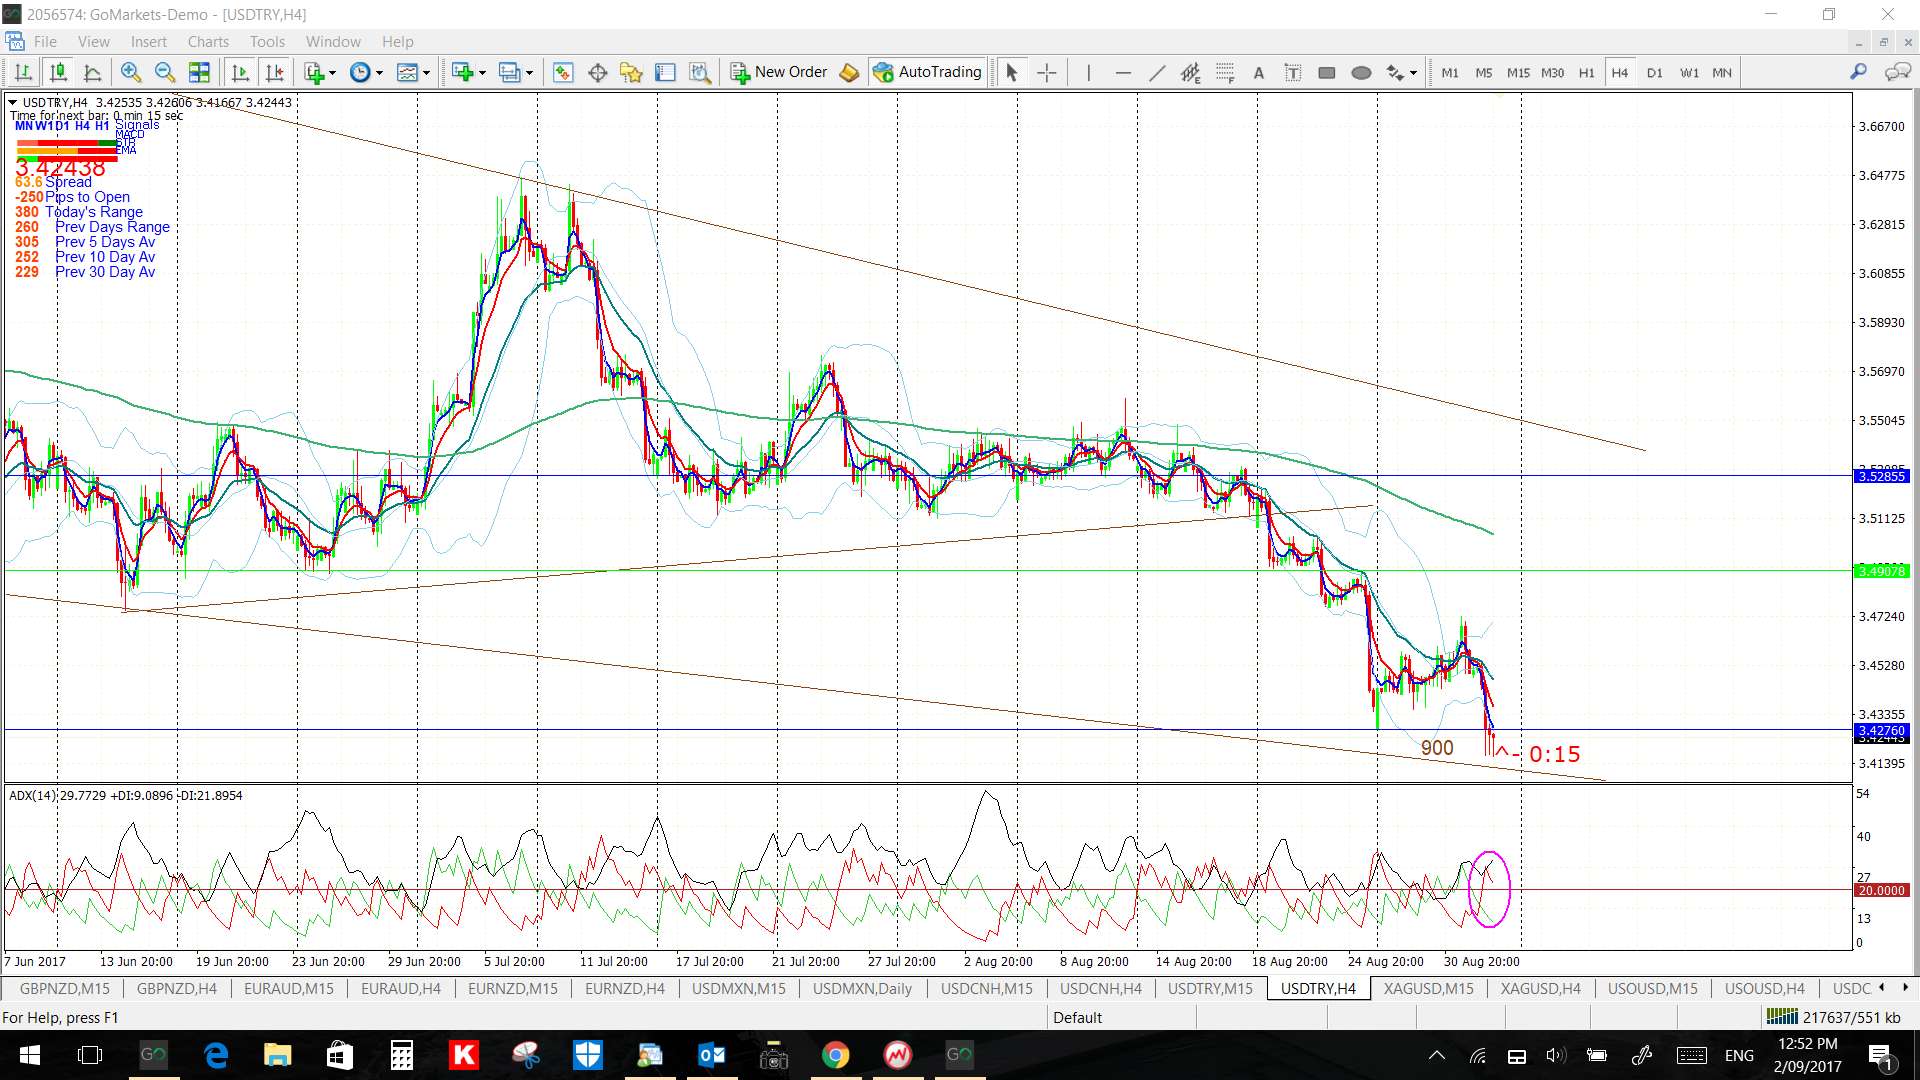
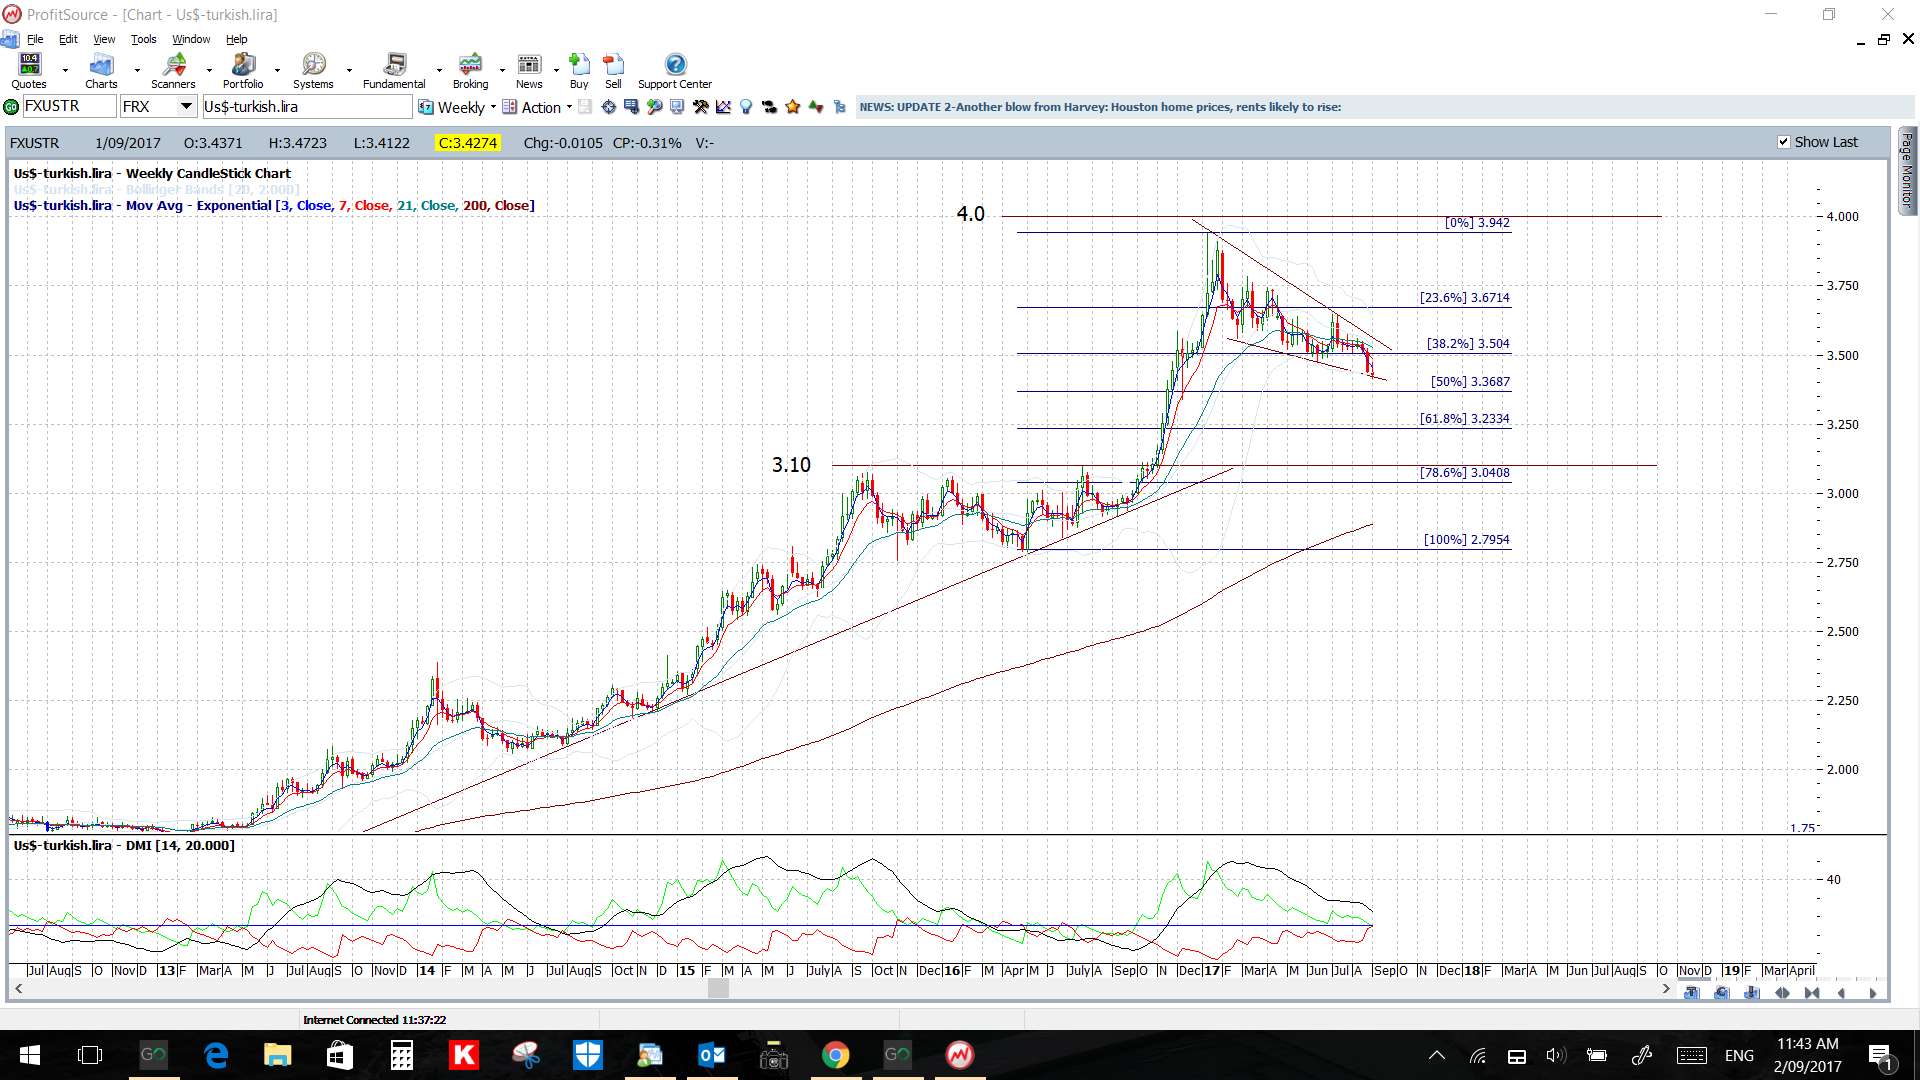
USD/TRY: This pair remains in the weekly chart’s wedge but is trading right at the bottom of this pattern. Watch the bottom wedge trend line for any new make or break:
Commodities:
Gold: Gold remains above the 6-year bear trend line and the monthly chart now presents as a Bull Flag. The metal printed a large bullish candle. Watch for any hold above $1,300 to target $1,400:
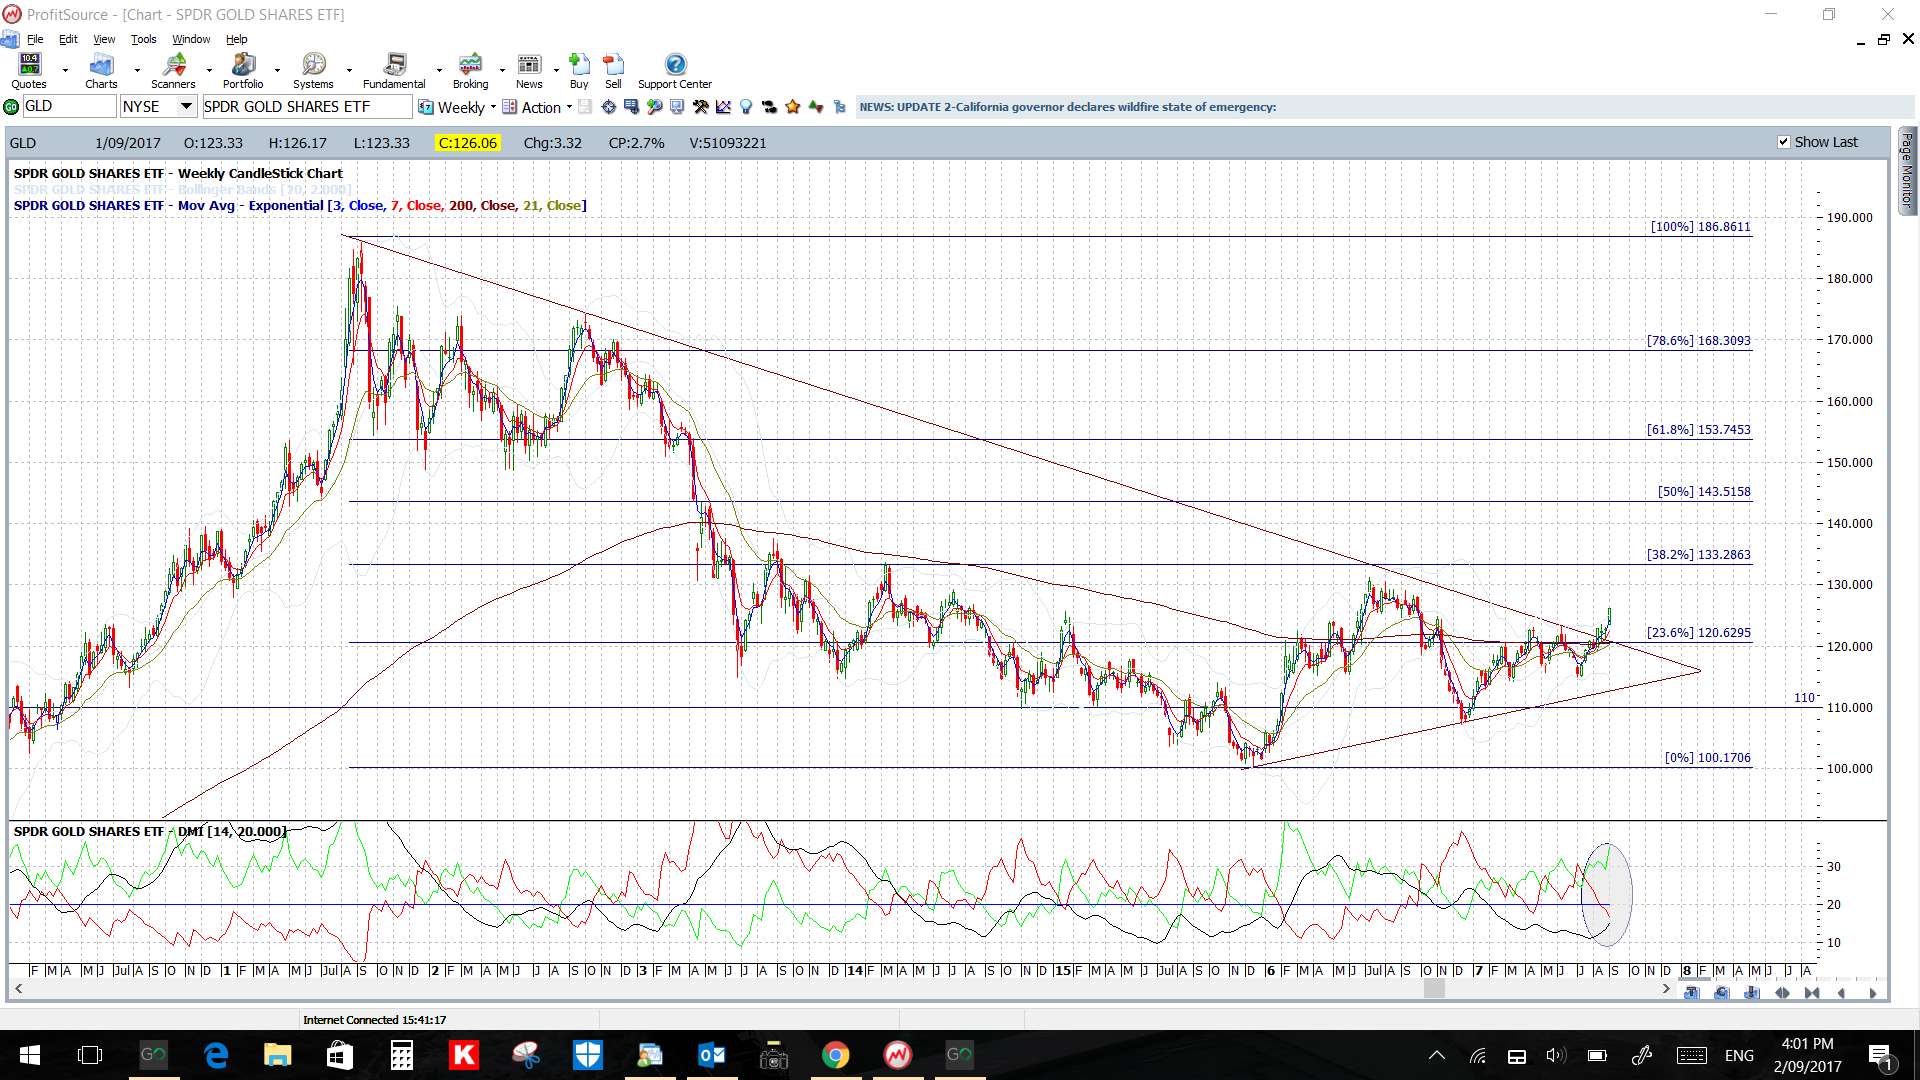
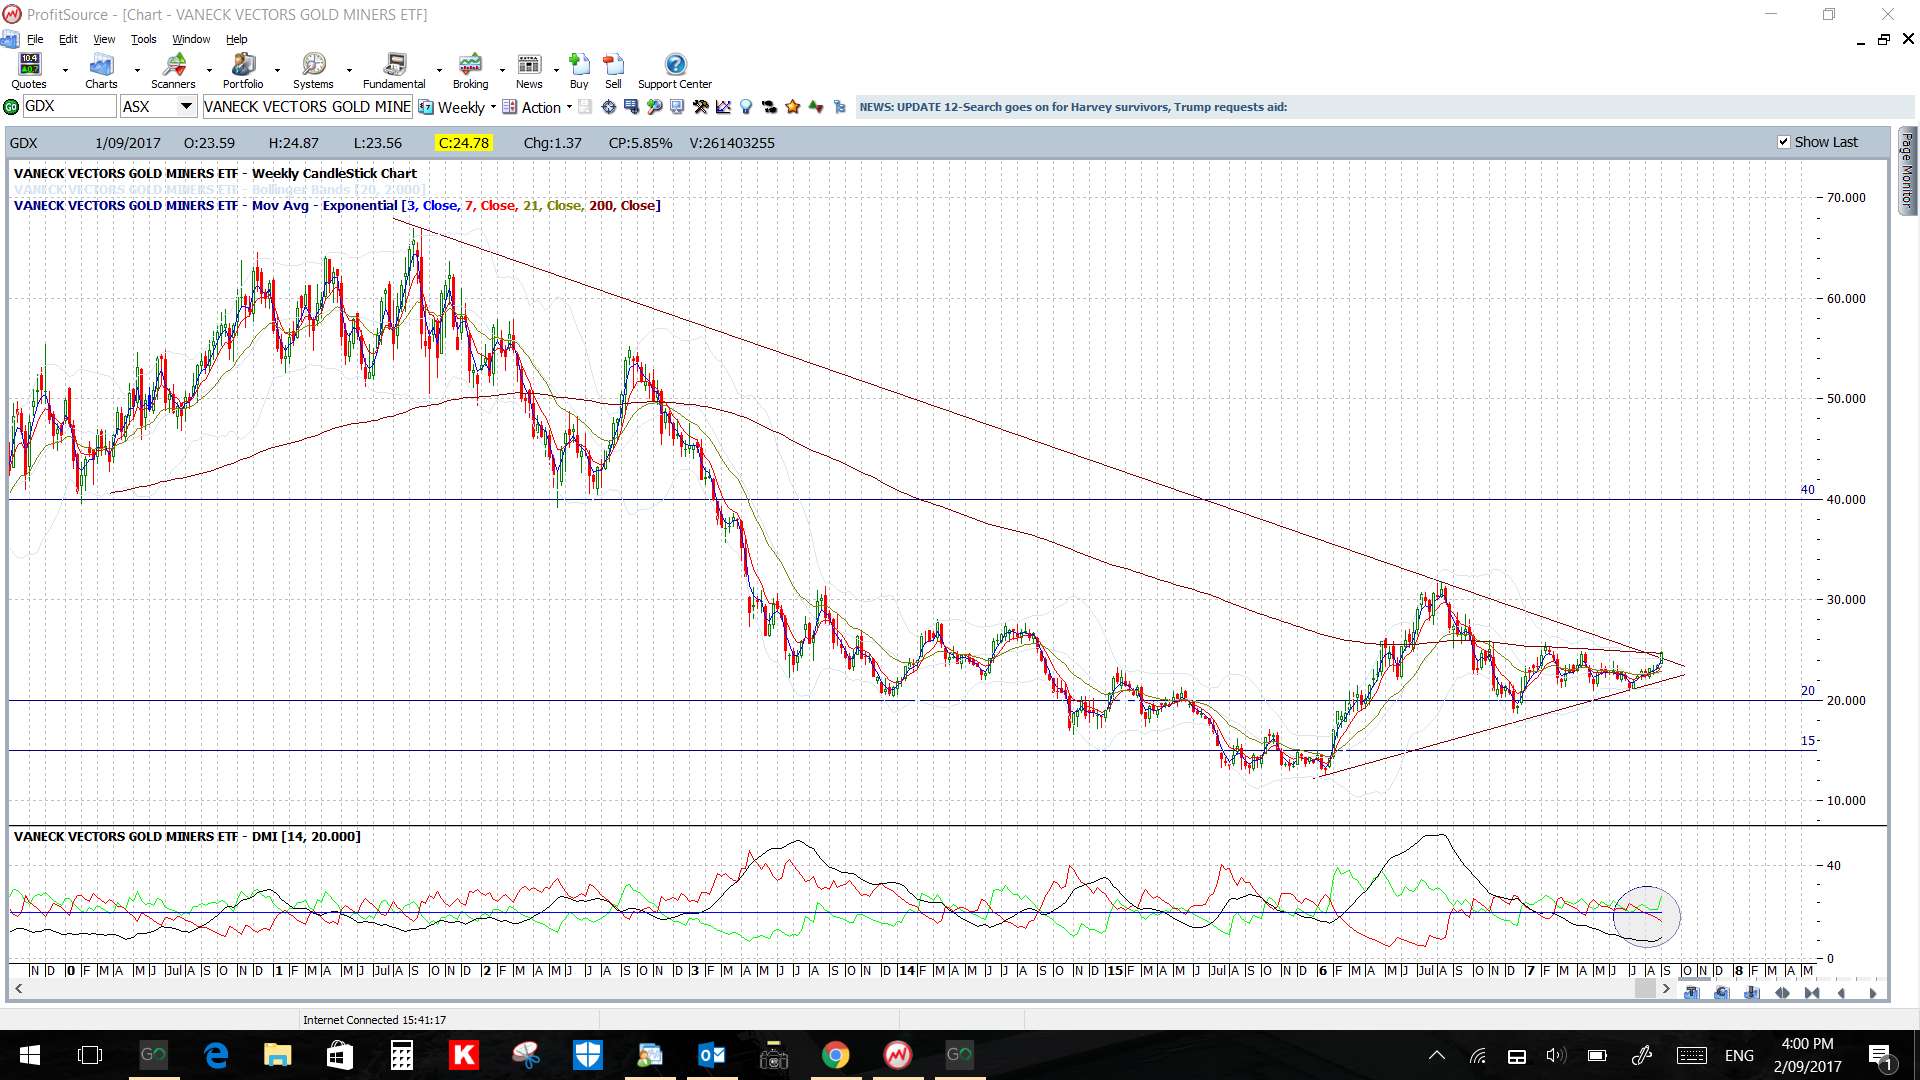
Note the triangle breakouts on the Gold bullion and miners ETFs:
GLD weekly:
GDX weekly:
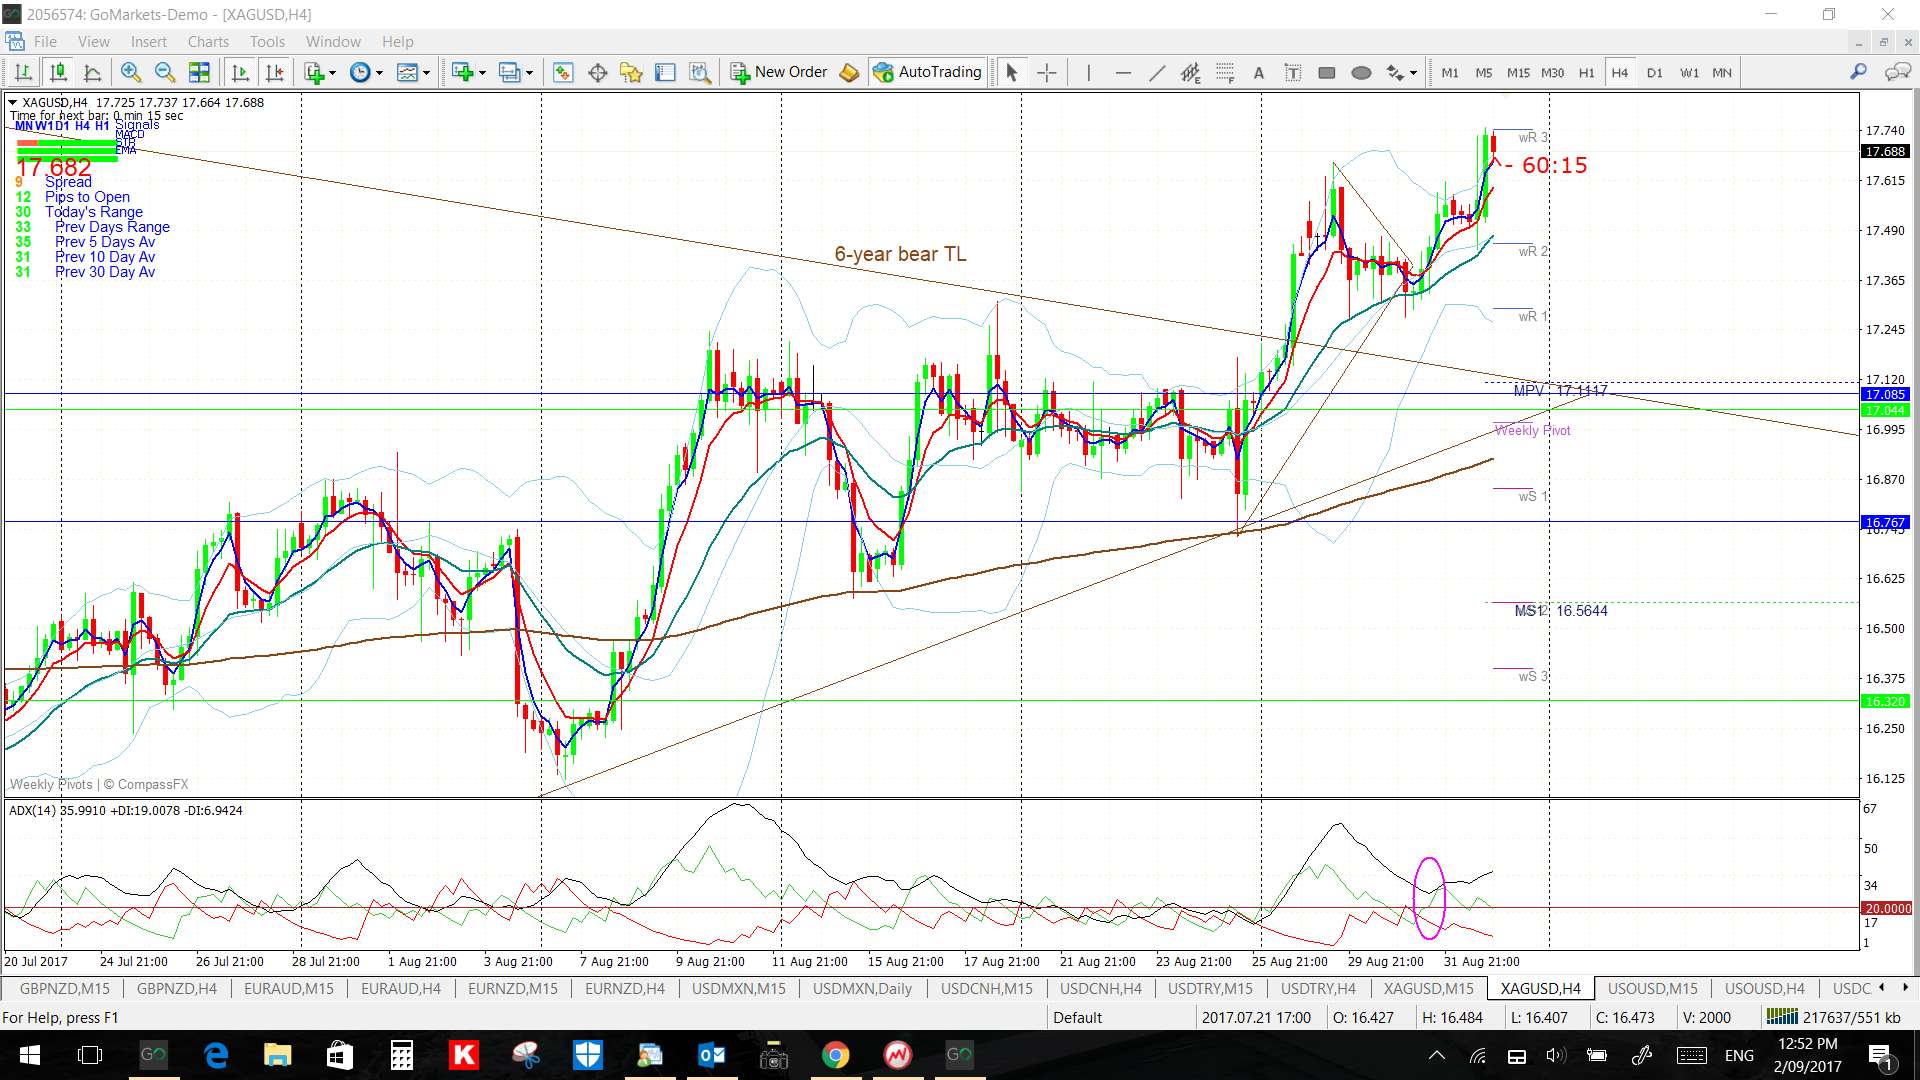
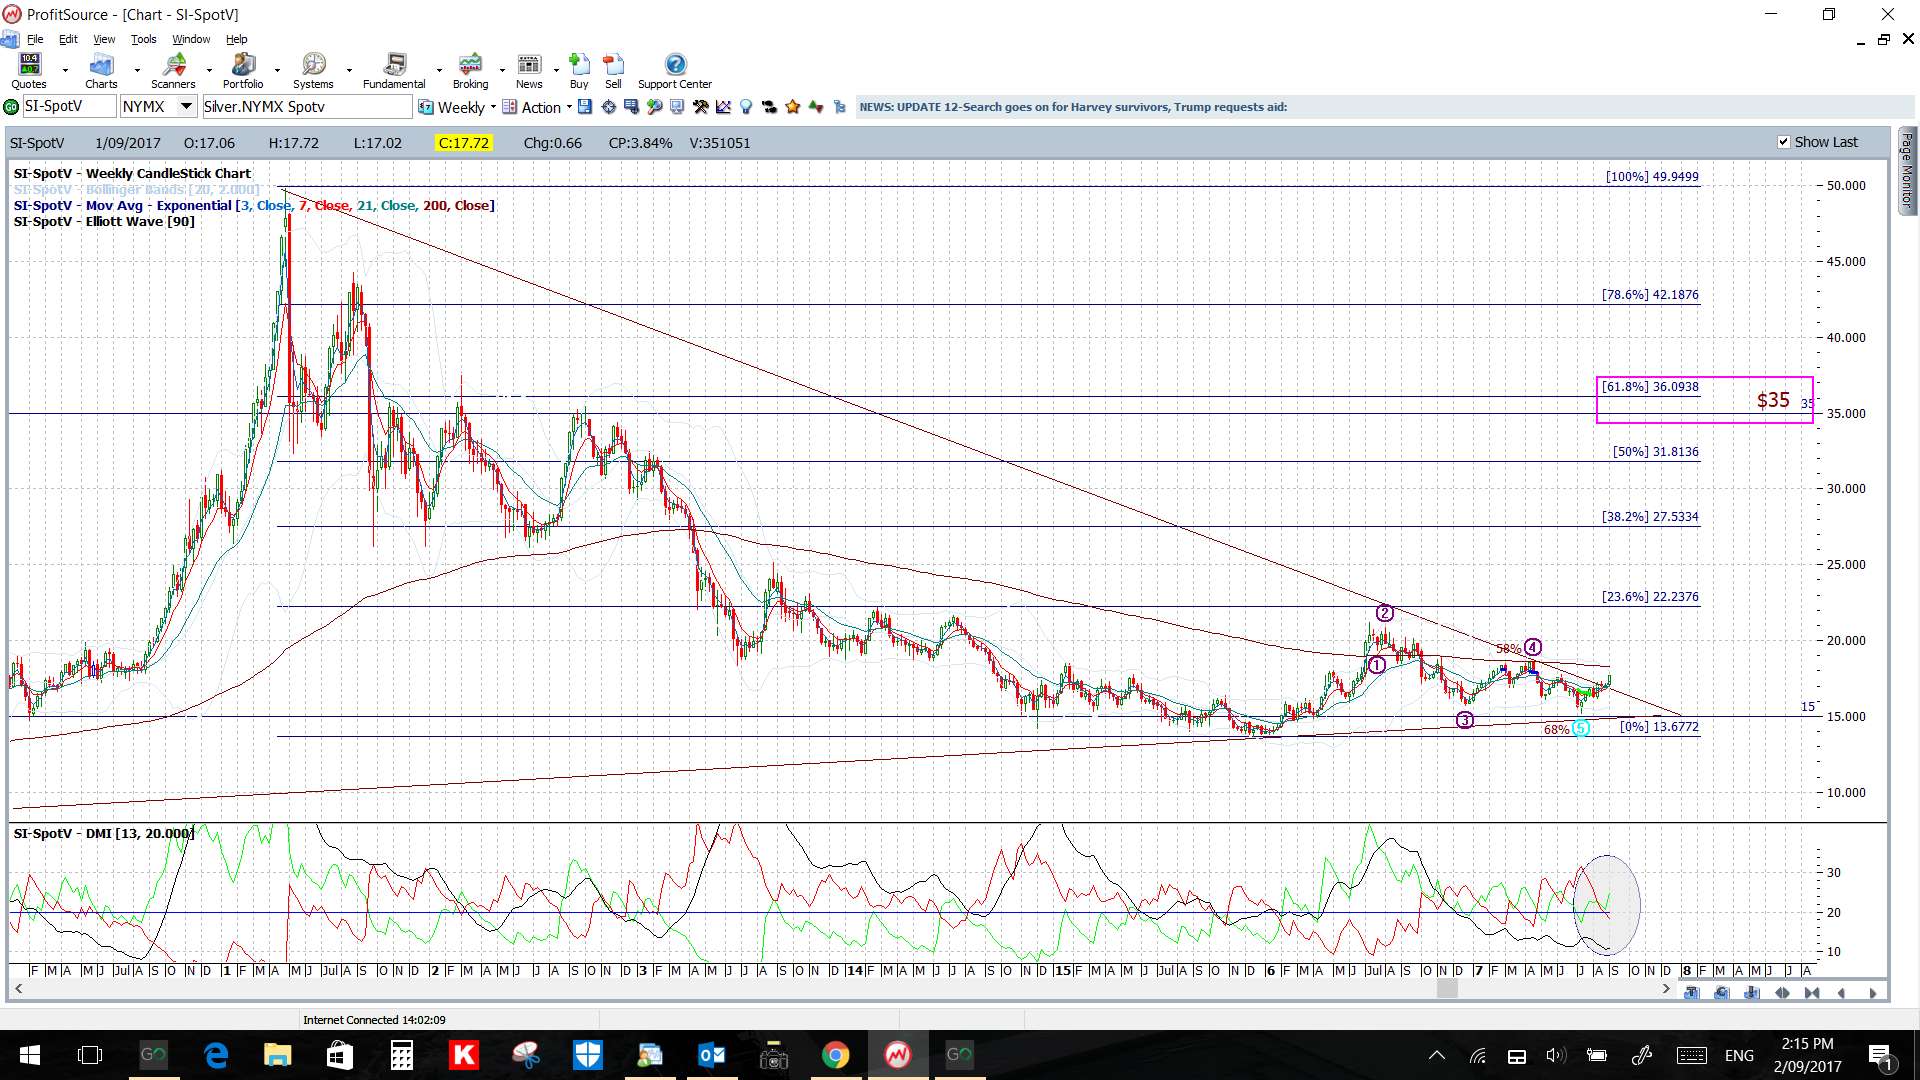
Silver: Silver has now also broken above its 6-year bear trend line so watch for any continuation higher as part of some mean reversion:

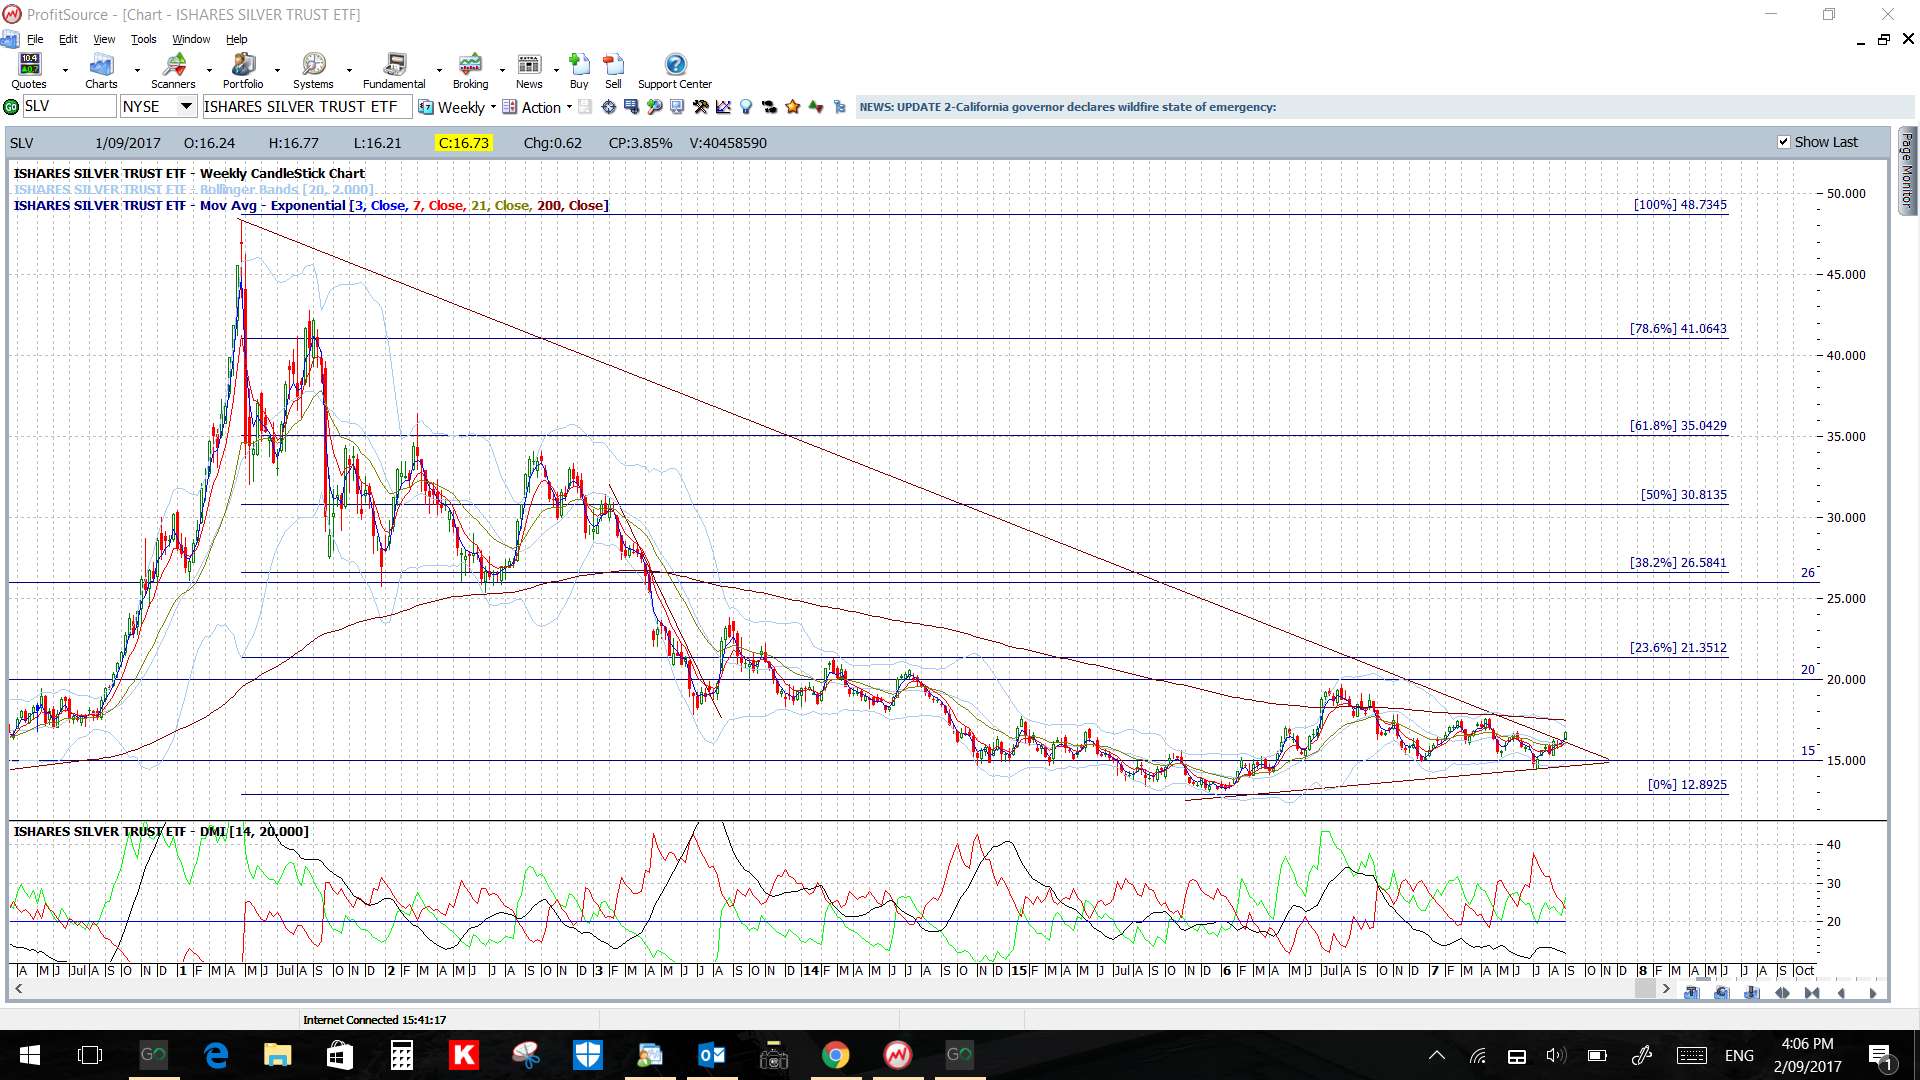
Note the triangle breakout with the Silver bullion ETF. There isn’t much momentum here just yet though:
SLV weekly:
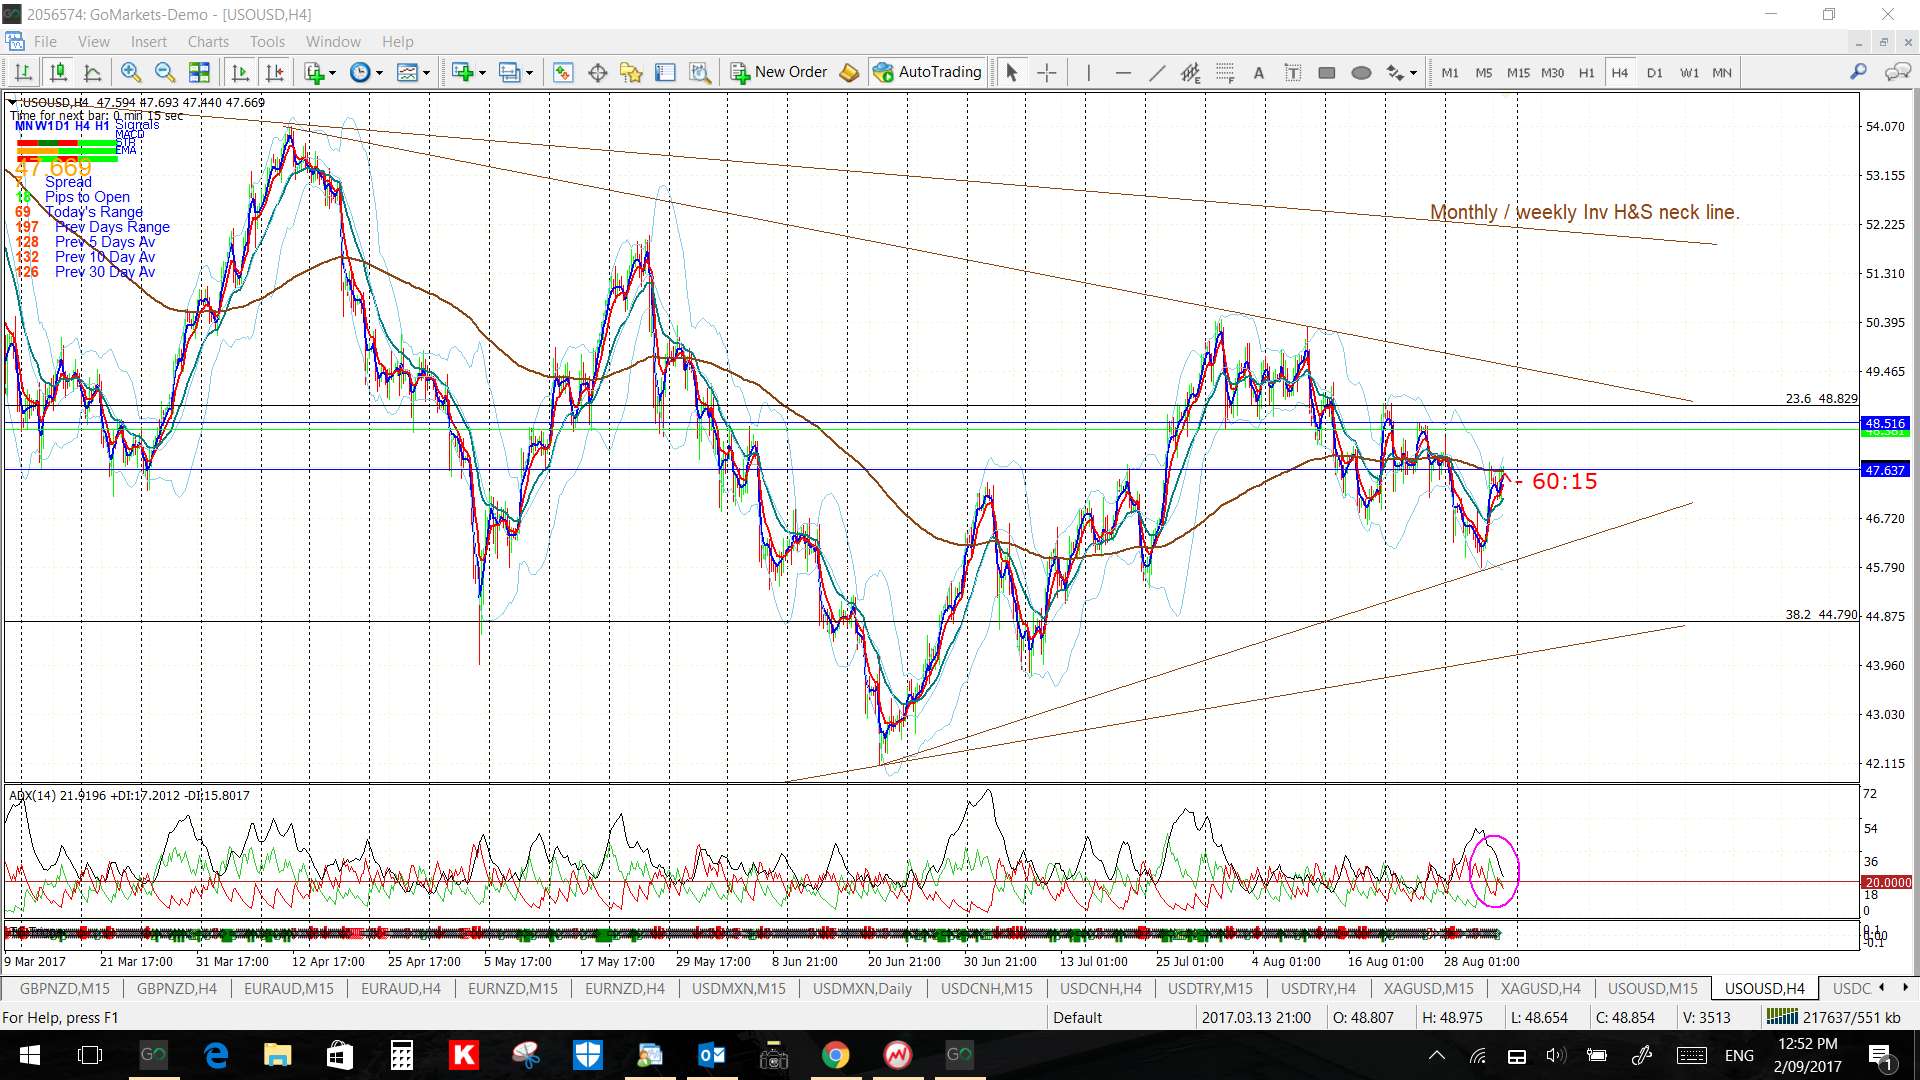
Oil: watch the revised 4hr chart triangle trend lines for any new breakout: