This week: I’m watching to see how the US$ moves from here as any further weakness could trigger FX Index alignment for some classic-style ‘risk on‘. This would tie in with some healthy risk appetite that I am seeing across on some stocks and I posted earlier about this here. Forex trend line breakout trades were very profitable last week and more Flag patterns are setting up for the week ahead. Remember that the trading week could get off to a slow start due to the USA holiday Monday but markets may heat up after that with the end of week US Presidential Inauguration.
Last week: Last week proved to be an exceptional one for trades derived simply from taking momentum-based trend line breakouts. I posted a few charts last weekend plus early last week and six of these delivered up to 1,200 pips. There were two failed breakout trades on the EUR/USD and AUD/JPY but the gain with winners more than offset the losers.
The following six profitable trades did not require any algorithm but, rather, to just watch as advised for any trend line breakout that evolved with momentum. The AUD/USD and GBP/JPY charts were initially posted here, the Kiwi chart here, the USD/JPY chart was posted here, the Gold chart was initially posted here and the USD/CAD chart here. Before and after screen shots of these six profitable breakout trades are shown below:
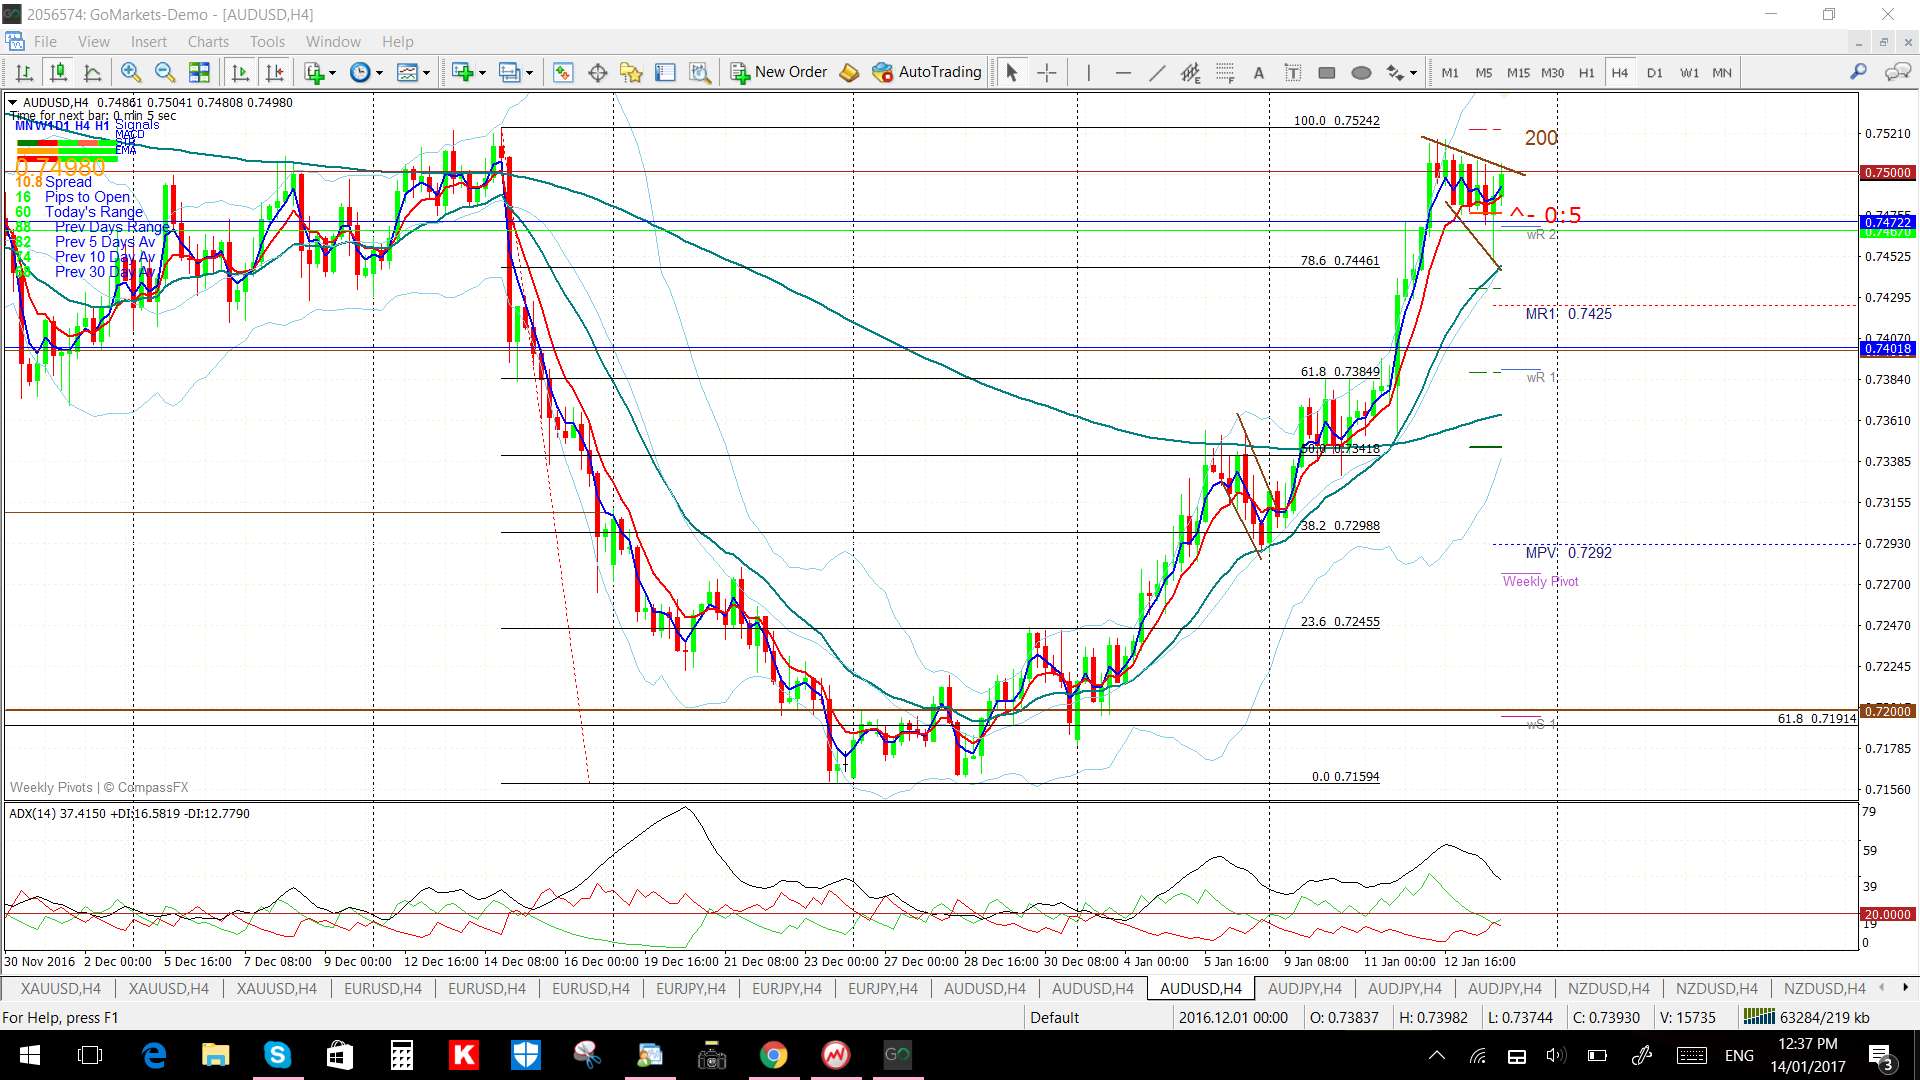
- AUD/USD 4hr: Screen shot from last w/e post showing the Bull Flag pattern:

Screen shot after the 200 pip breakout move:

- Gold 4hr: Screen shot from last w/e post showing a Bull Flag here too:

Screen shot after the 300 pip breakout:

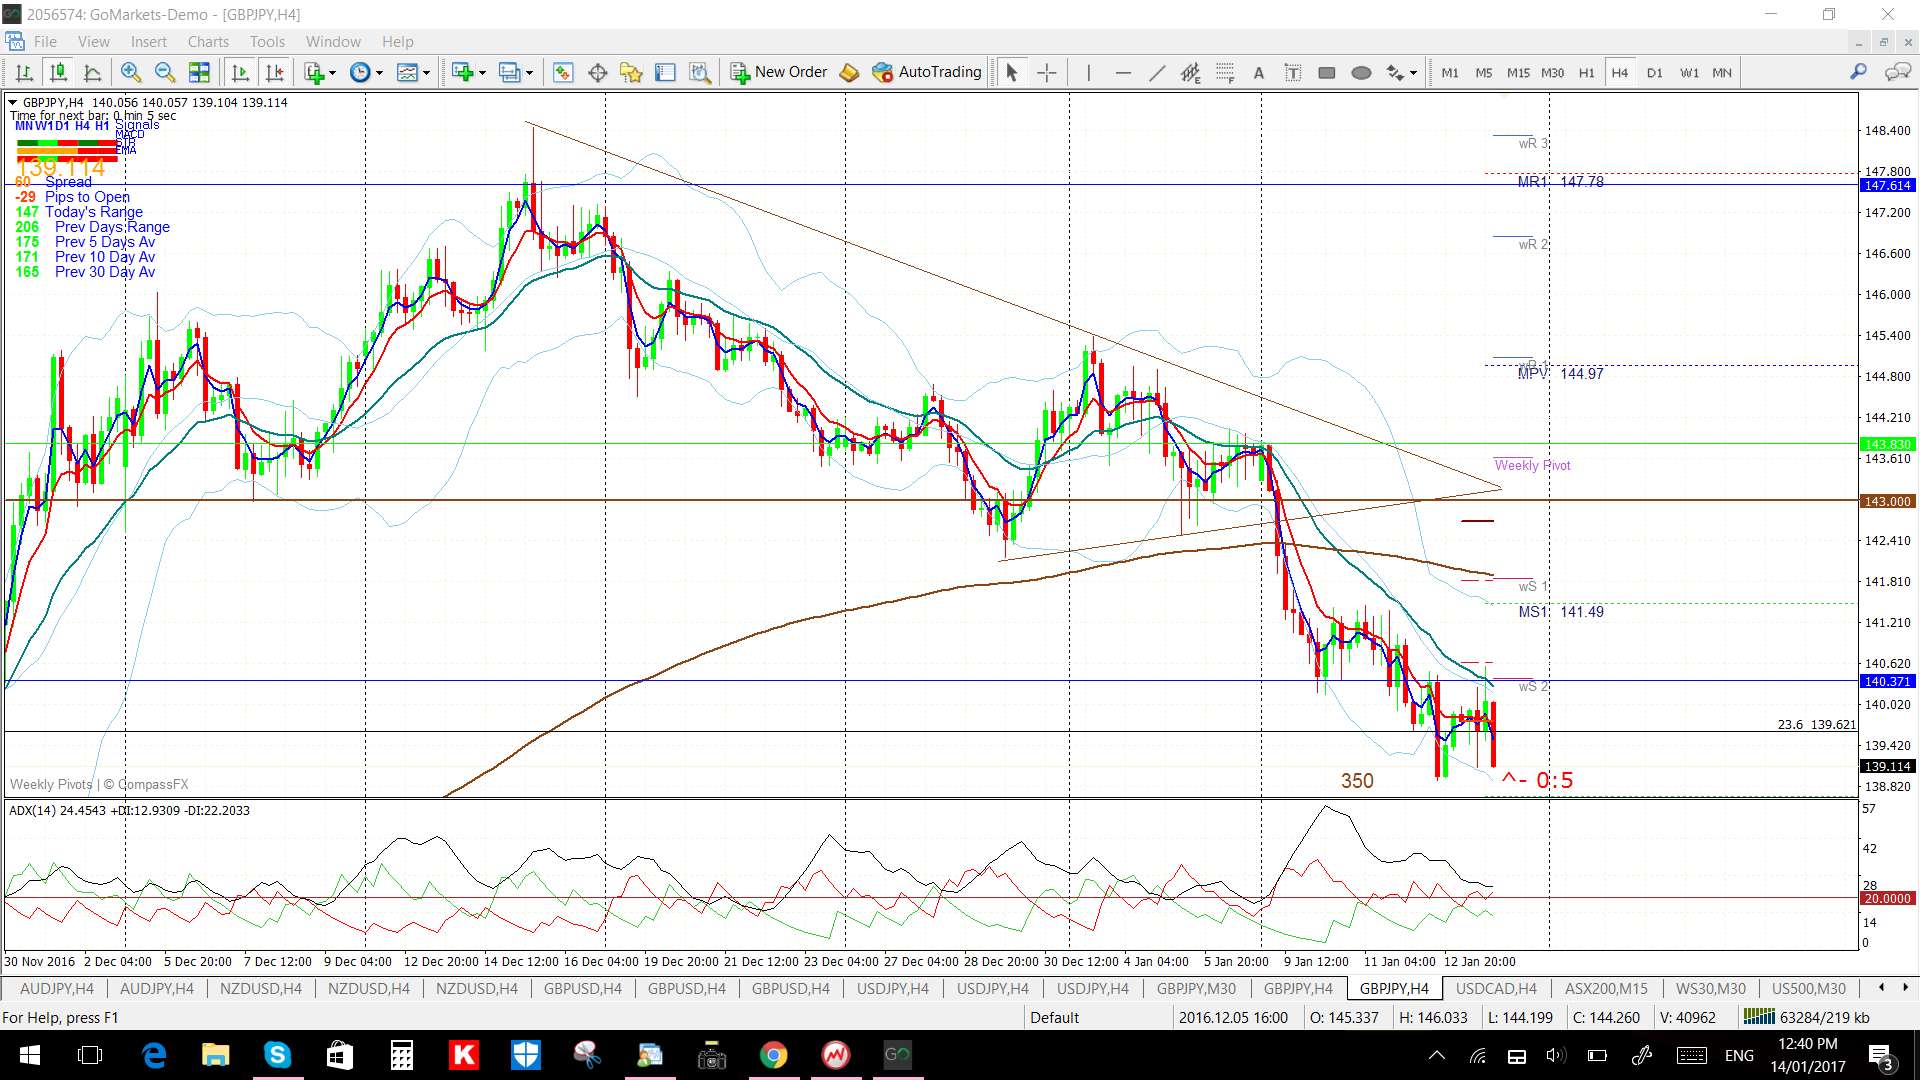
- GBP/JPY 4hr: Screen shot from last w/e post:

Screen shot after the 350 pip breakout:
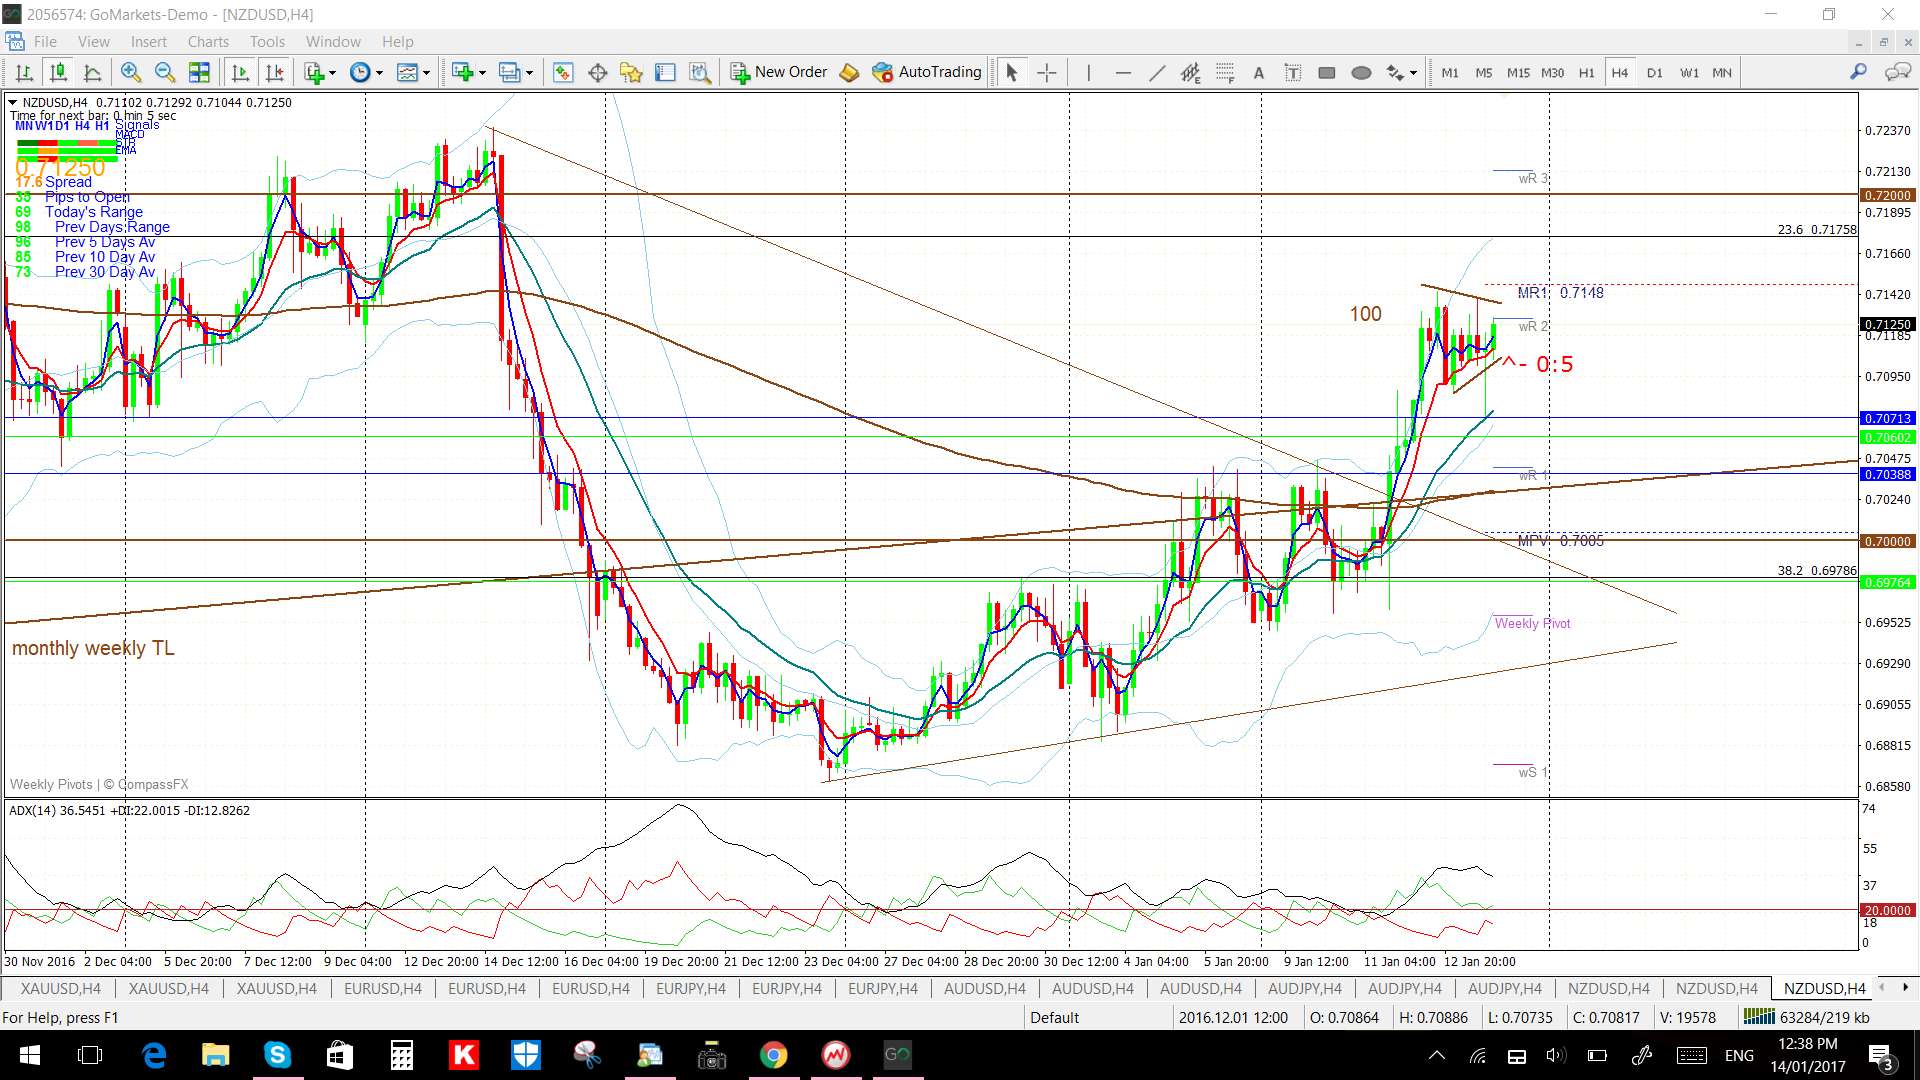
- NZD/USD 4hr: screen shot from the mid week post:

Screen shot from after 100 pip breakout:
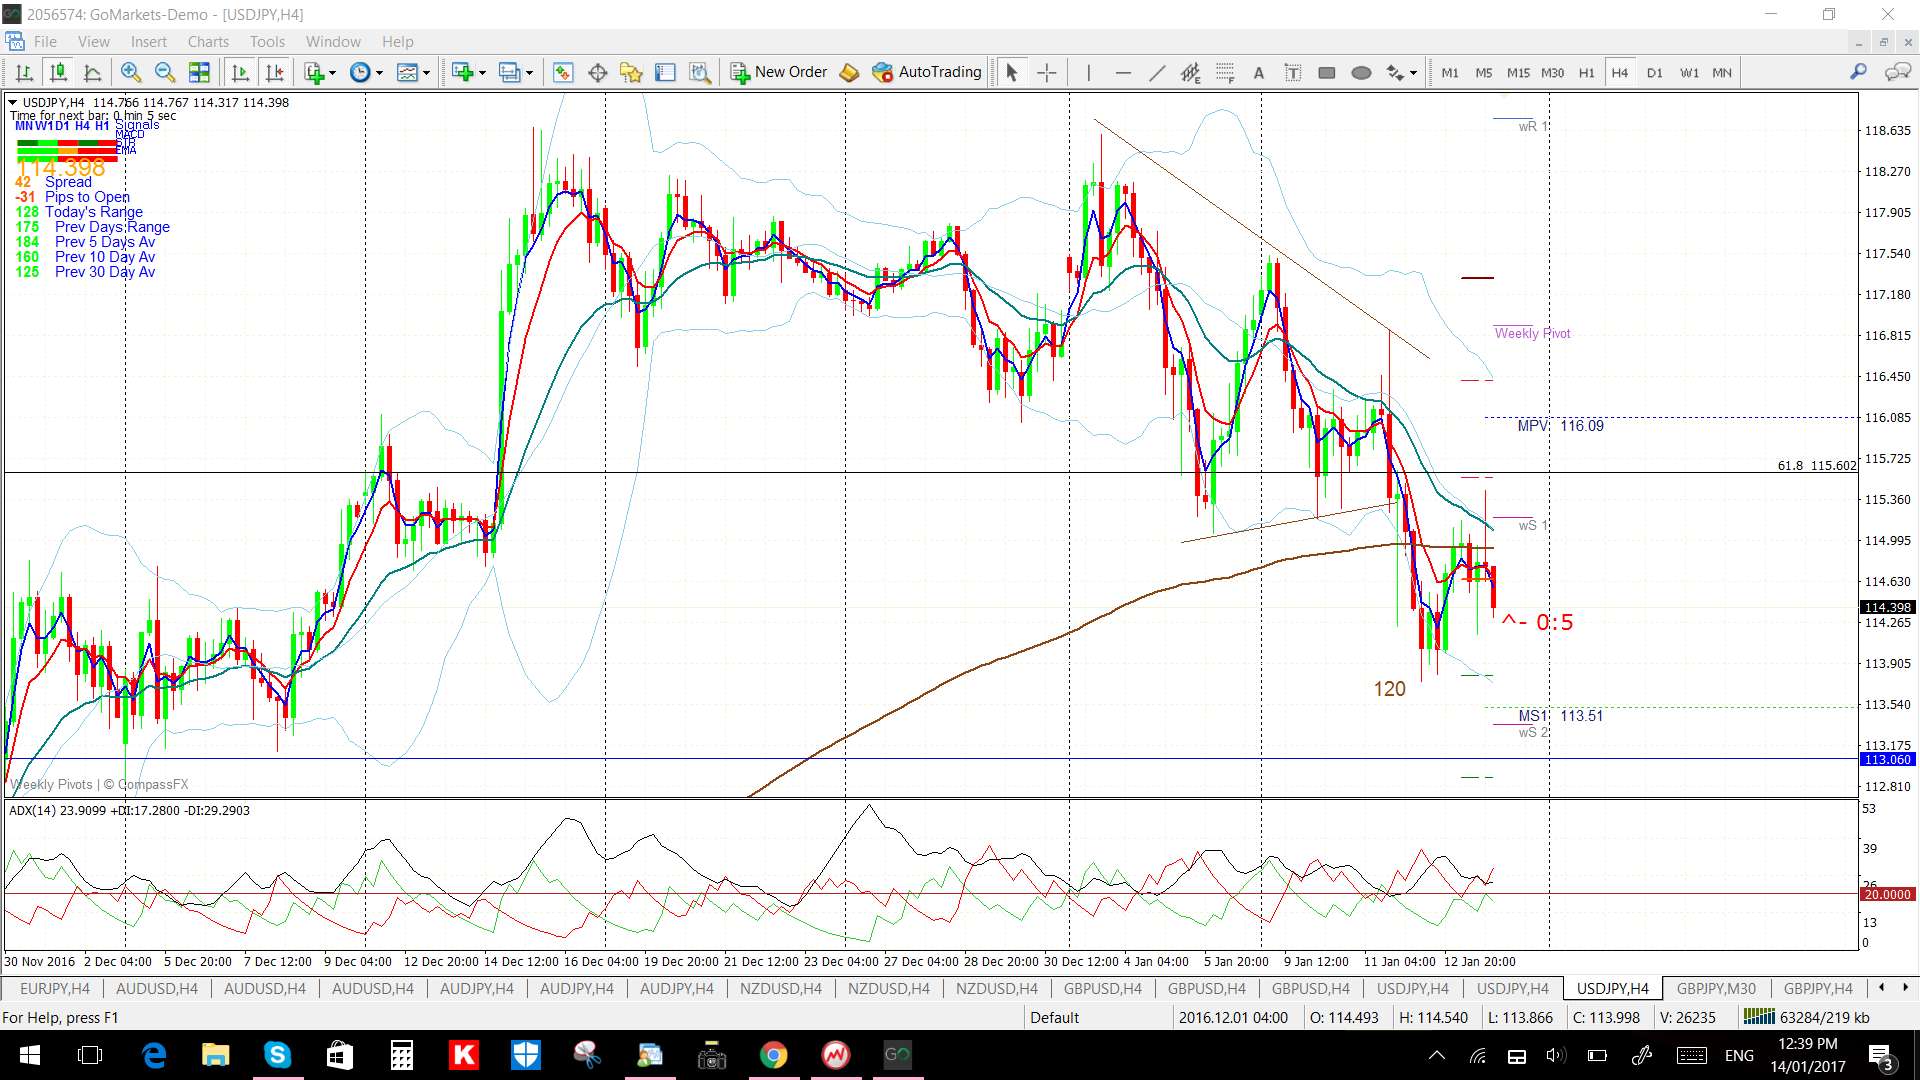
- USD/JPY: On Wednesday 11th I posted this chart of the USD/JPY suggesting I was not sure of how to read this pair but the trend lines I had in place proved to be a good guide!

Screen shot from after the 120 pip breakout:
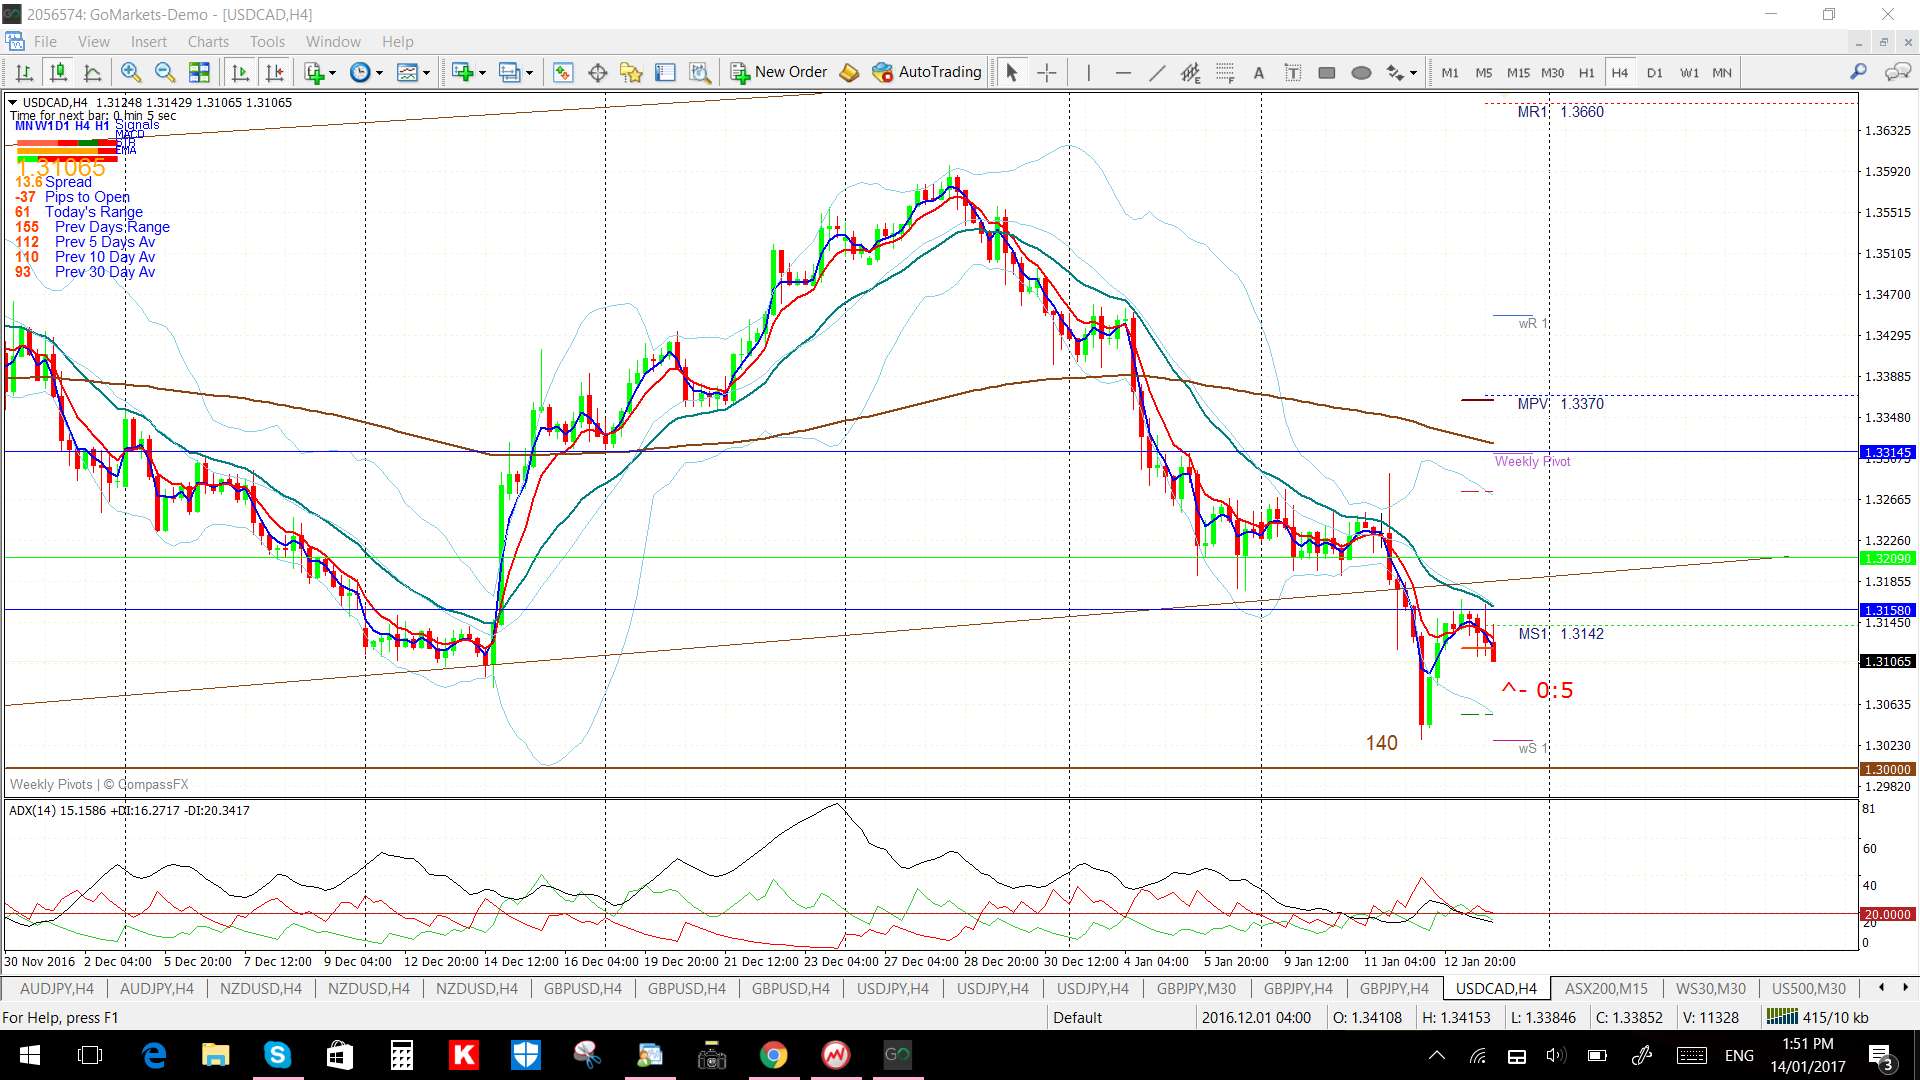
- USD/CAD: On Thursday I had suggested that any break of the wedge trend line might target the 1.30 level and this is the chart from that post:

Price did eventually break down through the wedge trend line and target the 1.30 level in a move that gave 140 pips before bouncing.

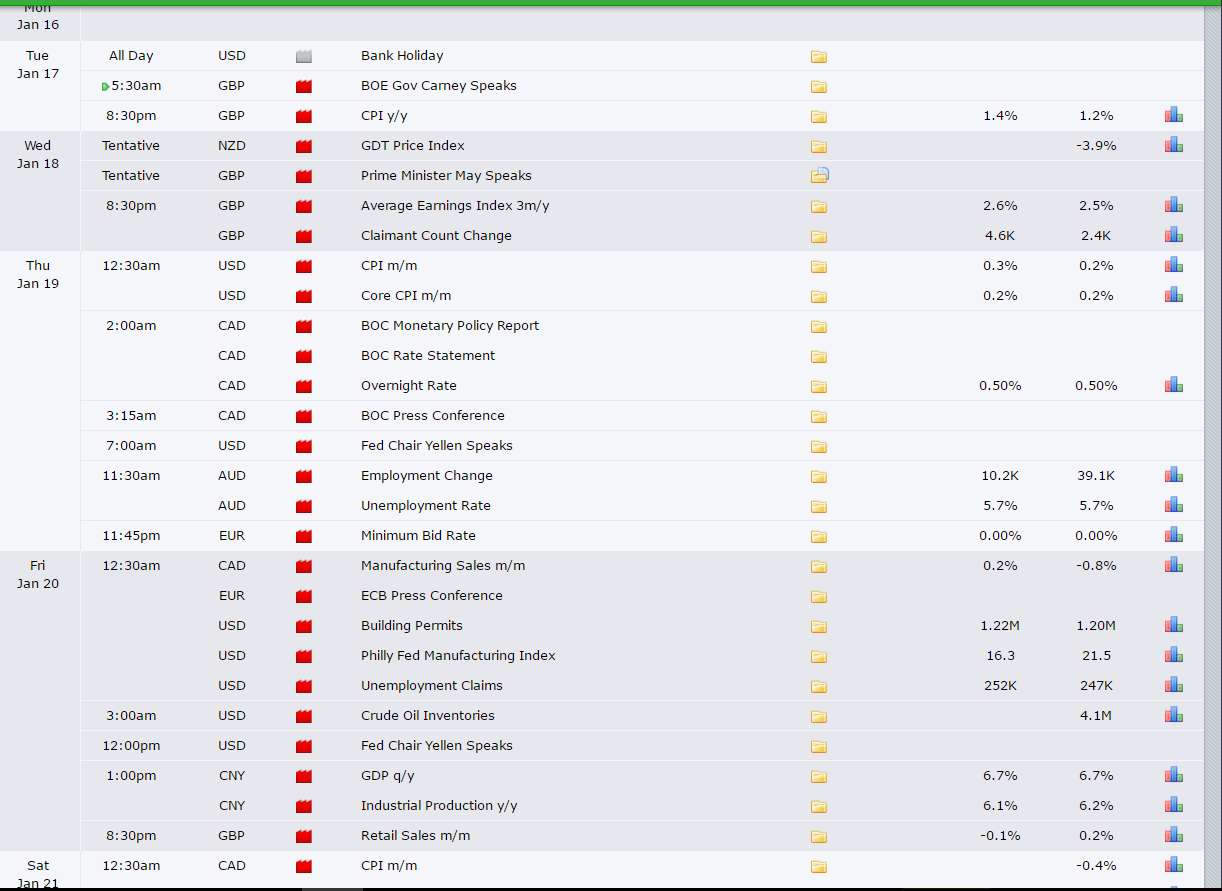
Calendar: It is a busy week but note the US holiday on Monday. The Trump Inauguration is set down for next Friday 20th.
Forex and levels to watch for next week: the fate of many currency pairs is closely tied to that of the US$ which has been chopping lower for the last three weeks. Next week’s Trump inauguration may help to define the US$ move and, therefore, that of many currency pairs. A review of the FX indices can be found through this link. BTW: Gold was reviewed earlier and can be found through this link.
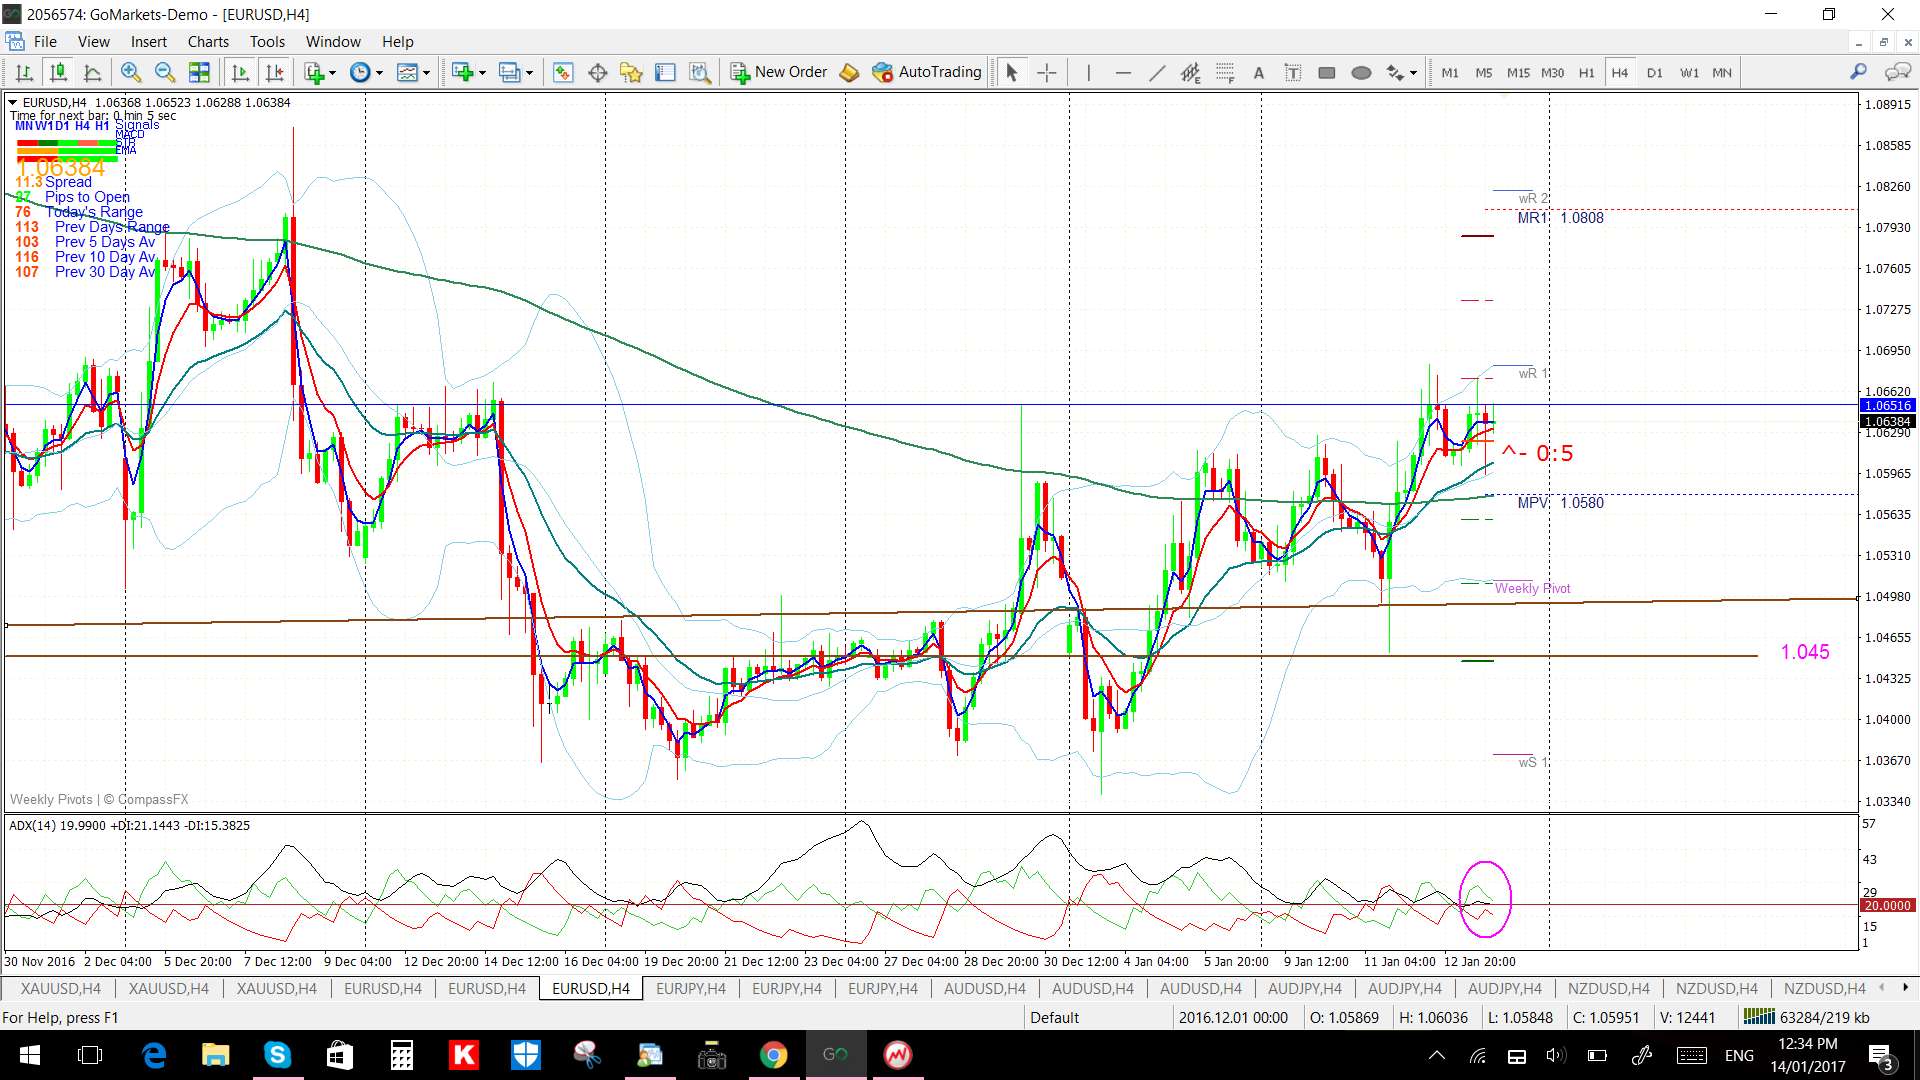
EUR/USD: keep an eye on the 1.045 for any clear-cut make or break move.
There is the ECB interest rate decision & Press Conference next Thursday as well as US CPI, Weekly Unemployment data and a Yellen speech and Friday brings US Building Permits, US Philly Fed Manufacturing data and another Yellen speech:

EUR/JPY: keep an eye on the 4hr chart’s Flag trend lines for any make or break move.
There is the ECB interest rate decision & Press Conference next Thursday as well as US CPI, Weekly Unemployment data and a Yellen speech and Friday brings US Building Permits, US Philly Fed Manufacturing data and another Yellen speech:

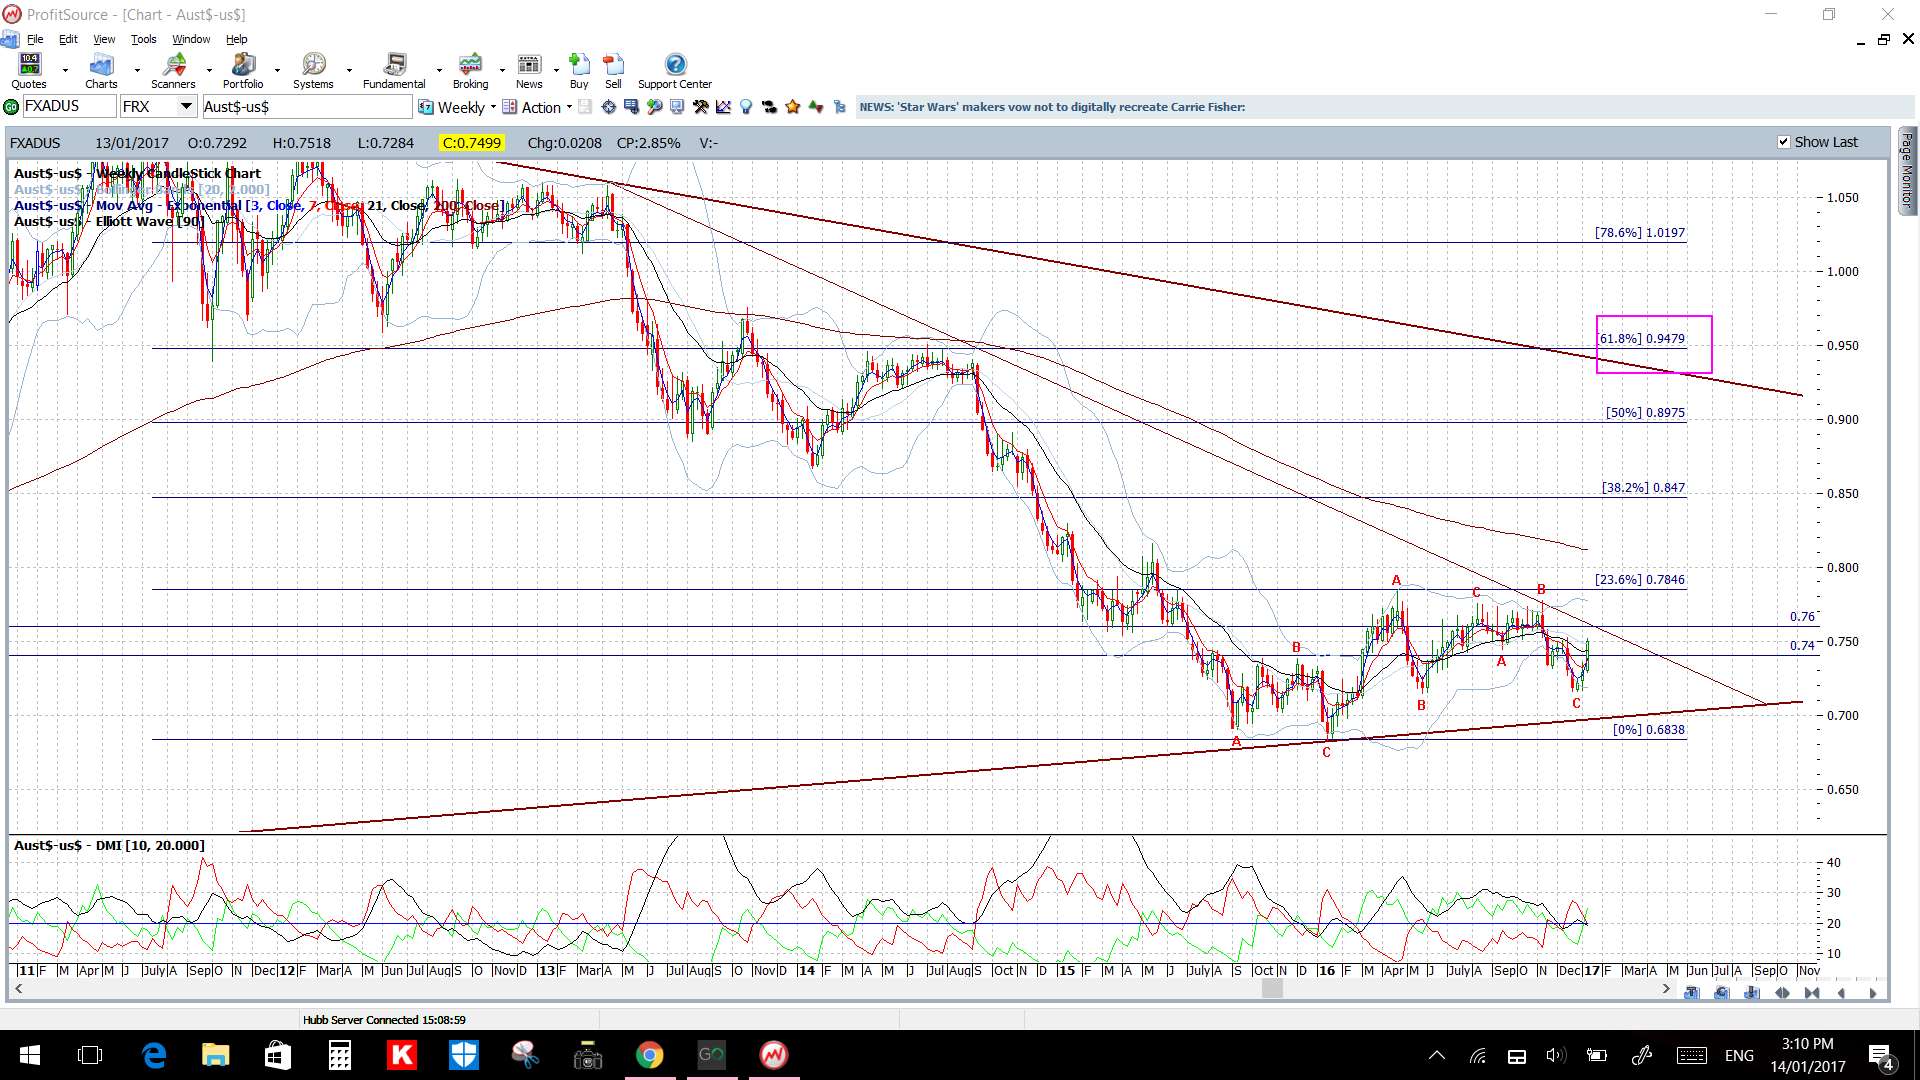
AUD/USD: keep an eye on the newly formed Flag for any momentum-based breakout move. Any bearish pullback could see price test the 0.73 region as this is near the 4hr chart’s 61.8% fib and the monthly/weekly pivots.
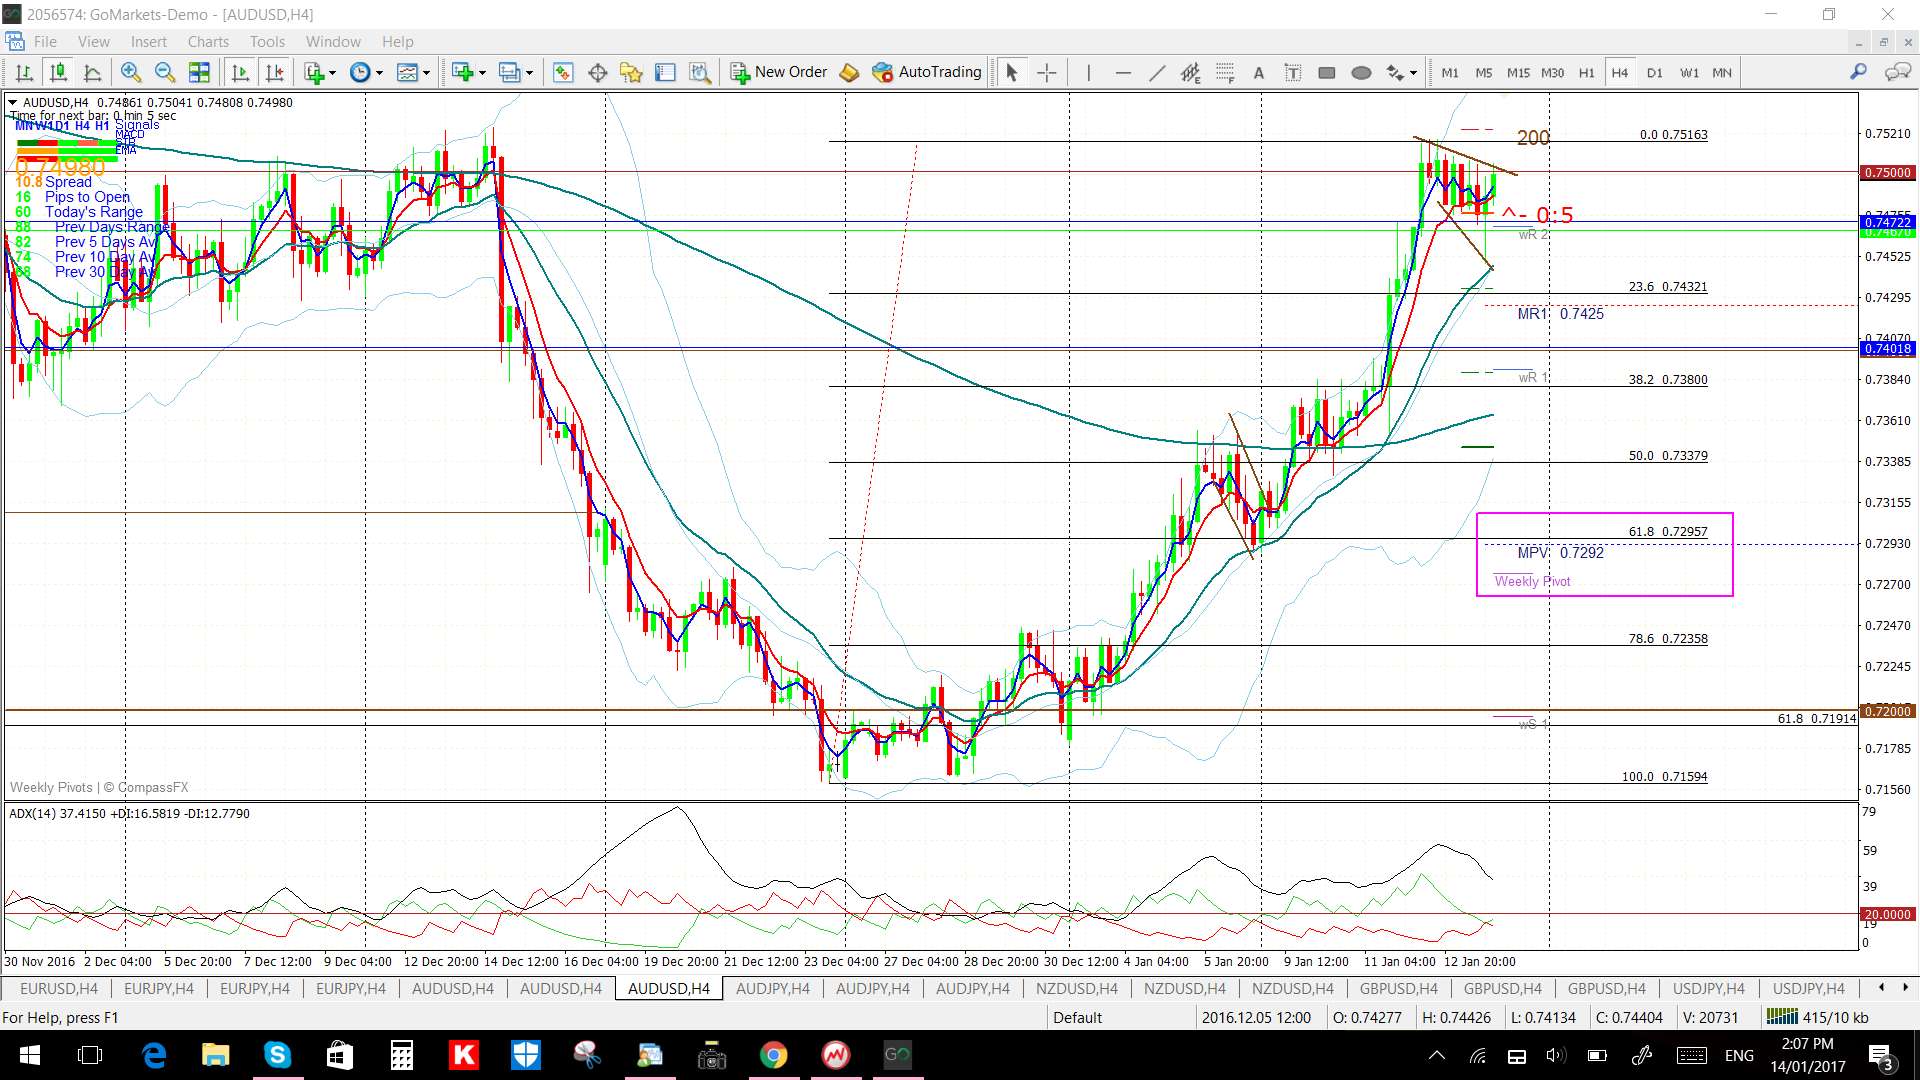
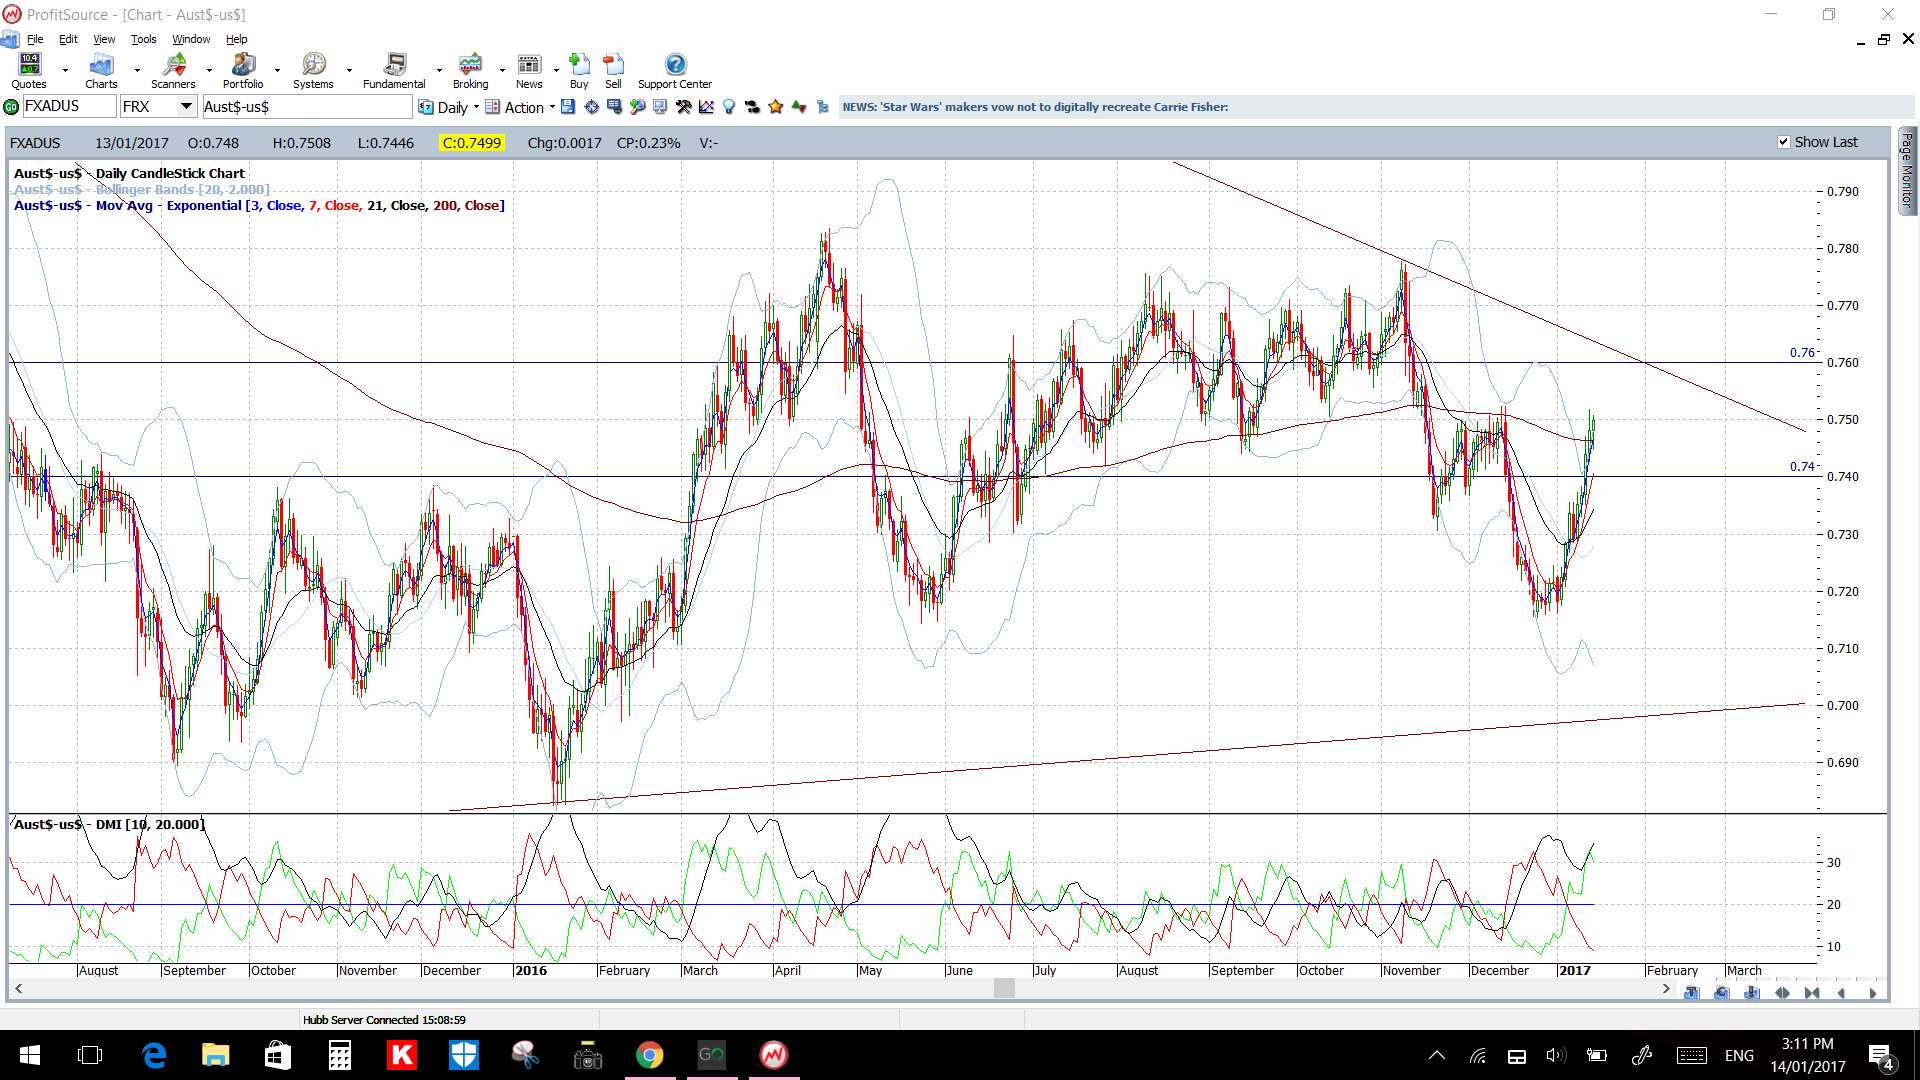
Bullish continuation on the Aussie though would have me focused on 0.76 as this is the next whole-number level and it also near the 3 1/2 bear trend line:
There is AUD Employment data on Thursday as well as US data with US CPI, Weekly Unemployment data and a Yellen speech and Friday brings US Building Permits, US Philly Fed Manufacturing data and another Yellen speech:
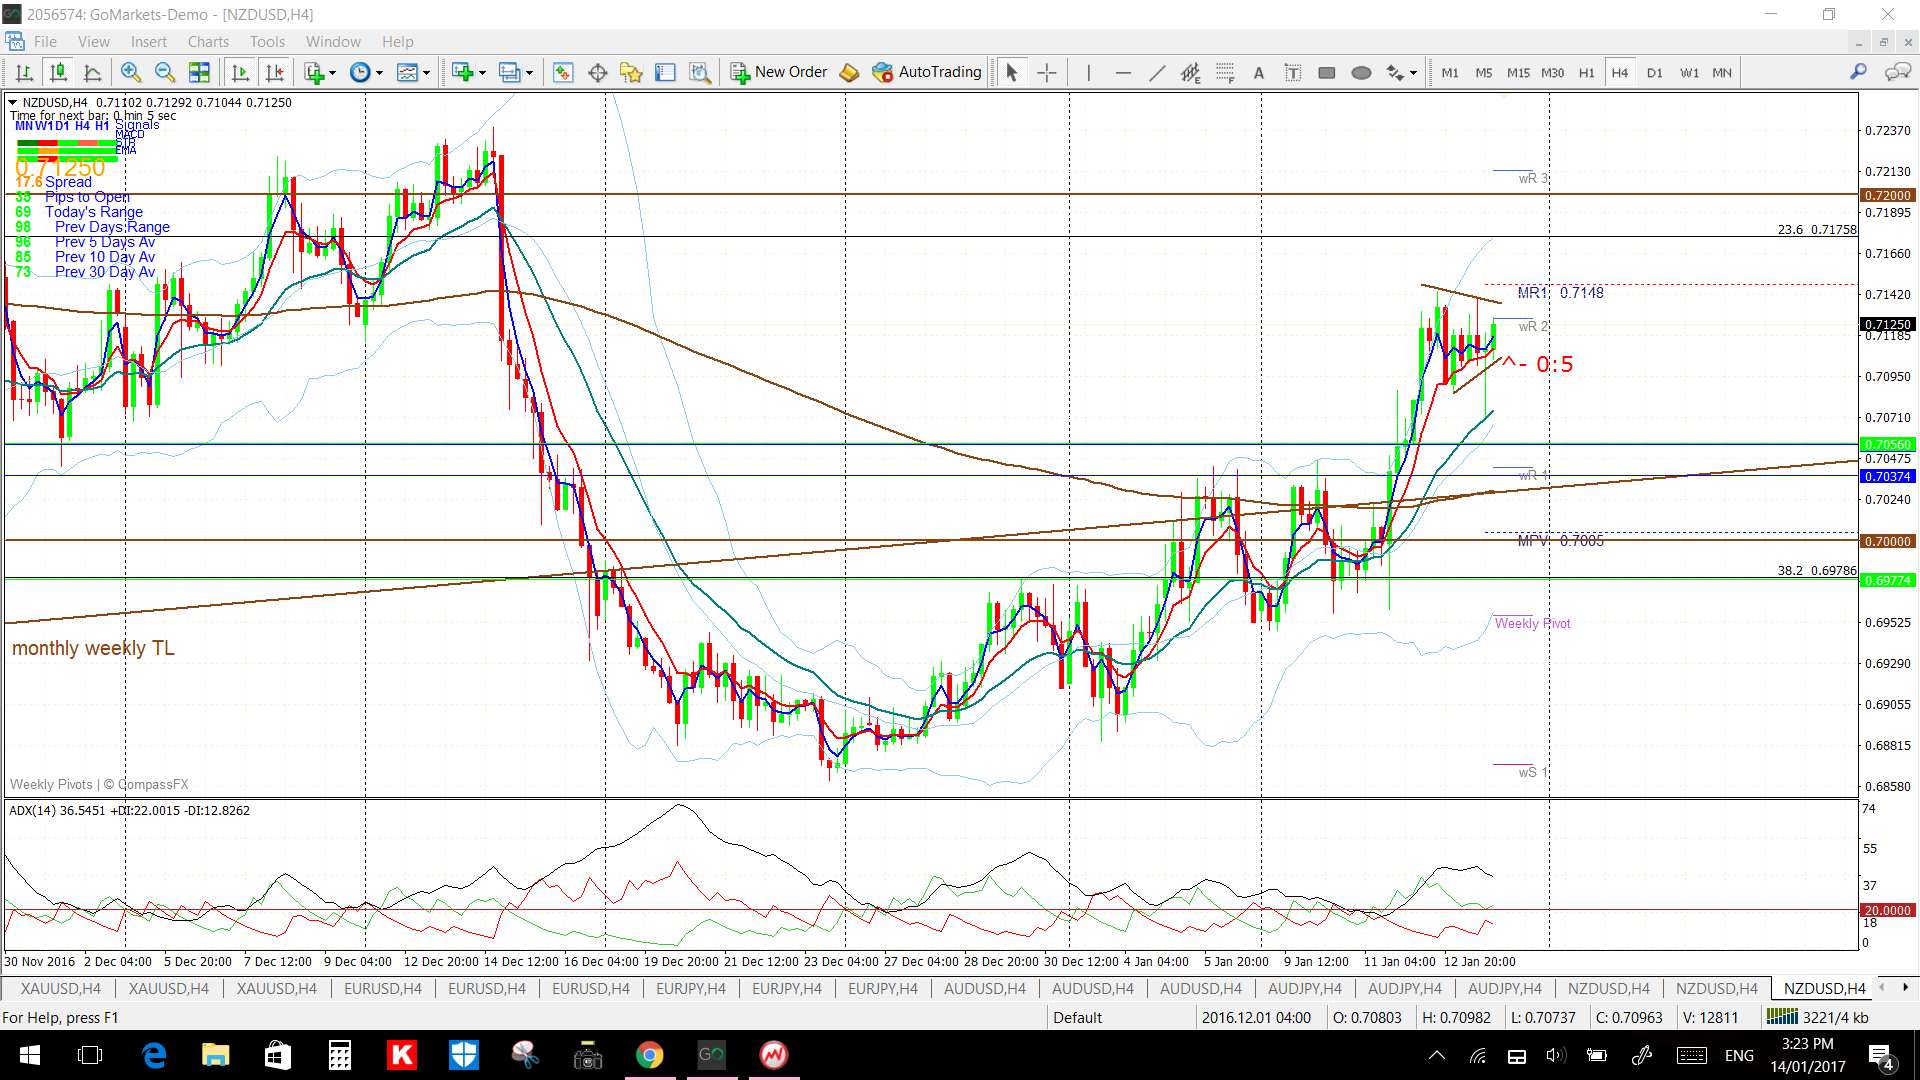
NZD/USD: The Kiwi recovered last week and has moved up to trade within a Flag pattern and just under the key 0.72 level:
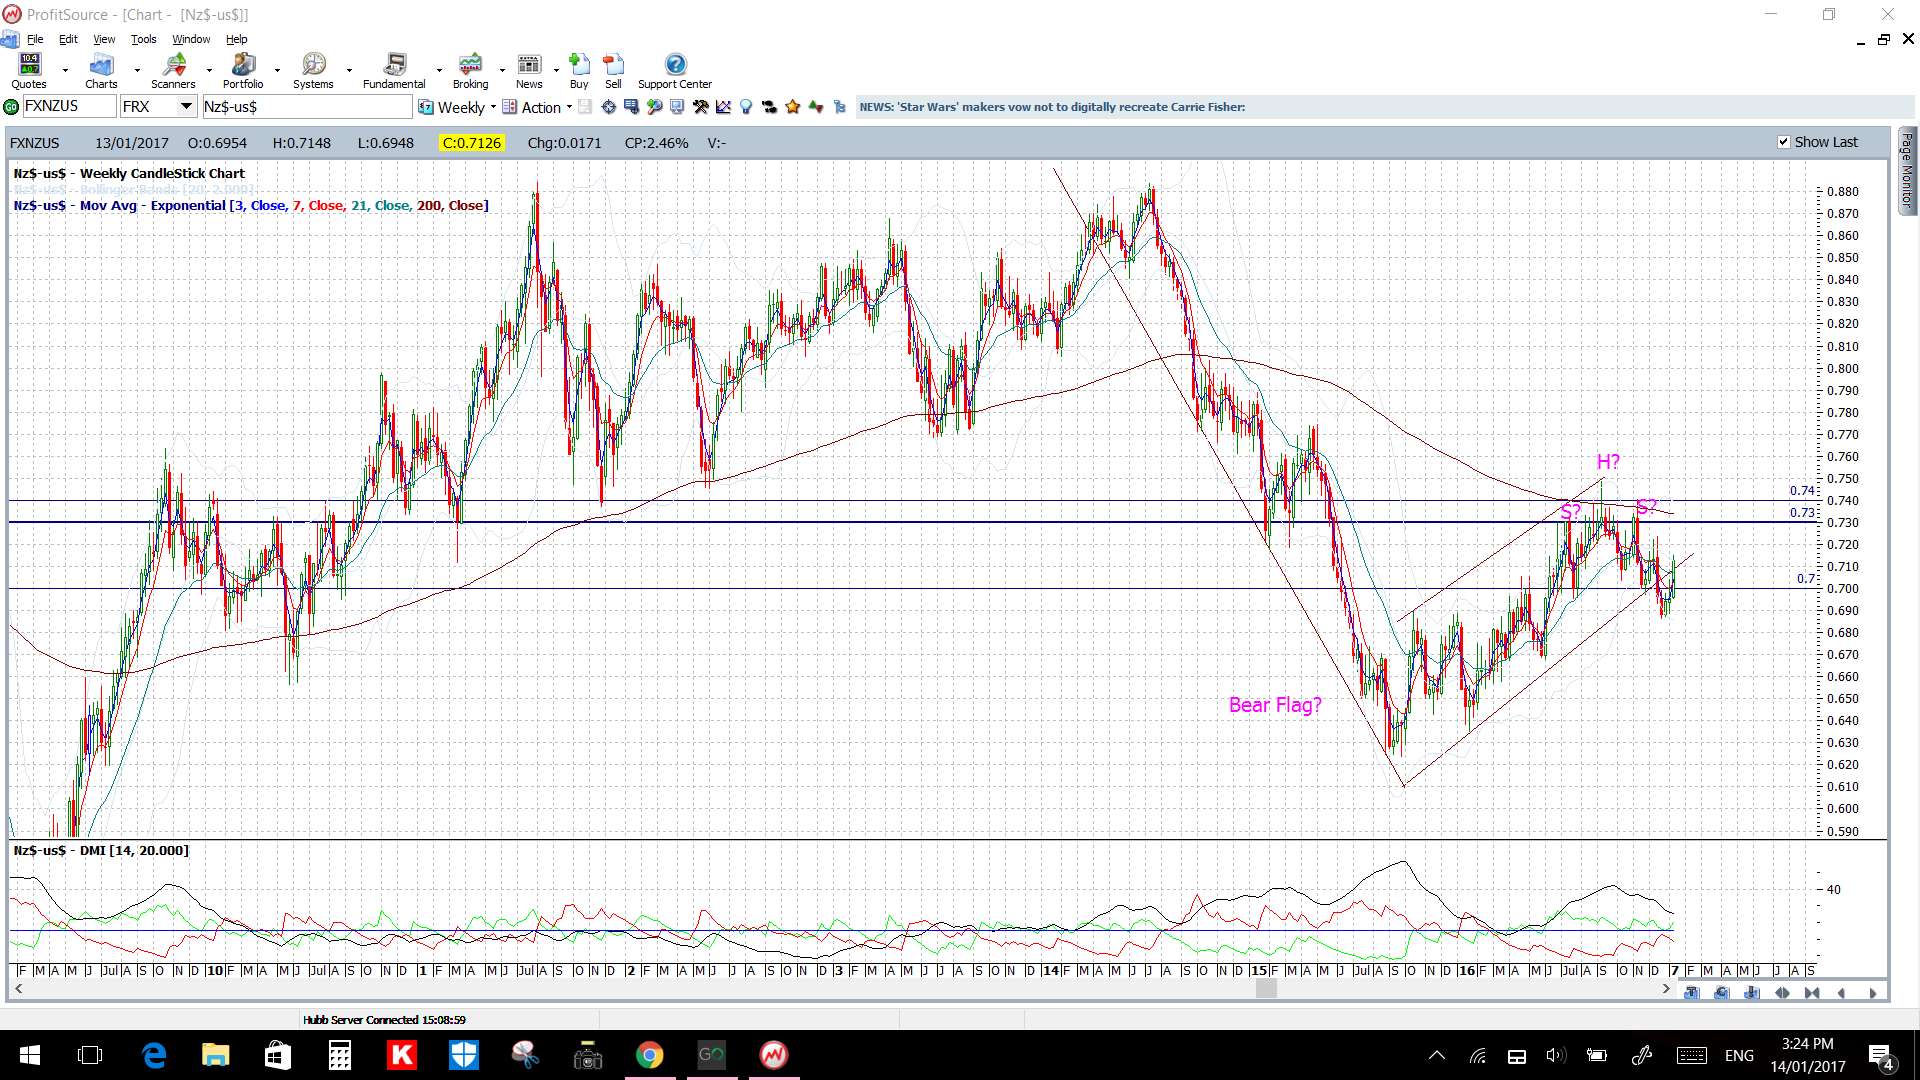
The weekly chart had been suggesting bearish activity with a potential Bear Flag and H&S. However, NOTE how the ADX was declining through this period and so any trend line breakout was susceptible to failure:
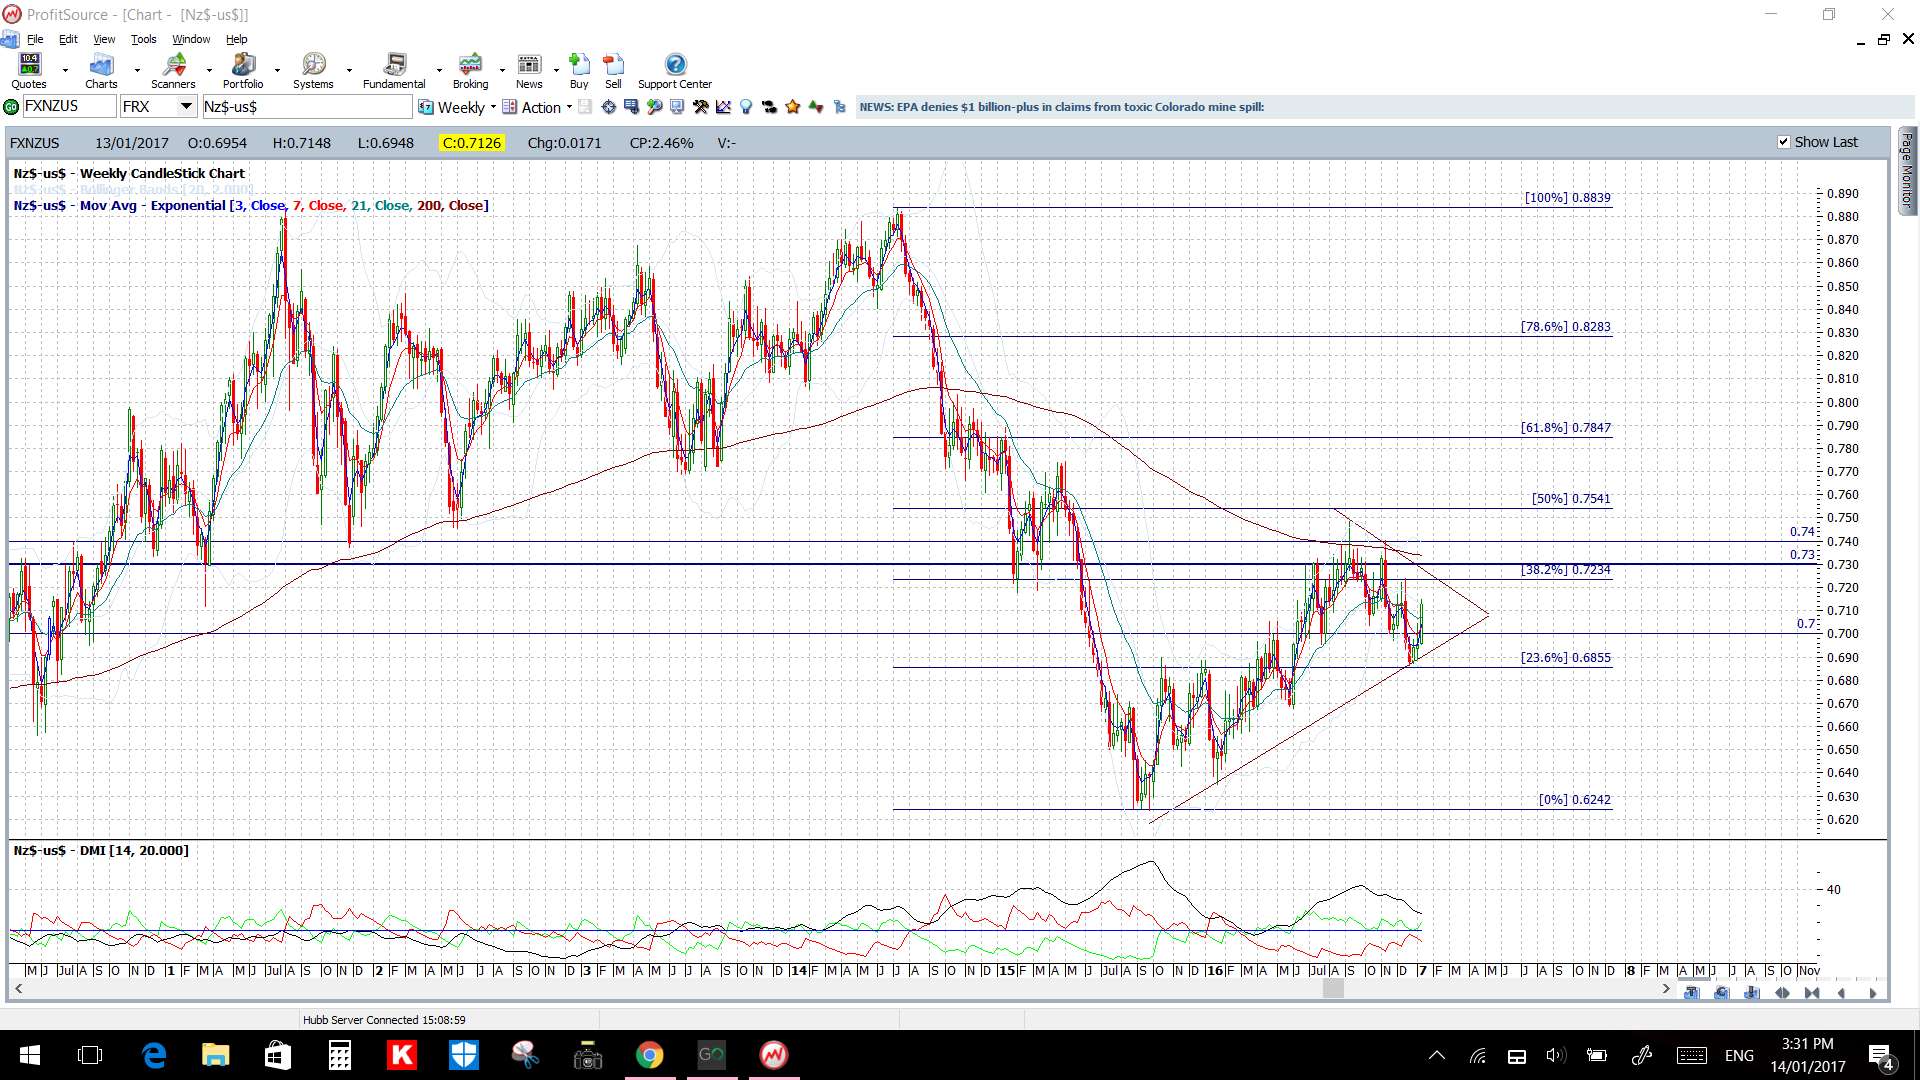
I’ve revised my trend lines on the daily chart and I’ll be watching for any momentum-based trend line breakout. Any bullish breakout will have me looking for a test of the 0.79 level as this is up near the 61.8% fib:

The monthly chart of the Kiwi also has the ADX declining and so this recent bearish trend line breakout is questionable for the time being as well.
There is NZD GDT Price Index data on Tuesday as well as US data with US CPI, Weekly Unemployment data and a Yellen speech and Friday brings US Building Permits, US Philly Fed Manufacturing data and another Yellen speech:

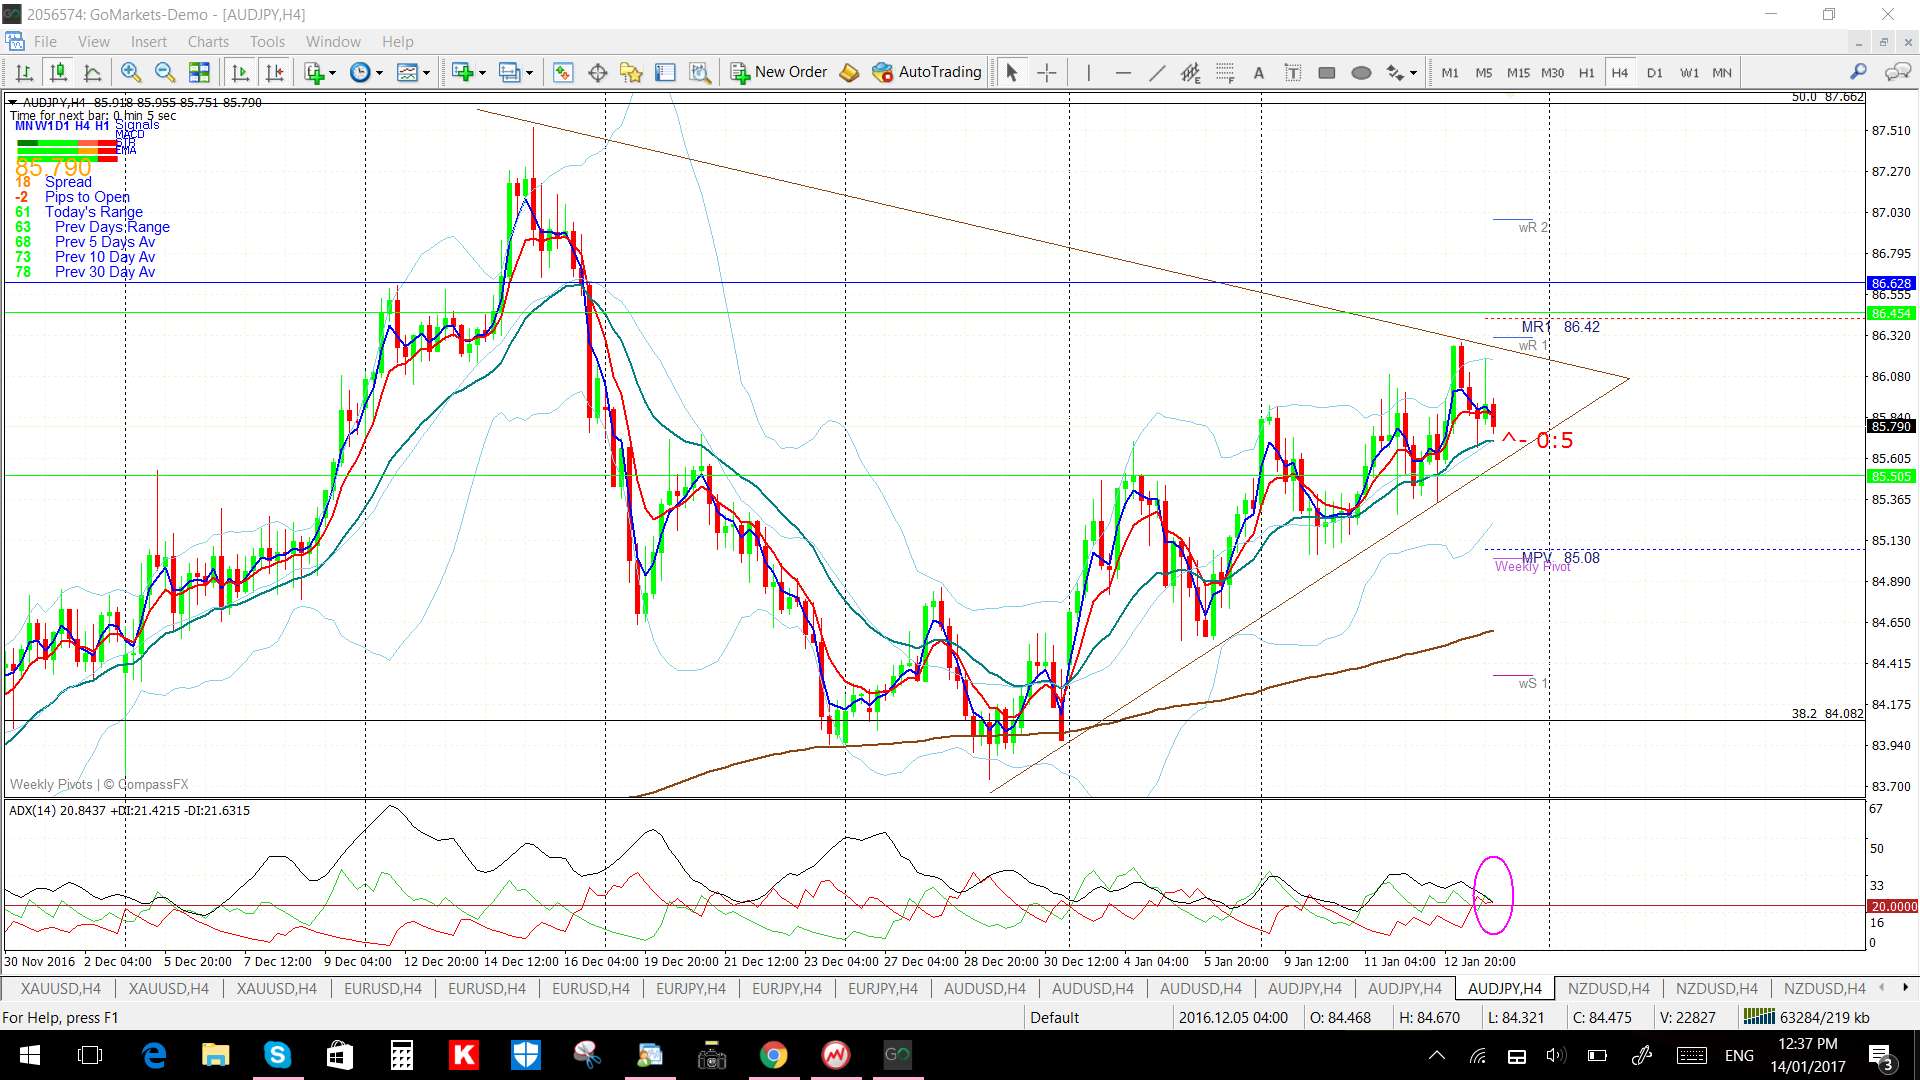
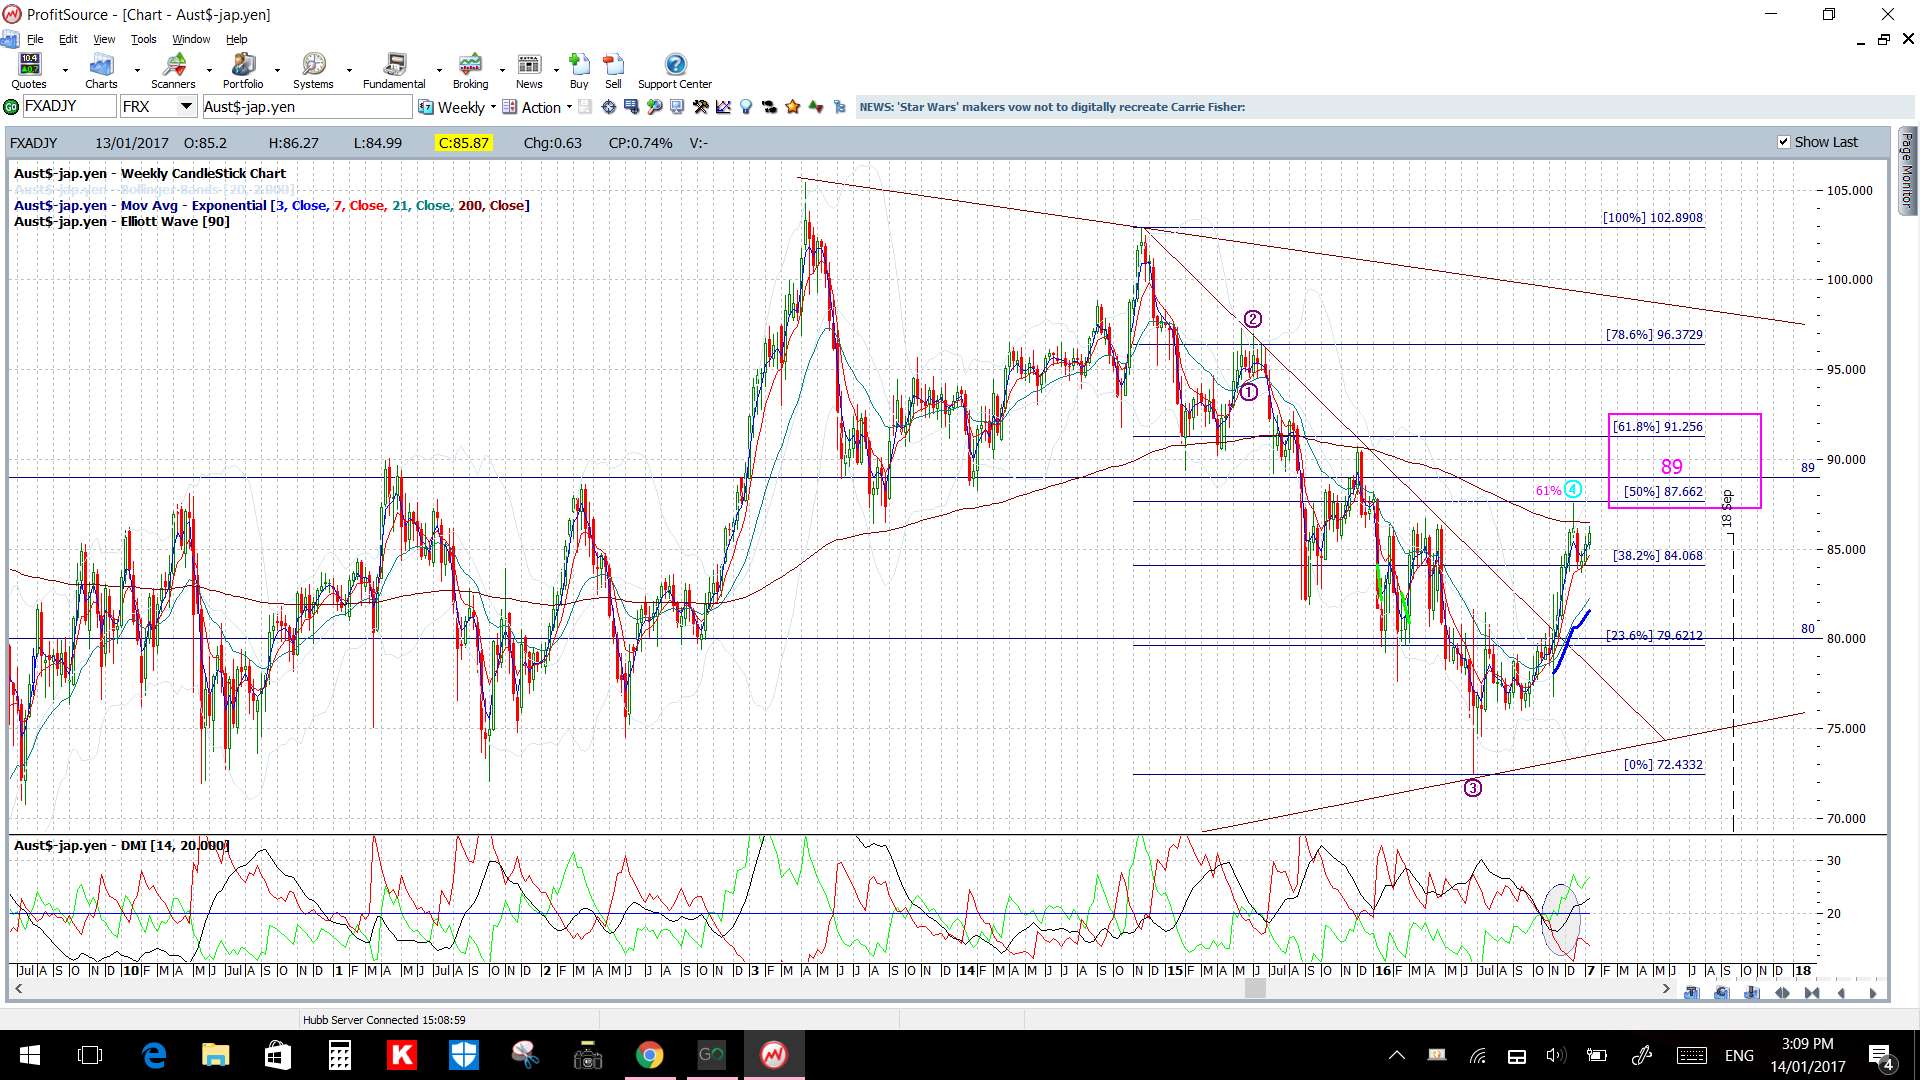
AUD/JPY: there are new 4hr chart triangle trend lines to watch for any make or break move. I’m still watching for any test of the key 89 level and it is worth noting that any continued bullish sentiment with stocks could help to drag this currency pair higher as the two are highly positively correlated.
There is AUD Employment data on Thursday as well as US data with US CPI, Weekly Unemployment data and a Yellen speech and Friday brings US Building Permits, US Philly Fed Manufacturing data and another Yellen speech:
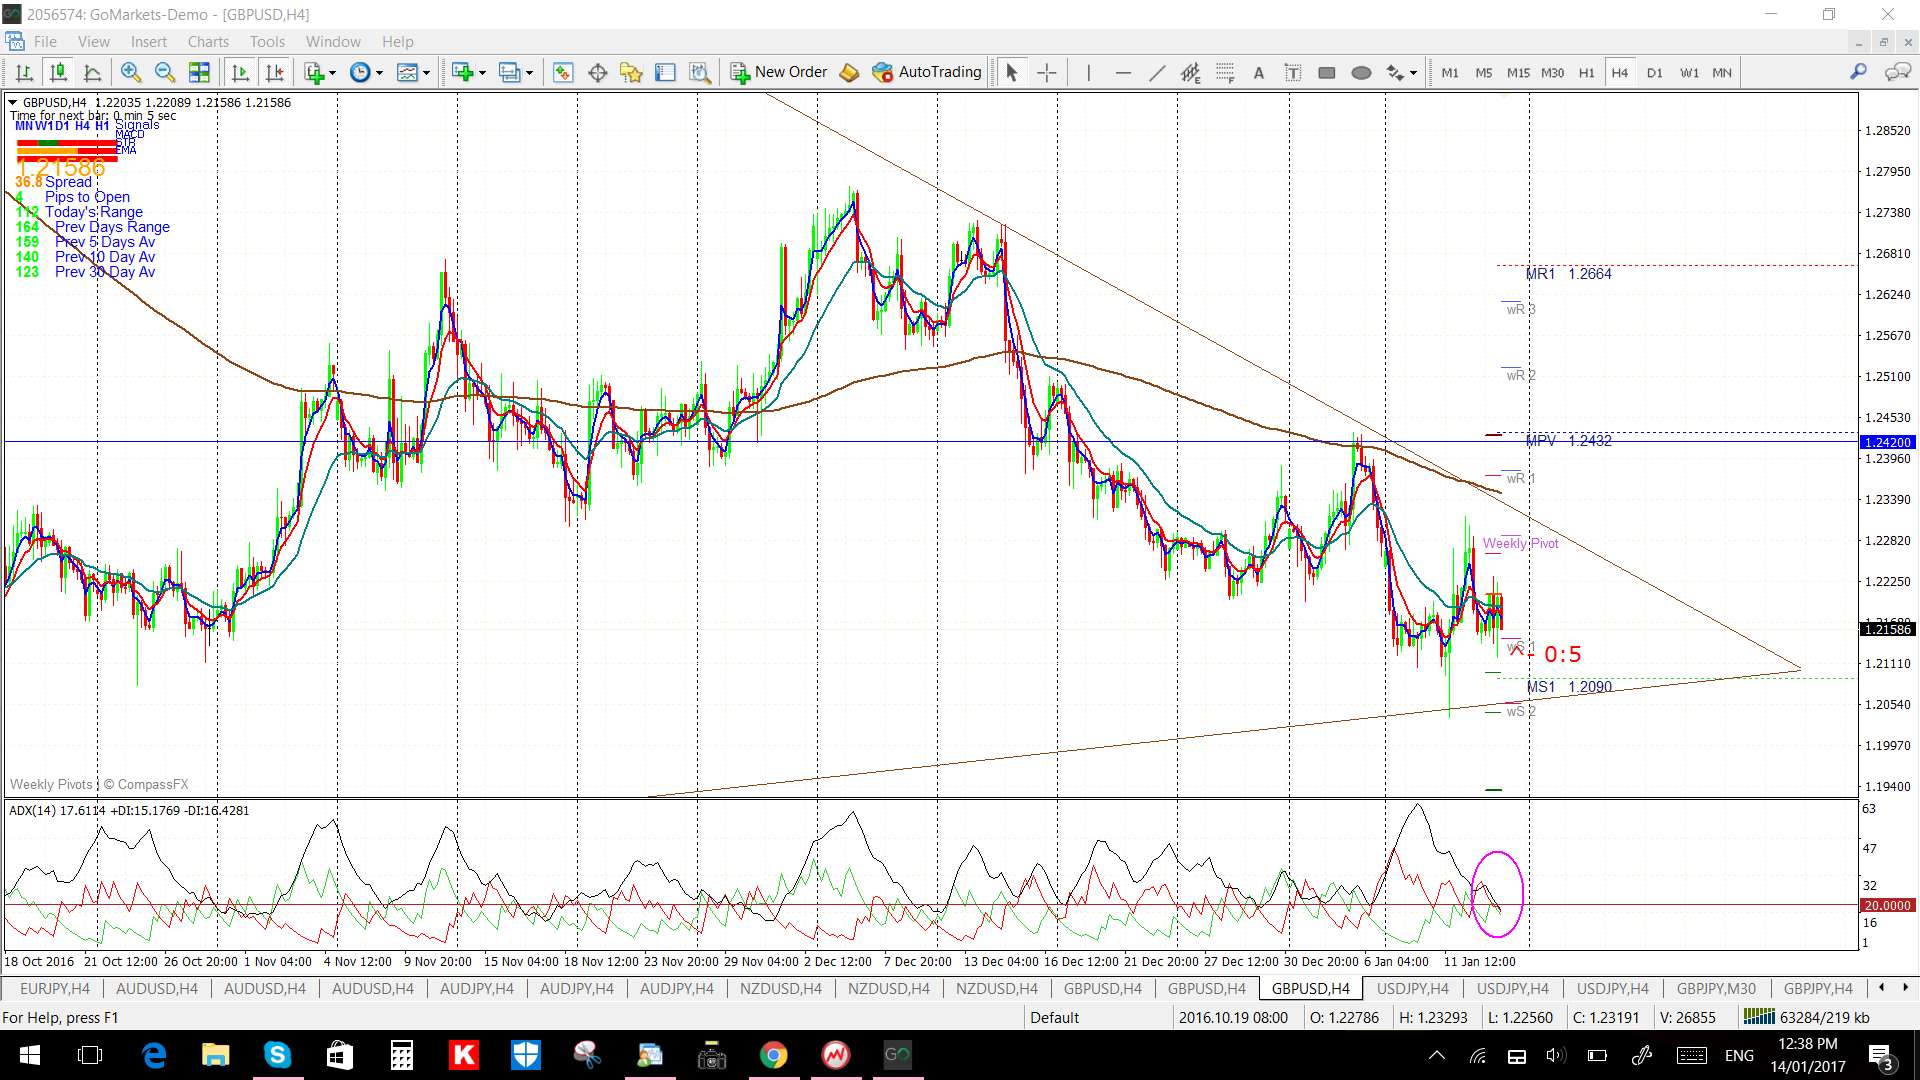
GBP/USD: The Cable could start off under pressure in the coming week as w/e news reports suggest that the UK Prime Minister, Theresa May, may be willing to follow a hard Brexit route and leave the single market. The Prime Minister is scheduled to speak on Tuesday, thus, keep an eye on the triangle trend lines for any clear-cut make or break move:
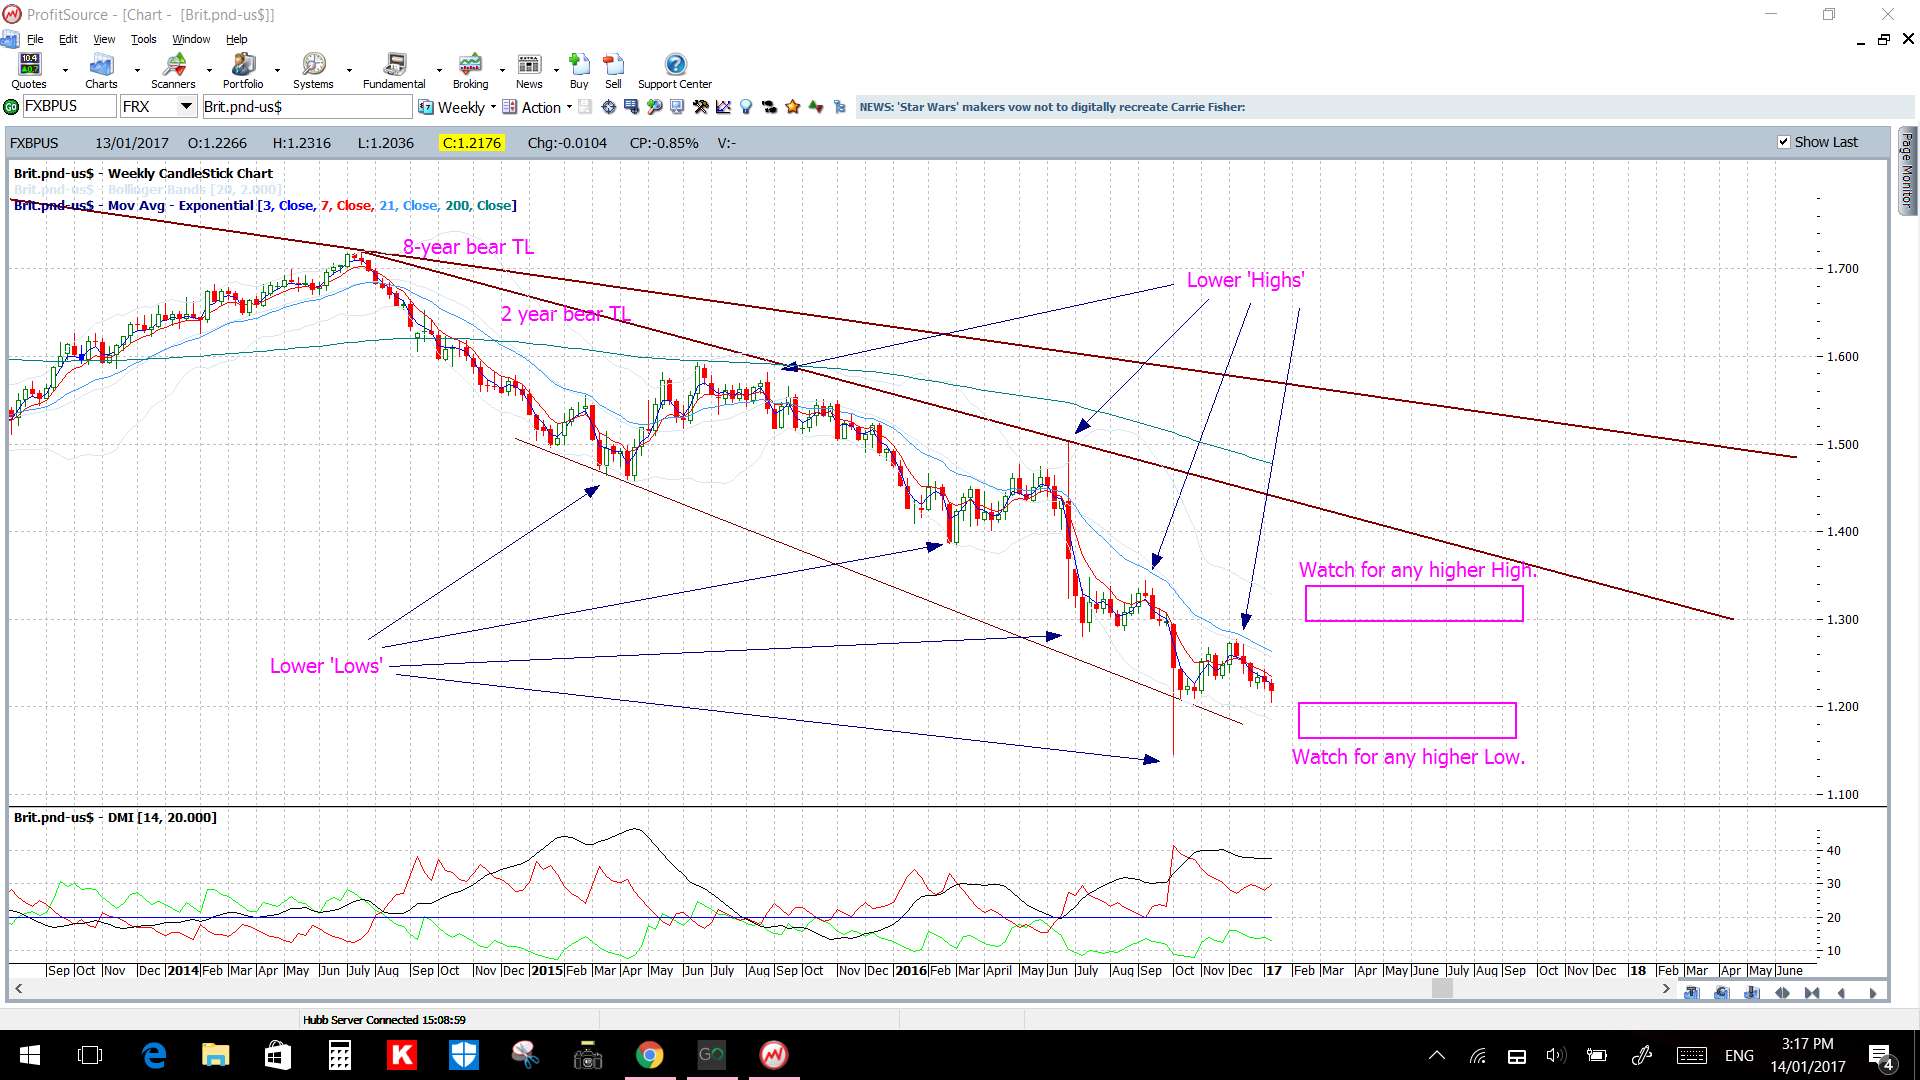
I’m still watching the Cable’s weekly chart for any sign of bearish continuation or reversal though:
There is a fair bit GBP data to watch for this week with a BoE Gov Carney speech, CPI data and a PM Theresa May speech on Tuesday, Employment data on Wednesday and Retail Sales on Friday. There US data with US CPI, Weekly Unemployment data and a Yellen speech on Thursday and US Building Permits, US Philly Fed Manufacturing data and another Yellen speech on Friday.
USD/JPY: there are new new trend lines on the 4hr chart here as well to watch for any make or break activity:
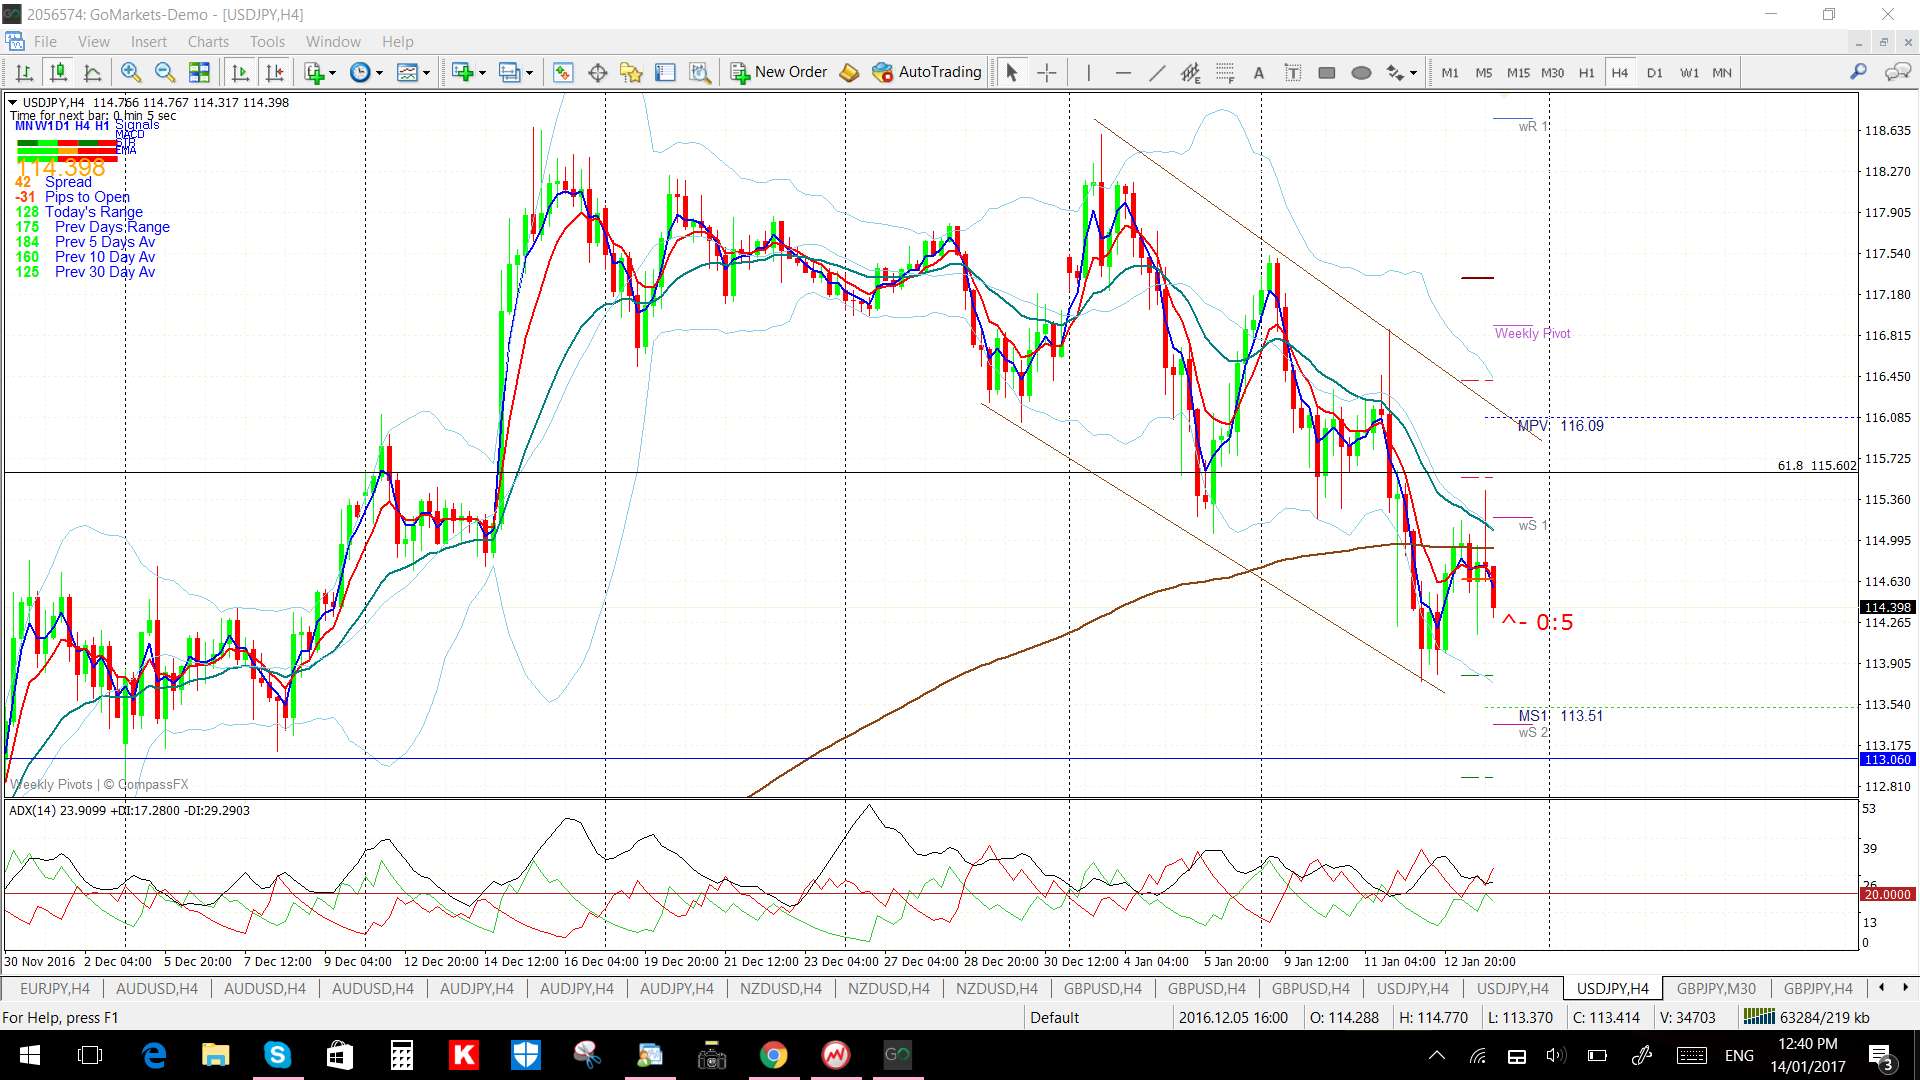
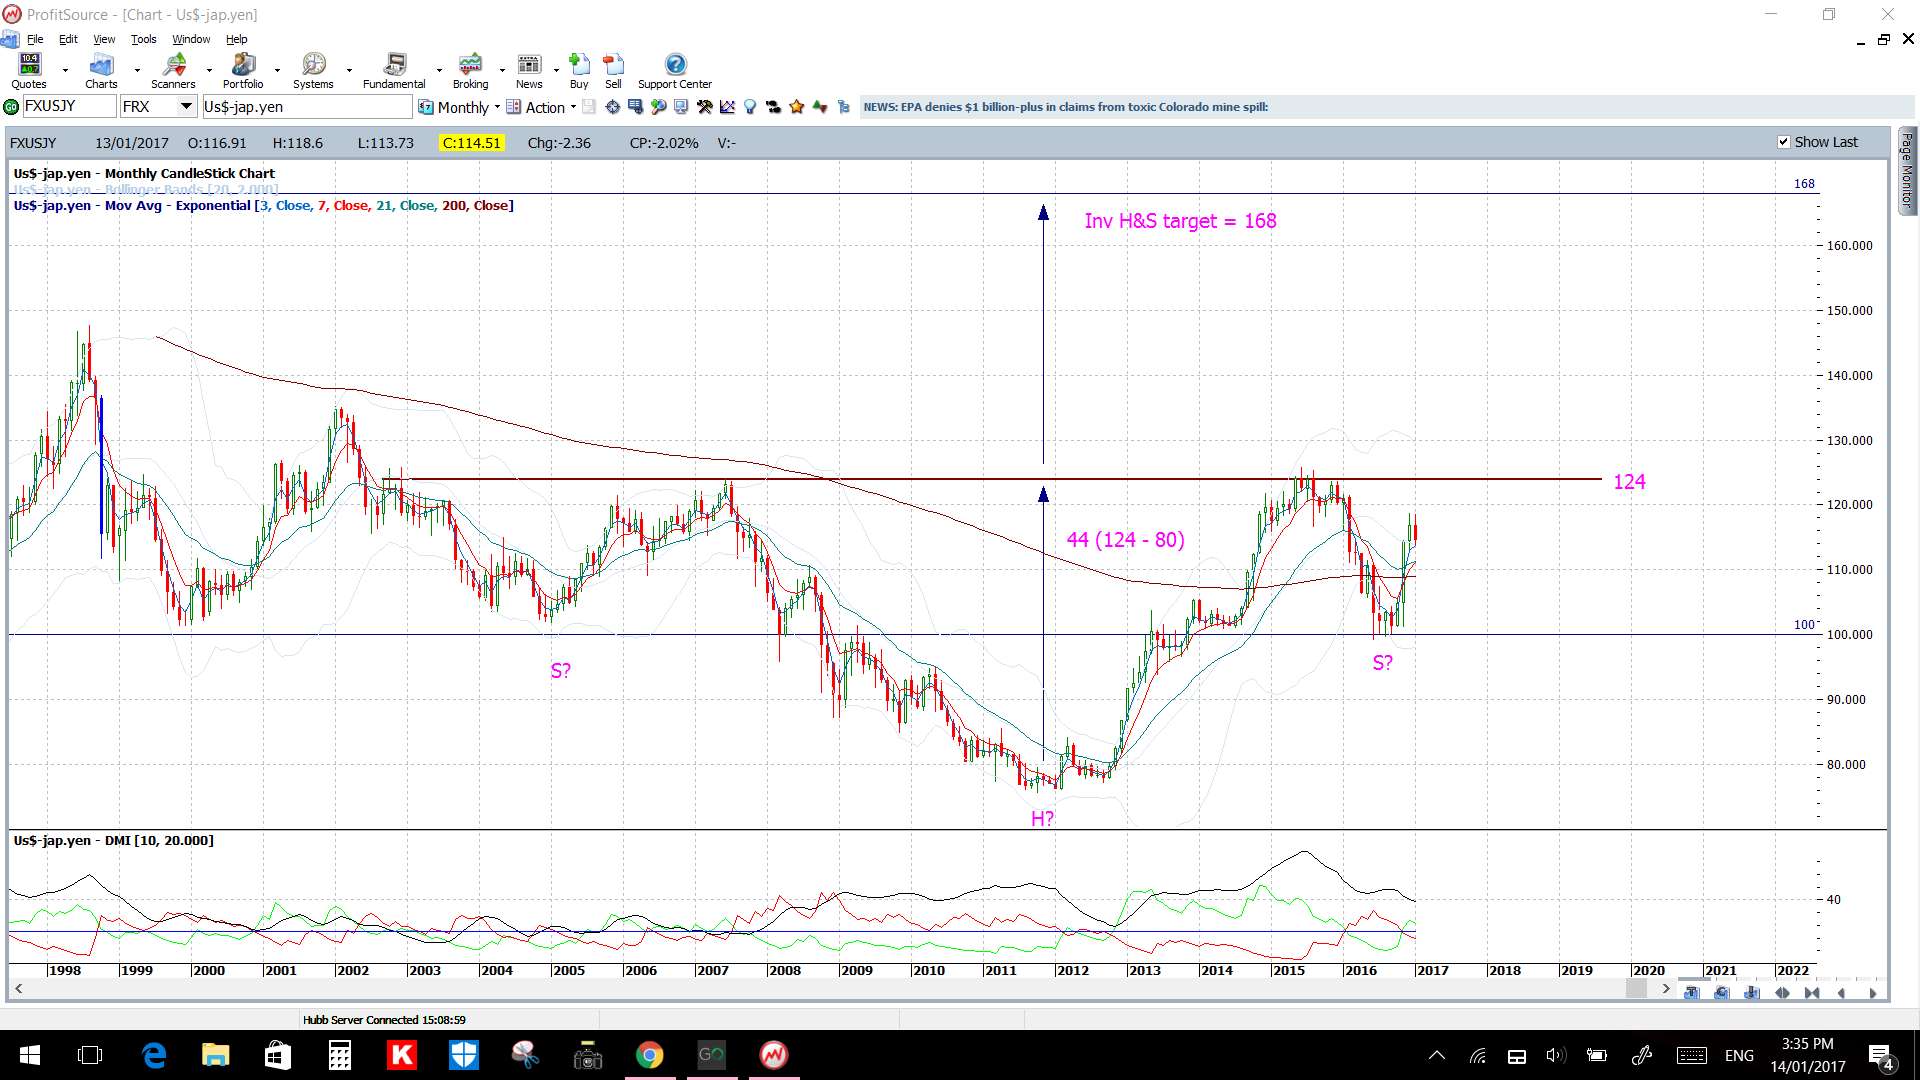
The monthly USD/JPY chart reveals the bigger picture move being stalked here though:
There is US data to watch on Thursday with US CPI, Weekly Unemployment data and a Yellen speech and Friday brings US Building Permits, US Philly Fed Manufacturing data and another Yellen speech:
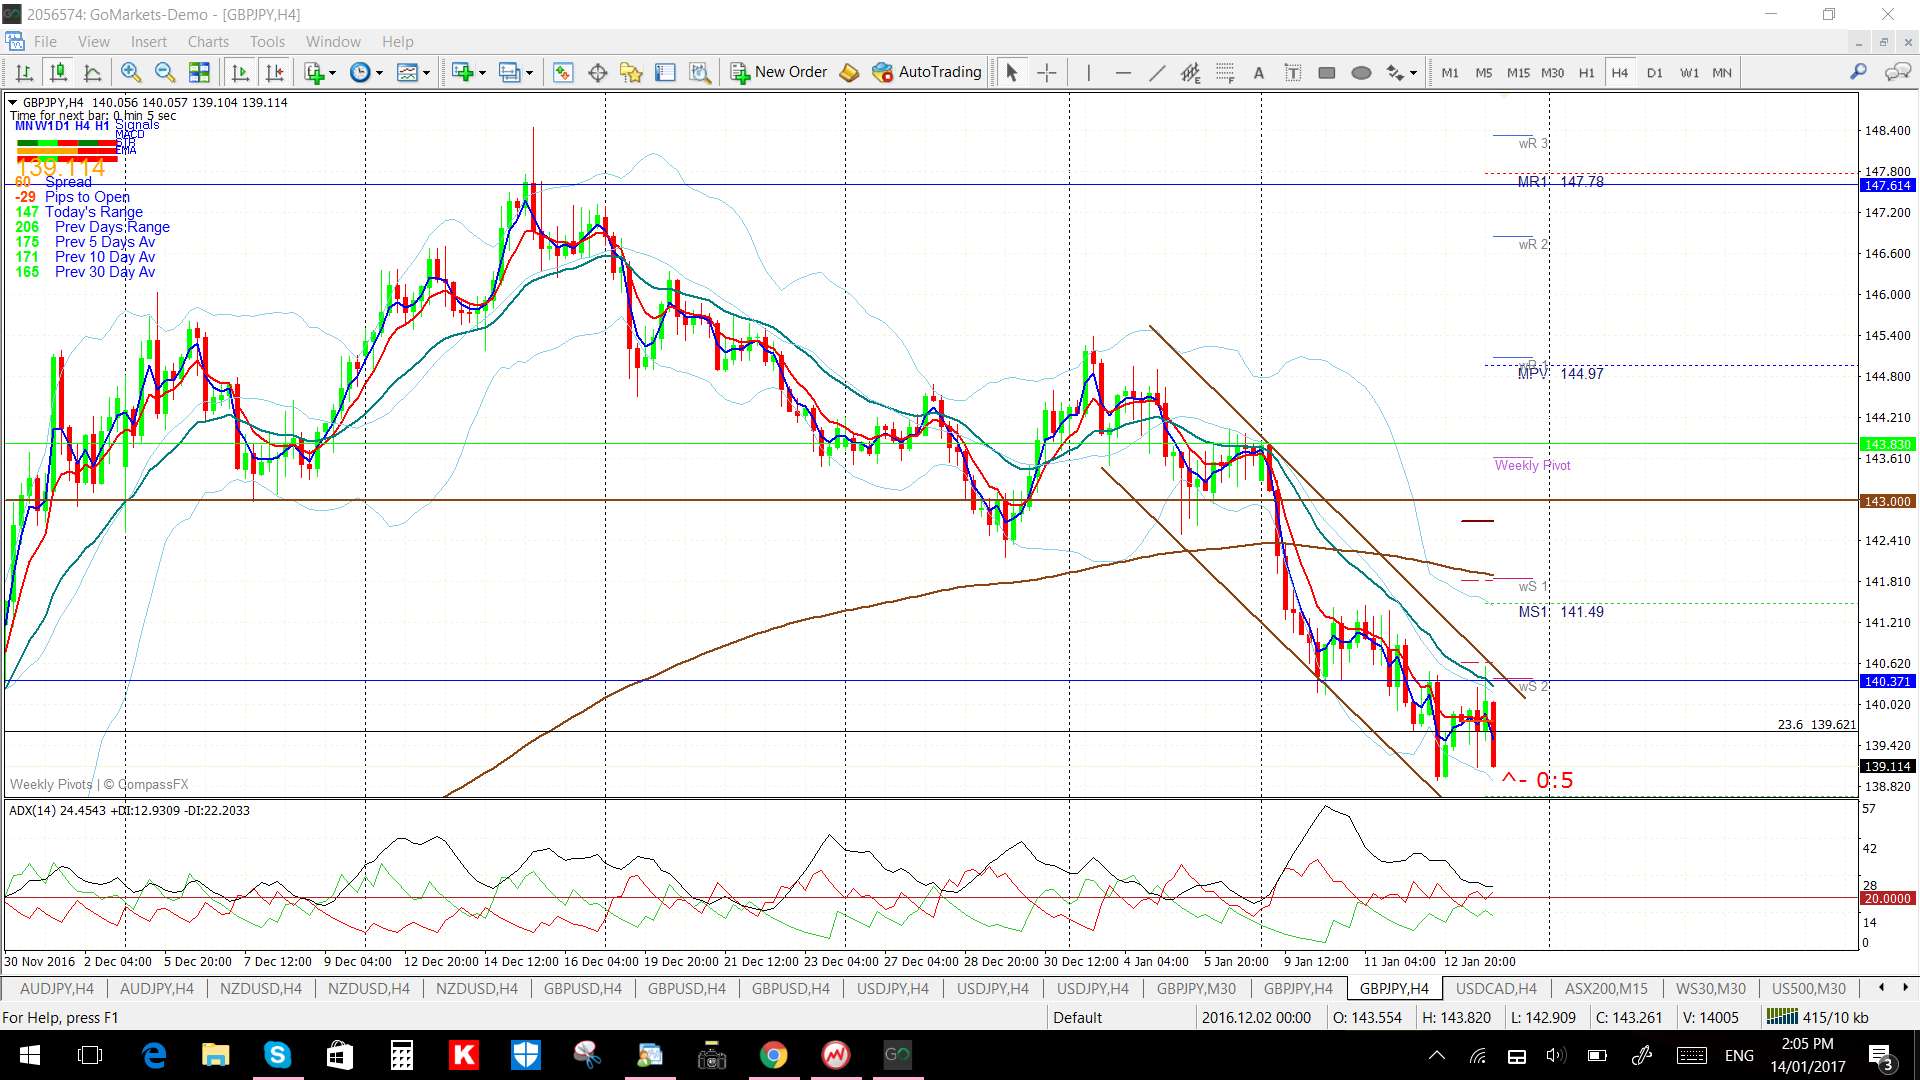
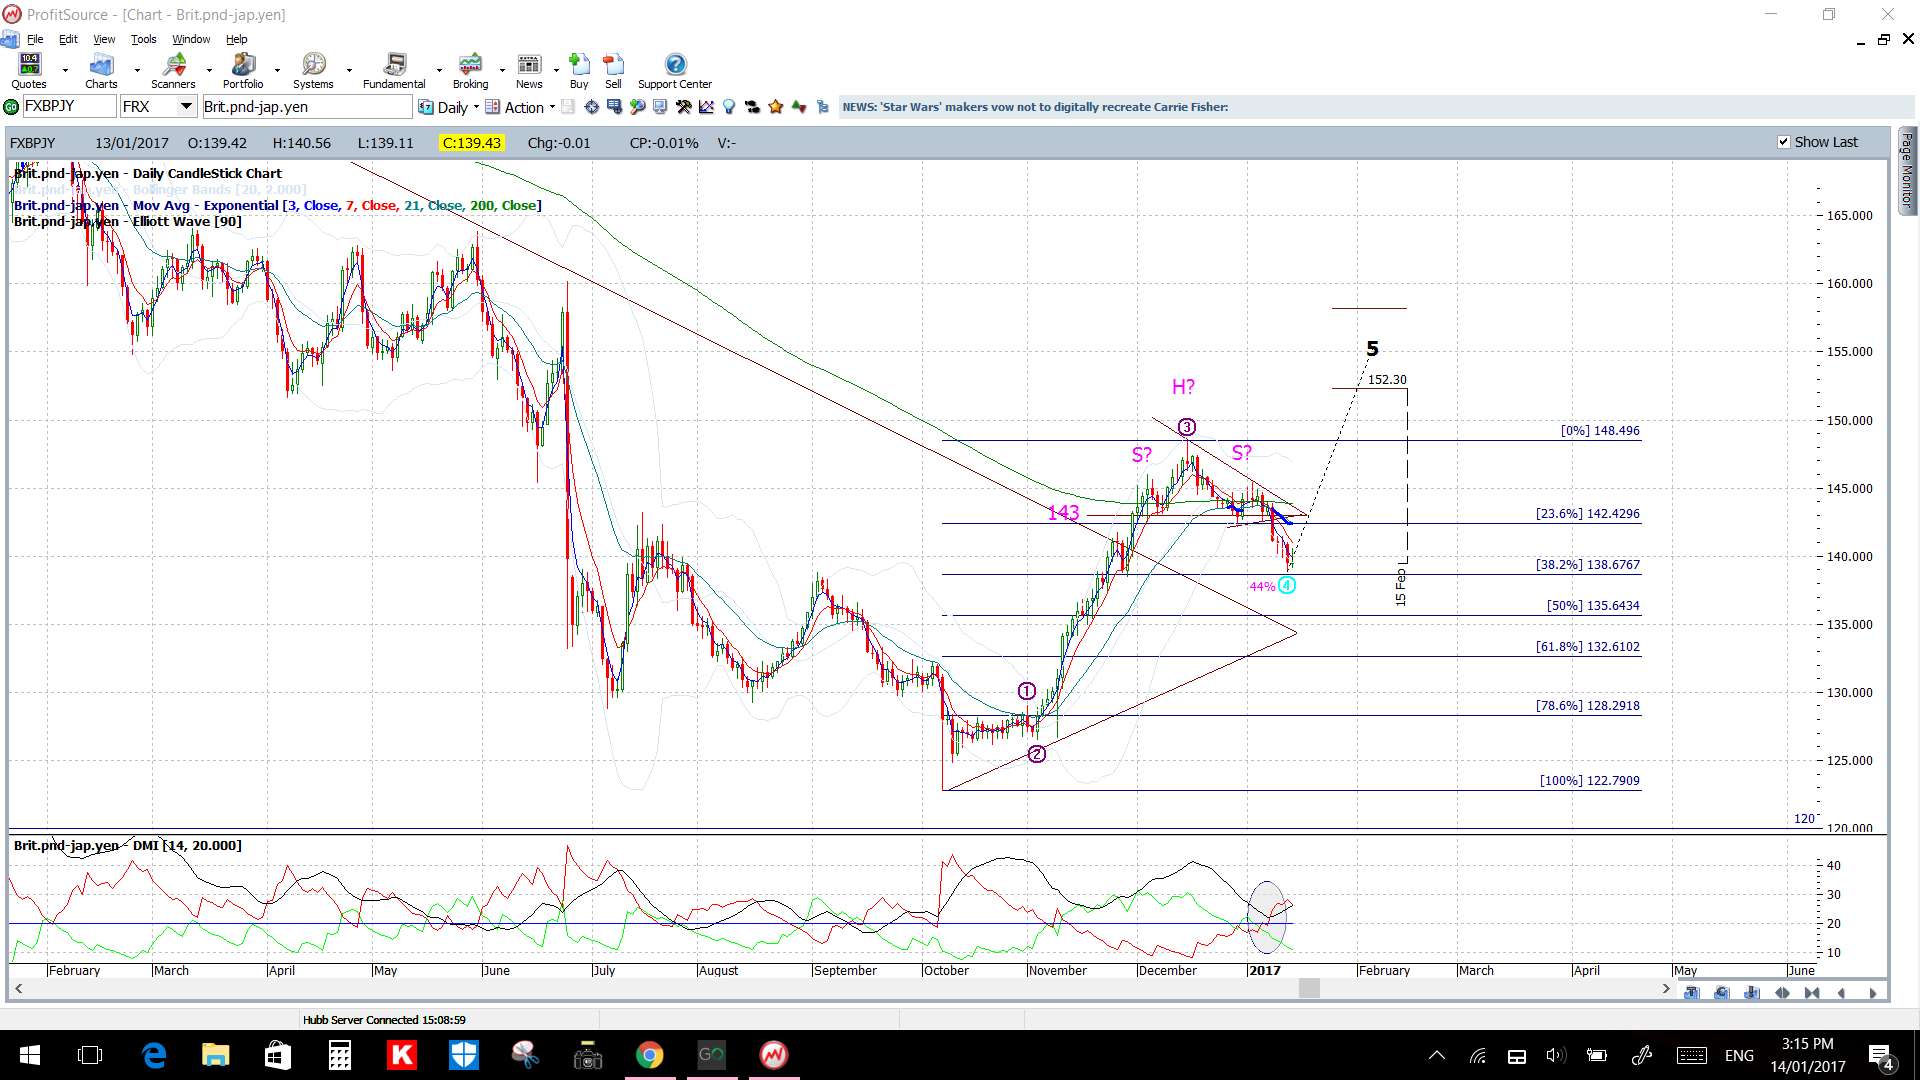
GBP/JPY: there are new trend lines on the 4hr chart here as well to watch for any make or break activity. The daily chart’s bearish H&S is still in play here for now though.
There is a fair bit GBP data to watch for this week with a BoE Gov Carney speech, CPI data and a PM Theresa May speech on Tuesday, Employment data on Wednesday and Retail Sales on Friday. There US data with US CPI, Weekly Unemployment data and a Yellen speech on Thursday and US Building Permits, US Philly Fed Manufacturing data and another Yellen speech on Friday.
USD/CAD: keep an eye on the 1.30 level for any make or break activity:
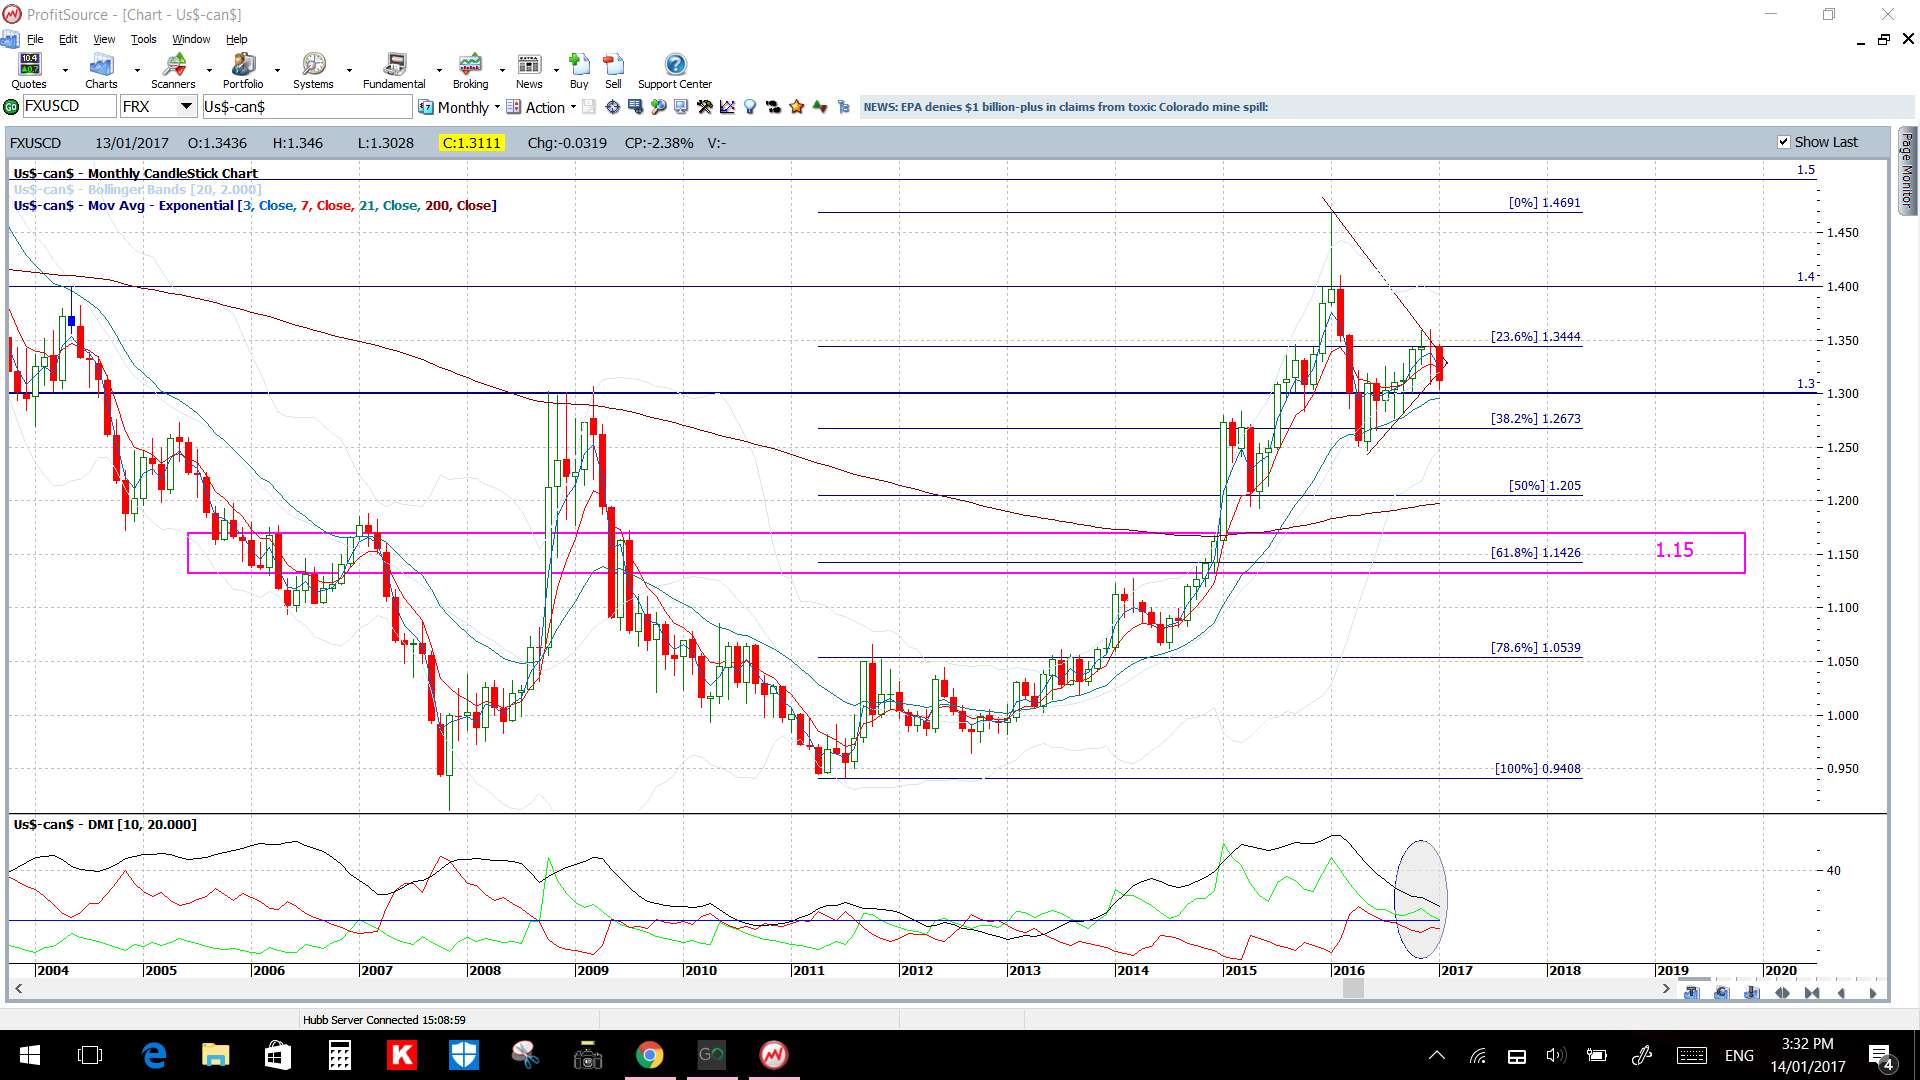
Watch to see where the monthly candle closes as this is currently suggesting a bearish triangle breakdown:
There is CAD Interest Rate data on Thursday and CPI on Friday to watch for as well as US data with US CPI, Weekly Unemployment data and a Yellen speech on Thursday and US Building Permits, US Philly Fed Manufacturing data and another Yellen speech on Friday.
USD/CNH weekly: there has been one trend line break here so watch the next trend line for any test.
There is CNY data on Friday with GDP and Industrial Production as well as US data with US CPI, Weekly Unemployment data and a Yellen speech on Thursday and US Building Permits, US Philly Fed Manufacturing data and another Yellen speech on Friday.

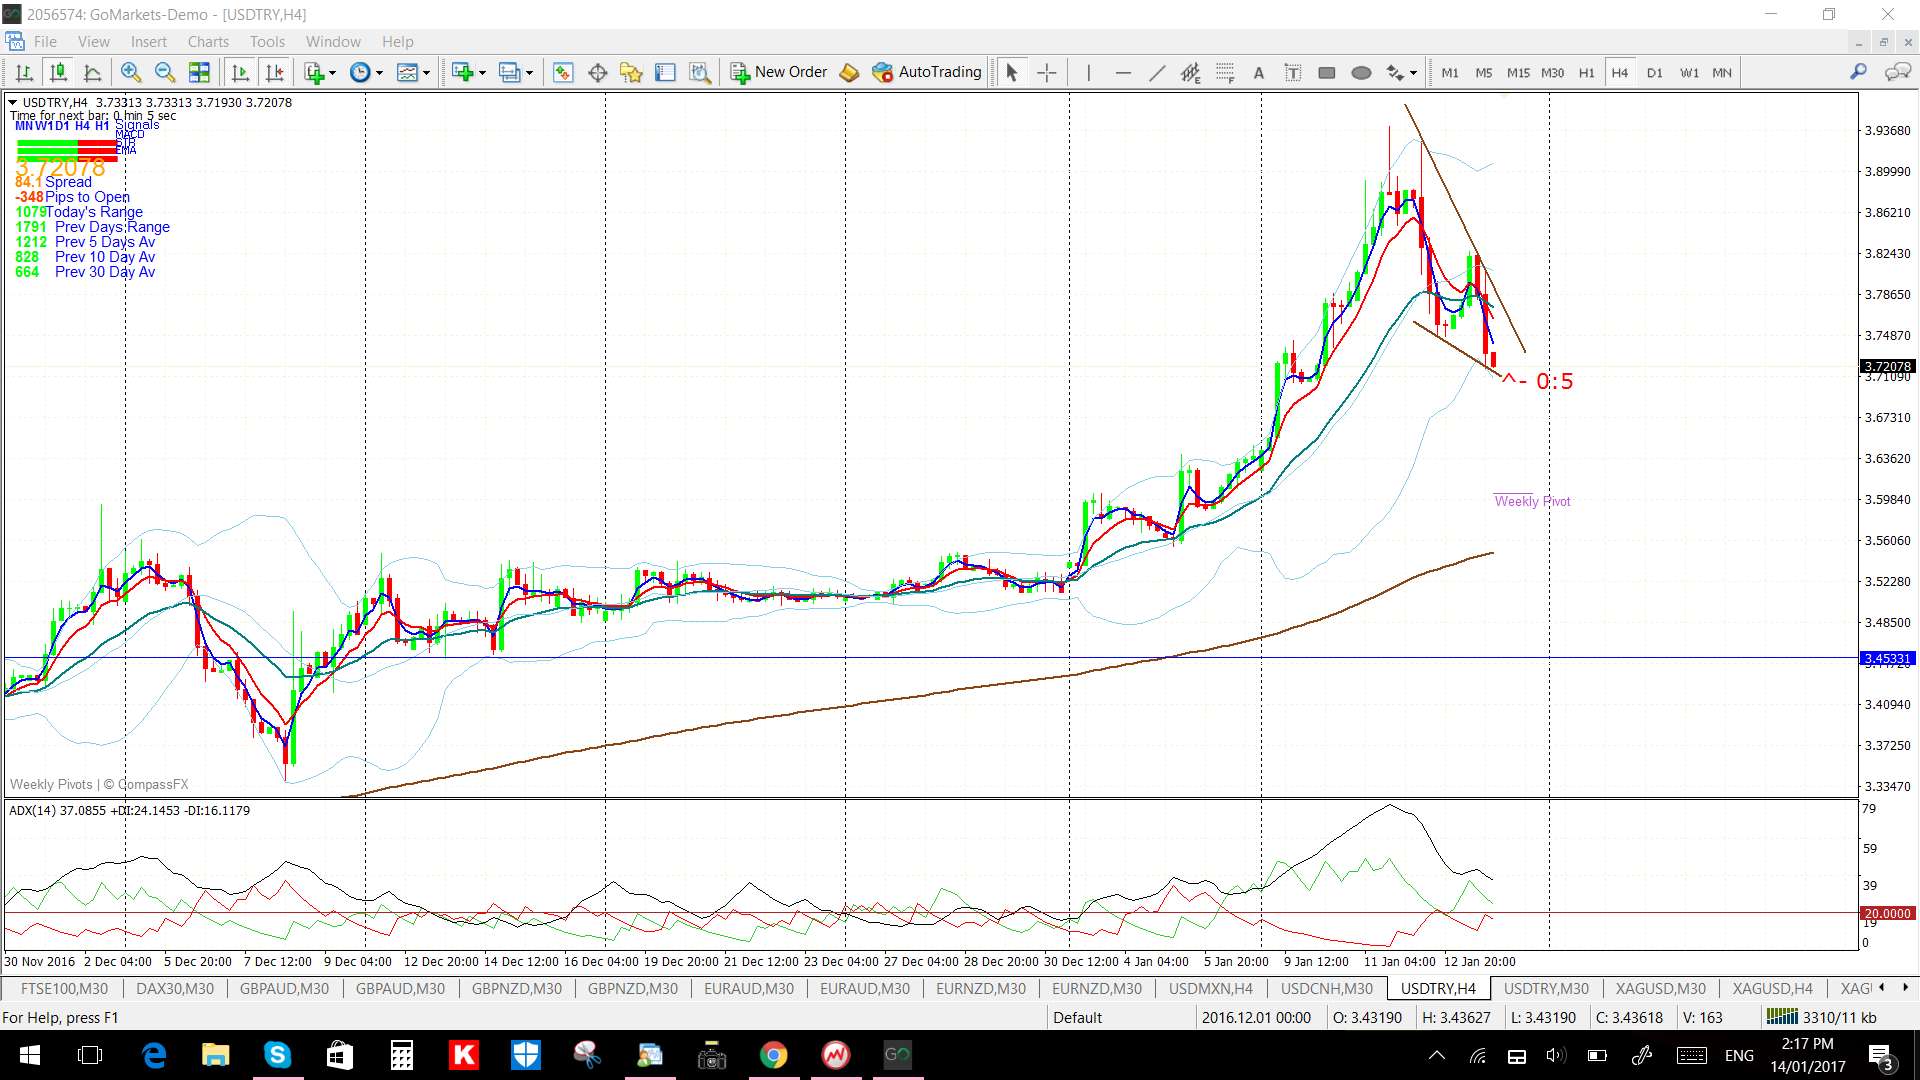
USD/TRY: The Turkish Lira has been under pressure for some time and has been making headlines during the week again. Price action pulled back at the end of last week and this has set up a 4hr chart Flag pattern so watch these trend lines for any momentum-based breakout:

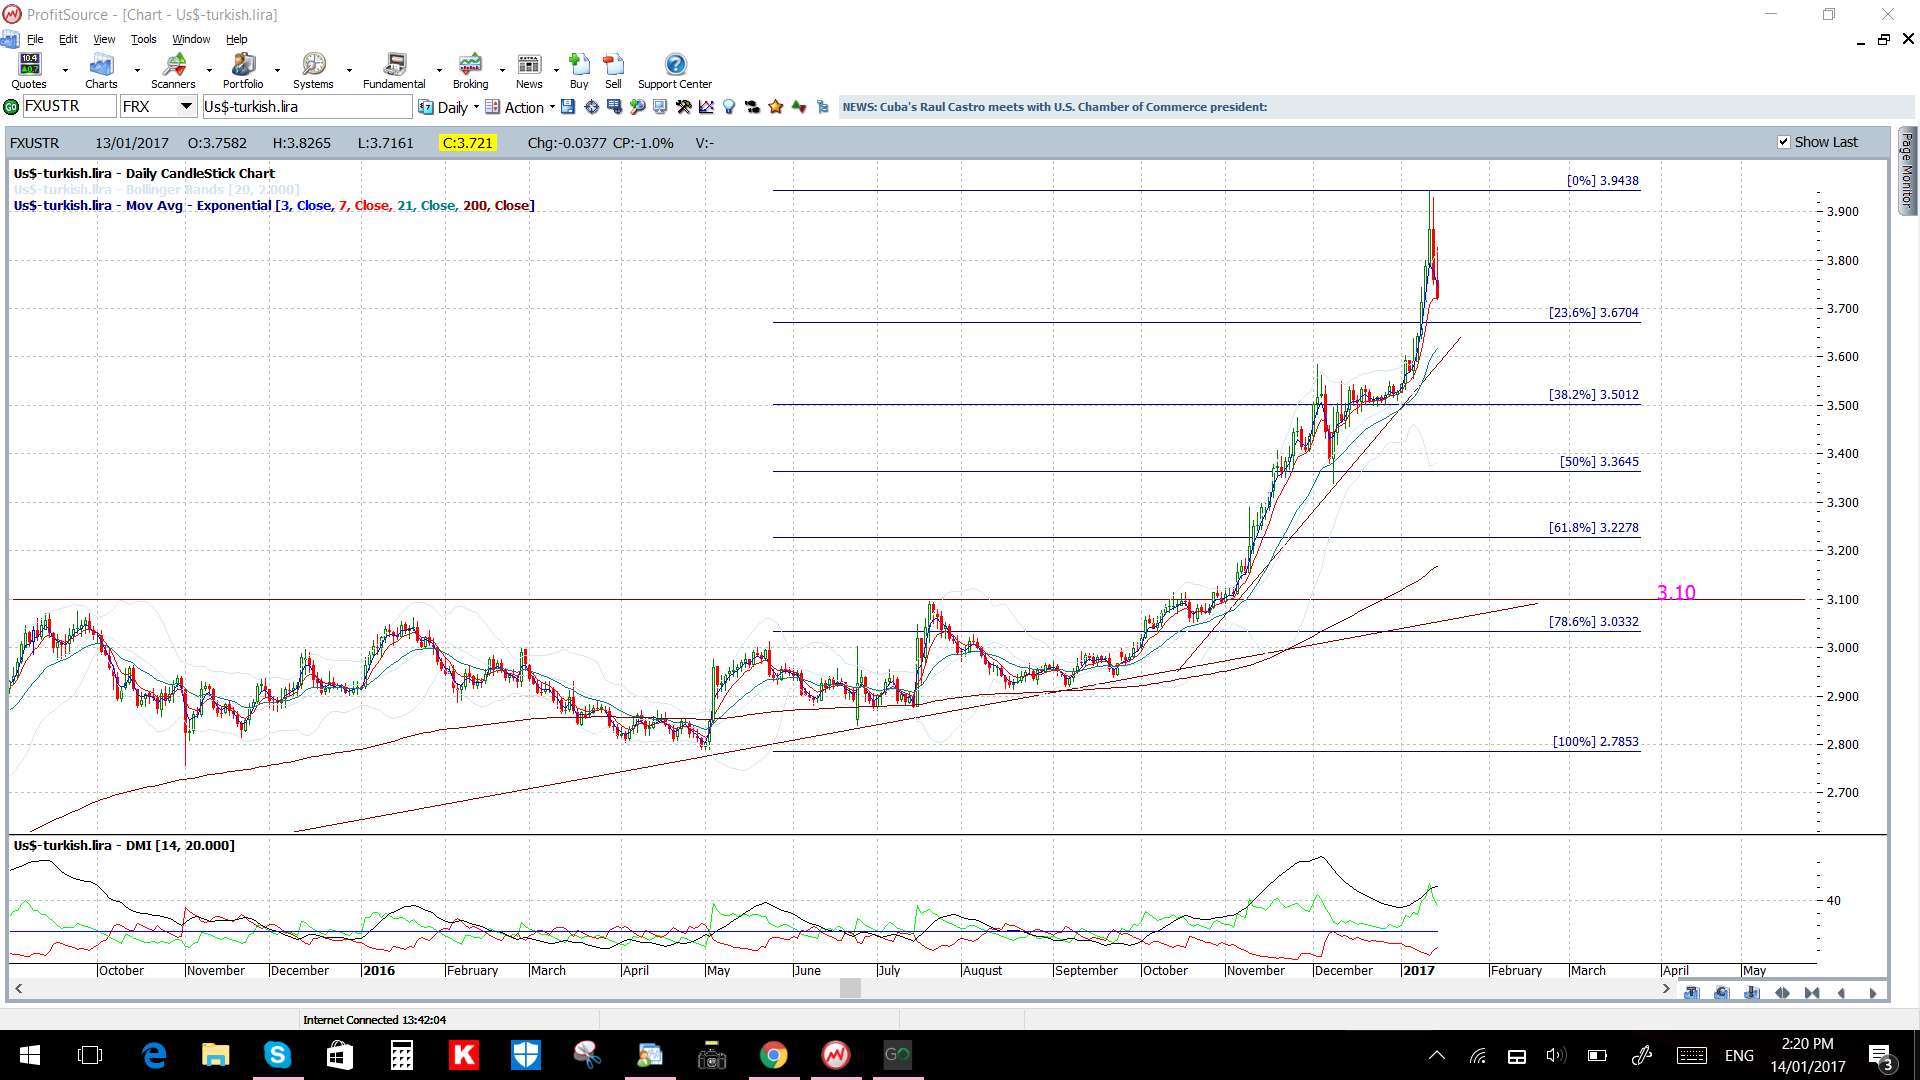
This pair will be impacted by Turkish news as well as US data from US CPI, Weekly Unemployment data and a Yellen speech on Thursday and US Building Permits, US Philly Fed Manufacturing data and another Yellen speech on Friday.
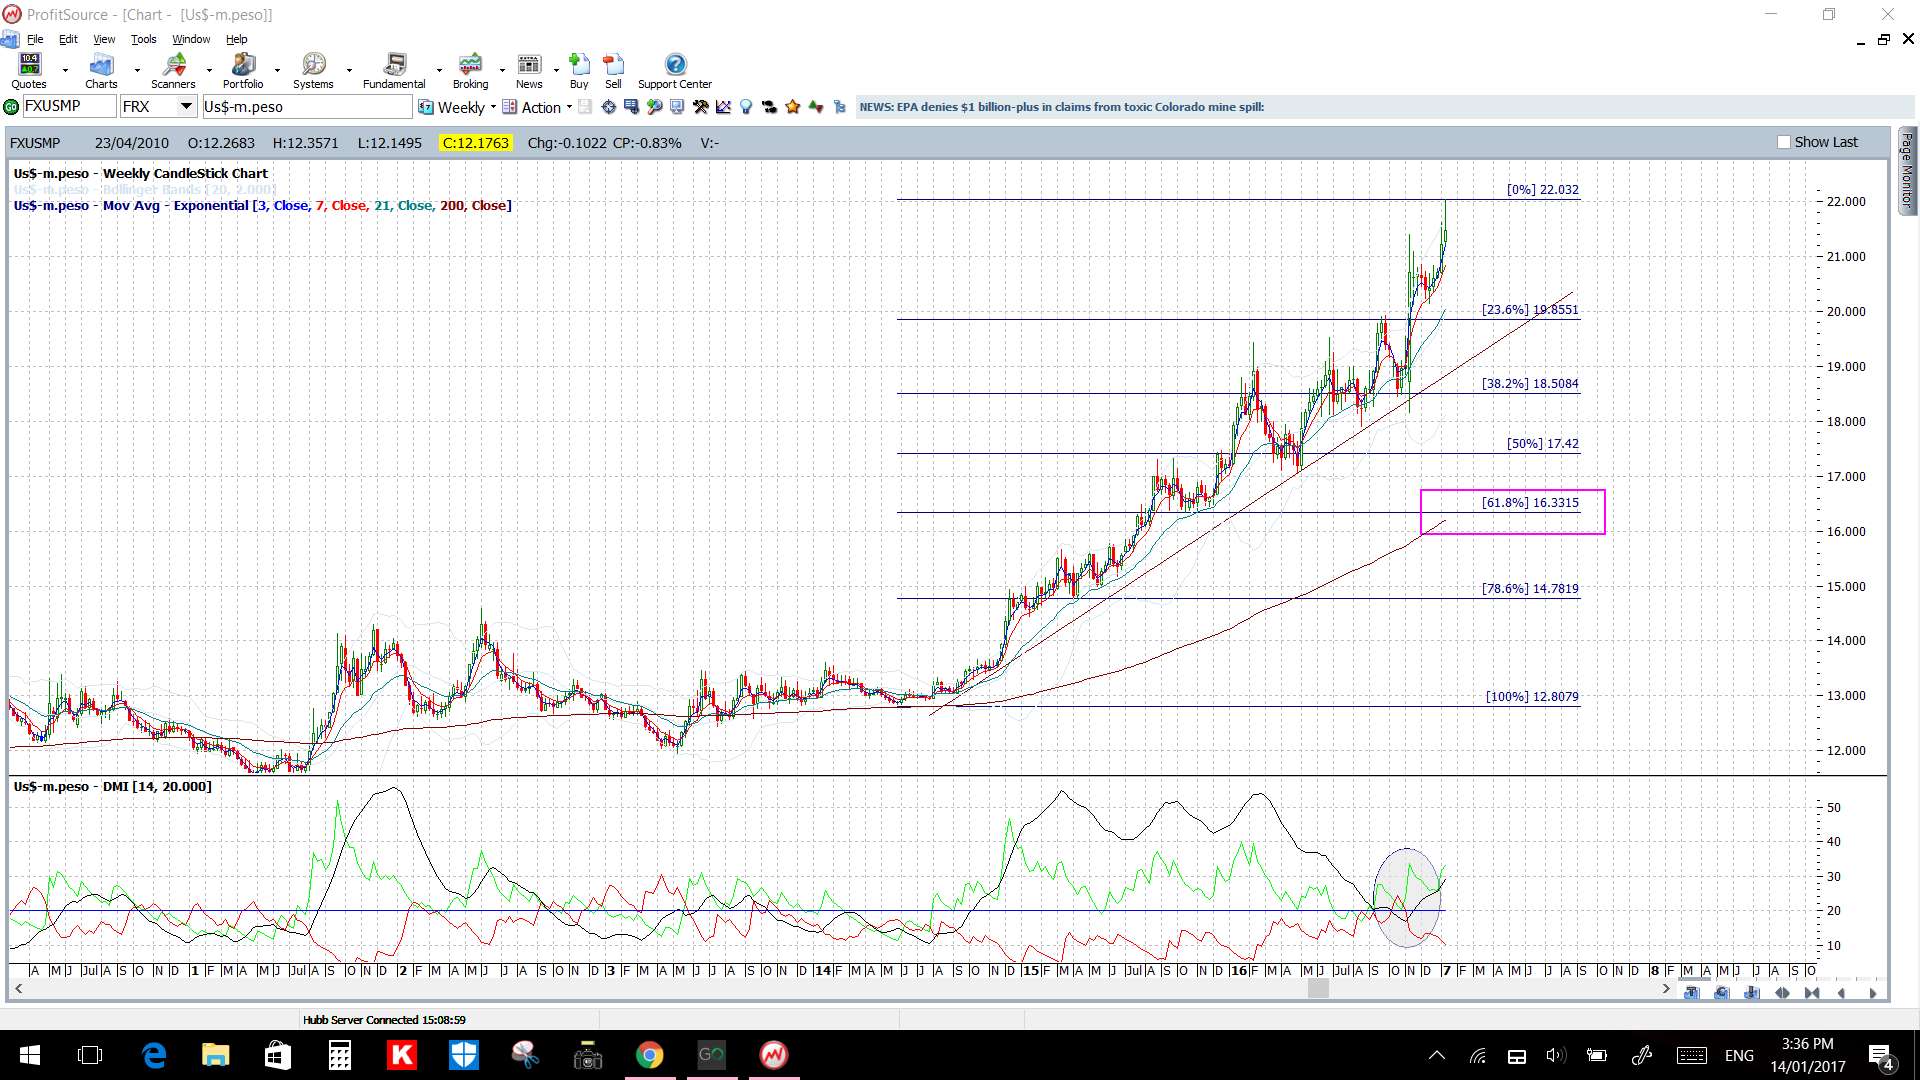
USD/MXN weekly: no pullback just yet.
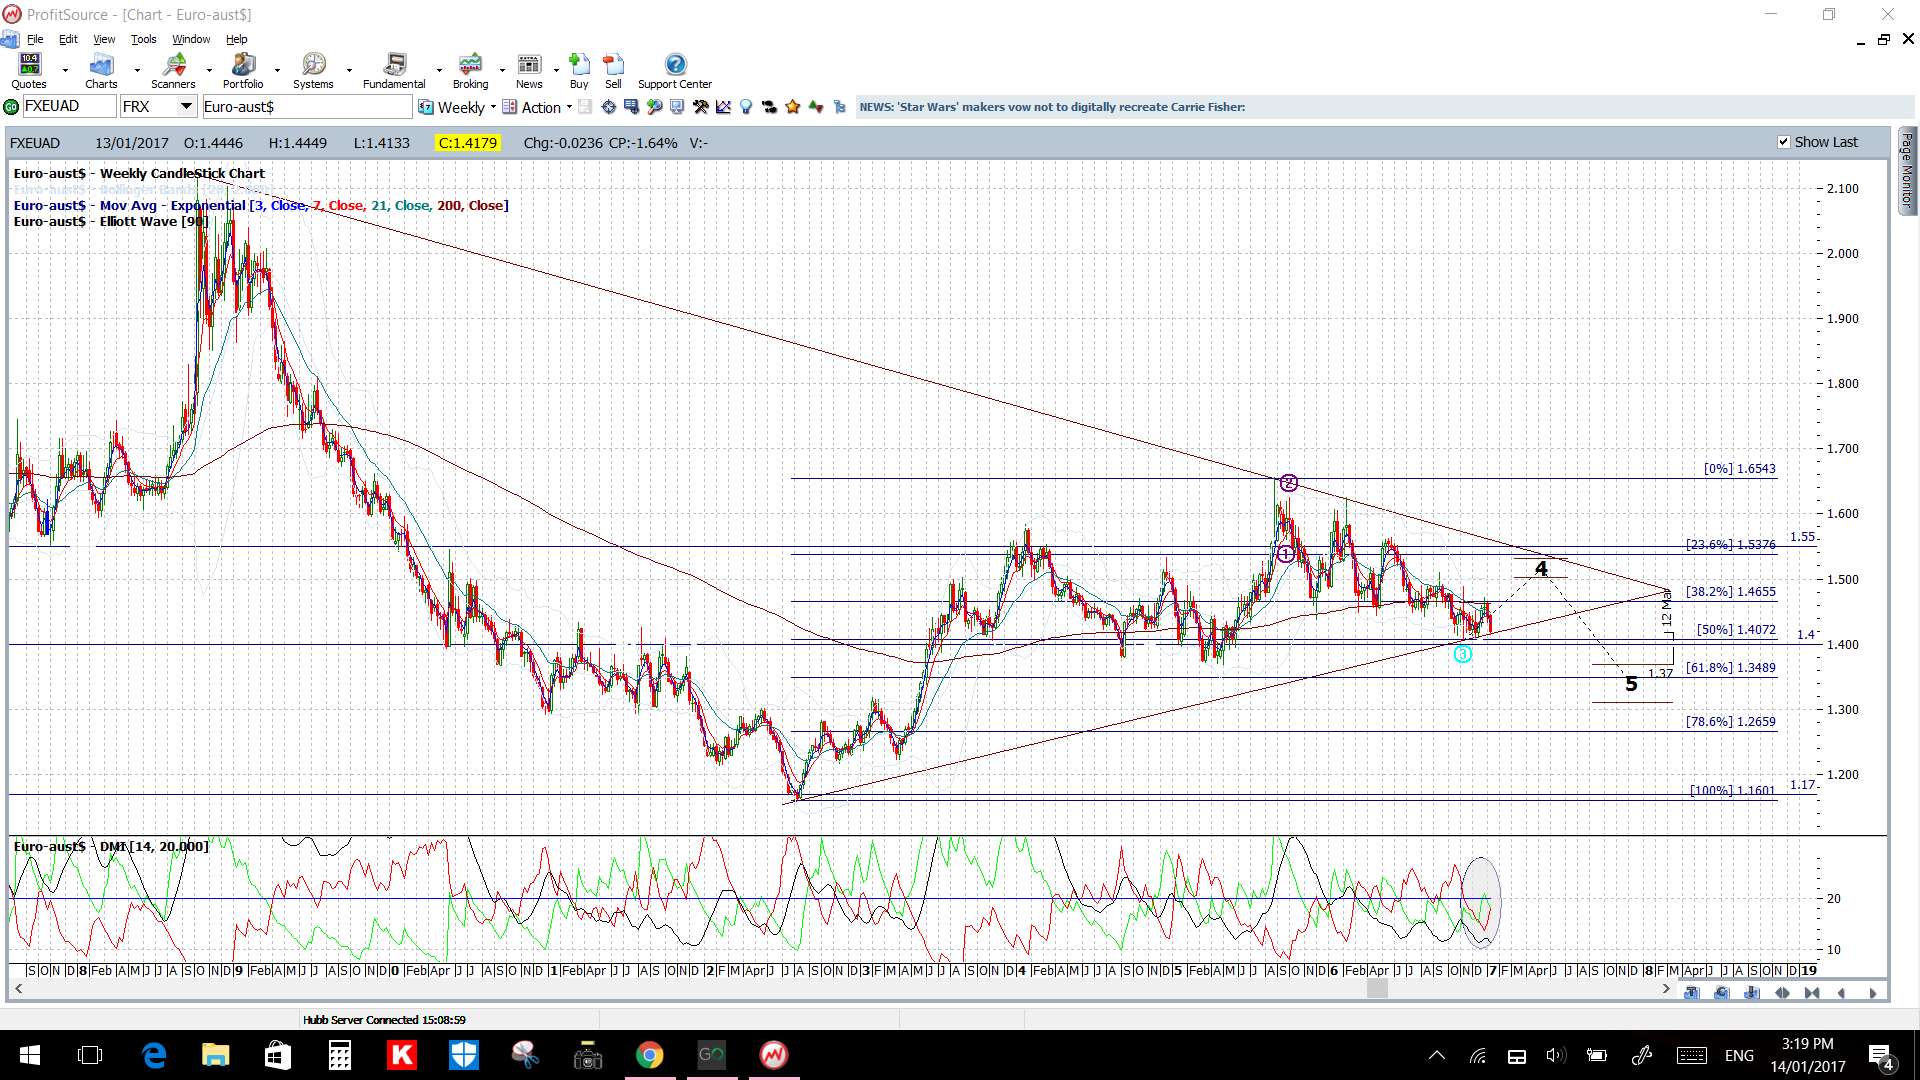
EUR/AUD weekly: I’m keeping an eye on the revised weekly chart trend lines here for any make or break activity:
The post FX shifting back to ‘risk on’? appeared first on Trade Charting.
The post FX shifting back to ‘risk on’? appeared first on www.forextell.com.