The fear of rising US interest rates fueled a further sell off across the US stock markets with the contagion reaching other stock markets as well. This move has fed into FX, however, more so by way of Yen rather than US$ strength and there was some GBP weakness as well following weaker than expected GBP Services PMI data. All of this helped to triggered some great trend line breakout trades and new TC signals but, as per usual, the best signals were to be harvested during the US session.
Data: Watch today with AUD Retail Sales, Trade Balance and the RBA rate update. There is second tier EUR Retail PMI and NZD GDT Price Index data as well.
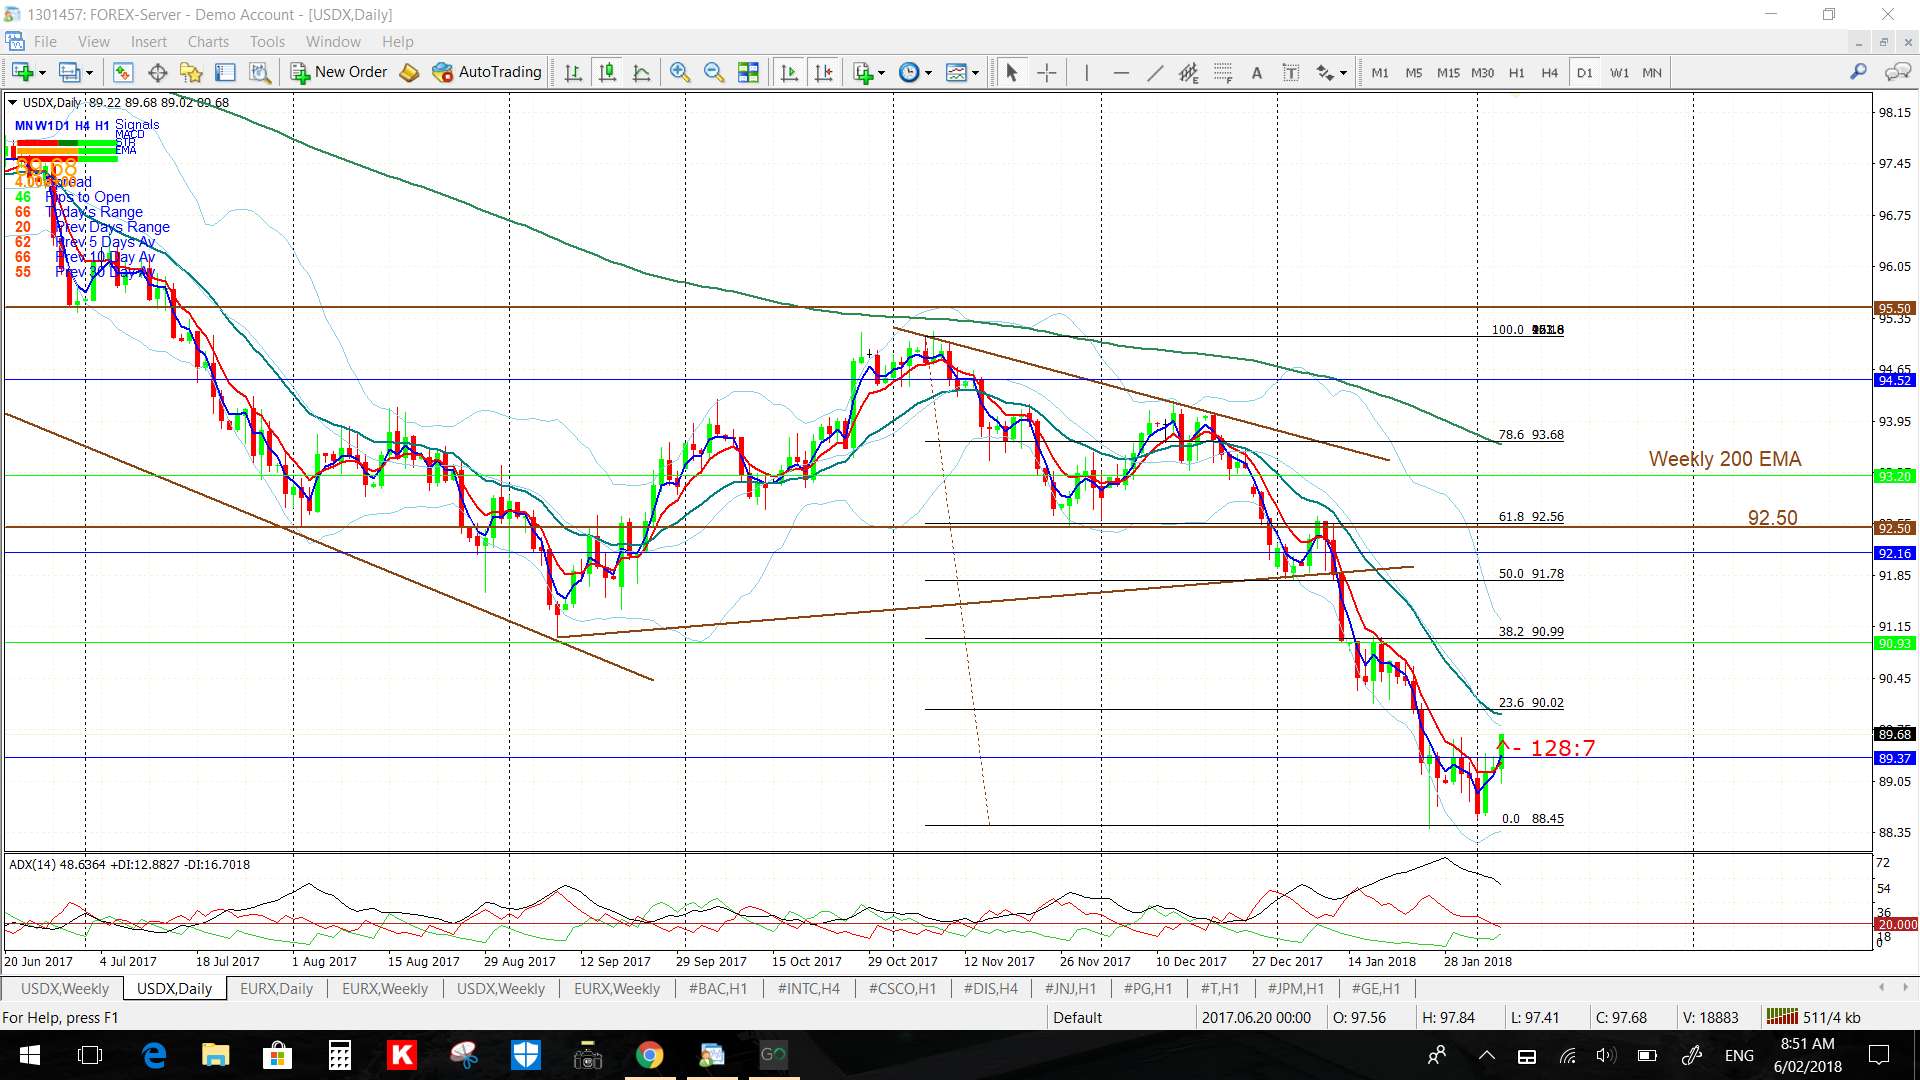
USDX daily: only a little higher for now but watch for any test of previous S/R near the 61.8% fib at 92.50:
FX Indices: the FX Indices are no longer aligned.
Trend line breakouts and TC signals:
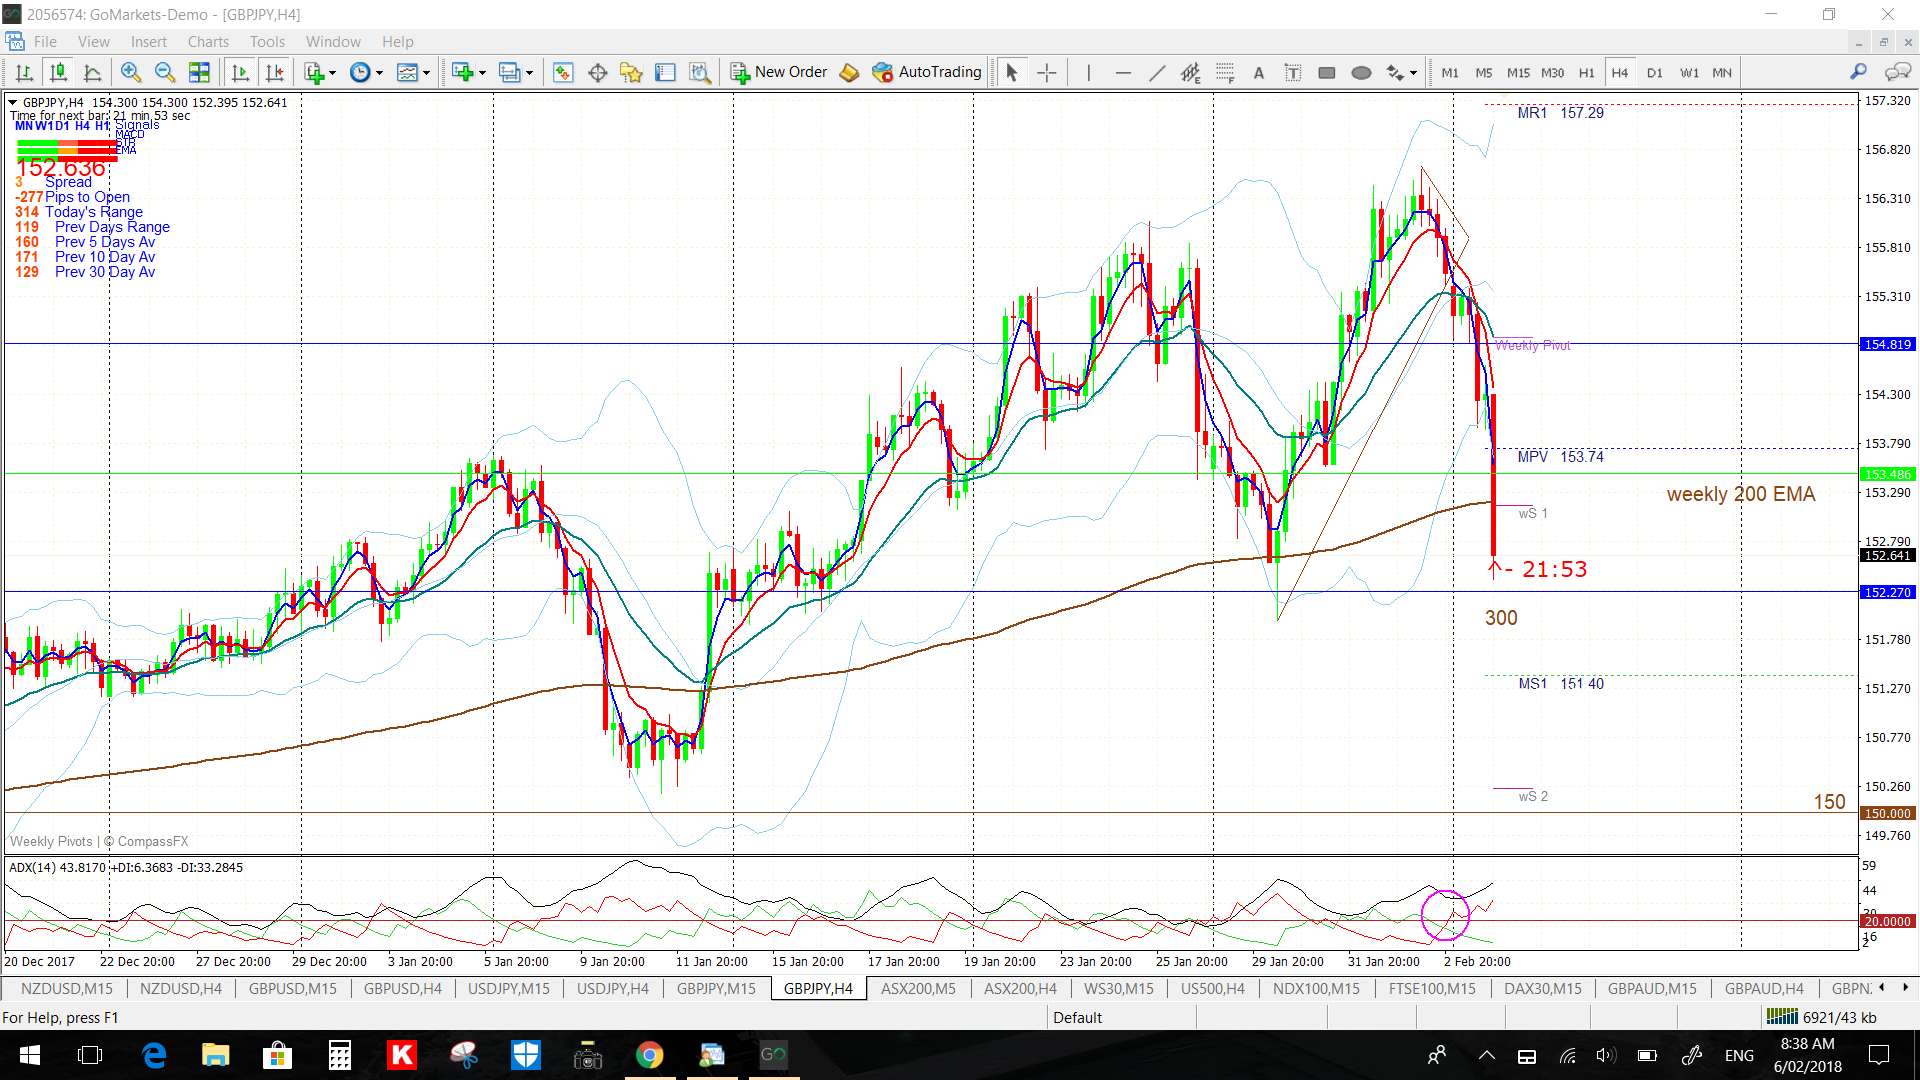
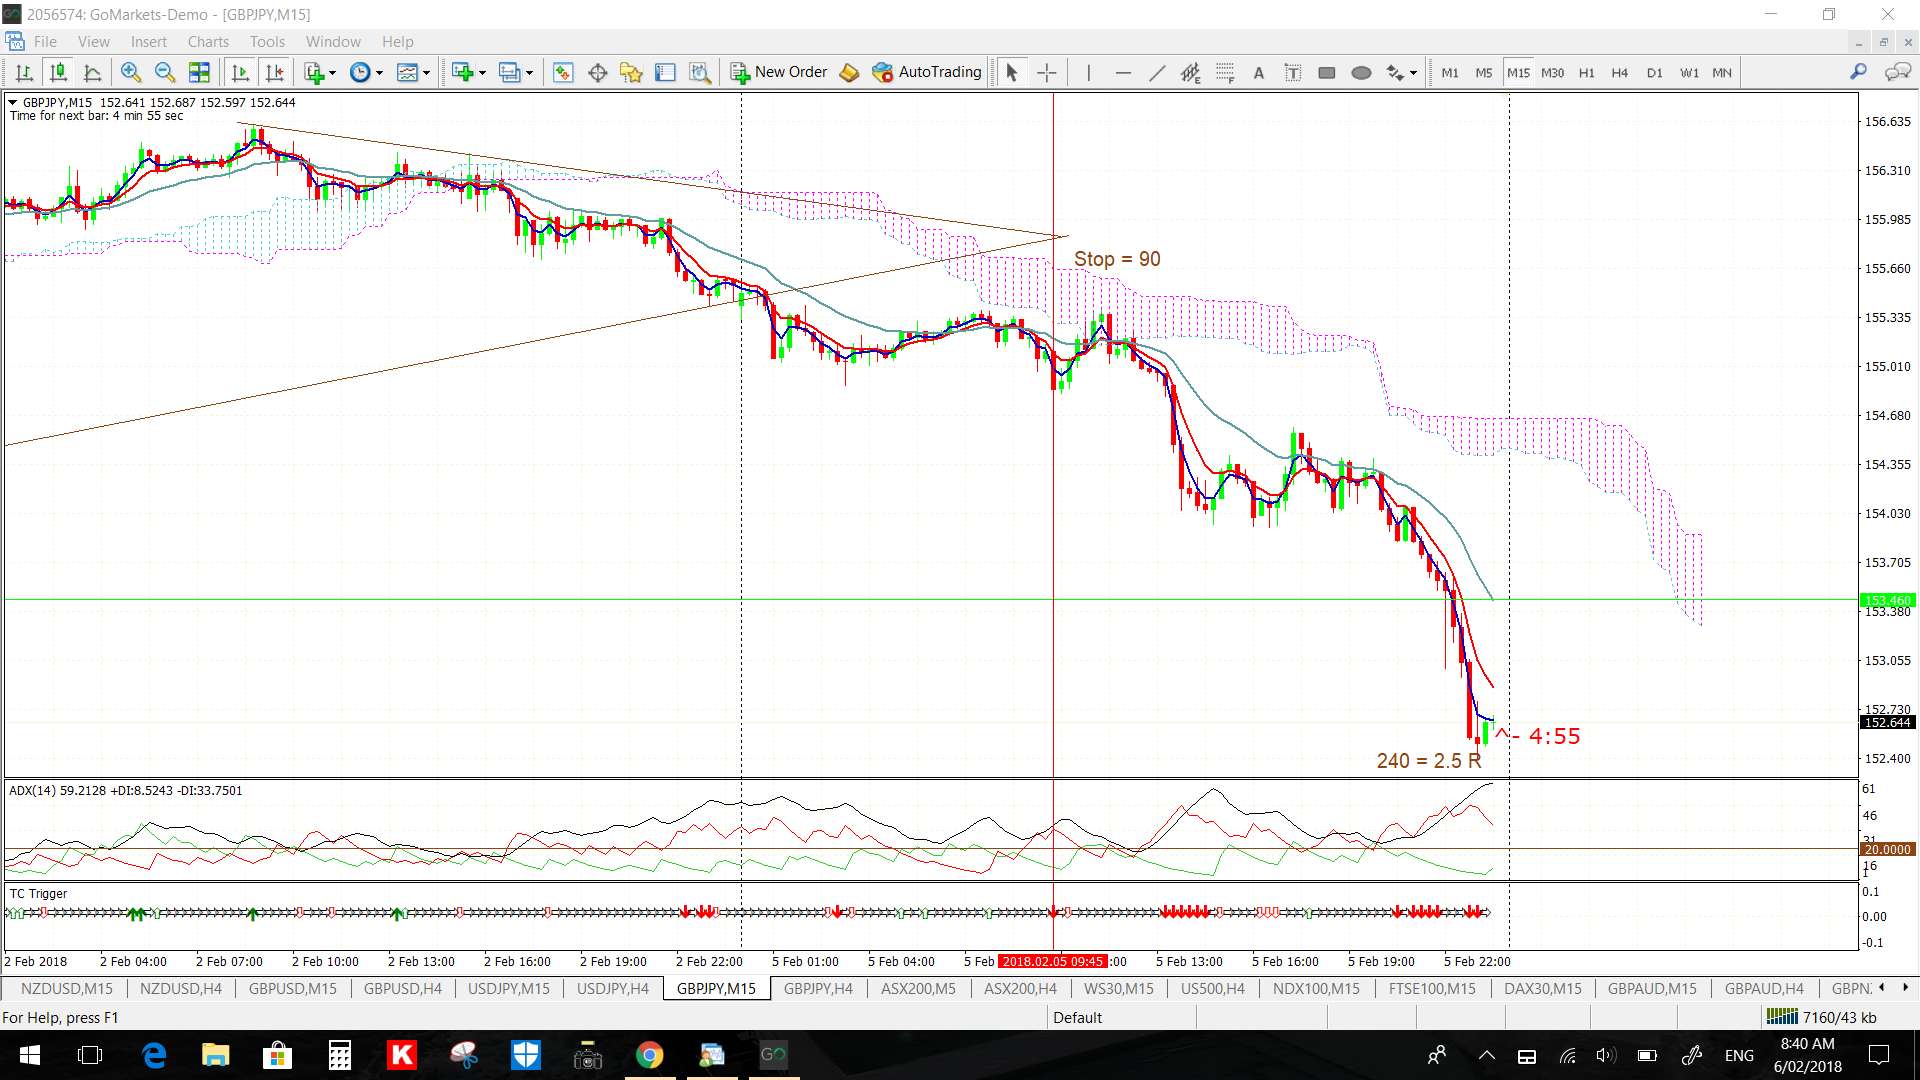
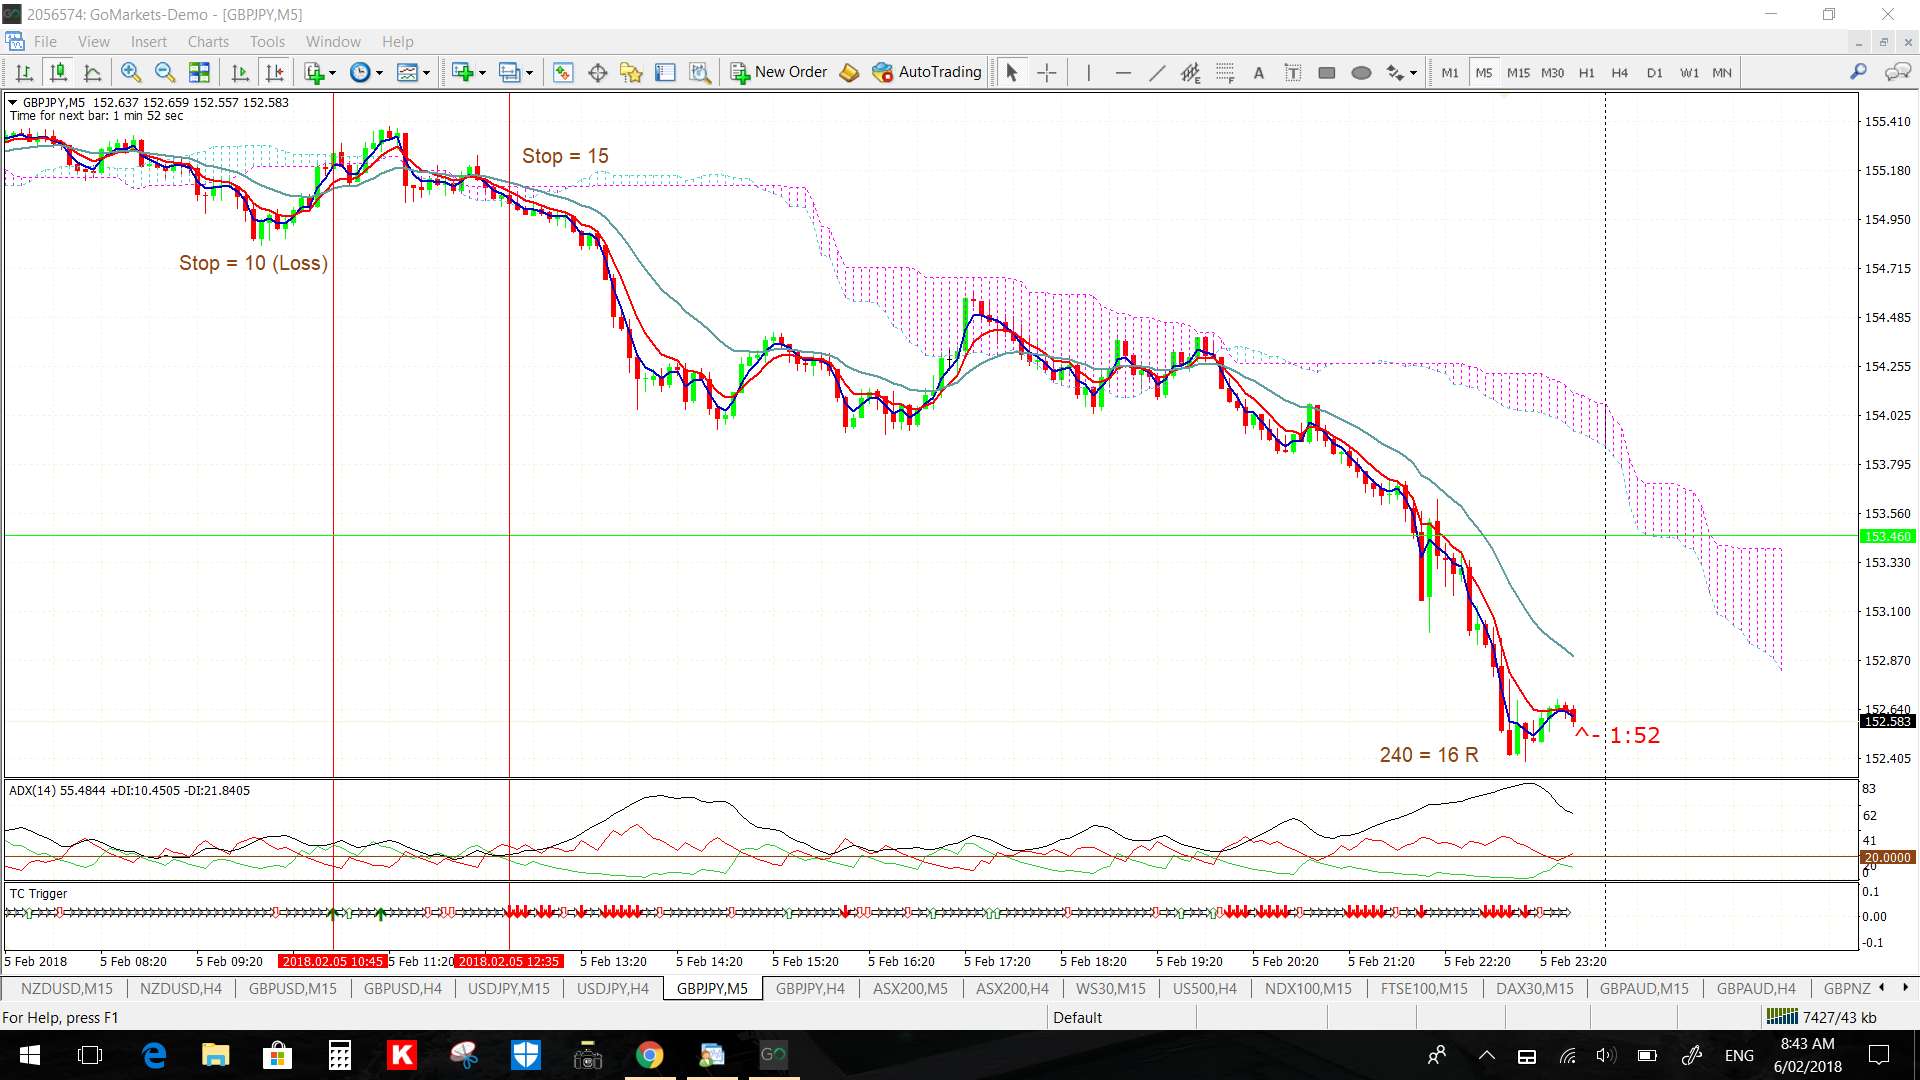
GBP/JPY: This got the double whammy with both GBP weakness and JPY strength! There was a great trend line breakout trade with TC signals off both the 15 and 5 min charts:
GBP/JPY 4hr:
GBP/JPY 15 min: this TC signal worked but needed too large a Stop for my liking:
GBP/JPY 5 min: dropping down to the 5 min chart gave a smaller initial Risk which made for much better profit margin and a 16 R trade result!
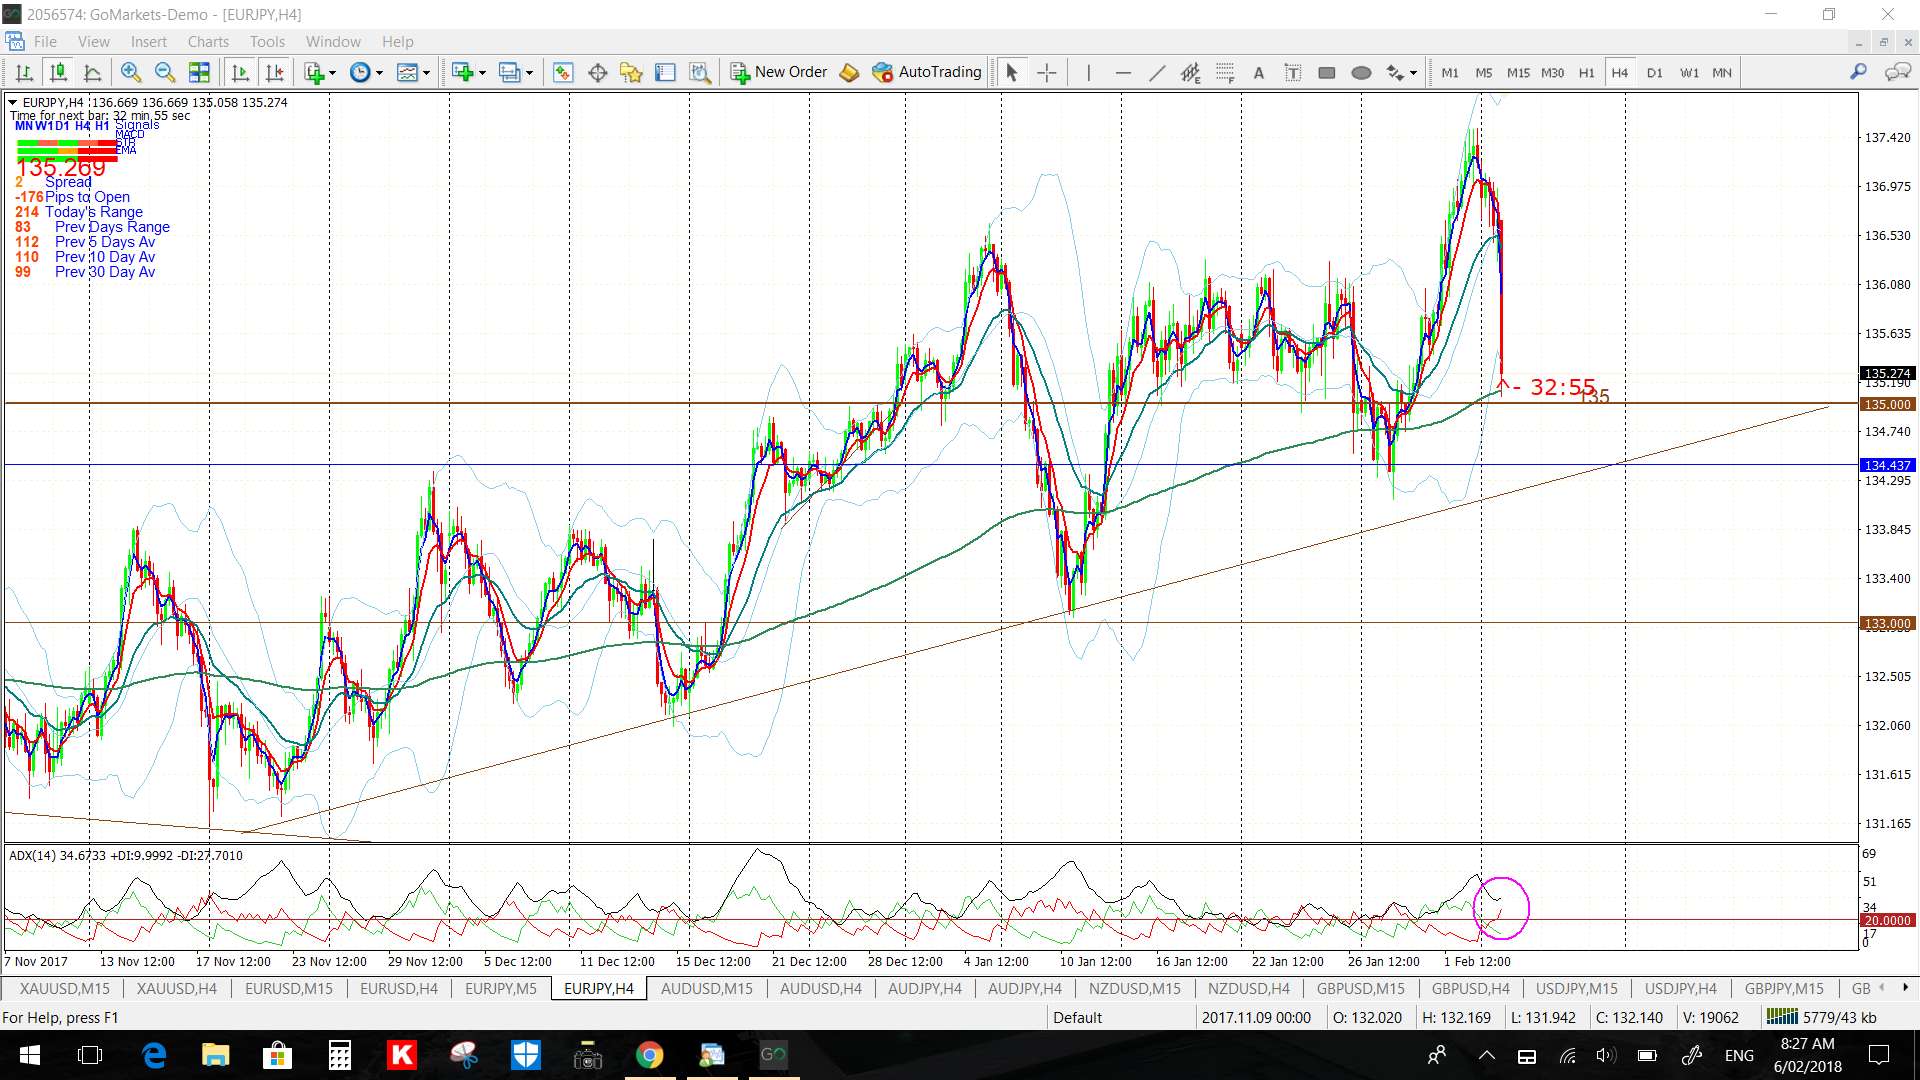
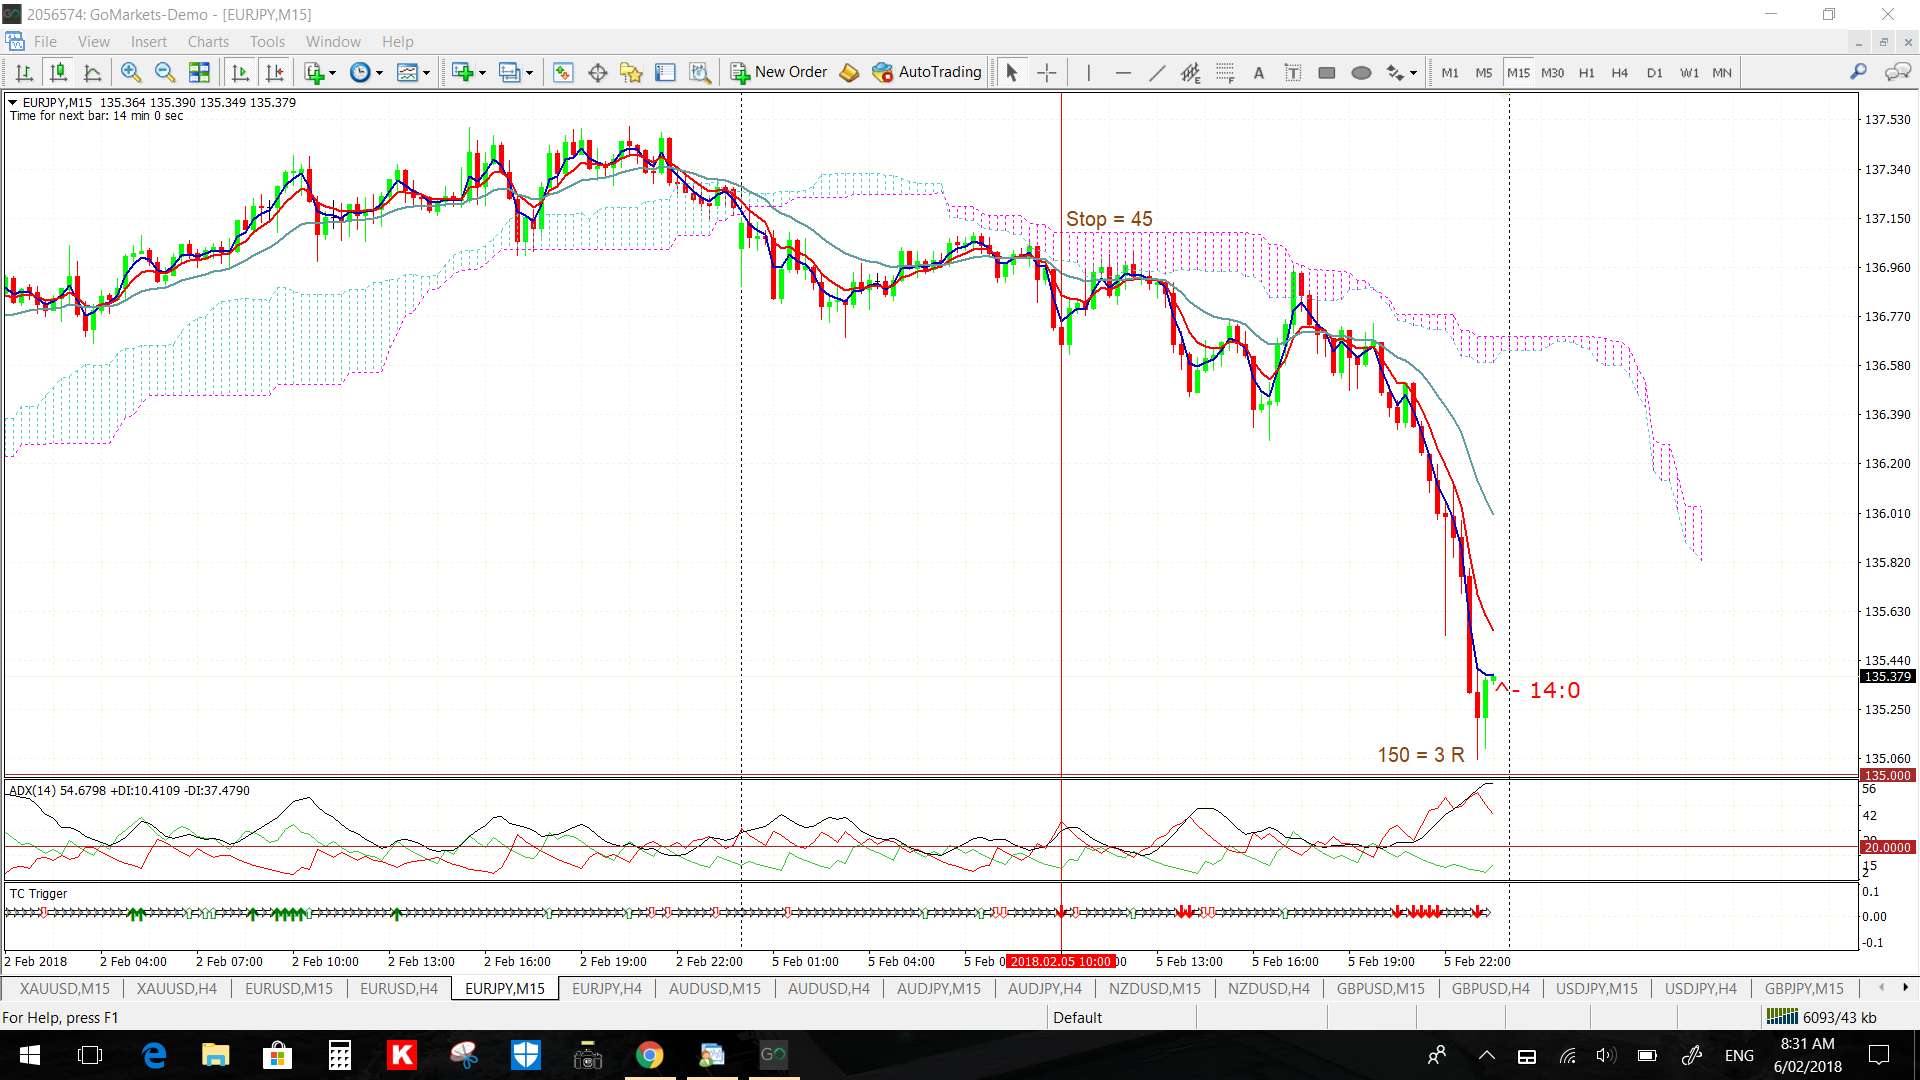
EUR/JPY: no trend line breakout but an OK TC signal for 3 R:
EUR/JPY 4hr: watch the 135 S/R level:
EUR/JPY 15 min: the first TC signal here was a good one for 3 R:
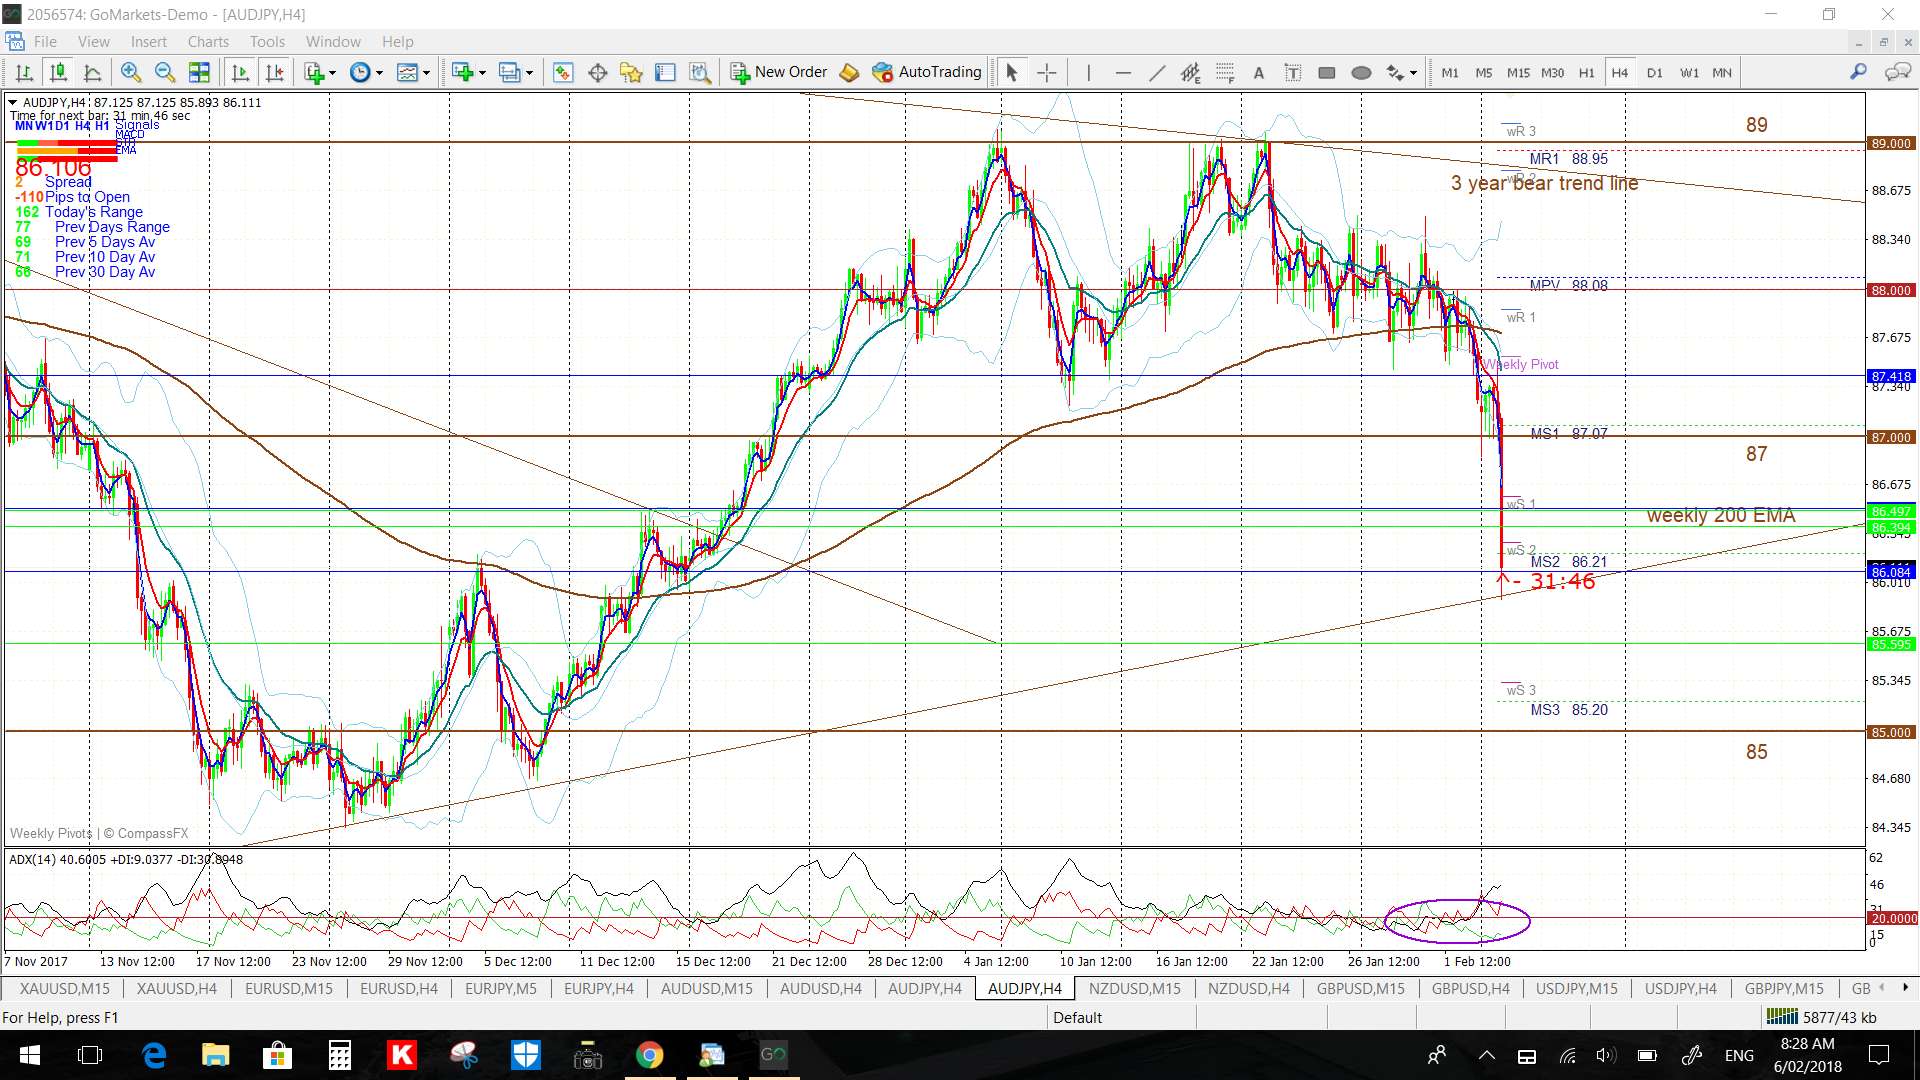
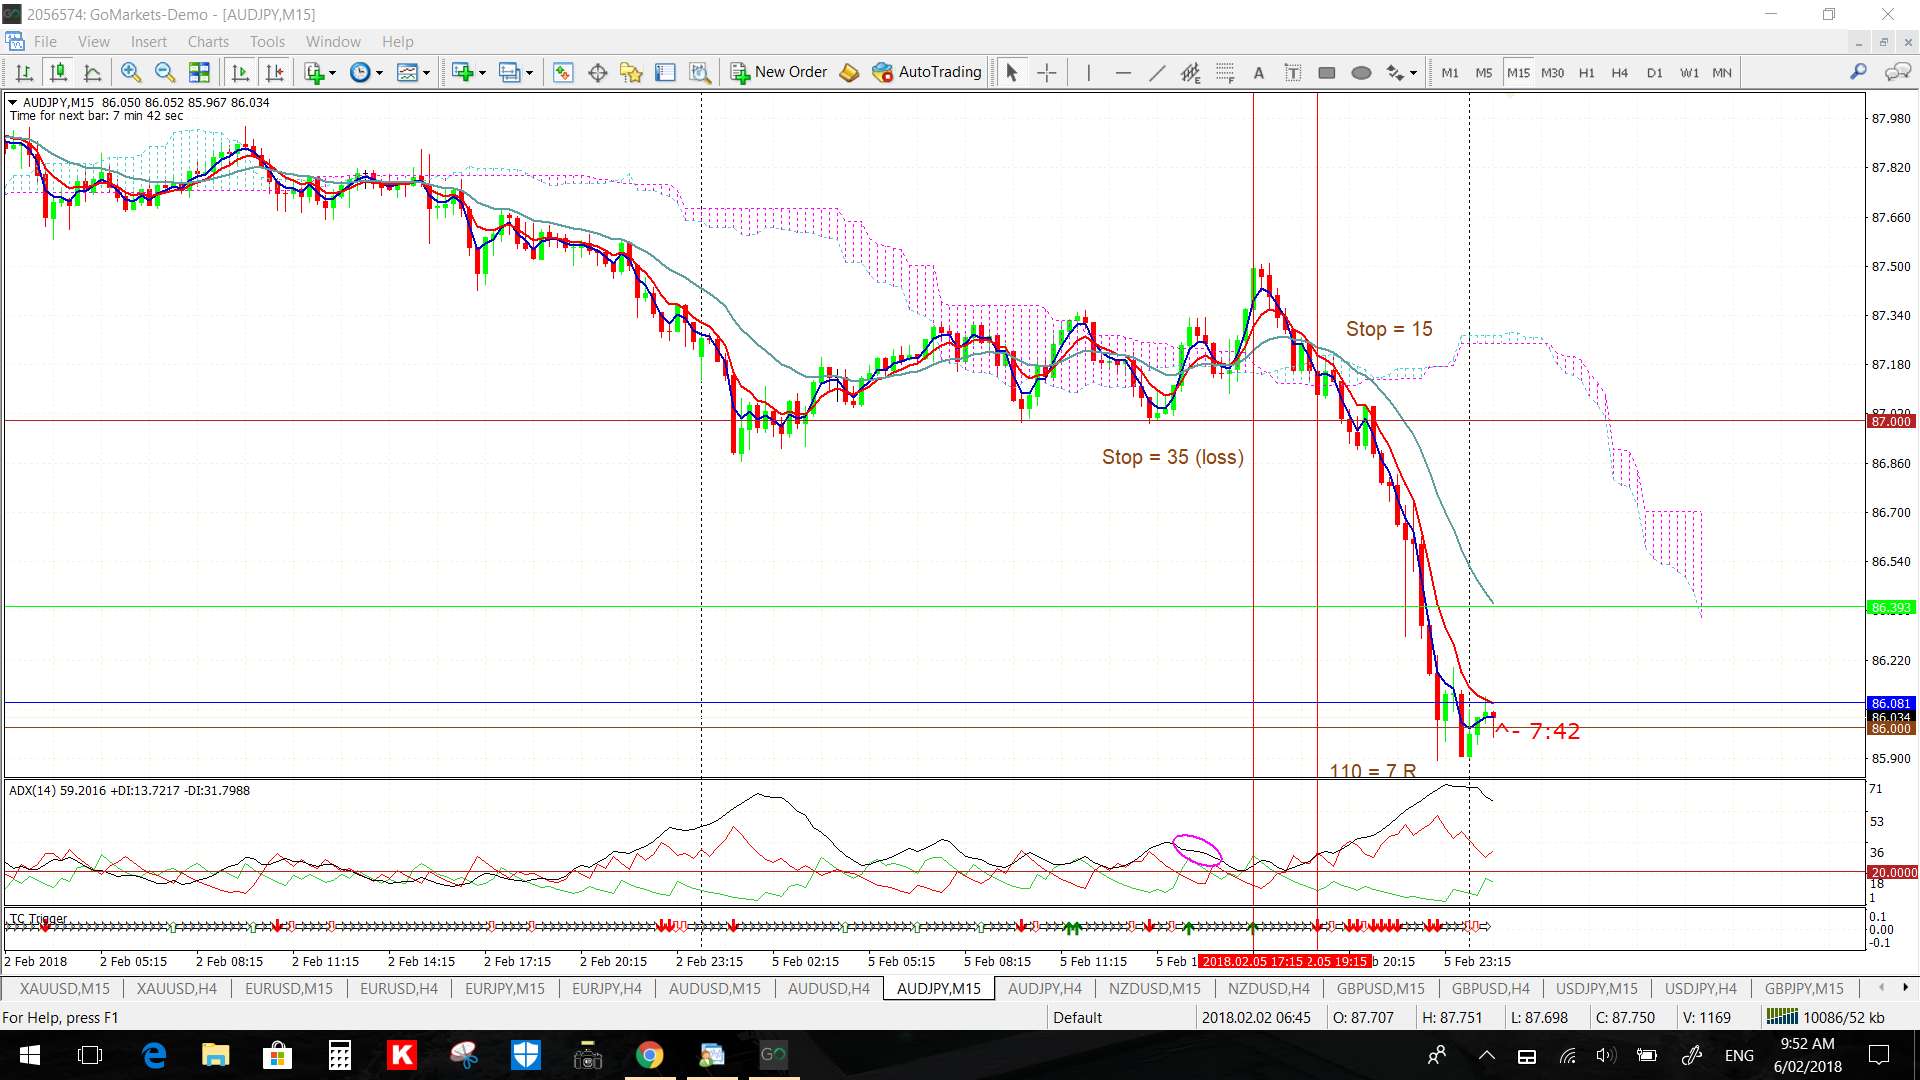
AUD/JPY: Yen strength helped trigger a 15 min TC signal here:
AUD/JPY 4hr: watch the support trend line here, especially with all of the scheduled AUD data:
AUD/JPY 15 min: I could not imagine thinking any LONGs would have worked here but there was a failed LONG signal. However, a SHORT here after the break below 87 would have worked here:
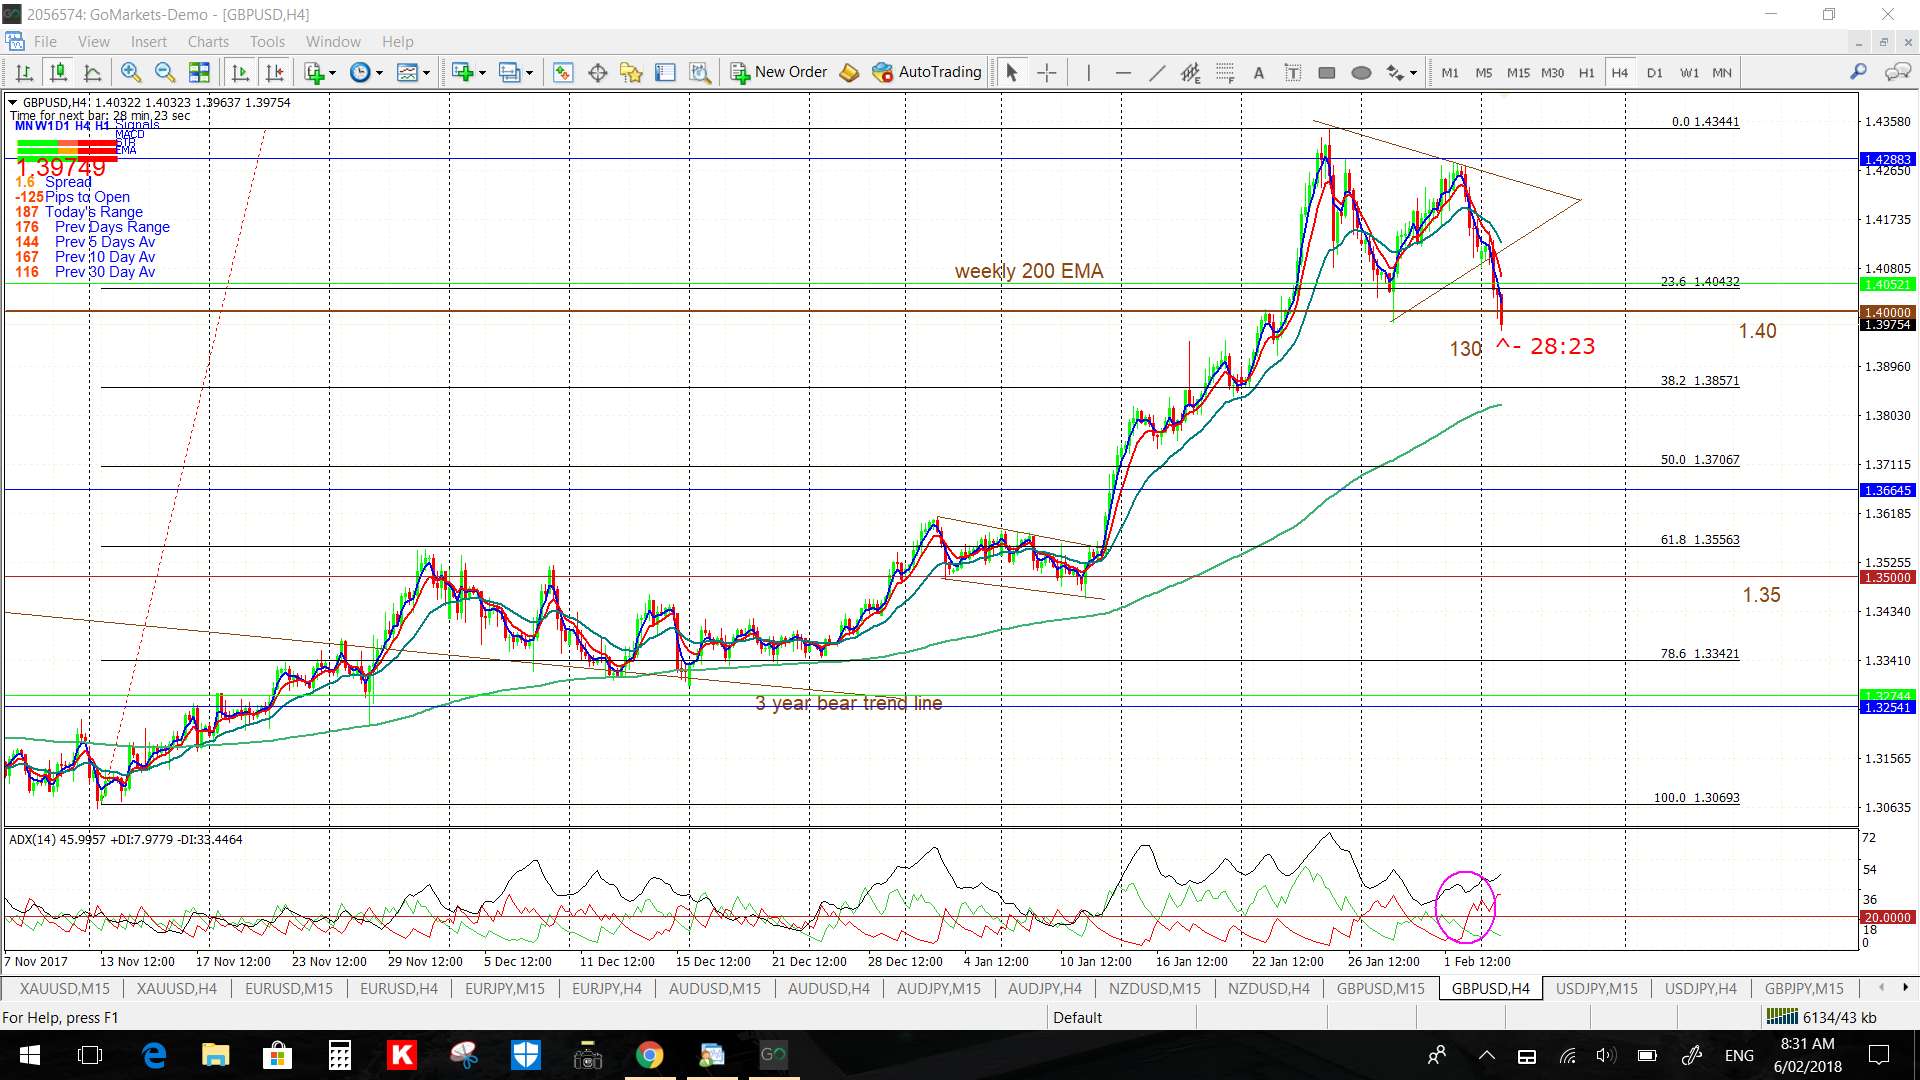
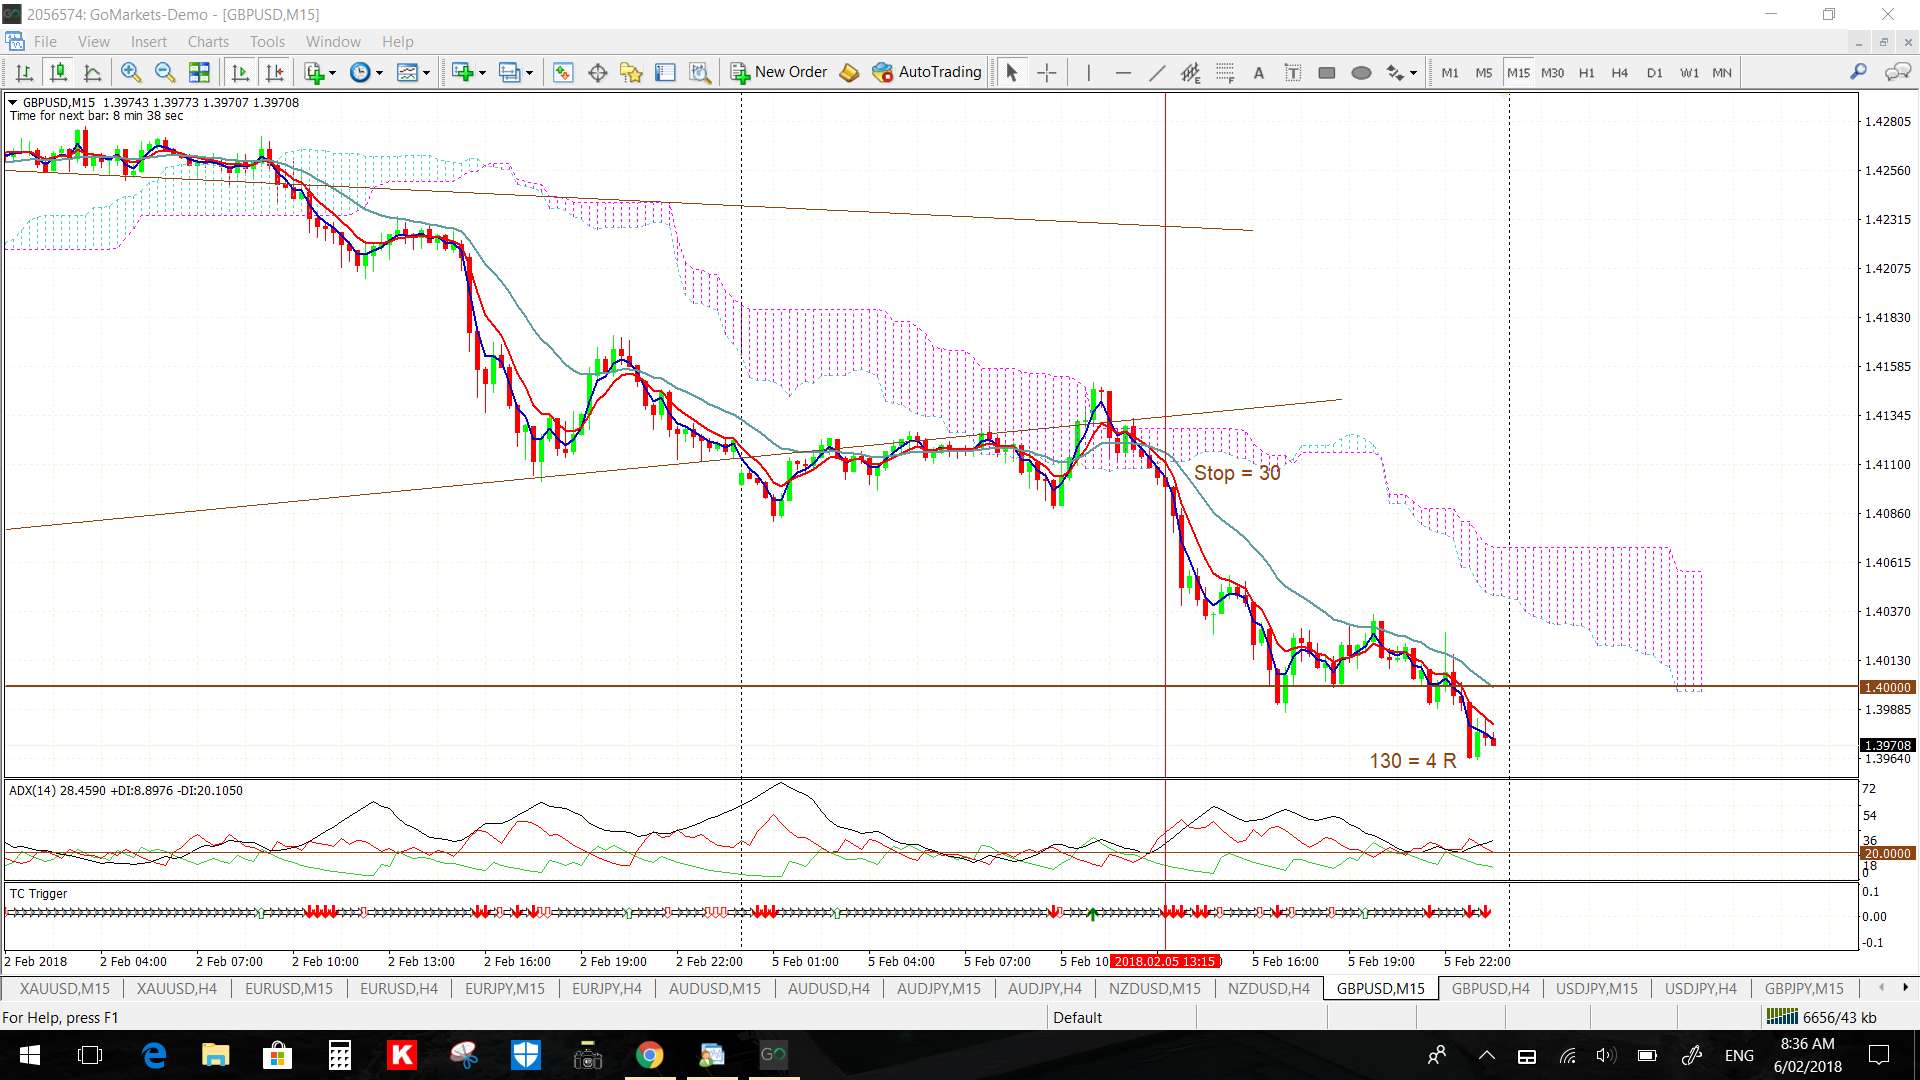
GBP/USD: GBP weakness and US$ strength fed in here for a new trend line breakout trade:
GBP/USD 4hr: 130 pips thus far:
GBP/USD15 min: only looking for SHORTs gave a 4 R trade here:
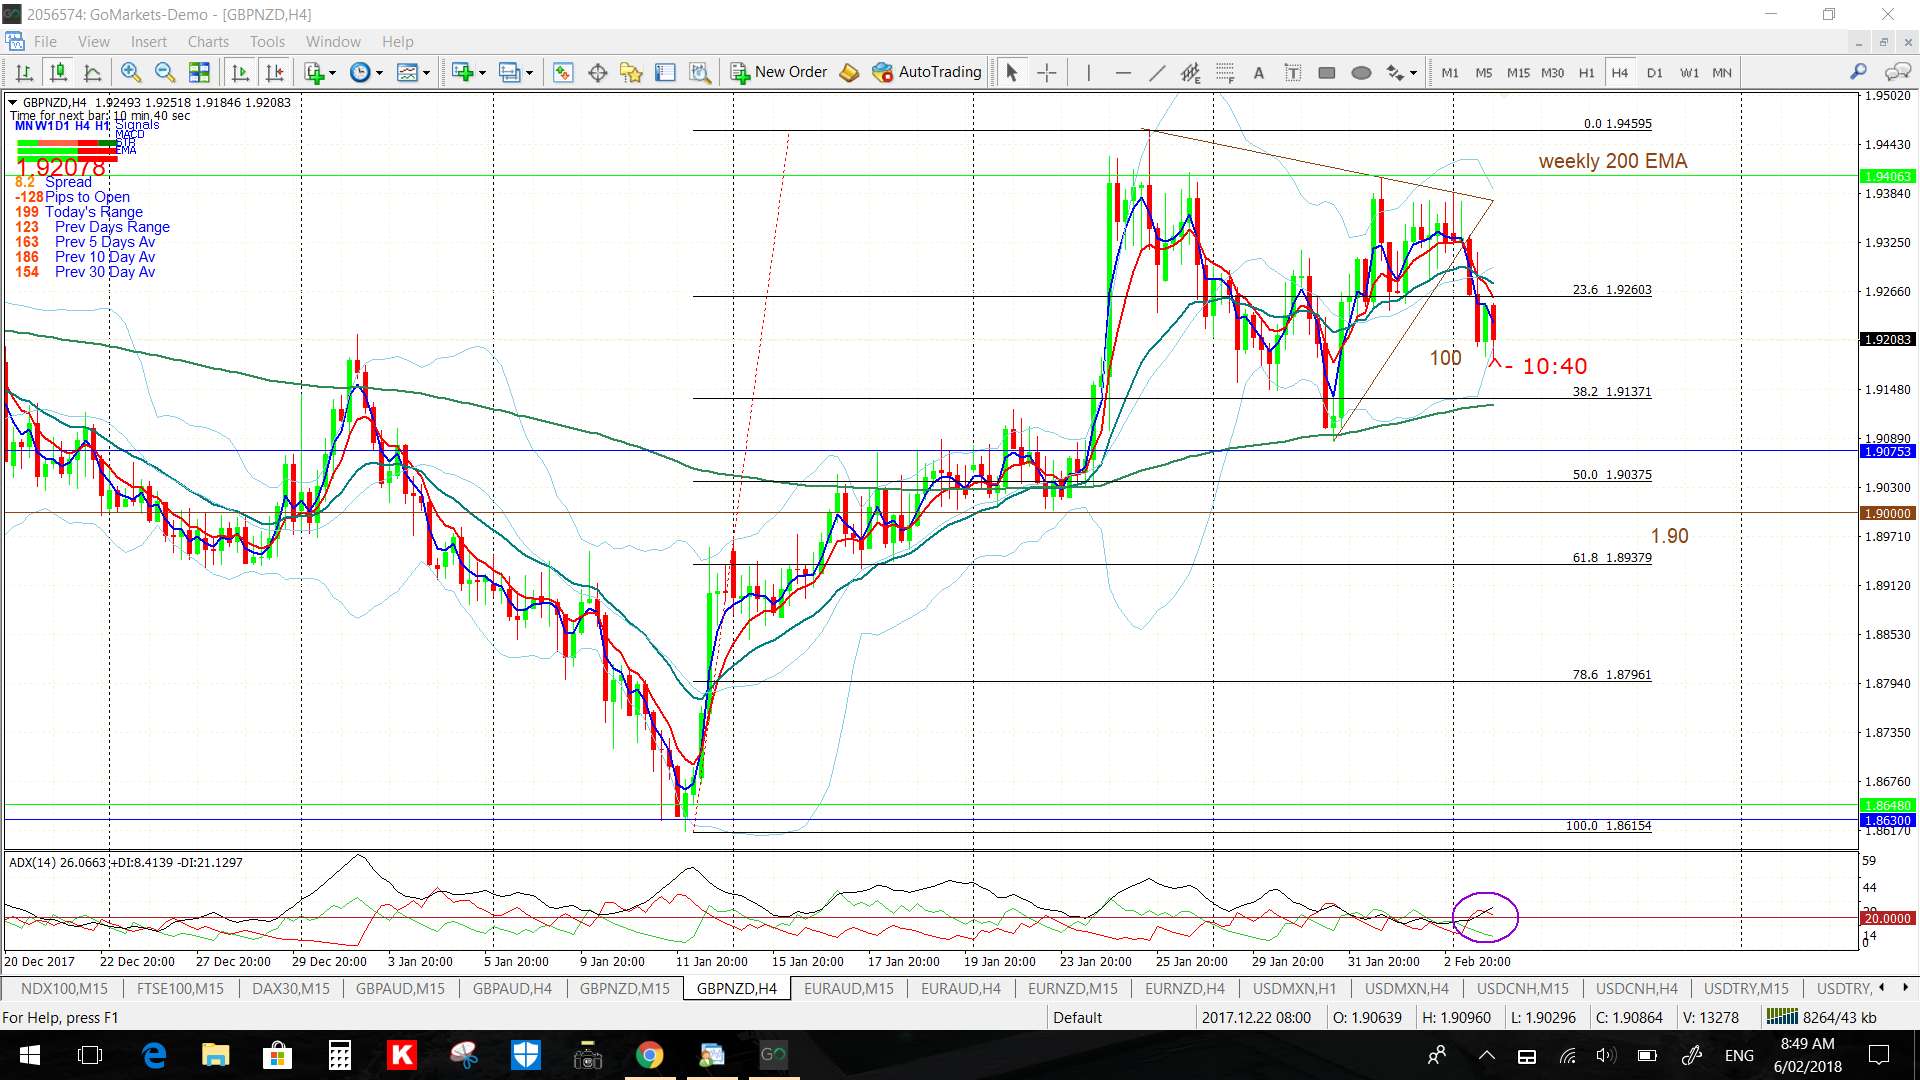
GBP/NZD 4hr: a choppy 100 pip move here:
Oil 4hr: a 95 pip trend line breakout here: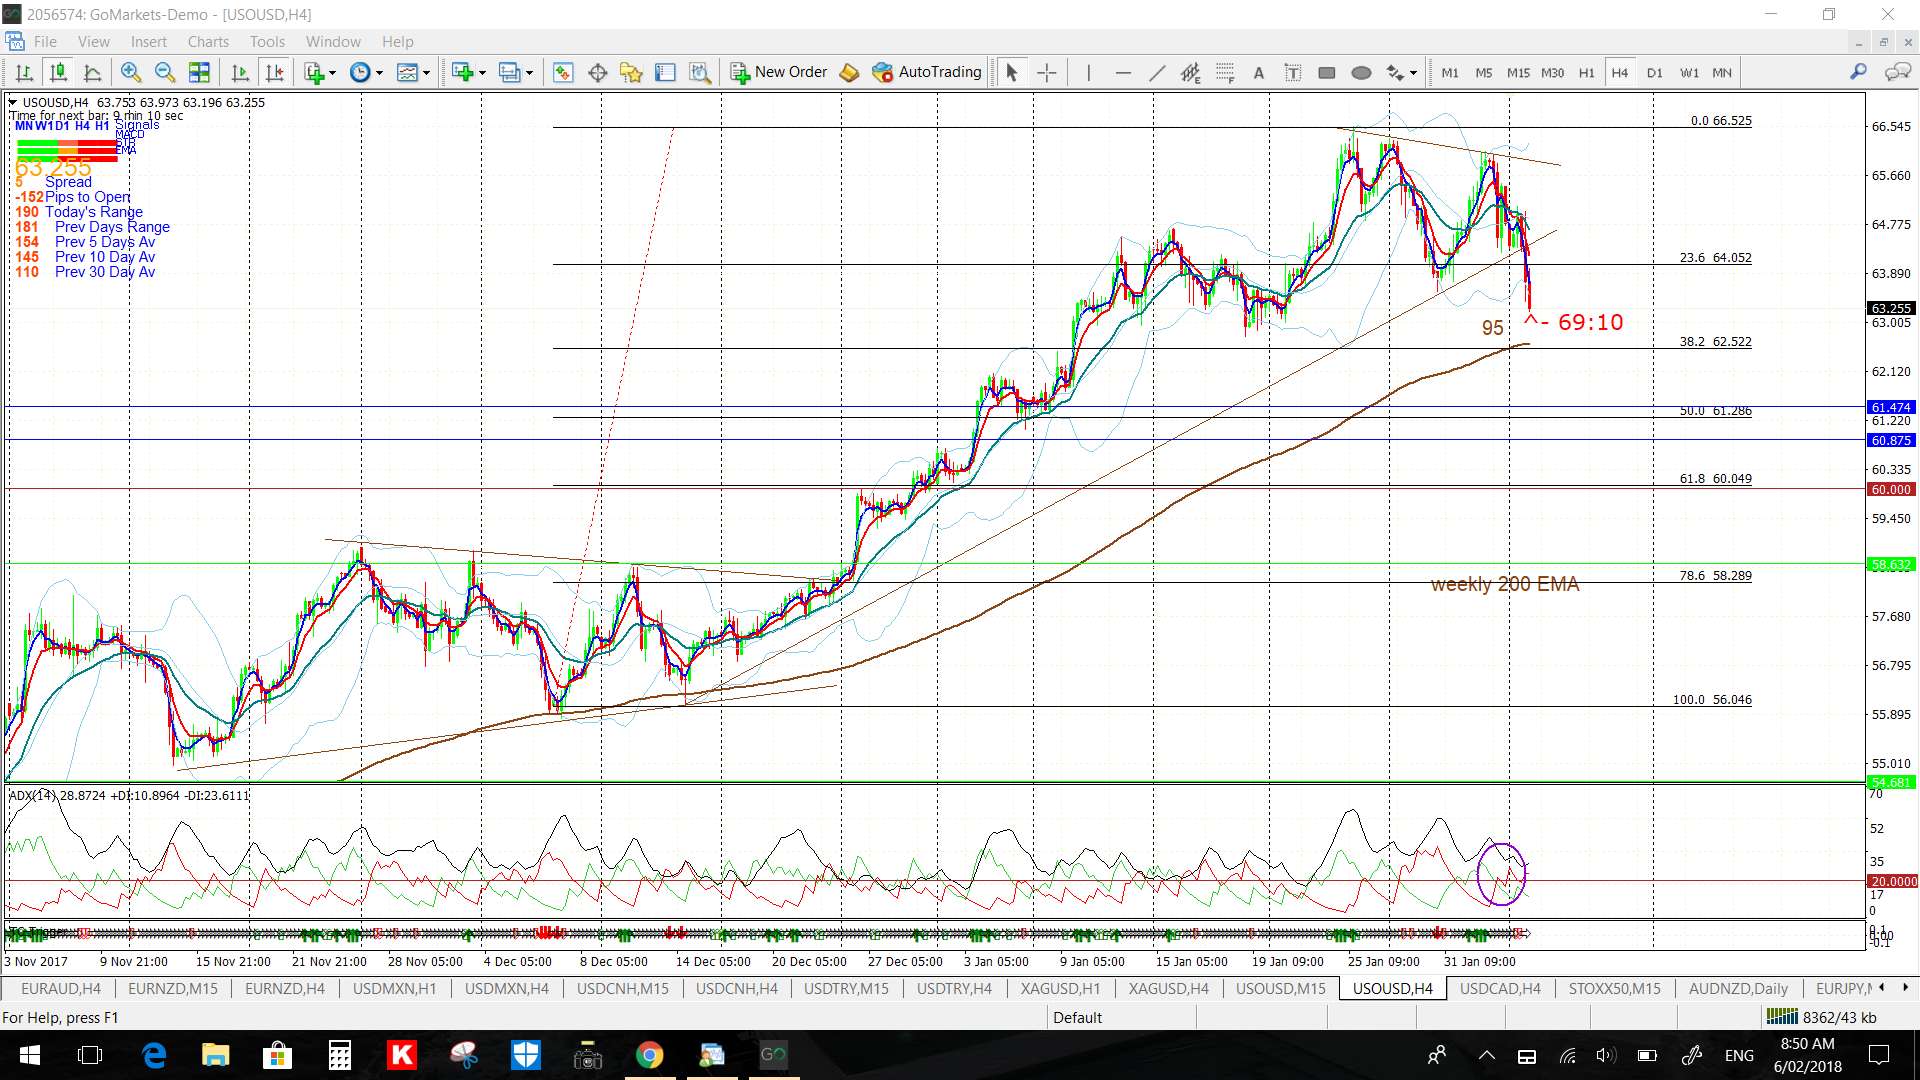
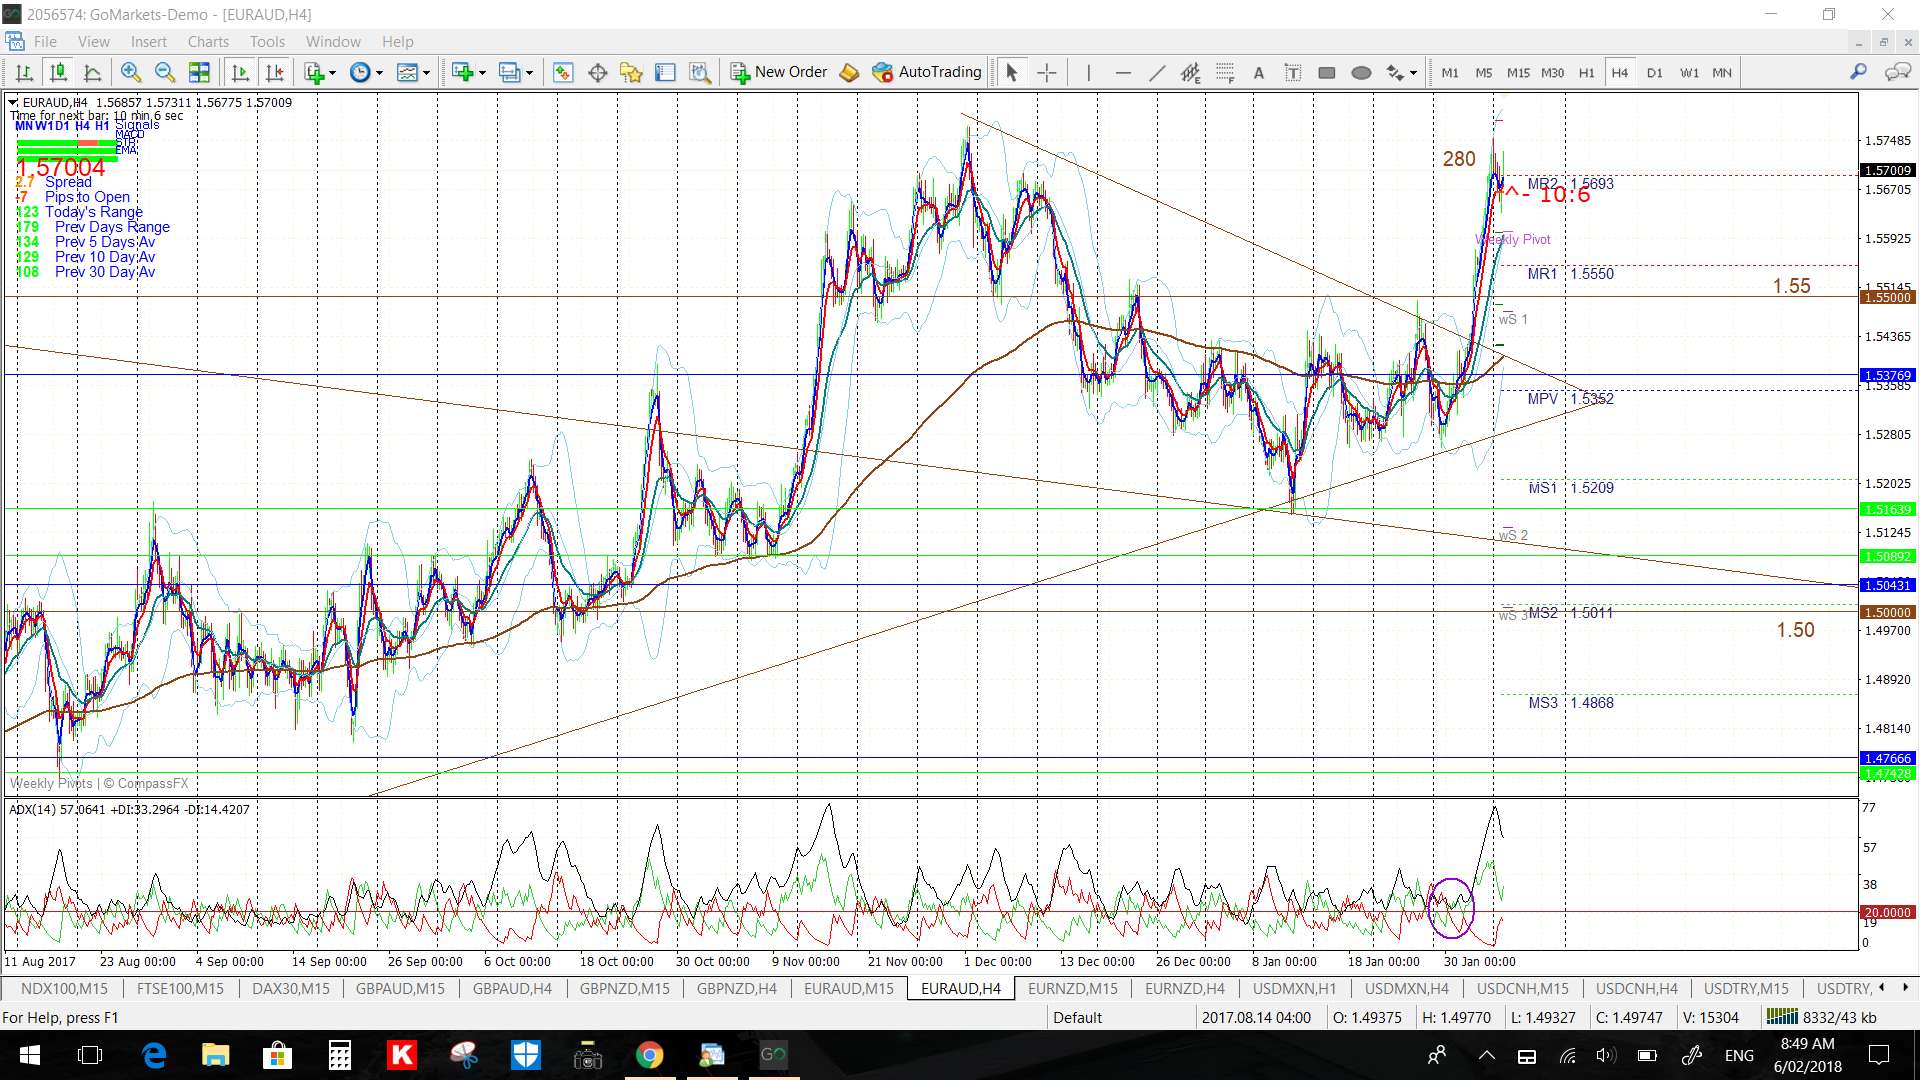
EUR/AUD 4hr: not much more here just yet:
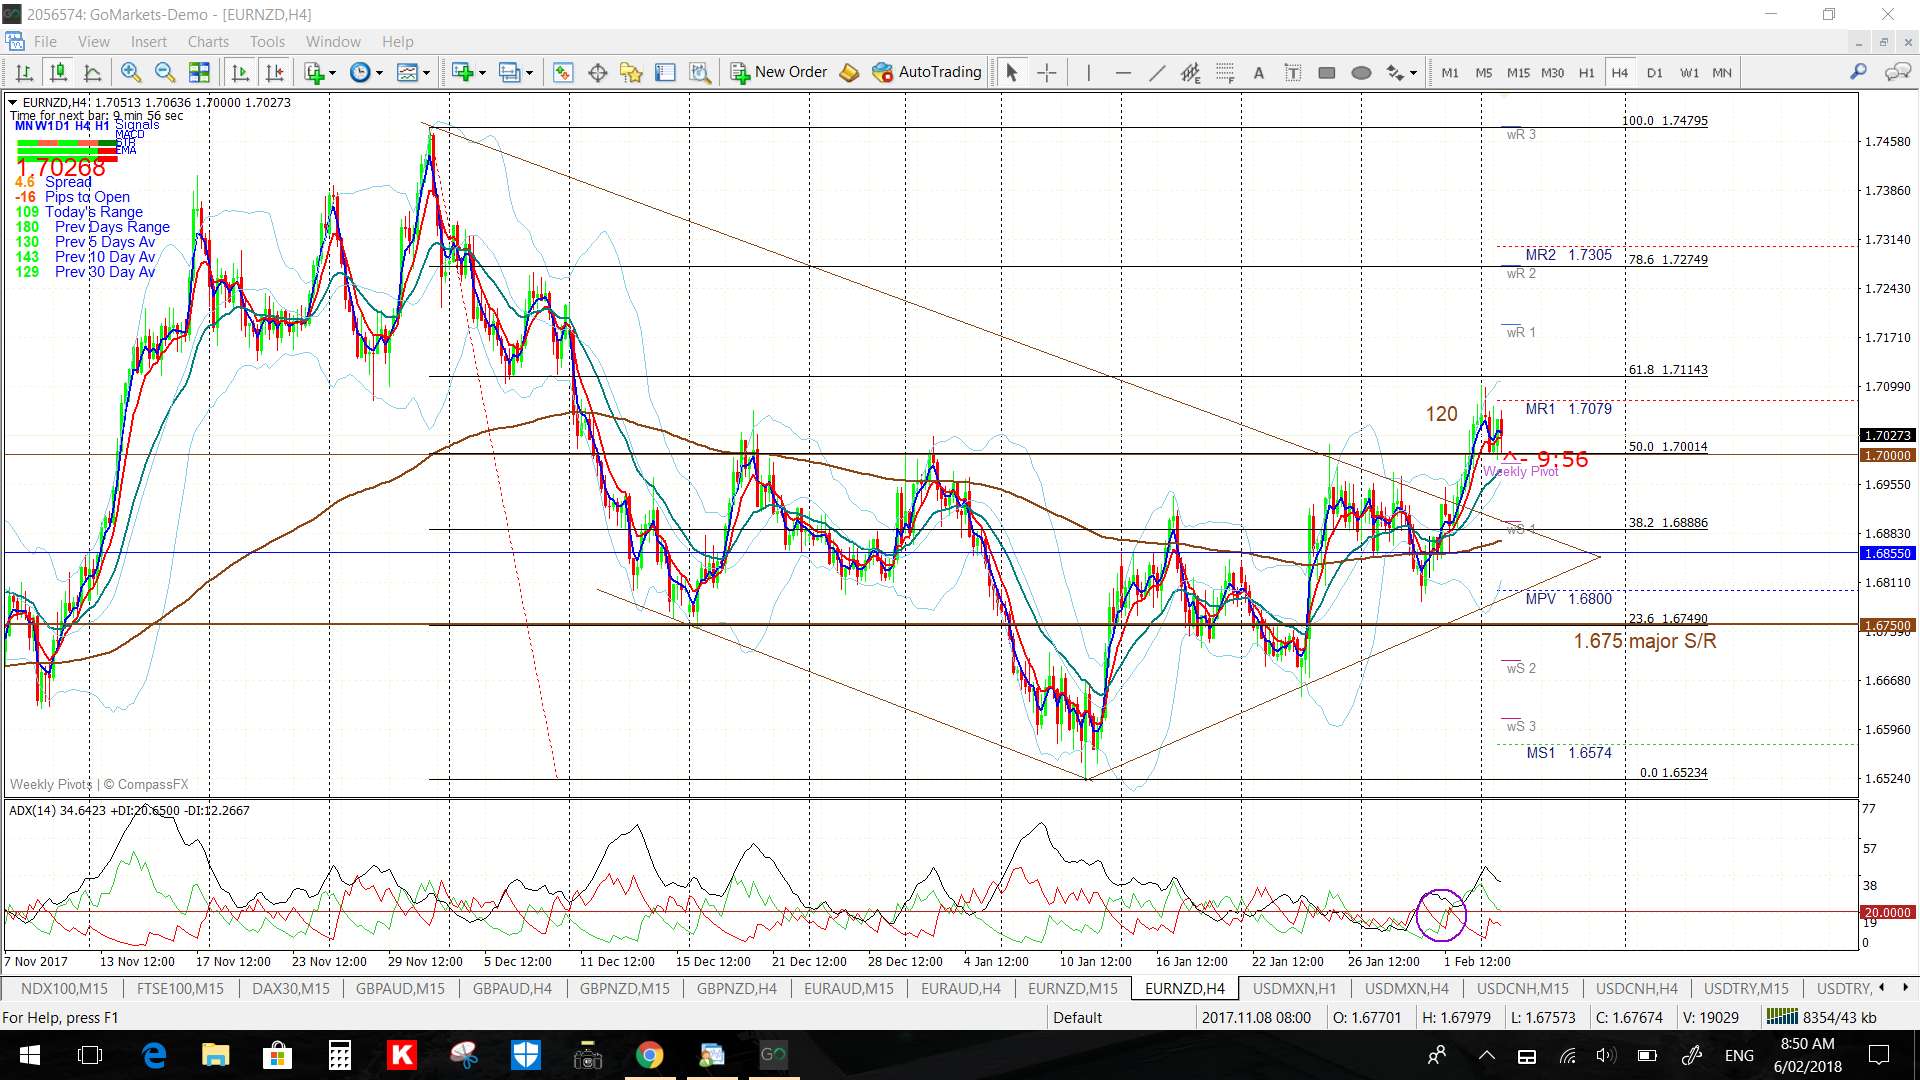
EUR/NZD 4hr: nor here:
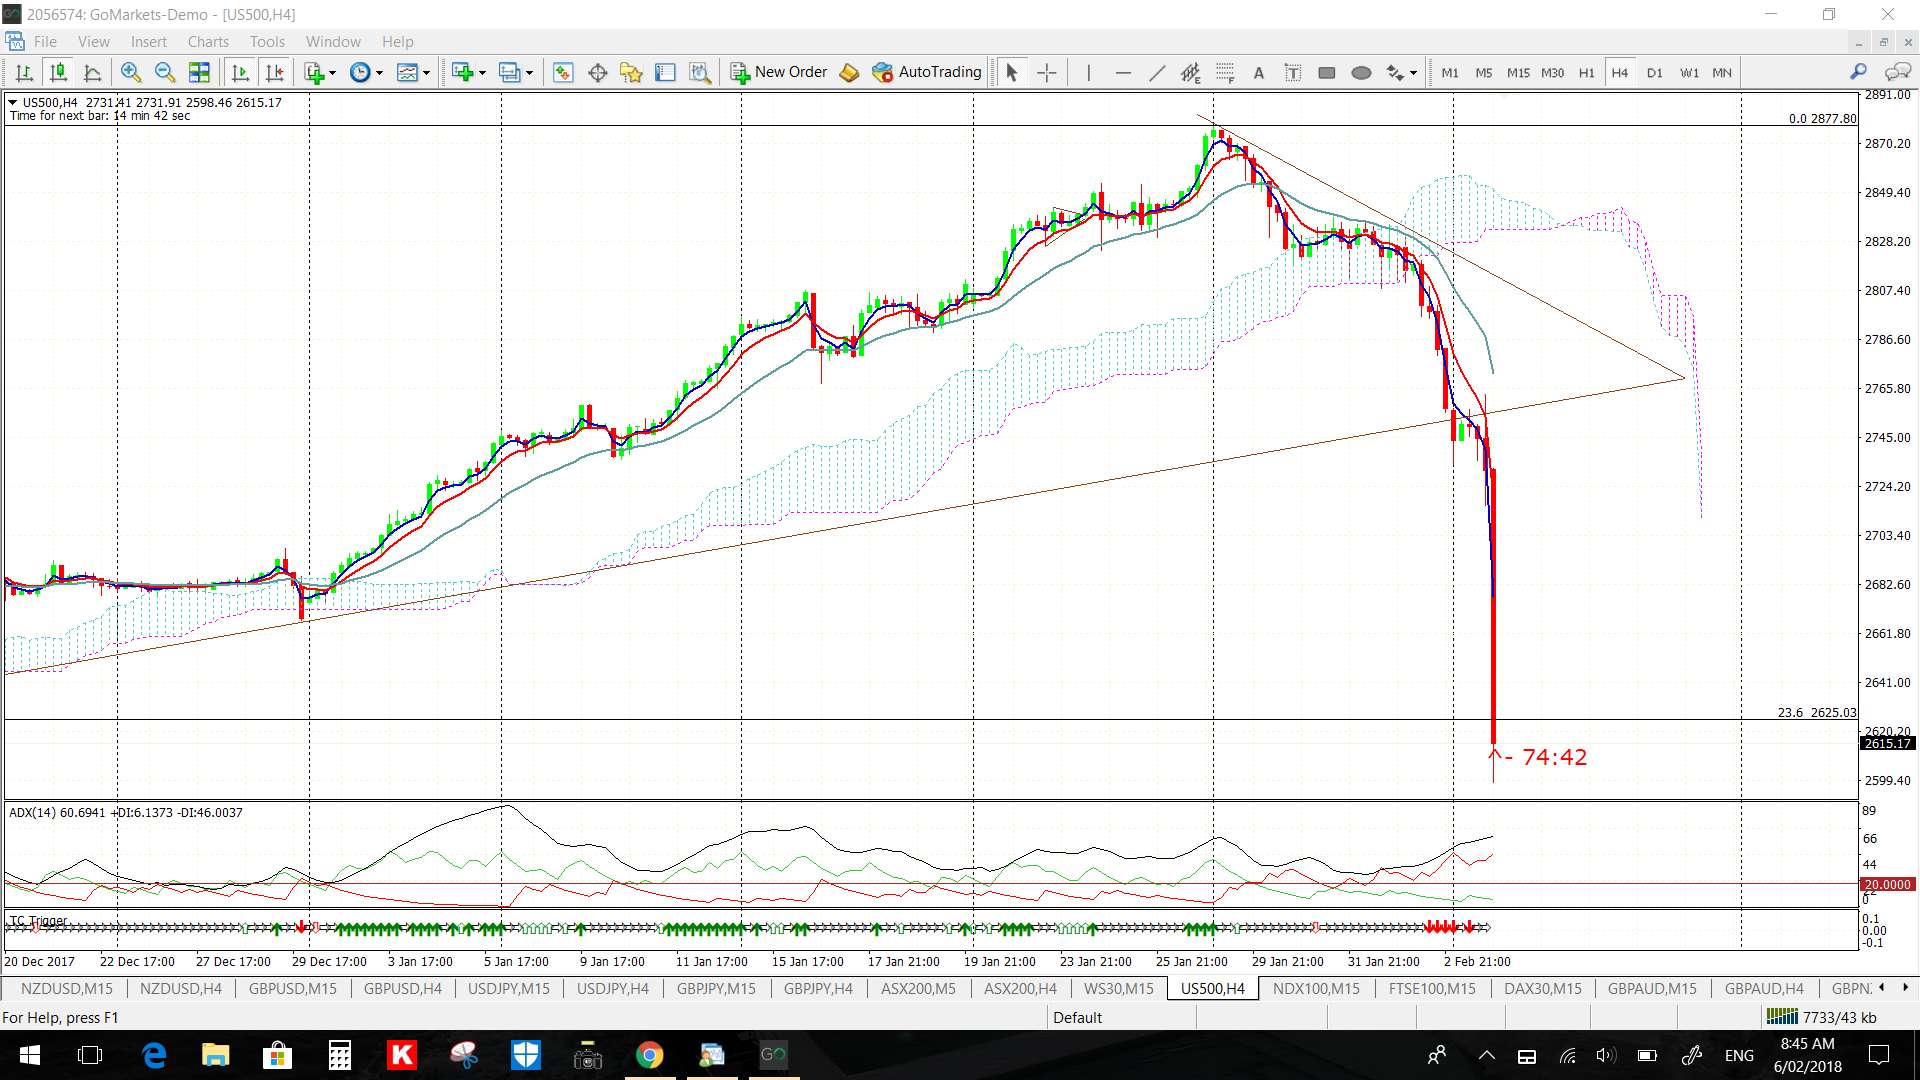
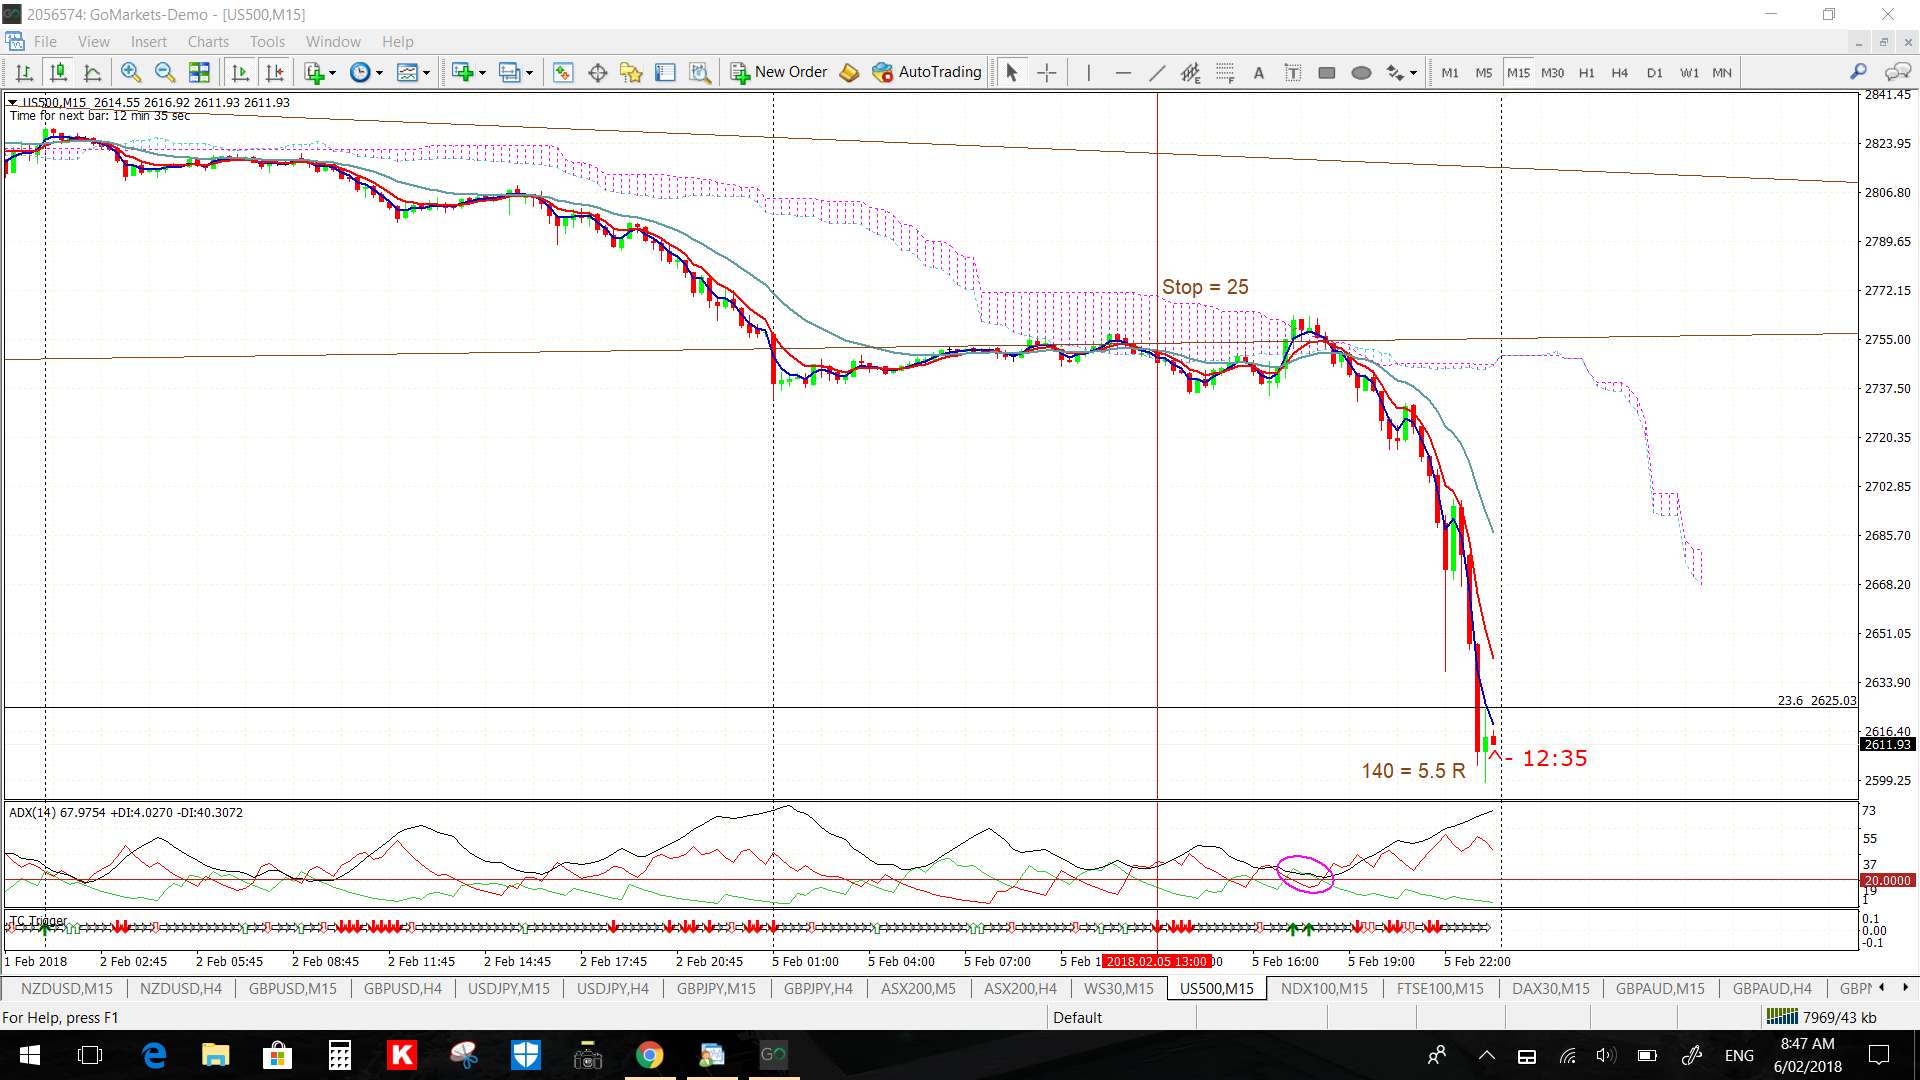
S&P500: there was a large move on this index as there were on other US stock indices:
S&P500 4hr: a decent enough trend line break here last session:
S&P500 15 min: this gave a great TC signal for 5.5 R:
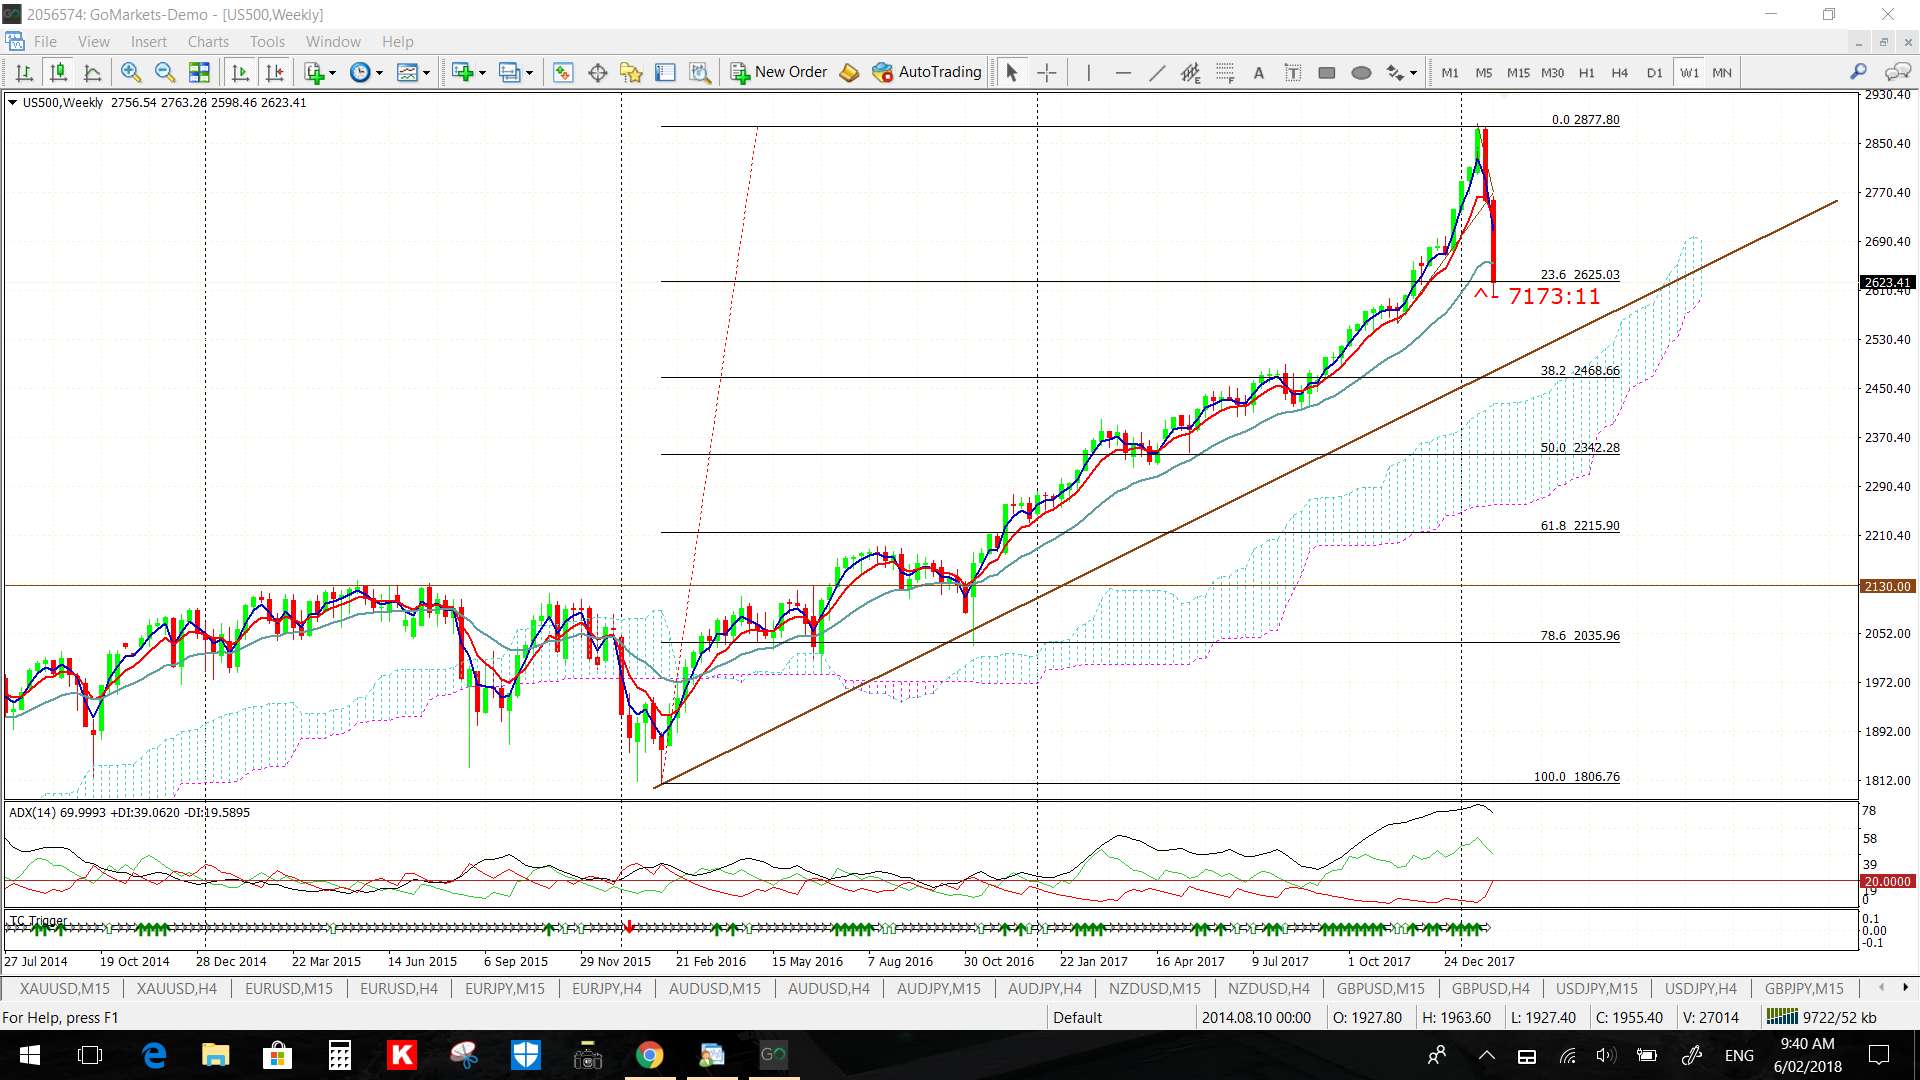
S&P500 weekly: I Tweeted this chart yesterday and the comment remains the same. As worrisome as the pullback has been thus far, this chart hasn’t even started to look ugly yet. Any break of the support trend line and Cloud would add to misery but a pullback to the 61.8% fib could be expected whilst still keeping the overall uptrend intact. Digest that!
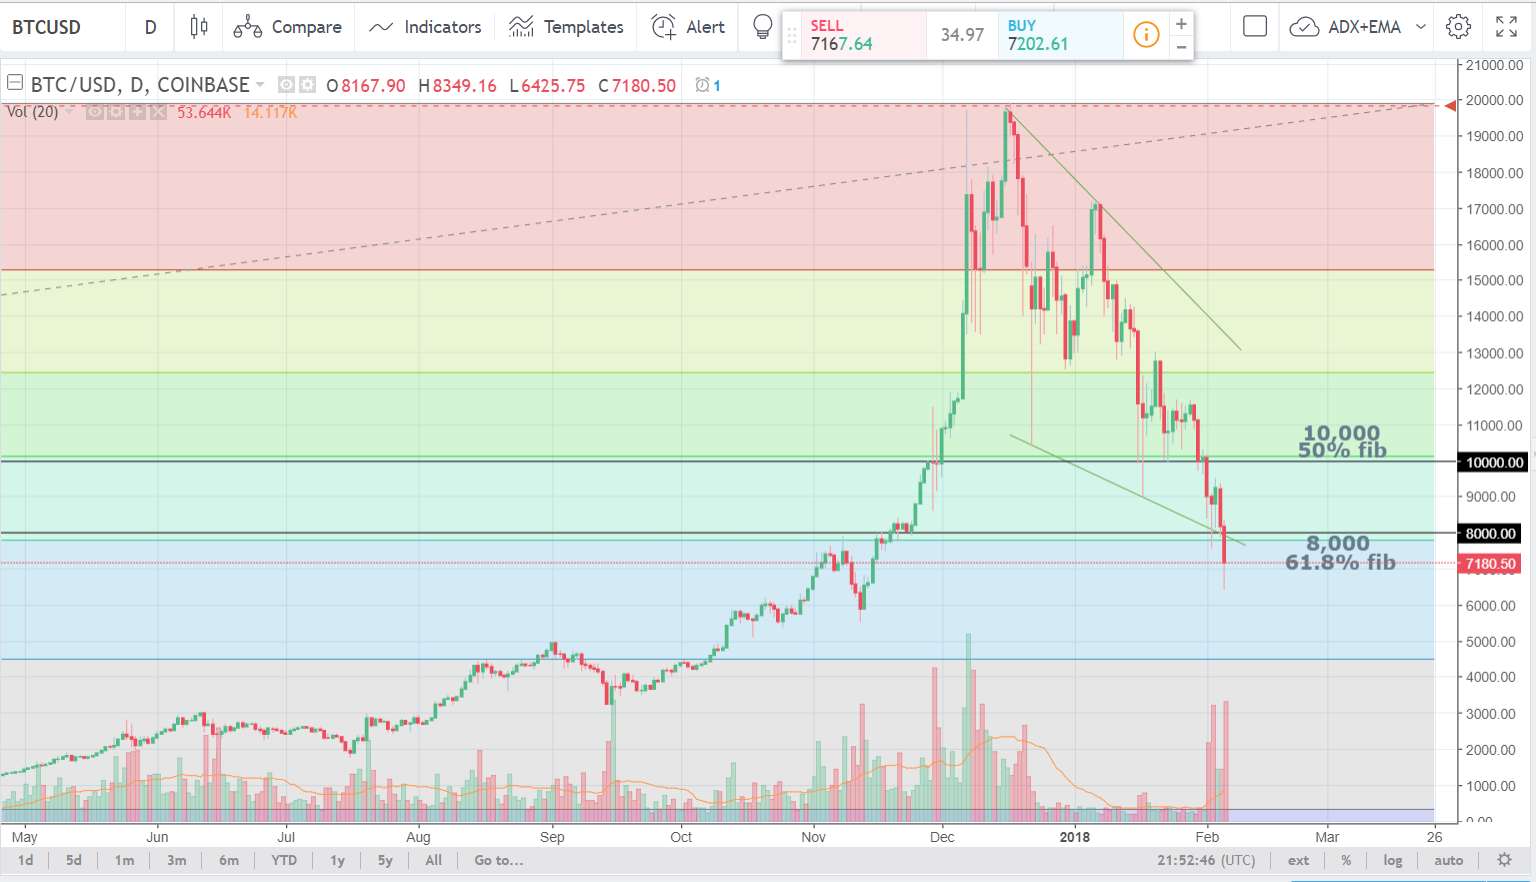
BTC/USD daily: this is below the key $8,000 level BUT watch to see where it closes for the week as this is a weekly fib level:
Other Forex: watch for any new momentum-based trend line breakouts:
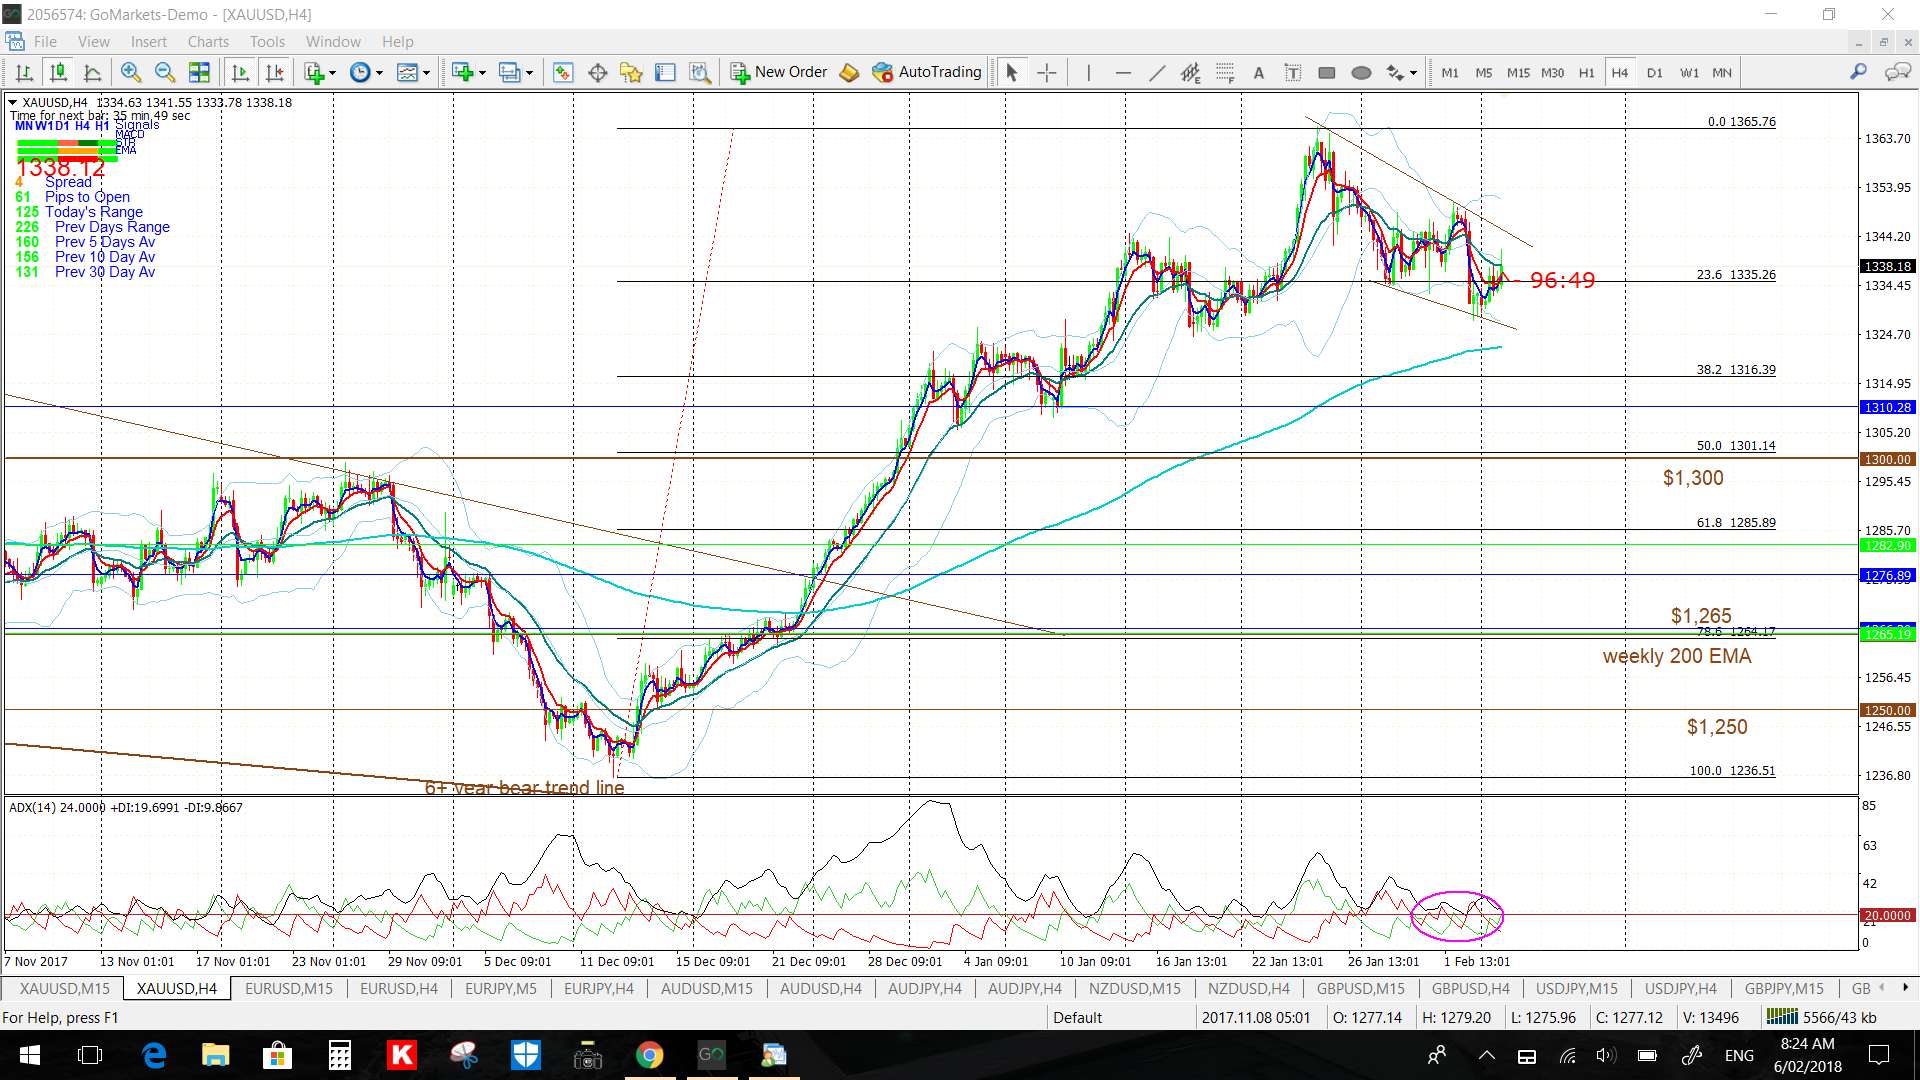
Gold 4hr:
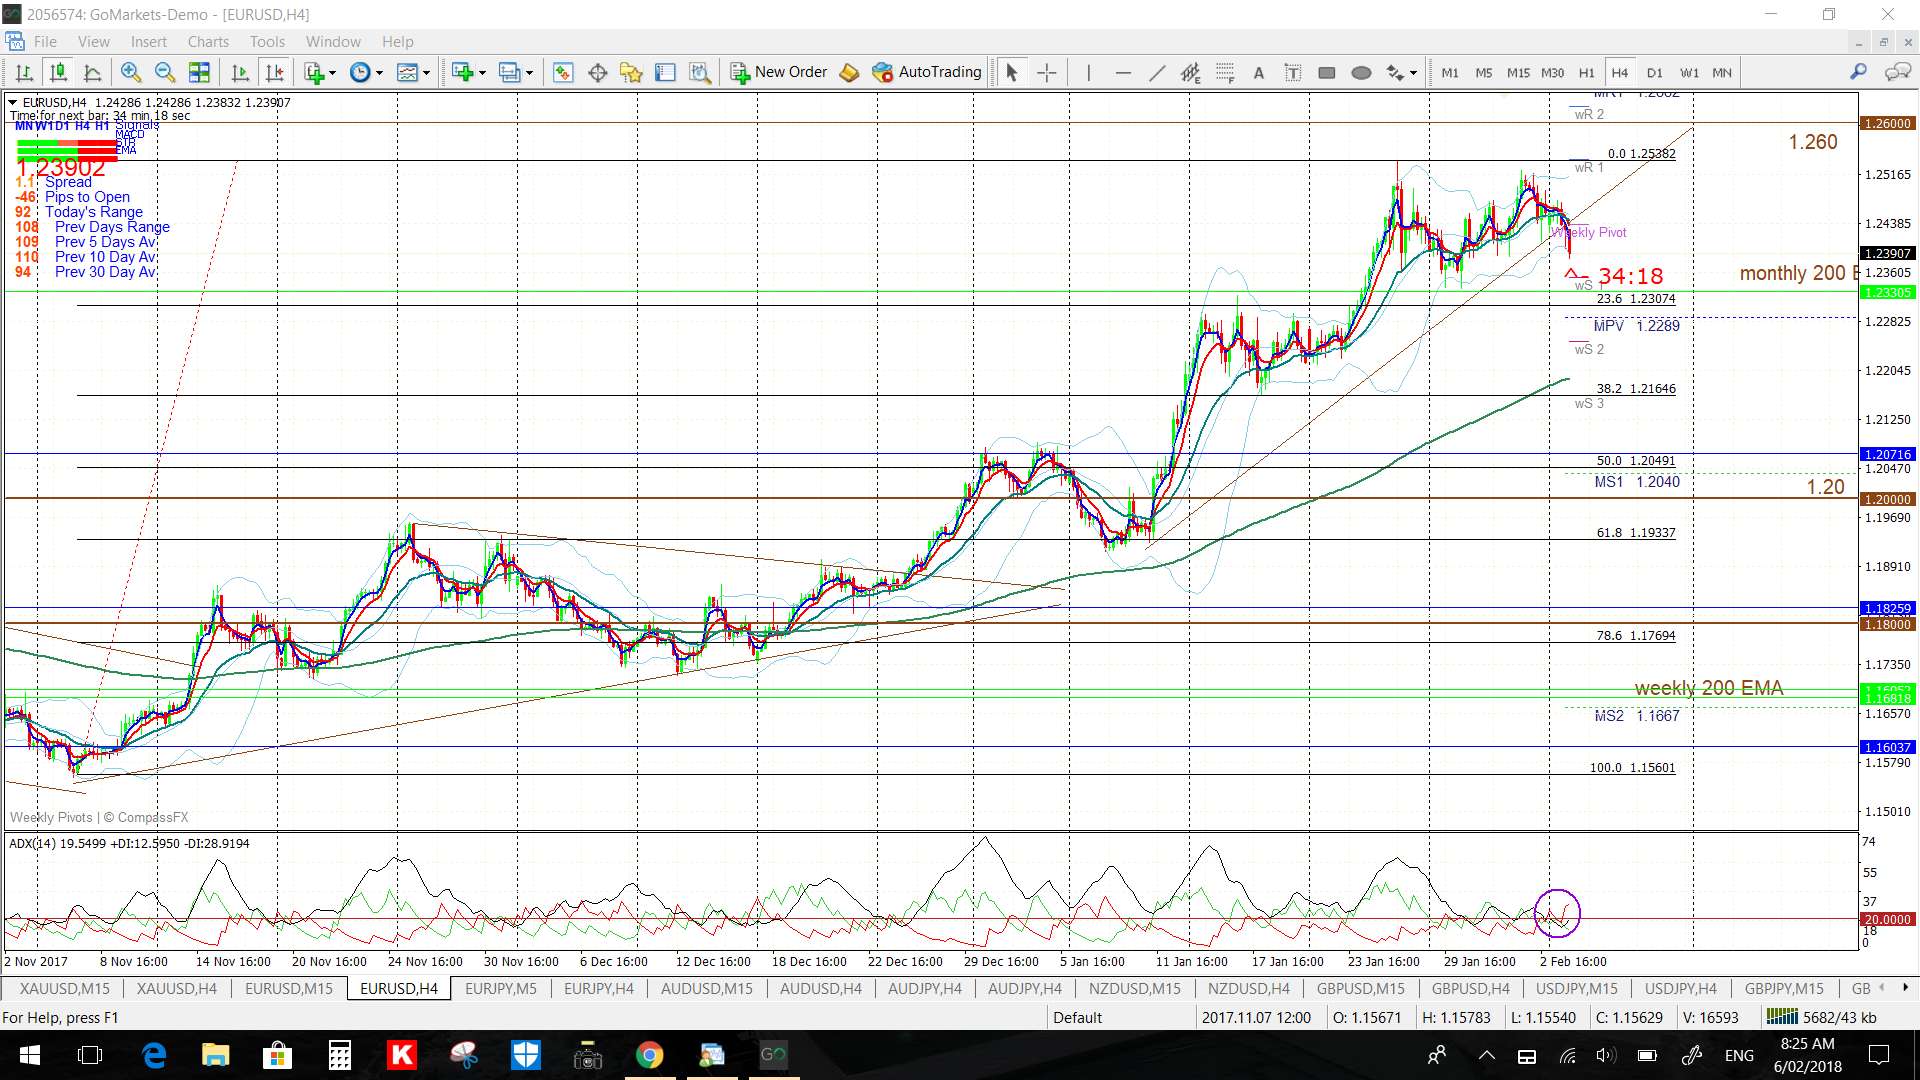
EUR/USD 4hr: watch for any developing pullback here:
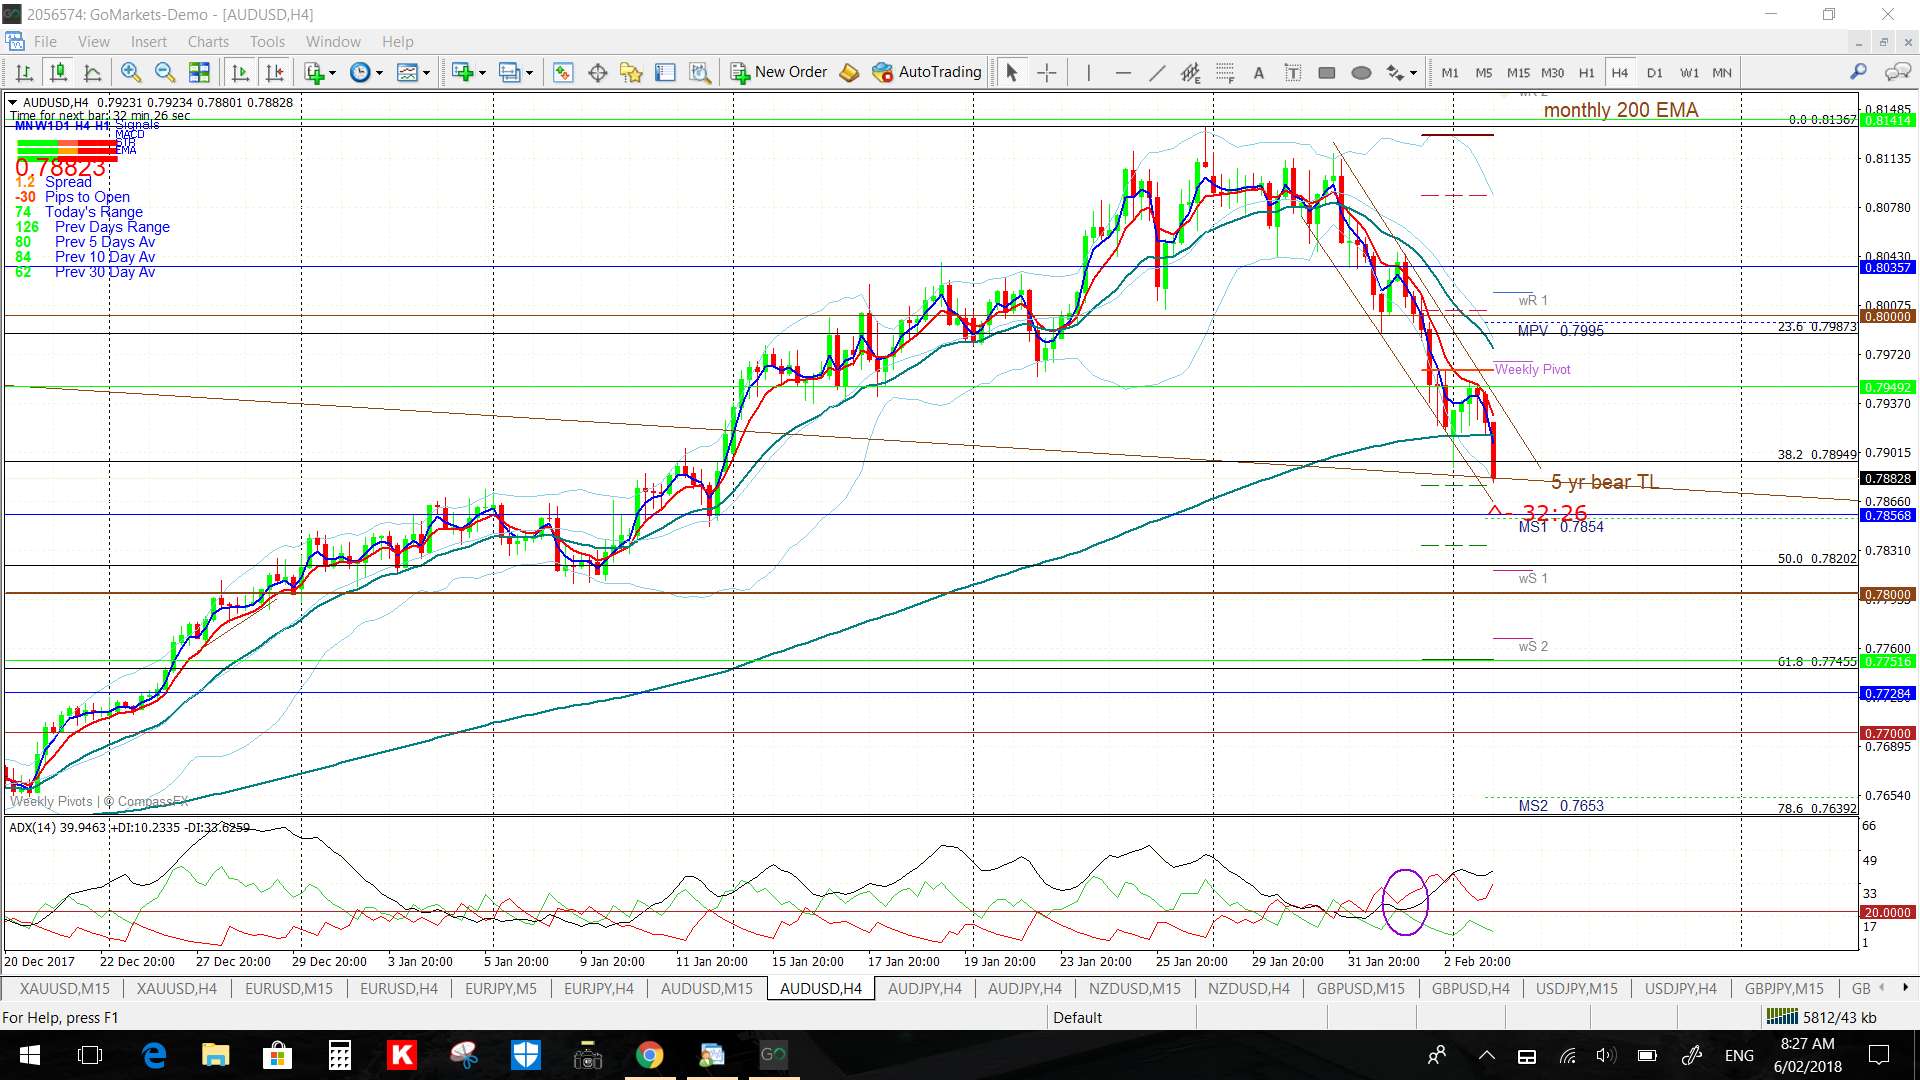
AUD/USD 4hr: watch for any support from the previously broken 5-year bear trend line, especially with all of today’s scheduled AUD data:
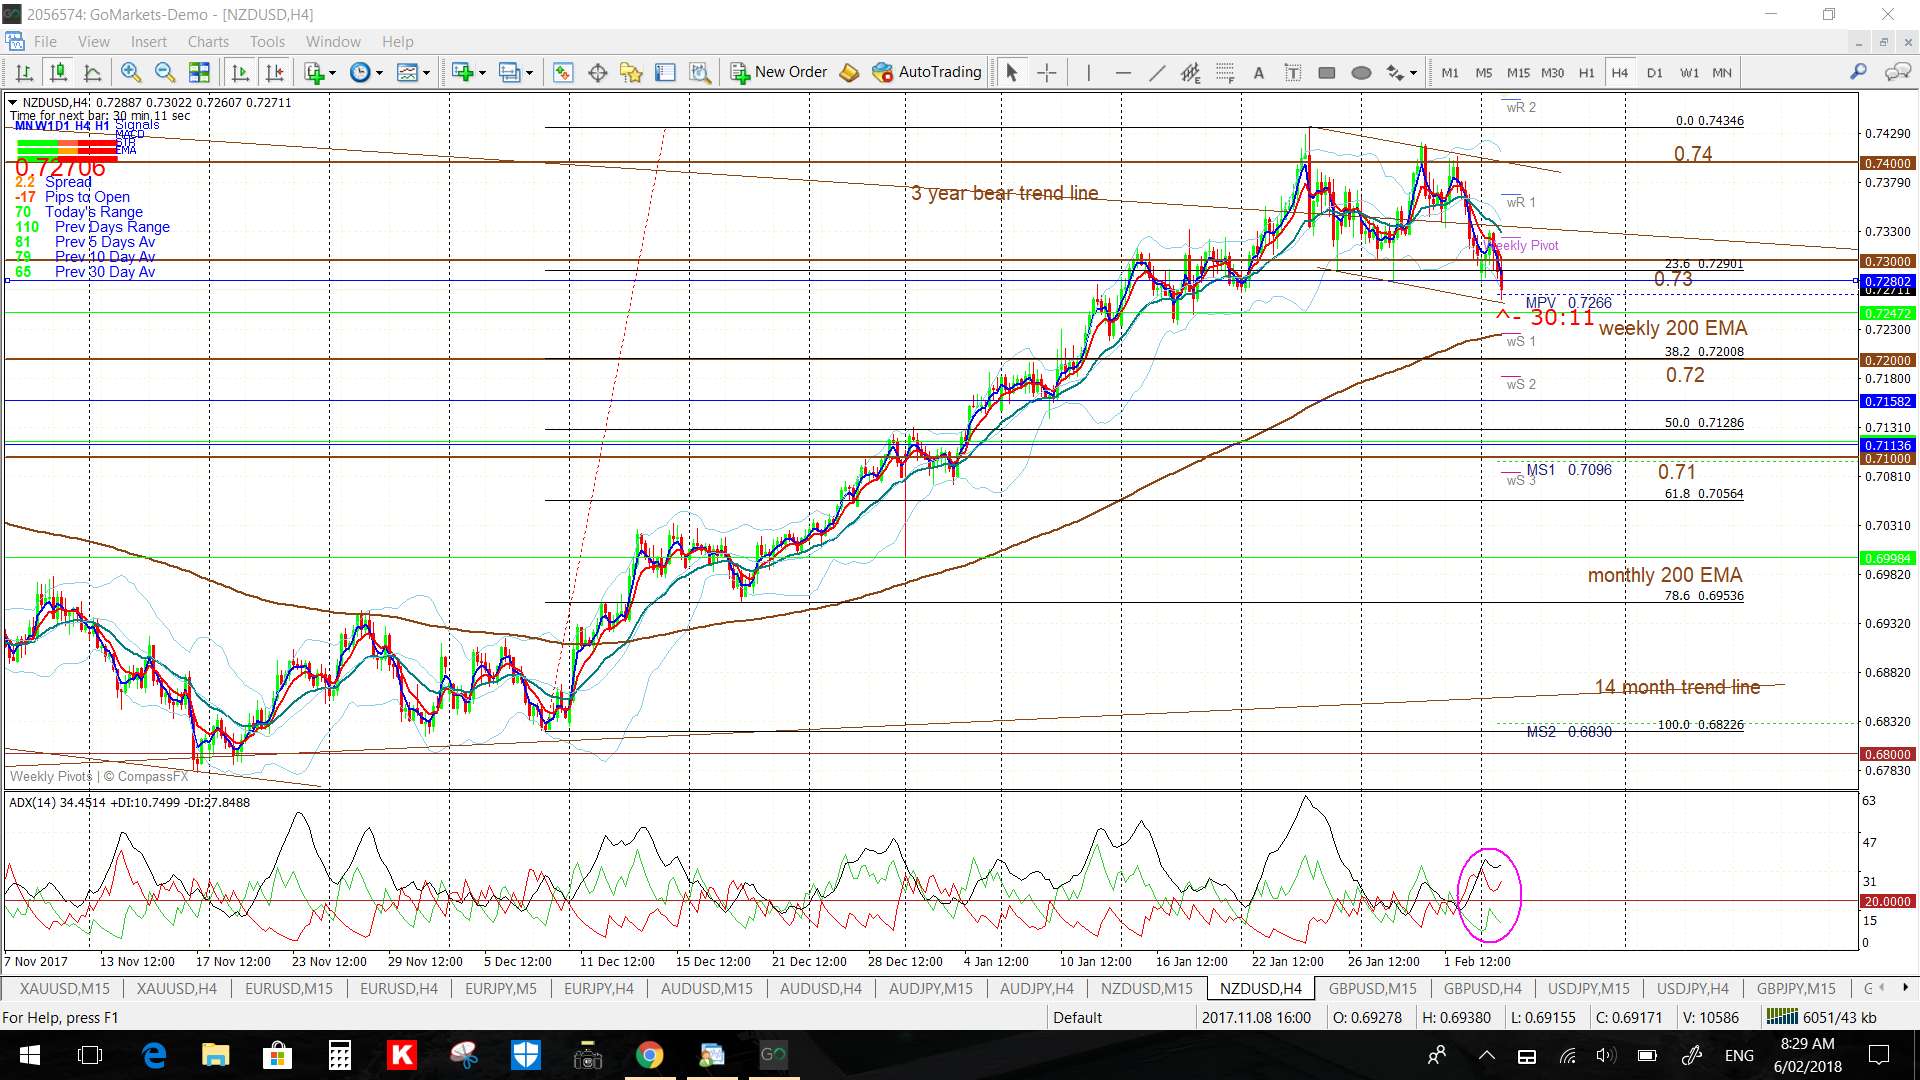
NZD/USD 4hr:
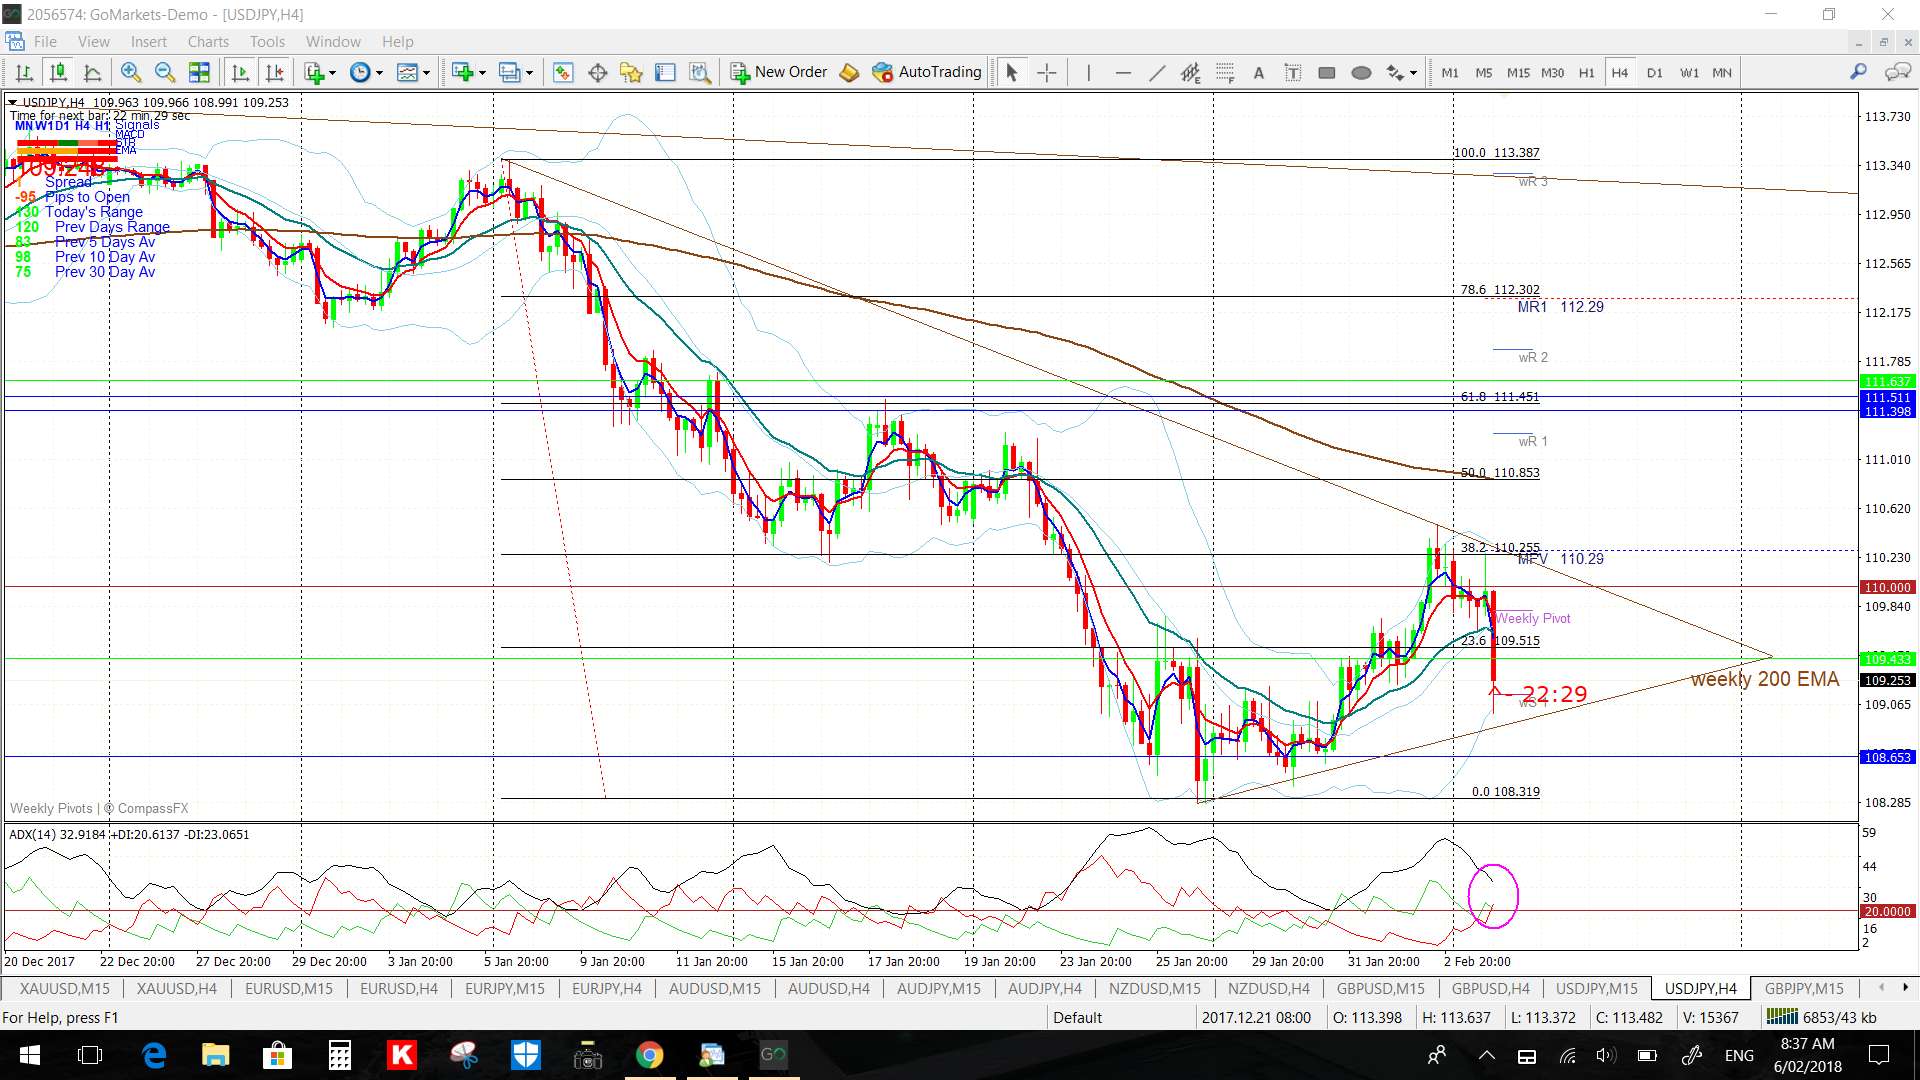
USD/JPY 4hr:
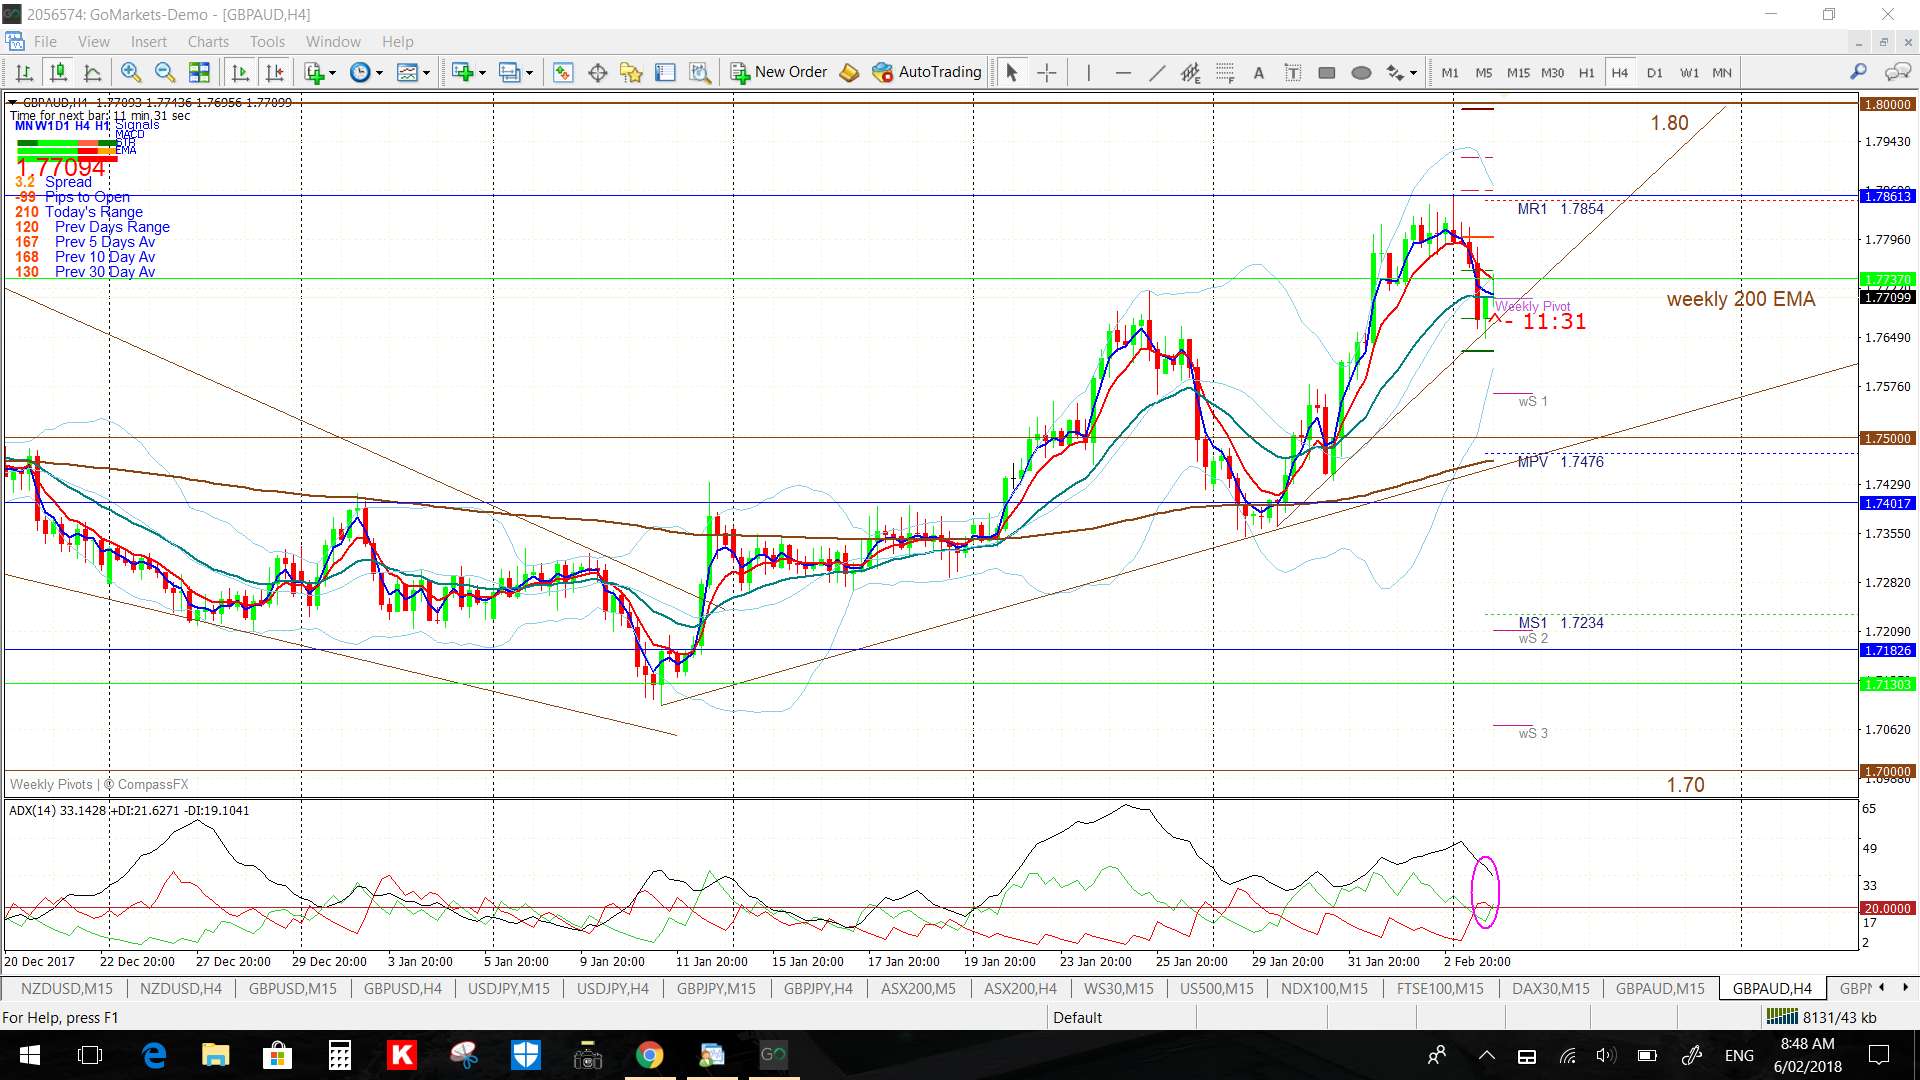
GBP/AUD 4hr: