Last week: it hasn’t been the easiest three trading weeks for the start of my TC Trial but there have still been some decent trades. Things picked up a bit on Thursday of this week and I’m hoping to see that this helped my TC Trial participants. There isn’t a lot of scheduled high impact data for next week but there are plenty of consolidation patterns with associated trend lines to monitor.
Trend line breakout tally: These breakout moves noted mid-week here and here:
- AUD/USD: 70 pips.
- EUR/USD: 55 pips.
- EUR/JPY: 90 pips.
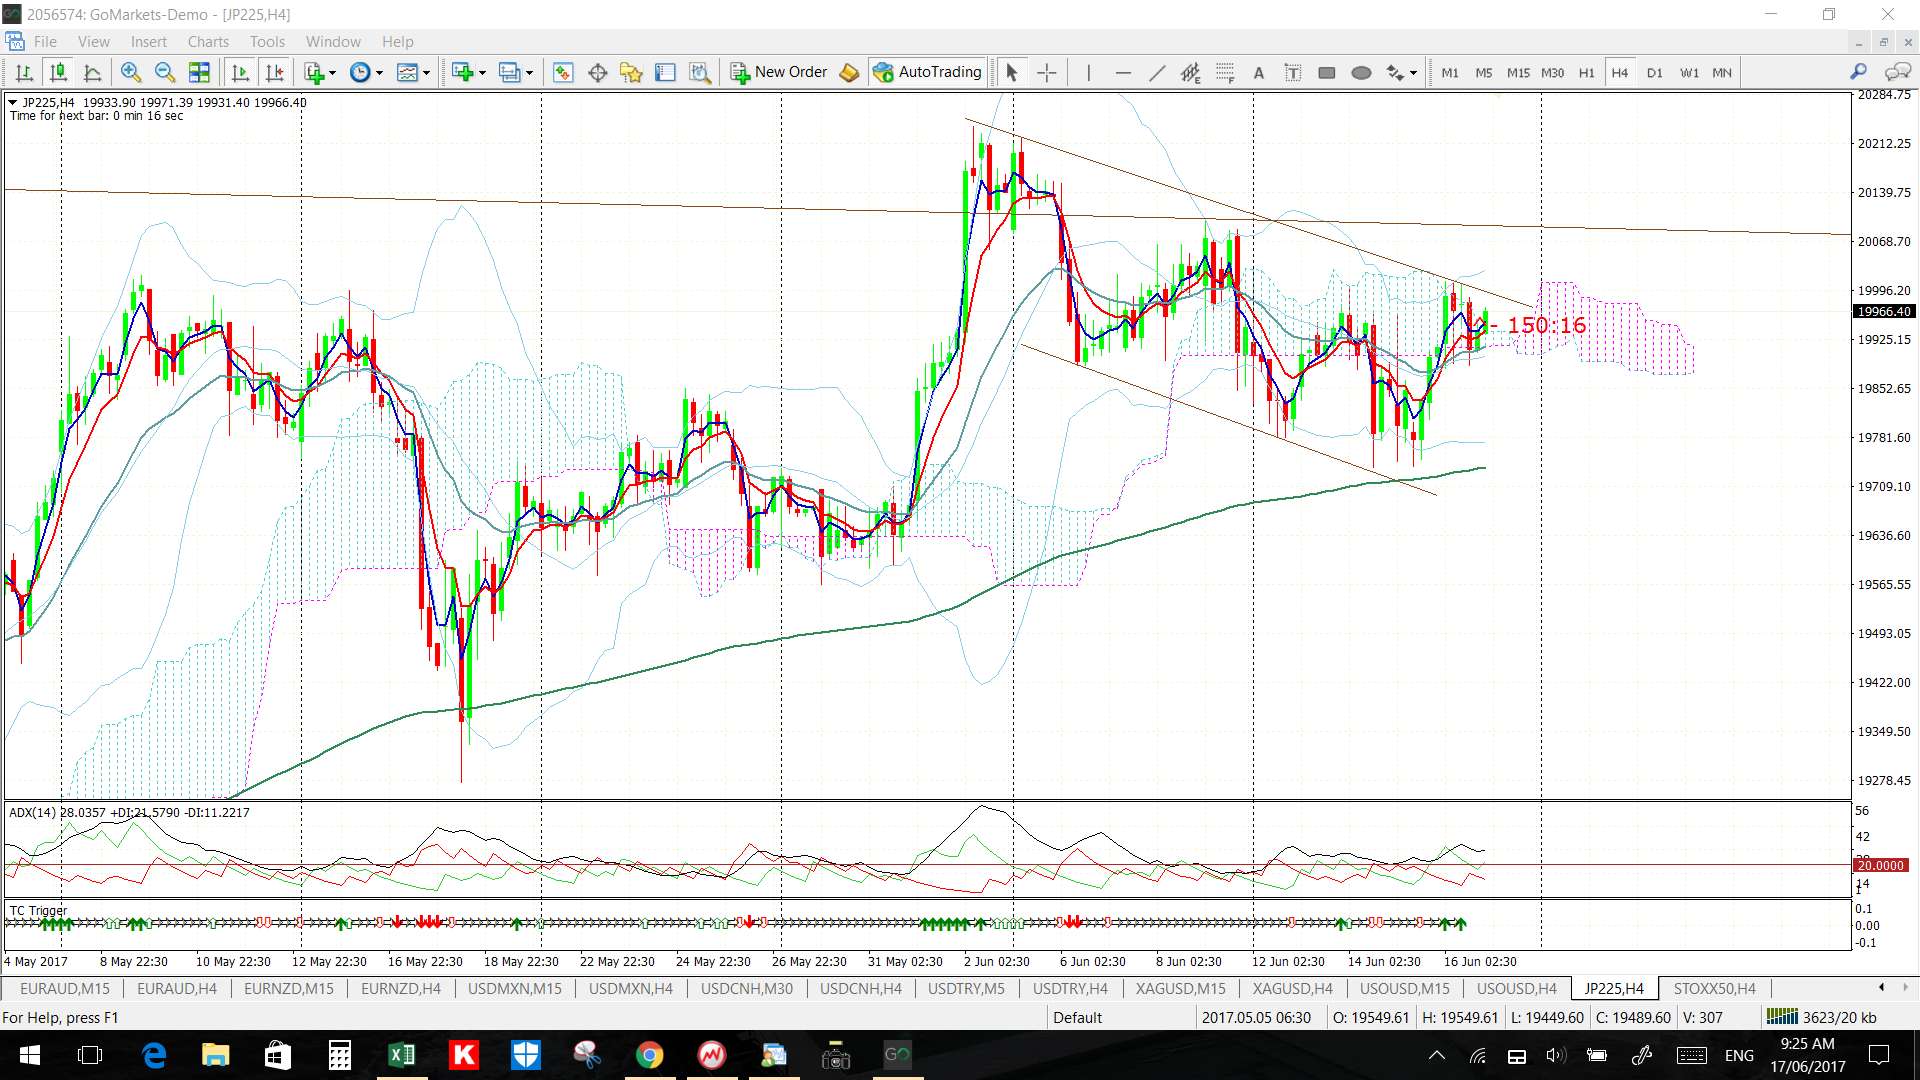
- AUD/JPY:150 pips.
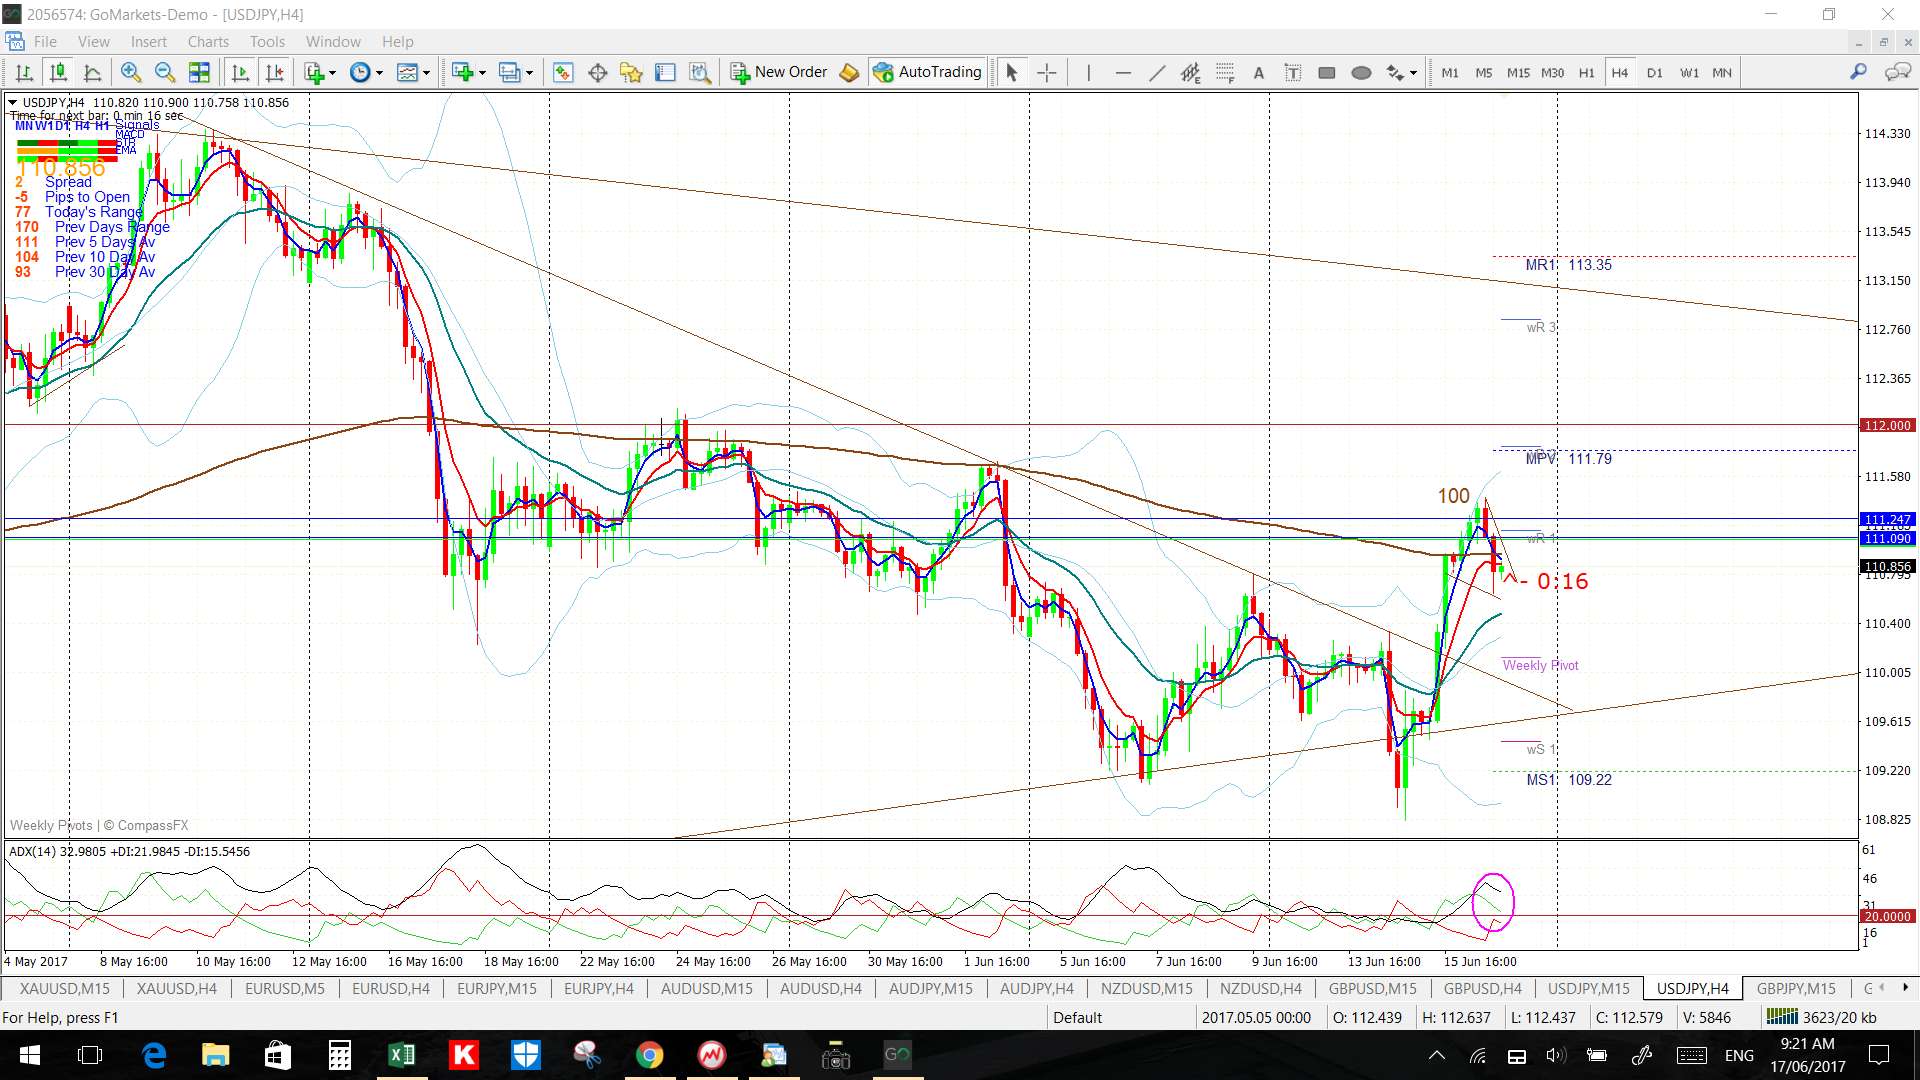
- USD/JPY: 100 pips.
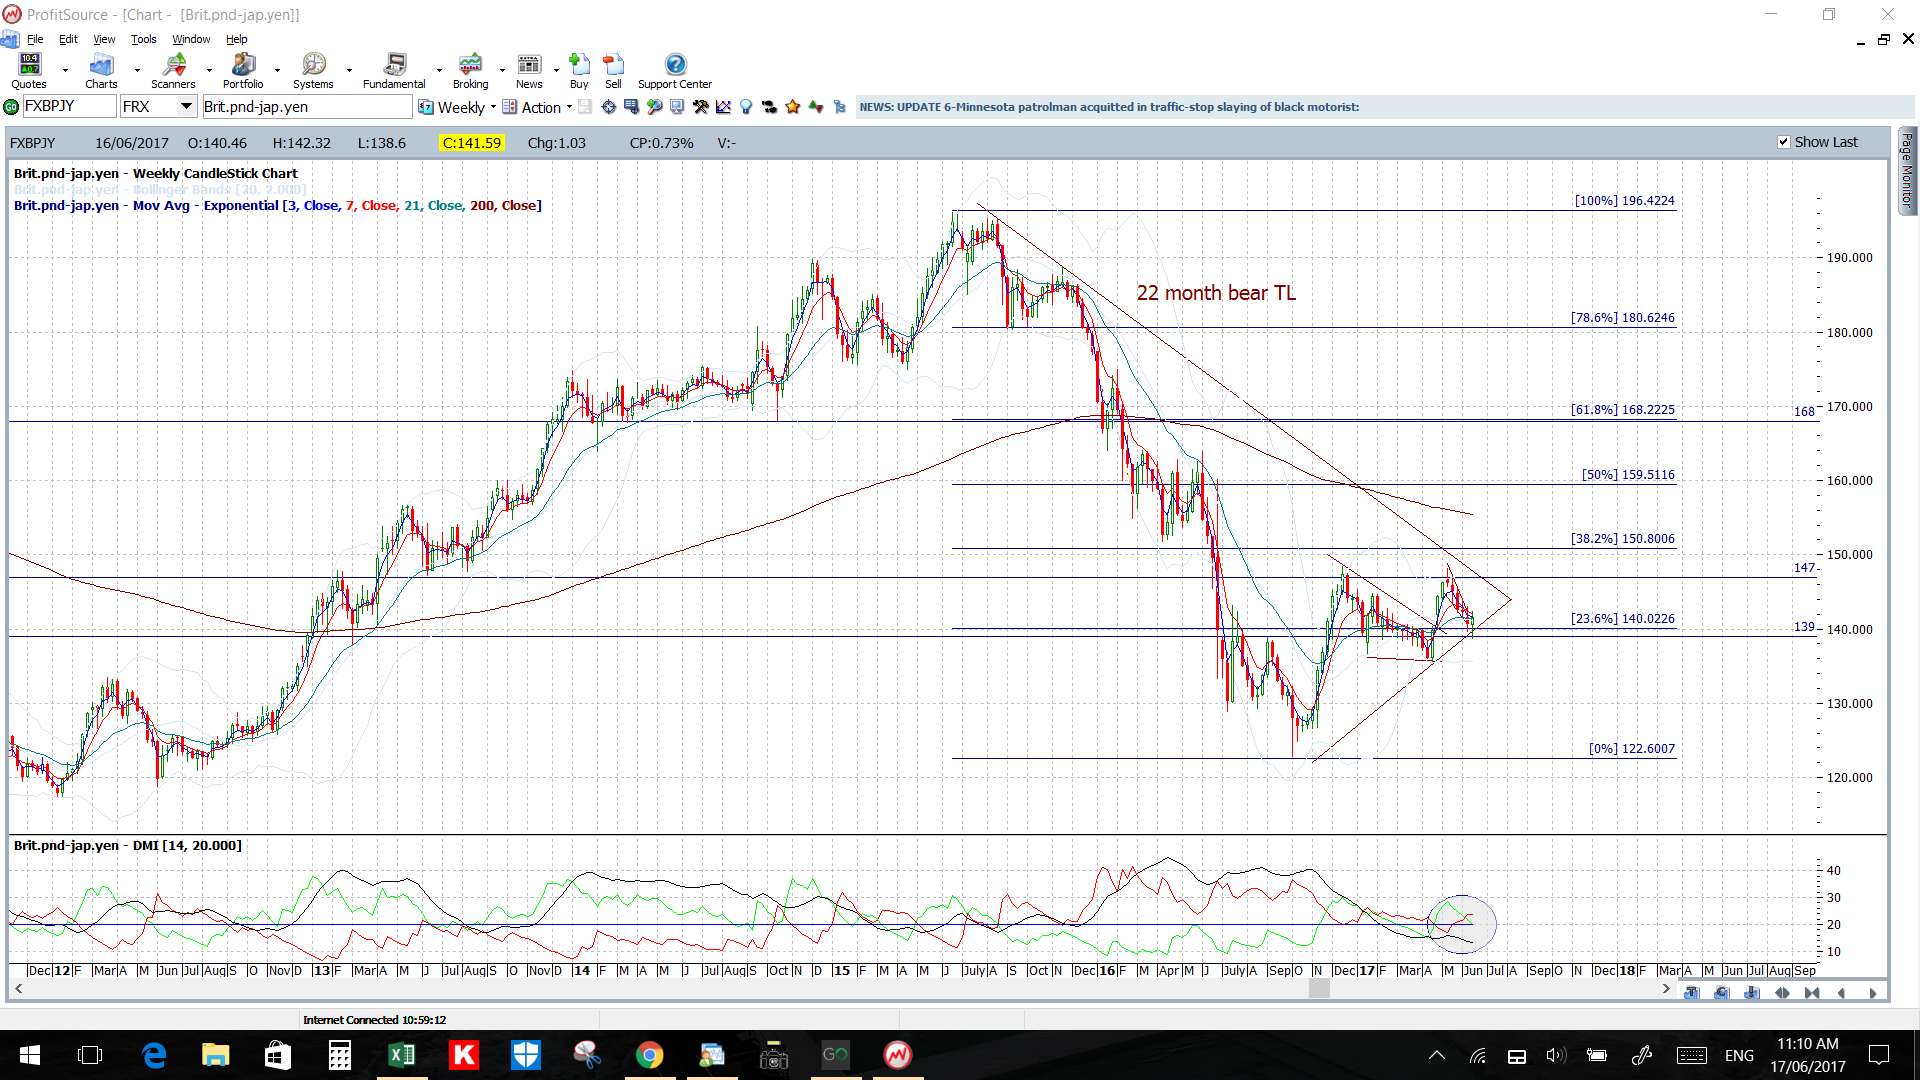
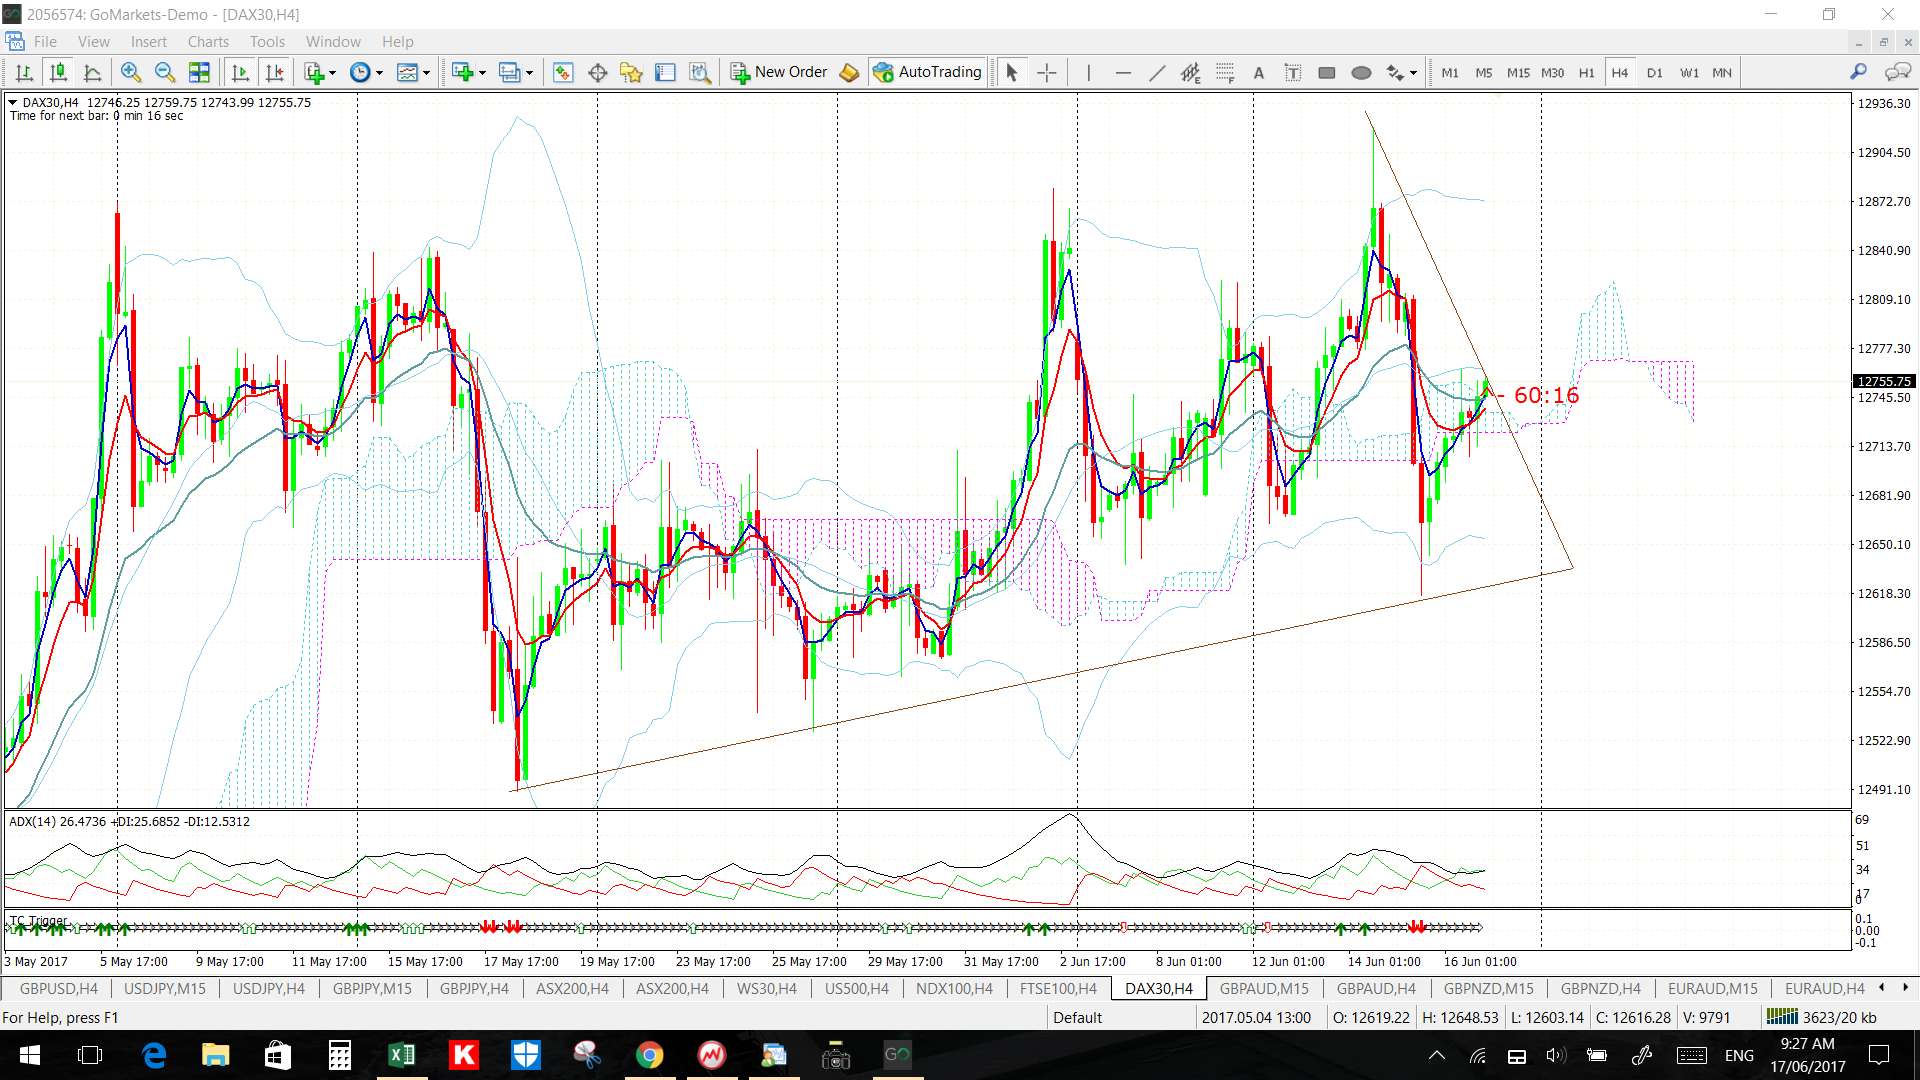
- GBP/JPY: 60 pips: updated in this post
- USD/CNH: 230 pips.
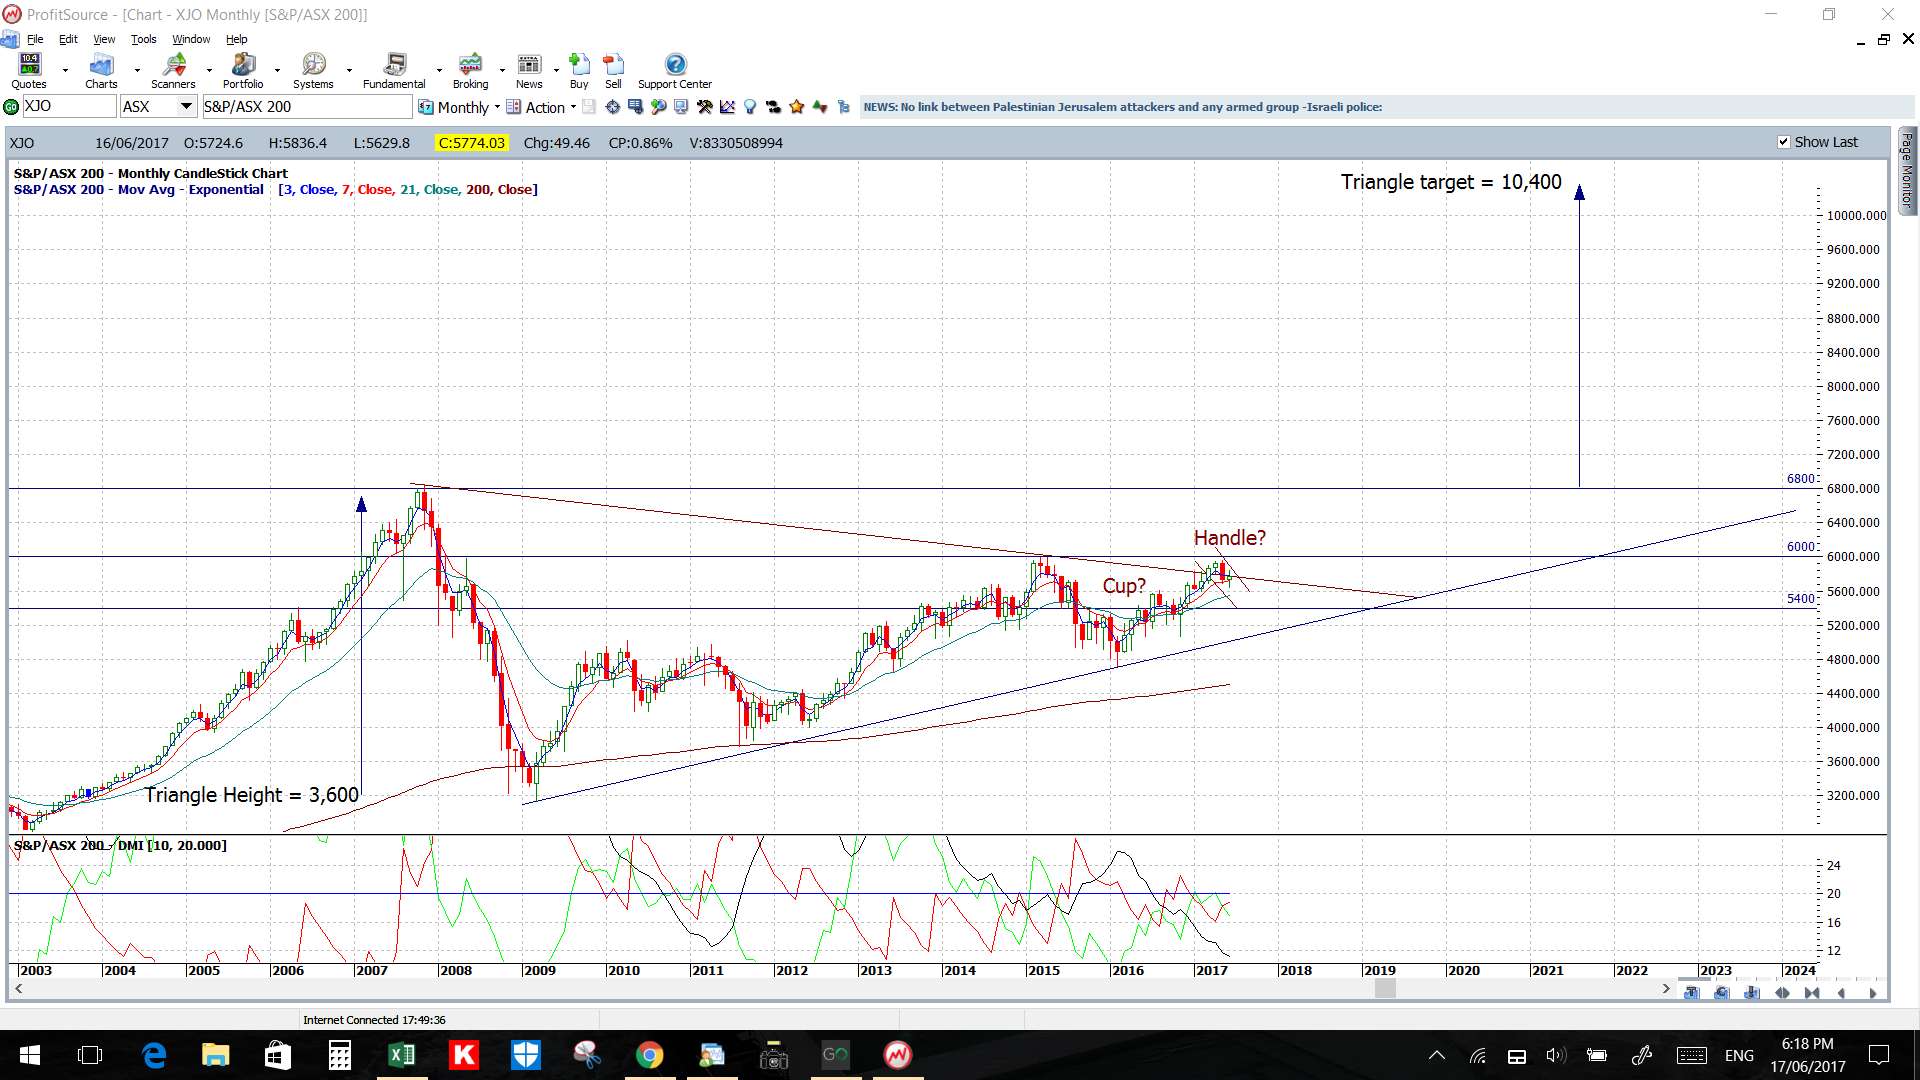
- ASX-200: 145 points.
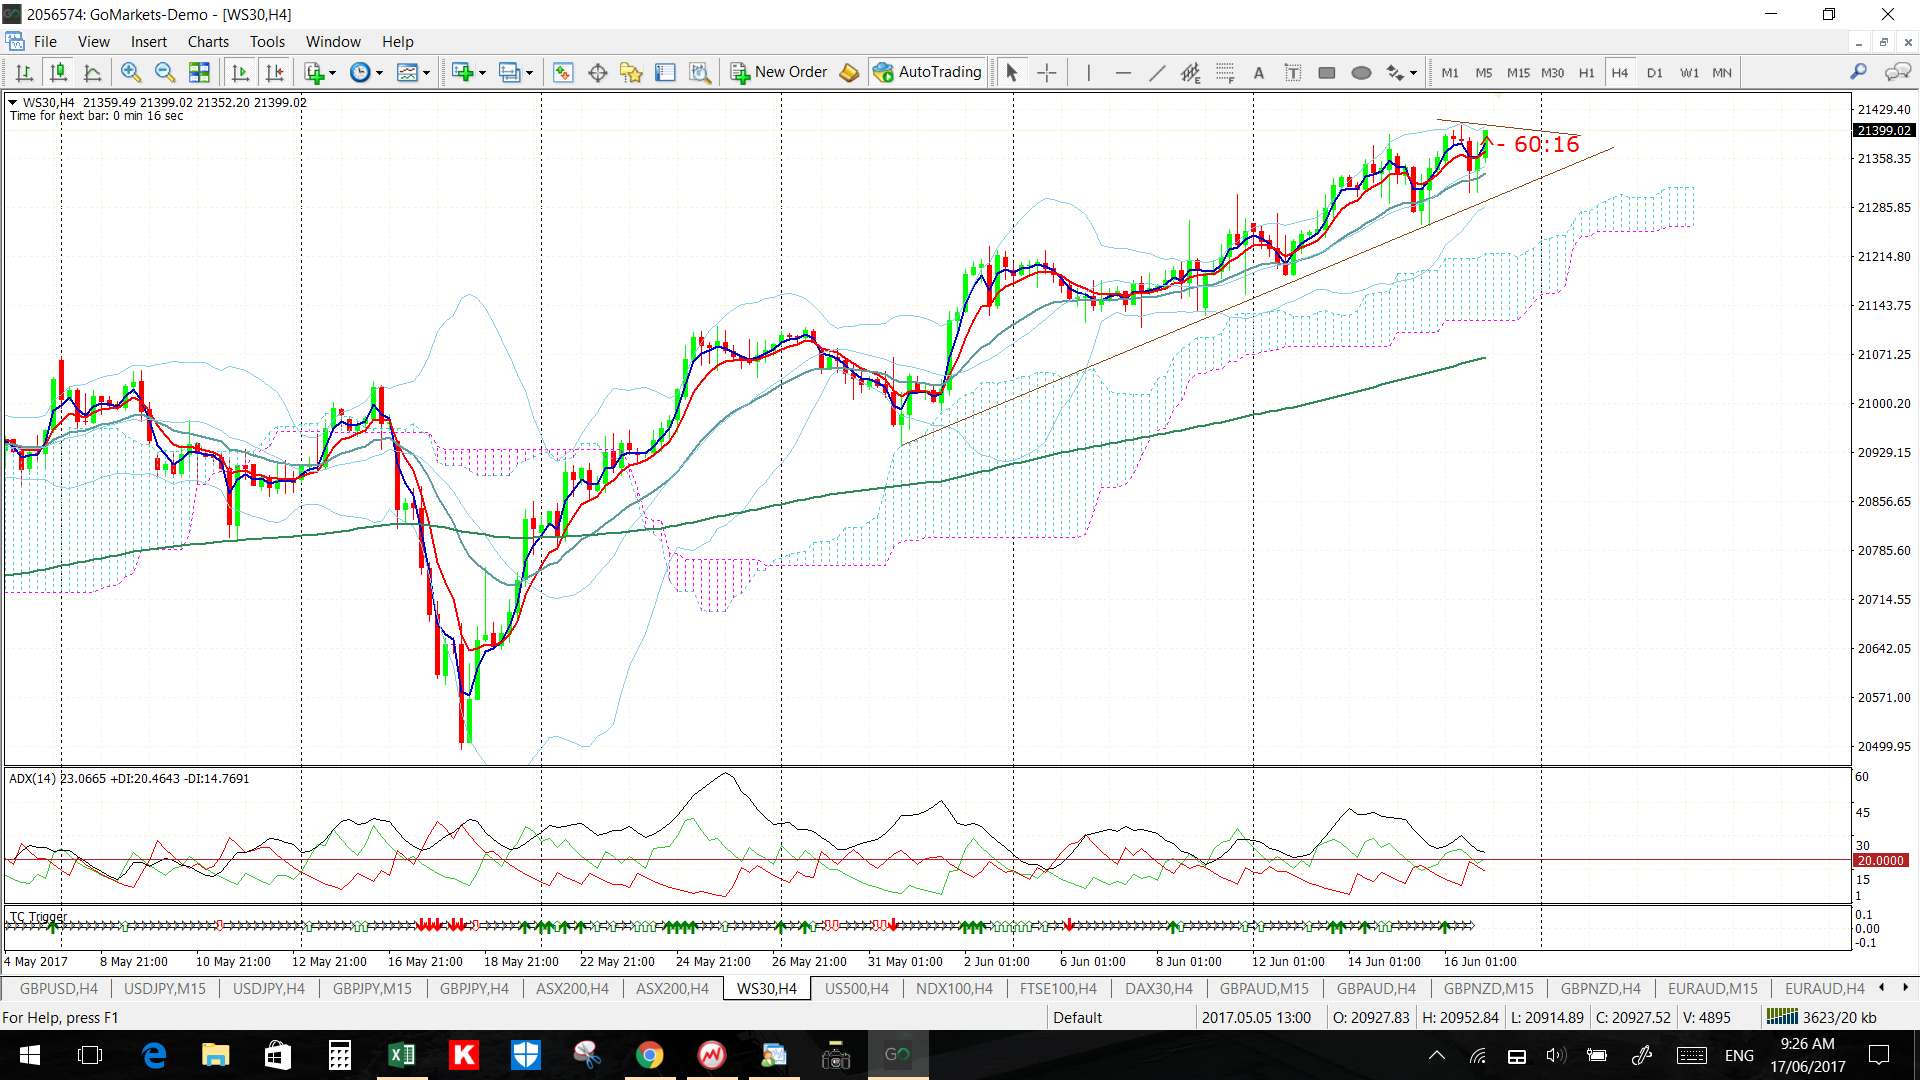
- DJIA: 130 points.
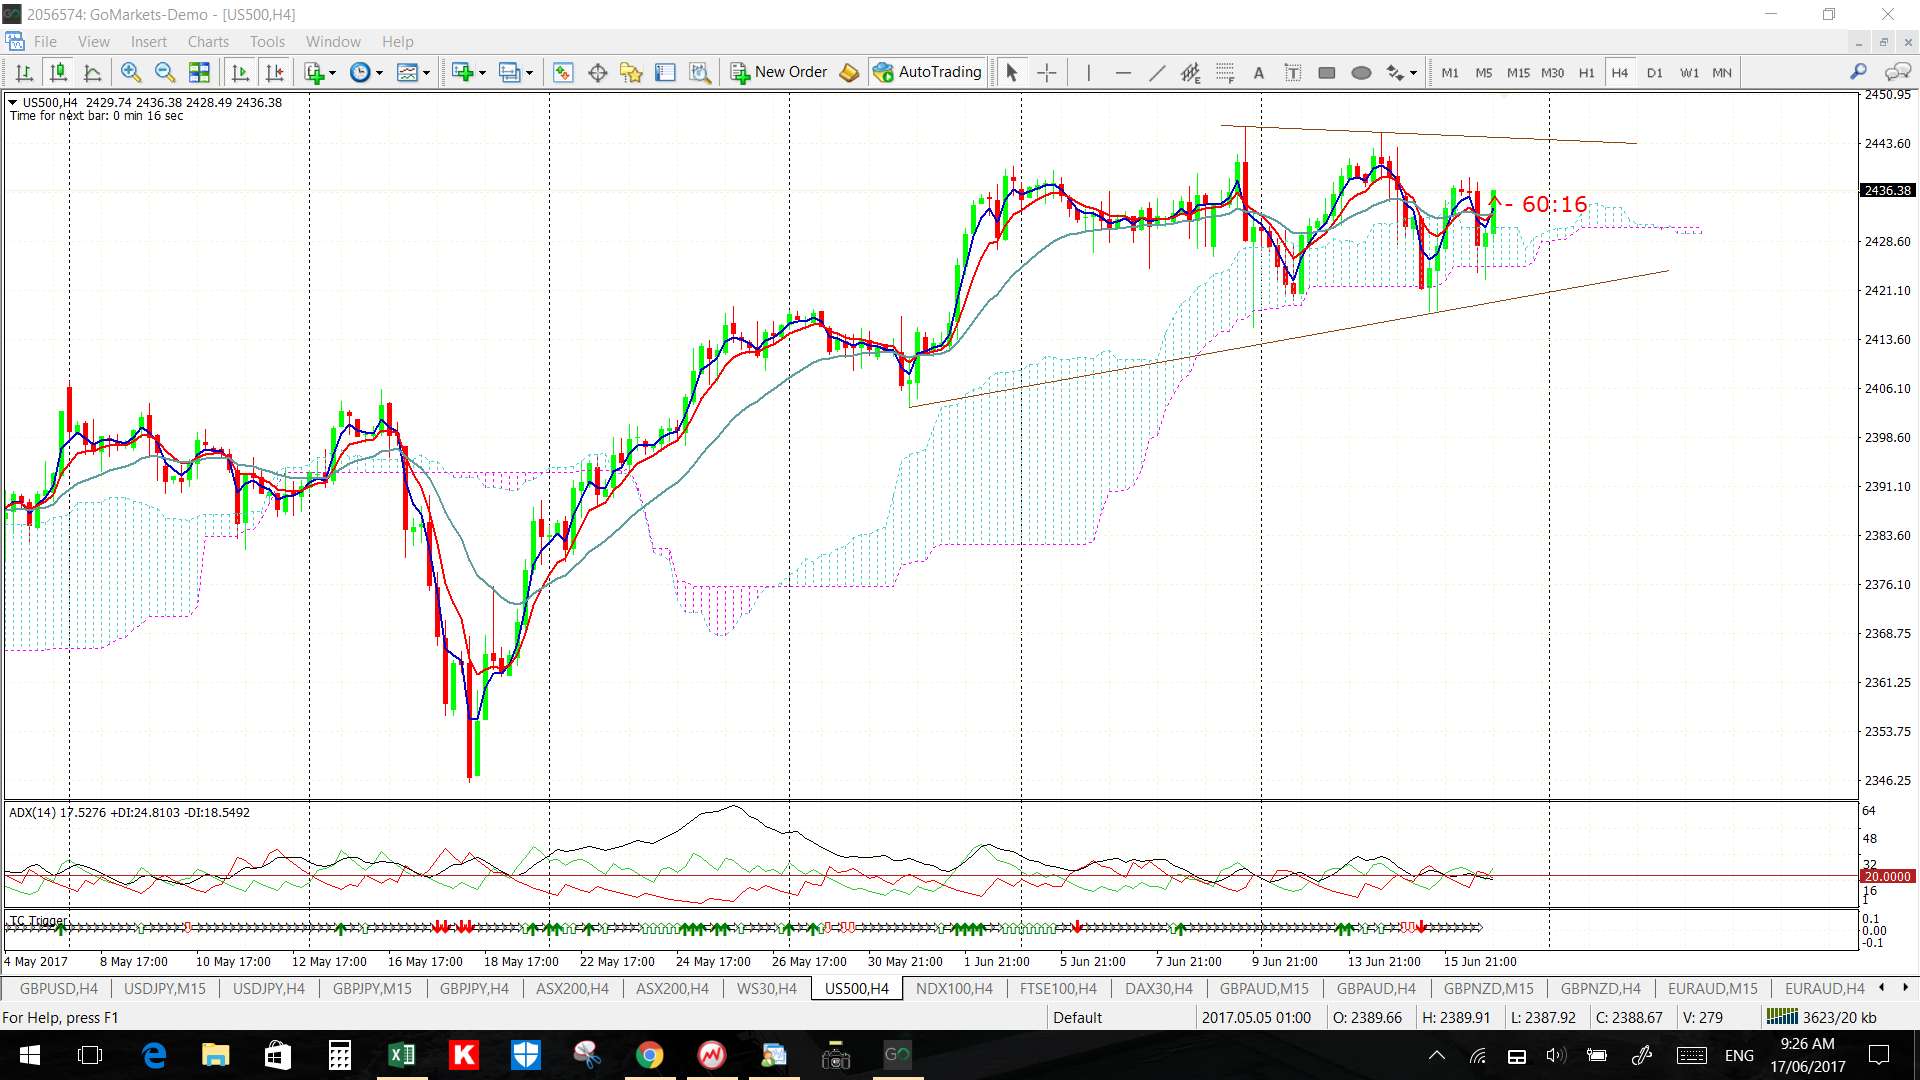
- S&P500: 10 points.
- DAX-30: 130 points.
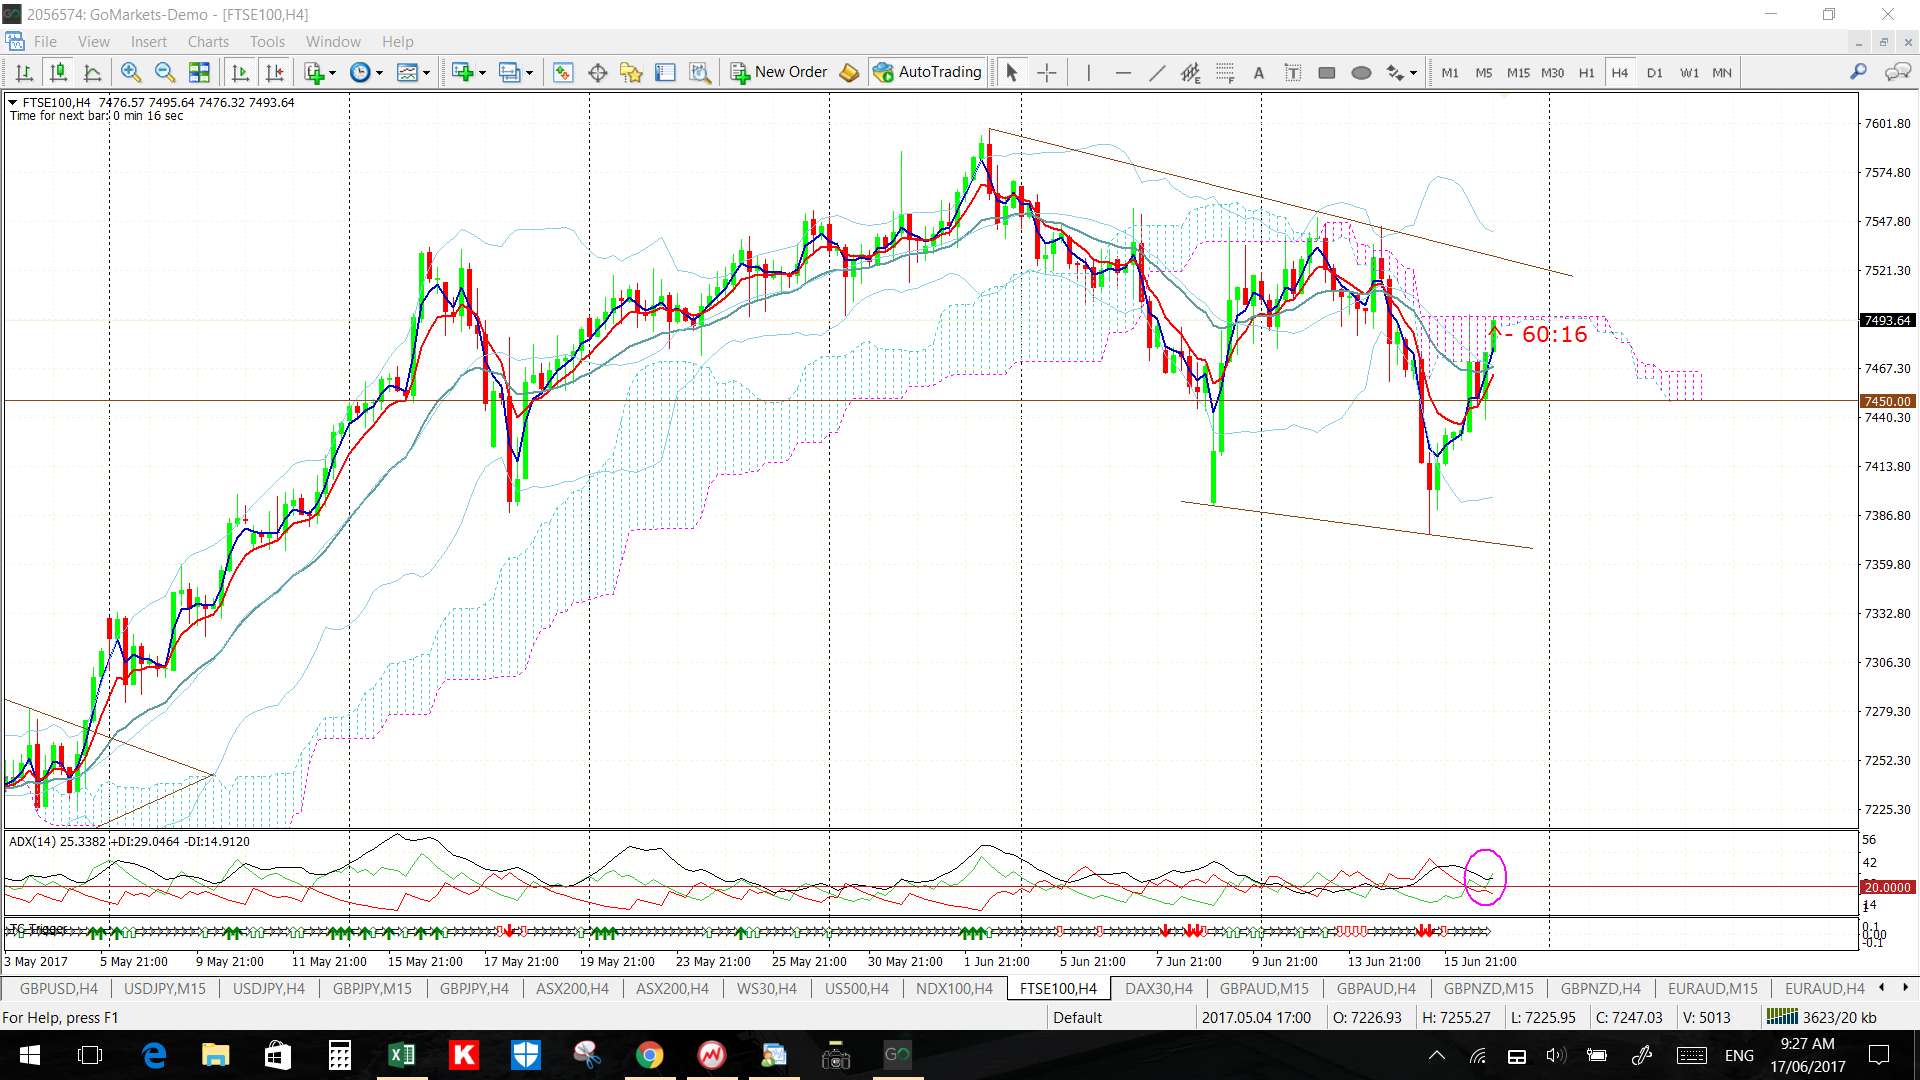
- FTSE: 80 points.
This week:
- US$: The US$ closed slightly lower last week despite the FOMC rate hike and any further US$ weakness would help tip the FX Indices into alignment for ‘risk on’. A review of the FX Indices can be found through this link.
- Central Banks: the RBNZ update interest rates next week.
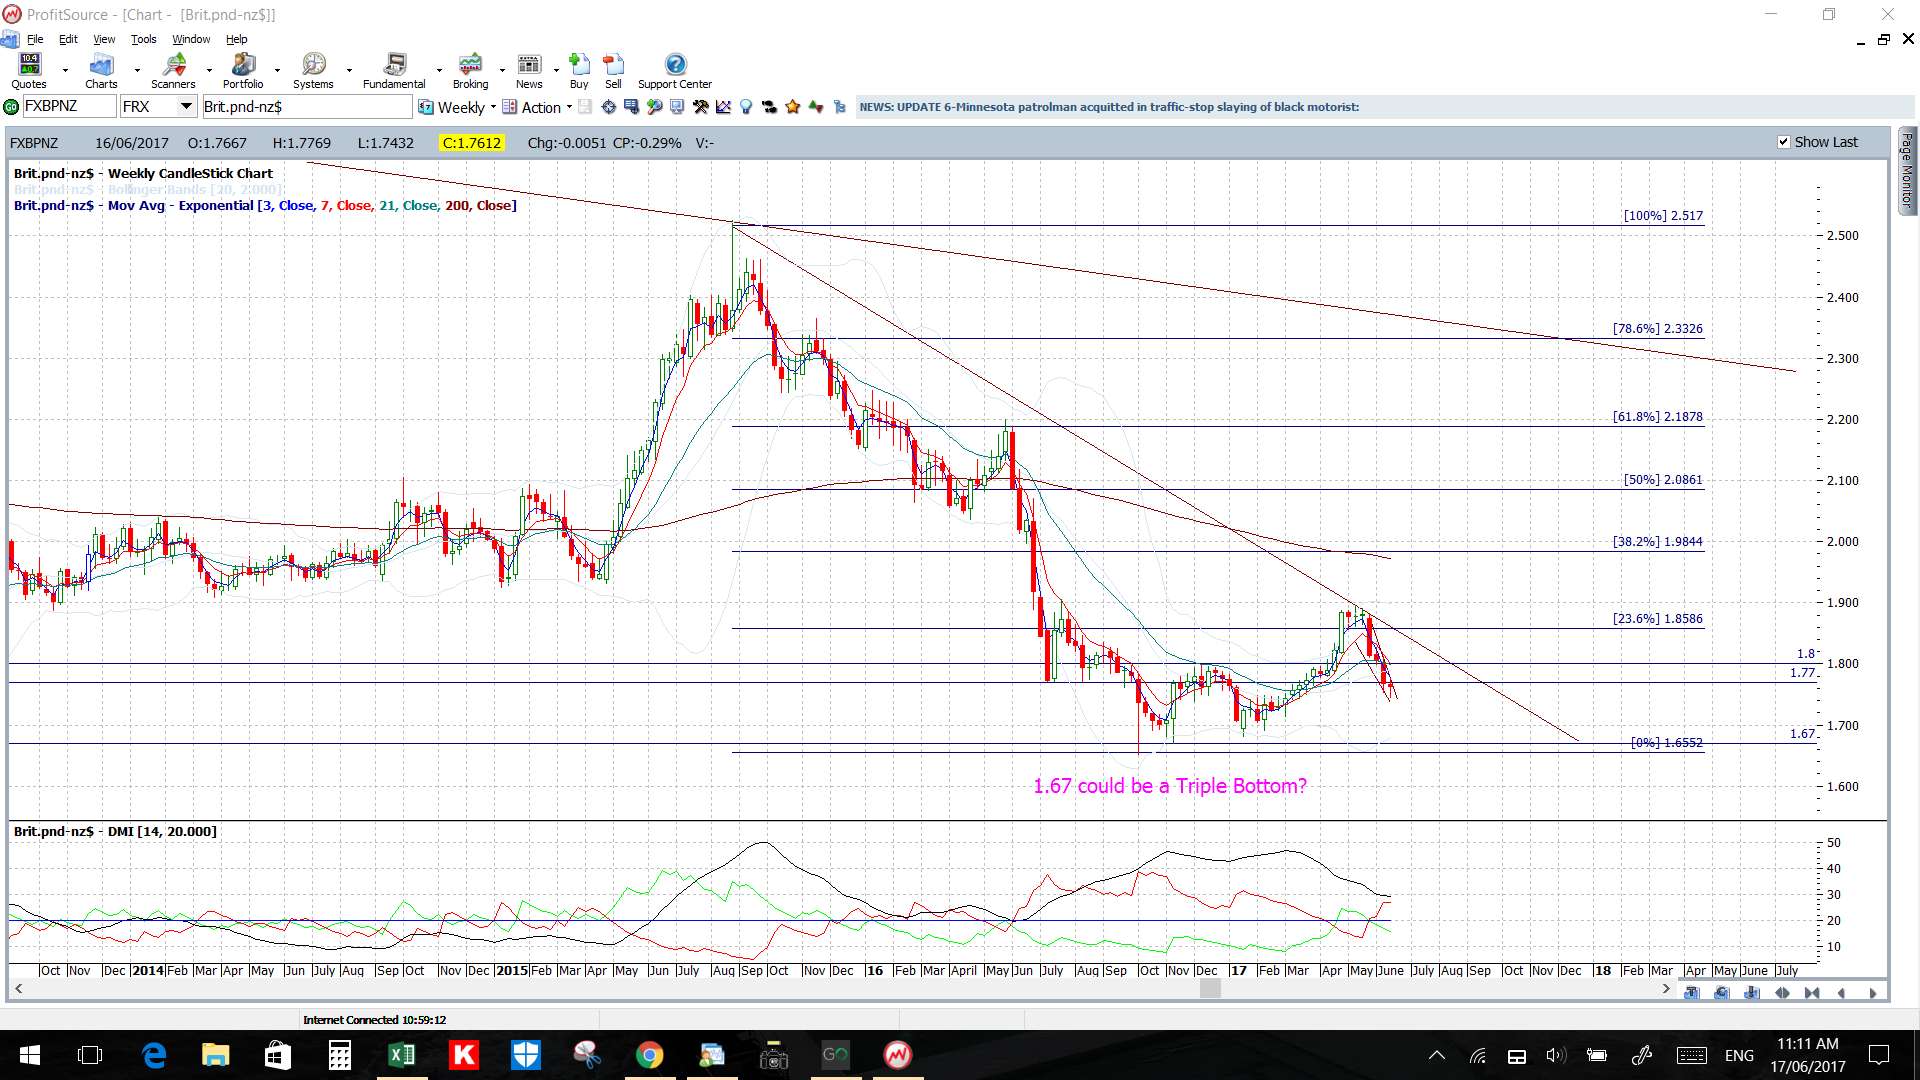
- GBP/AUD, GBP/NZD and GBP/JPY: these pairs continue chopping under 20+ month bear trend lines so watch for any make or breakactivity. These trend lines form part of triangle patterns that technical theory suggests are worth over 4,000 pips so these are well worth monitoring.
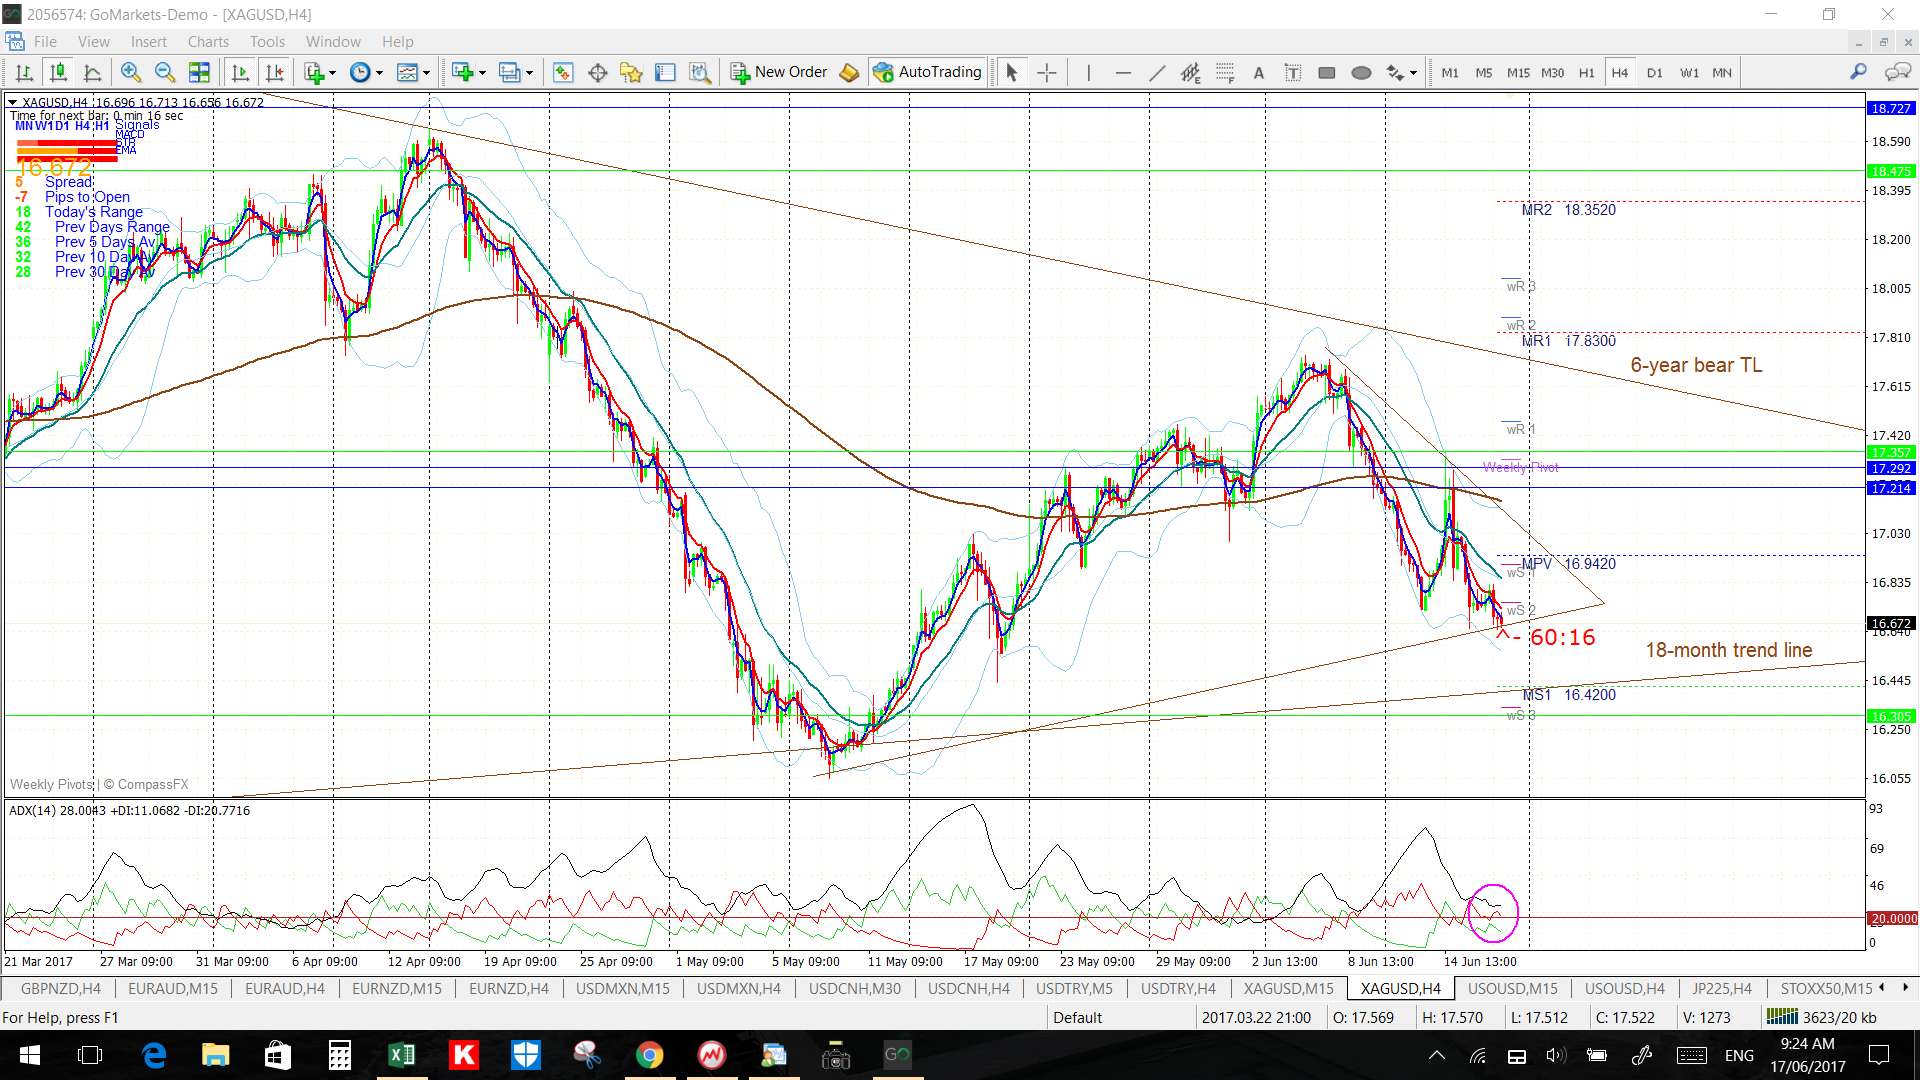
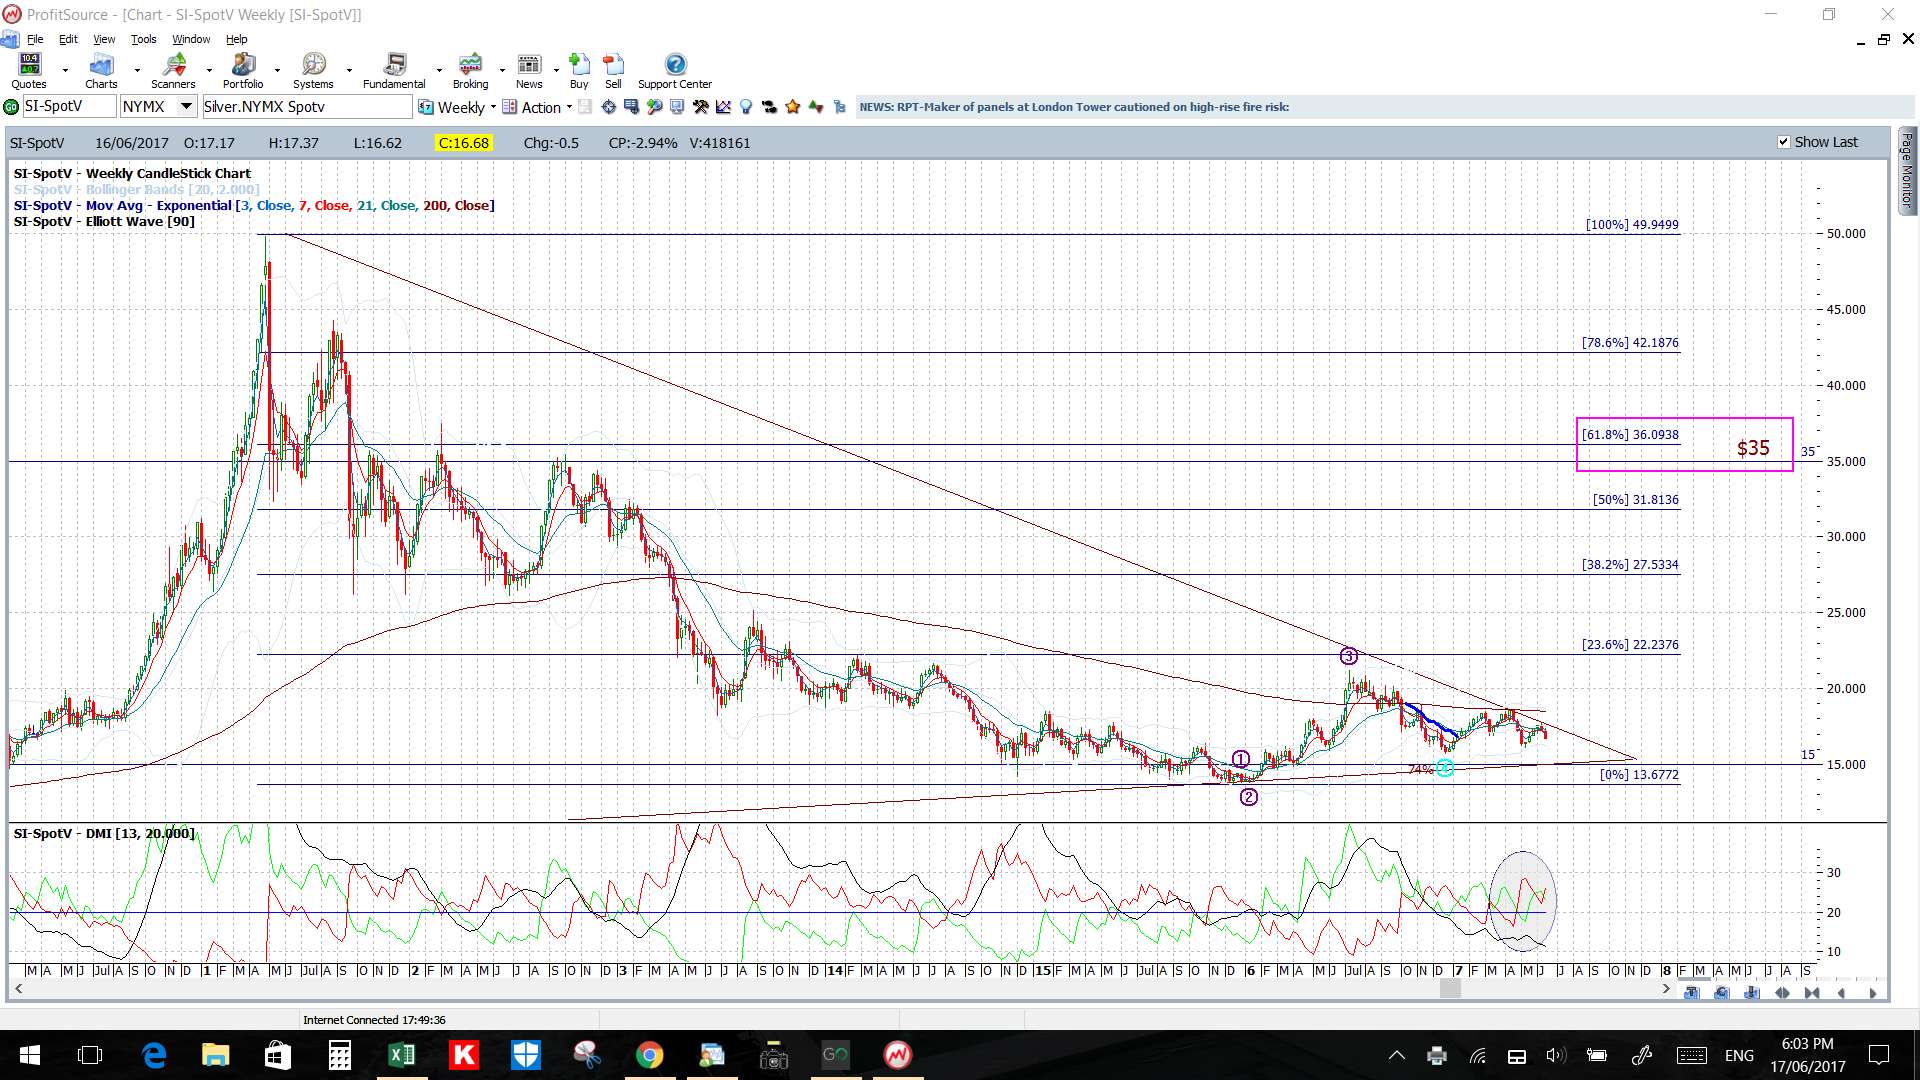
- Gold and Silver: both metals remains below 6-year bear trend lines but, as previously mentioned, I would expect some choppiness around these major demarcation zones.
- AUD/USD: the Aussie has broken above a 41/2-year bear trend line so watch for any hold above this region to support an inflection-type move for the currency.
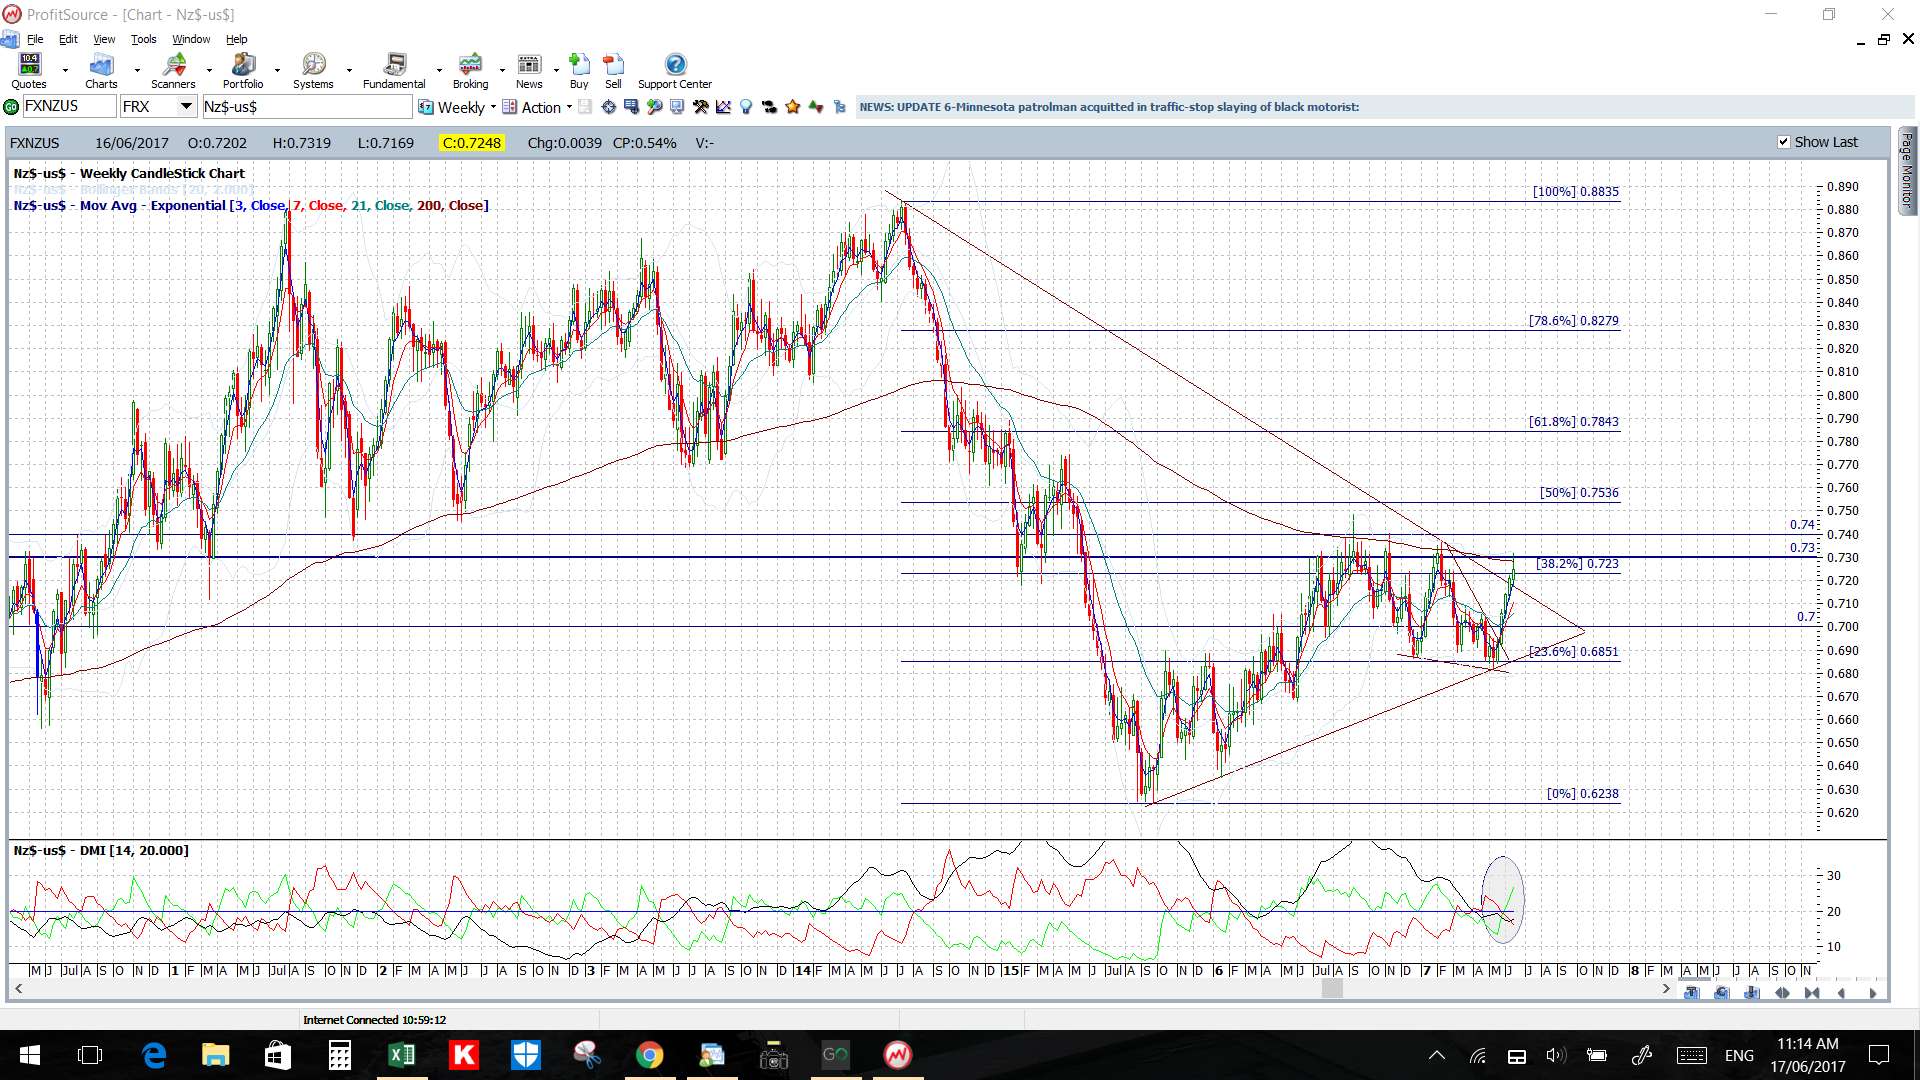
- NZD/USD: the Kiwi has held above a 3-year bear trend line so watch for any continuation above this region to support an inflection-type move for this currency too.
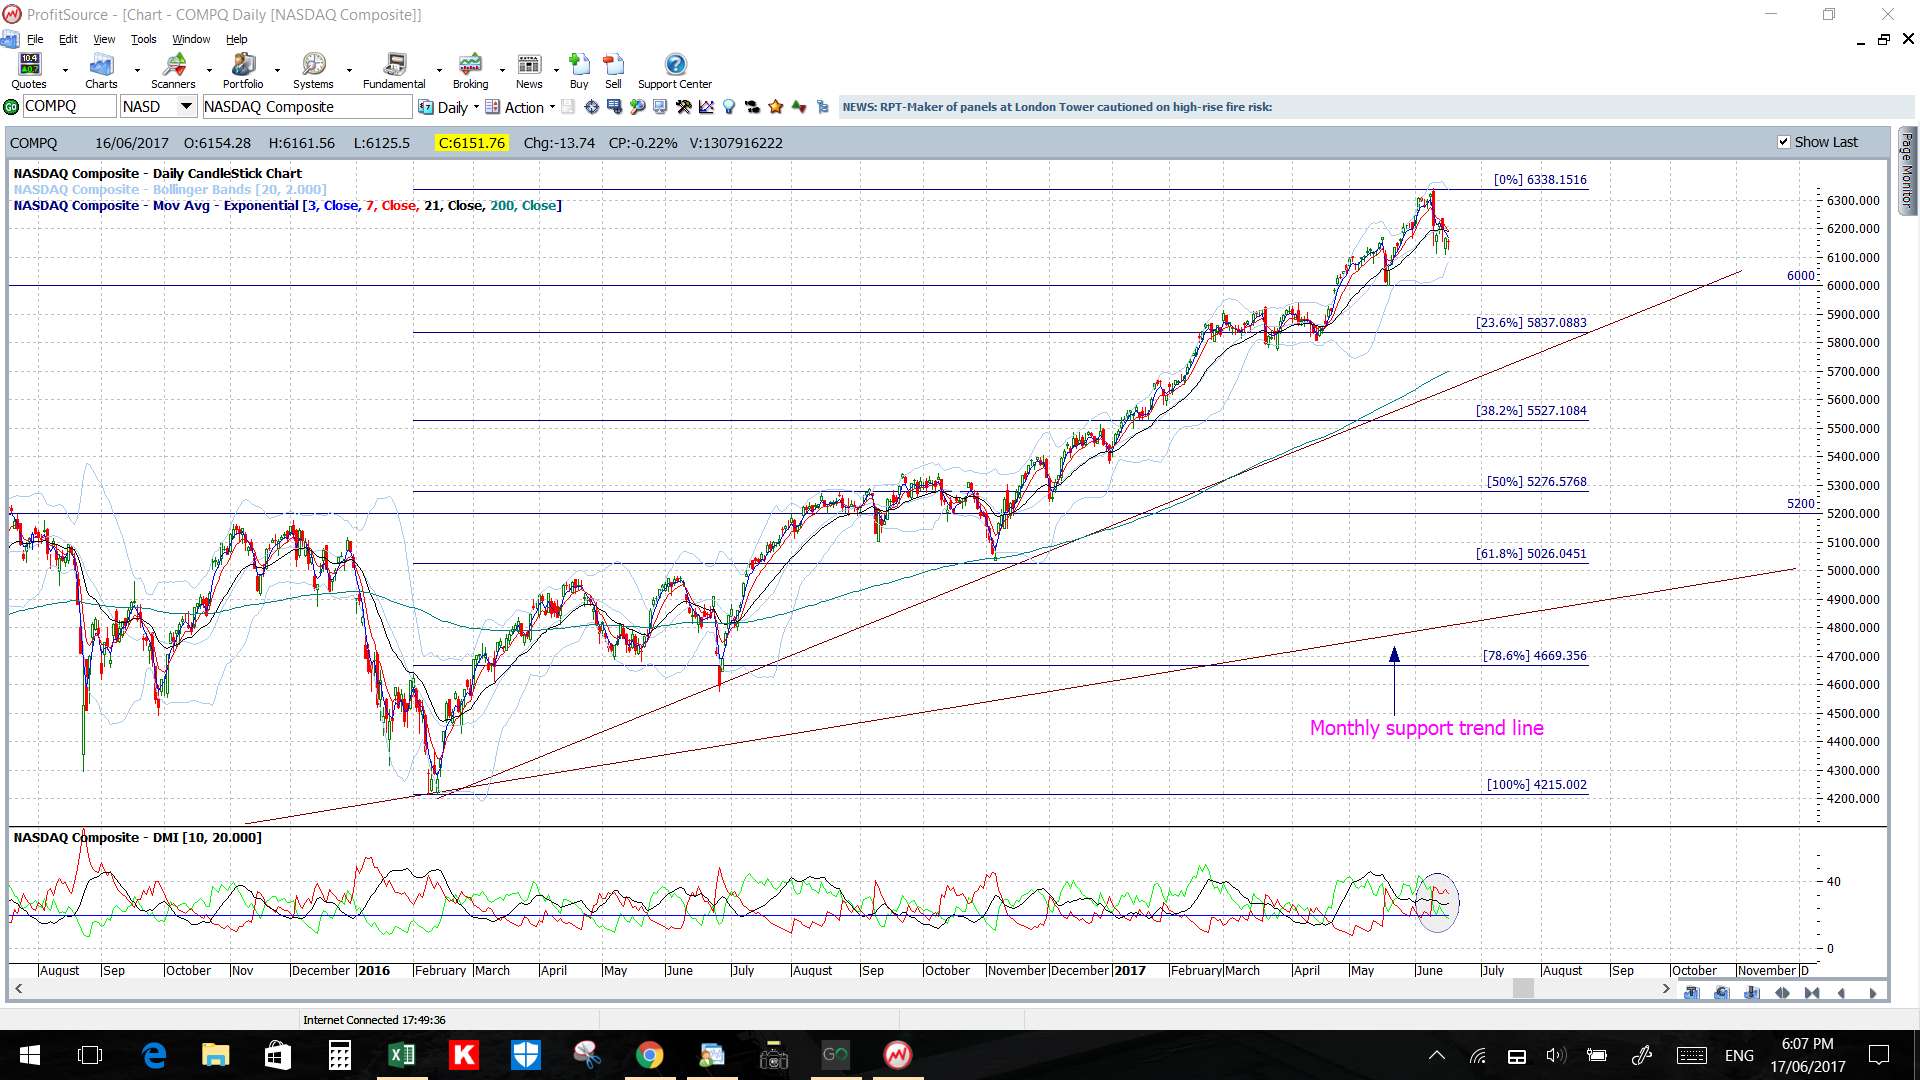
- NASDAQ: much has been made about recent NASDAQ weakness but the following daily and monthly charts might help to put this into some perspective. The current swing high move has been going since February 2016, some 16 months, and there is quite a bit of room between current price and the daily support trend line for a pause or pullback move. However, if there is any break down below the daily support trend line then I’ll be looking for a test of the daily chart’s 61.8% fib which happens to be near the 5,200 ascending triangle breakout level. Confluence!

- E-mail: It has come to my attention that correspondence sent to me through the website is not being delivered to my e-mail. Thus, would people who have comments or question please send them directly to me via e-mail at [email protected].
- Podcast: I listen to podcasts each morning as I walk the beach and this was one that I think was well worth listening to: ‘Google is God, Facebook is love and Amazon will be worth $1 trillion‘: Scott Galloway, founder, L2 recorded by Recode Decode, hosted by Kara Swisher in Podcasts. Find it through this link. This is particularly poignant after Friday’s AMAZON Whole Foods announcement!
Calendar:
- Mon 19th: AUD RBA Gov Lowe speaks.
- Tue 20th: AUD Monetary Policy Meeting Minutes.
- Wed 21st: USD Crude Oil Inventories. Winter Solstice down here! Yeah…this means that Summer is on the way!
- Thurs 22nd: NZD RBNZ Interest Rate update. CAD Core Retail Sales. USD Weekly Unemployment Claims.
- Fri 23rd: CAD CPI.
Forex:
EUR/USD: The EUR/USD has essentially been chopping sideways in a trading channel for the last 4 weeks.
Watch the 4hr chart’s channel trend lines for any breakout move:
- Upper targets: any bullish breakout will focus 1.15, as previous S/R, followed by 1.18 as the daily chart triangle breakout target.
- Lower targets: any bearish breakout would have me looking for a test of 1.095 S/R followed by the daily chart’s broken trend line. After that, the 4hr chart’s 61.8% Fib.
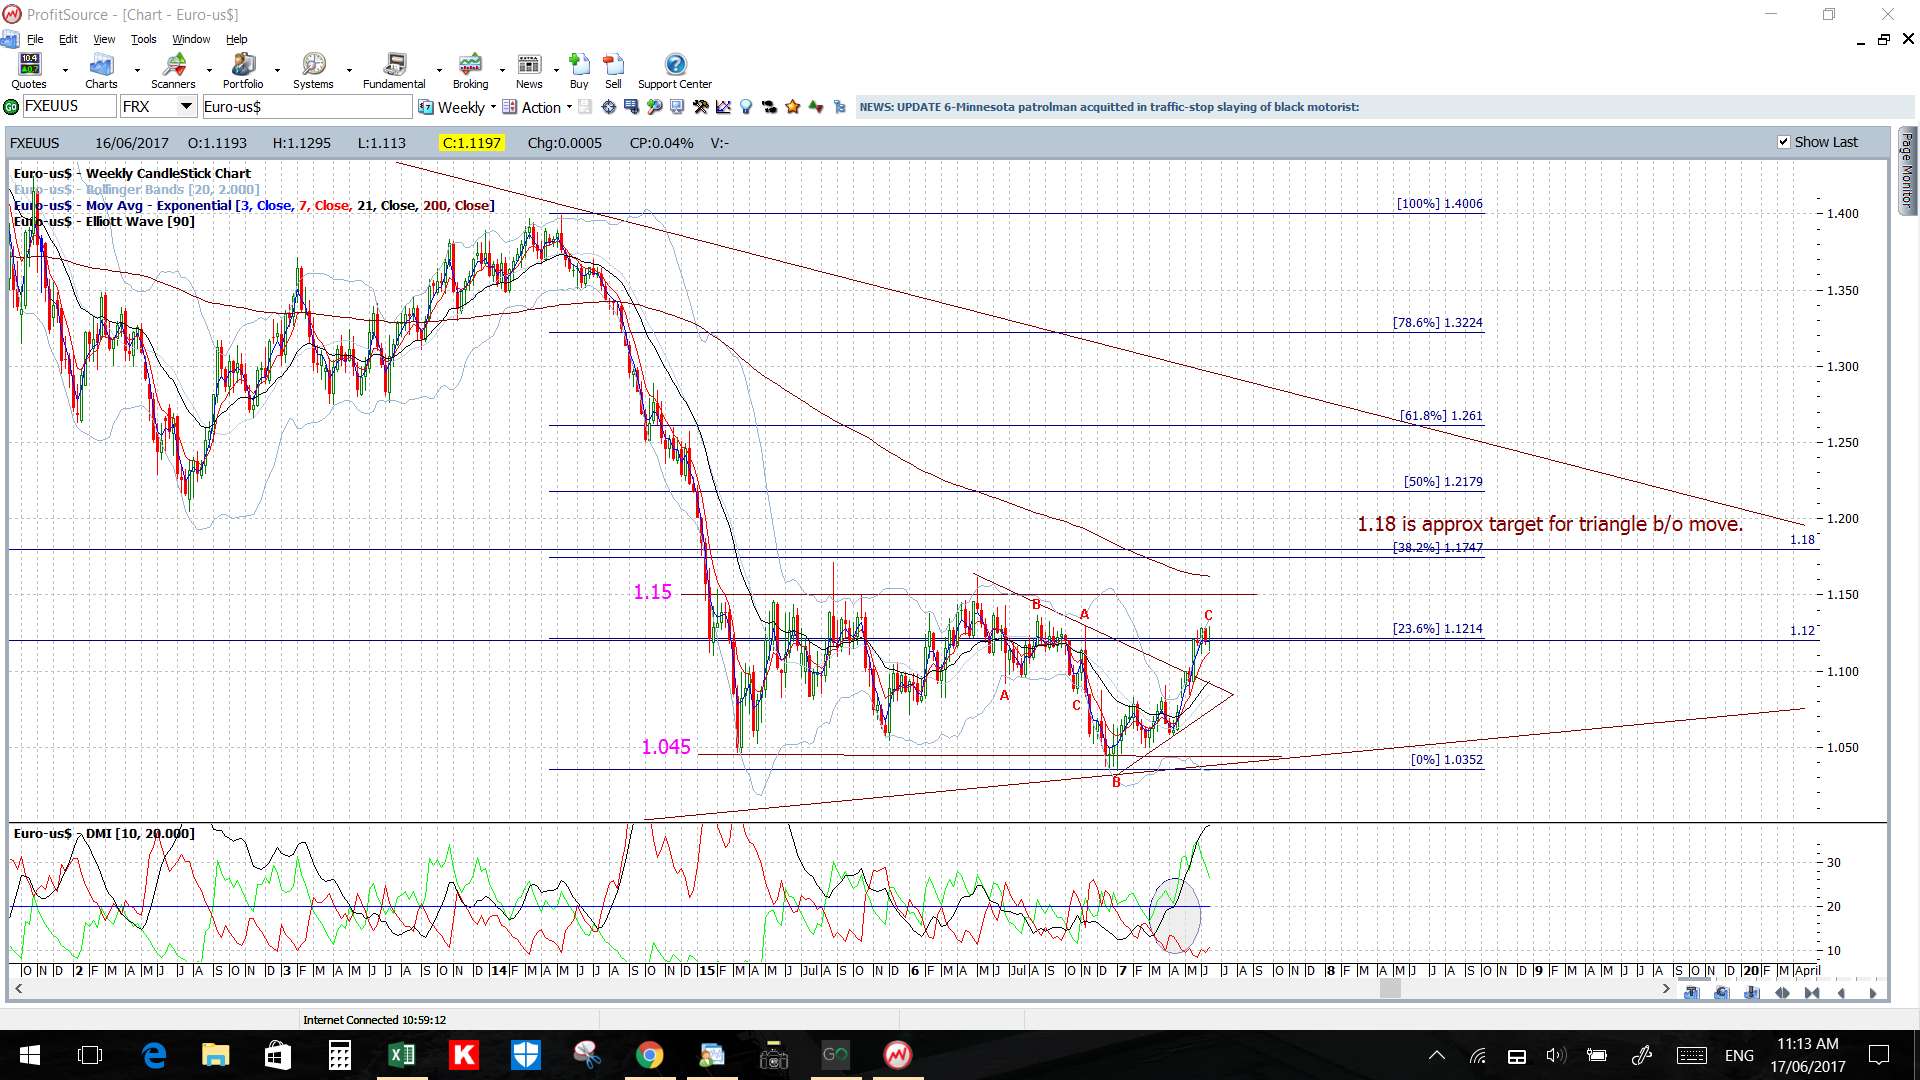
Remember: The yield from the earlier triangle breakout remains around 280 pips of a projected move that could be worth up to 800 pips. The target for the daily triangle breakout move is up near 1.18 and this is near the upper edge of the trading range for this pair since the start of 2015 (shown on the weekly chart below).
Watch for any impact from all this week’s EUR PMIs 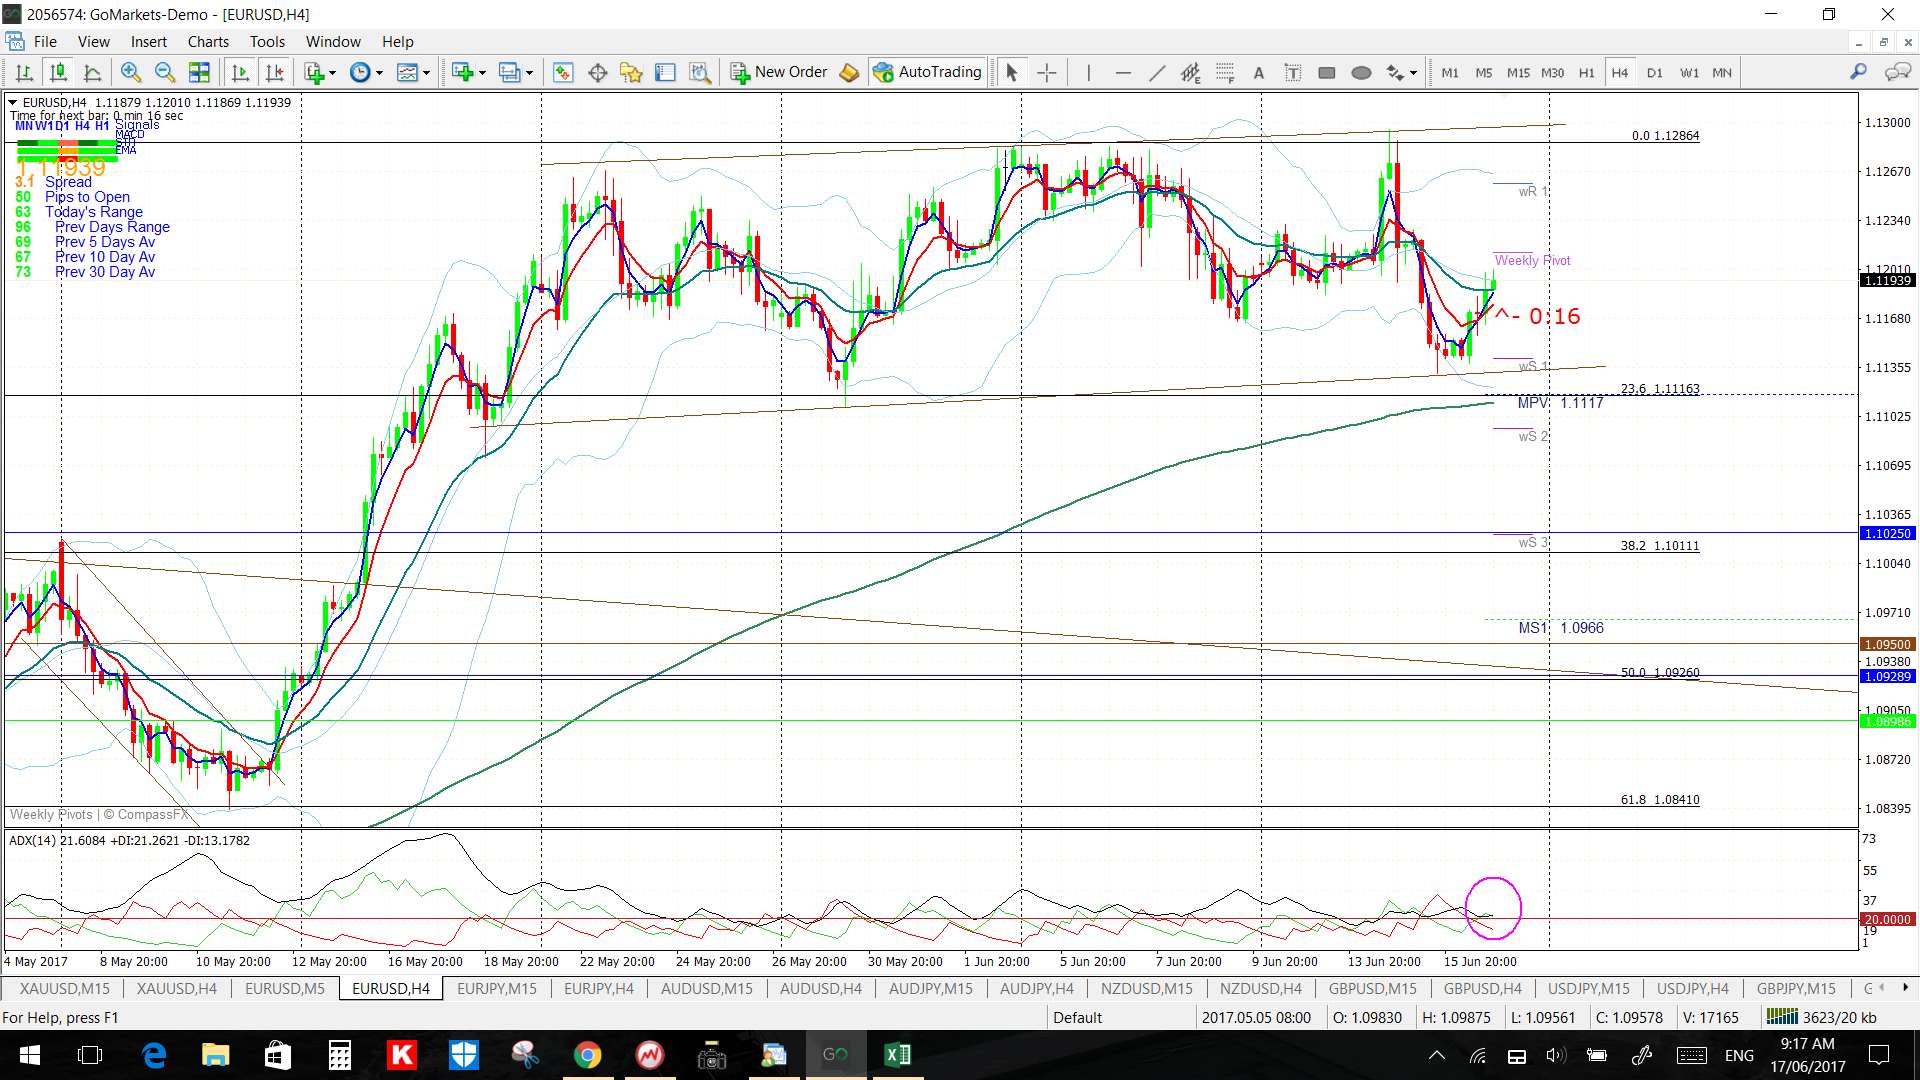
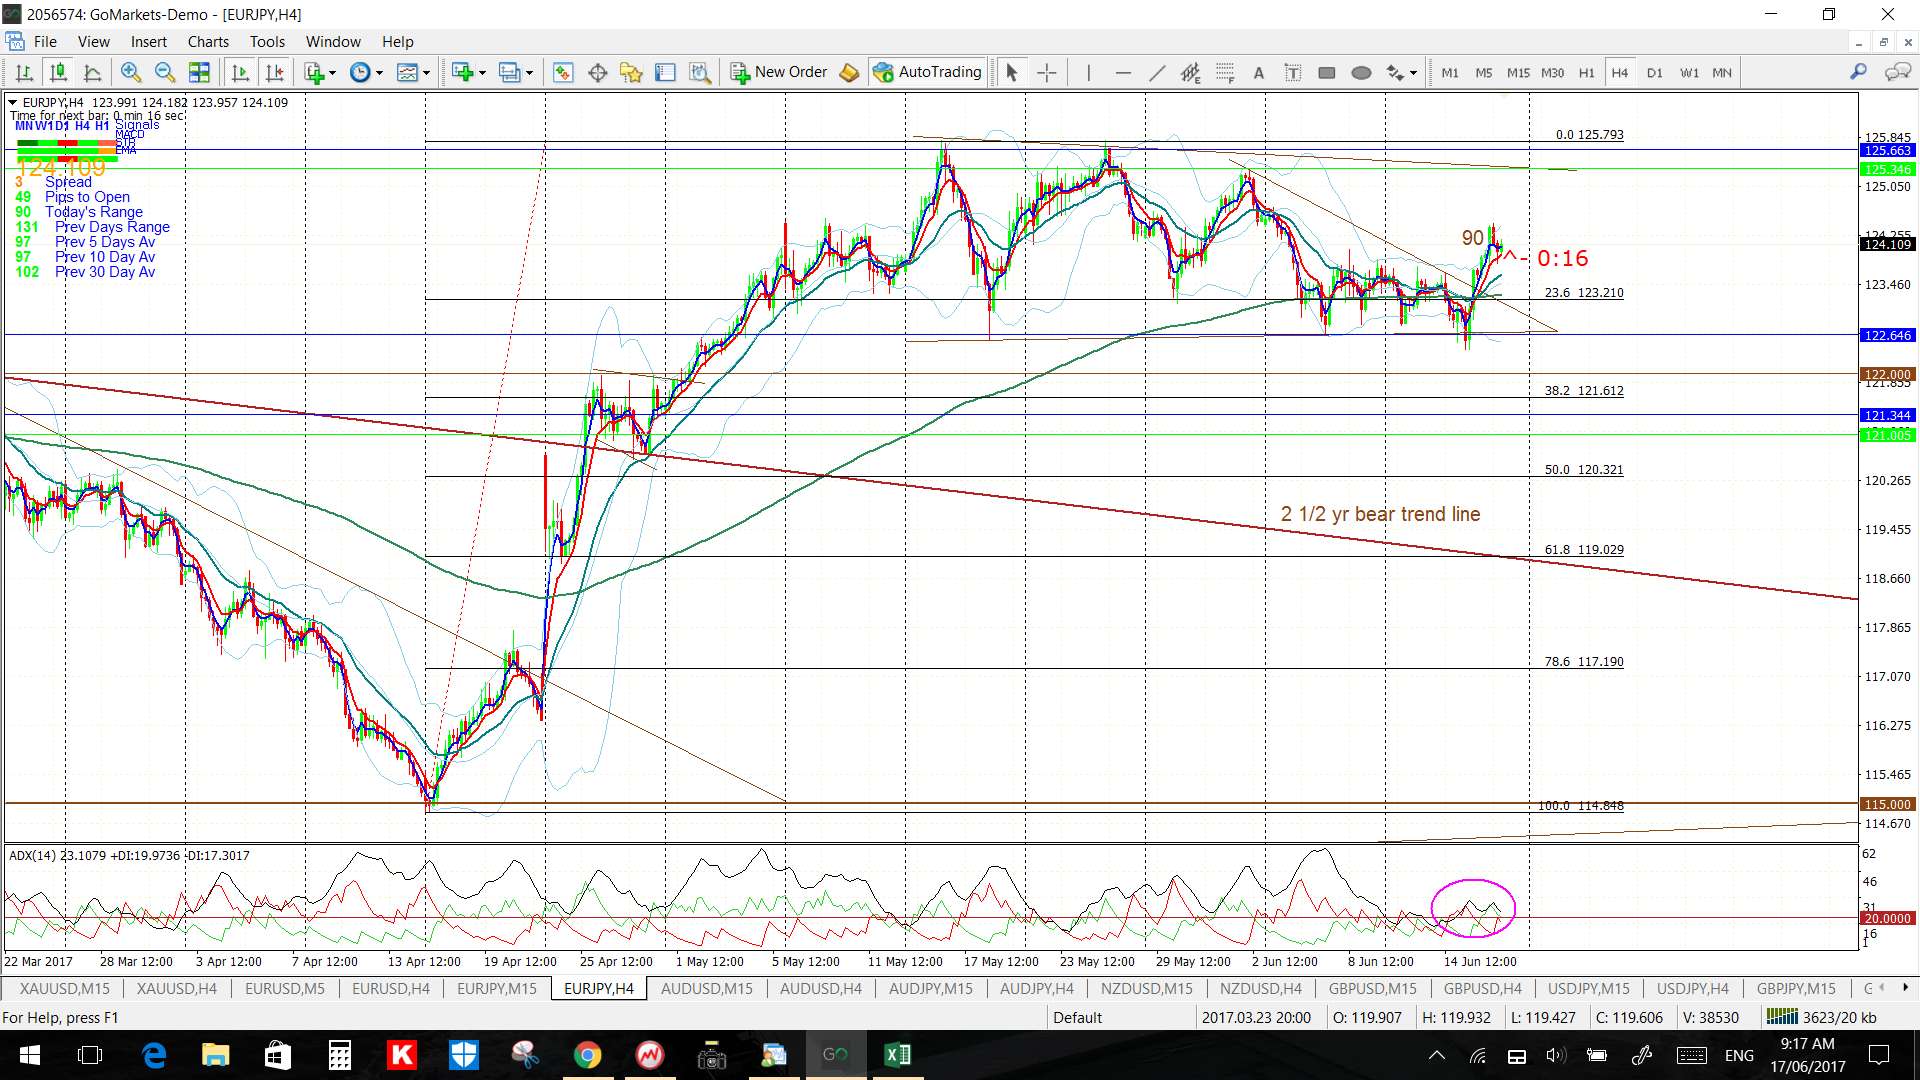
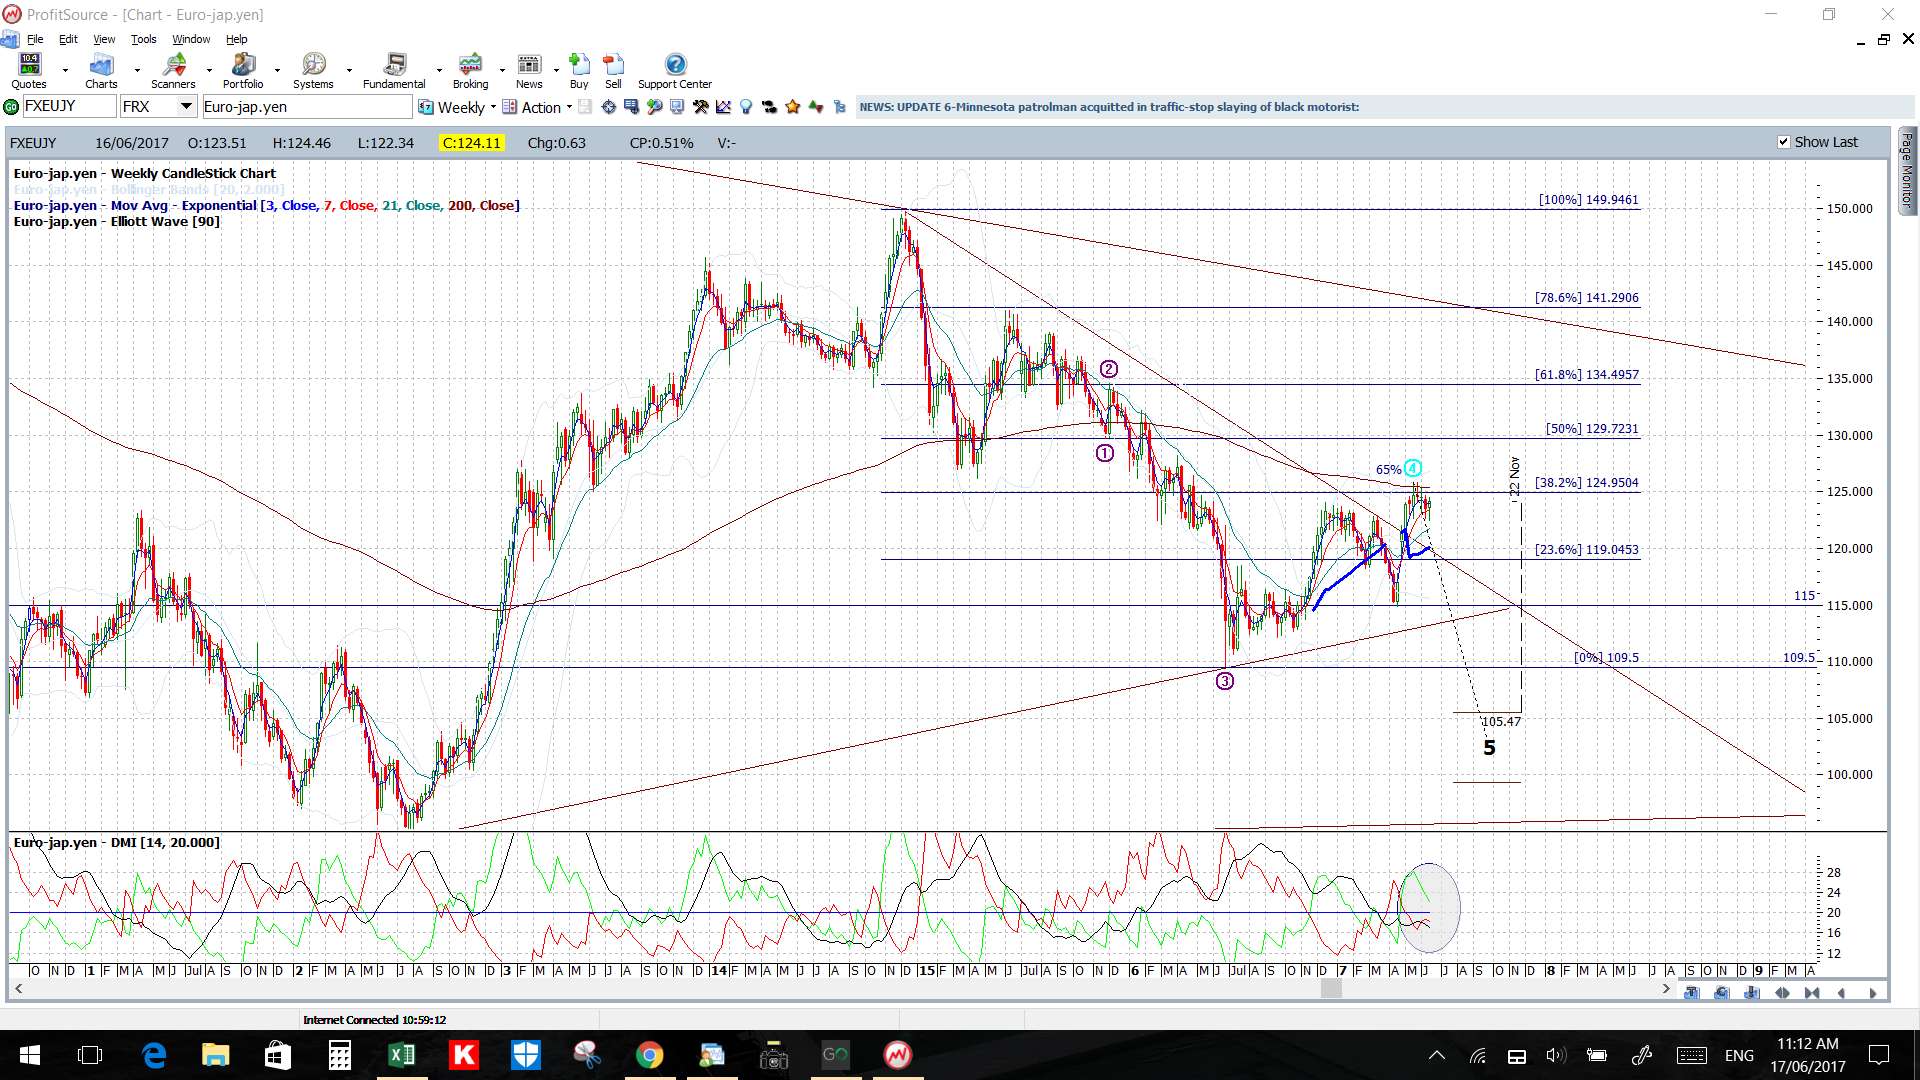
EUR/JPY: This pair has also been chopping sideways in a wide trading channel but for the last five weeks. It broke out of a more recent triangle pattern, set within this channel, during Thursday’s European session and still remains above a previously broken 2 ½ bear trend line.
Watch the 4hr chart’s trading channel trend lines for any new breakout:
- Upper targets: any bullish breakout would have me looking for a test of the weekly chart’s 61.8% Fib, near 135.
- Lower targets: any bearish breakout would have me looking for a test of the daily chart’s broken 2 ½ bear trend line which is now nearer to the 4hr chart’s 61.8% Fib.
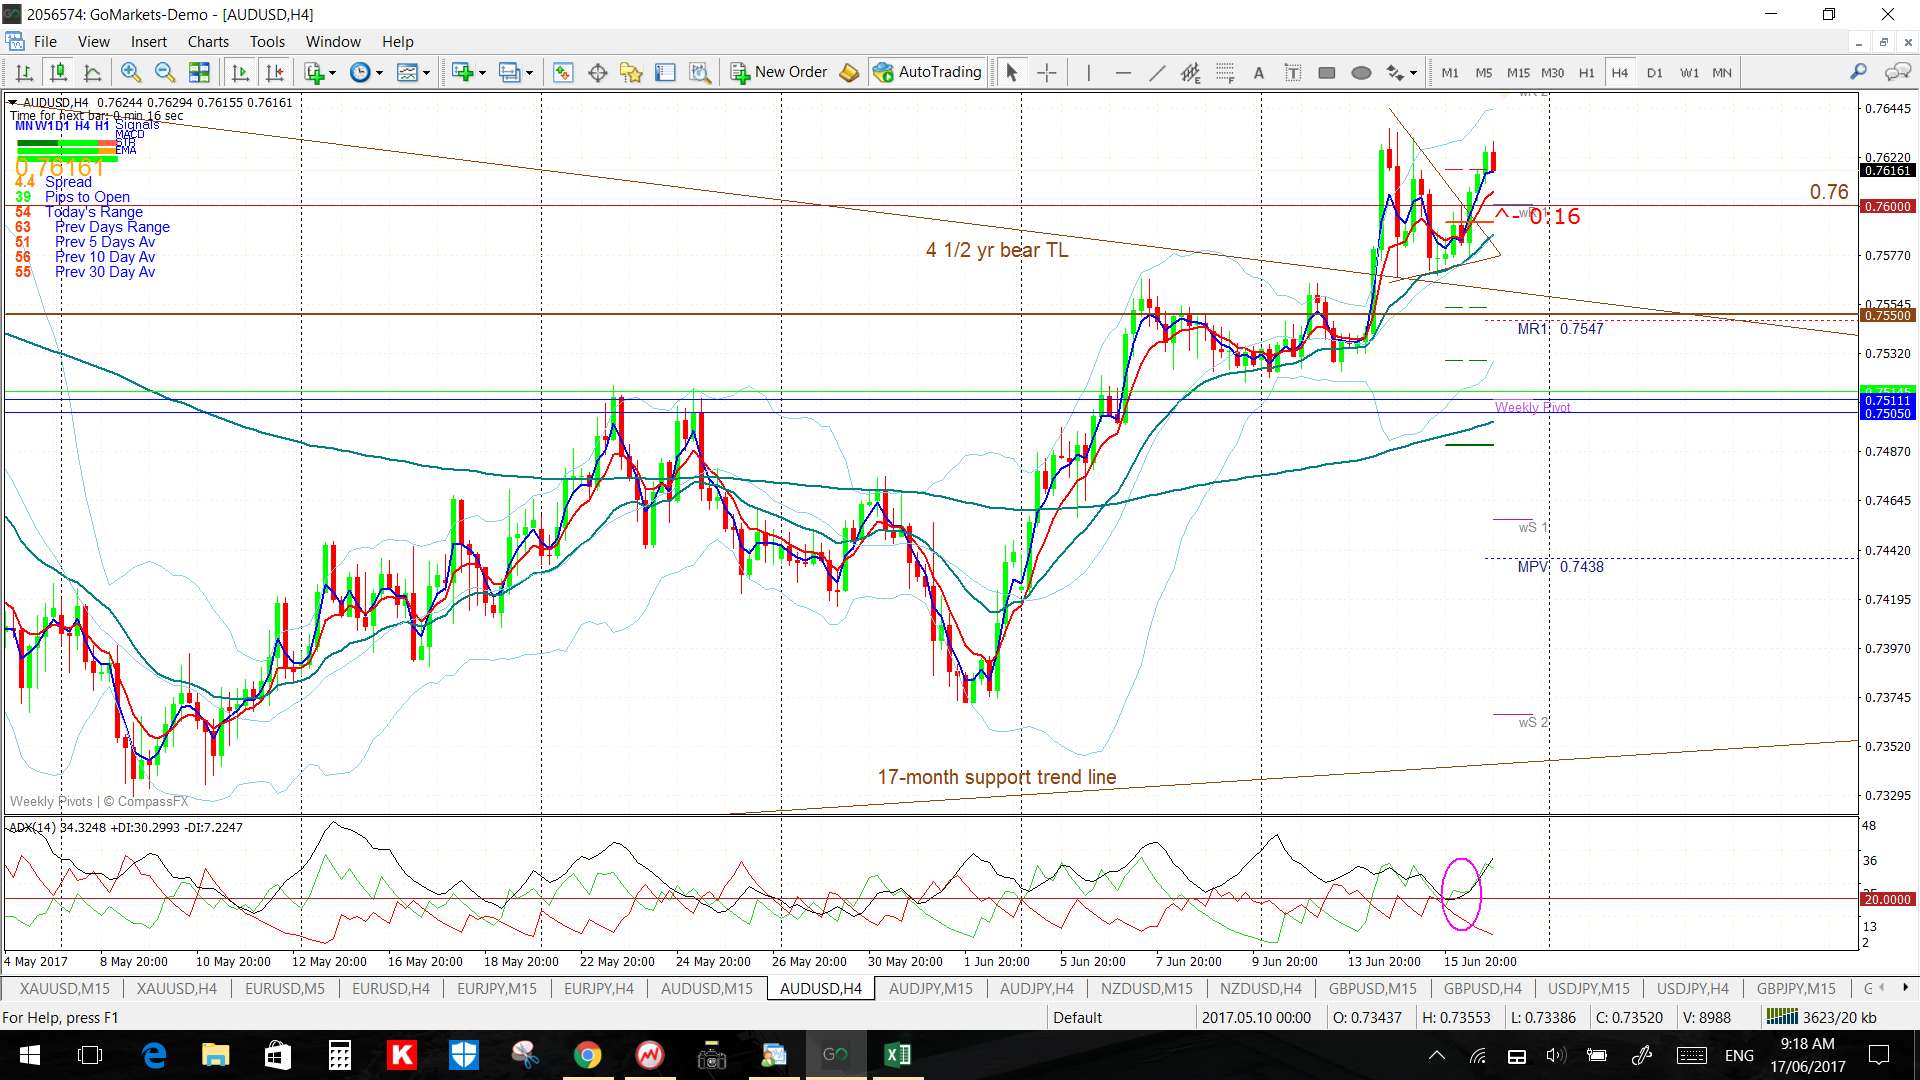
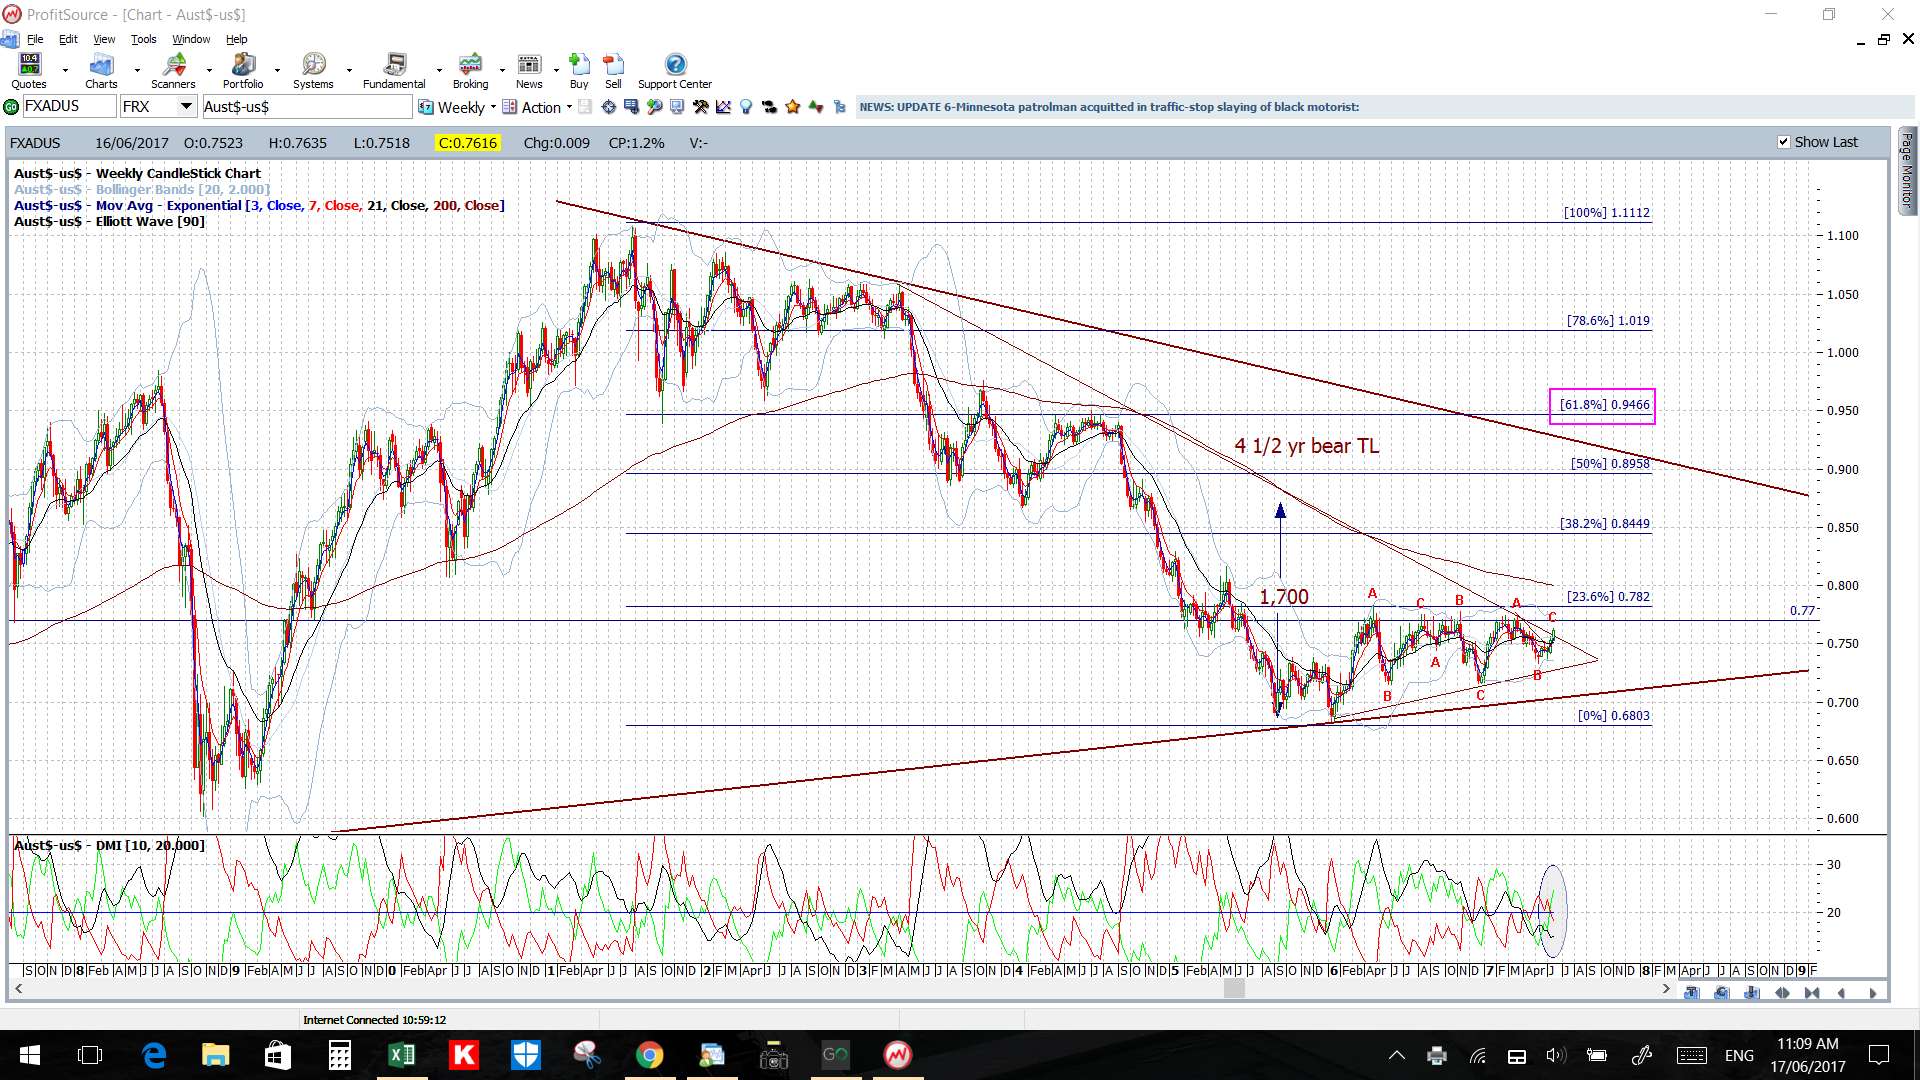
AUD/USD: What a huge achievement for the Aussie this week! It has broken and held above the daily chart’s 4½ year bear trend line, and also the 0.76 S/R level, so watch for any new make or break from this region. This could represent the start of the daily chart triangle breakout worth up to 1,700 pips that I have been on about for some weeks now!
- Upper targets: any bullish continuation would bring 0.77 and other whole numbers followed by the monthly chart’s bear trend line, near 0.90 and the weekly chart’s 50% fib, into focus.
- Lower targets: any pullback would have me looking for a test of 0.755 S/R, near the 4 ½ year broken bear trend line, followed by the daily chart’s 17-month support trend line and, after that, the monthly chart’s 61.8% fib which is near 0.72.
Watch for any impact from the RBA Gov Lowe speech and the RBA Monetary Policy Meeting Minutes.
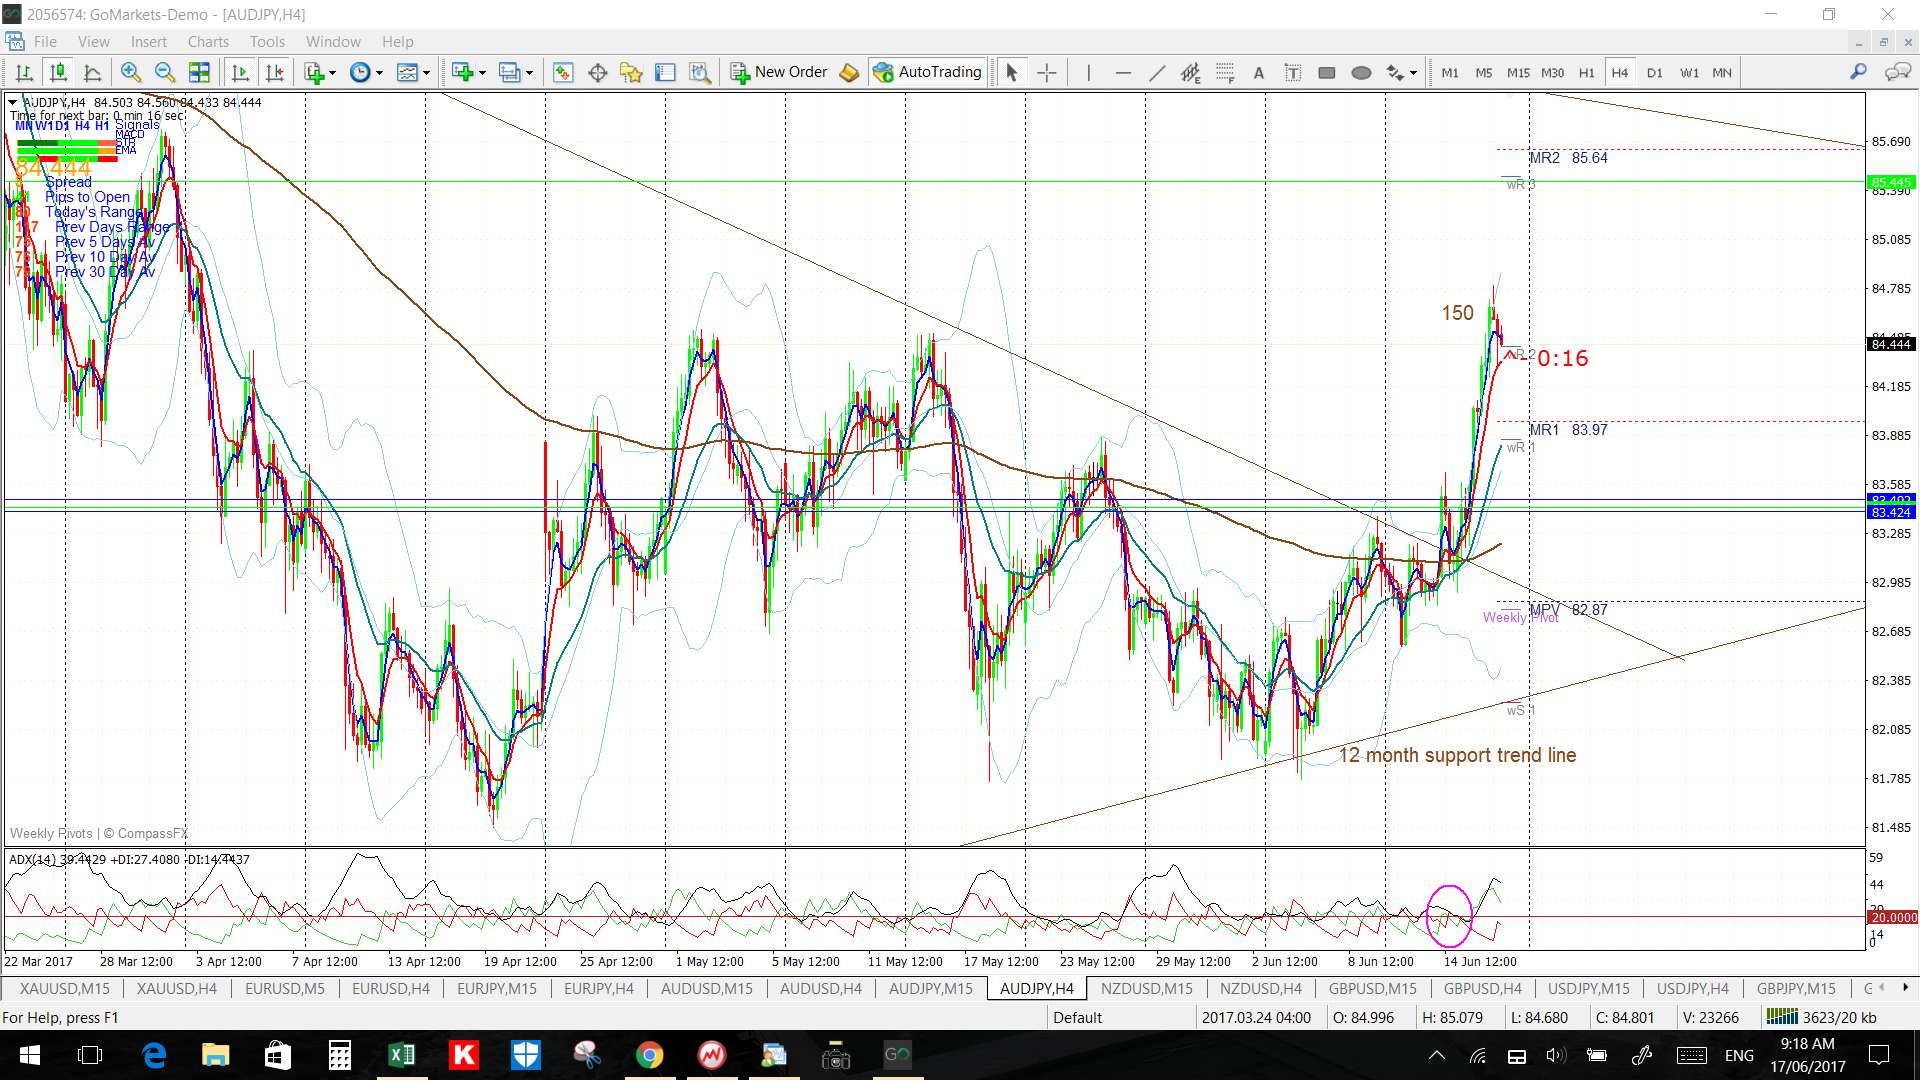
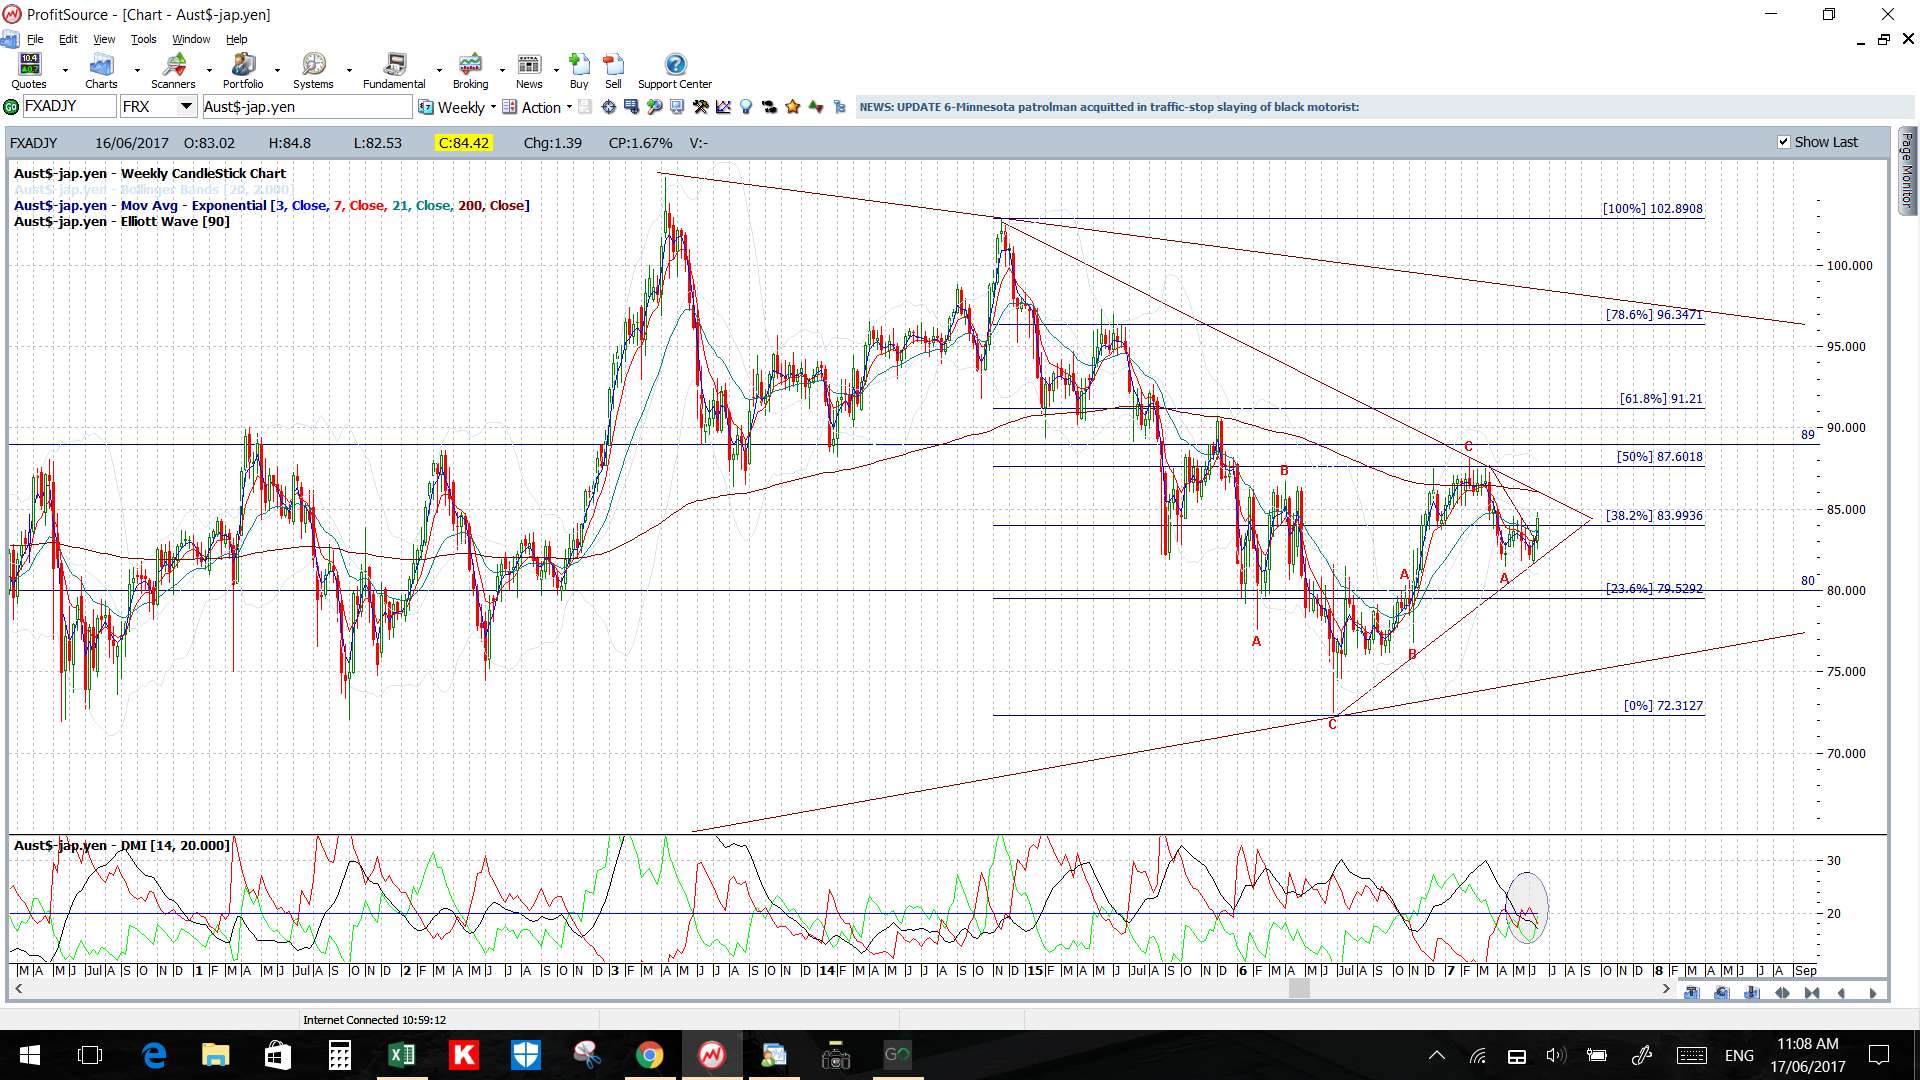
 AUD/JPY: The AUD/JPY has finally broken out of a 4hr chart triangle that it had been consolidating within for the last 12 weeks. This breakout triggered during Thursday’s European session and has yielded up to 150 pips! NB: the 4hr chart triangle was set within a larger daily chart triangle so shift your focus to these trend lines now.
Watch for any continuation from the 4hr chart’s triangle breakout:
- Upper targets: the upper triangle trend line from the daily chart triangle and, then, the 85 and 87 S/R levels.
- Lower targets: any pullback would have me looking for a test of the bottom trend line of the daily chart triangle followed by 80 S/R and then the daily chart’s 61.8% Fib near 79 S/R and then 75.
NZD/USD: The Kiwi remains above the broken 3-year bear trend line and the key 0.72 level so watch this area for any new make or break:
- Upper targets: 0.73 and 0.74 as previous S/R followed by the weekly chart’s 61.8% fib near 0.79.
- Lower targets: 0.70, being the 4hr chart’s 61.8% fib and near the monthly pivot, and then 0.67 S/R.
Watch for any impact from this week’s RBNZ rate update.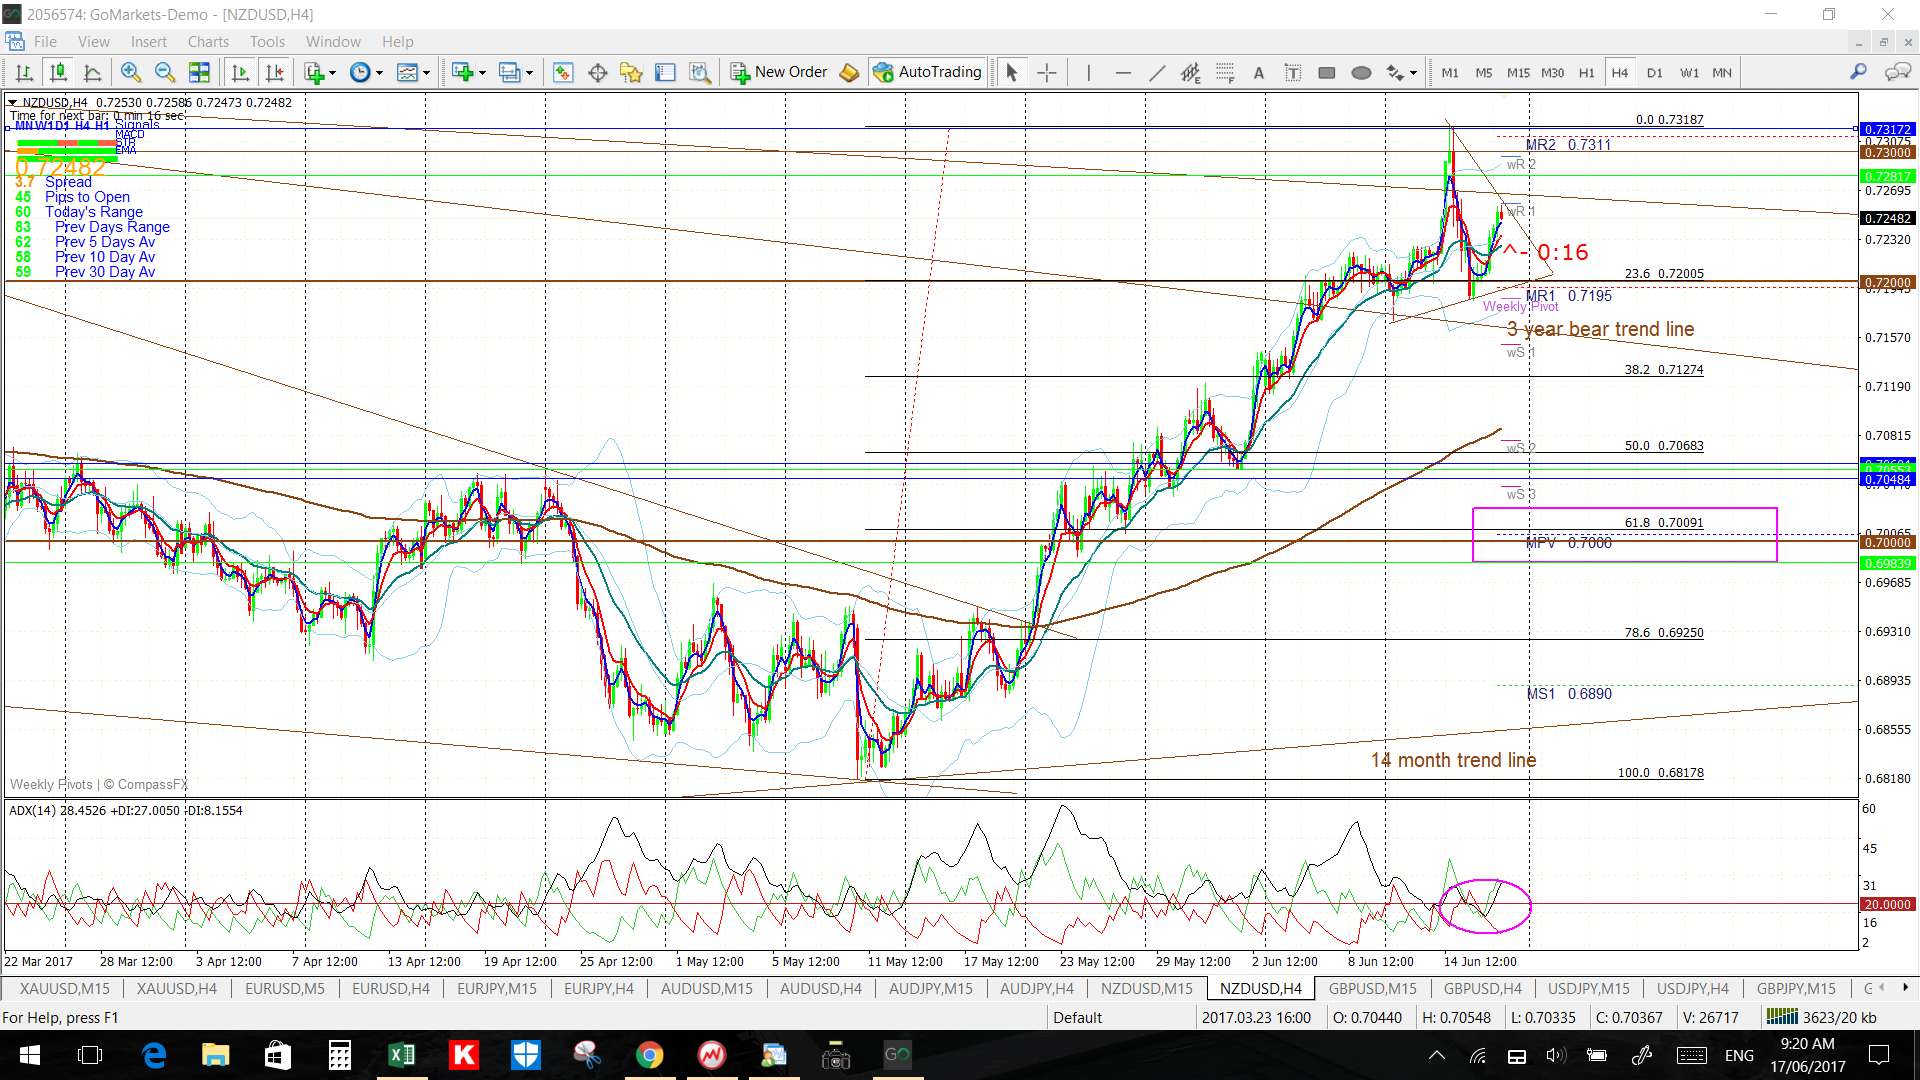
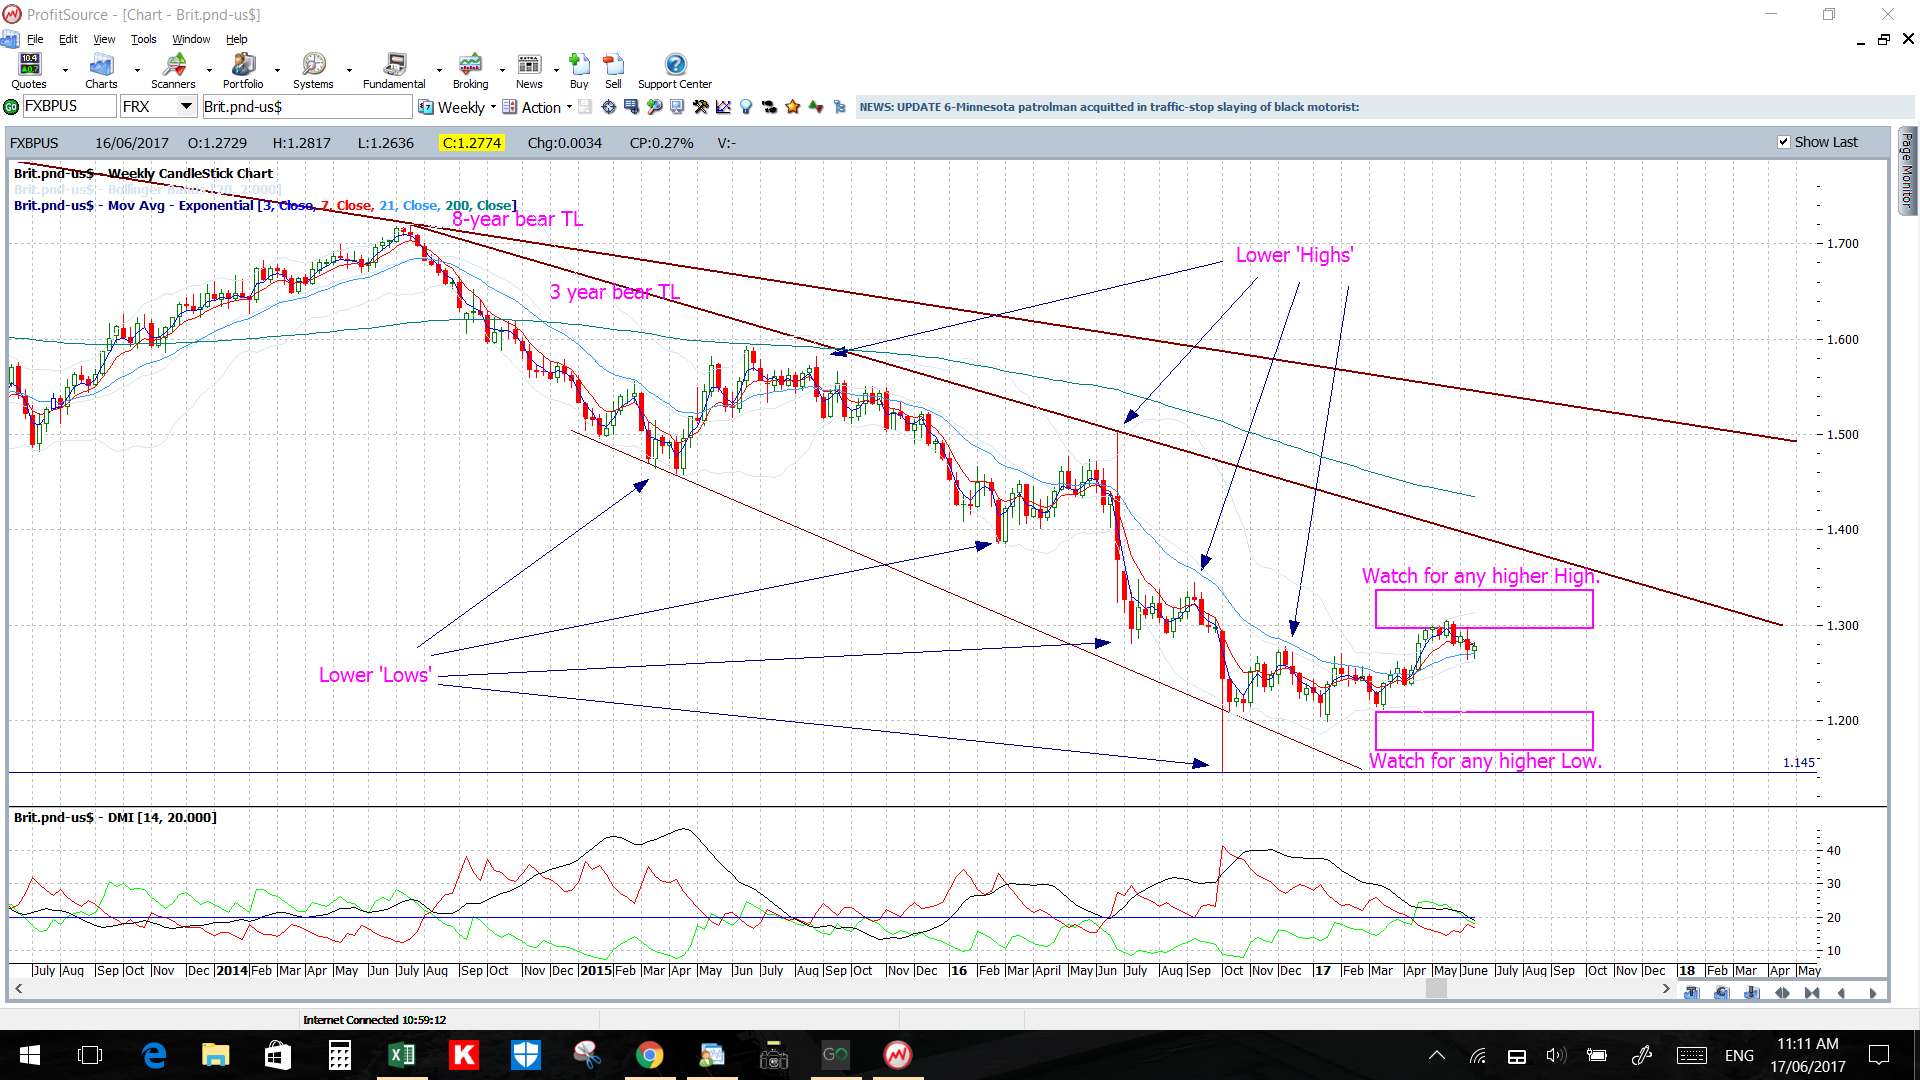
GBP/USD: The Cable traded within a triangle last week under the key 1.30 level.
Watch the 4hr chart triangle trend lines for any breakout activity:
- Upper targets: any bullish breakout will bring 1.30 and then 1.35 as previous S/R followed by 1.40, which is near the 3-year bear trend line into focus.
- Lower targets: any bearish breakout will bring the 4hr chart’s 61.8% Fib near 1.25 into focus.
Watch for any impact from the BoE Gov Carney speech. 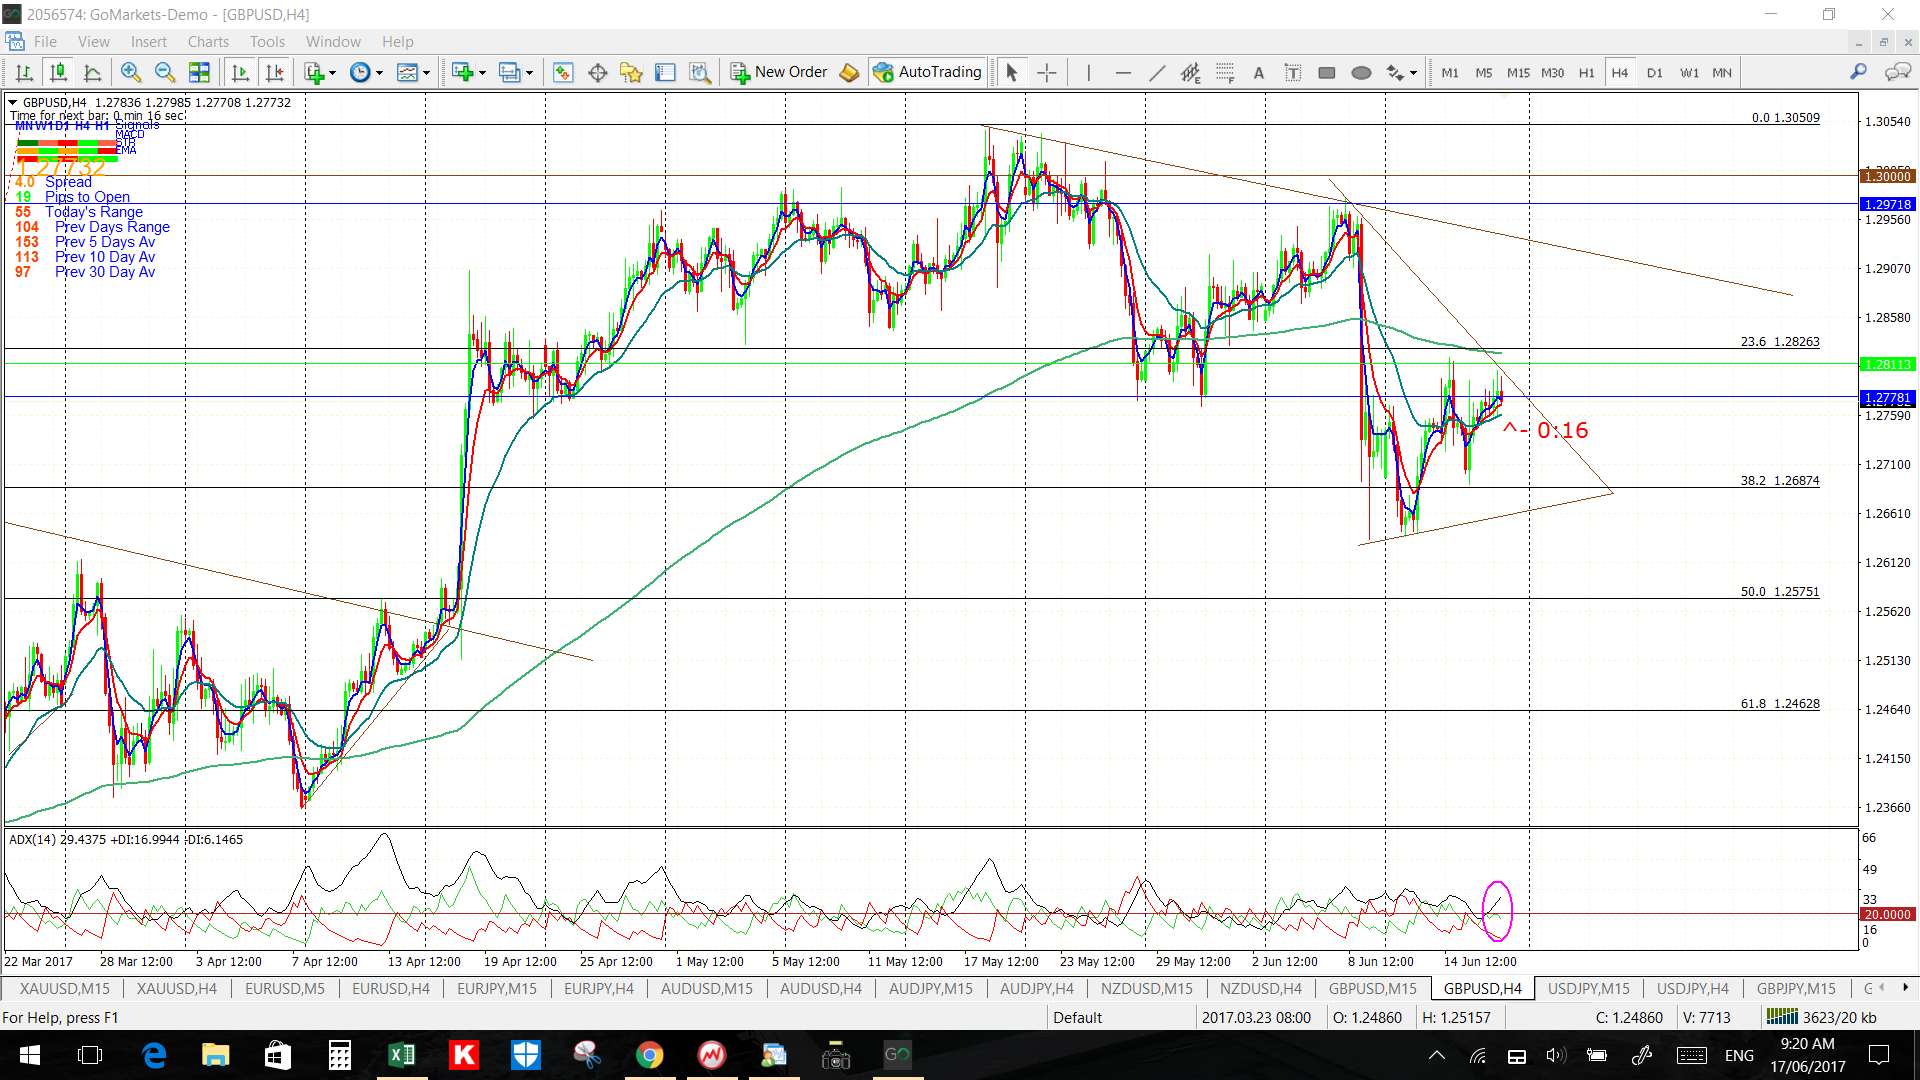
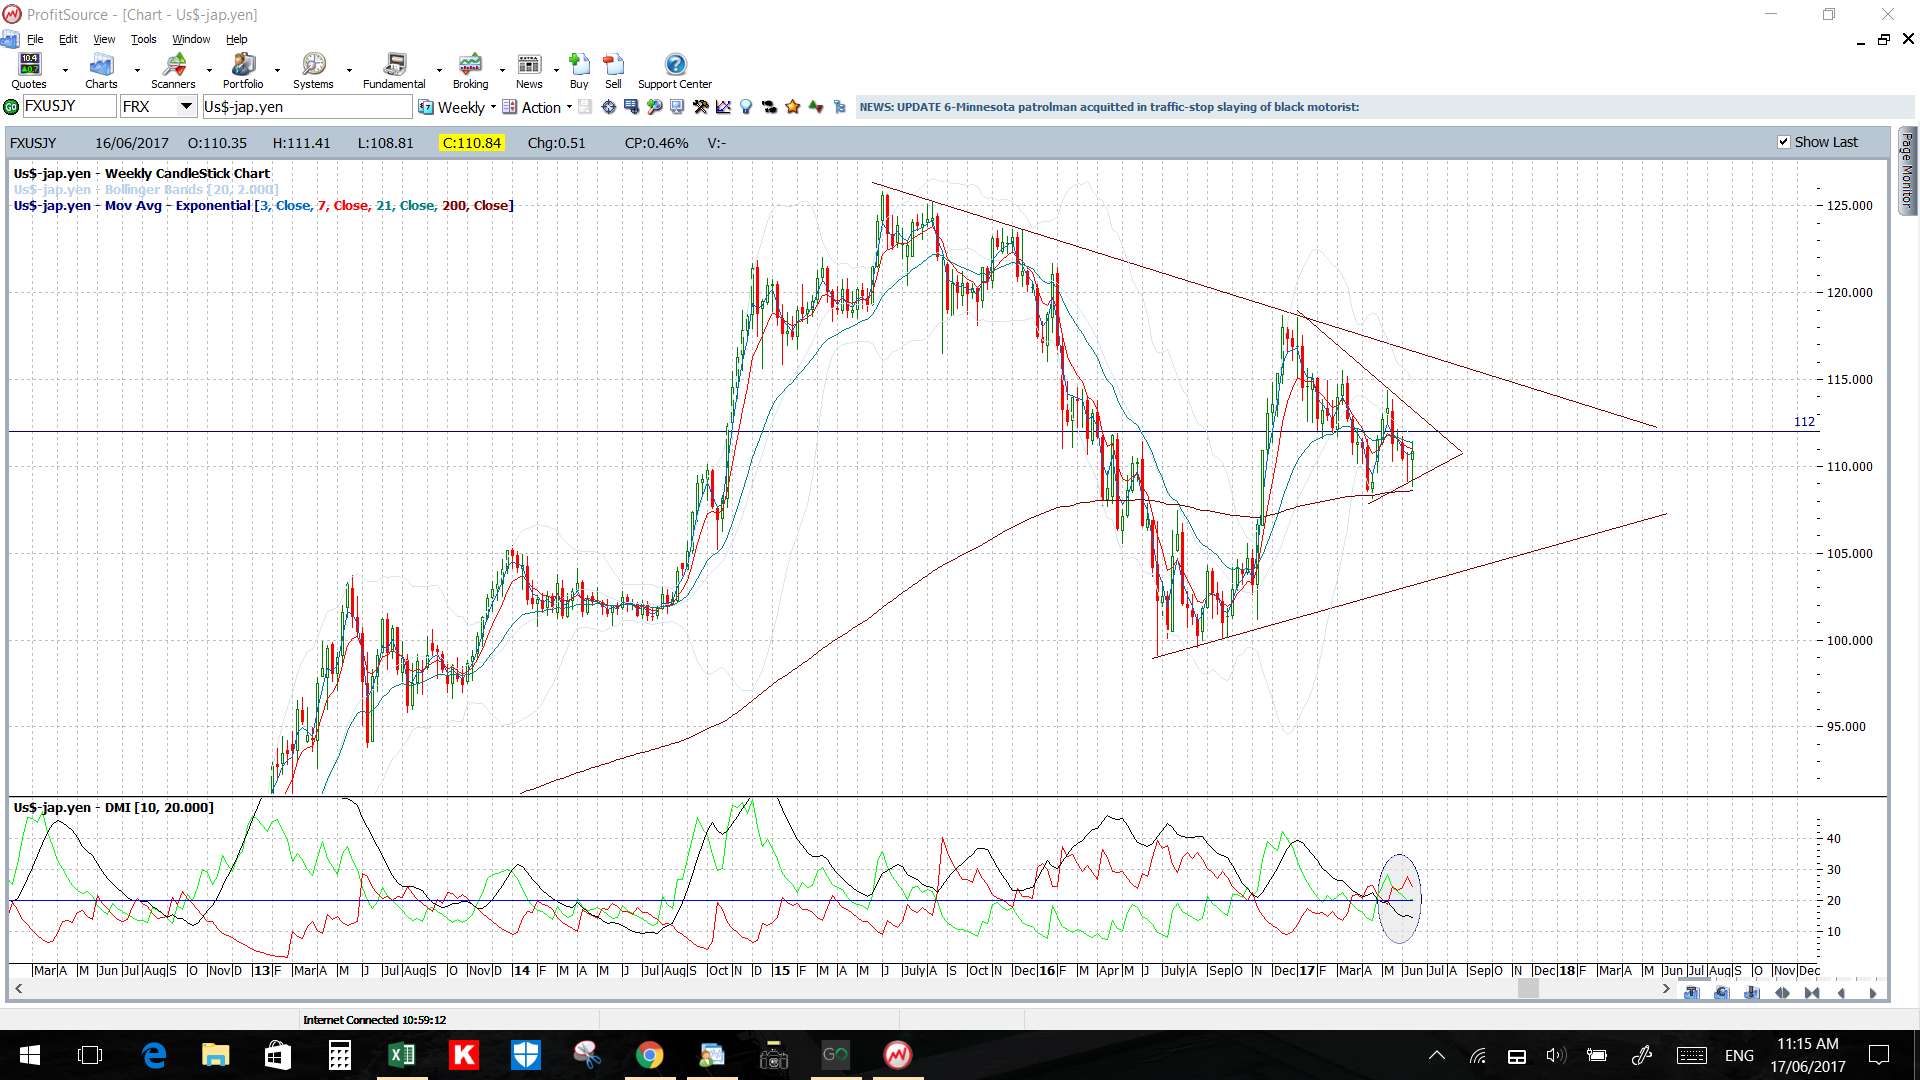
USD/JPY: The USD/JPY broke up and out of the 4hr chart’s 6-week triangle during Thursday’s European session. This move stalled though after giving 100 pips as it approached the 112 S/R level.
Watch the new 4hr chart’s Flag trend lines for any breakout move:
- Upper targets: any bullish breakout will bring the 112 level and then the daily chart’s upper triangle trend line into focus.
- Lower targets: any bearish breakout will bring the daily chart’s lower triangle trend line into focus.
 GBP/JPY: The GBP/JPY has just made a bullish breakout from a 6-week descending trading channel so watch next week to see if this breakout move develops. Note that this channel is set within a larger daily chart triangle.
Watch the 4hr chart’s descending channel trend lines for any continuation:
- Upper targets: whole numbers but especially 147, as previous S/R and, then the 22 month bear trend line followed by the weekly chart’s 61.8% Fib which is up near 168.
- Lower targets: any pullback would have me looking for a test of the daily chart’s triangle support trend line near the 139 level.

 GBP/AUD: The GBP/AUD has pulled back within a descending broadening wedge to the 50% fib of the recent swing high move on the 4hr chart. Price action is rather choppy here though and, if US$ weakness develops at all, then the cross pairs like this one might remain a bit choppy.
Watch the 4hr chart’s descending wedge trend lines for any breakout:
- Upper targets: The 1.75 level, then 1.80 as previous S/R and, then, the 20-month bear trend line.
- Lower targets: any pullback would have me looking for a test of the 4hr chart’s 61.8% Fib near 1.65 followed by 1.601 S/R.

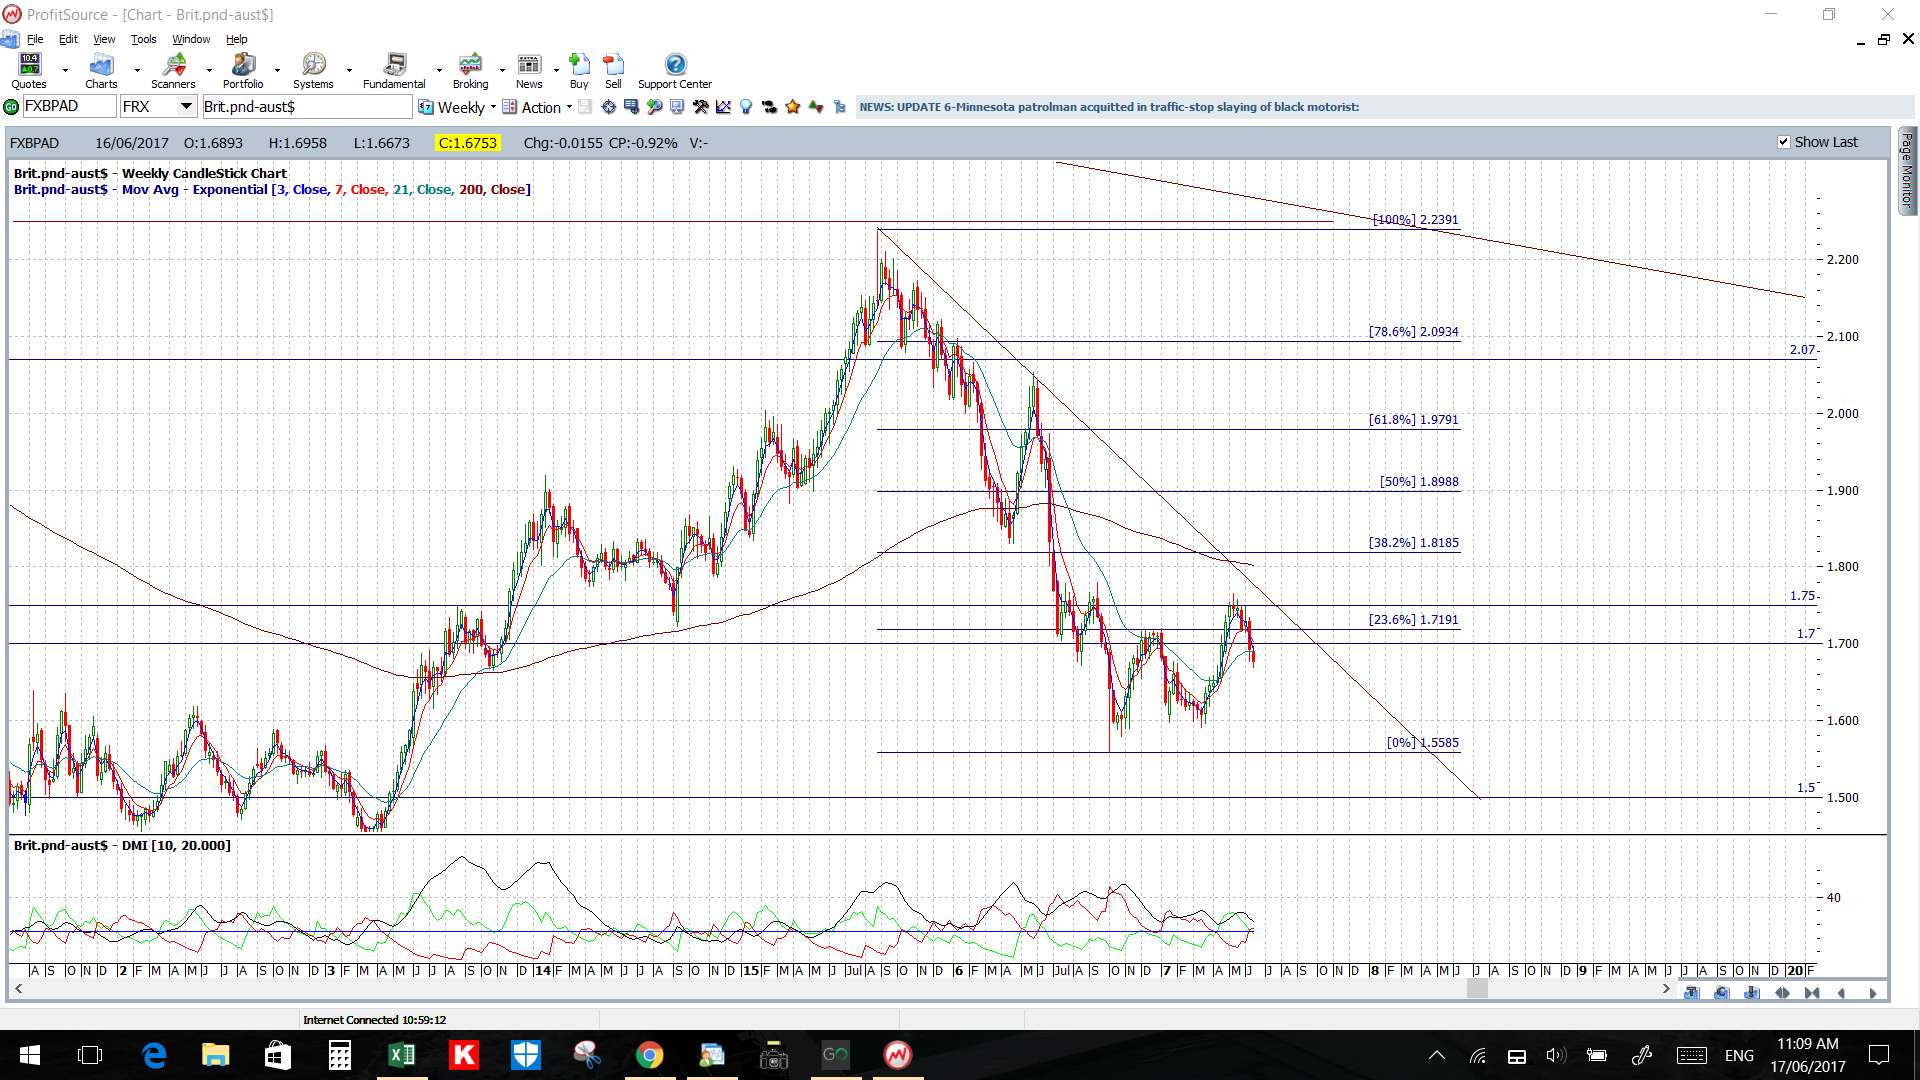
GBP/NZD: The GBP/NZD has pulled back within a descending trading channel to the 78.6% fib of the recent swing high move on the 4hr chart. Note how price gravitated back to the major 1.77 S/R level last week but remained pegged by this key level! The same deal apples here as with the GBP/AUD though, this pair could remain choppy if US$ weakness develops as a theme at all.
Watch the 4hr chart’s channel trend lines and 1.77 level for any new breakout:
- Upper targets: The 1.80 level followed by the monthly charts revised monthly bear trend line, then the 1.90 as previous S/R and, after that, the weekly chart’s 61.8% Fib near 2.20 S/R.
- Lower targets: any deeper pullback would have me looking for a test of the 1.67 S/R level.

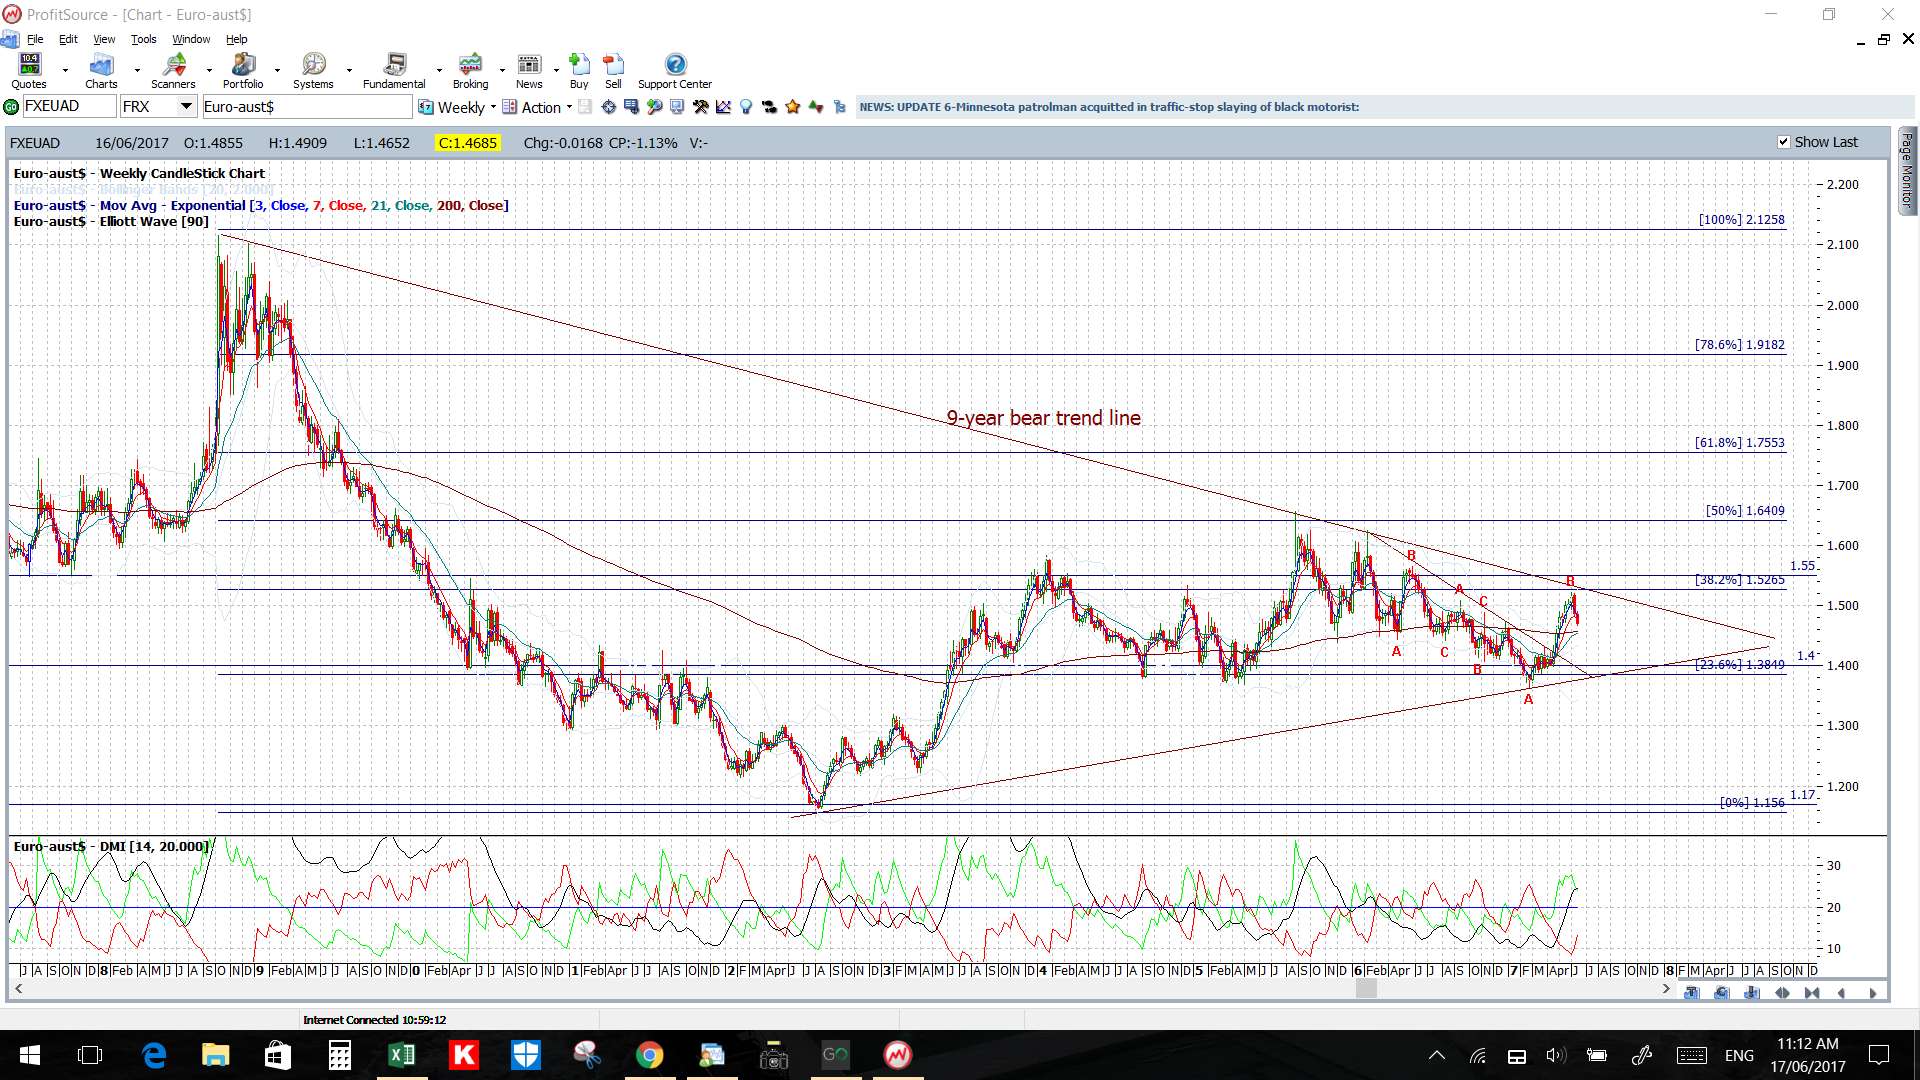
EUR/AUD: This pair still looks to be consolidating under the 9-year bear trend line and has been doing so now within a 4 hr wedge pattern for the last four weeks. Caution is needed here too if US$ weakness develops, or breaks for that matter.
Watch the 4hr chart’s wedge trend lines for any breakout:
- Upper targets: any bullish breakout will bring the 1.50, then the 9-year bear trend line and then the previous S/R level of 1.55 into focus.
- Lower targets: any bearish breakout will bring the 4hr chart’s 50% Fib, near 1.44, and then the 1.40 level into focus.

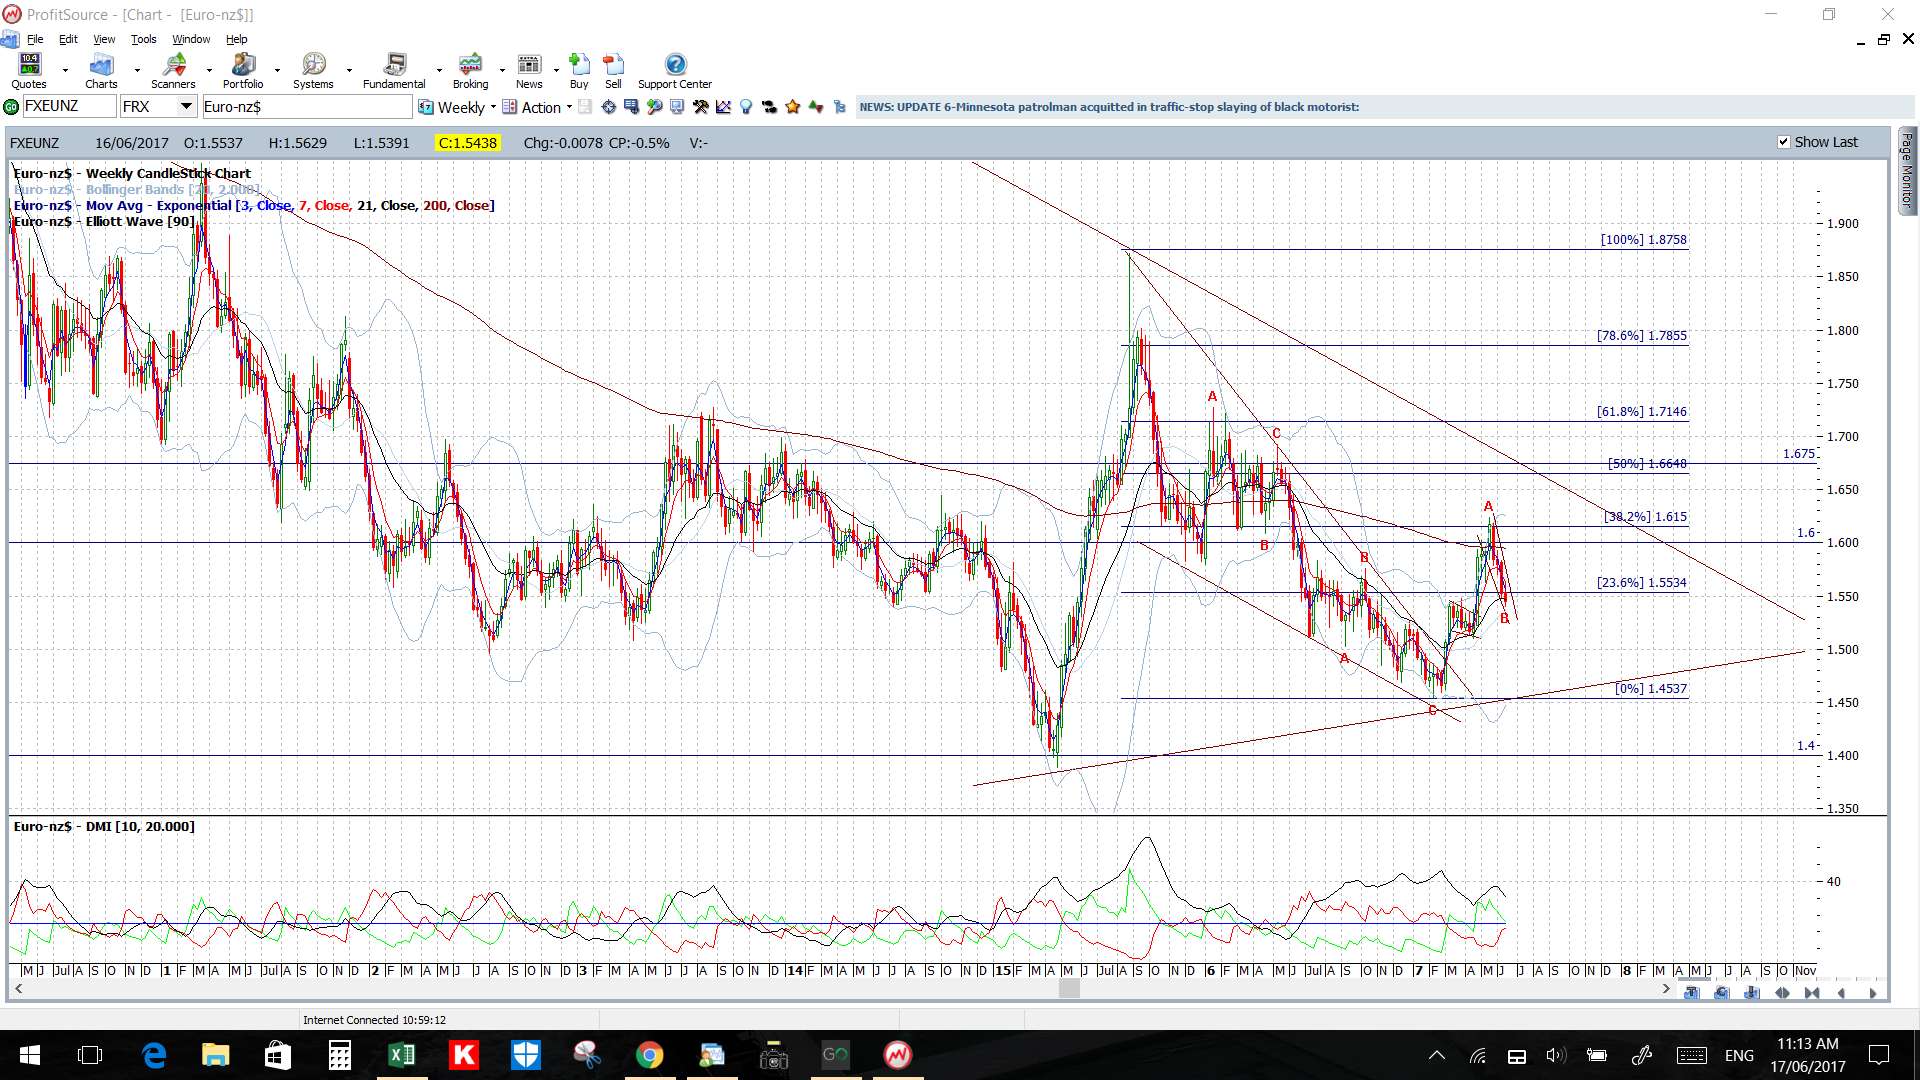
EUR/NZD: The EUR/NZD has chopped a bit lower within the 4-week descending trading channel.
Watch the 4hr chart’s channel trend lines for any breakout:
- Upper targets: any bullish breakout will bring the key 1.60 and then the 1.675 S/R region, followed by the 9-year bear trend line into focus.
- Lower targets: any bearish breakout will bring the 4hr chart’s 100% Fib, near 1.50, into focus.

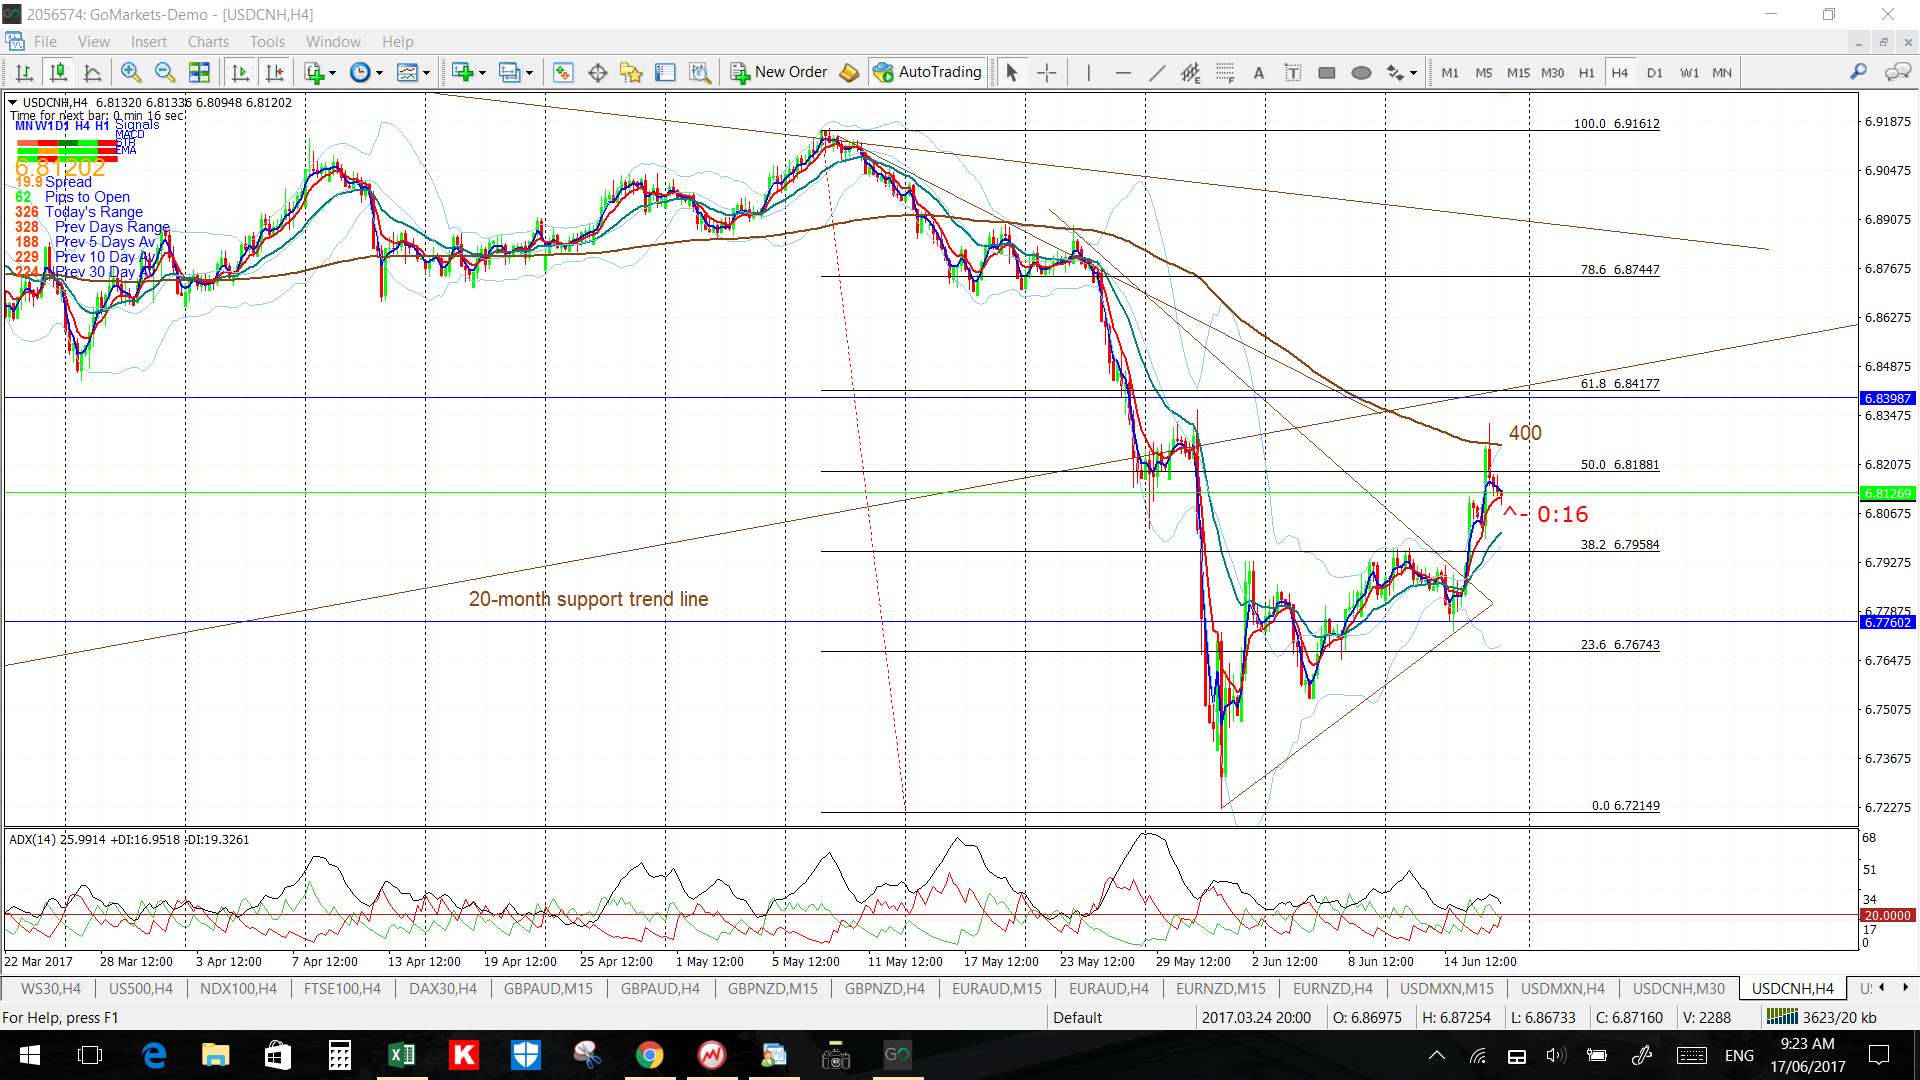
USD/CNH: This pair made a decisive bullish breakout above a 4-week bear trend line during Thursday’s European session and gave up to 400 pips before finally stalling! I’d mentioned to watch for any test of the broken 20-month support trend line, as this was also near the 61.8% fib of the last swing low move, and this is where price stalled on Friday!
I’m watching now to see if price can recover above this broken 20-month support trend line. I’d previously mentioned care needs to be taken here though in case this price action develops into an extended Flag pattern and this might be what we see develop here! I’ve noted this Flag on the weekly chart below.
- Upper targets: watch for any further move to re-test of the broken 20-month support trend line as this is also near the 61.8% fib of the last swing low move (see 4hr chart).
- Lower targets: any pullback from the weekly chart’s bottom trend line would have me looking for a test of the recent low, near 6.70, followed by the weekly chart’s 50% fib near the previous S/R level of 6.50.

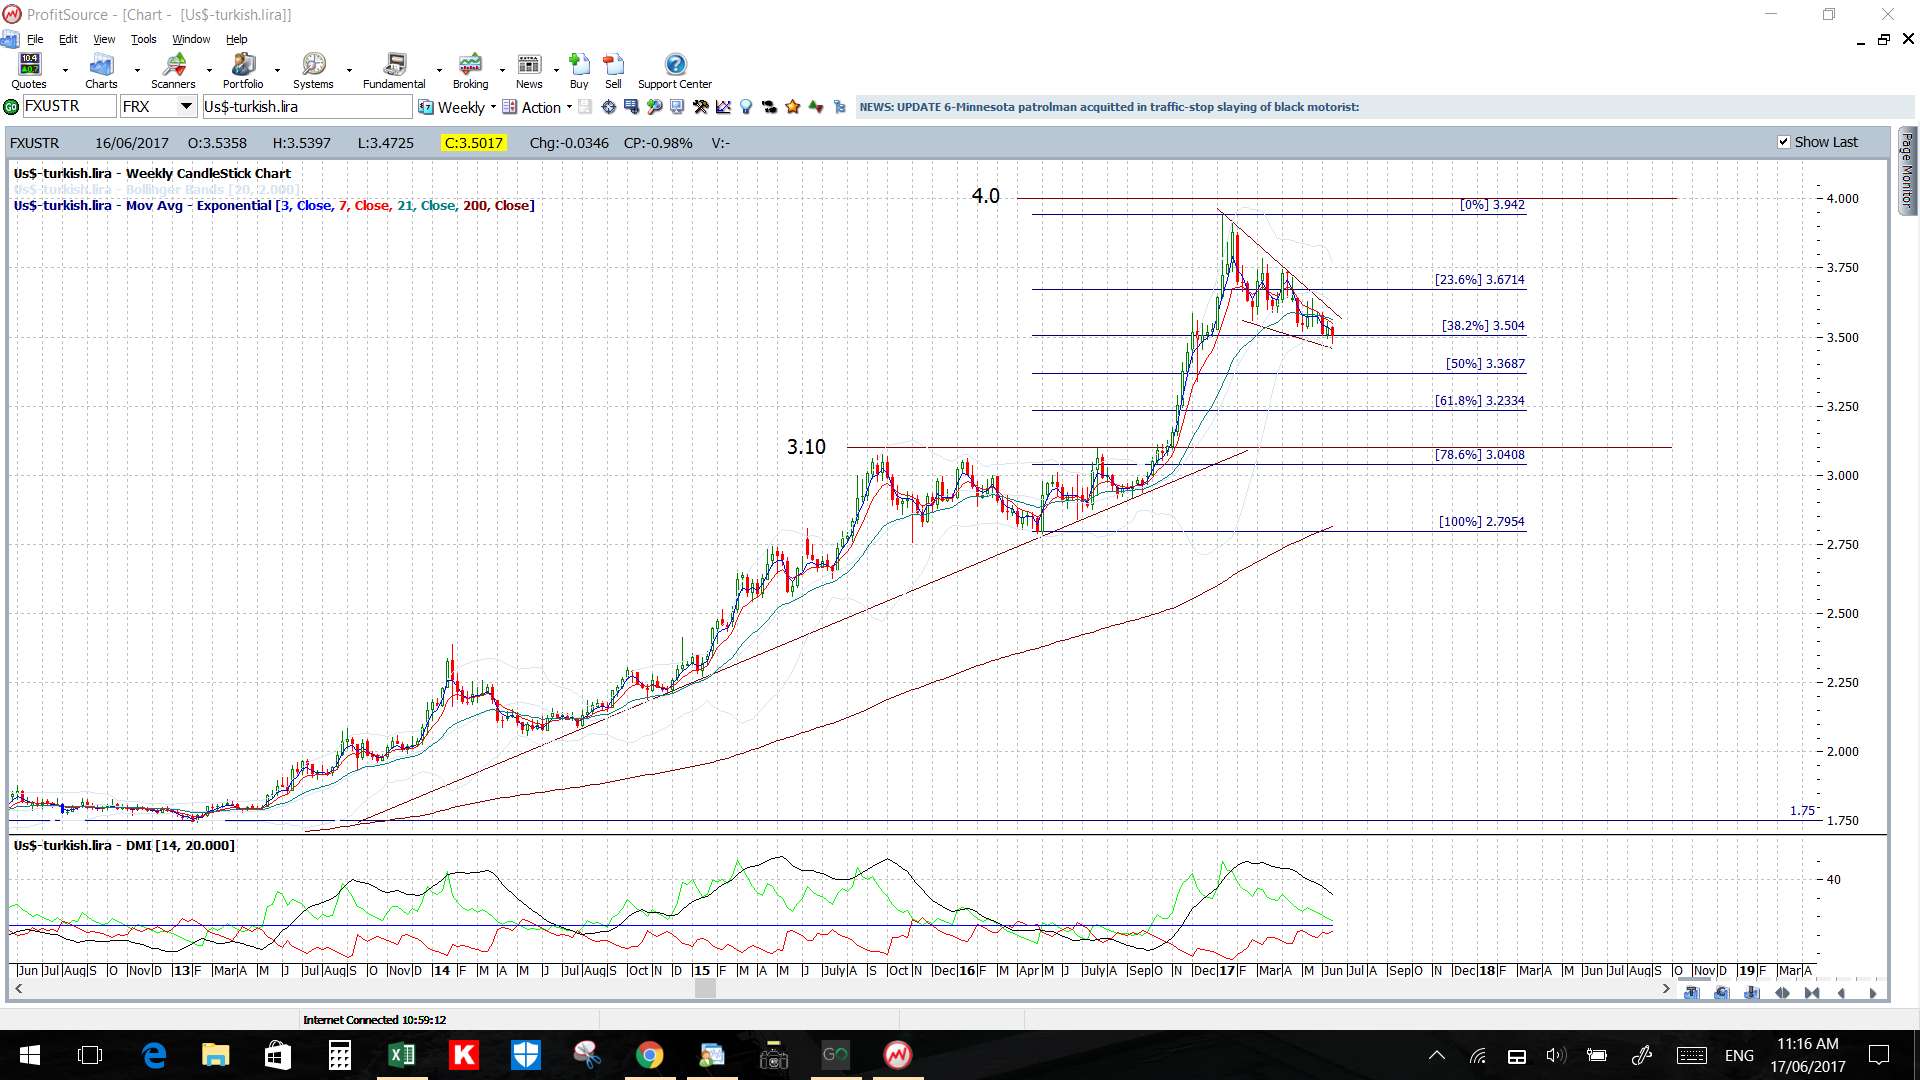
USD/TRY: This pair remains trapped within a 6-month Flag pattern however, set within this, there is a 5-week triangle pattern.
Watch the 4hr chart’s triangle trend lines, set within the daily flag, for any breakout:
- Upper targets: any bullish breakout will bring the daily chart’s upper Flag trend line followed by the key ‘4’ level as long-term resistance into focus.
- Lower targets: any bearish breakout below the daily chart’s lower Flag trend line will bring the weekly chart’s 61.8% fib and, after that, the 3.10 region as previous S/R into focus.

USD/MXN: The 25,000+ pip Bear Flag move looks to be underway here:
- Upper targets: The key 19 level.
- Lower targets: The weekly chart’s 61.8% fib near previous S/R of 16.

Commodities:
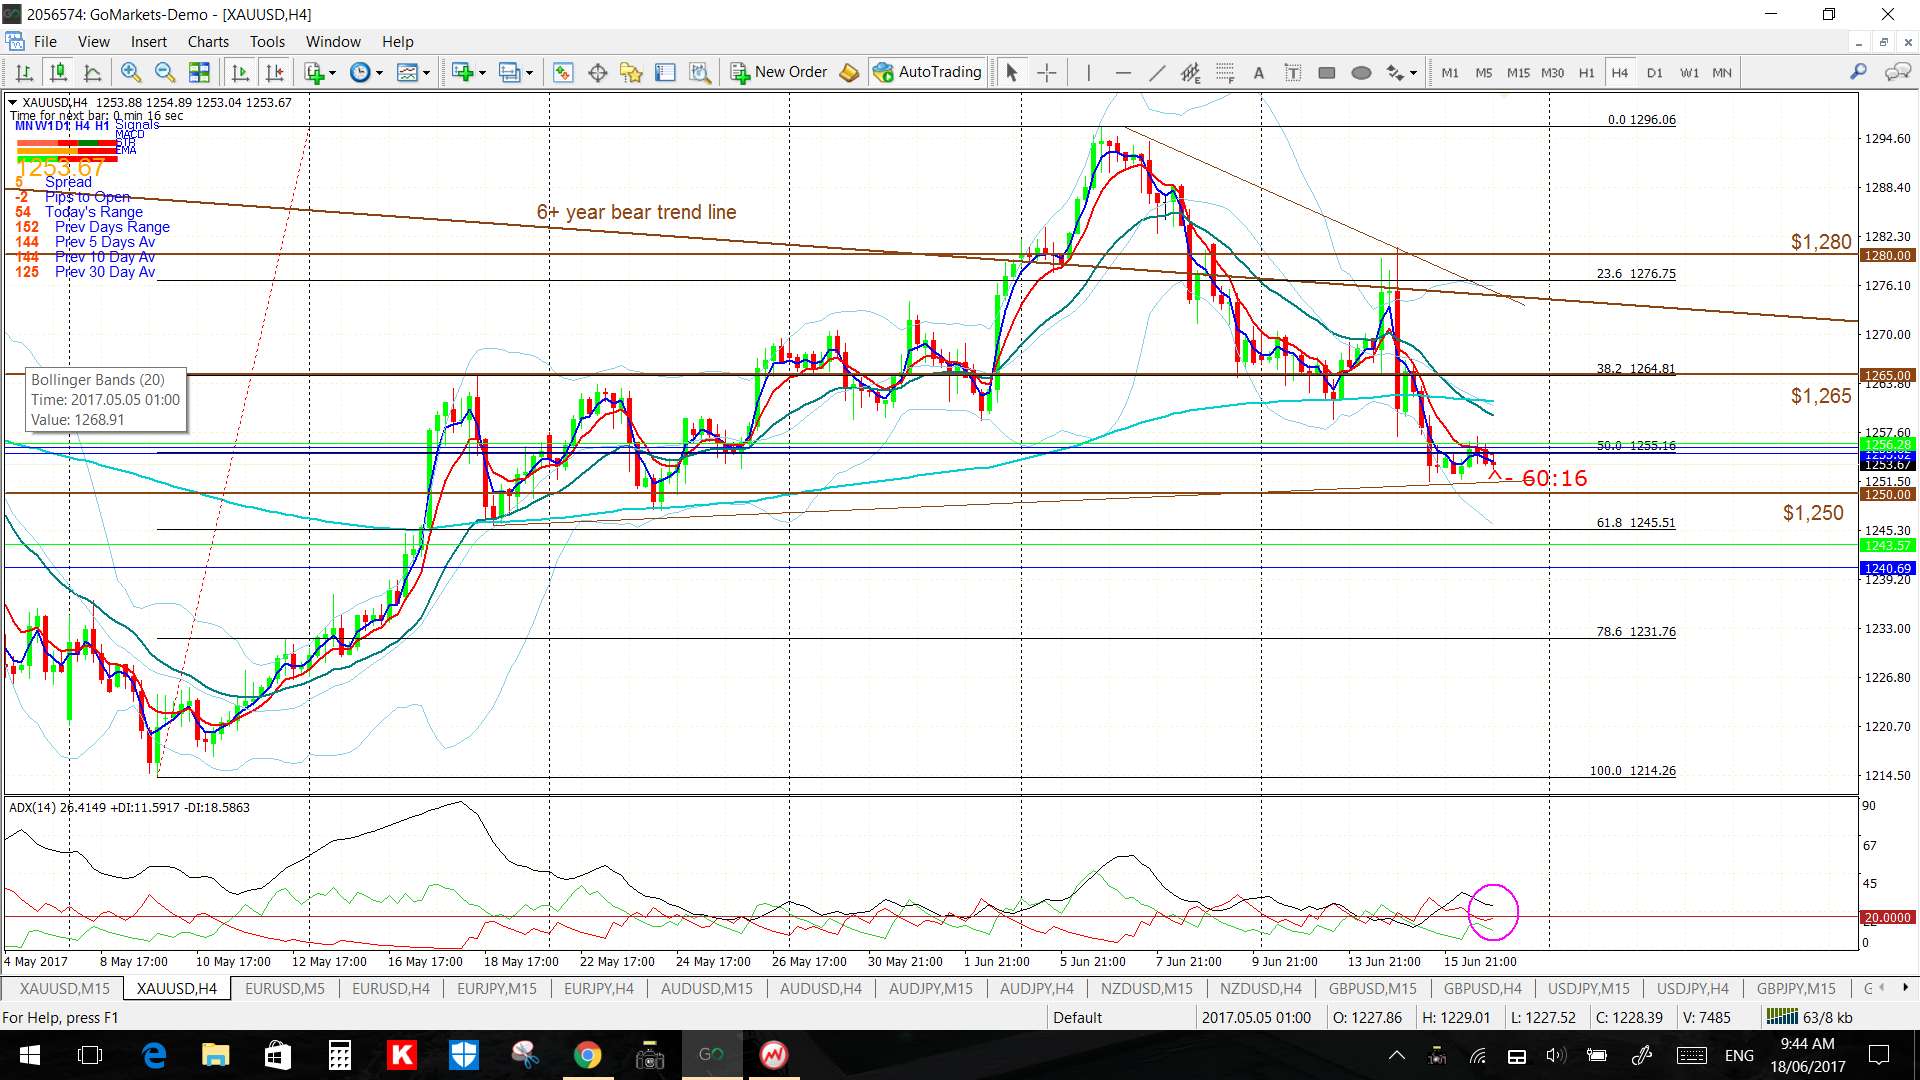
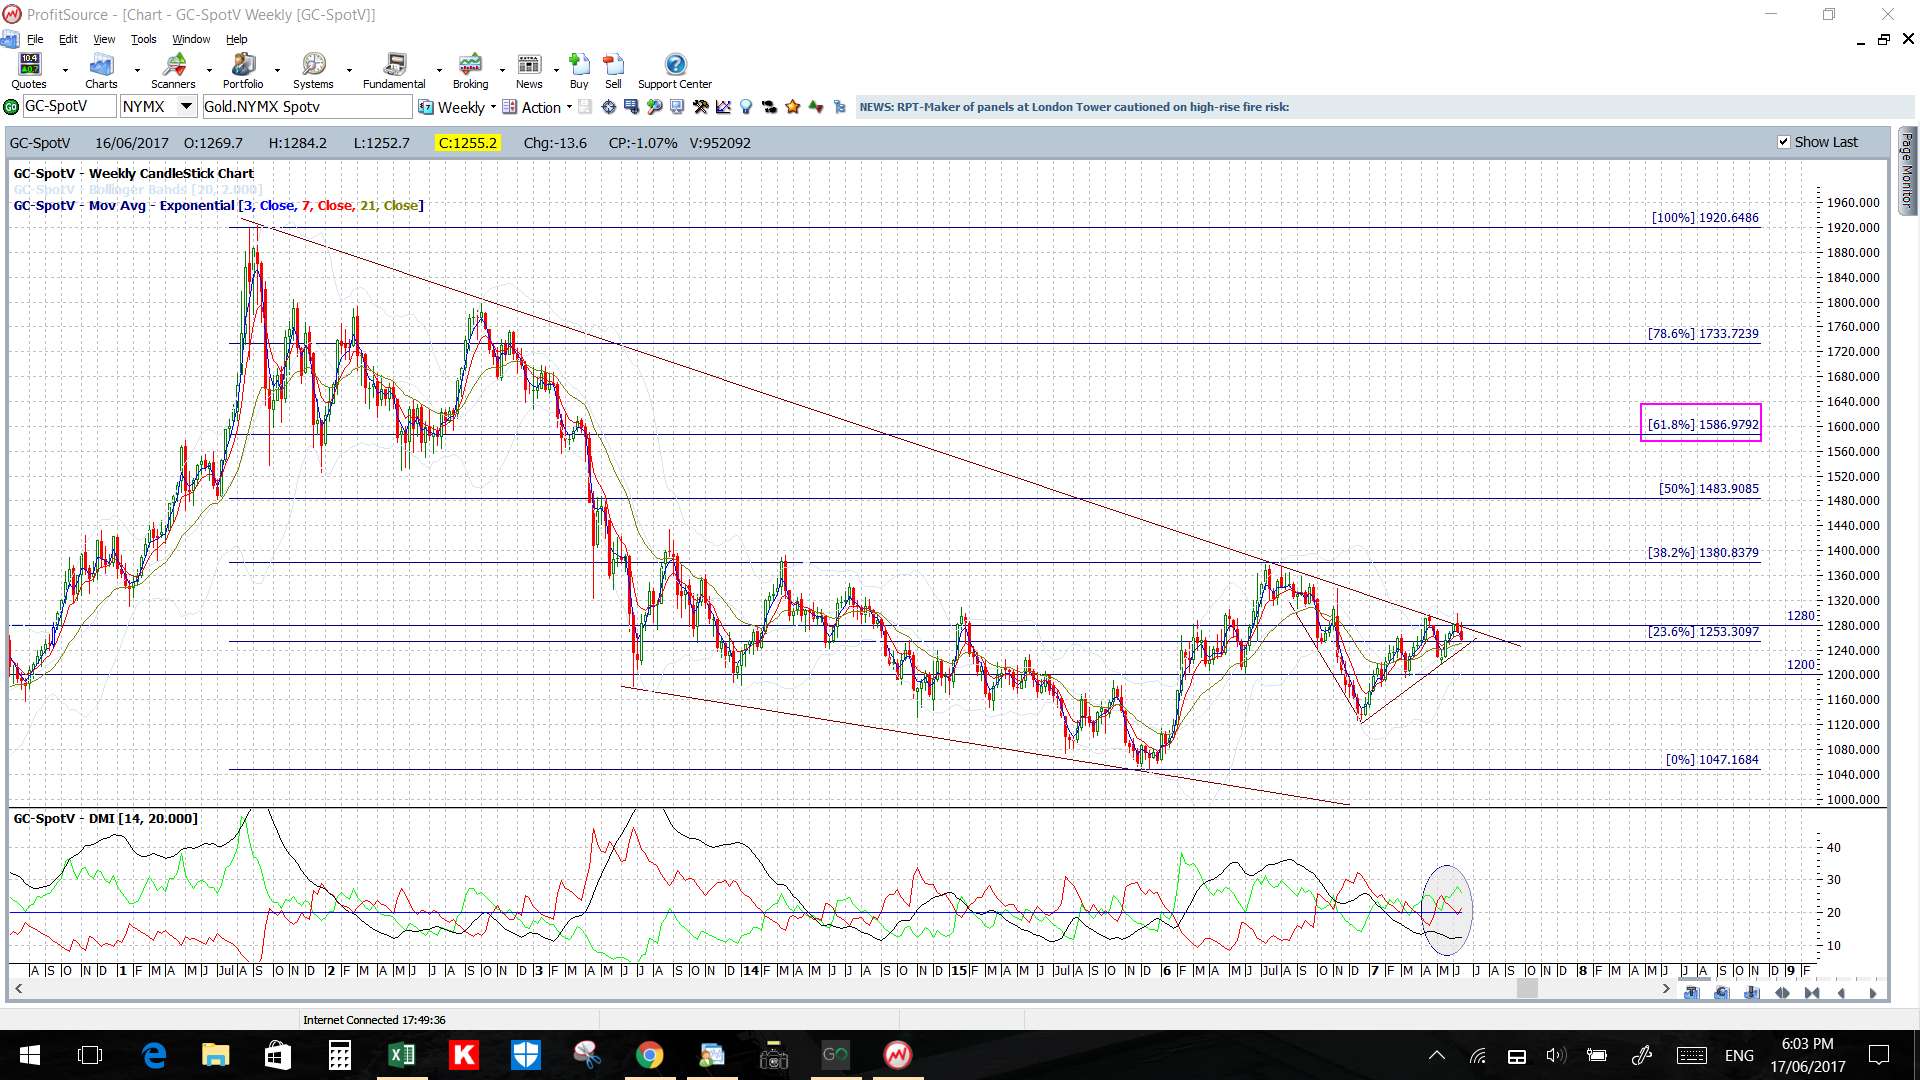
Gold: Gold continues to hover below the 6-year bear trend line, that is near the $1,280 level, and this remains the key resistance level to watch in the longer term.
Watch the 4hr chart’s wedge trend lines and the $1,250 level for any make or break:
- Upper targets: any bullish breakout will bring the 6-year bear trend line, near $1,280, and then the weekly chart’s 61.8% fib, near $1,600, into focus.
- Lower targets: any bearish breakout will bring the 4hr chart’s 61.8% fib level, near $1,240, into focus.
Silver: Silver is becoming increasingly squeezed towards the apex of a multi-month triangle and is still under the 6-year bear trend line.
Watch the recent 4hr chart triangle for any breakout:
- Upper targets: any bullish breakout will bring the 6 year bear trend line into focus.
- Lower targets: any bearish breakout will bring the daily chart’s bottom triangle trend line into focus.
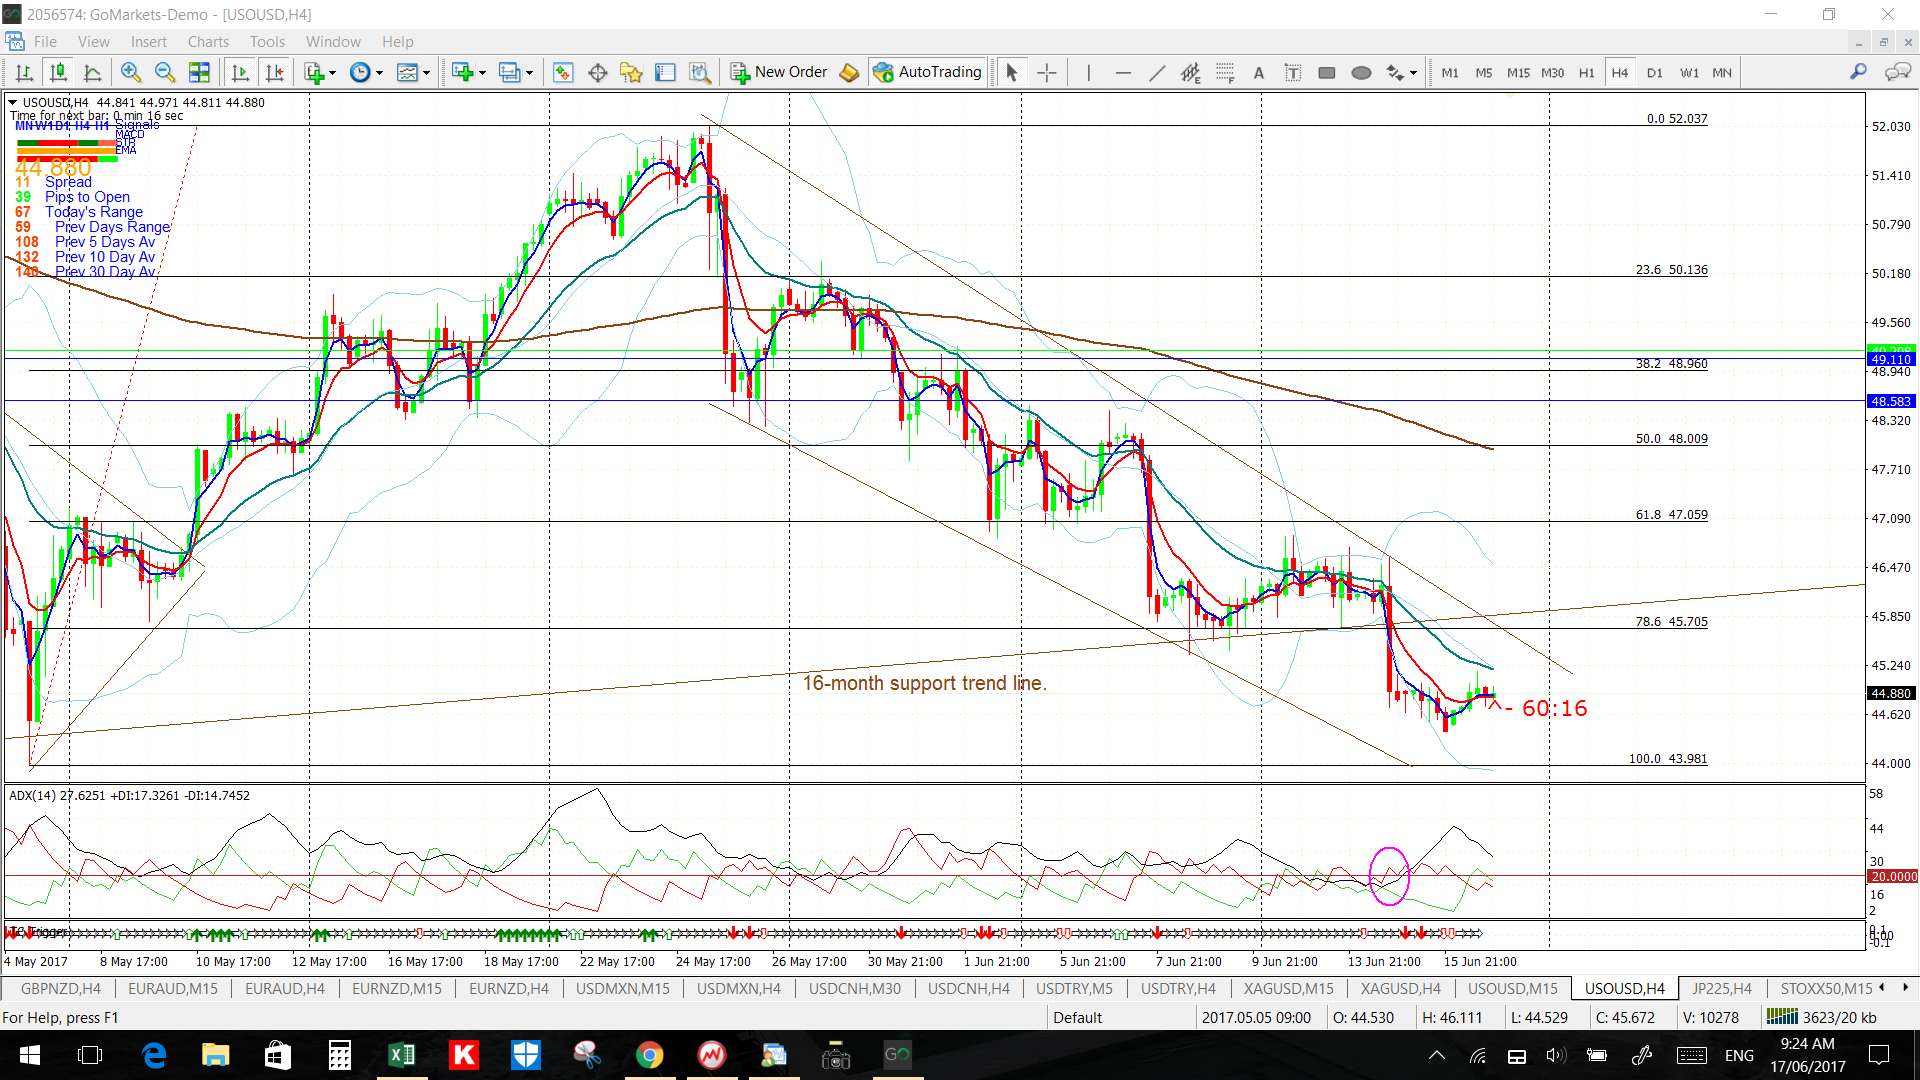
Oil: Oil has broken down below a 16-month support trend line and almost tested the 100% fib of the recent swing high move.
Watch for the descending trading channel trend lines for any breakout:
- Upper targets: any bullish breakout will bring the daily/weekly/monthly chart’s bottom and then upper trend lines into focus.
- Lower targets: any bearish breakout will bring the 4hr chart’s 100 Fib, near $44, into focus, after that, the weekly chart’s 50% fib, near $40.
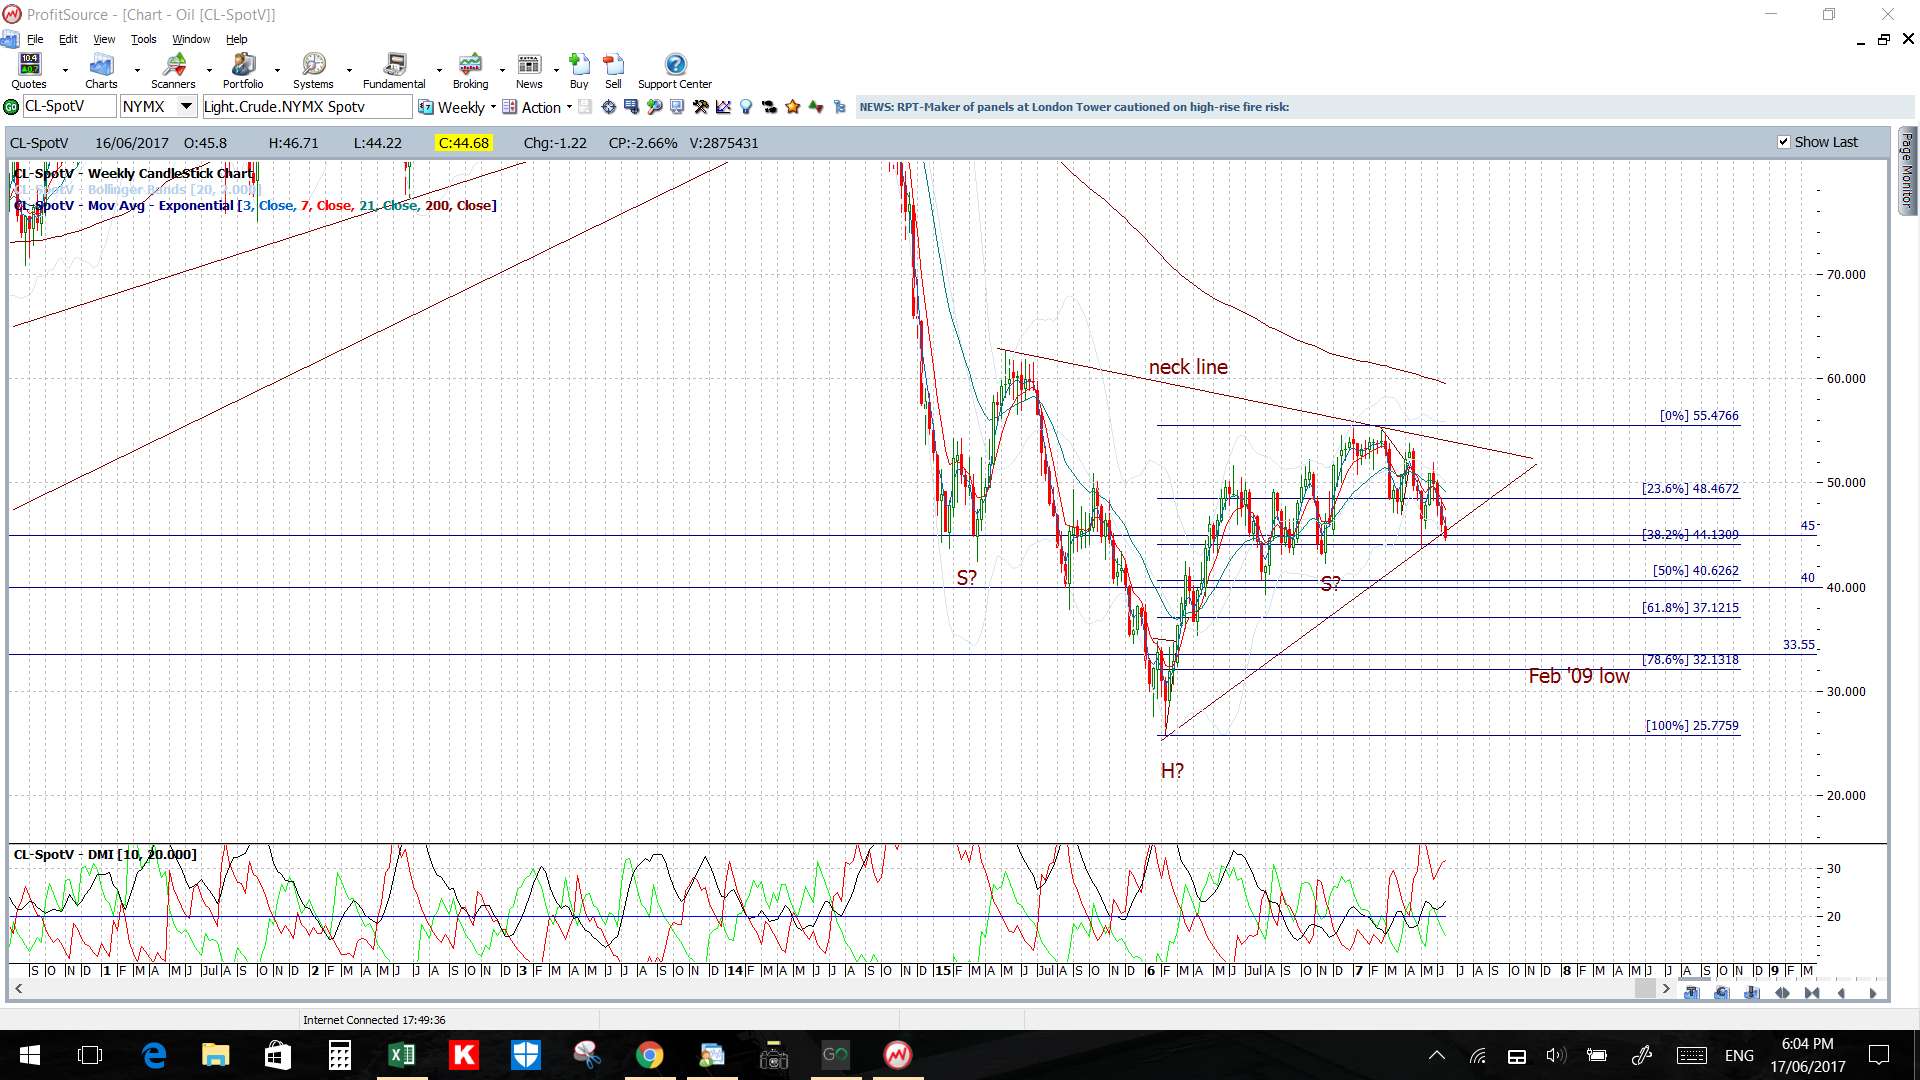
Note: There is 2-year bear trend line above current price and this also forms the monthly chart’s ‘Neck Line’ for a potential ‘Inverse H&S’ pattern. This pattern has a height of approximately $30 or 3,000 pips and this puts the target for any breakout move up near the $85 level which ties in with the 50% Fibonacci of the 2008-2016 swing low move.
Stock Indices: there are 4hr chart patterns to monitor:
S&P500:
DJIA:
NASDAQ-100:

ASX-200: I’m watching the triangle on the 4hr chart but, also, the developing Cup ‘n’ Handle on the monthly chart:

FTSE-100:
DAX-30:
JP-225:
STOXX-50:
