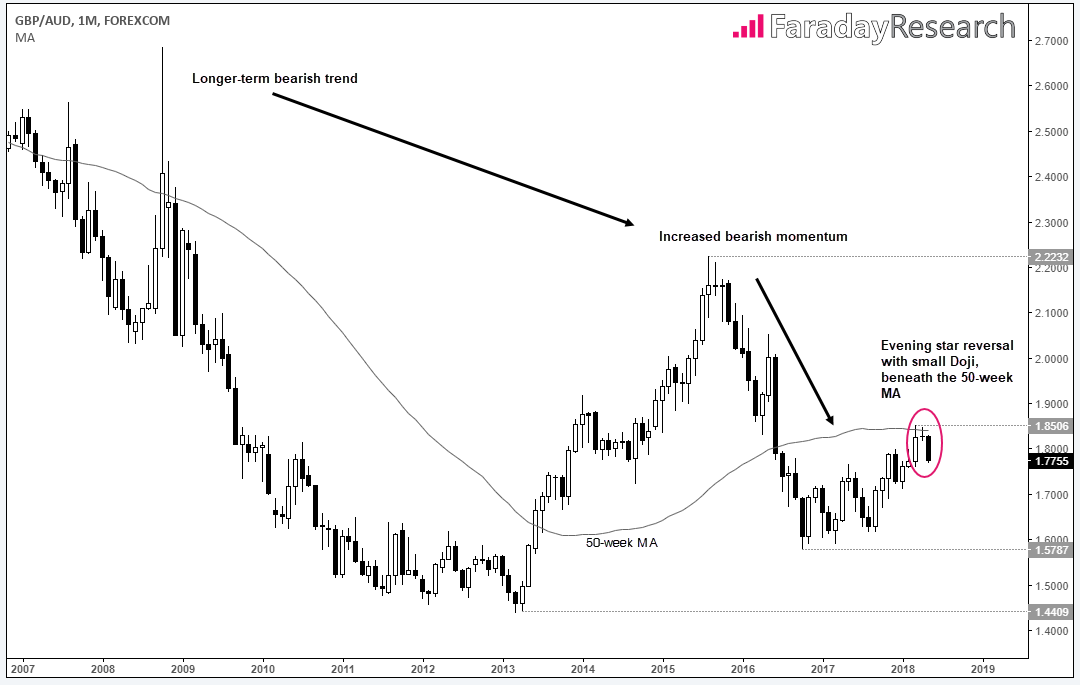
We highlighted the potential for a 3-month reversal on GBP/AUD a few weeks ago. A 3.5% decline and break of key support later, a longer-term reversal pattern appears all but given.
Unless we see a miraculous recovery over the following six sessions, its highly likely anevening star reversal pattern will materialize on the monthly chart. As this follows on from a relatively low volatility retracement, it suggests we may have seen the corrective high at 1.8506. And if 1.8506 is indeed the corrective high, it points to the potential for larger losses occur in the months ahead.

Whilst these are not your typical trading timeframes they do serve as a basis for top-down charting. If we have an expectation (and confirmation of) a bearish reversal on a higher timeframe, we can refer to lower timeframes to time a better entry.
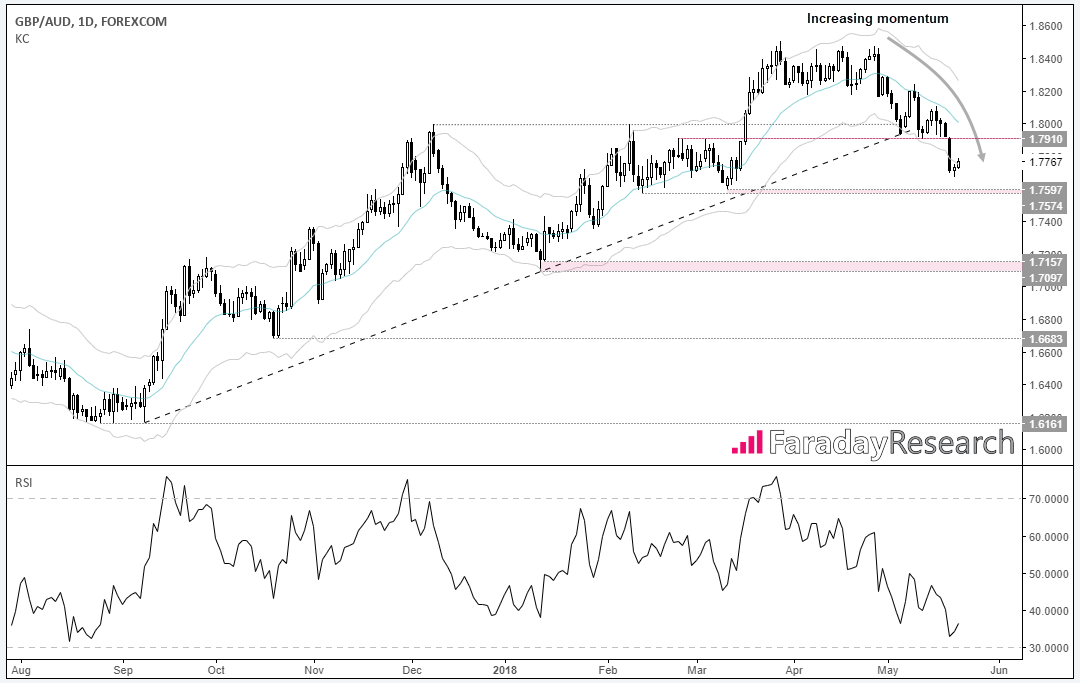
The daily chart shows a trendline break occurred on the 10th May, although the immediate follow through lacked the conviction we’d hoped for in our prior analysis. Whilst the break itself took a little longer than we’d have liked, the trendline was invalidated and bearish momentum finally returned.

Monday’s range expansion broke 1.9710 support on Monday and, whilst the move has paused for breath, our bias remains bearish whilst below 1.7910 resistance. We saw a minor sign of over-extension with yesterday’s small Doji beneath the lower Keltner band, although as RSI is not oversold and as the trend appears within its infancy, it downside doesn’t appear over-extended by too much. That said, as Monday’s elongated bearish bar cleared support by quite a distance, we’re welcoming the current low volatility period as it allows for a potential retracement below 1.7910.
The lows around 1.7574/97 could be easy picking for bears so a retracement from here would be ideal to provide a better reward to risk ratio. Ultimately we’re seeking a break lower to target the 1.7097-1.1757 lows. However, with UK CPI in a few hours and GDPon Friday, GBP crosses are vulnerable to whipsaws so we’ll step aside for now. But as the higher the timeframes point to lower prices in the weeks of months ahead, it could provide ample of opportunity to short in due course.
By Faraday Research (Matt Simpson)
May 23, 2018 05:21AM ET
Source: Investing.com
