The GBP/JPY broke down from a triangle pattern two weeks ago and has subsequently fallen around 1,000 pips. Price action has now broken back below the 184 level but is currently back up testing the strength of this key S/R region. This 184 and 50% fib region is the level to watch in coming sessions.
GBP/JPY monthly: this time frame chart shows the significance of the 184 level. This 184 level is also the 50% Fibonacci level of the 2006-2011 swing low GFC move. Any hold back above this 184 level would support bullish continuation to possibly test the 61.8% fib up near the 200 level:
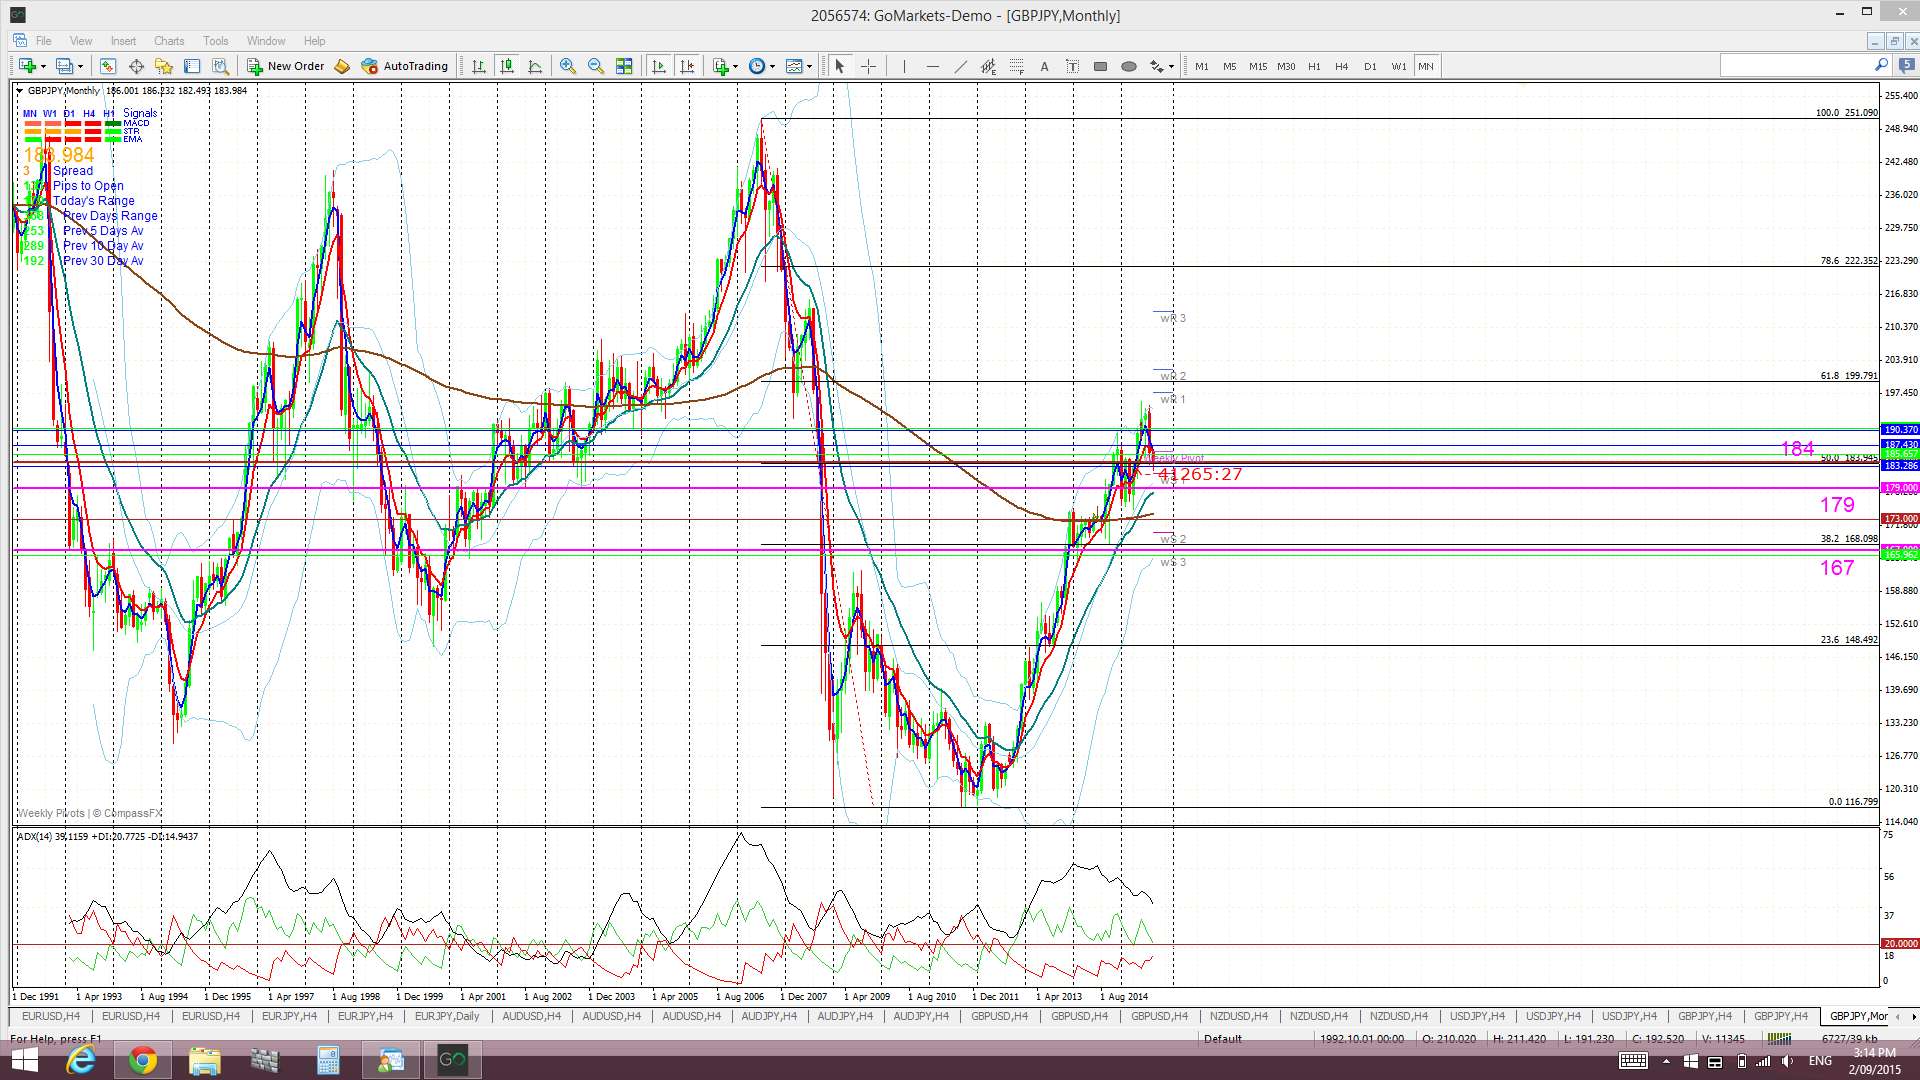
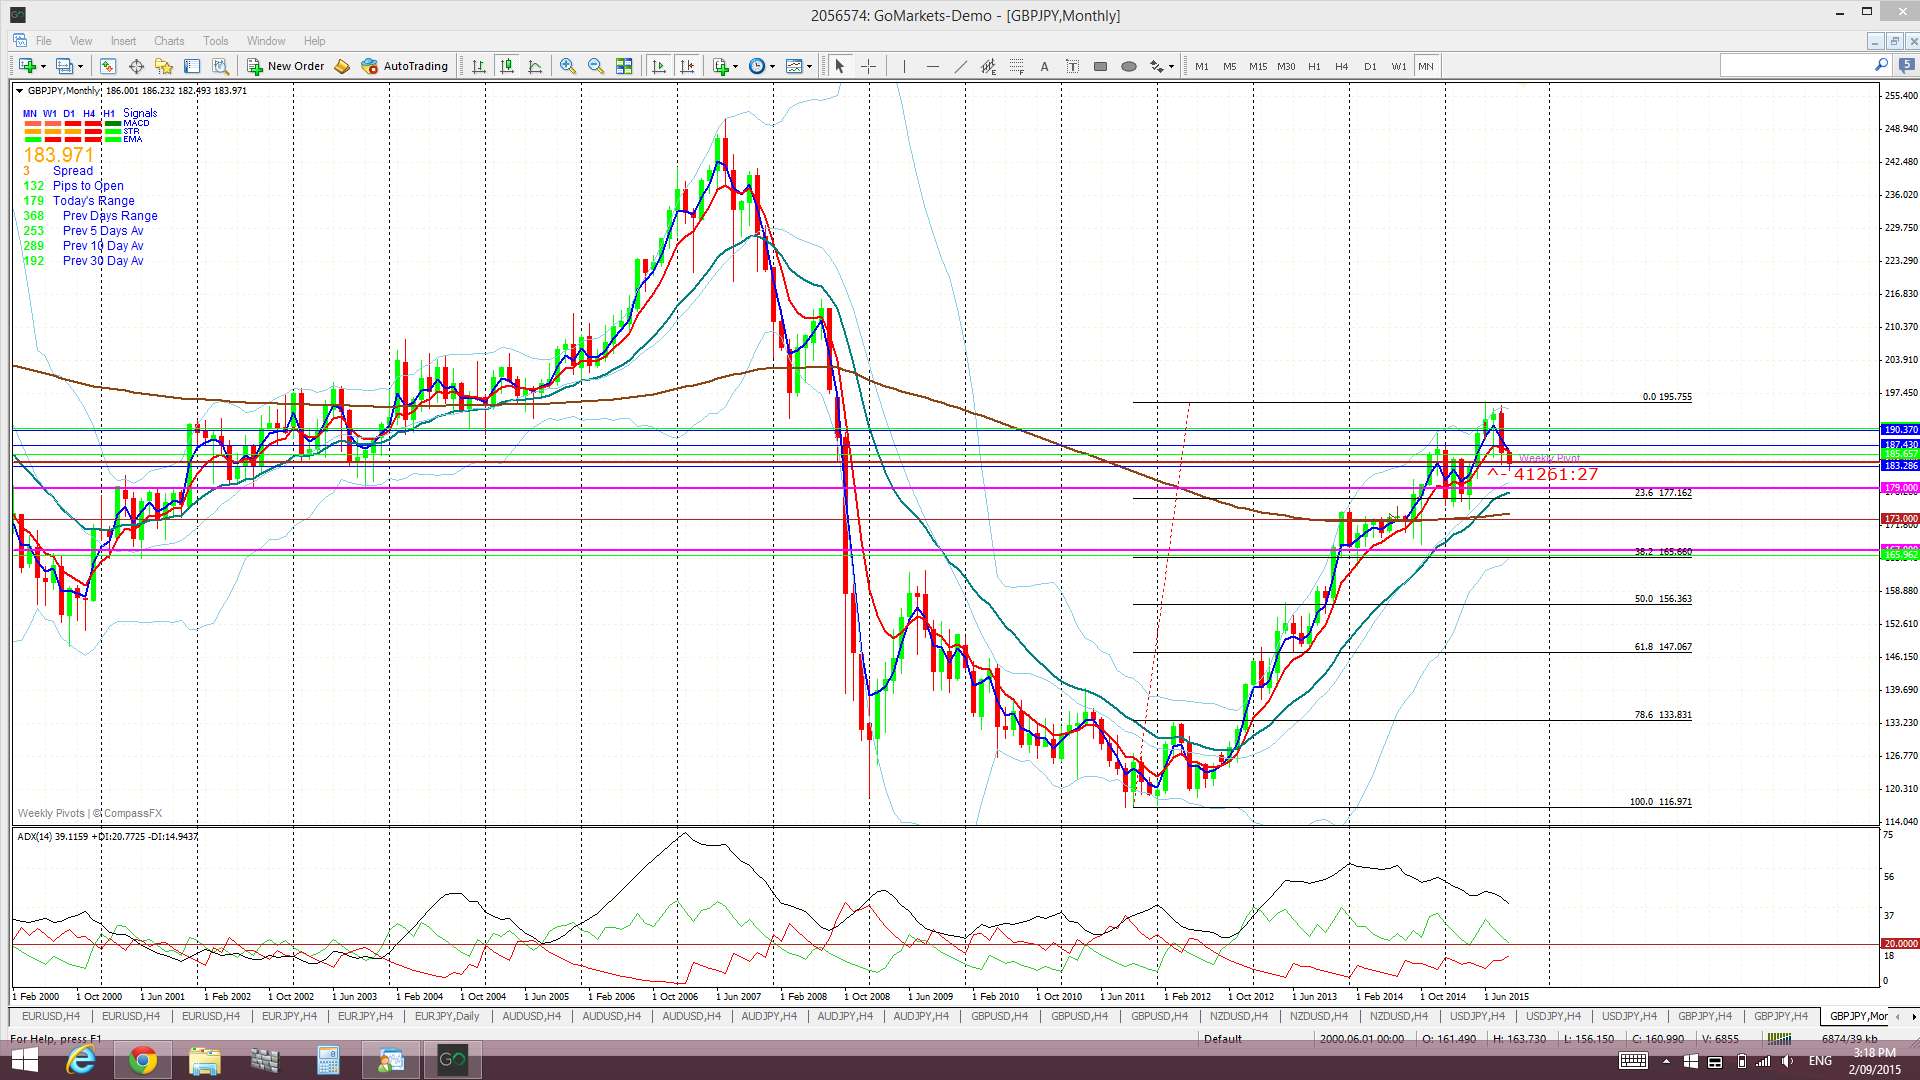
Any failure to reclaim this 184 level would be bearish though and would suggest a deeper pullback. Fibbing the recent swing high move might help to locate bearish targets should bearish continuation evolve. A 61.8% fib pullback would identify a target near 147 as the following monthly chart shows:
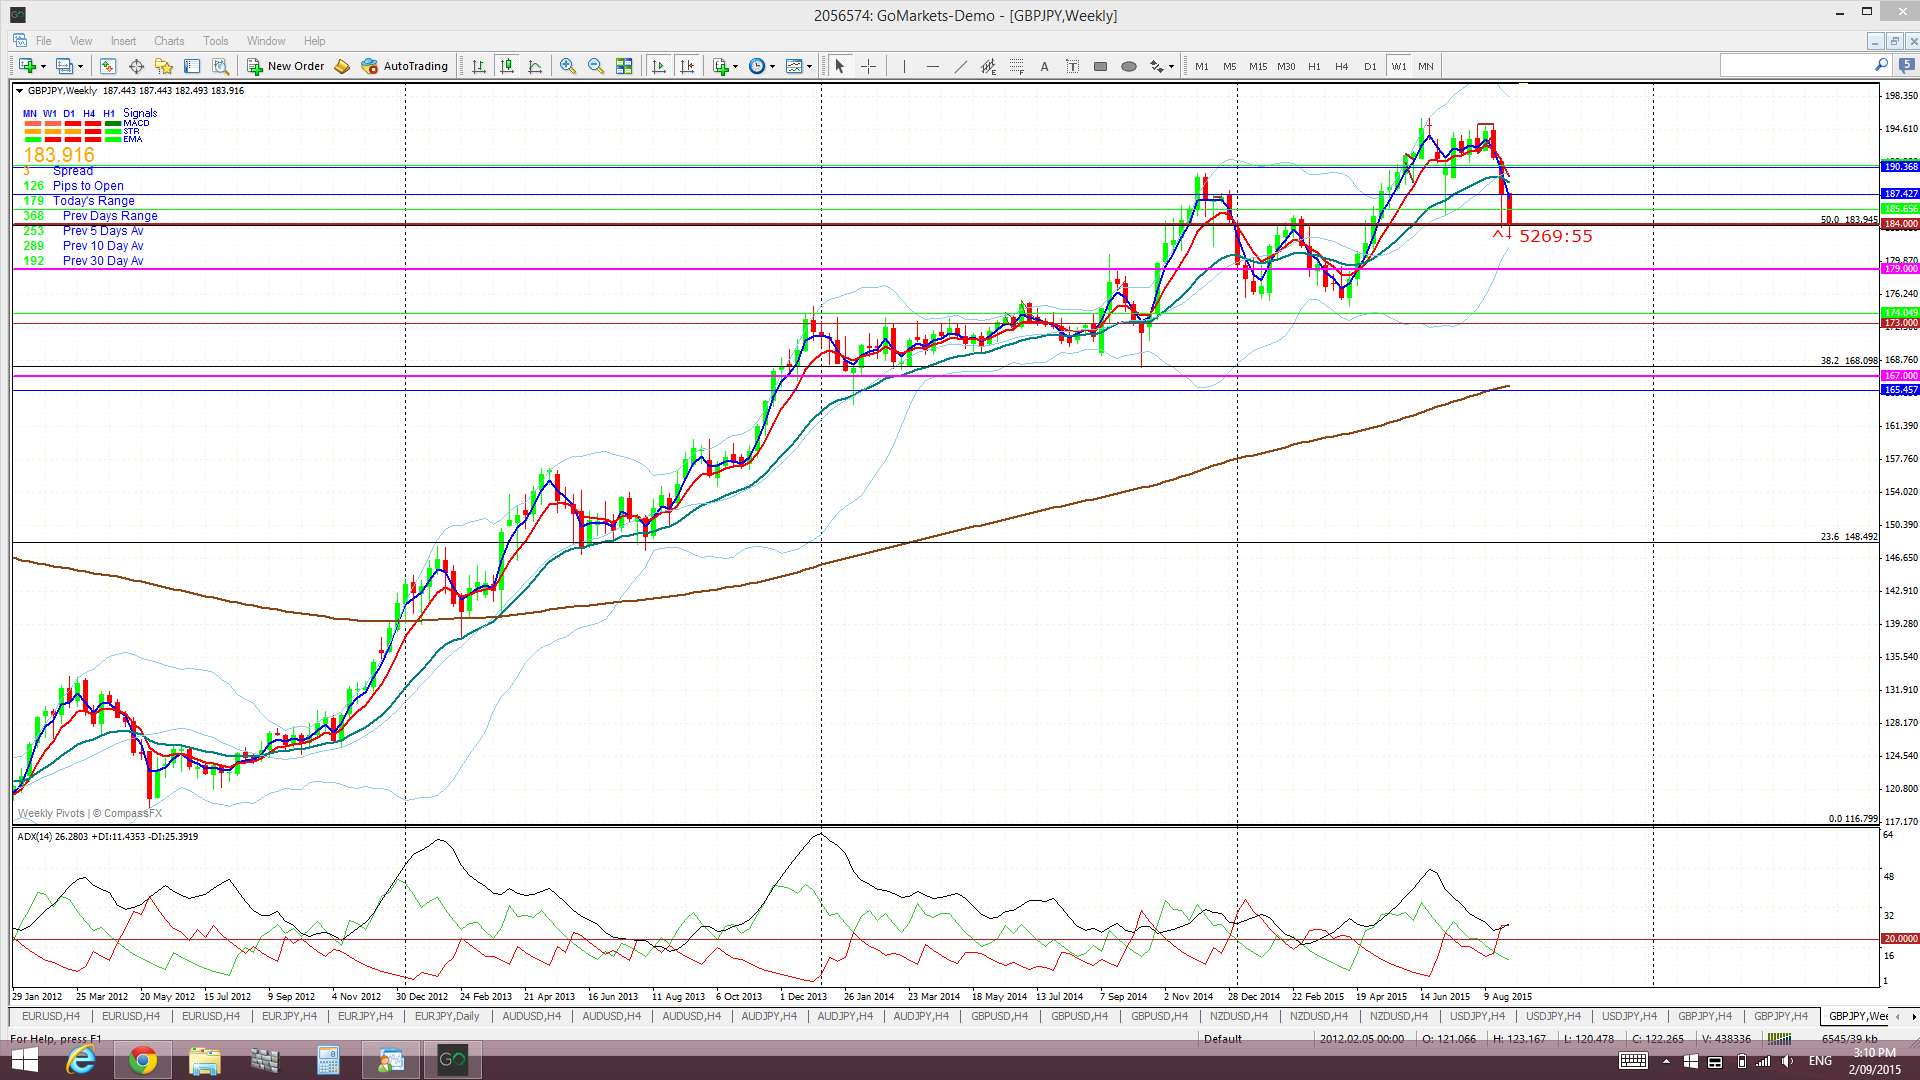
GBP/JPY weekly: 184 is a key S/R level here:
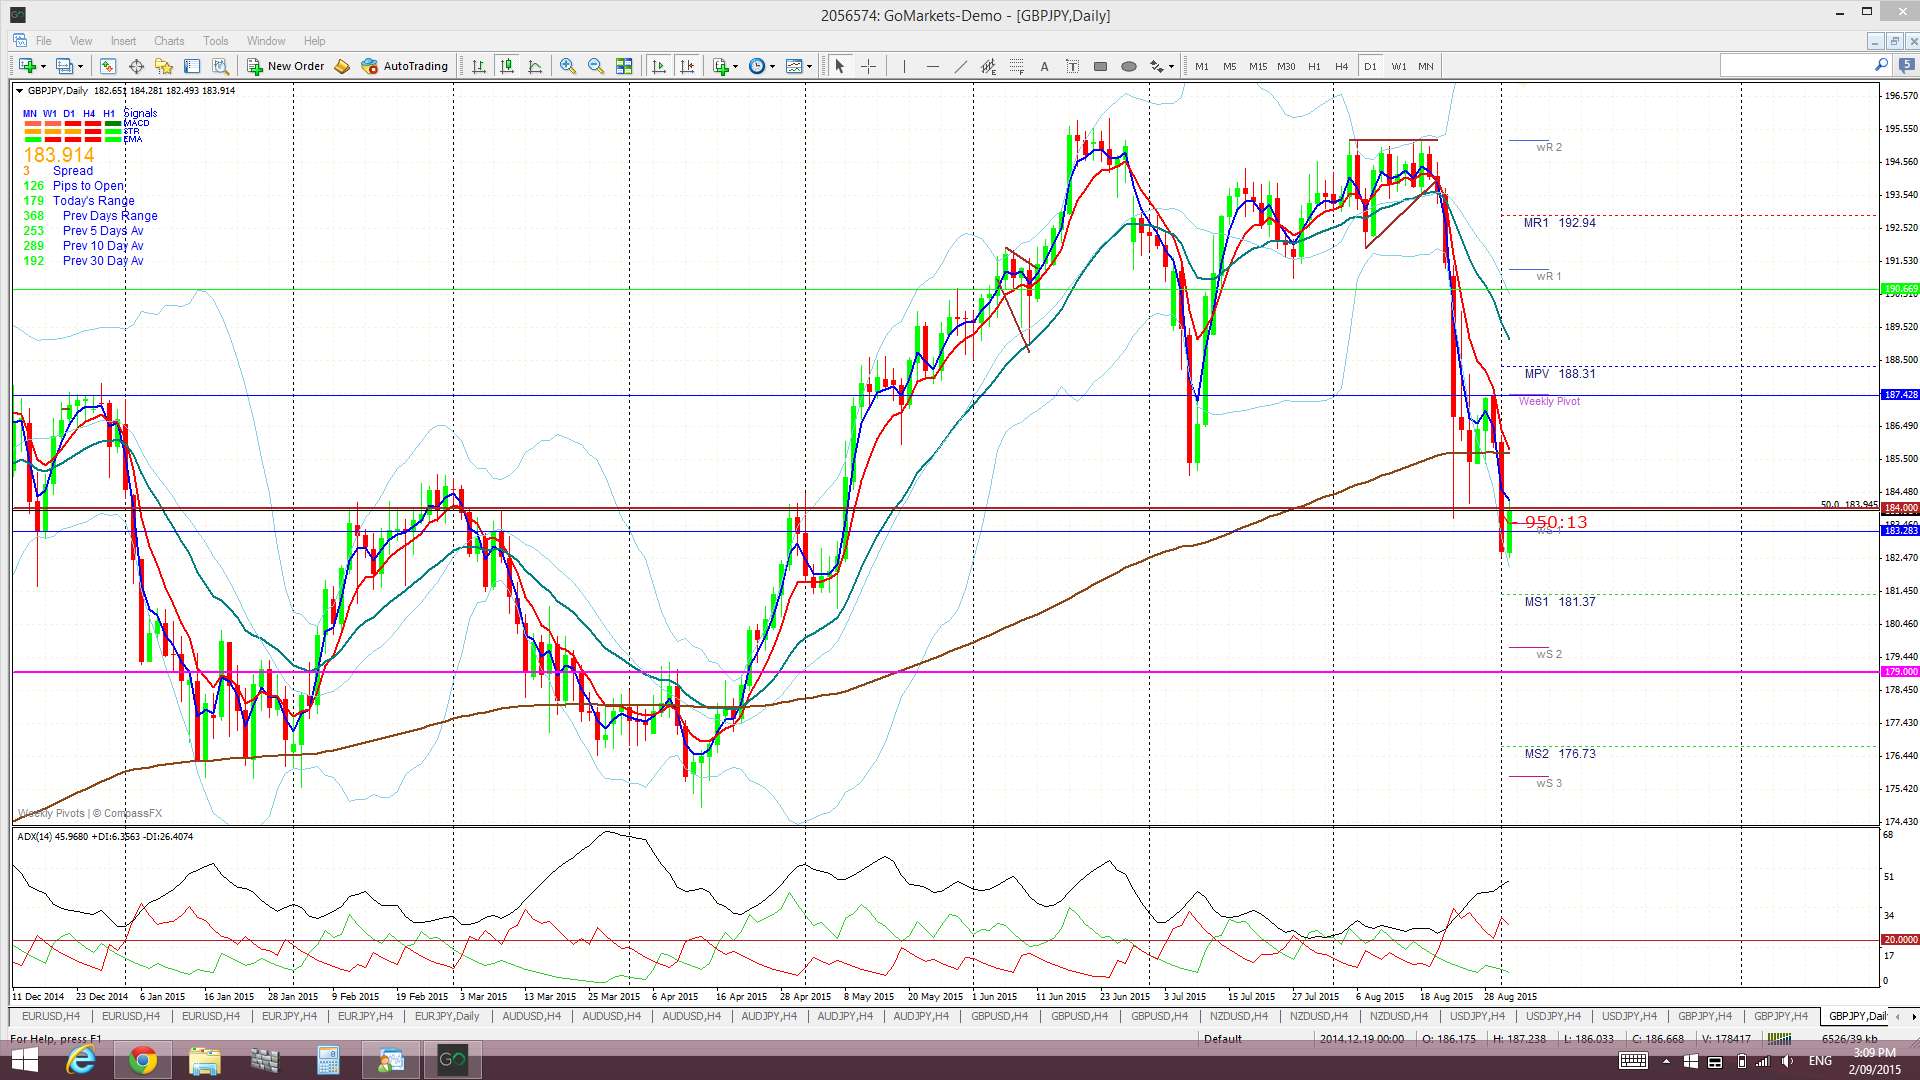
GBP/JPY daily: the 184 level has been broken and are we now seeing a test of this region before possible bearish continuation? Time will tell!
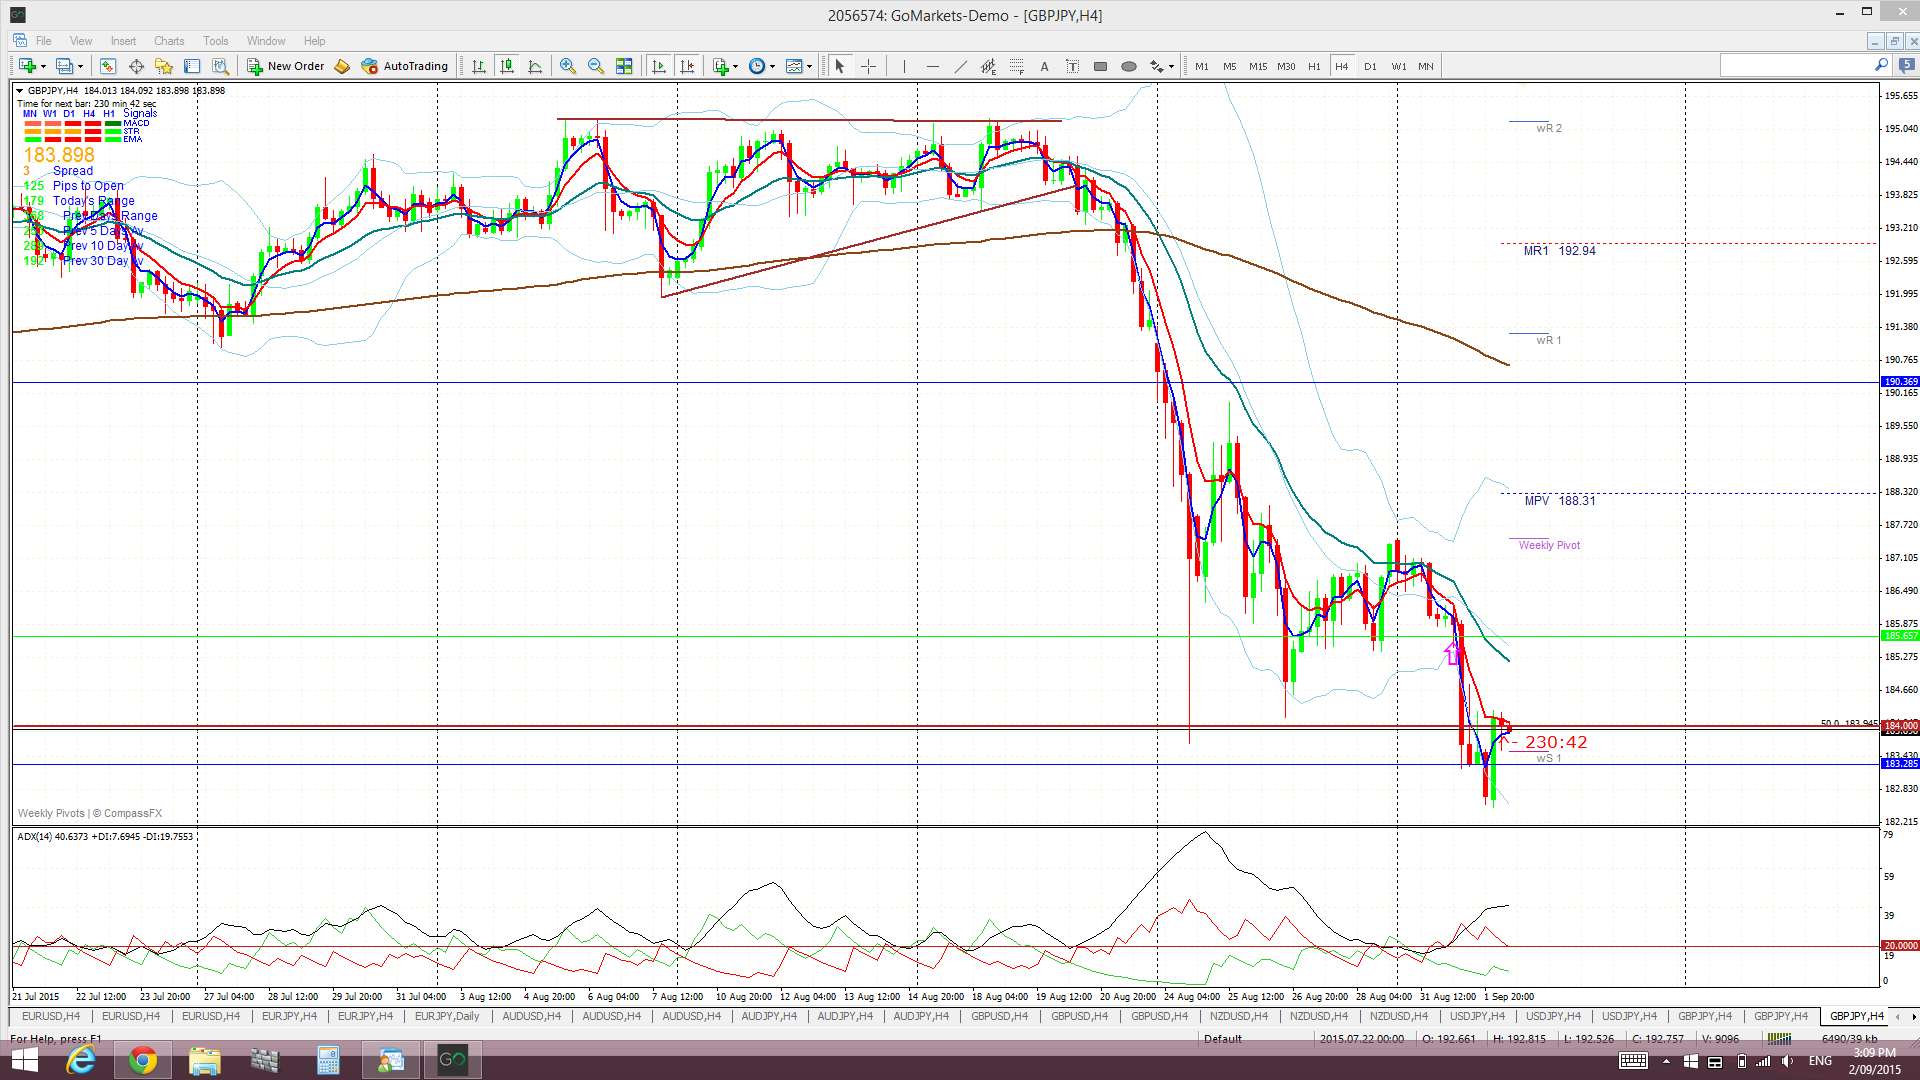
GBP/JPY 4hr: the triangle breakdown gave around 1,000 pips. Annoyingly, I missed seeing a new TC signal on yesterday’s 4hr chart that has moved on for around 300 pips. Keep an eye on how this pair moves from here though:
Summary: The GBP/JPY is currently testing a key level at 184 as this represents the 50% fib level of the major swing low GFC move. Watch this key 184 level for the following:
- a hold below 184 may support a move down towards the 147 region as this is the 61.8% fib of this recent swing high move.
- a move and hold back above 184 may support continuation up towards the 61.8% fib level near 200.
The post GBP/JPY and the 184 level. appeared first on www.forextell.com.