Gold has moved above a 6-year bear trend line and looks to be making a bullish breakout. However, traders need to watch to see if there is a weekly close and hold above this trend line to support a breakout thesis. In this post I review the charts of Gold, some ETFs and Gold stocks.
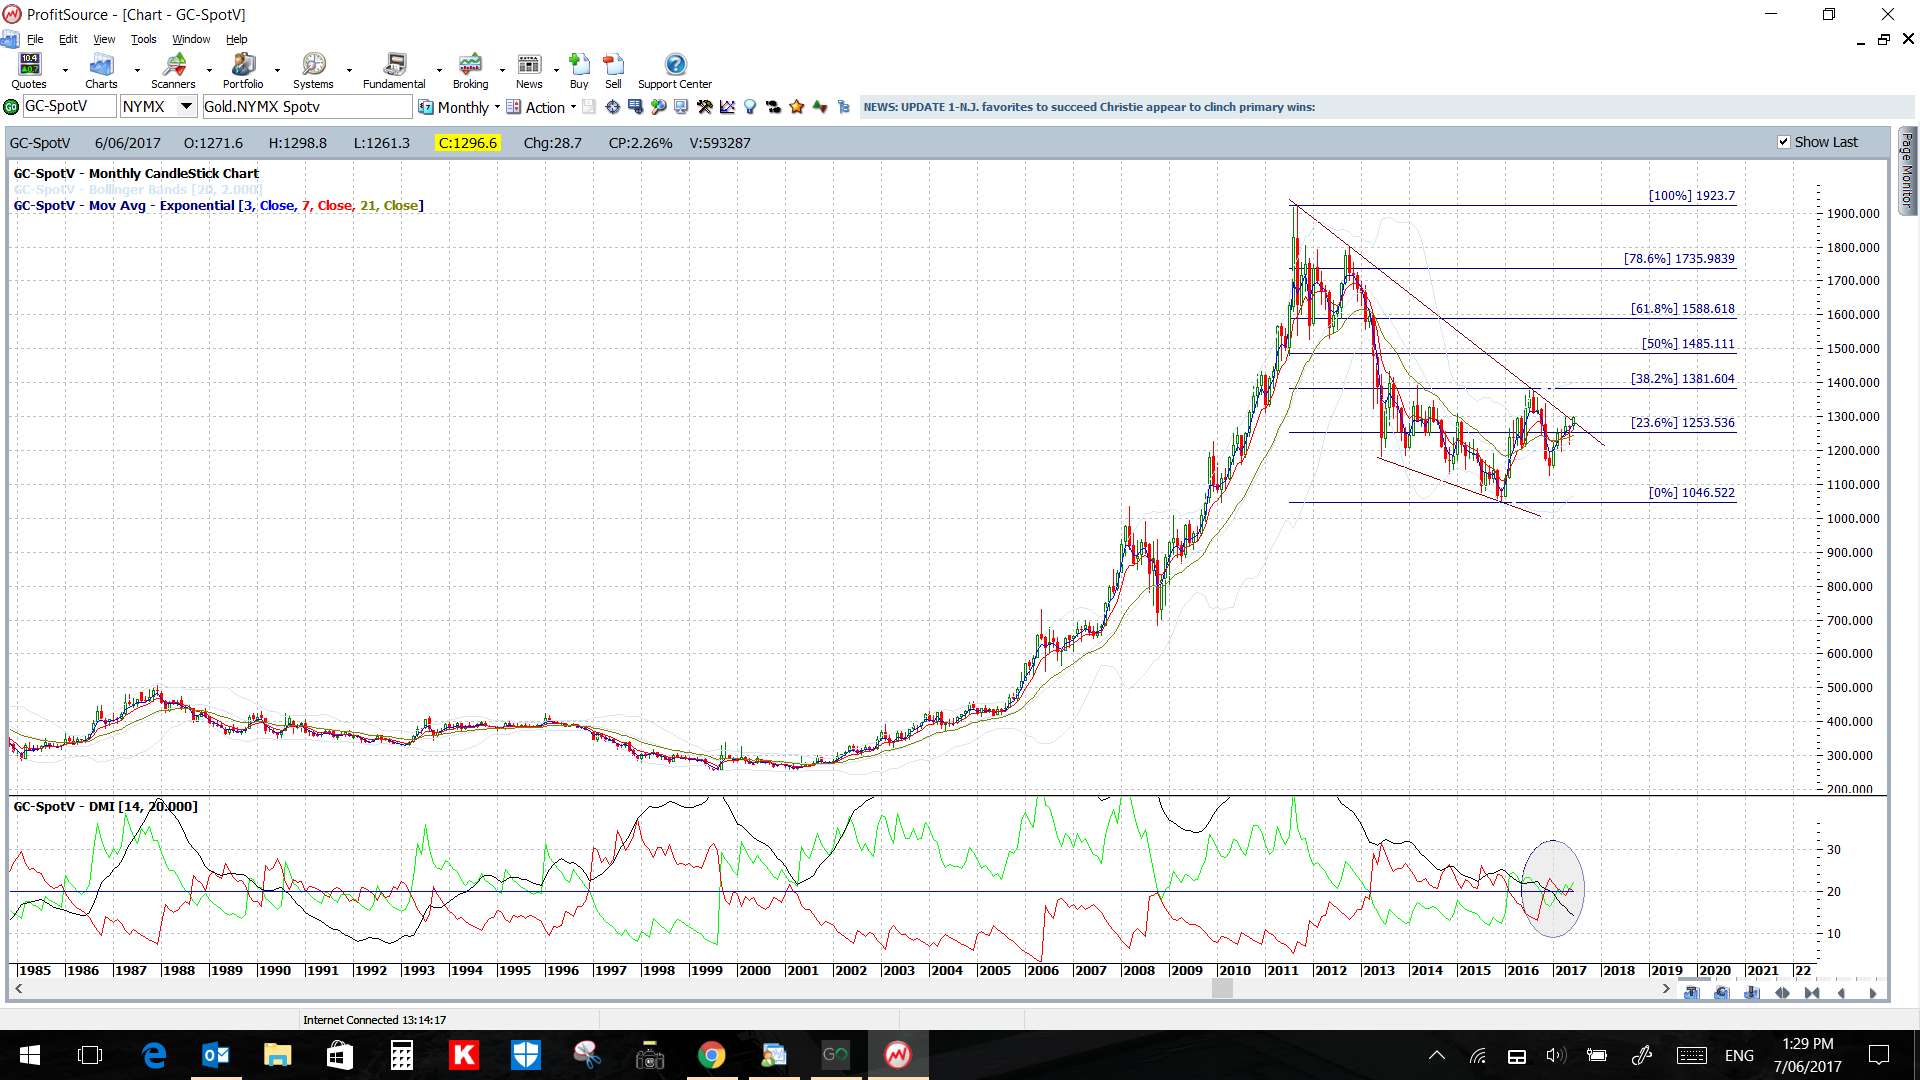
Gold monthly: this has looked like a Bull Flag for some time and it might be starting to render! A monthly candle close above the trend line would need to be seen to confirm this Flag:
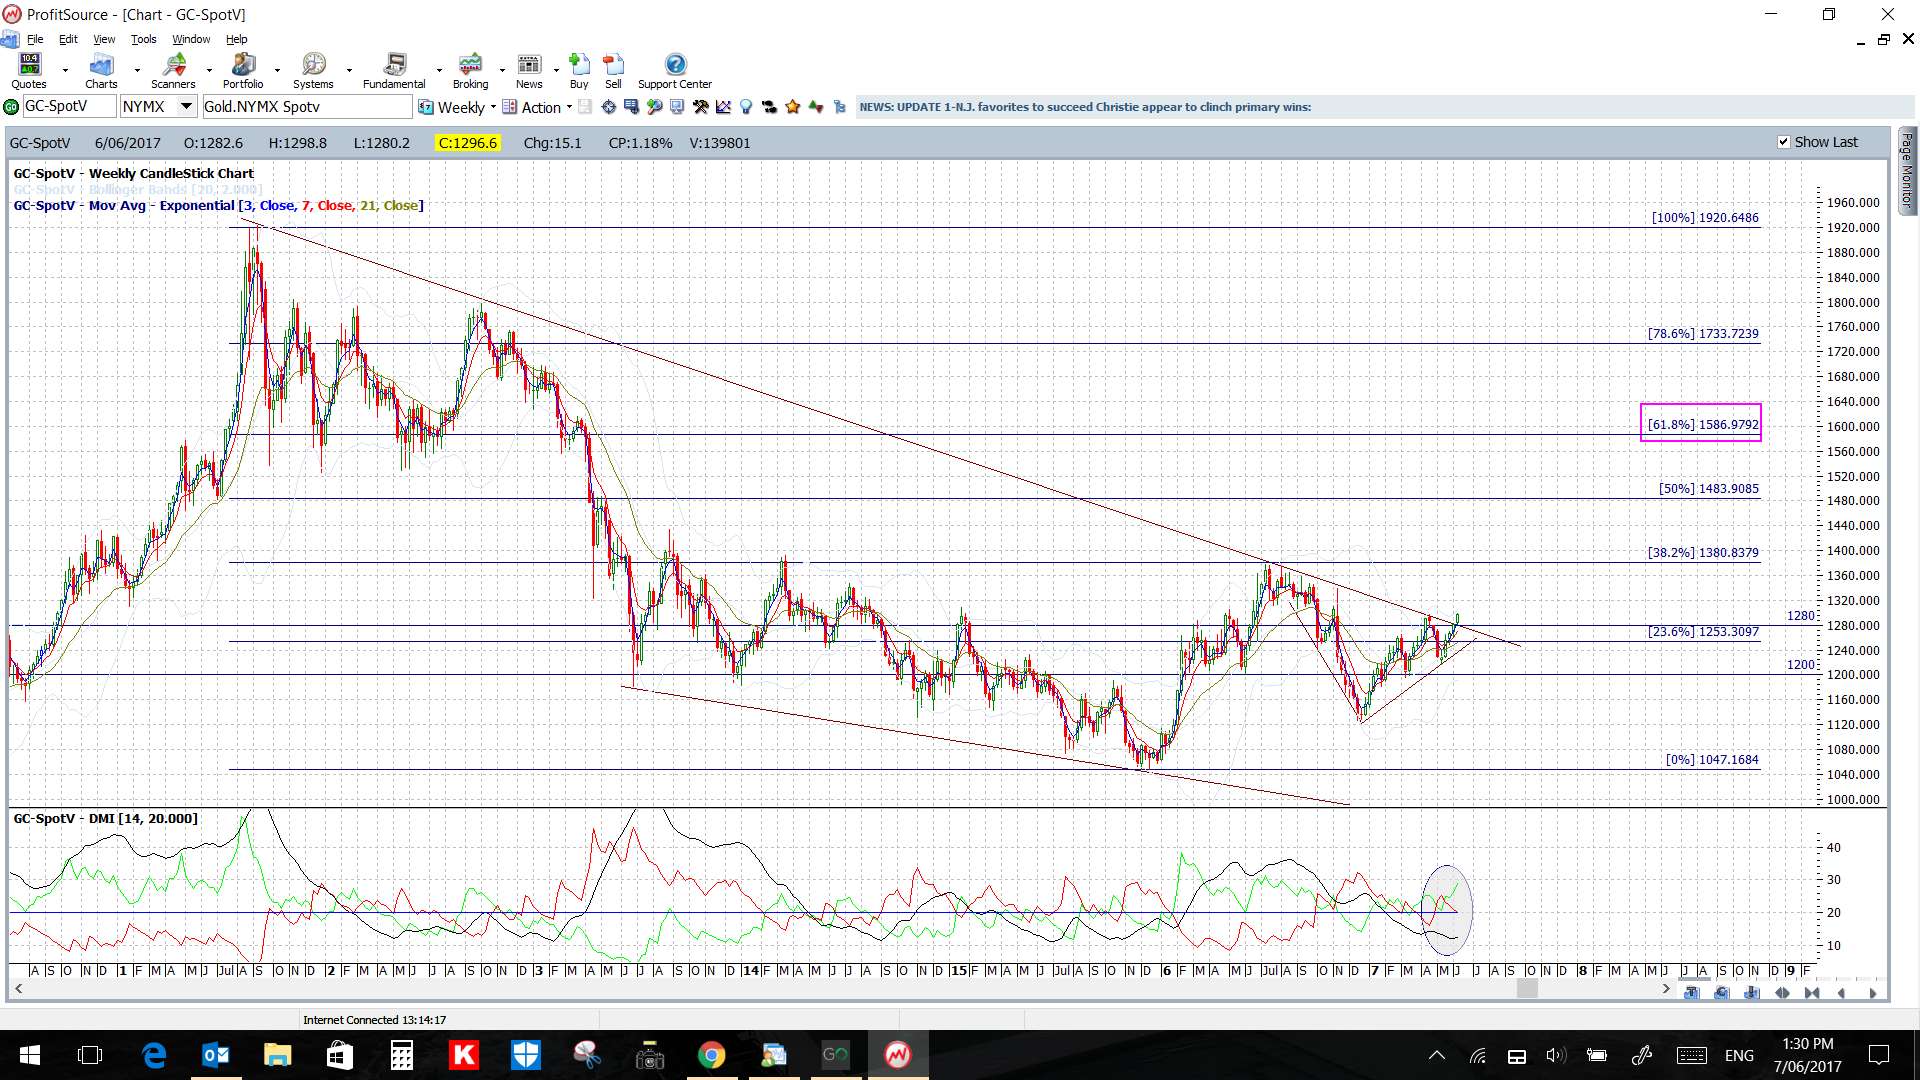
Gold weekly: watch for any hold above this trend line to support a bullish bias. A test of this broken trend line would not surprise either though so be on the lookout for that; near $1,280:
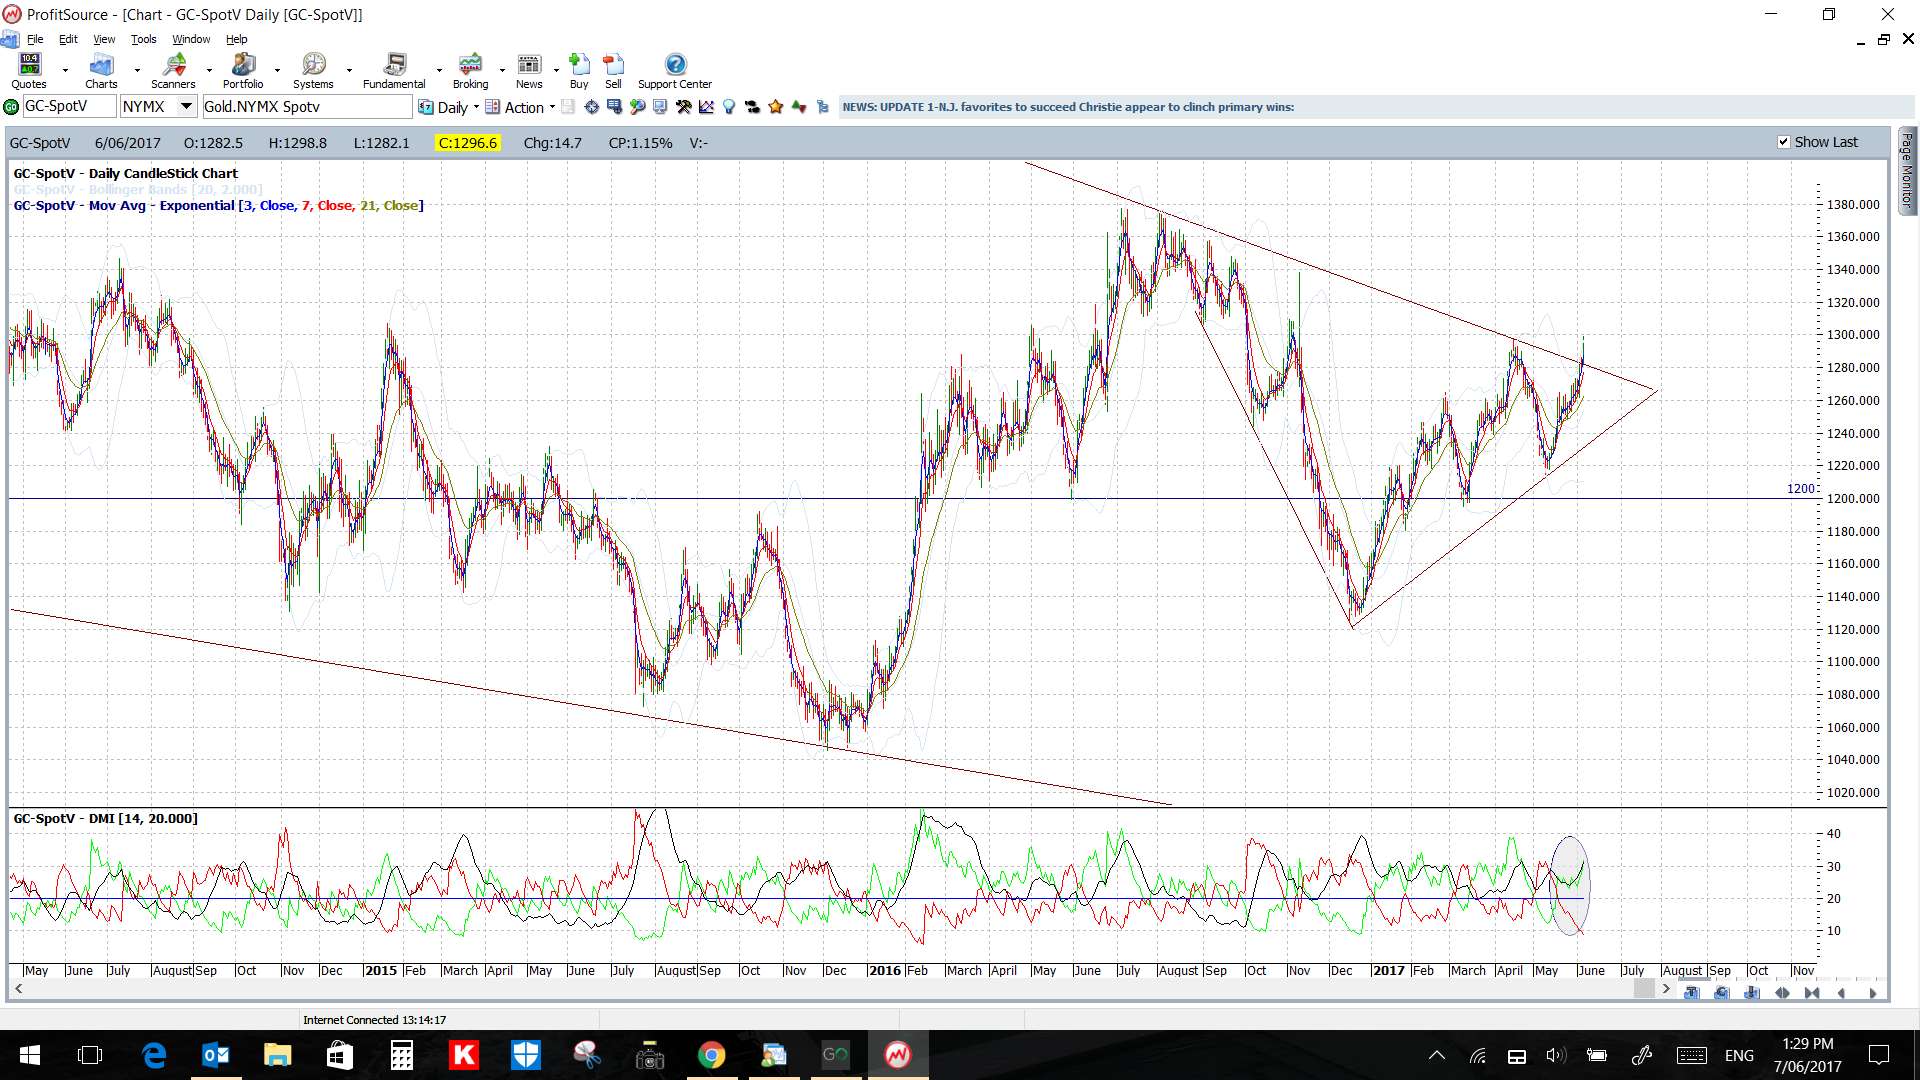
Gold daily: there has been a daily candle close above this 6-year bear trend line but we need to see a weekly close:
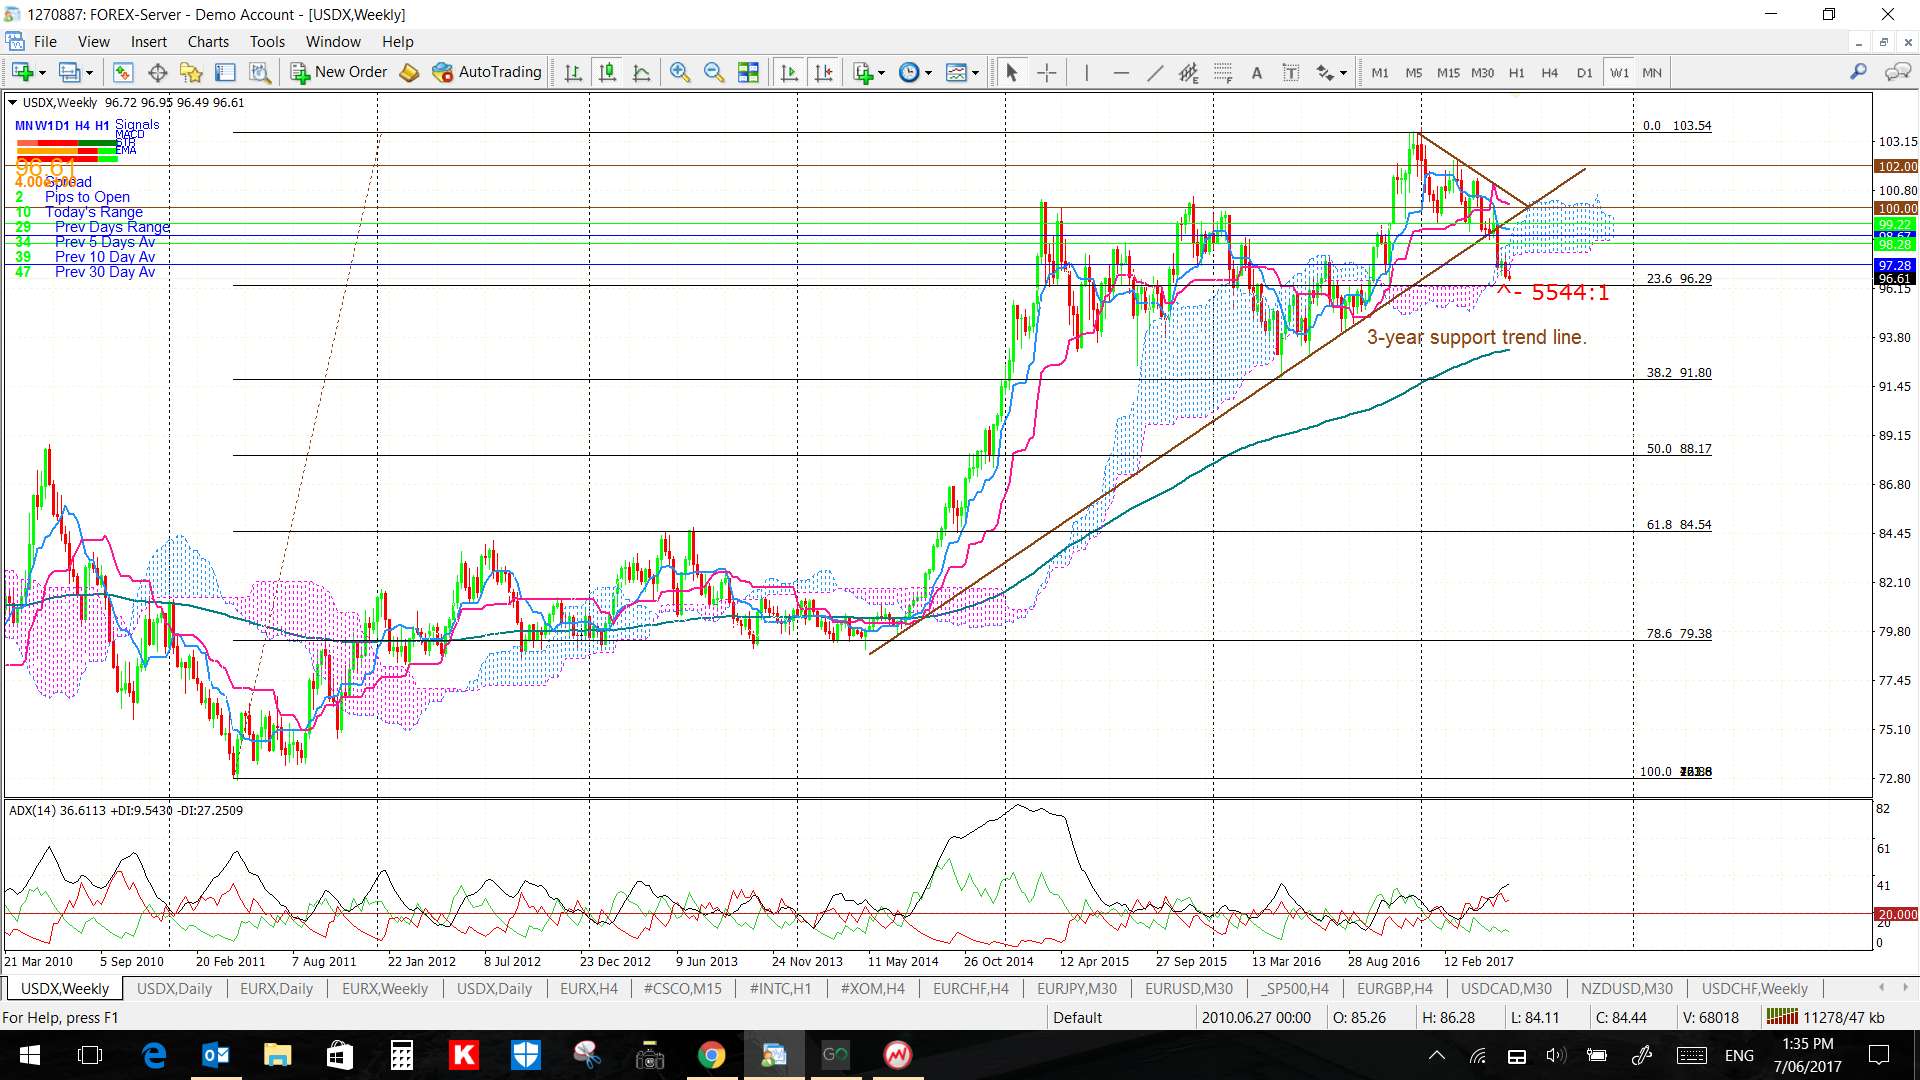
USDX weekly:
Any bearish follow through on the US$ would help to underpin bullish sentiment on Gold, that and growing Geo-political jitters:
Gold Stocks and ETFs:
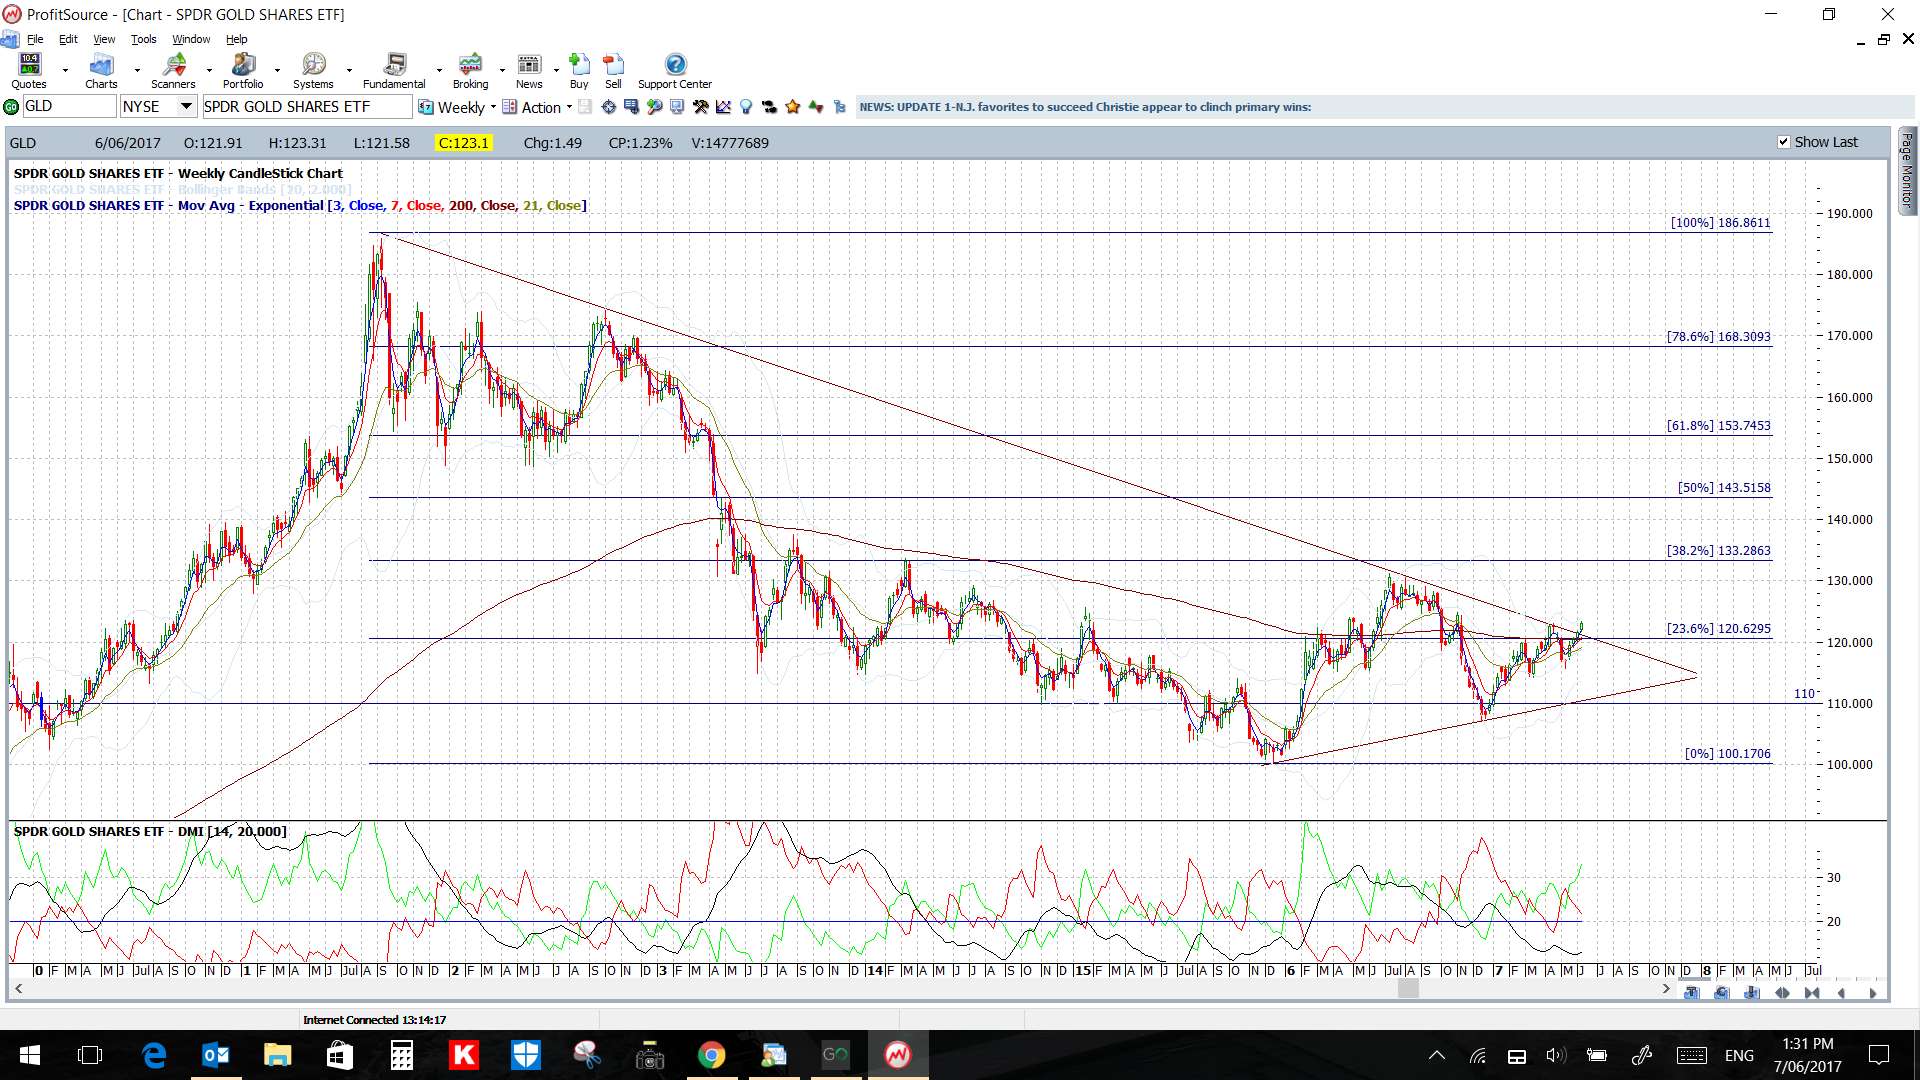
GLD weekly: Gold bullion ETF; like the base metal, this ETF is attempting a bullish trend line breakout.The trend line and weekly Cloud have been broken but watch for the ADX and Volume to kick in:

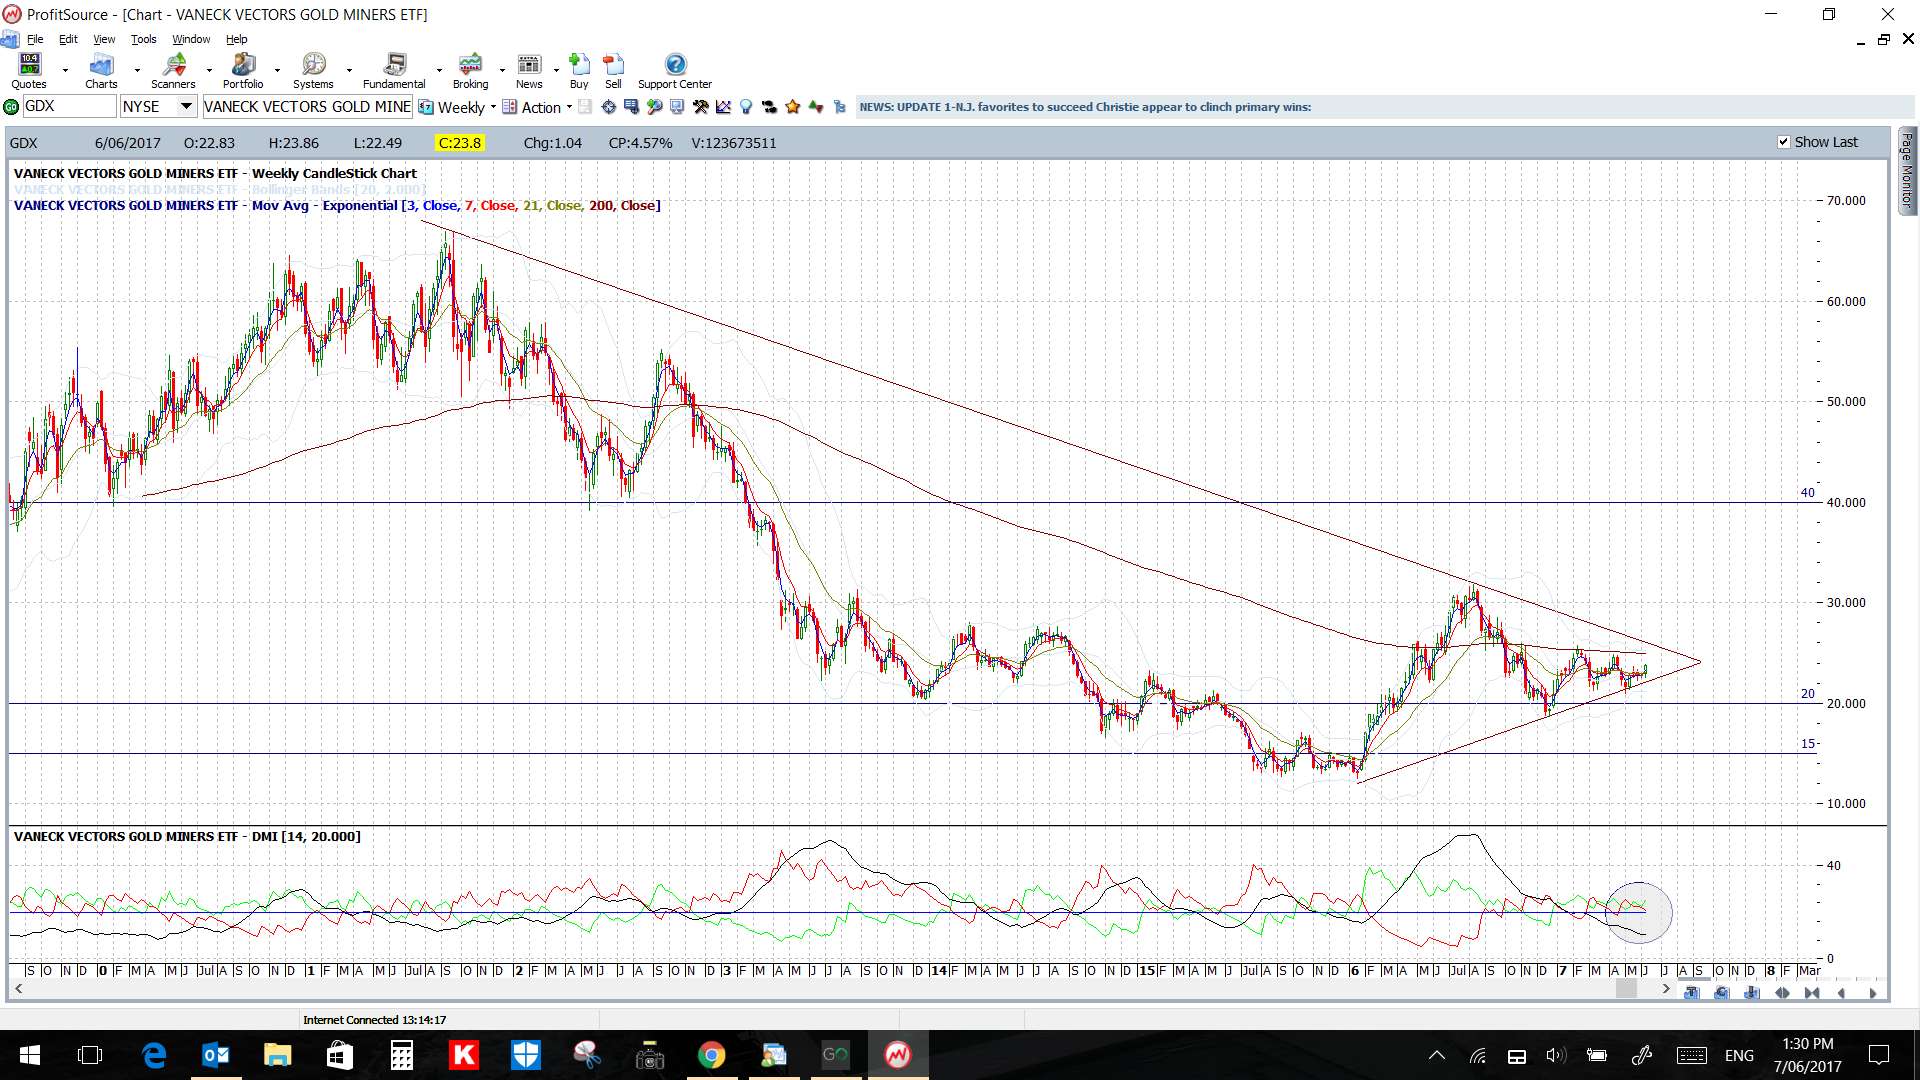
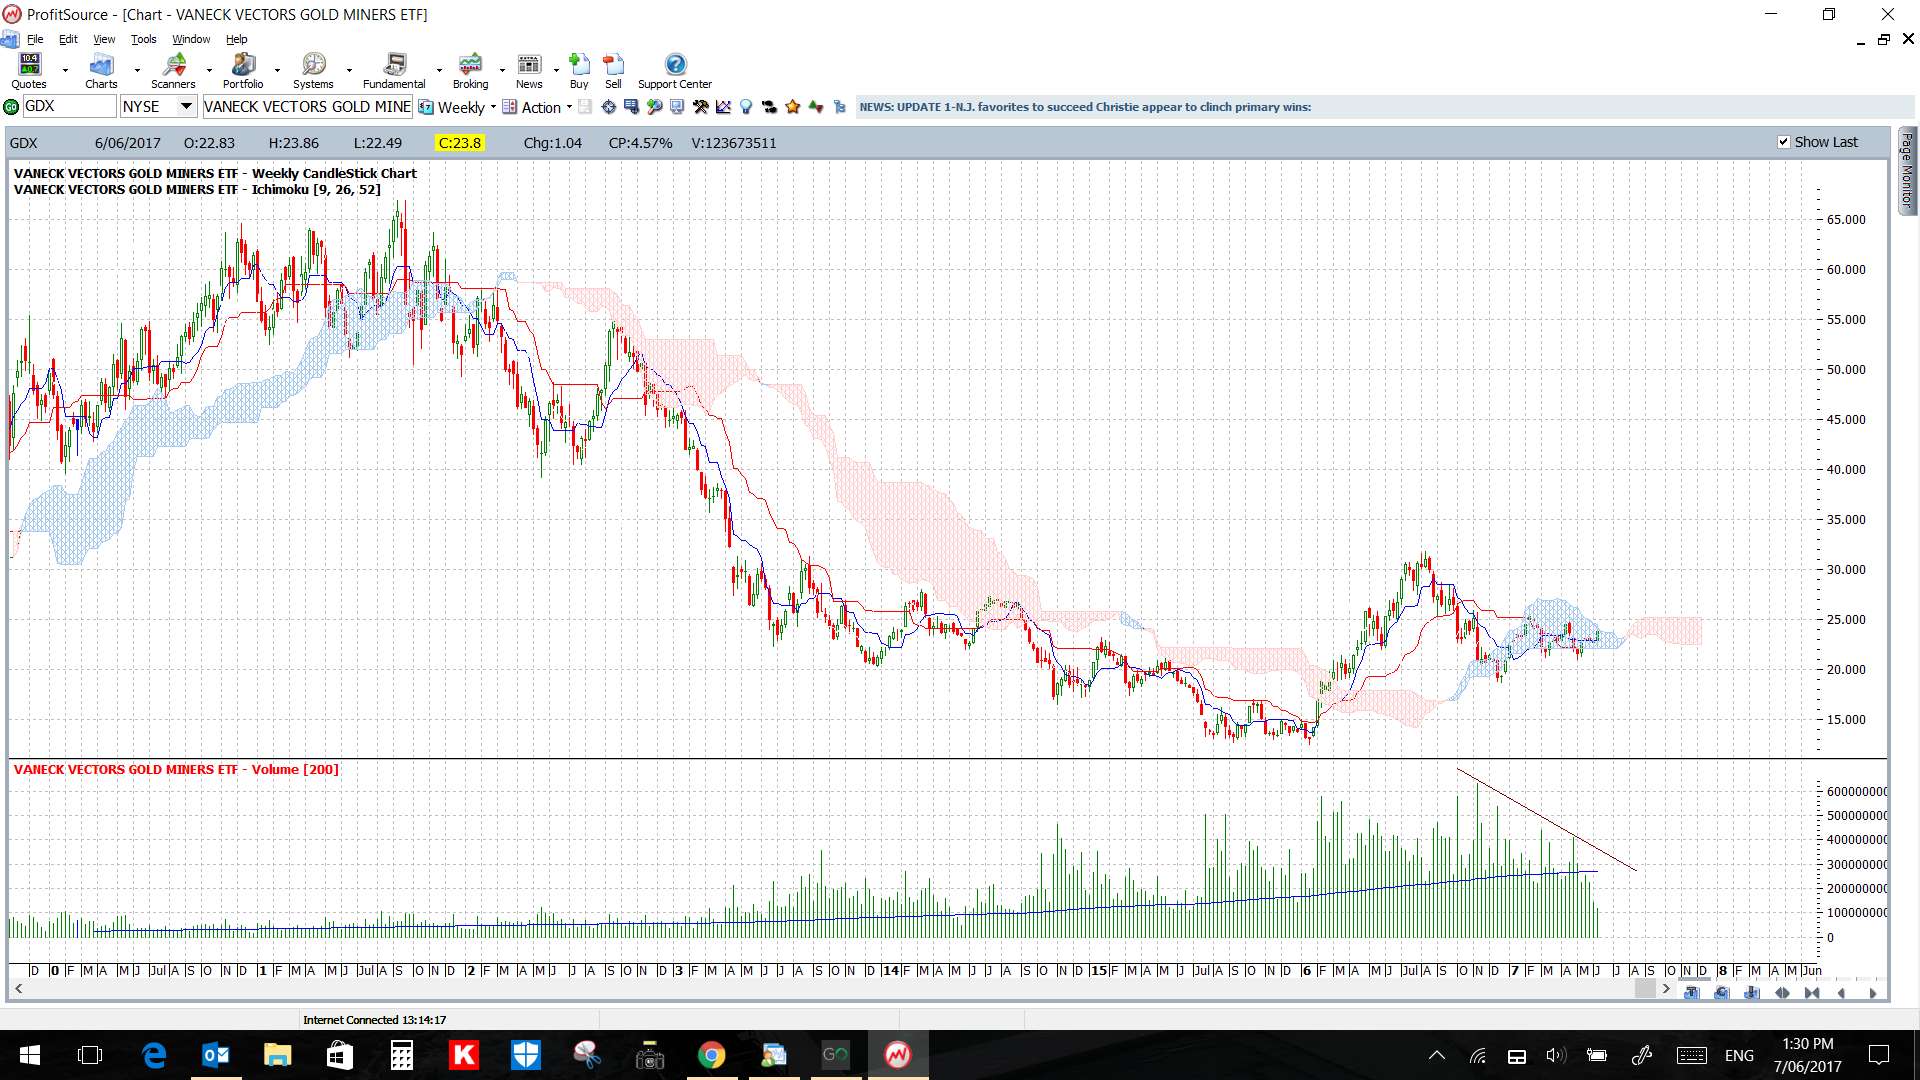
GDX weekly: Gold Miners ETF: I’m still seeing a bit of work to be done here for this to achieve a trend line, Cloud and Volume breakout:
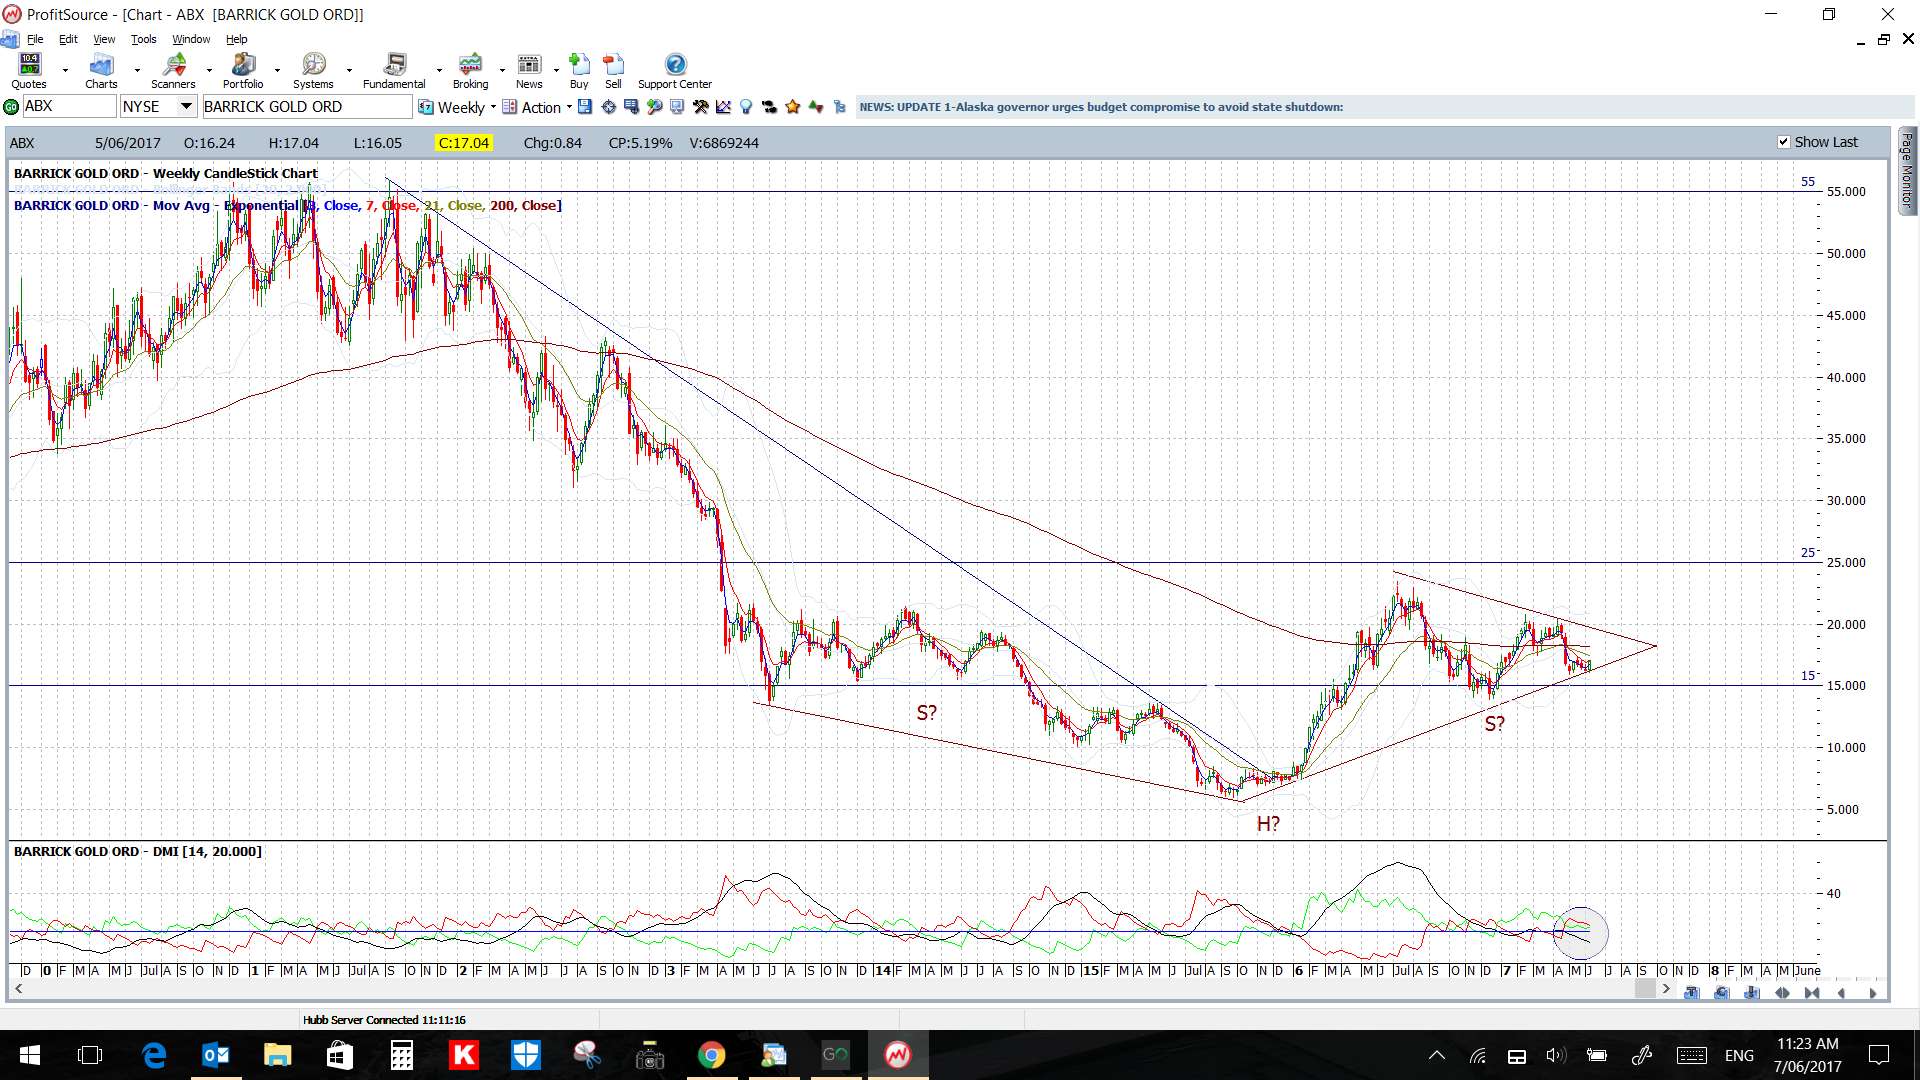
ABX weekly: Barrick Gold: watch for any momentum-based trend line breakout:
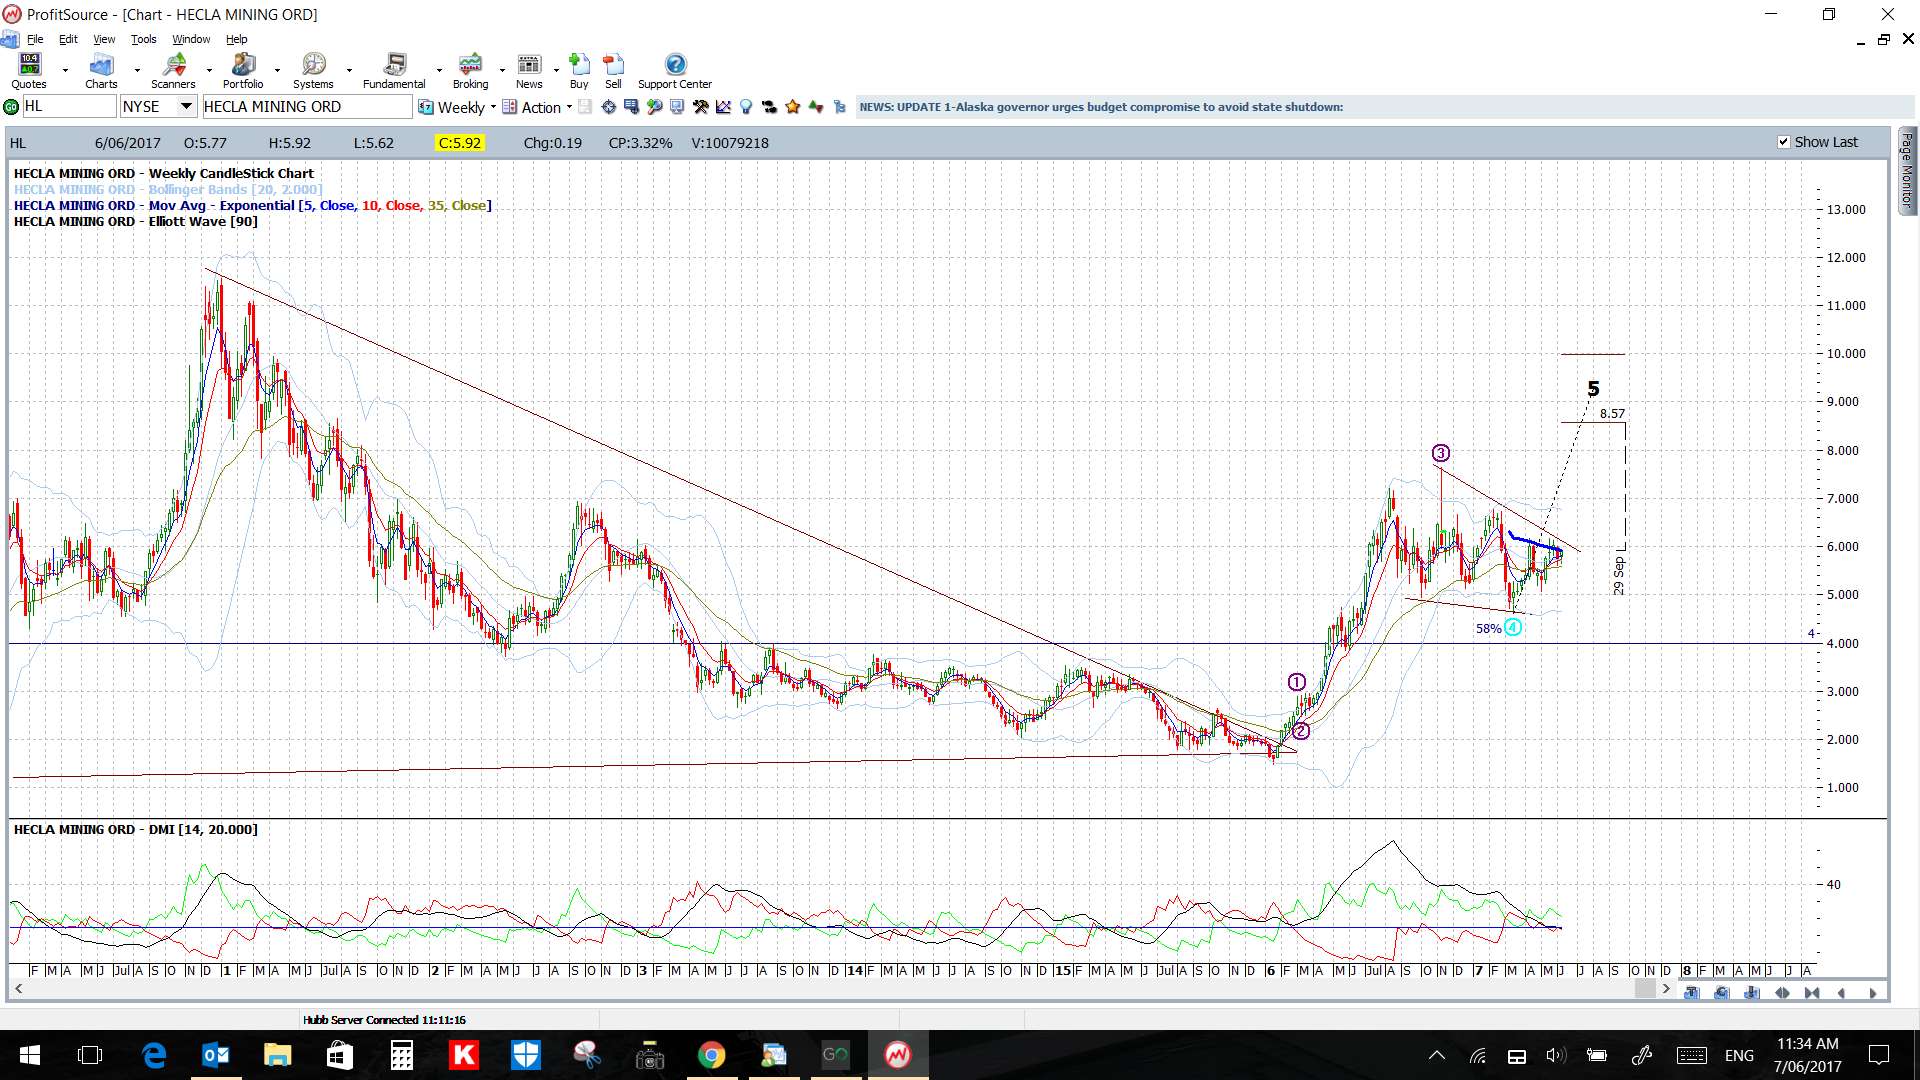
HL weekly: Hecla Mining: ditto:
HMY weekly: Harmony Gold: watch for any momentum-based trend line breakout:

IAG weekly: IAMGOLD Corp: a bullish breakout looks to be underway here. Target would be the 61.8% fib:

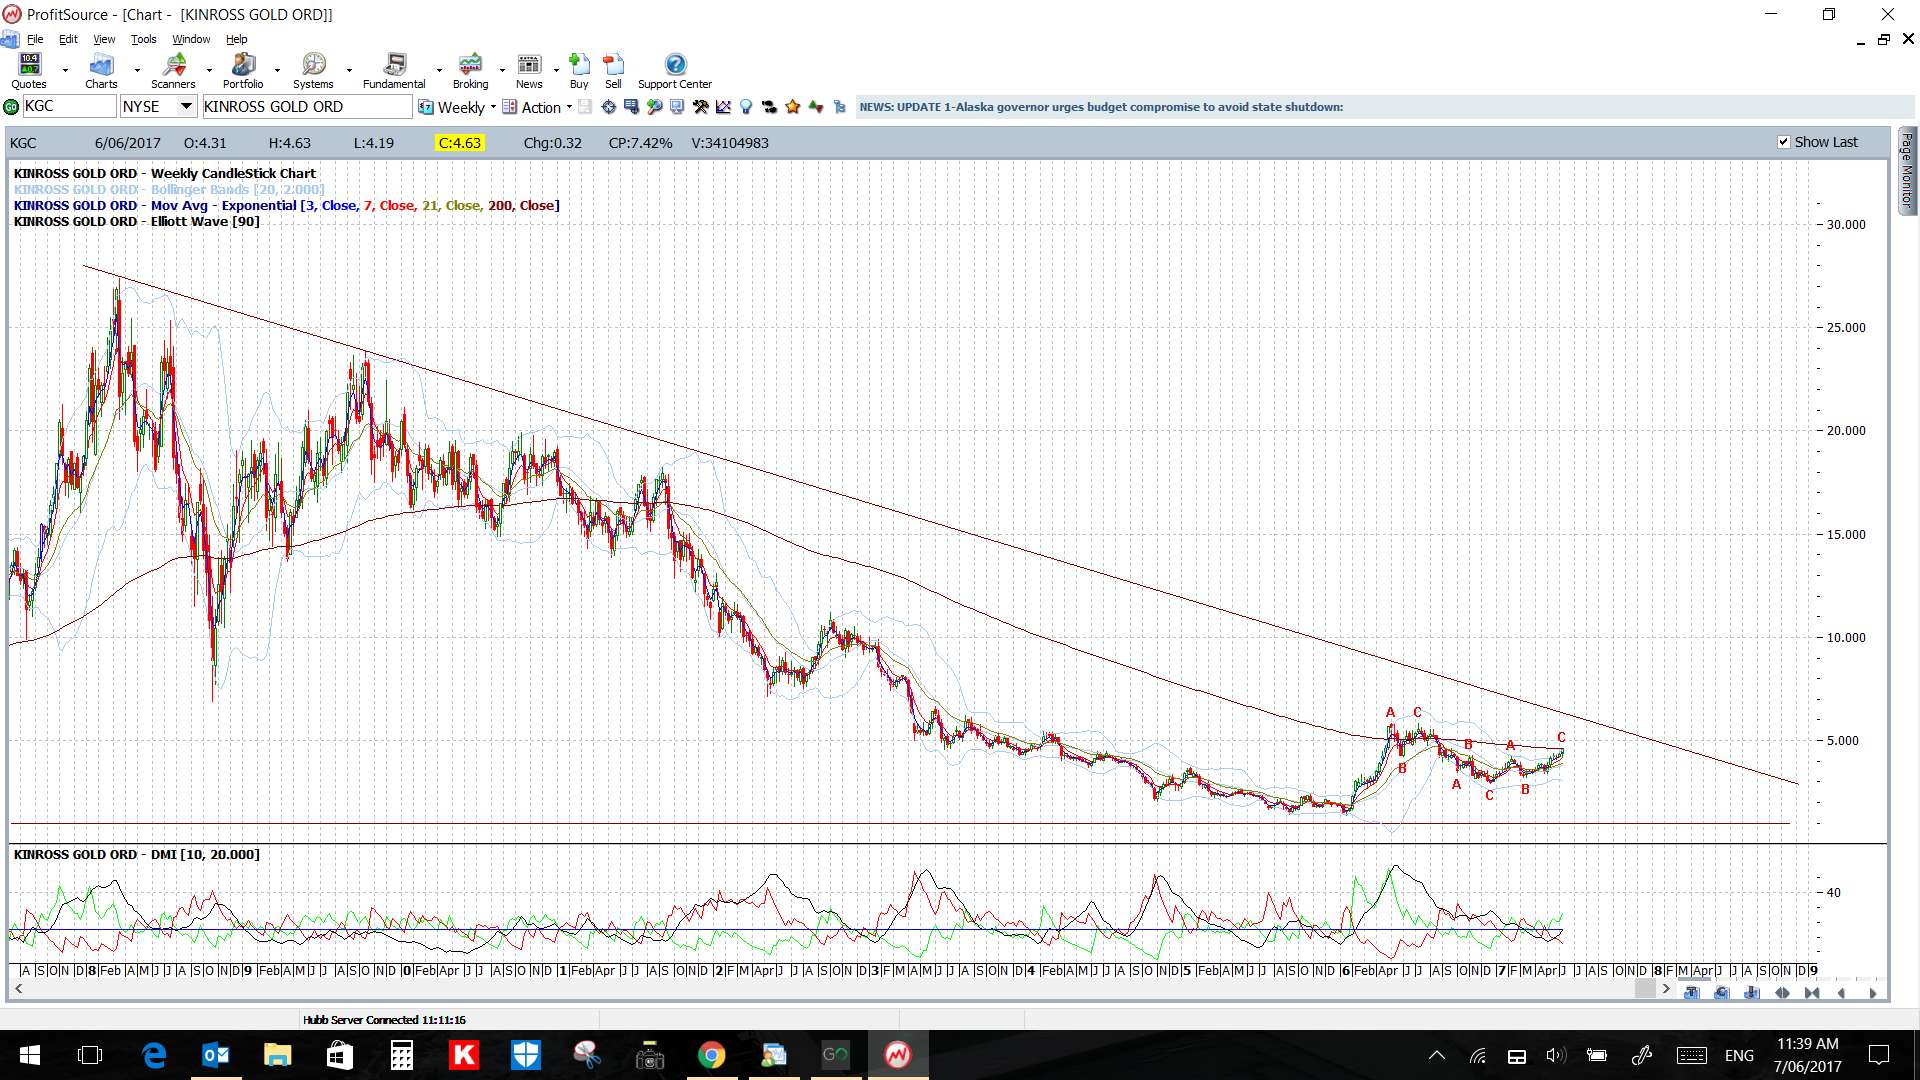
KGC weekly: Kinross Gold Corp: watch for any momentum-based trend line breakout: