Last week: there were two TC signals on the USD/CAD = closed off for -40 and the EUR/JPY= 200 pips & still open but there was also the trend-line breakout trade on the EUR/USD, a move that was stalked here in the lead up to ECB, and this went on for over 300 pips.
This week:
FOMC: The main event this week is FOMC and this will be closely watched to see what impact the news might have on the US$. It could prove to be a pivotal week for many FX pairs as the US$ and EUR$ indices have been range-bound within Flag patterns for the last six months and the big question is whether this week’s FOMC might be the event to trigger a major breakout. A review of the US$ can be found through this link.
There are three Central Banks reporting Interest Rate decisions this week: US FOMC on Wednesday, NZD RBNZ on Thursday and the BoJ on Friday.
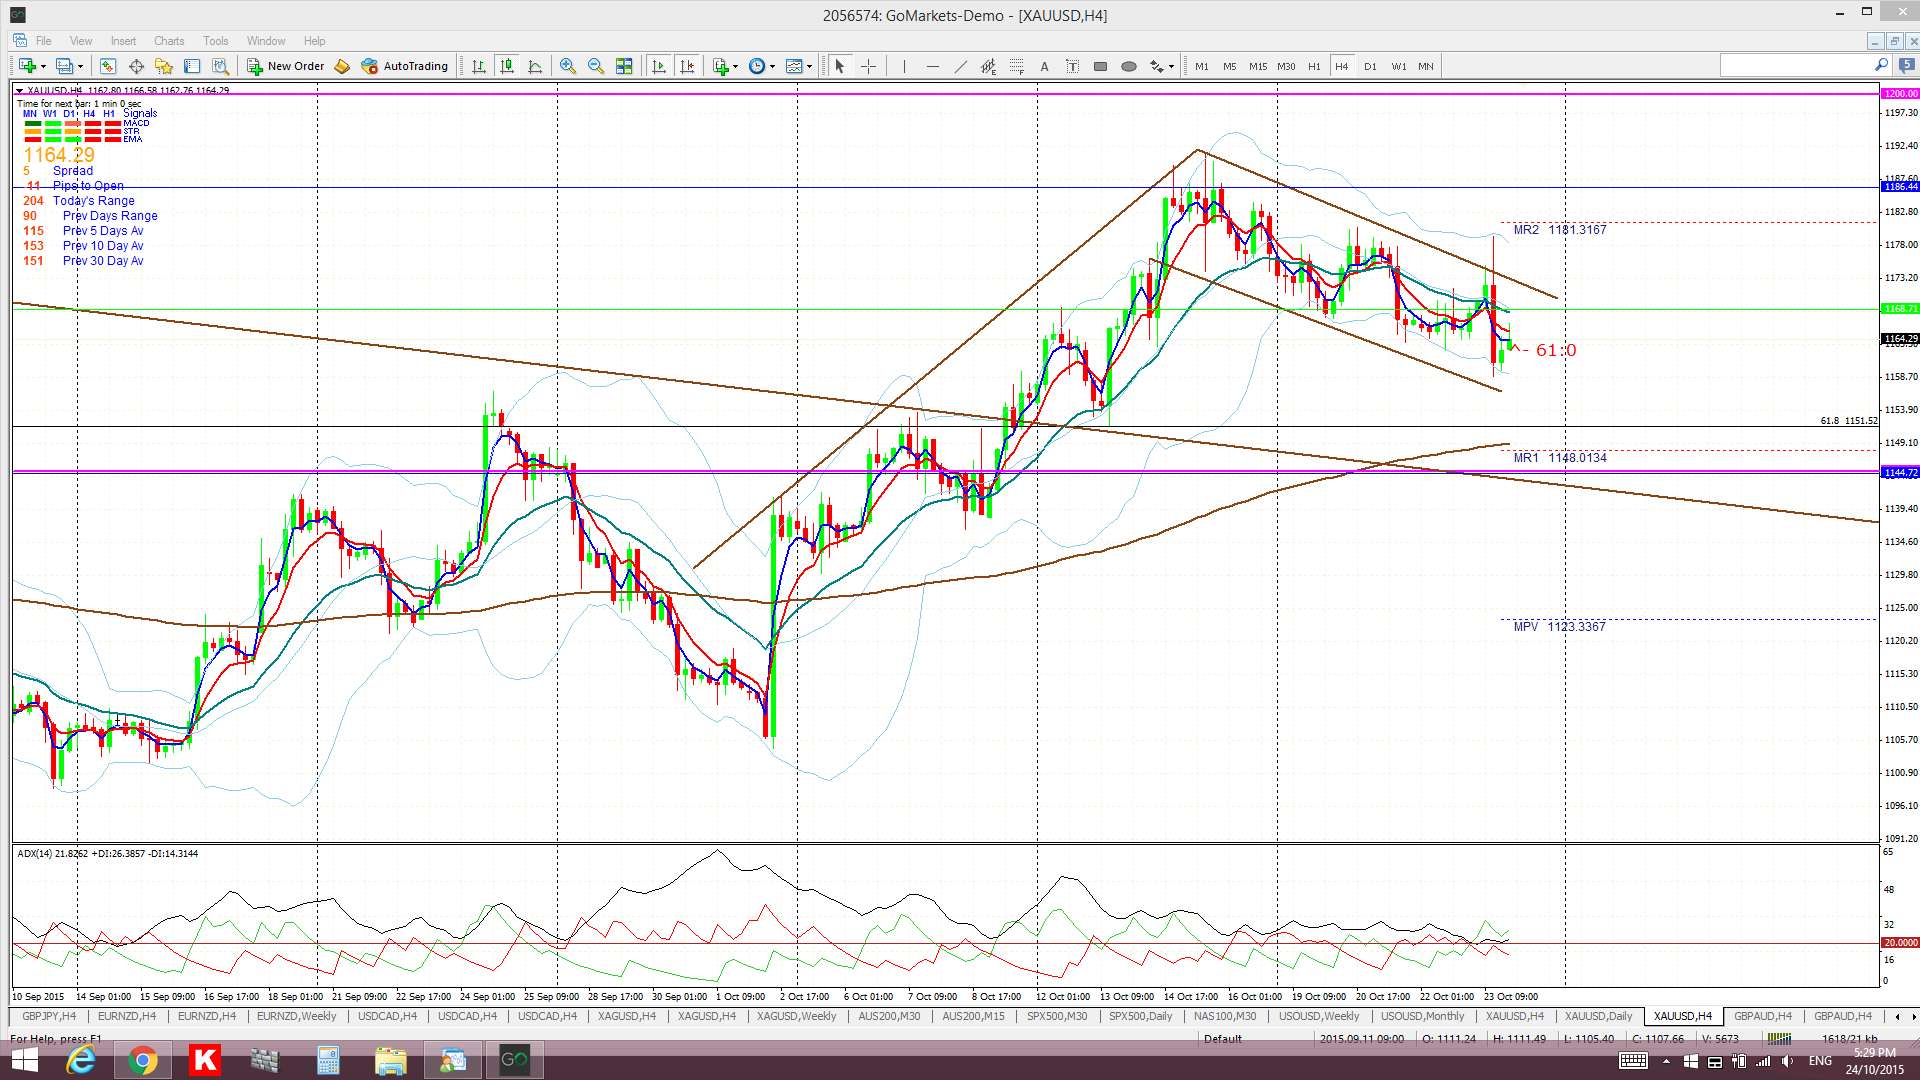
Gold: Gold could benefit significantly if there is any delayed US rate hike. Keep an eye on the next resistance level of $1,200 or for any close back below $1,145.
Next Friday is the final trading day for the month and so watch out for monthly candle formations and new Pivots after that.
NB: this is a relatively brief update as I am away for the w/e.
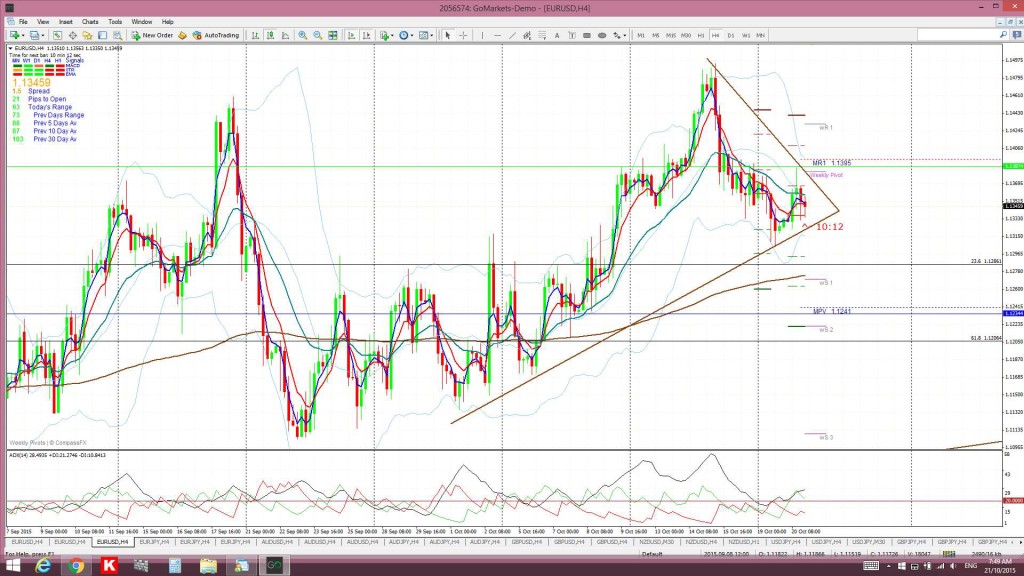
EUR/USD: This pair was savaged by last week’s dovish ECB comments. This was how the 4hr chart of the E/U appeared in my post prior to the ECB meeting:
This is how the 4hr chart appears now. Clearly, the triangle trend line guide could have helped to leg-in to a 300 pip+ move!
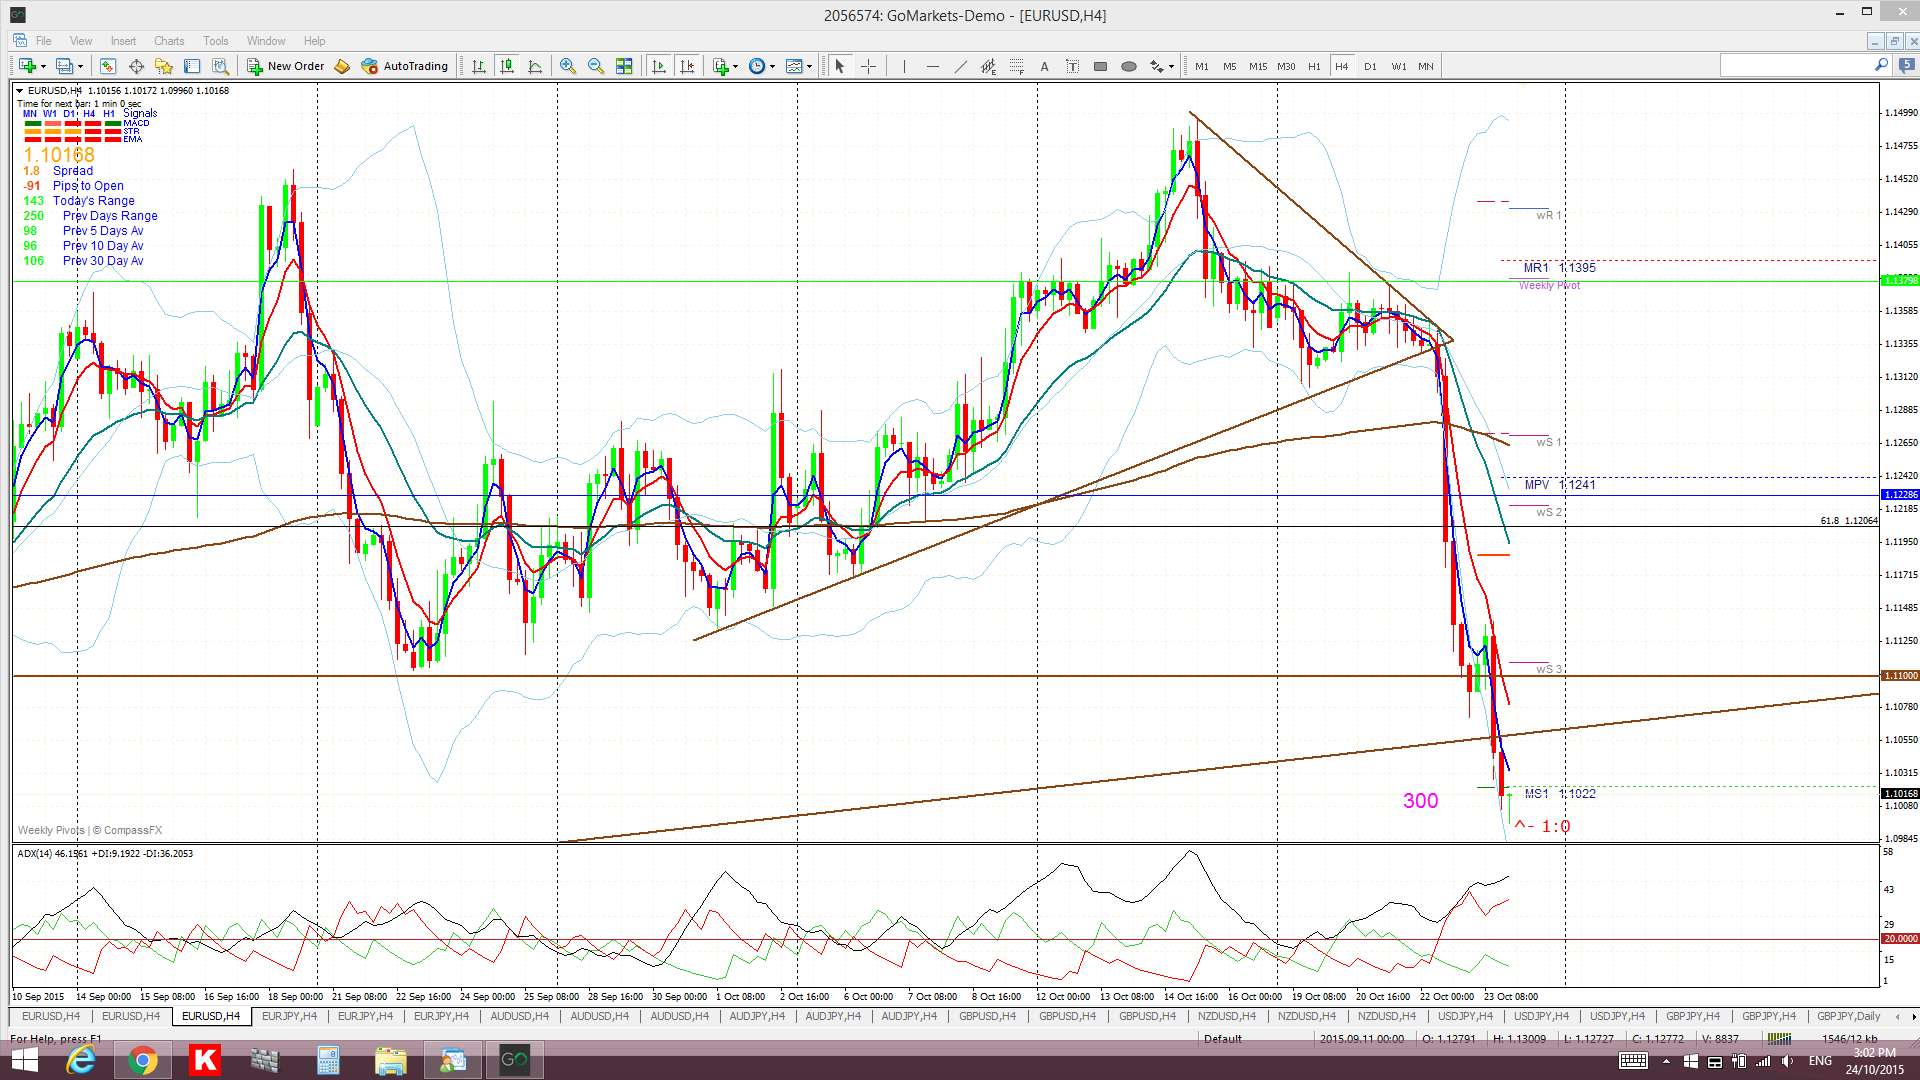
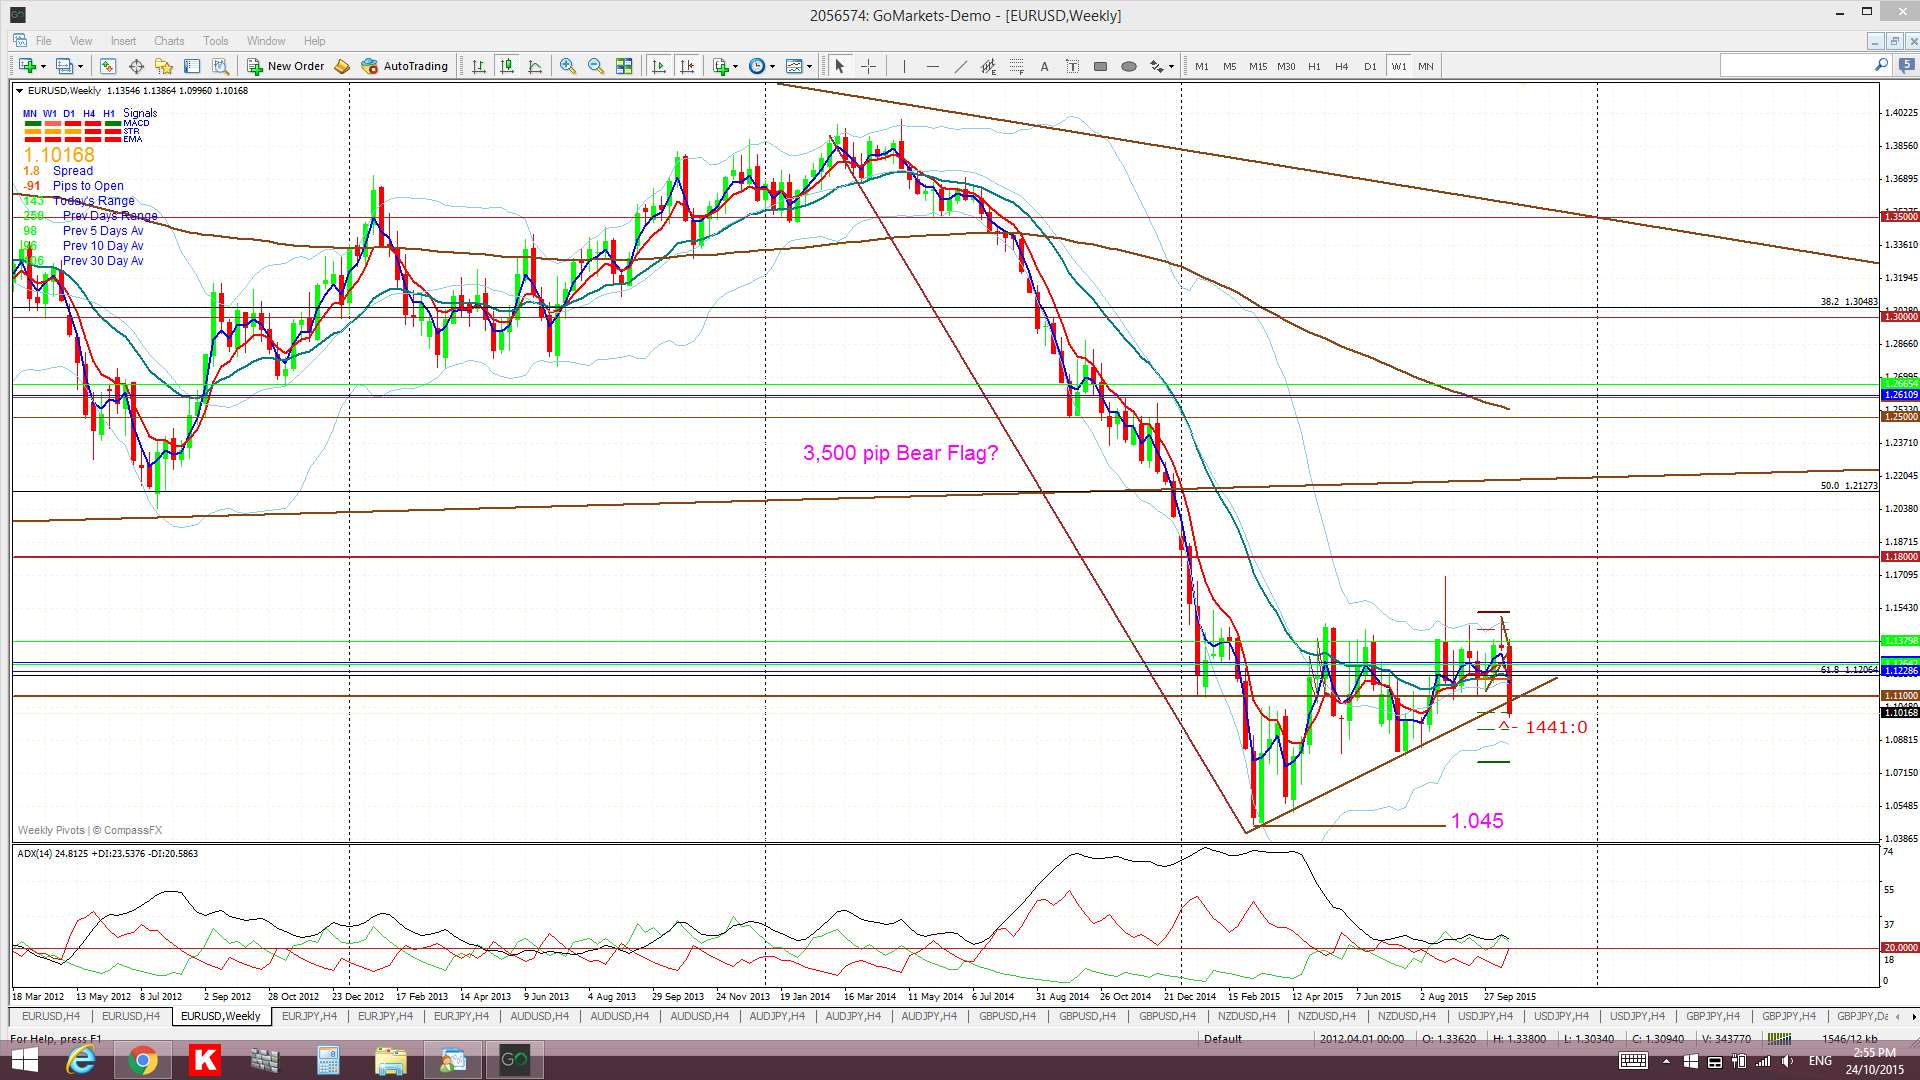
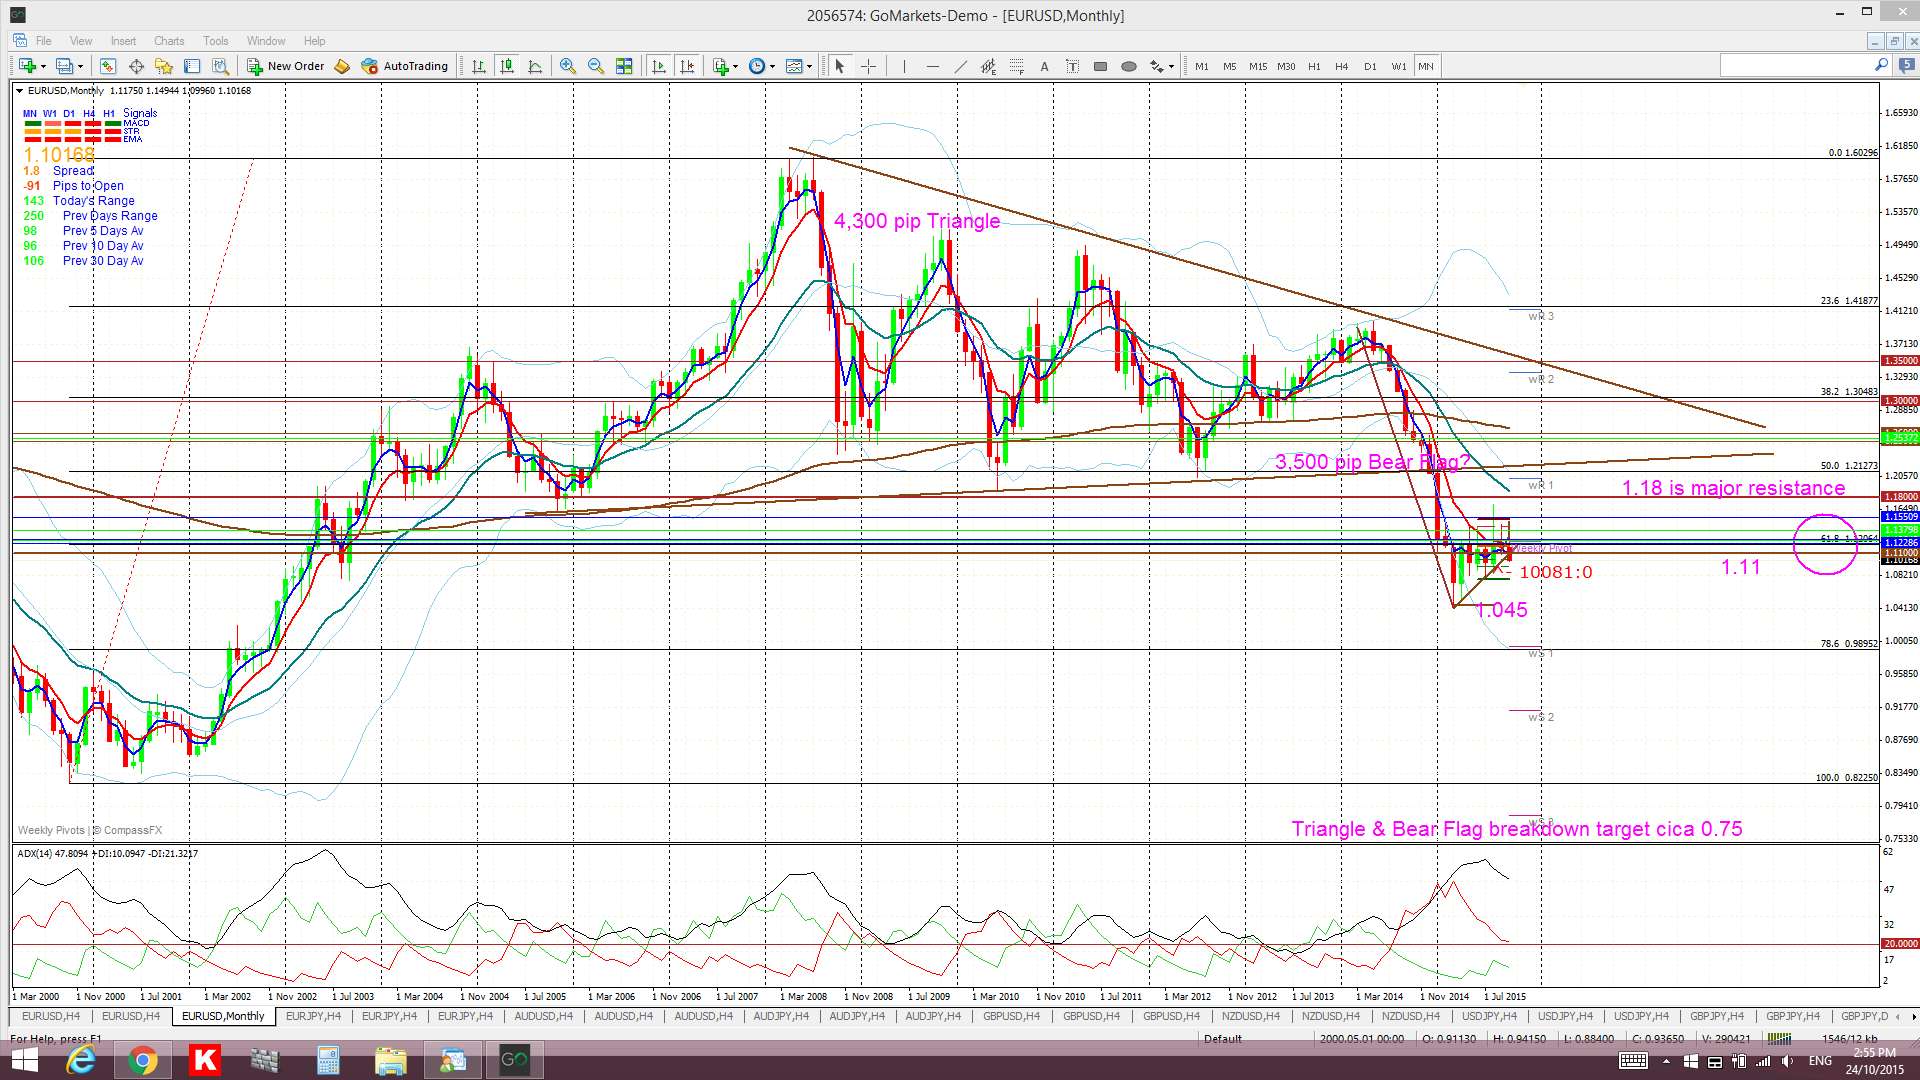
Bear Flag?: I have been posting about this potential bearish pattern for months now and a breakout appears to have triggered, however, next week’s FOMC could be a deciding factor here. Any commitment to lift US interest rates this year could help to fuel this Bear Flag move and technical theory suggests that such a move could be worth a potential 3,500 pips. However, any broadcast delay with lifting US rates could help to undermine the US$ rally and, in turn, help to support this pair, and, if this pair was ever going to try and bounce then these levels would be just the place to execute such a move.
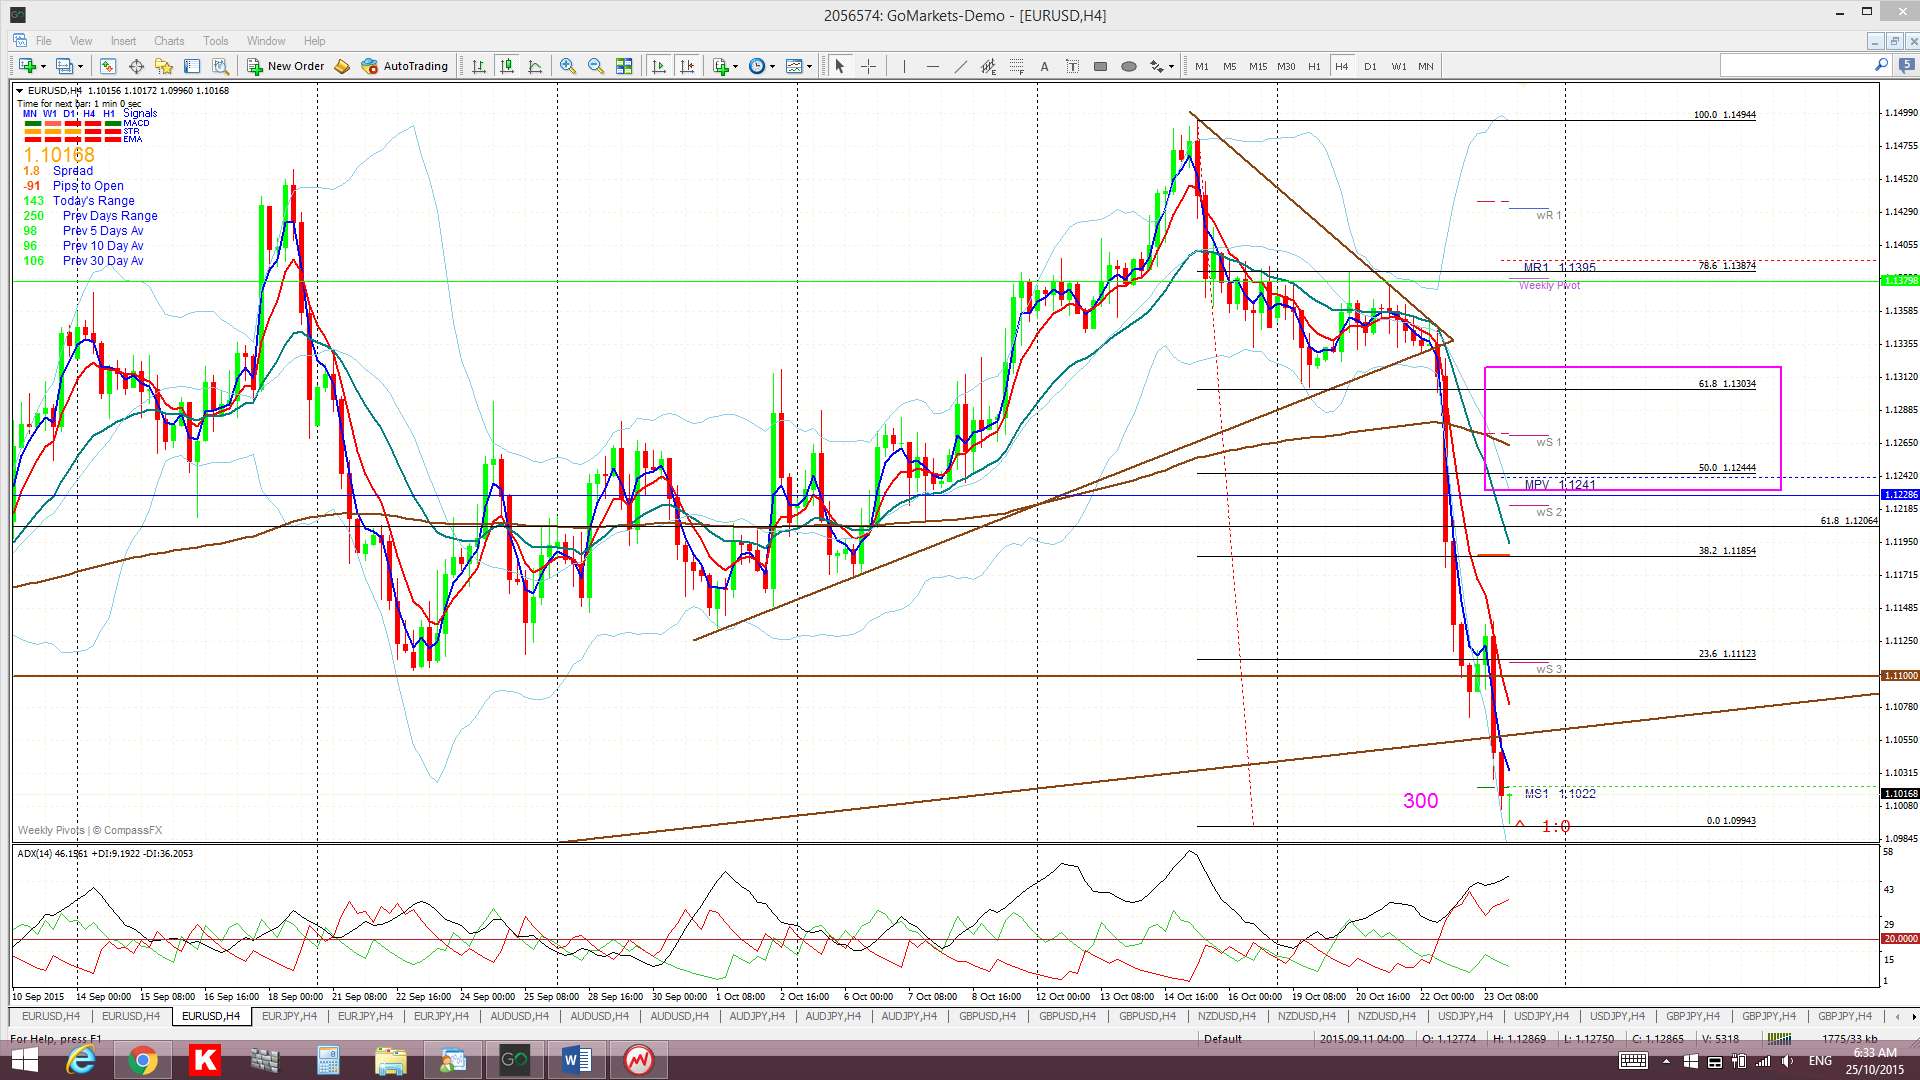
The 4hr chart below shows how a 61.8% fib pull back, quite reasonable even as part of any bearish continuation, would bring price back near the monthly pivot and 4hr 200 EMA but up past the previous S/R region of 1.11. This higher congested zone might be the target IF there is any bounce. Otherwise, the 1.11 region and or bottom triangle trend line might at least be tested before any bearish continuation.
Monday brings EUR German Ifo Business Climate data and this, if positive, could help to lift this pair. Other than that, it is only the US$-related high impact data to impact here, of which there is plenty.
- I’m watching for any new TC signal, the Bear Flag lower trend line and 1.11 region BUT, also, the 4hr chart’s 61.8% fib region for any bounce, even if only short-term.
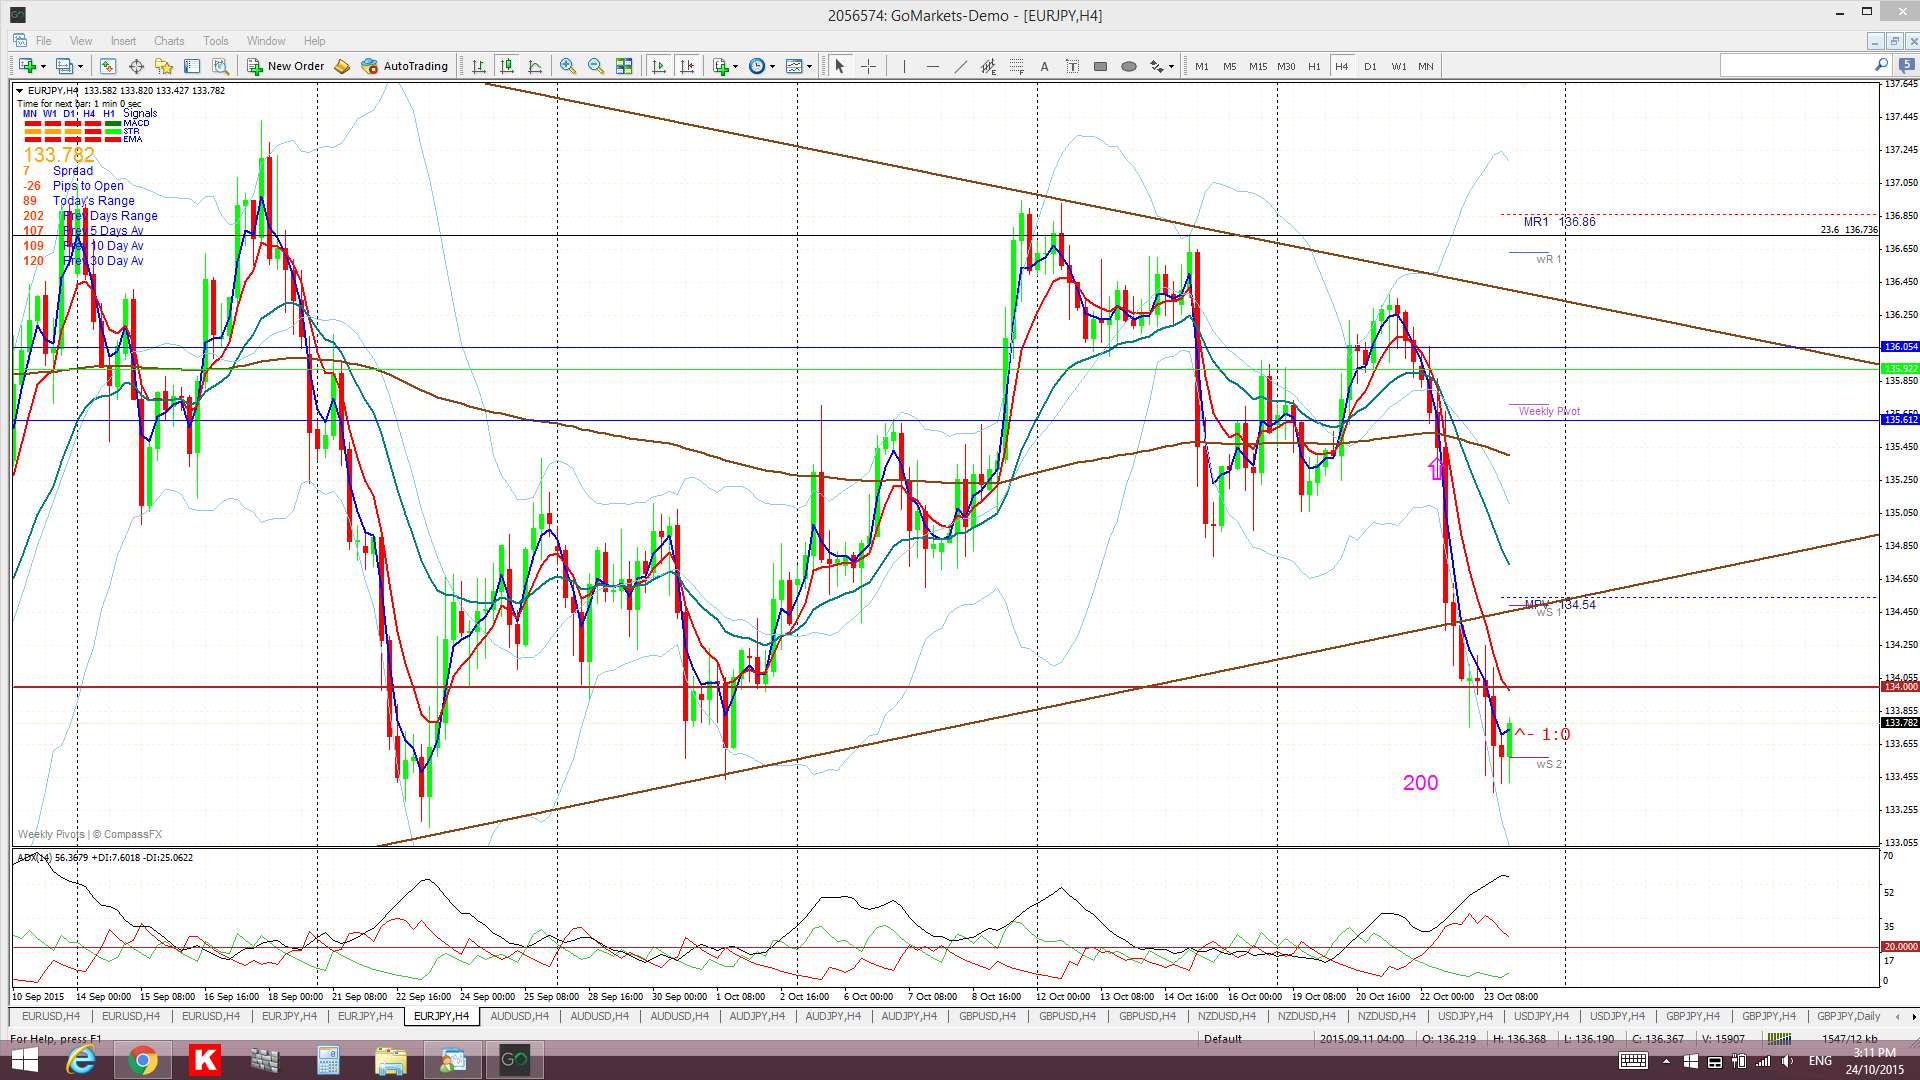
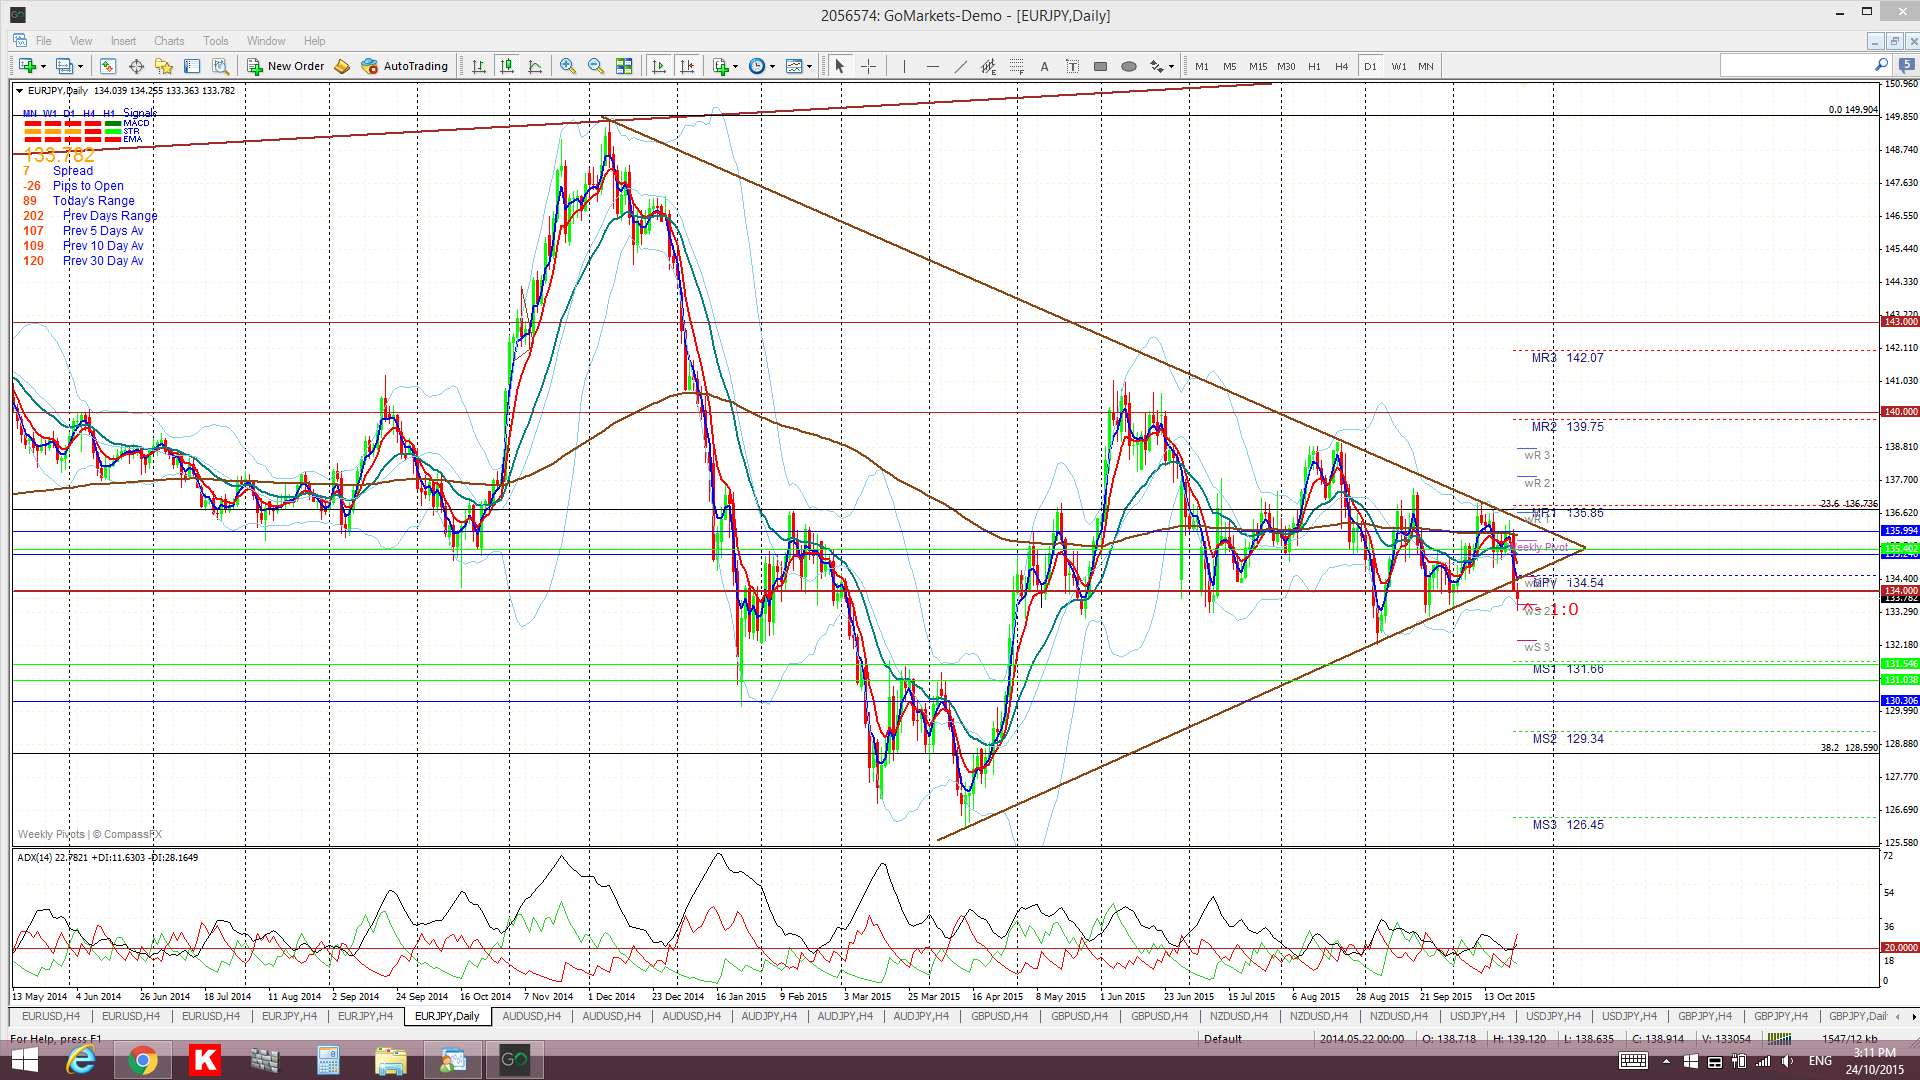
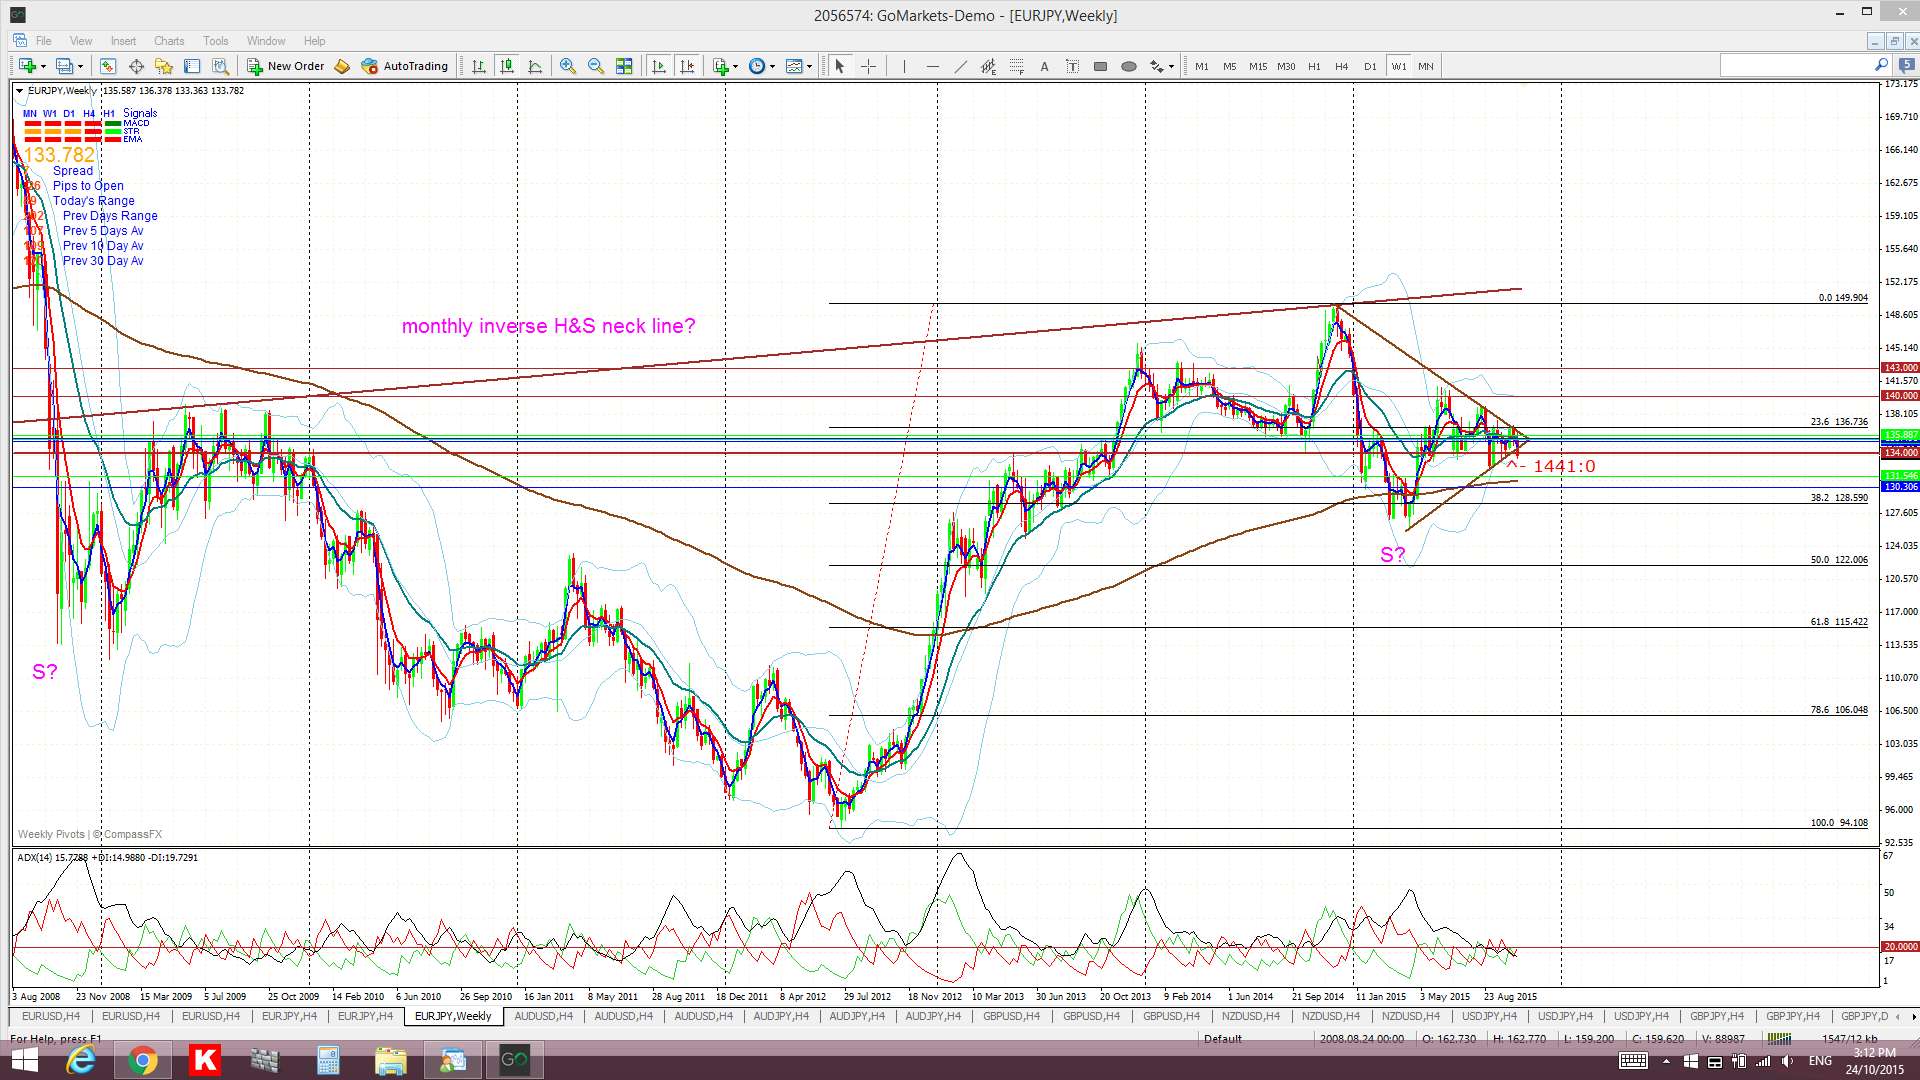
EUR/JPY: this pair was savaged by the ECB commentary as well and this bearish move triggered a new TC signal and also a daily chart triangle breakout. Price has also closed below the key 134 level.
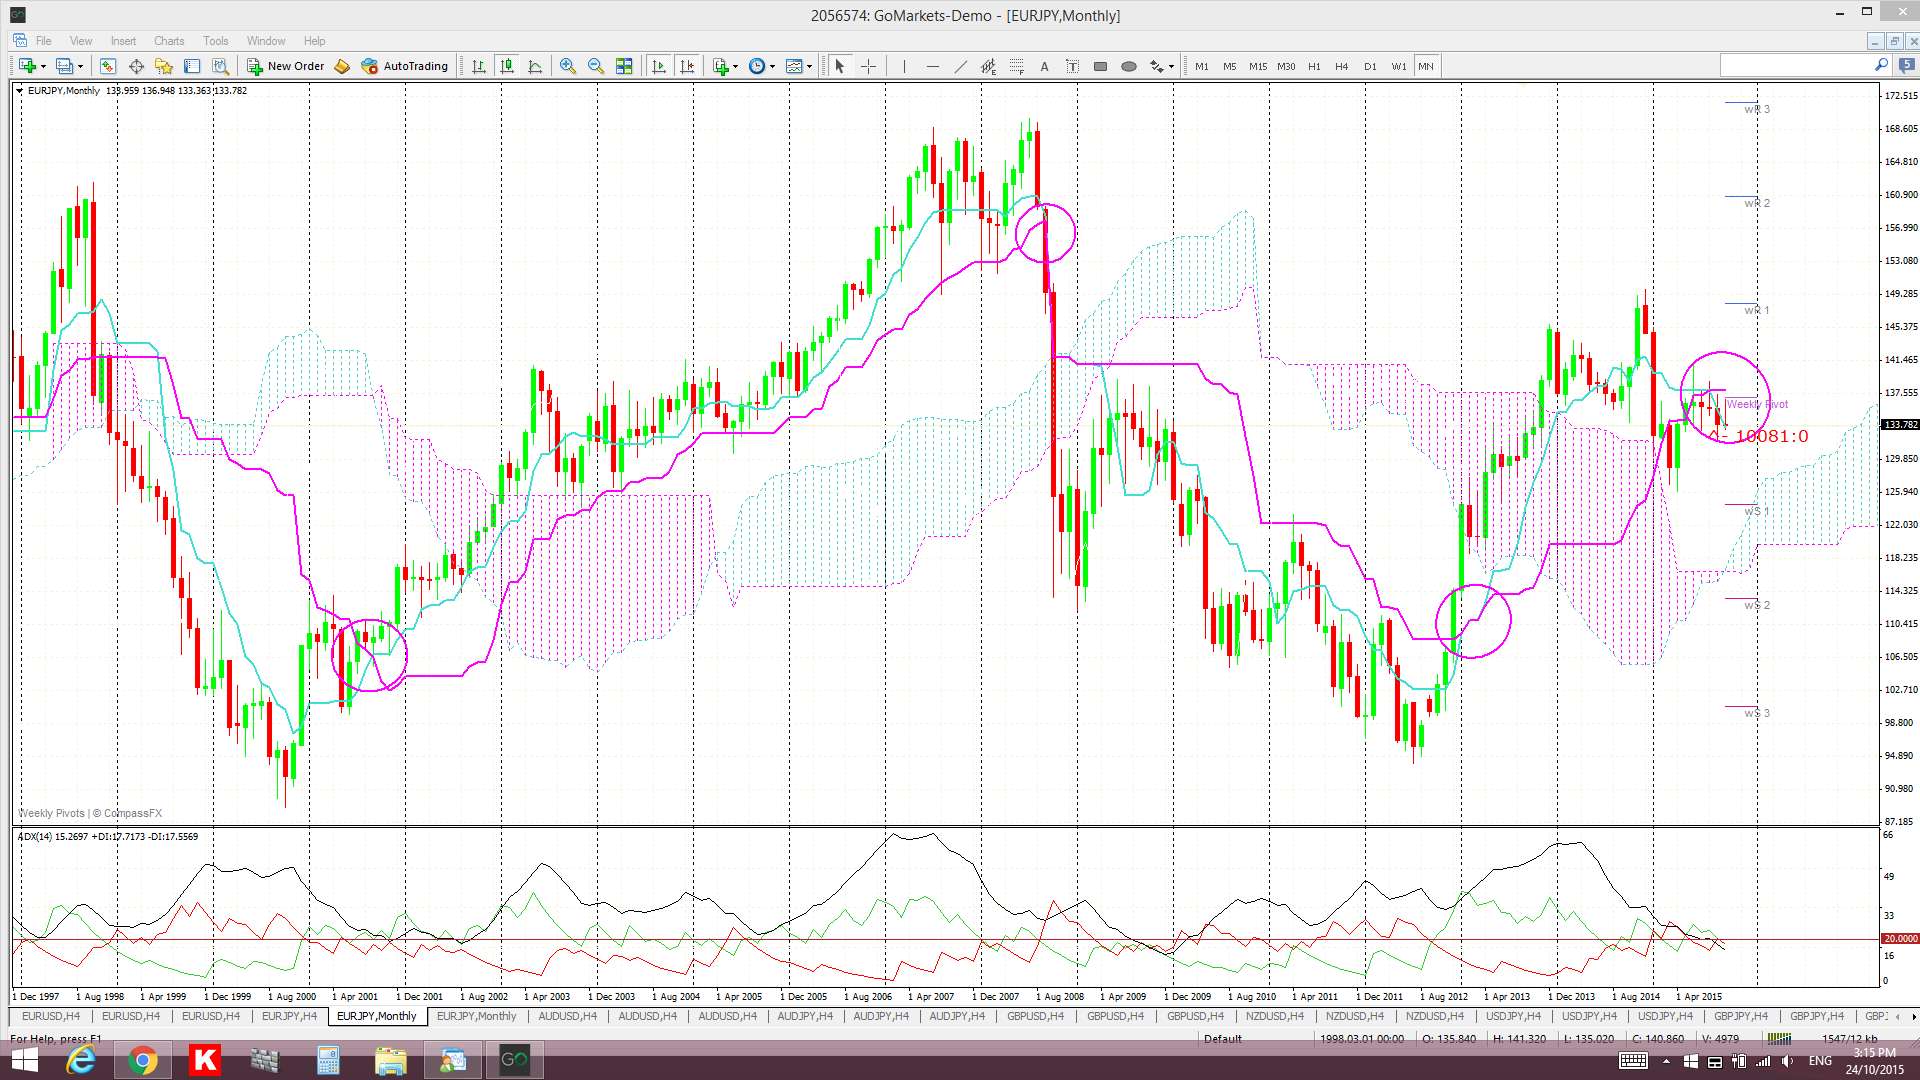
The weekly close below the triangle trend line and 134 level is bearish but the monthly candle close needs to be watched and this will close at the end of next week. A monthly close below these levels would help to support a continued bearish bias on this pair. At this point is worth reminding you of a chart-type I have posted a few times recently showing the bearish Tenkan/Kijun cross on the monthly E/J chart. These ‘crosses’ have been quite rare events for this pair and generally result in a decent move and, so, this recent cross may have been the clue here. A monthly close and hold below 134 might help define the start of a significant bearish wave for this pair:
Like with the E/U though any delayed US rate hike could help to undermine the US$ rally and boost the EUR and so this pair will be worth monitoring with FOMC as well.
Monday brings EUR German Ifo Business Climate data and this, if positive, could help to boost this pair. Other than that, it is the US$-related high impact data and Friday’s BoJ Interest Rate data to impact here.
- There is an open TC signal here BUT I’m watching the 134 level with Wednesday’s FOMC and Friday’s BoJ.

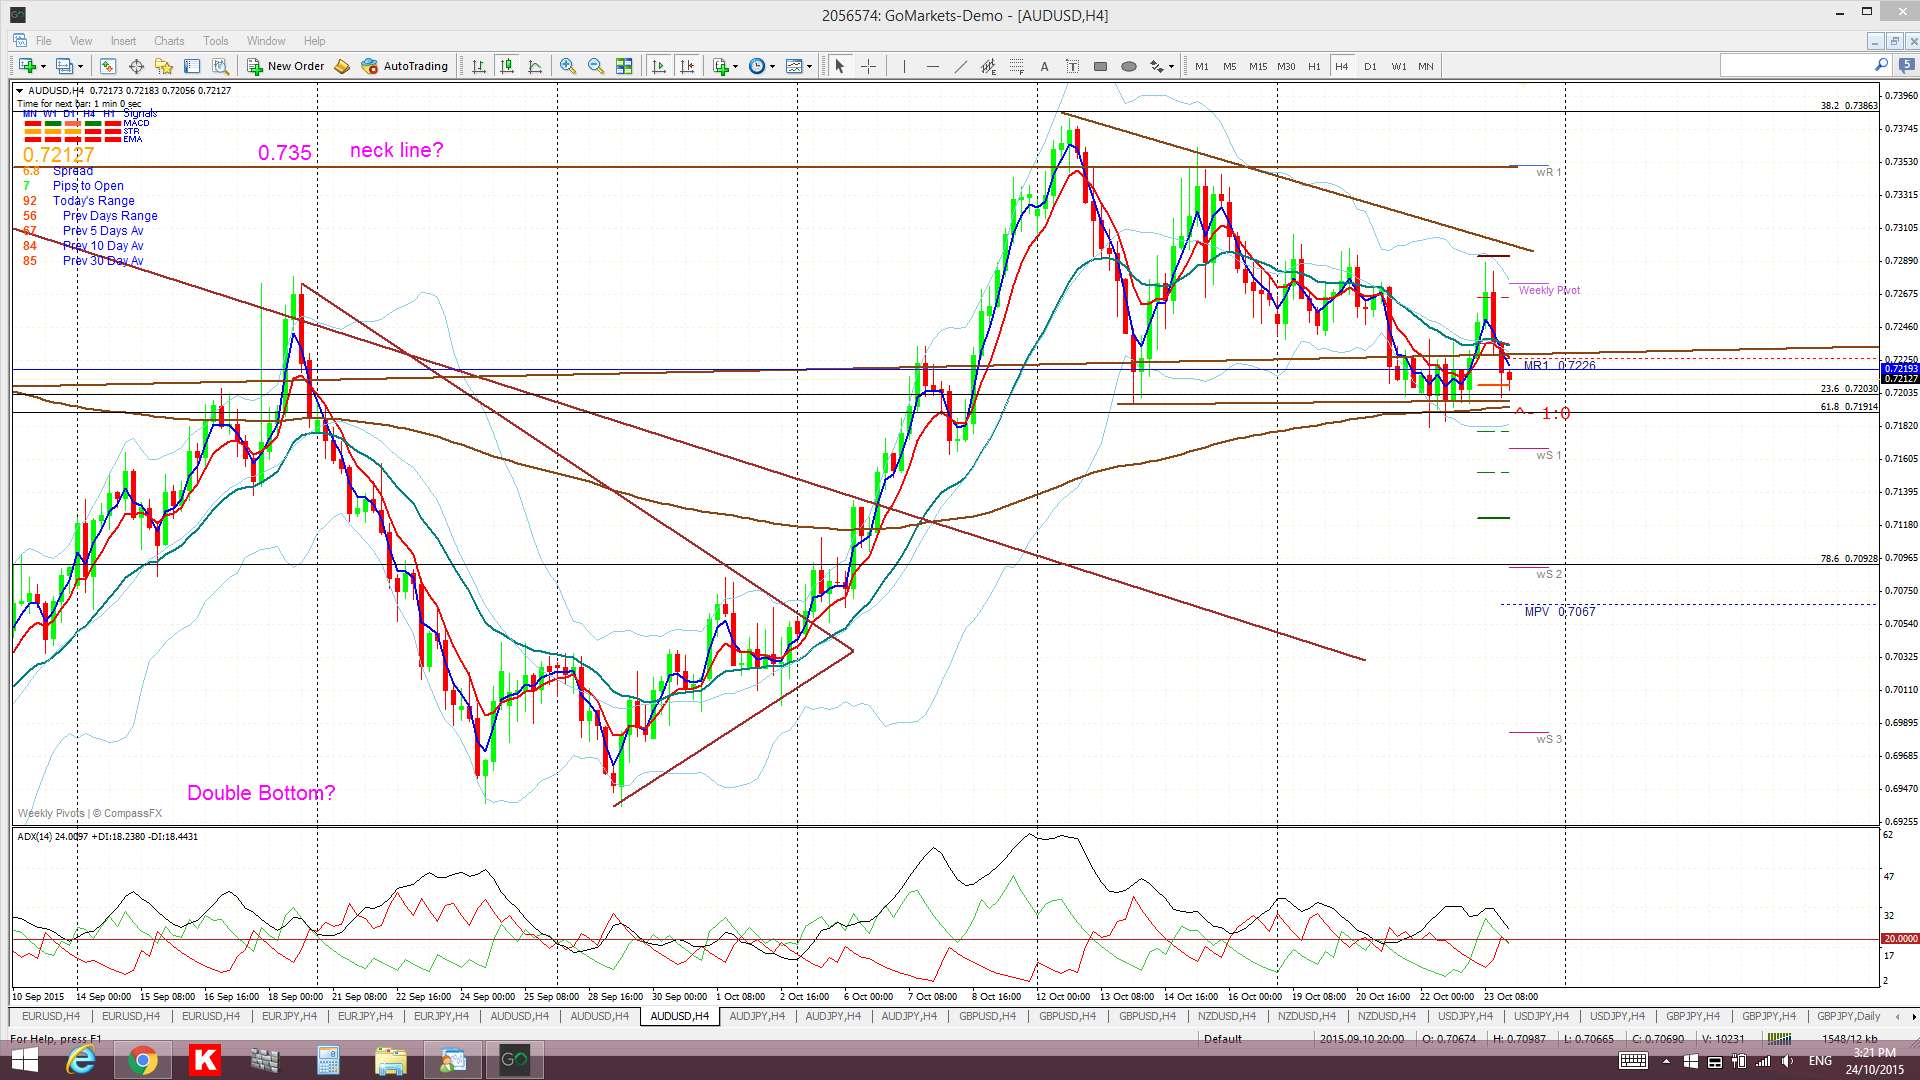
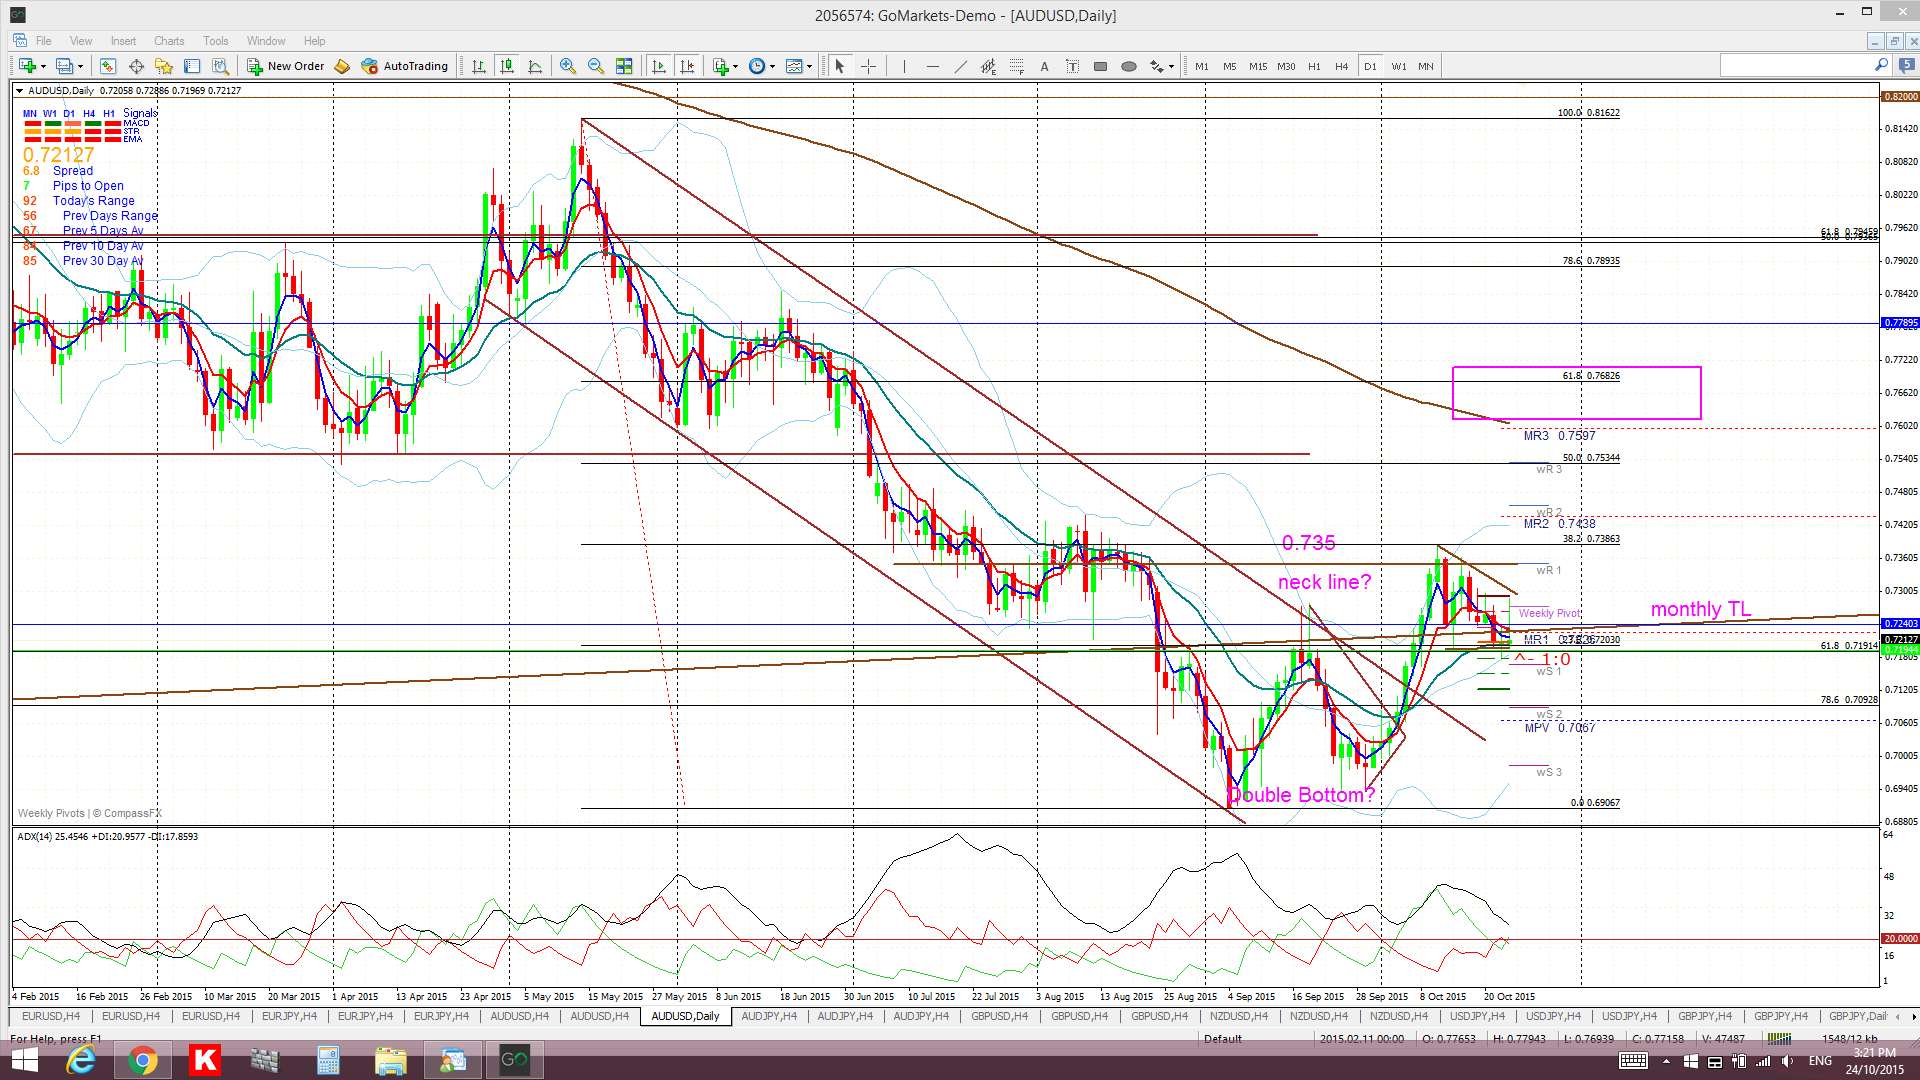
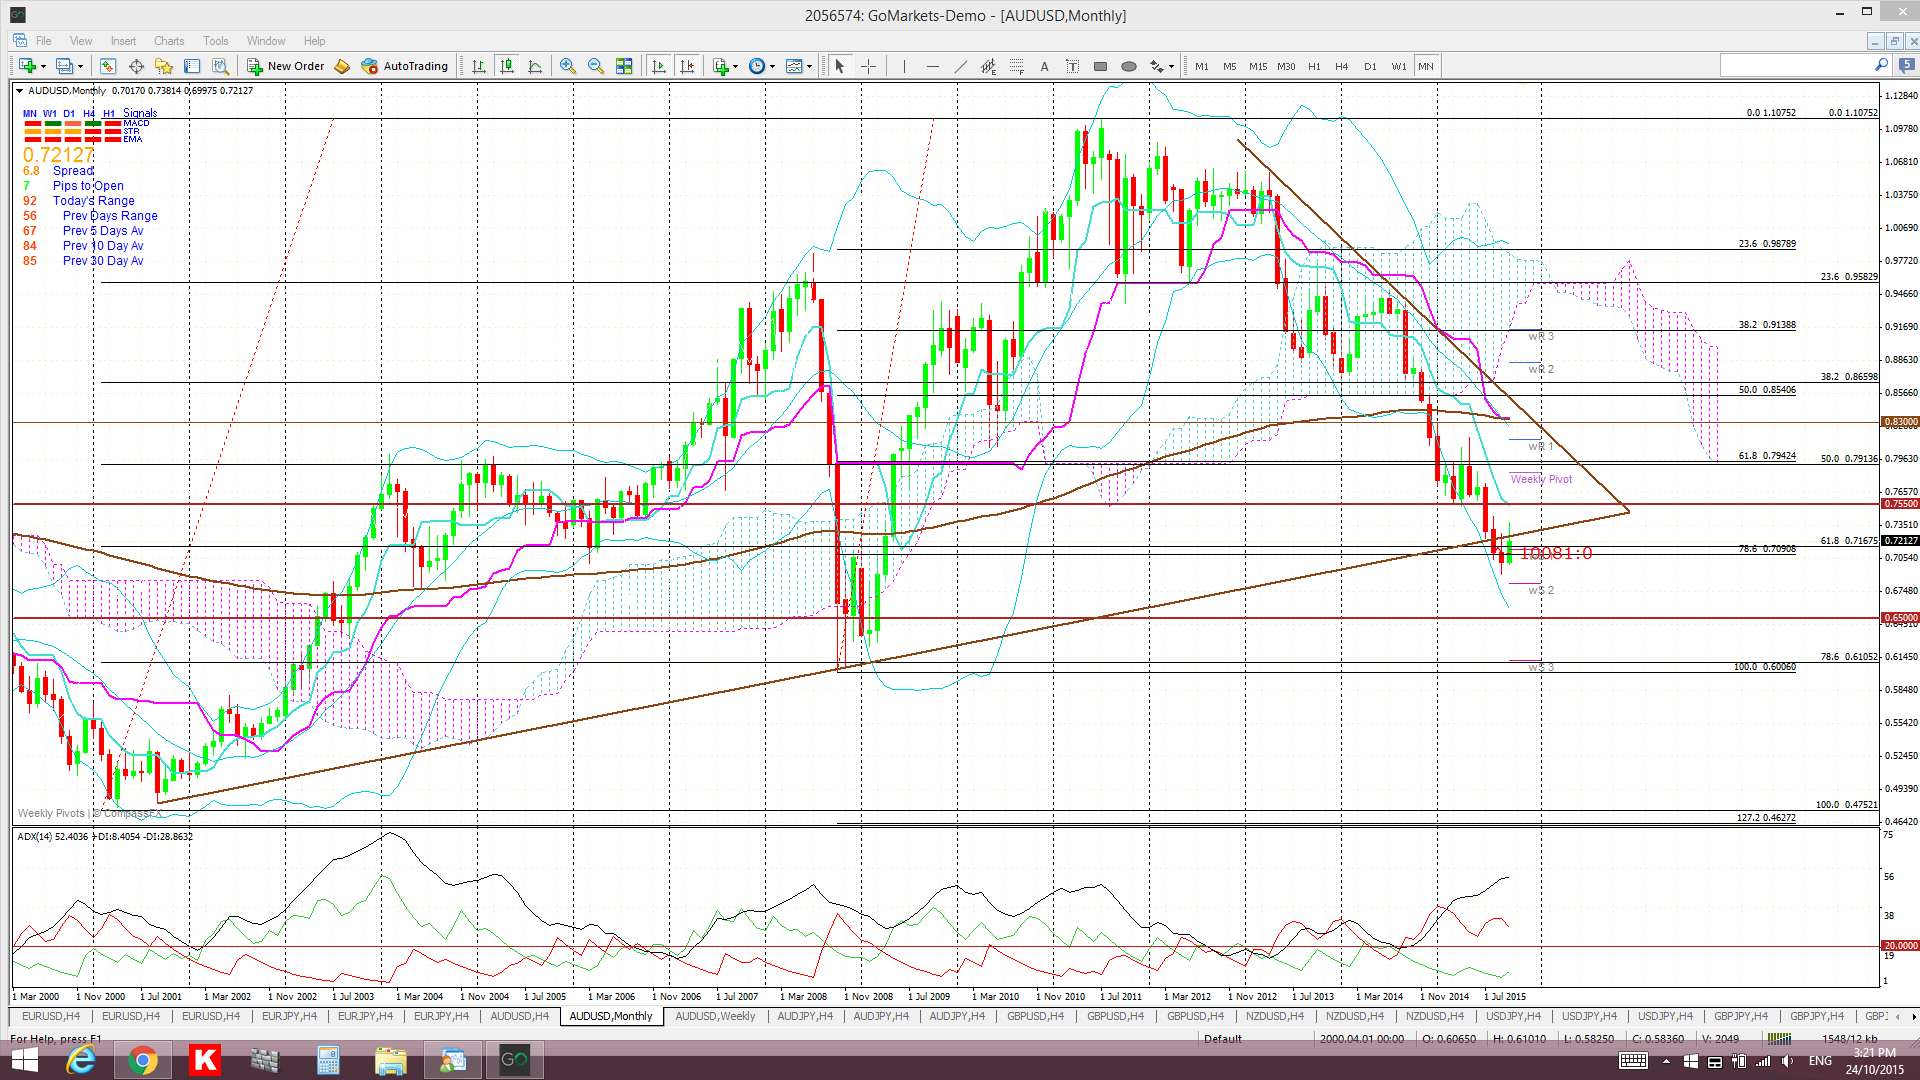
AUD/USD: this pair held up quite well last week and still looks to be shaping up into a wedge on the 4hr chart that is set within a potential ‘Double Bottom’ on the daily chart.
FOMC will be key here too as any US$ weakness will help to support this pair although AUD CPI is released on Wednesday and will impact here as well. Traders will be mindful though of the AUD RBA Interest Rate decision scheduled for the week after next.
Note the current monthly candle and the bullish engulfing form though and how price is hovering near major S/R being from a monthly support trend line and two key fib regions:
- The 61.8% fib of the major swing high move from 2000 to 2011 near 0.715 and
- The 78.6% fib of the 2008-2011 swing high move near 0.71.
Wednesday is a big day for this pair with AUD CPI and US FOMC to monitor.
- I’m watching for any new TC signal and the 4hr chart wedge pattern and the daily chart’s ‘Double Bottom’.
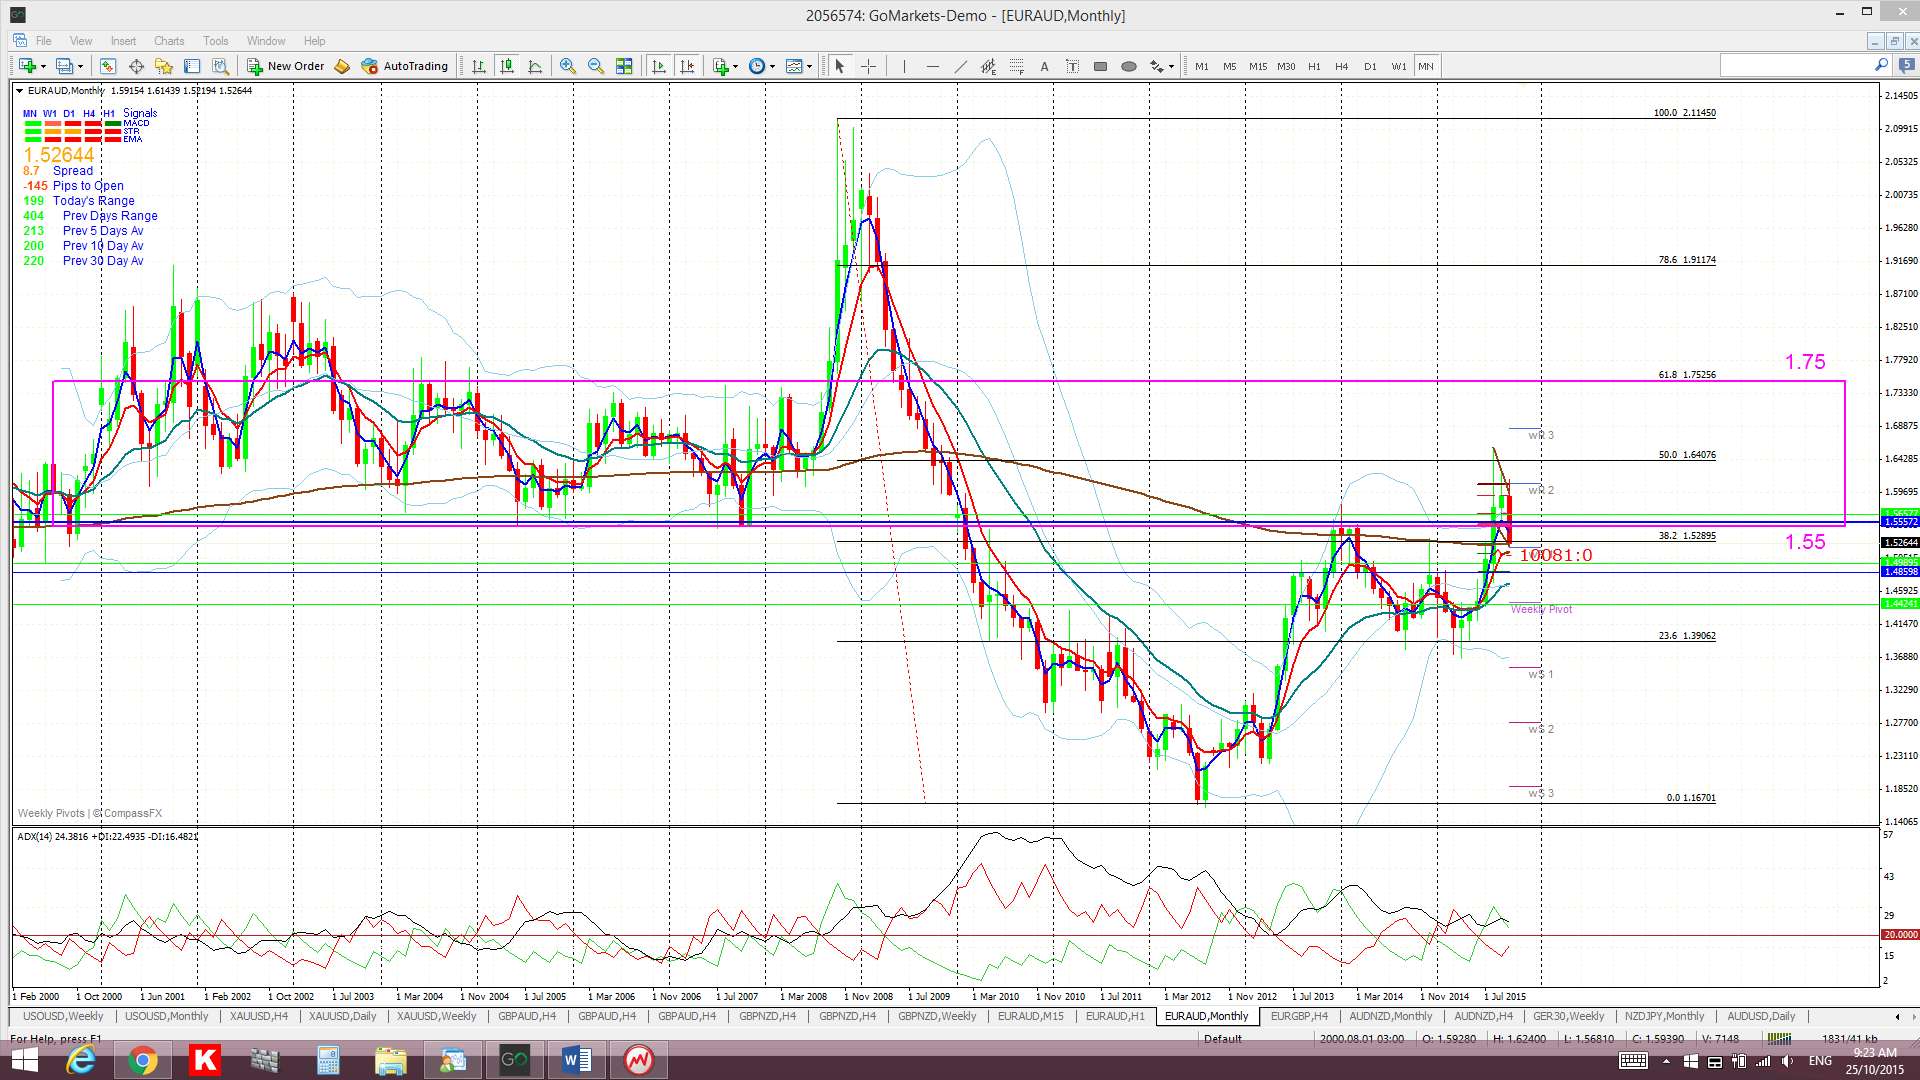
EUR/AUD monthly: I haven’t posted about this pair recently but the monthly chart is worth taking a look at. I have highlighted the zone between 1.75 and 1.55 and you can easily see how this was a combat zone back in the 2000-2008 time period. Price has been below this region since 2010 but recently fought its way back up into the zone. The recent EUR$ weakness though has seen it slip back below 1.55 but I think this will be the key level to monitor after FOMC. Recent price action does seem to suggest a bullish-reversal Cup or even ‘Double Bottom’ with 1.55 as the top boundary here. A hold below 1.55 might help to frame up bearish continuation but any new monthly close and hold back above this might support bullish momentum.
- I’m watching the 1.55 level.
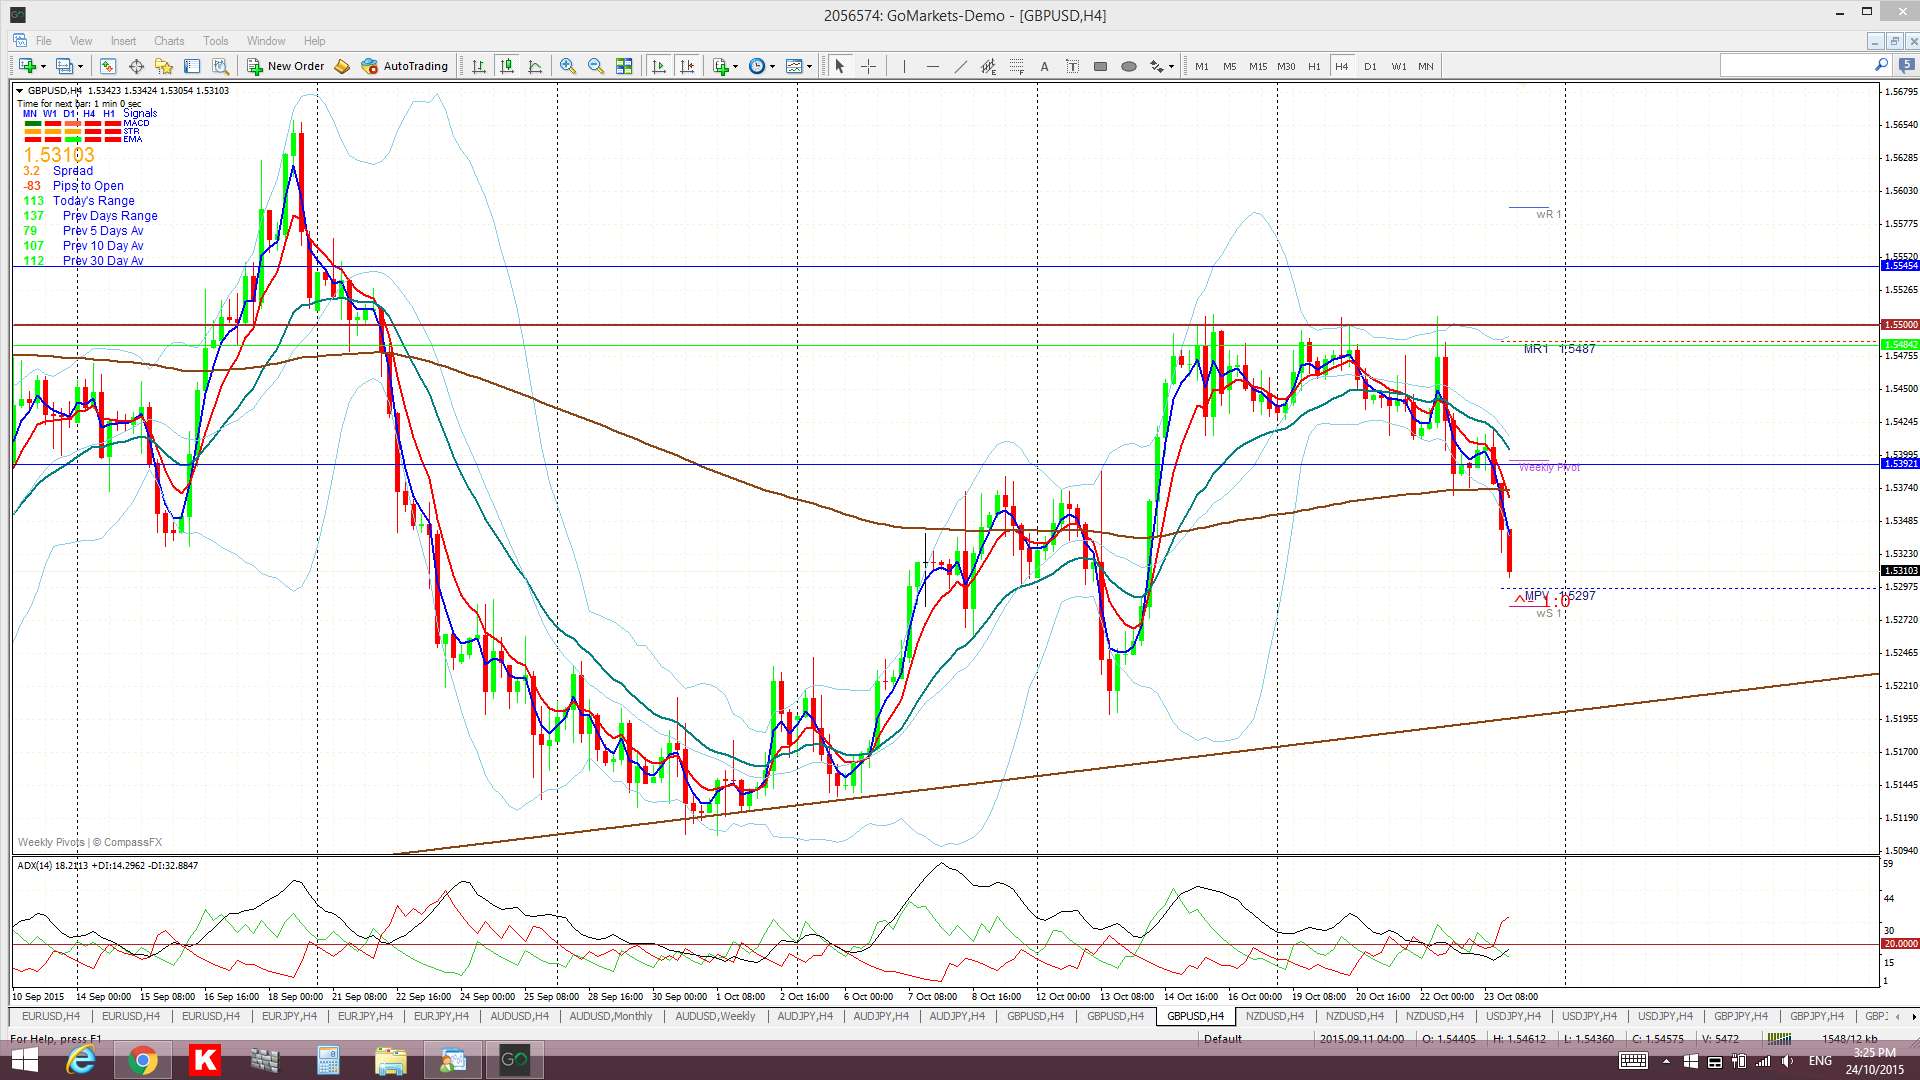
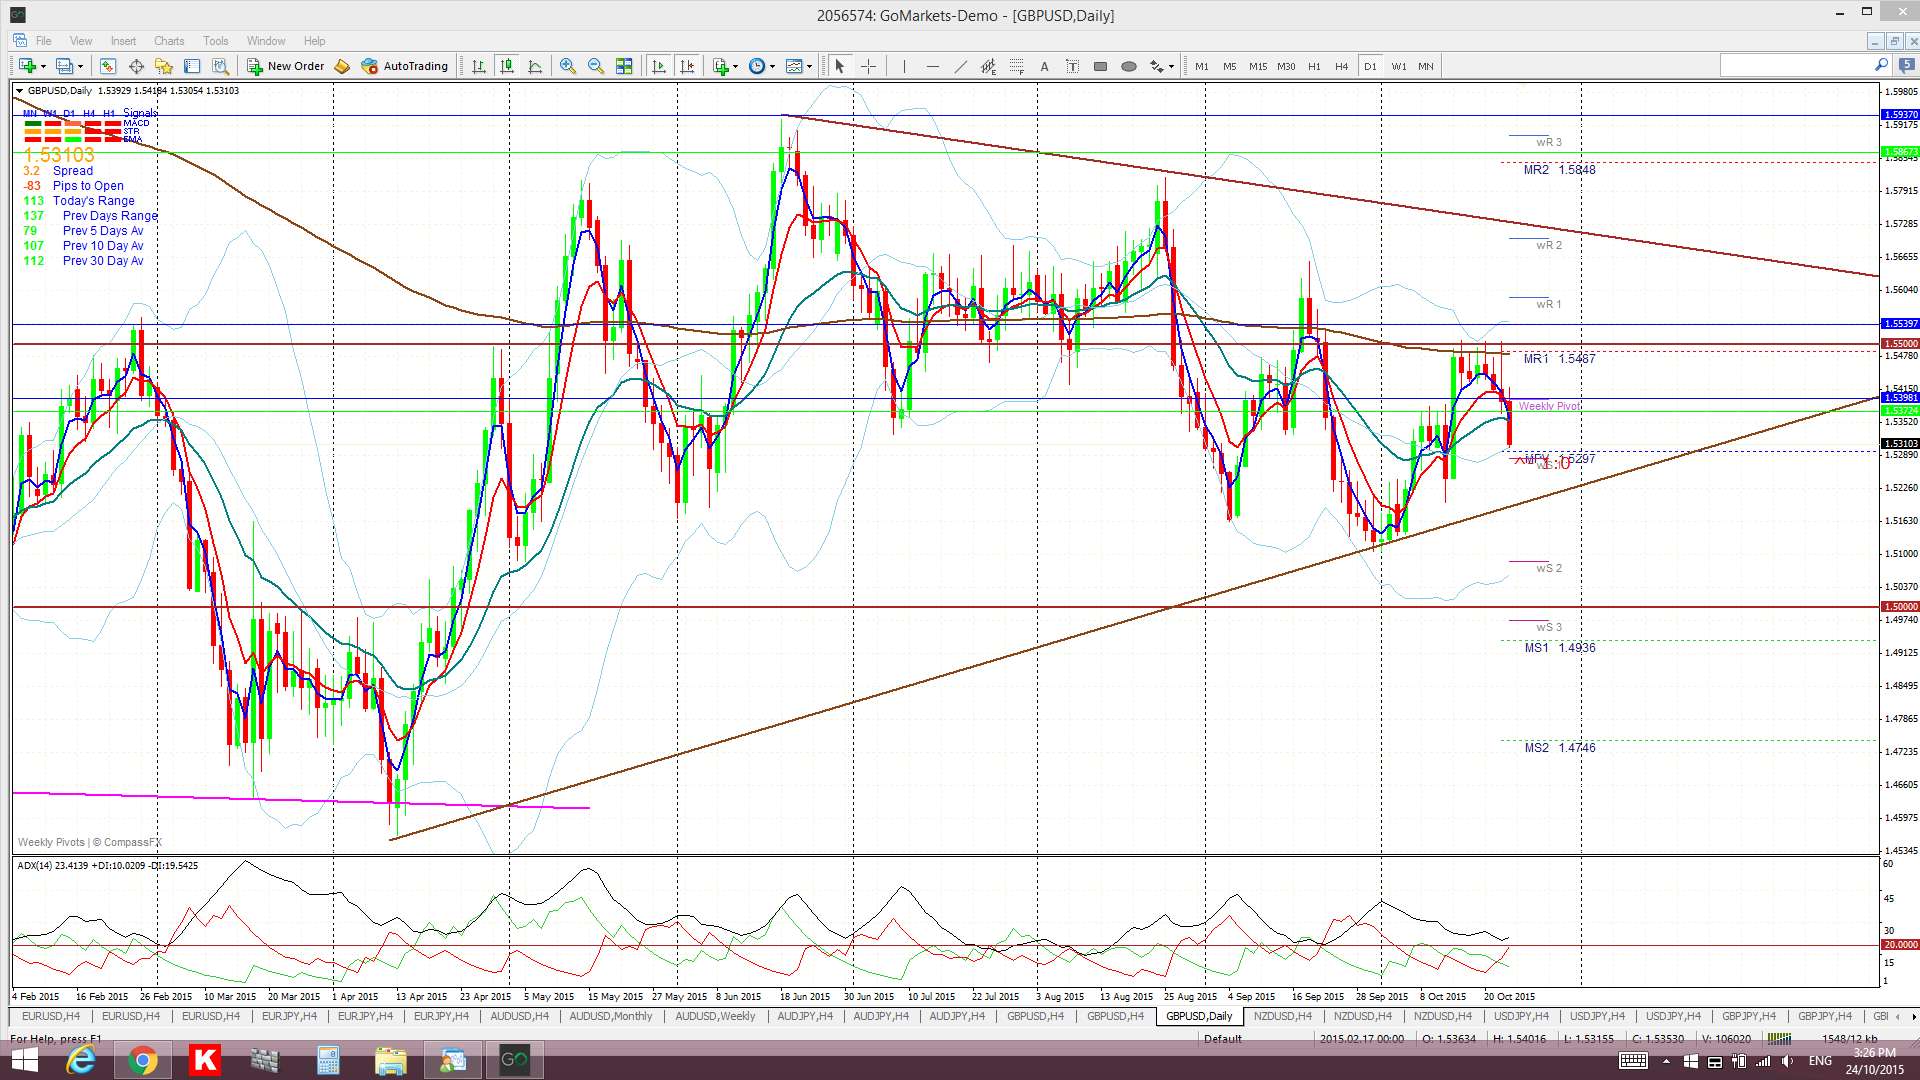
GBP/USD: this has bounced down from the 1.55 level but without any new TC signal. I’ll be watching for any support from the triangle TL, especially around FOMC, as any US$ weakness would support this pair.
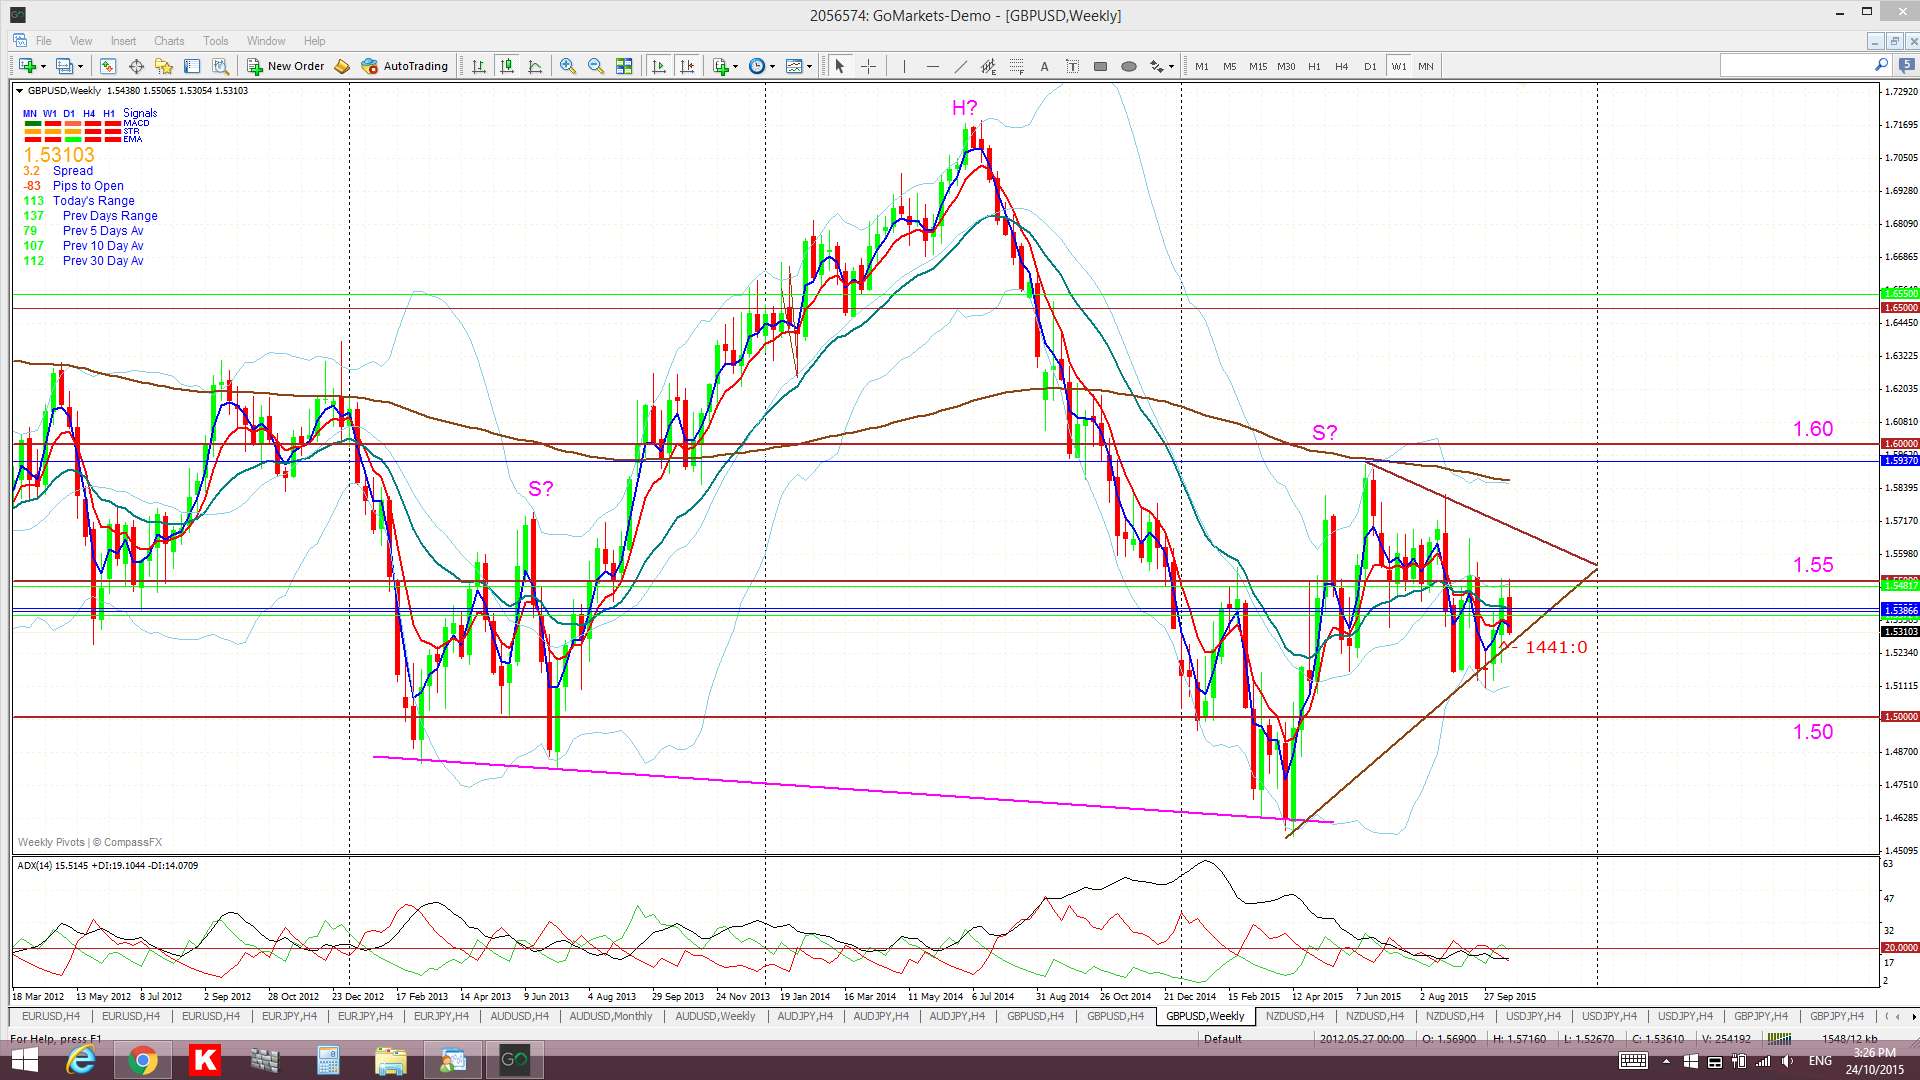
Weekly chart H&S: There is still a possible bearish H&S pattern forming on the weekly chart but the failure to break below the ‘neck line’ is holding this pattern off the time being. The height of the pattern is about 2,400 pips and suggests a similar move lower with any break and hold below the ‘neck line’. I would consider that any close and hold back above 1.60 would void this pattern.
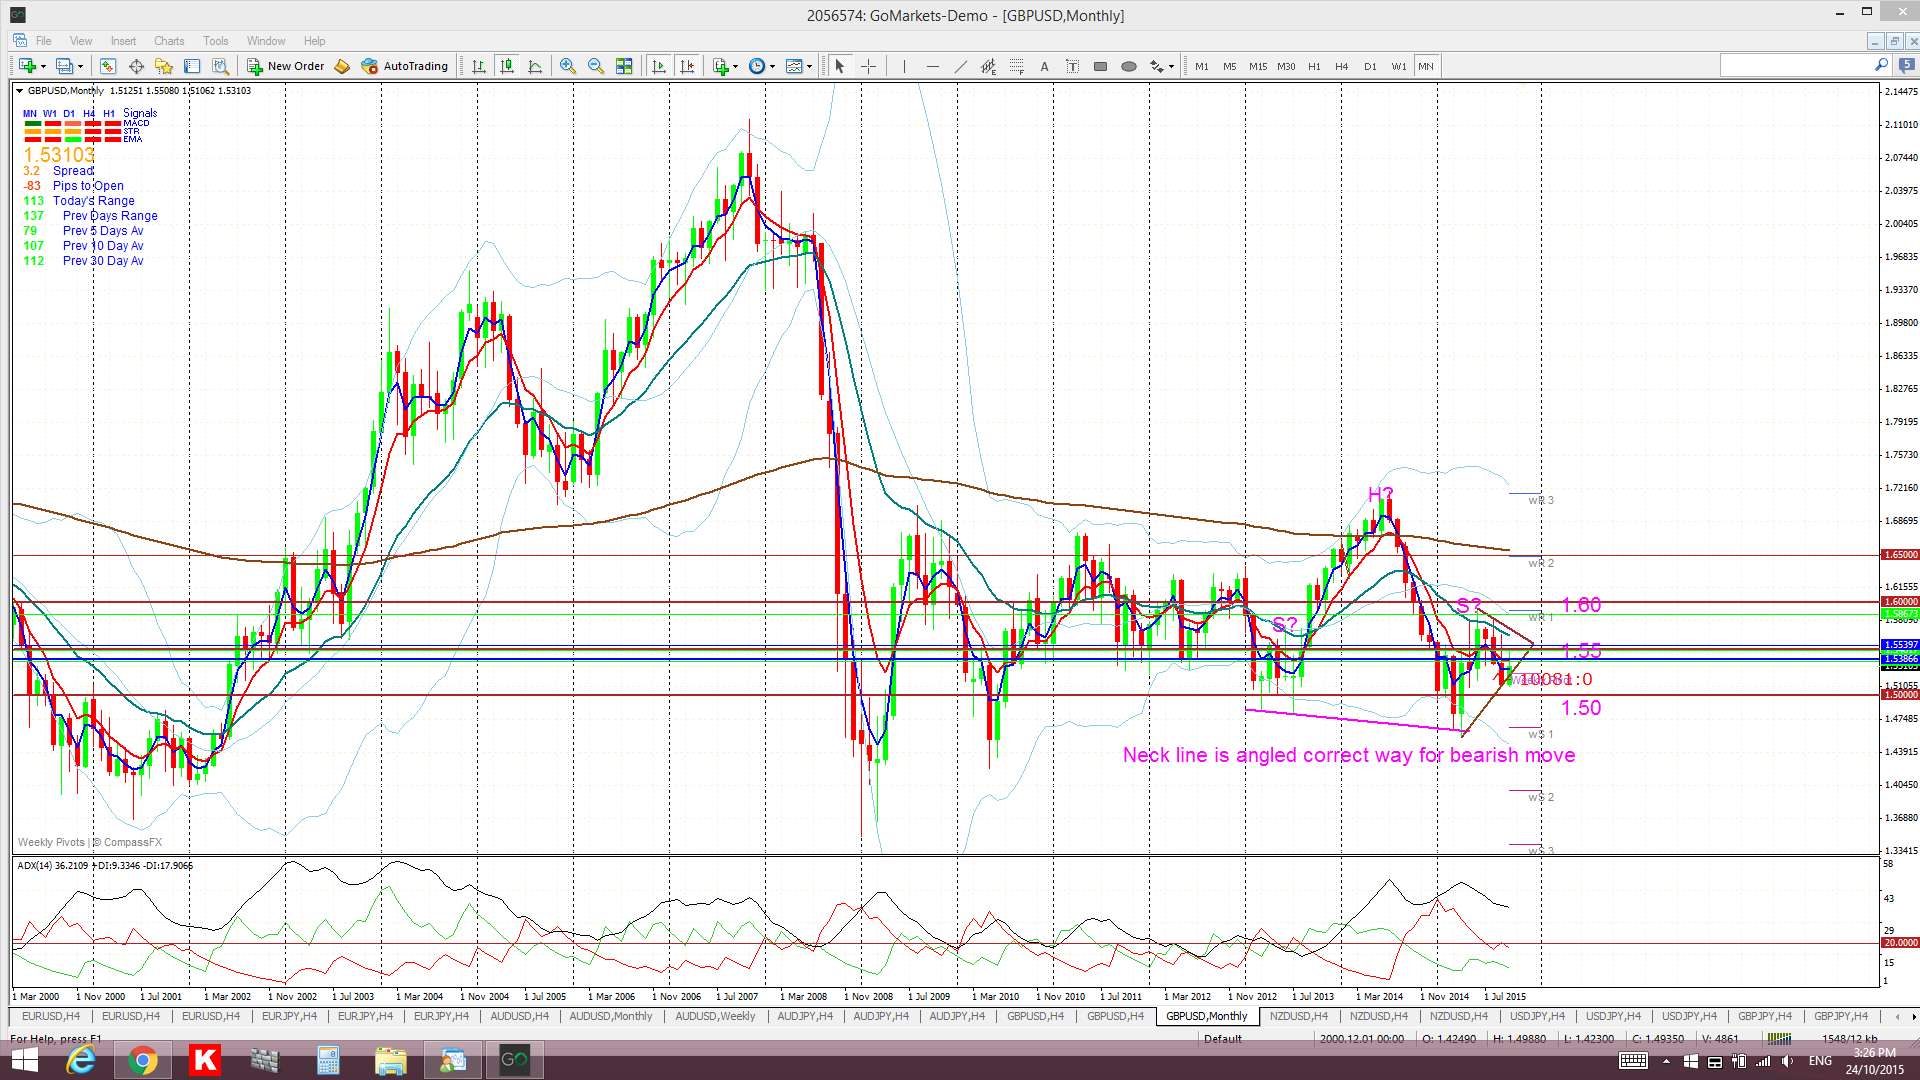
There is GBP GDP data on Tuesday but Wednesday’s FOMC will be key here too. Note the potential bullish-reversal candle pattern currently setting up on the monthly chart. Worth watching as next week brings month end.
- I’m watching for any new TC signal and the bottom triangle trend line.
NZD/USD: this pair continues consolidating below 0.68 ahead of a big data week next week. There is NZD Trade Balance data on Tuesday, FOMC on Wednesday, RBNZ Interest Rate decision on Thursday and ANZ Business Confidence on Friday.
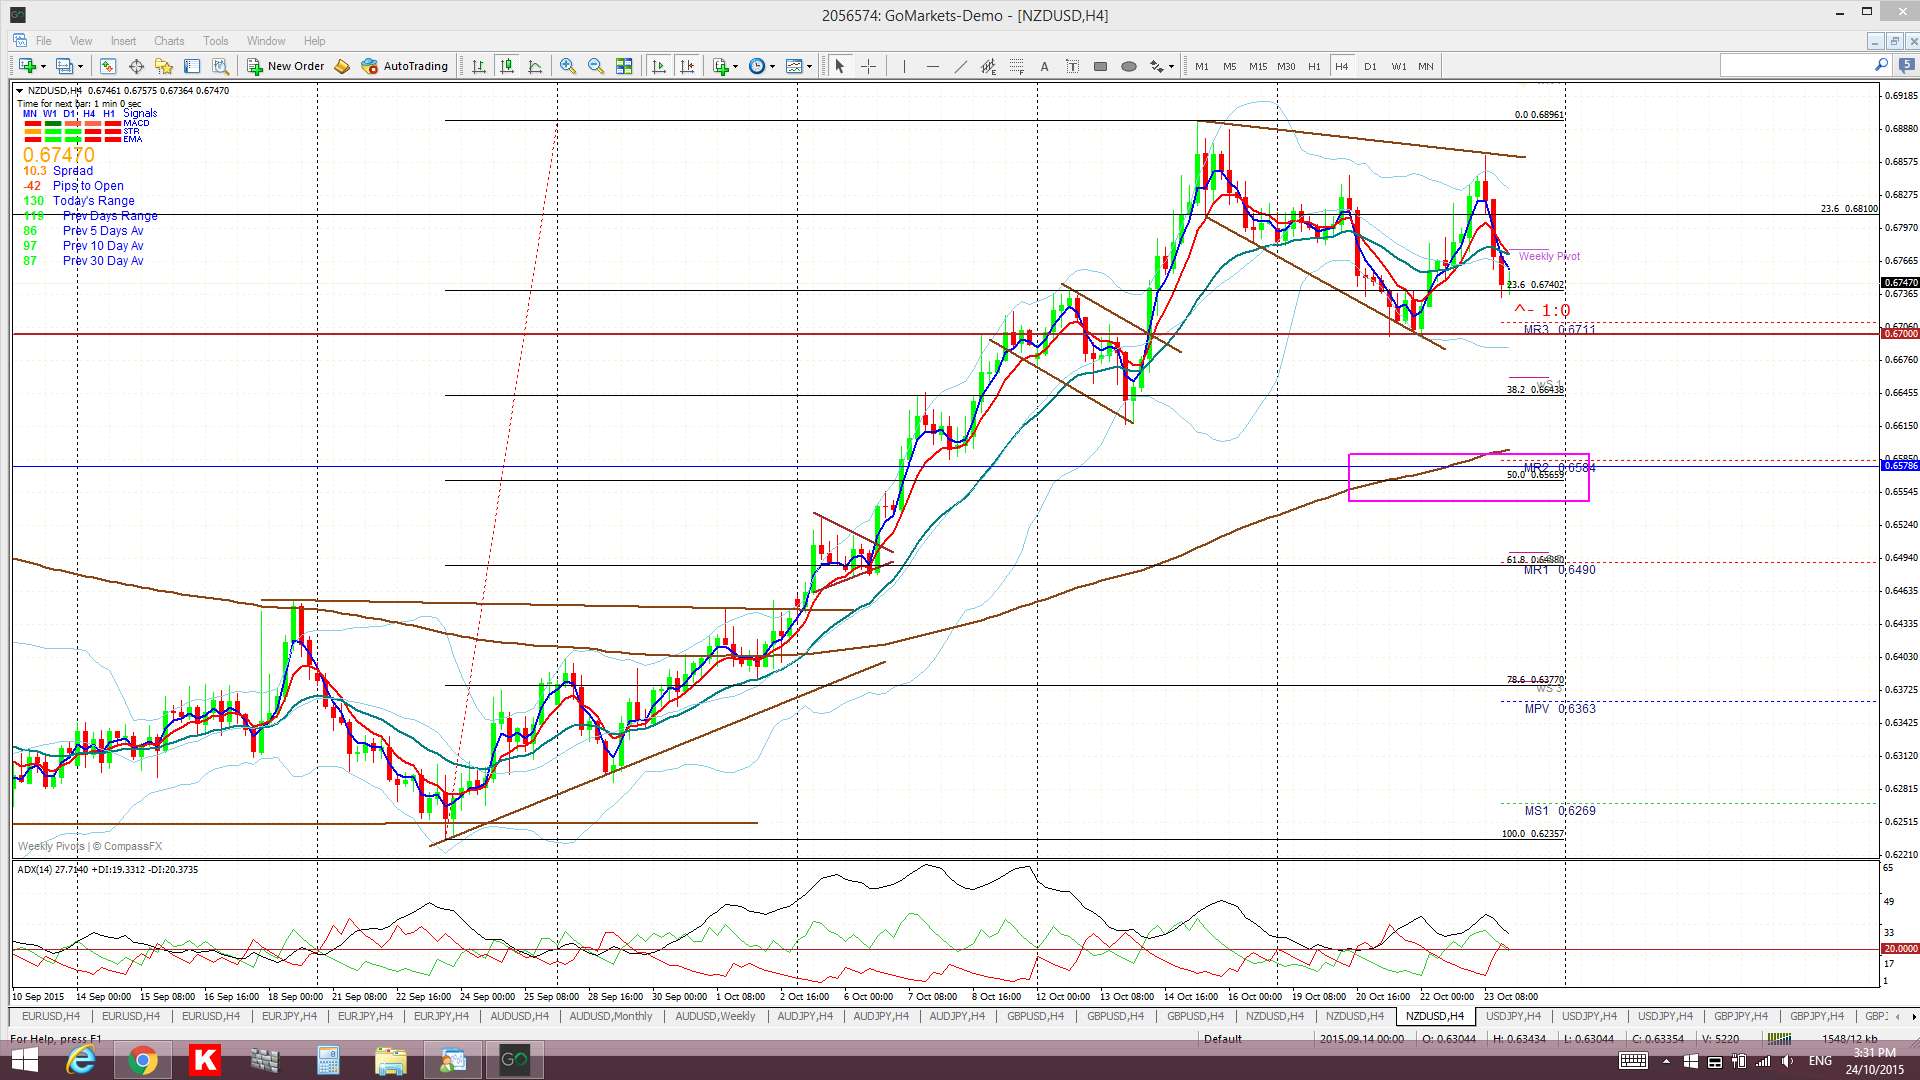
I’ve noted potential bearish and bullish target zones on the chart’s below as I’m open-minded about the next direction on this pair.
- 4hr: the first bearish target area is highlighted but the 0.65 region, near the 61.8% fib, would also come into focus for any bearish breakdown. I’m also open to a bullish ‘Bull Flag’ breakout though with the daily & weekly charts holding the target regions. I’ll be keeping an eye on the Flag trend lines from the start of the week:
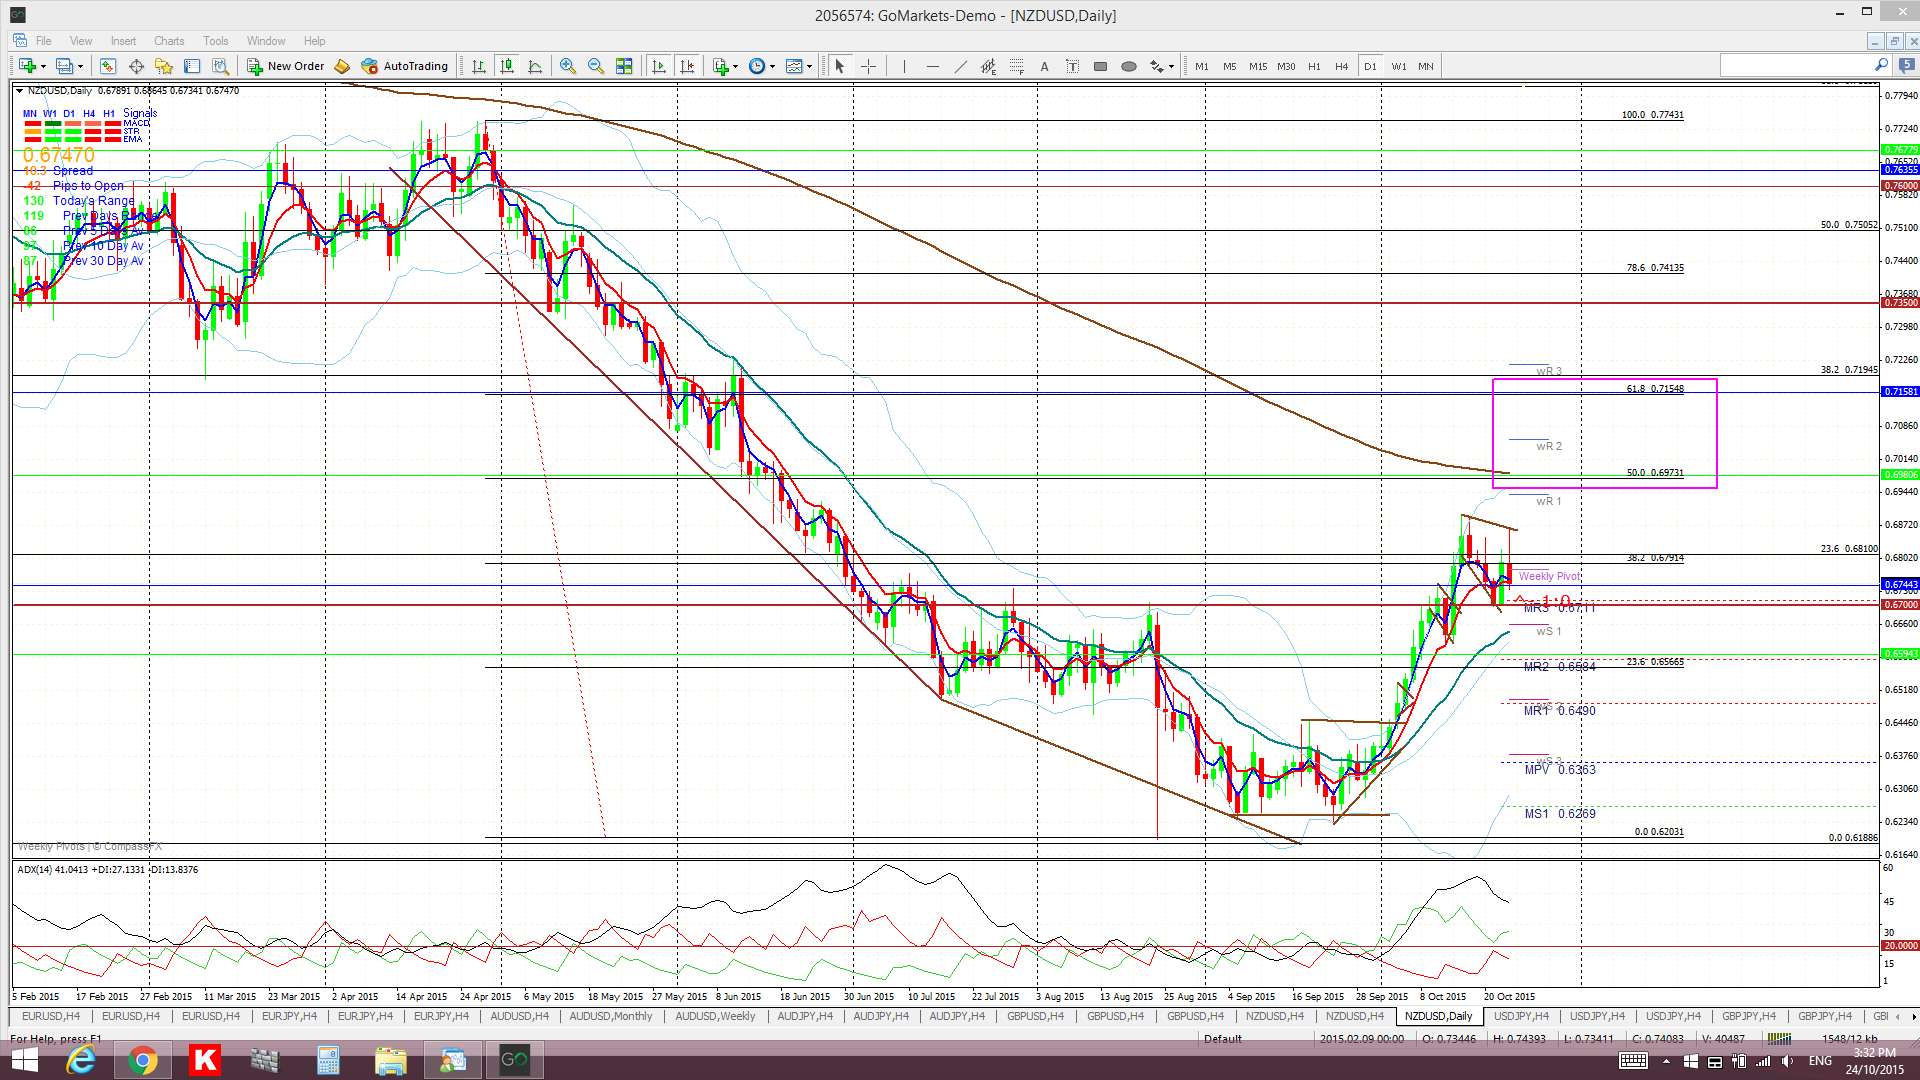
- daily: any bullish continuation following a Bull Flag breakout on the 4hr chart would bring the highlighted area of the daily chart into focus and, then, the previous long term S/R region of 0.735:
- weekly: further bullish continuation would bring the weekly 61.8% fib and 200 EMA region into focus:

- Kiwi monthly: note the bullish monthly candle currently forming up here though and how price is trying to bounce up off a major 61.8% level:

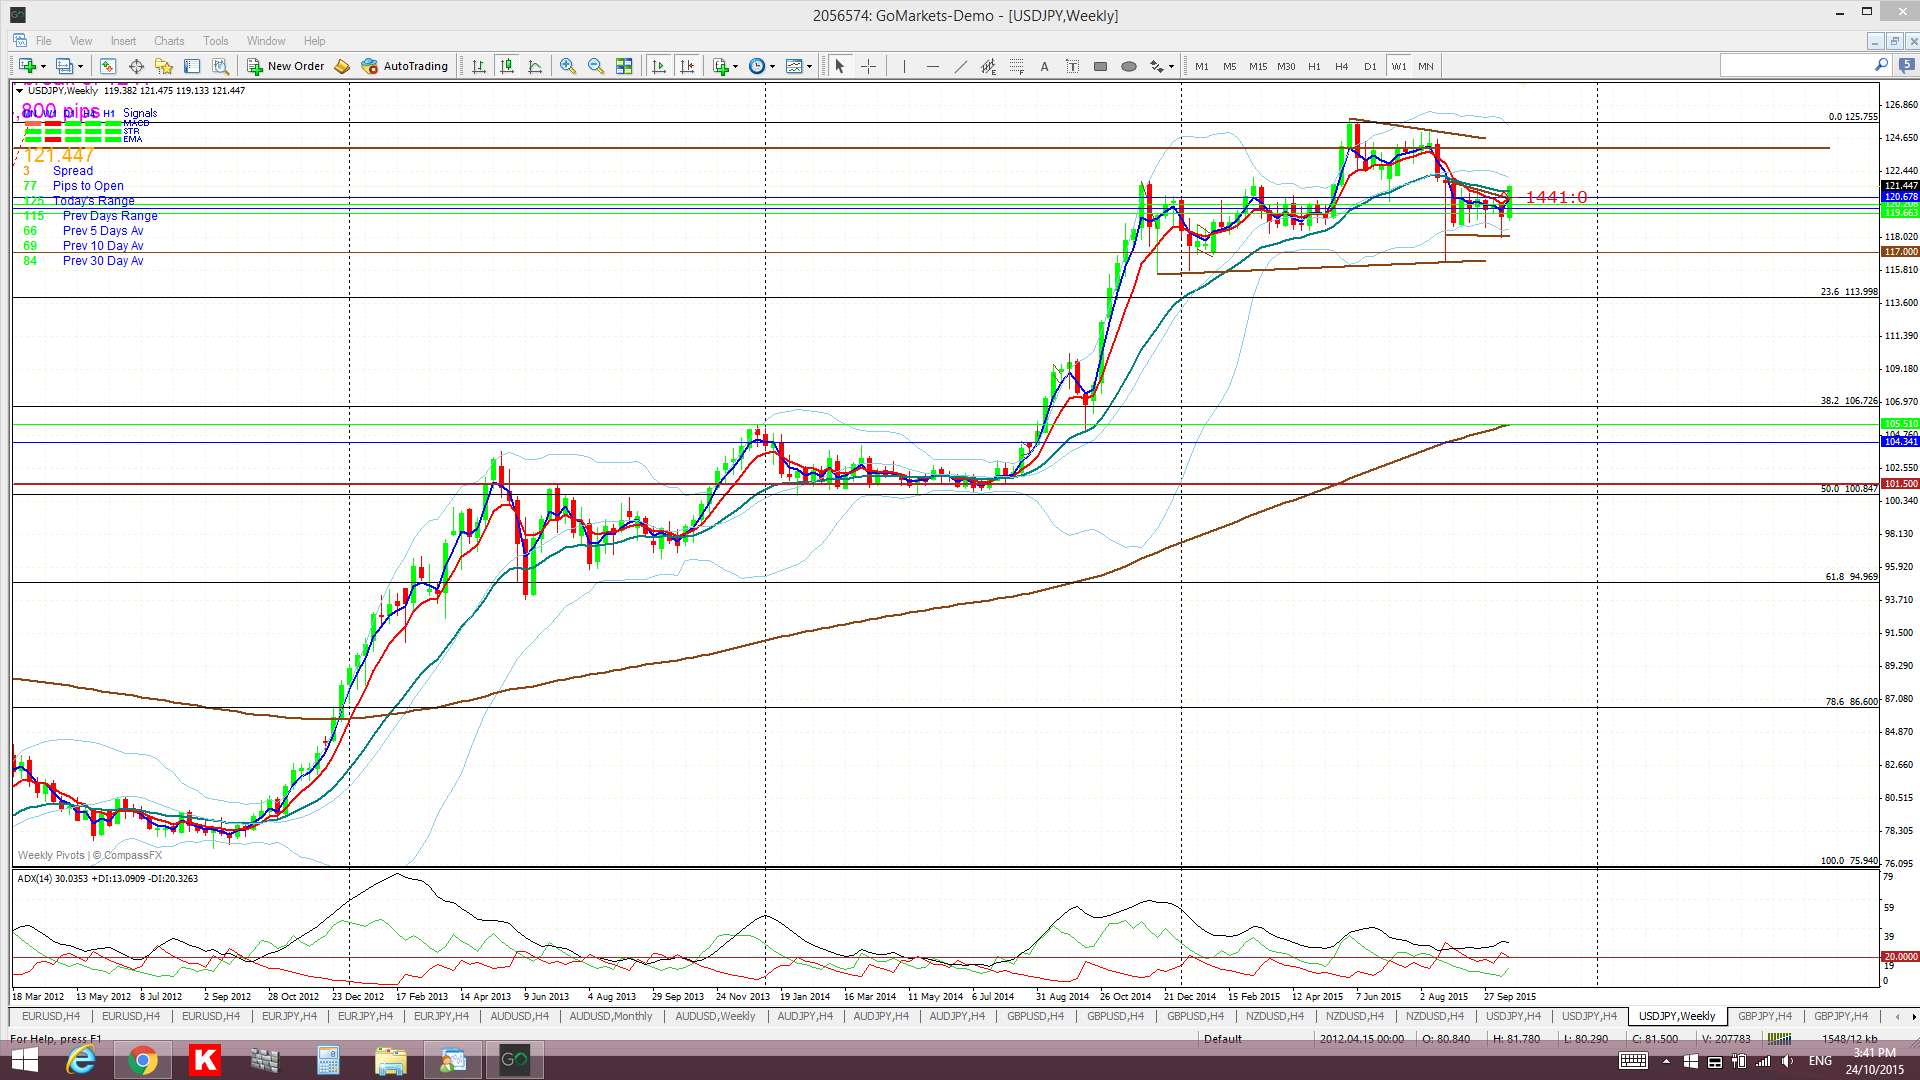
USD/JPY: US$ strength helped this pair to trigger a daily-channel breakout last week but the S/R level of 124 is now just above price action again and will be the area to keep in sight now. The 124 level is the top level for the new Cup ‘n’ Handle pattern I am stalking and I have been expecting choppiness around this region as the ‘Handle’ continues to form up.
There is a fair bit of news to impact this pair next week with FOMC on Wednesday and the BoJ Interest Rate announcement on Friday. One or both of these items might help to define whether the U/J breaks or respects this 124 level.
- I’m watching for any new TC signal and the 124 level.


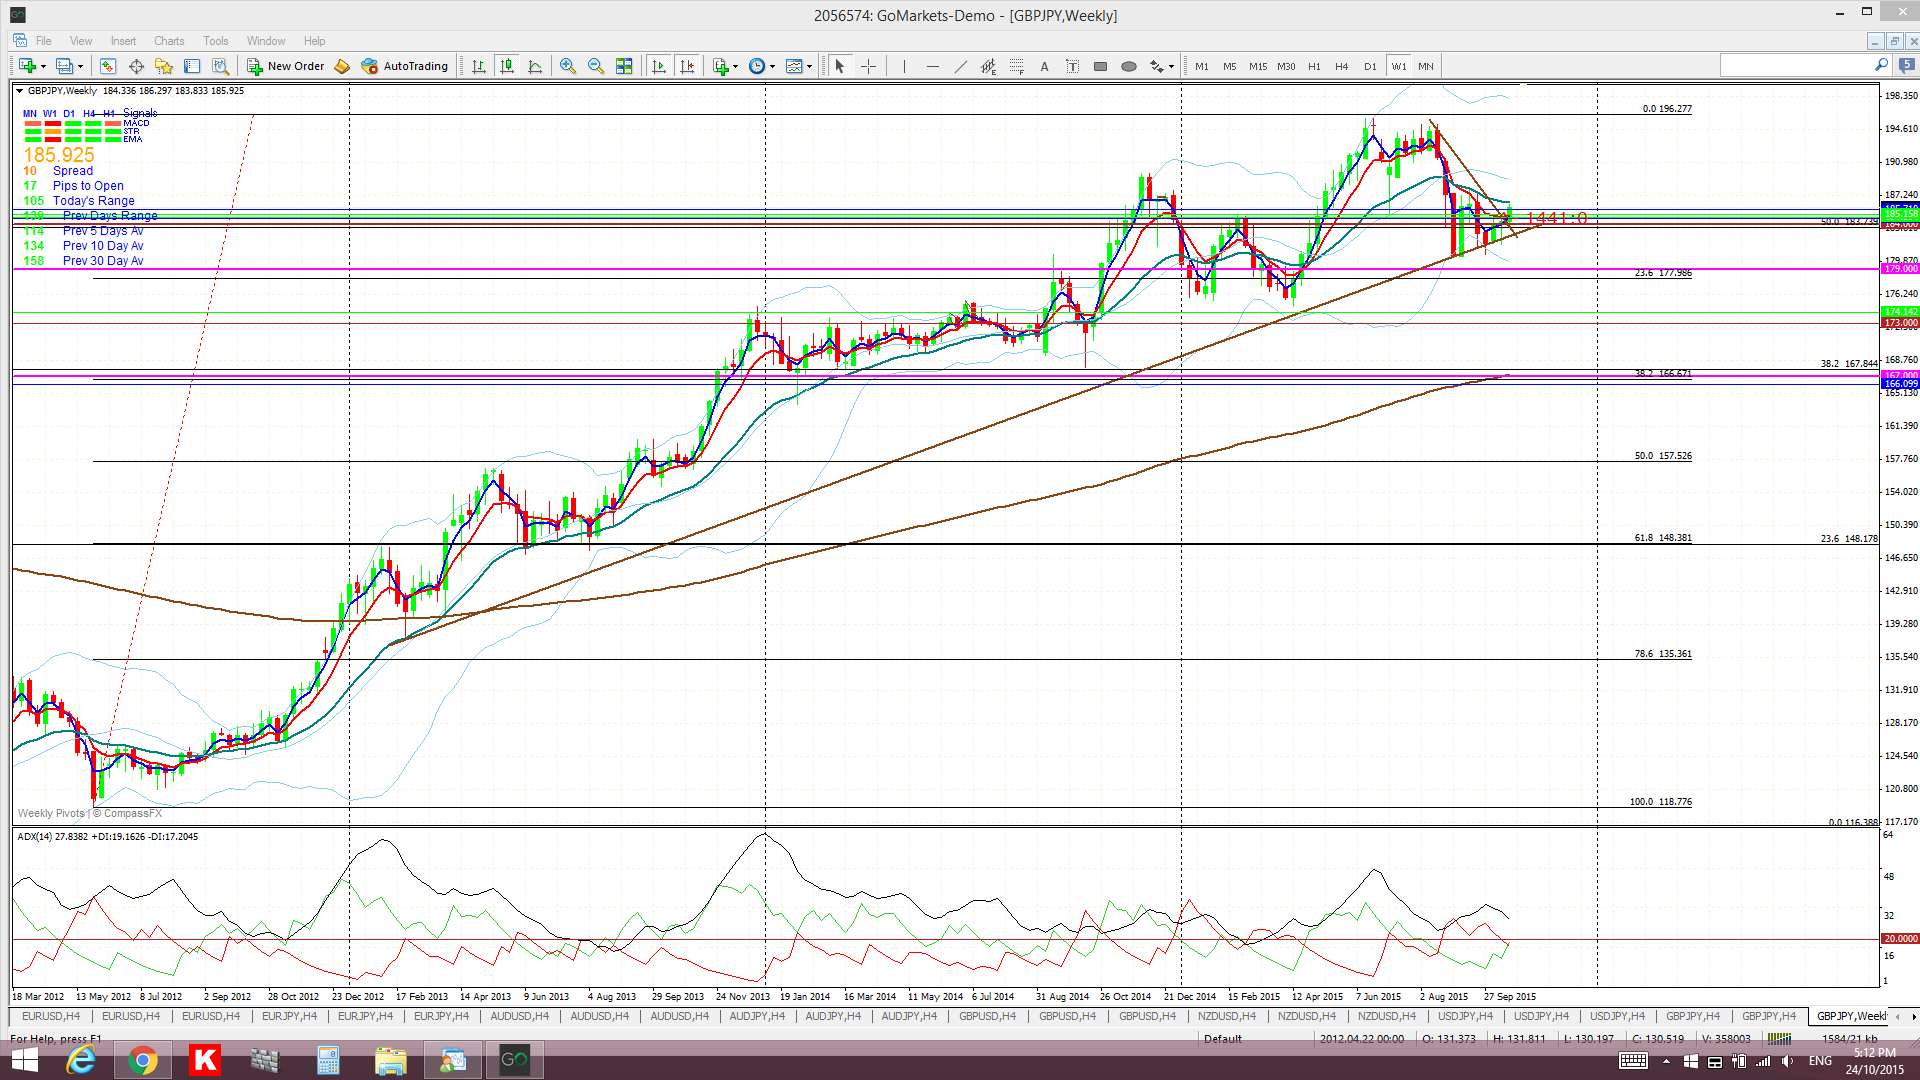
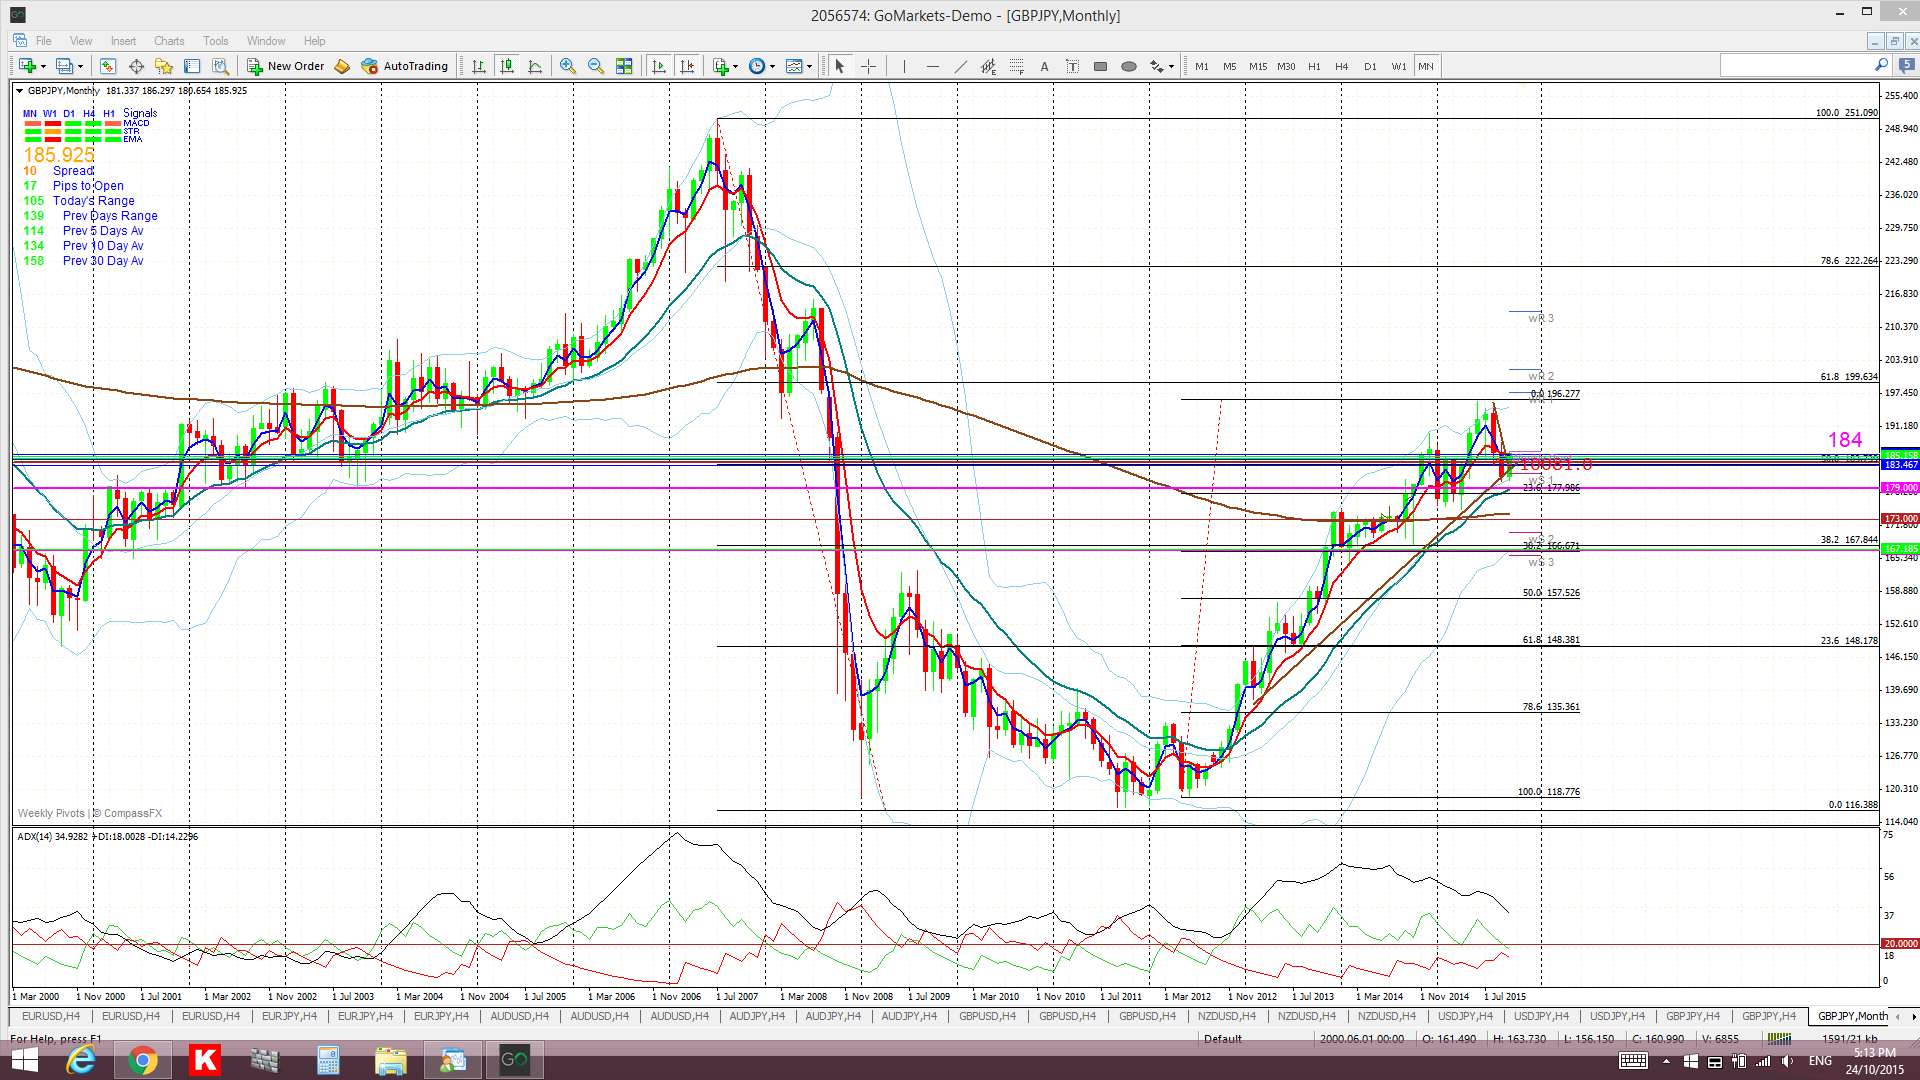
GBP/JPY: this continues to hold above the broken bear trend line and key 184 level. The 184 level is the region of the 50% fib of the monthly chart’s swing low move. A hold above this region would bring the 61.8% fib near 200 into focus.
- I’m watching for any new TC signal and the 184 level.

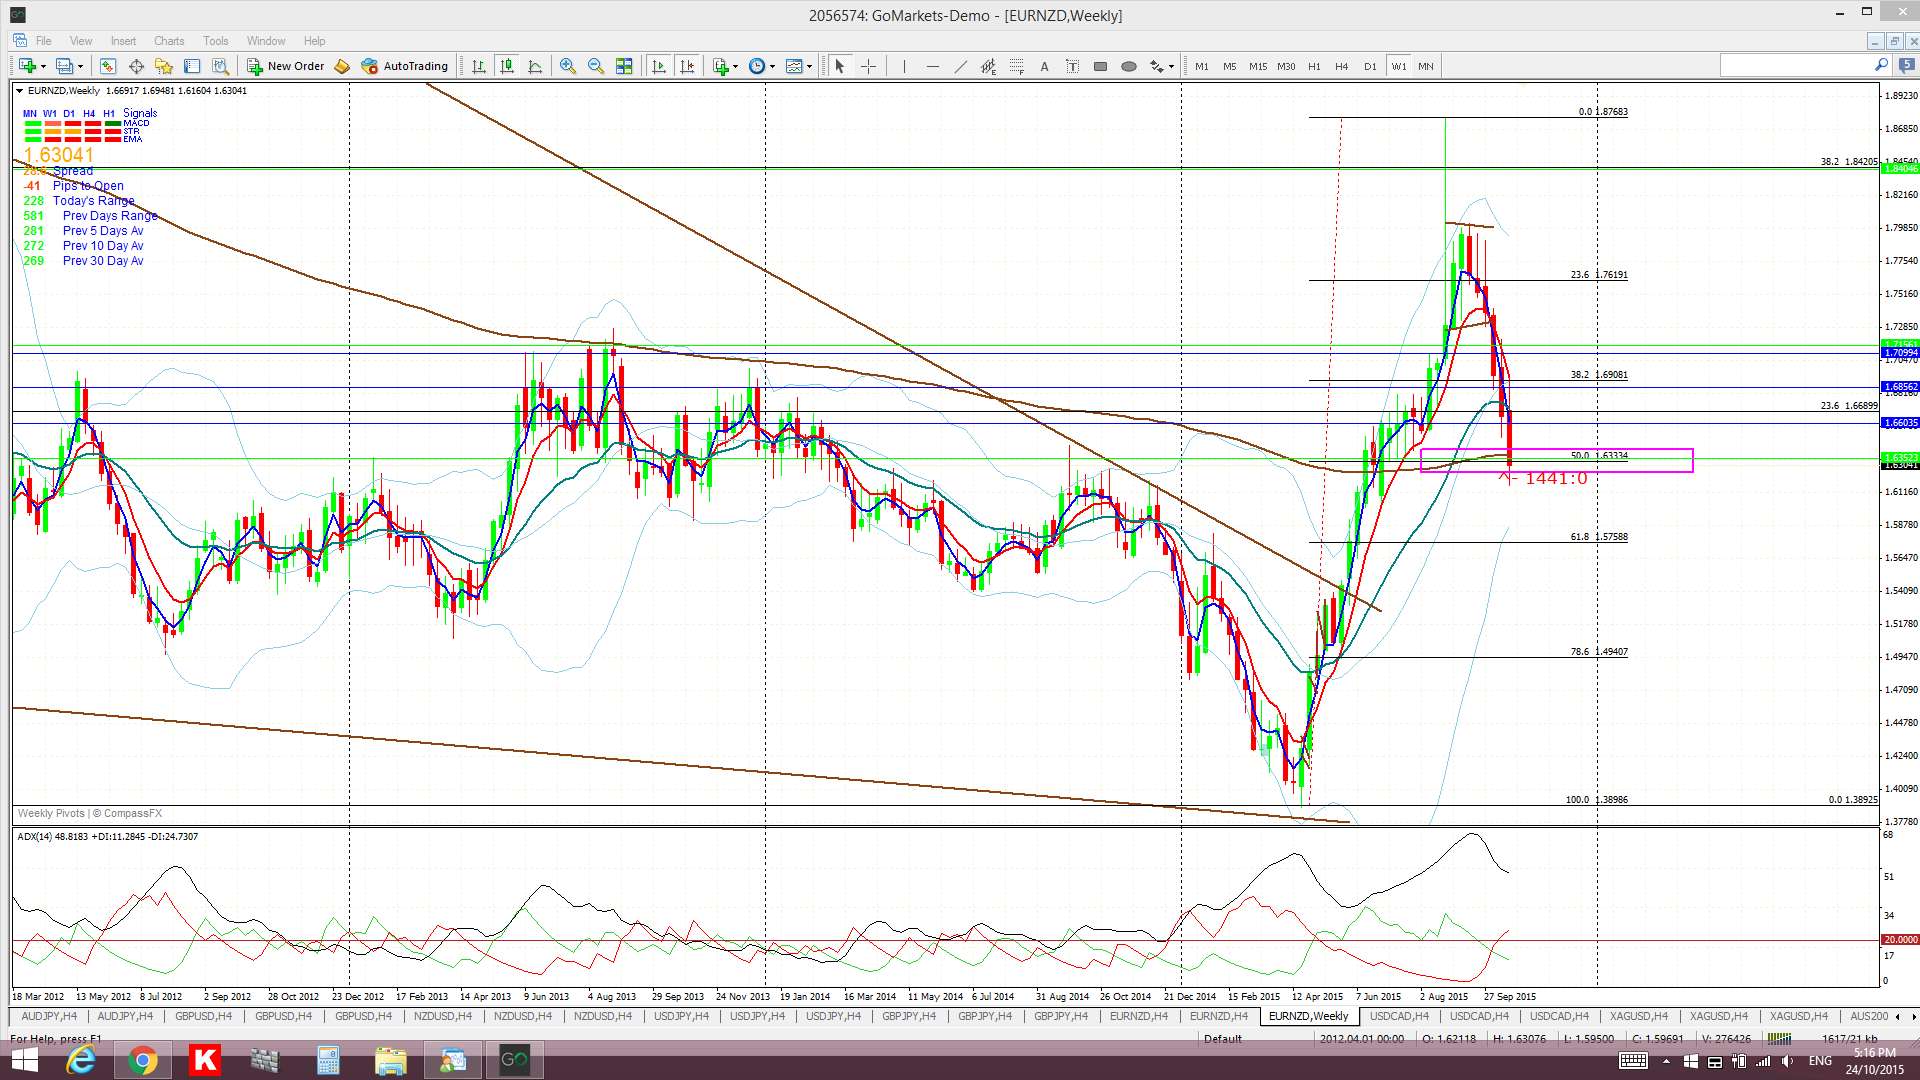
EUR/NZD: this has pulled back to the target 50% region now but, where to next? Any continued bearish sentiment might support a move down to the 61.8% fib near the 1.575 area. However, if a US rate hike is delayed AND the RBNZ cut rates then this could bounce. Traders will need to keep a watch on their trading calendar for this pair this week!
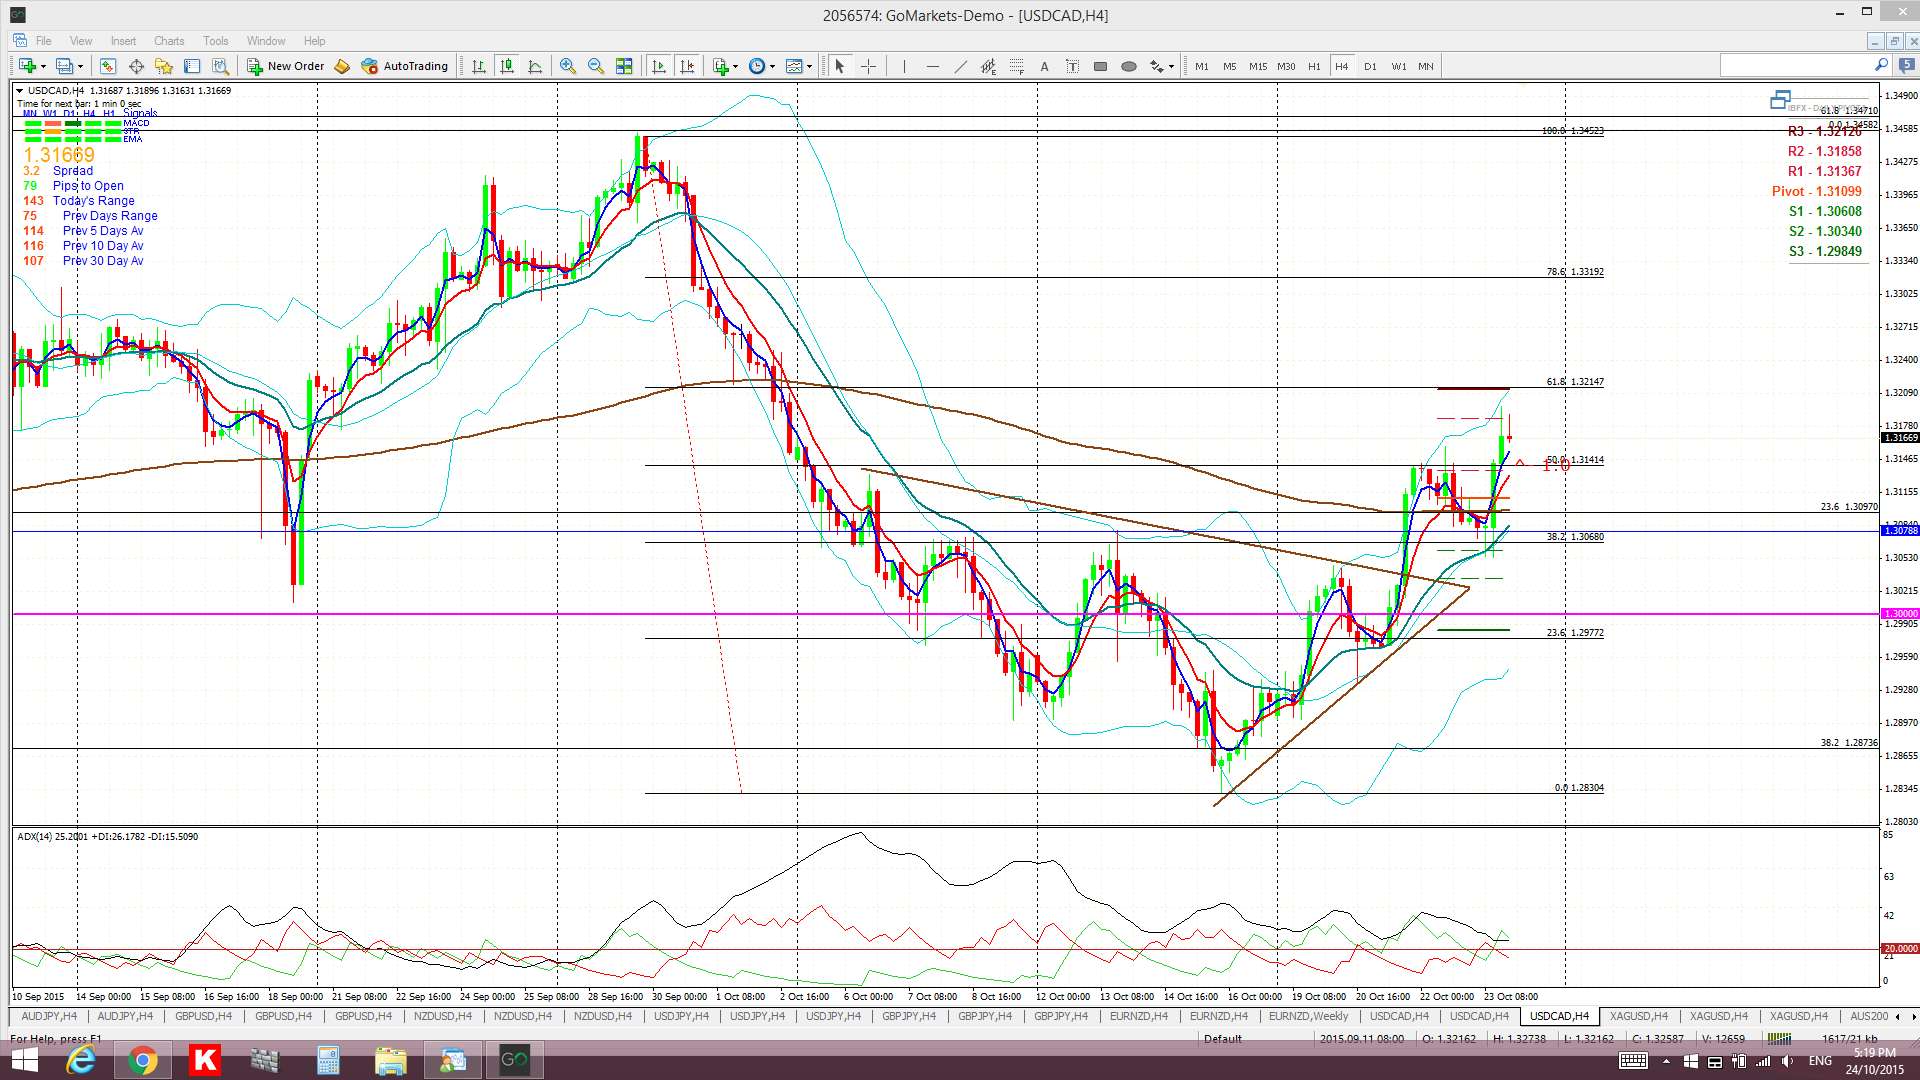
USD/CAD: Dovish commentary from the BoC helped to trigger a bullish triangle breakout here last week that yielded 100 pips and a move up to near the suspected 4hr 61.8% fib region. The new TC signal that triggered didn’t follow through though and closed off for -40 pips.
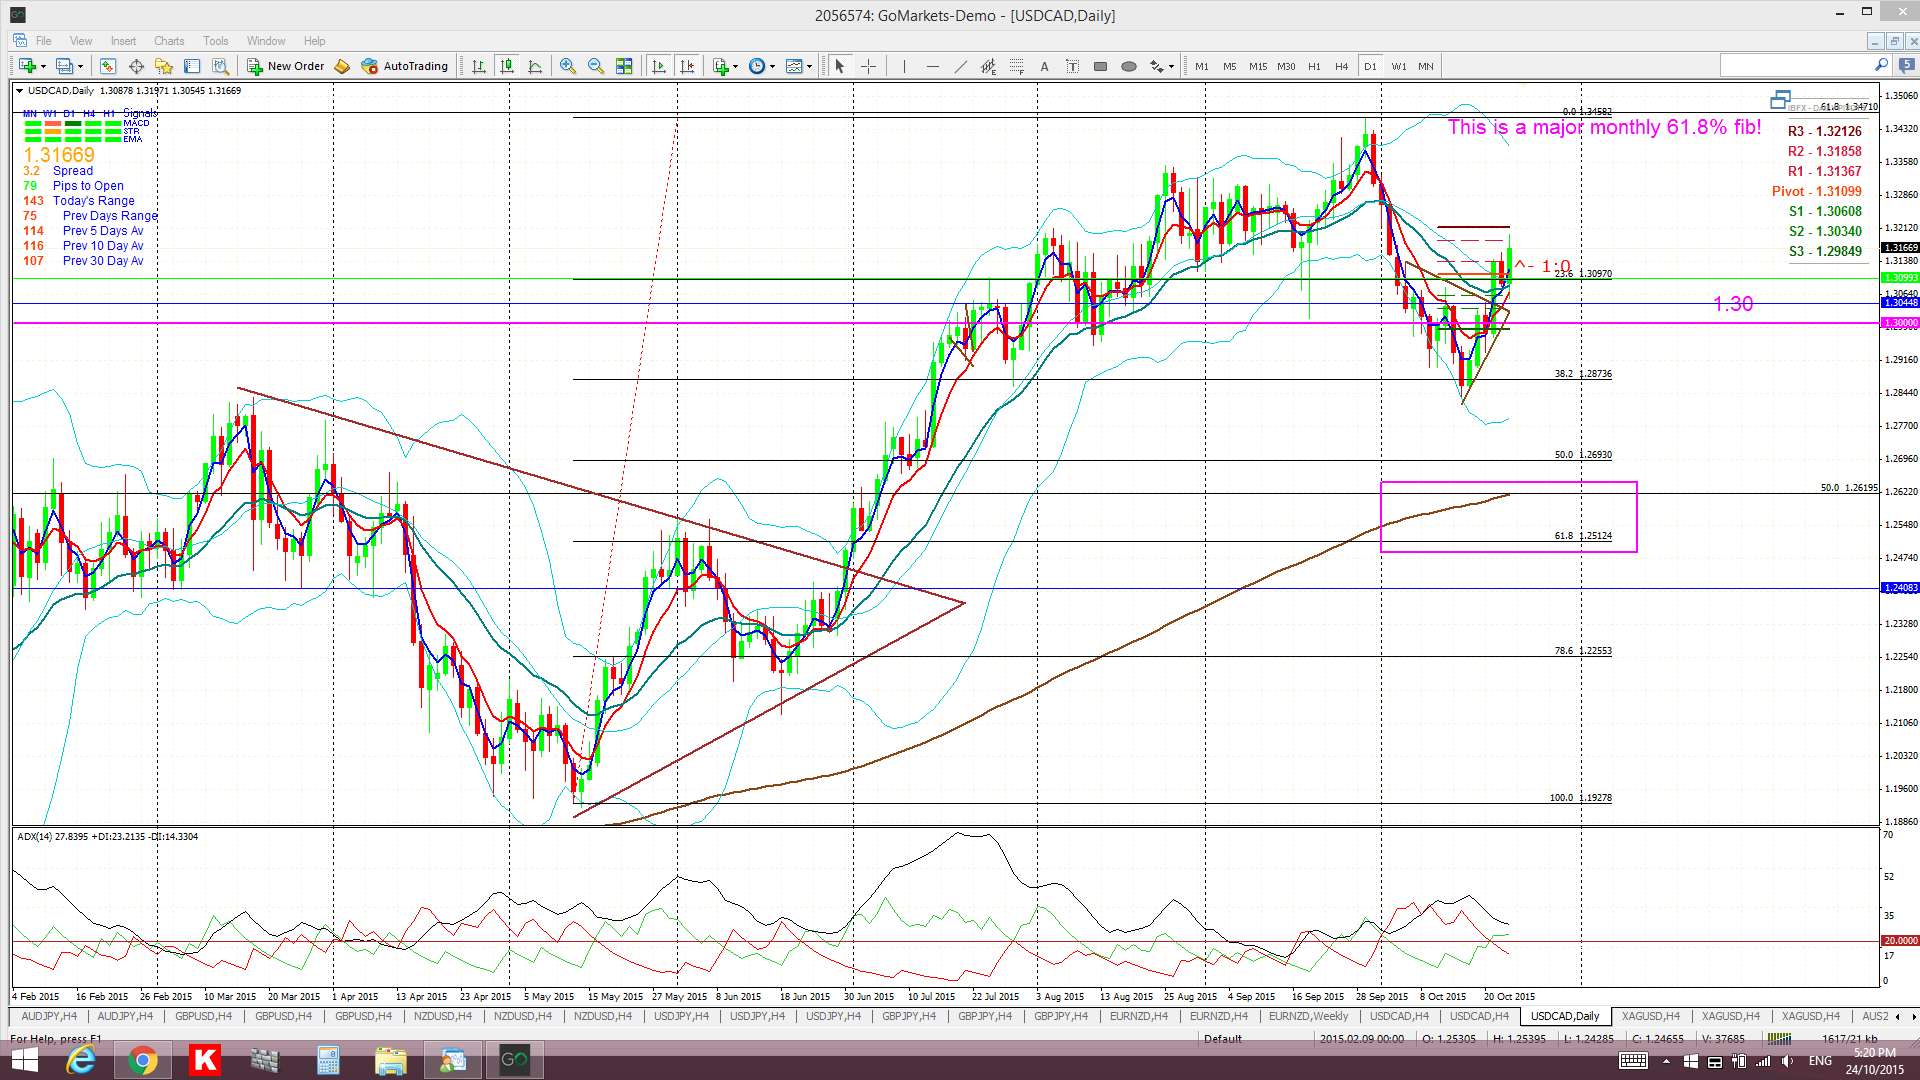
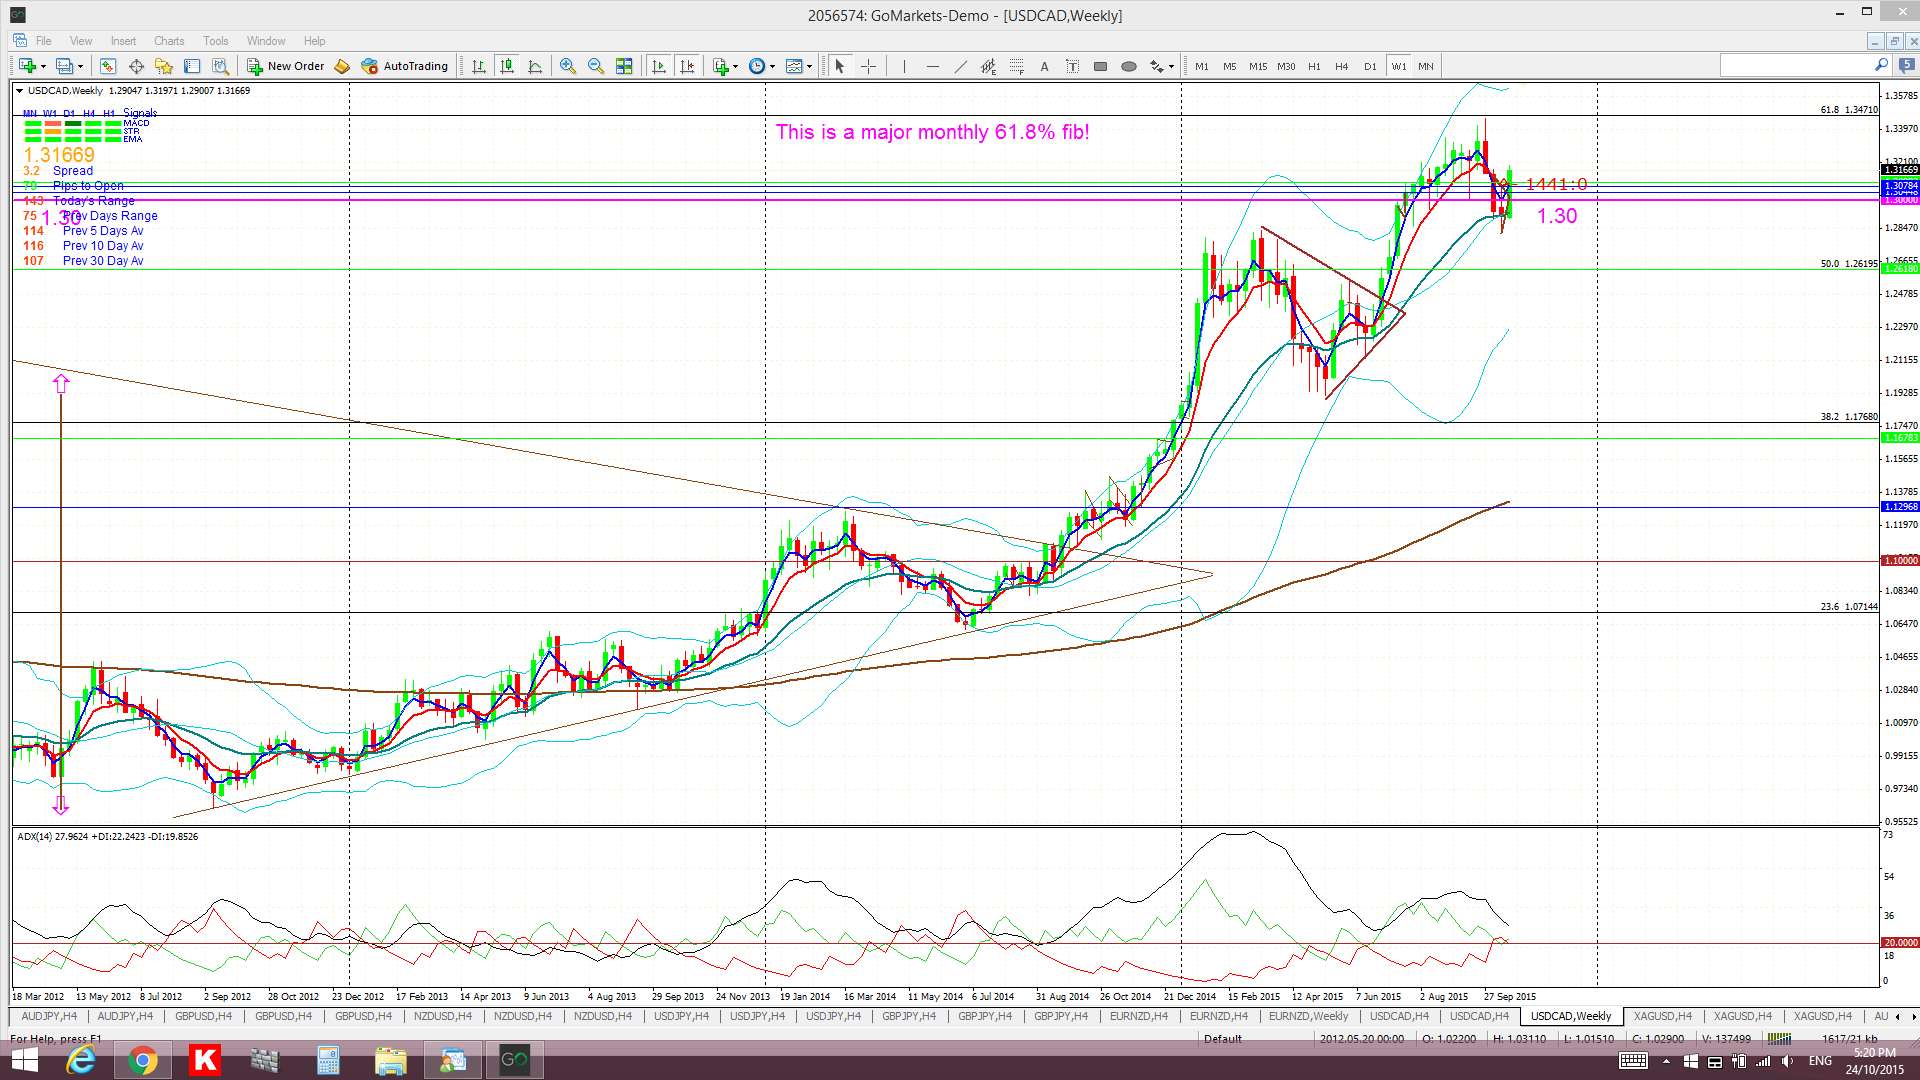
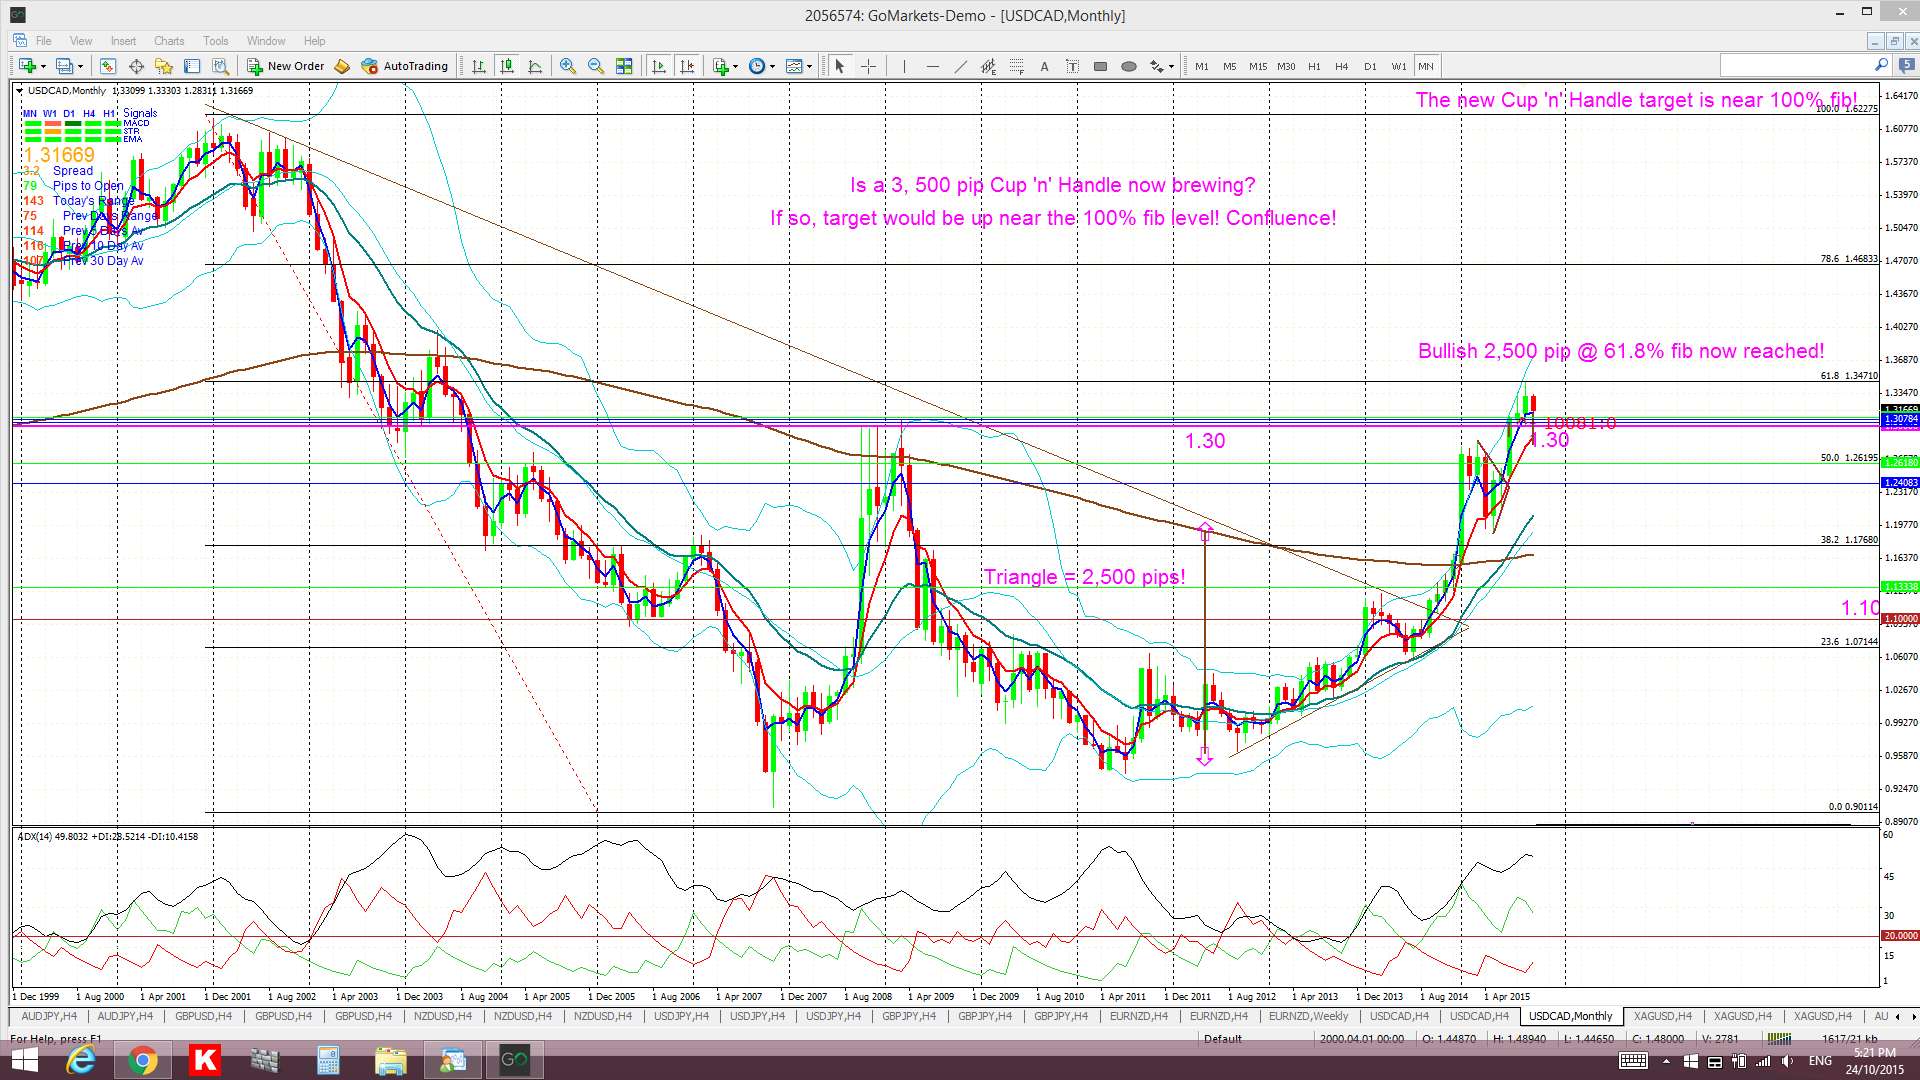
The 1.30 remains the level to watch here as it is the upper boundary of the major Cup ‘n’ Handle pattern that I see brewing on the monthly chart.
The US data will impact here but there is also CAD GDP on Friday to monitor.
- I’m watching for any new TC signal here, the 1.30 level and the monthly chart’s 61.8% fib.
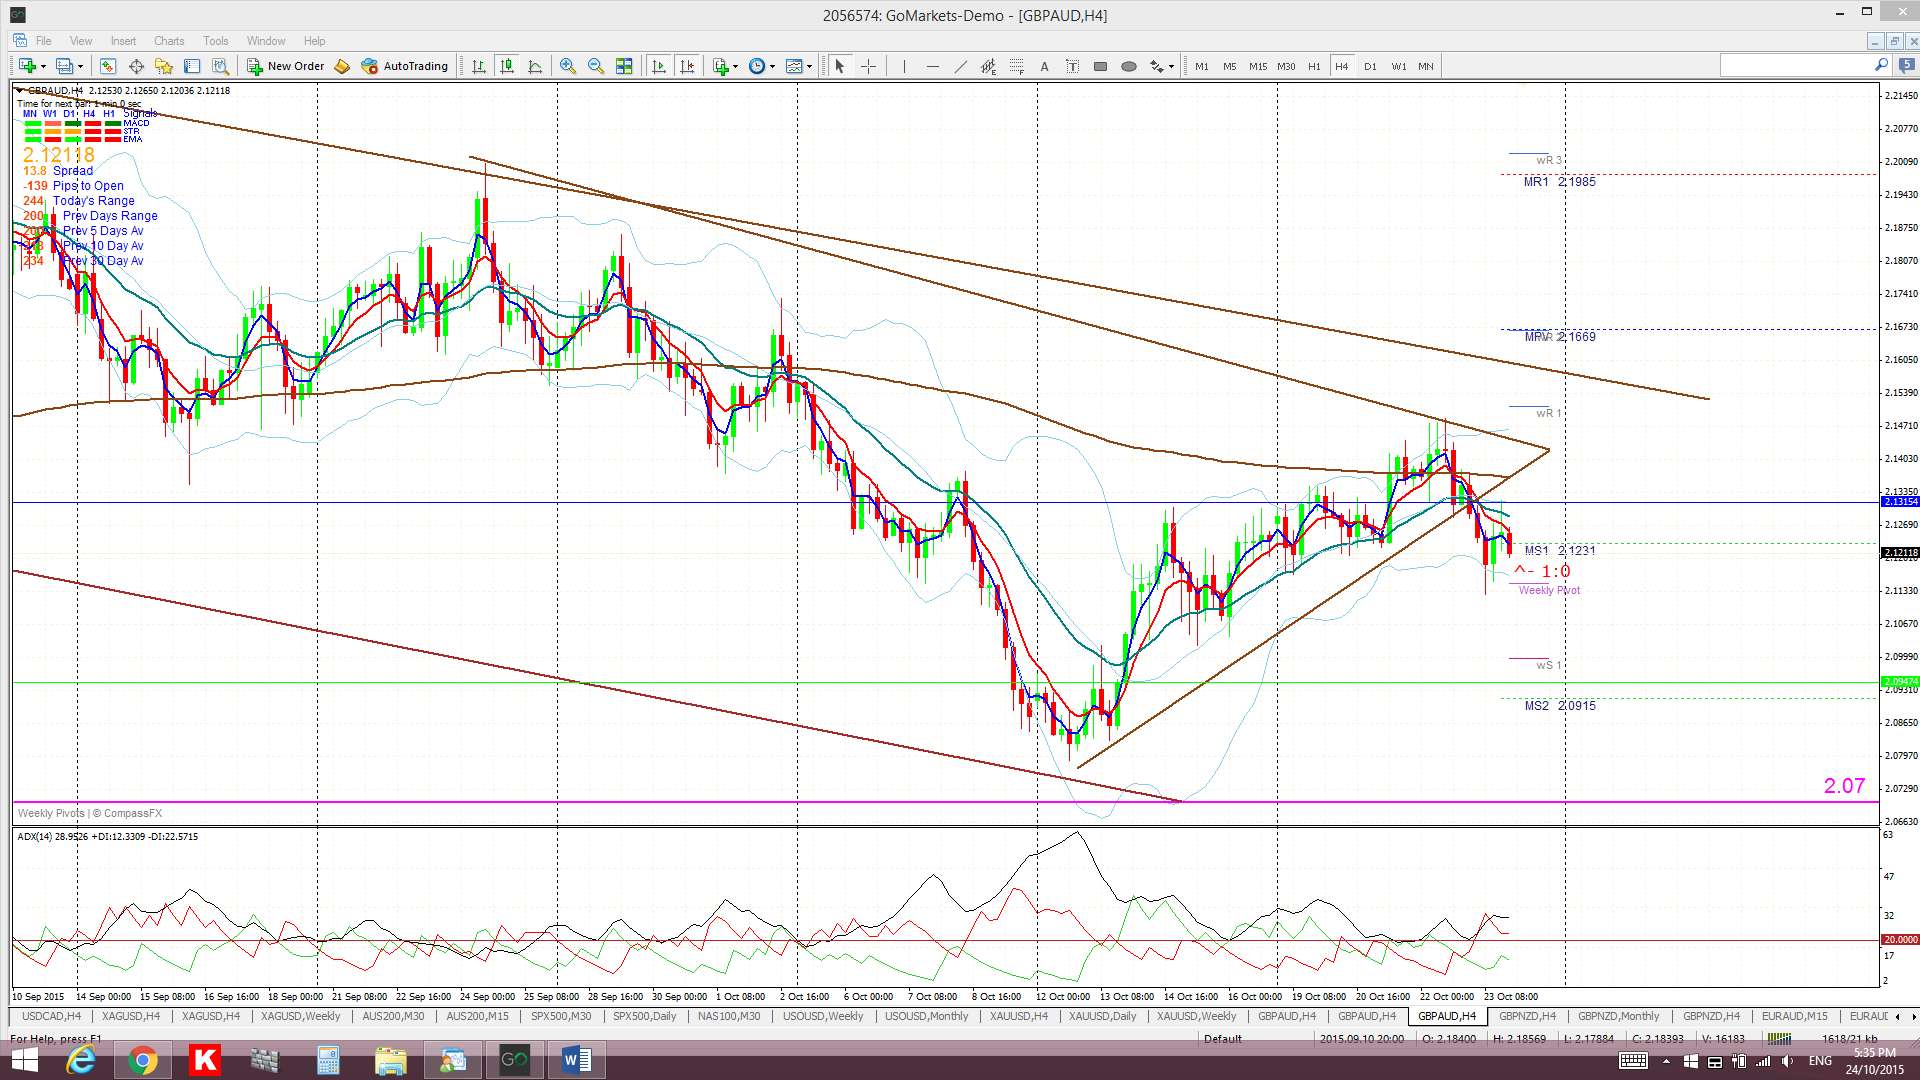
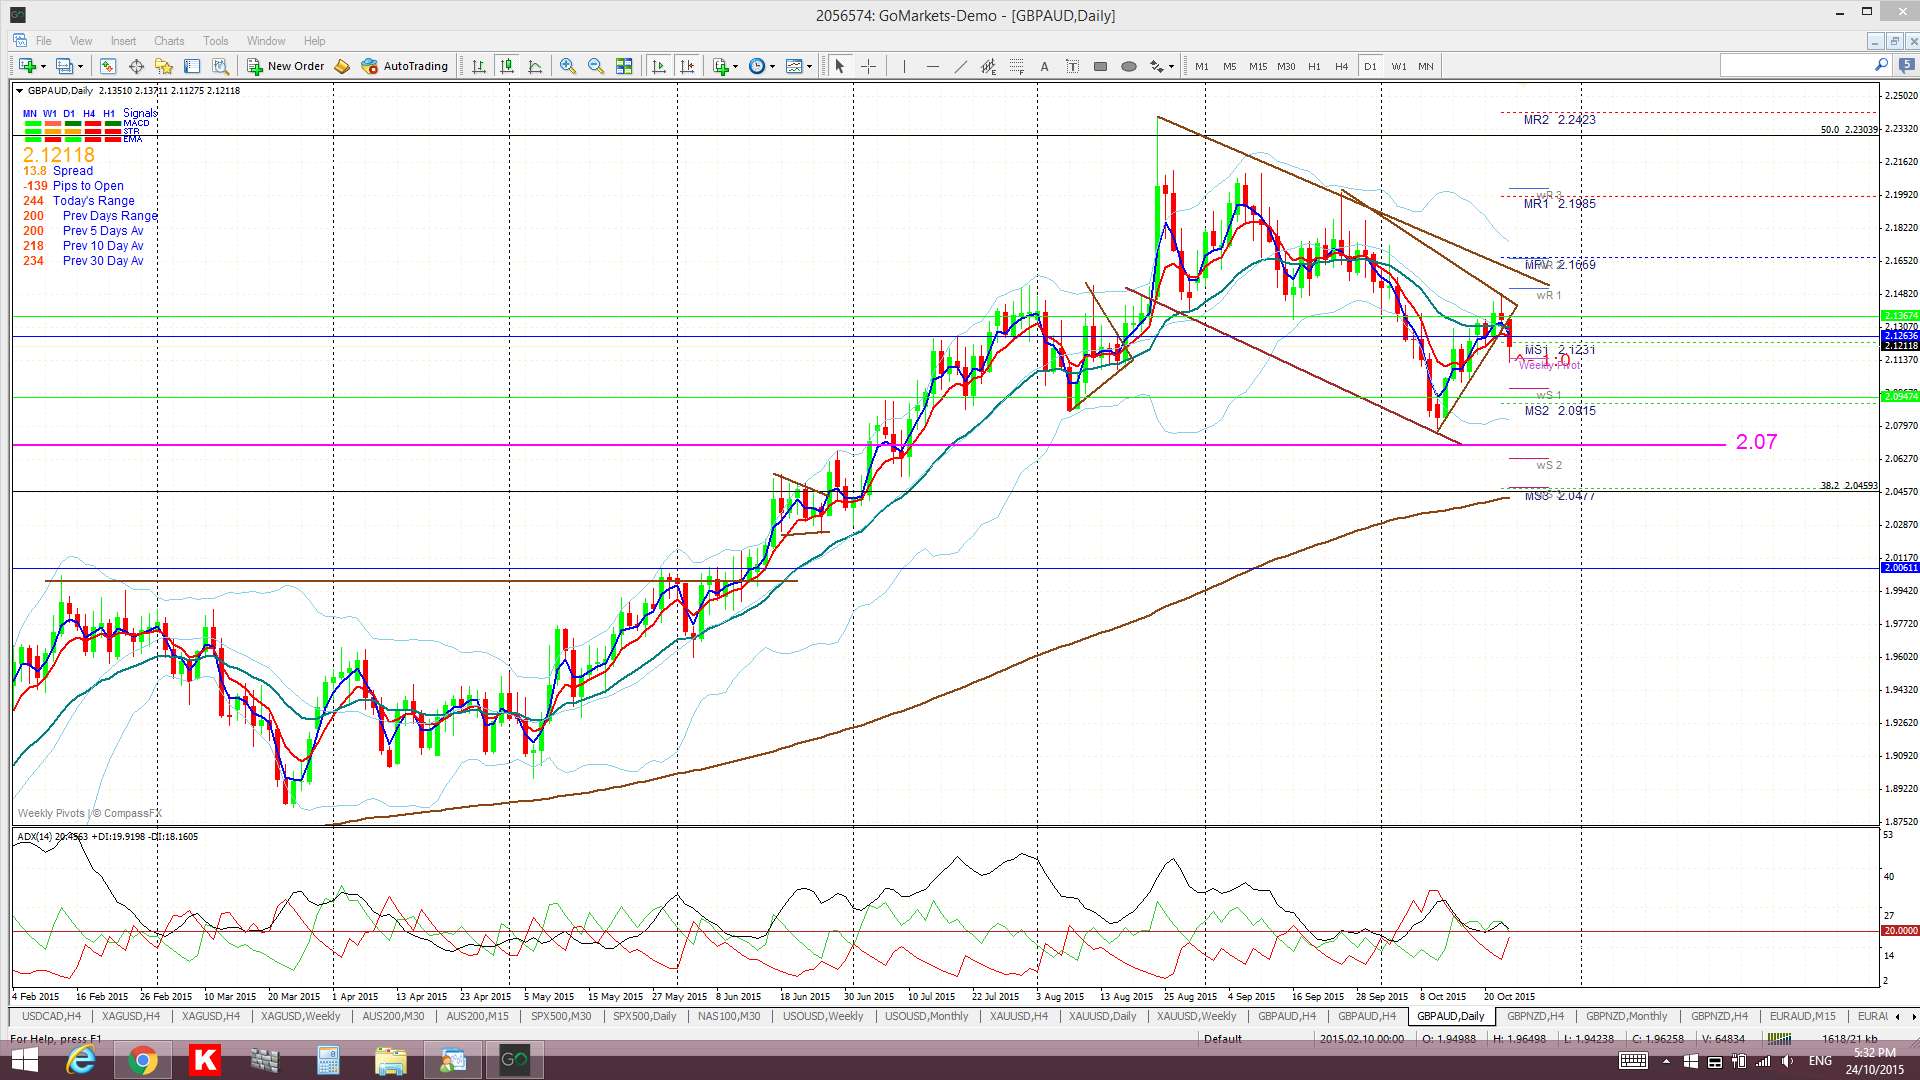
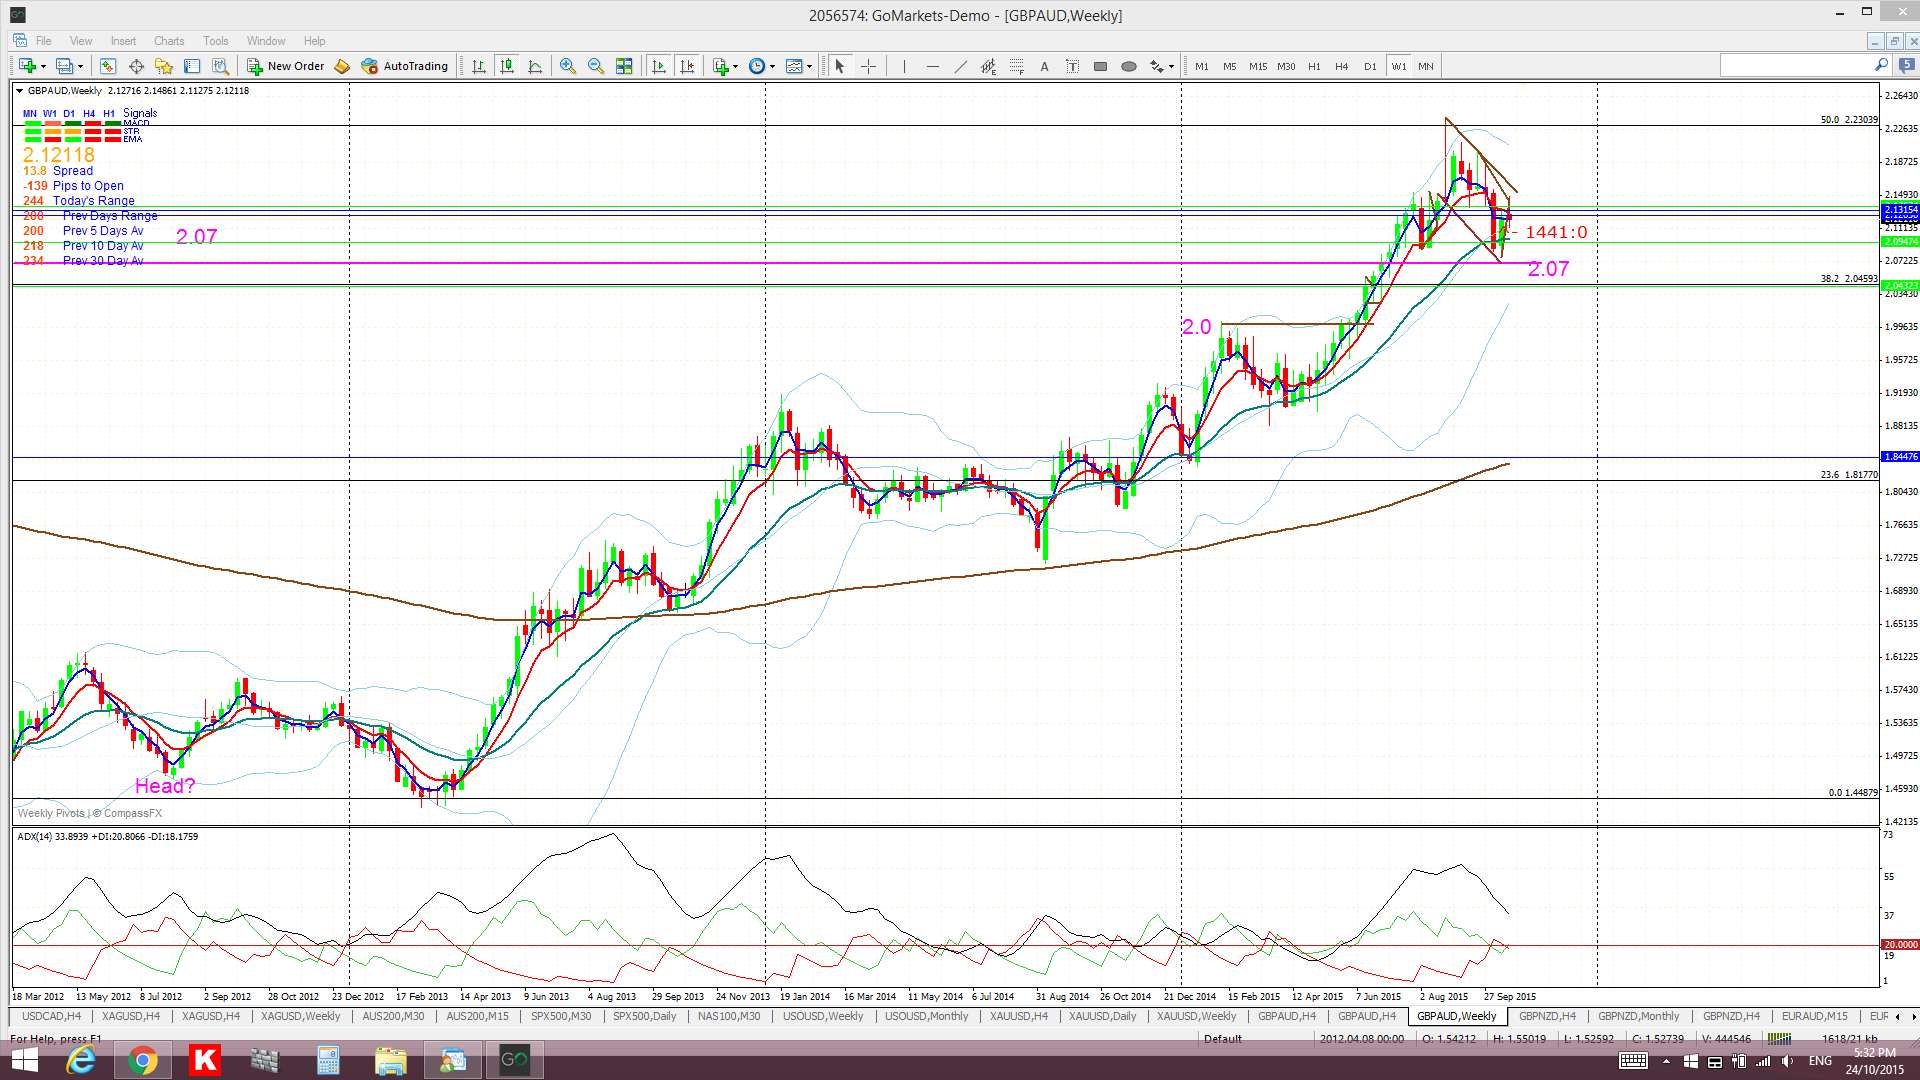
GBP/AUD: this has made a bearish TL break but without a new TC trade signal but any bearish follow-through might take this pair back down to the 2.07 S/R level.
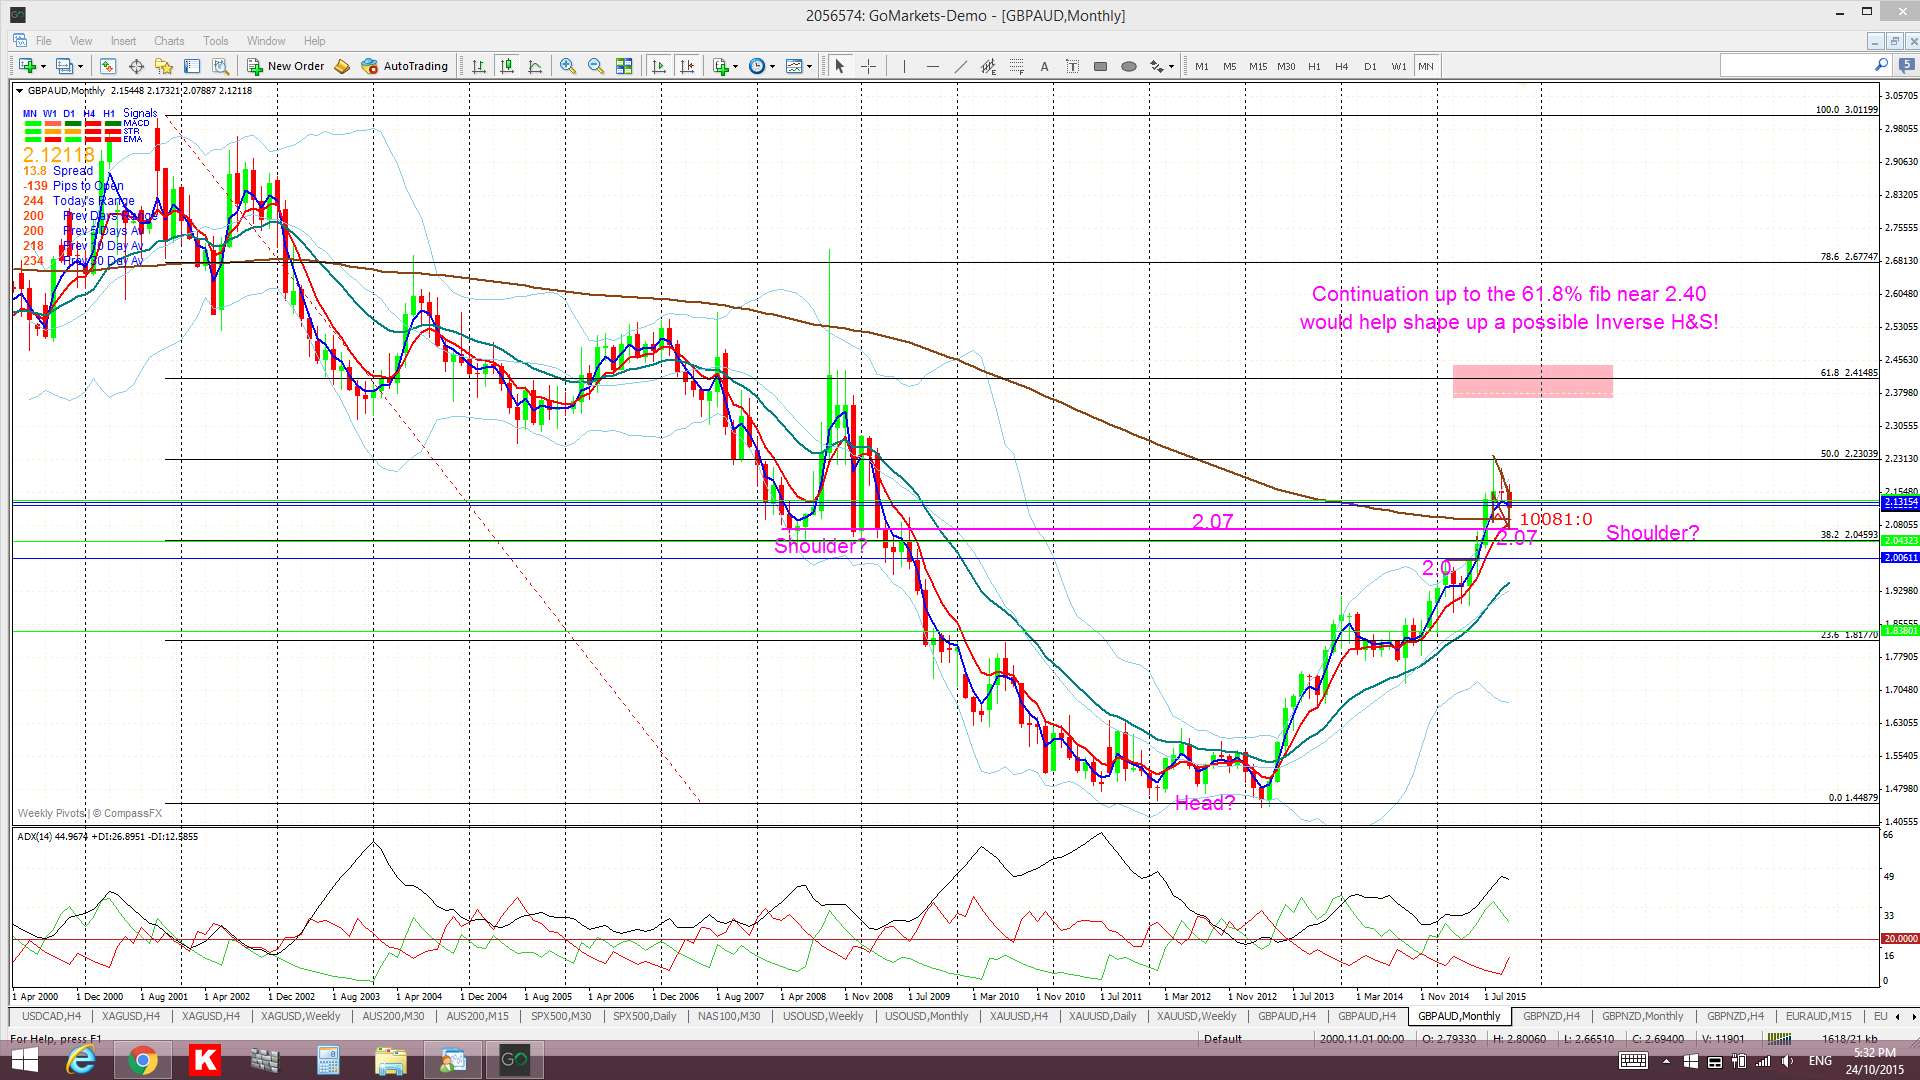
Recall that there is a Cup pattern forming up on the monthly chart with a top near this 2.07 level and that there could be continued choppiness around this region as a potential ‘Handle’ forms up. Any continued bullish momentum may bring an alternative monthly chart pattern into focus as well. A continued push up to the 2.40 region, near the 61.8% fib, would help to form up a possible bullish ‘Inverse H&S’ pattern. Both patterns are bullish patterns though:
- I’m watching for any new TC signal and the 2.07 level.
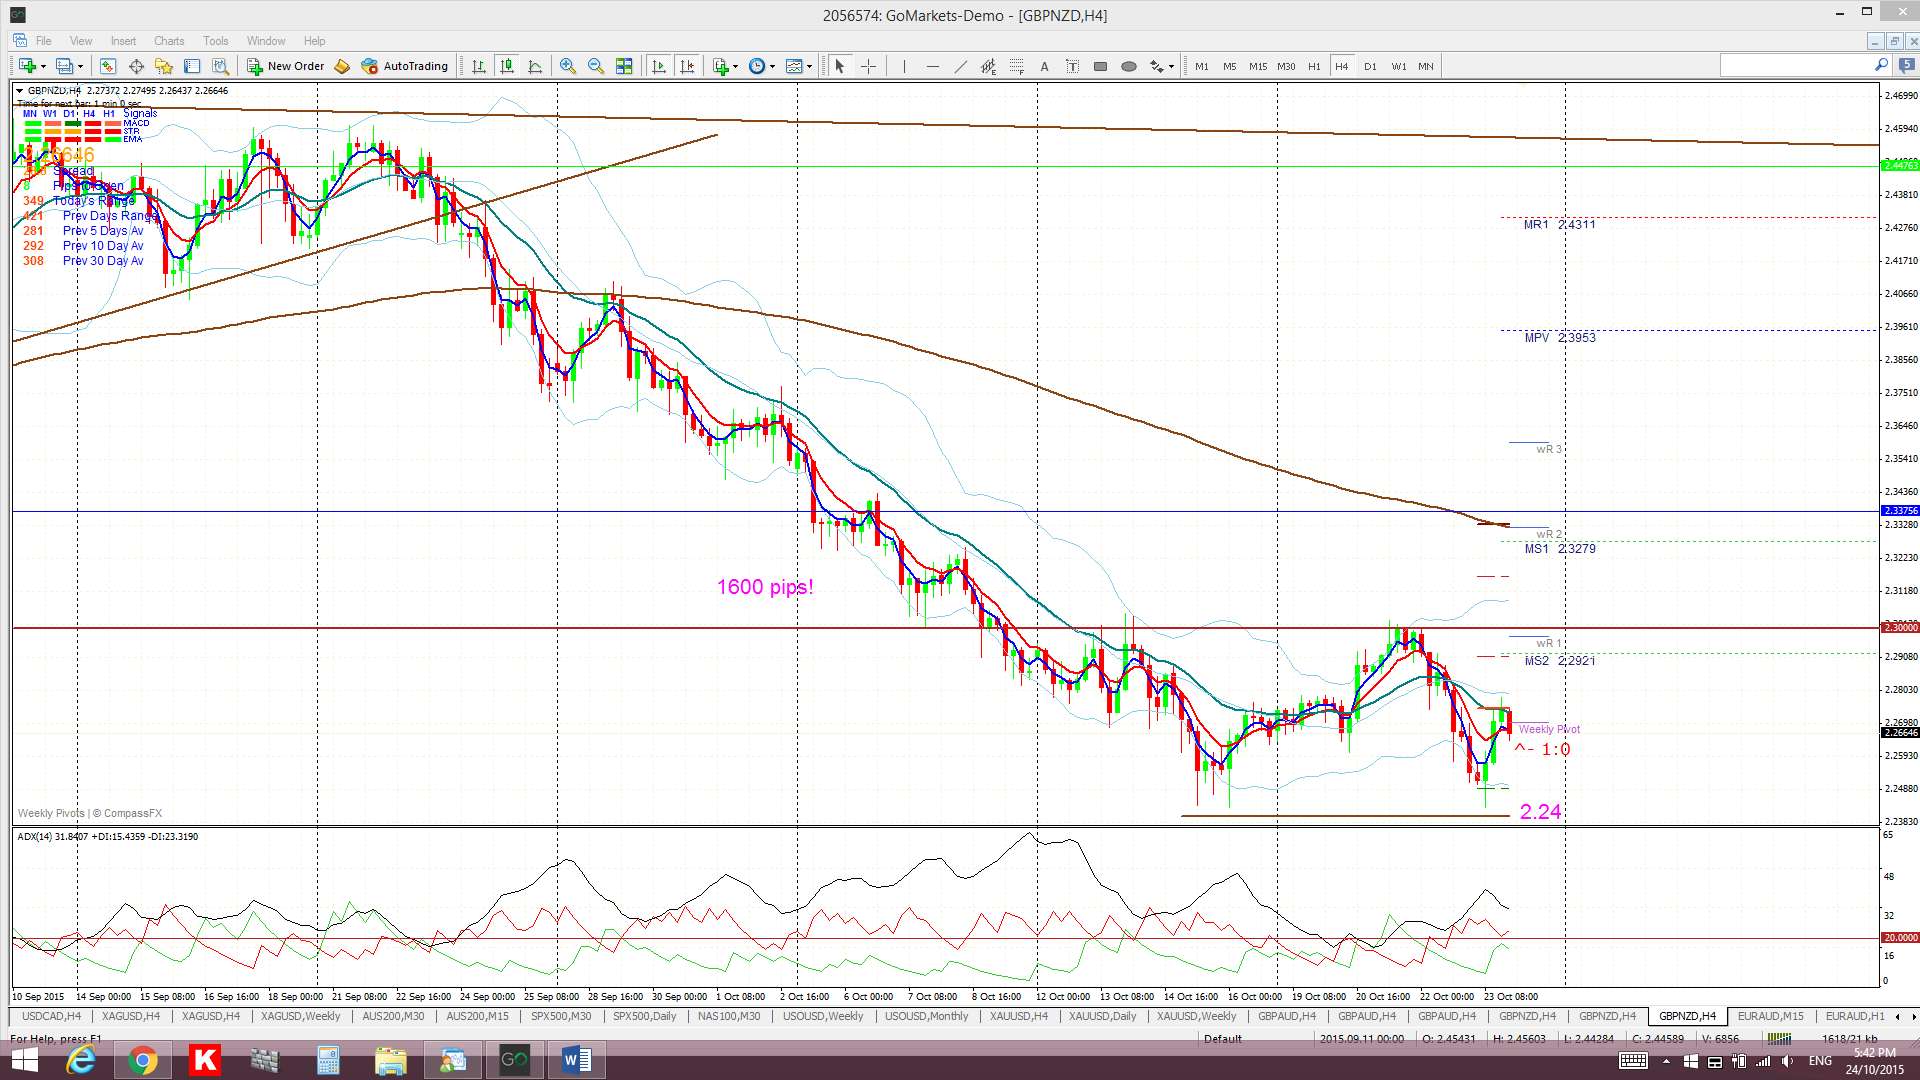
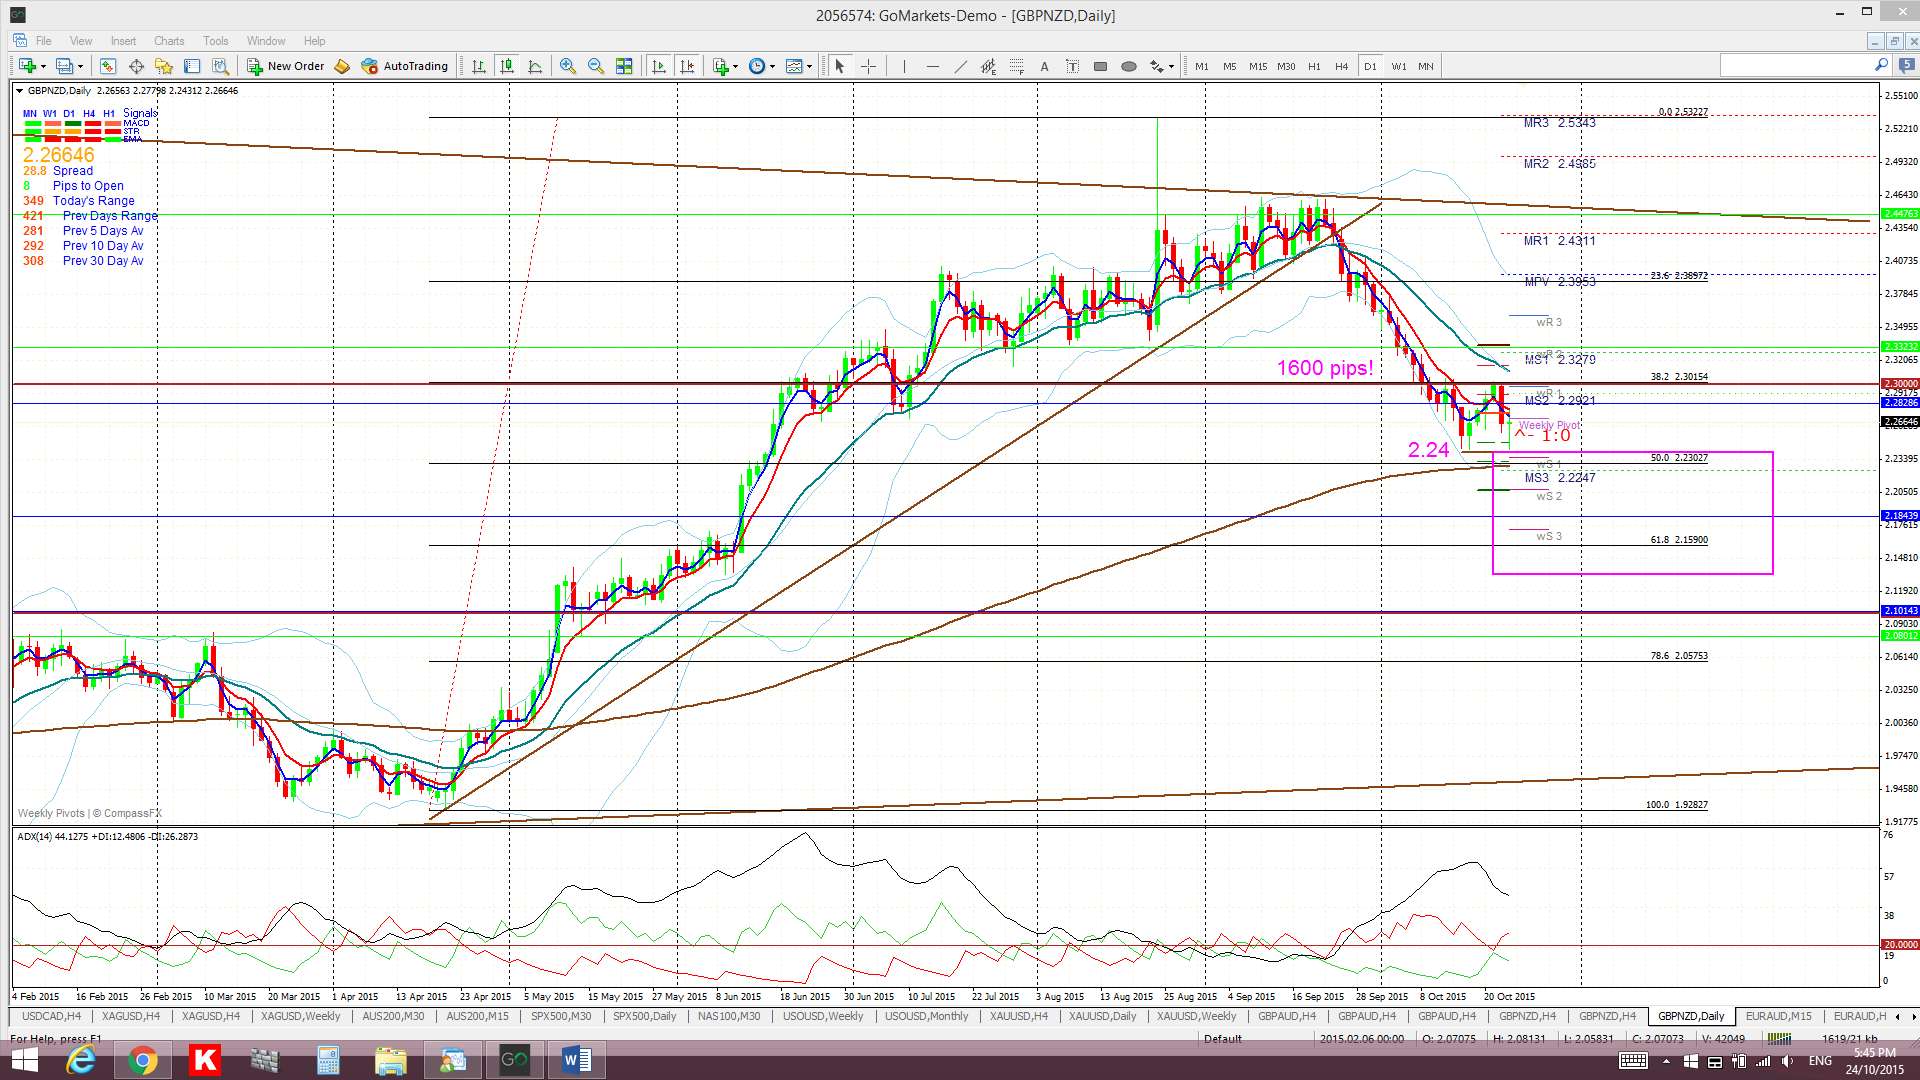
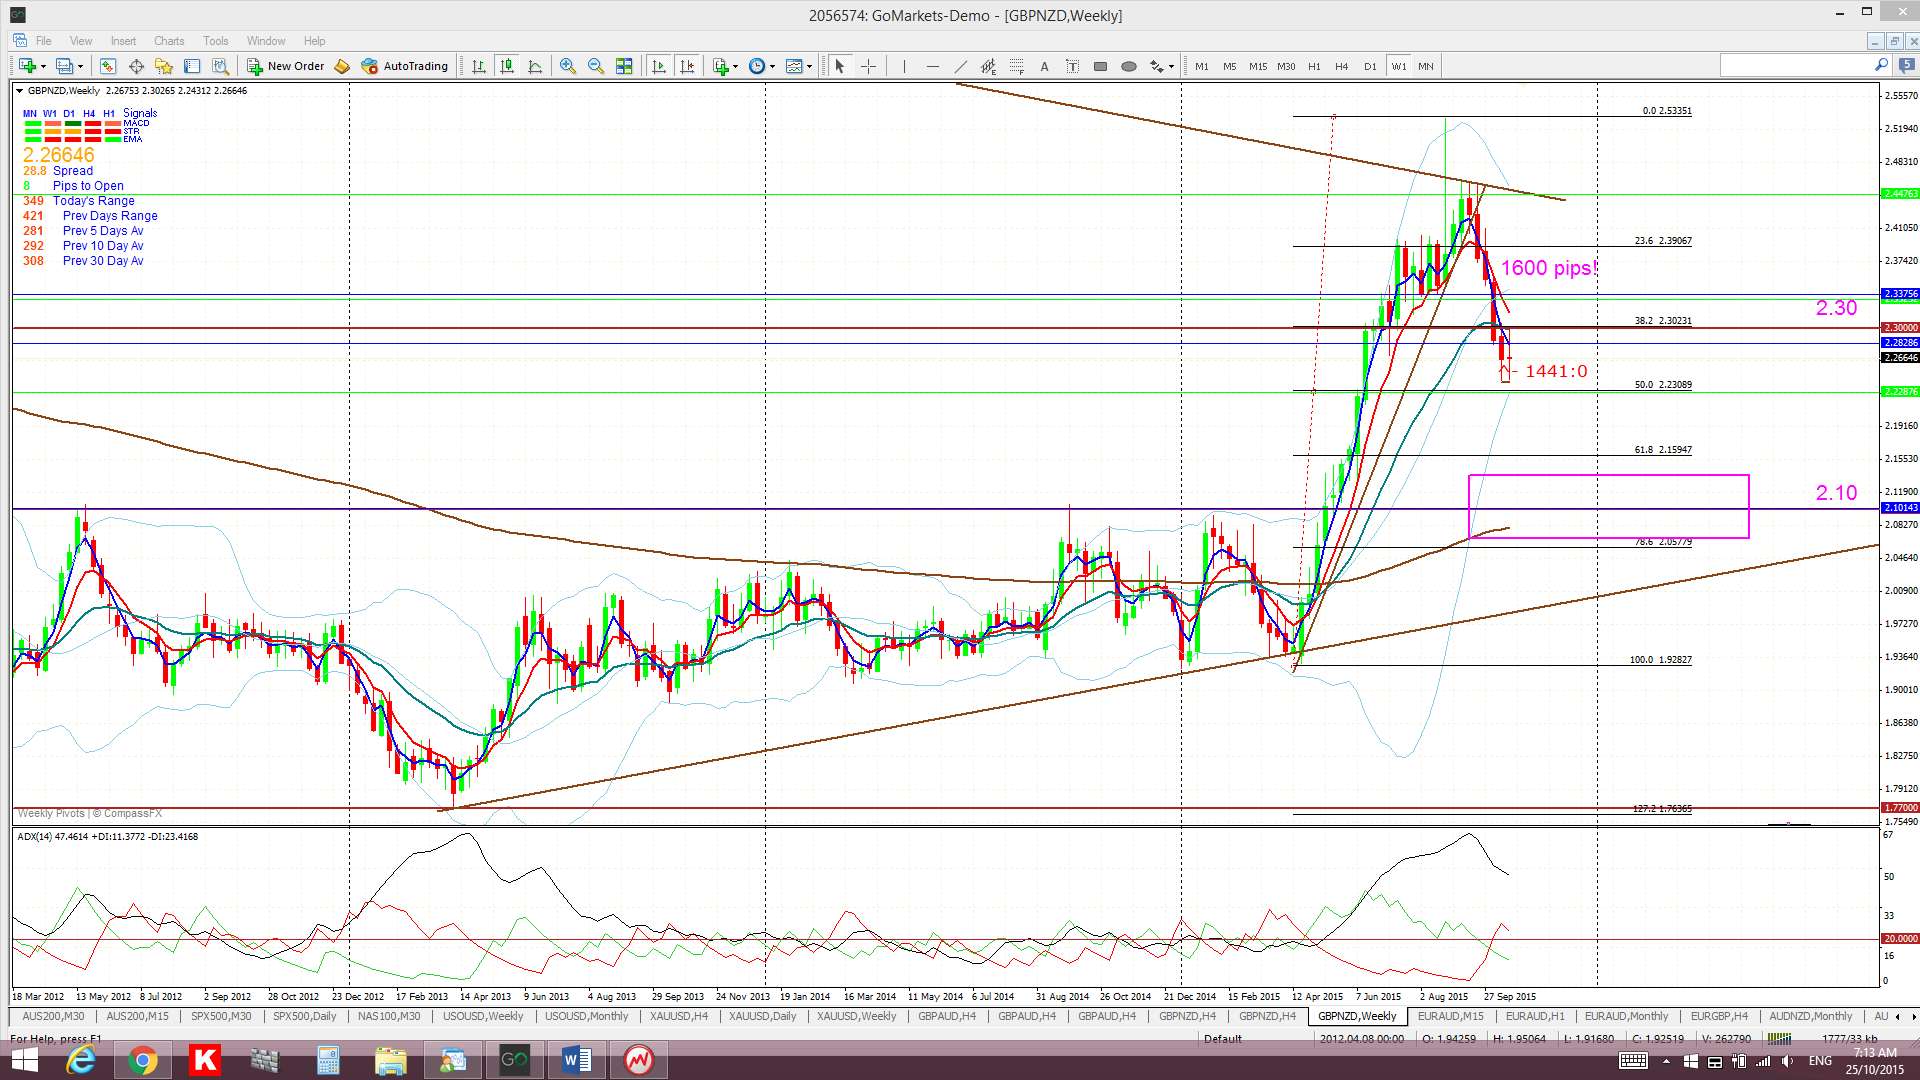
GBP/NZD: I had suggested this pair might pull back to test the key S/R level of 2.30 and that it did.
Price action found support last week from the 2.24 region as this was just above the daily chart’s 50% fib and 200 EMA region. Any bearish follow through might head to the daily chart’s 61.8% fib near 2.16 and, after that, to the previous S/R region of 2.10 as this is near the weekly 200 EMA and just below the weekly chart’s 61.8% fib region.
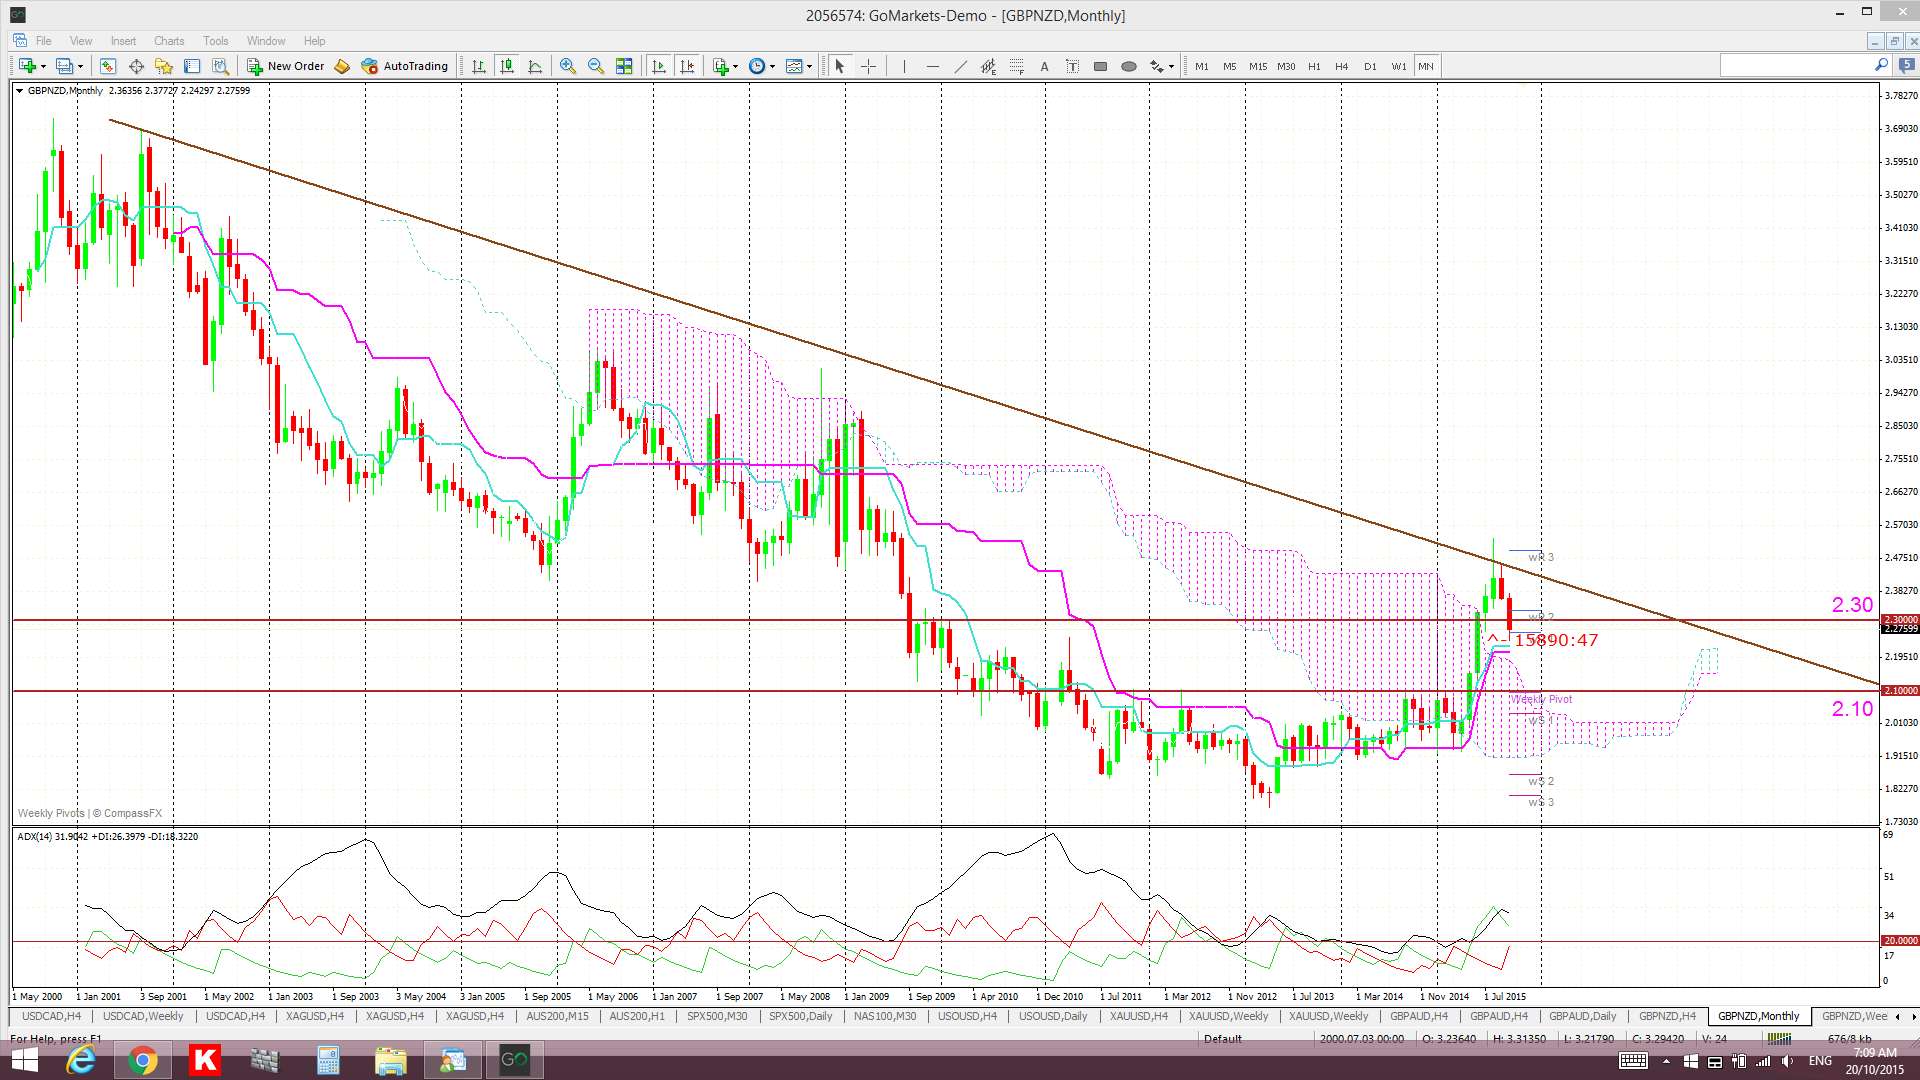
Any close and hold back above the 2.30 level though would suggest a trip up to test the monthly chart’s triangle upper trend line; the region where price was last rejected.
- I’m watching for any new TC signal and the 2.30 level.
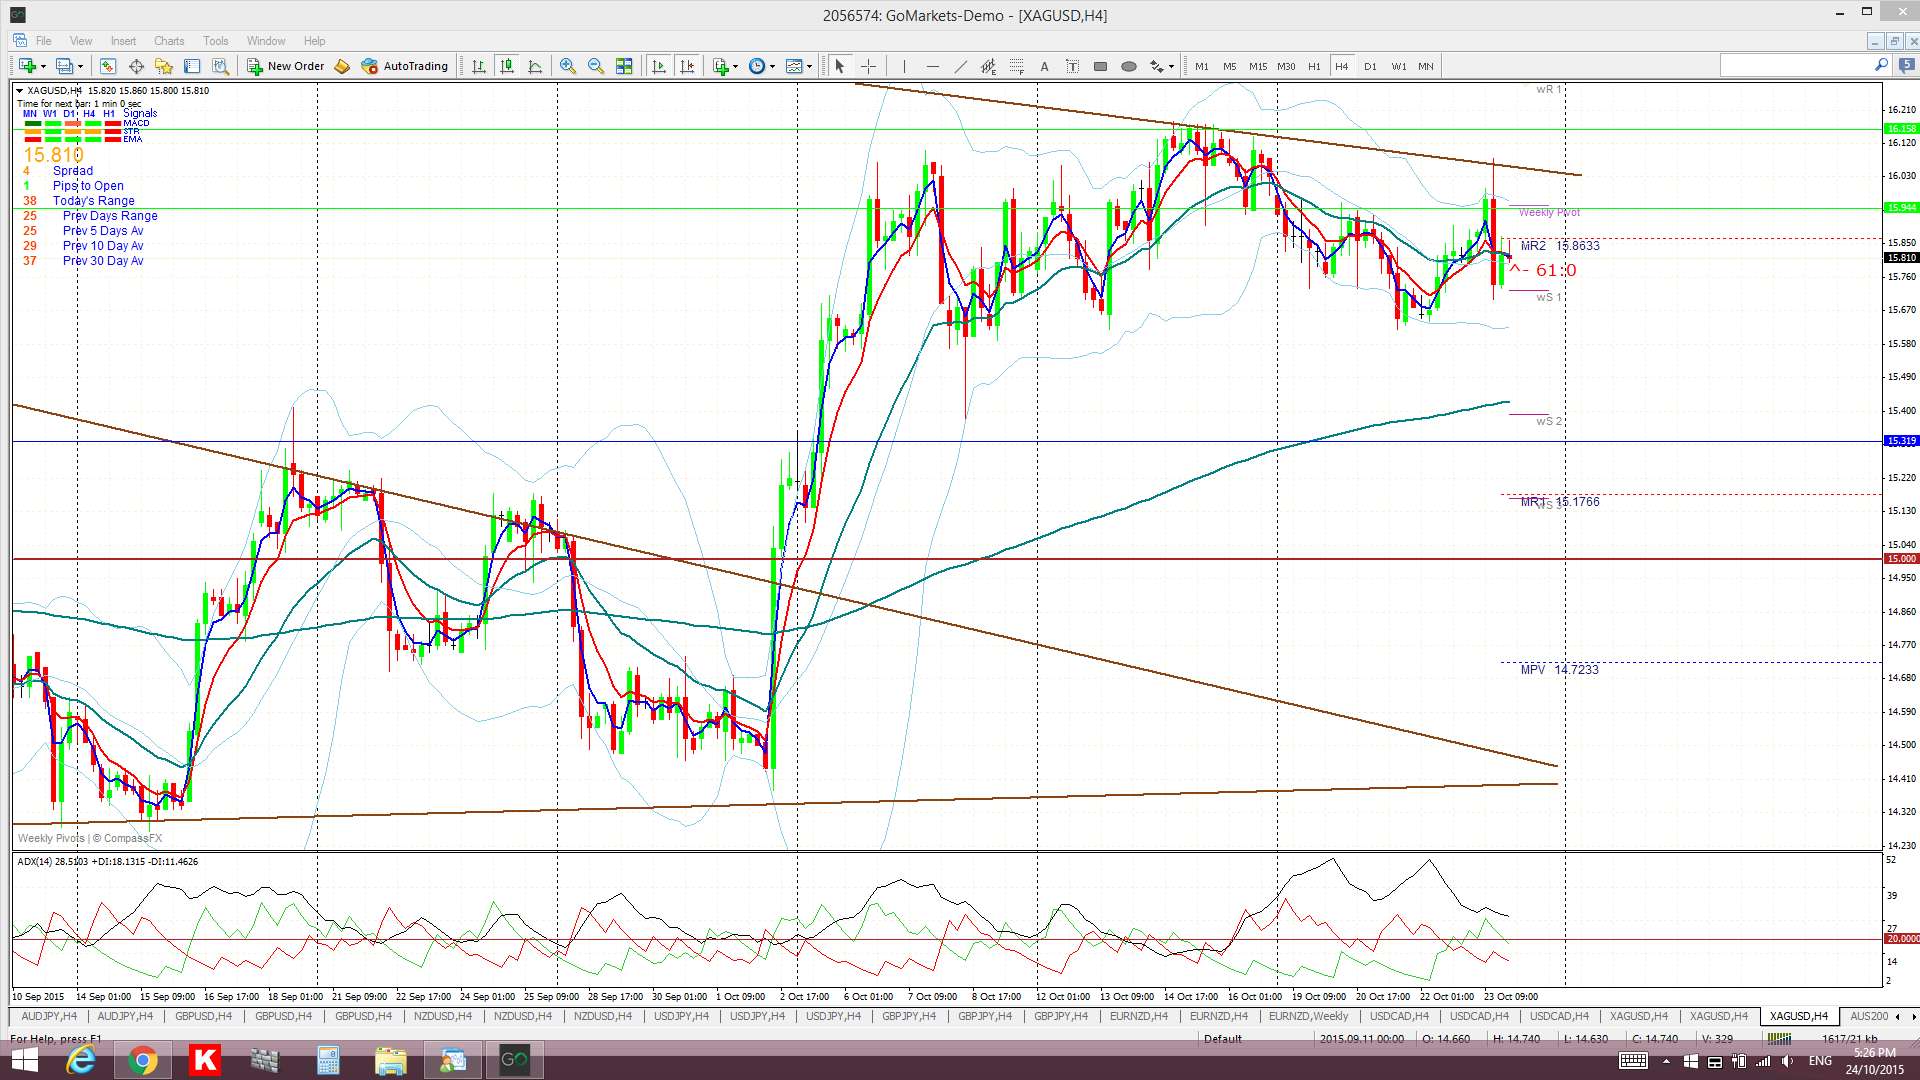
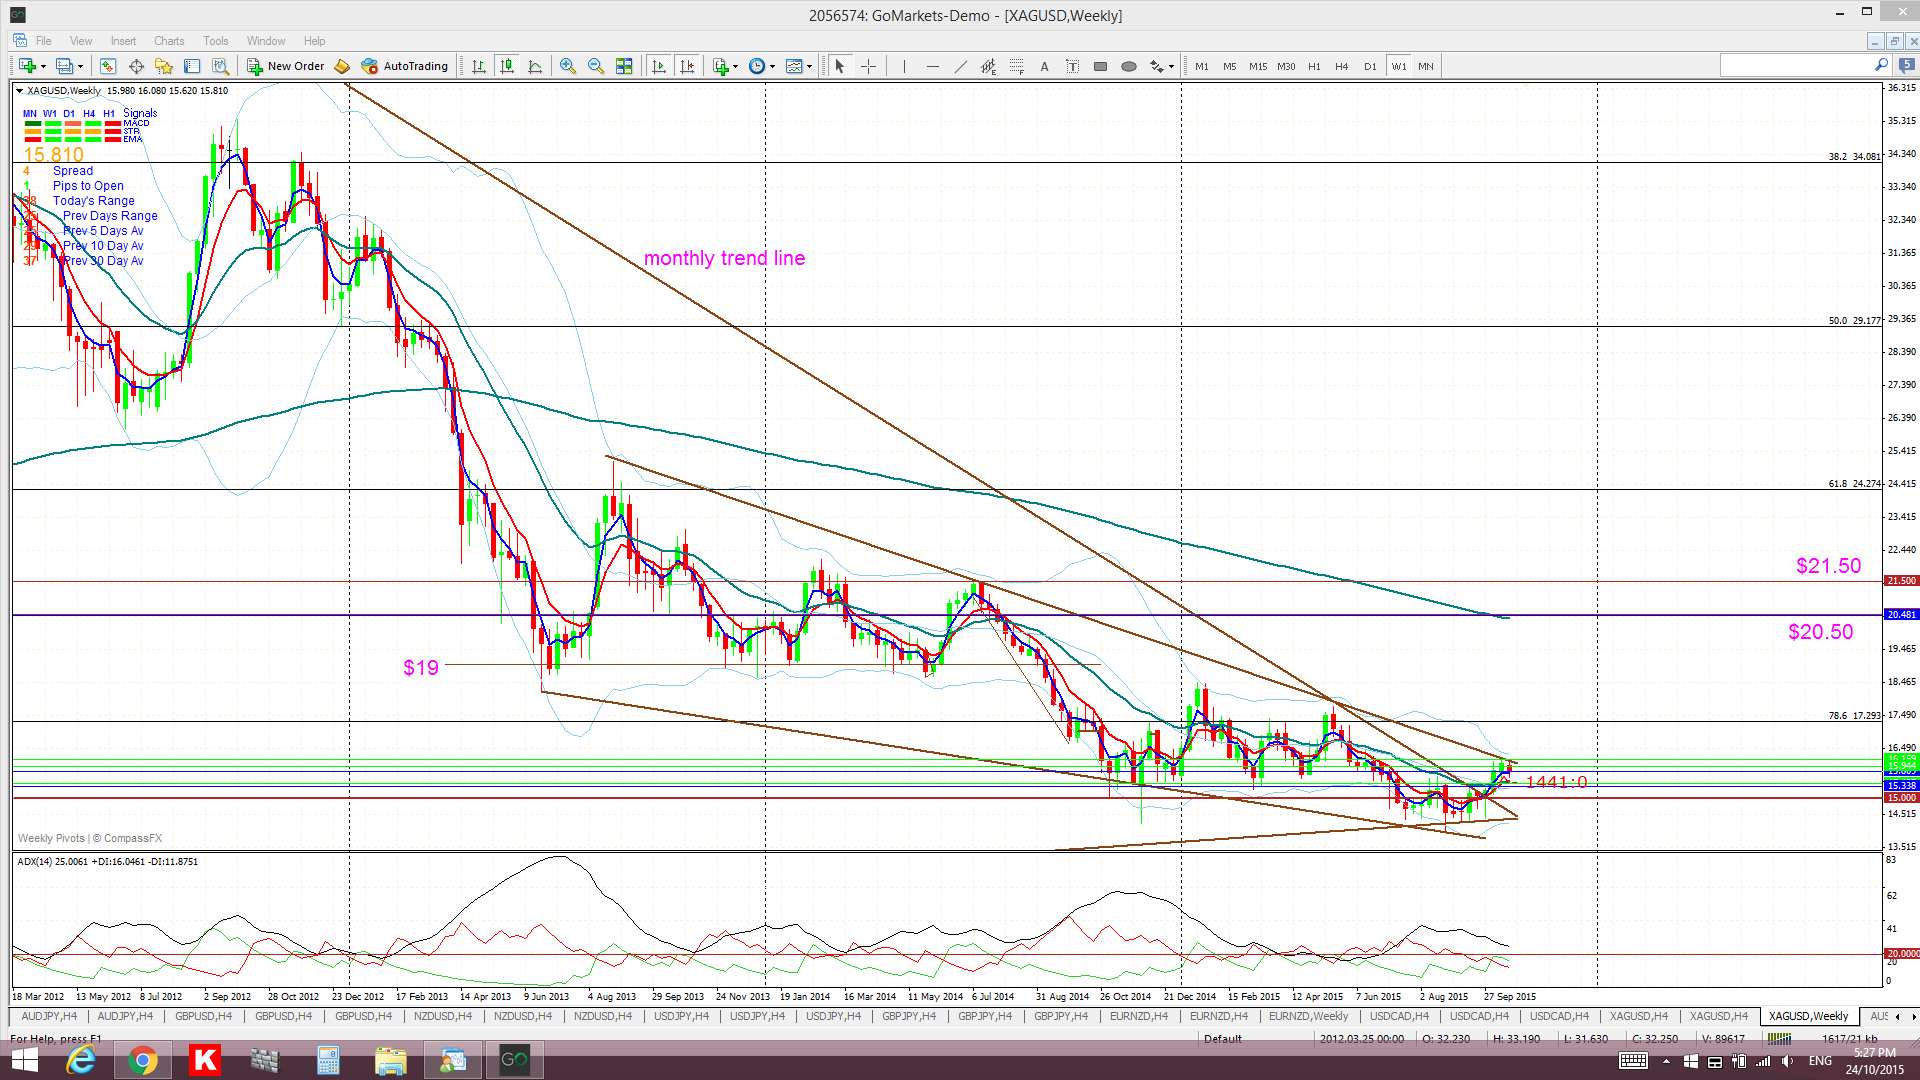
Silver: you get the feeling that this metal is preparing to launch higher as it is currently consolidating just below the upper trend line of a bullish descending wedge. FOMC might dictate fortune here though:
Gold: this is also consolidating in a channel under the $1,200 level and follows on from an earlier bullish wedge breakout. Like with Silver, FOMC might seal its fate:

The post It’s a huge week for FX with FOMC! appeared first on www.forextell.com.