The Kiwi has bounced higher following FOMC but is approaching a 9 month bear trend line that might determine which way it heads from here.
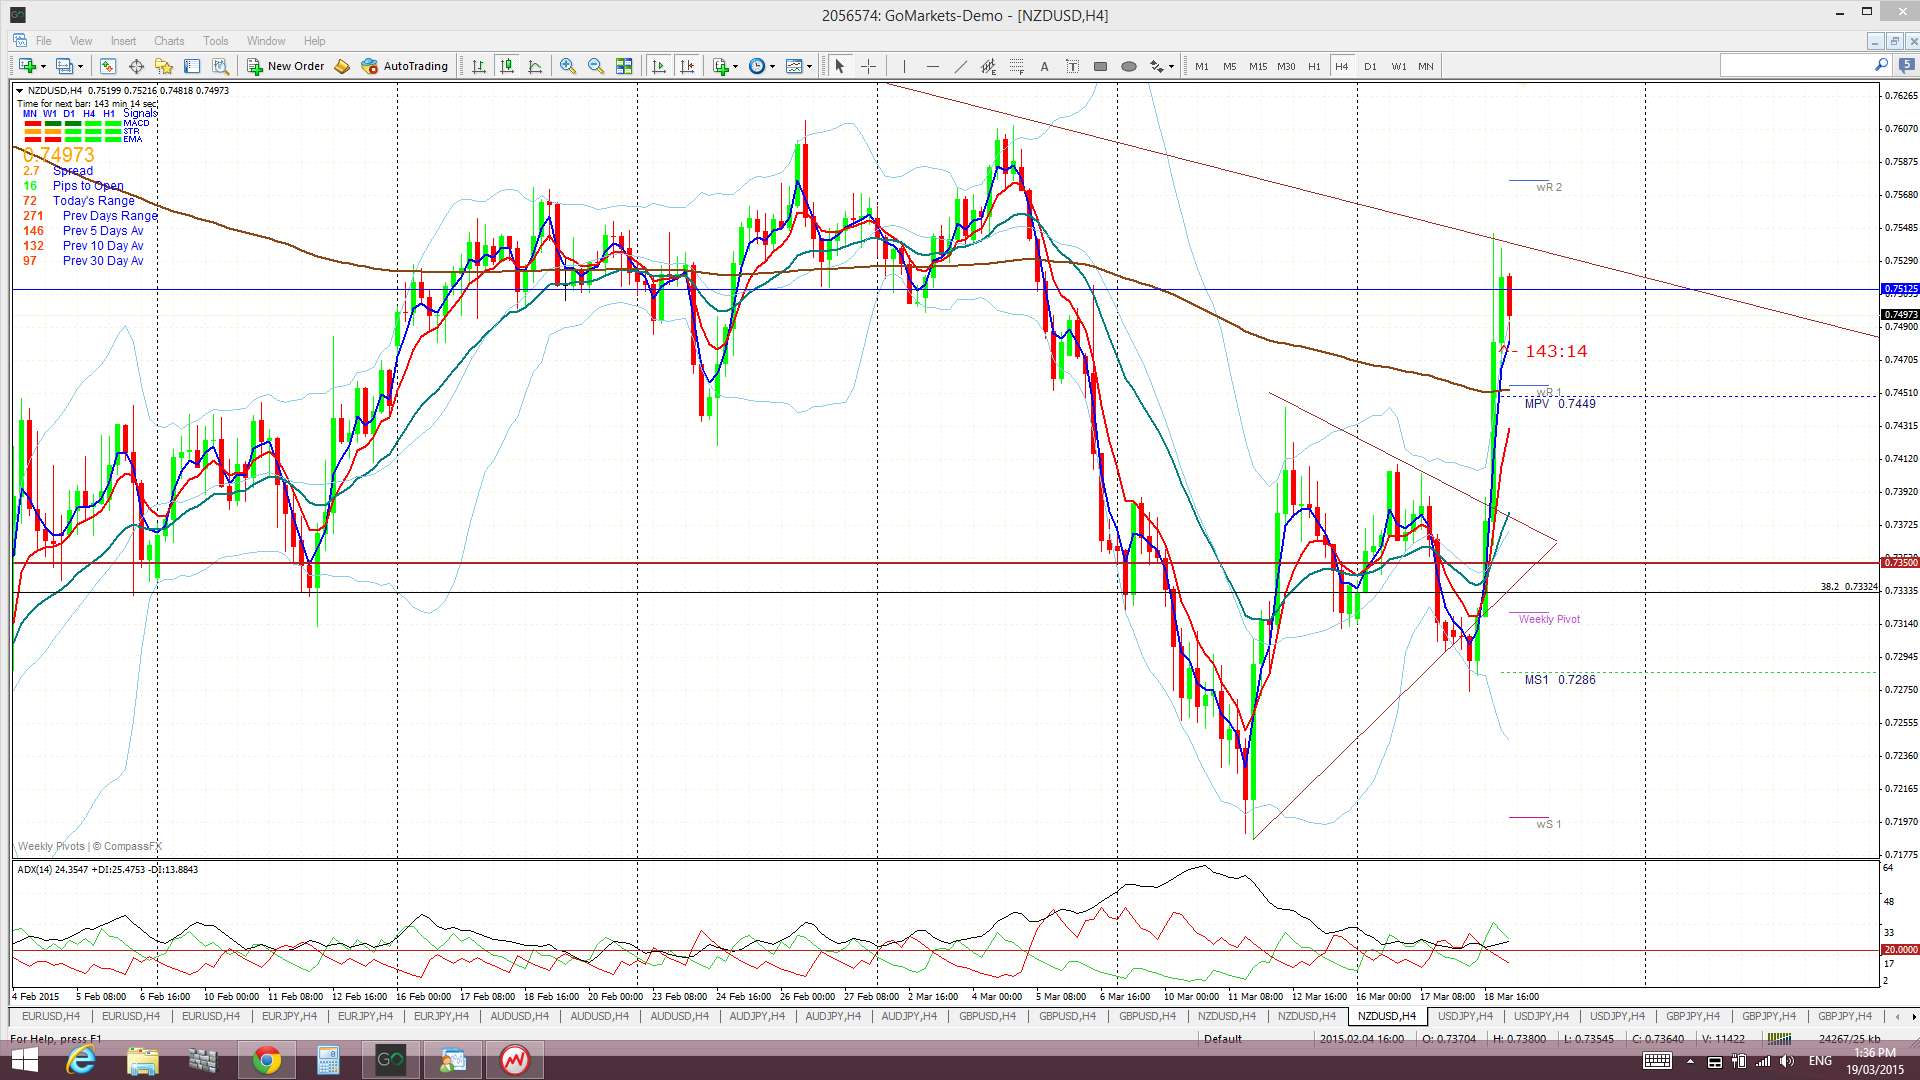
Kiwi 4hr: price rallied up and out from the 4hr chart’s triangle following FOMC but ran into the resistance of a daily-chart bear trend line:
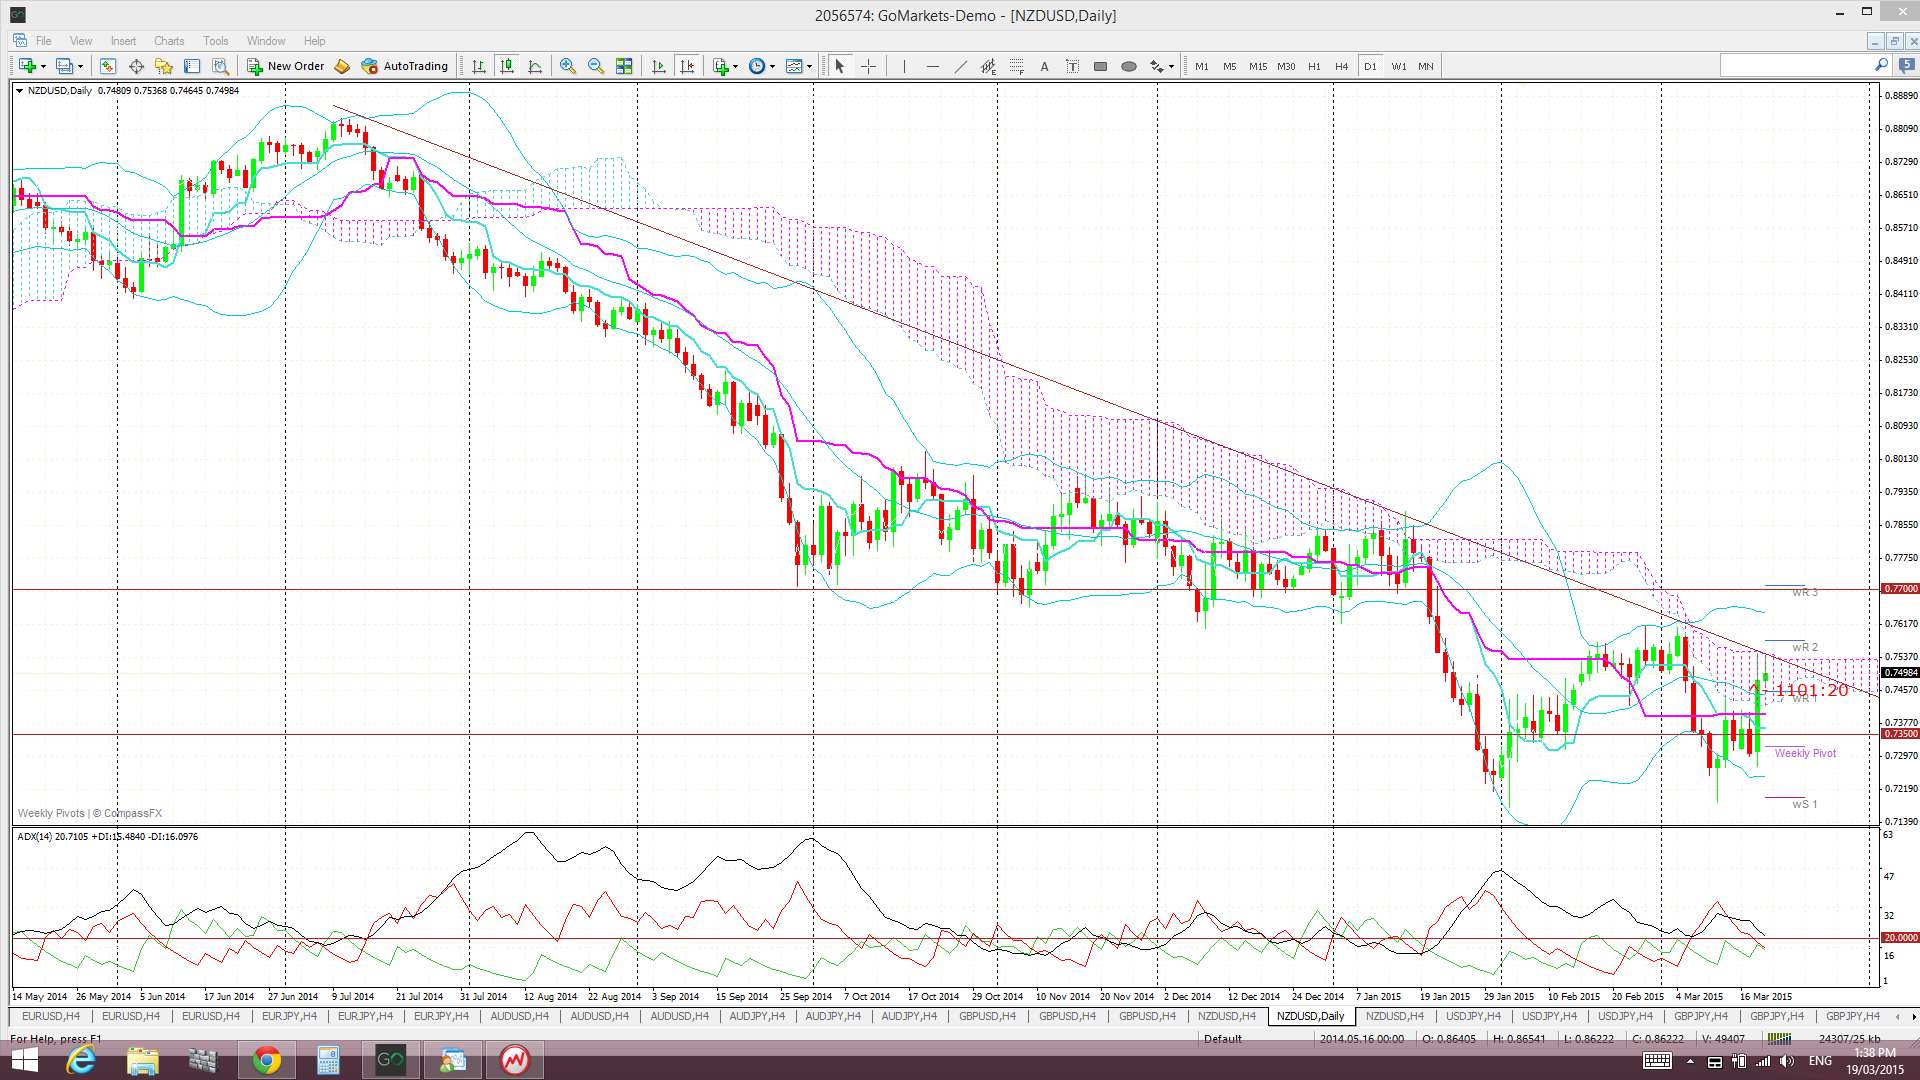
Kiwi daily: the daily chart shows how price has traded under a bear trend line for the last nine months. A break and hold above this trend line would suggest bullish continuation but respect would suggest more of the same, that is, lower:

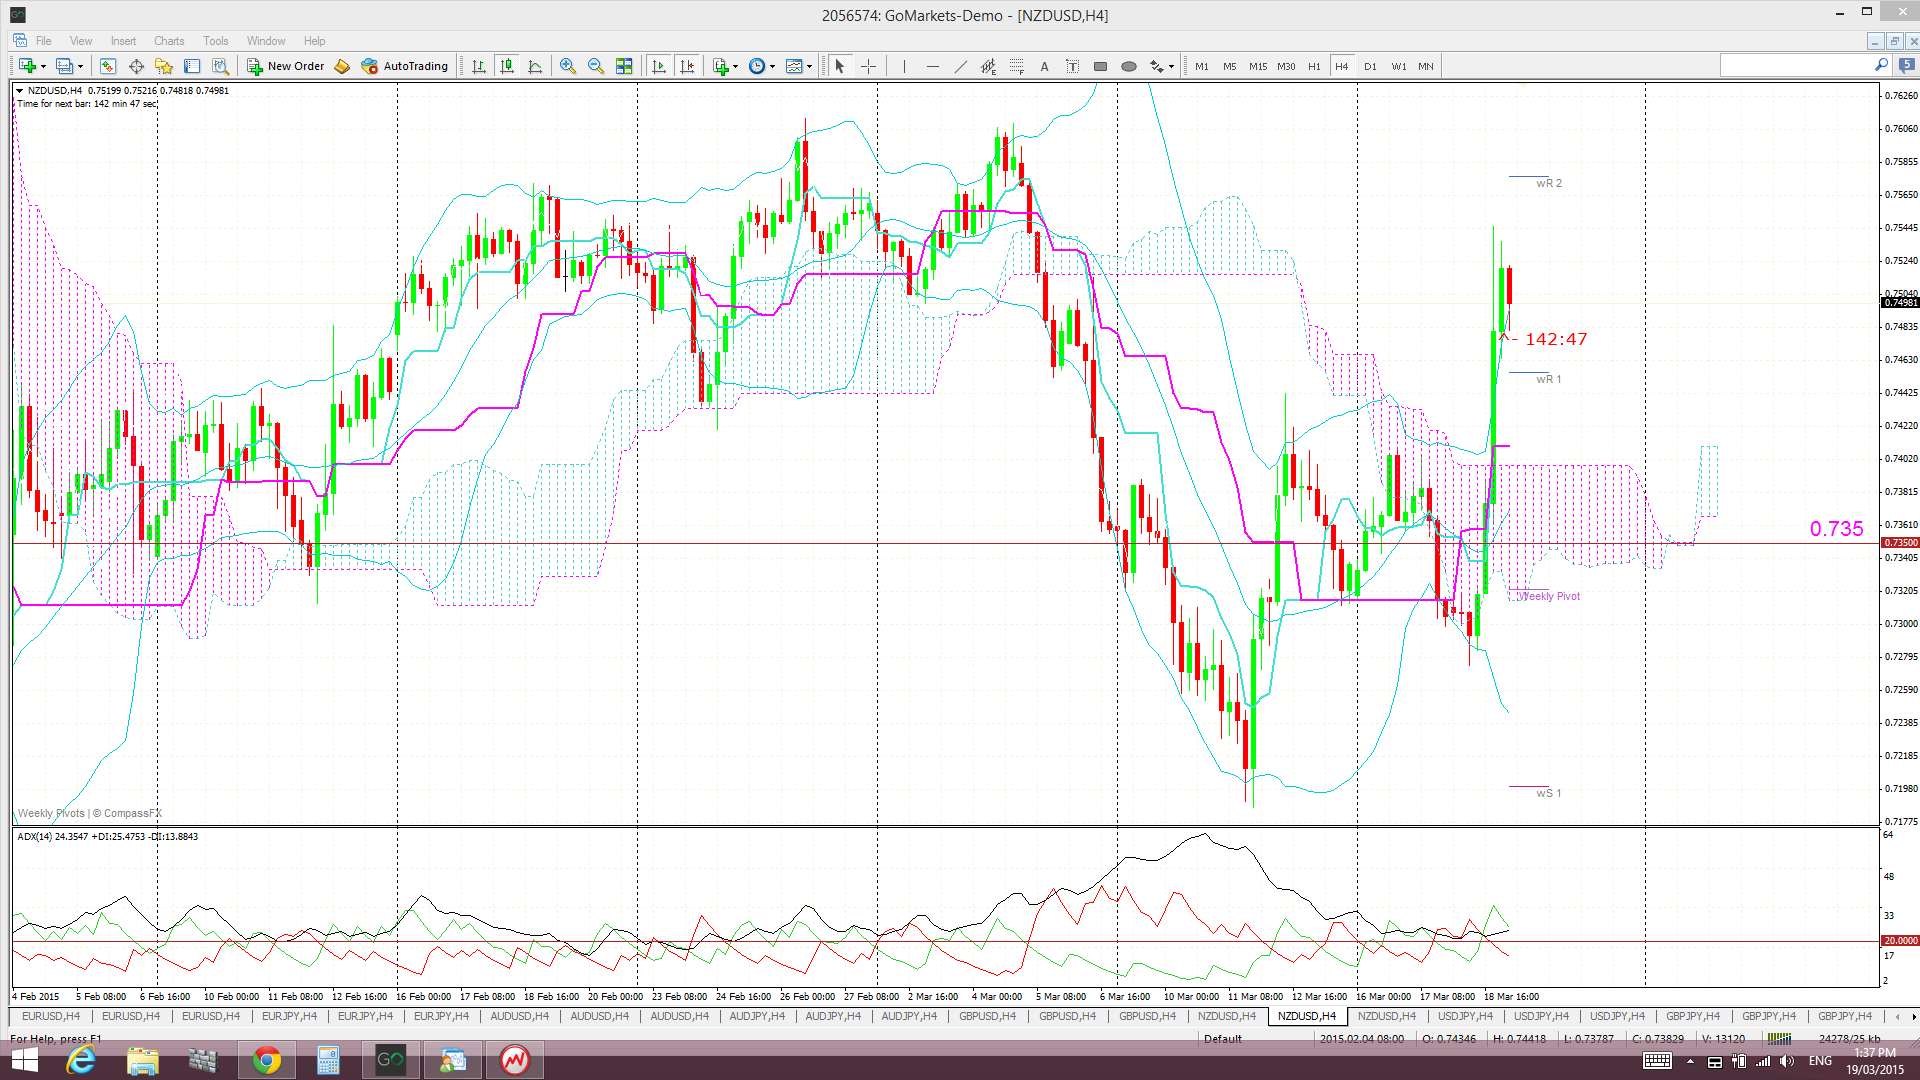
Kiwi 4hr Cloud: price is above the 4hr Cloud again. Nothing too exciting here:
Kiwi daily Cloud: it is the daily Cloud chart that is of more interest though. Note how the daily bear trend line intersects with the top of the daily Cloud. Thus, any break and hold above the bear trend line would have the added support of a bullish Cloud breakout. Not something to ignore!
 Summary: The Kiwi has made a significant move following FOMC but the next directional move is not clear just yet. Watch the daily chart’s bear trend line and daily Cloud for clues as to the next move:
- a daily candle close and hold above the bear trend line and daily Cloud would suggest further bullish follow through.
- a respect of the bear trend line and daily Cloud would suggest resumption of the previous downtrend.
The post Kiwi post FOMC: levels to watch. appeared first on www.forextell.com.