Last week: Last week was another great week for trading trend line breakouts that evolved following increased momentum with the pip tally for monitored moves passing 2,900. All of the relevant charts were posted FREELY on this site, well in advance, and were accompanied with commentary about levels to watch for any potential breakout move. There are more chart patterns to monitor in this FOMC week and this post contains charts and commentary to help traders to identify candidates for any momentum-based breakout move.
The tally for breakout trades last week is as follows with many patterns having been originally posted last w/e.
- Oil: 140 pips (now closed).
- USD/CNH: 250 pips (now closed).
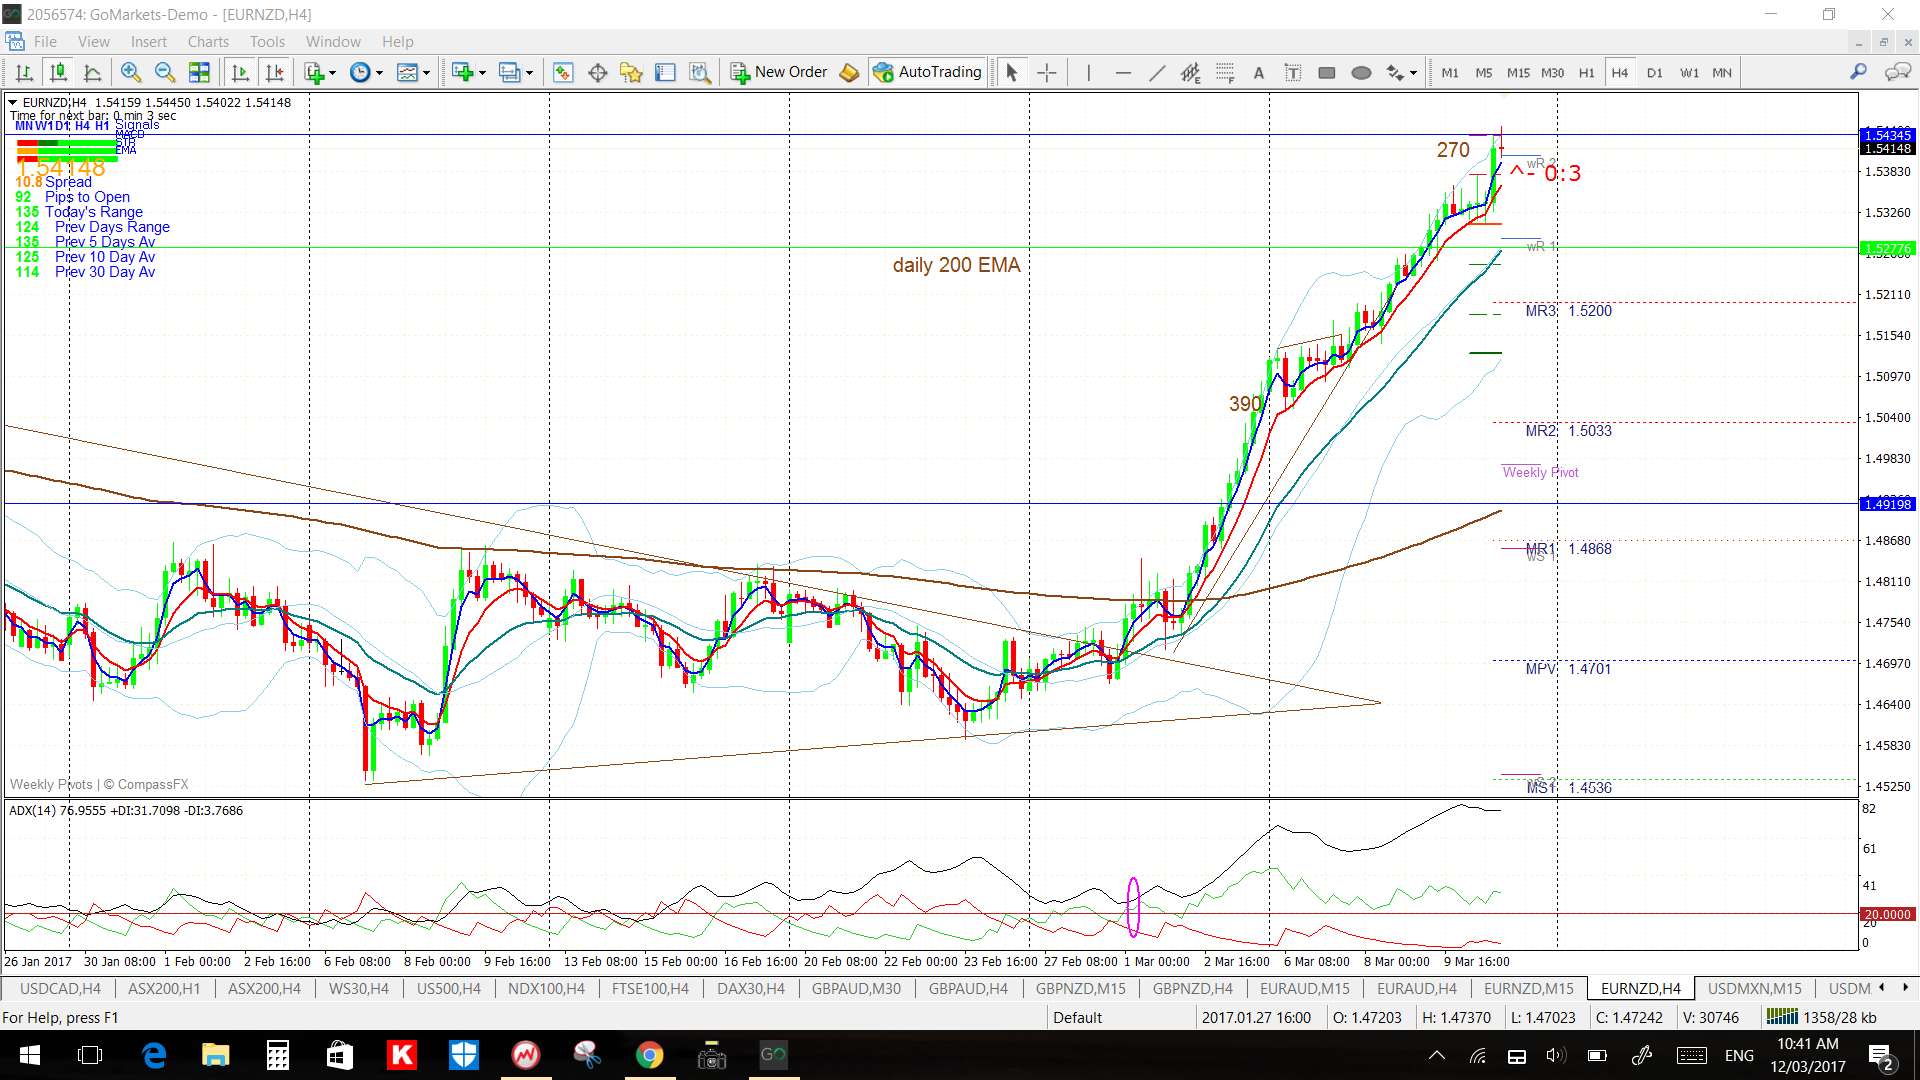
- EUR/NZD: 270 pips.
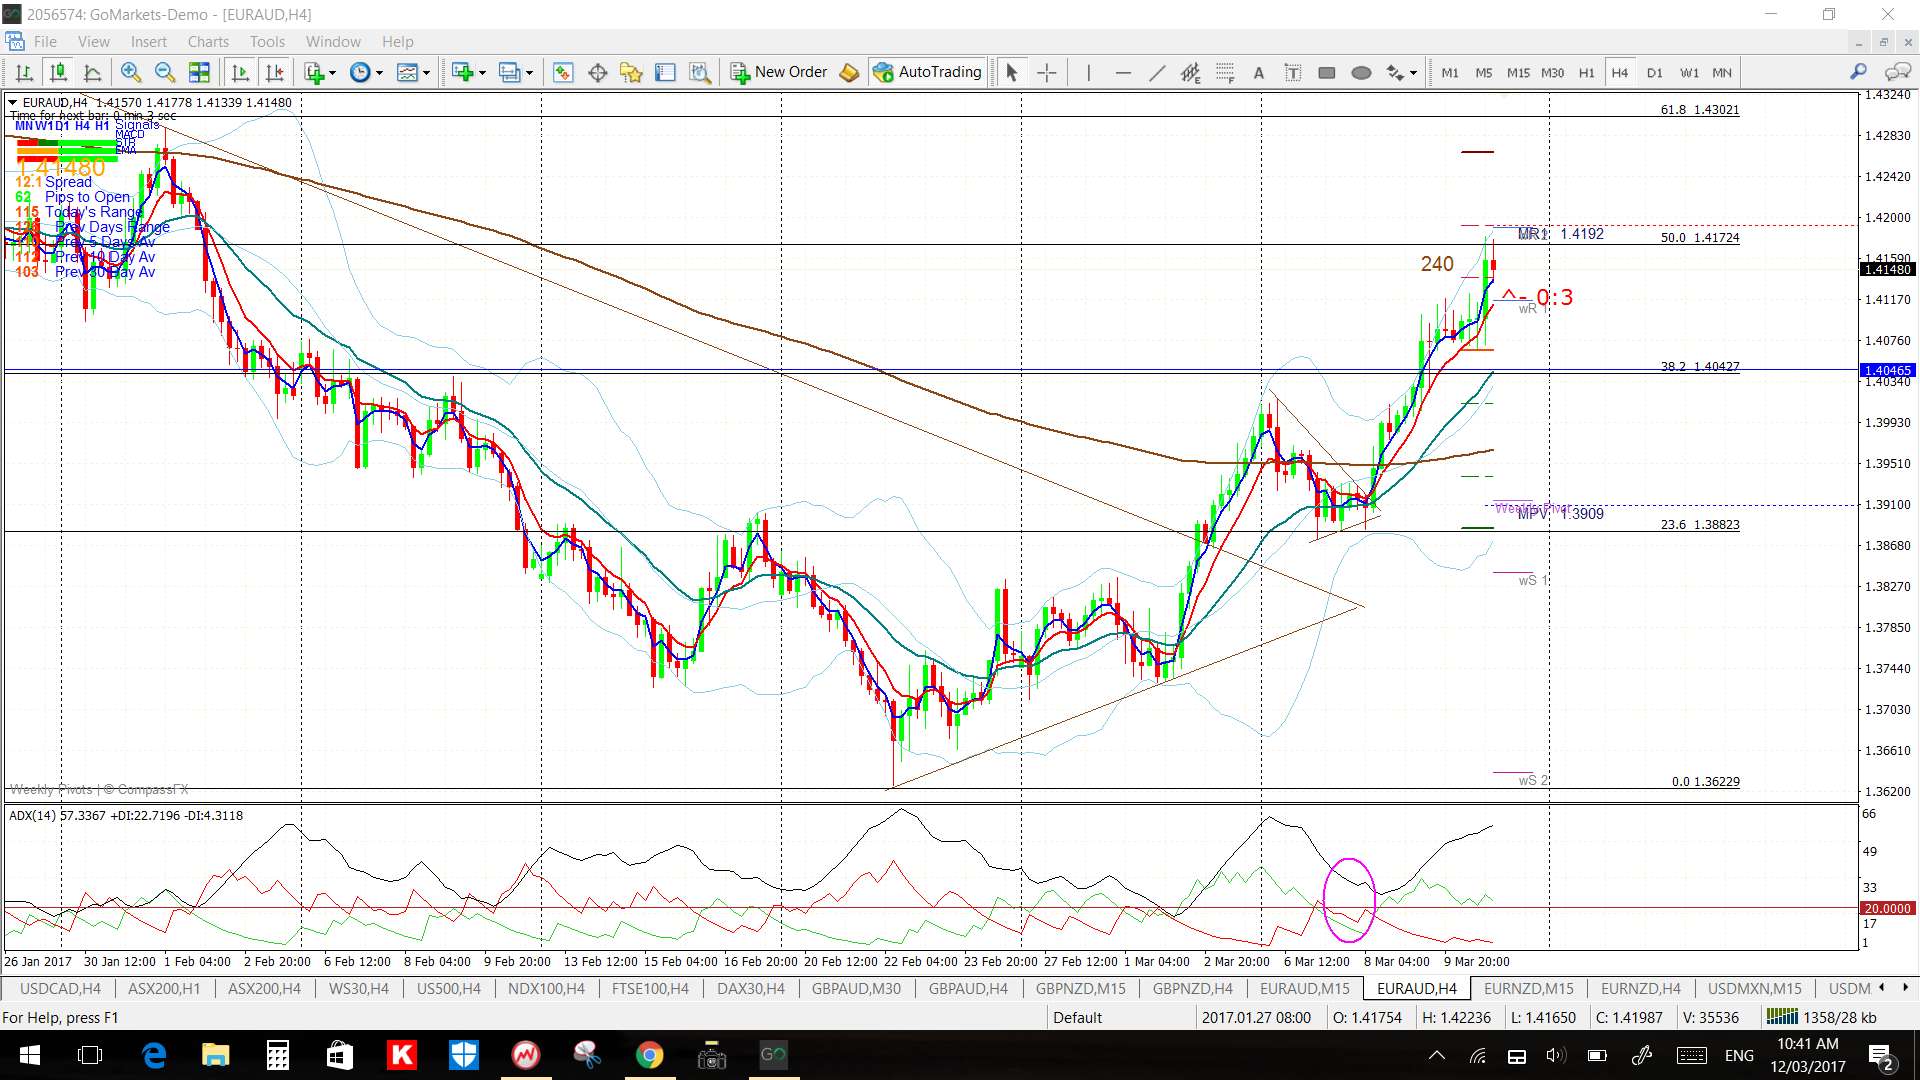
- EUR/AUD: 240 pips.
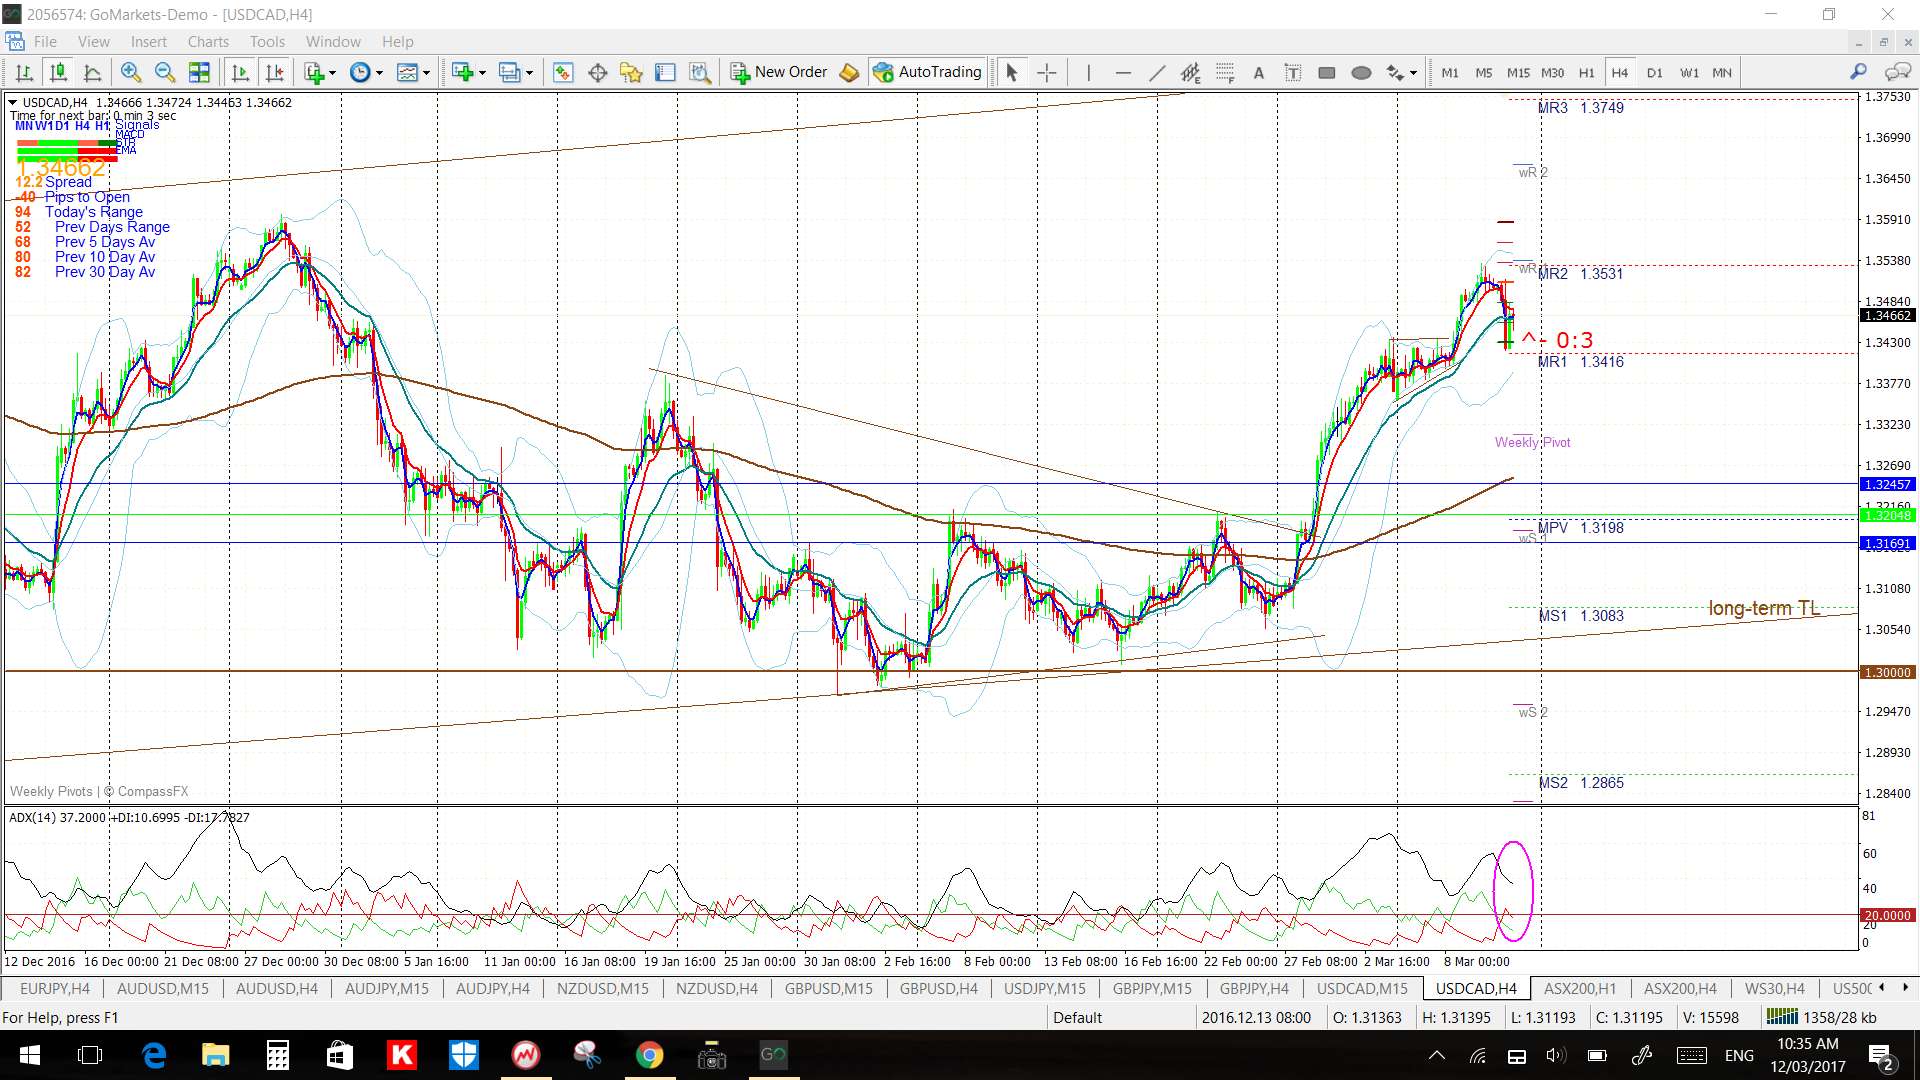
- USD/CAD: 90 pips.
- GBP/NZD: 140 pips.
- NZD/USD: 60 pips.
- AUD/USD: 70 pips.
- USD/MXN 1,300 pips.
- USD/JPY: 70 pips.
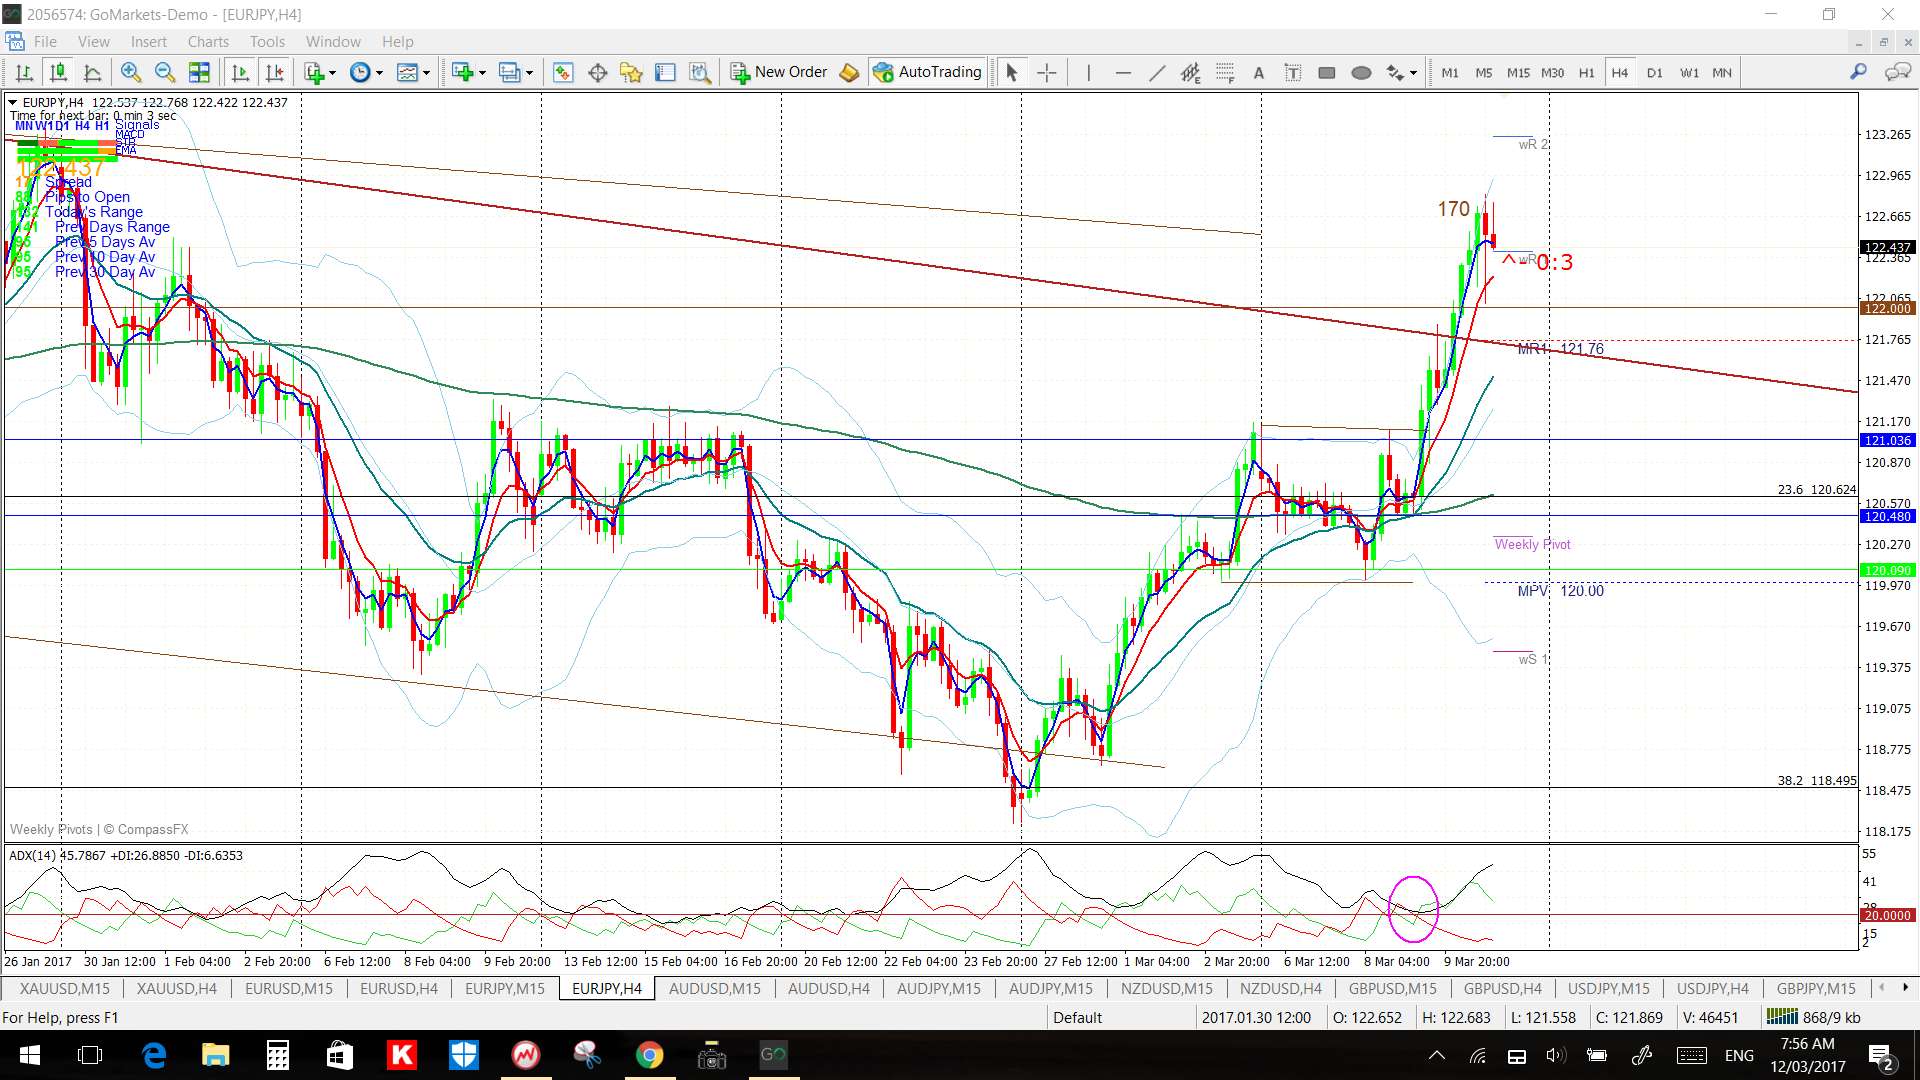
- EUR/JPY: 170 pips.
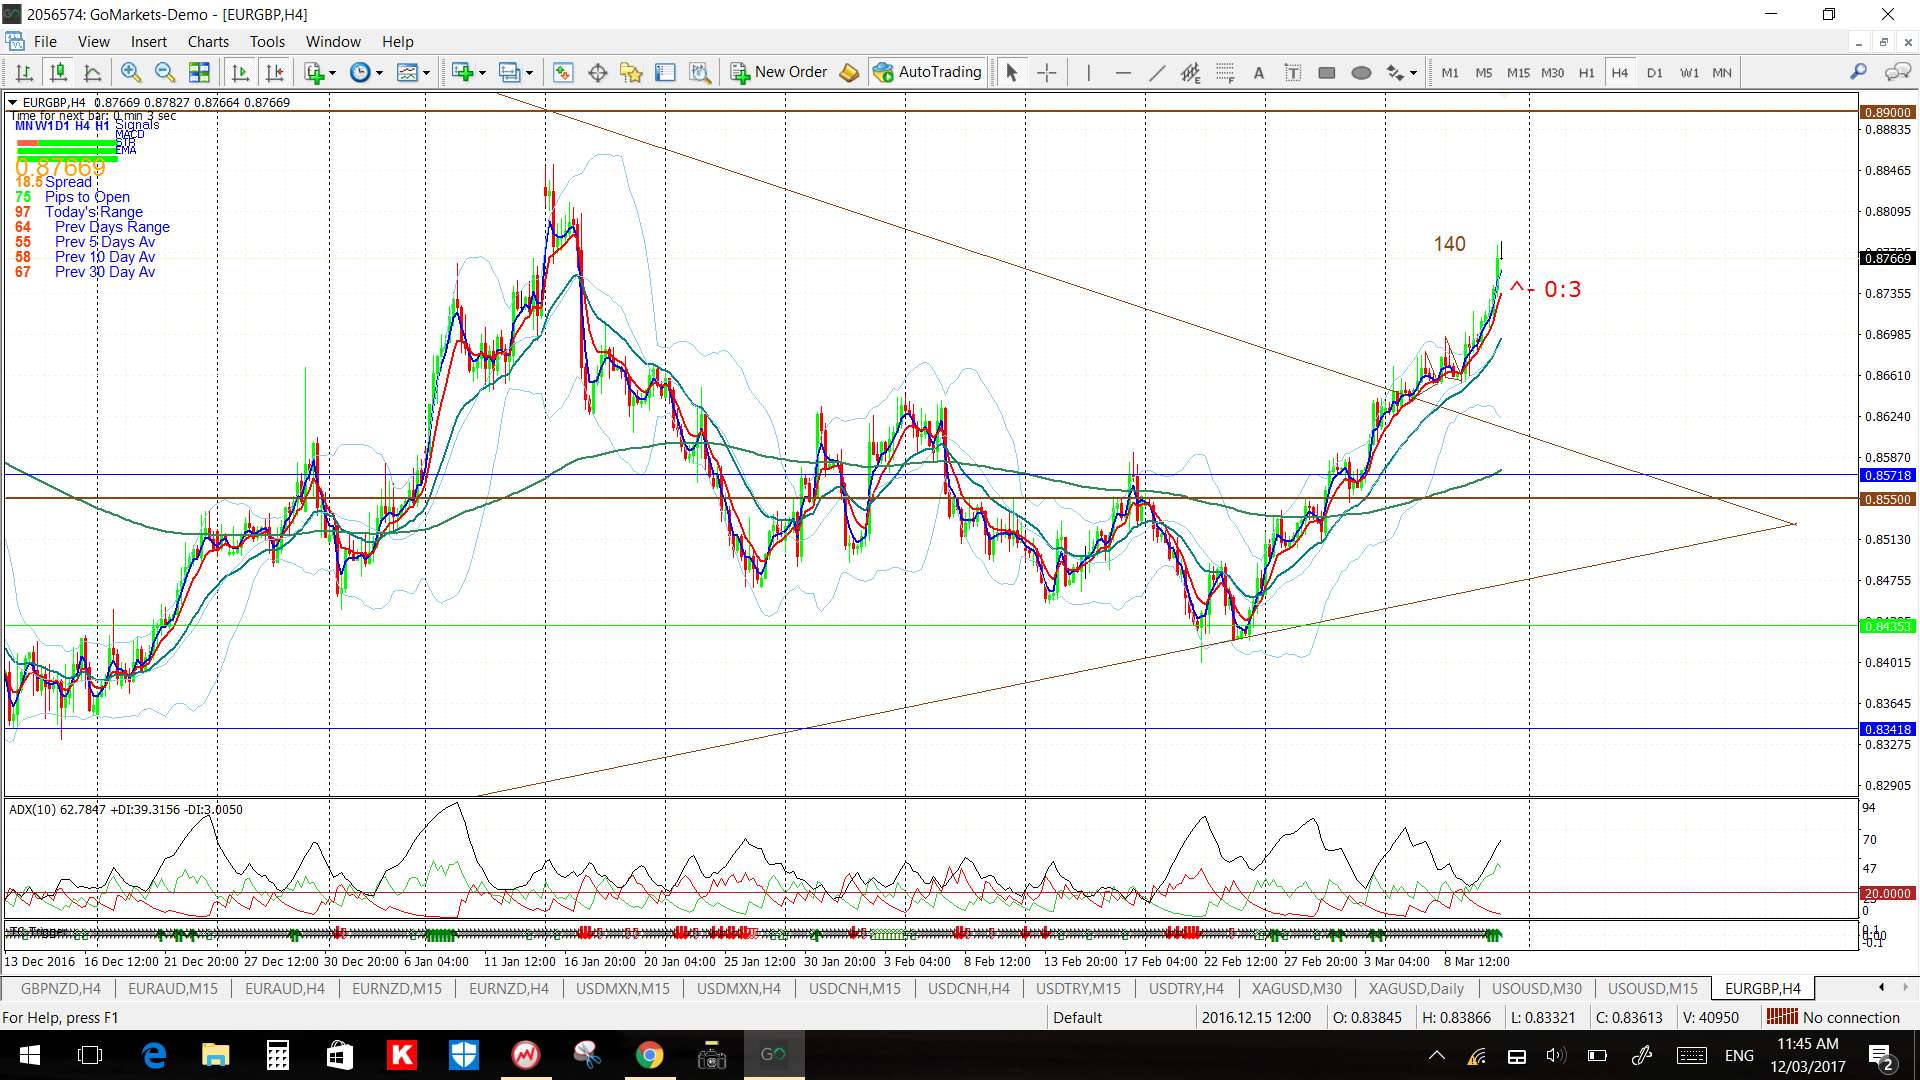
- EUR/GBP: 140 pips
TC Trigger: I posted an article about how I use my TC Trigger indicator last week and this can be found through the following link.
Next week:
- Dutch election: this will be a closely watched event to see what inroads Far-Right sentiment has made in what was once lauded a most racially tolerant country. This is especially pertinent ahead of the looming French and German elections.
- Central Banks: it is a busy week with four Central Banks reporting interest rate updates next week: FOMC on Wednesday and BoJ (JPY), SNB (CHF) and BoE (GBP) on Thursday.
- US$: the US$ will be in greater focus next week with FOMC and a review of both FX indices can be found through this link.
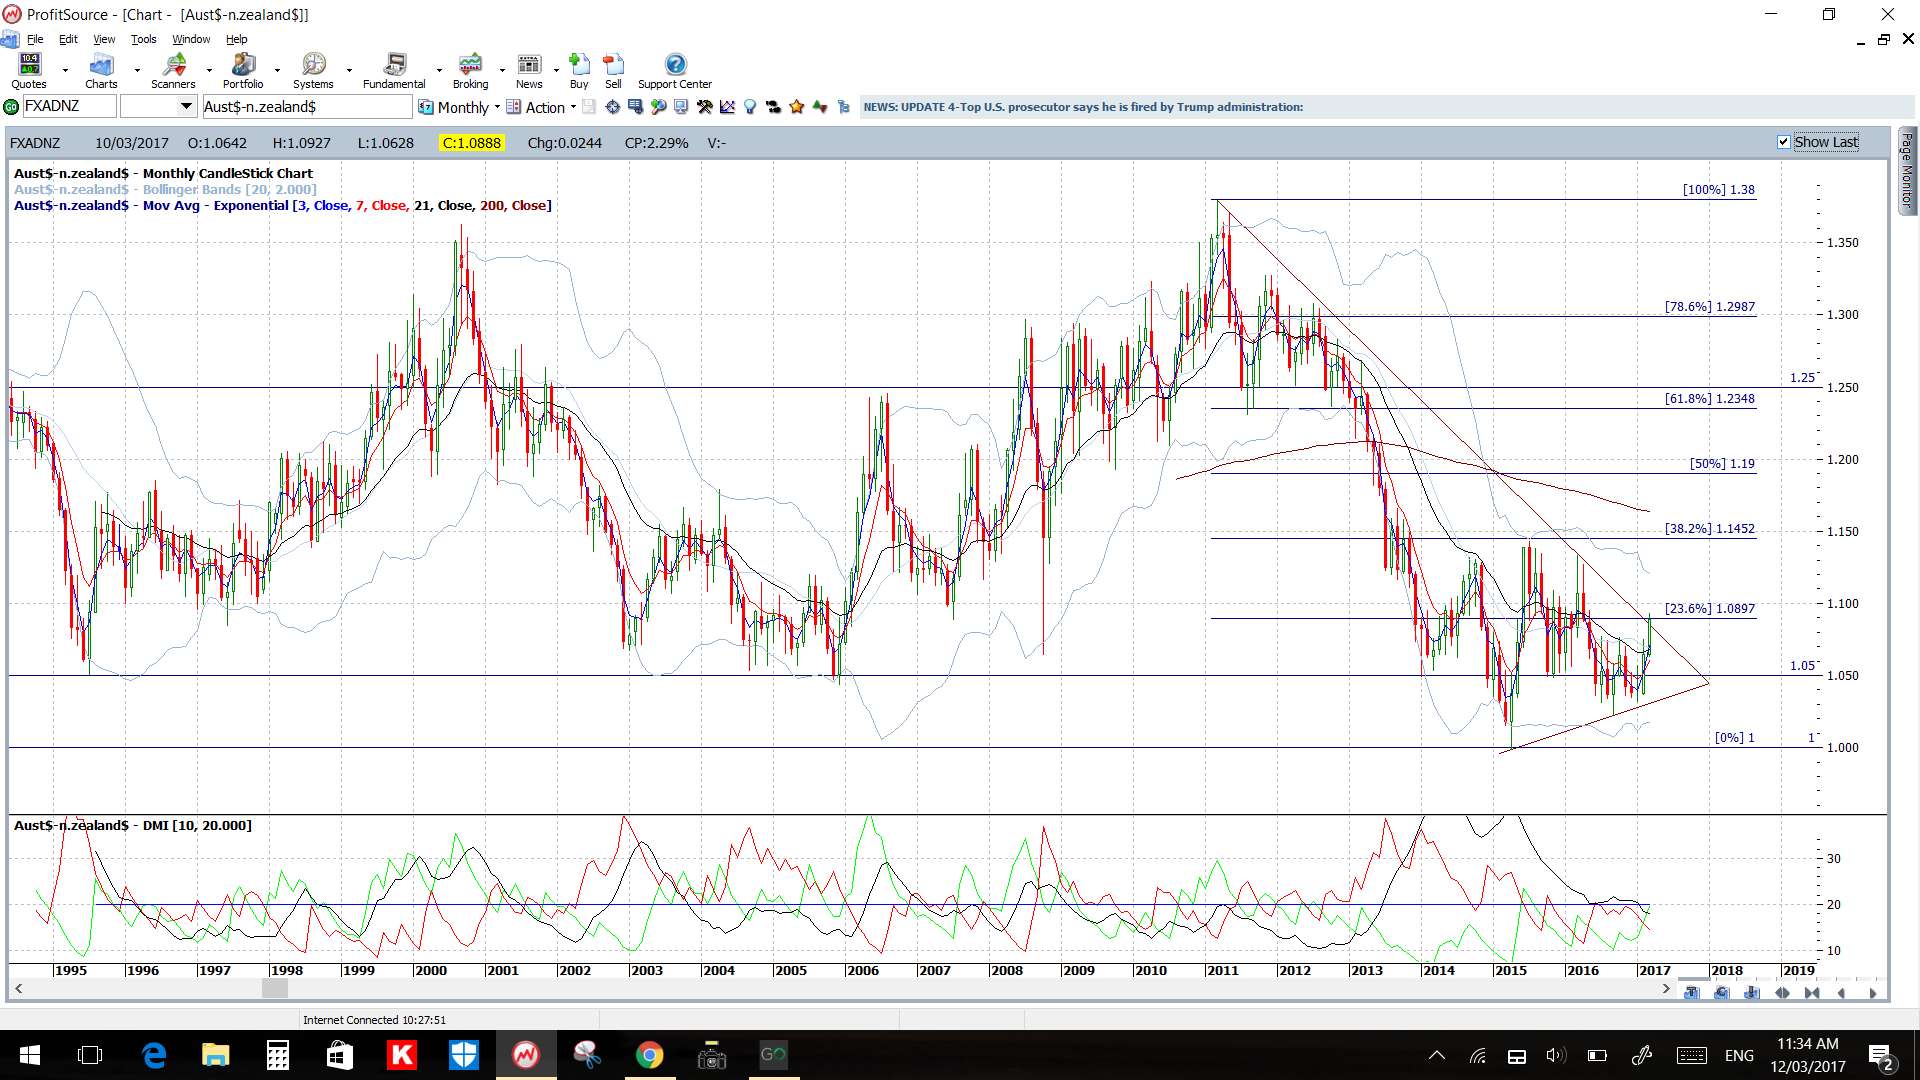
- AUD/NZD monthly: I’ve been tracking this triangle for some time now and there looks to be the start of a bullish triangle breakout. The month has a way to go just yet though but keep an eye on this time frame chart for any breakout move. The 61.8% fib of the last major swing low move is back up near previous S/R at 1.25 and would make an obvious target for any eventual bullish breakout move.
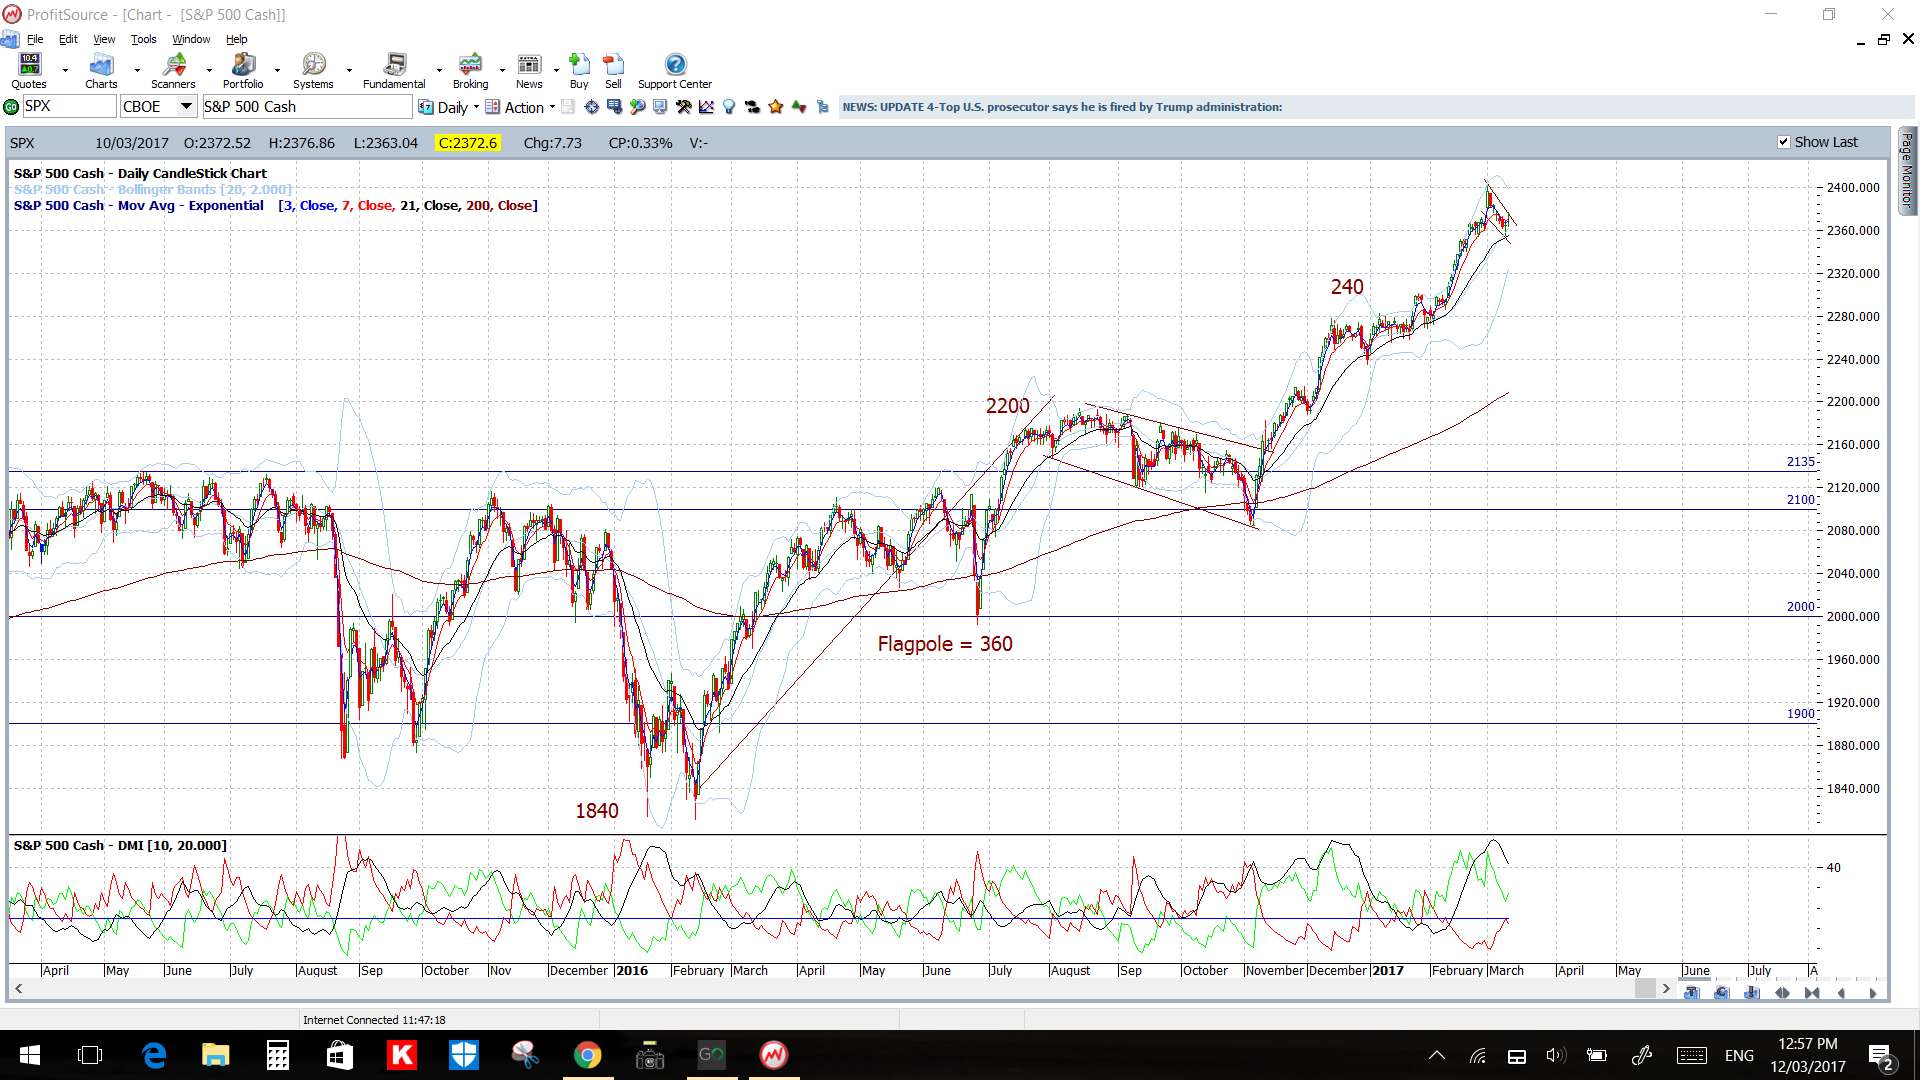
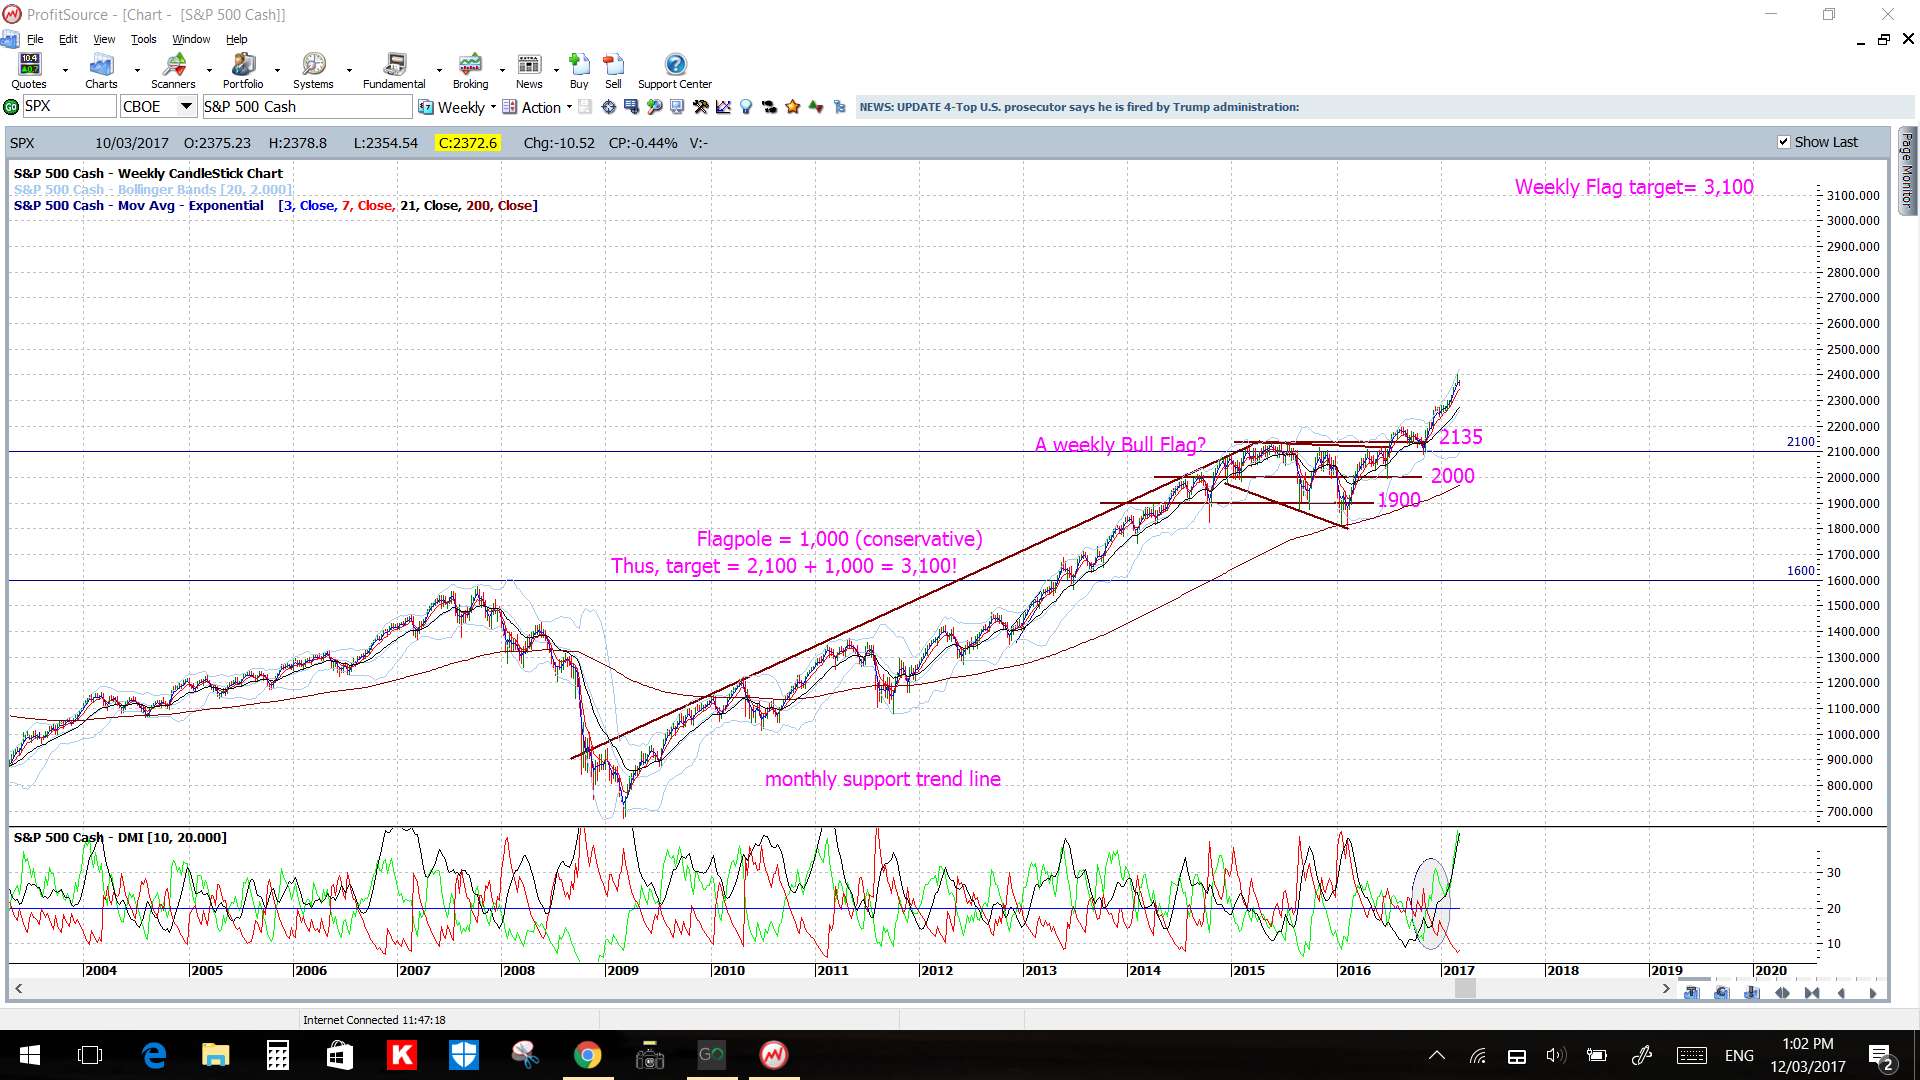
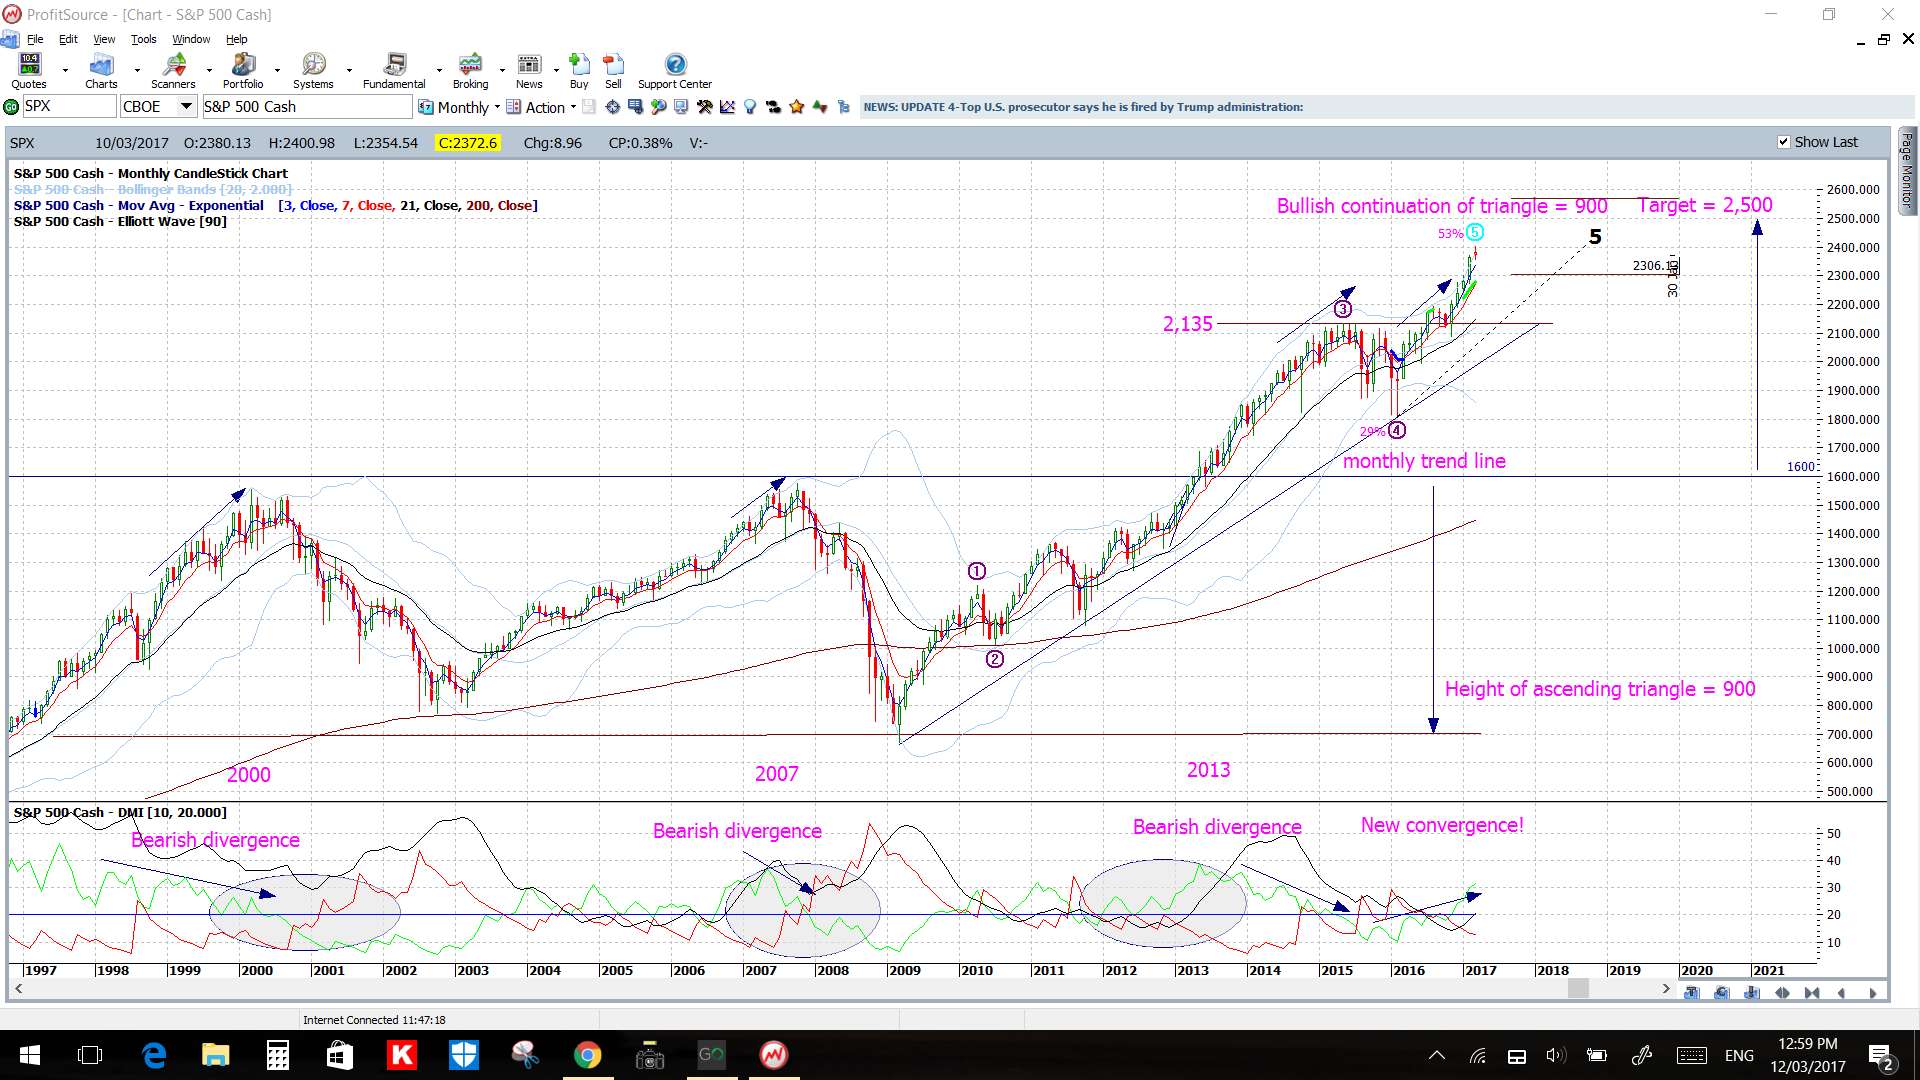
- S&P500: the daily chart Bull Flag wasn’t too far off the mark with the projected move suggesting 360 points and we’ve had around 240 to date. However, there is a Bull Flag on the larger time frame weekly chart too where the target is much more ambitious:
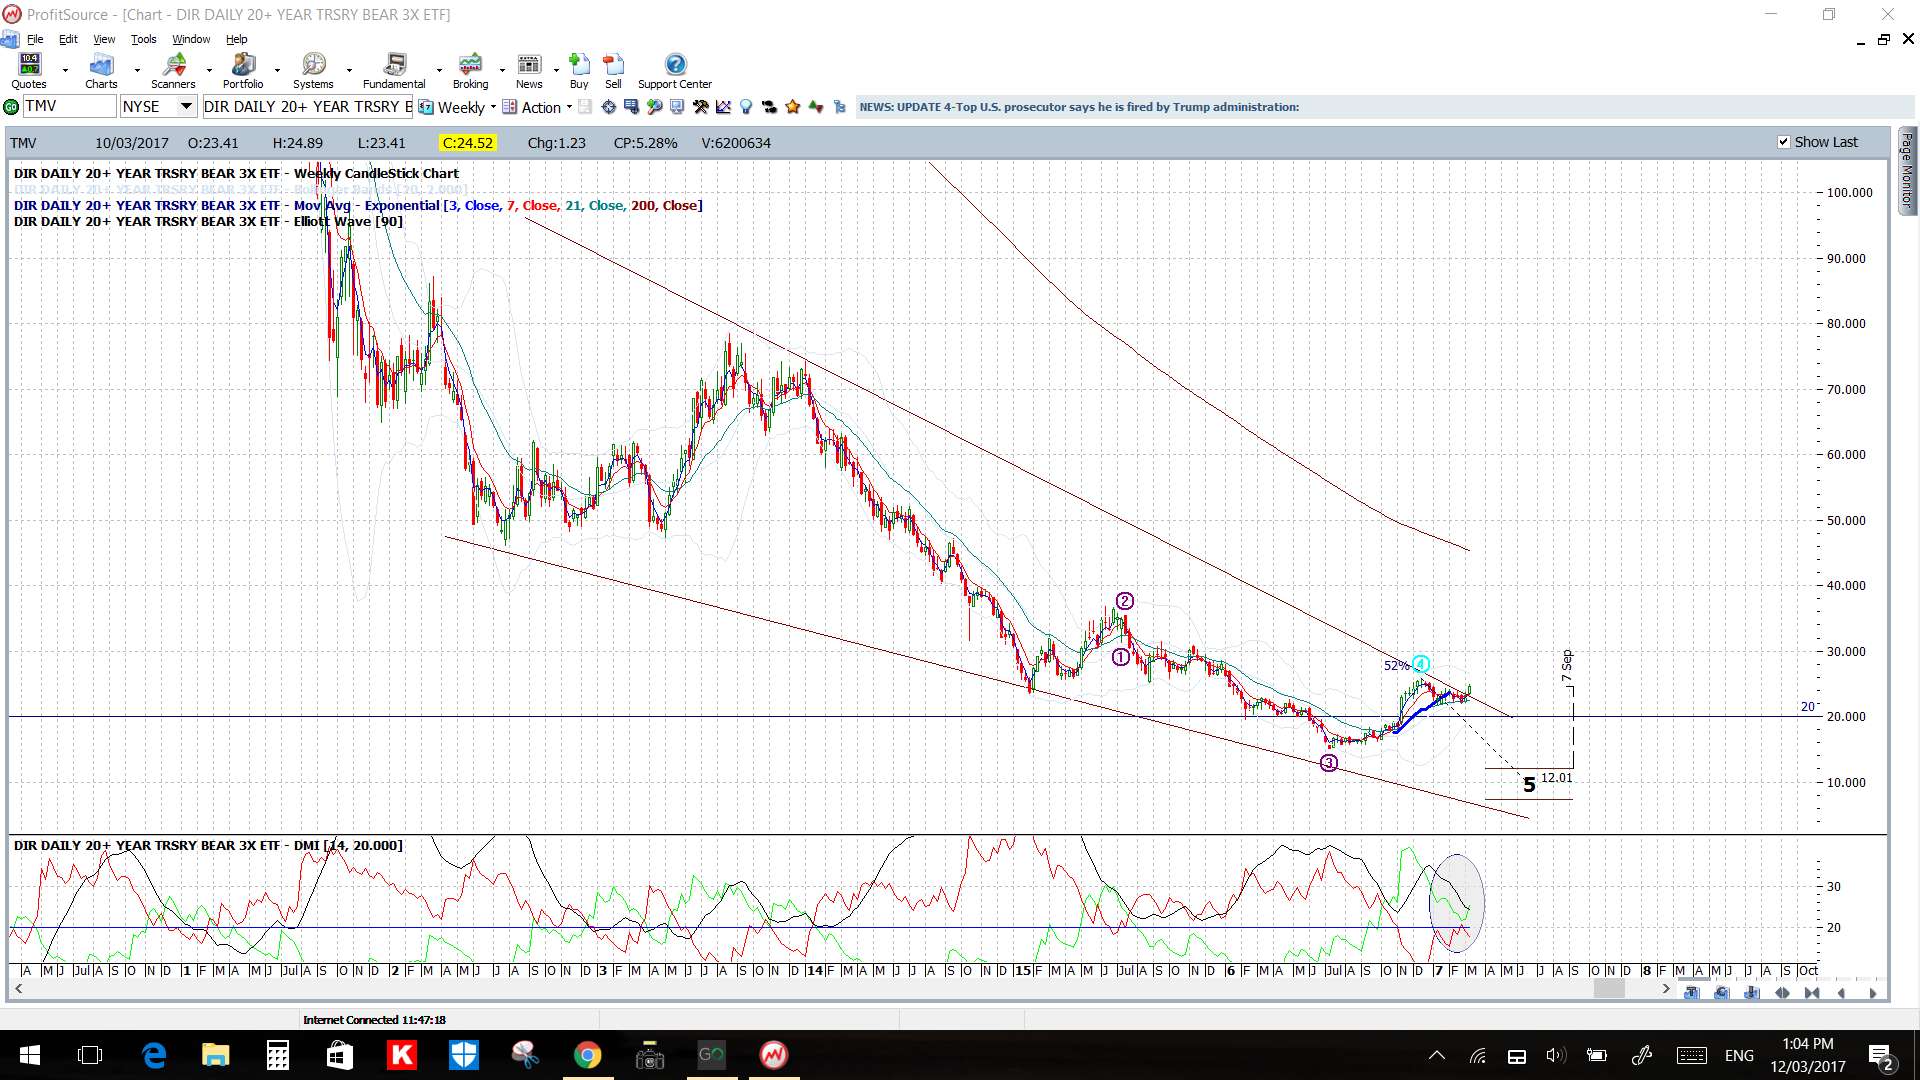
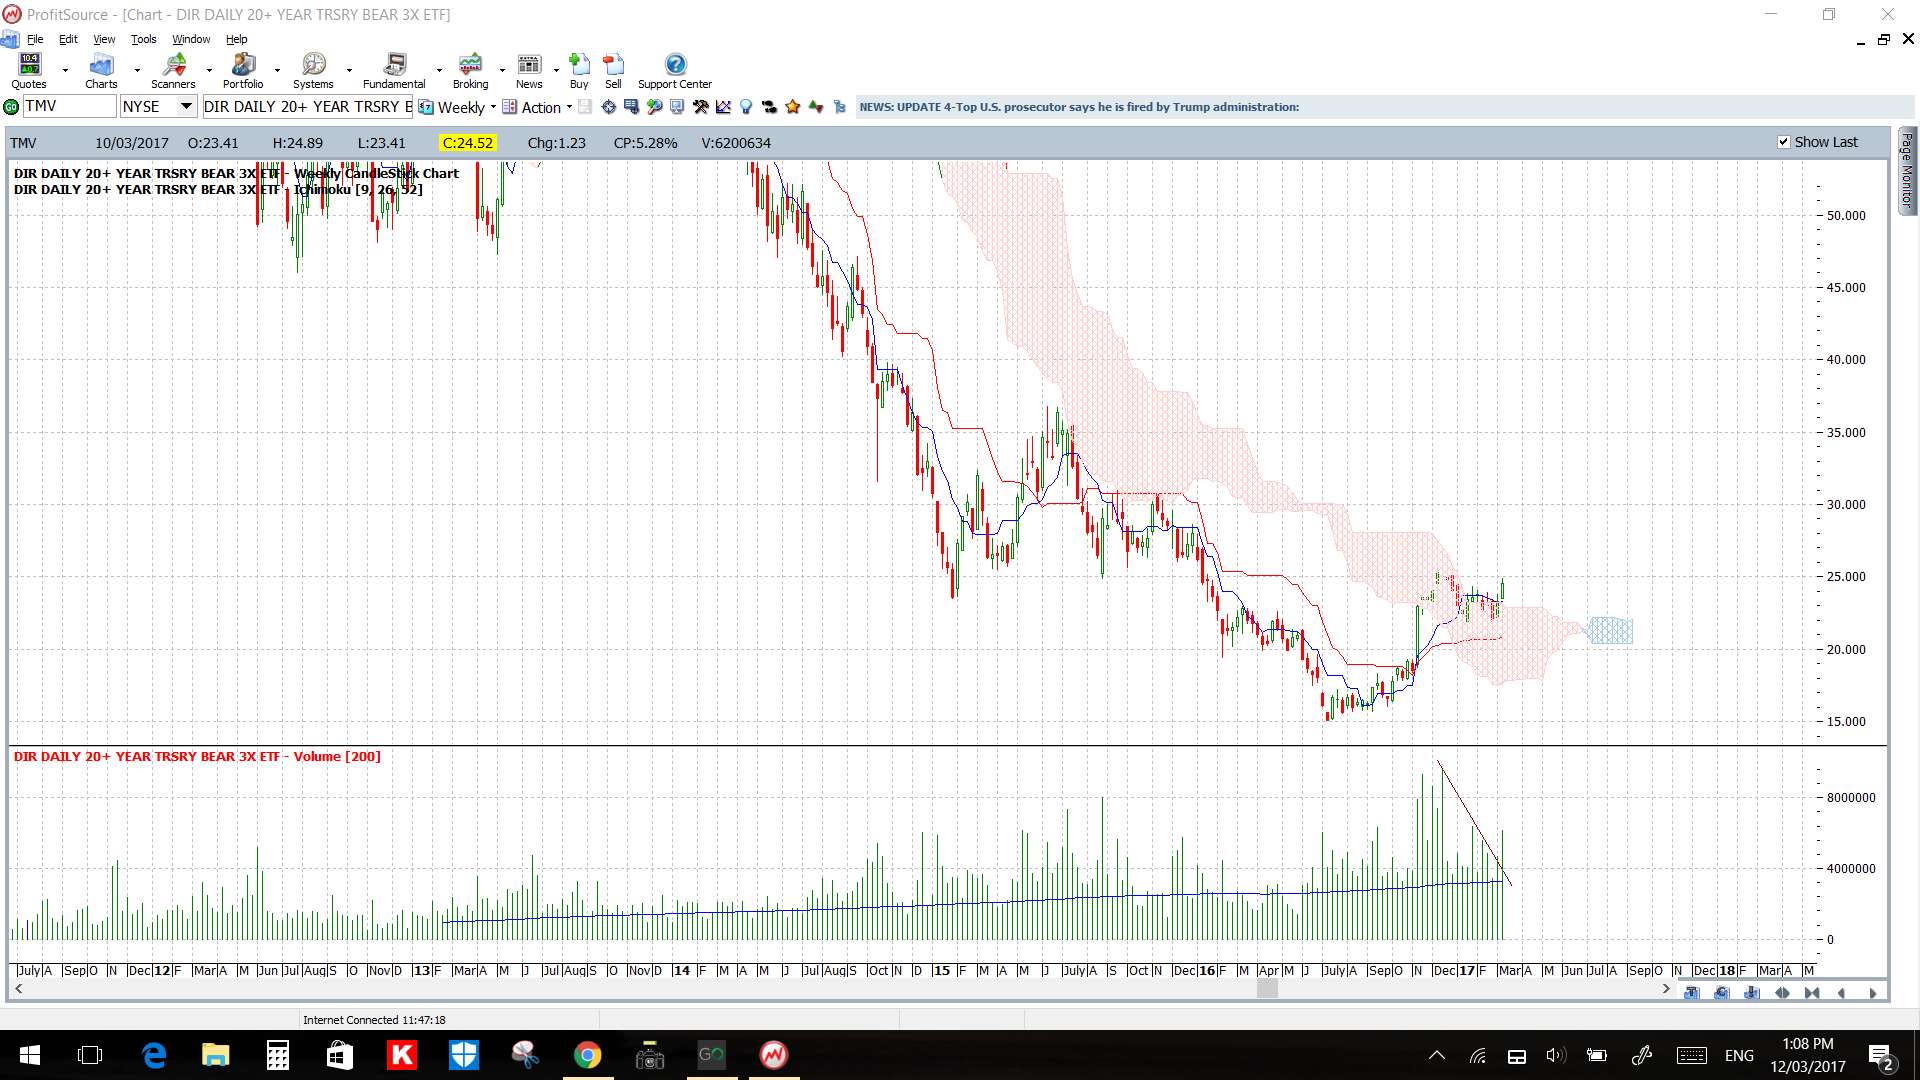
- US Bonds: With a US rate hike anticipated from this week’s FOMC the TMV ETF breakout suggests this could be bearish for Bonds. Note the trend line, Ichimoku Cloud and Volume breakout:
Calendar:
- Mon 13th: JPY PPI. EUR ECB President Draghi speaks.
- Tue 14th: CNY Industrial Production. USD PPI.
- Wed 15th: Dutch election. GBP Employment data. USD CPI, Retail Sales, Crude Inventories, FOMC & FOMC Press Conference.
- Thurs 16th: NZD GDP. AUD Employment data. JPY BoJ Monetary Policy Update. CHF SNB Monetary Policy Update. GBP BoE Monetary Policy Update. USD Building Permits & Weekly Unemployment Claims.
- Fri 17th: CAD Manufacturing Sales. USD Prelim UoM Consumer Sentiment.
Forex:
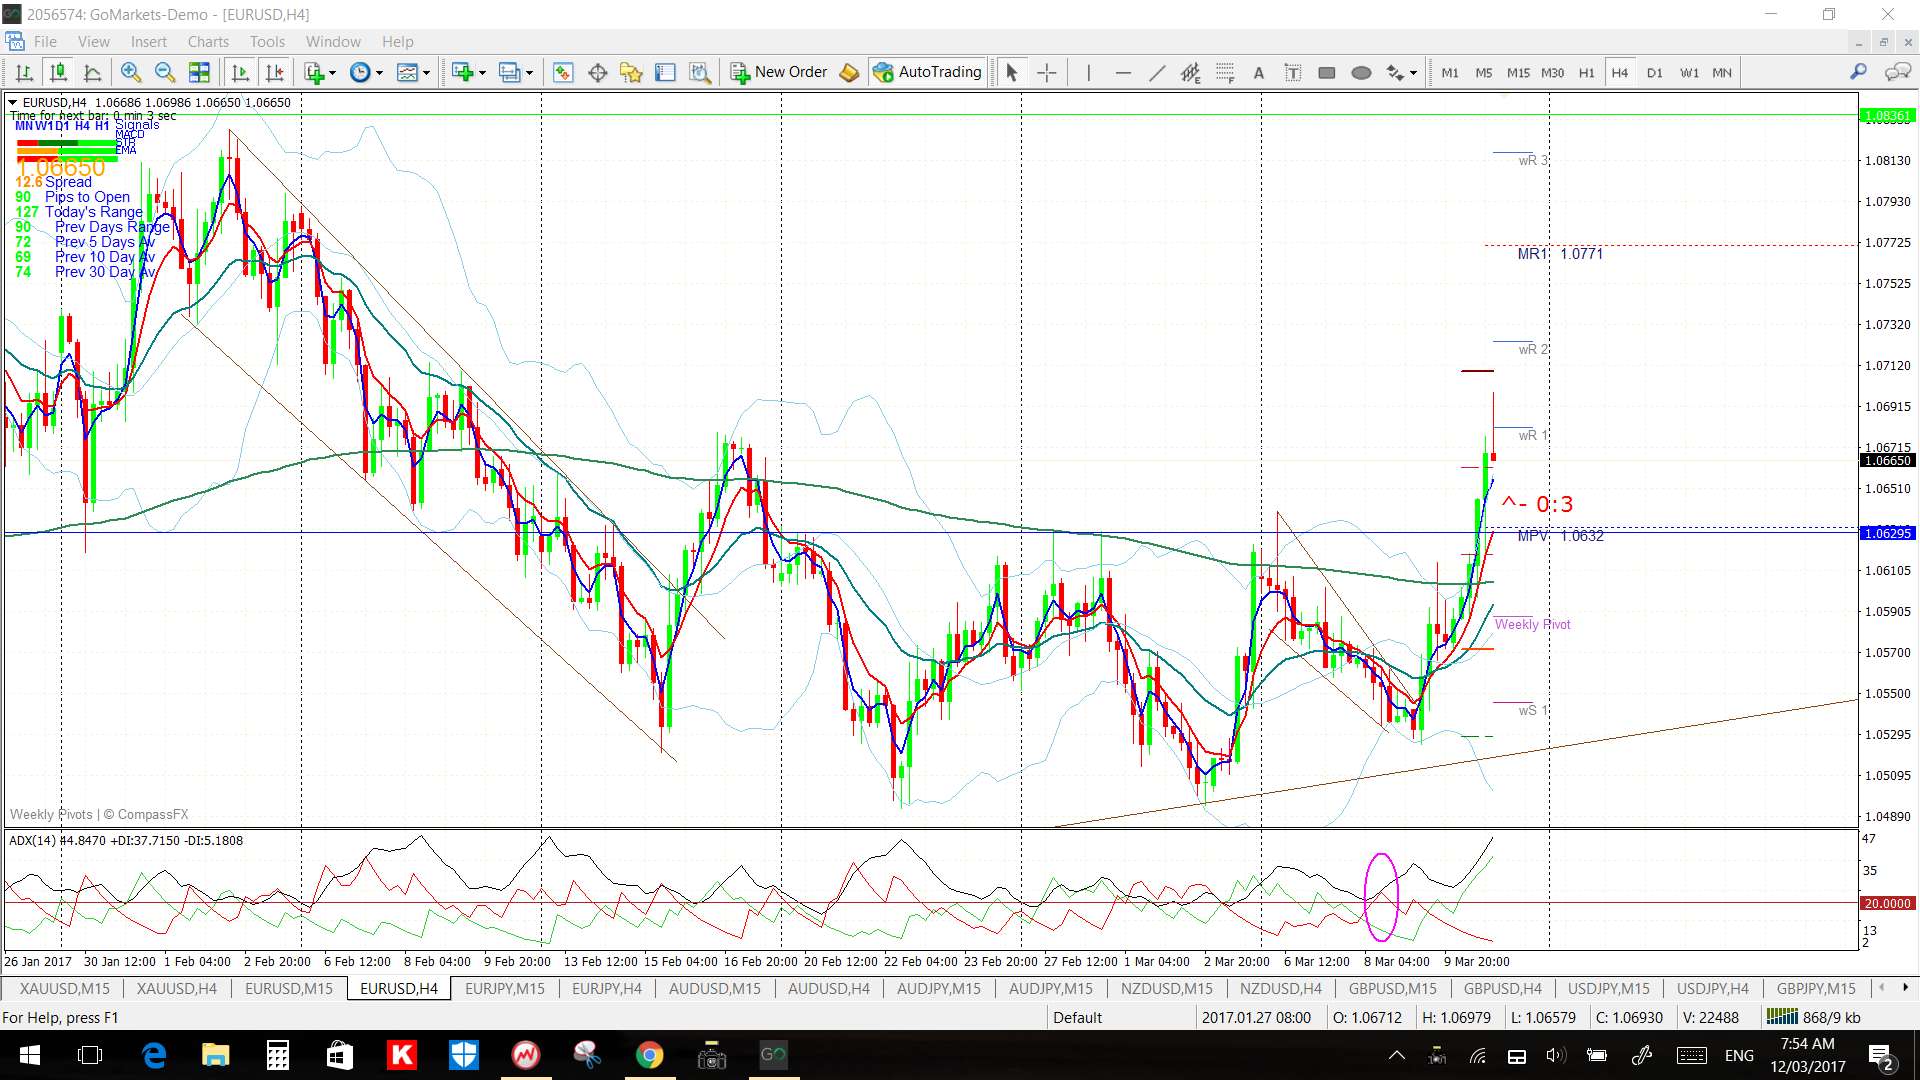
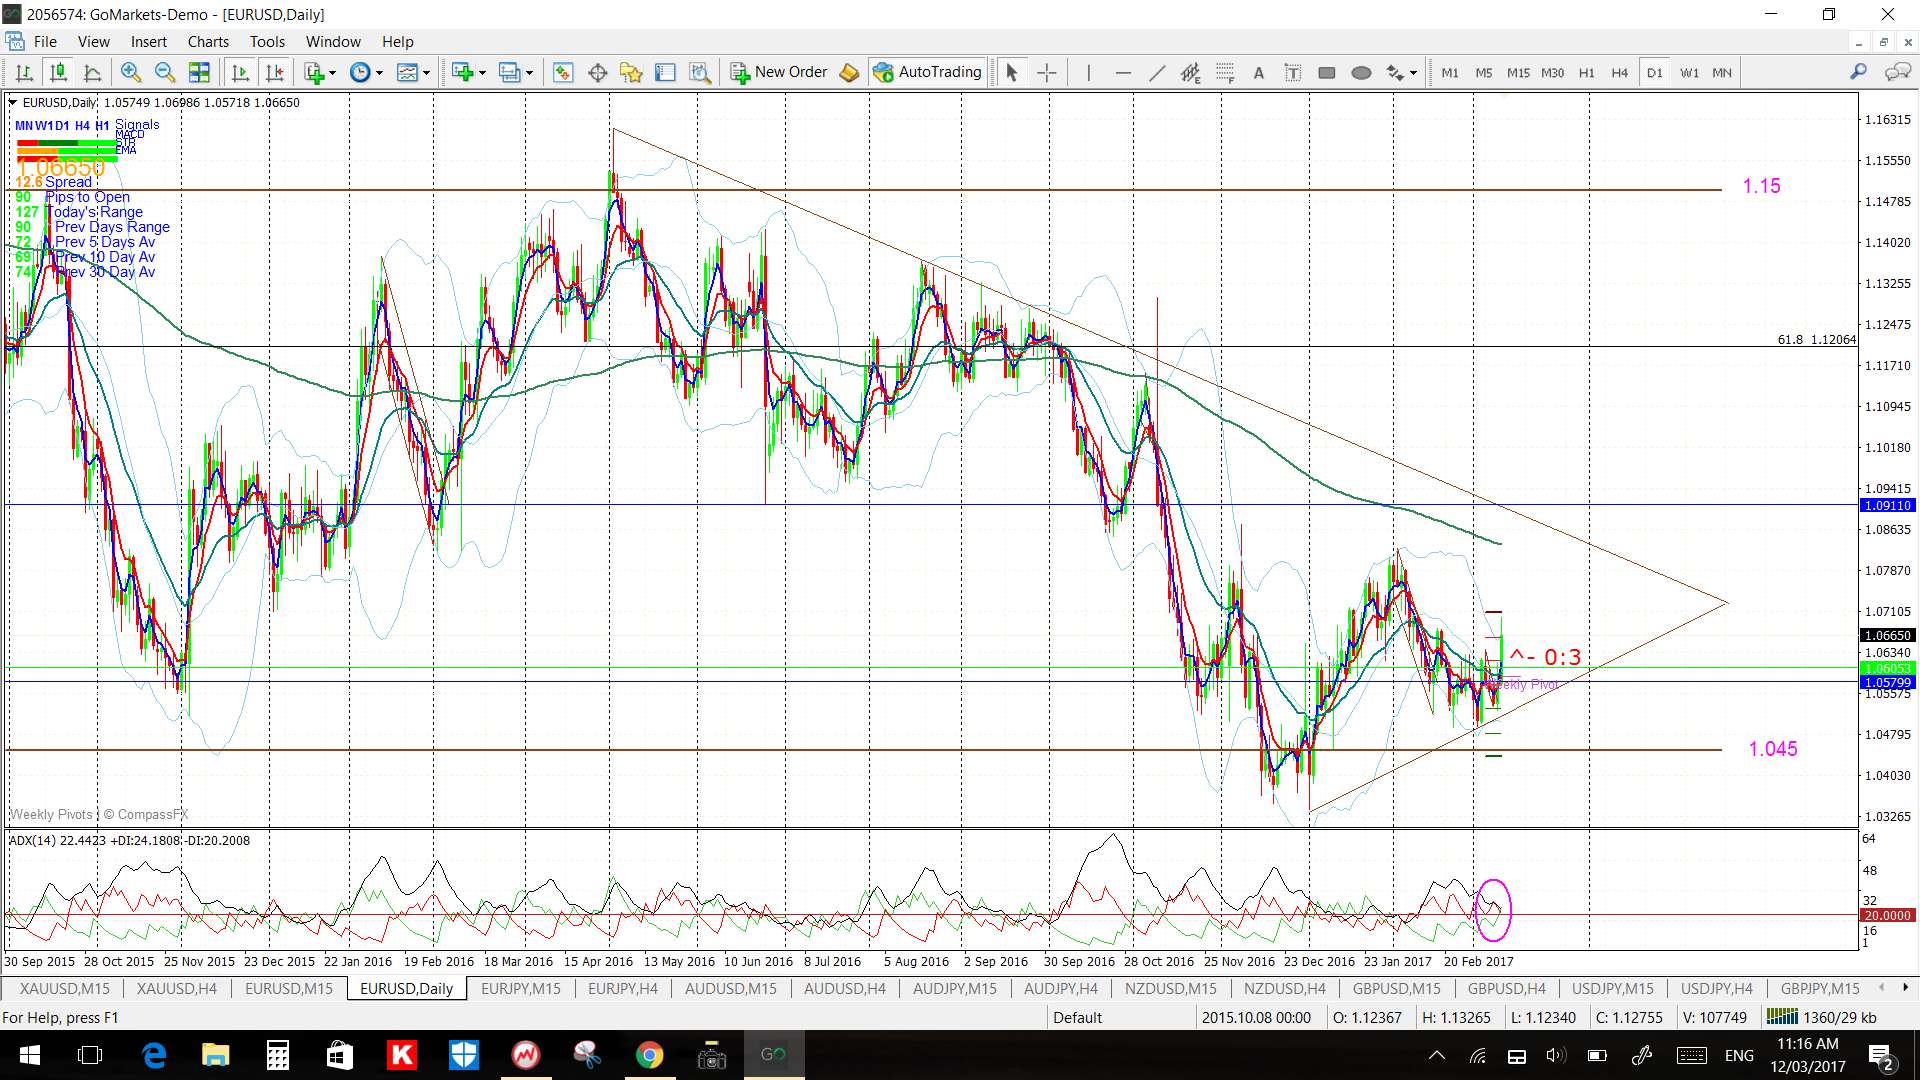
EUR/USD: watch the daily chart triangle for any momentum-based breakout move:
E/U 4hr:
E/U daily:
EUR/JPY: This pair gave a wedge breakout during the week that has delivered 170 pips but the more interesting point to note here though is that this bullish move also broke through a two-year+ bear trend line.
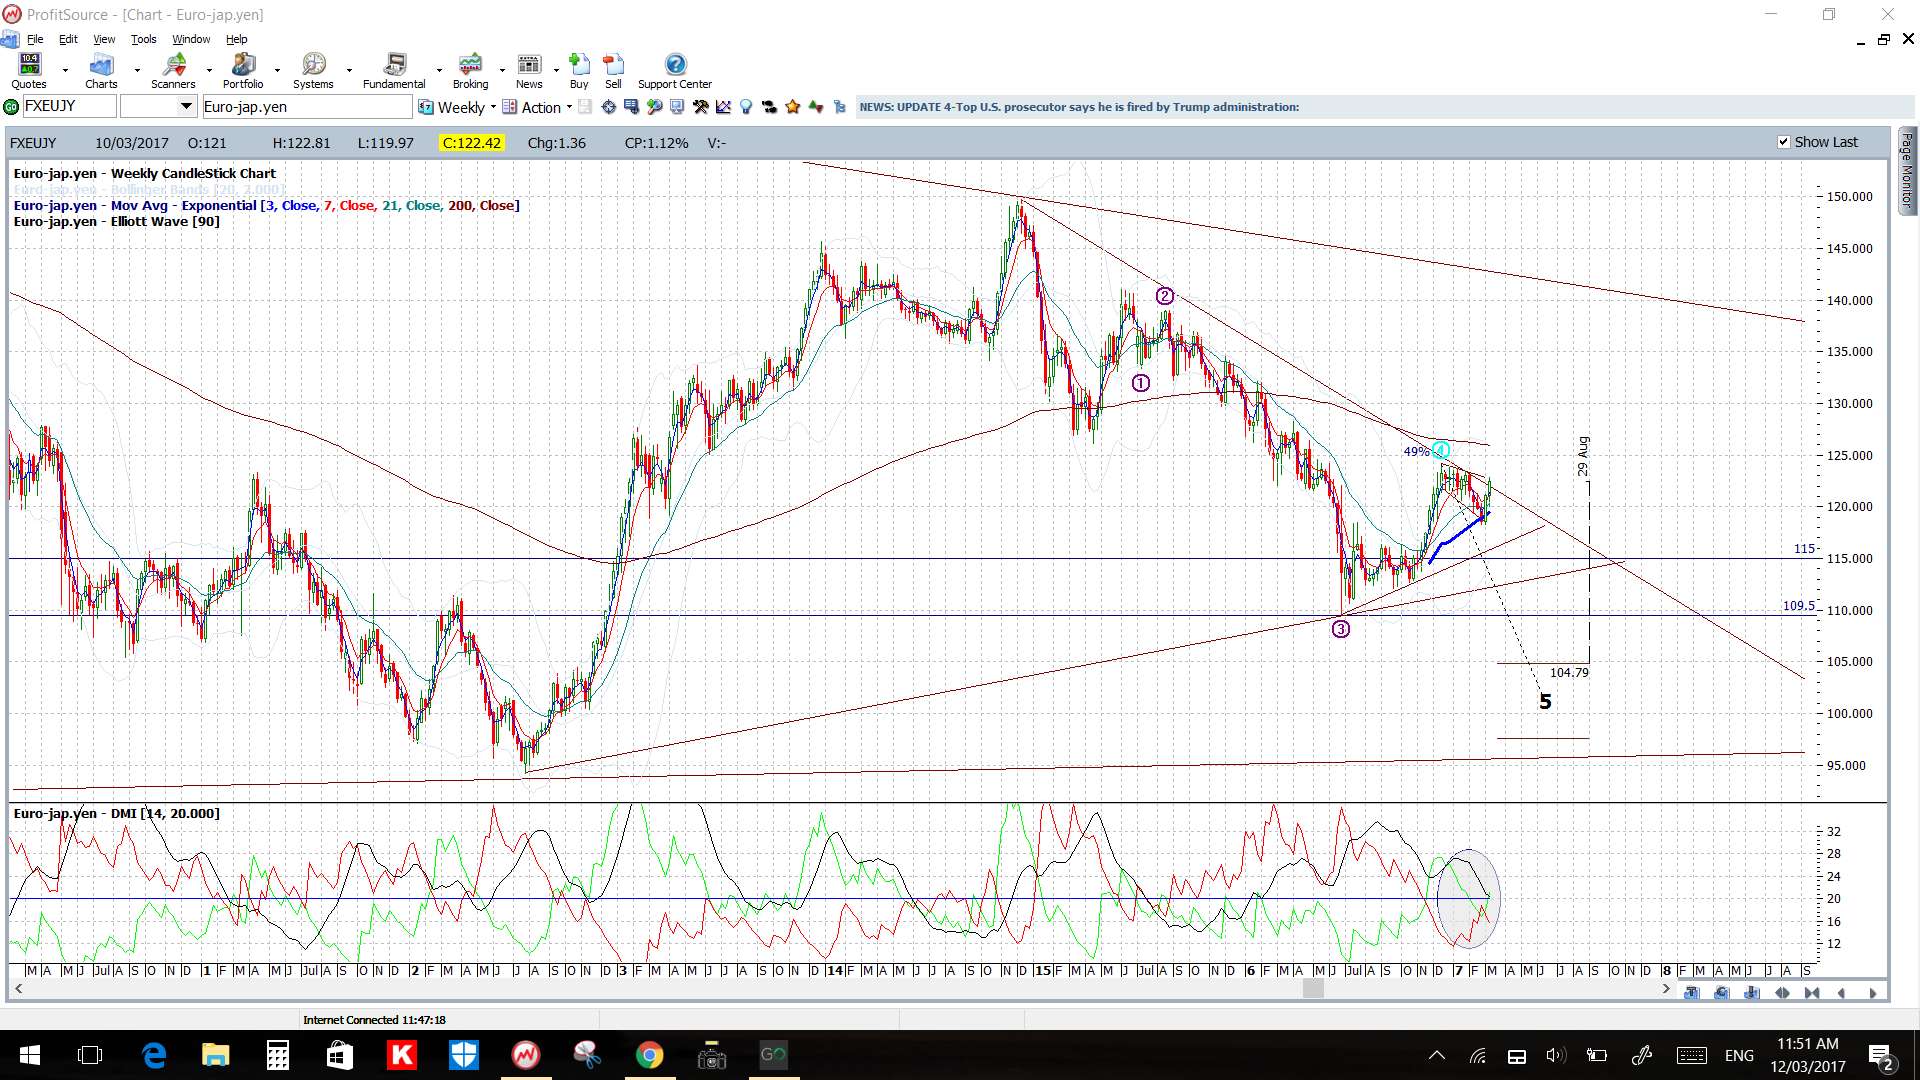
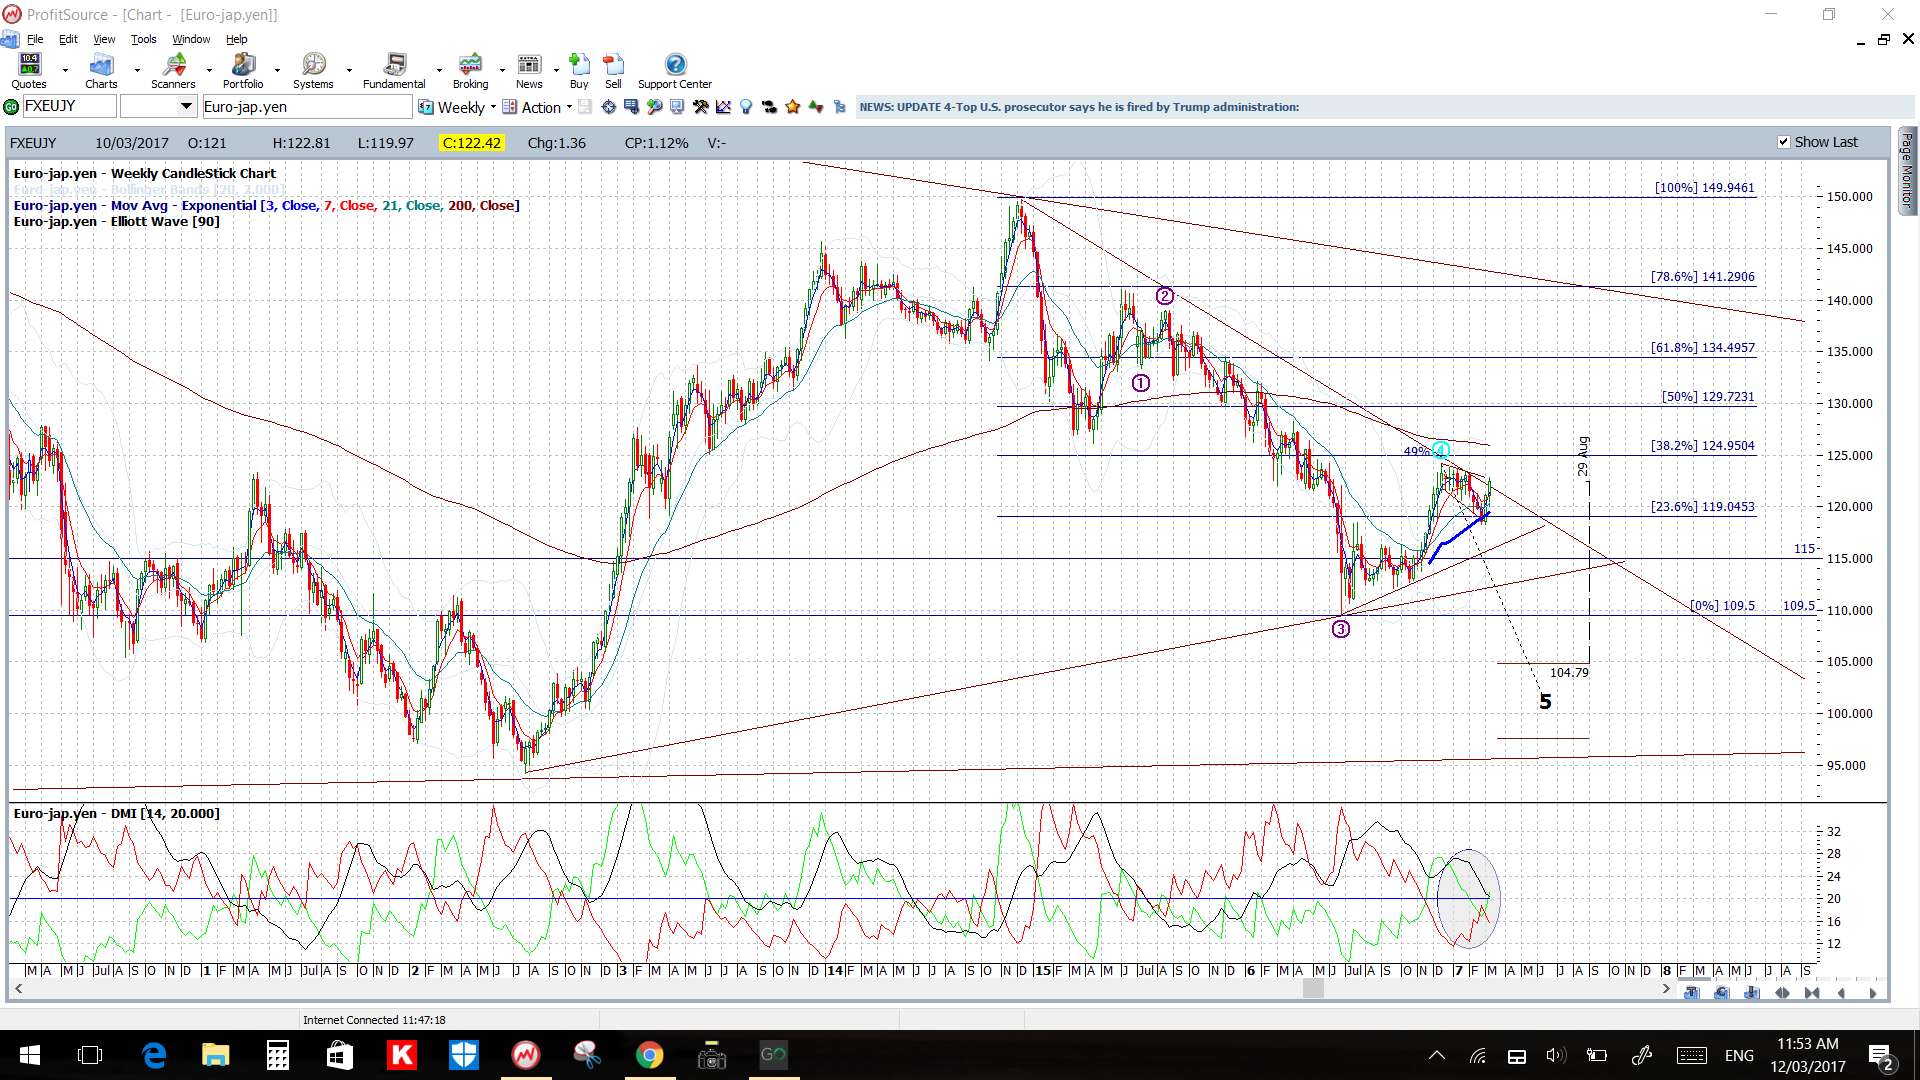
The weekly chart shows this weekly candle close above the bear trend line and how the 61.8% fib of the recent swing low is up near previous S/R at 135 and so this would be an obvious long-term target for any bullish continuation.
E/J 4hr:
E/J weekly:
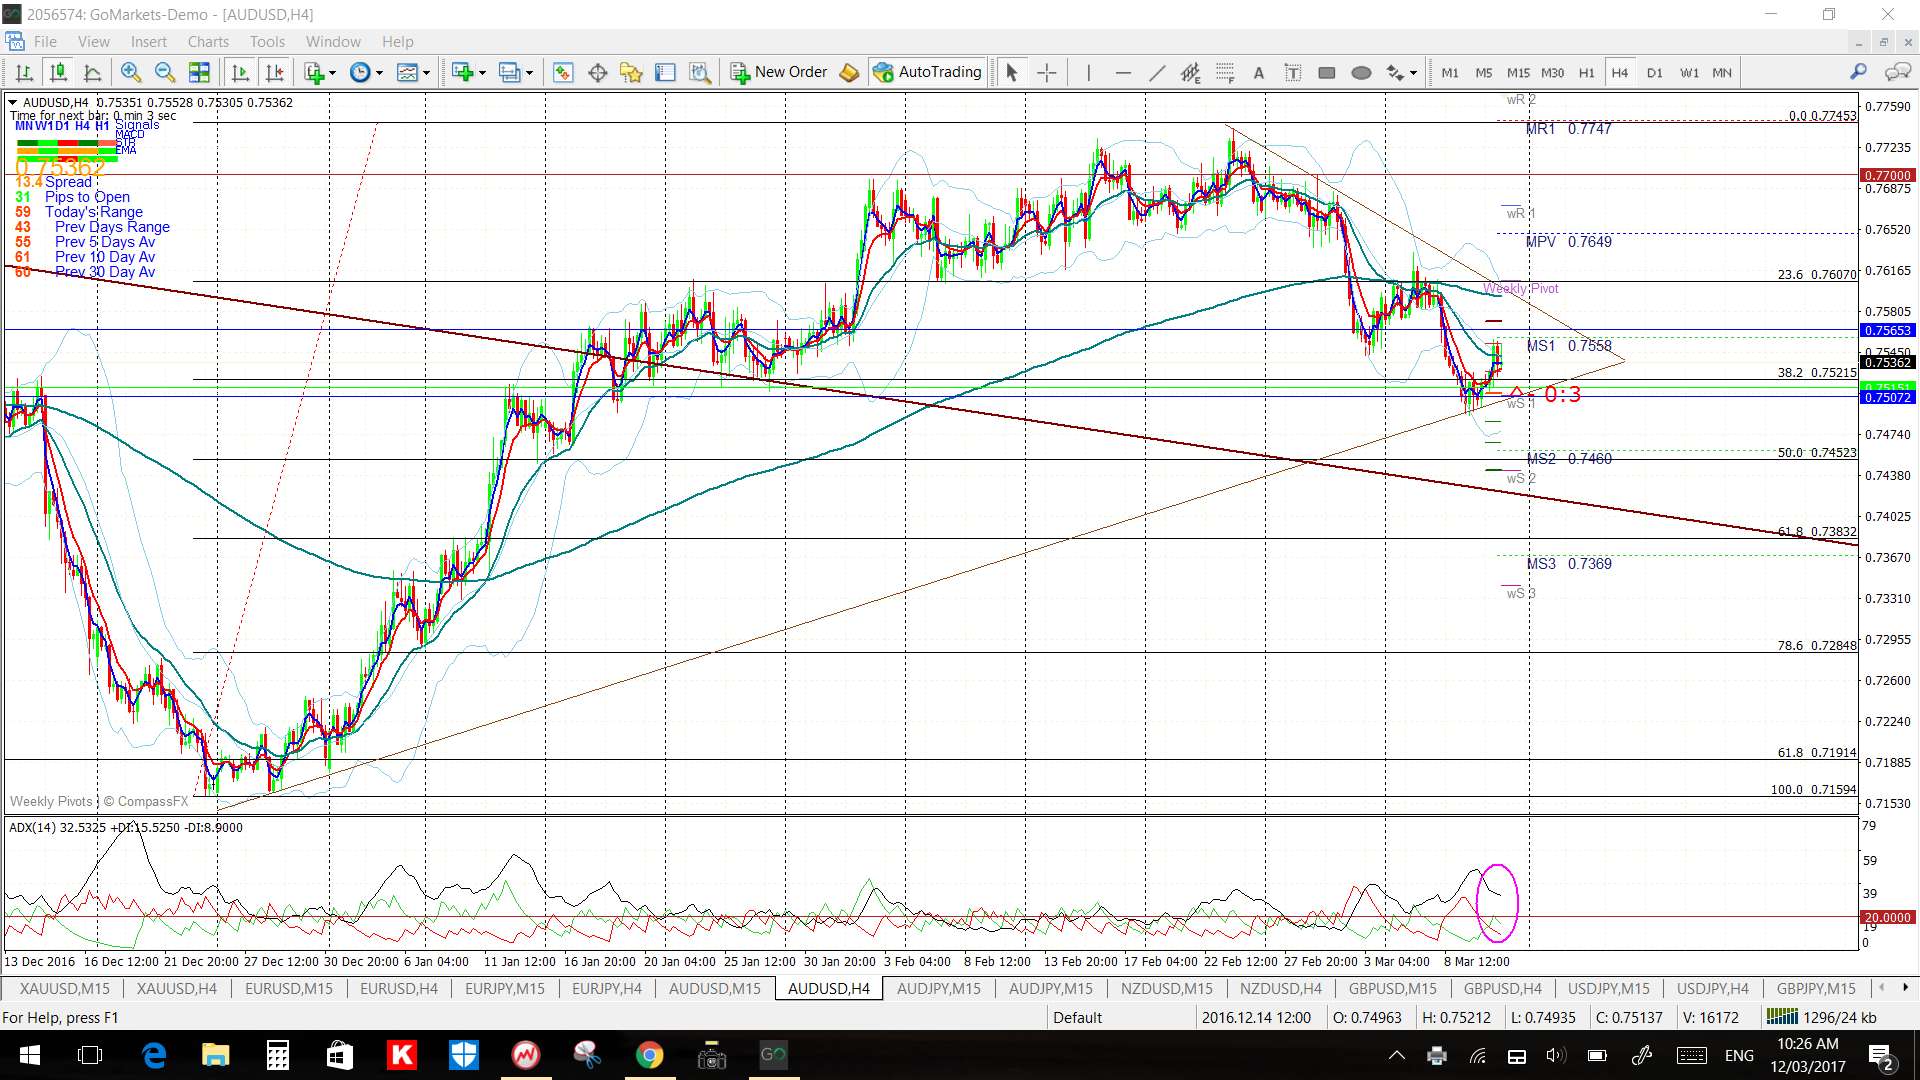
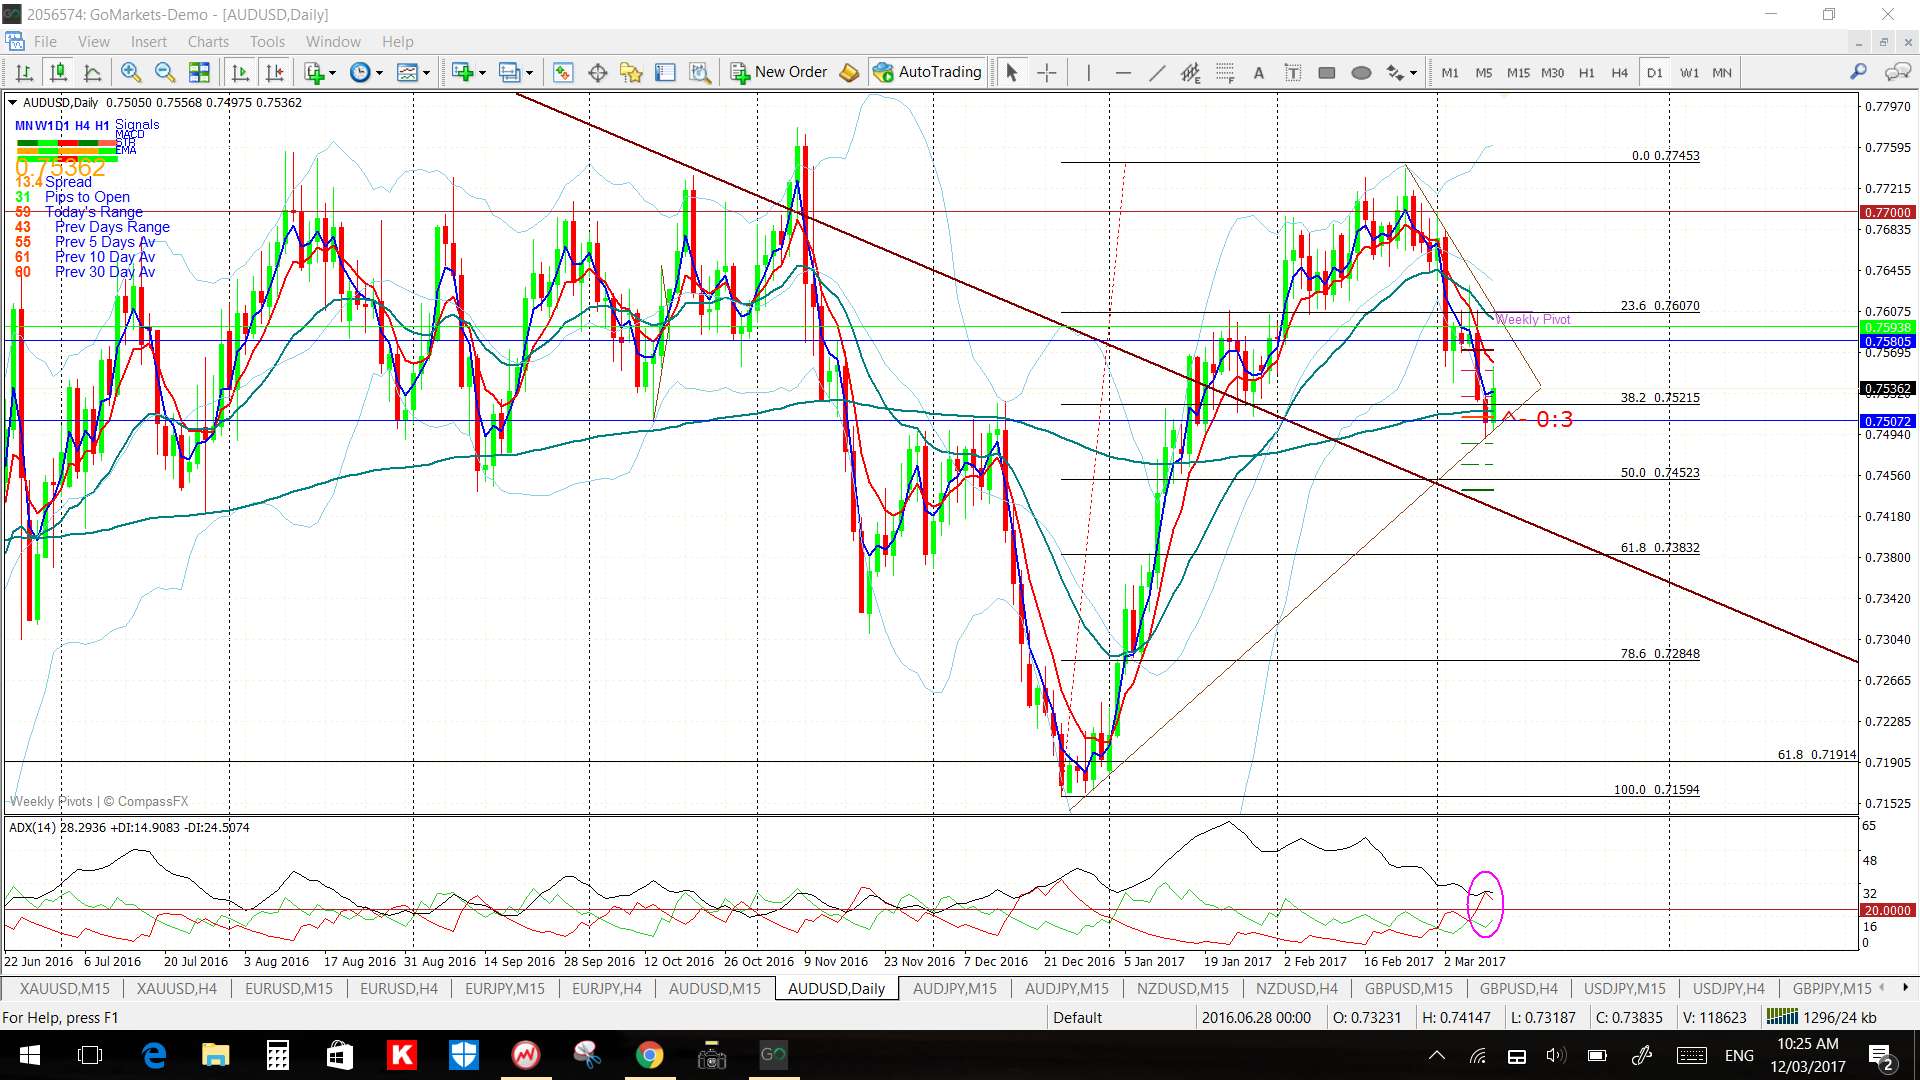
AUD/USD: watch the revised 4hr chart triangle for any momentum-based breakout move:
A/U 4hr:
A/U daily:
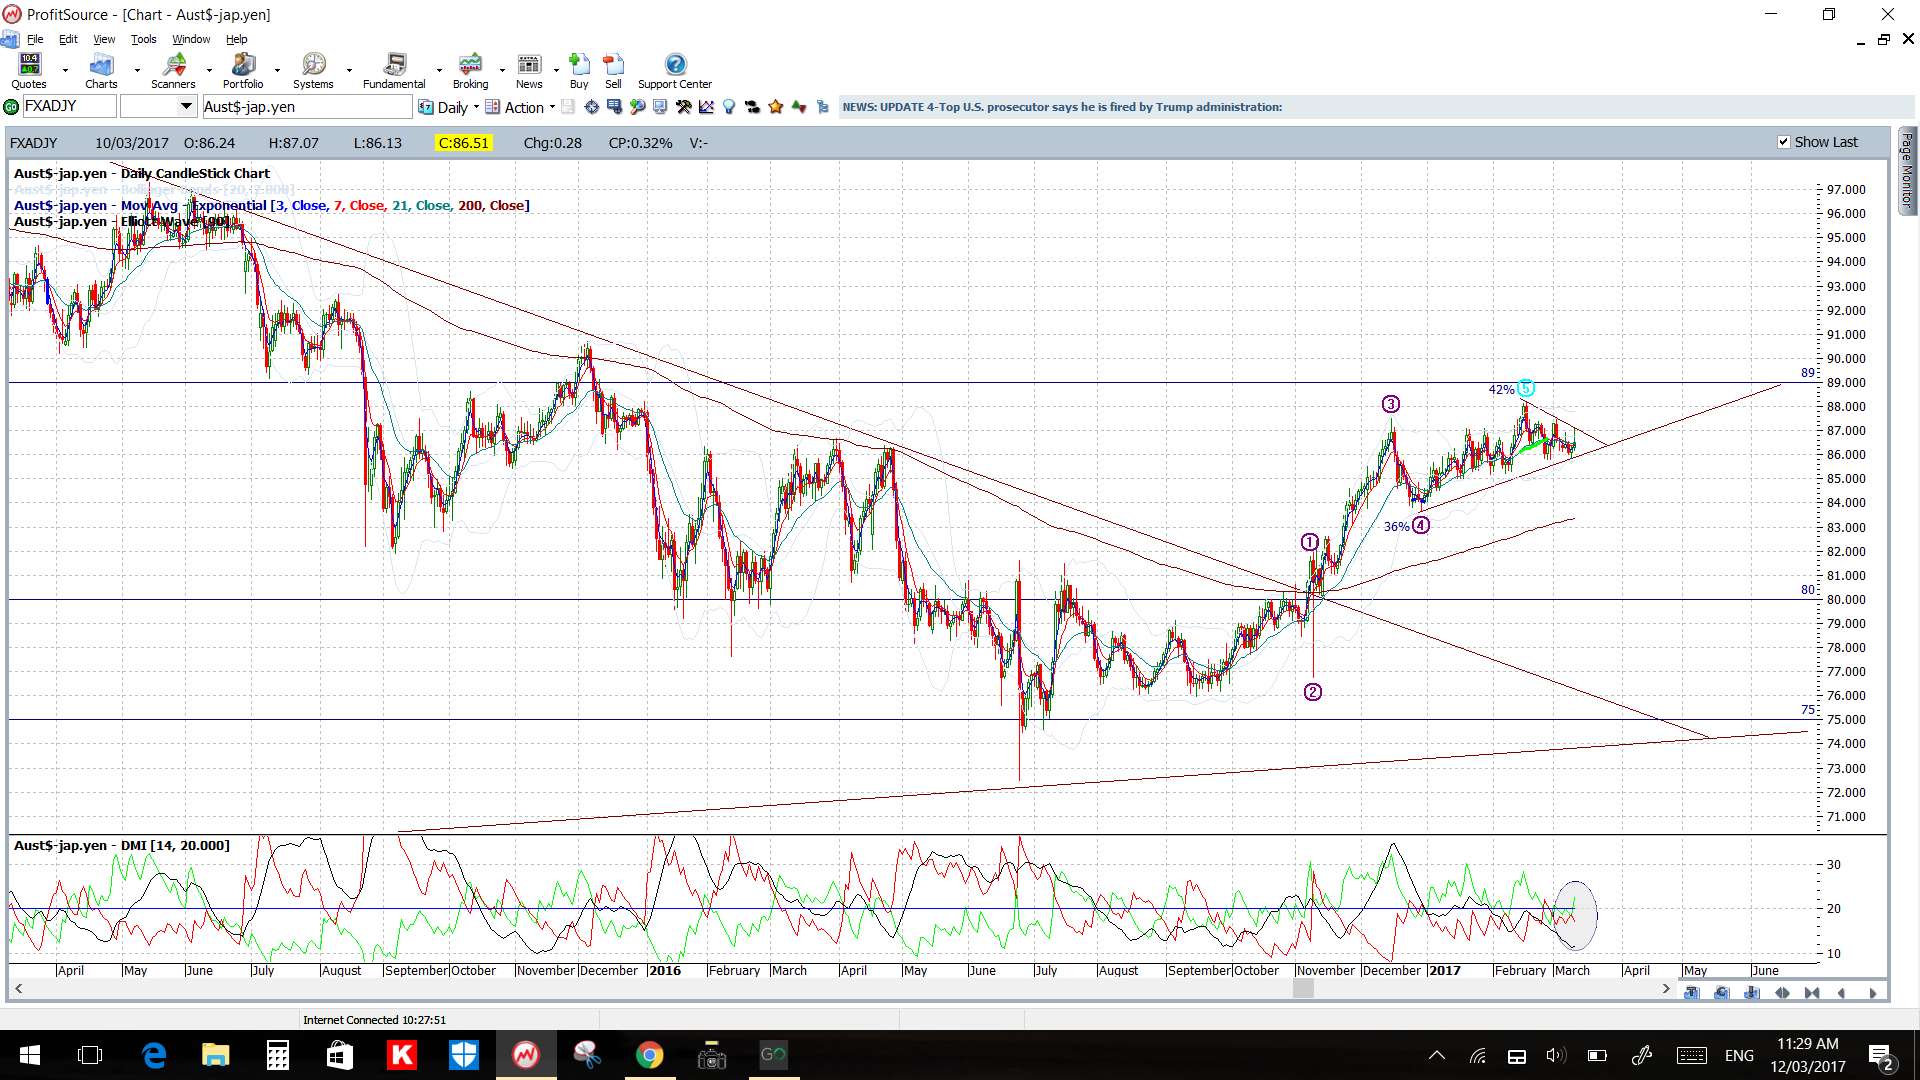
AUD/JPY: watch the 4hr chart triangle for any momentum-based breakout move. Any bullish breakout and move above 87 would bring the key S/R level of 89 back into focus:
A/J 4hr:
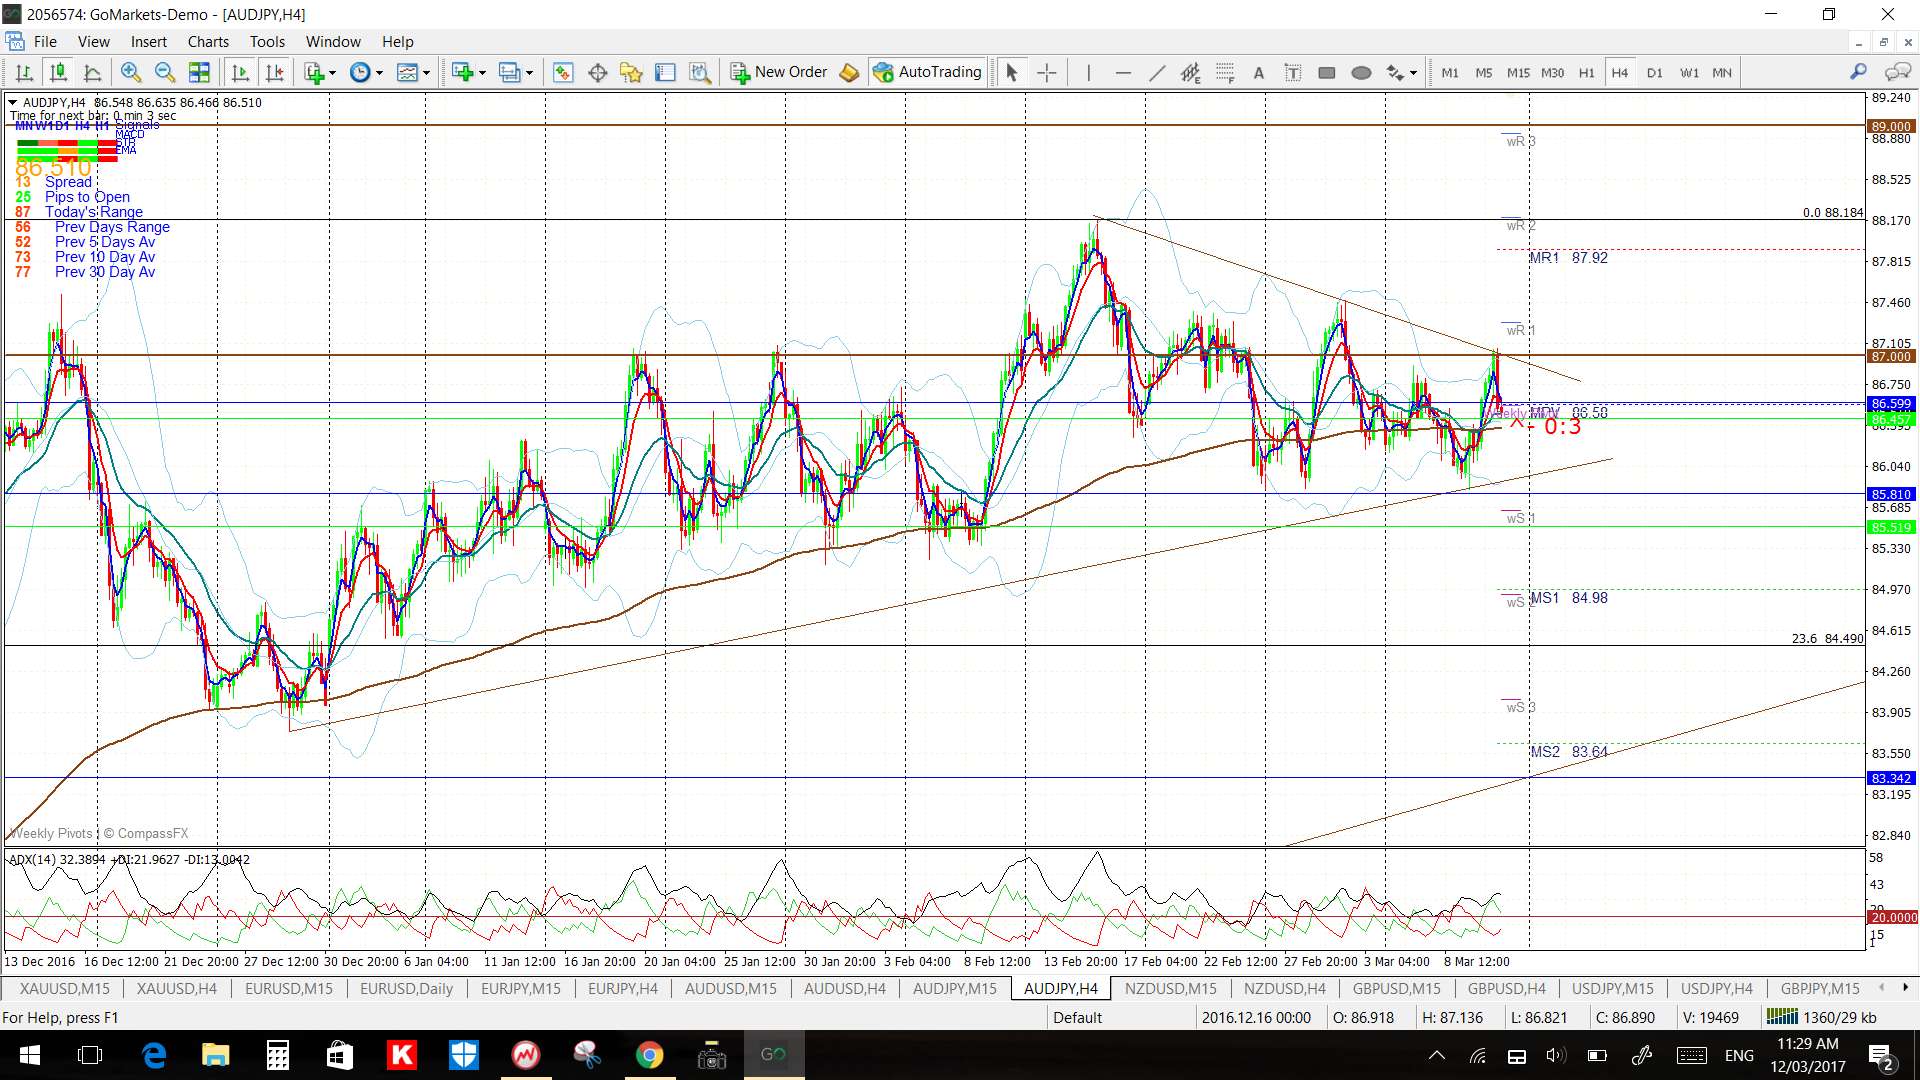
A/J daily:
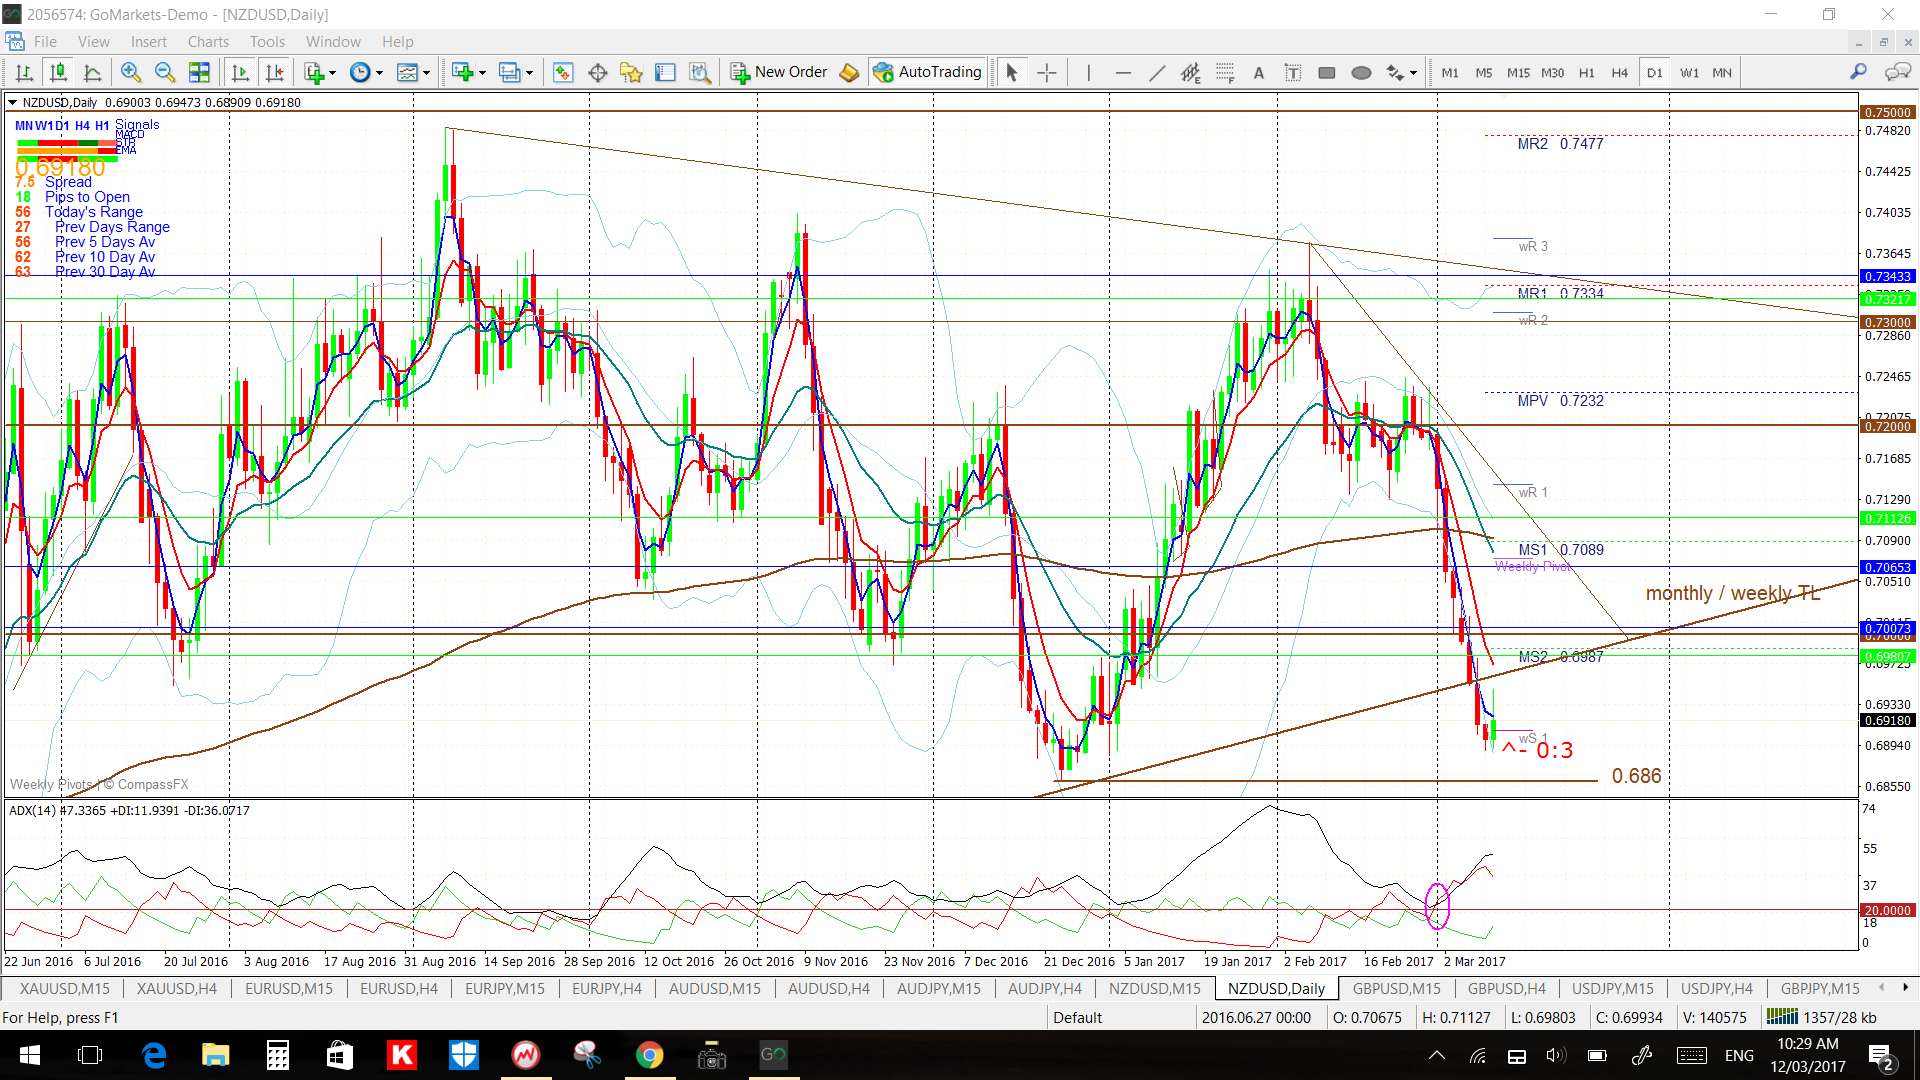
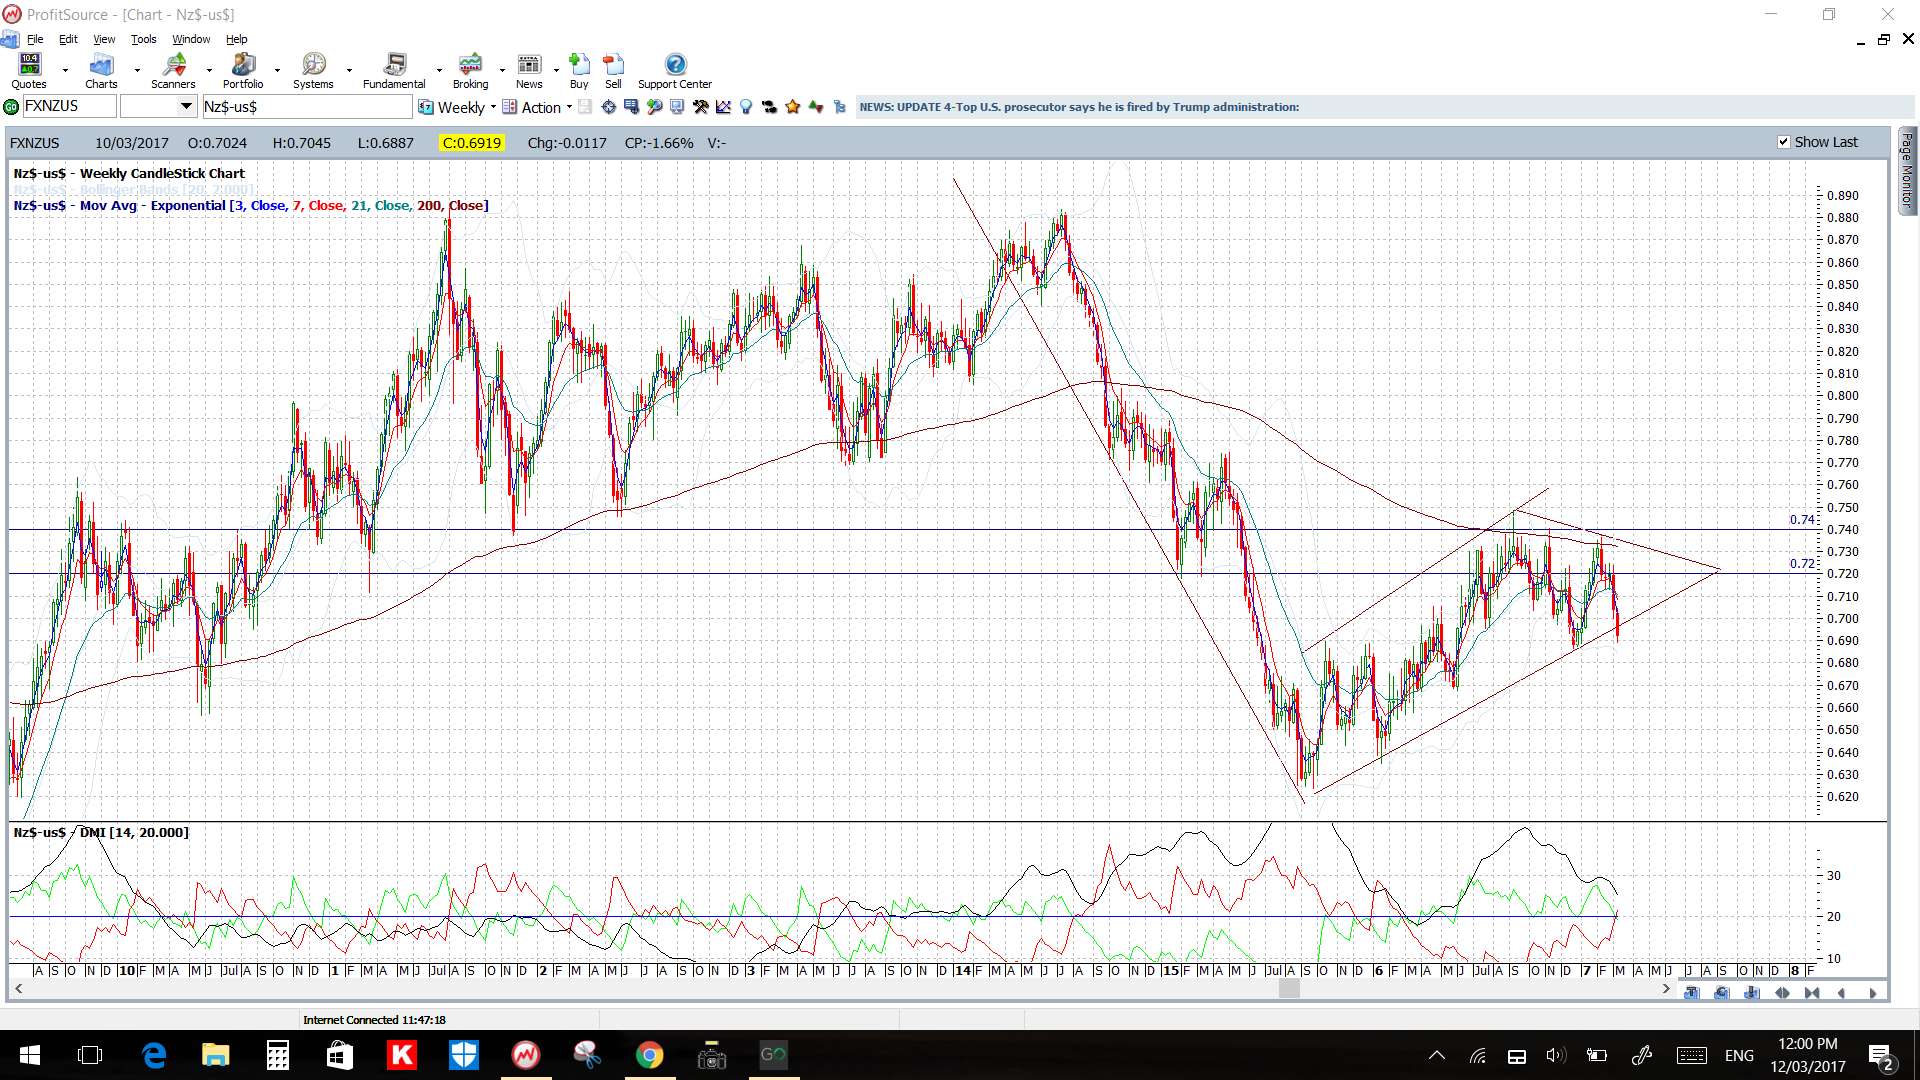
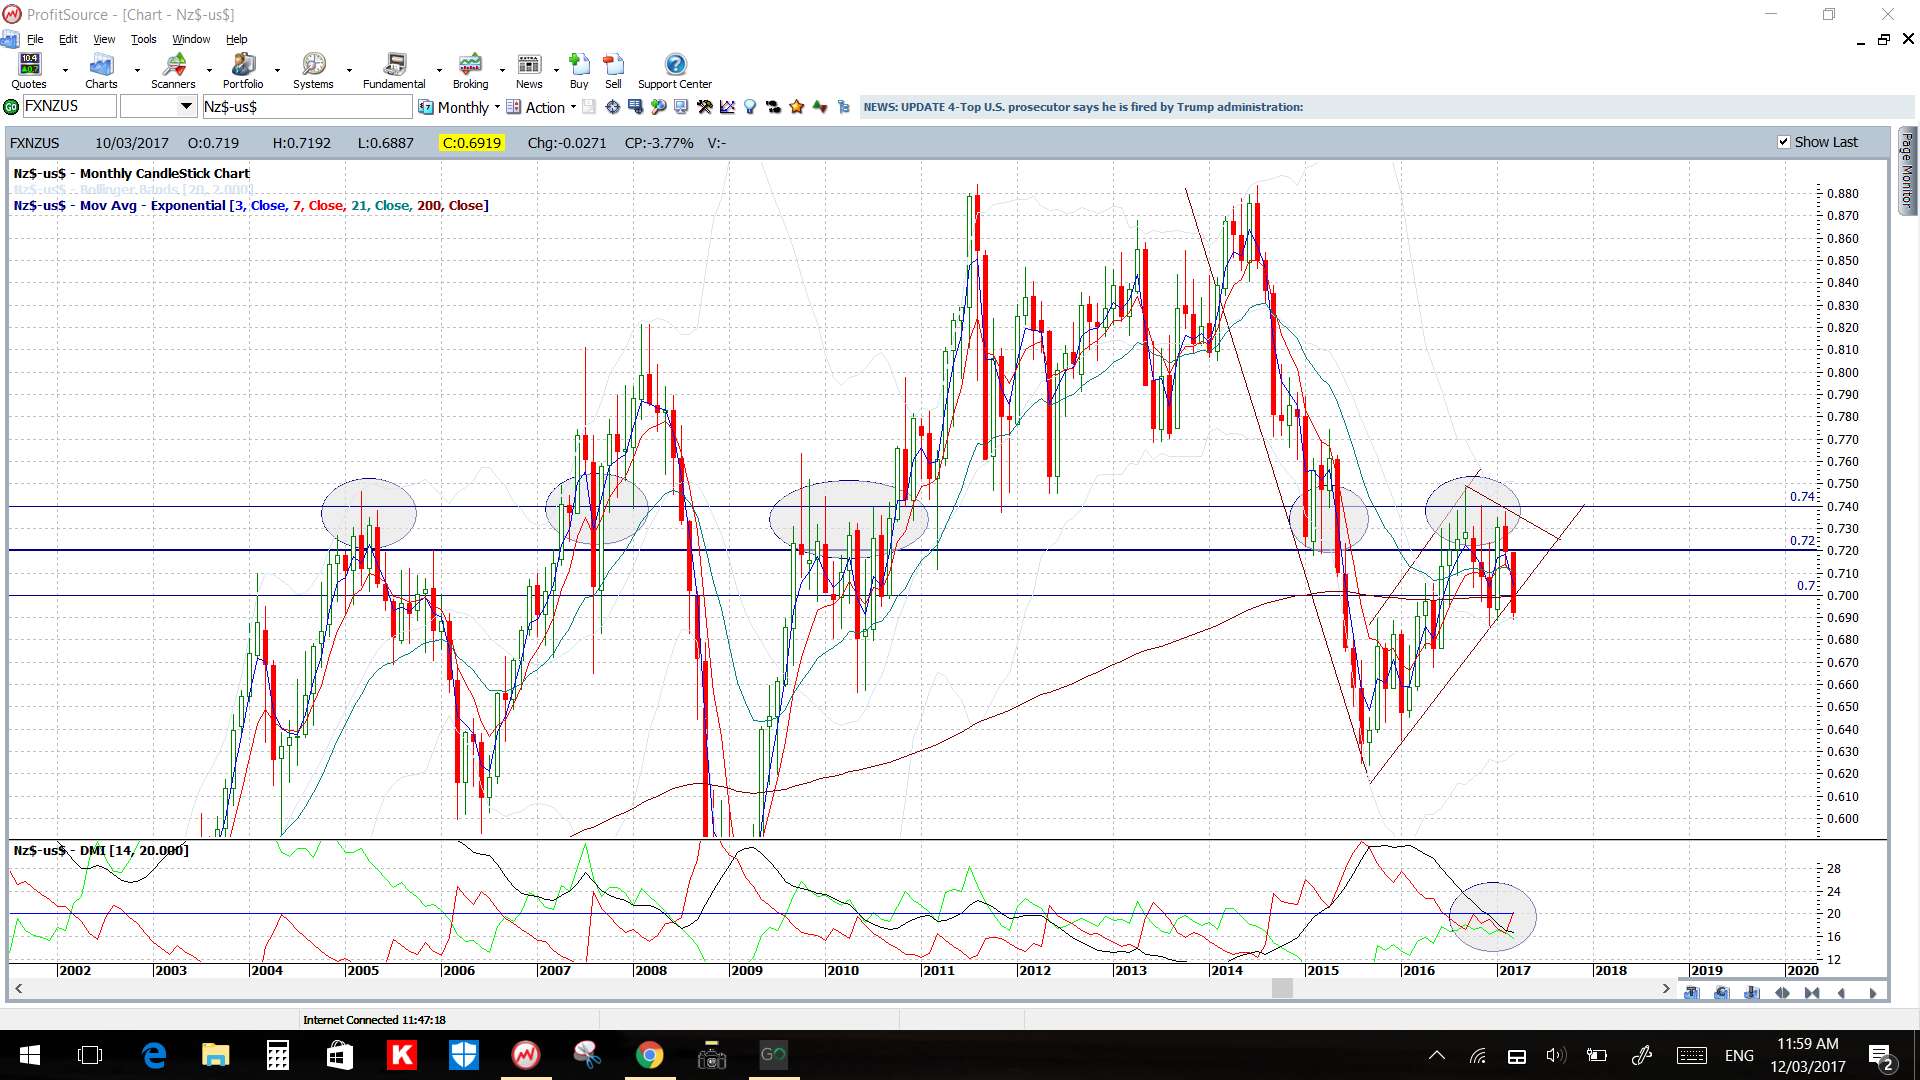
NZD/USD: This is a tough one as price action has now closed the week below a major 14-month support trend line although the decline slowed as price reached a recent low near 0.686. This 0.686 might be the level worth watching for any new make or break activity with FOMC next week. However, a test of the broken 14-month trend line could evolve even if there is to be ultimate bearish continuation:
Kiwi 4hr:
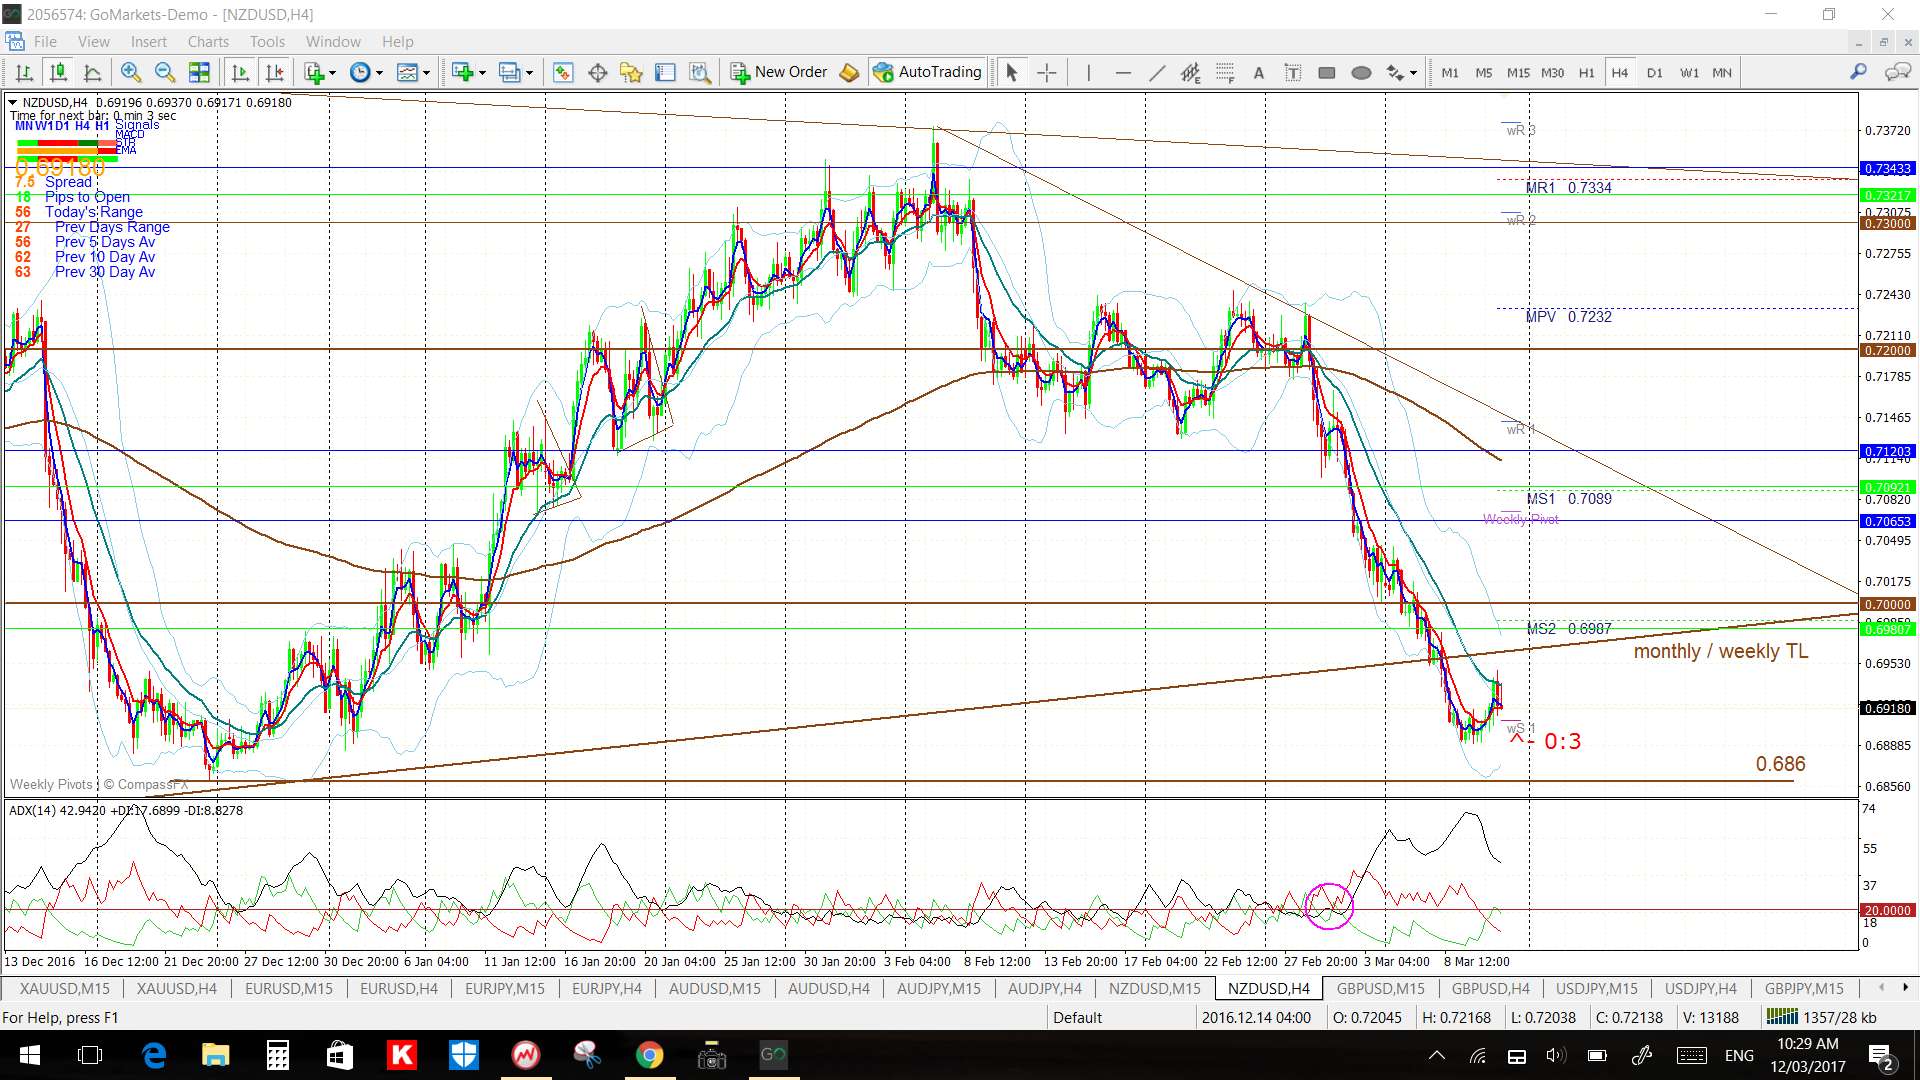
Kiwi daily:
Kiwi weekly:
Kiwi monthly:
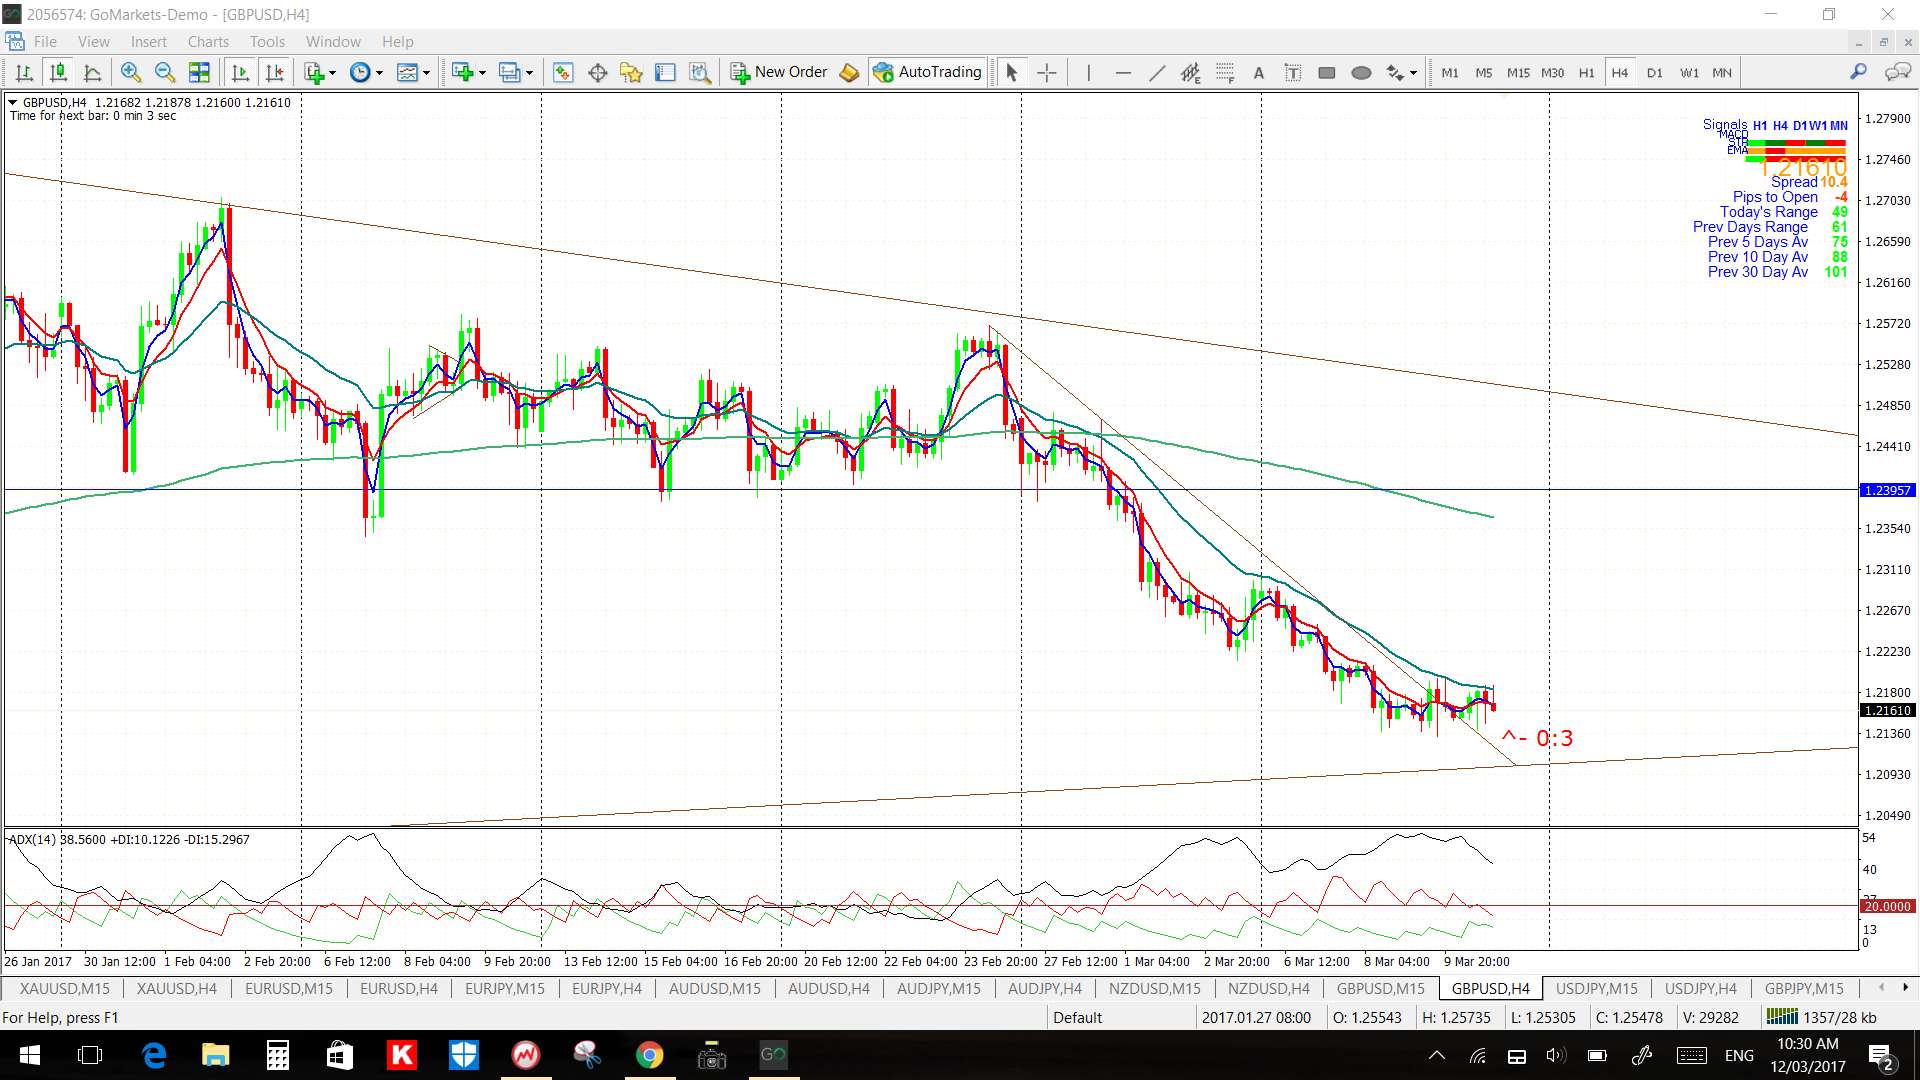
GBP/USD: watch the recently broken 4hr chart’s bear trend line and the daily chart’s support triangle trend line for any momentum-based breakout move:
Cable 4hr:
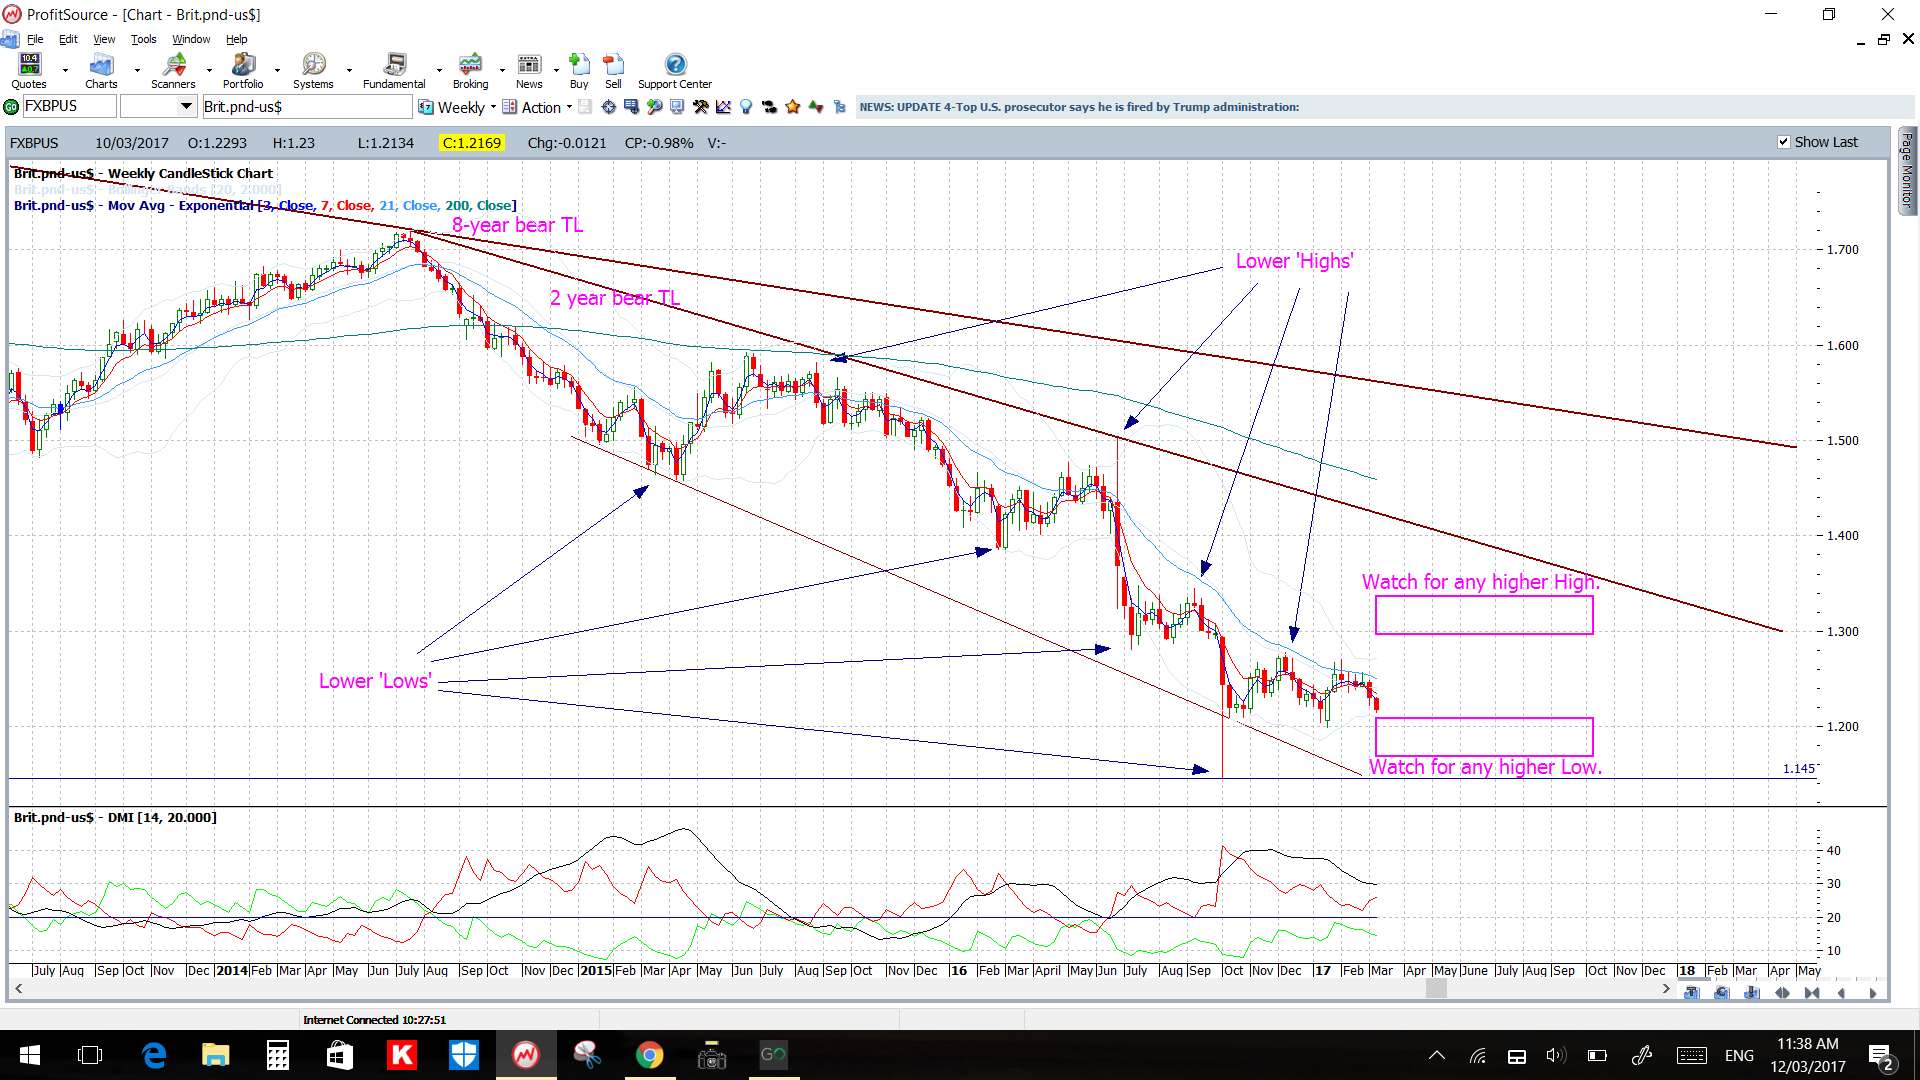
Cable weekly: the weekly chart reveals how price action has basically been going sideways for some weeks now and I’m still waiting for the clear-cut print of either a higher High or a higher Low:
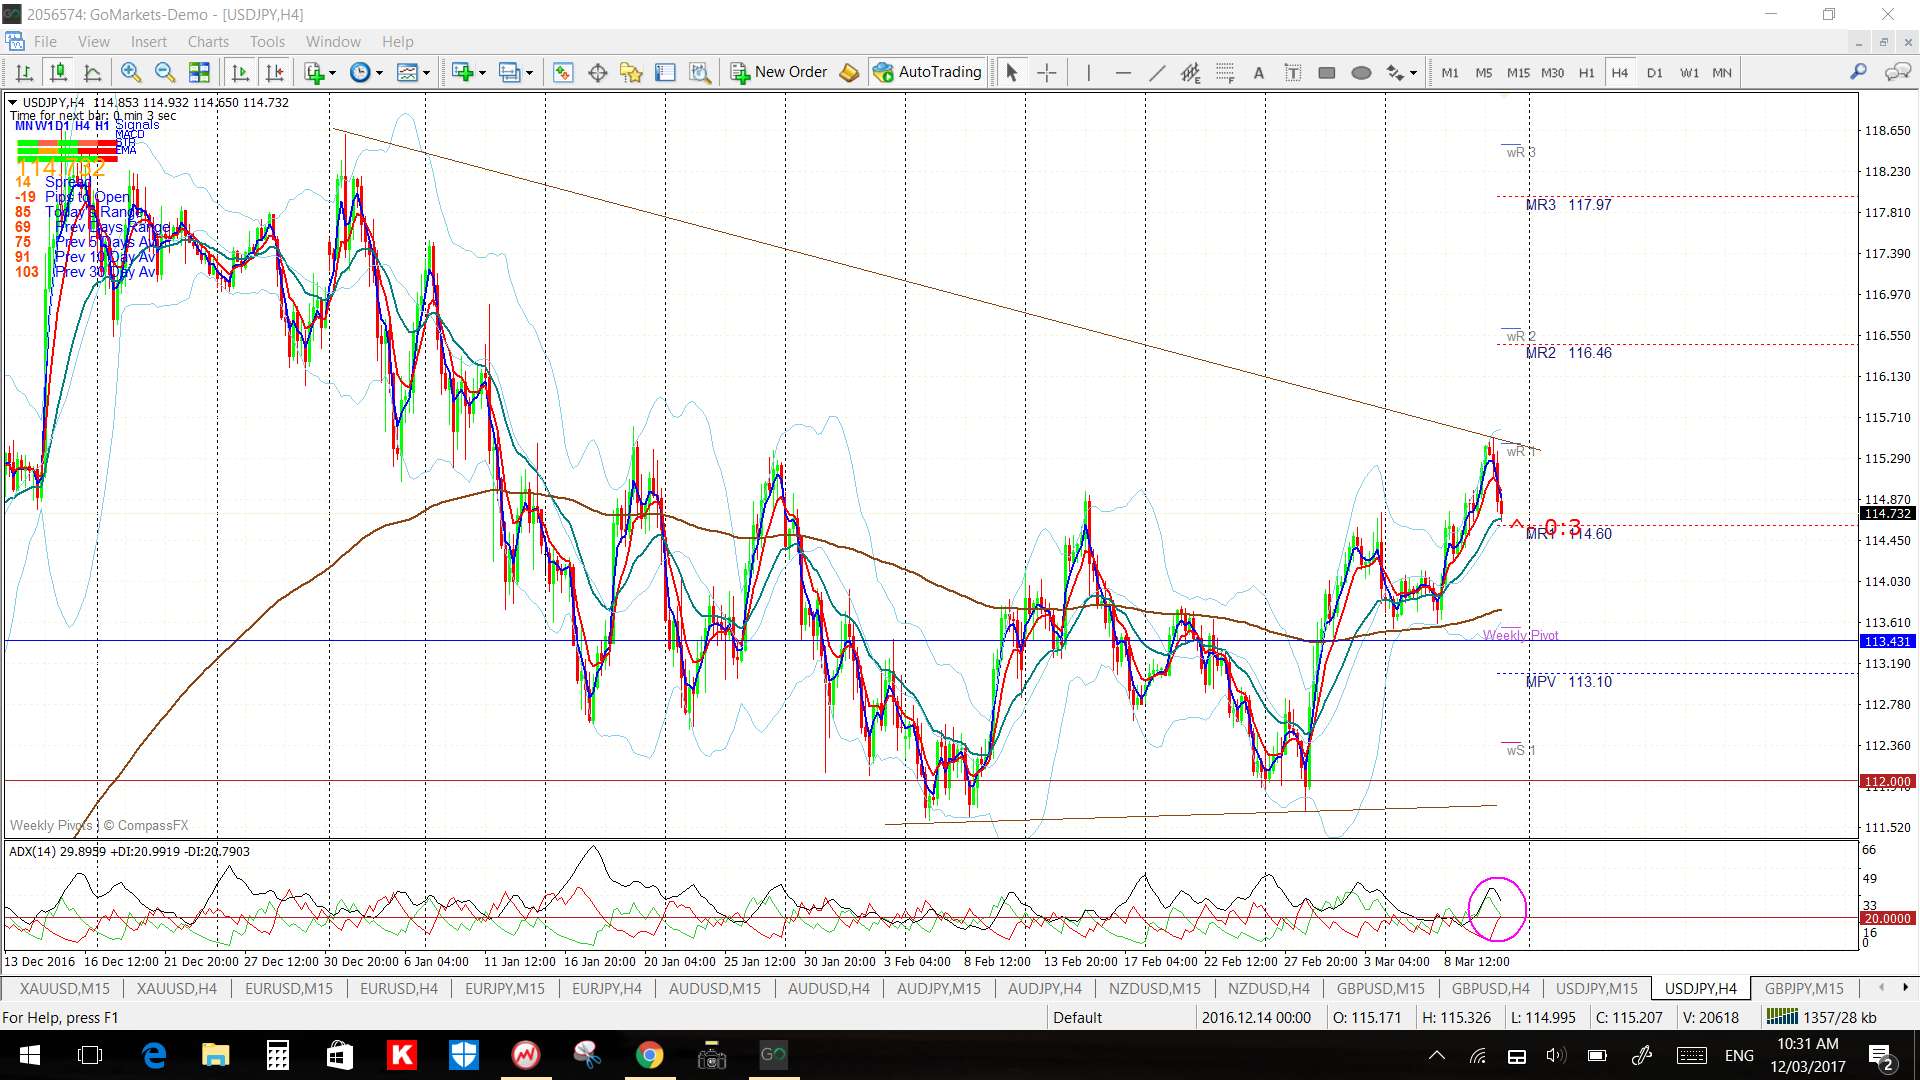
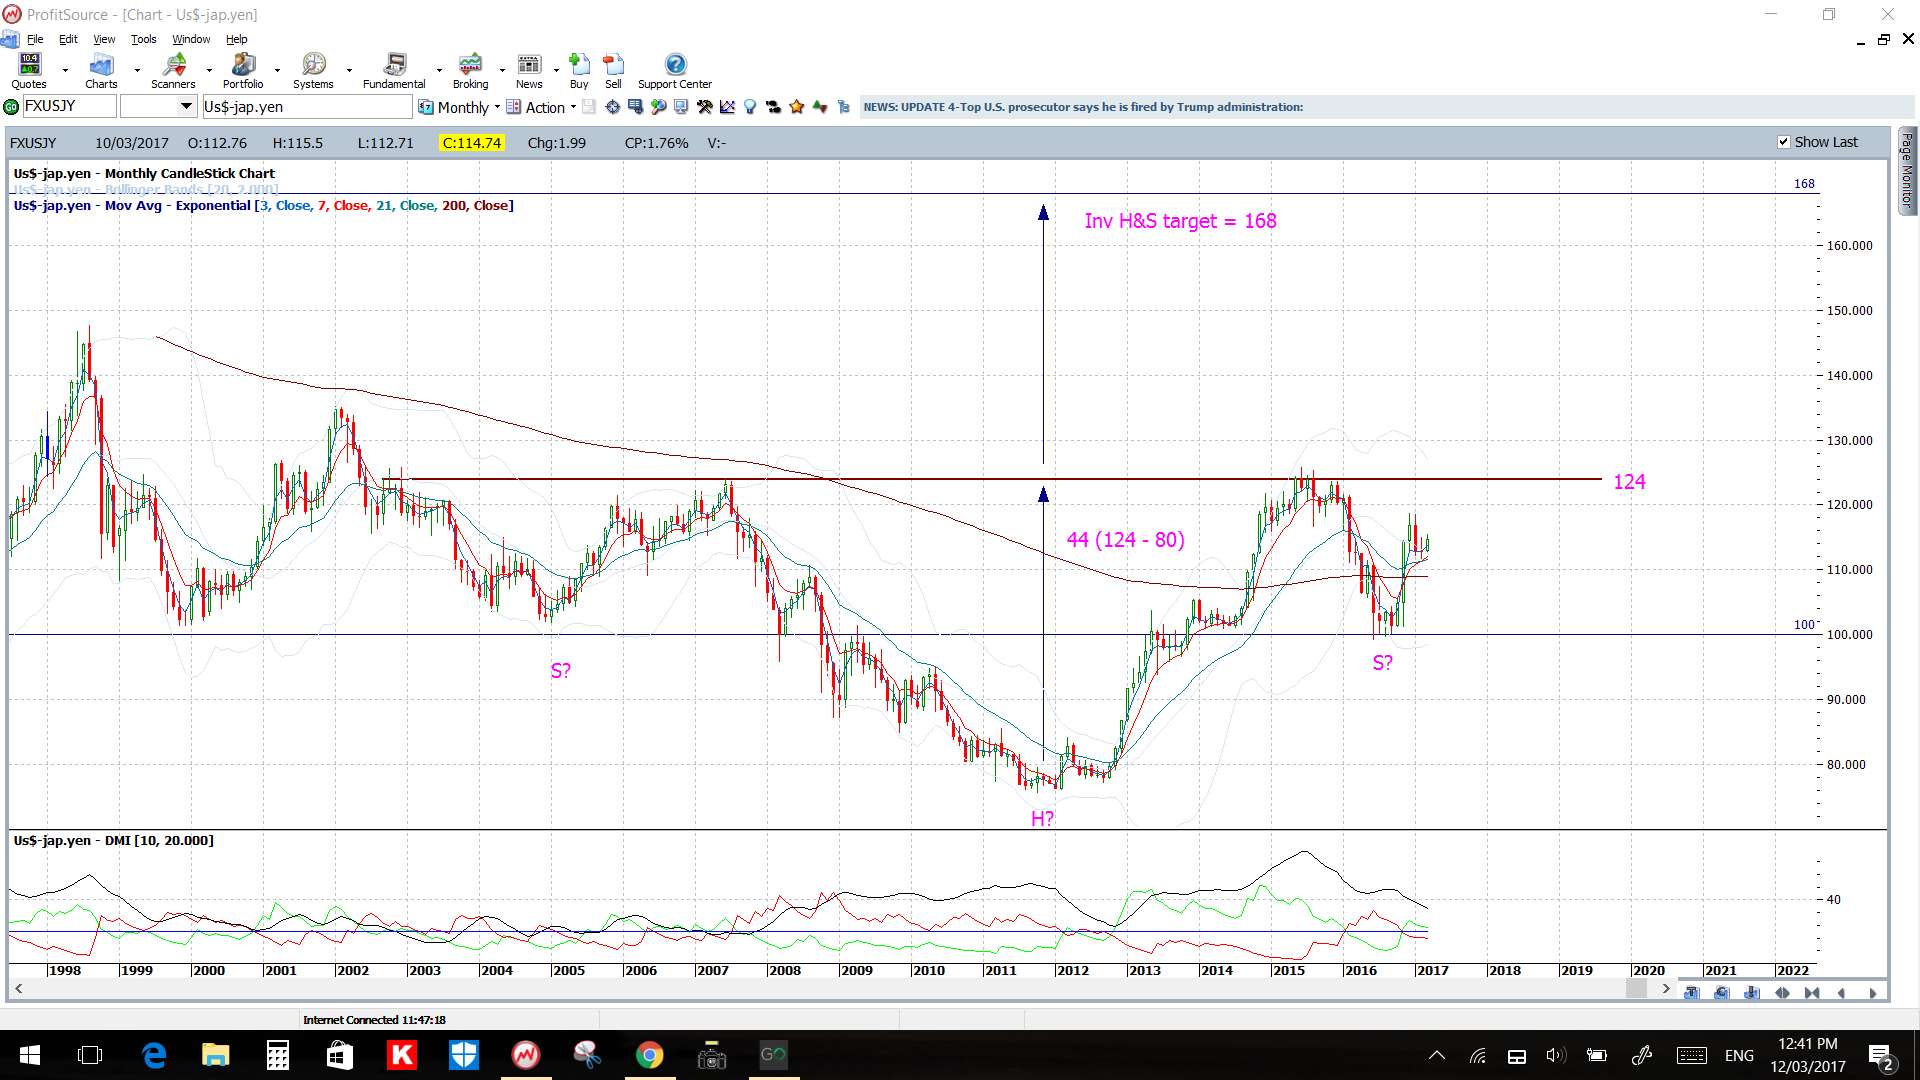
USD/JPY: watch the revised 4hr chart’s wedge for any momentum-based breakout move. Also, don’t lose sight of the longer-term pattern brewing on the monthly chart:
U/J 4hr:
U/J monthly:
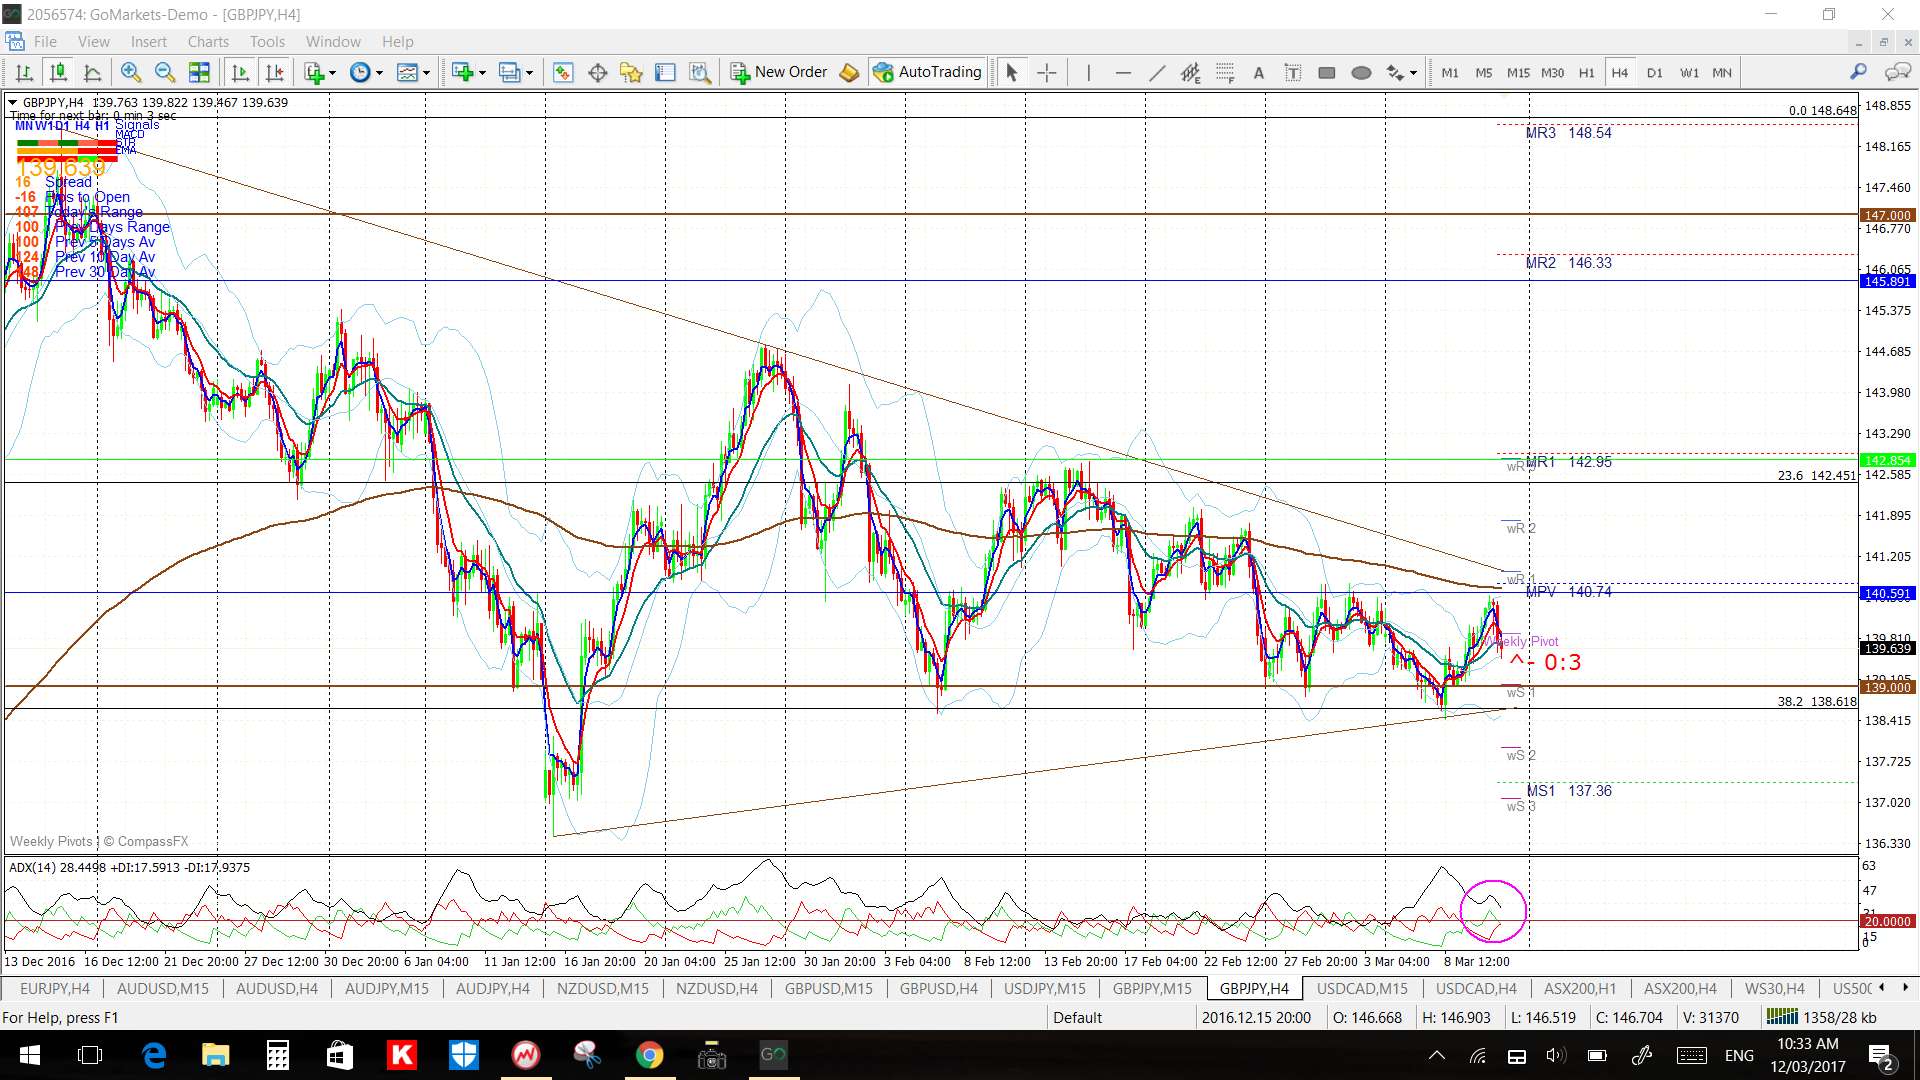
GBP/JPY: watch the 4hr chart’s triangle for any momentum-based breakout move:
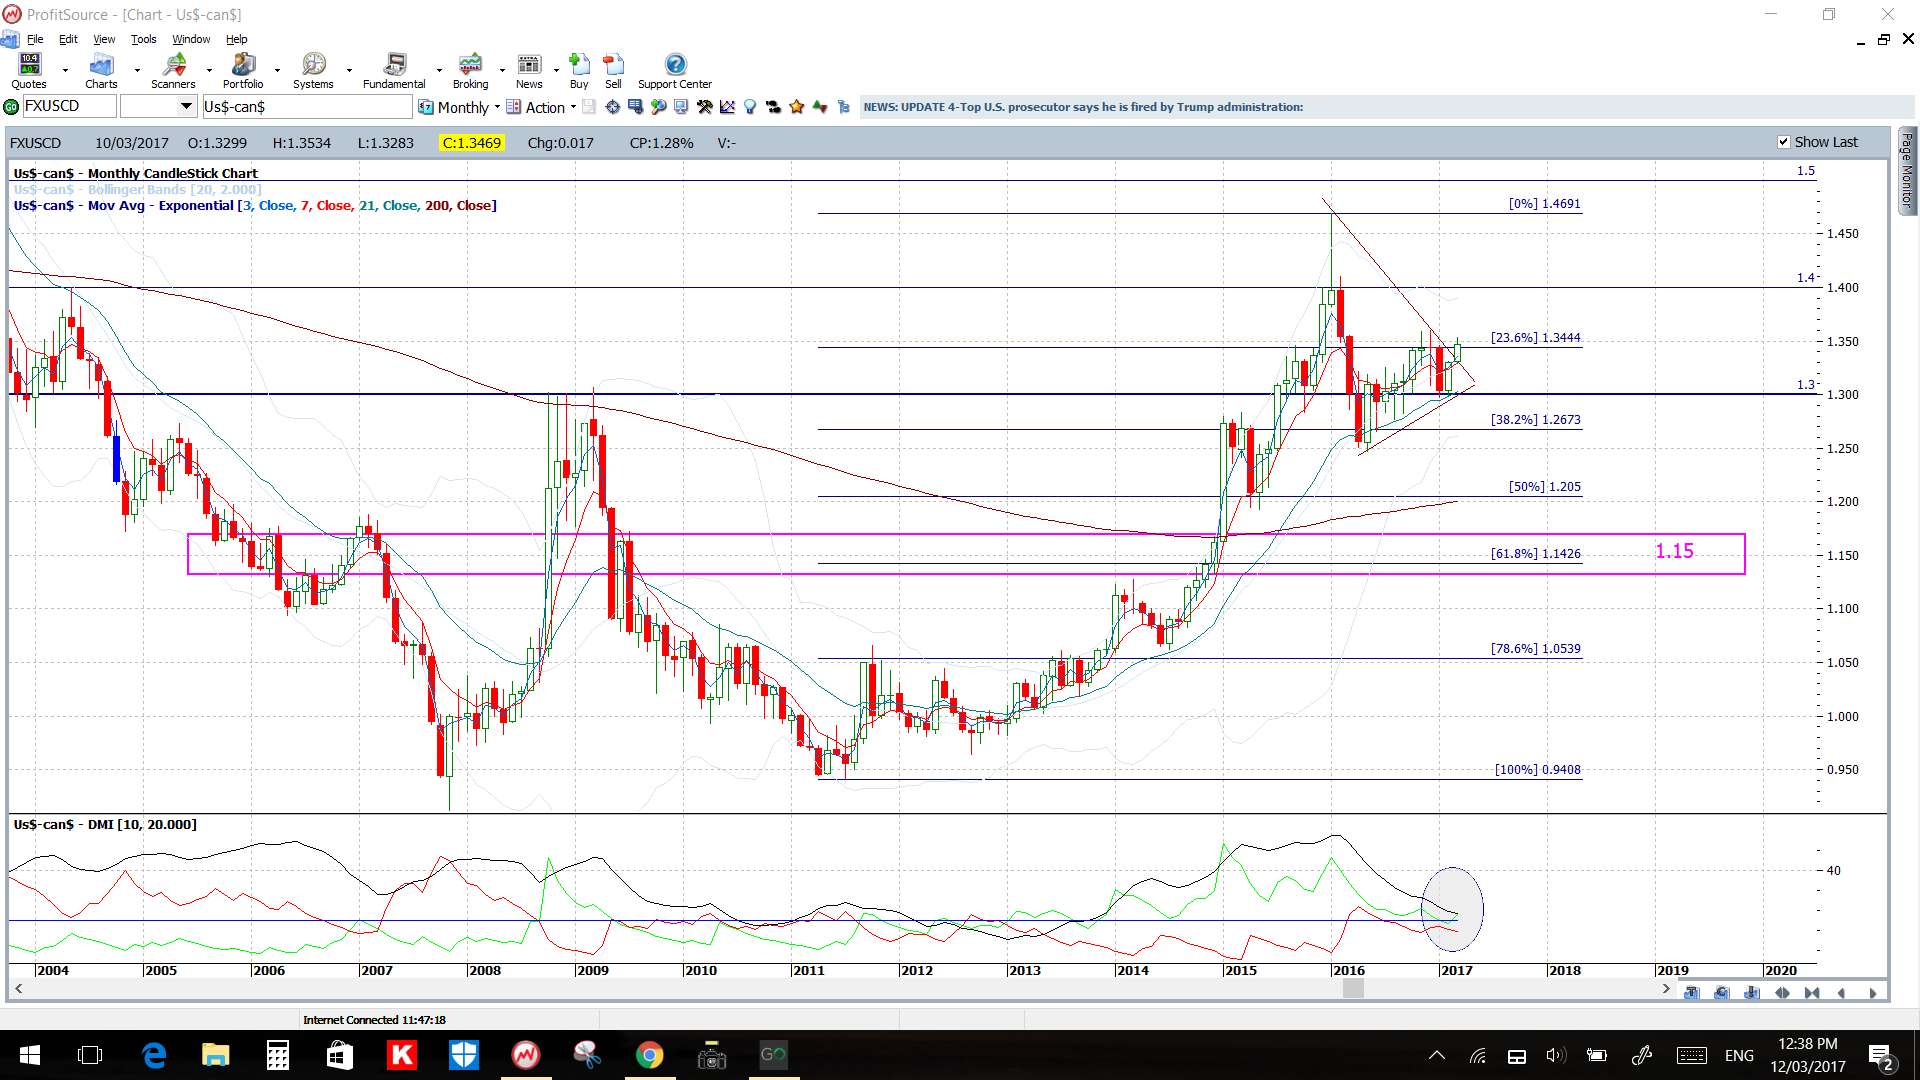
USD/CAD: I’m a bit lost with this pair as it continues within the long-term ascending channel. A look at the monthly chart though paints a bit of a different picture as I’ve had a triangle on this time frame chart. A close and hold out of this triangle for March might take over the long suffering ascending channel!
USD/CAD 4hr:
USD/CAD monthly:
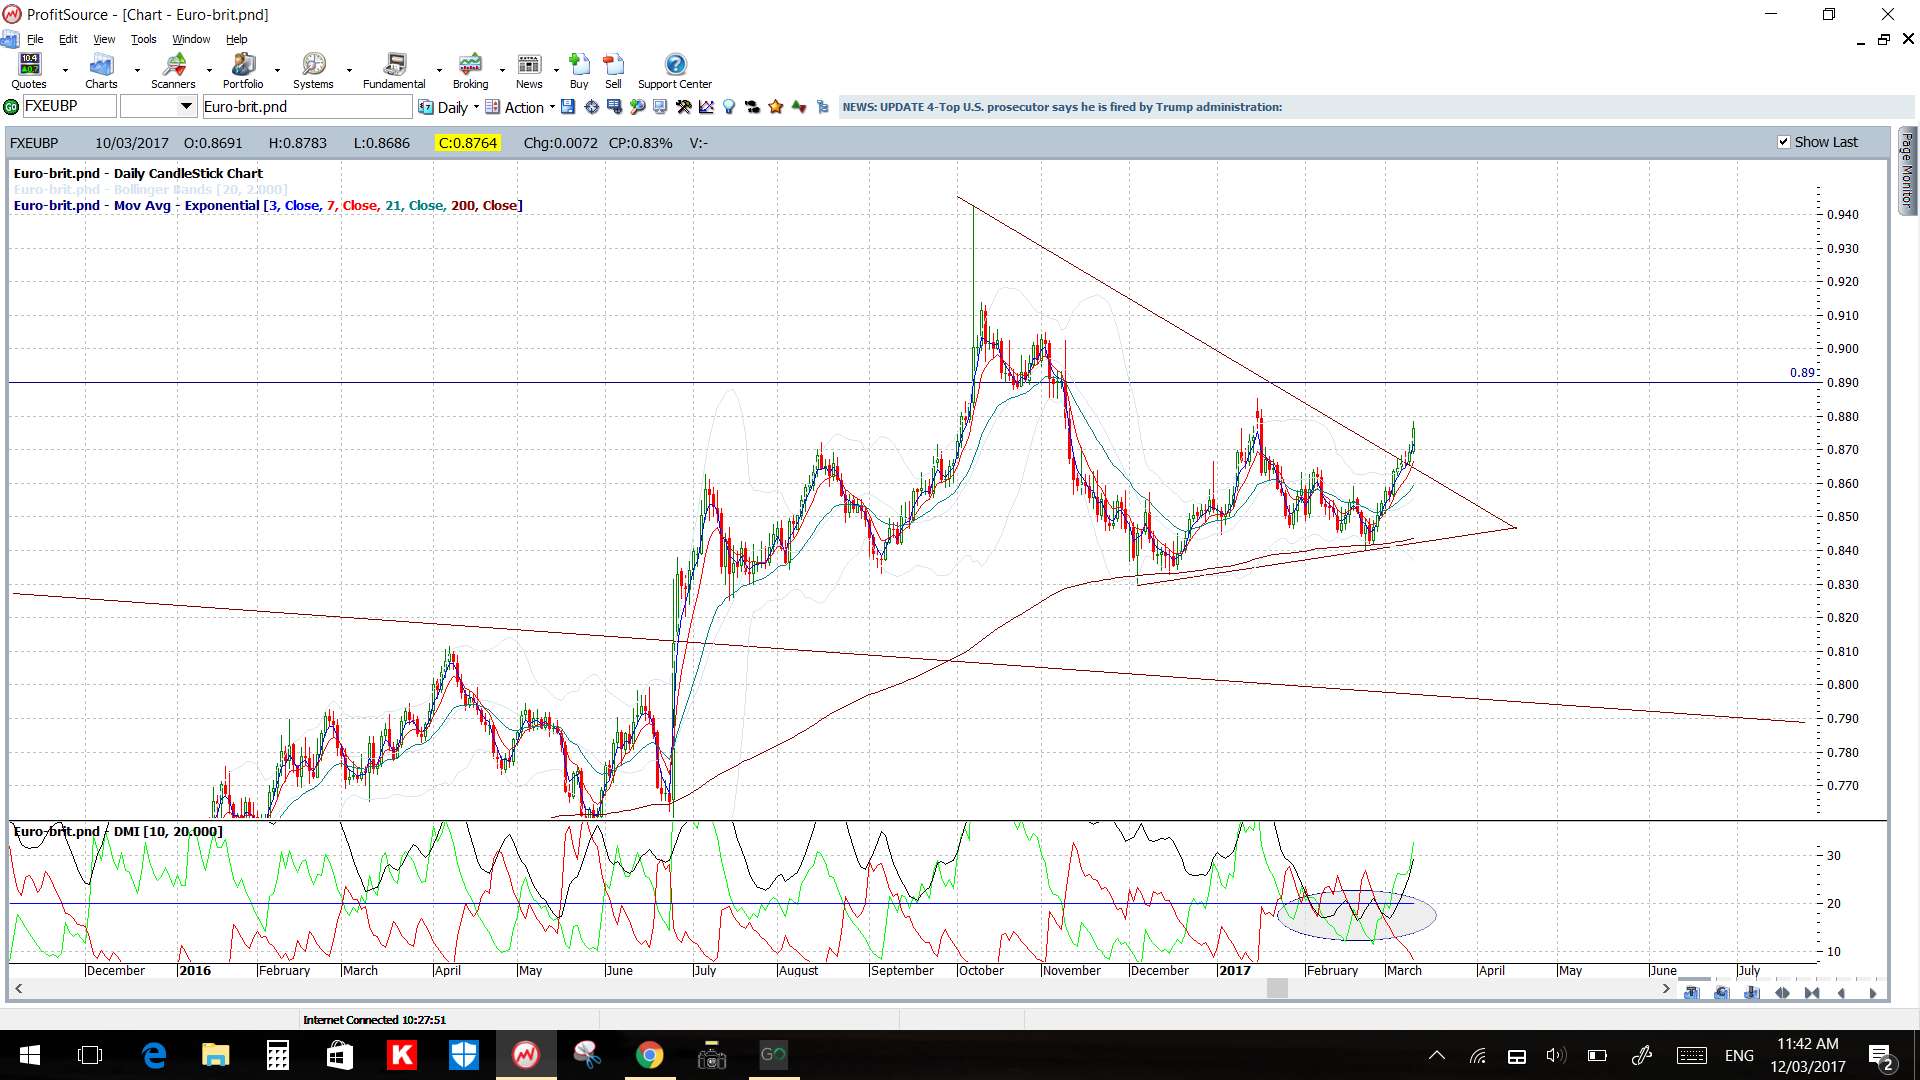
EUR/GBP: there was a bullish breakout from the triangle posted in last week’s update that gave 140 pips. The previous S/R level of 0.89 is about 130 pips above current price and might be the ultimate target for this bullish breakout move:
E/G 4hr:
E/G daily:
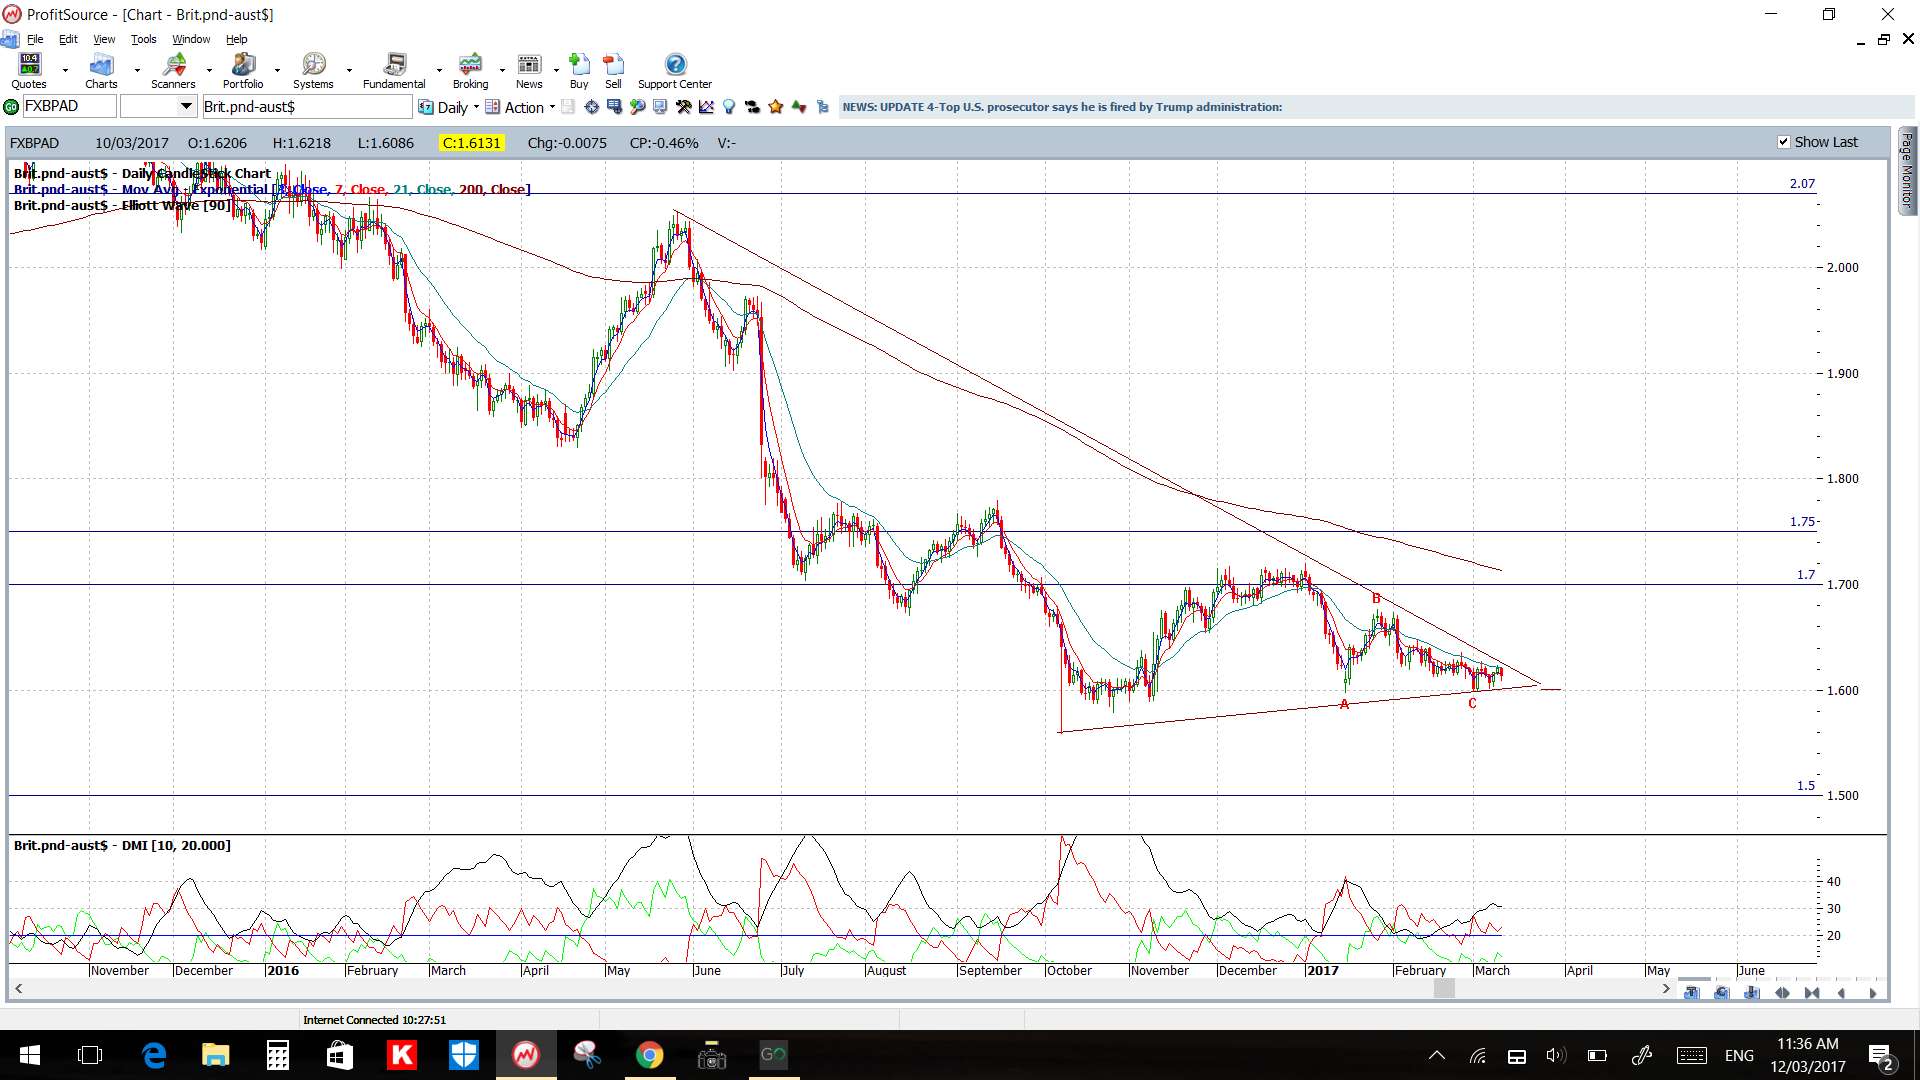
GBP/AUD: watch the 4hr chart triangle for any momentum-based breakout move:
G/A 4hr:
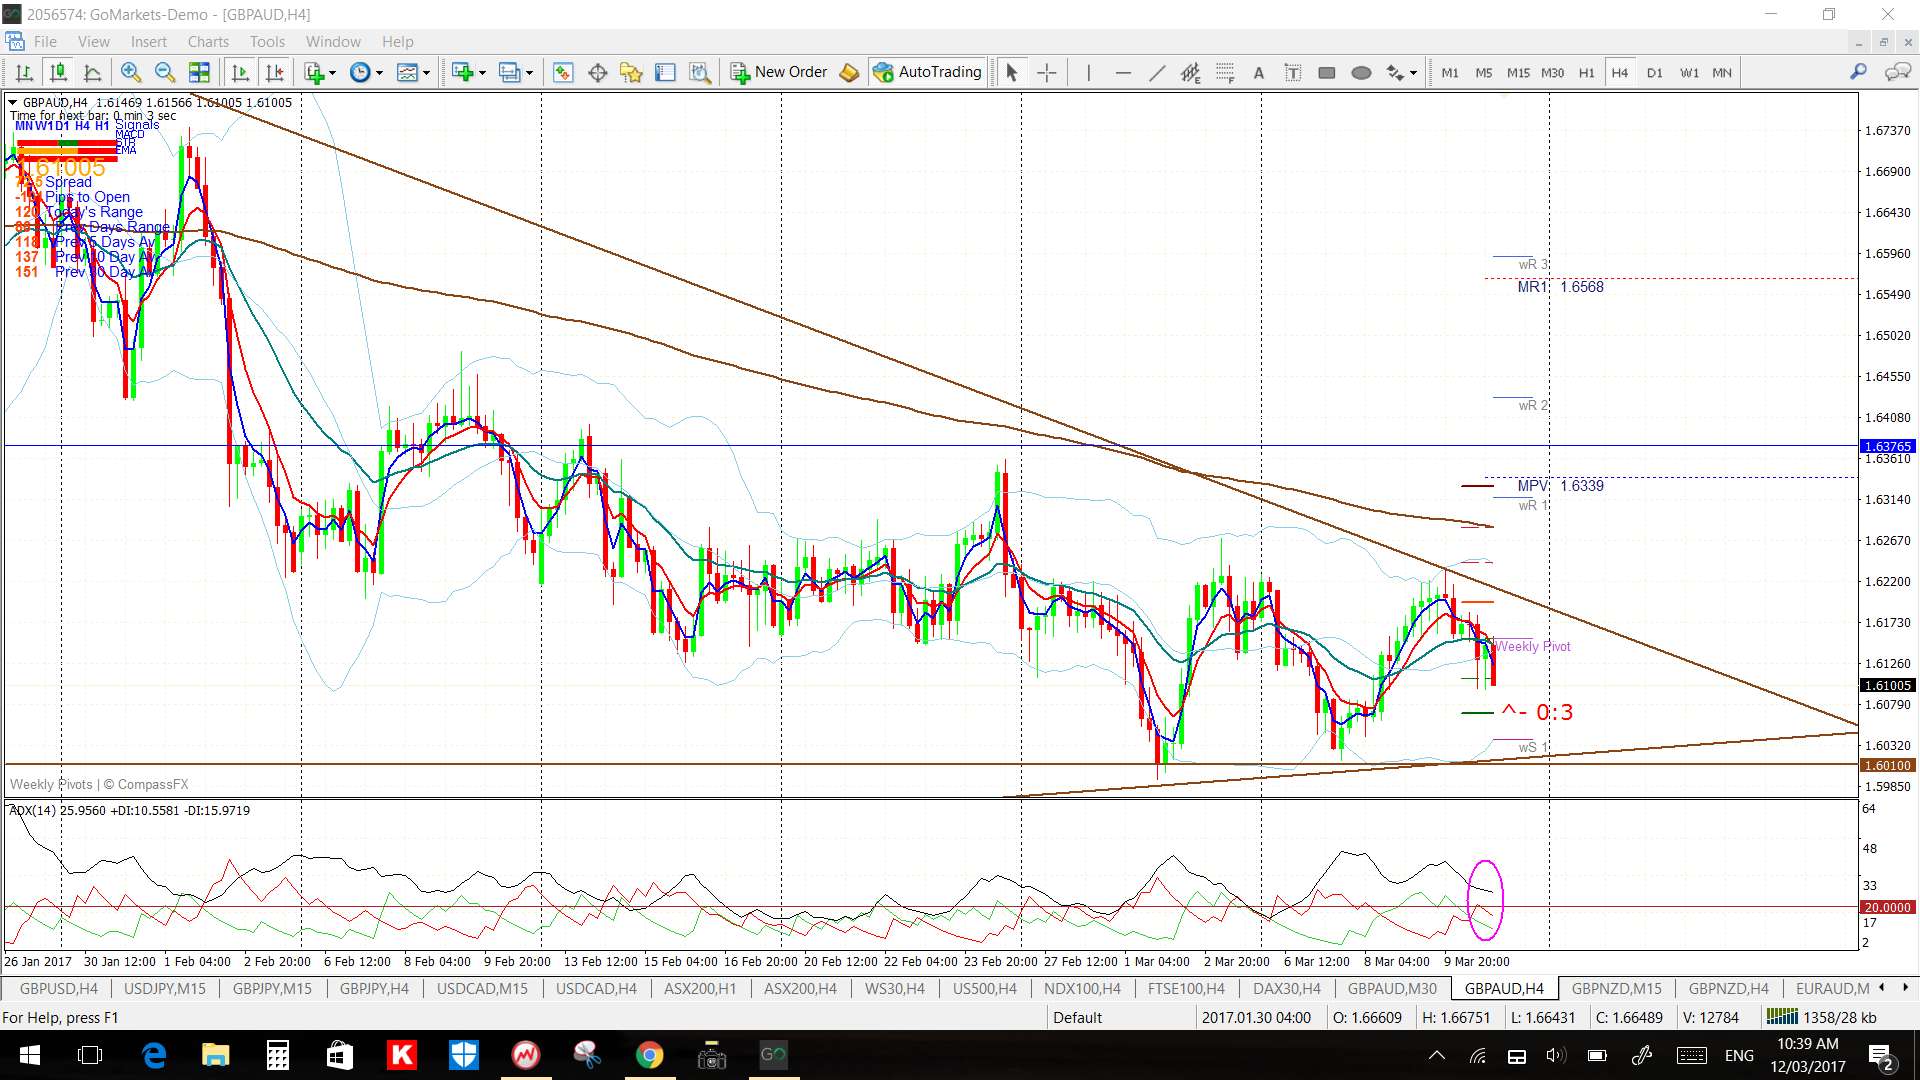
G/A daily:
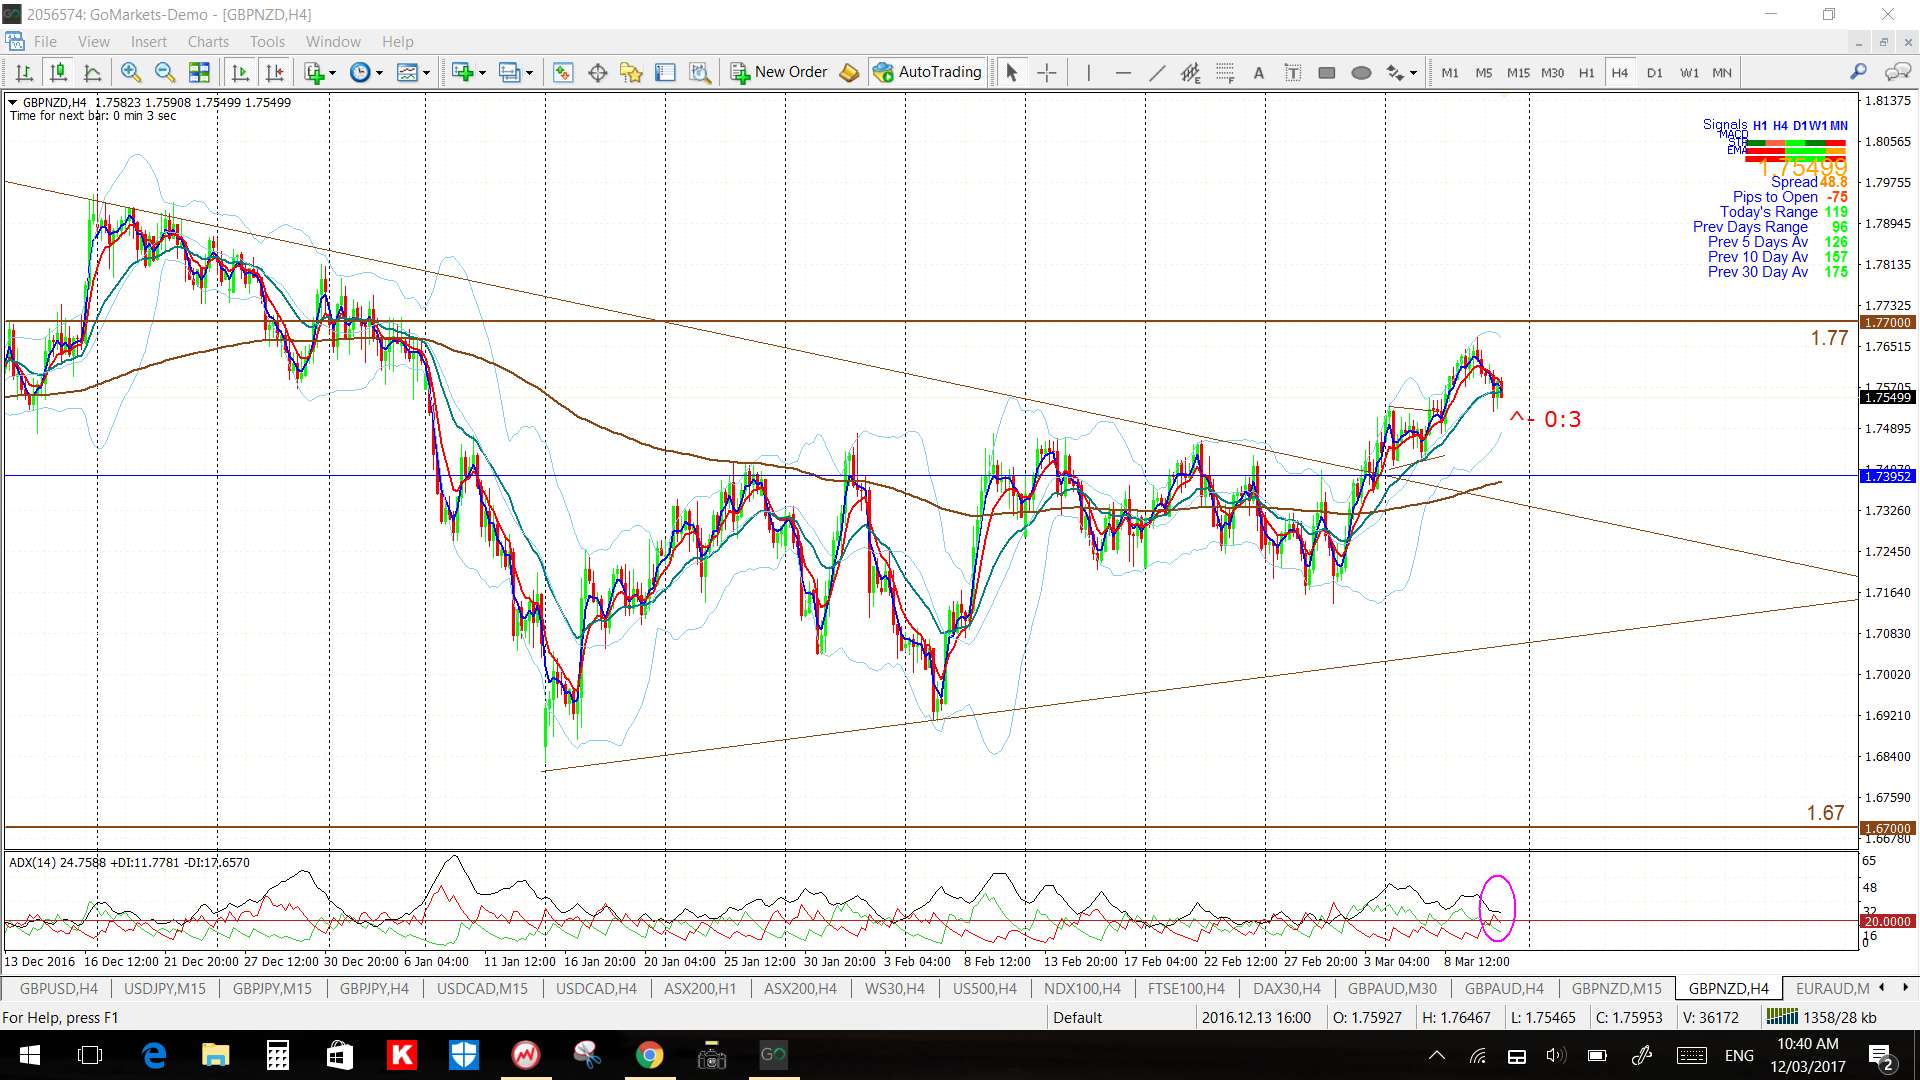
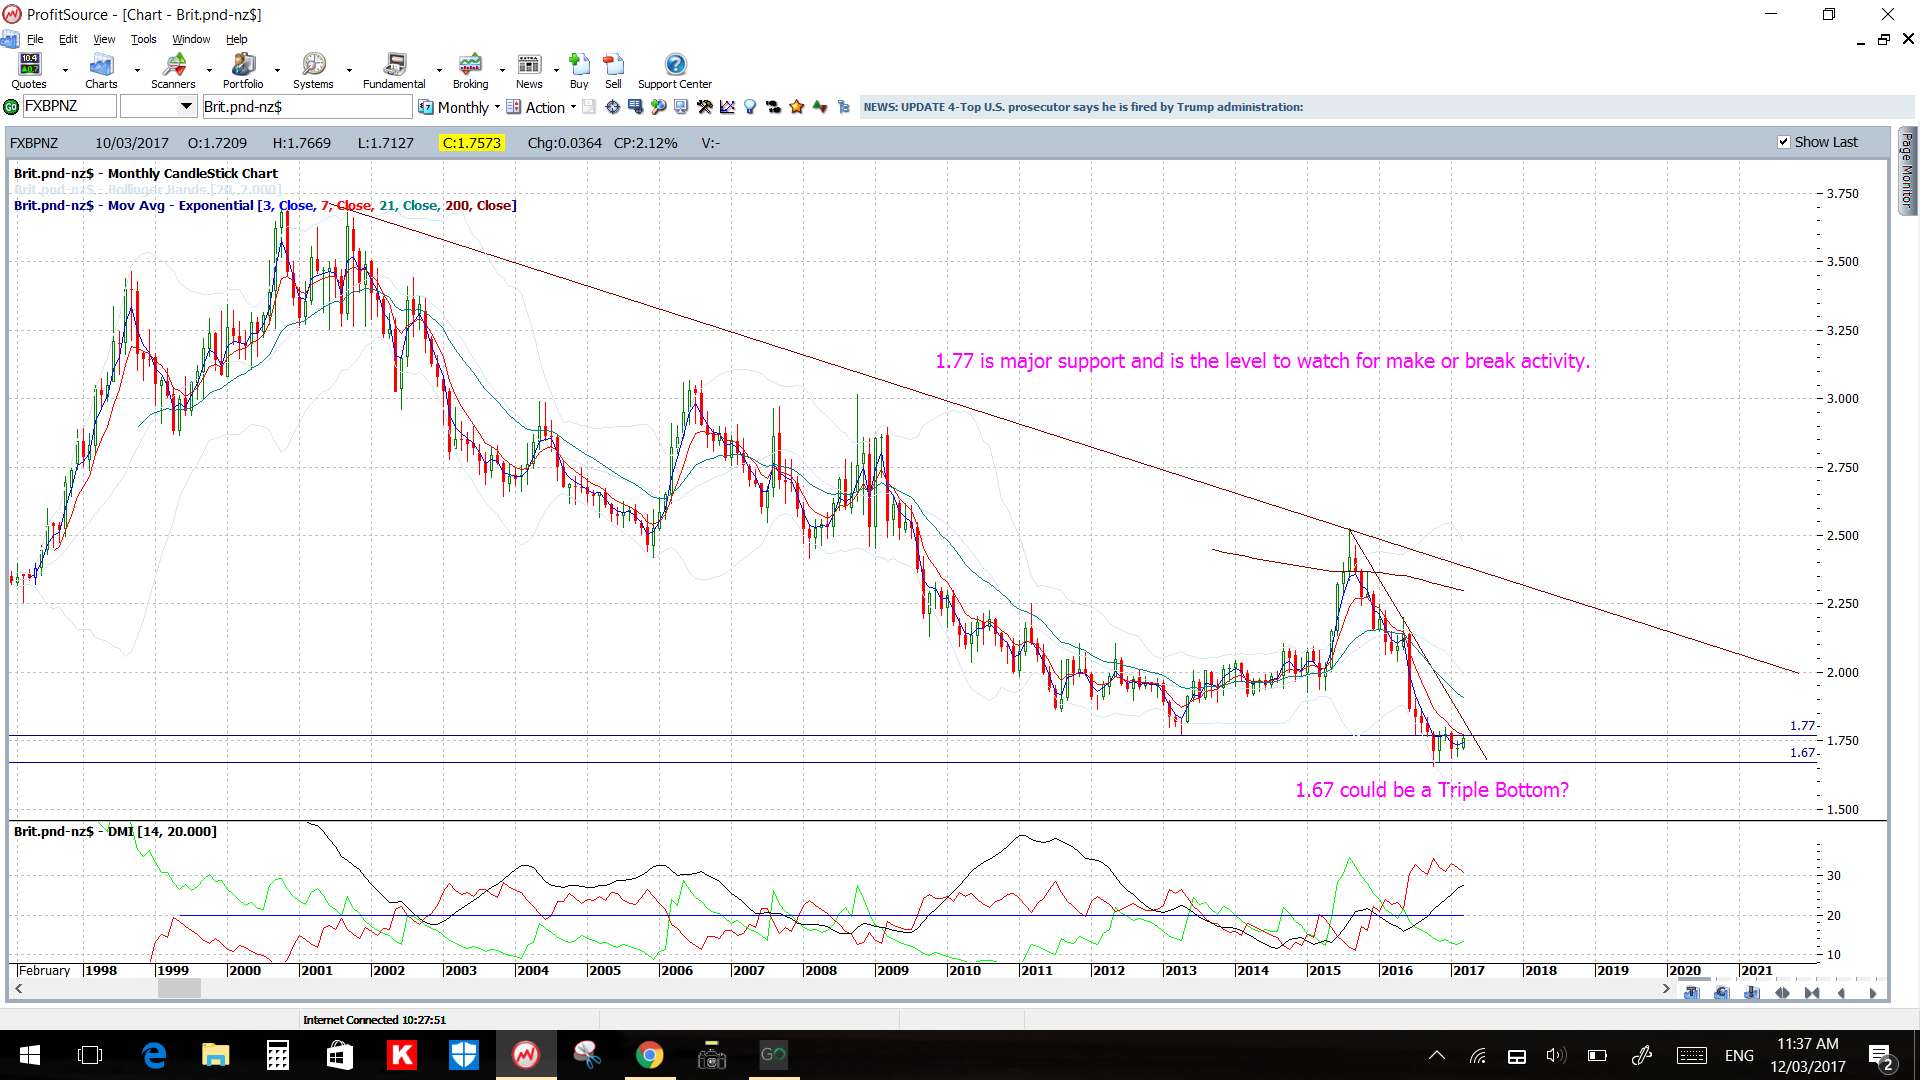
GBP/NZD: there has been a recent triangle breakout here but note where price action stalled! At the previous S/R level of 1.77 and this level has been a feature on my monthly chart for a long time. Thus, 1.77 may be the level to watch in coming sessions for any make or break activity;
G/N 4hr:
G/N monthly:
EUR/AUD: this bullish recovery move seems like it might continue:
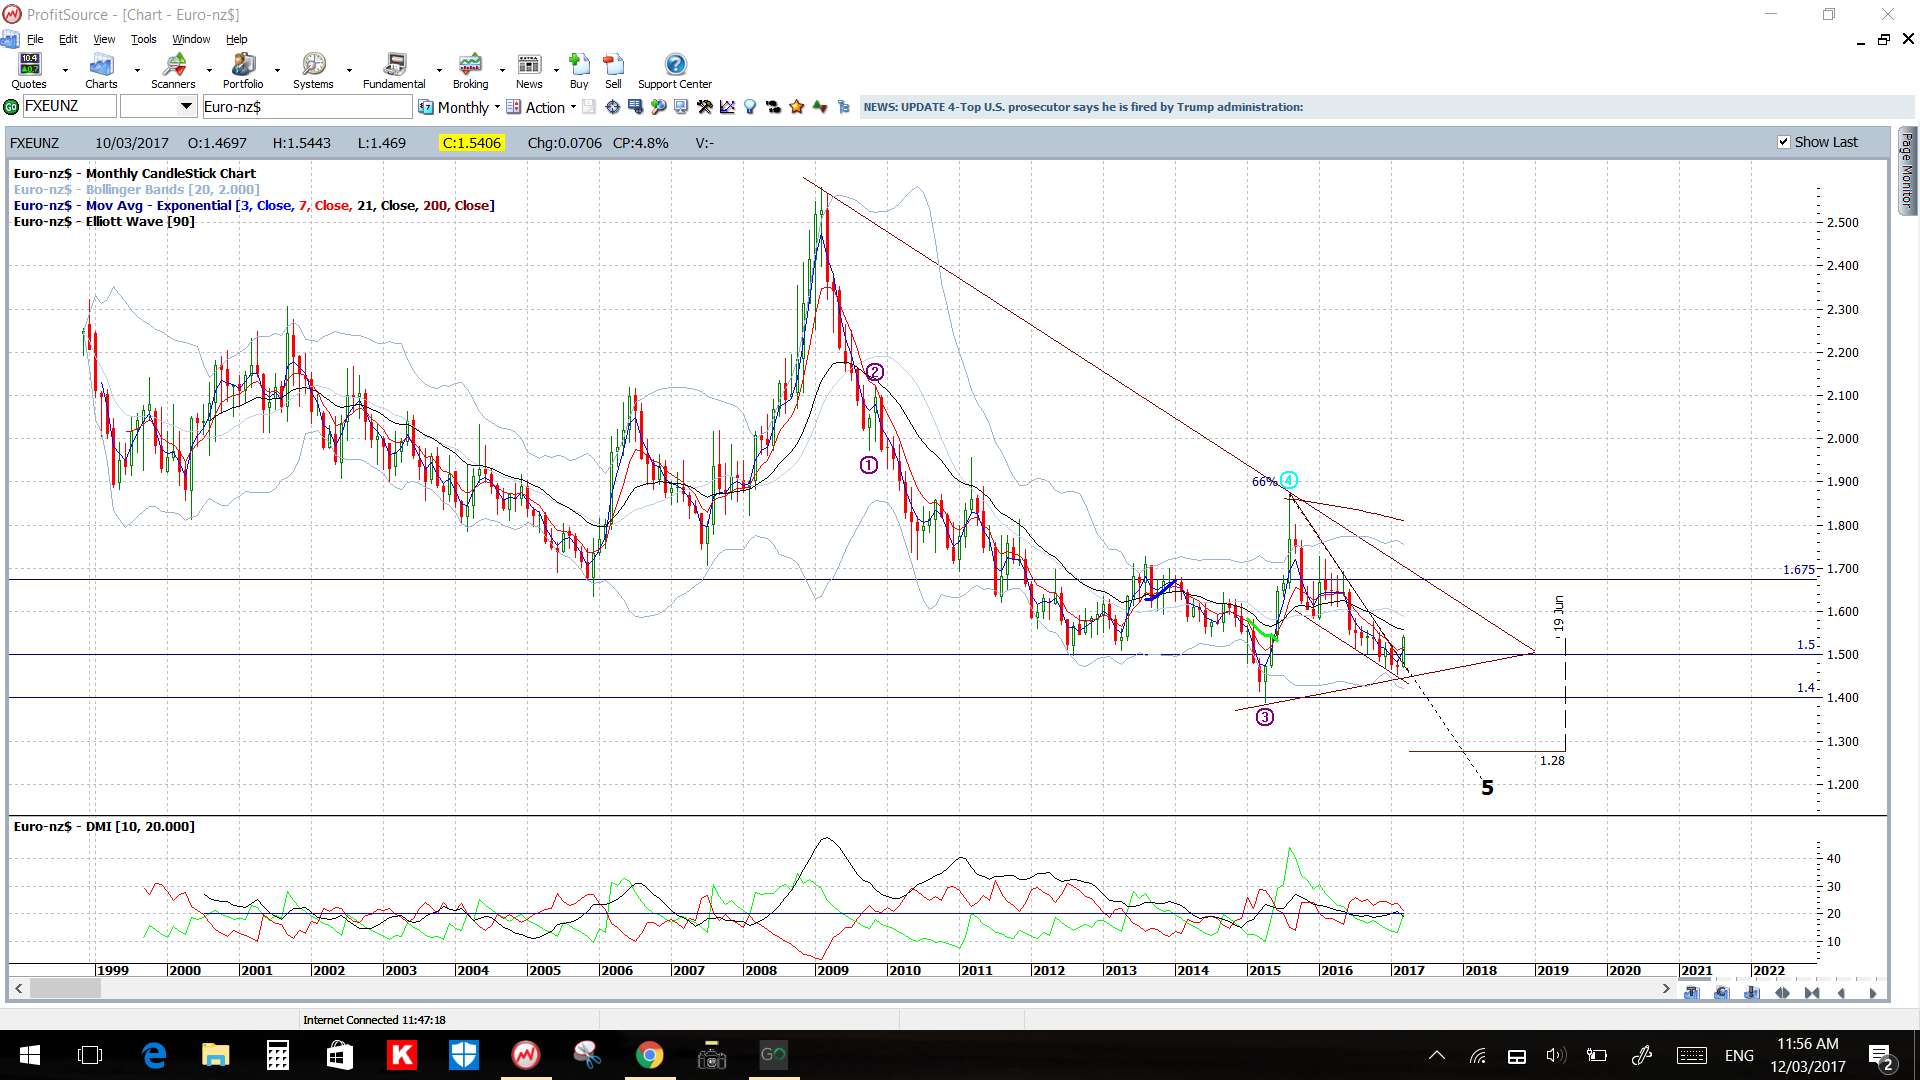
EUR/NZD: ditto here but note how the monthly chart shows previous S/R up near 1.675 and how this also intersects near another monthly chart bear triangle trend line. Thus, bullish continuation might target this region:
E/N 4hr:
E/N monthly:
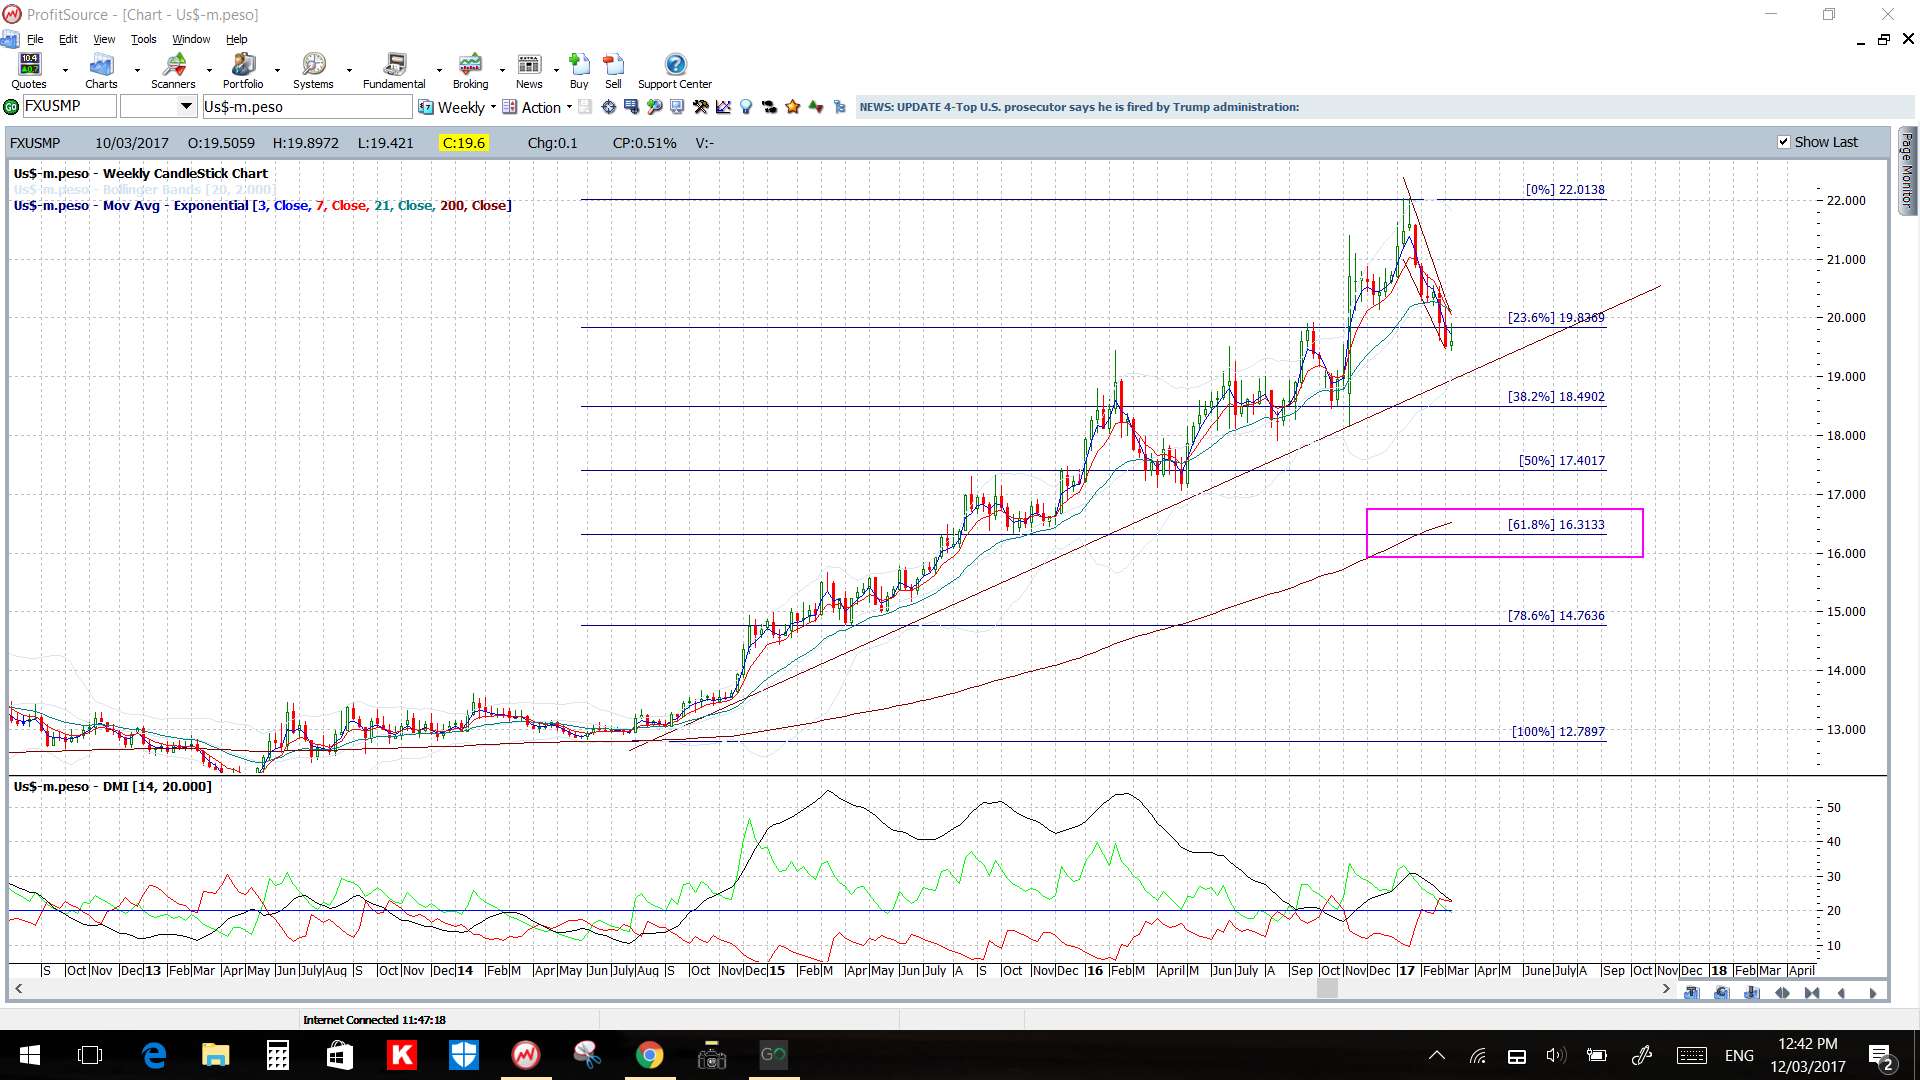
USD/MXN: watch the revised 4hr/daily chart descending channel for any momentum-based breakout move:
USD/MXN 4hr:
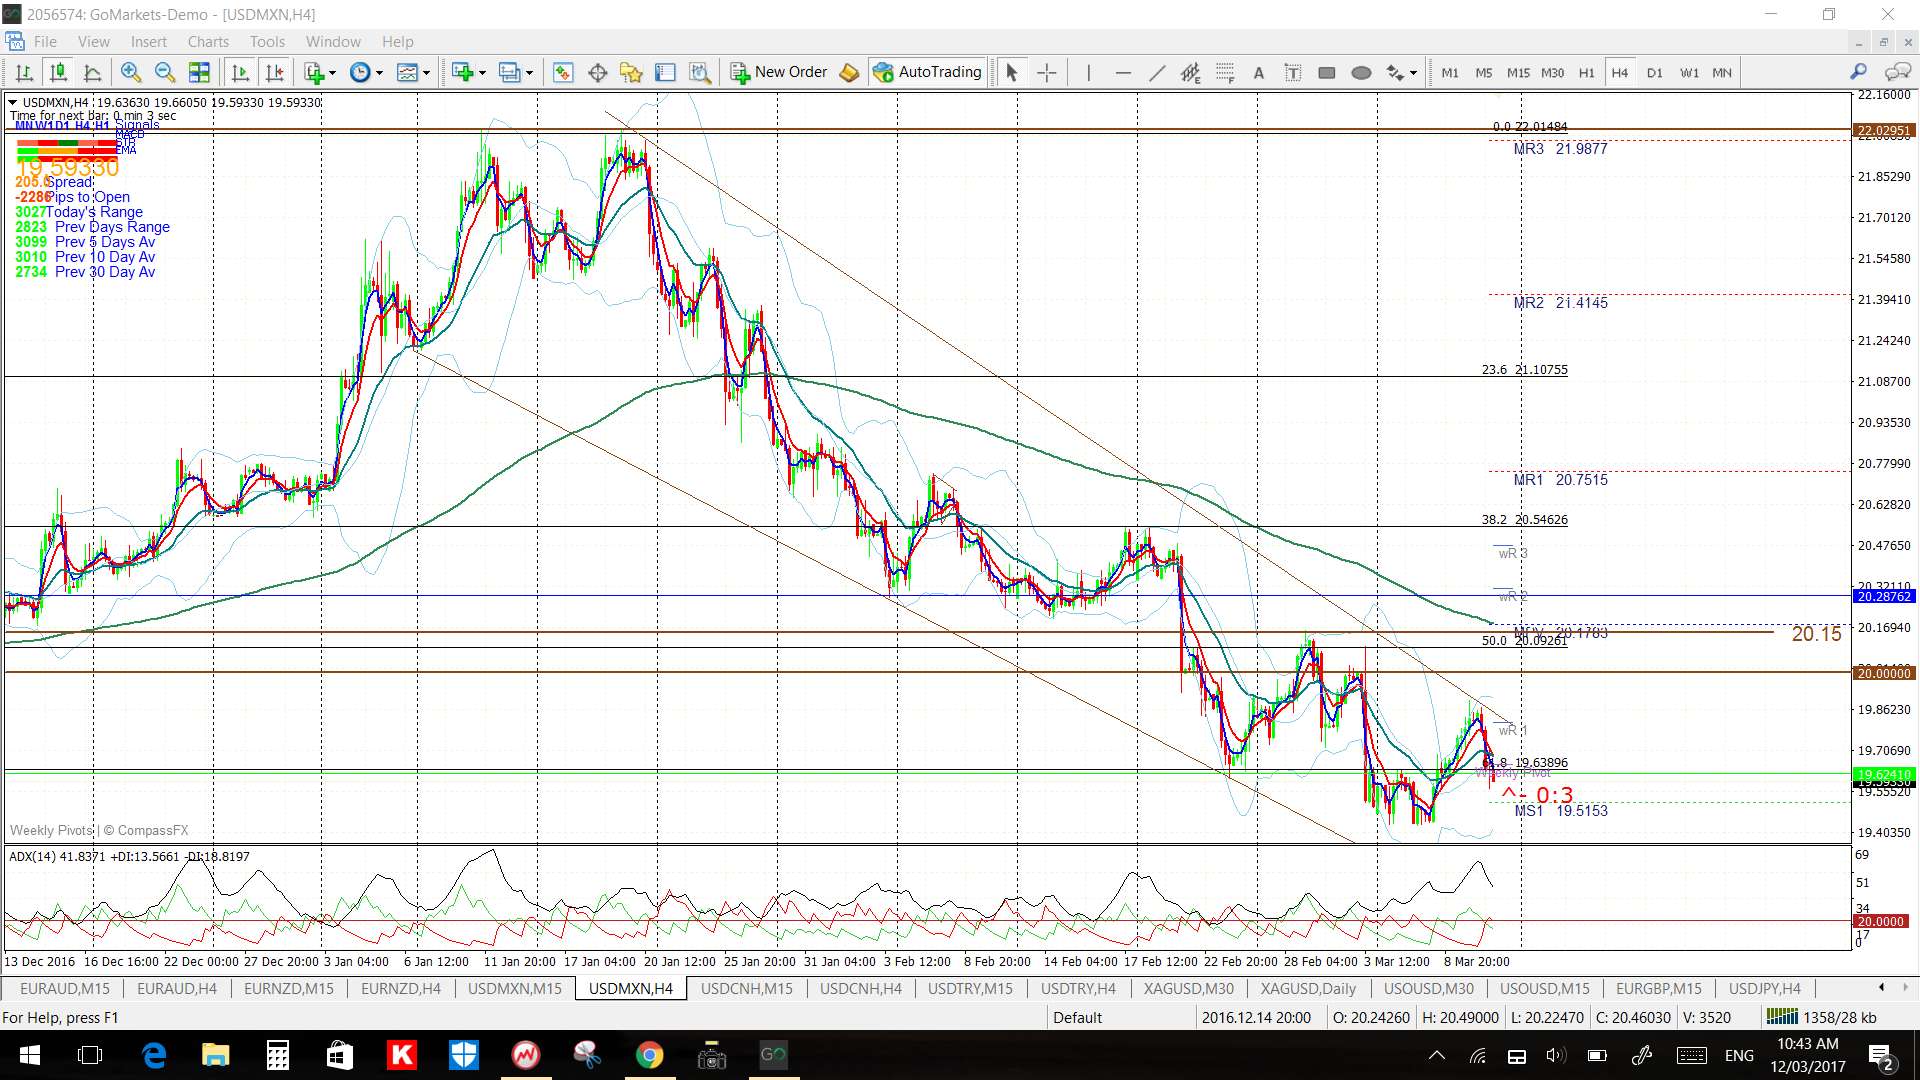
USD/MXN daily:
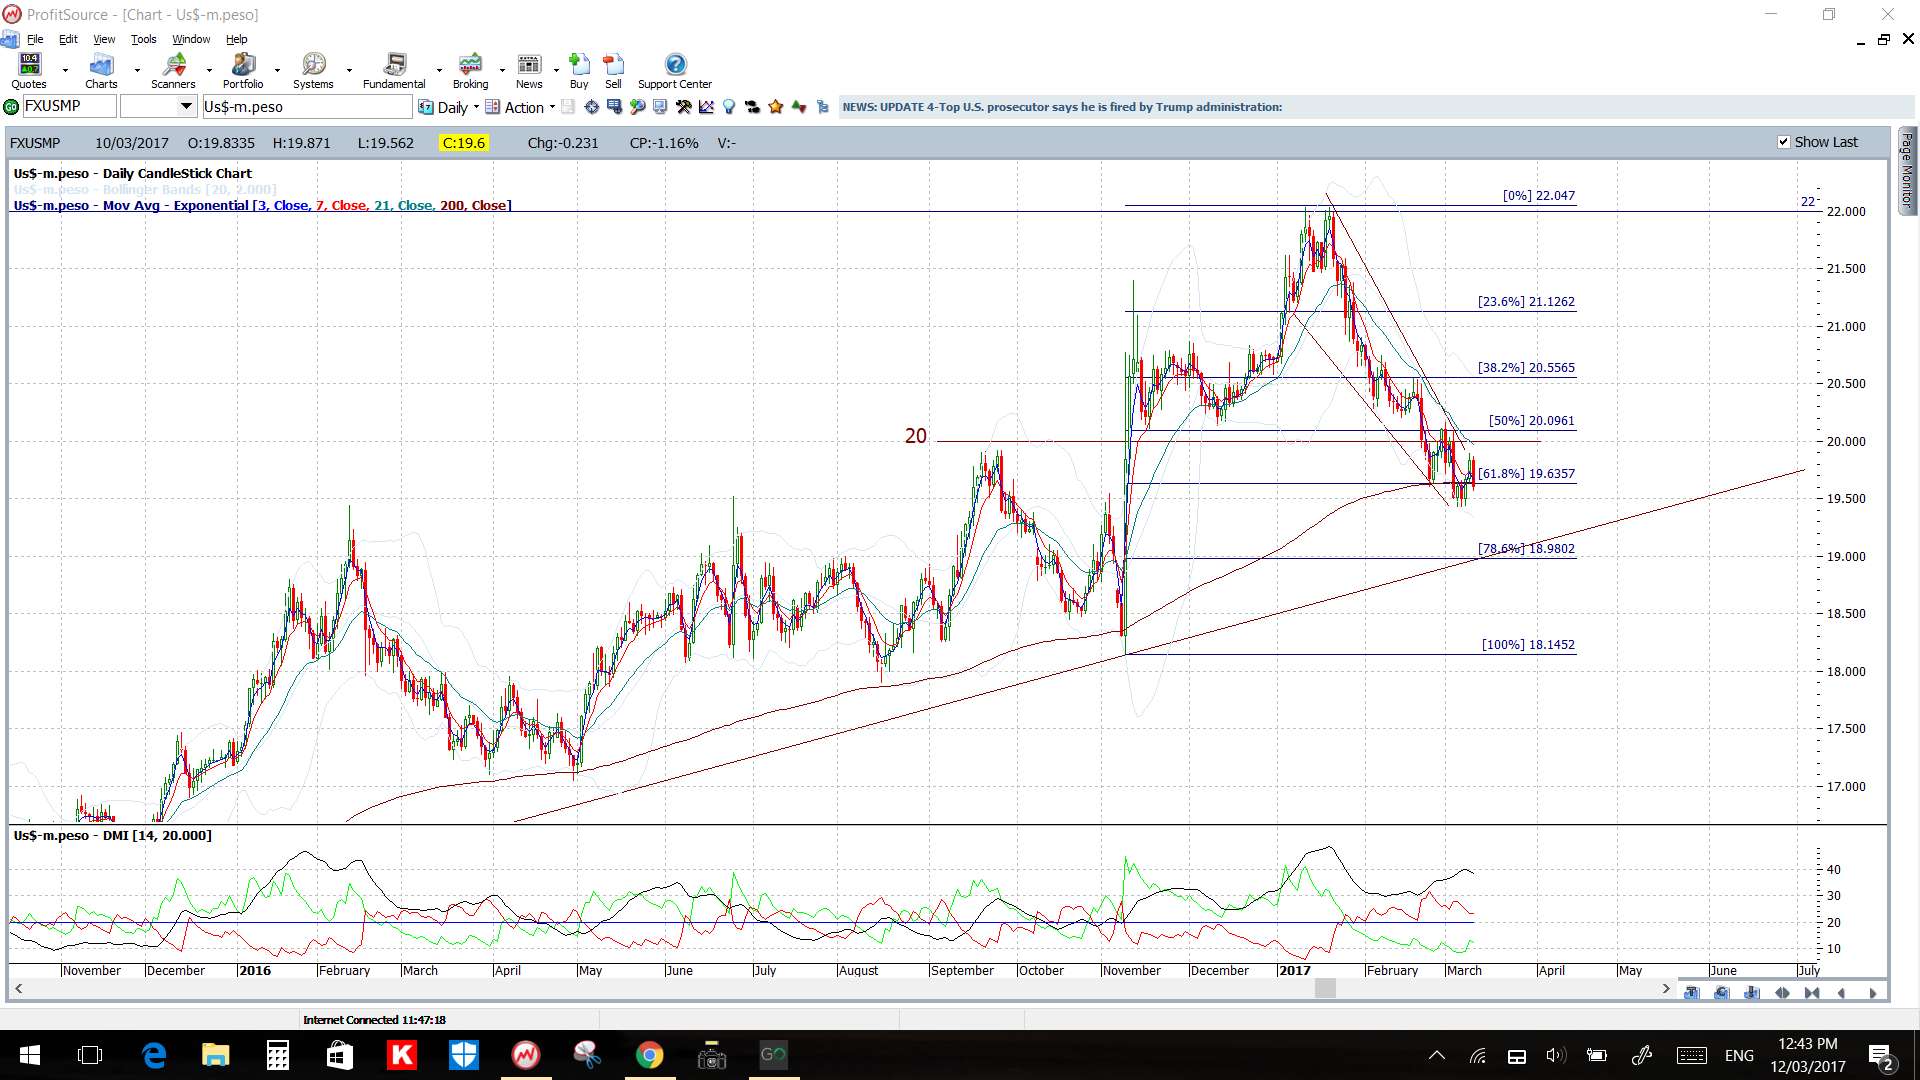
USD/MXN weekly:
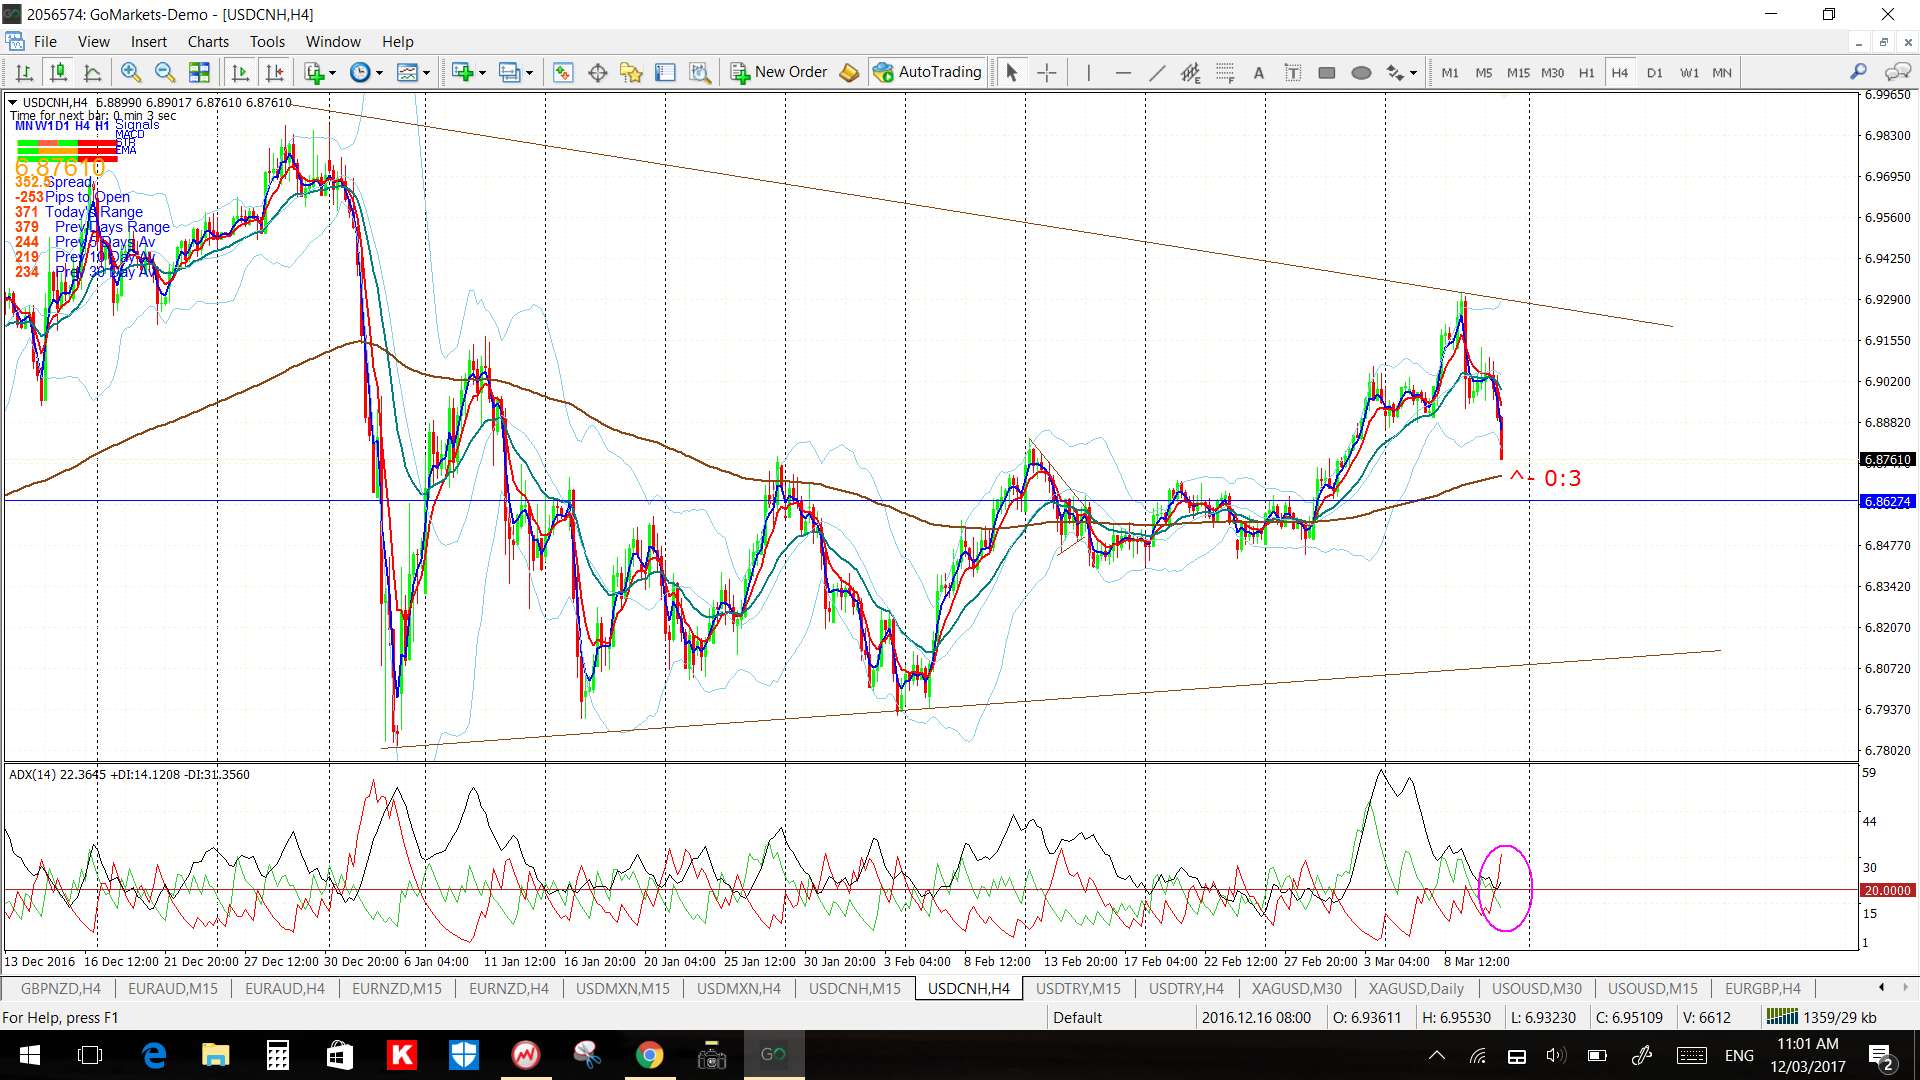
USD/CNH: watch the revised daily chart wedge for any momentum-based breakout move:
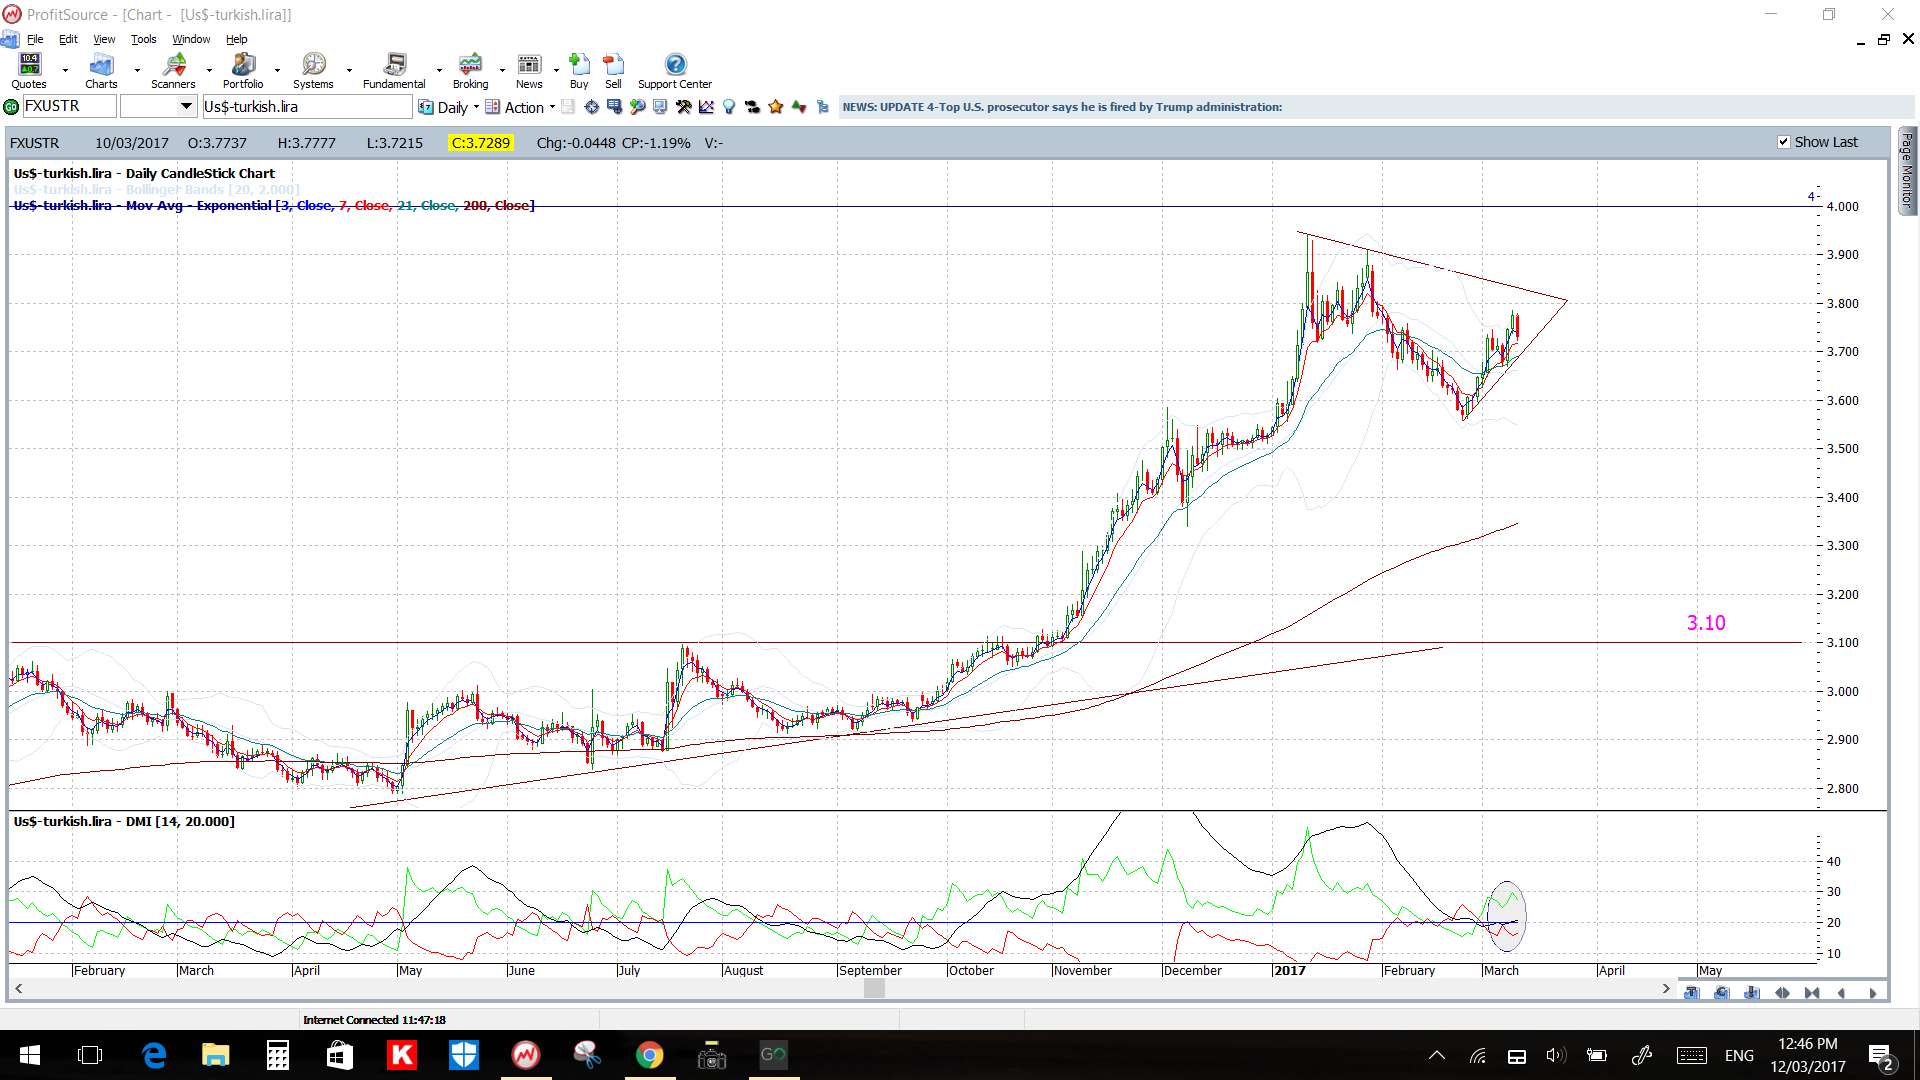
USD/TRY: watch the 4hr chart triangle for any momentum-based breakout move:
USD/TRY 4hr:
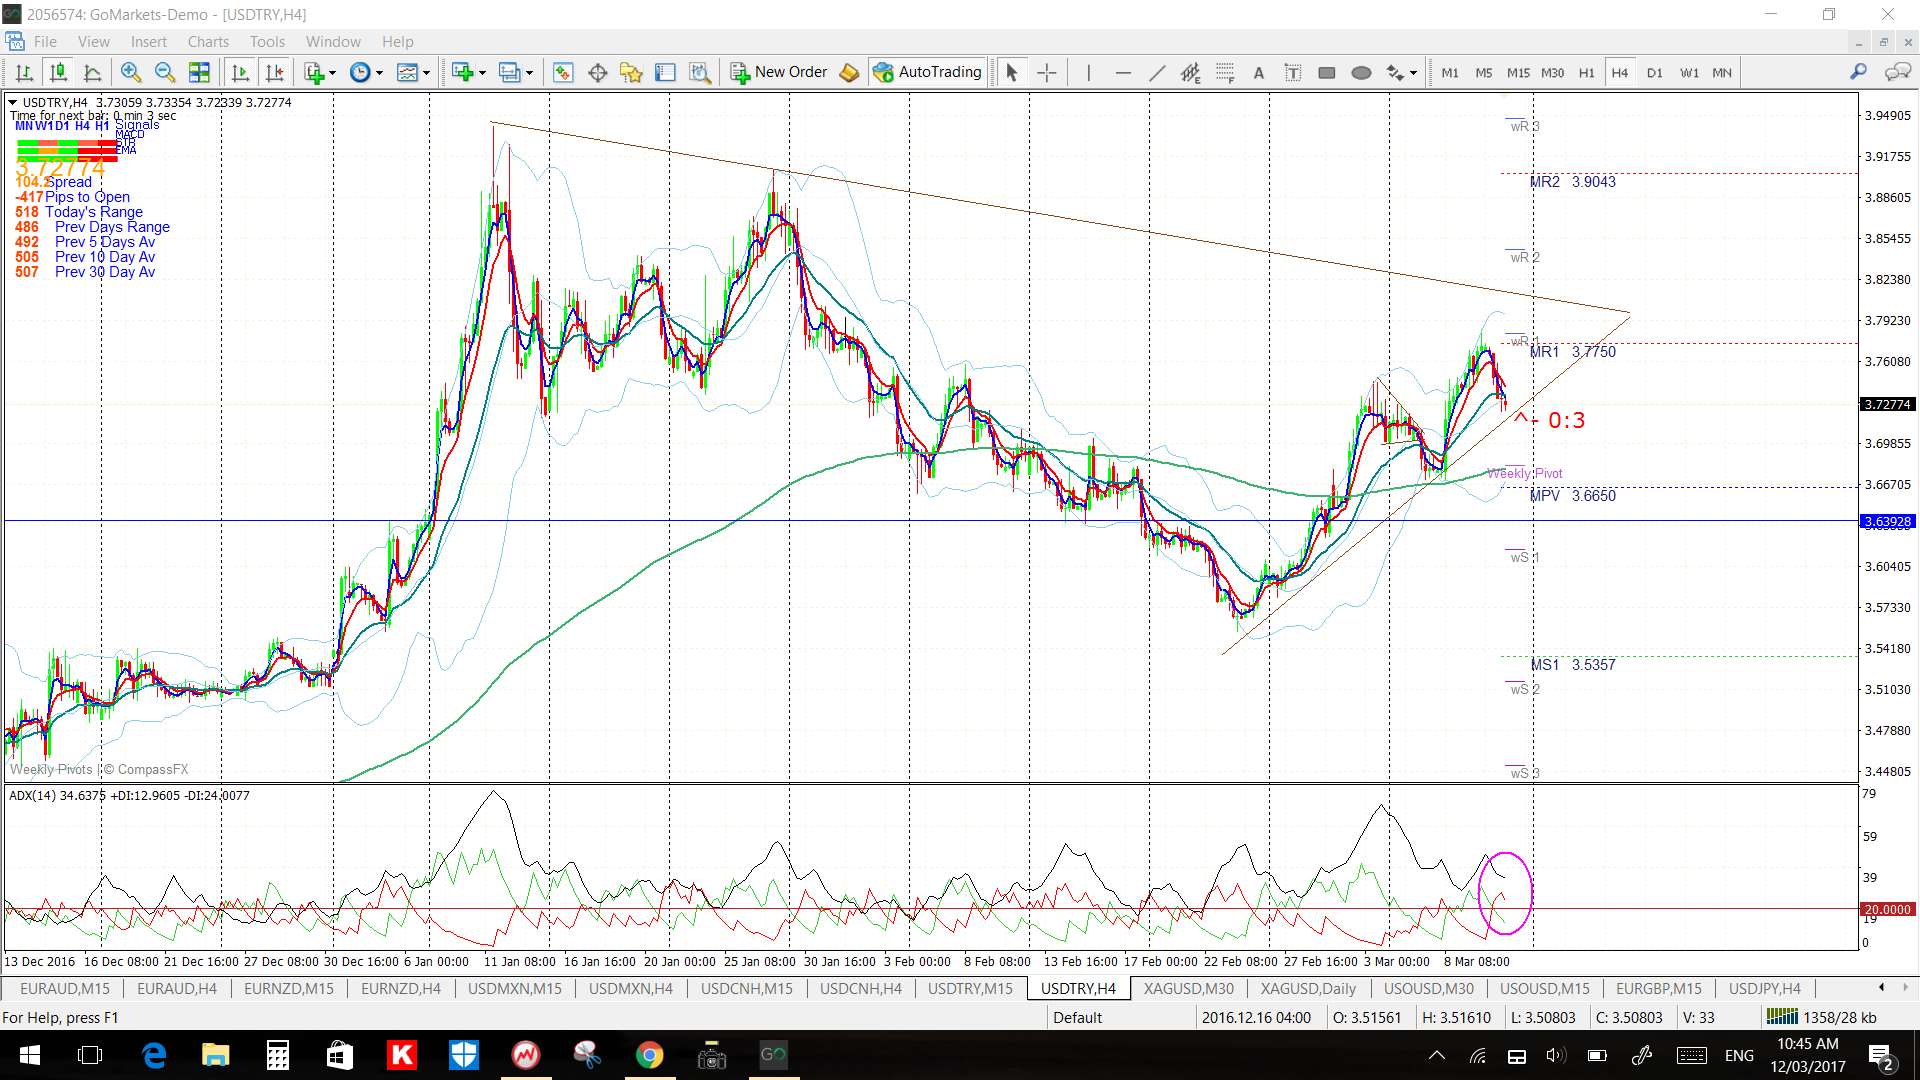
USD/TRY daily:
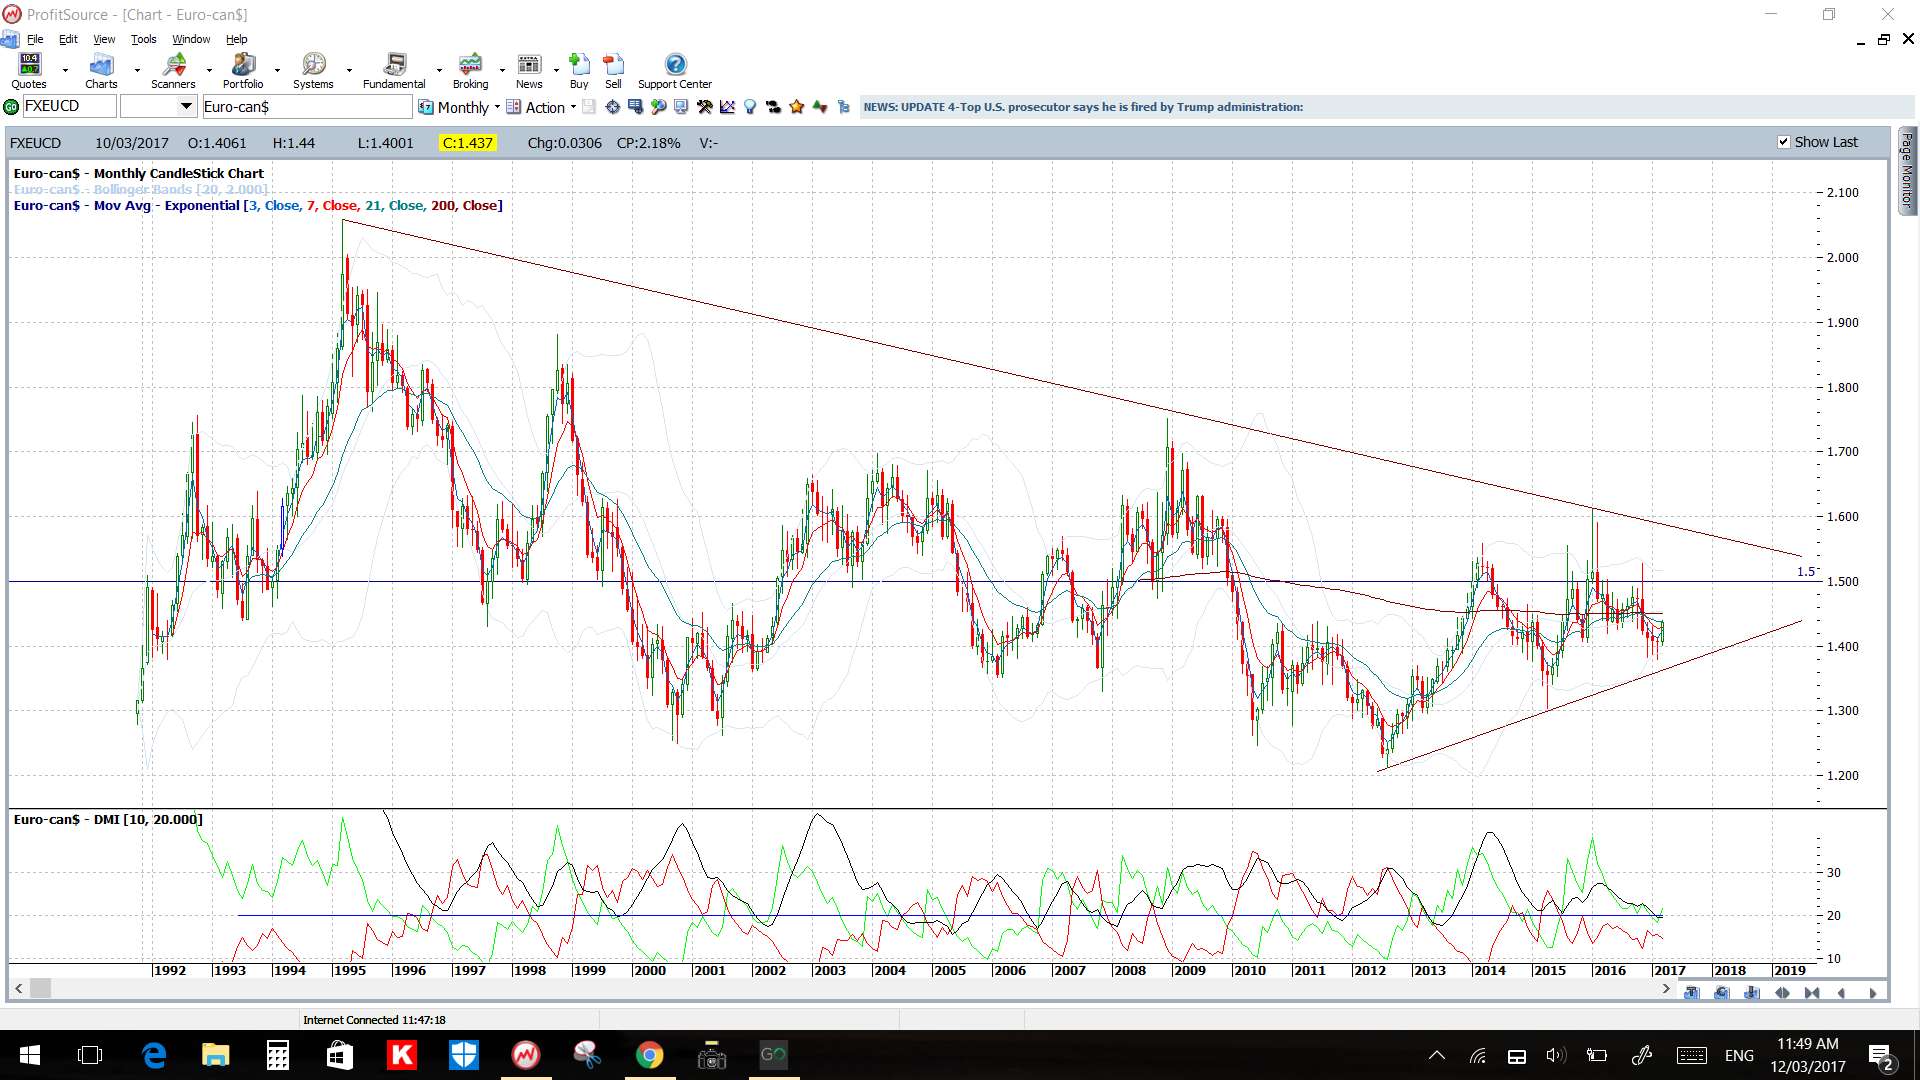
EUR/CAD monthly: I don’t trade this pair but the chart pattern is becoming more and more interesting:
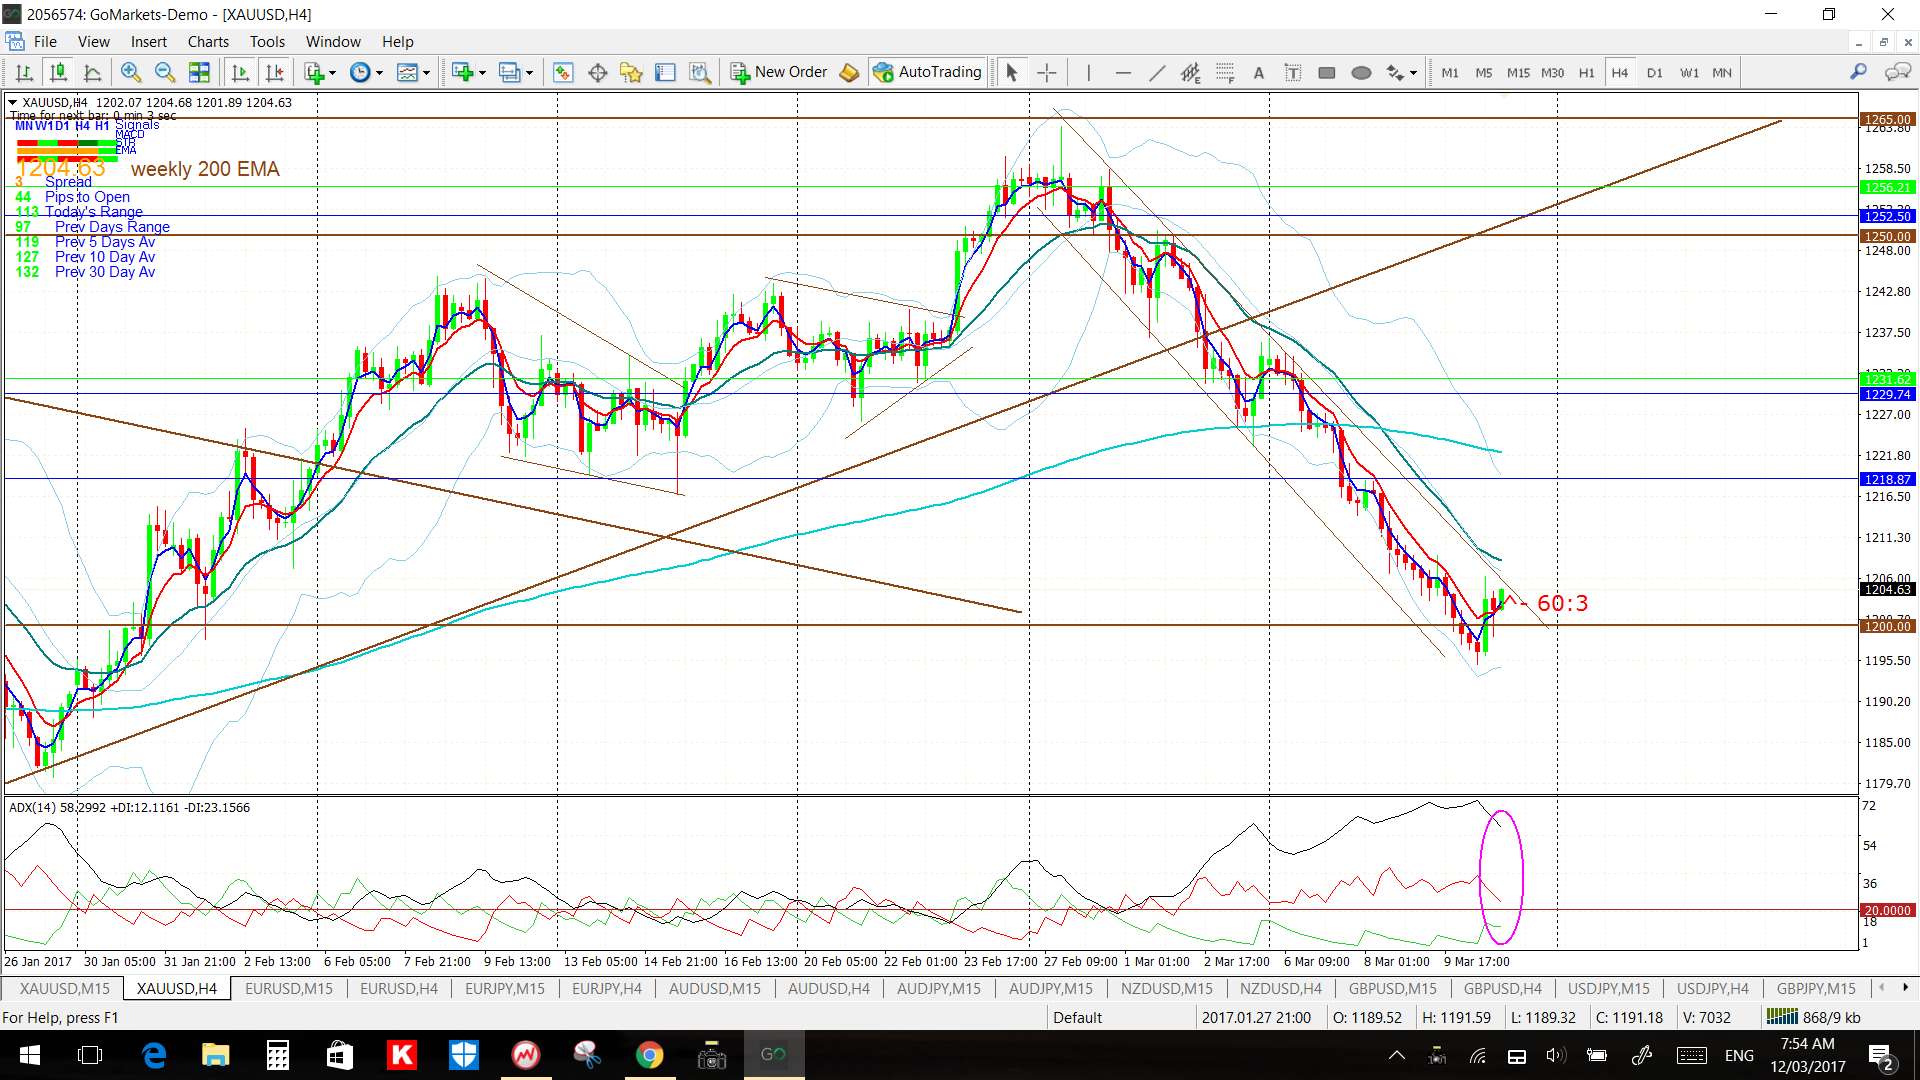
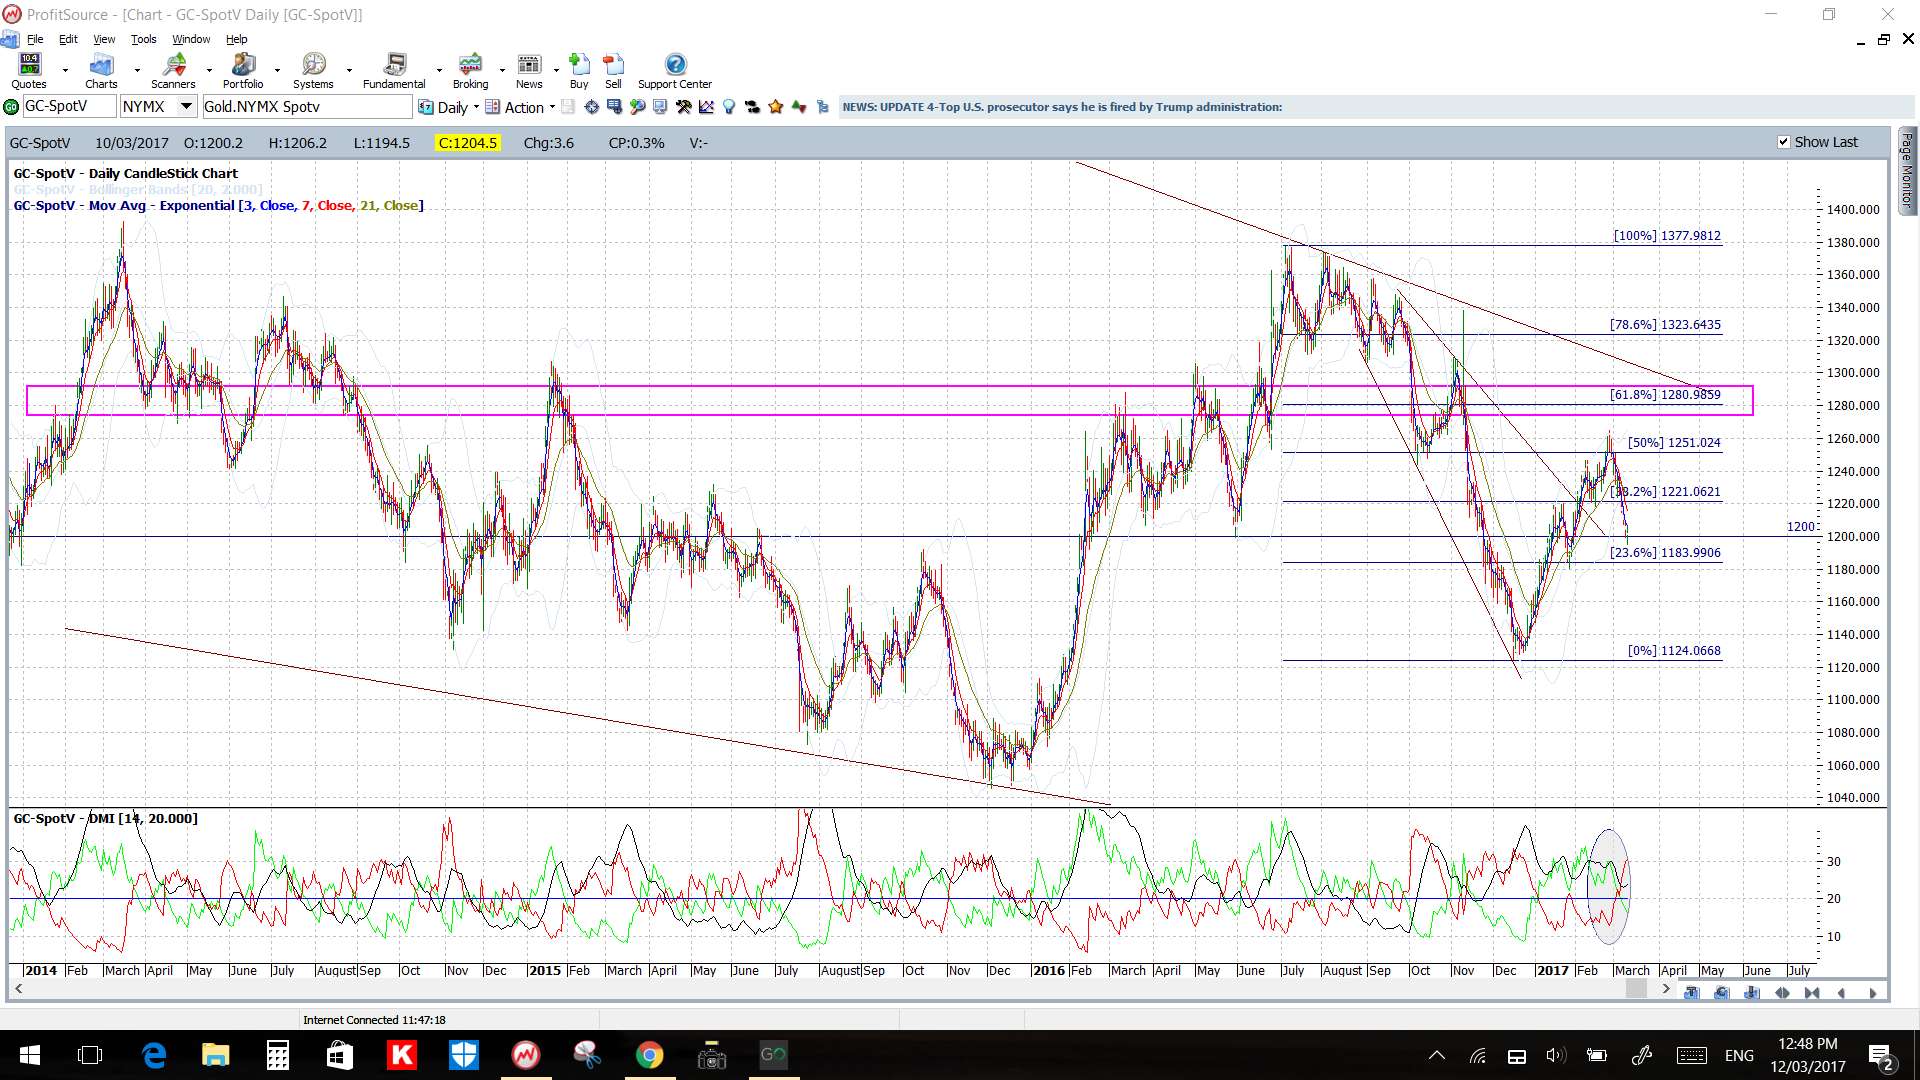
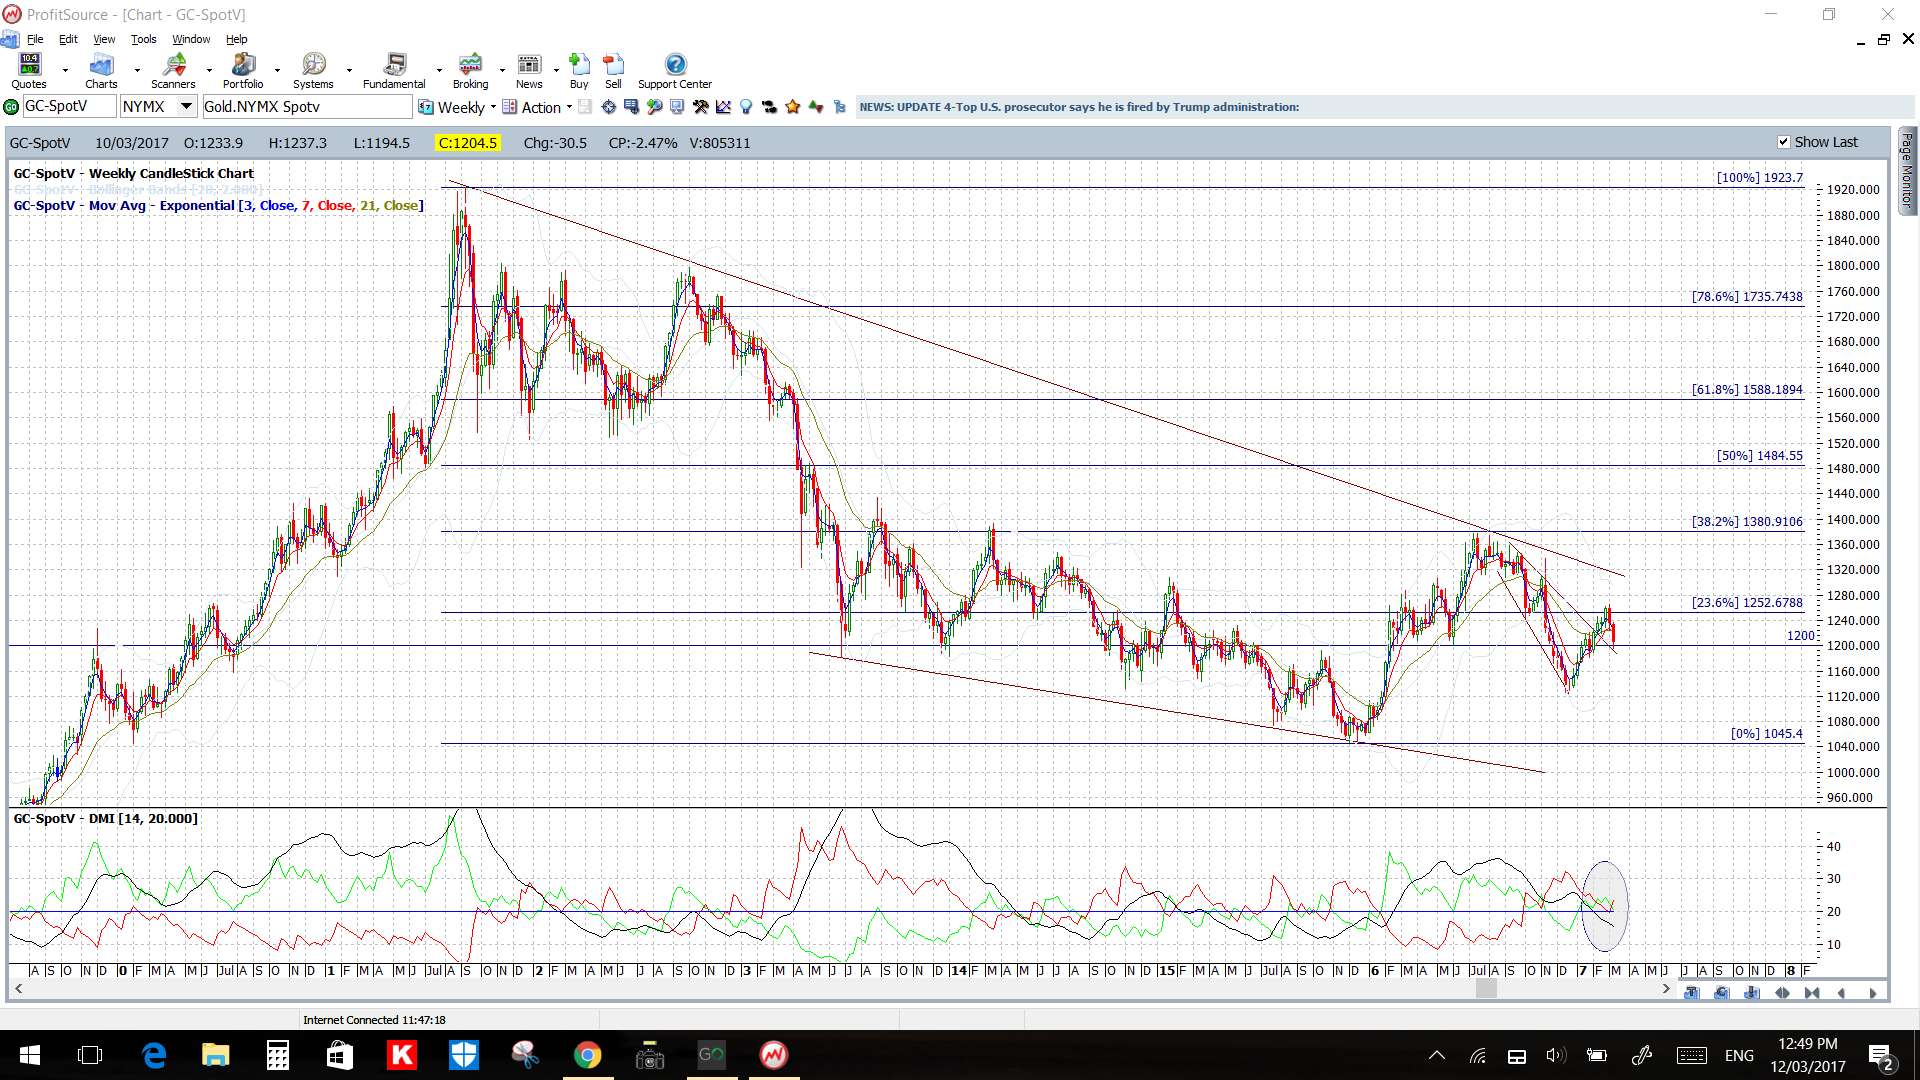
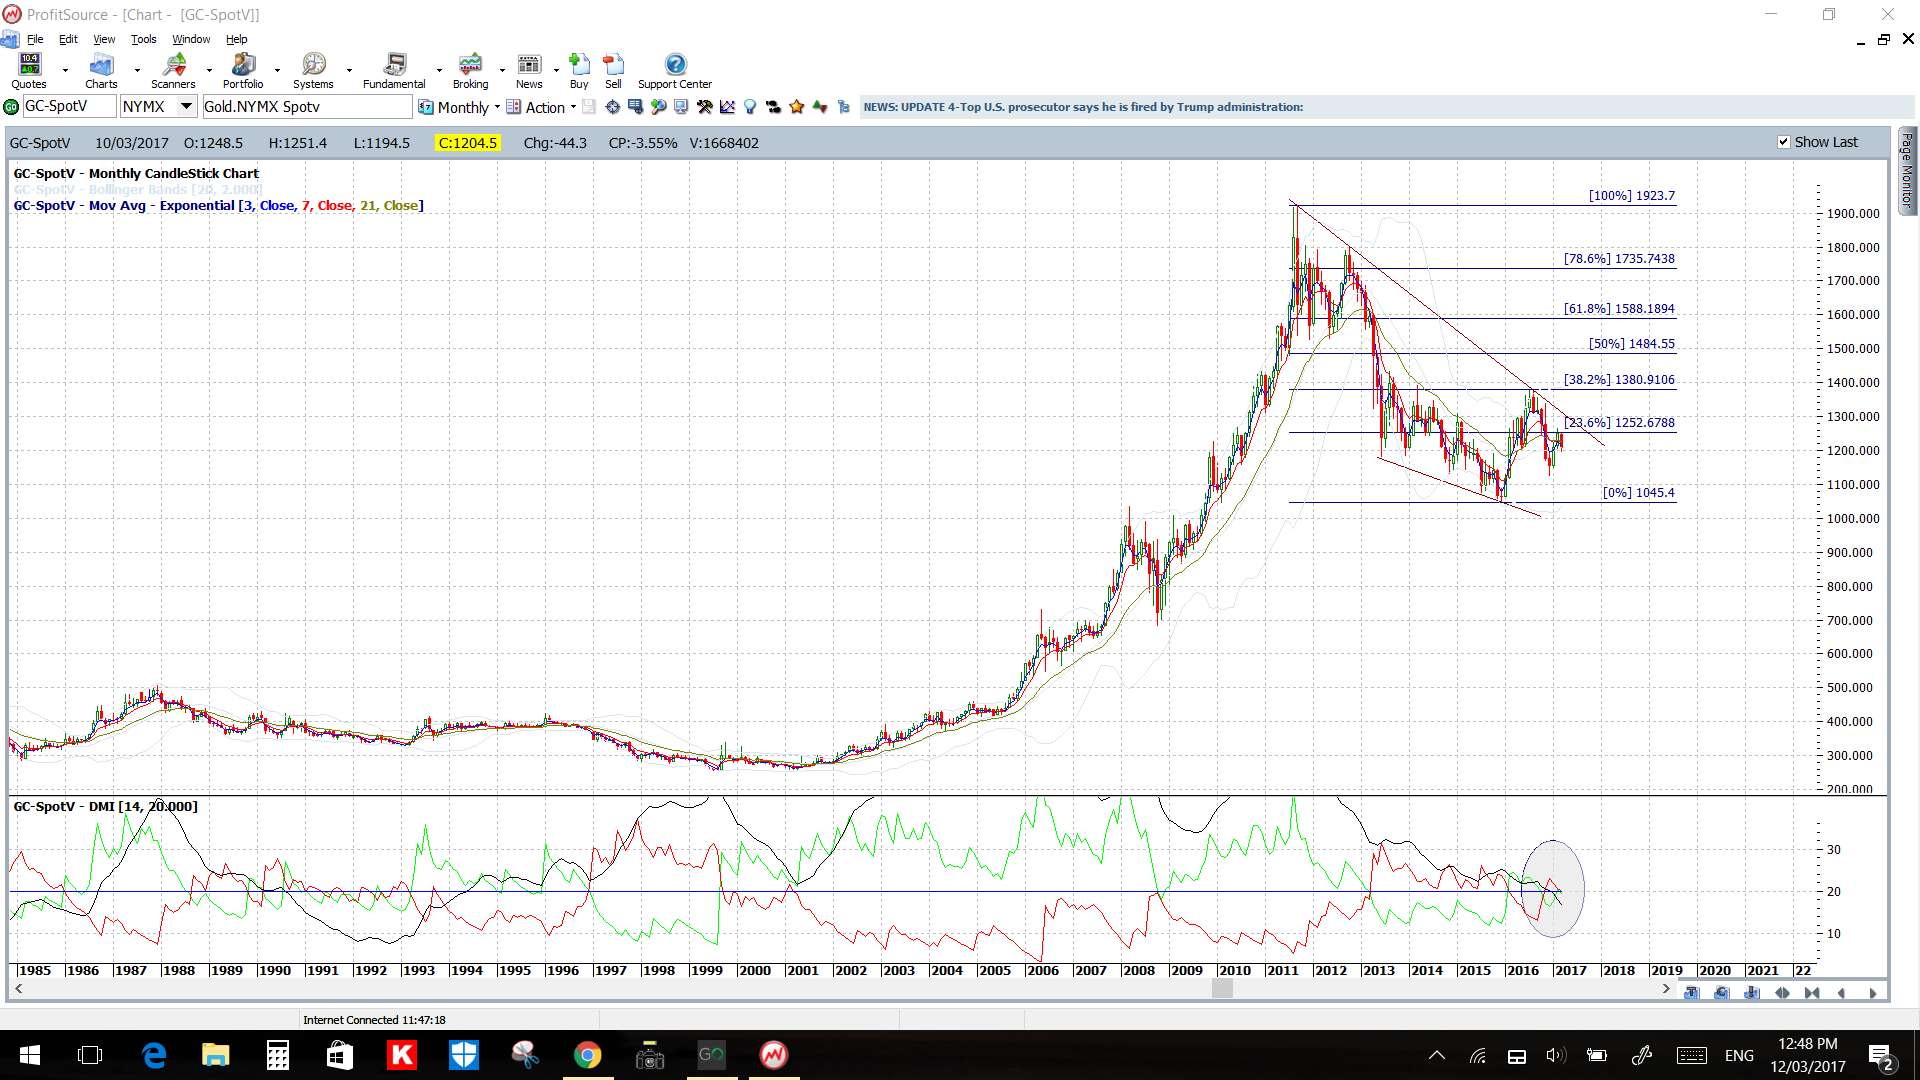
Gold: Note how Gold managed to recover the key $1,200 psychological level to close the week! Watch the 4hr chart’s descending trading channel for any momentum-based breakout move:
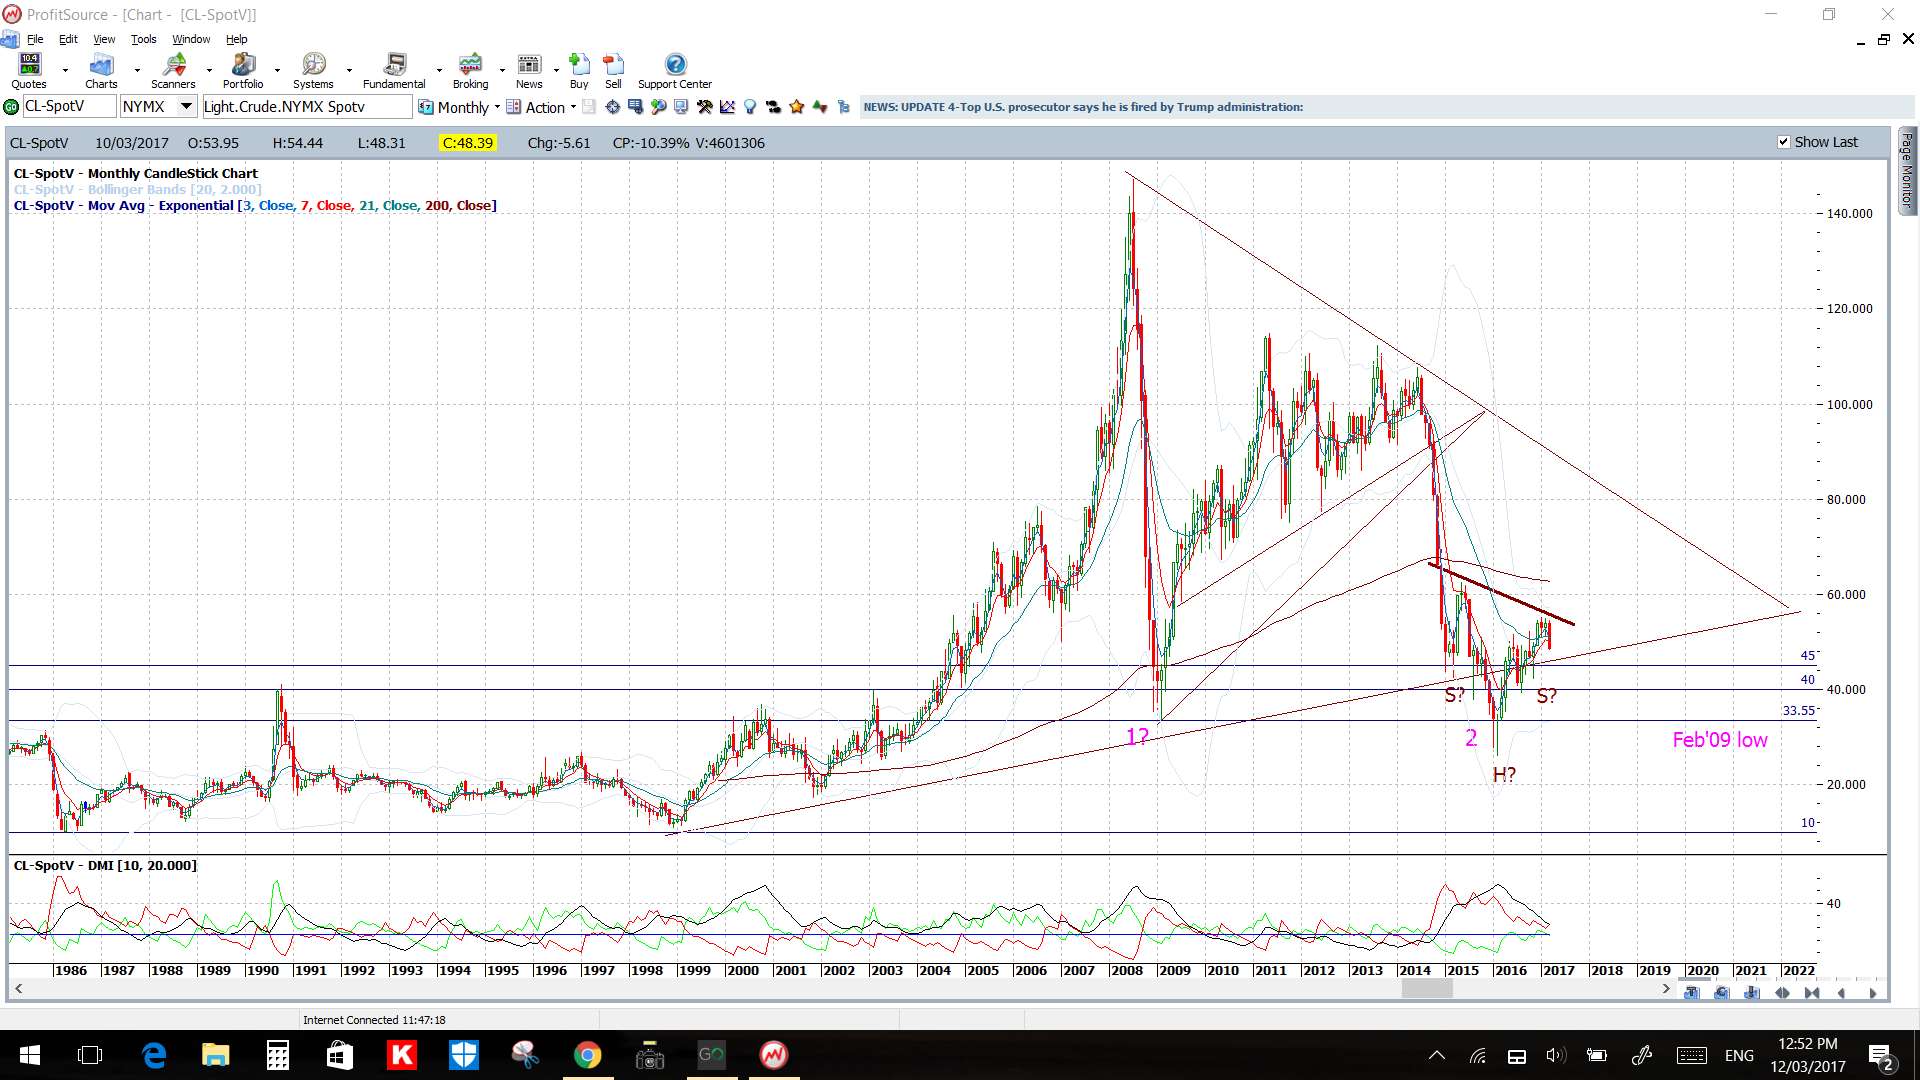
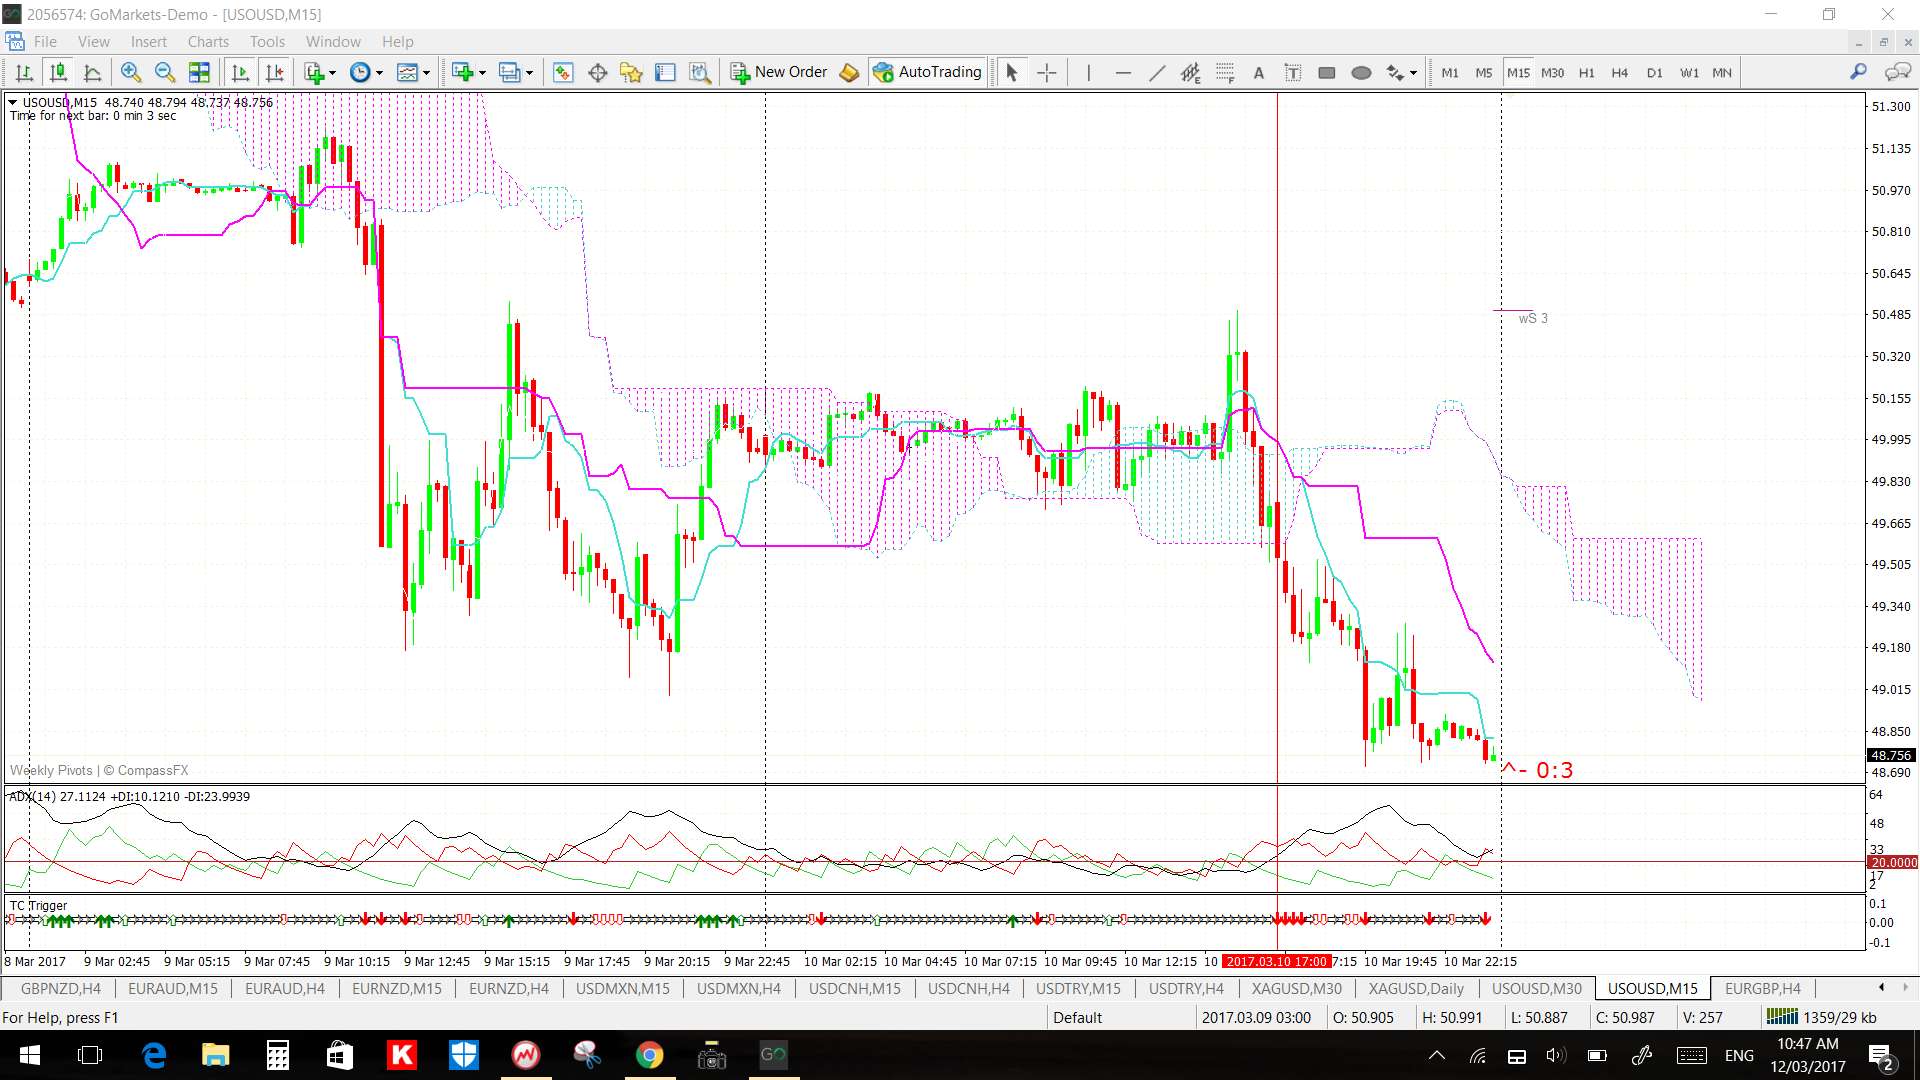
Oil: Oil works well with my TC algo on the shorter time 15-min chart. Note the new monthly Inverse H&S shaping up though:
Oil monthly:
Oil 15 min:
Stock Indices:
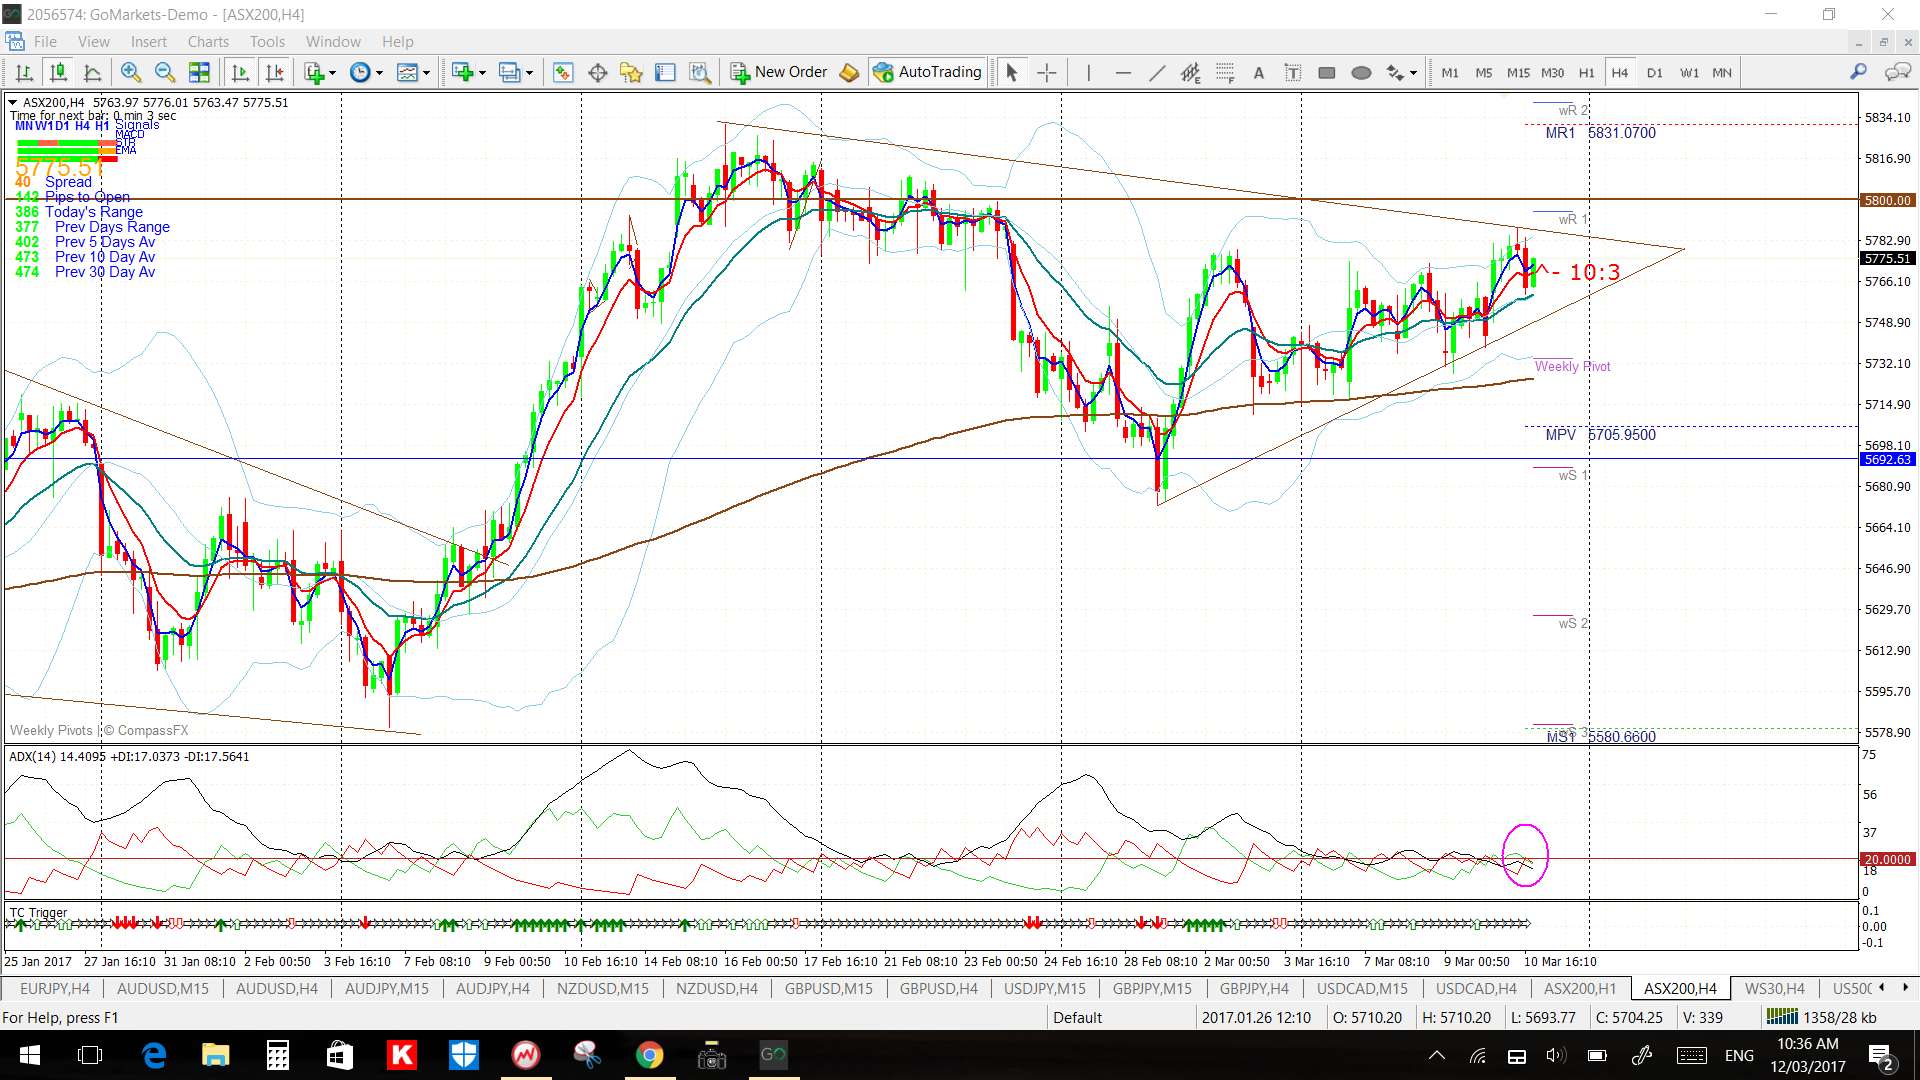
ASX-200 4hr: watch the 4hr chart’s triangle for any momentum-based breakout move:
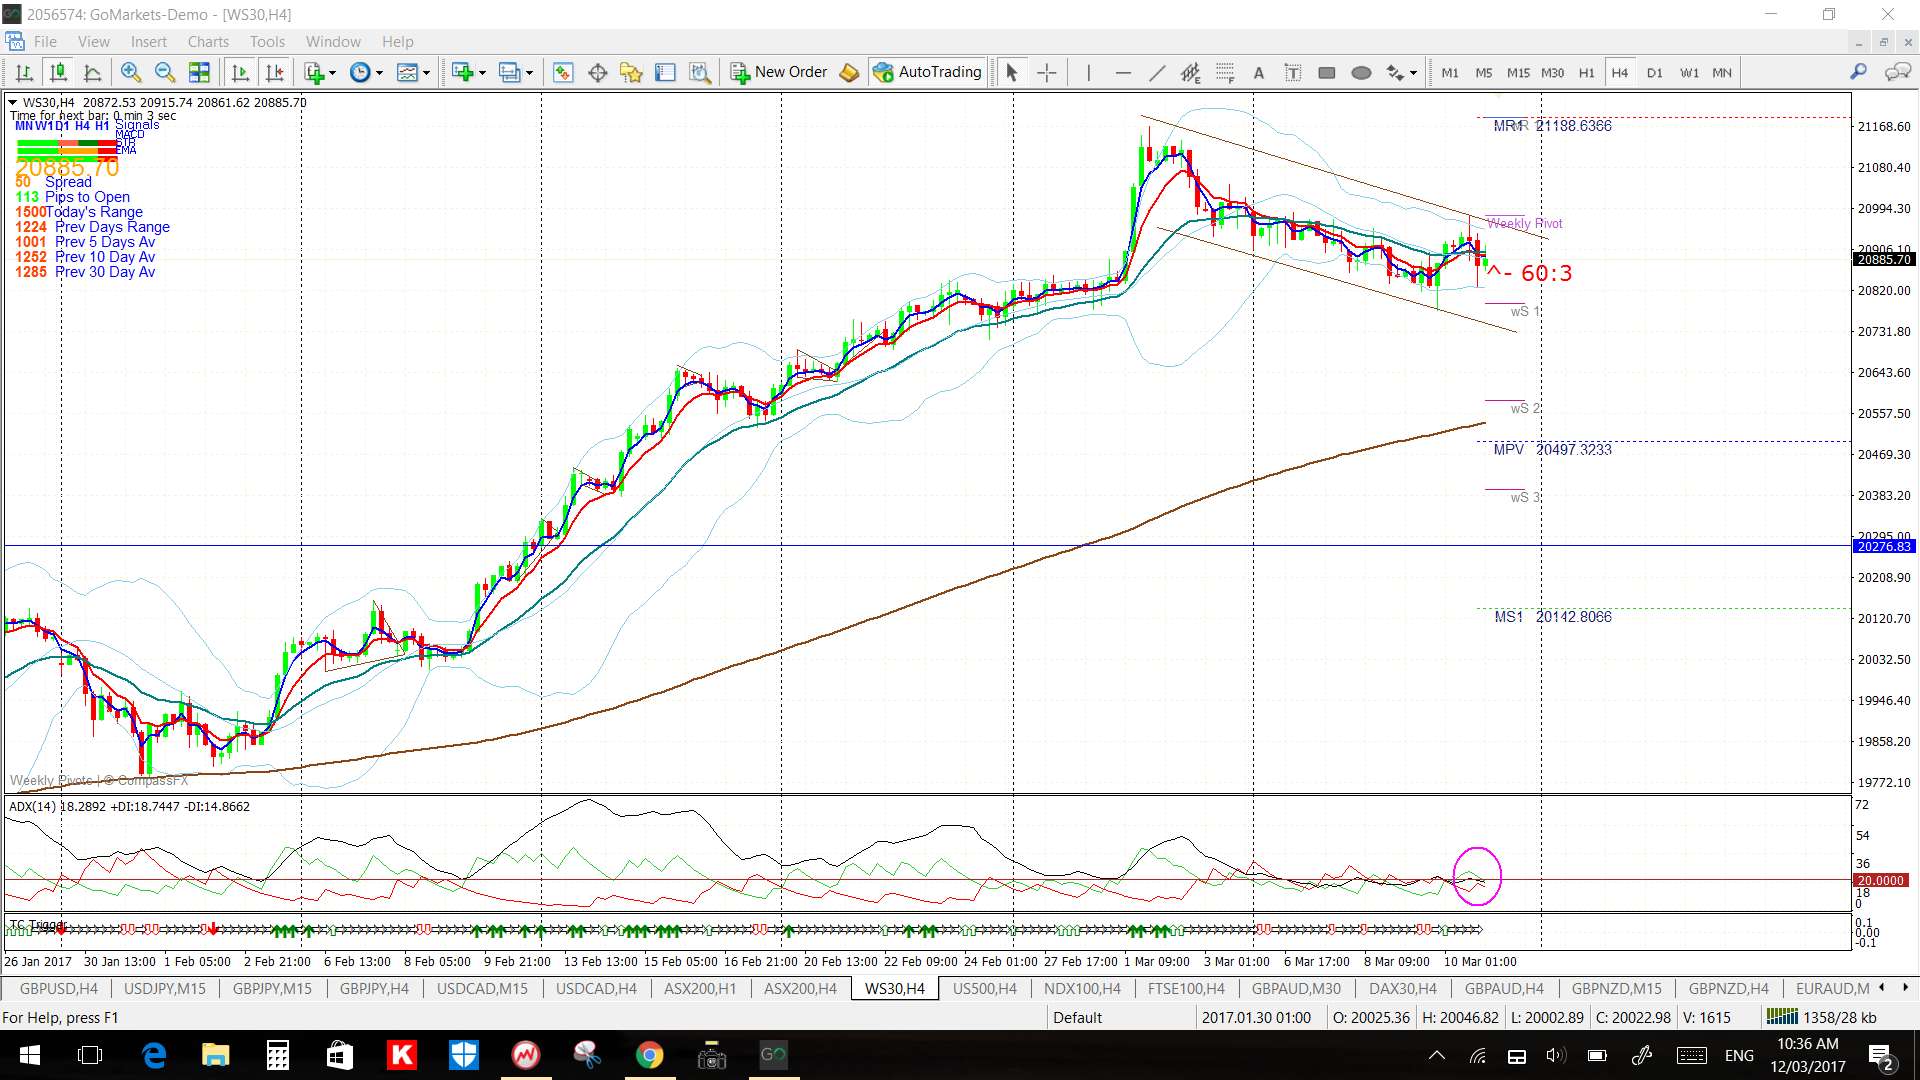
DJIA 4hr: watch the 4hr chart’s wedge for any momentum-based breakout move:
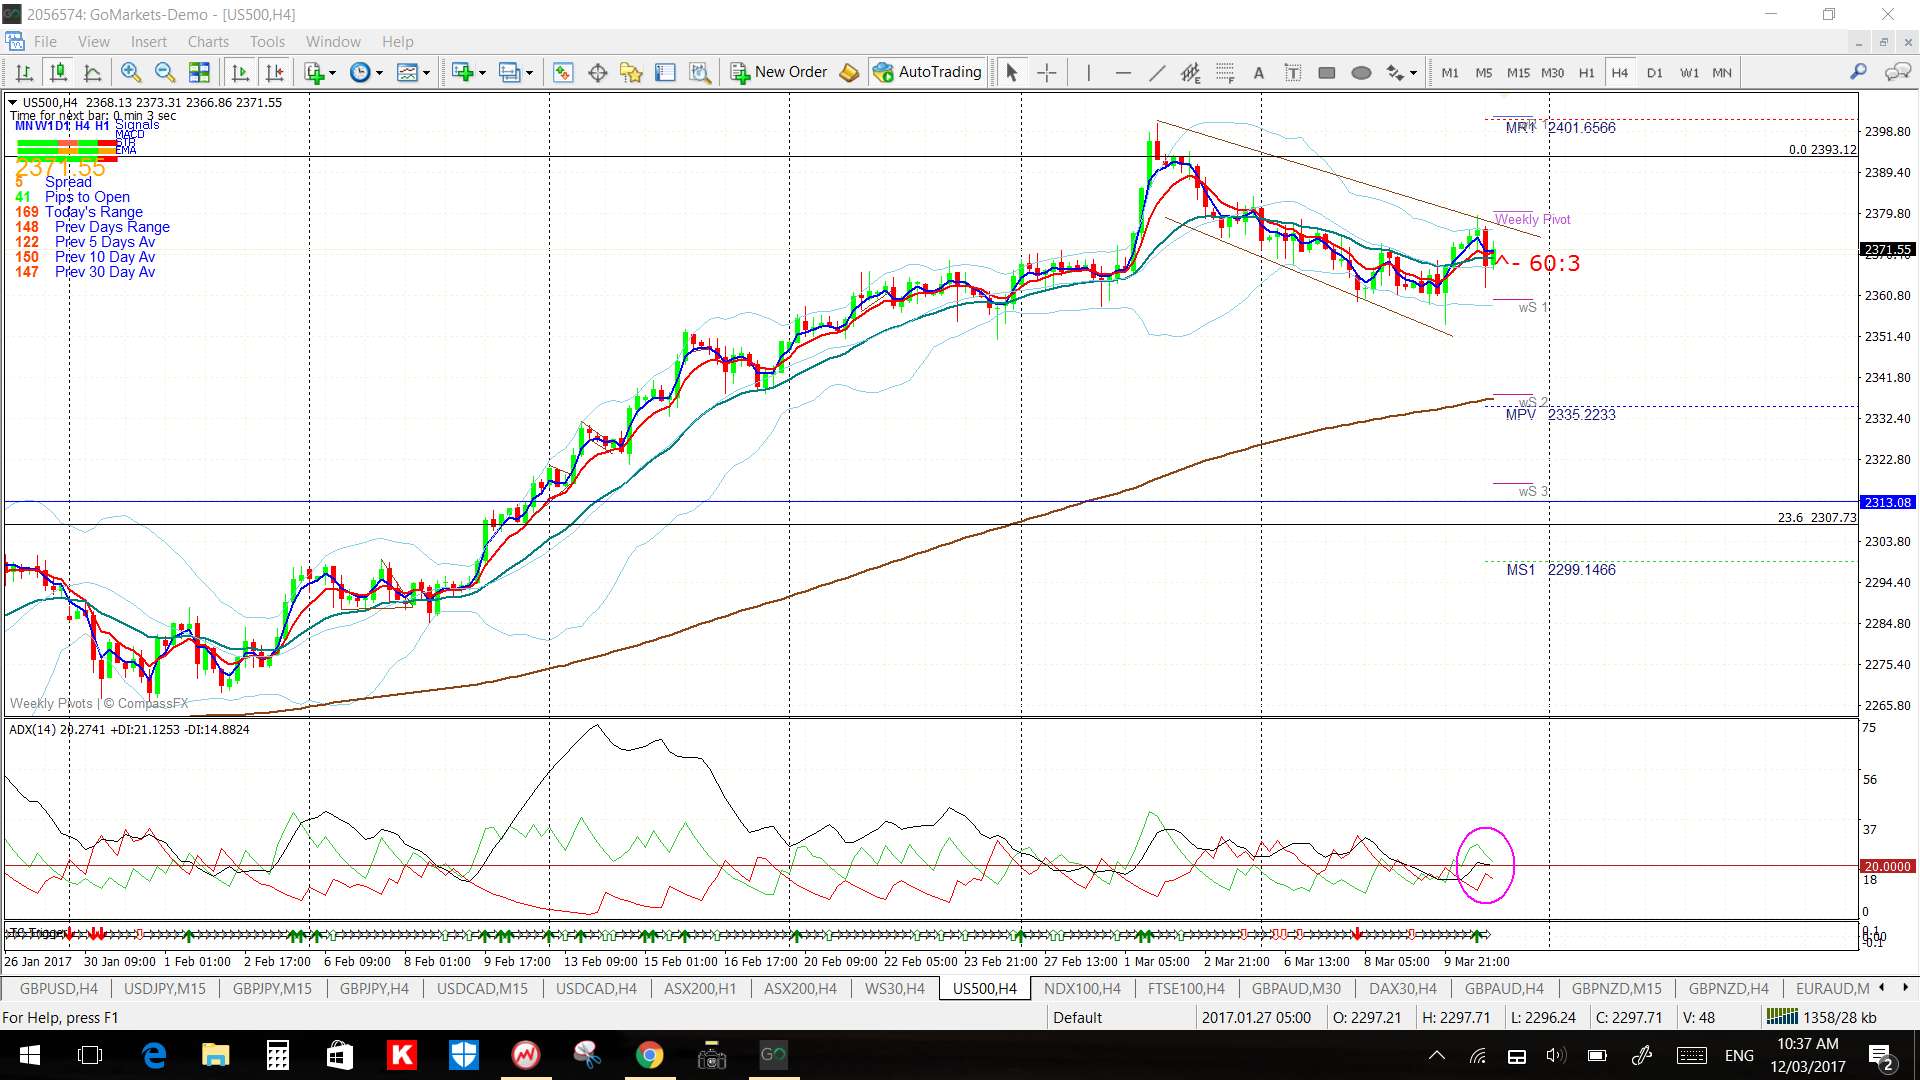
S&P500 4hr: watch the 4hr chart’s wedge for any momentum-based breakout move:
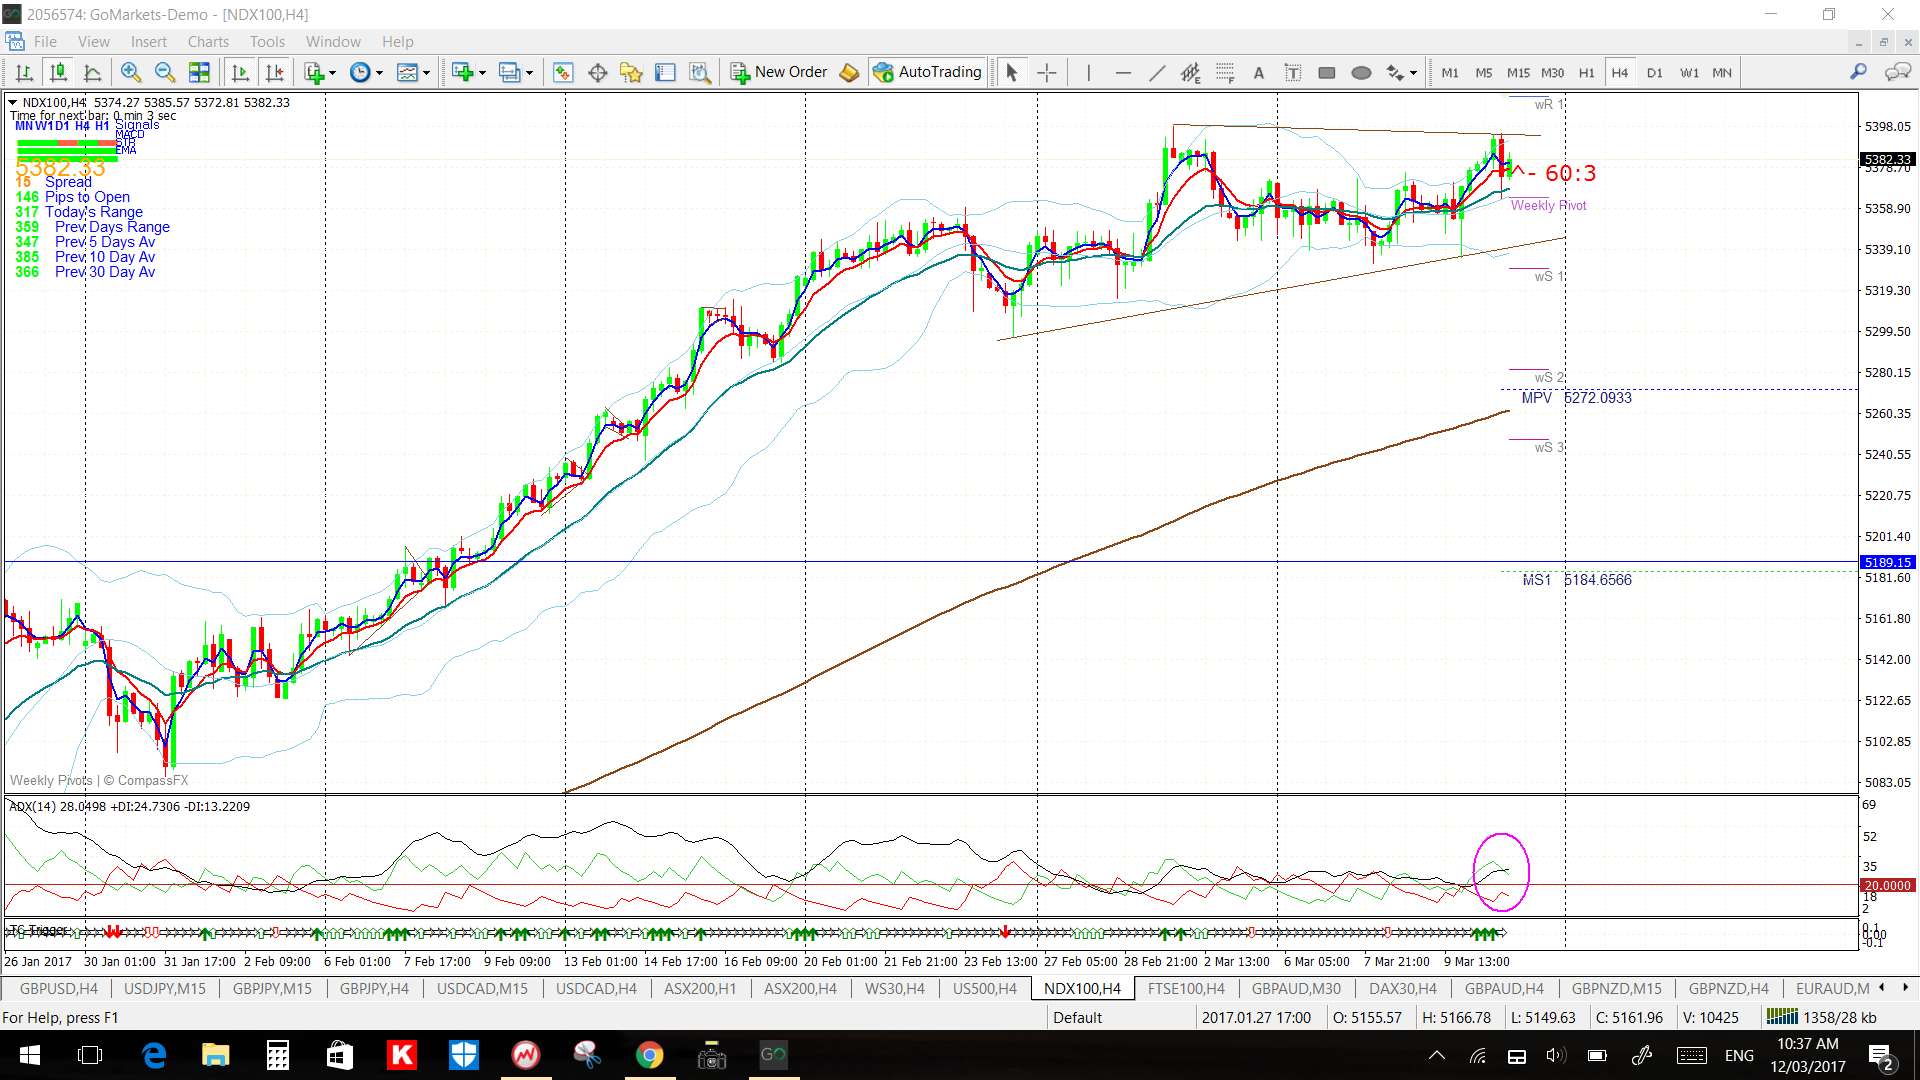
NASDAQ-100 4hr: watch the 4hr chart’s triangle for any momentum-based breakout move:
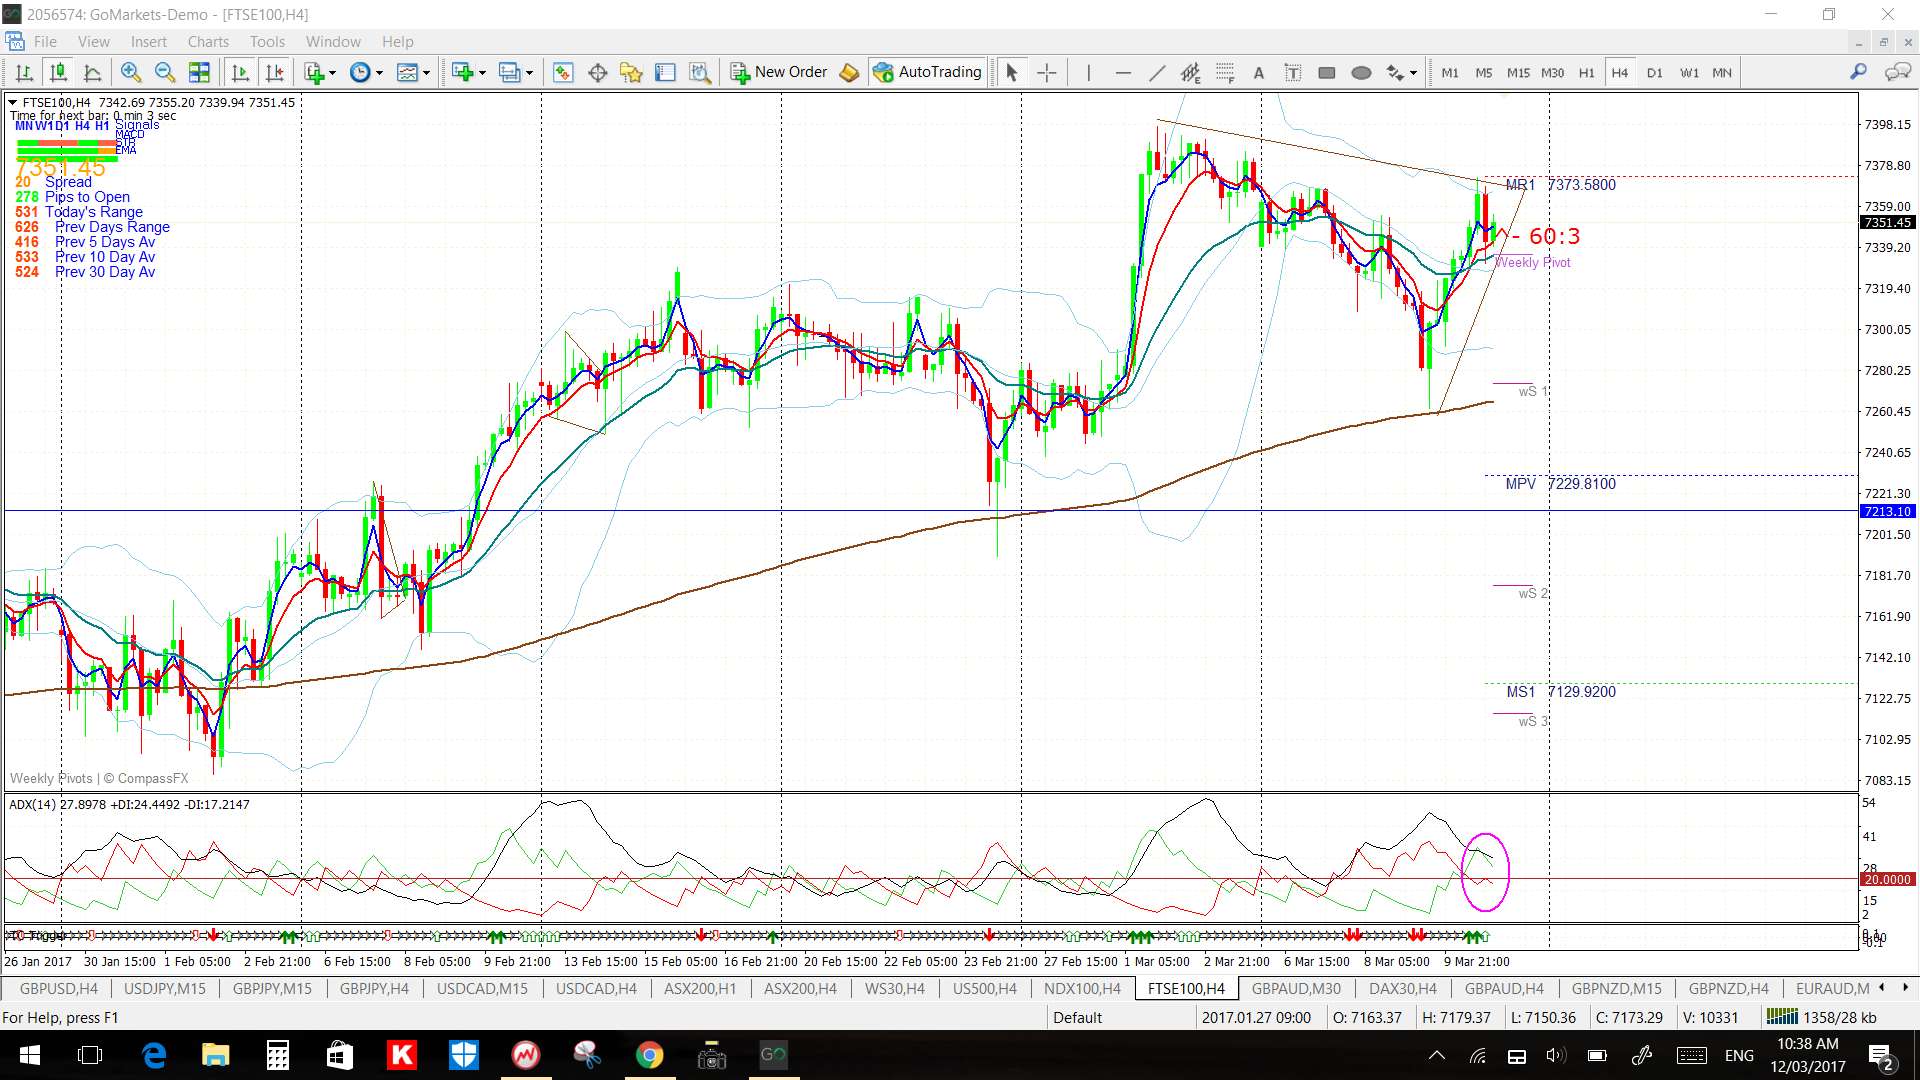
FTSE-100 4hr: watch the 4hr chart’s triangle for any momentum-based breakout move:
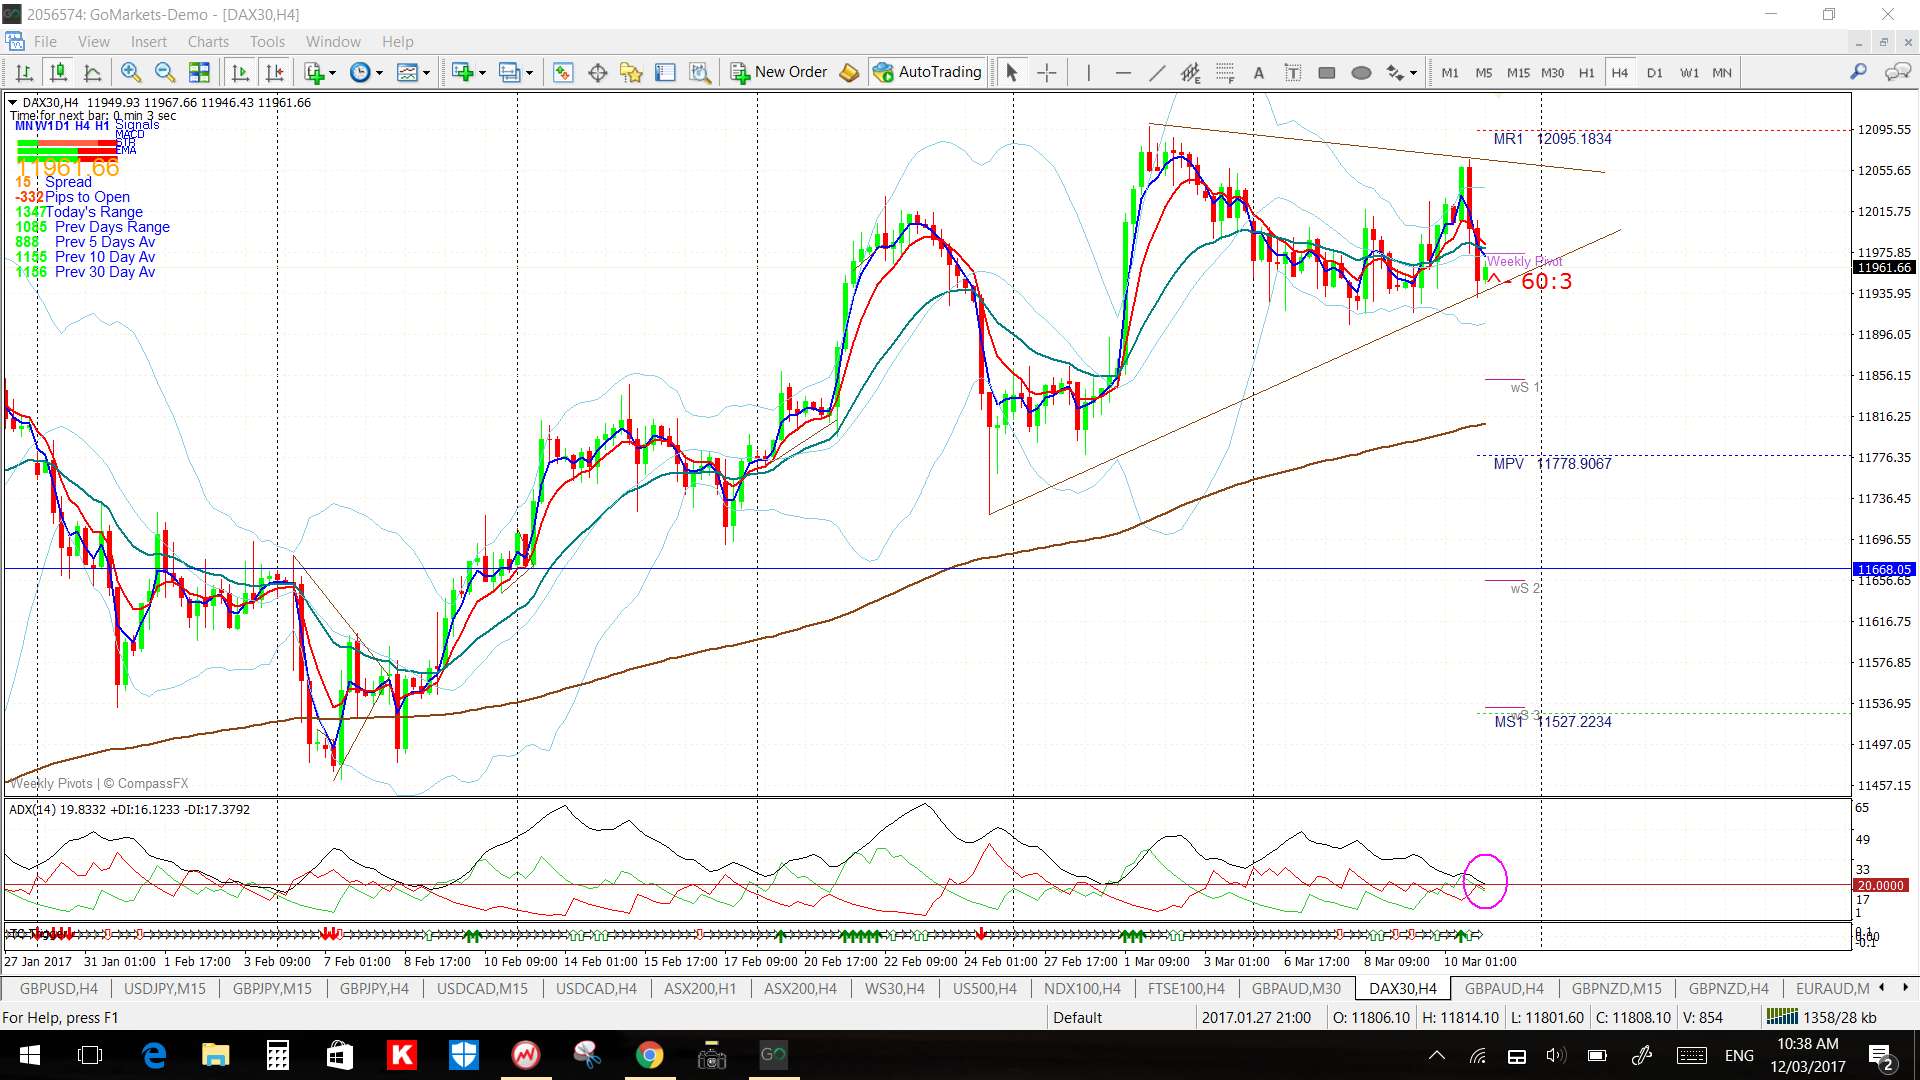
DAX-30 4hr: watch the 4hr chart’s triangle for any momentum-based breakout move:
The post Lots of TLs in focus with FOMC. appeared first on Trade Charting.
The post Lots of TLs in focus with FOMC. appeared first on www.forextell.com.