Last week: What an end to the week! After lamenting that the looming Monday holidays in the US and UK might keep FX quiet for Friday I could not have been more wrong! There were 9 new trend line breakout trades that triggered and, if this wasn’t bad enough, many of them triggered during the Asian session; a period that I often lament as being too quiet to warrant much focus!
This increased the tally for trend line breakout trades last week and the regime of watching for trend line breaks with new TC signals continues to be a winning one. I started my TC Trial during the week and so I’m hoping the summer choppy markets won’t creep up on us too early. The good news is that there are many consolidation patterns in play giving us trend lines to watch in the coming week.
Trend line breakout trades: the following moves were summarised here, here, here and here last week and the stock index moves were summarised here:
- Gold: 60 pips
- AUD/USD: 55 pips
- NZD/USD: 100 pips
- GBP/NZD: 180 pips
- Silver: 40 pips
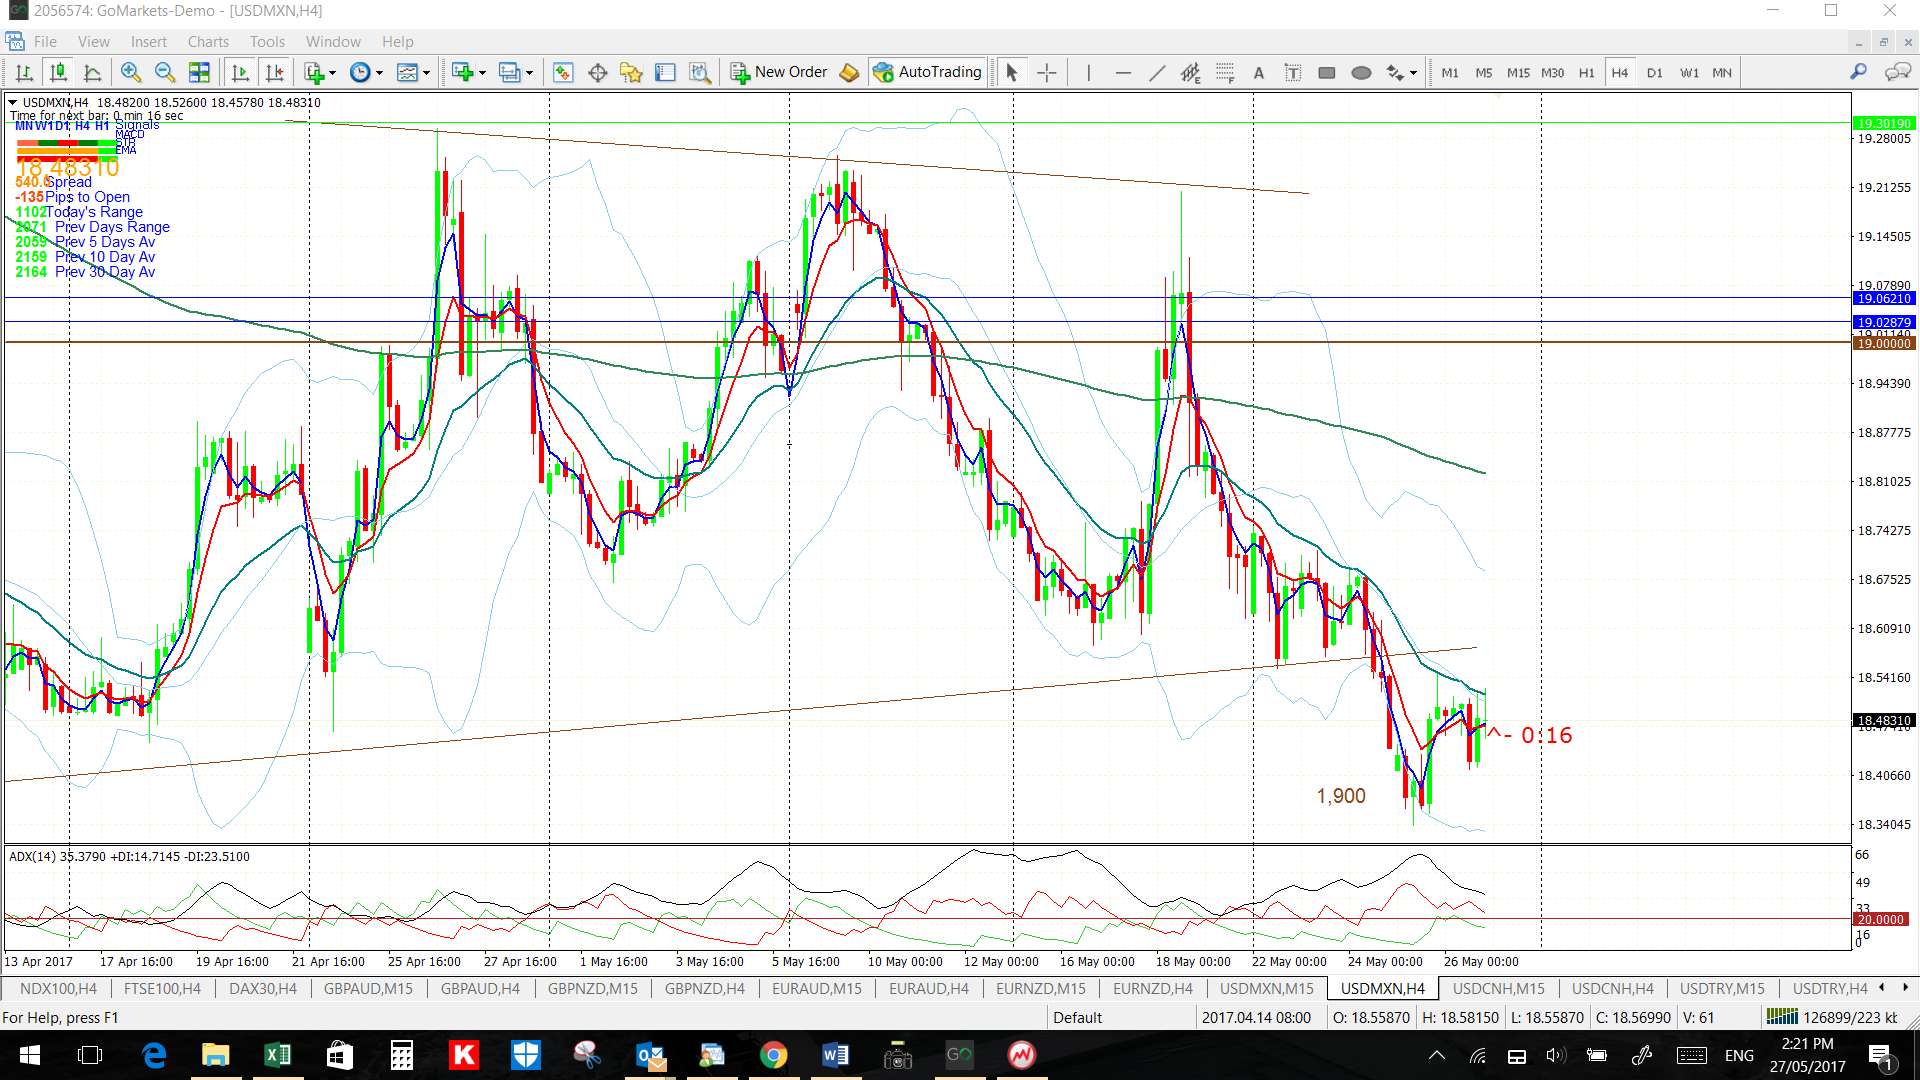
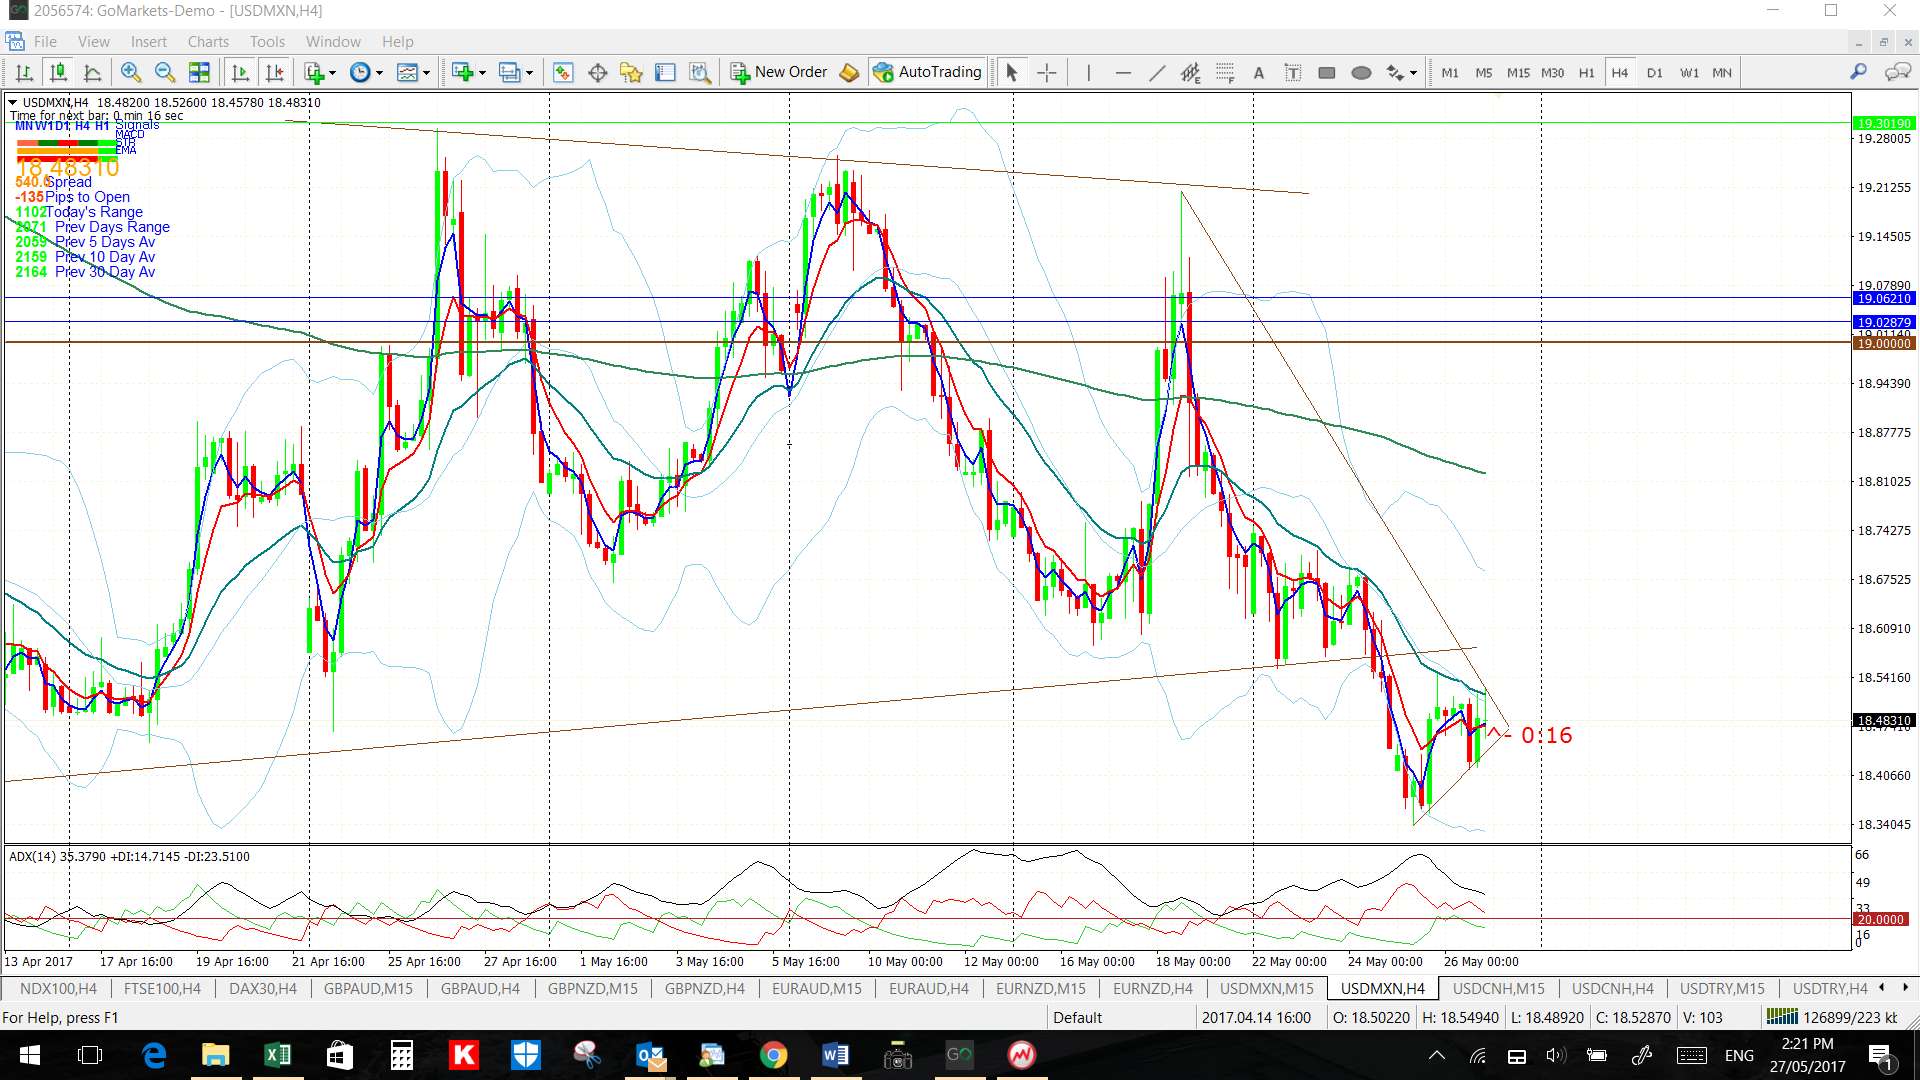
- USD/MXN: 1,900 pips
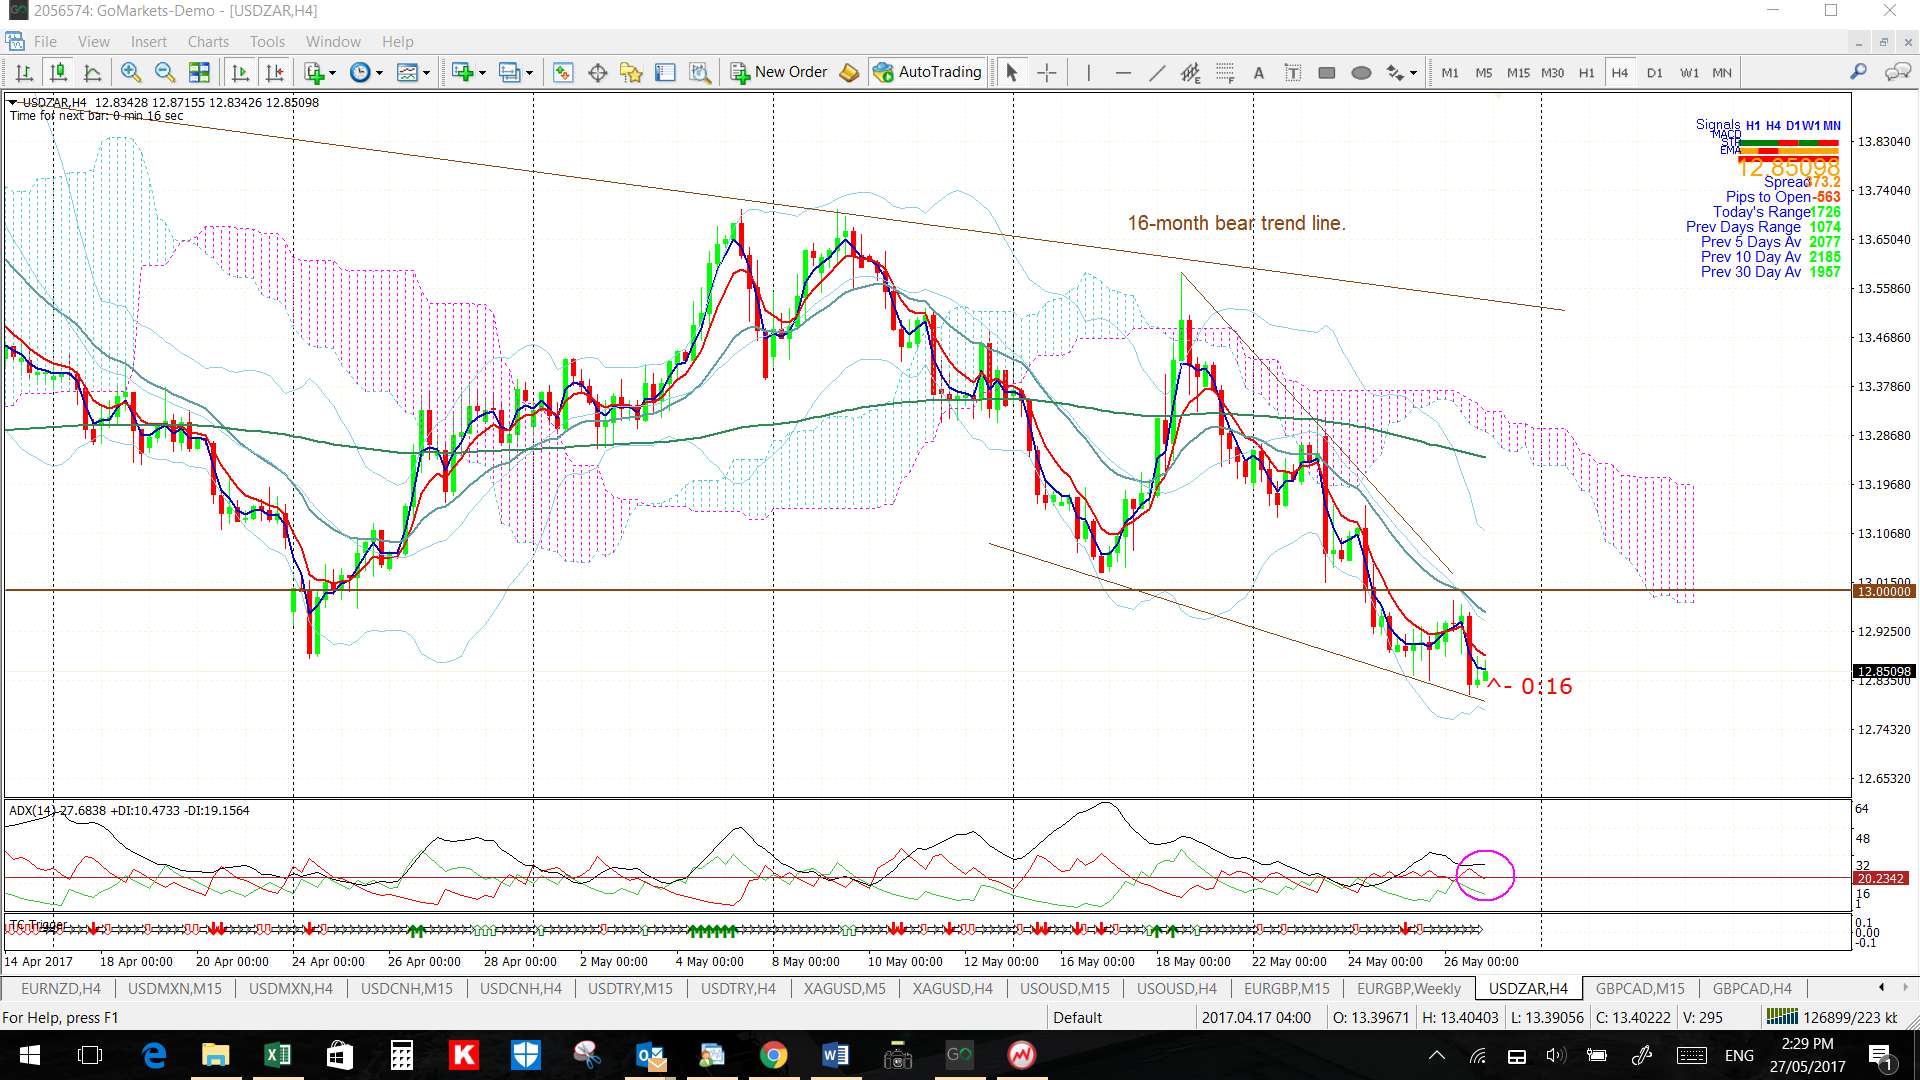
- USD/ZAR: 1,900 pips
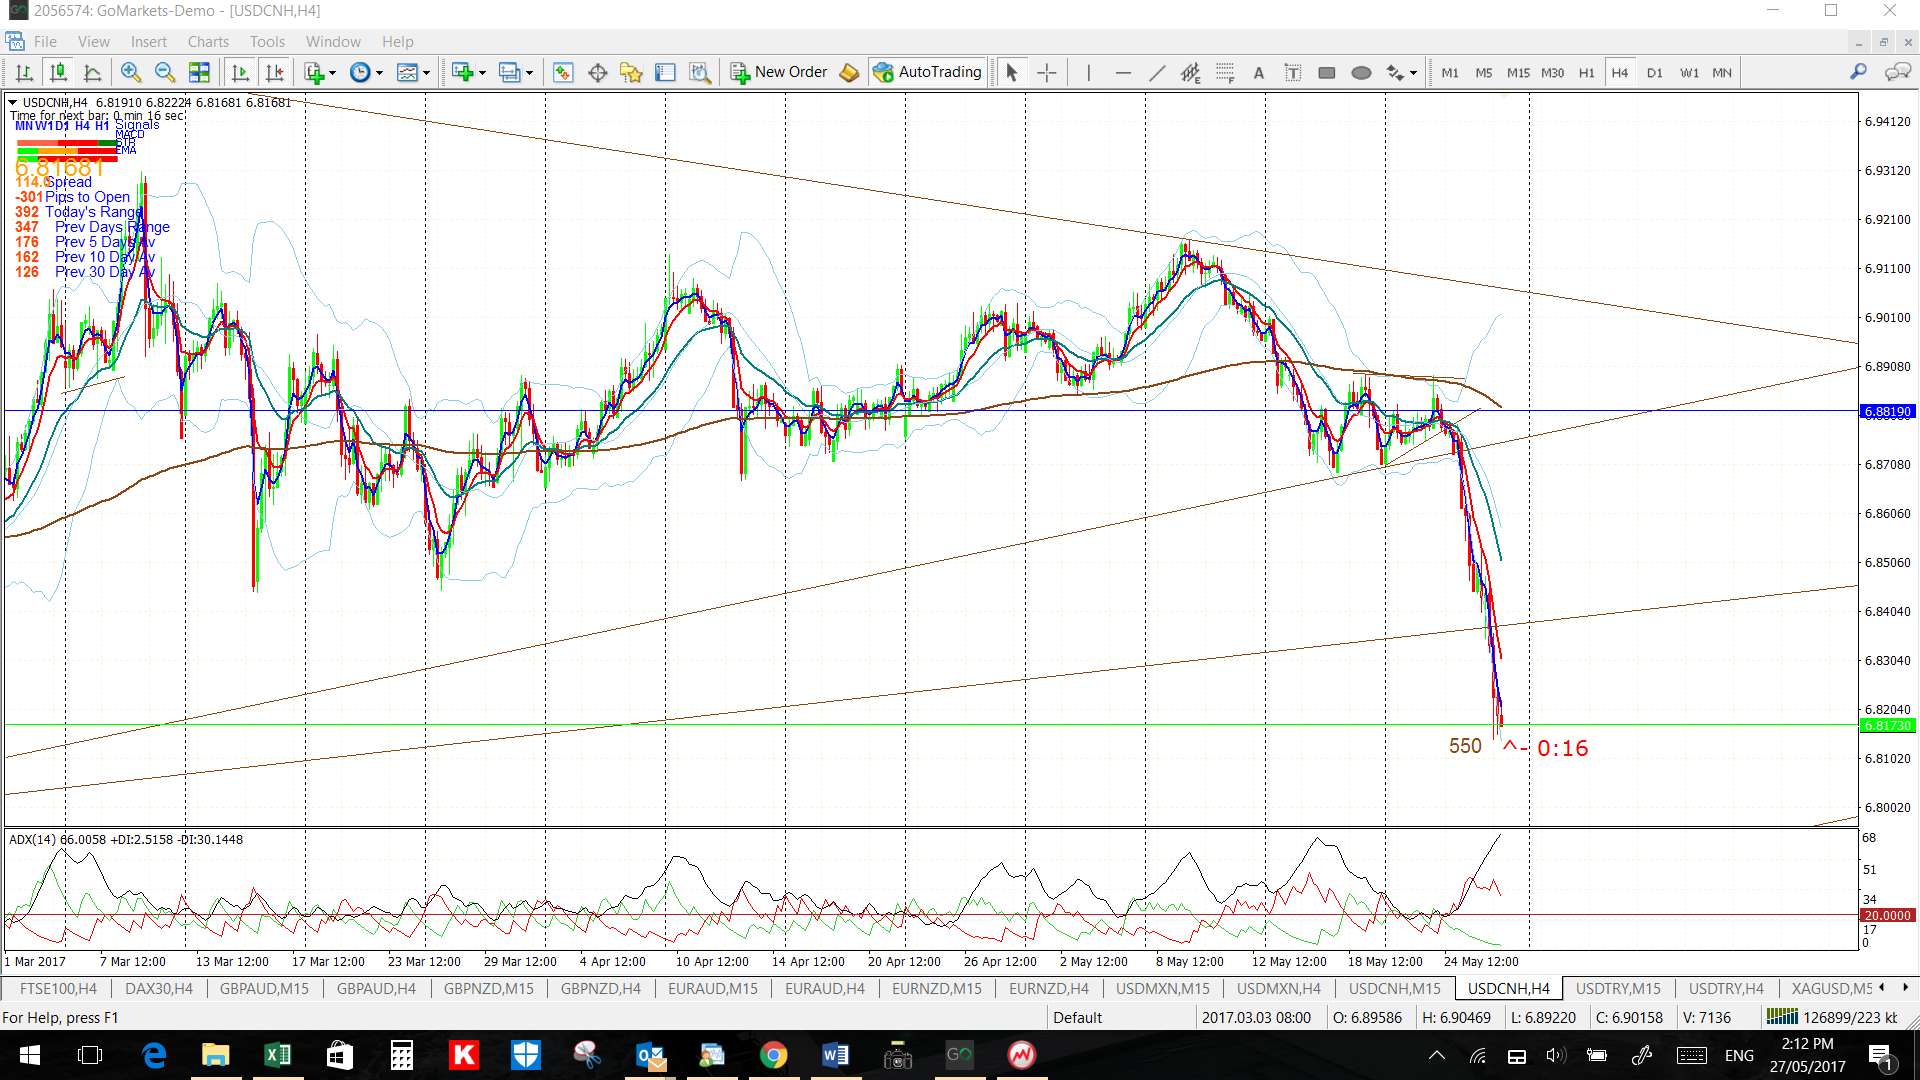
- USD/CNH: 550 pips
- S&P500: 30 points
- DJIA: 250 points
- NASDAQ-100: 120 points
The following moves evolved on Friday and are recorded in this post:
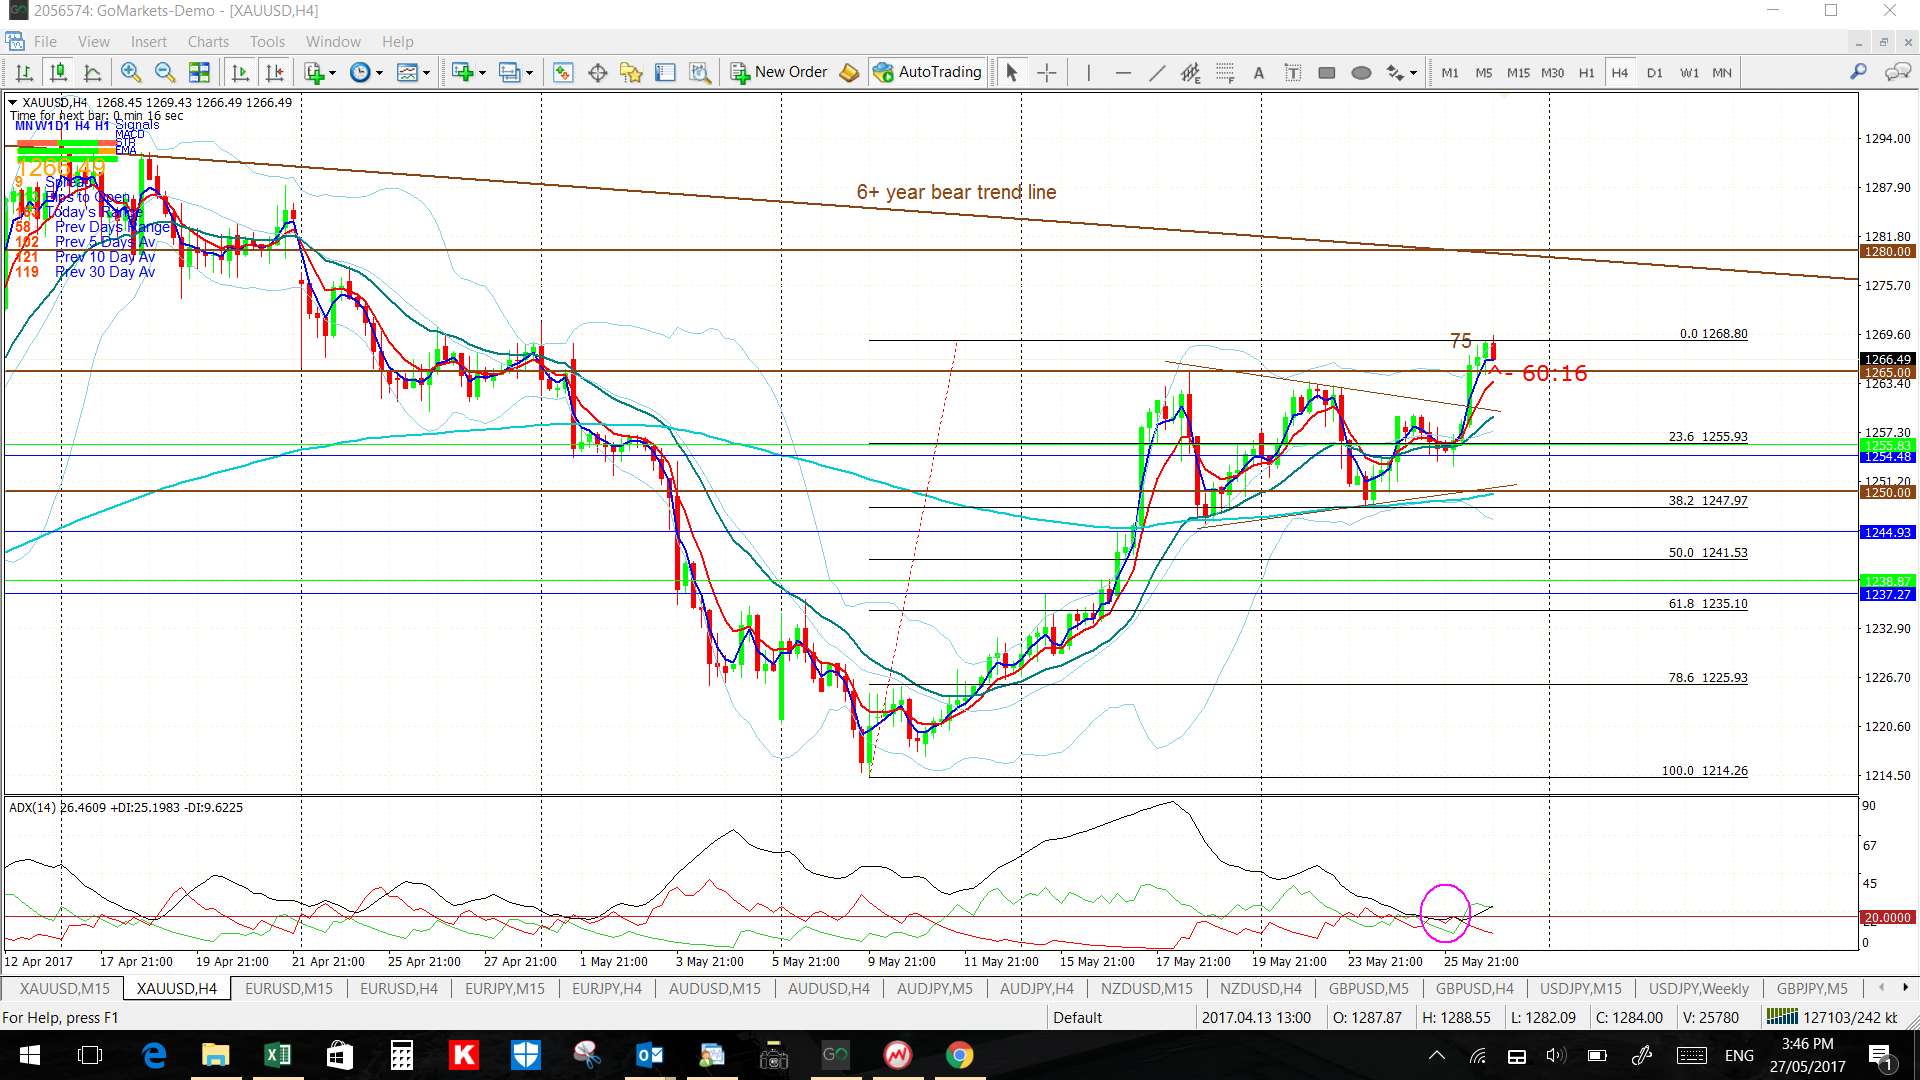
- Gold: 75 pips
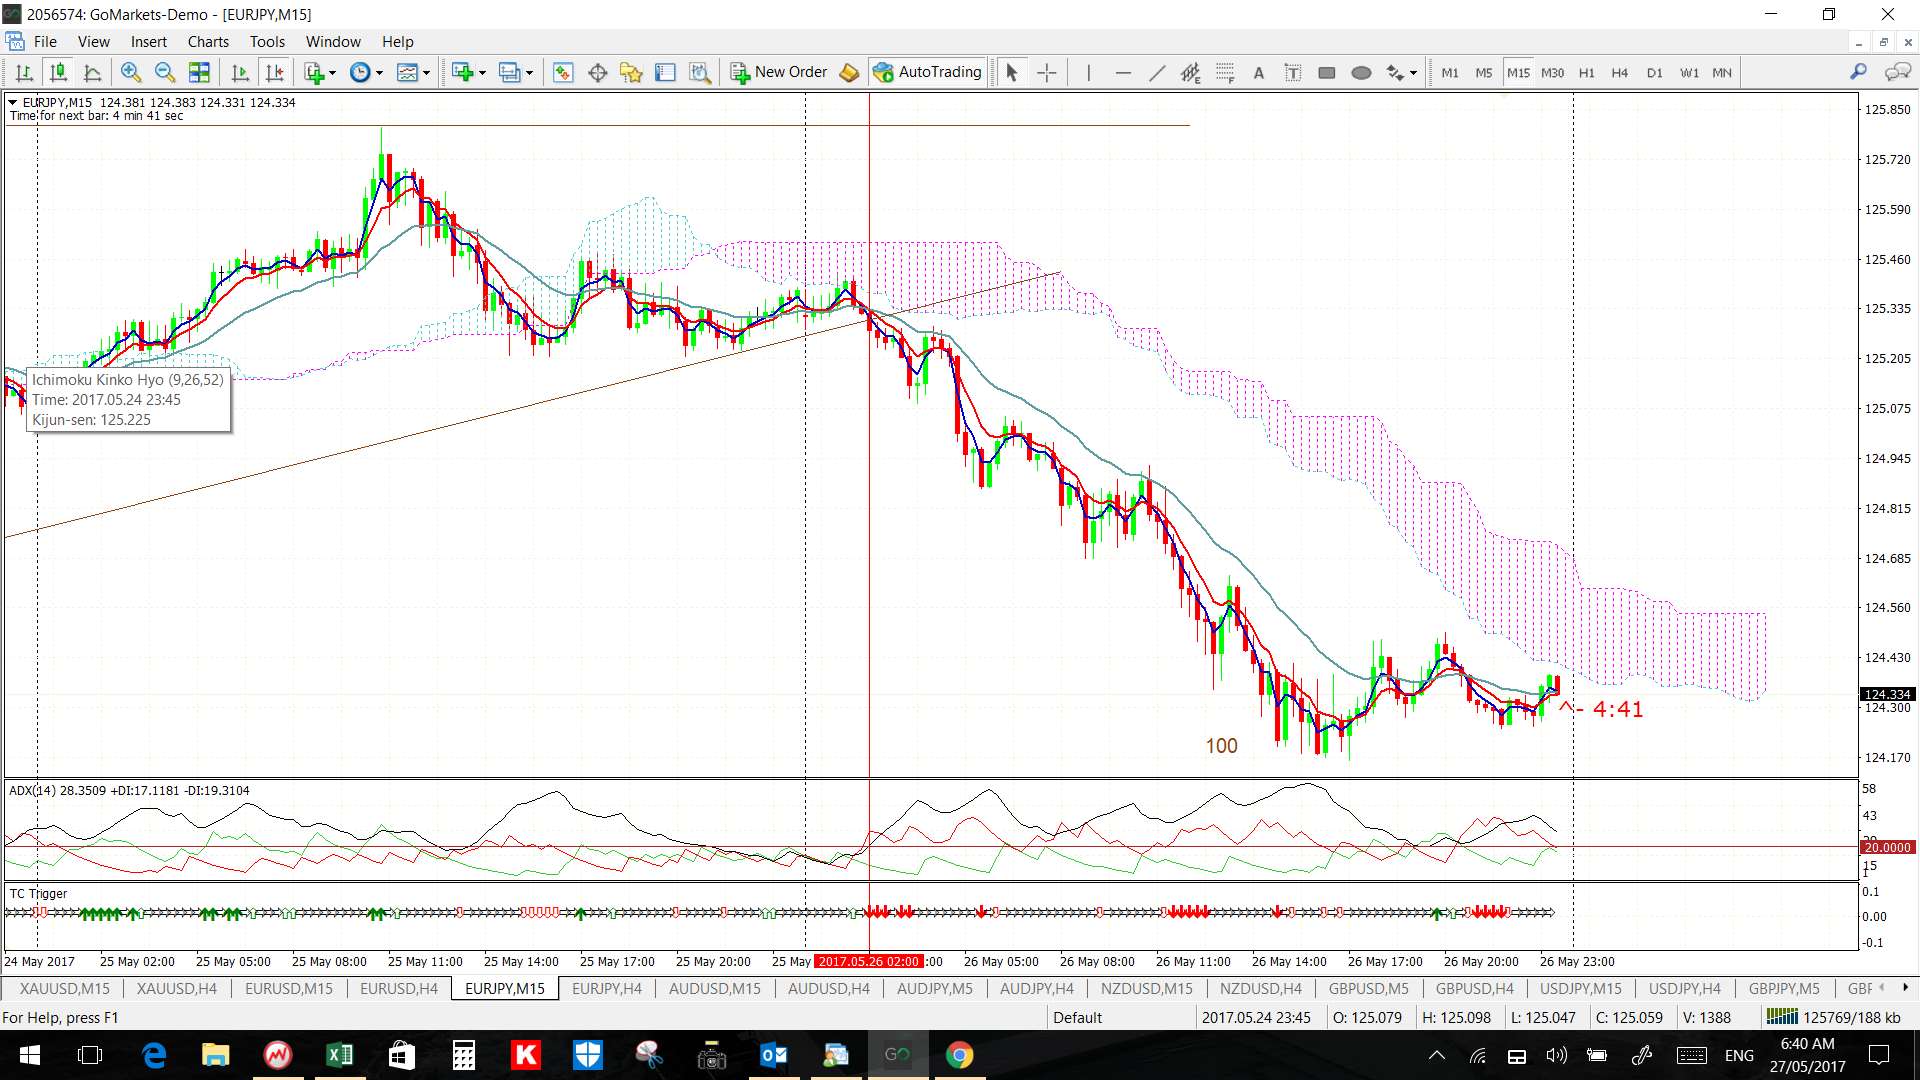
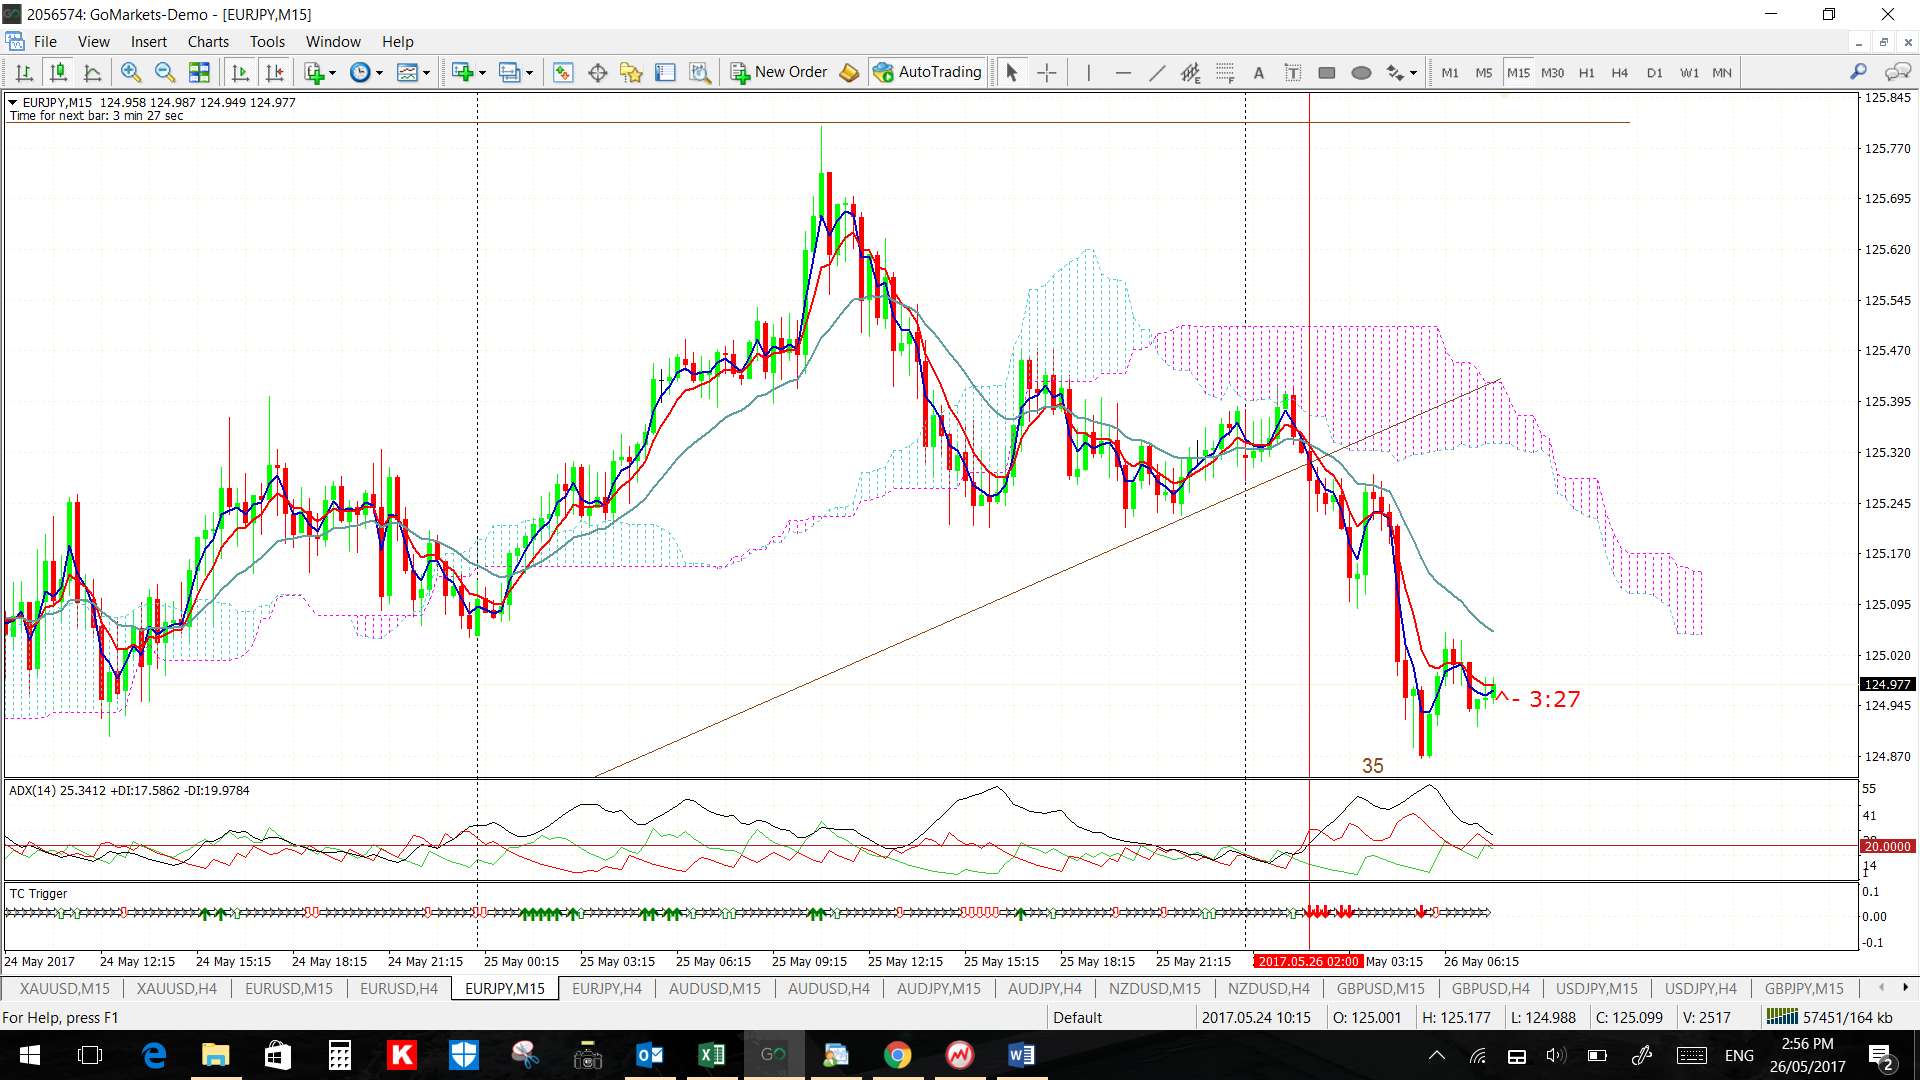
- EUR/JPY: 80 pips.
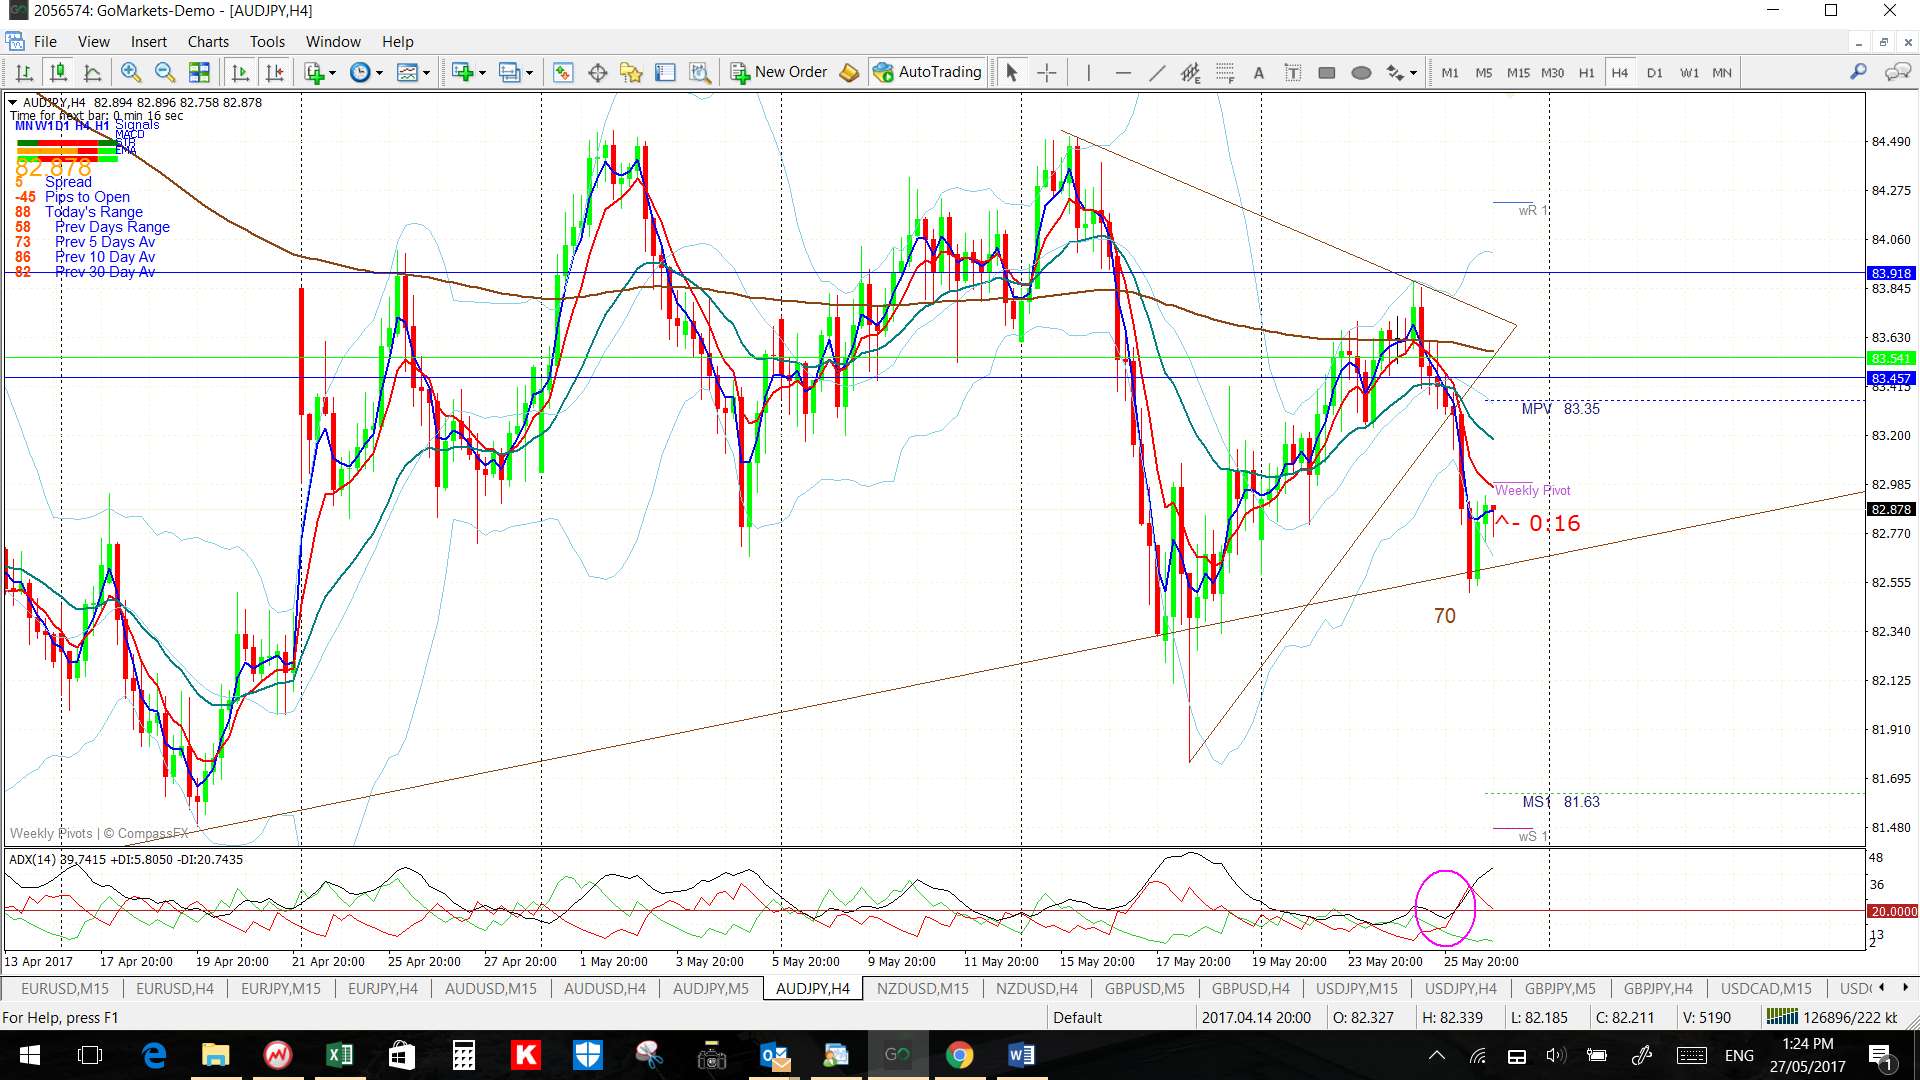
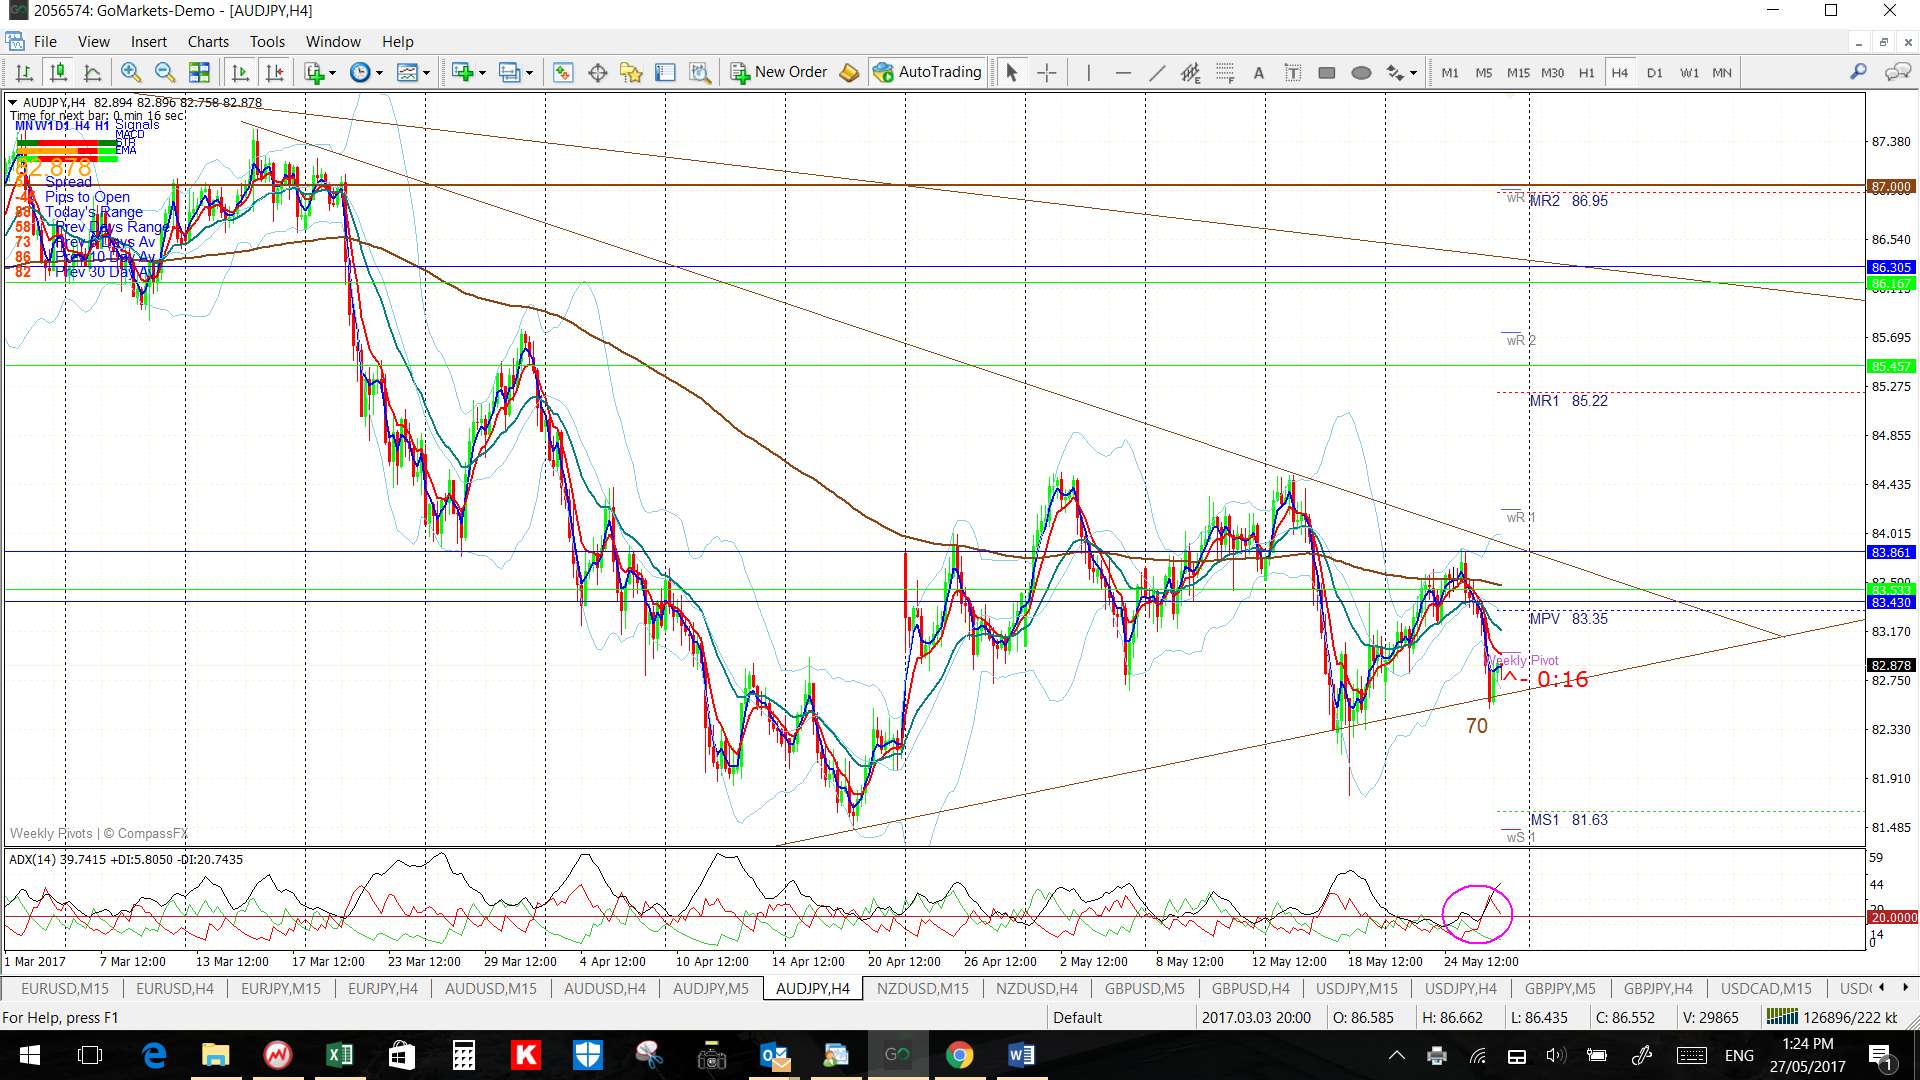
- AUD/JPY: 70 pips.
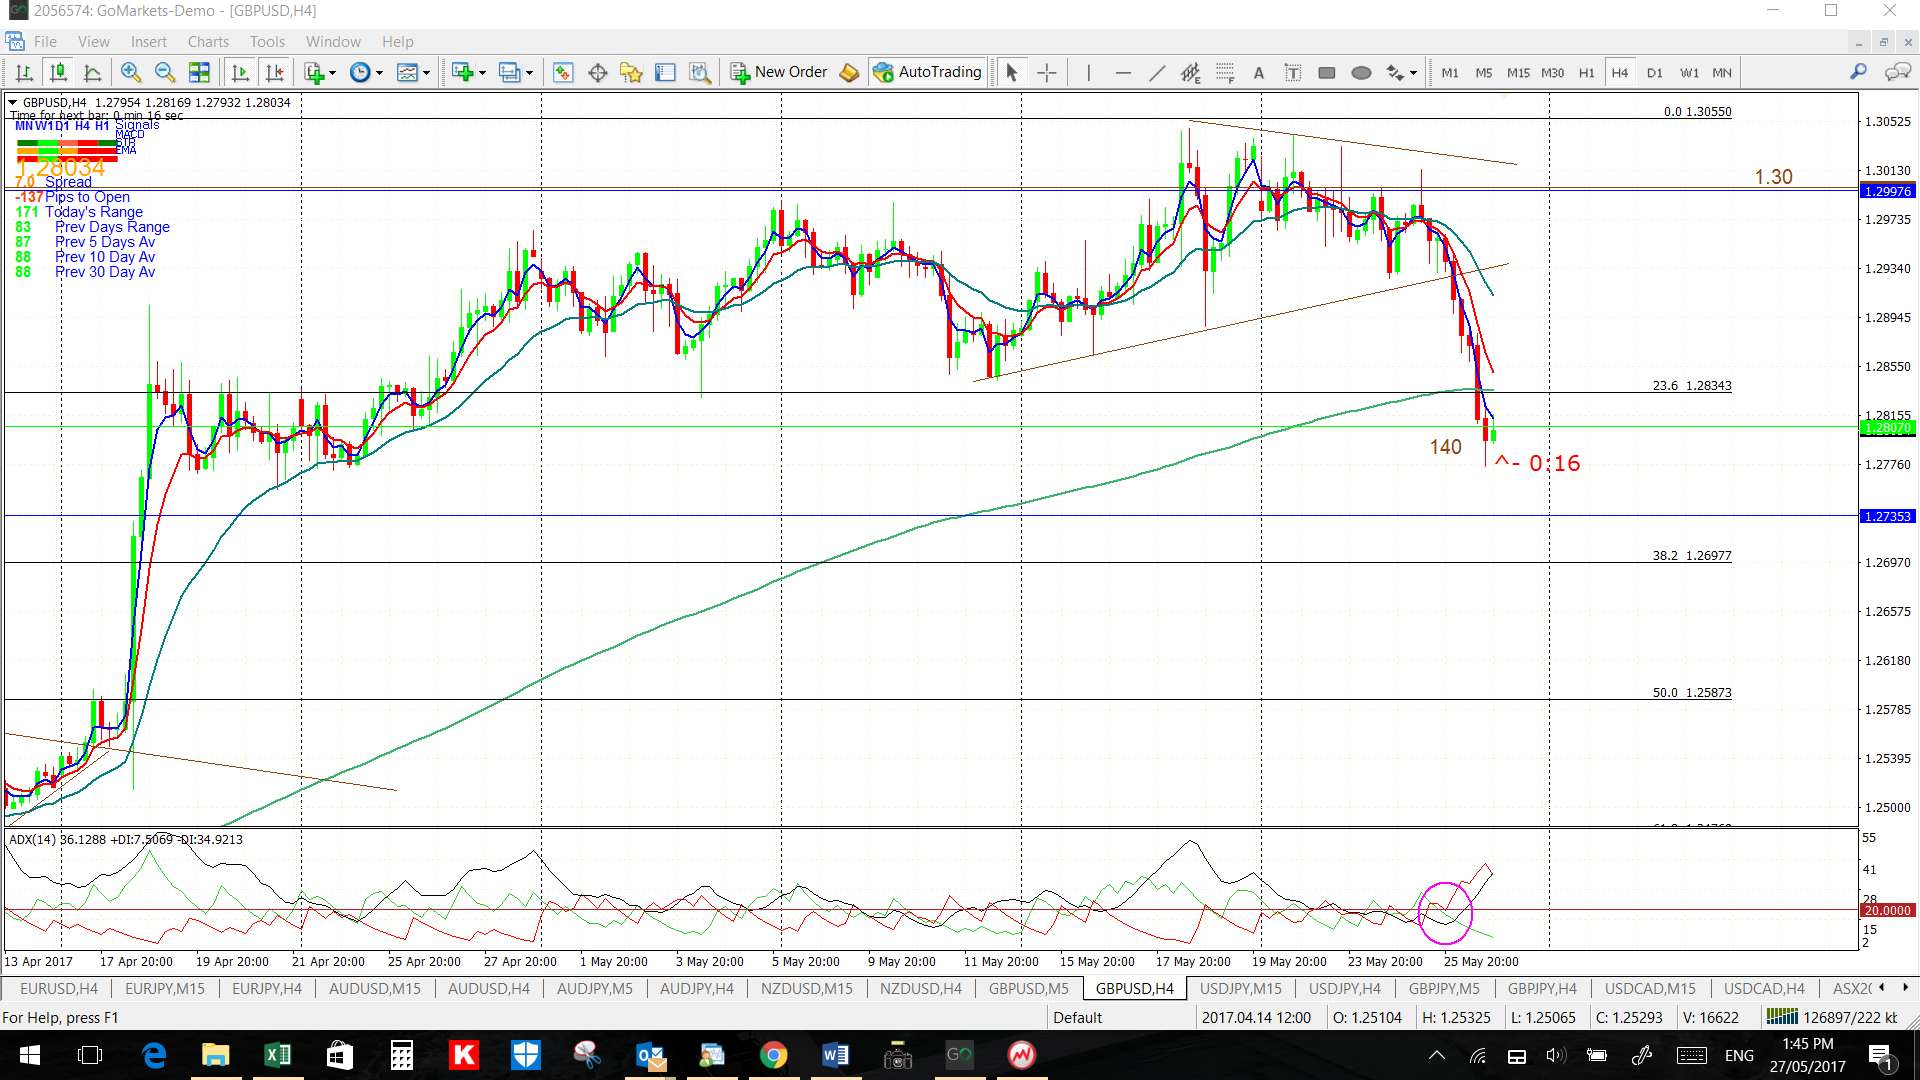
- GBP/USD: 140 pips.
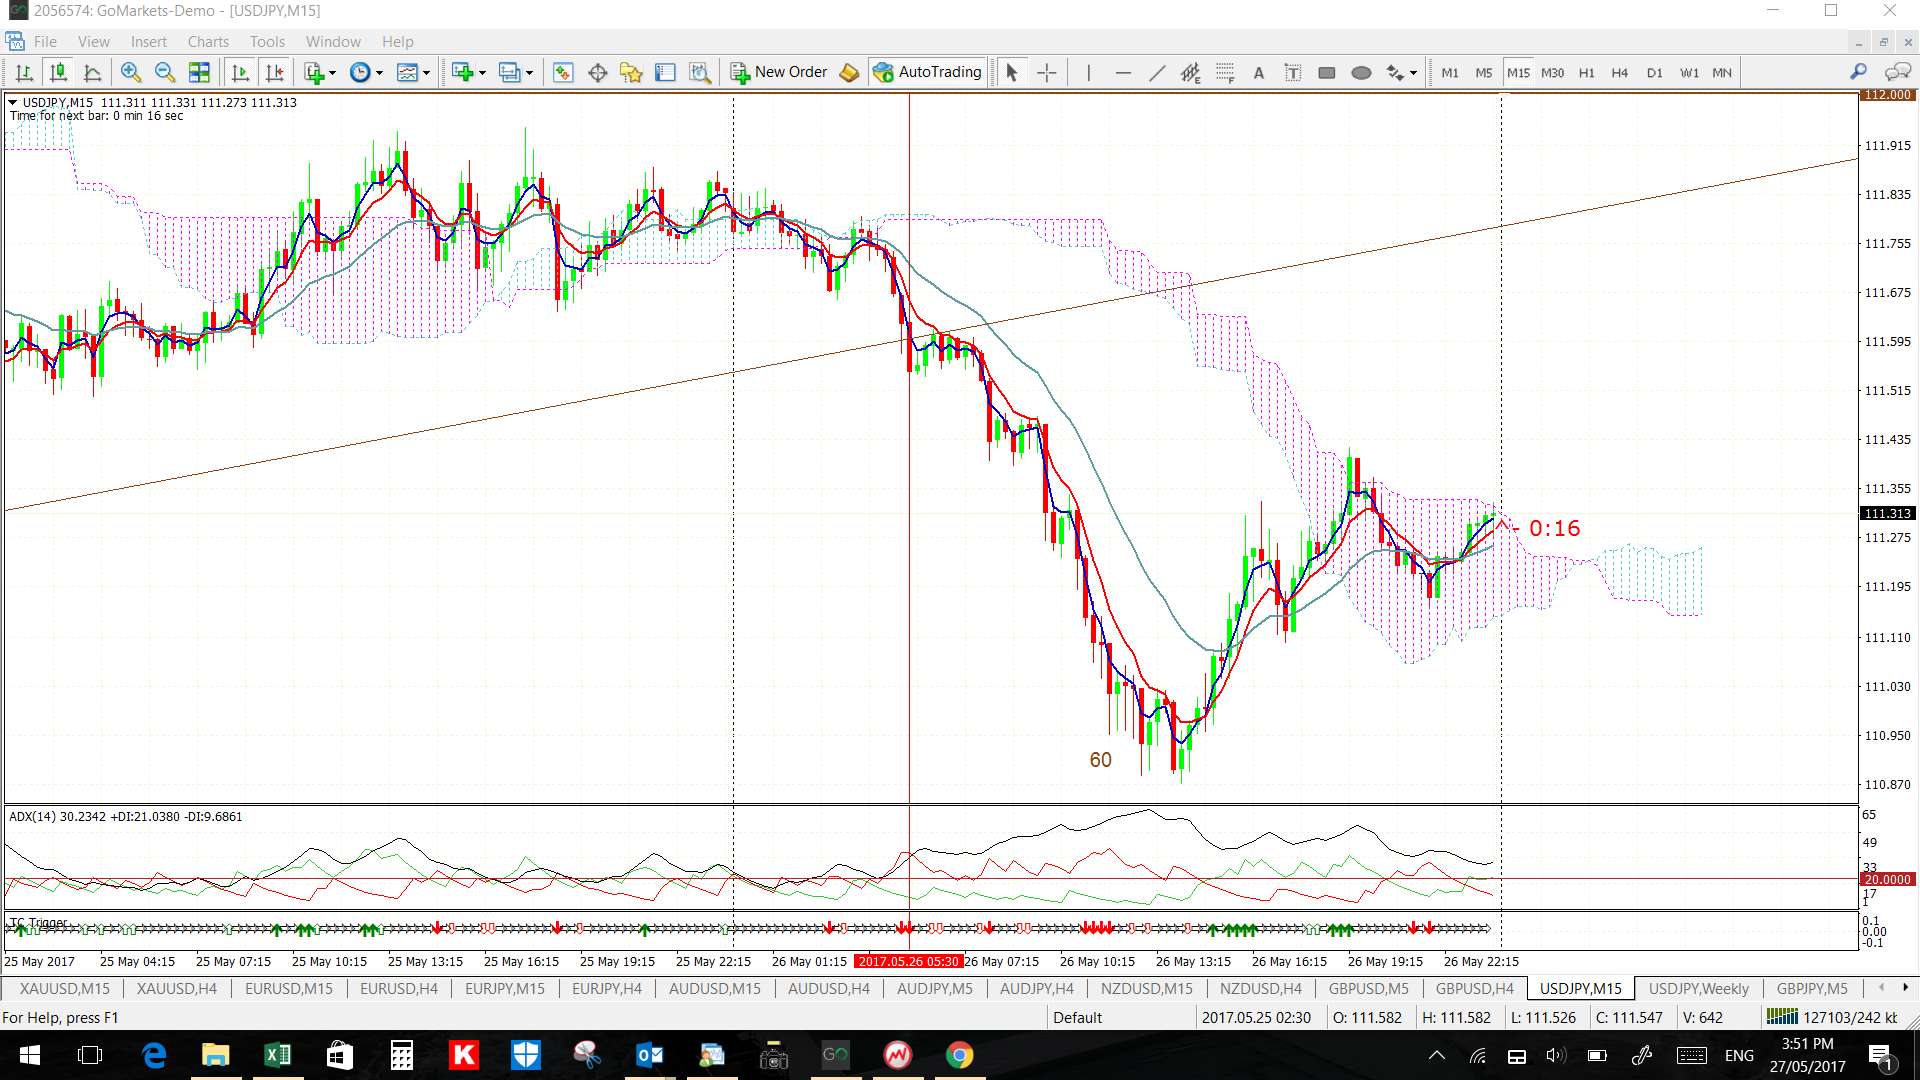
- USD/JPY: 50 pips.
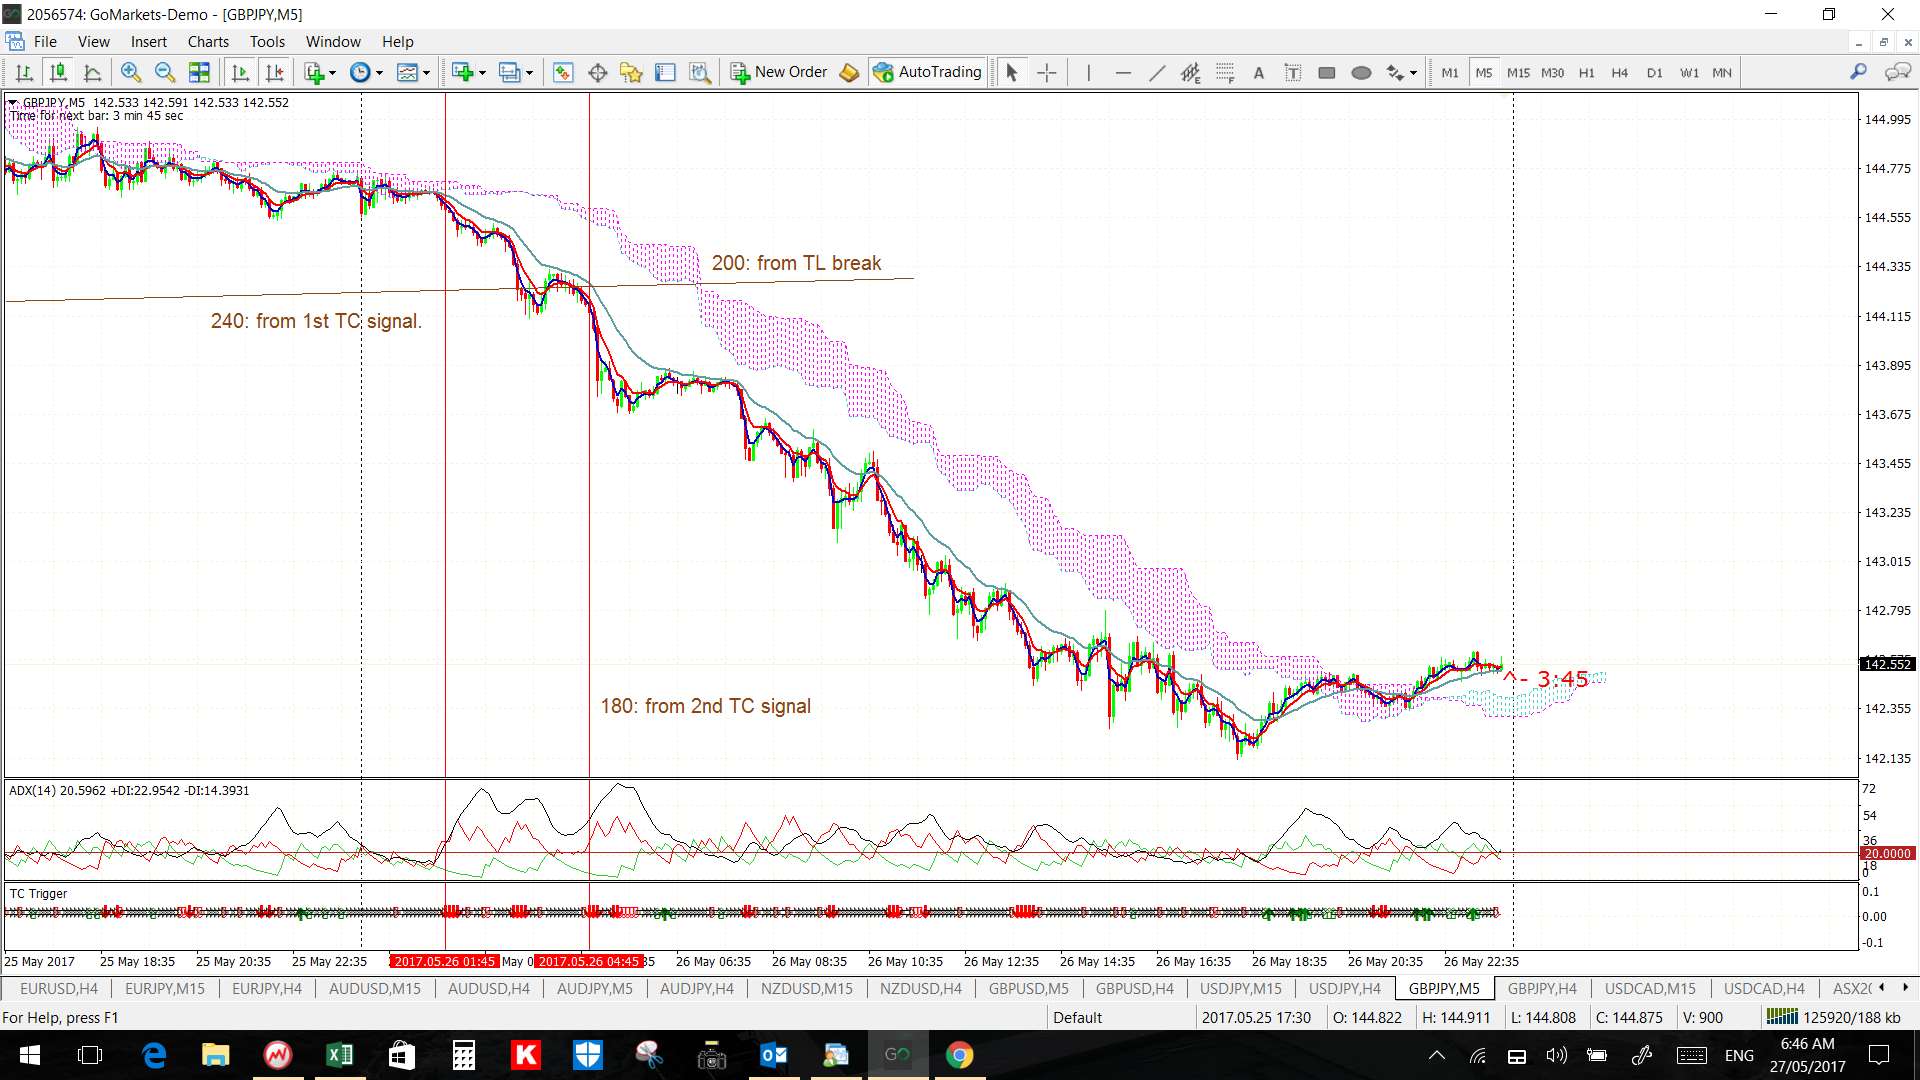
- GBP/JPY: 180 pips.
- GBP/NZD: 200 pips.
- EUR/NZD: 80 pips.
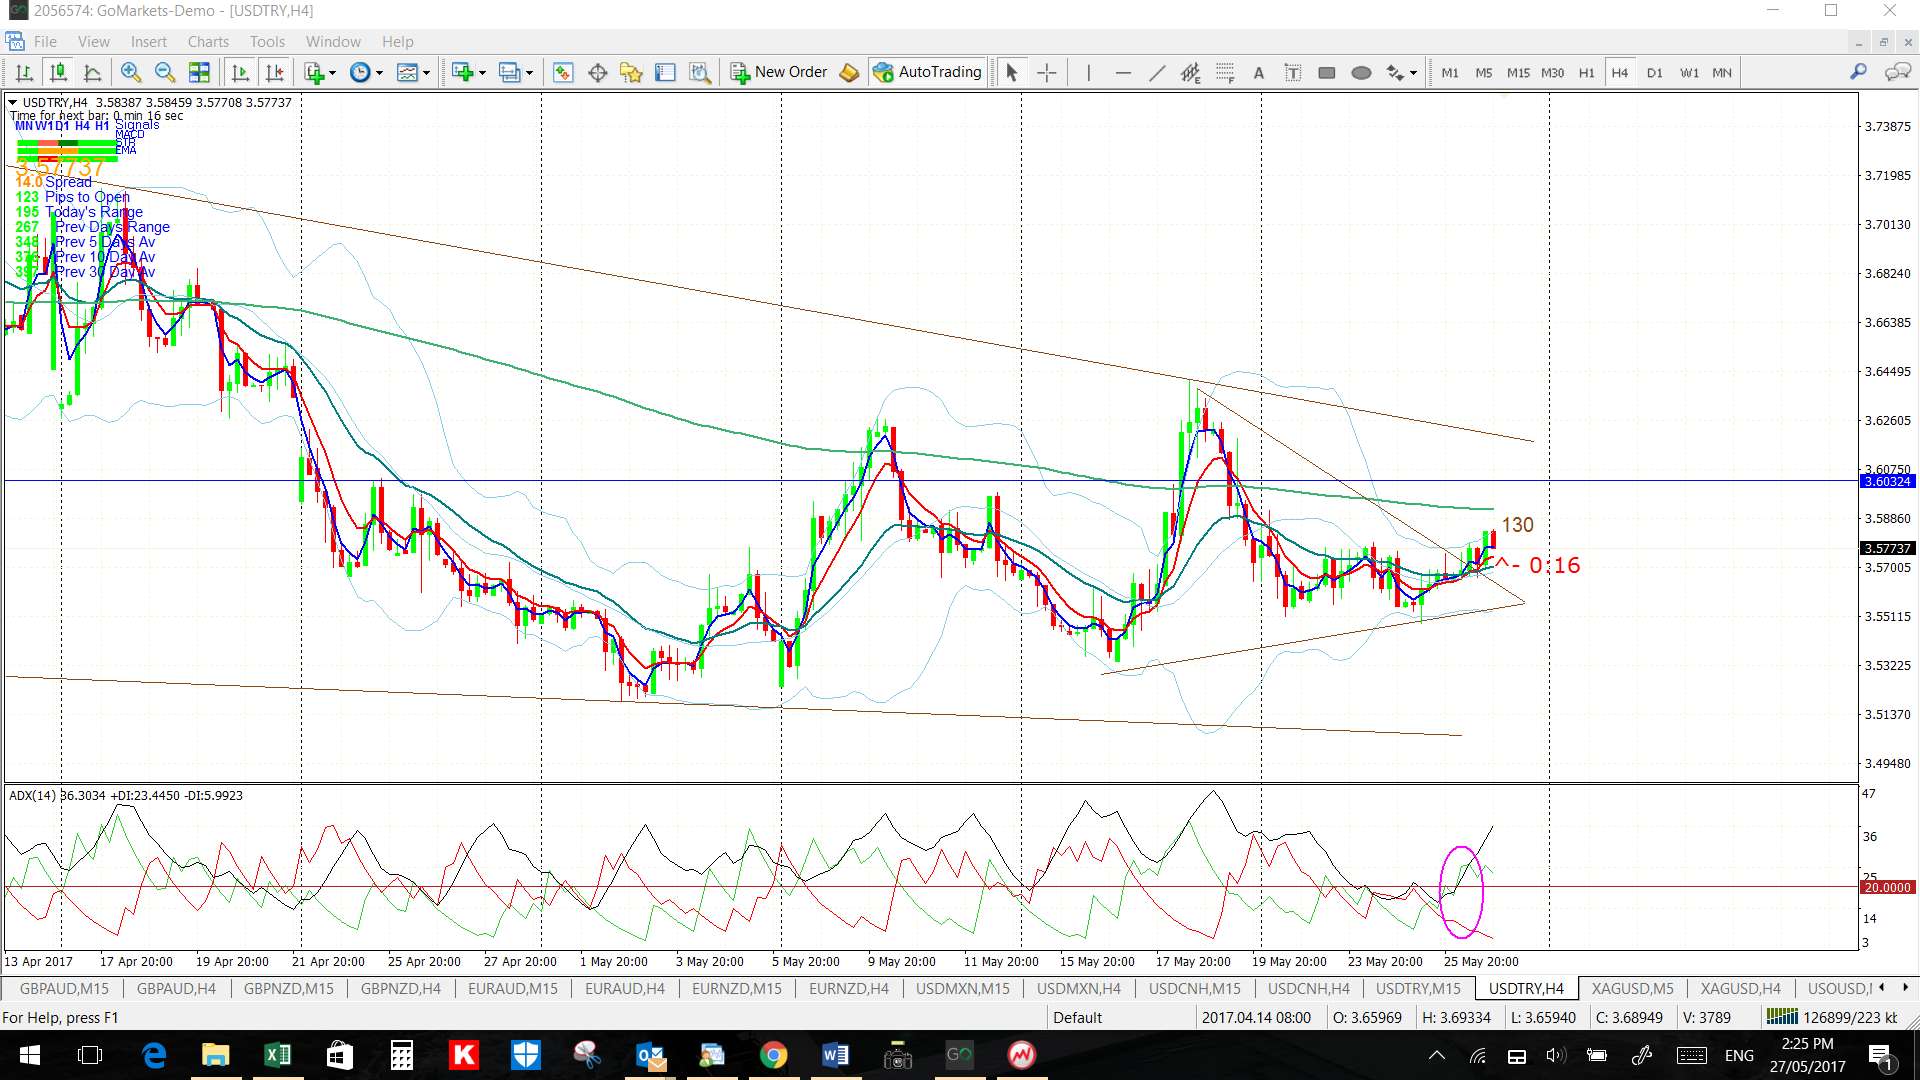
- USD/TRY: 130 pips.
This week:
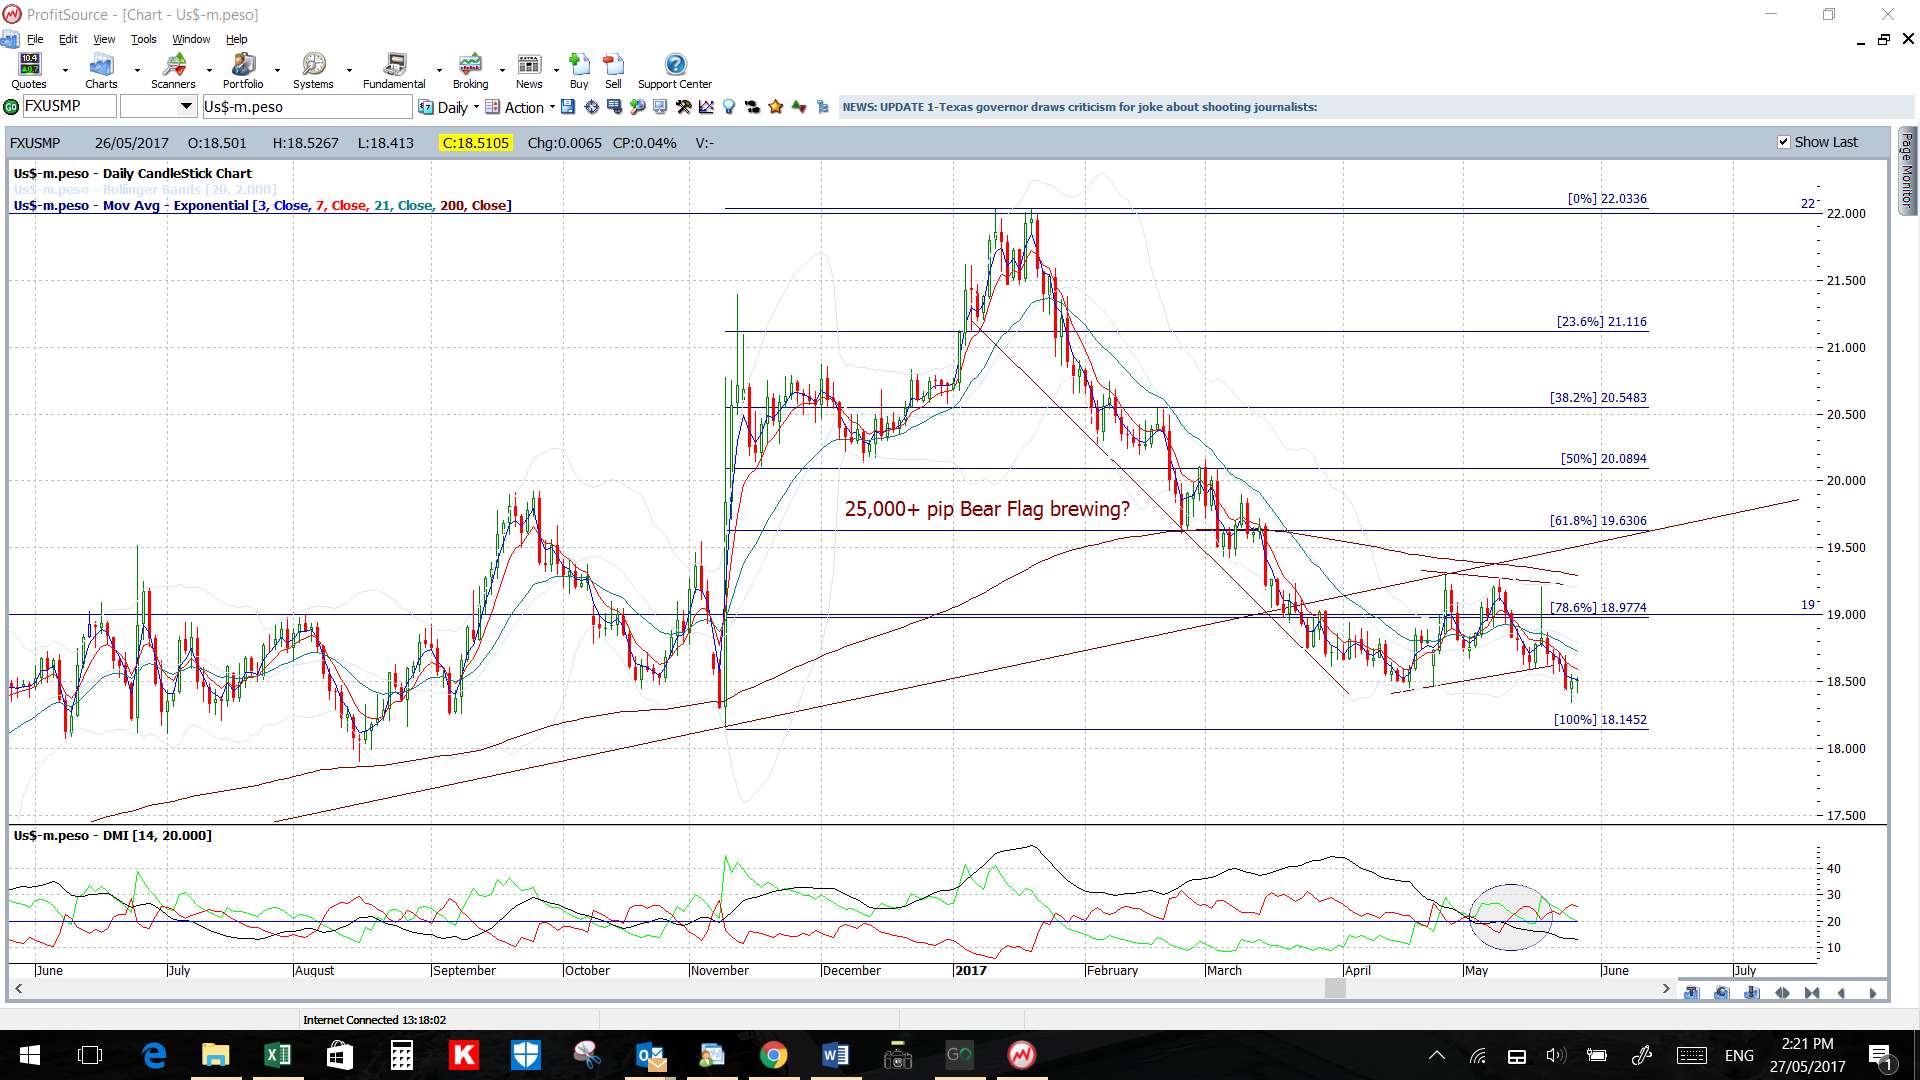
- US$: the US$ remains below a major 3-year support trend line and this week’s NFP might dictate whether this break holds. Any continued US$ weakness could herald some big moves in pairs such as the USD/MXN and USD/CNH. The USD/MXN could be starting a huge bear Flag and the USD/CNH is testing a multi-year support trend line with lots of room to fall. A review of the FX Indices can be found through this link.
- End of month: The month of May concludes during the week so watch for end of month flows on Wednesday.
- NFP: is probably the highlight for data next week.
- UK Elections: the UK election is held the week after next so some GBP hesitation might be expected.
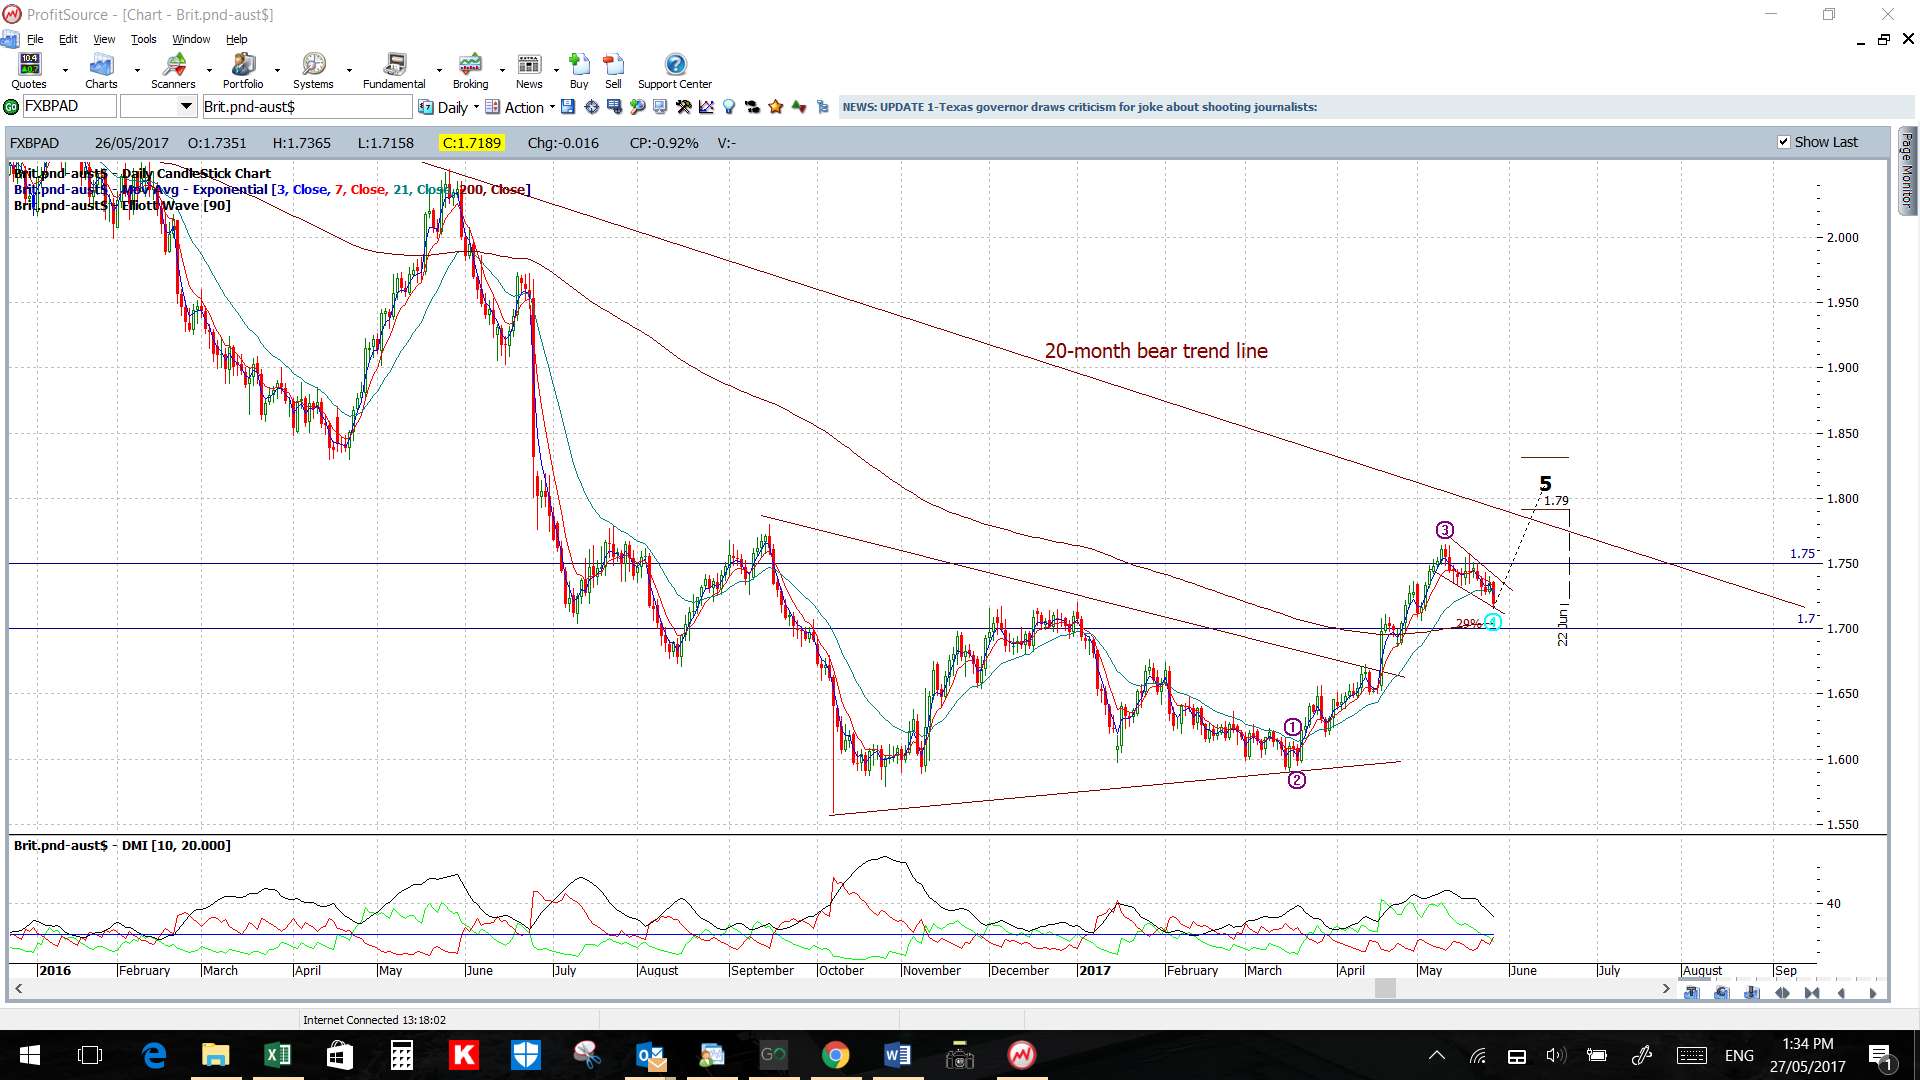
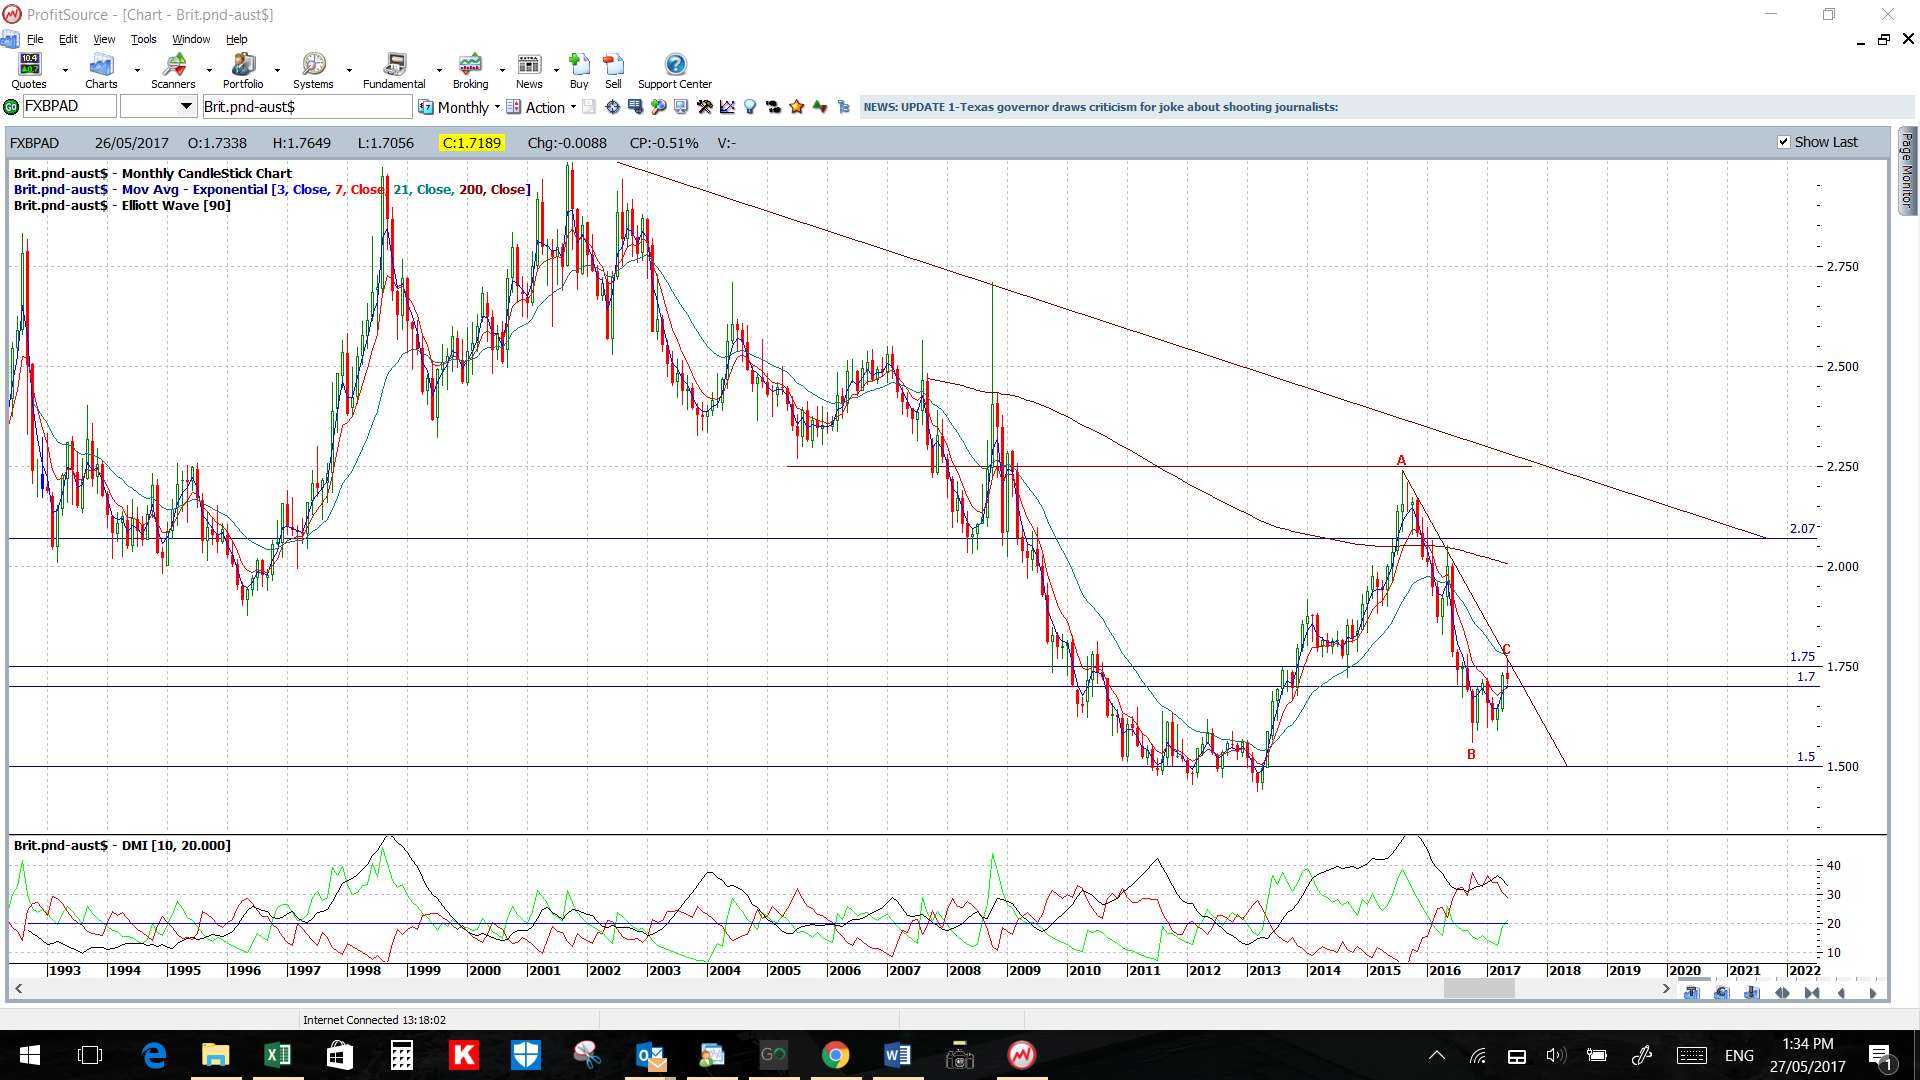
- GBP/AUD and GBP/JPY: both of these pairs continue trading just under 20+ month bear trend lines so watch for any make or break activity. These trend lines form part of triangle patterns that technical theory suggests are worth over 4,000 pips so these are well worth monitoring.
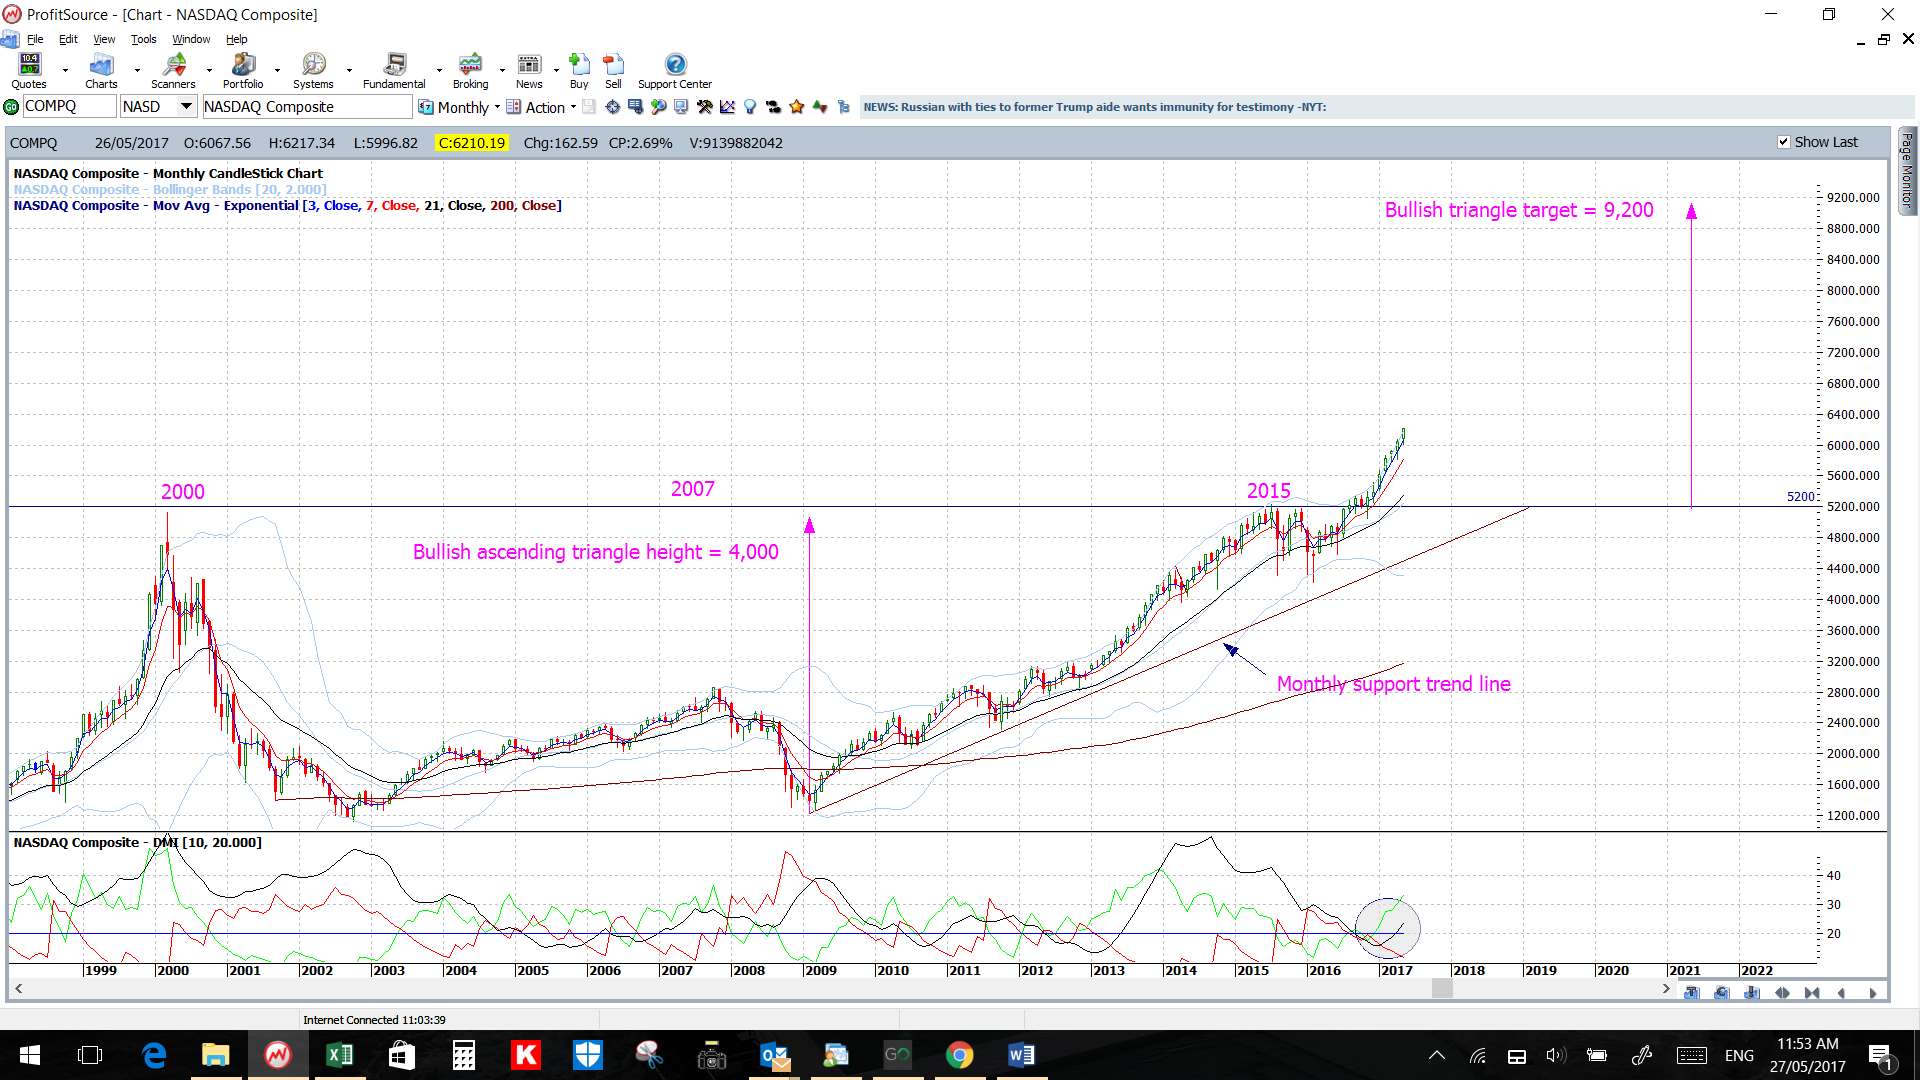
- NASDAQ: two years ago I gave a series of presentation in Sydney suggesting traders would be wise to watch for any bullish breakout on the NASDAQ index. I was a bit early with my call, but, better before the breakout than after and I now feel kinda validated!
- Risk : Reward: I have published a new page on my site called Risk : Reward so please check this out.
- TC Trial Participants: please make sure you read this review of a recent losing trade and the new page on Risk : Reward.
- TC + TL: The regime of watching for trend line breakouts that trigger with new TC signals continues to be a winning formula and there were three text-book style examples on Friday with some Yen pairs as shown below (click on charts to enlarge):
GBP/JPY 5′:
 Calendar: data to monitor next week:
- Mon 29th: CNY, GBP & US Bank Holiday. EUR ECB President Draghi speaks.
- Tue 30th: CNY Bank Holiday. USD CB Consumer Confidence.
- Wed 31st: NZD RBNZ Financial Stability Report. CNY Manufacturing & Non-Manufacturing PMI. CAD GDP.
- Thurs 1st: AUD Private Capital Expenditure & Retail Sales. GBP Manufacturing PMI. EUR lots of PMIs. USD ADP NFP, Weekly Unemployment Claims & Crude Oil Inventories.
- Fri 2nd: GBP Construction PMI. USD NFP & Trade Balance. CAD Trade Balance.
Forex:
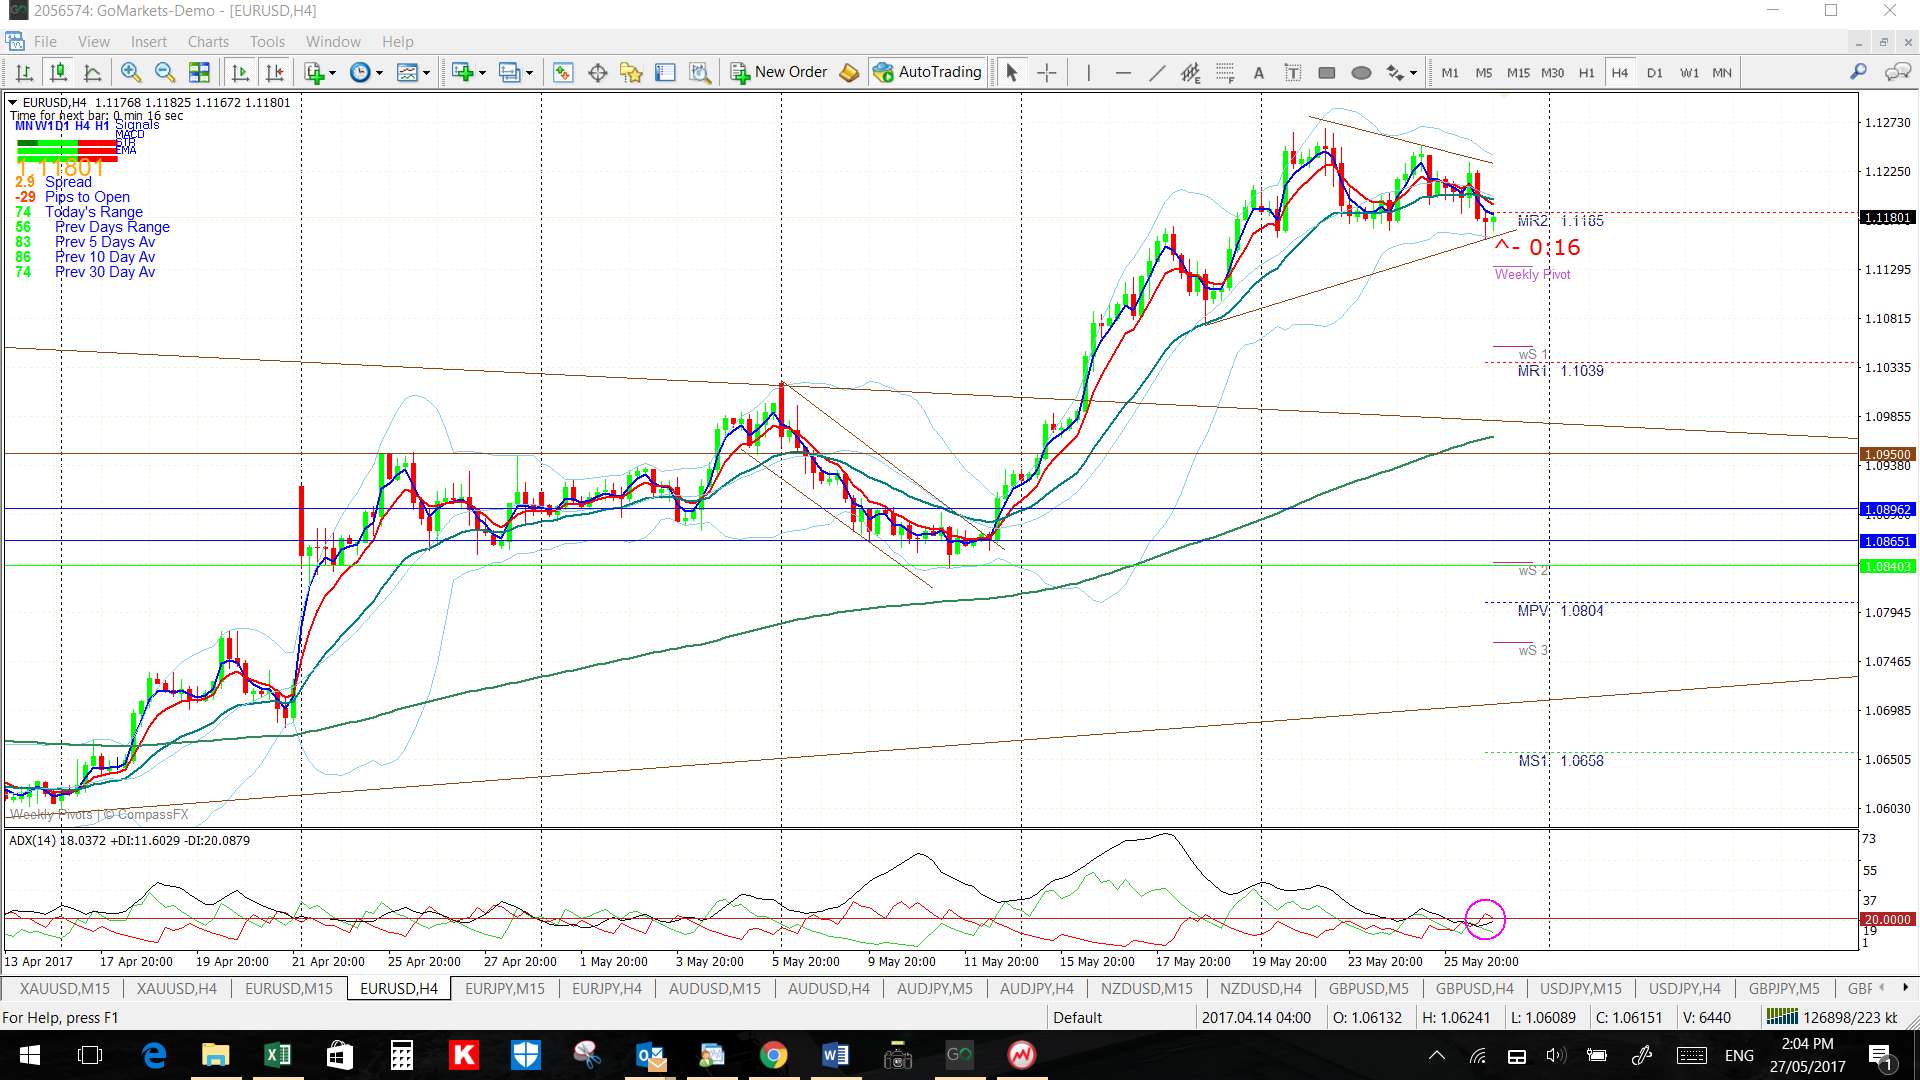
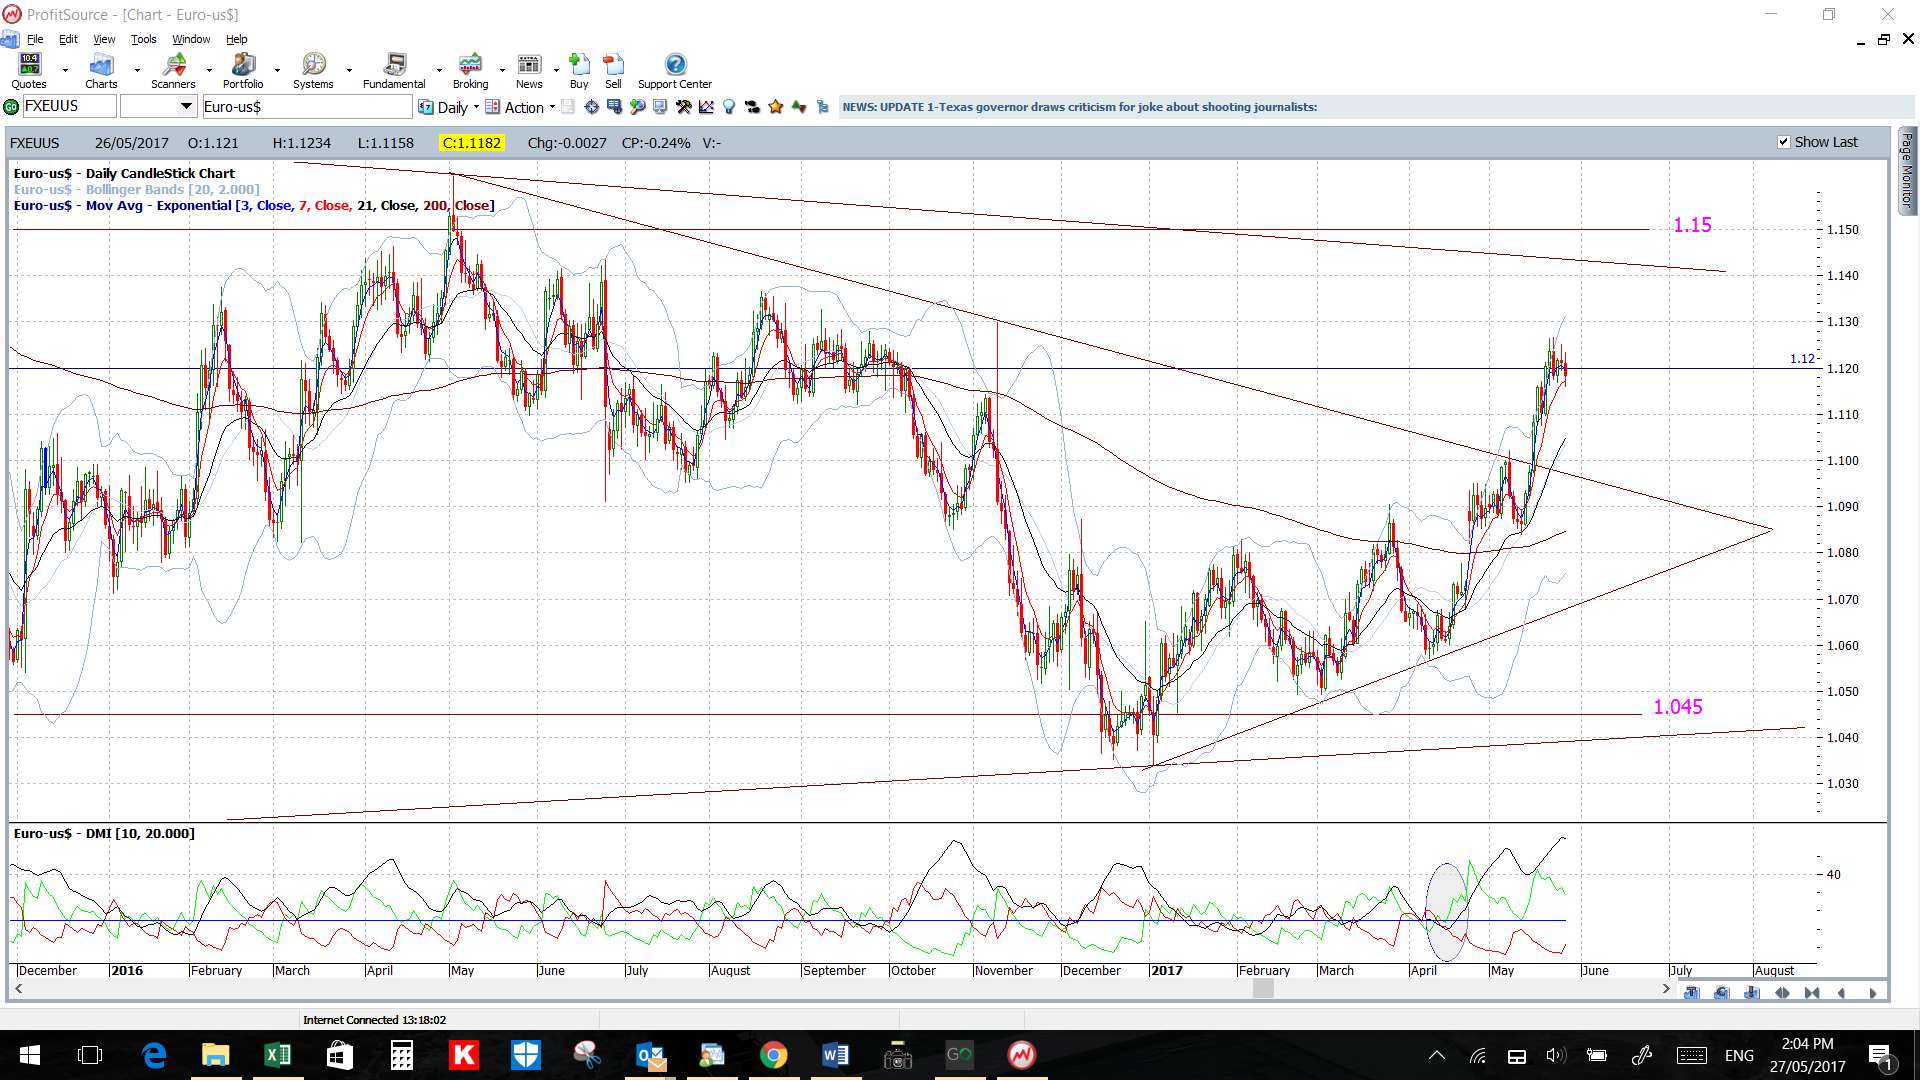
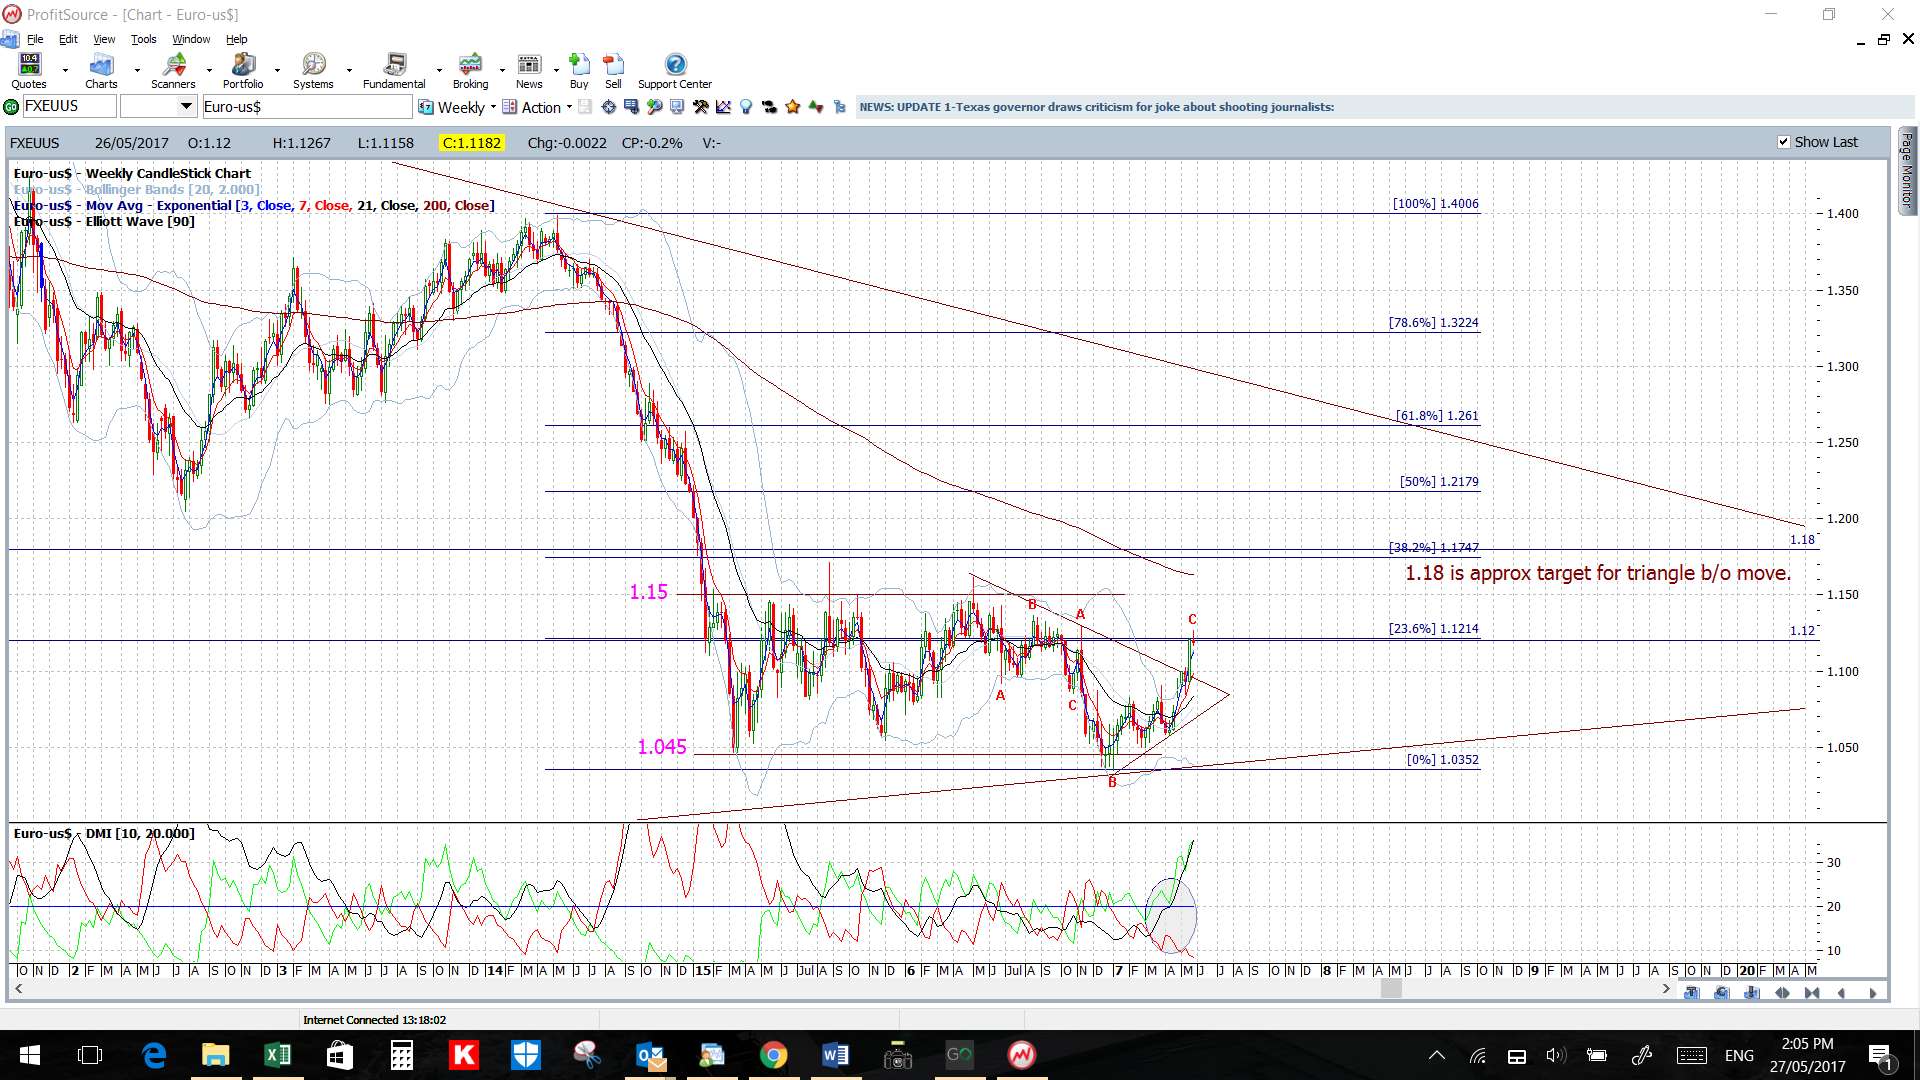
EUR/USD: The previous triangle breakout from the daily chart’s triangle is still in progress and this triangle could be worth up to 800 pips. There are trend lines on the 4hr chart though to monitor for any new breakout as well:
- Upper targets: 1.15 as previous S/R followed by 1.18 being the daily chart triangle breakout target.
- Lower targets: any pullback would have me looking for a test of the daily chart’s broken trend line. After that, the 4hr chart’s 61.8% Fib.
An interesting point is that the target for the triangle breakout move is up near 1.18 and this is near the upper edge of the trading range for this pair since the start of 2015 (shown on the weekly chart below).
Watch for impact from this week’s ECB President Draghi speech and from Friday’s NFP.


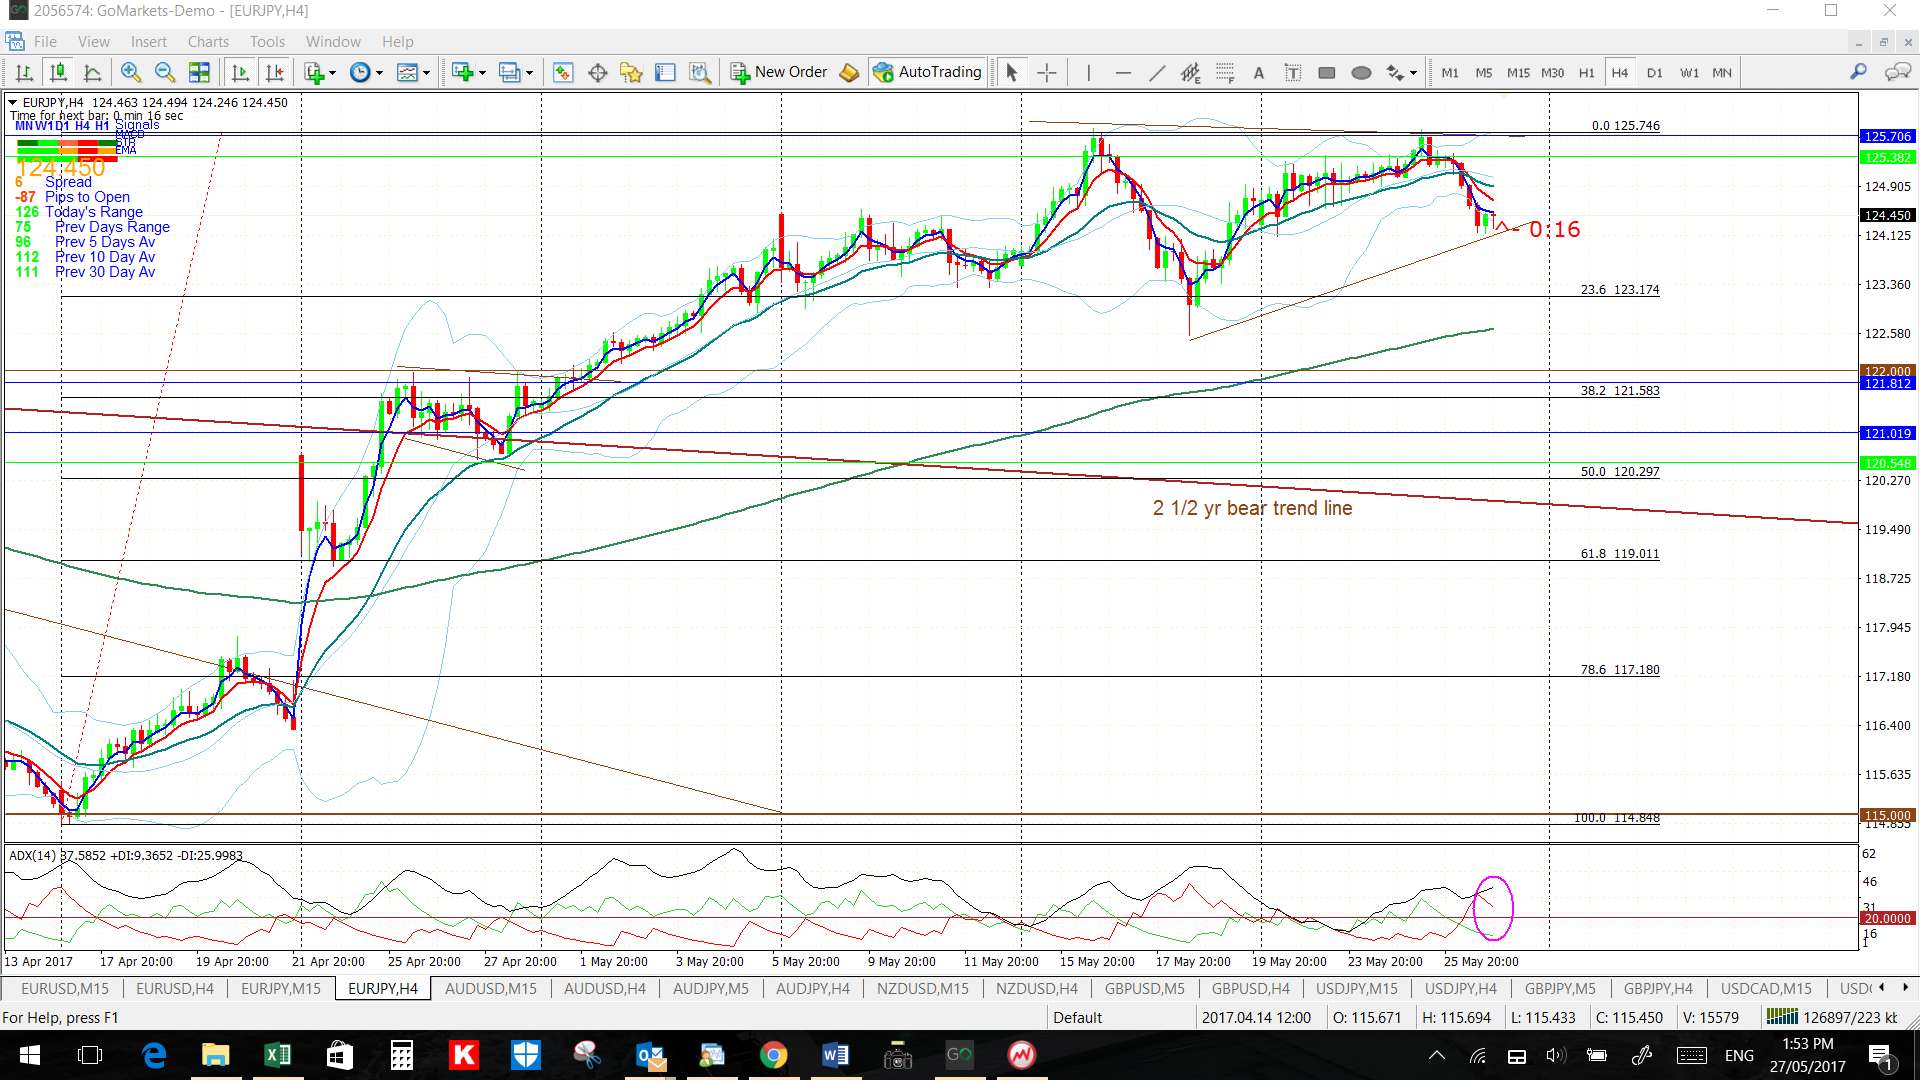
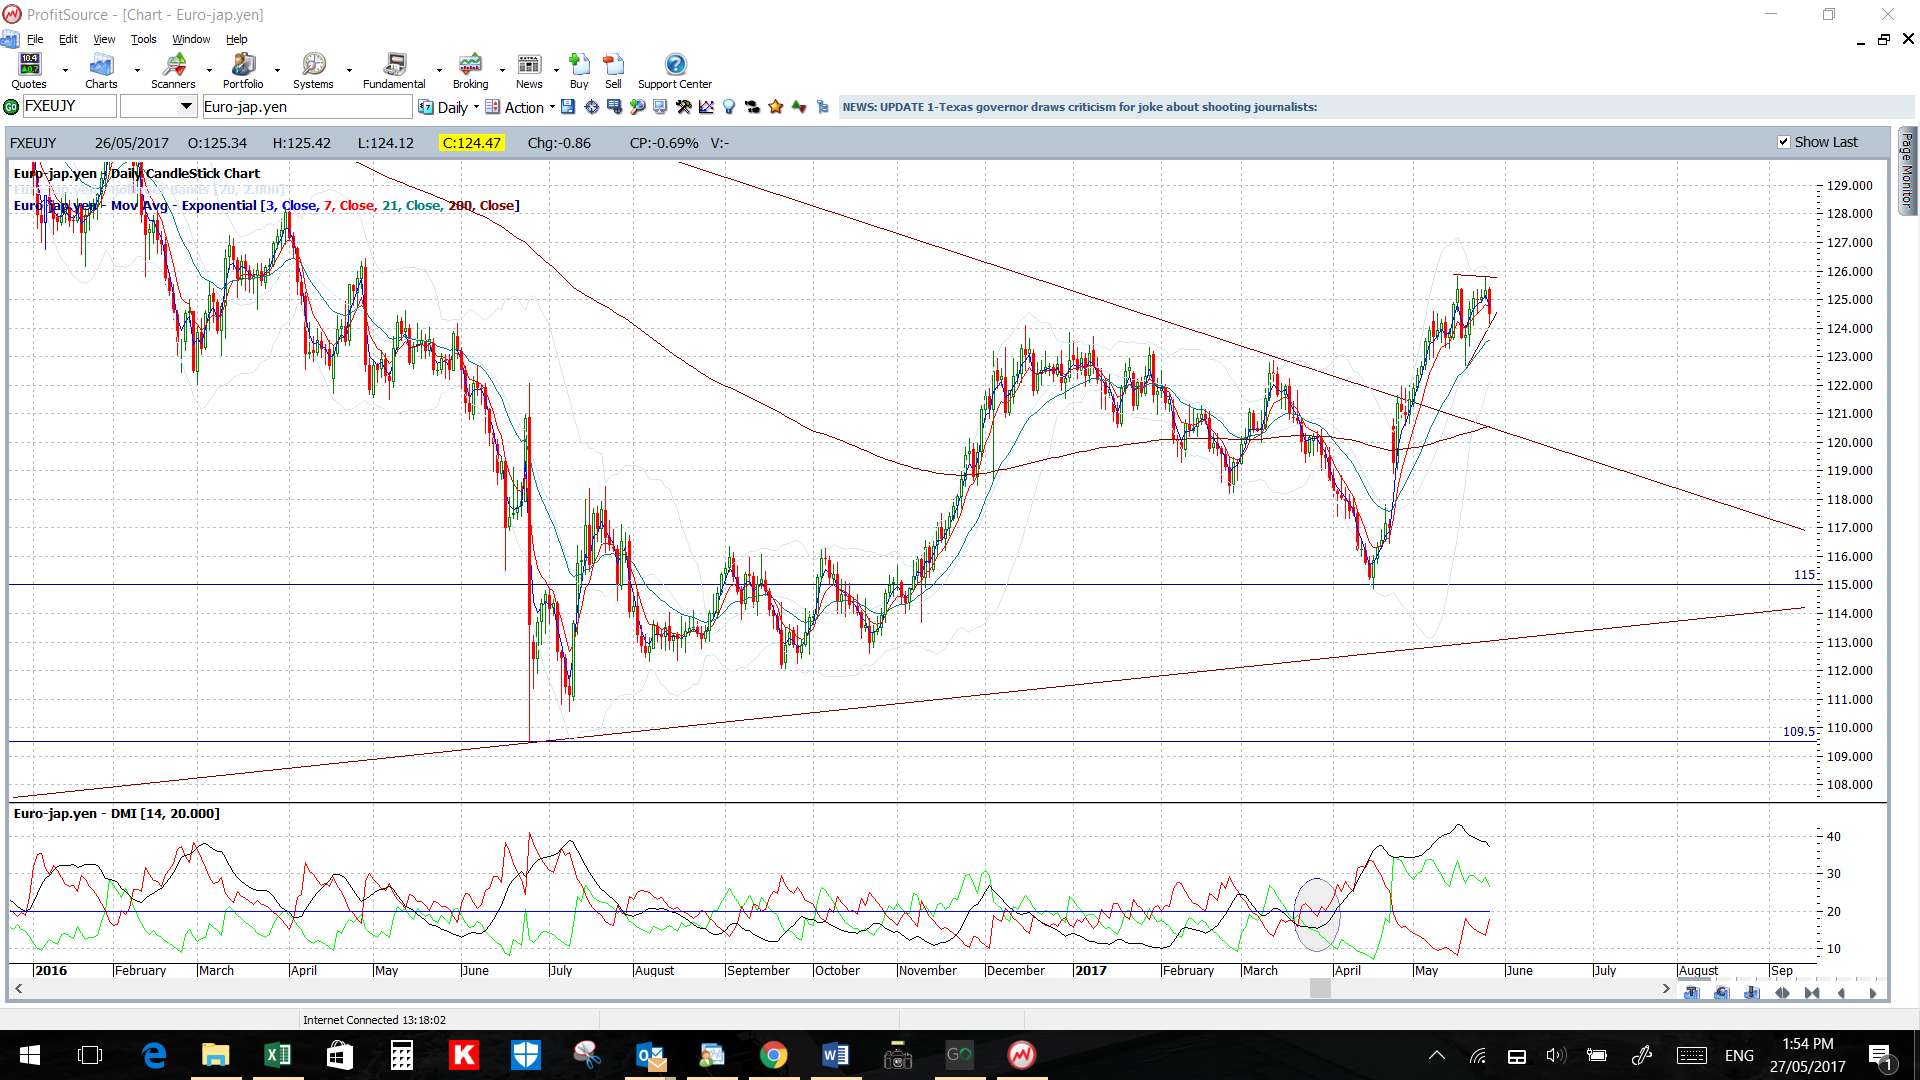
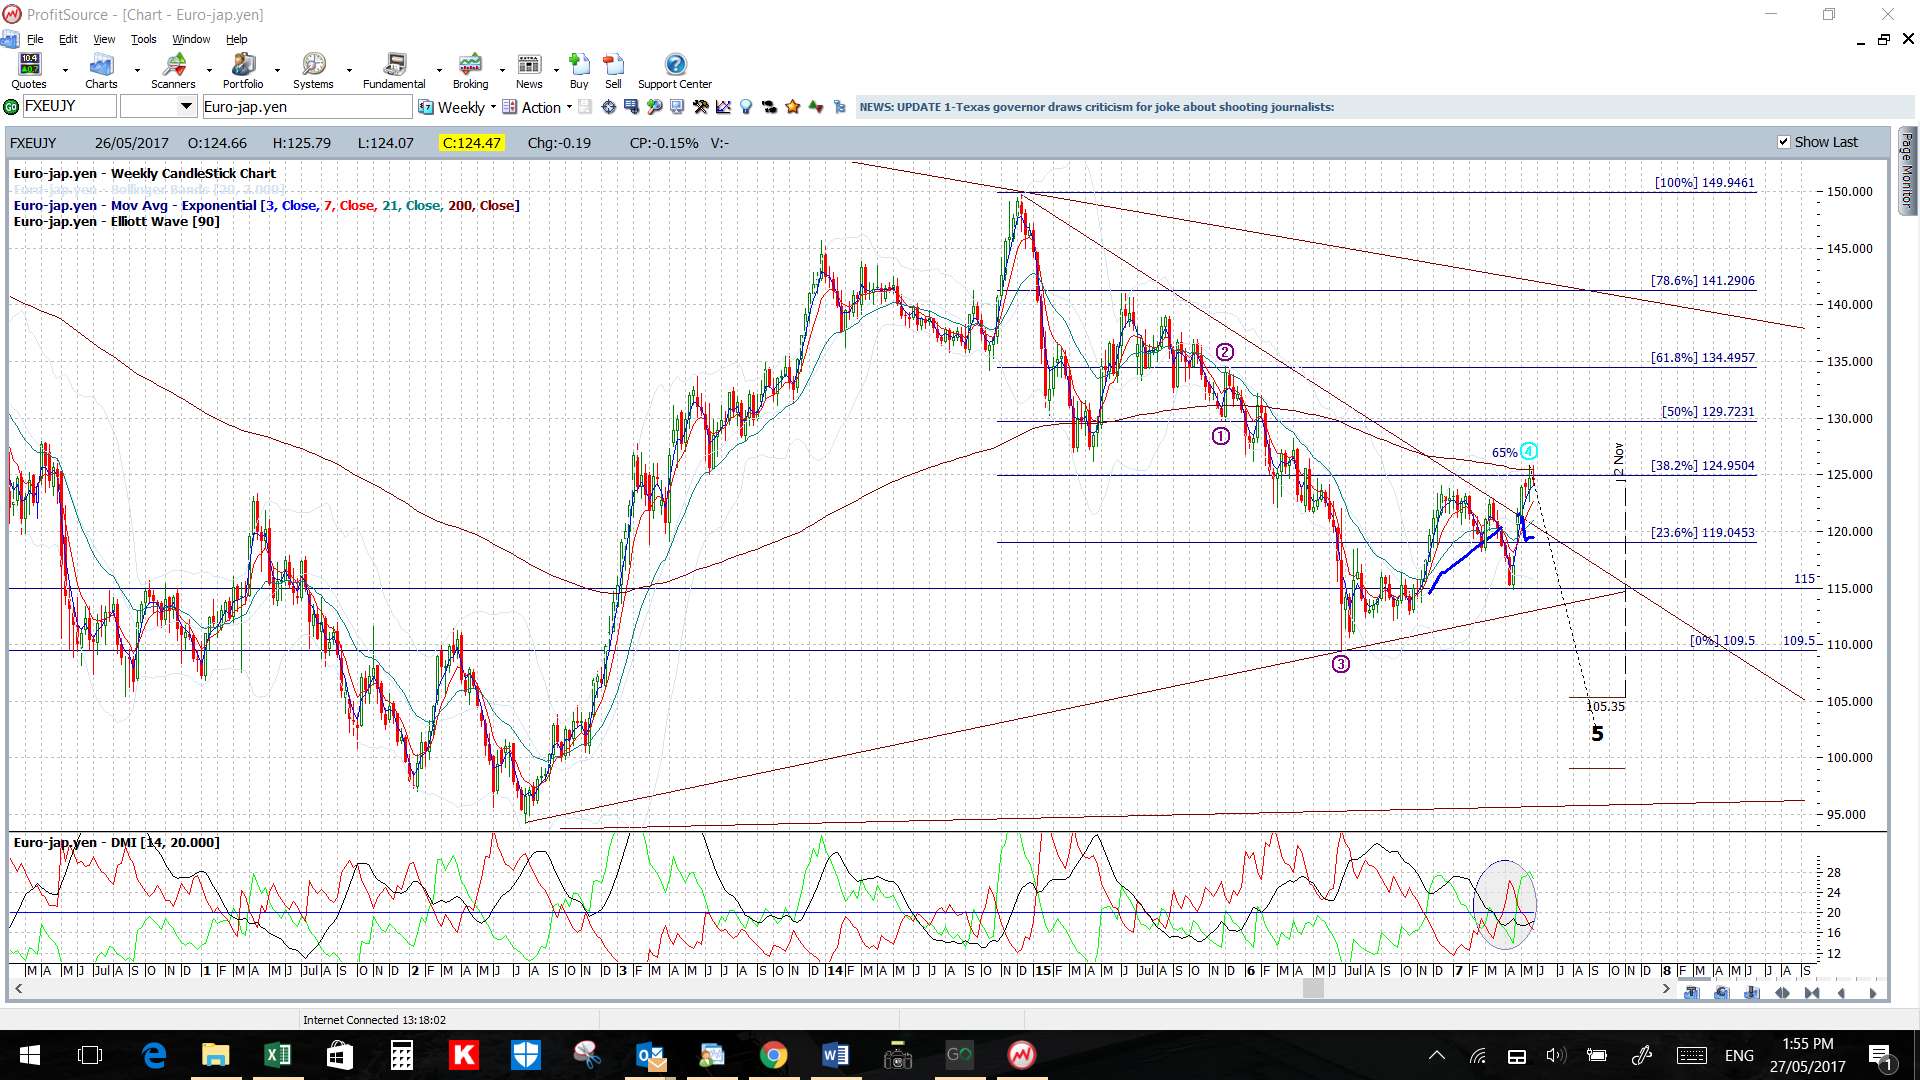
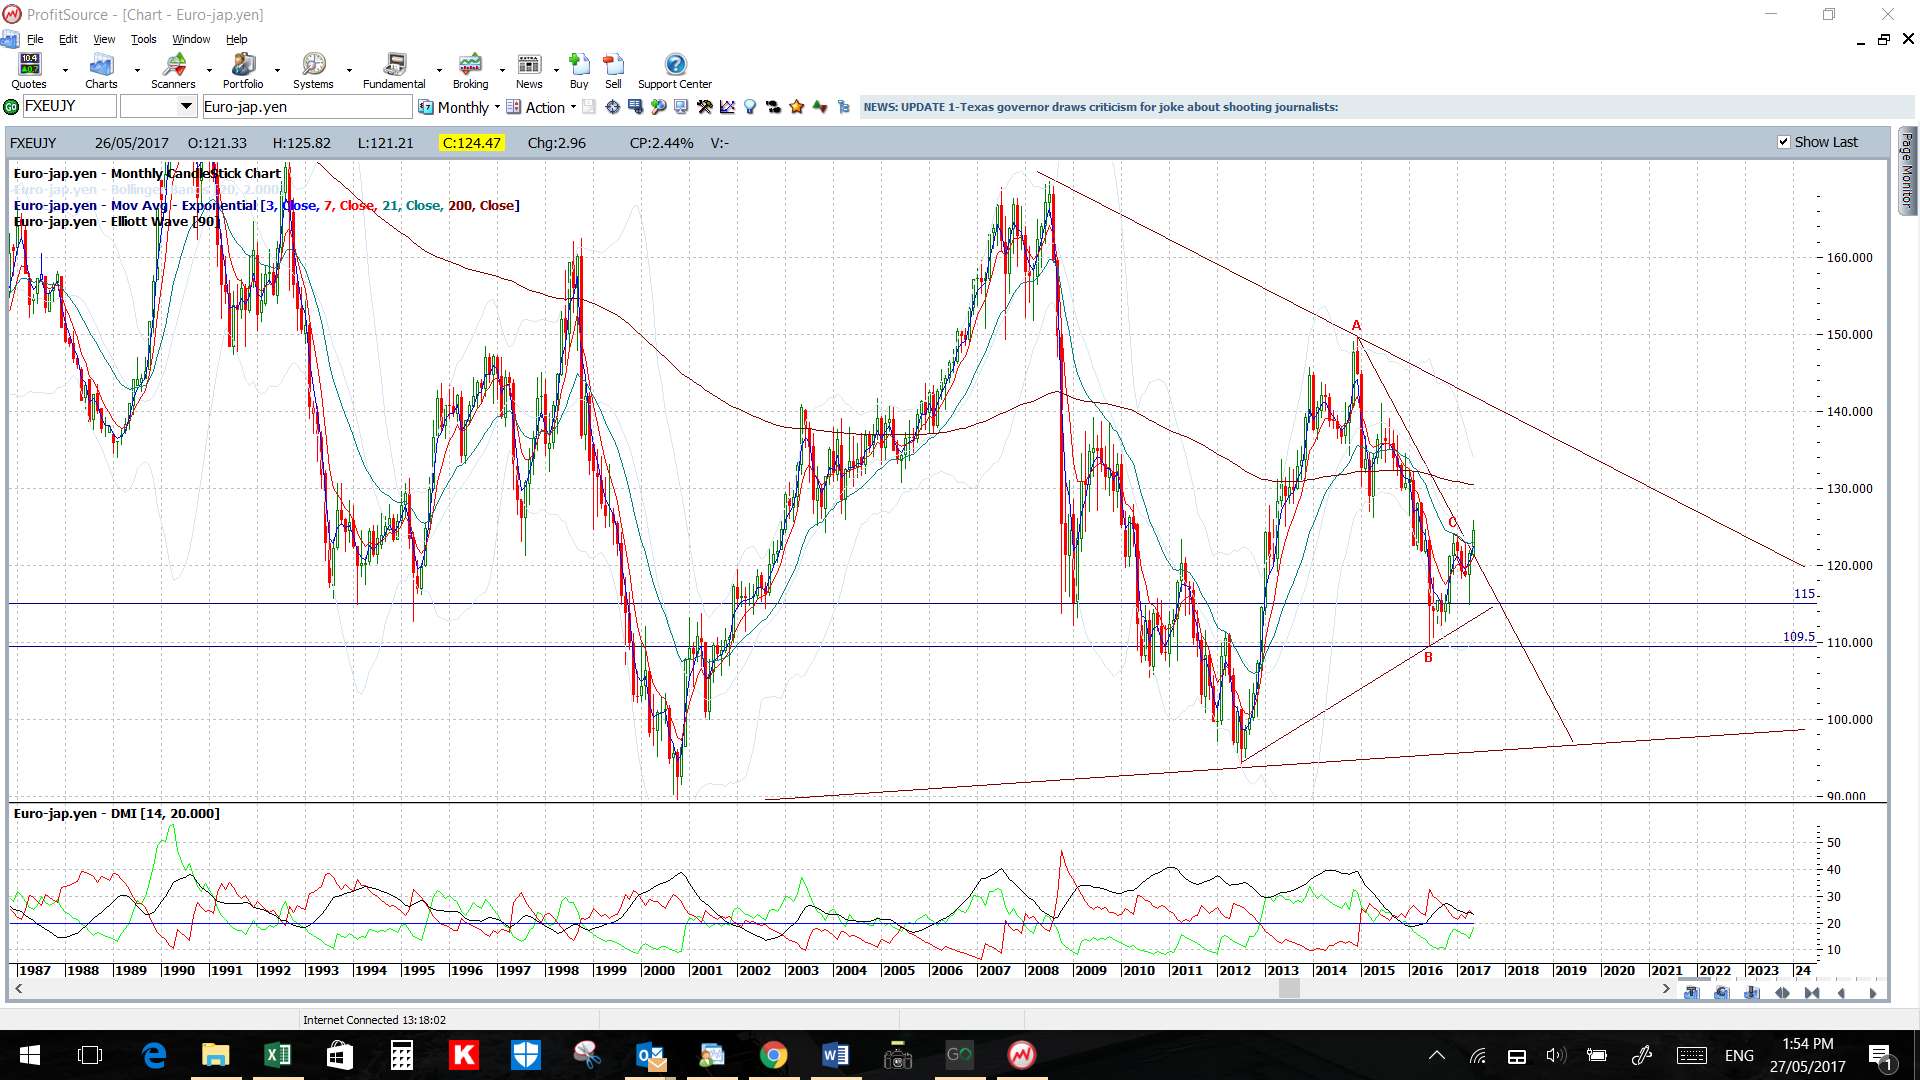
EUR/JPY: Watch the 4hr chart’s revised wedge trend lines for any new breakout:
- Upper targets: the weekly chart’s 61.8% Fib near 135.
- Lower targets: any pullback would have me looking for a test of the daily chart’s broken 2 ½ bear trend line which is near the 4hr chart’s 50% Fib.
Note how the monthly candle looks set to make a bullish close above the 2 ½ bear trend line!

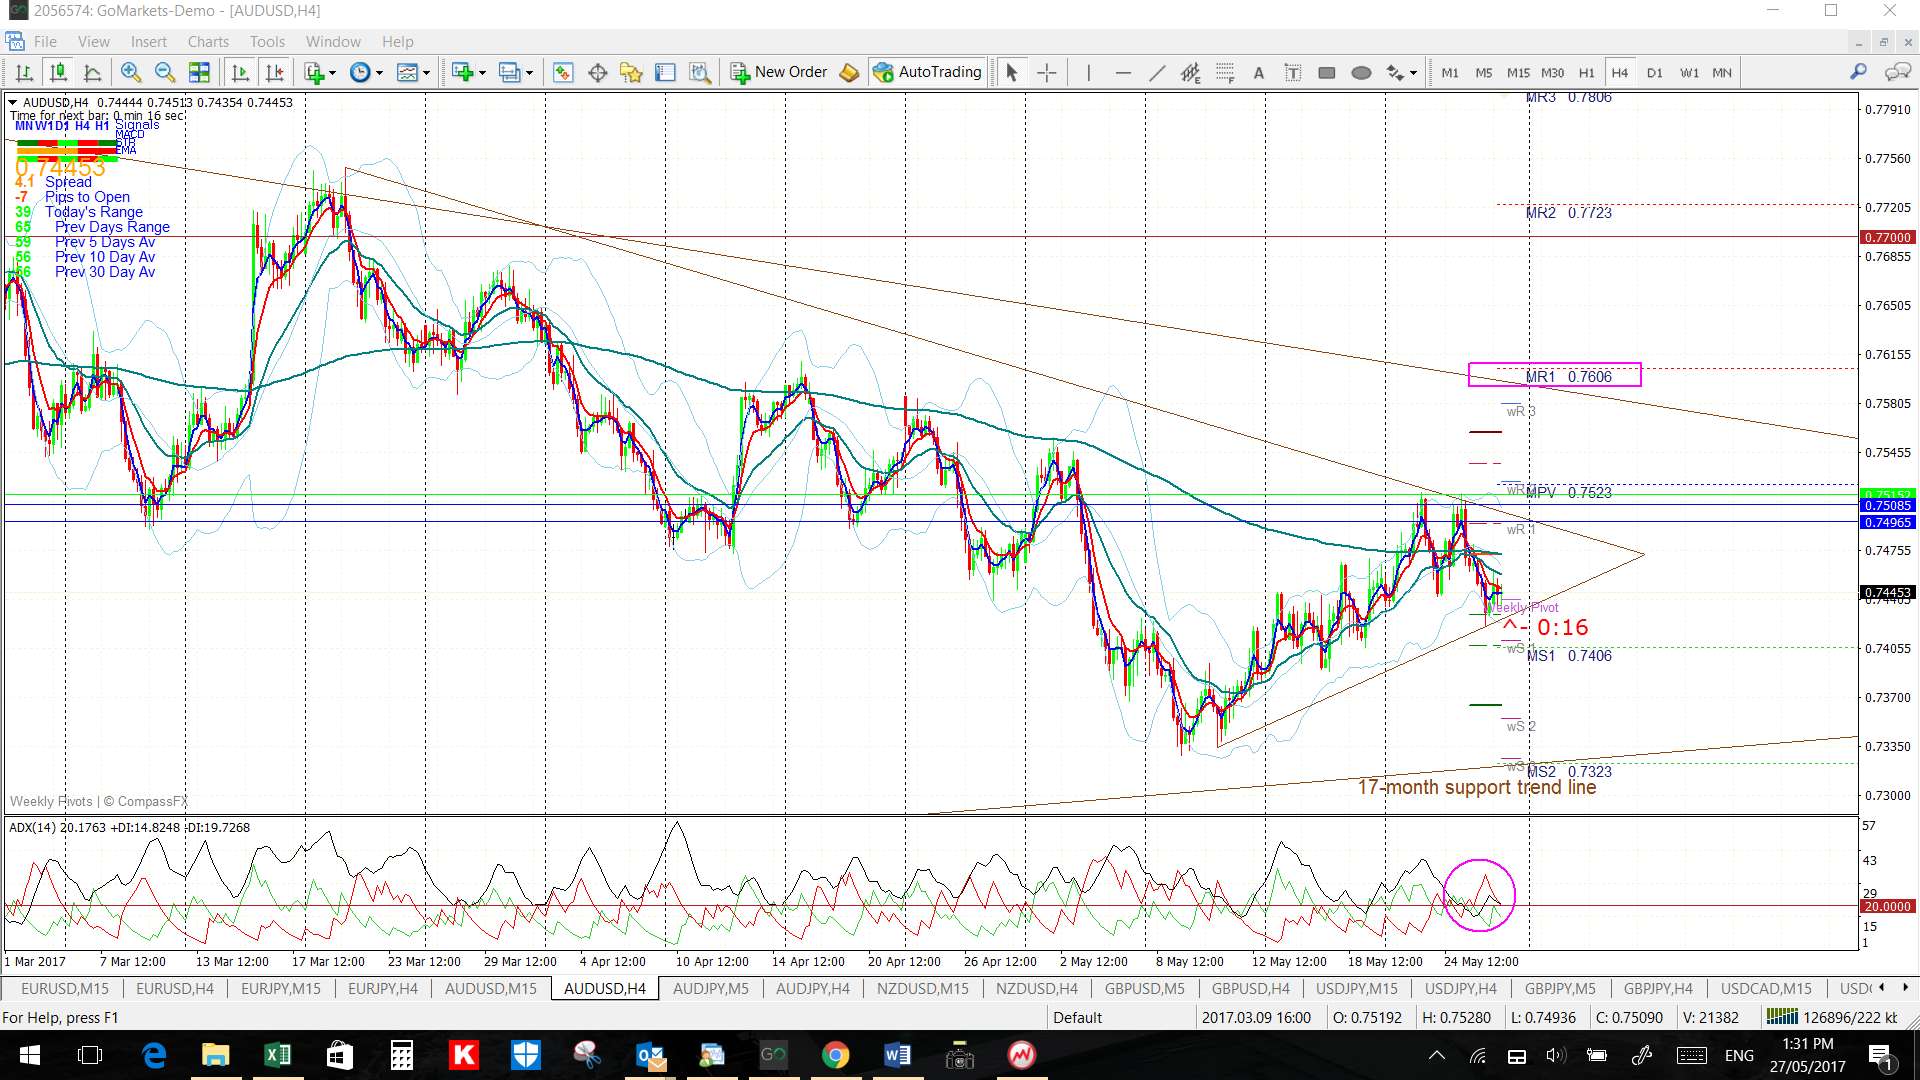
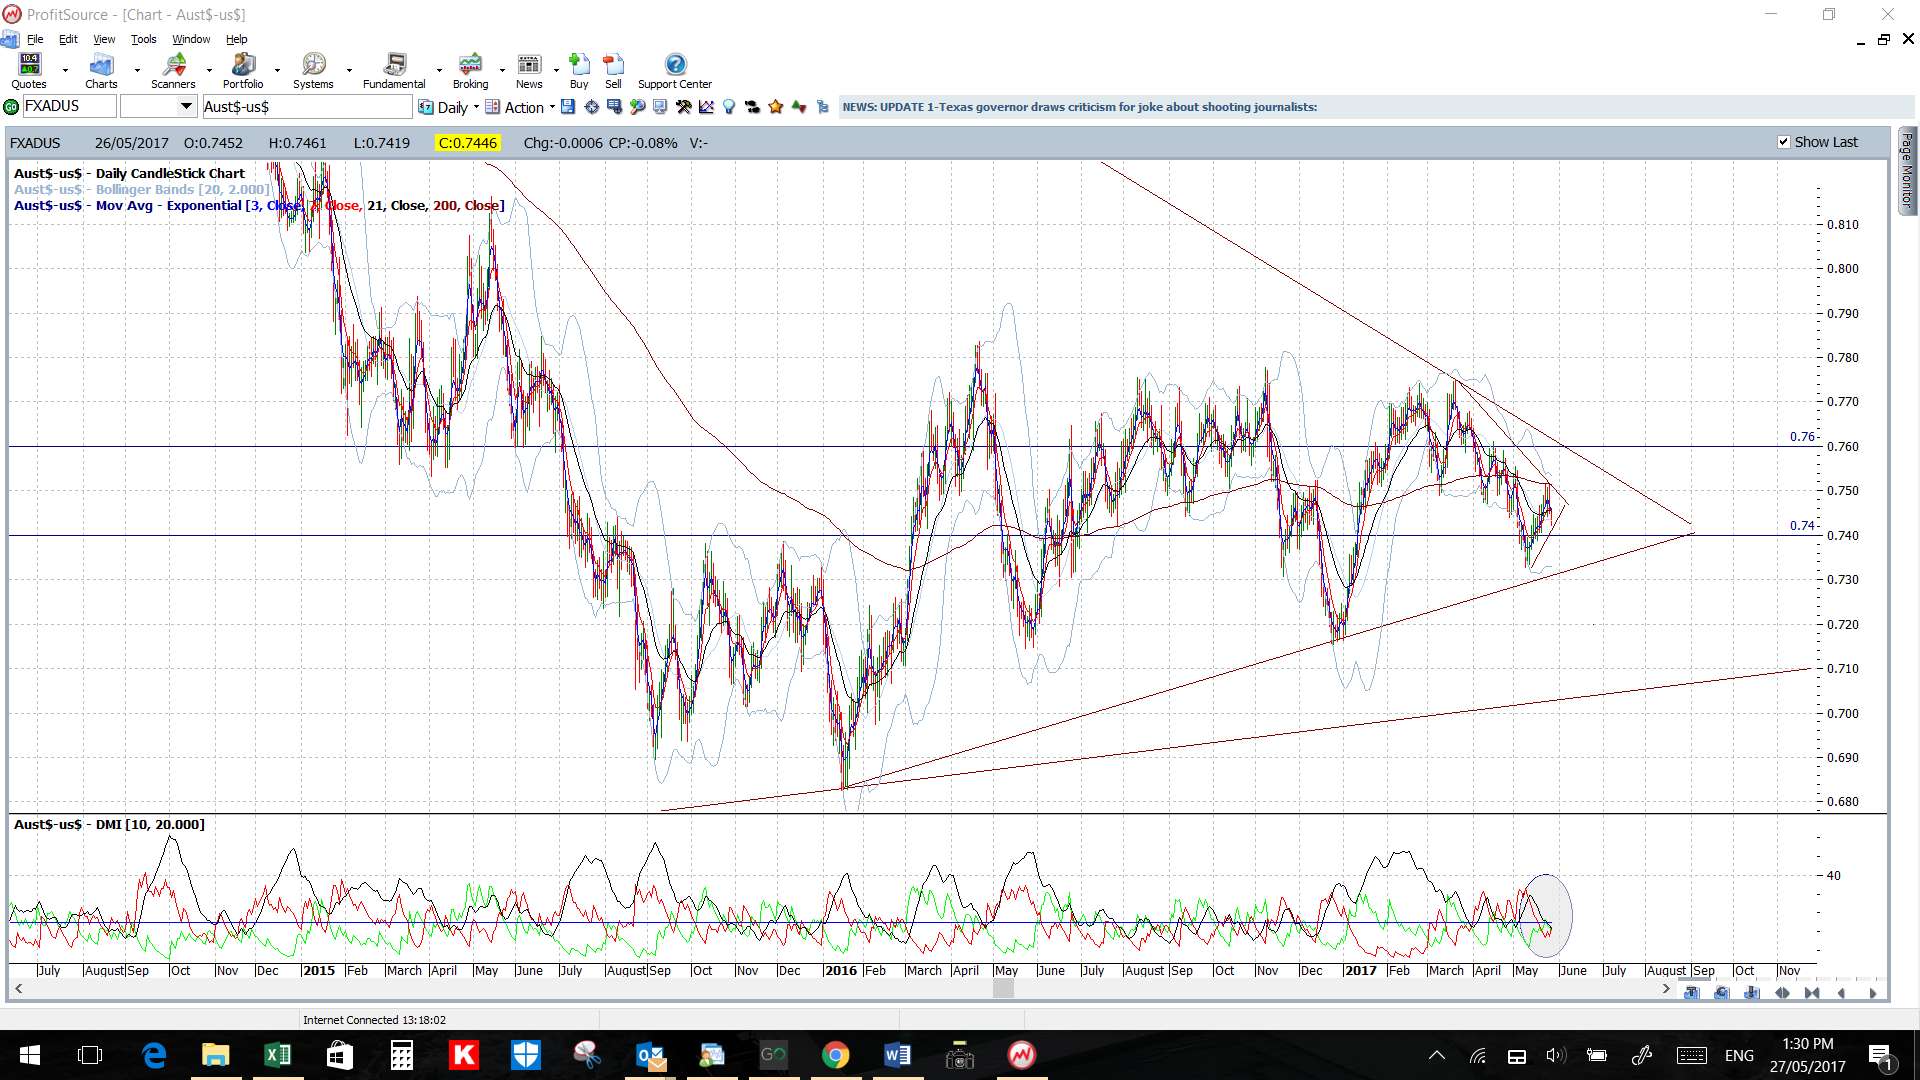
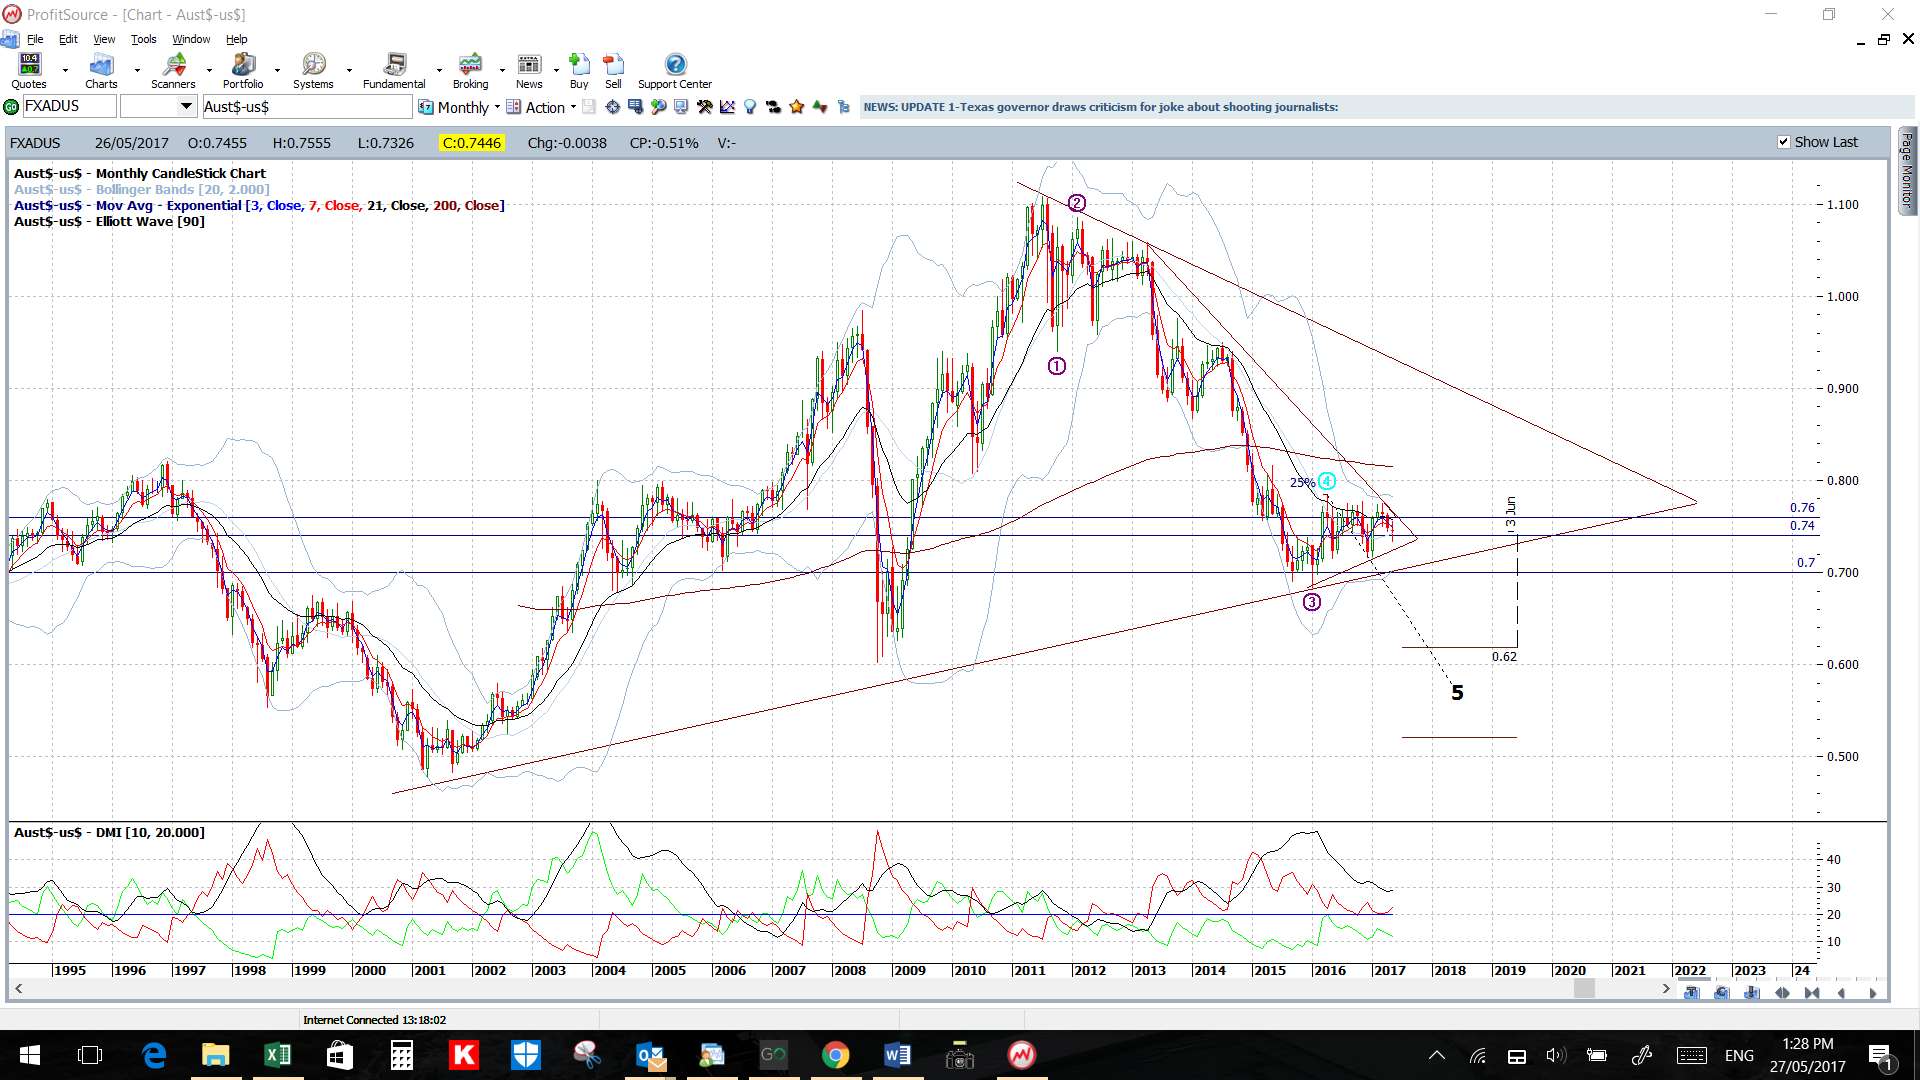
AUD/USD: Watch the 4hr chart’s revised triangle trend lines for any new breakout:
- Upper targets: 0.76 as prev S/R which is also near the daily chart’s next triangle bear trend line.
- Lower targets: any pullback would have me looking for a test of the daily chart’s 17-month support trend line.
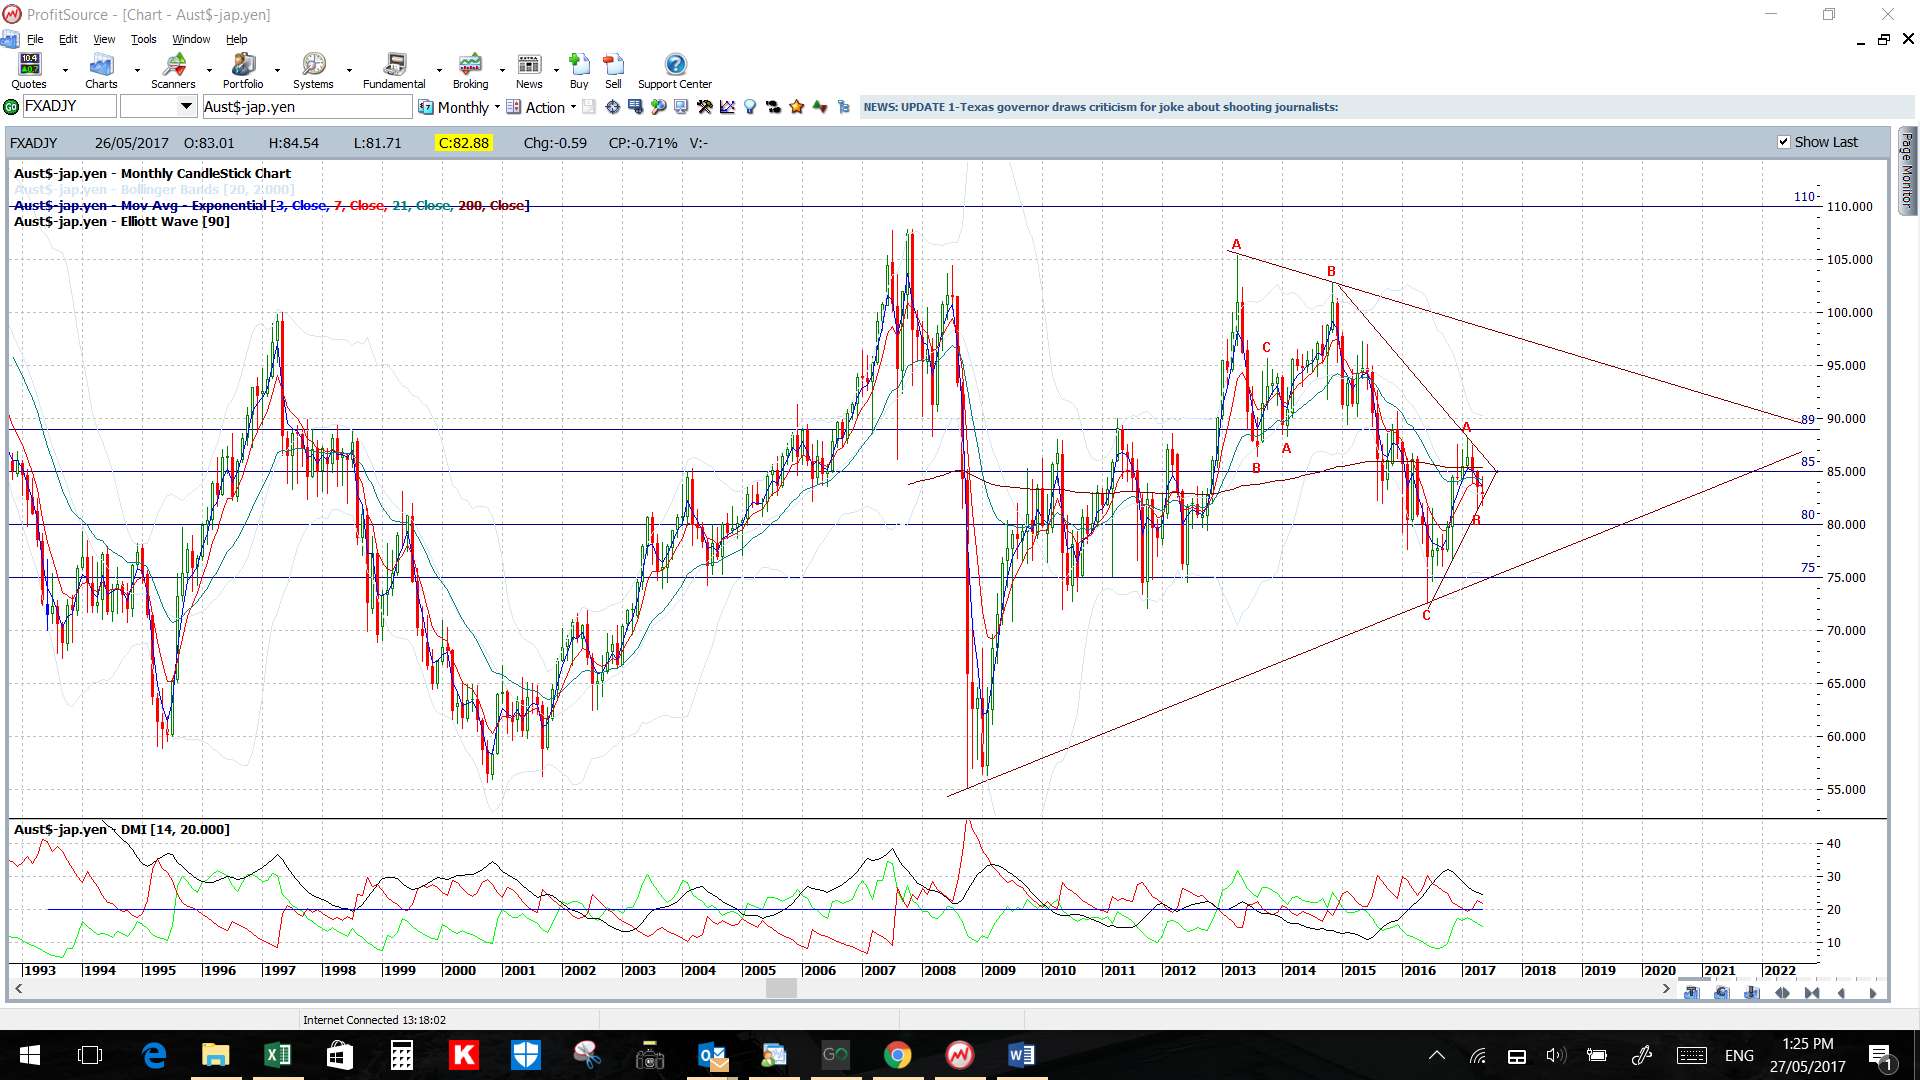
Note the potential 1,700 pip triangle shown on the weekly chart.
Watch for impact from Thursday’s AUD Private Capital Expenditure and Retail Sales data and Friday’s NFP.

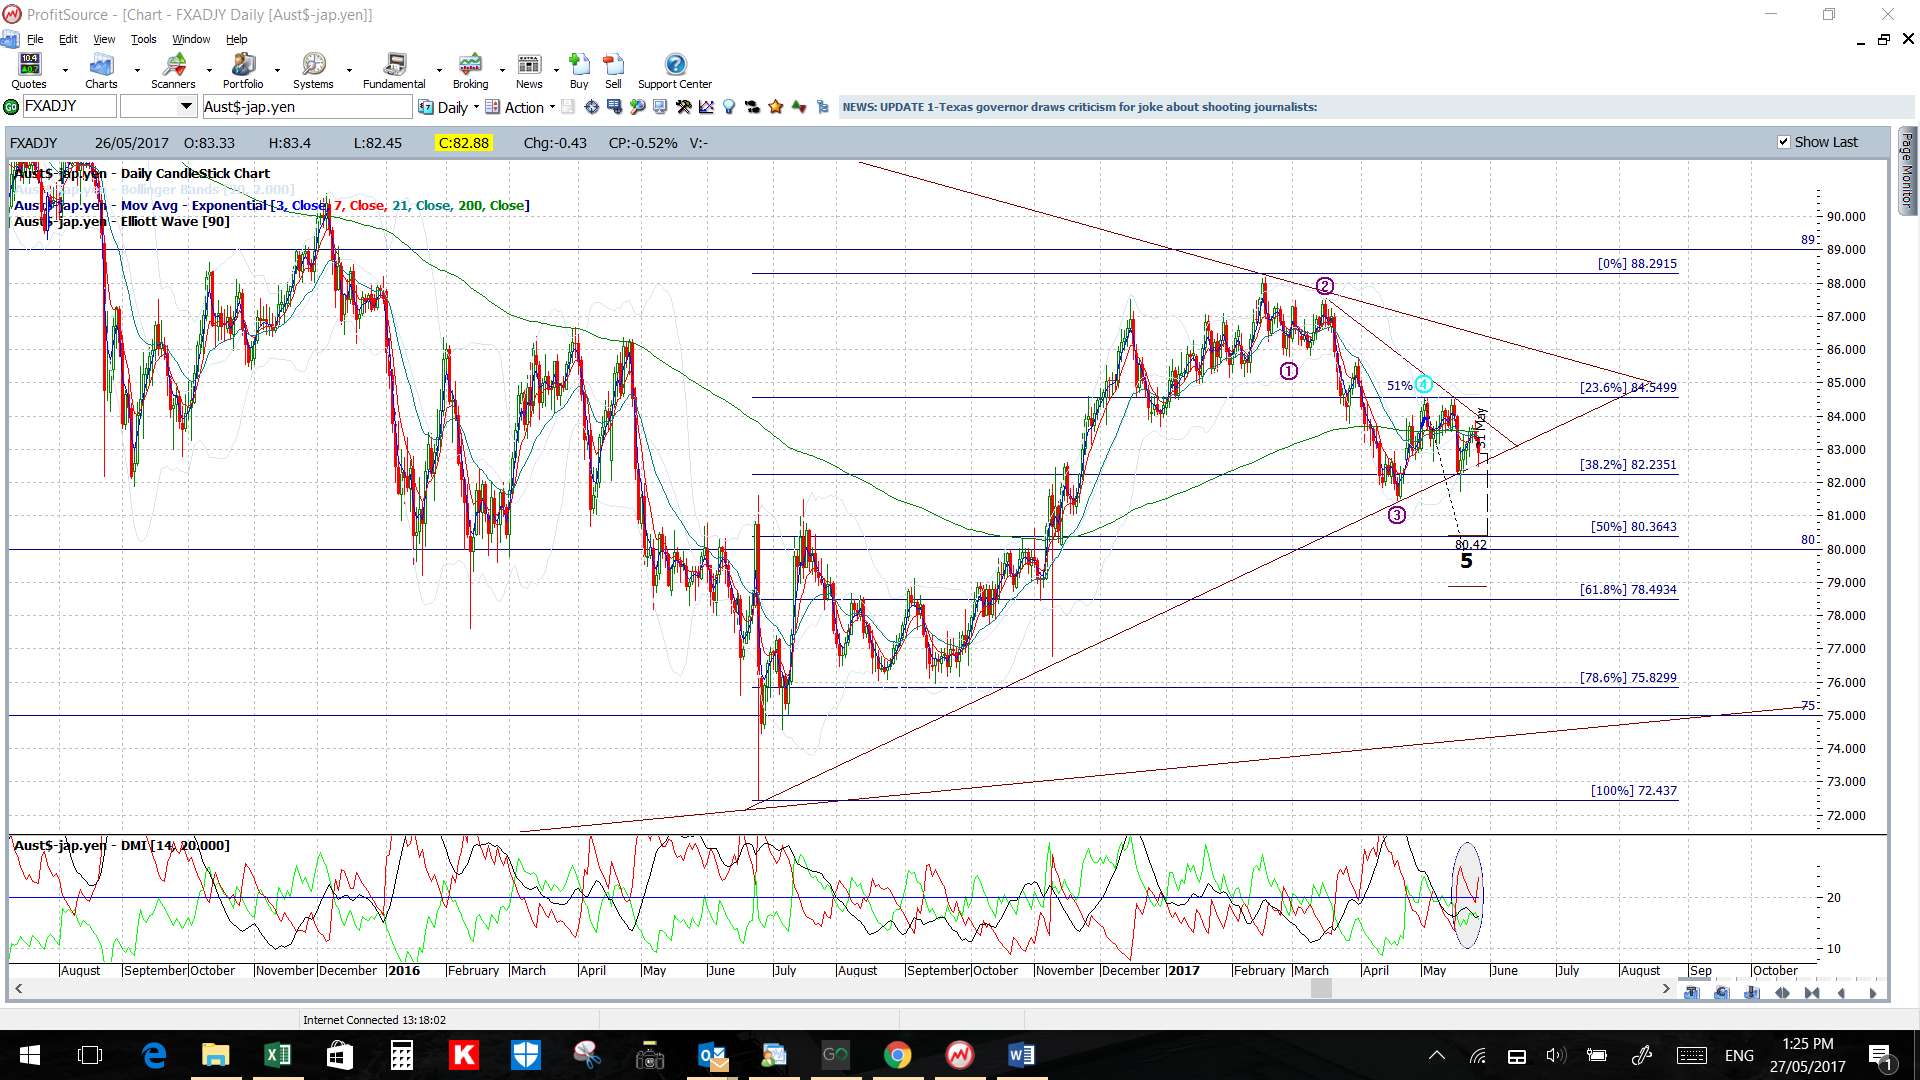
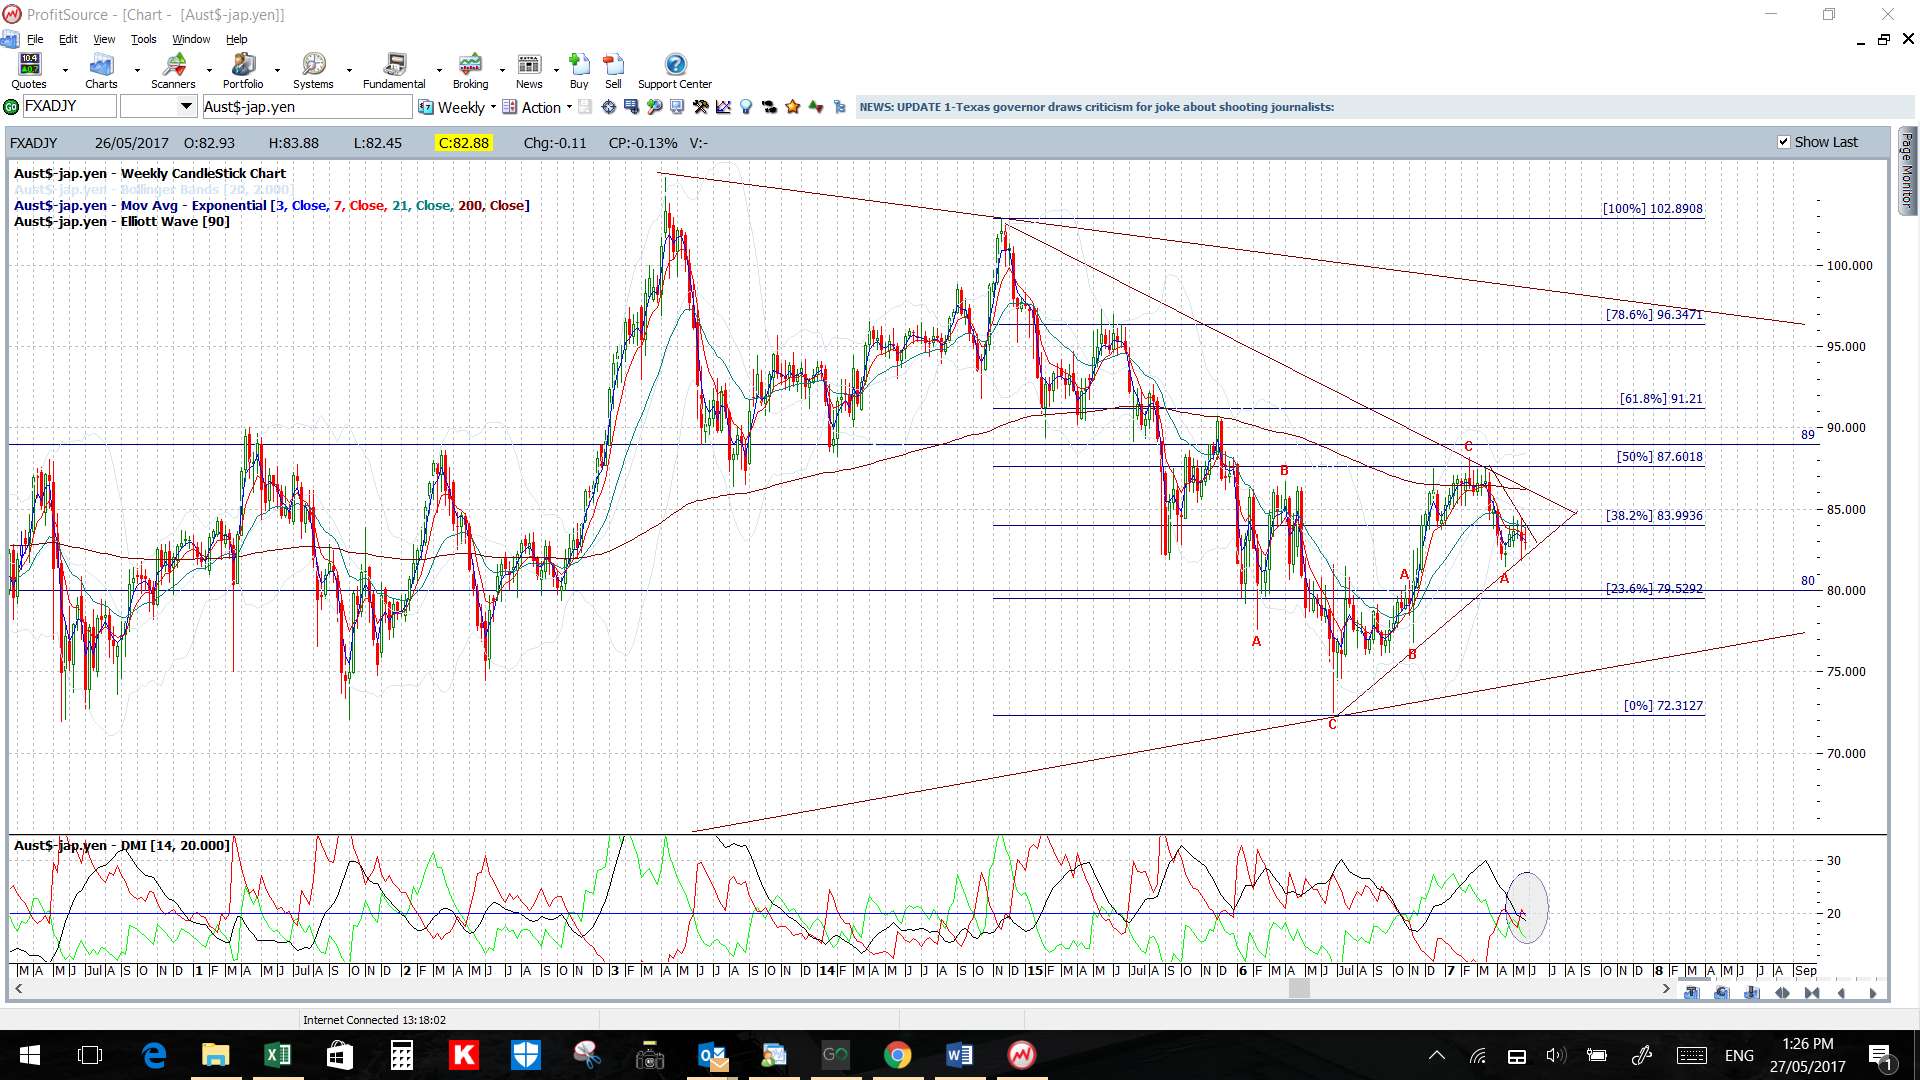
AUD/JPY: Watch the 4hr chart’s revised triangle trend lines for any breakout:
- Upper targets: the upper triangle trend line from the daily chart and, then, the 87 S/R level.
- Lower targets: any pullback would have me looking for a test of 80 S/R and then 75 S/R which is also the daily chart’s 61.8% Fib.
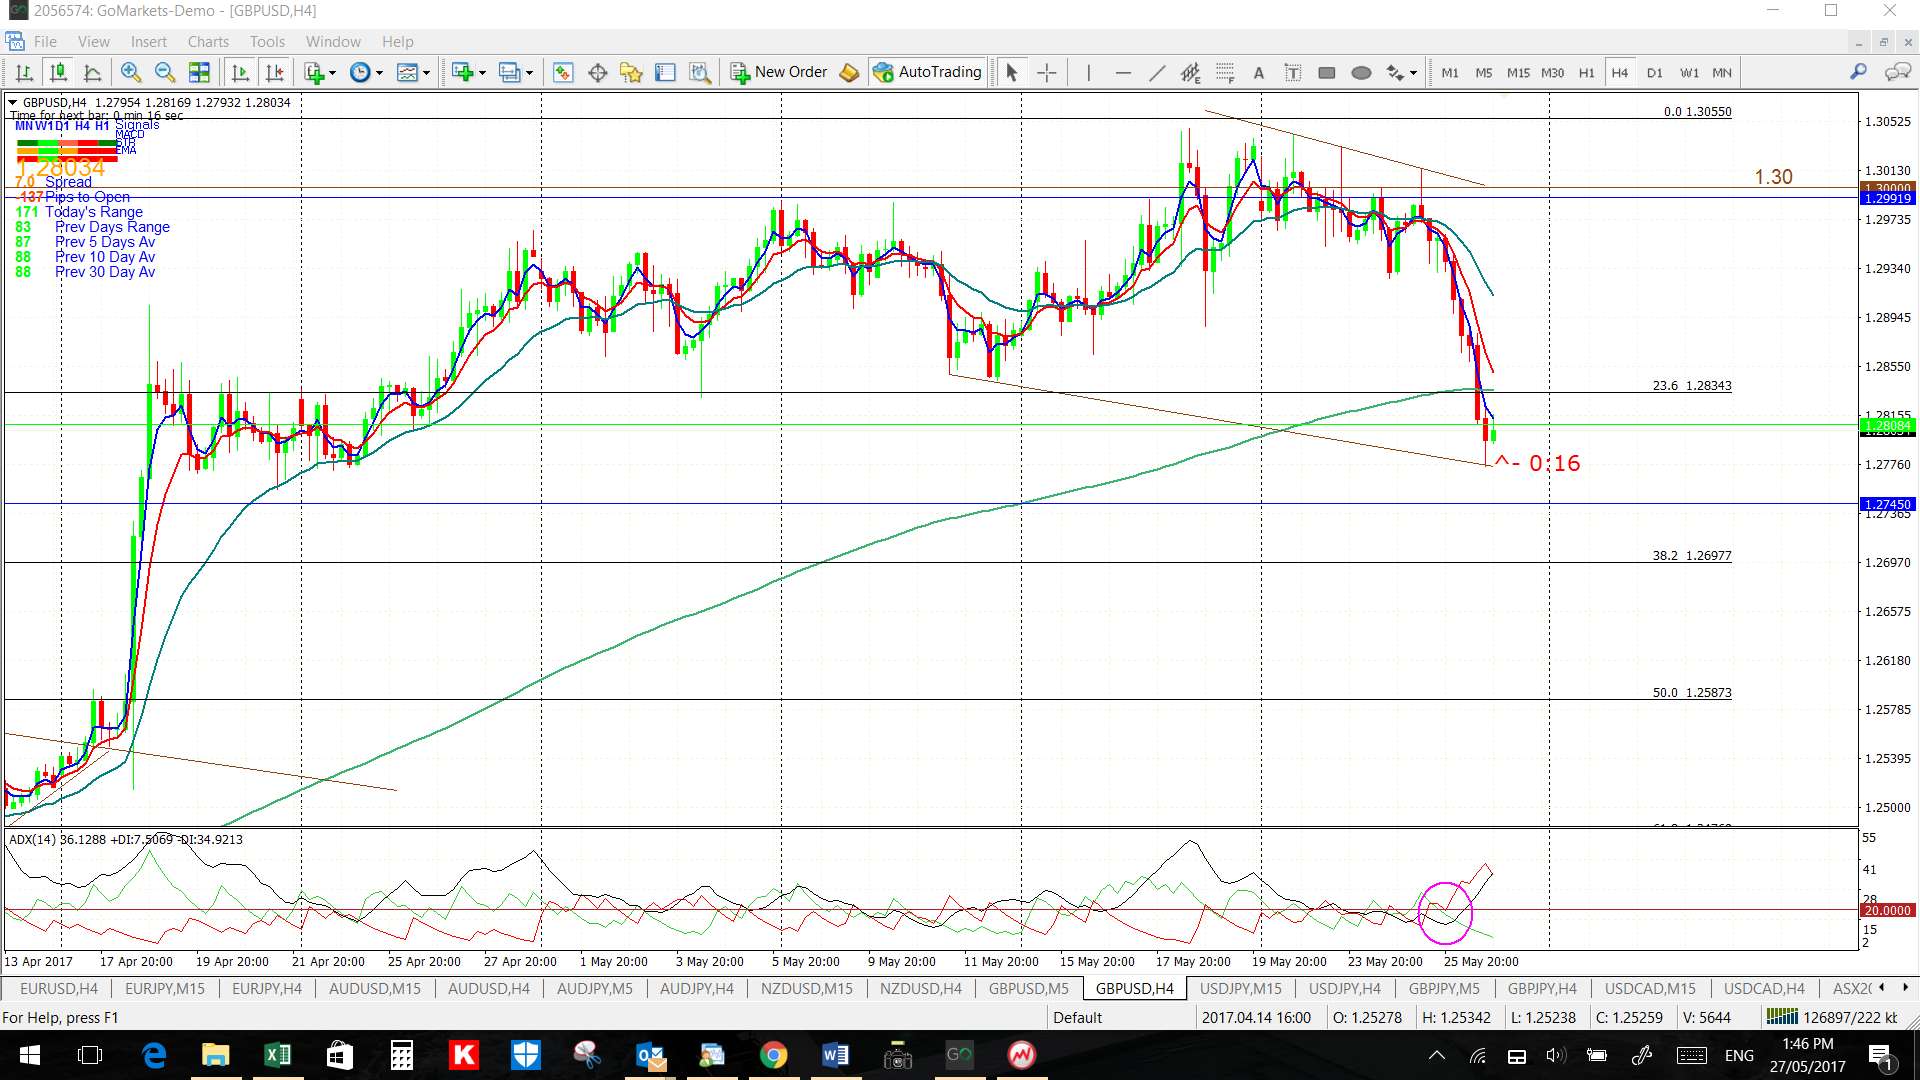
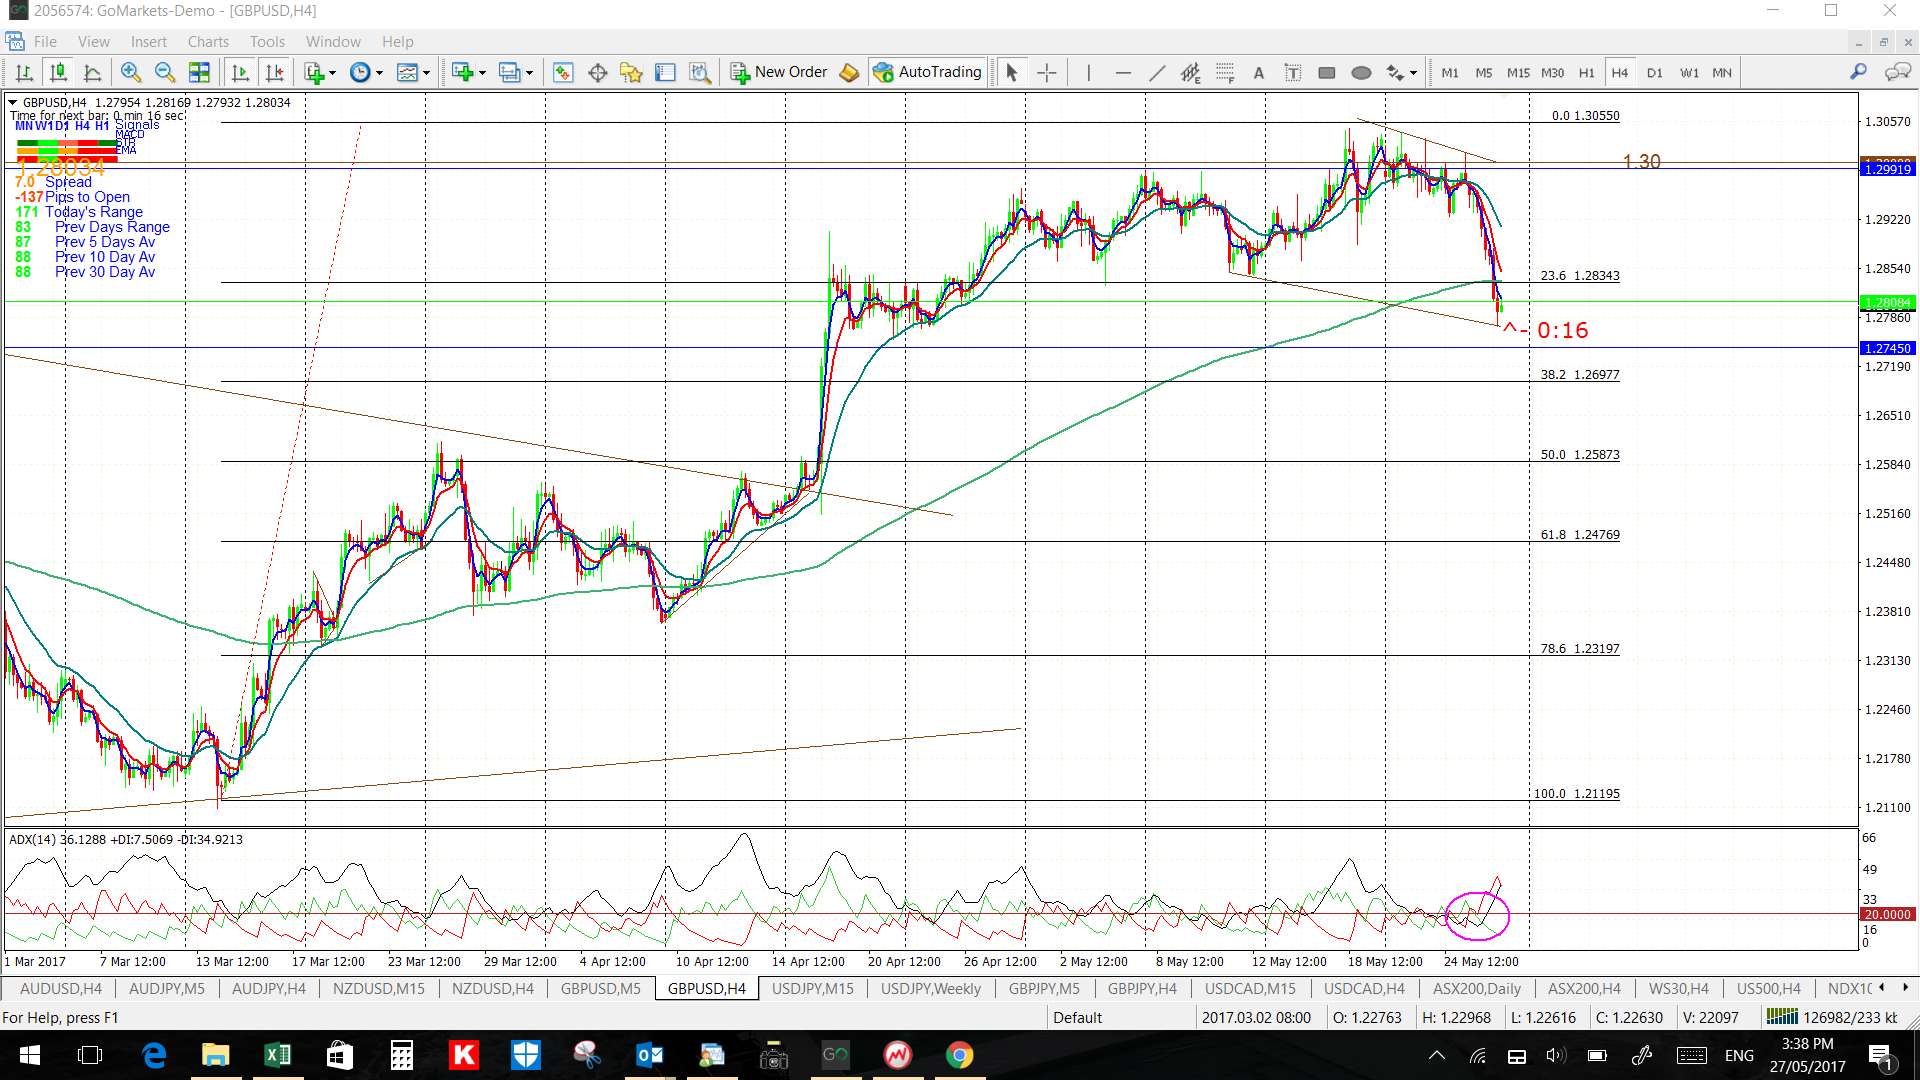
GBP/USD: Watch the 4hr chart’s revised wedge trend lines for any new breakout:
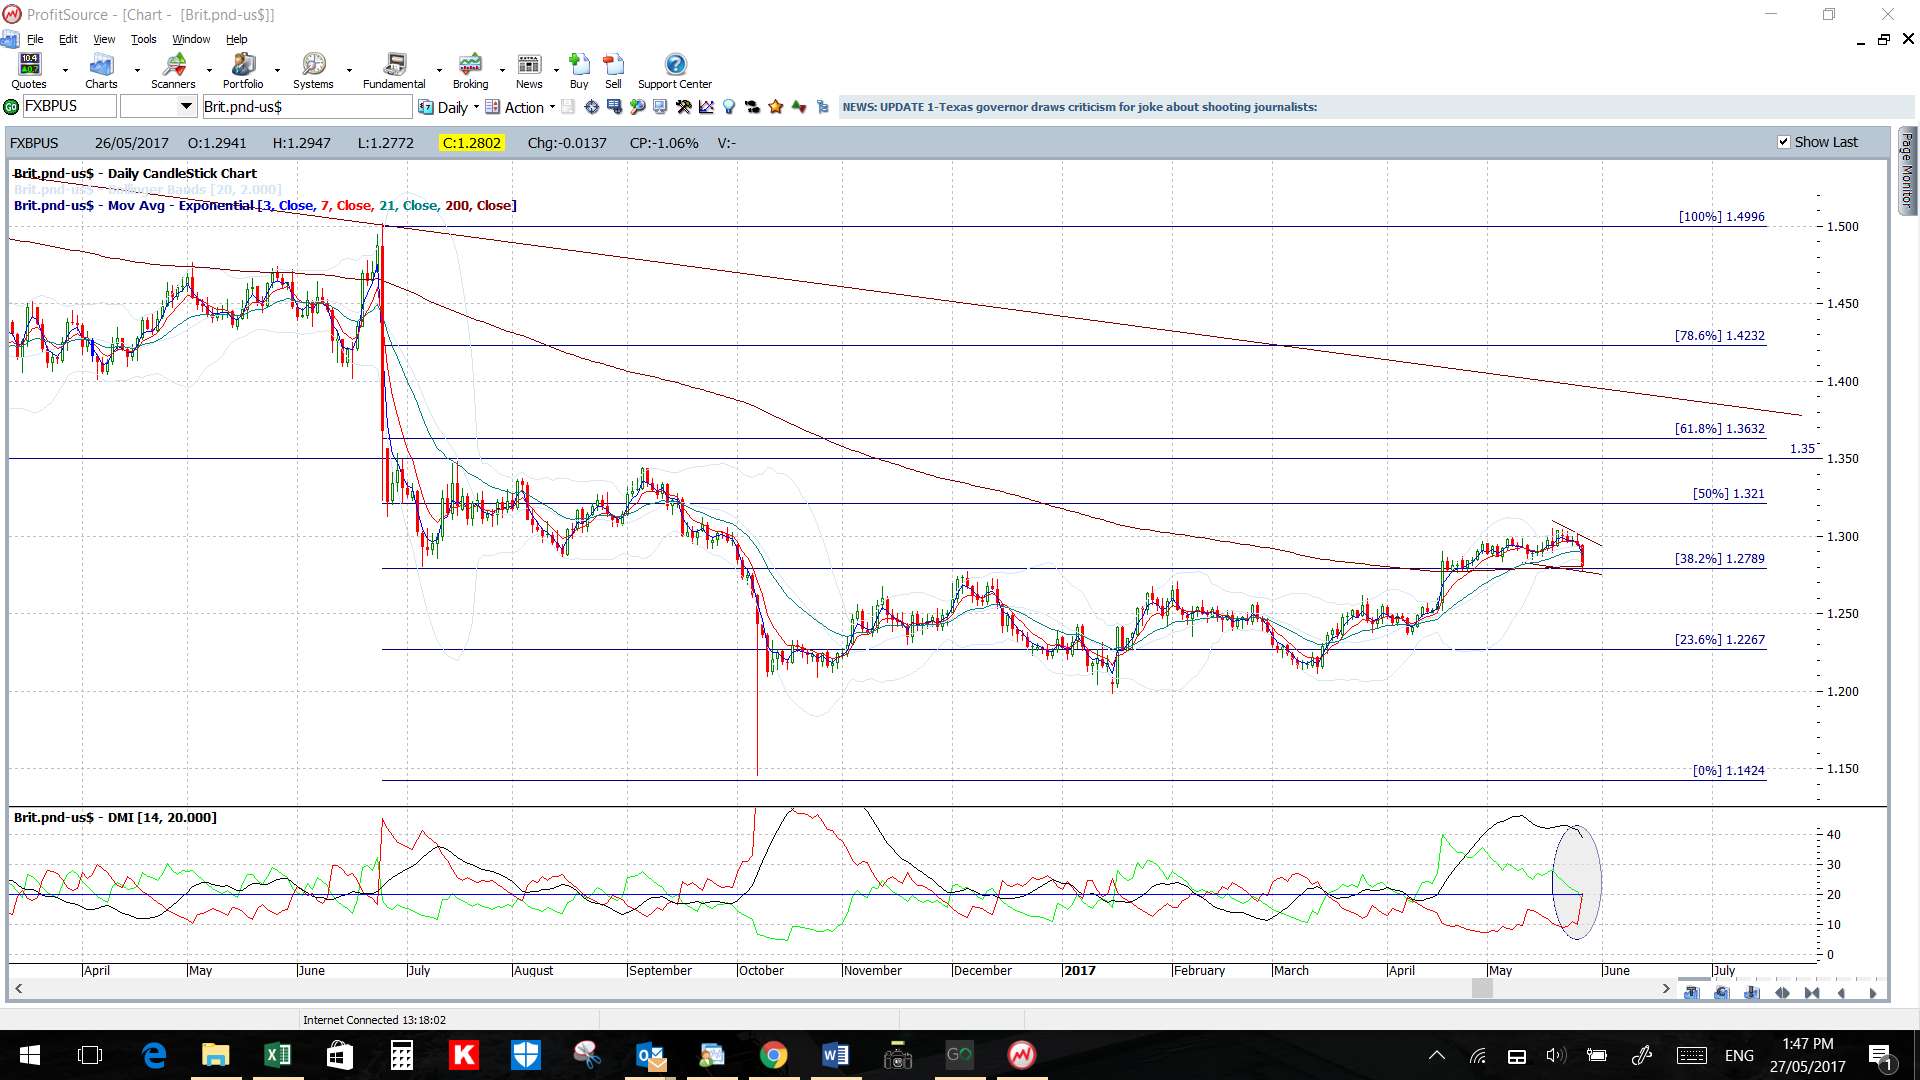
- Upper targets: 1.30 and then 1.35 as previous S/R followed by 1.40, which is near the 3-year bear trend line.
- Lower targets: any continued pullback would have me looking for a test of the 4hr chart’s 61.8% Fib near 1.25.
Watch for impact from Thursday’s GBP Manufacturing PMI and Friday’s Construction PMI as well as NFP.
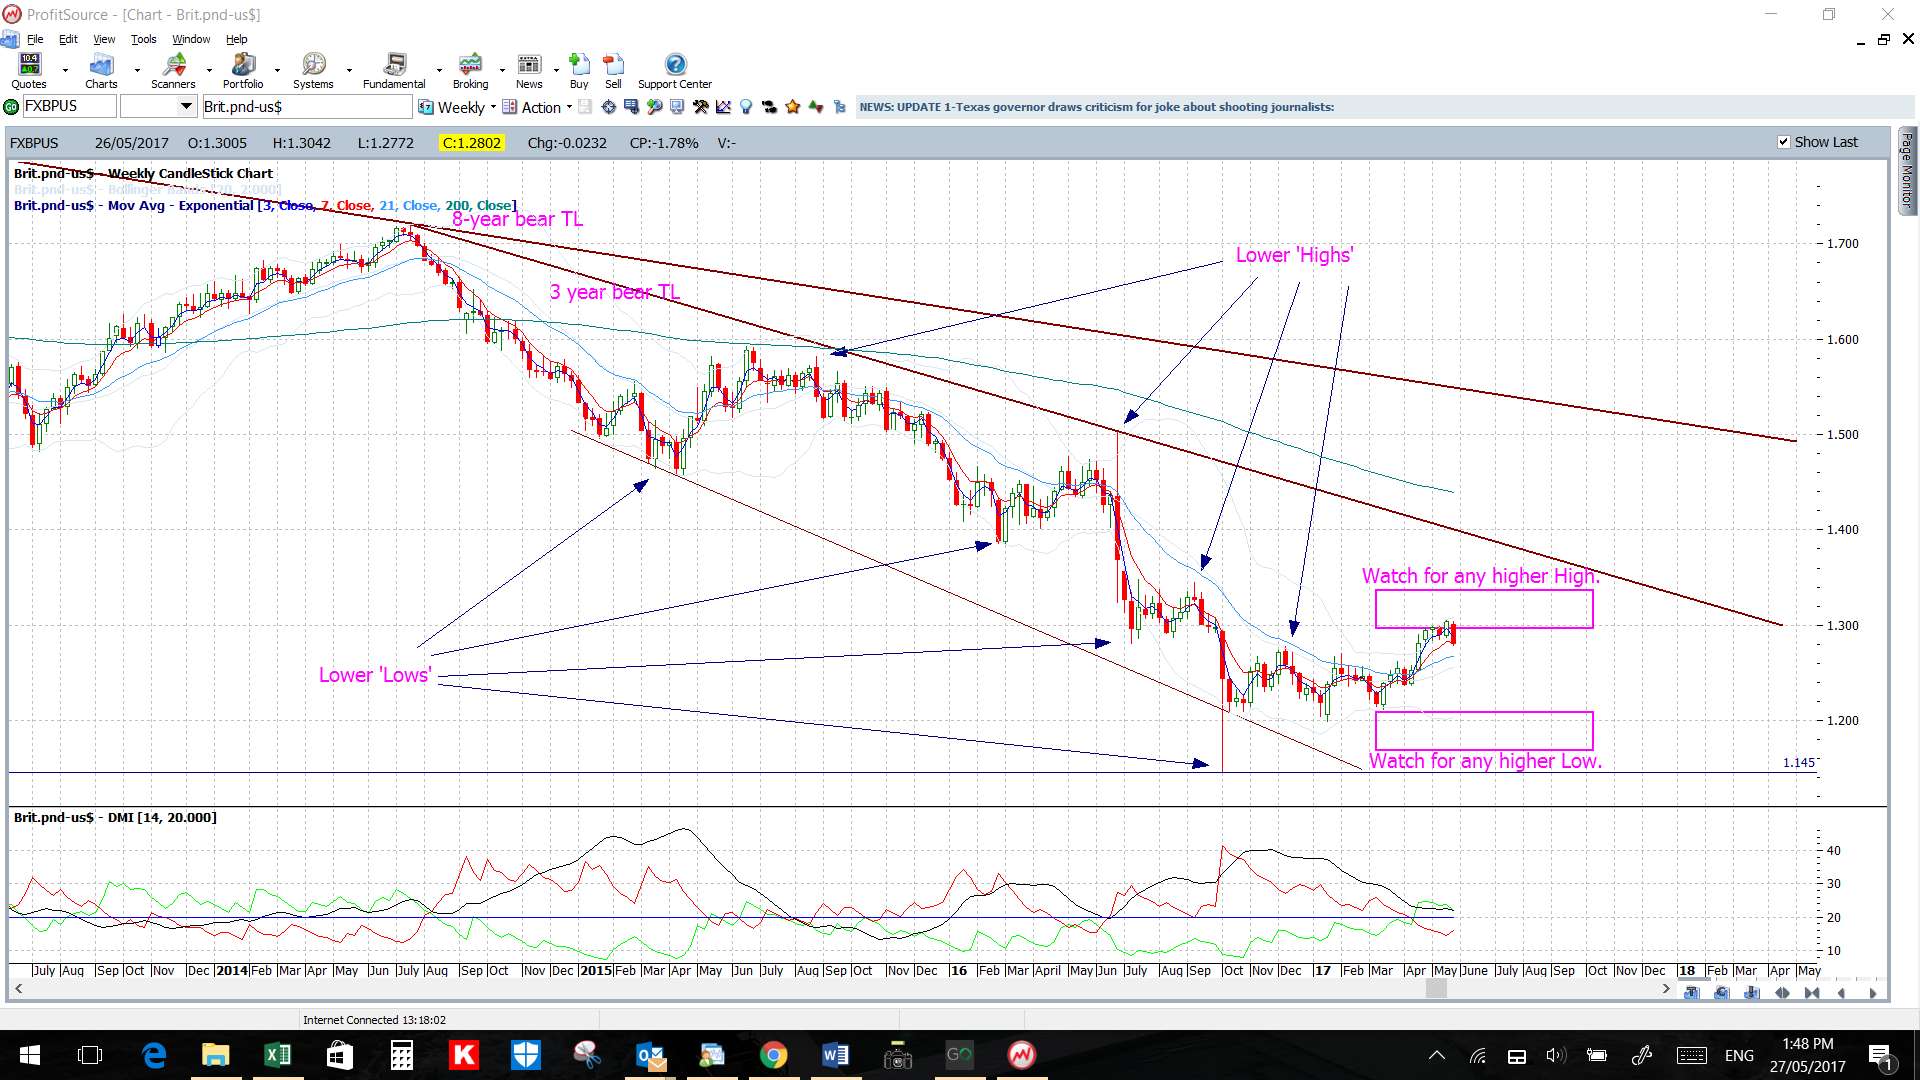
There could be a weekly chart ‘Inverse H&S’ shaping up here so keep an eye out for any progress:
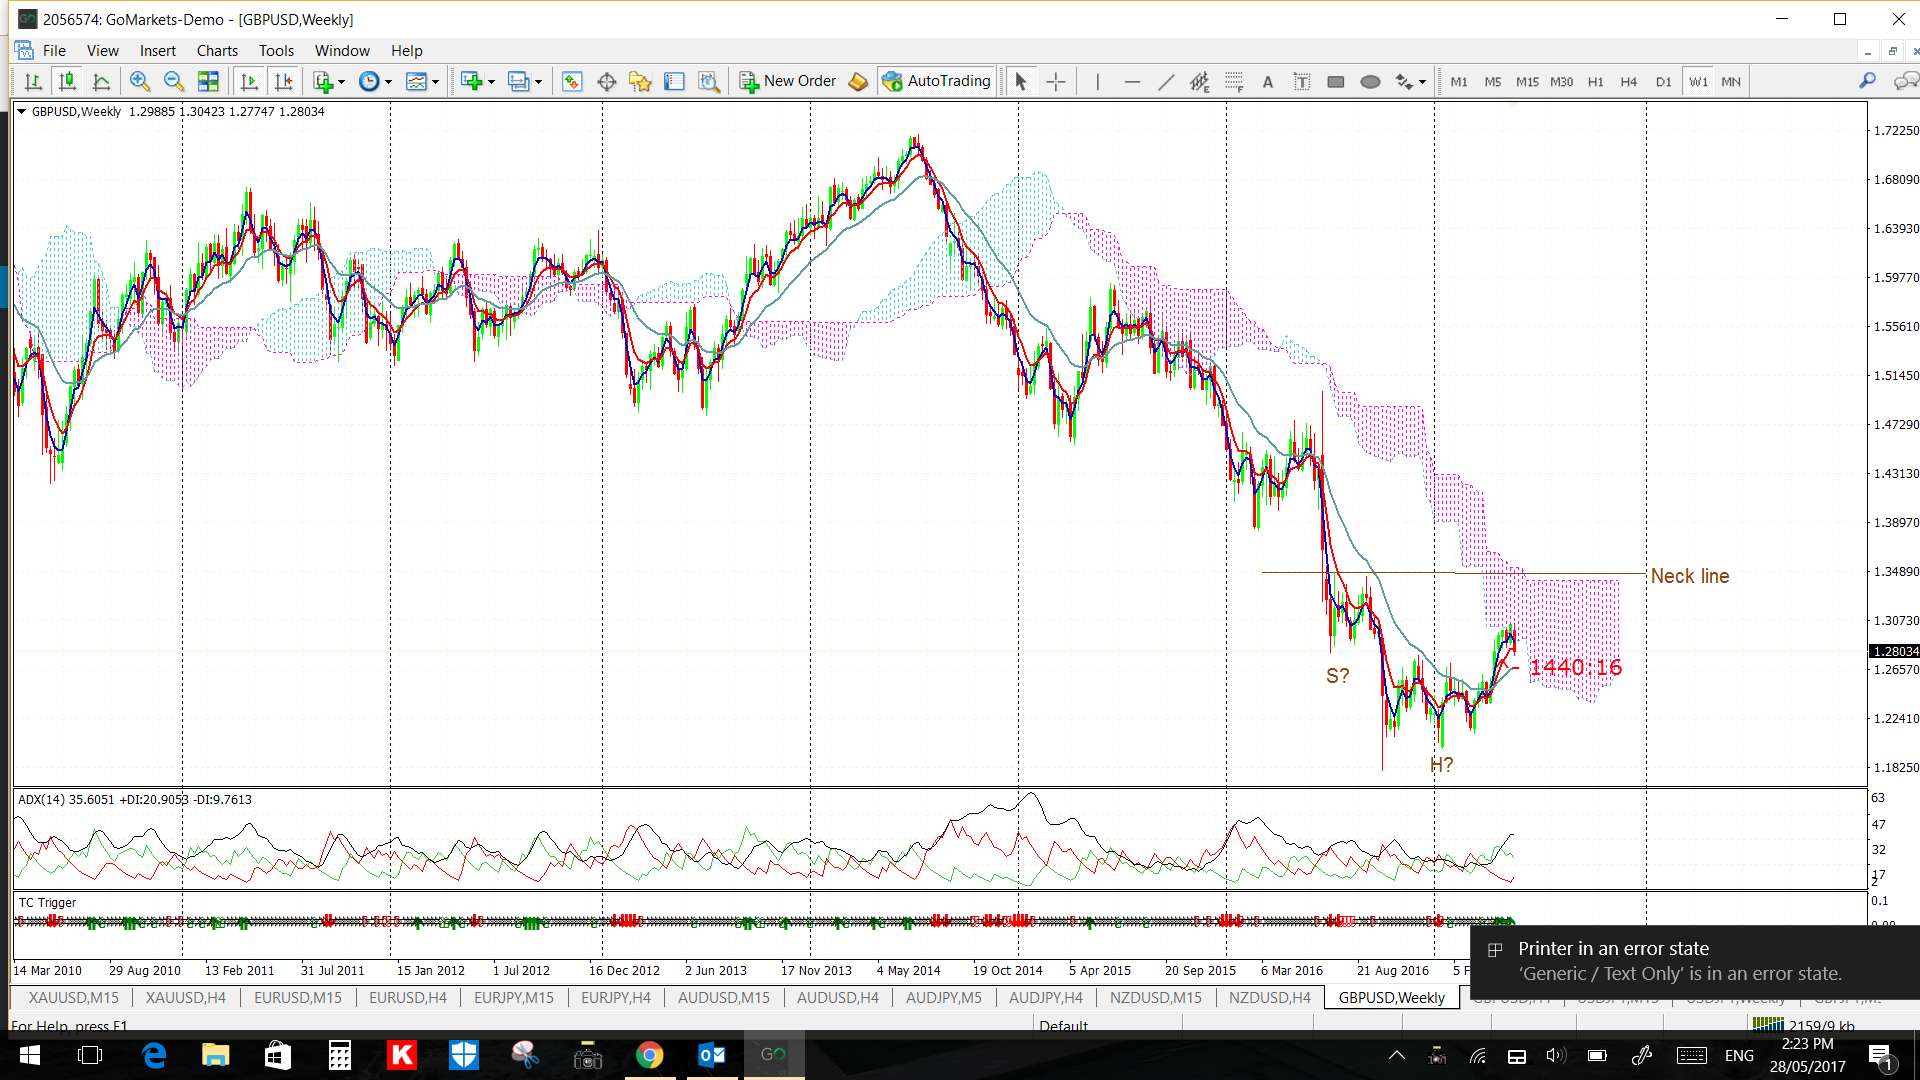
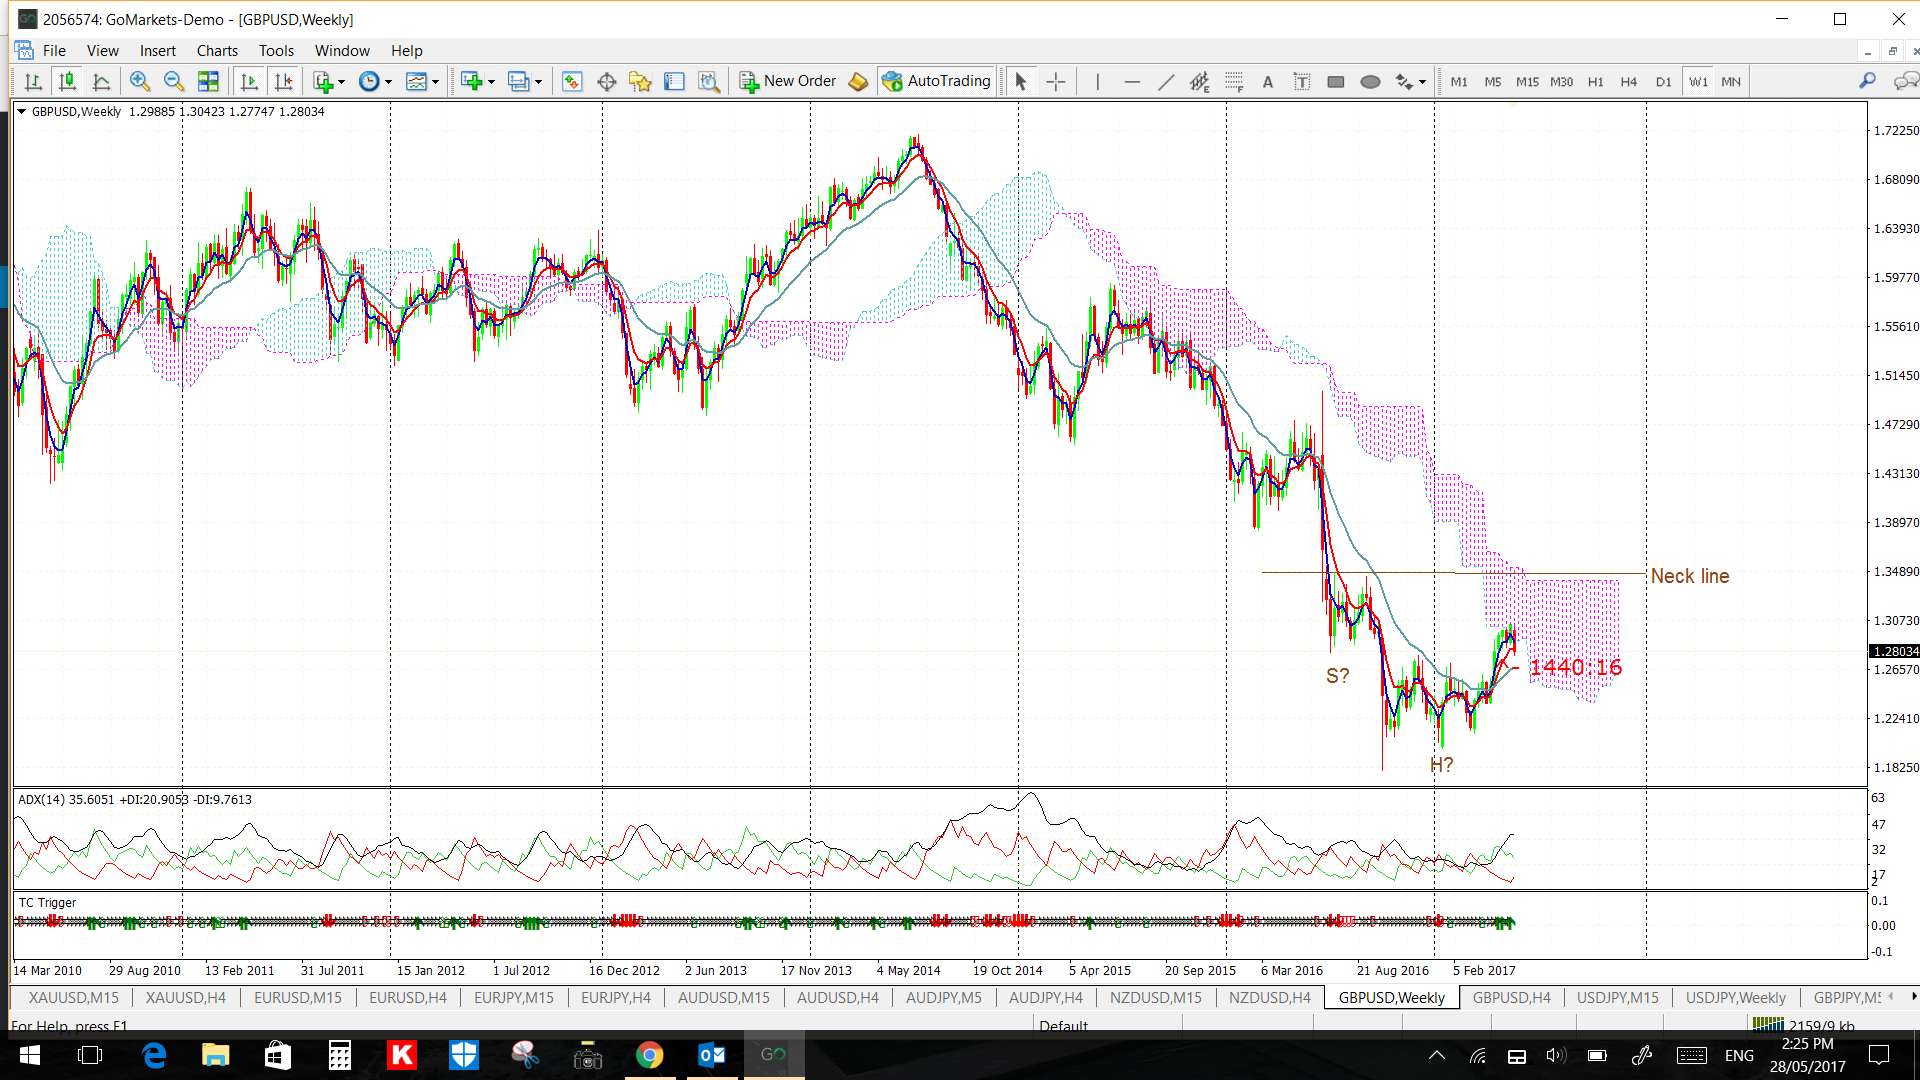
The UK Election is only a week and a half away, Thursday June 8th, and the polls are suggesting that this is a close contest. Some caution should be exercised trading GBP pairs ahead of this date.

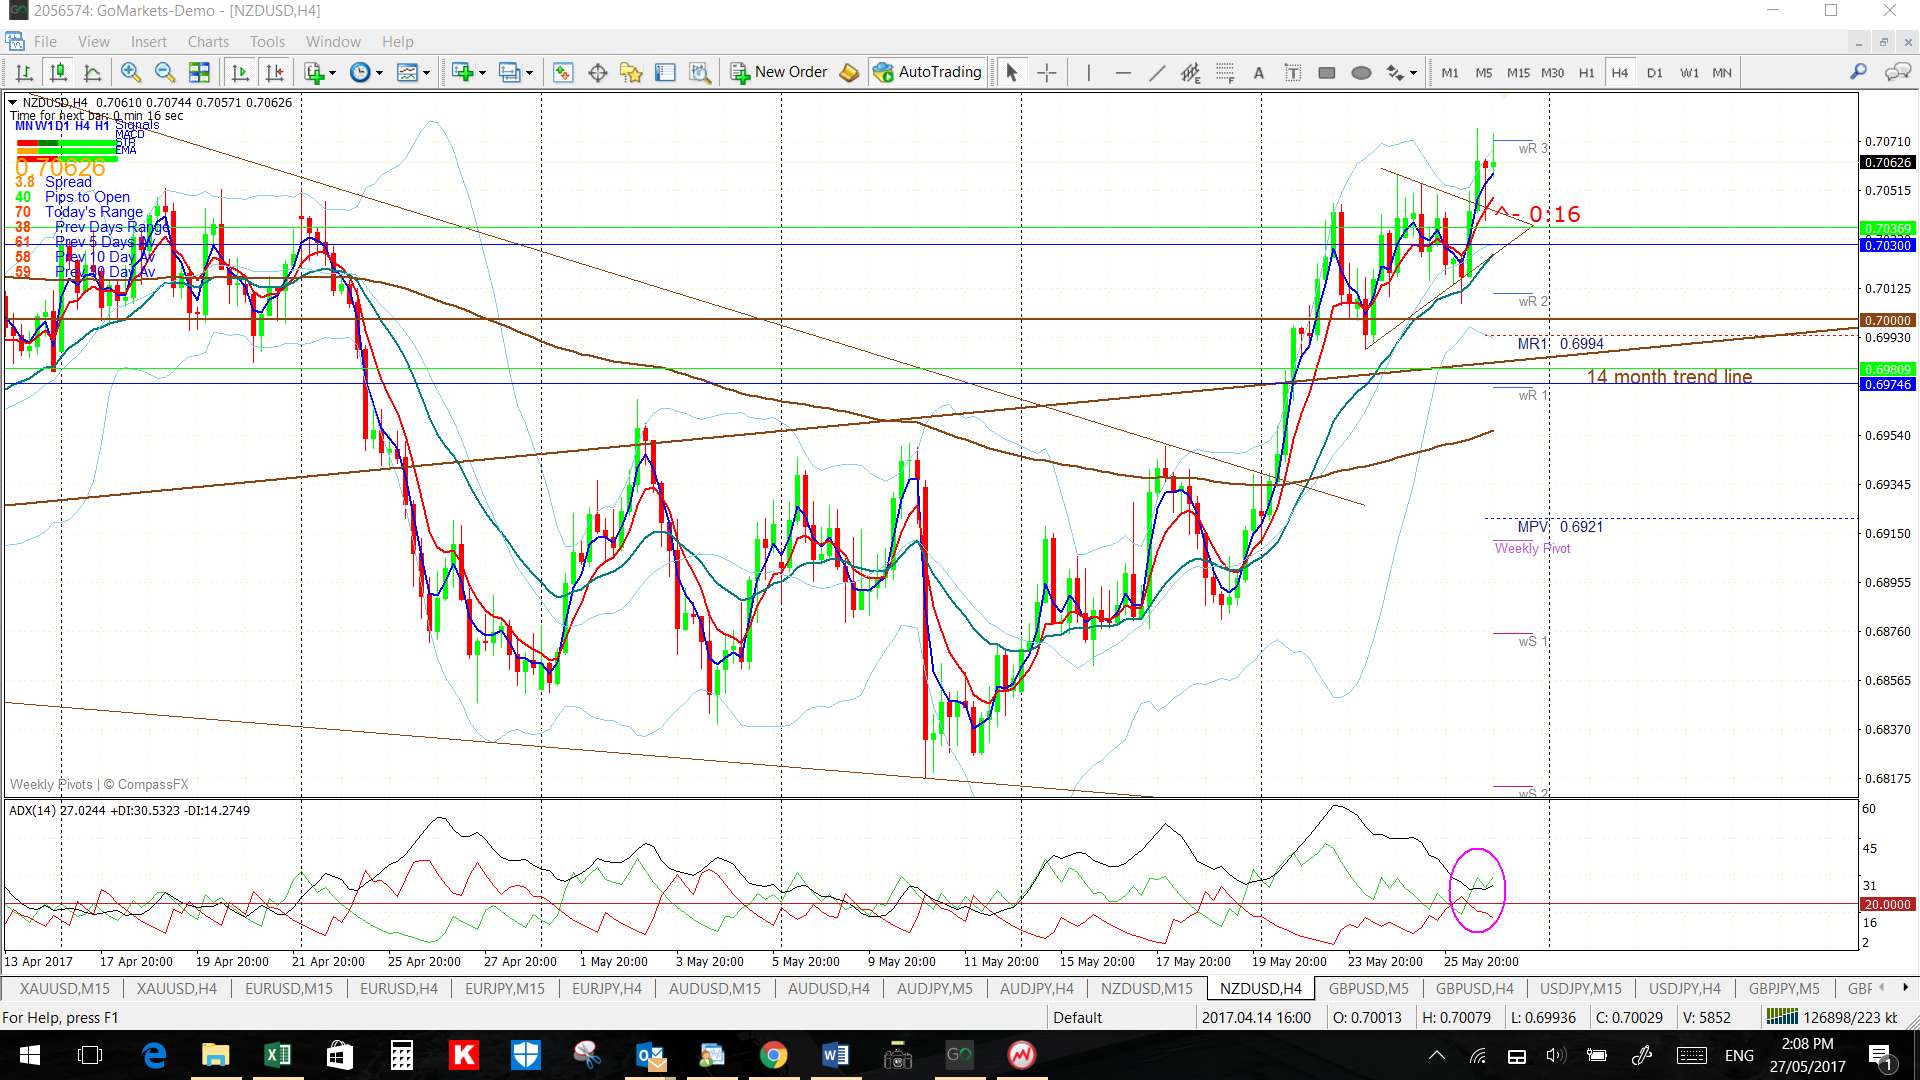
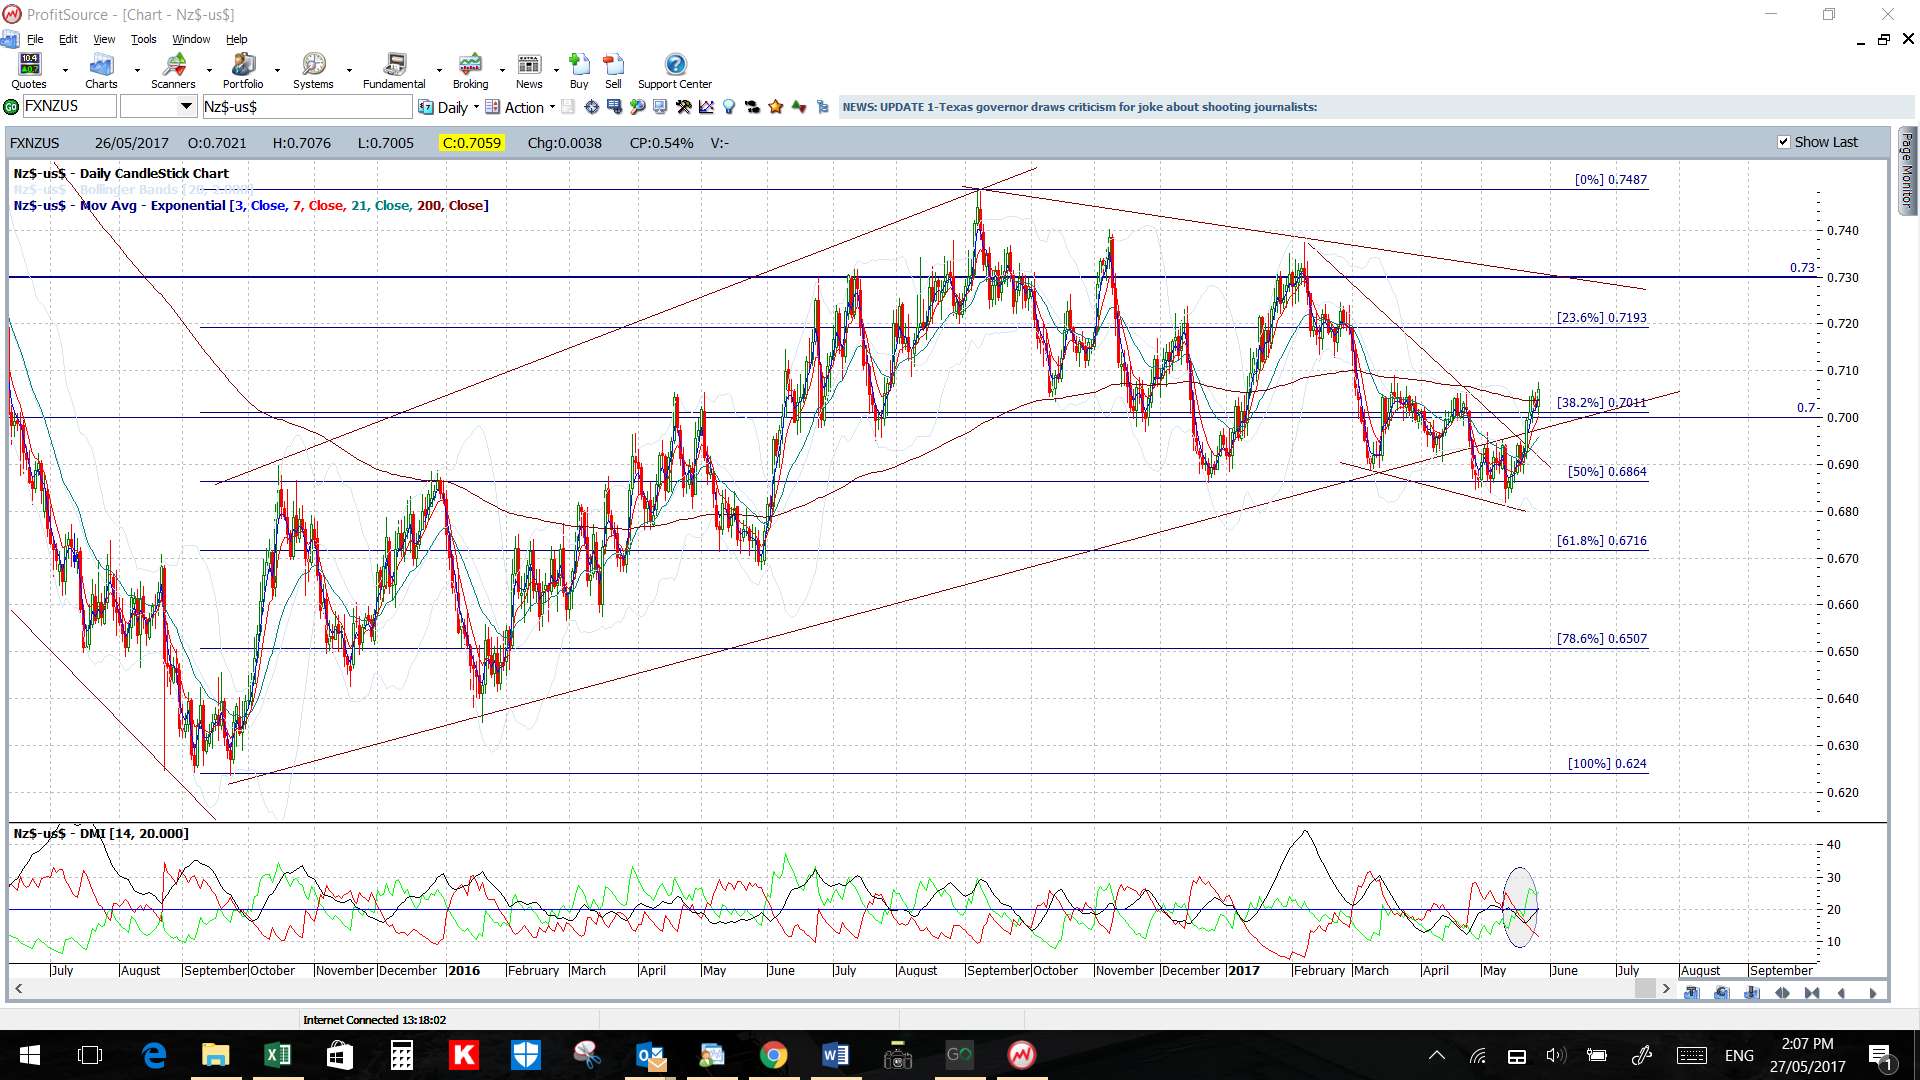
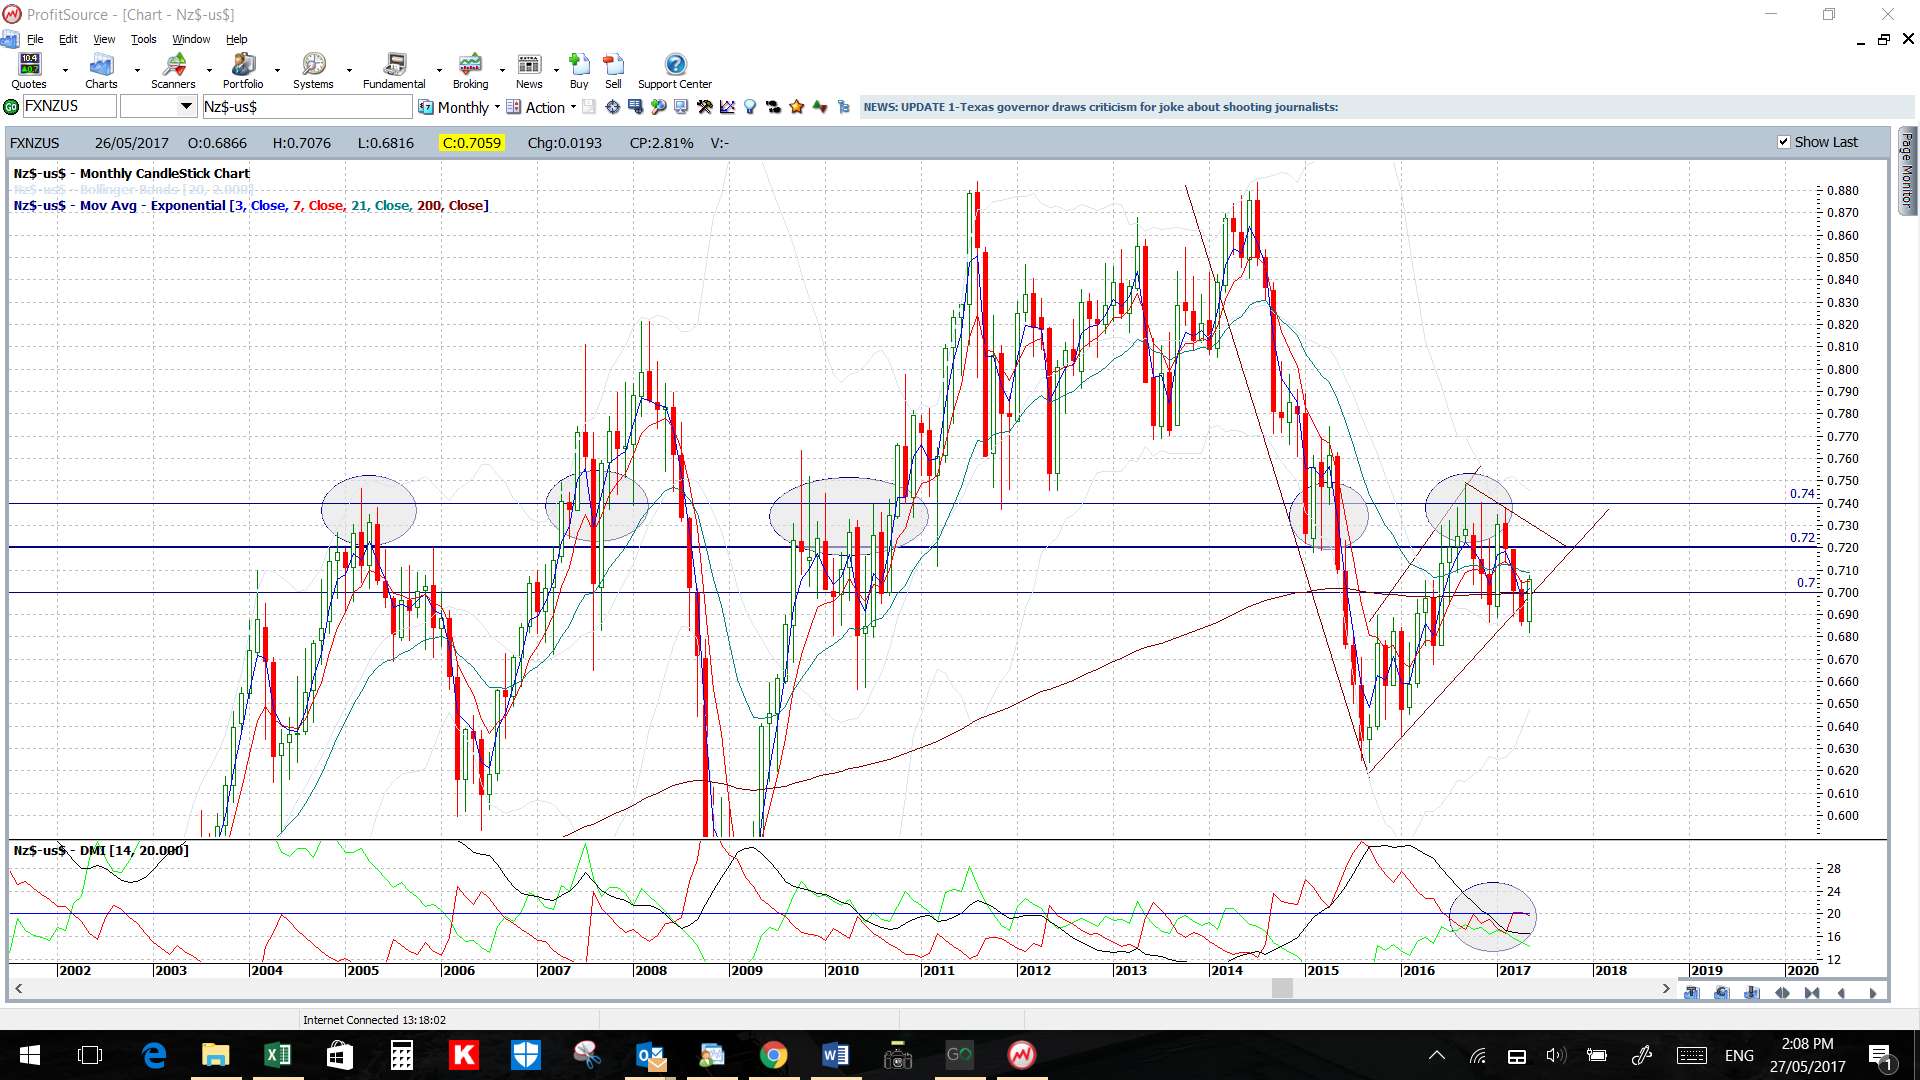
NZD/USD: The Kiwi looks to have made a 4hr chart triangle breakout so watch for any follow-through:
- Upper targets: 0.73 and 0.74 as previous S/R.
- Lower targets: 70 and 0.67.
Watch for impact from Wednesday’s RBNZ Financial Stability Report and Friday’s NFP.

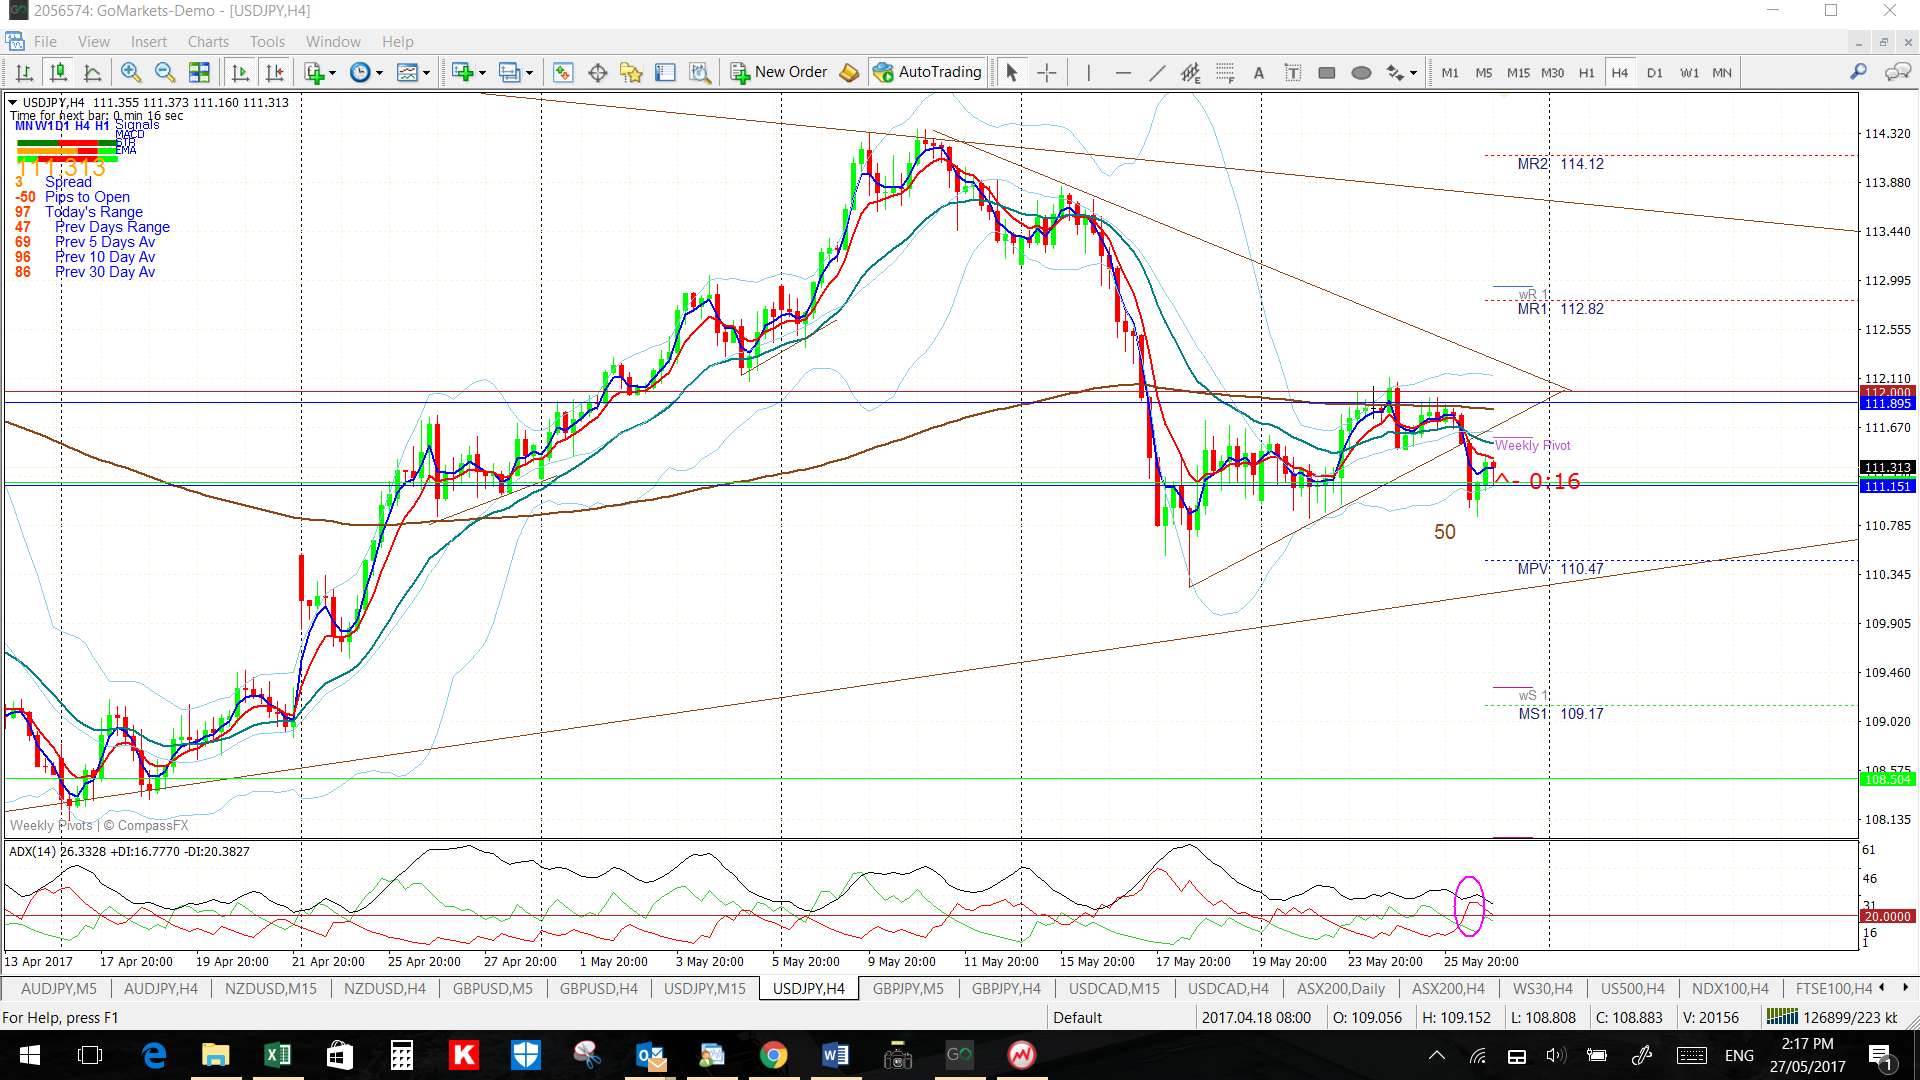
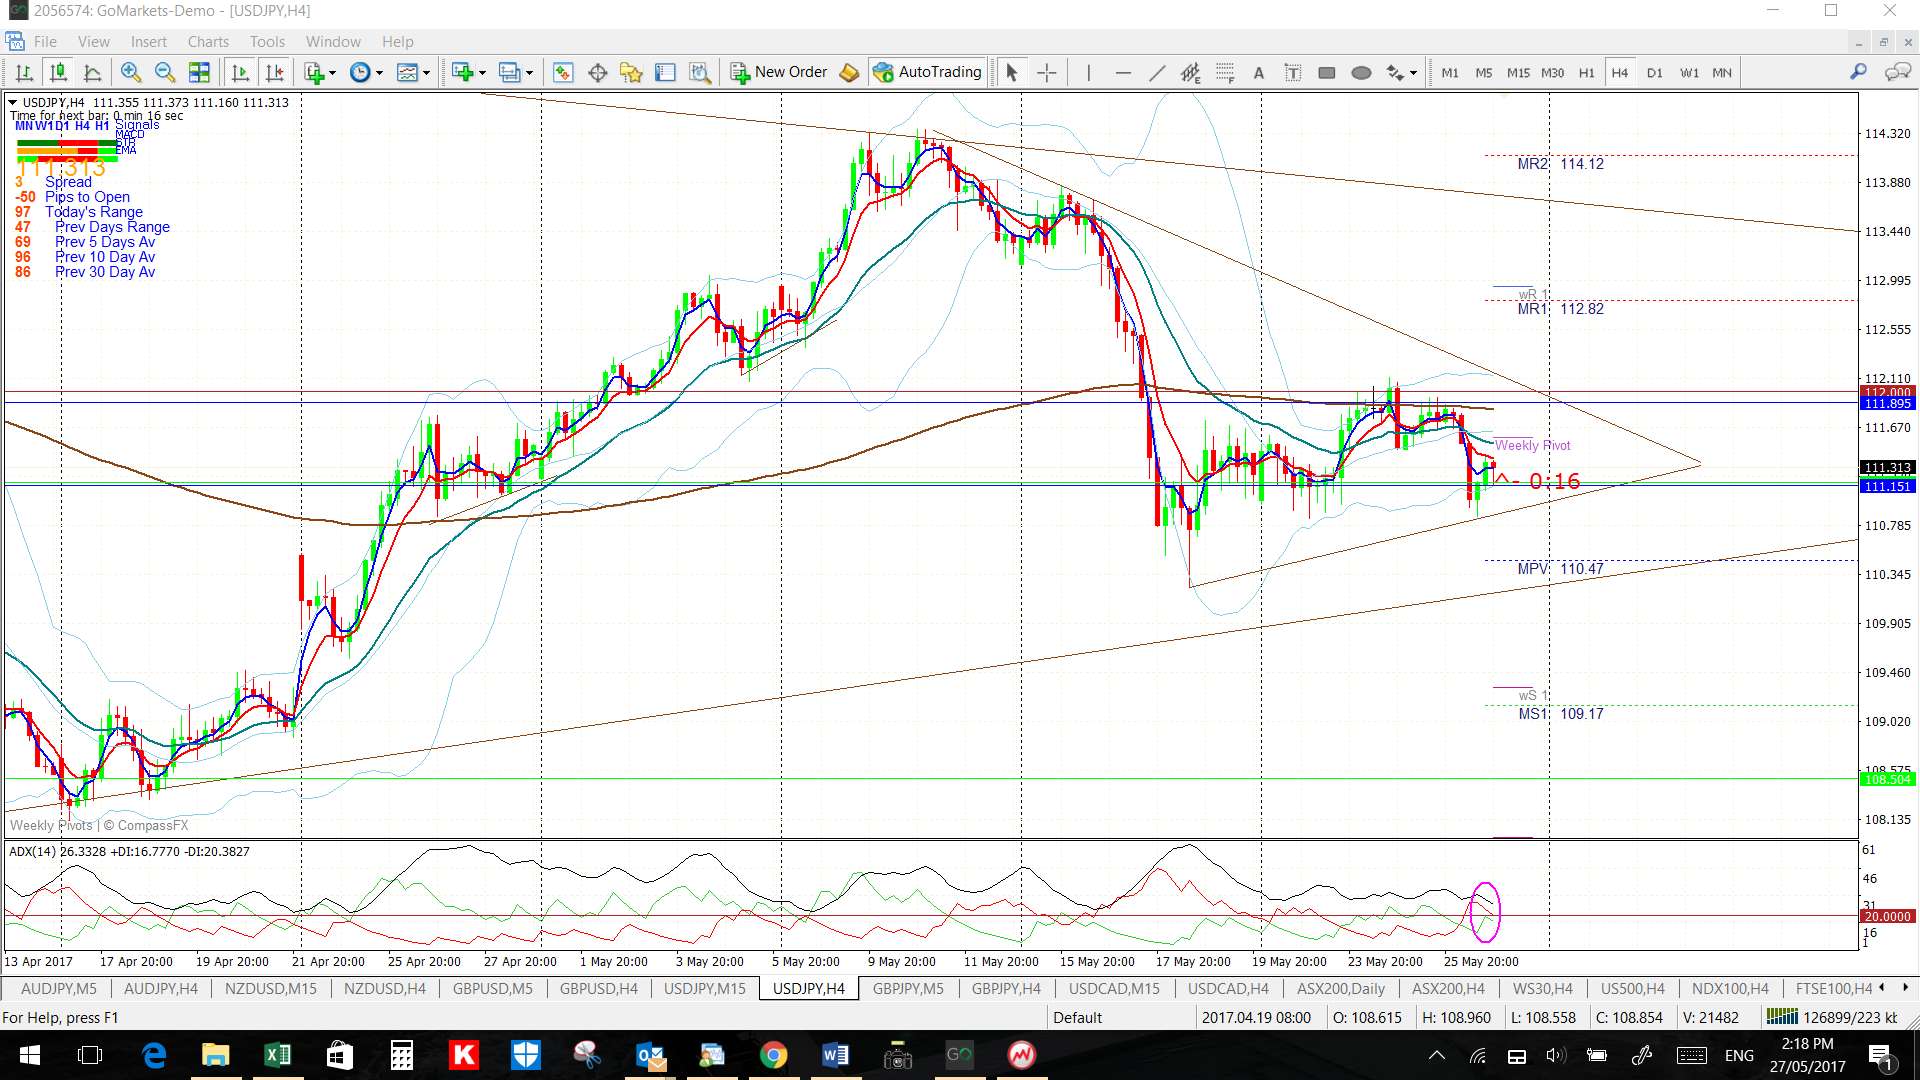
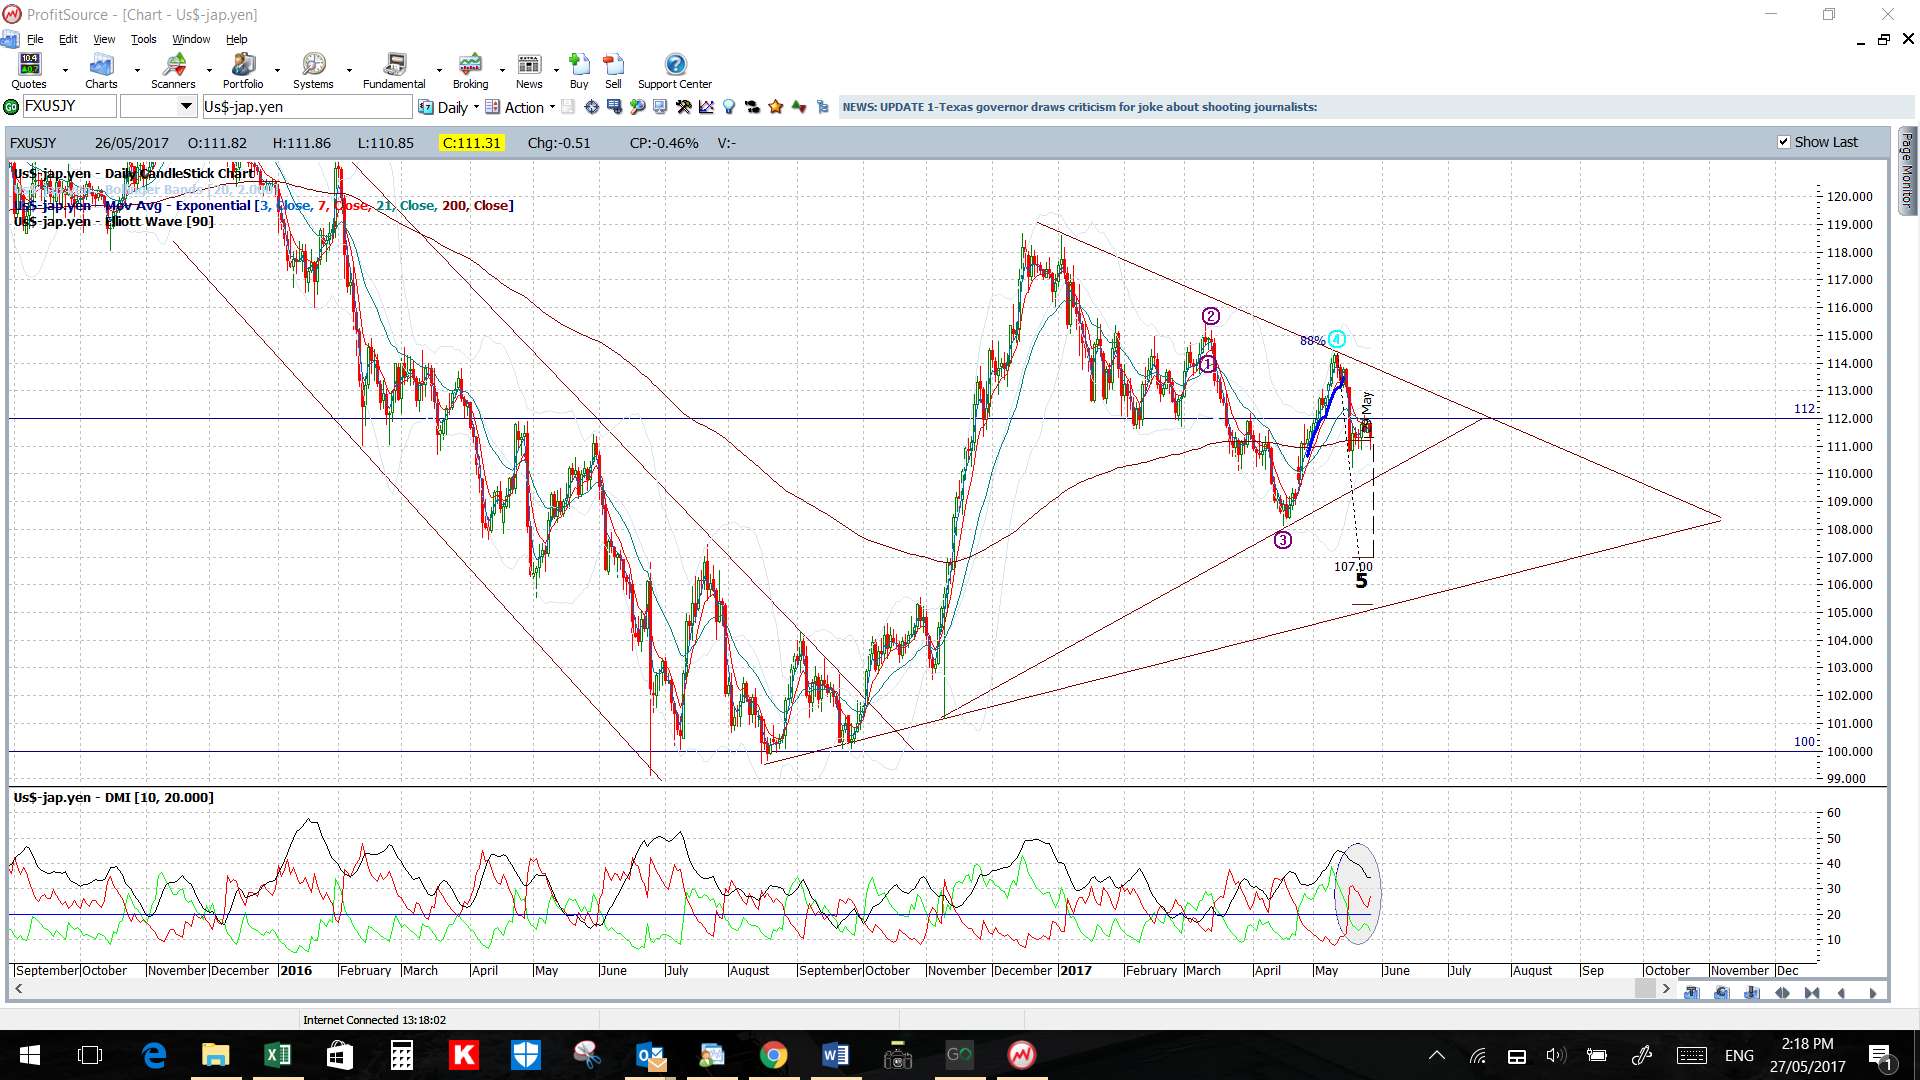
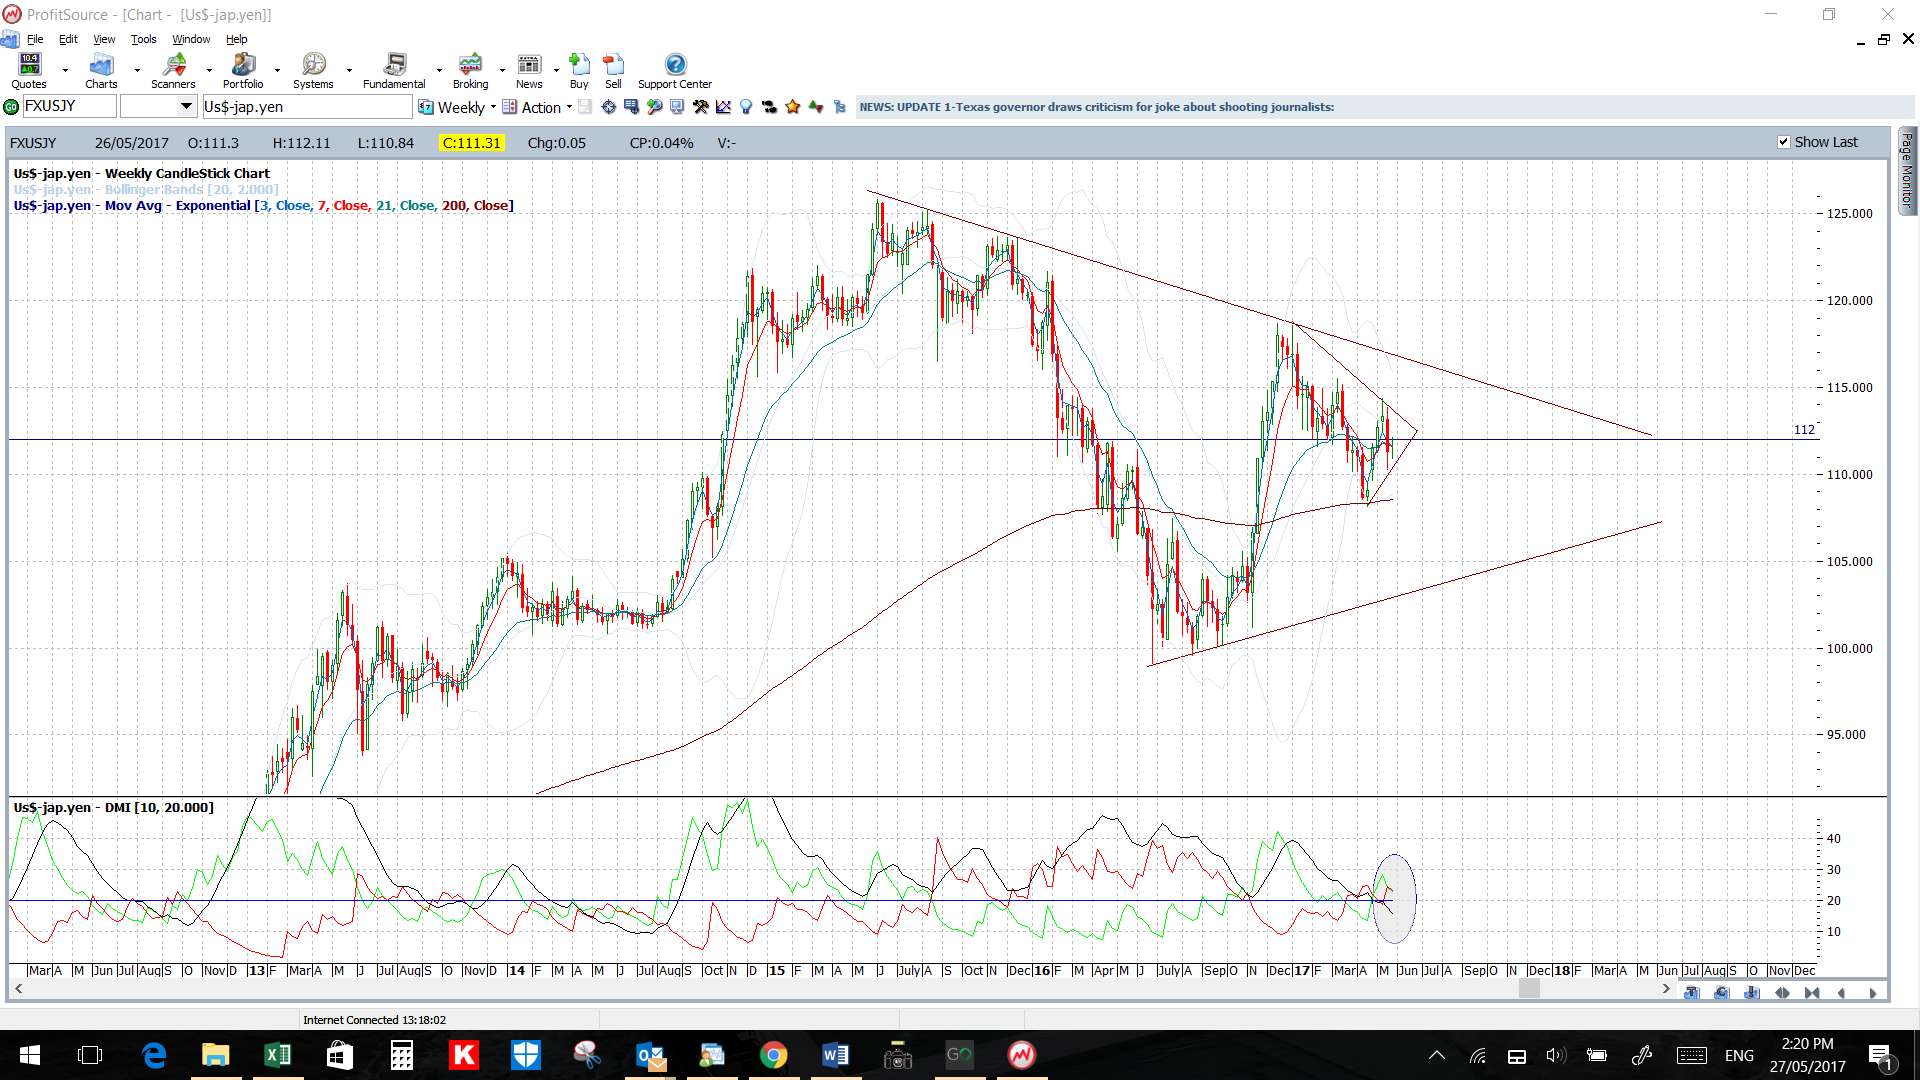
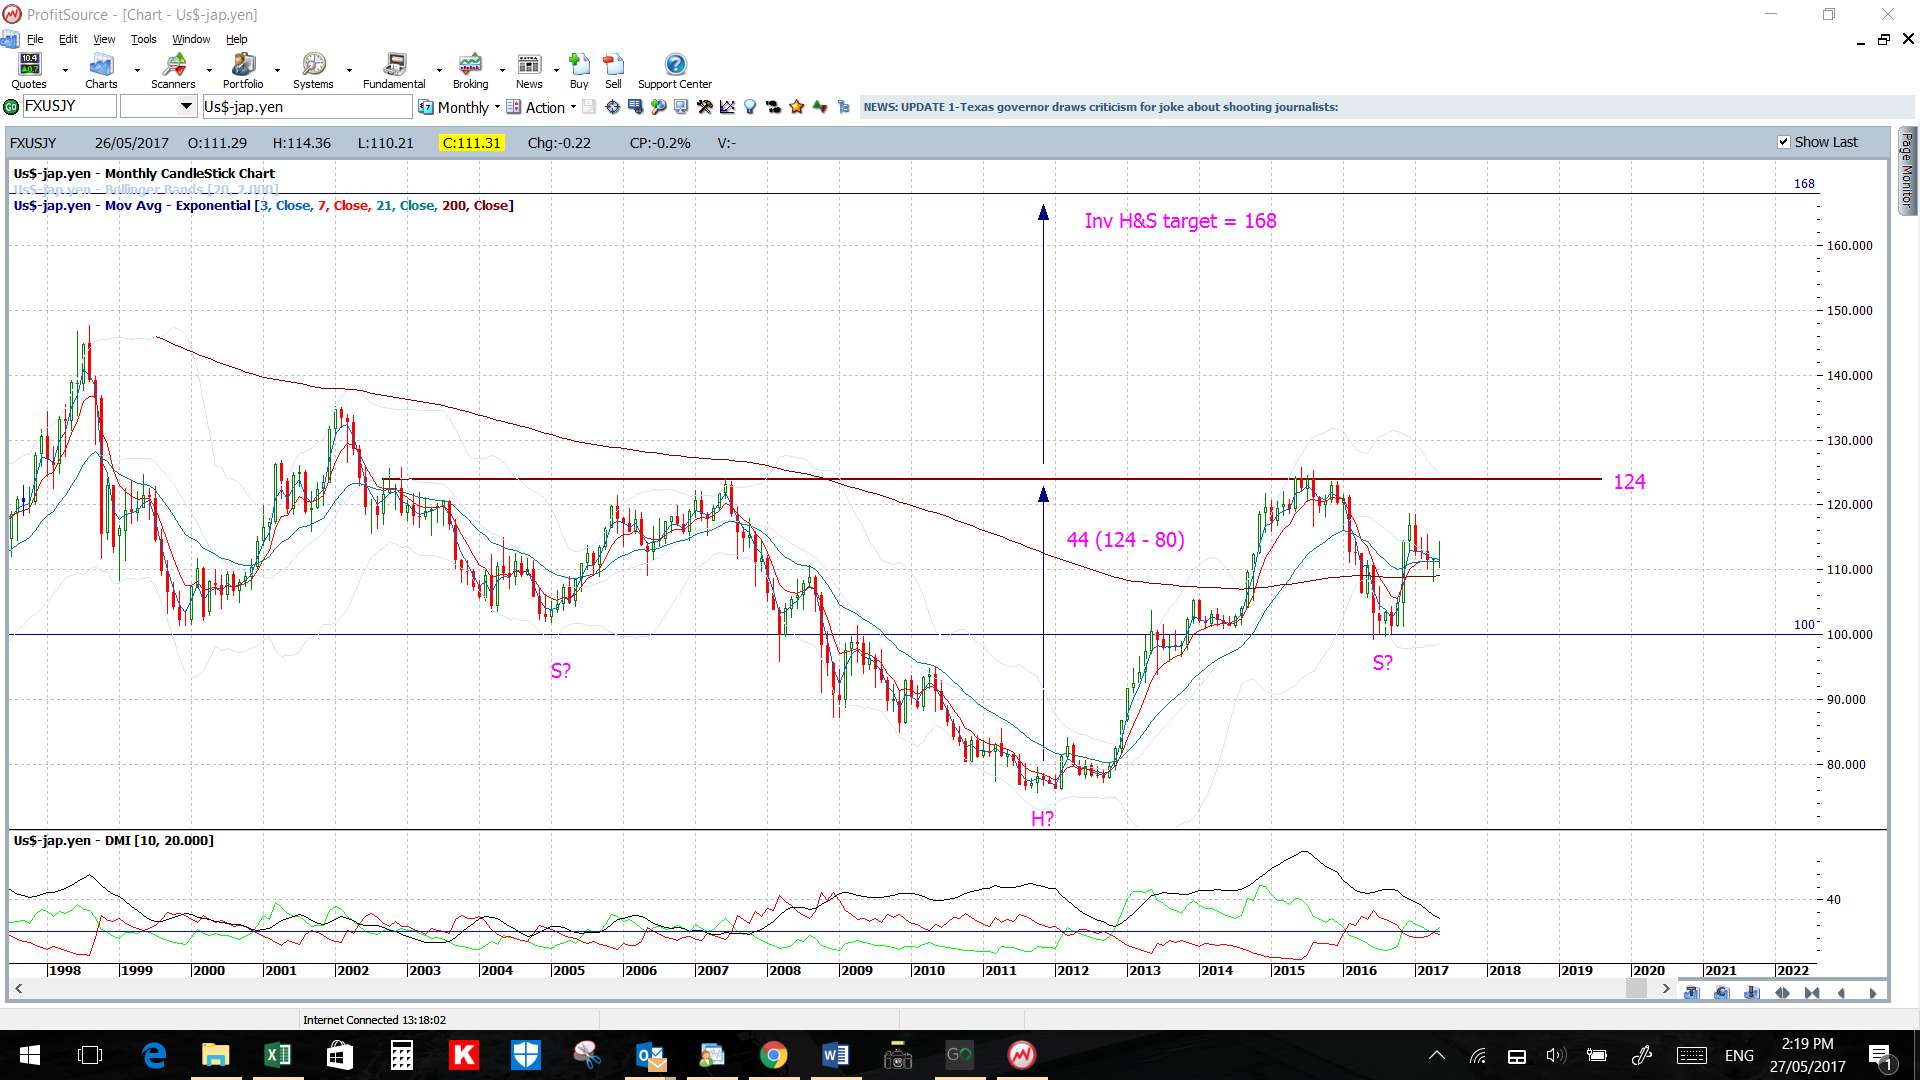
USD/JPY: Watch the 4hr chart’s revised triangle trend lines for any breakout:
- Upper targets: the daily chart’s upper triangle trend line.
- Lower targets: the daily chart’s lower triangle trend line.
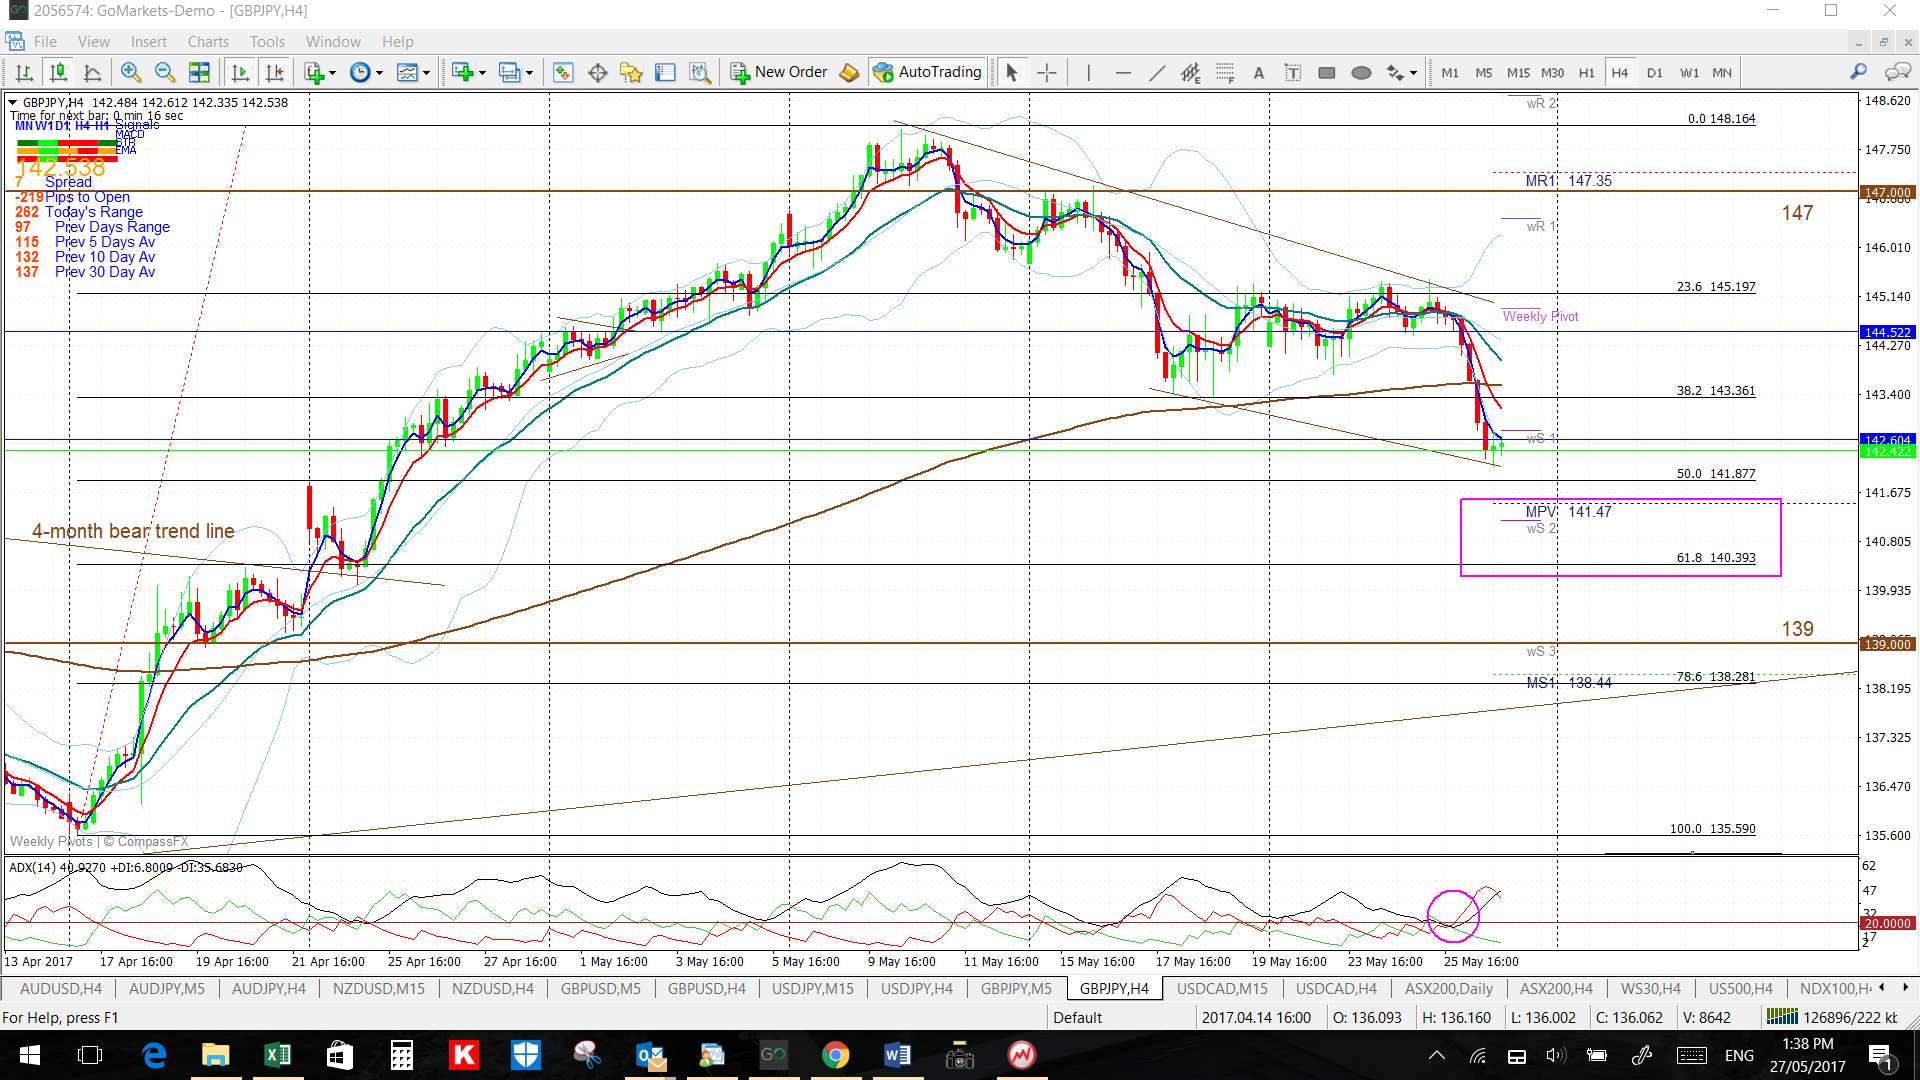
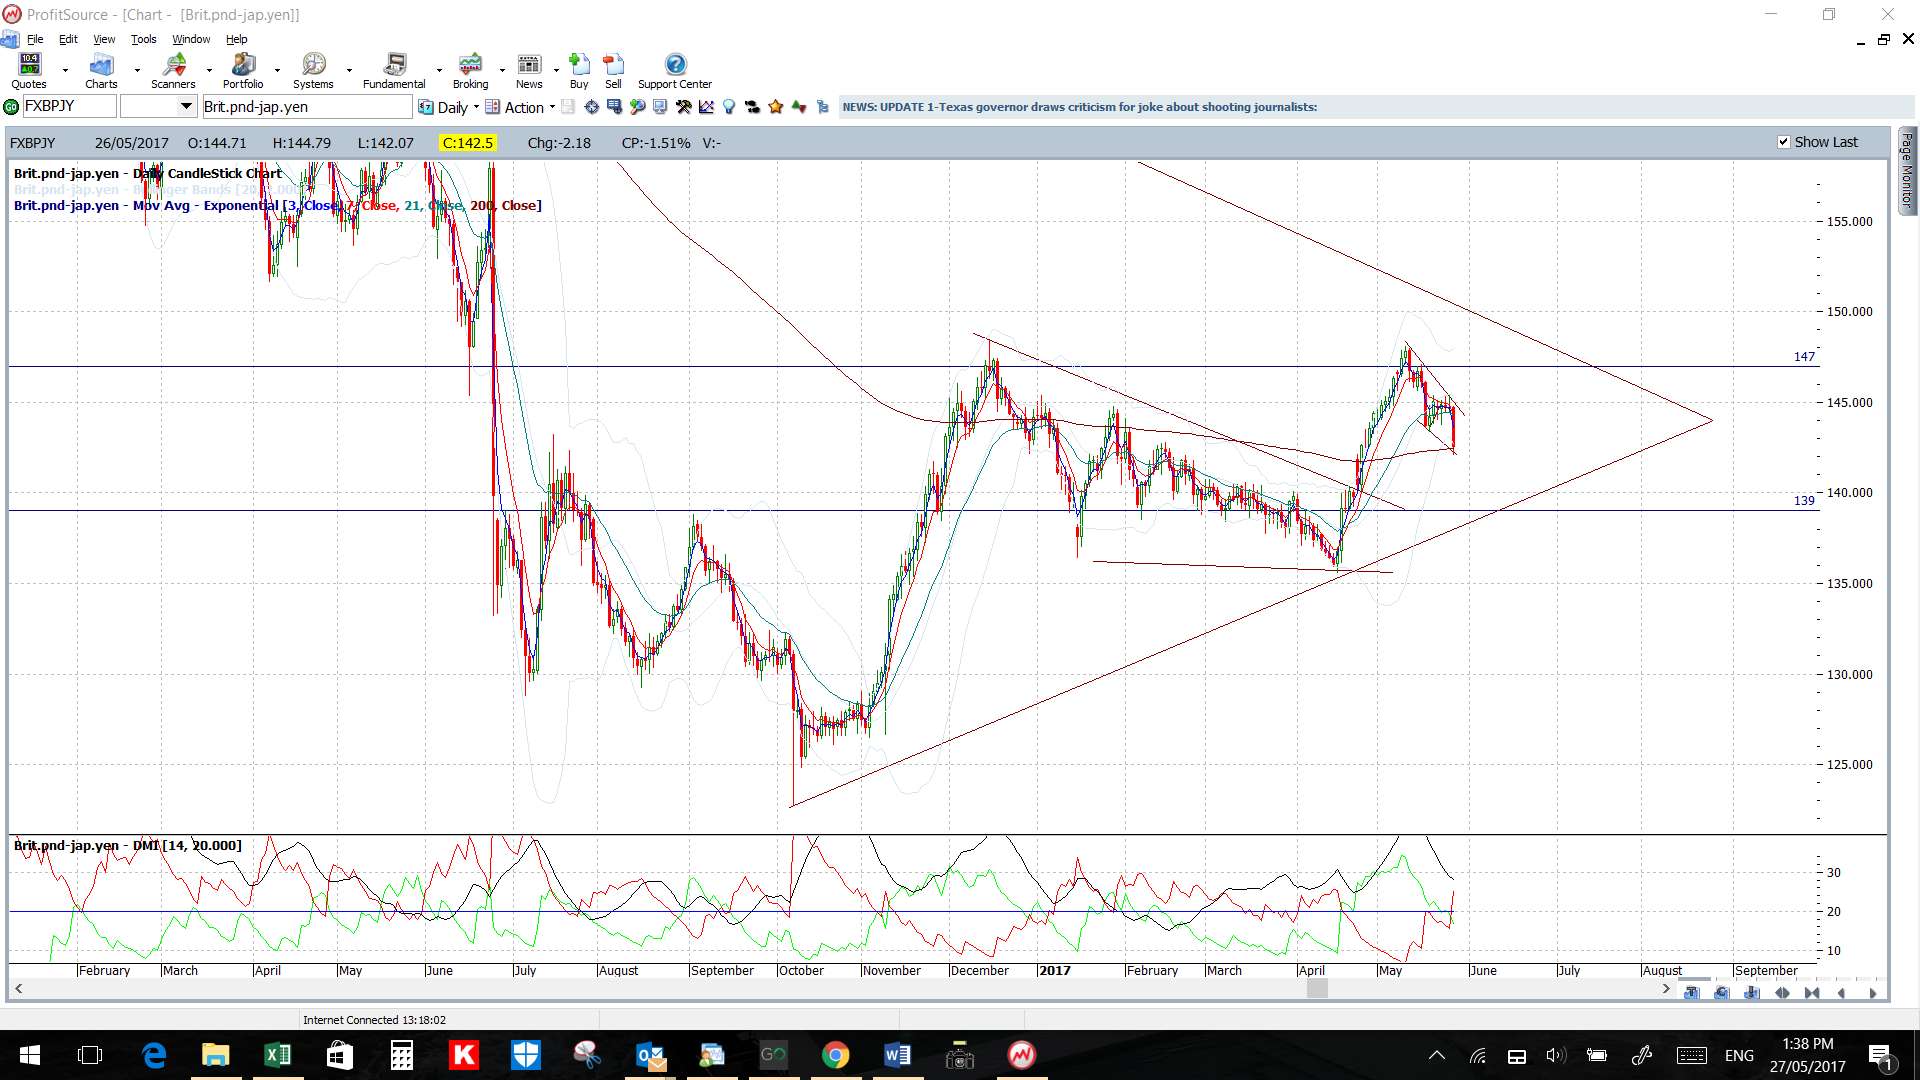
GBP/JPY: Watch the 4hr chart’s revised wedge trend lines for any new breakout move:
- Upper targets: 147 as previous S/R and, then, the 22 month bear trend line, which is about 500+ pips away, followed by the weekly chart’s 61.8% Fib which is up near 168.
- Lower targets: any pullback would have me looking for a test of the 4hr chart’s 61.8% Fib which is also near the monthly pivot and, after that, the 139 level.


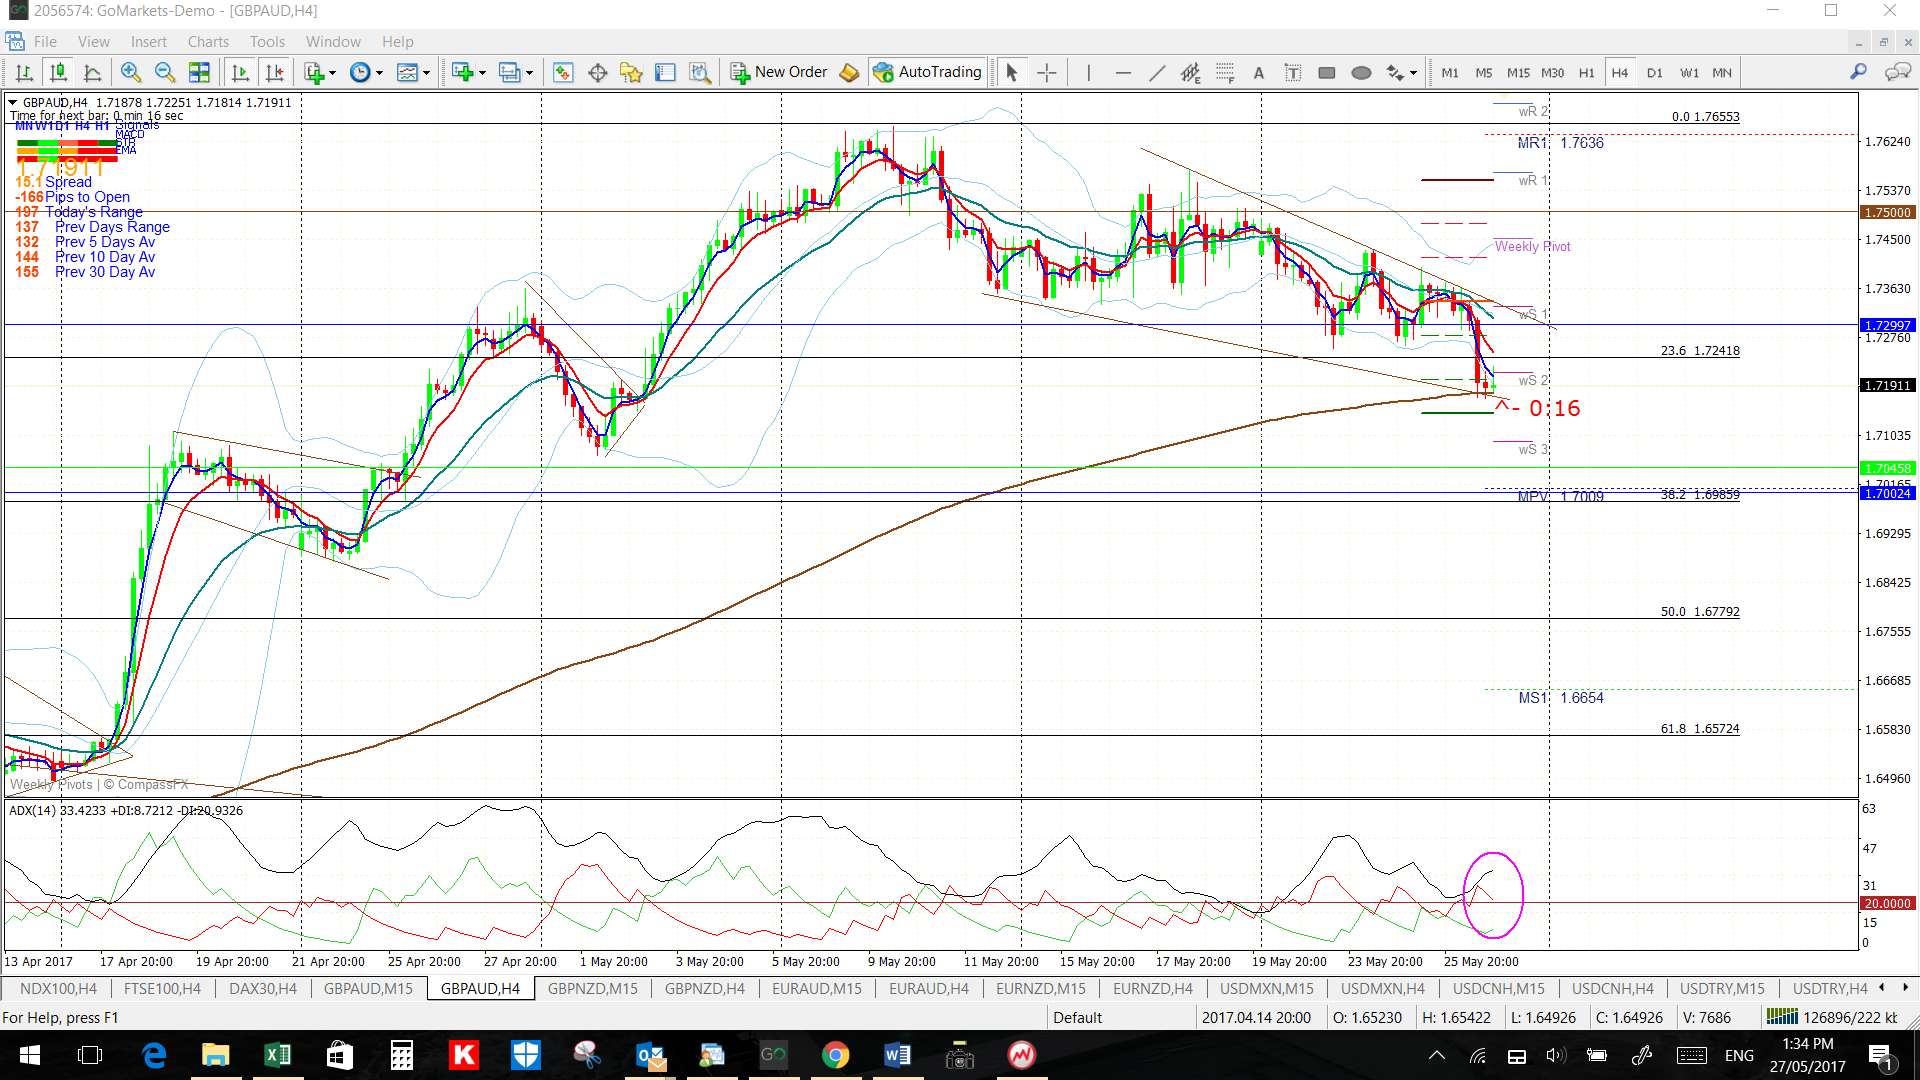
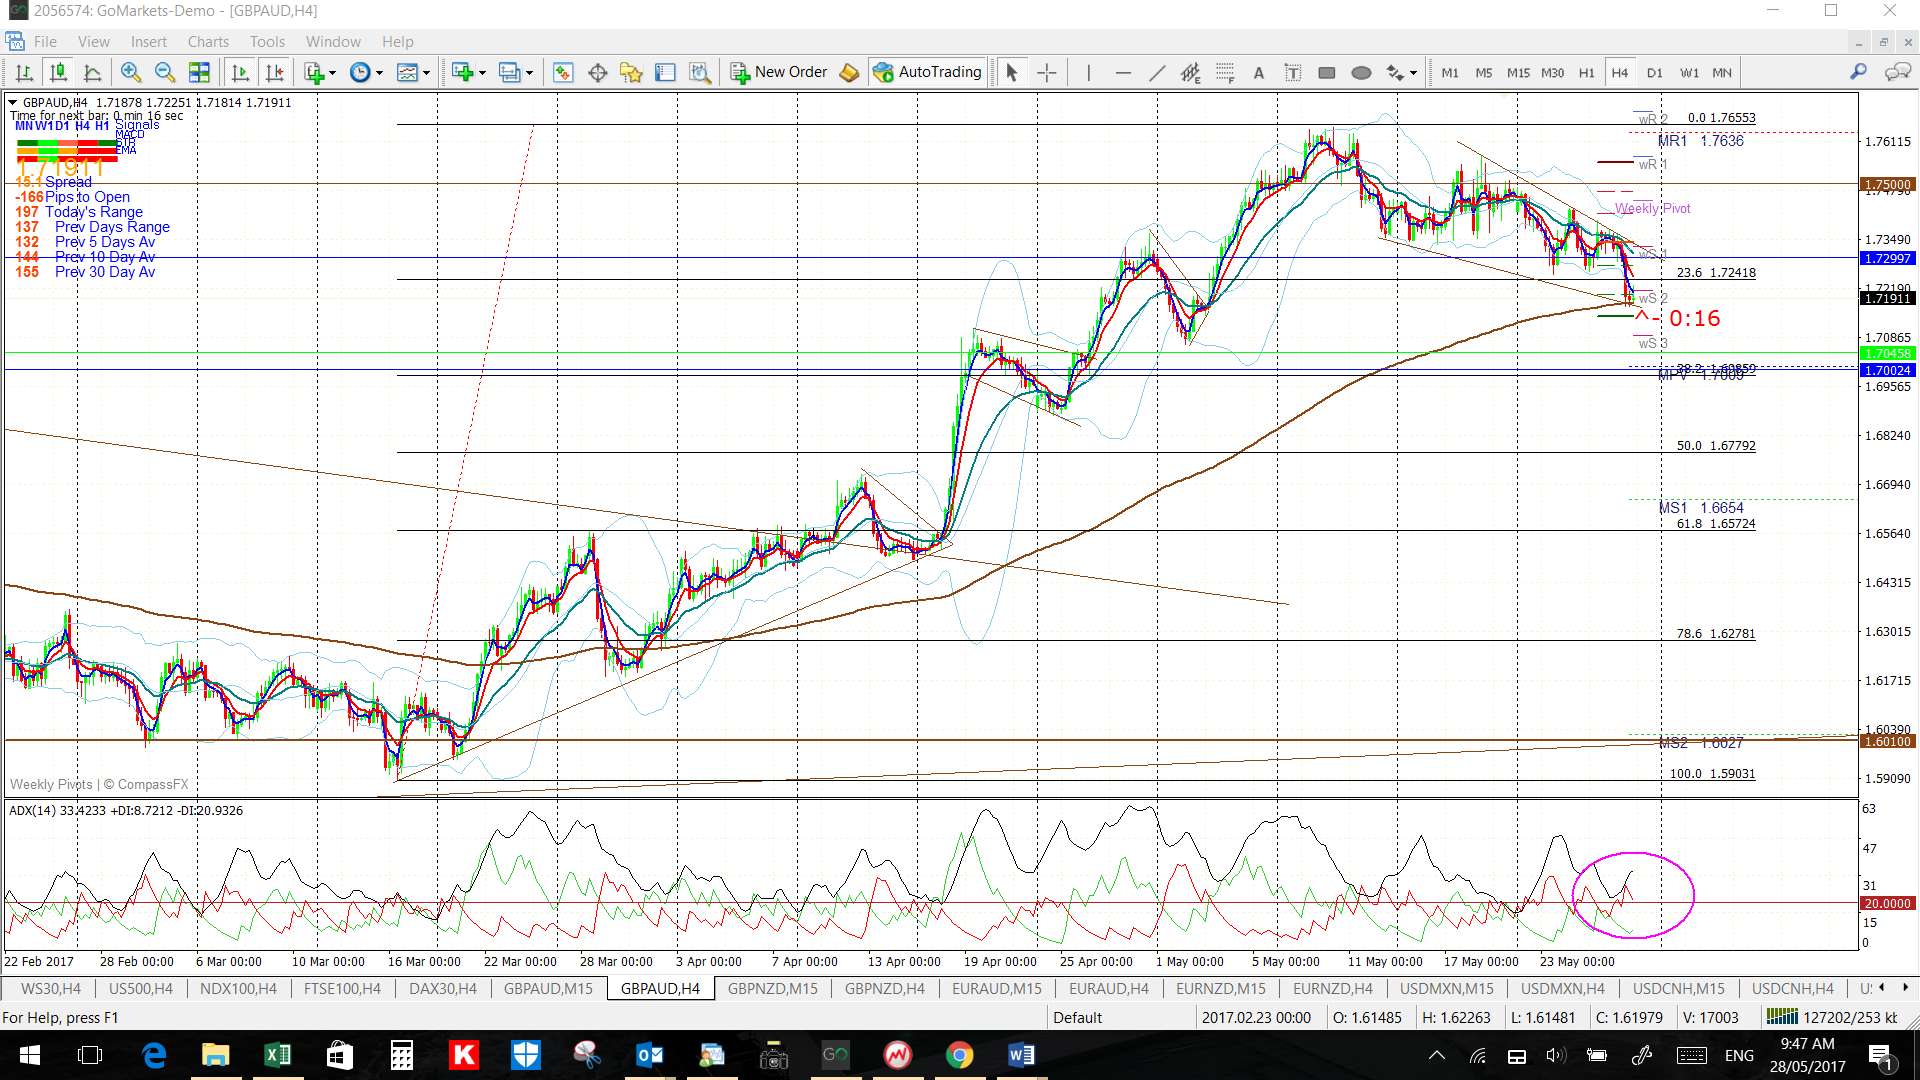
GBP/AUD: The condensed 4hr chart of this pair has a significant Bull Flag look to it; the Flagpole went up for 9 weeks and the Flag has been forming for 3 weeks. Watch the 4hr chart’s wedge trend lines for any breakout:
- Upper targets: The 1.75 level. Then the 1.80 level as previous S/R, now some 800 pips away and, then, the 20-month bear trend line that is some 1,000 pips away.
- Lower targets: any pullback would have me looking for a test of the 4hr chart’s 61.8% Fib near 1.65.
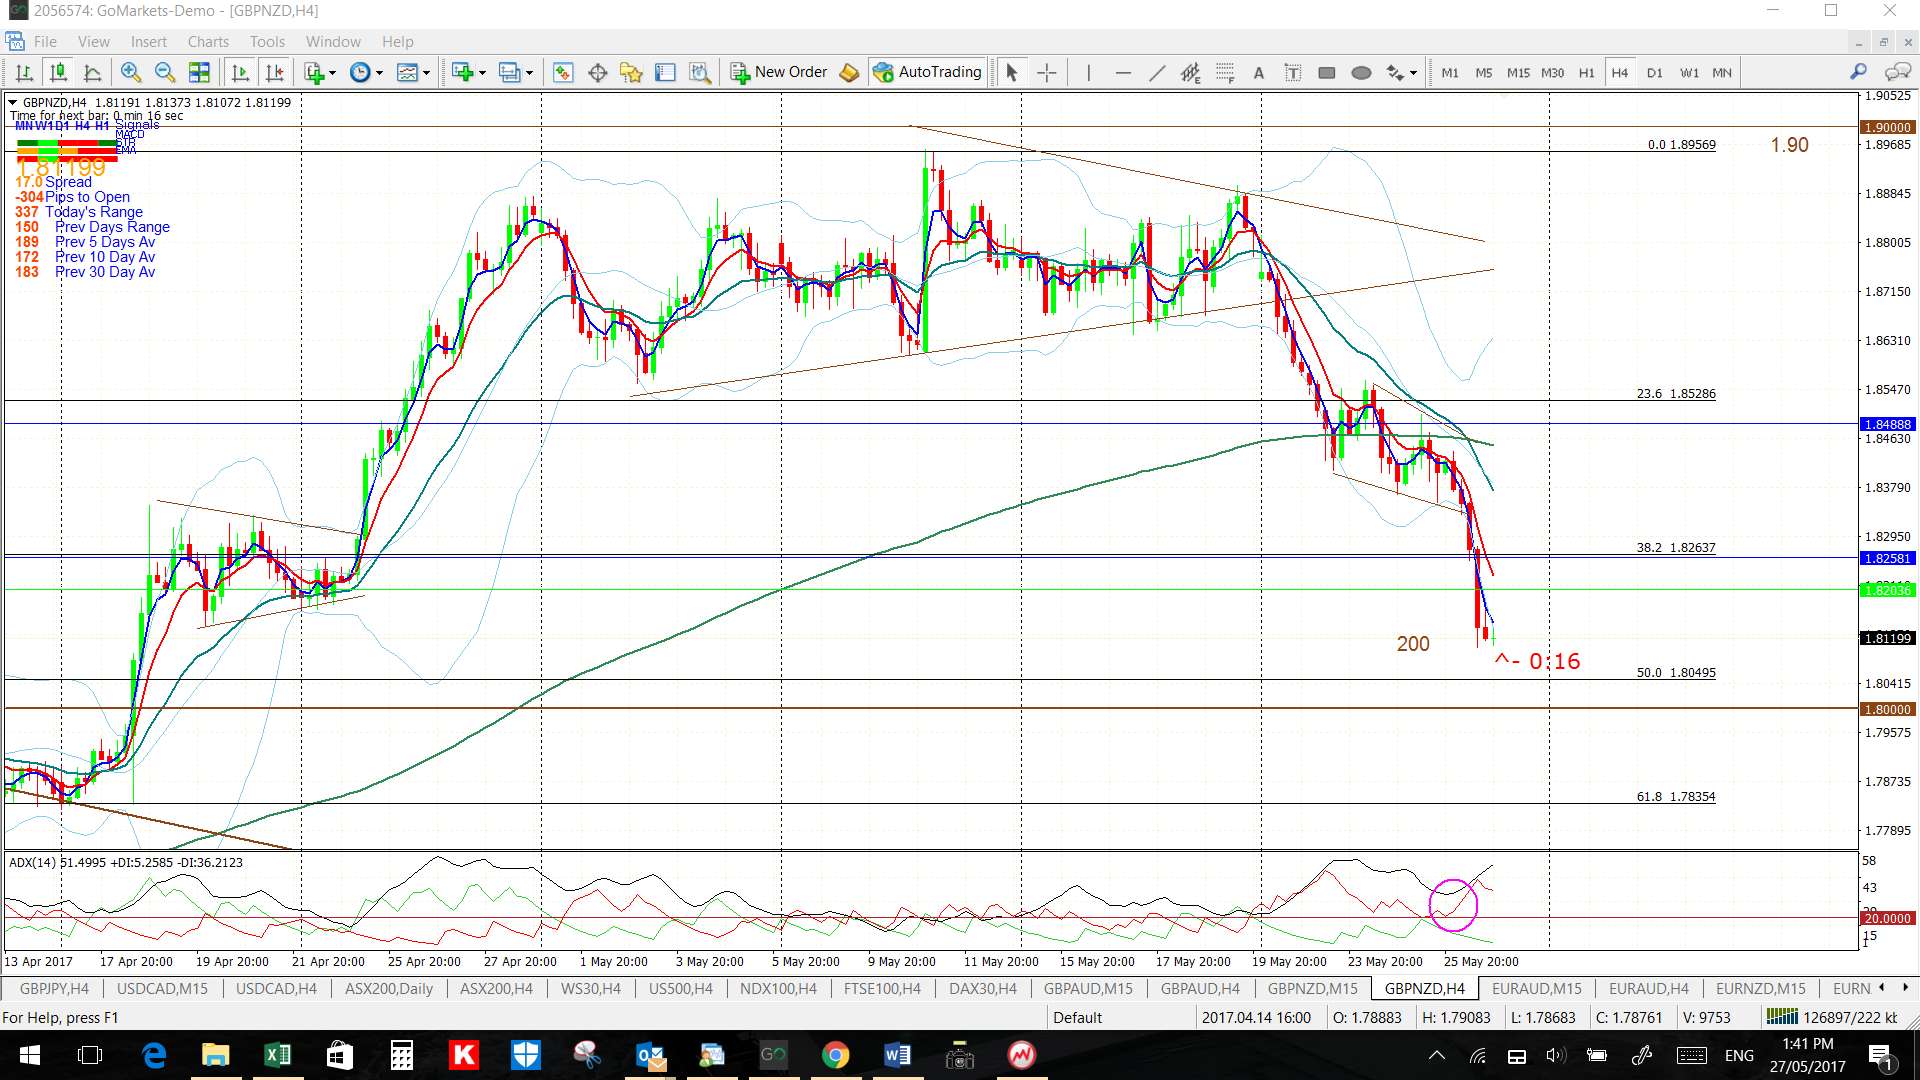
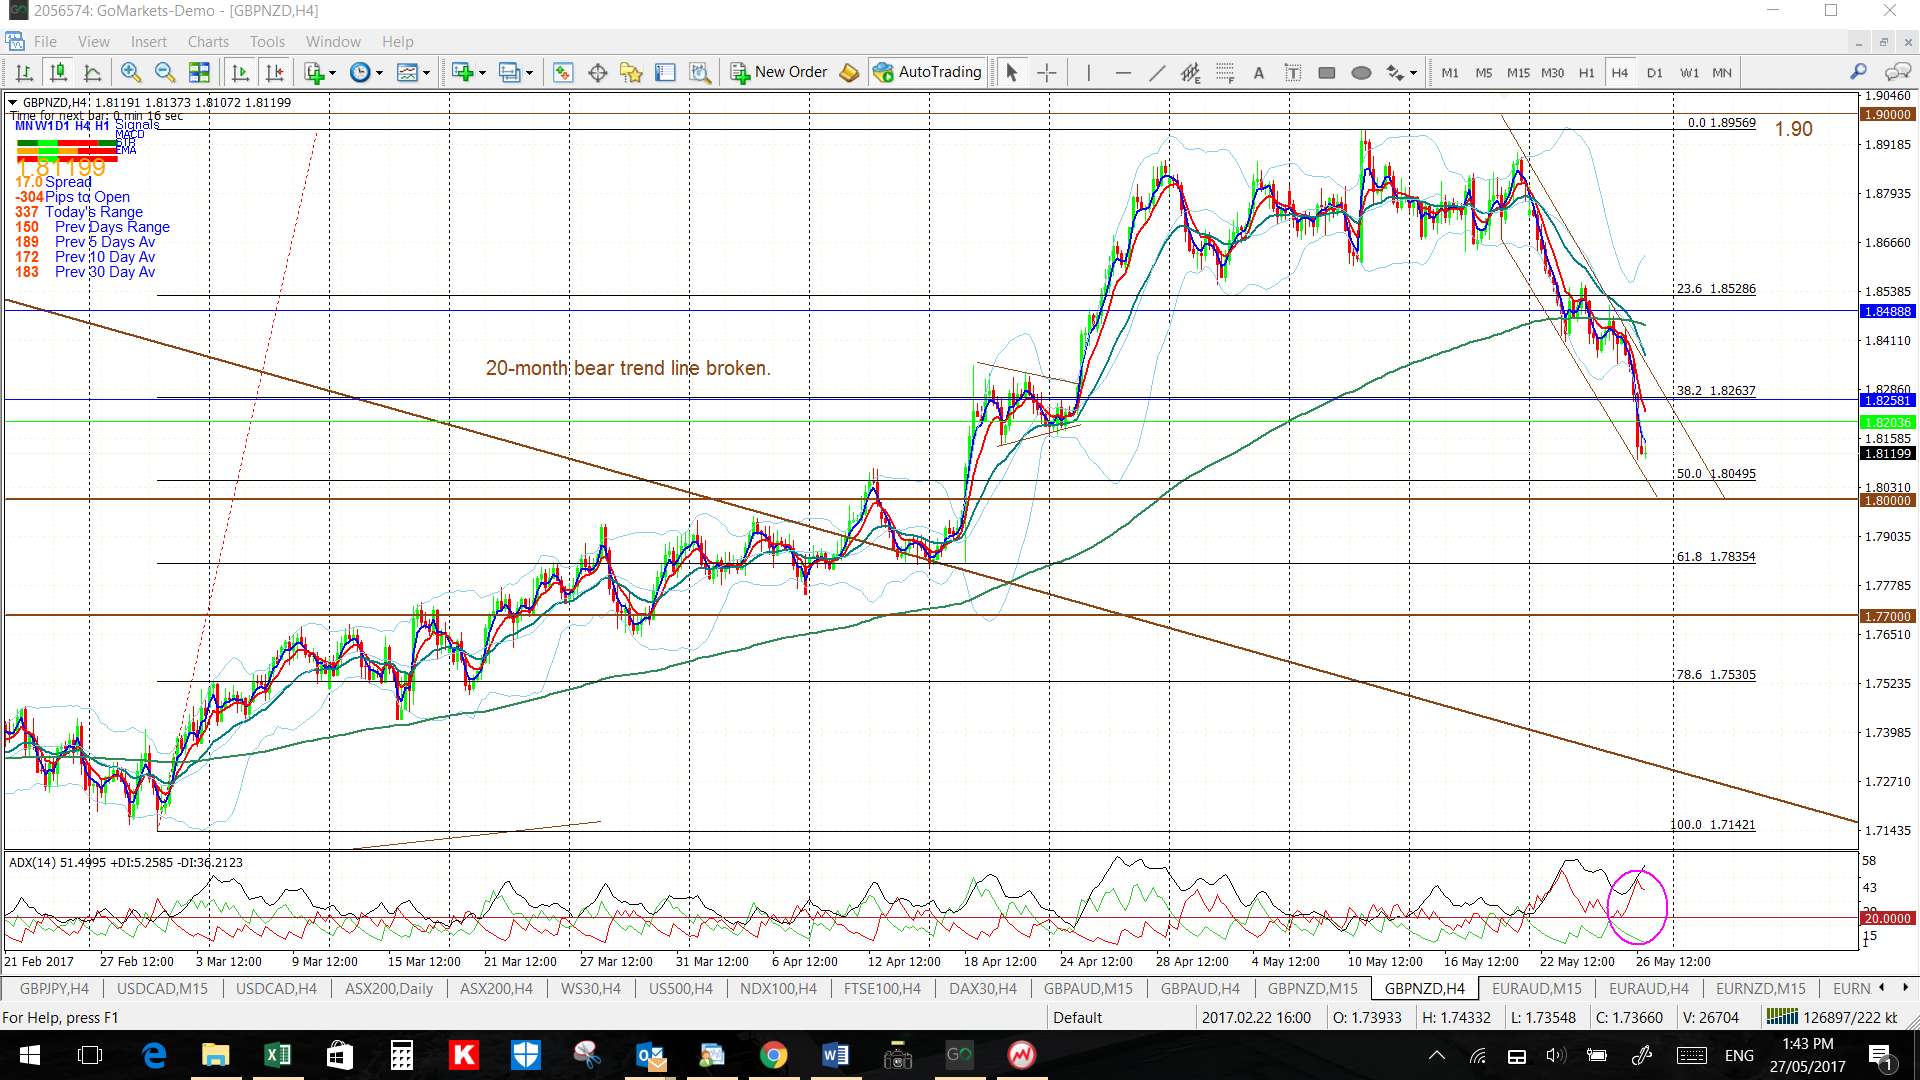
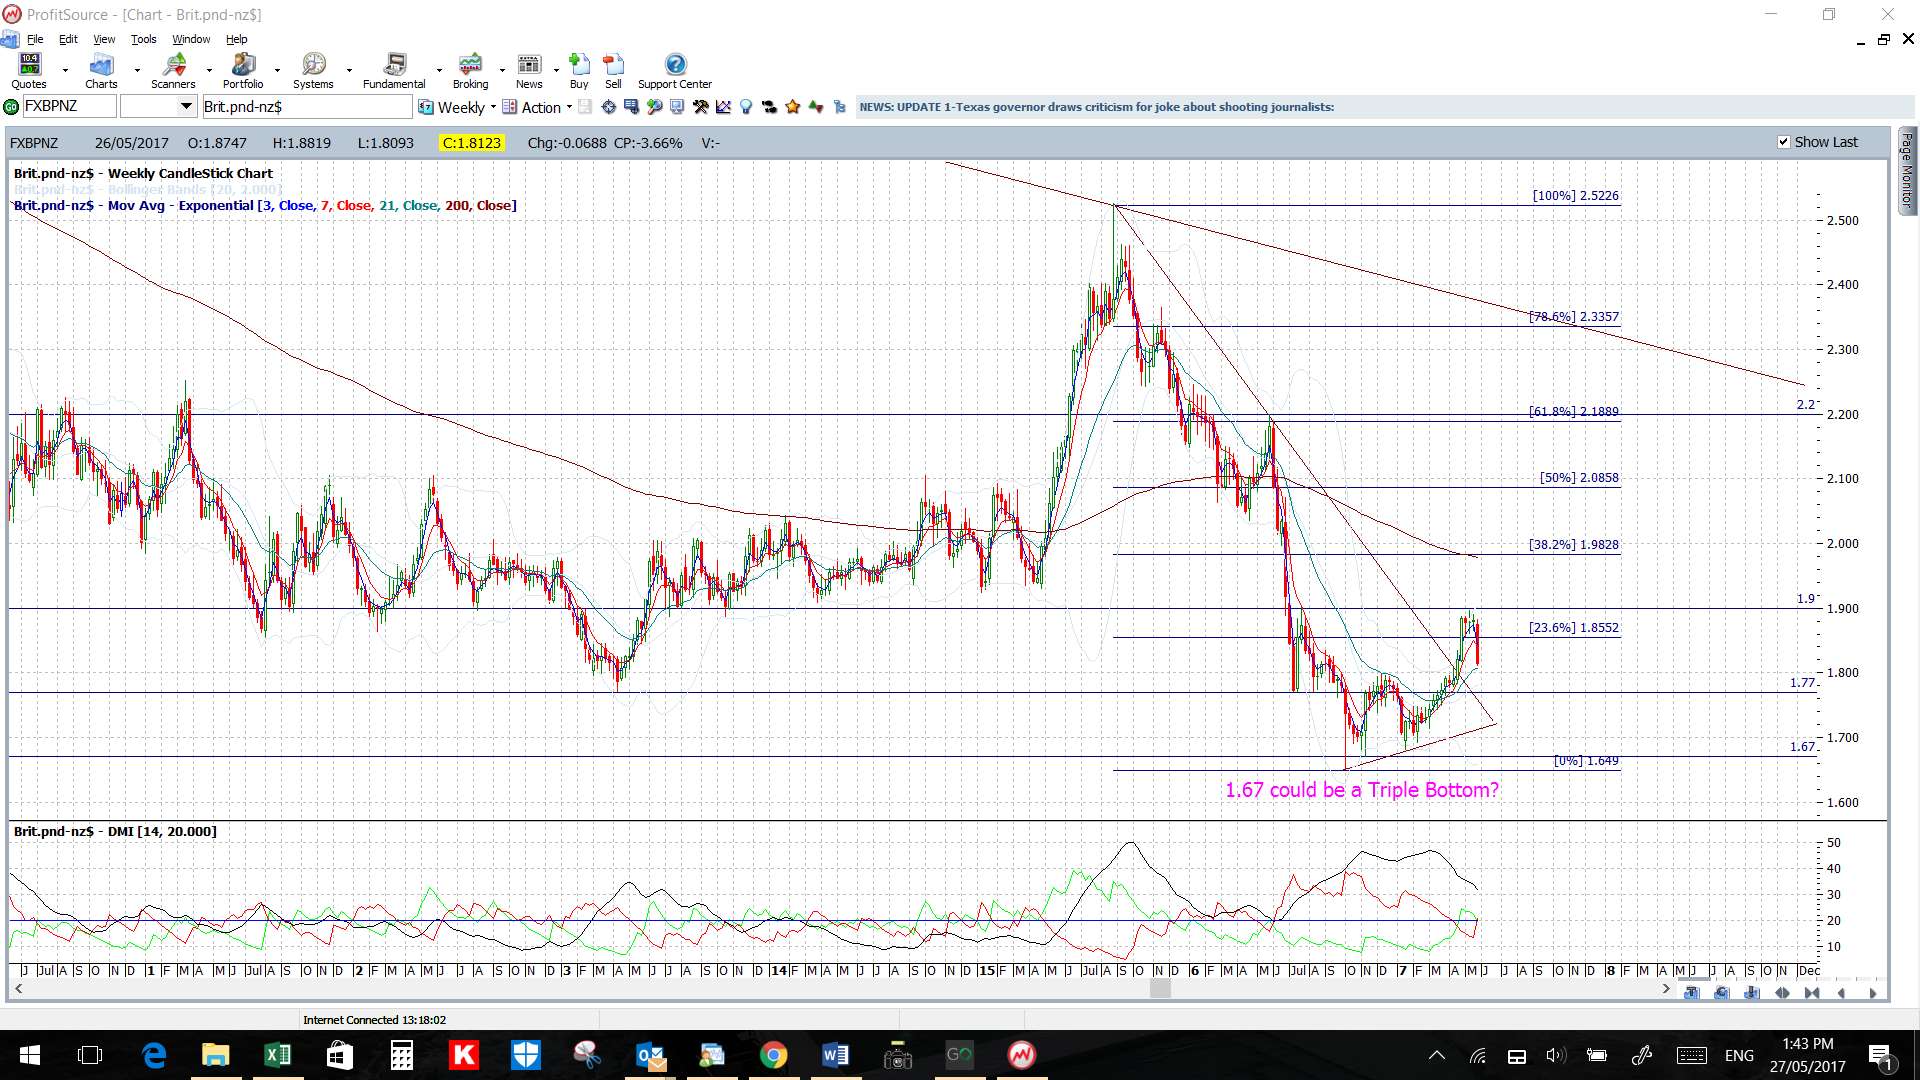
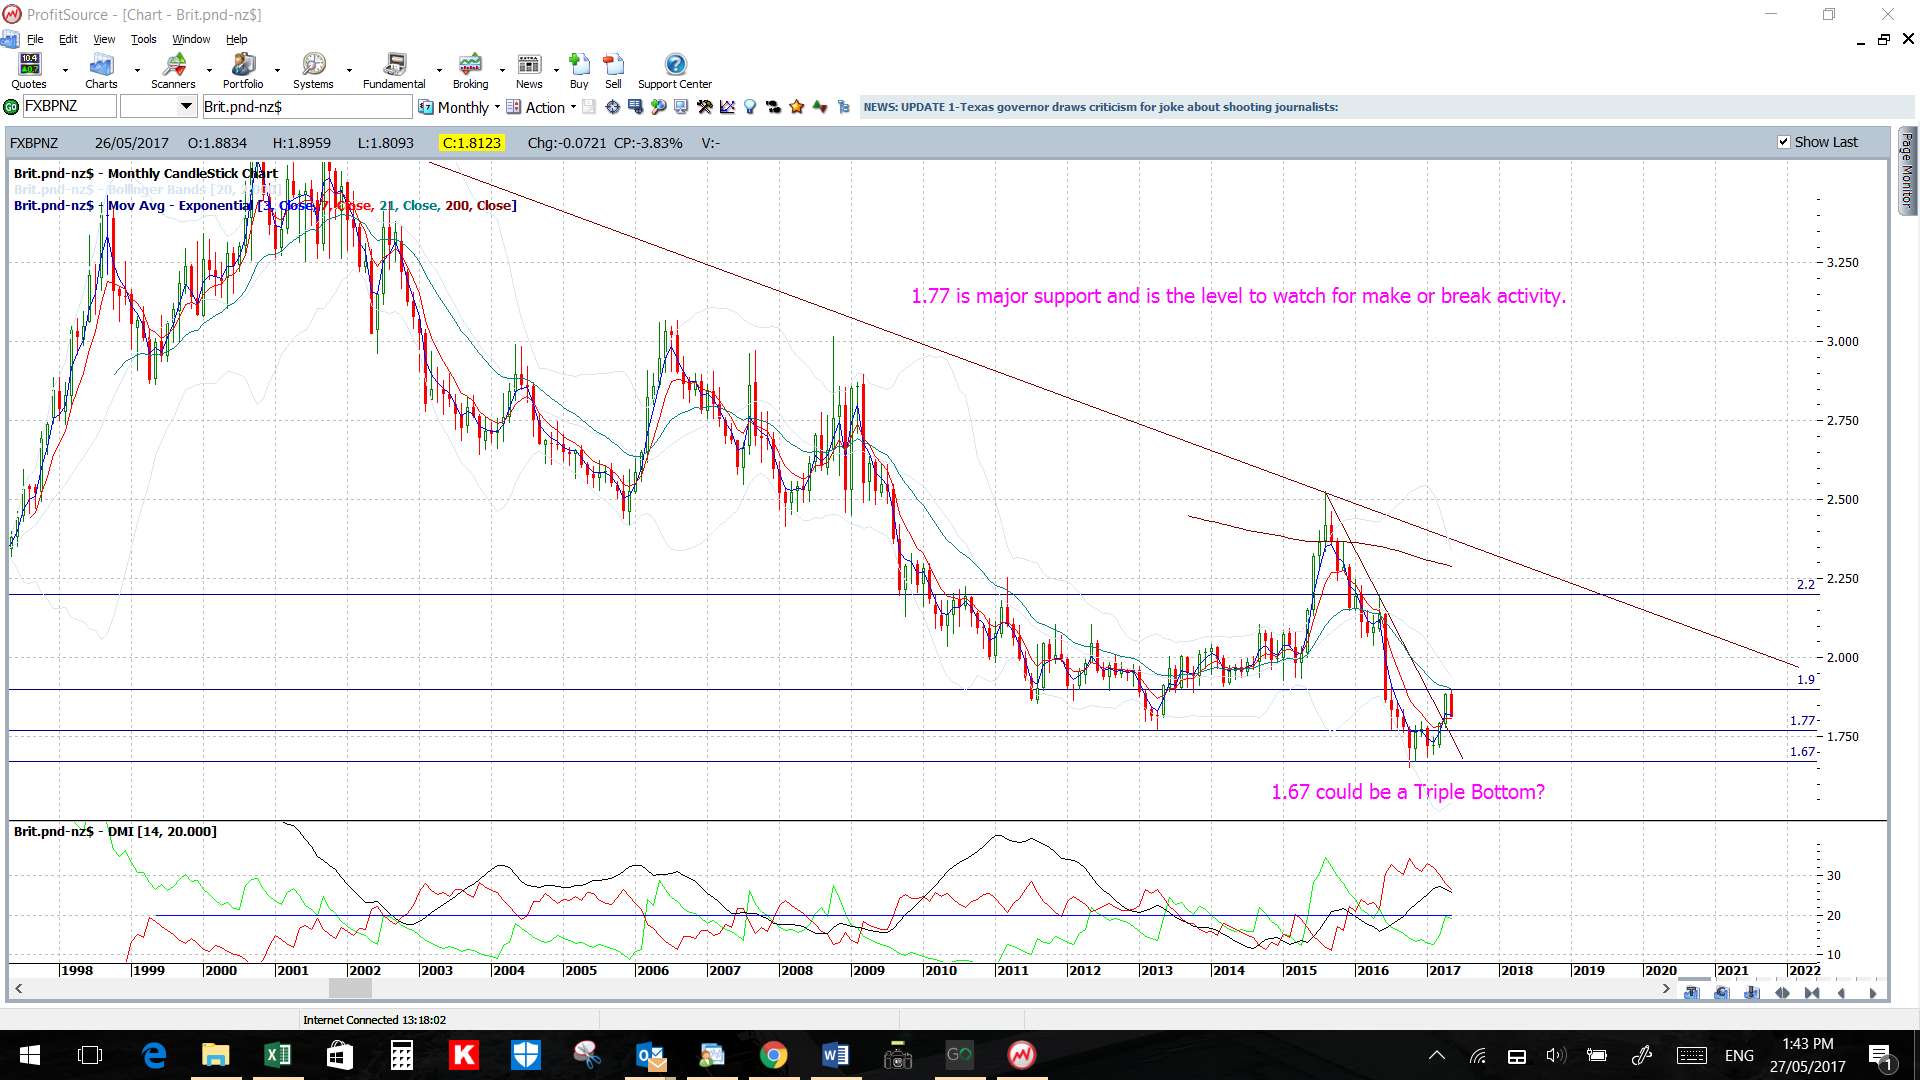
GBP/NZD: This pair rallied for nine week then went sideways for three before pulling back last week; however still only down to the near the 50% Fib level. Watch the 4hr chart’s revised channel trend lines for any new breakout:
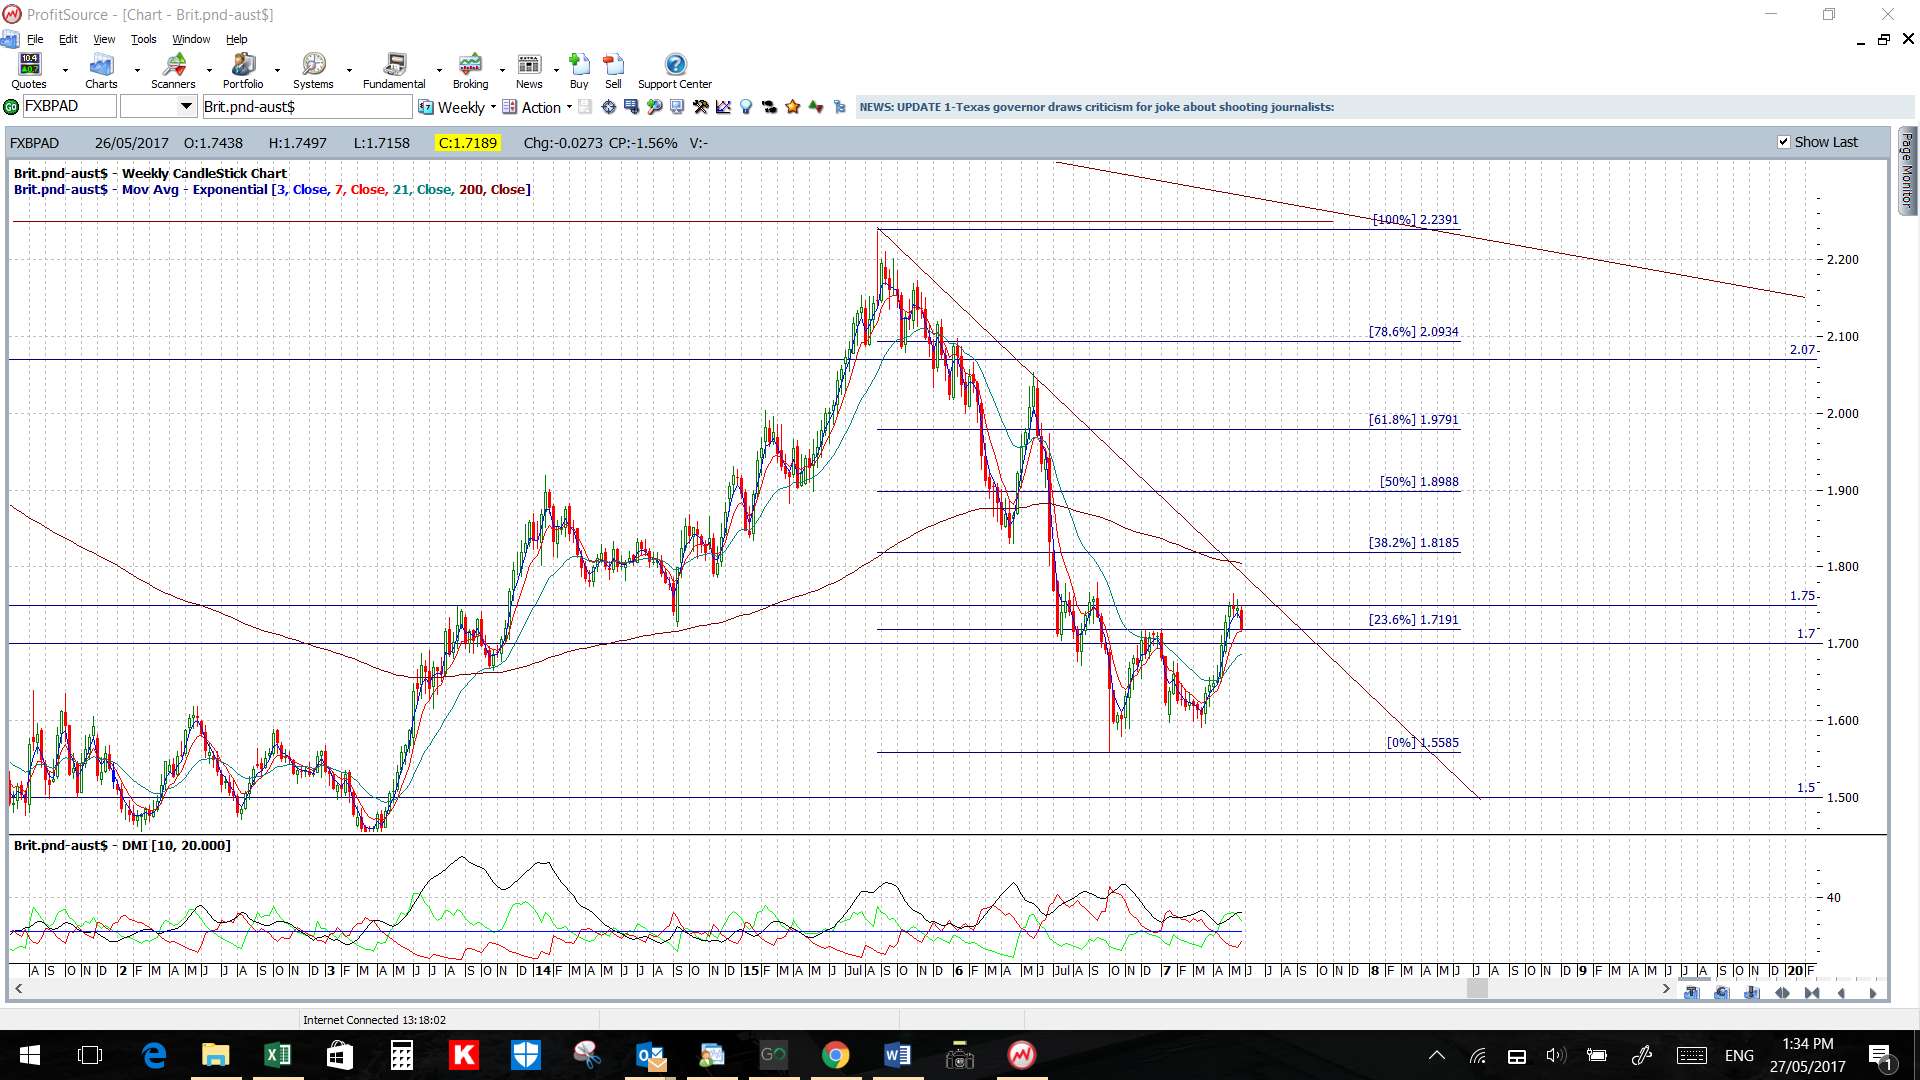
- Upper targets: 1.90 as previous S/R and, then, the weekly chart’s 61.8% Fib near 2.20 S/R.
- Lower targets: any deeper pullback would have me looking for a test of 1.77 S/R as we’ve already had the test of the 4hr chart’s 50% Fib near previous S/R of 1.80.
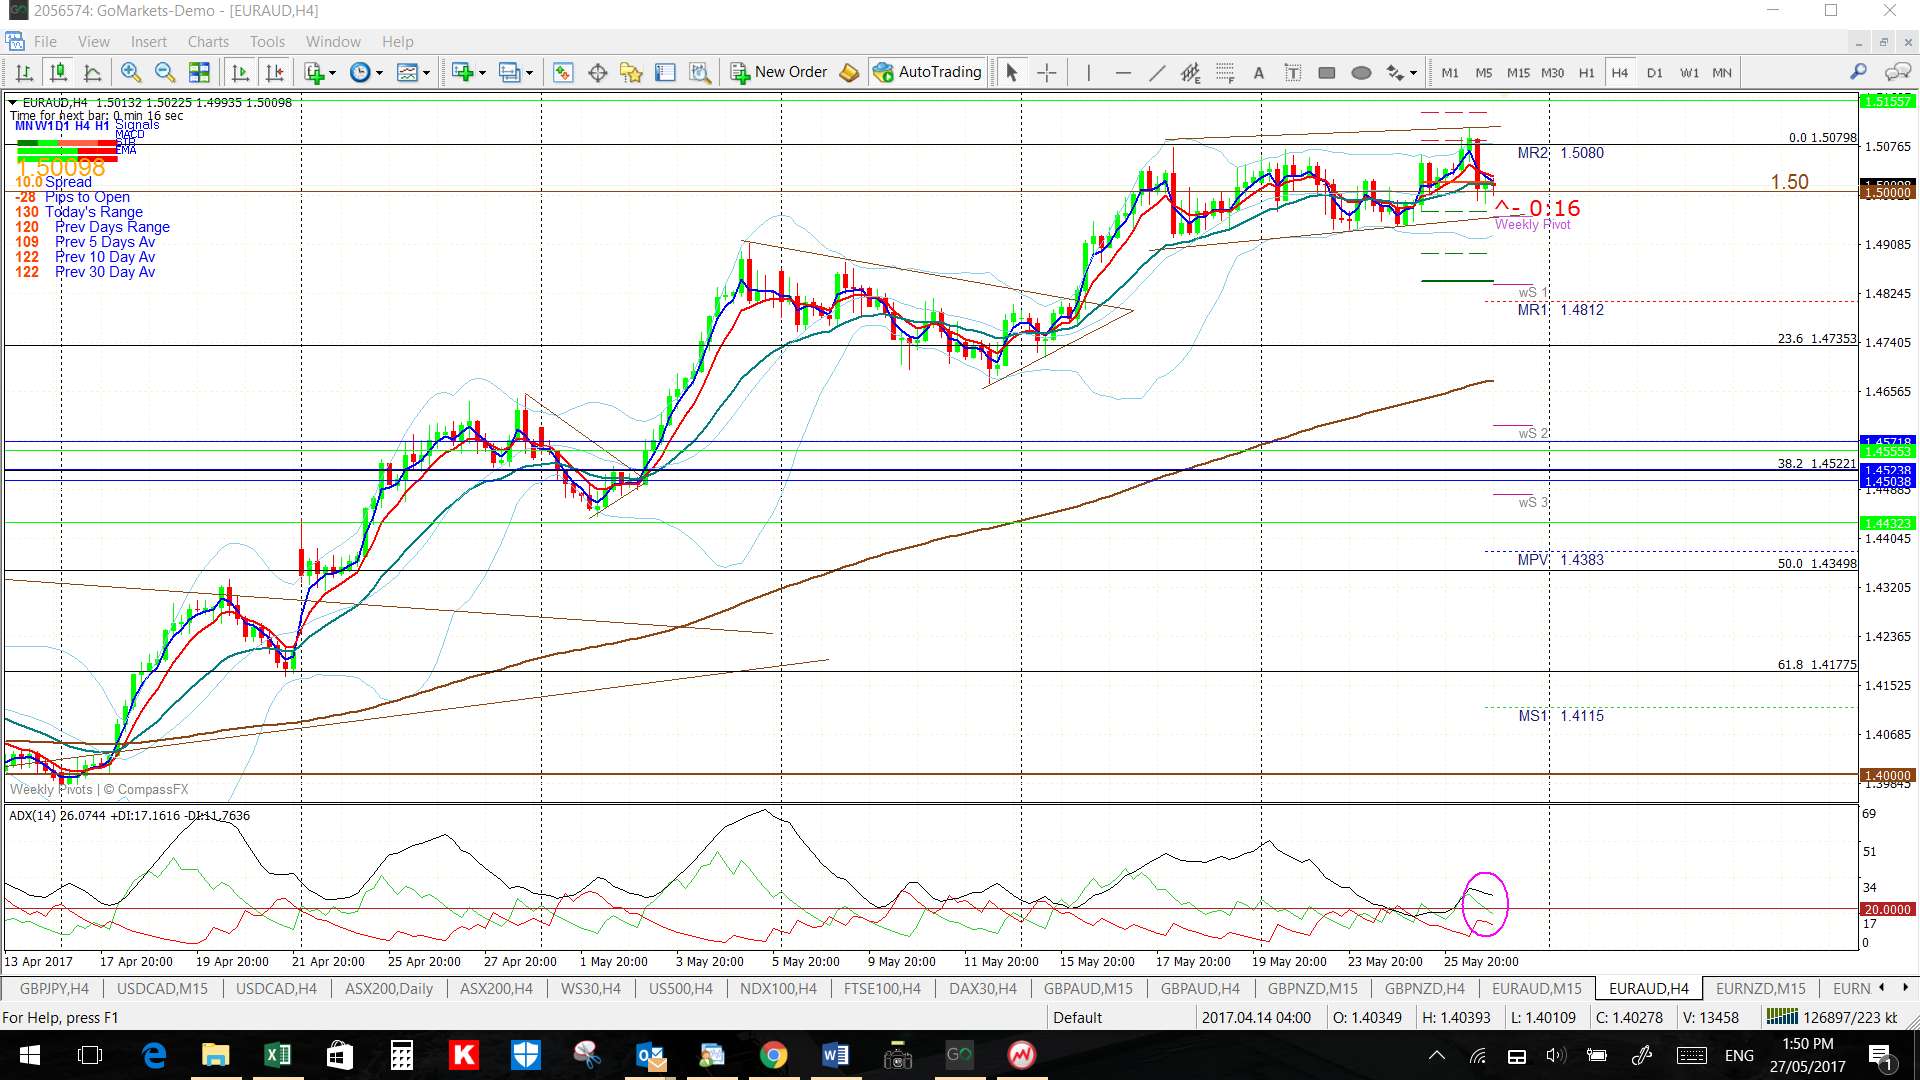
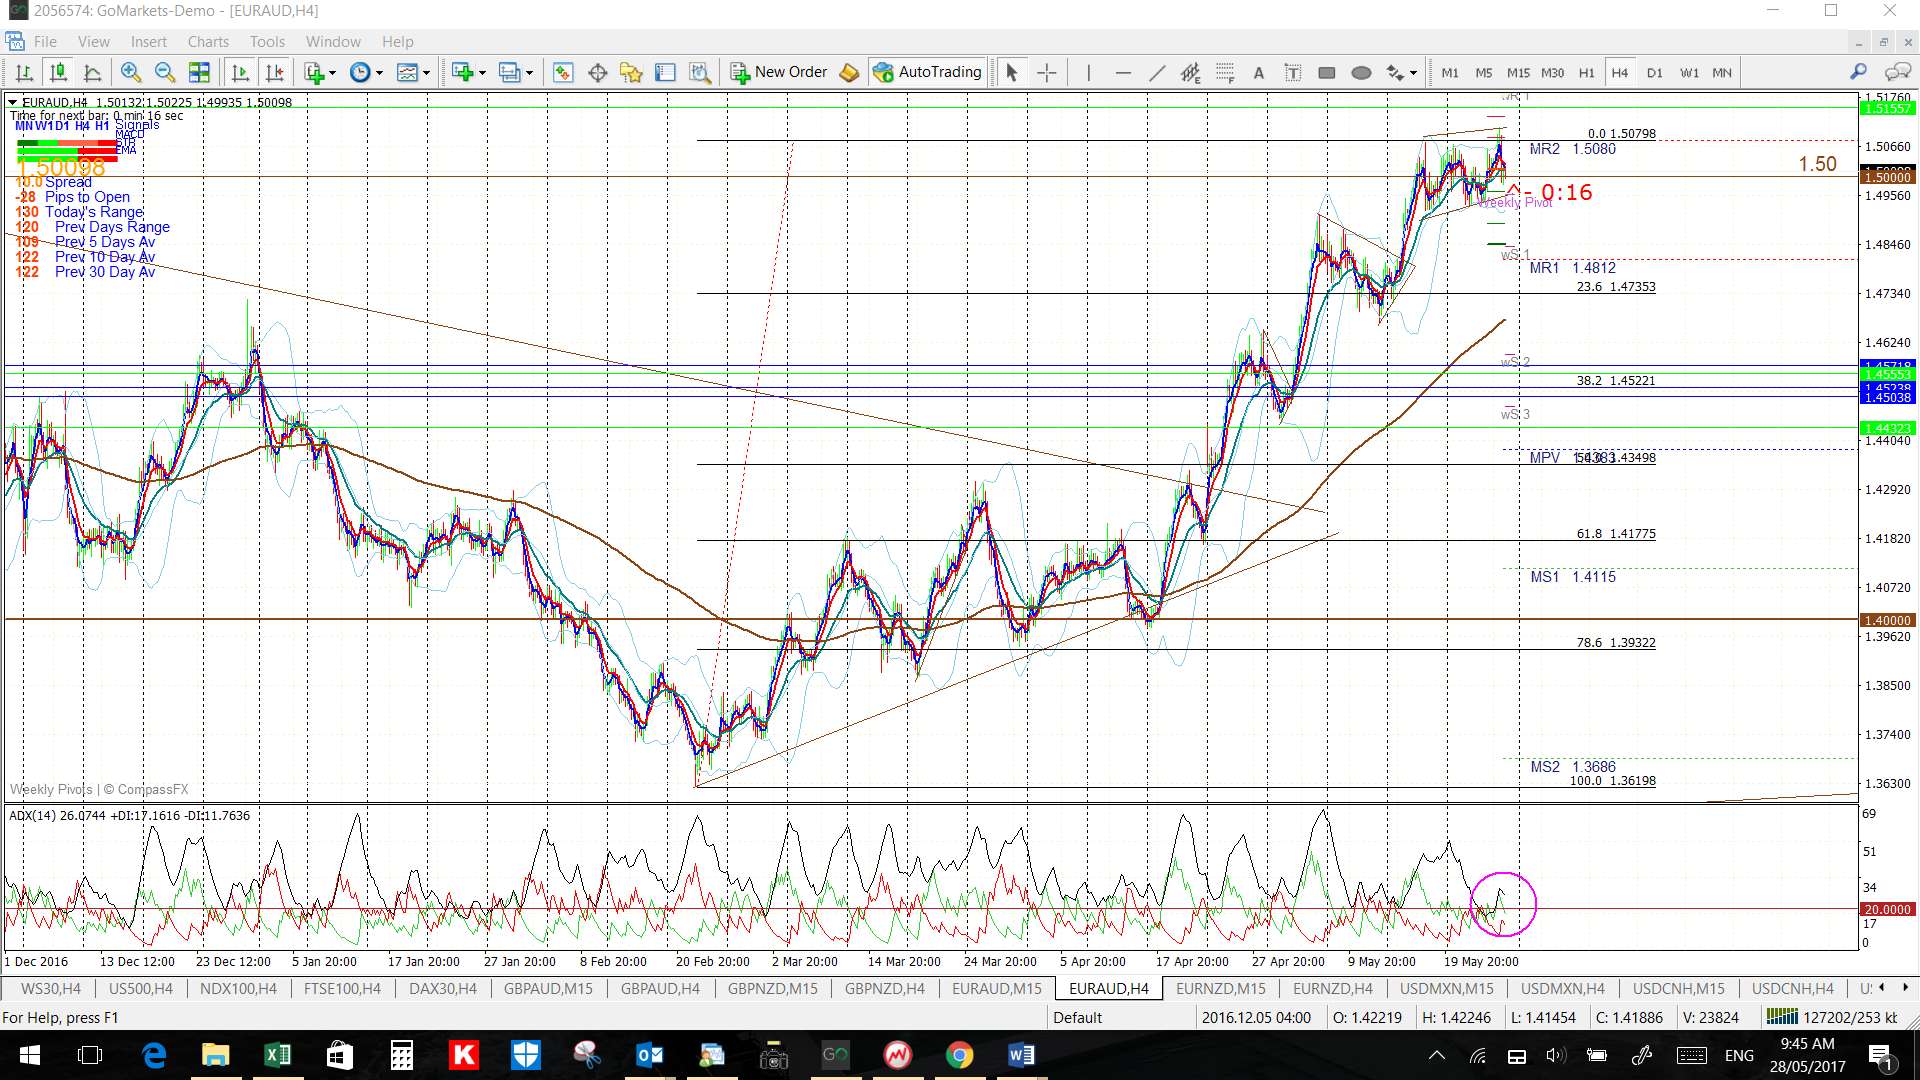
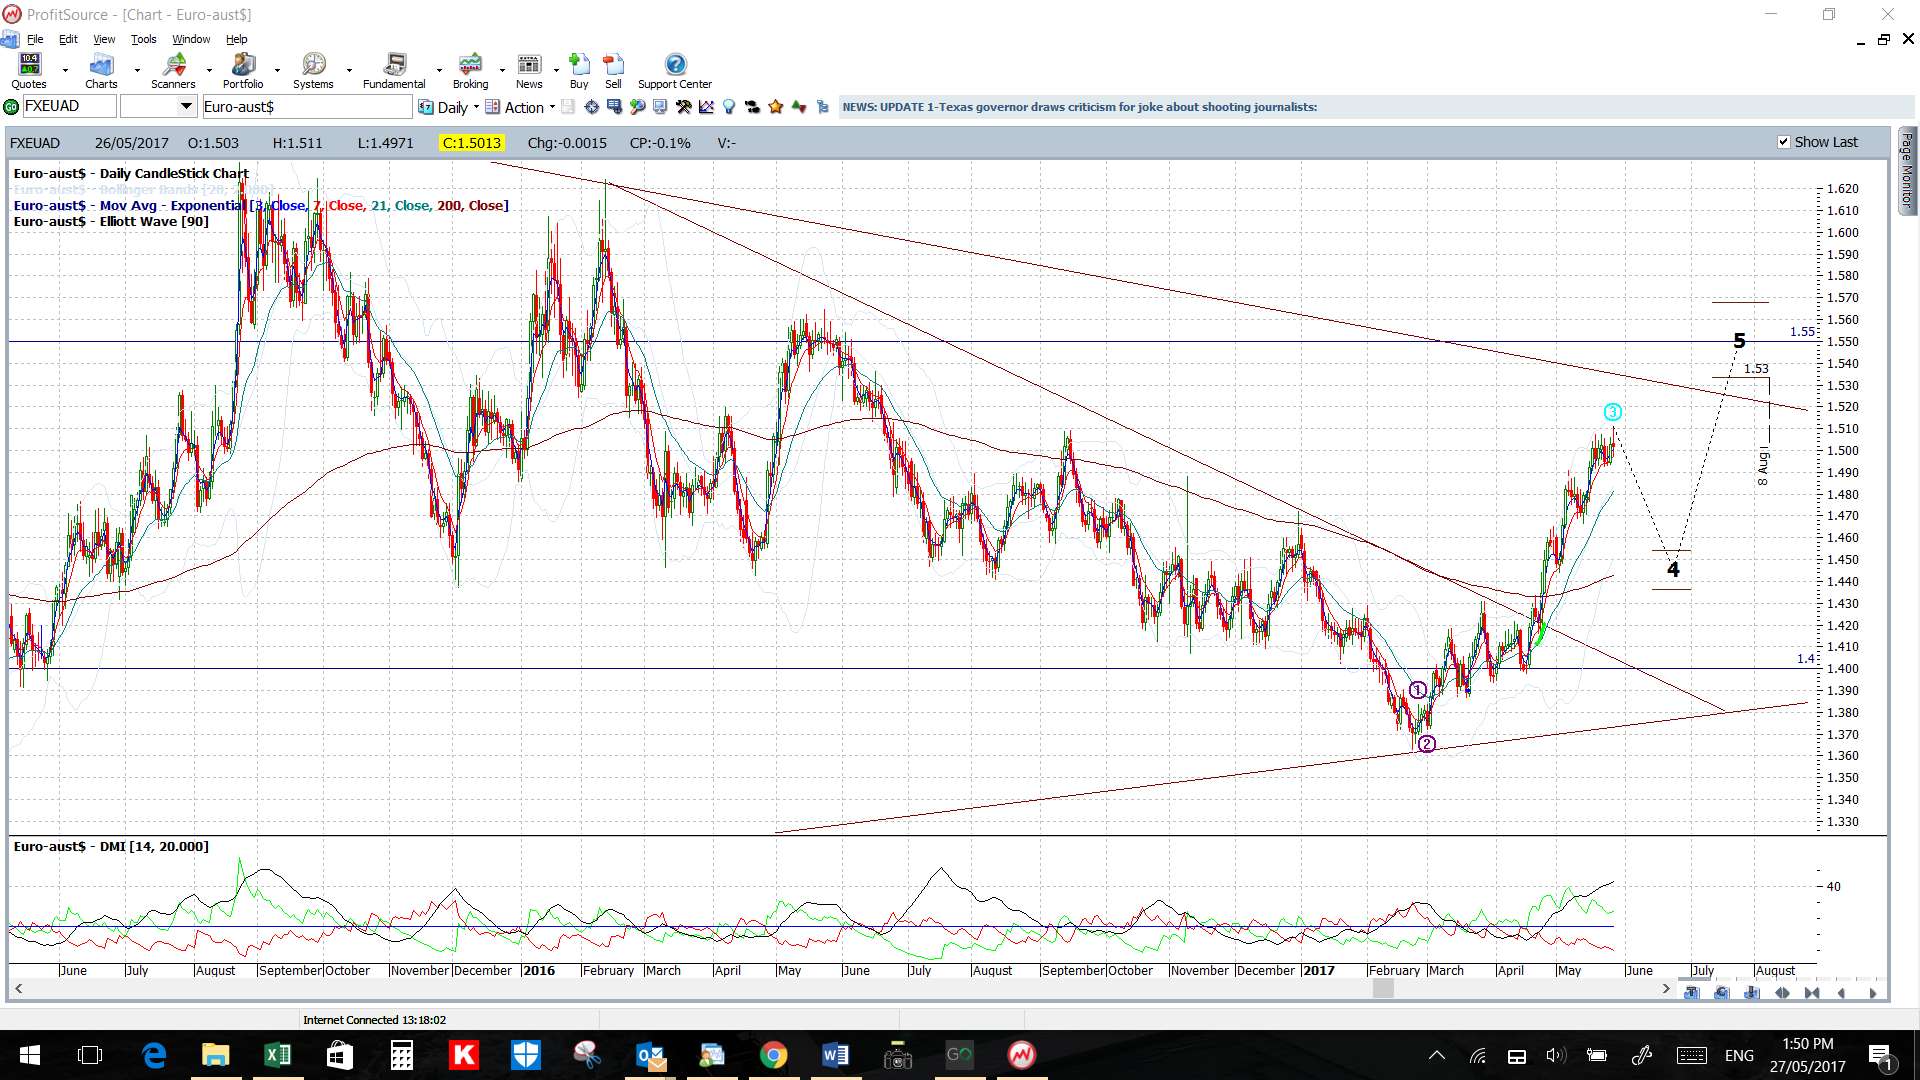
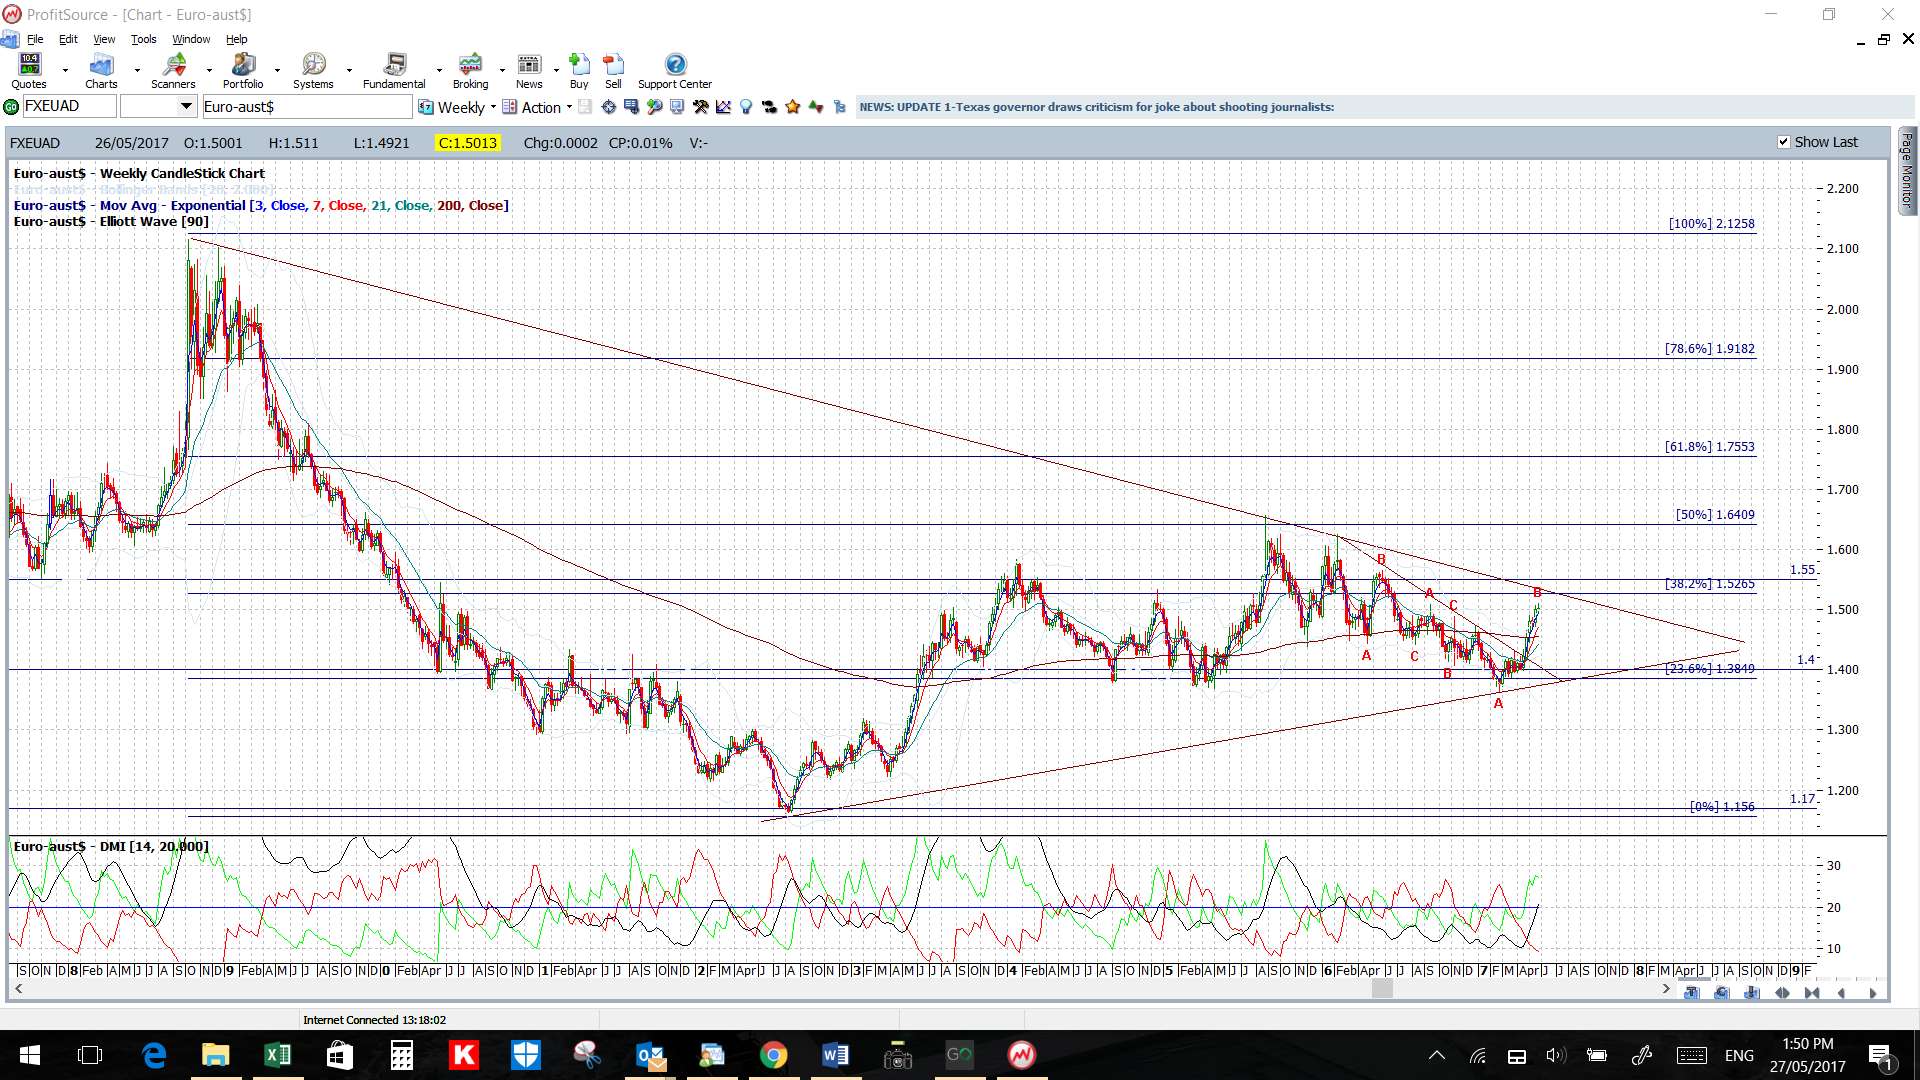
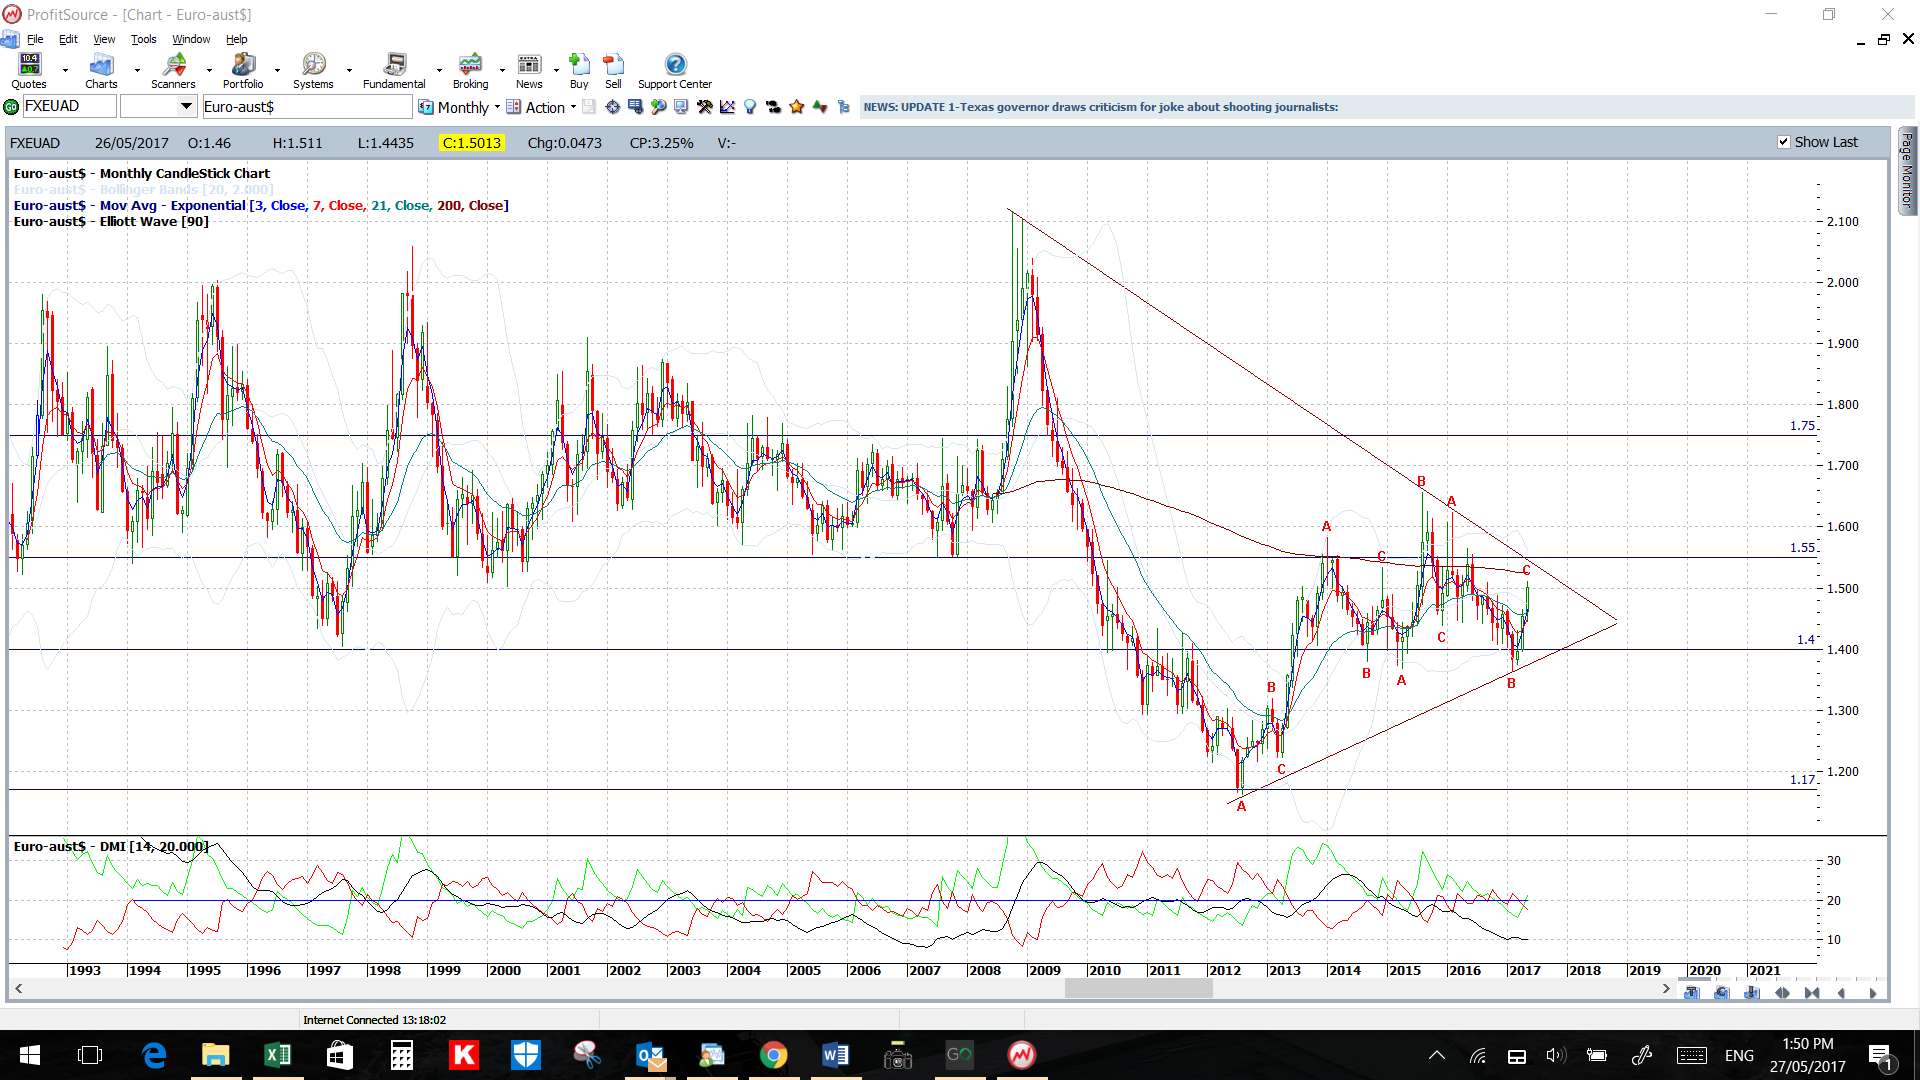
EUR/AUD: This pair has been on the rise for the last 13 weeks but the 1.50 level seems to be giving it some grief. Watch the 4hr chart’s wedge trend lines for any breakout:
- Upper targets: this pair is heading towards a 10-year bear trend line and this is just below the previous S/R level of 1.55. Note this is still about 500 pips away and so worth stalking!
- Lower targets: any pullback would have me looking for a test of the 4hr chart’s 50% Fib; near 1.44 and the monthly pivot.
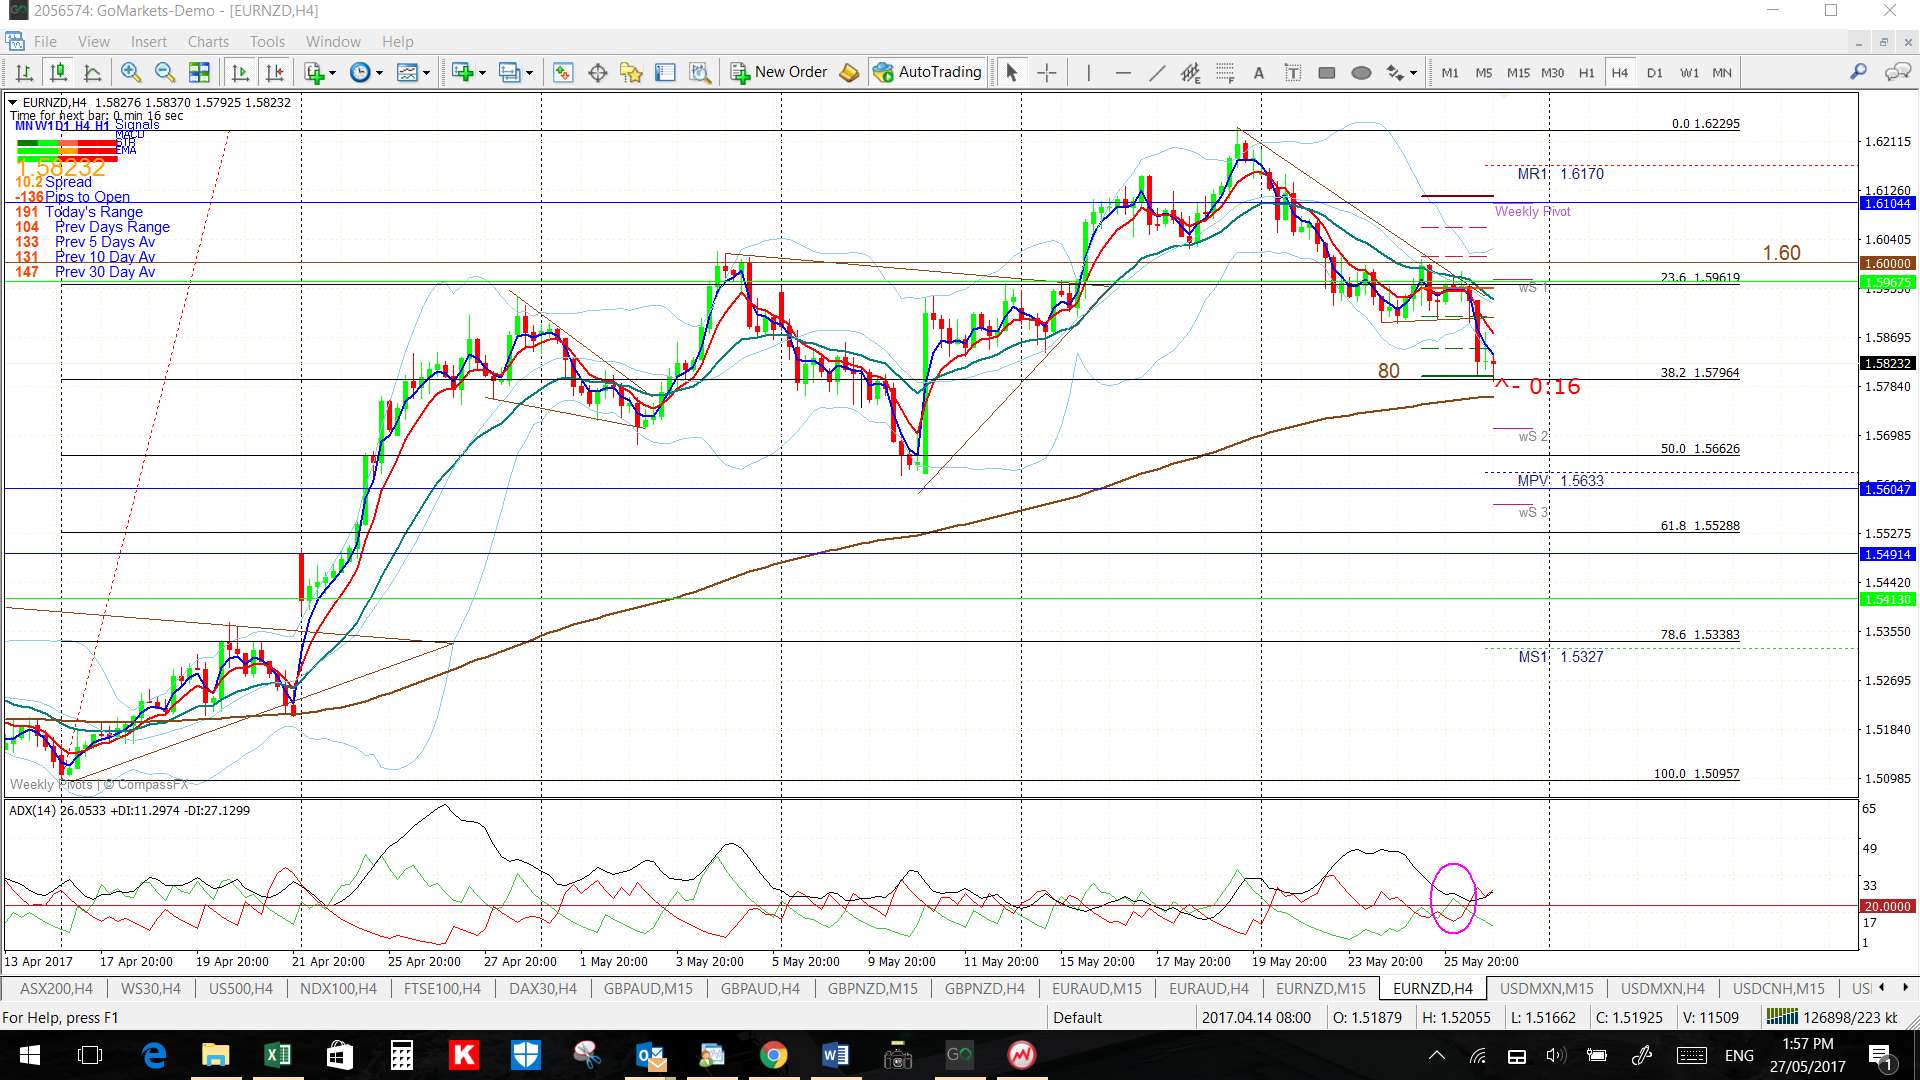
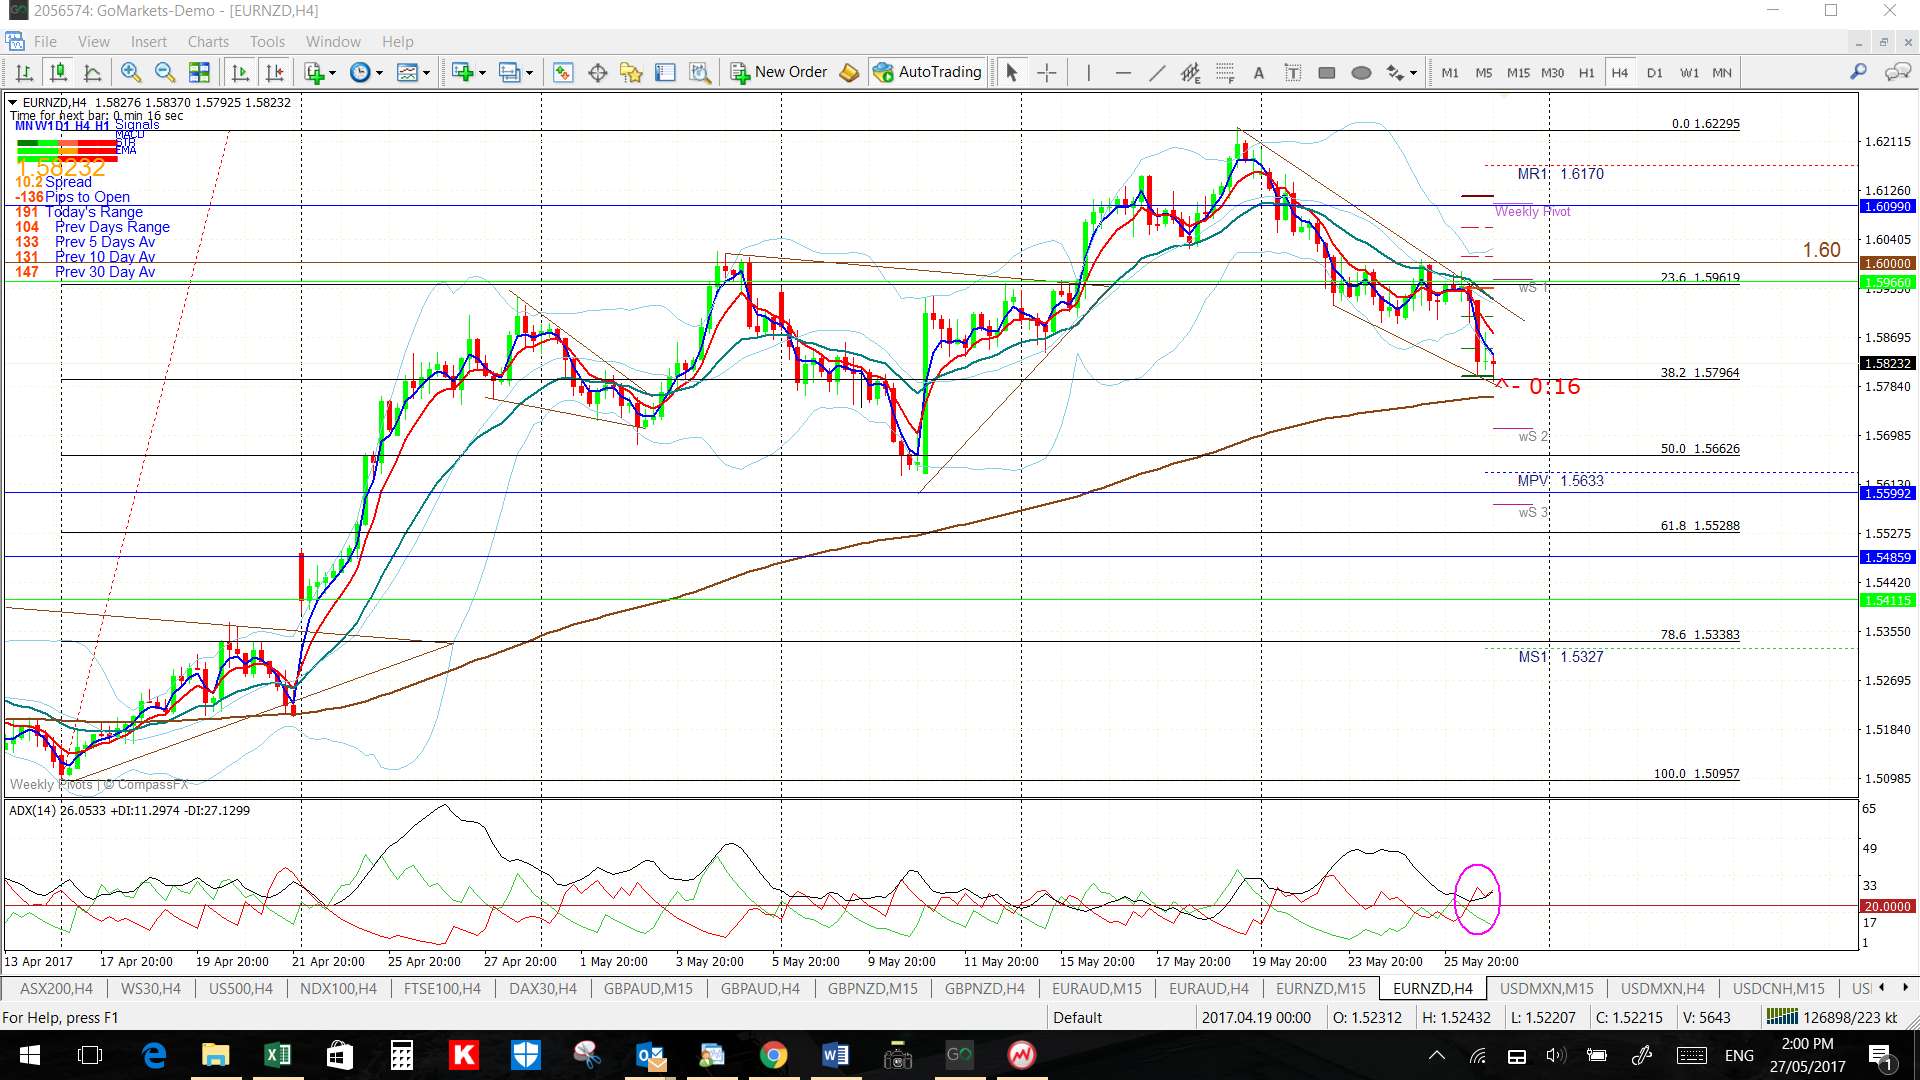
EUR/NZD: Watch the 4hr chart’s revised wedge trend lines for any new breakout move:
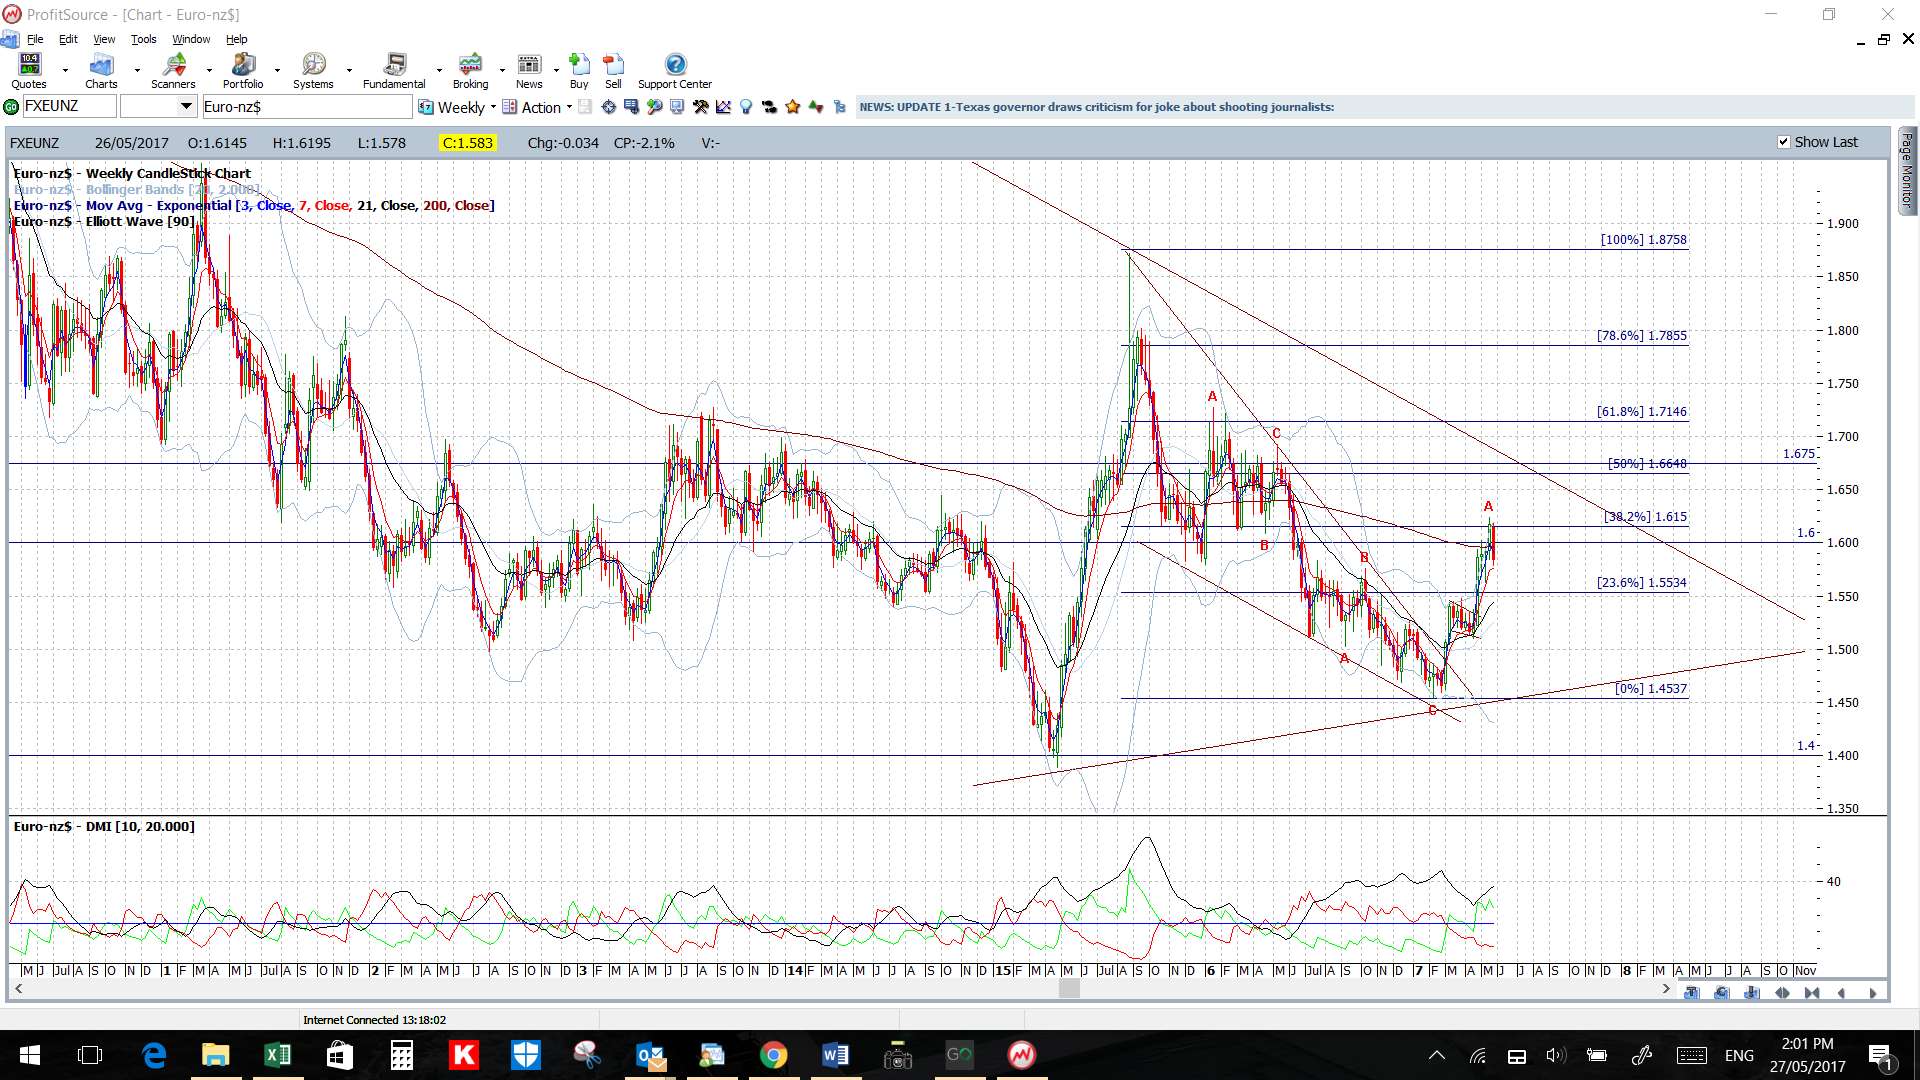
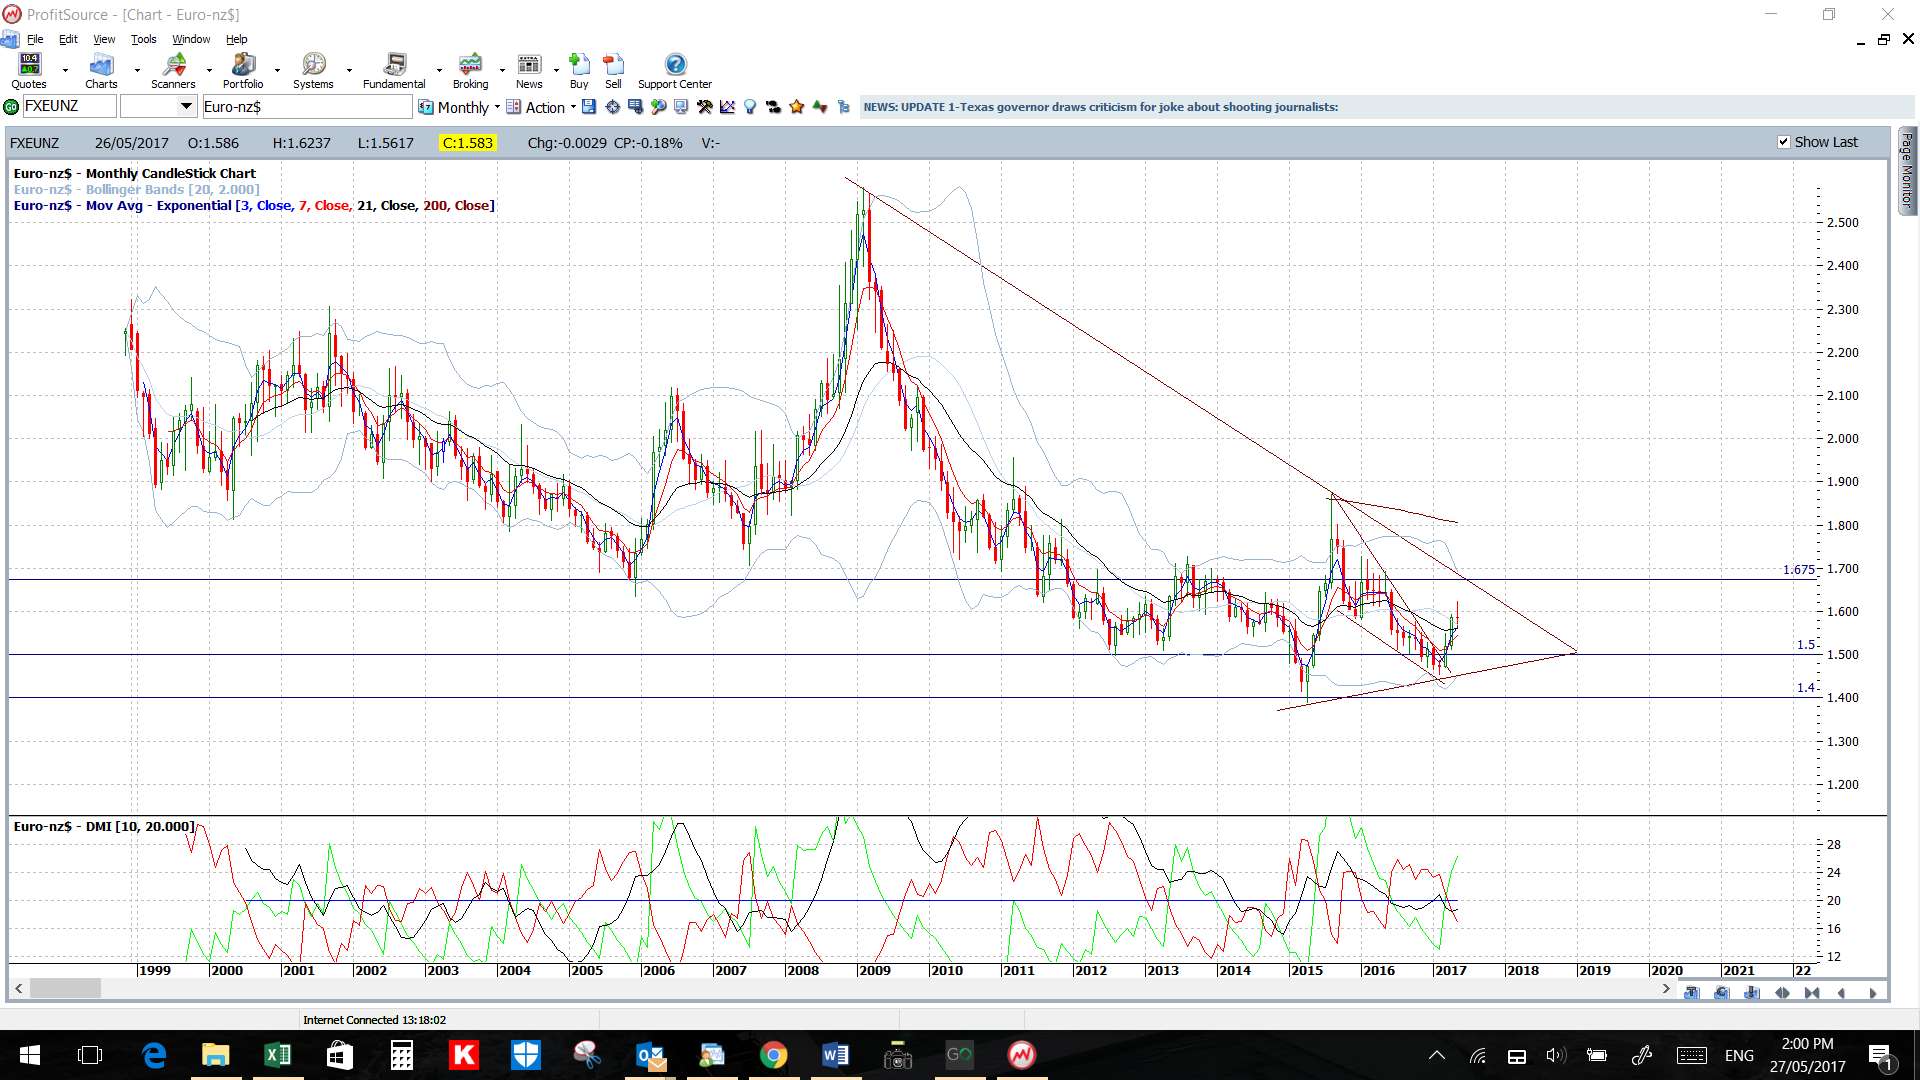
- Upper targets: The key 1.60 and then the 1.675 S/R region, which is about 900 pips above current price and, then, there is the 7-year bear trend line.
- Lower targets: any continued pullback would have me looking for a test of the 4hr chart’s 61.8% Fib near 1.55.
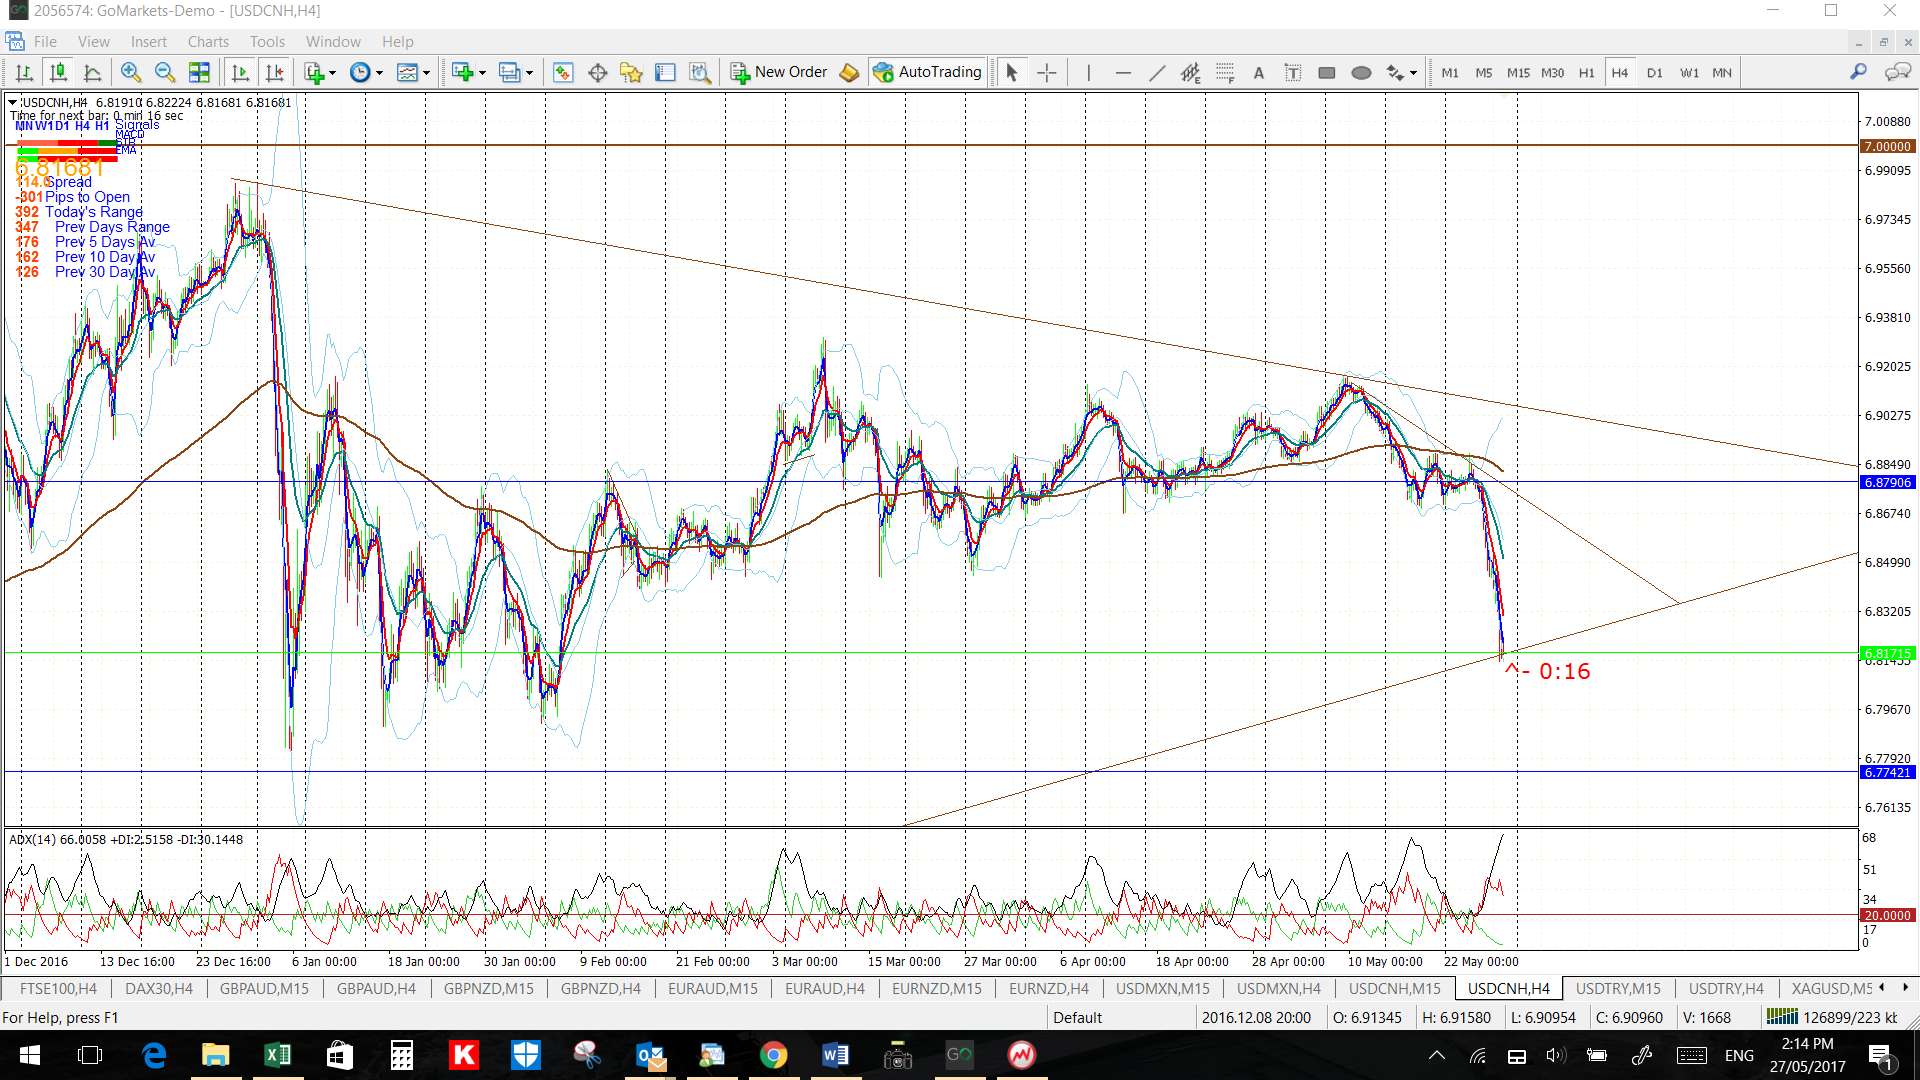
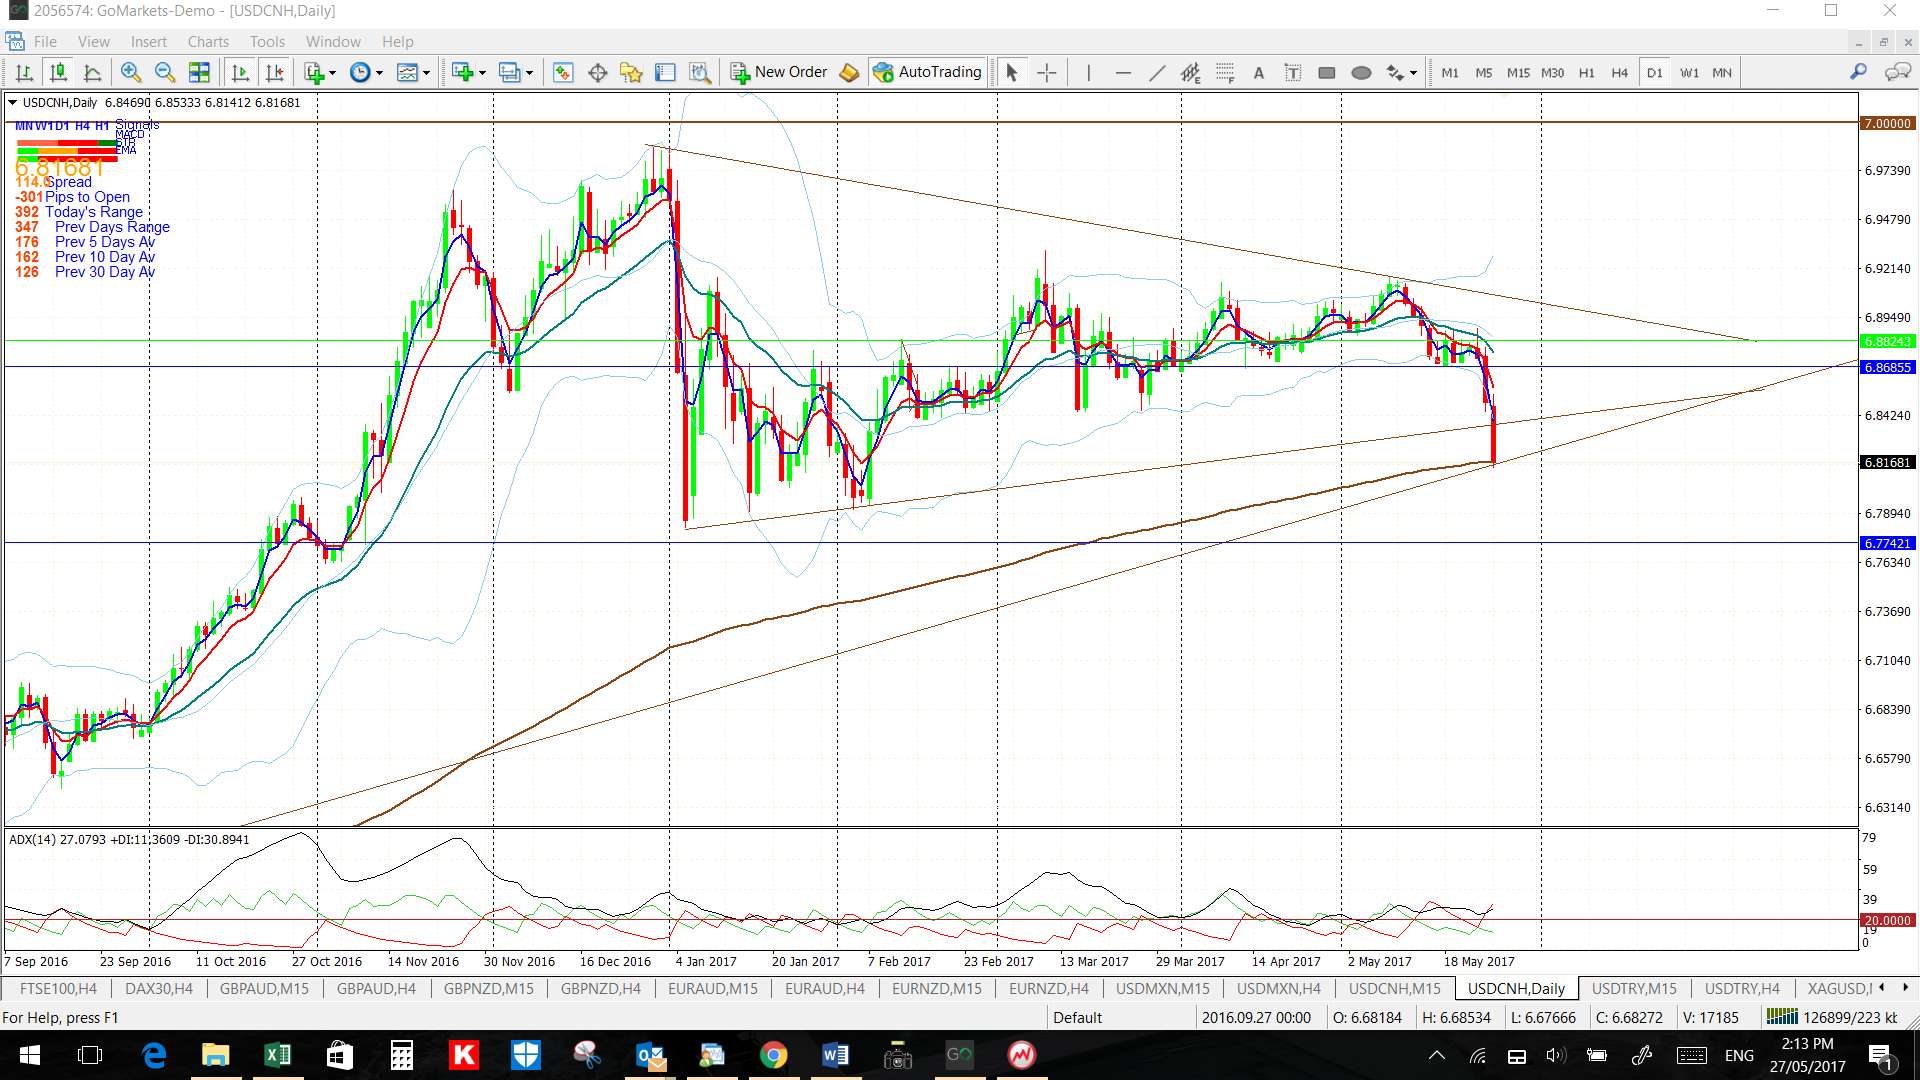
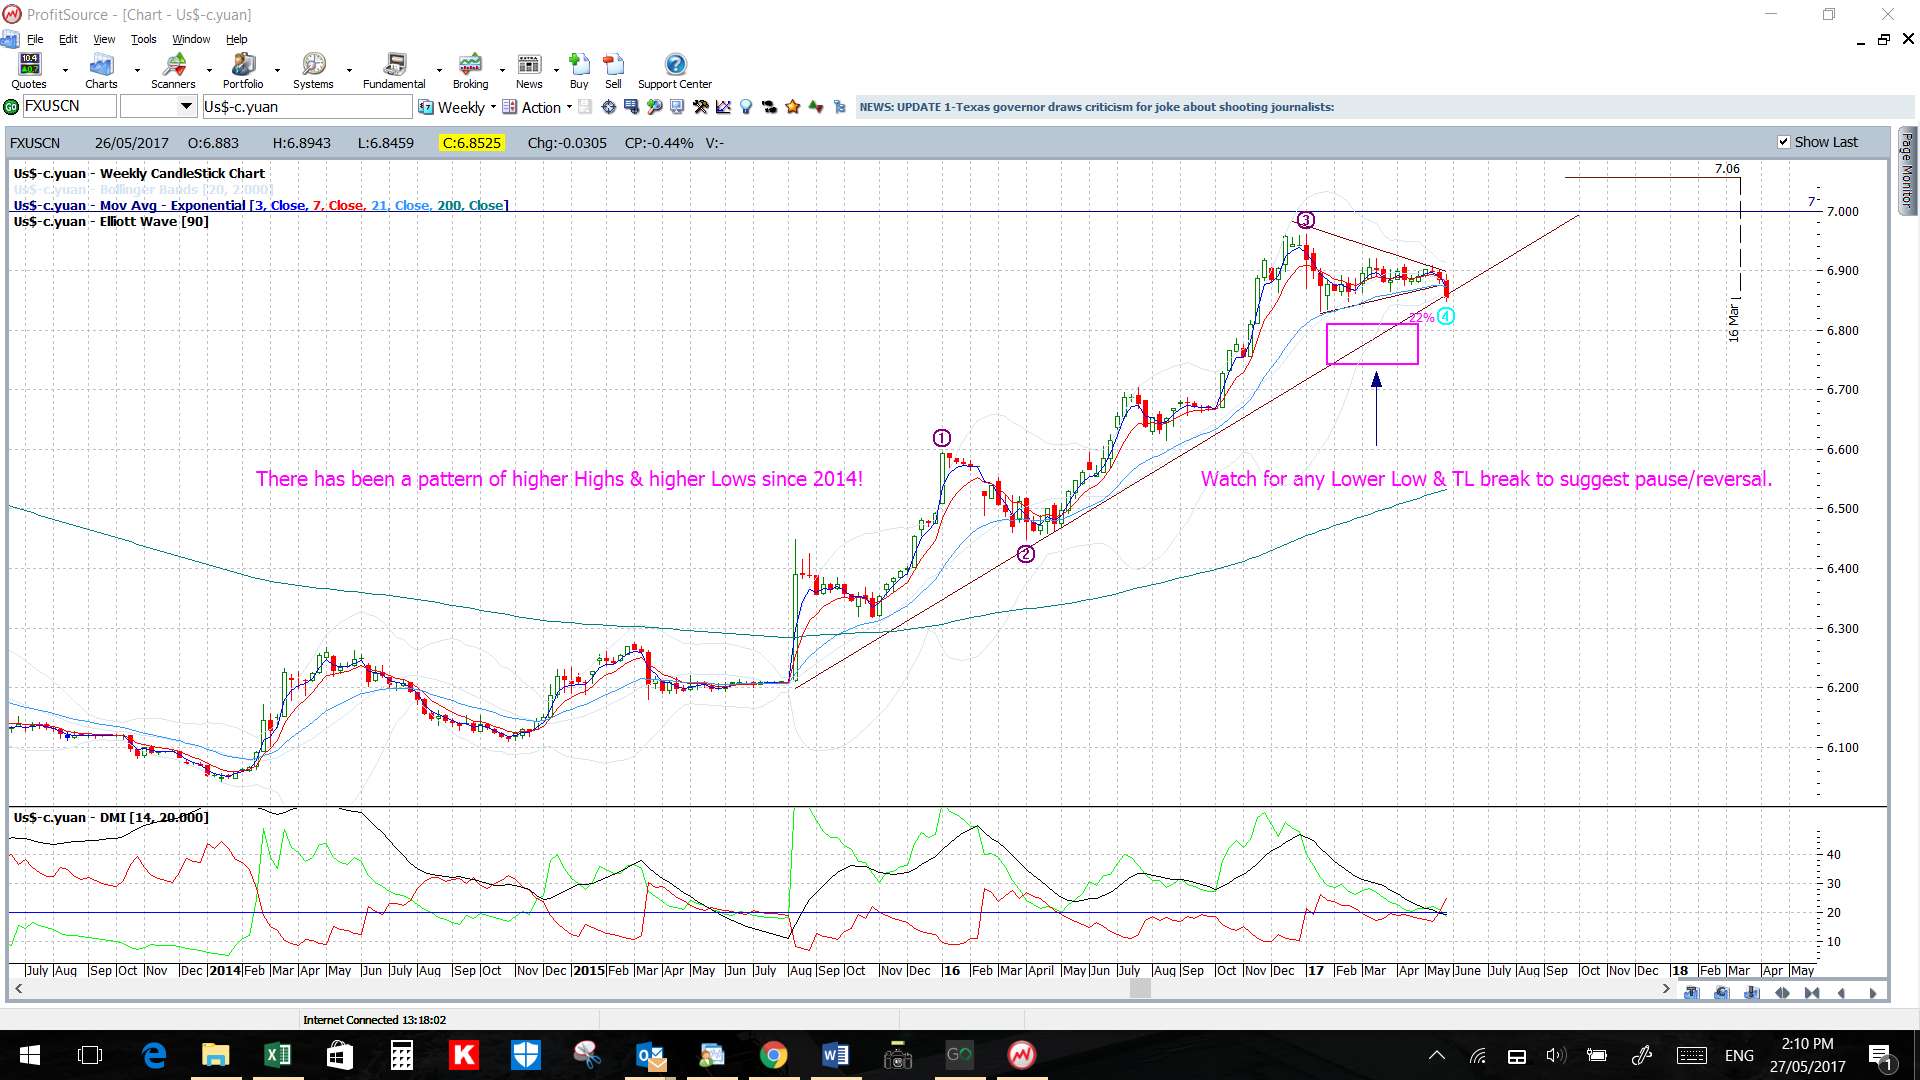
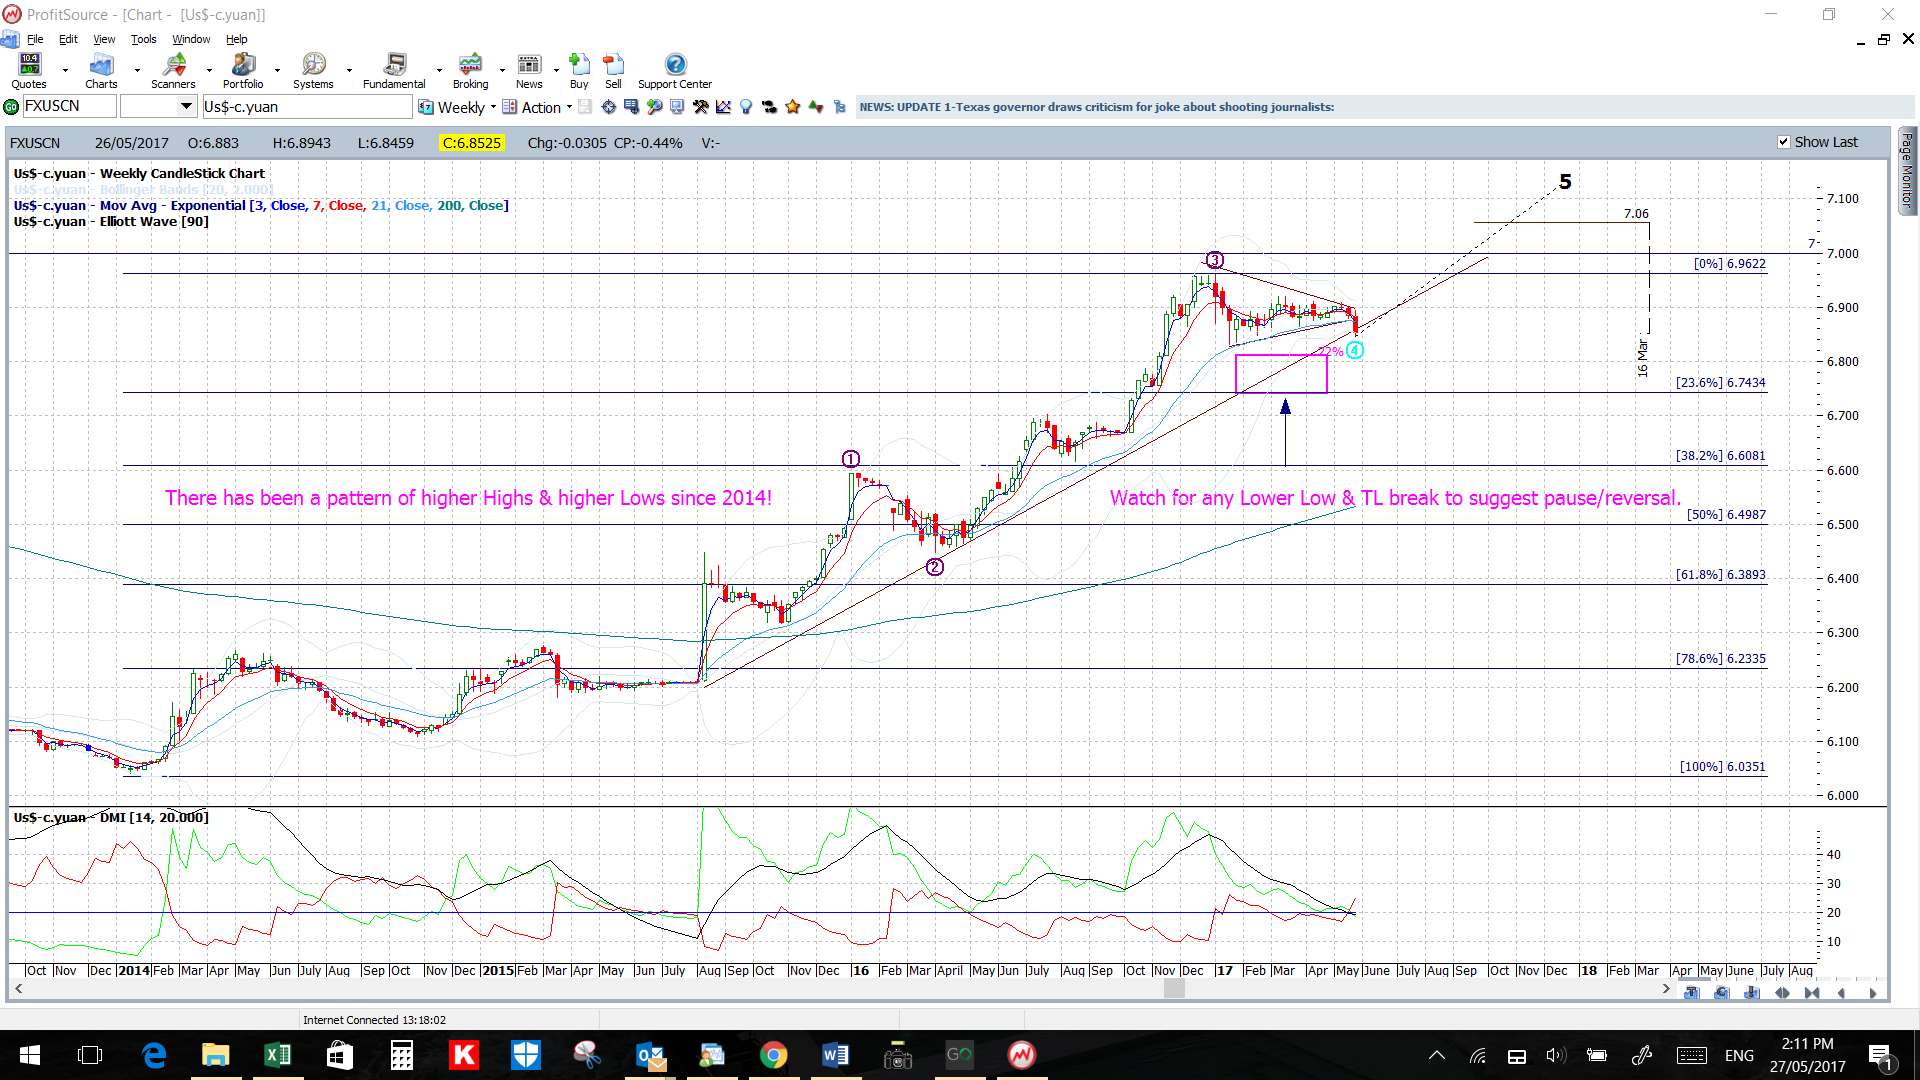
USD/CNH: Watch the daily chart’s major support trend line for any make or break as this TL has been in play for 2 years:
- Upper targets: The two 4hr chart bear triangle trend lines and then 7.0 as previous S/R.
- Lower targets: any continued pullback below the weekly chart’s bottom trend line would have me looking for a test of the weekly chart’s 50% fib near the previous S/R level of 6.50.
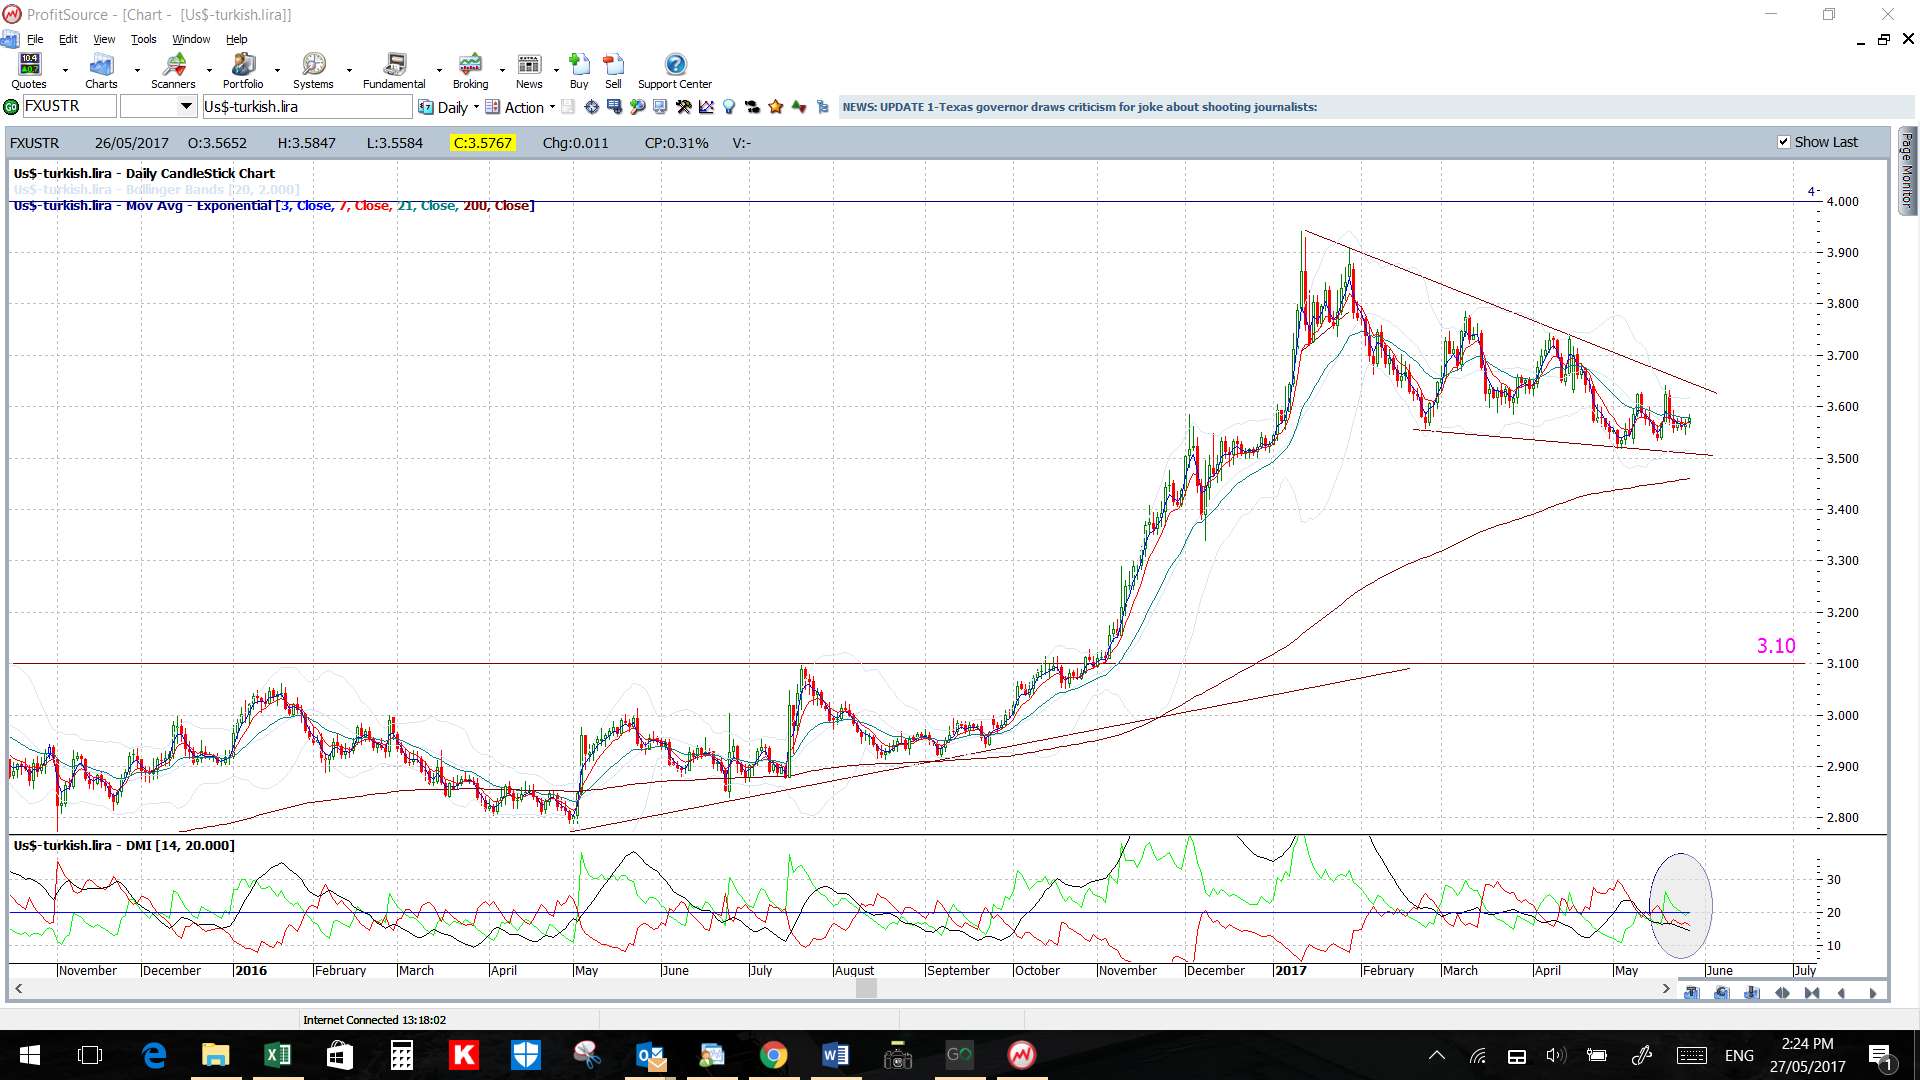
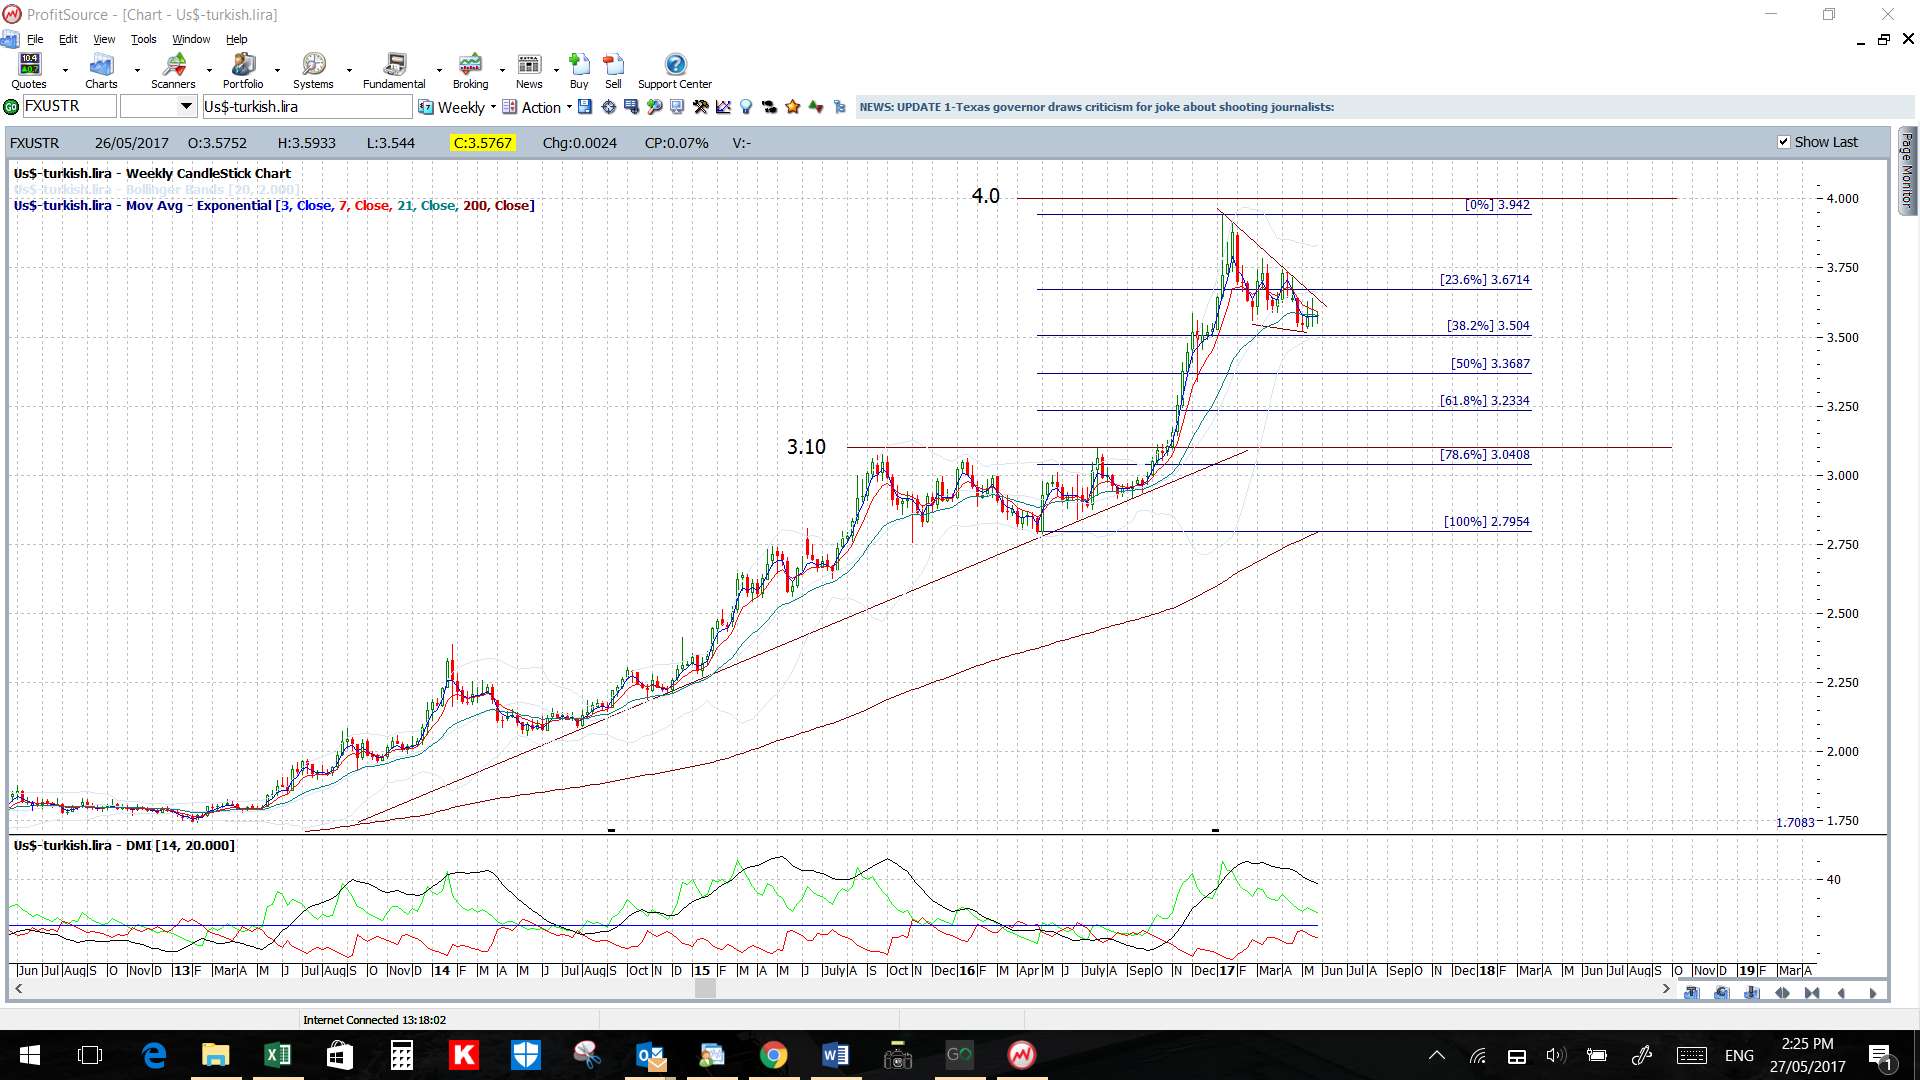
USD/TRY: Watch the 4hr chart’s triangle trend lines for any continuation of this recent bullish breakout attempt:
- Upper targets: The daily chart’s upper wedge trend line followed by the key 4 level as long-term resistance.
- Lower targets: any pullback would have me looking for a test of the daily chart’s lower wedge trend line followed by the 3.10 region as previous S/R.
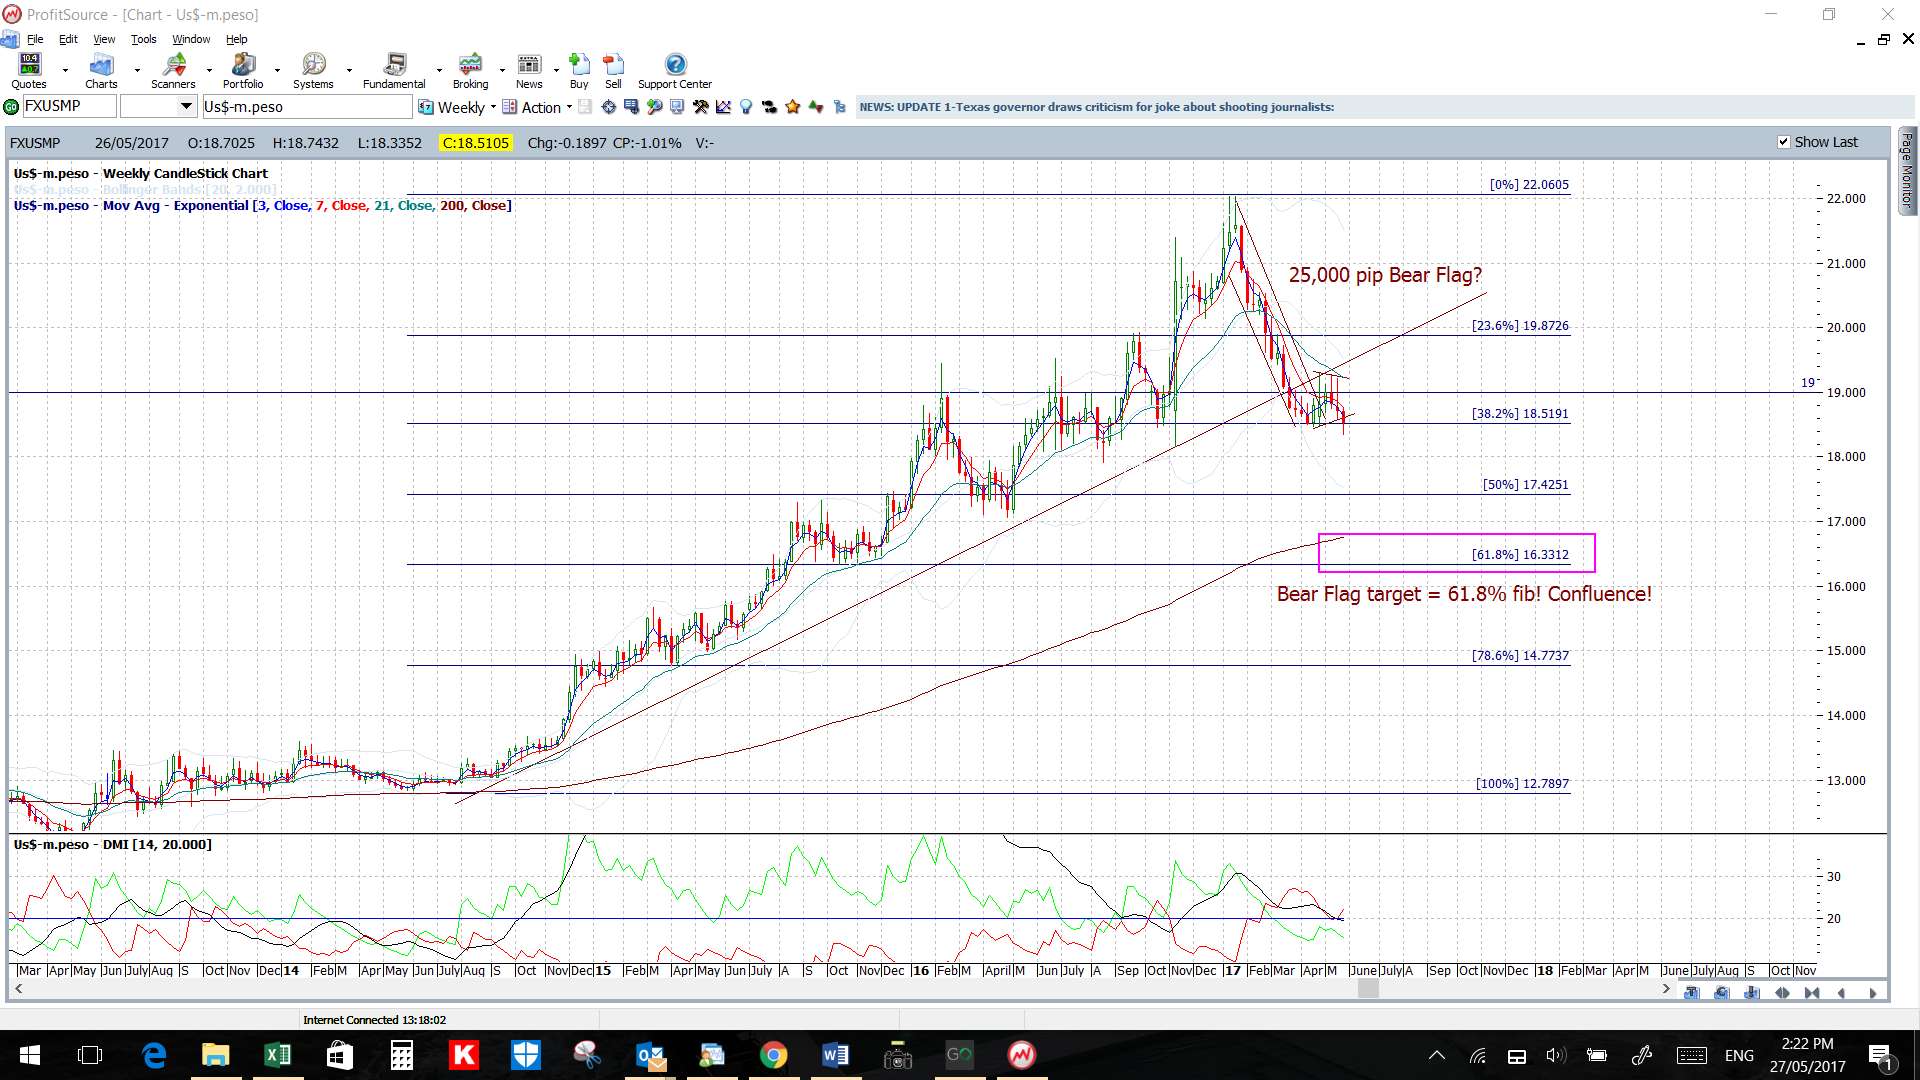
USD/MXN: The break of the weekly support Flag trend line represents the start of a potential 25,000+ pip Bear Flag move. Watch for any test of the broken trend line before continuation though:
- Upper targets: 19
- Lower targets: the weekly chart’s 61.8% fib near previous S/R of 16.
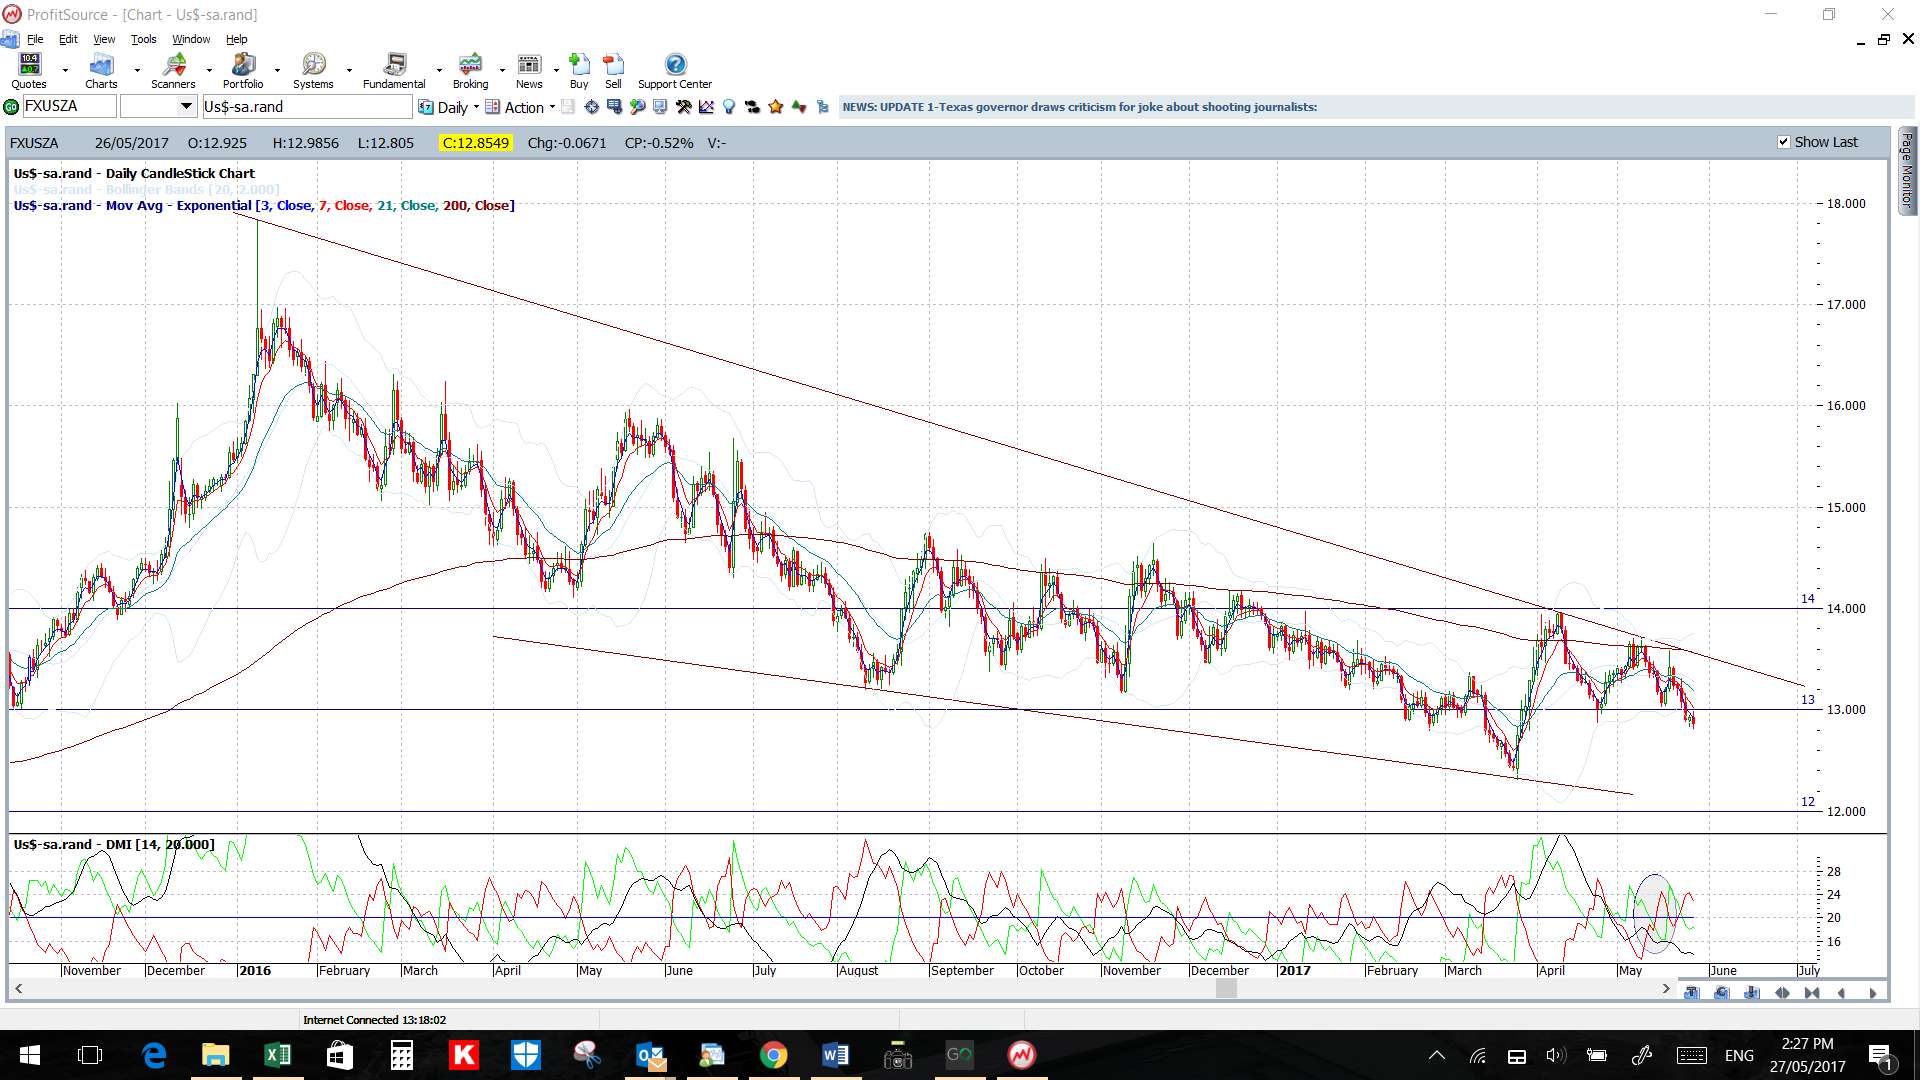
USD/ZAR: Watch the 4hr chart’s revised wedge trend lines for any new breakout:
- Upper targets: the daily chart’s upper triangle trend line.
- Lower targets:the daily chart’s lower triangle trend line.

Commodities:
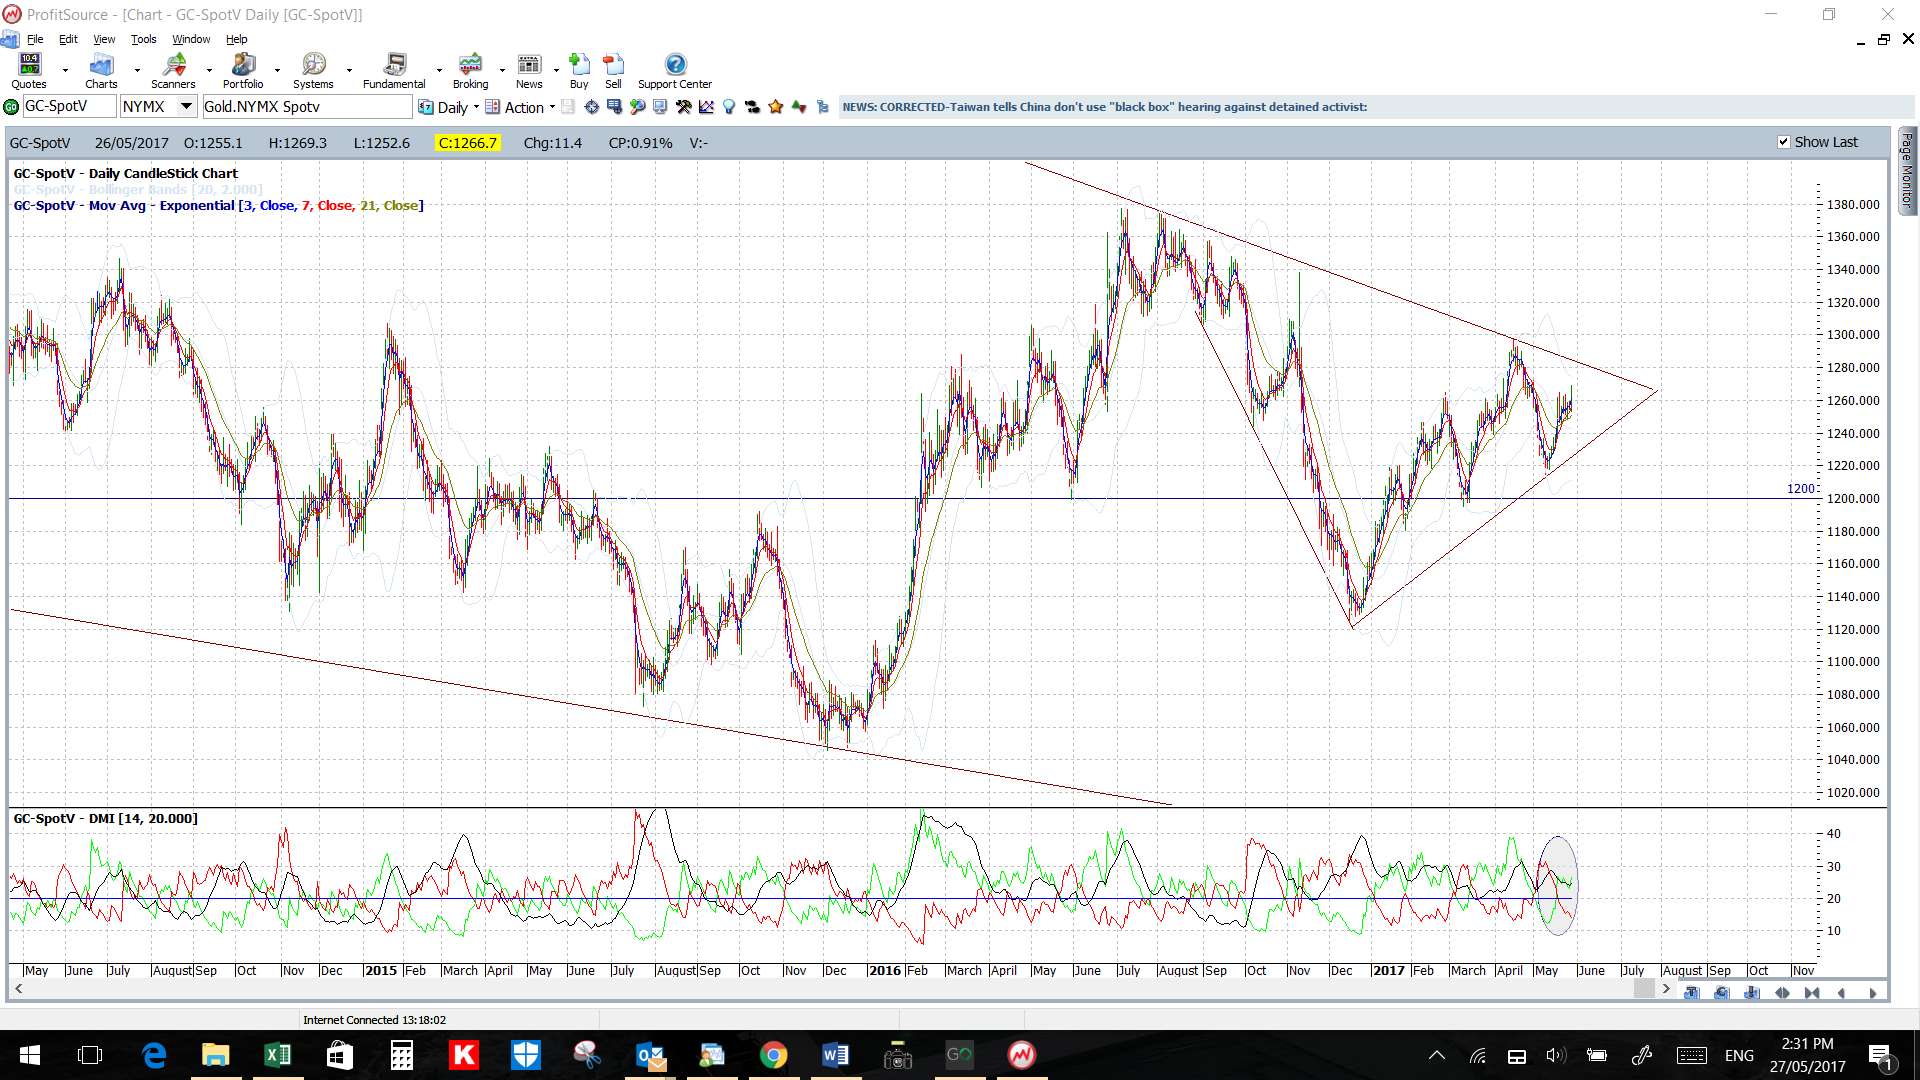
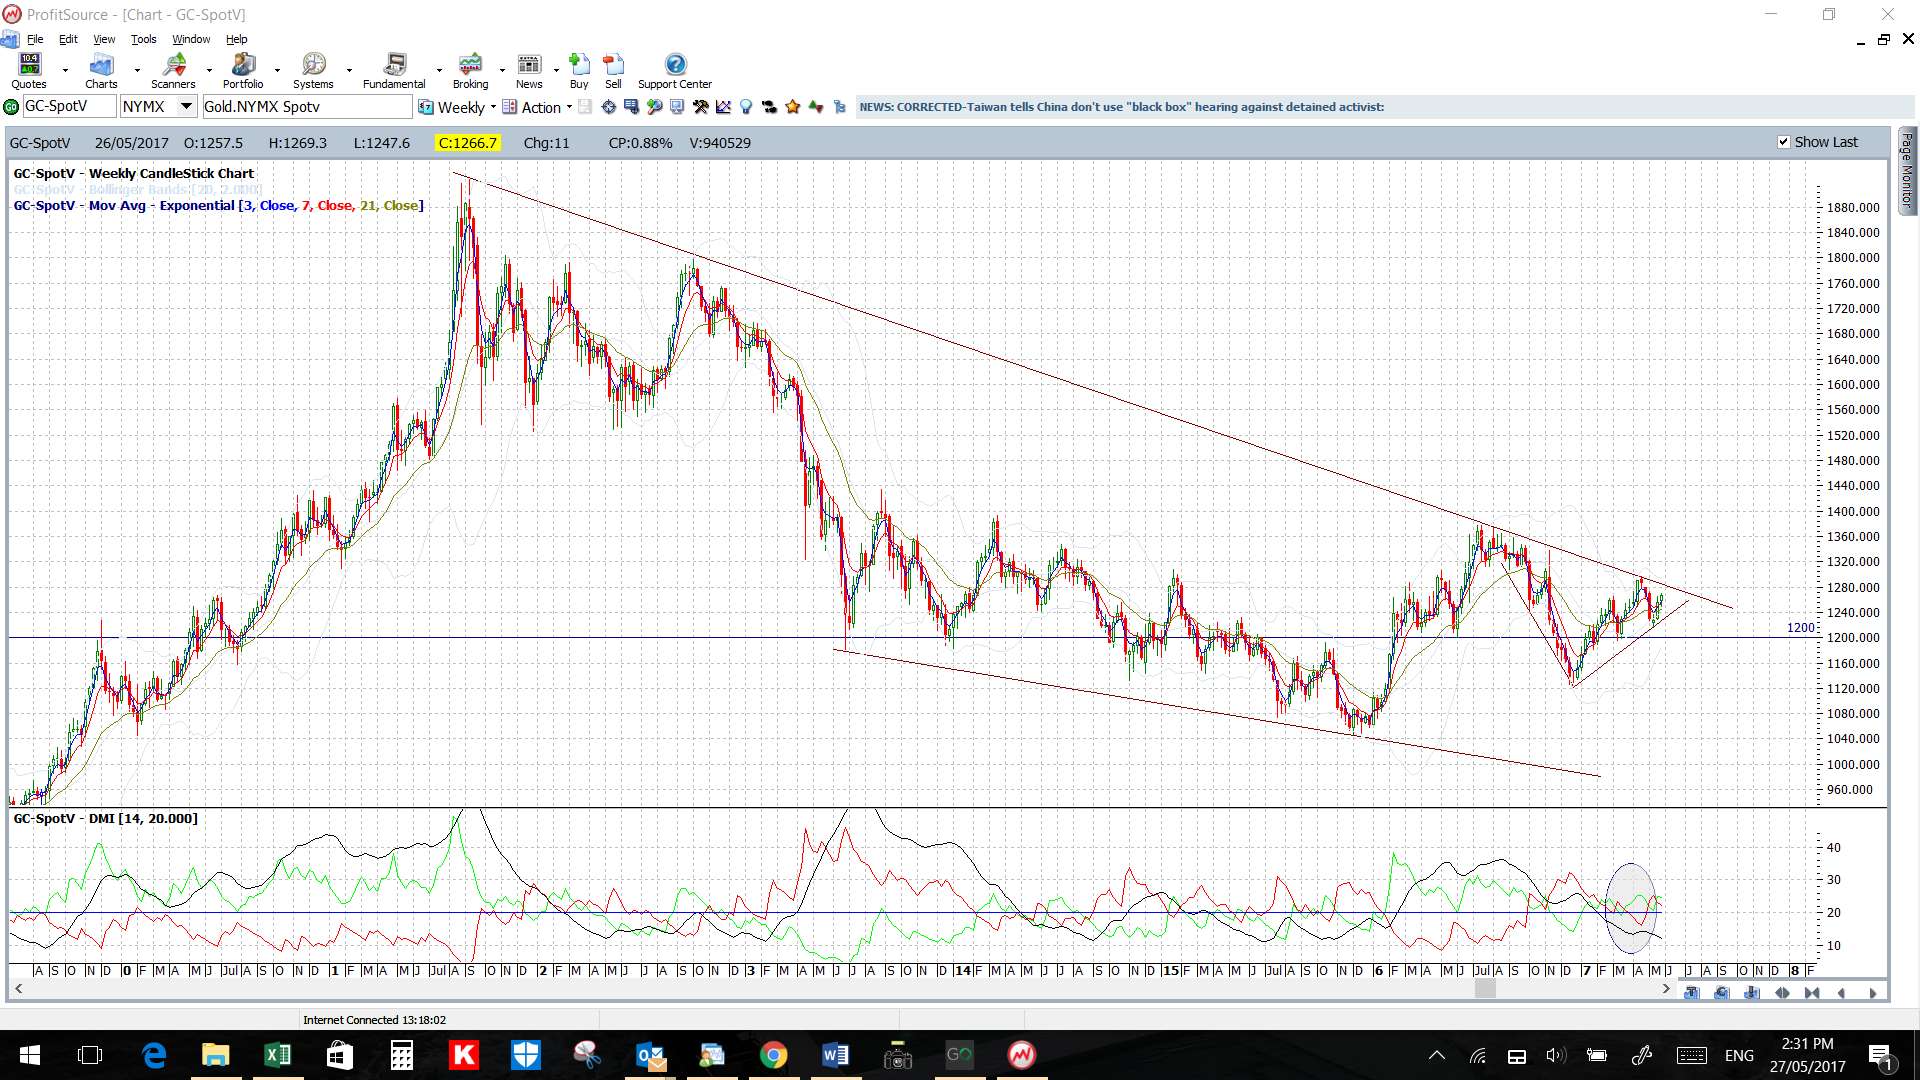
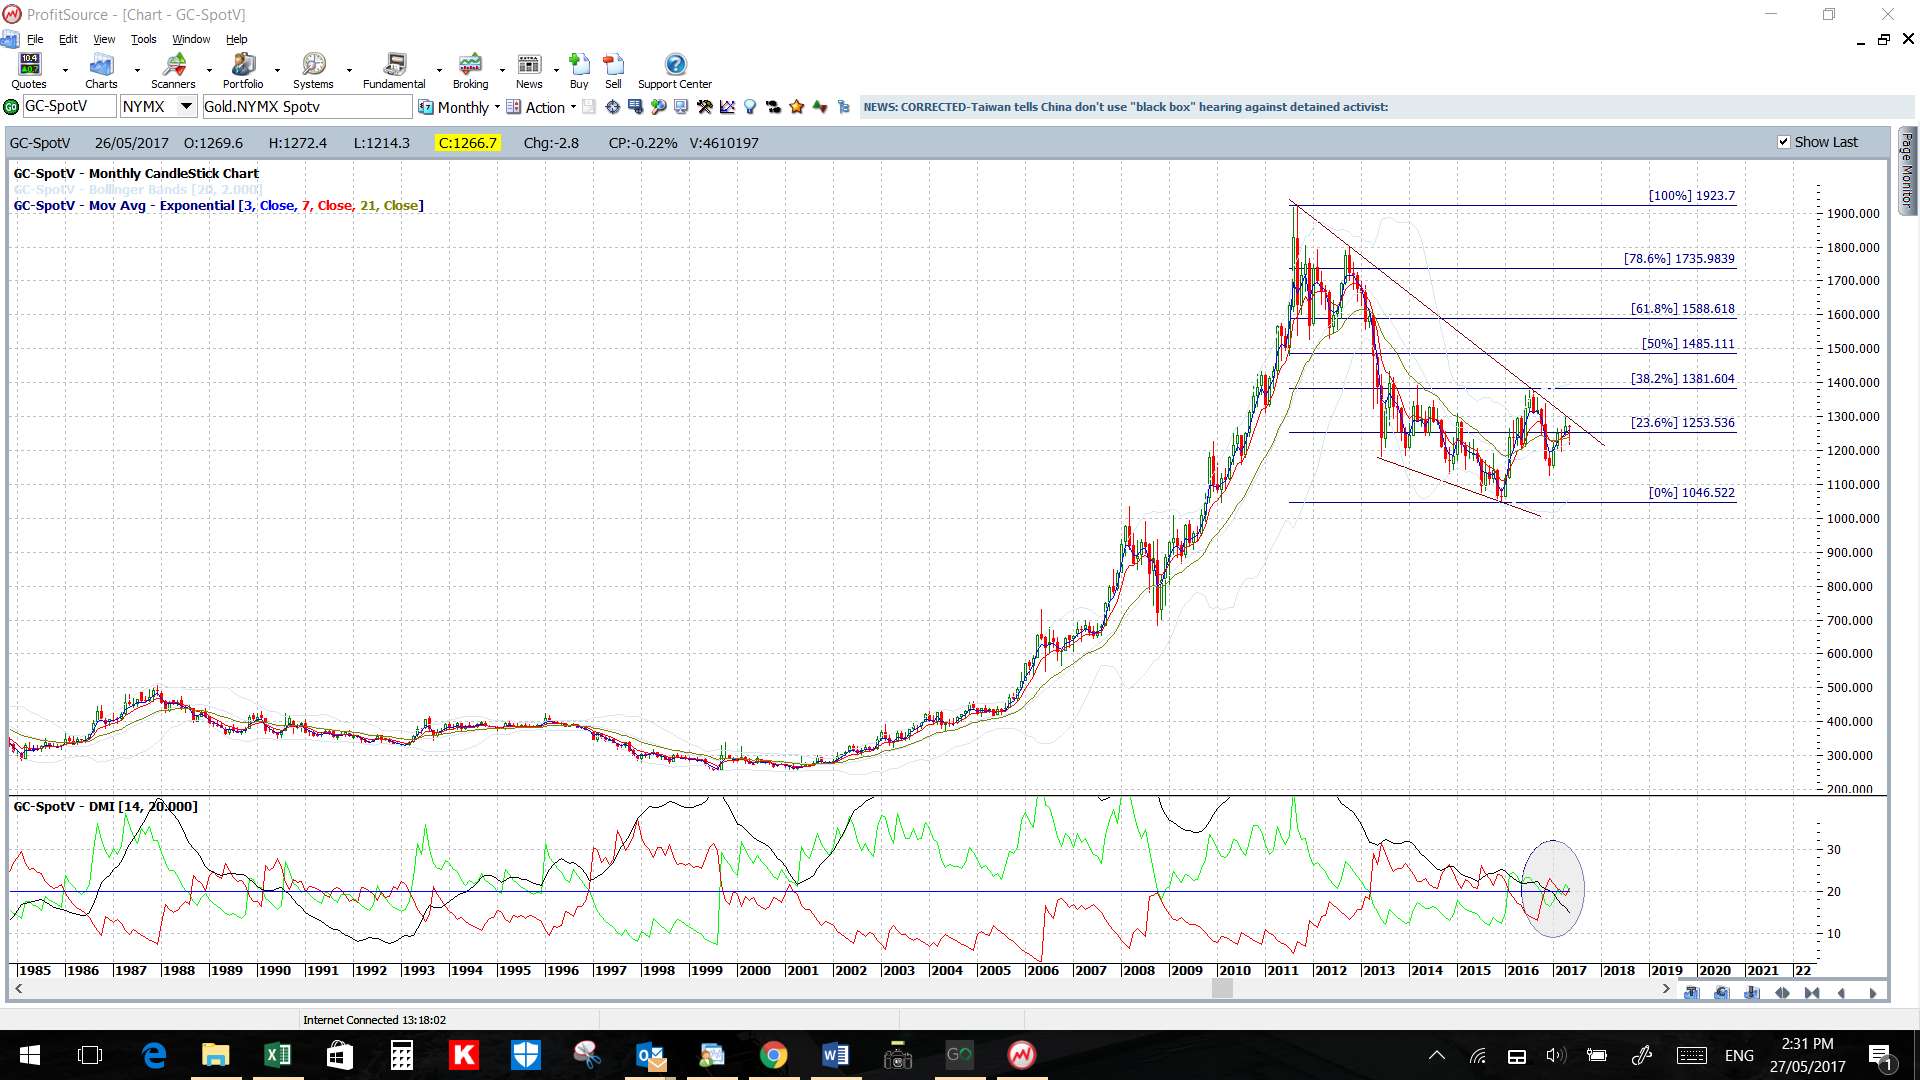
Gold: Watch the 4hr chart for any continuation of this bullish breakout move:
- Upper targets: the $1,280 region which is near the major 6-year bear trend line.
- Lower targets: any pullback would have me looking for a test of the $1,265 then $1,250 regions followed by the 4hr chart’s fib levels.

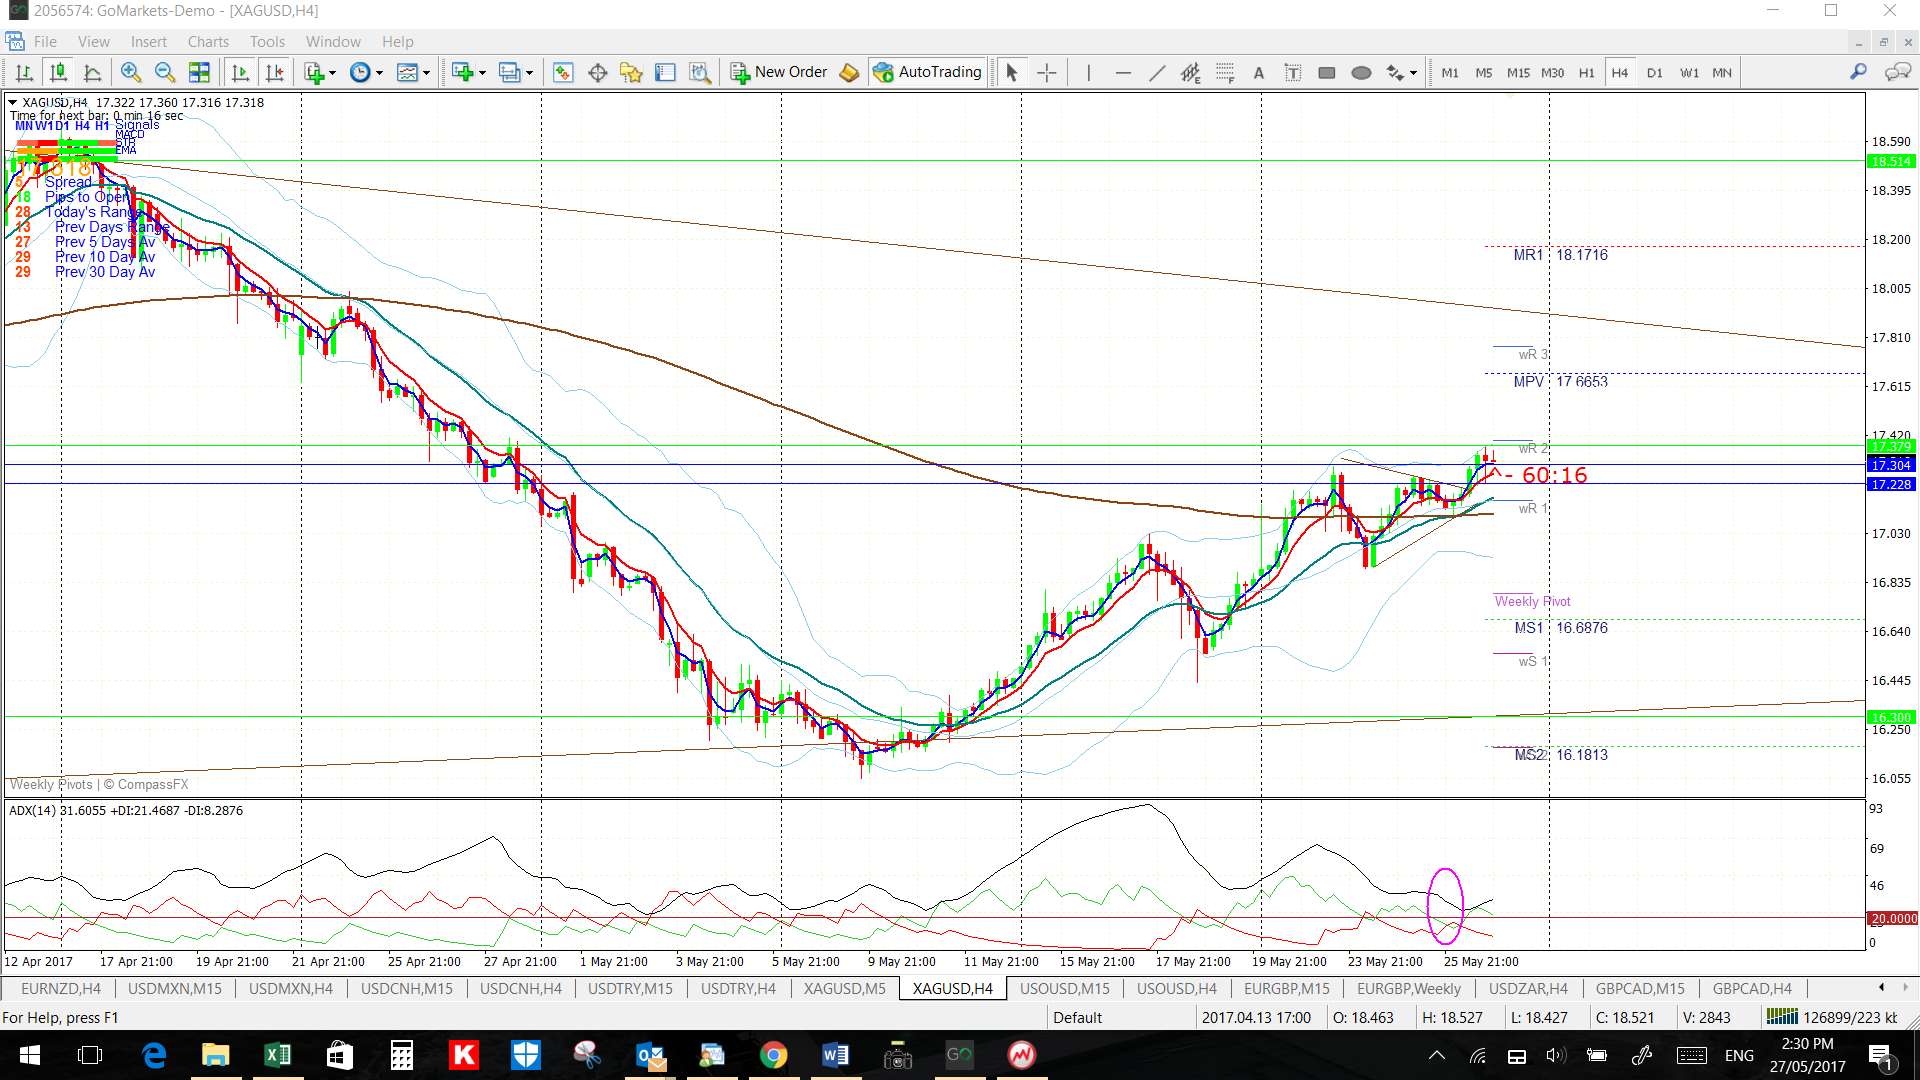
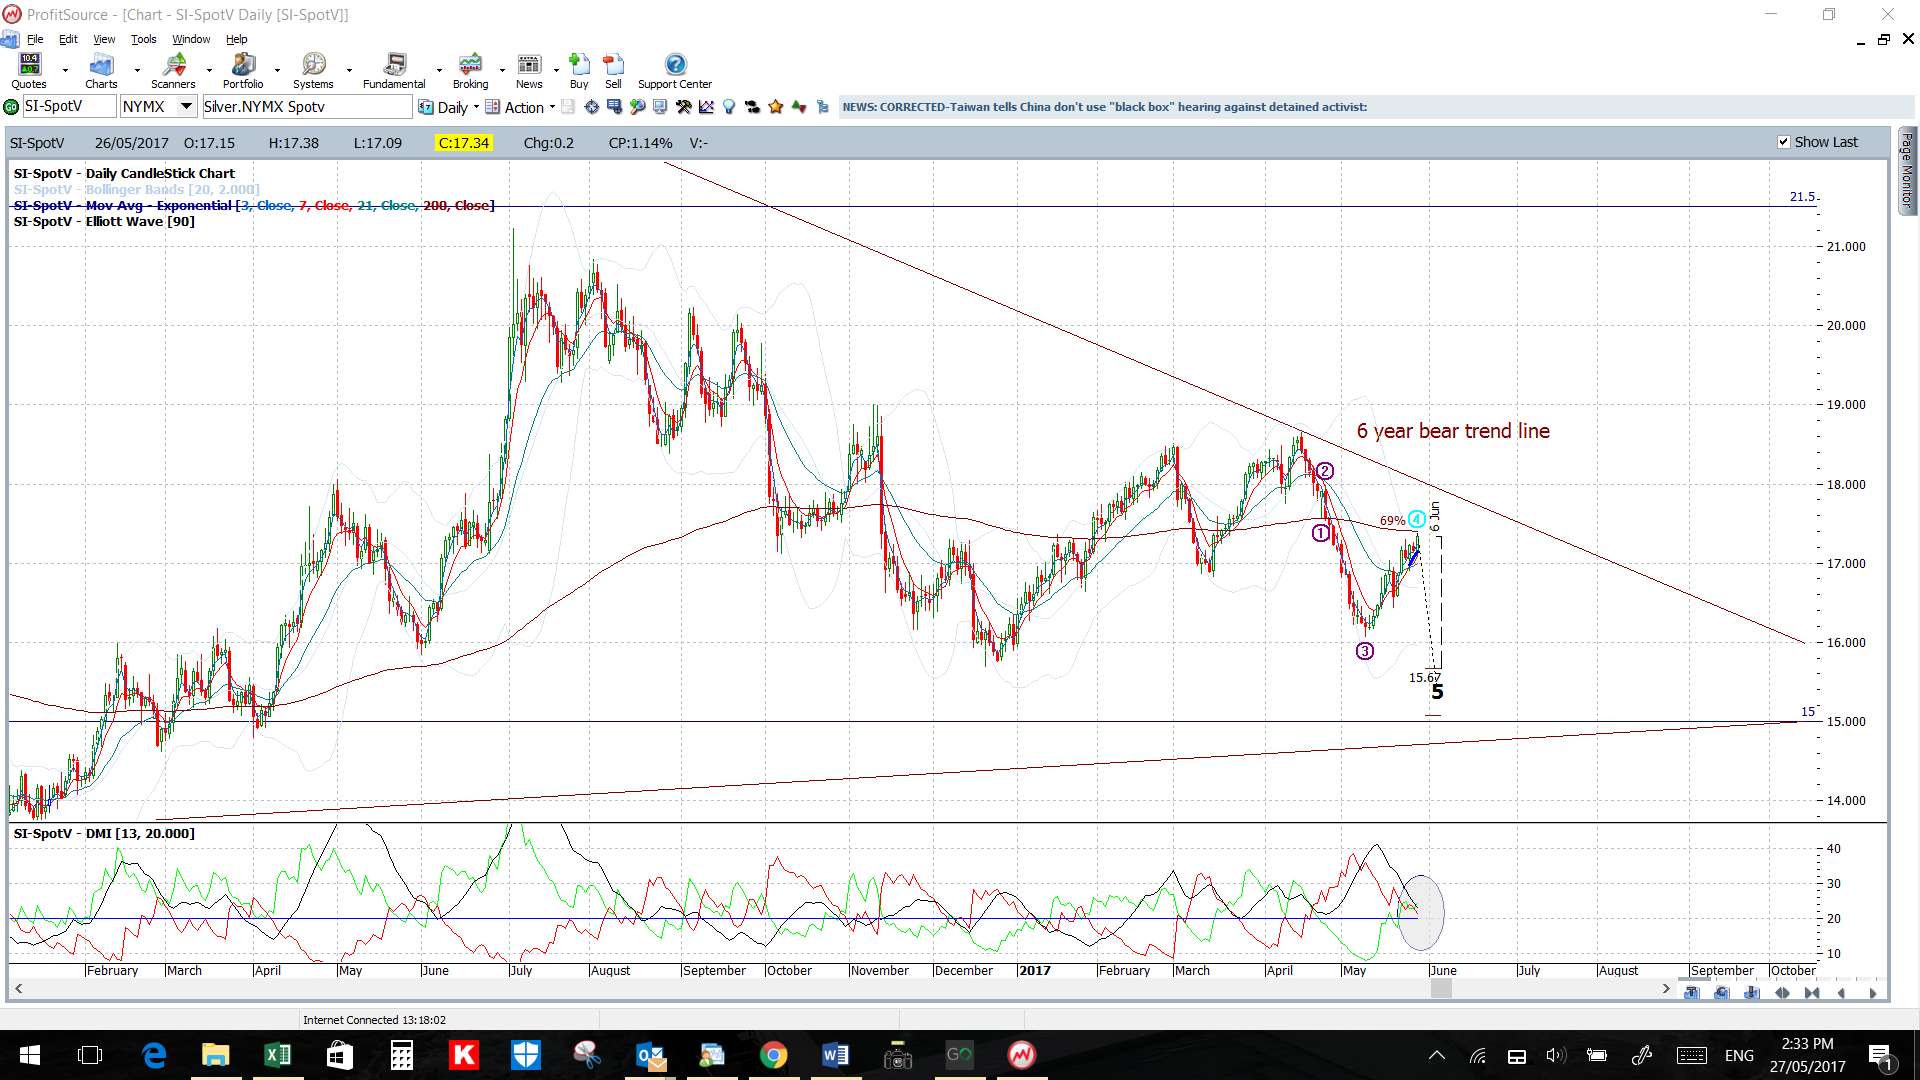
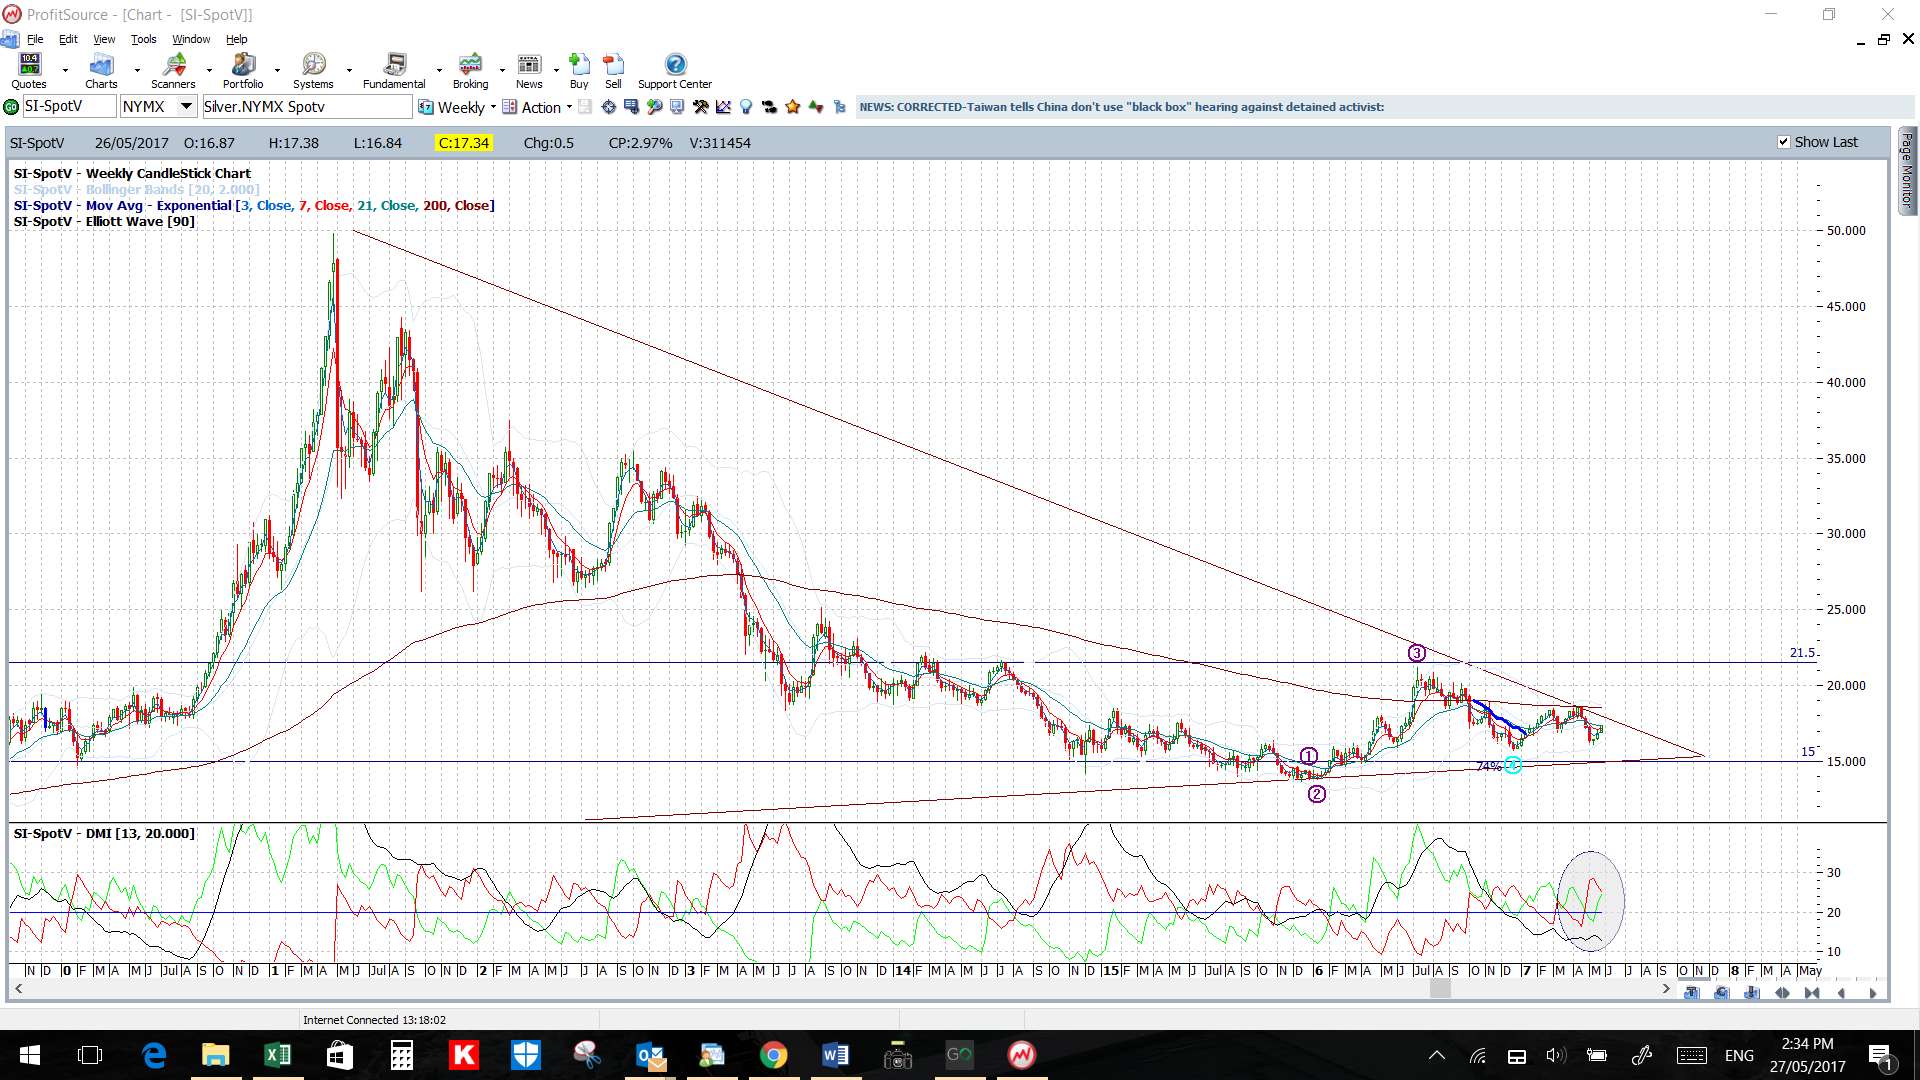
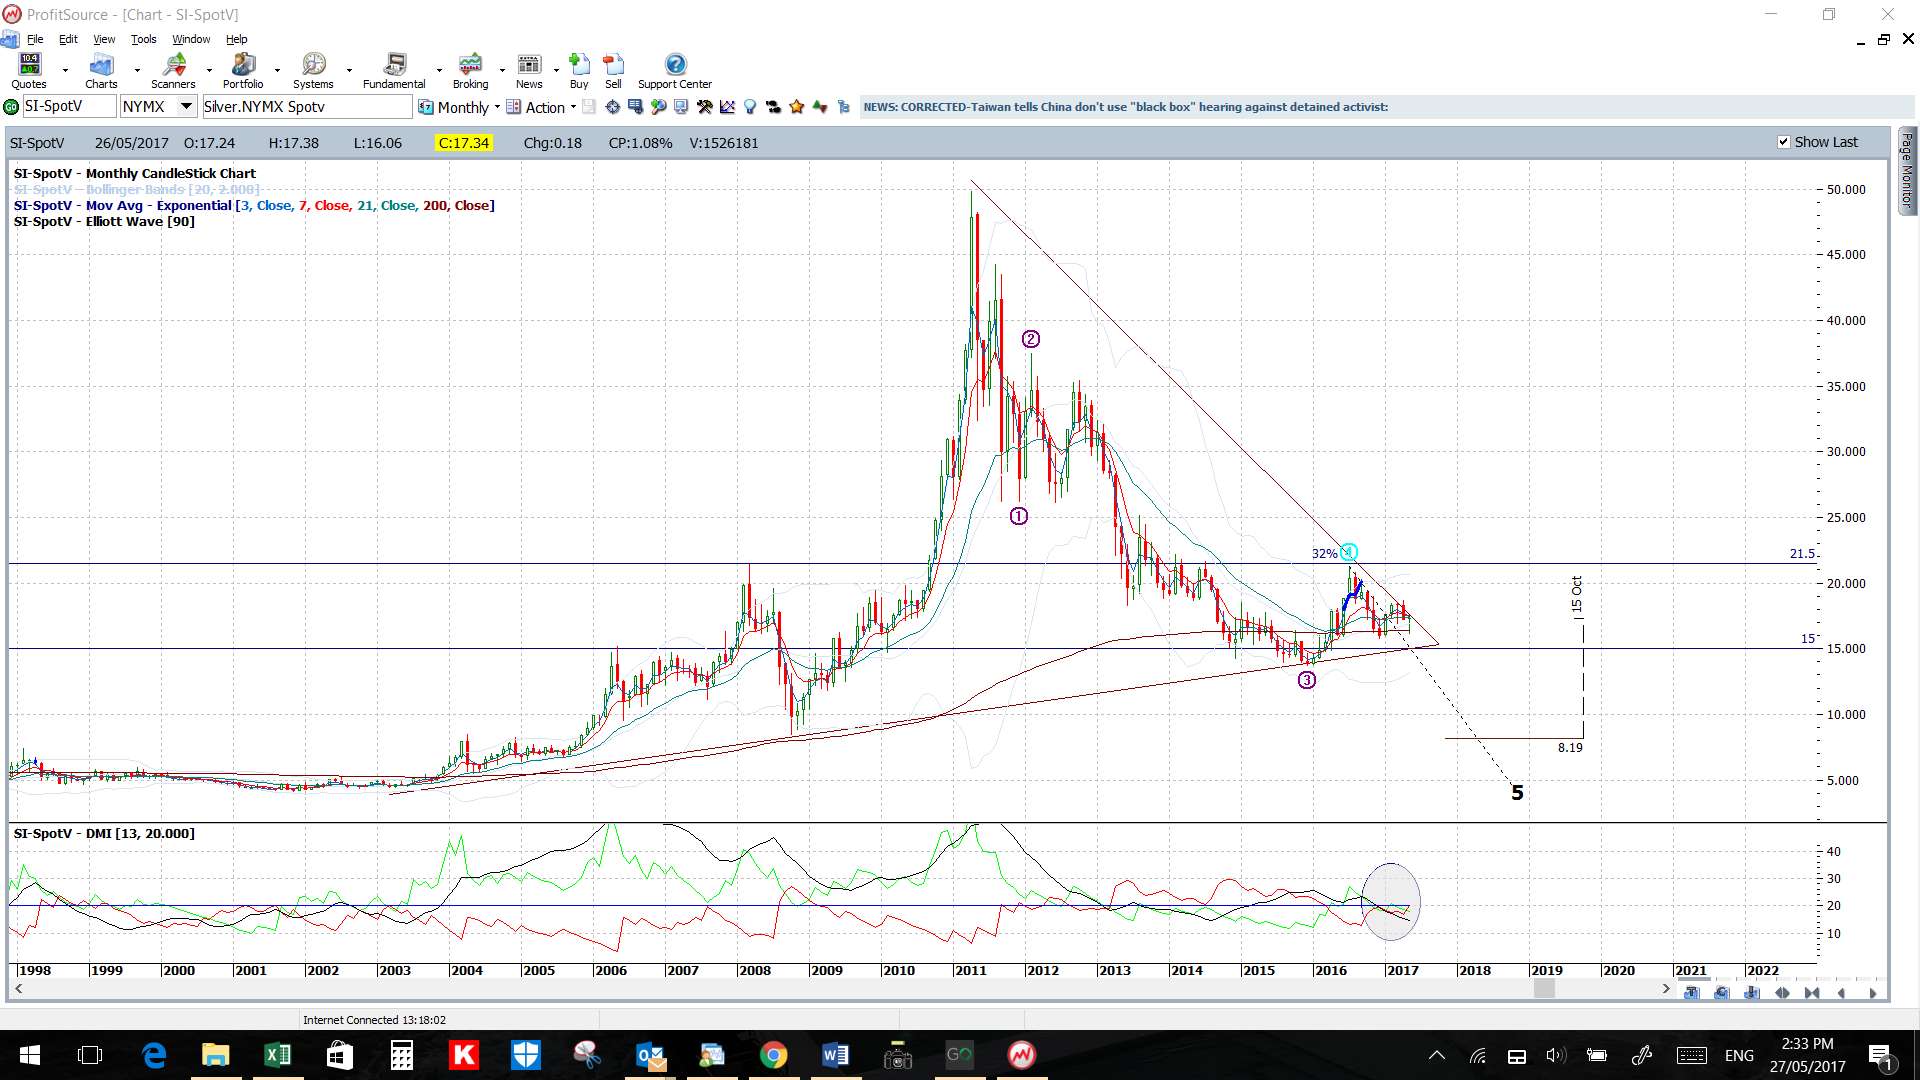
Silver: Watch the 4hr chart for any continued breakout move up to the long term bear trend line (100 pips away):
- Upper targets: the daily/weekly/monthly chart’s upper triangle trend line (100 pips away).
- Lower targets: the daily chart’s bottom triangle trend line.
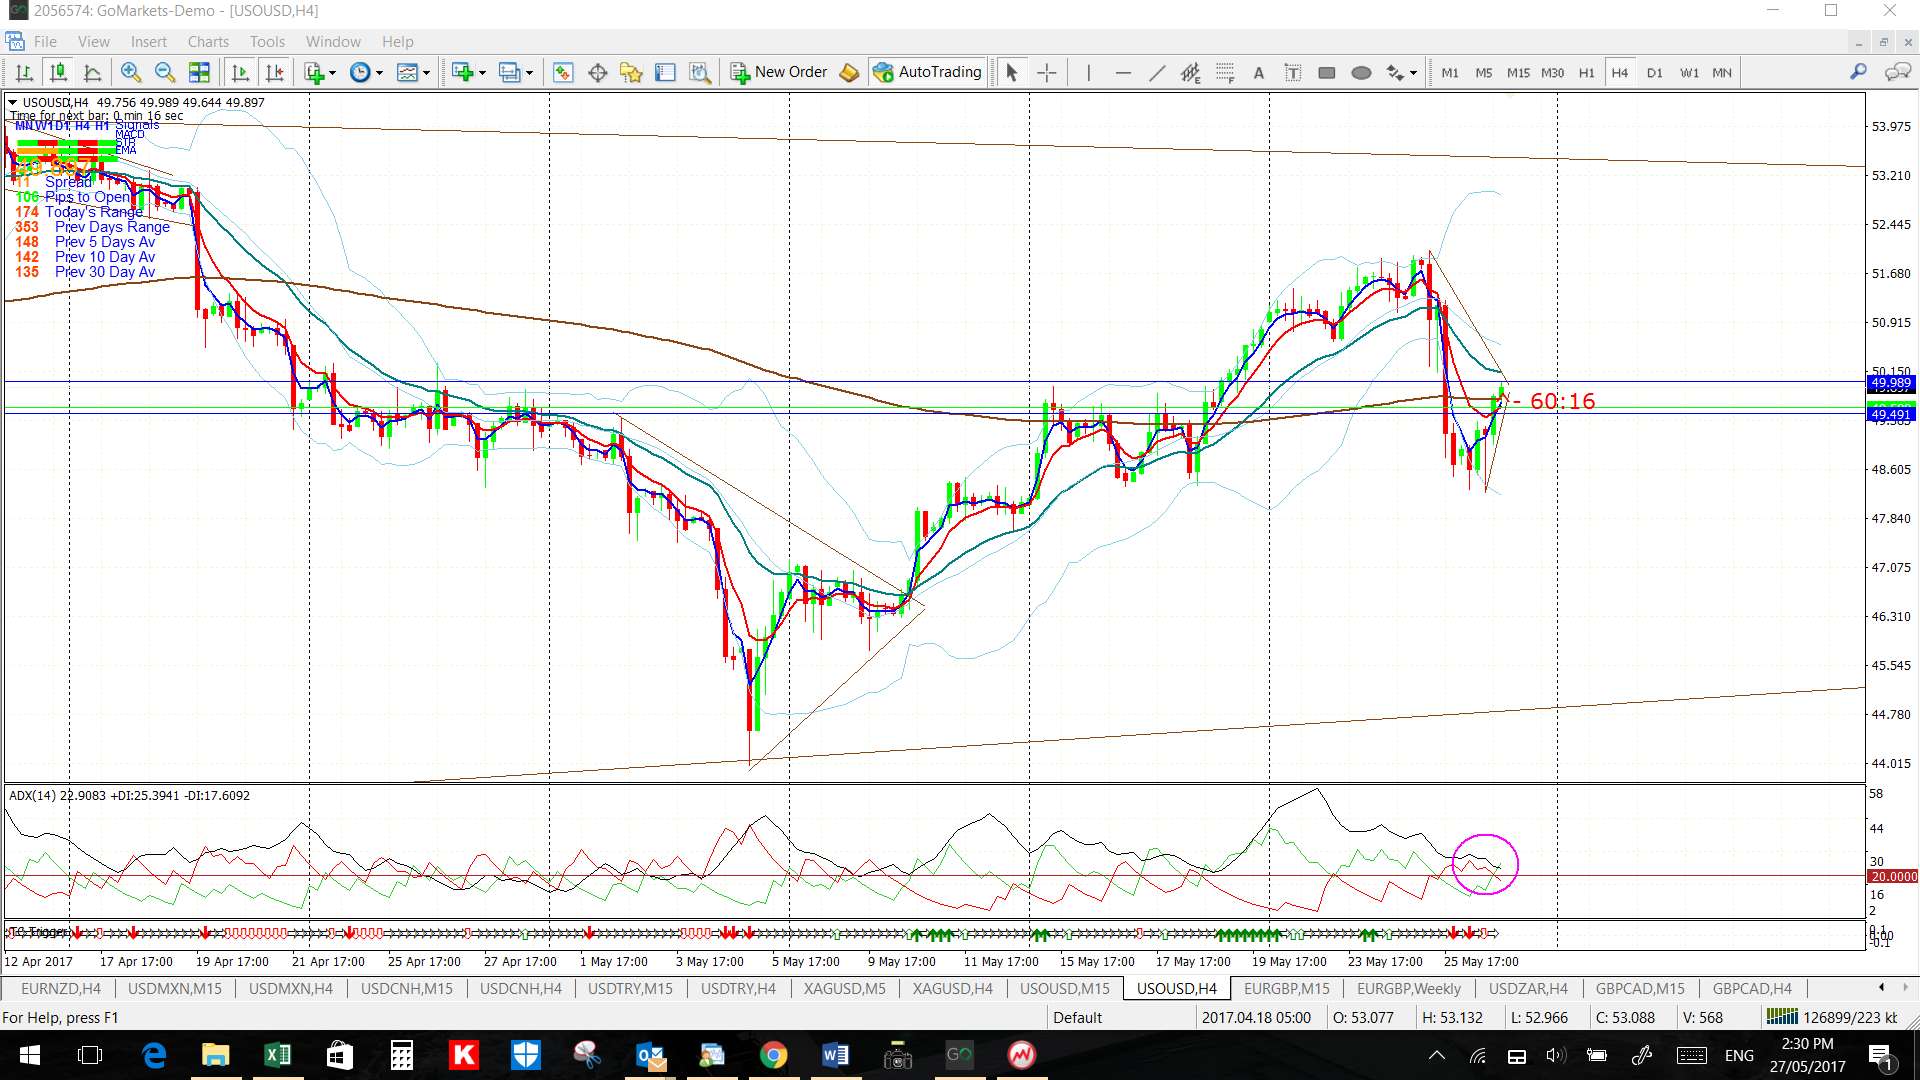
Oil: Oil moved higher for three weeks but took a bit of a breather at the end of last week as it edged closer to a major S/R region. Trends do not travel in straight lines forever! Watch the 4hr chart’s revised triangle trend lines this week for any new breakout move; up or down! The 61.8% Fib is the line in the sand for me; a break below that would be bearish, IMHO that is:
- Upper targets: the daily/weekly/monthly chart’s upper trend line (350 pips away).
- Lower targets: the daily/weekly chart’s bottom triangle trend line.
Note: There is 2-year bear trend line above current price and this also forms the monthly chart’s ‘Neck Line’ for a potential ‘Inverse H&S’ pattern. This pattern has a height of approximately $30 or 3,000 pips and this puts the target for any breakout move up near the $85 level which ties in with the 50% Fibonacci of the 2008-2016 swing low move.