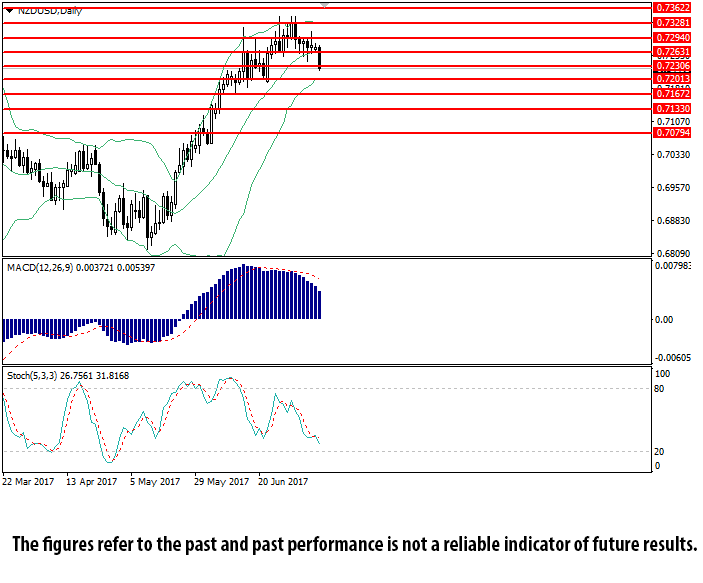
Yesterday the pair NZD/USD started to fall after FOMC released the data on the volume of consumer crediting. The value of $18.41 bln was much higher than expected (the forecast was 12.70 bln) which increases the possibility of major personal expenses stimulating economic growth. Later on, New Zealand published negative statistics on retail sales using credit cards which strengthened the “bearish” trend in the pair NZD/USD.
Today’s important macroeconomic events include statements by FOMC representatives Lael Brainard and Neel Kashkari. Market players will pay attention to their comments on the labor market, inflation dynamics, as well as the terms of reduction of FOMC assets.
On D1 chart the instrument is trying to consolidate below the level of 0.7230. Bollinger Bands were corrected sideward, while the price range remained unchanged indicating a high possibility for the continuation of the current trend. MACD histogram is in the positive zone with its volumes reducing and keeping the sell signal. Stochastic is approaching the oversold zone.
Support levels: 0.7200, 0.7165, 0.7135, 0.7080.
Resistance levels: 0.7265, 0.7295, 0.7330, 0.7360.

