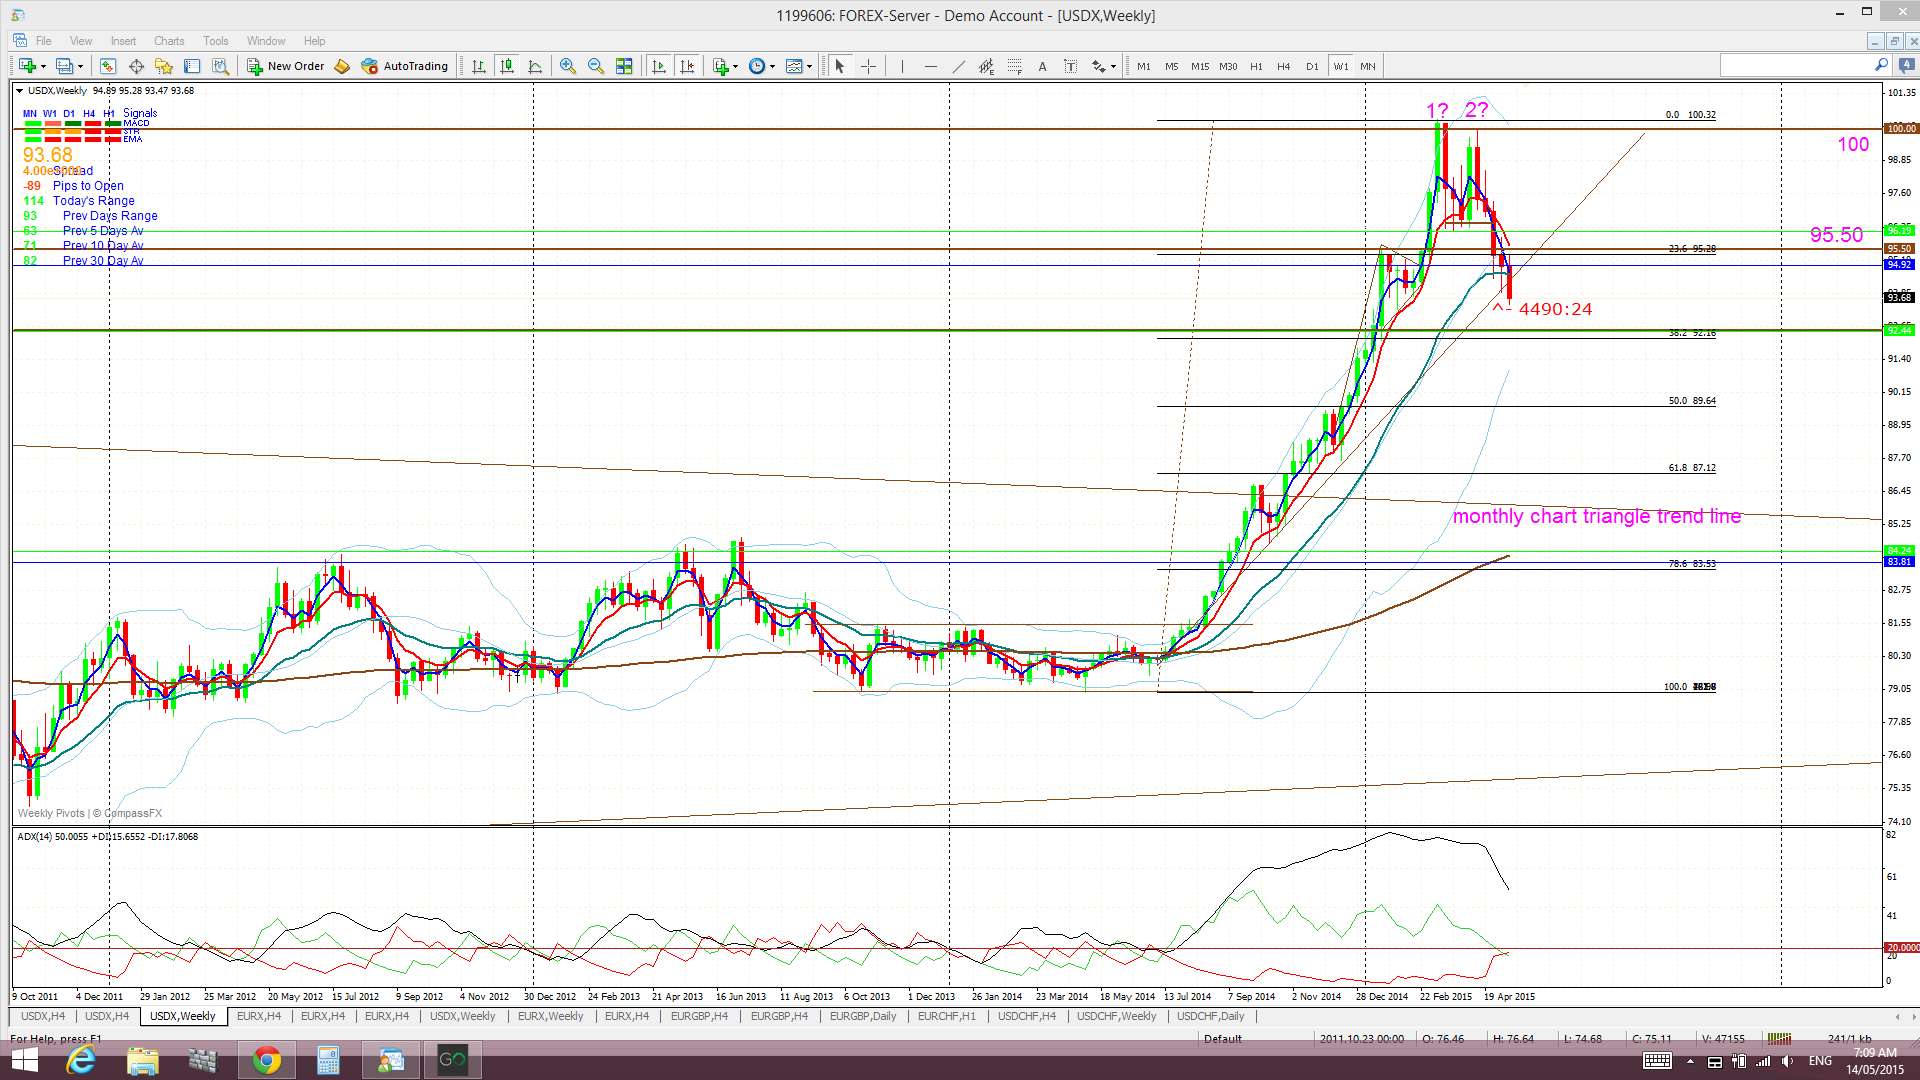
I had pondered yesterday whether US Retail Sales might be the single piece of data to break the US$’s back and this seems to have been the case. The US$ has fallen below a recent support trend line and this has triggered an upward move with both Silver and Gold. The move on Silver looks to be trying for a major 4 year+ triangle breakout whereas the move on Gold has triggered a daily triangle breakout but with more trend lines ahead.
USDX weekly: the weekly candle has yet to close BUT the recent support trend line has been broken for now. A weekly close below this level would confirm the bearish breakdown and support bearish follow through:
Silver:
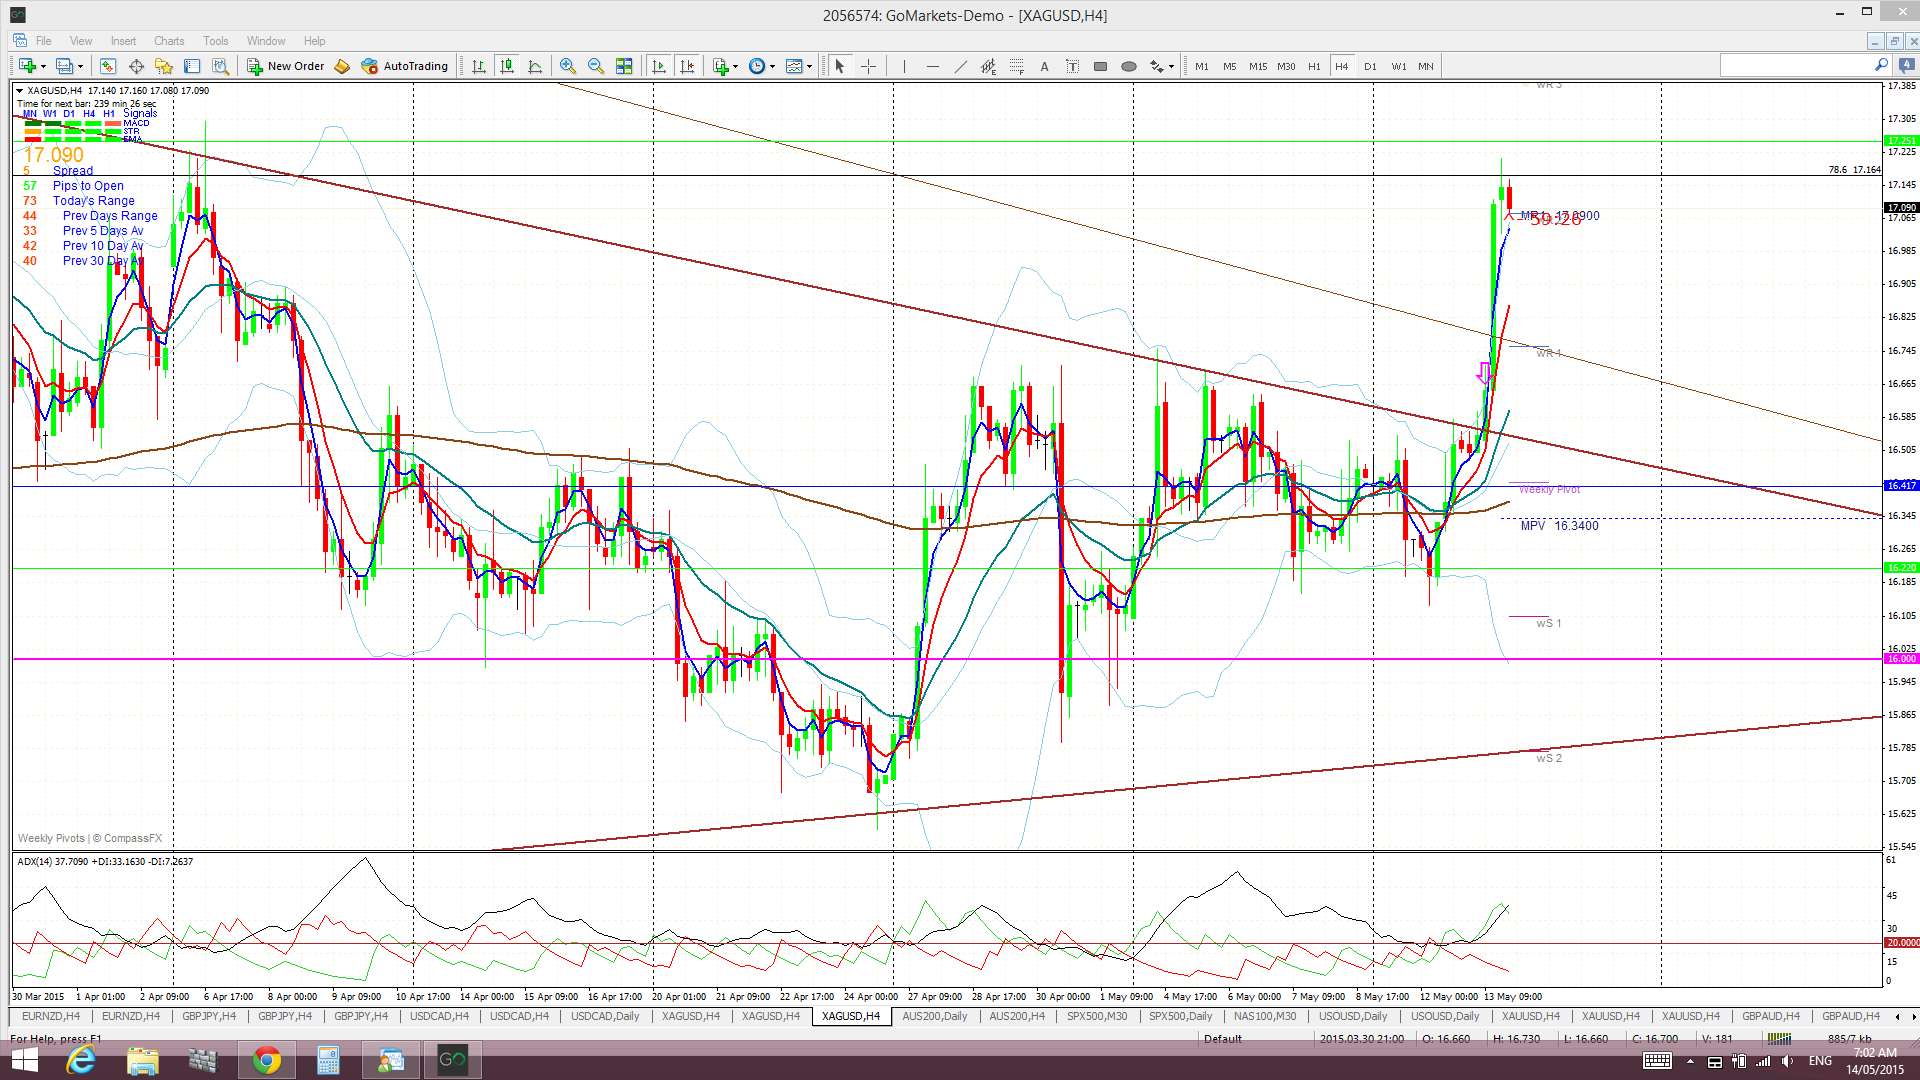
Silver 4hr: I had mentioned yesterday that Silver looked to be trying for a new TC signal off the 4hr chart and this eventually came through at 7pm. Silver is also trading above the 4hr and daily Ichimoku Cloud which is bullish:
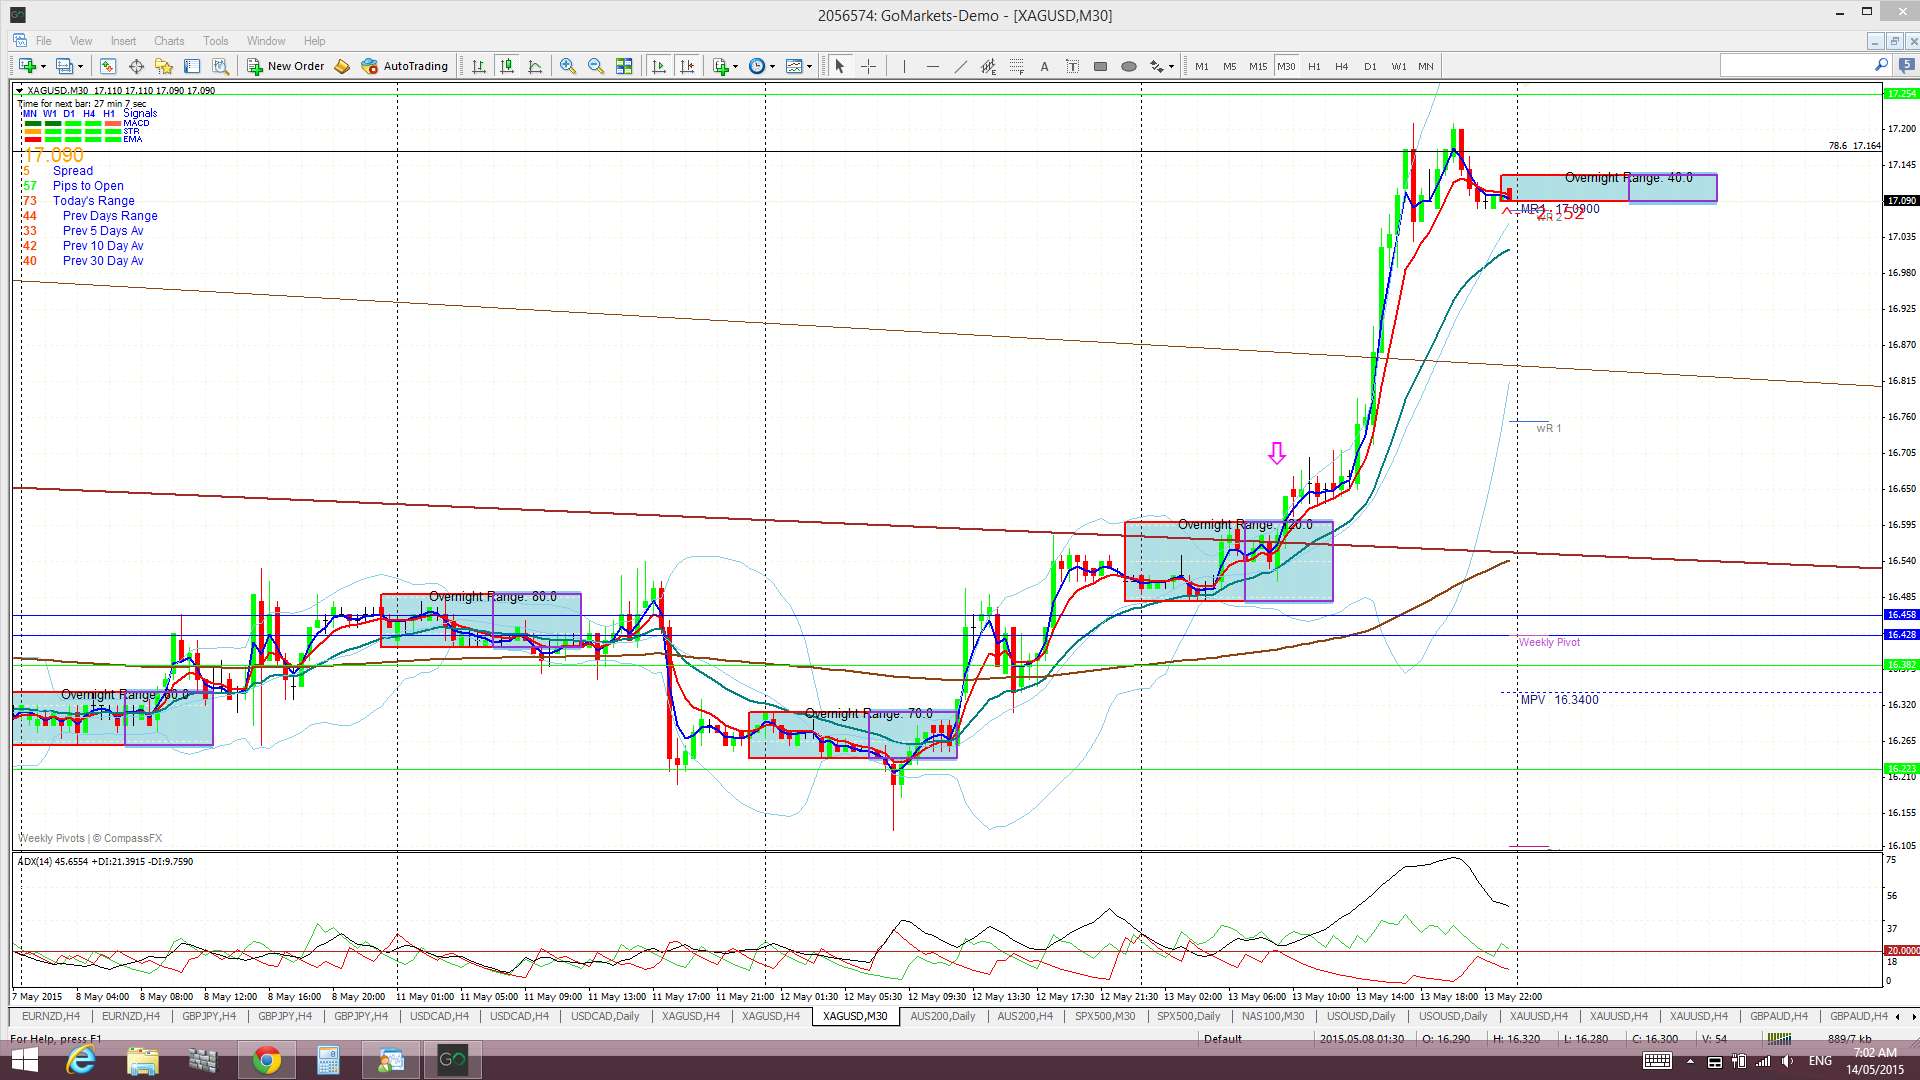
Silver 30 min: this chart shows the breakout move getting into full swing during the European and then US session:
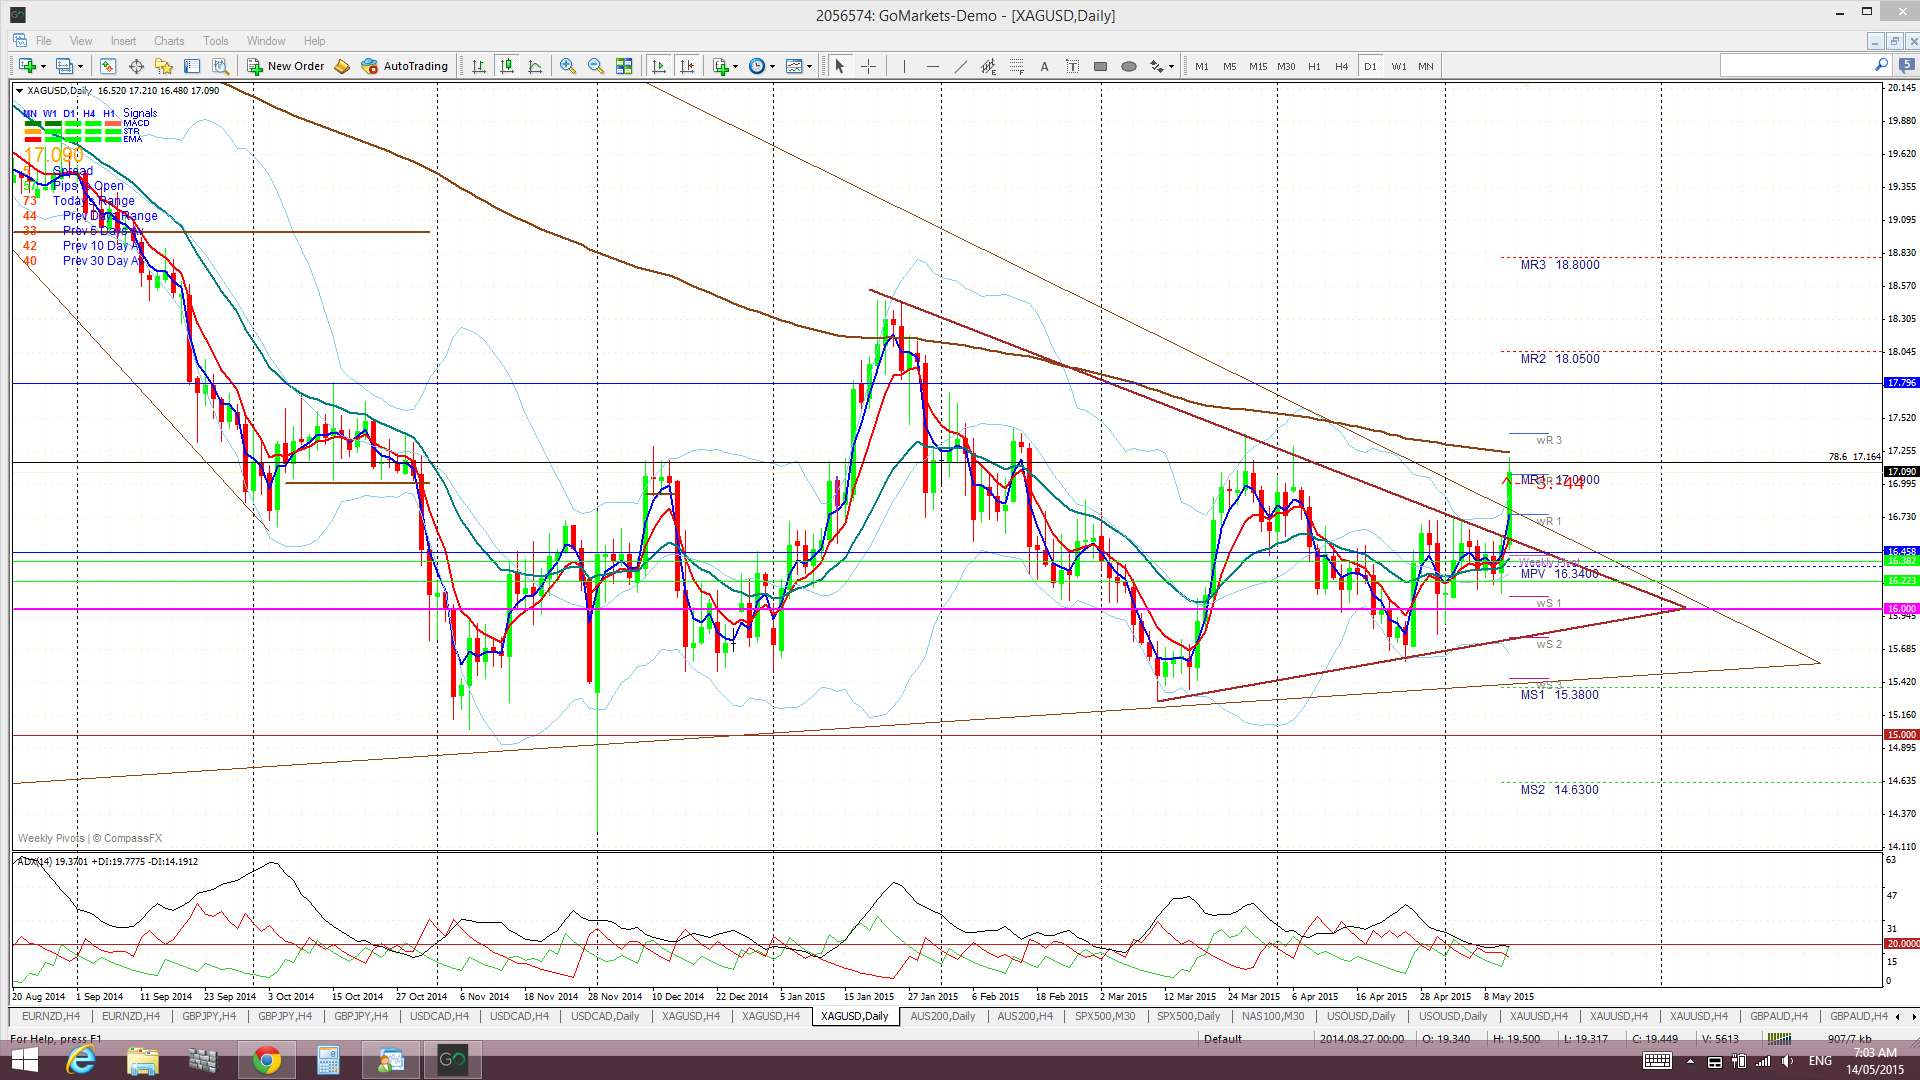
Silver daily: the daily candle looks set to close above two triangle trend lines; a more recent consolidation pattern and, then, one that has been brewing for over 4 years:
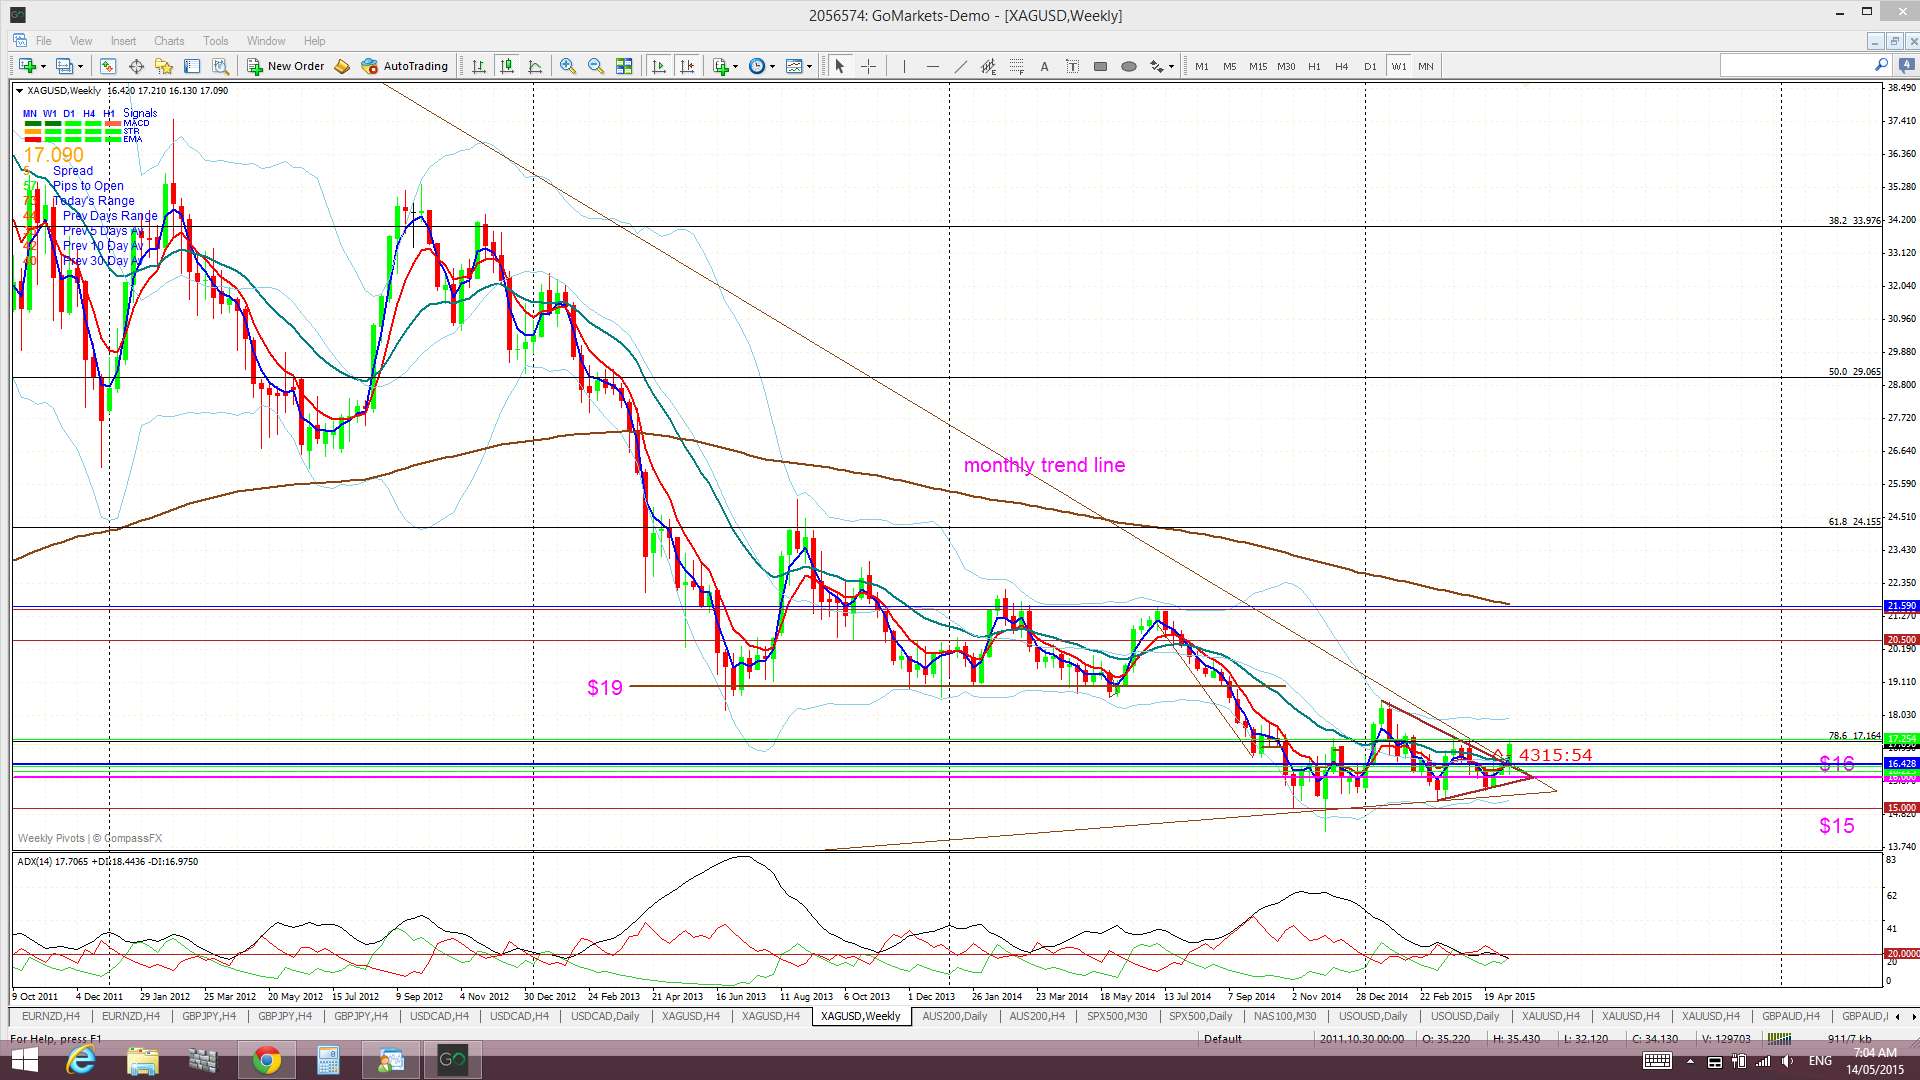
Silver weekly: watch for any weekly close out of this triangle:
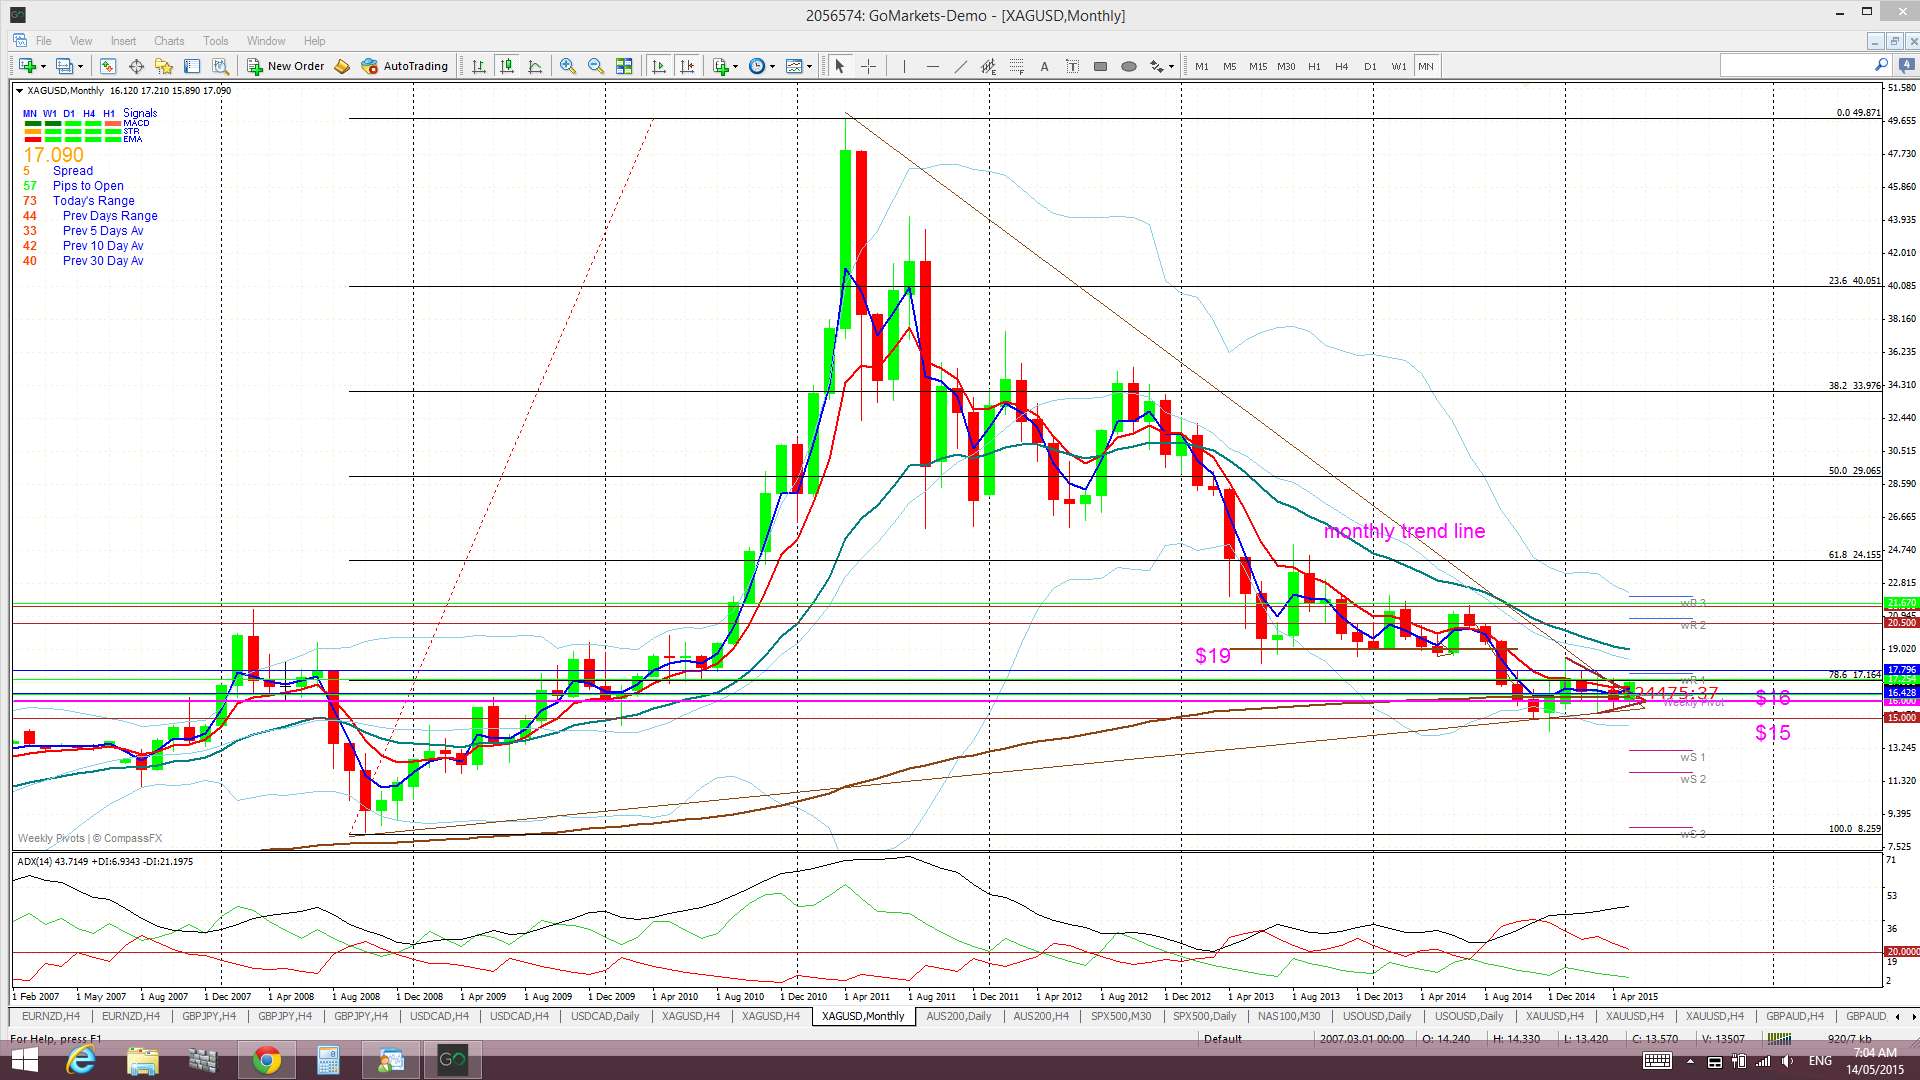
Silver monthly: the larger triangle is a monthly chart pattern though and, thus, a monthly candle close above the trend line needs to be seen to confirm this larger breakout:
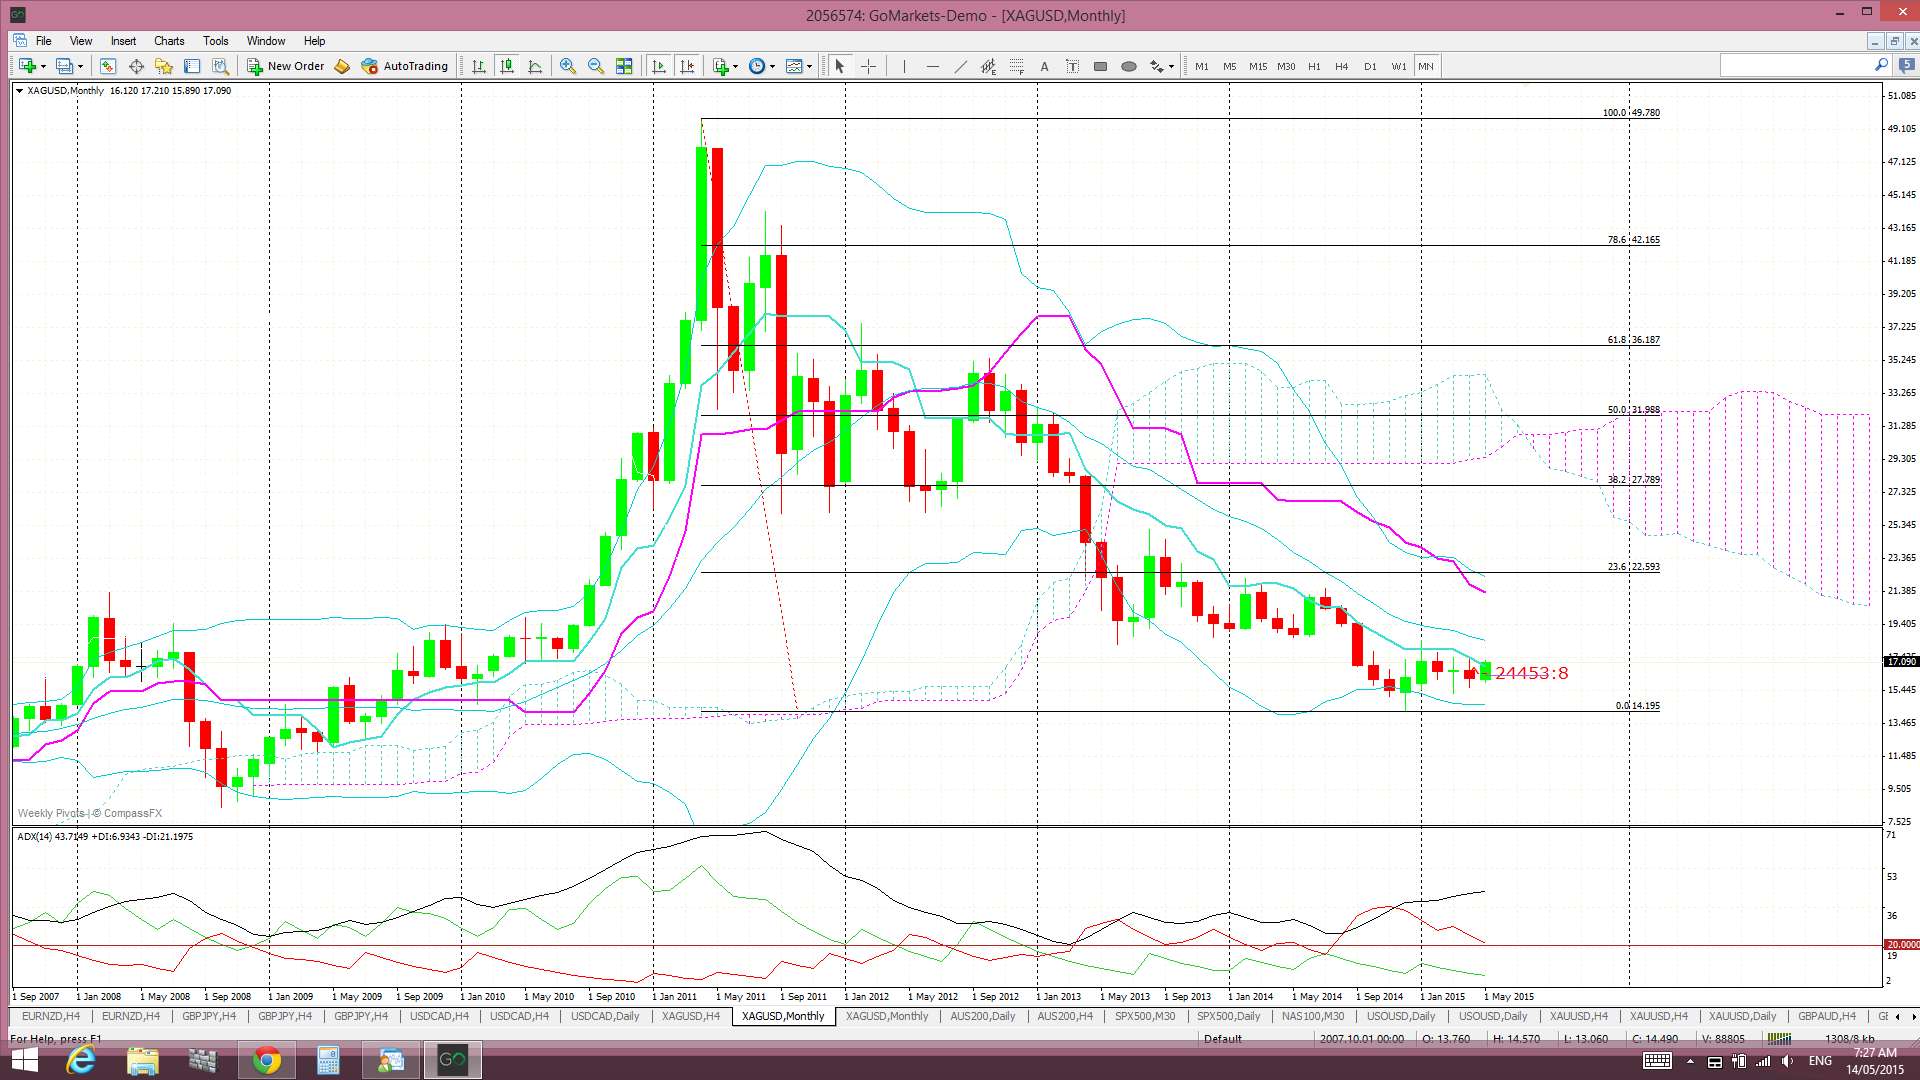
Silver Monthly Cloud: Apart from the obvious whole number levels placing Fibonacci levels on this major swing low move may help to identify targets for any bullish follow through:
Gold:
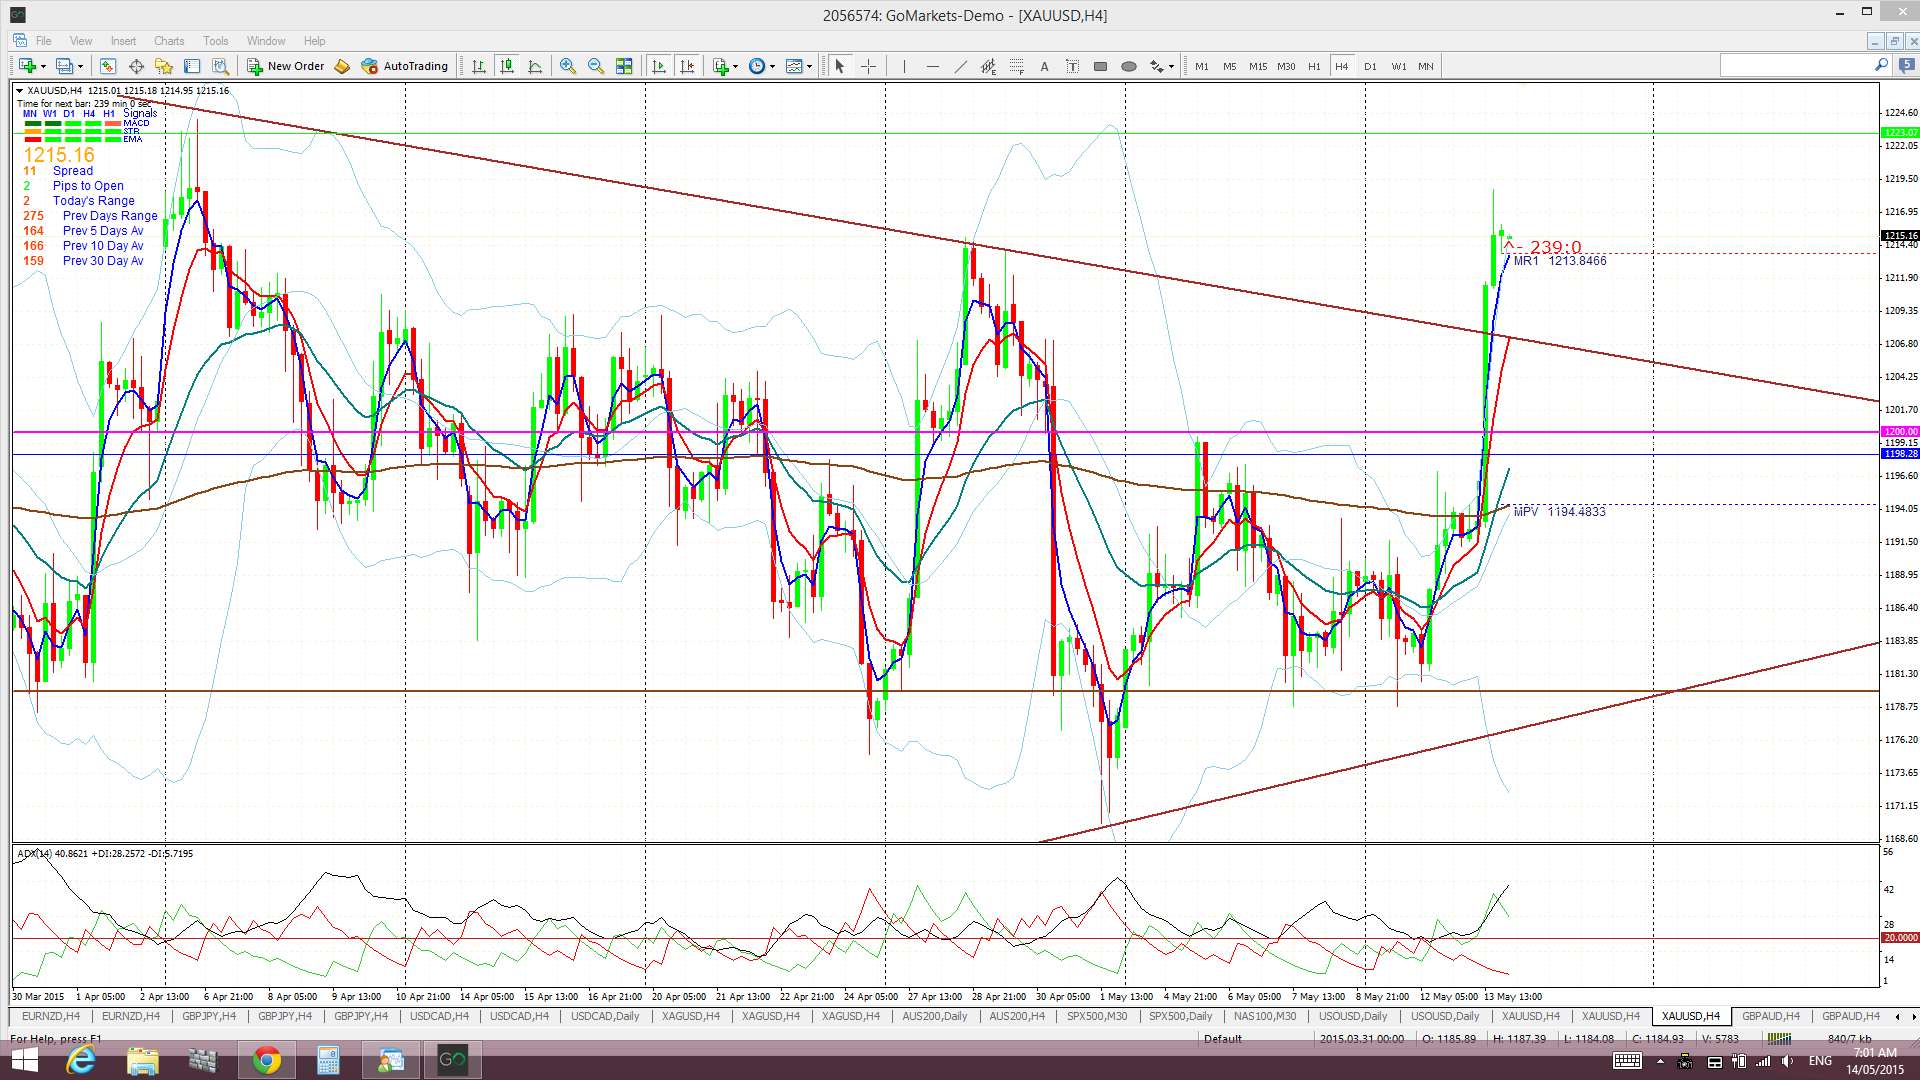
Gold 4hr: Gold also broke out of a recent triangle pattern but this move didn’t trigger a new TC signal:
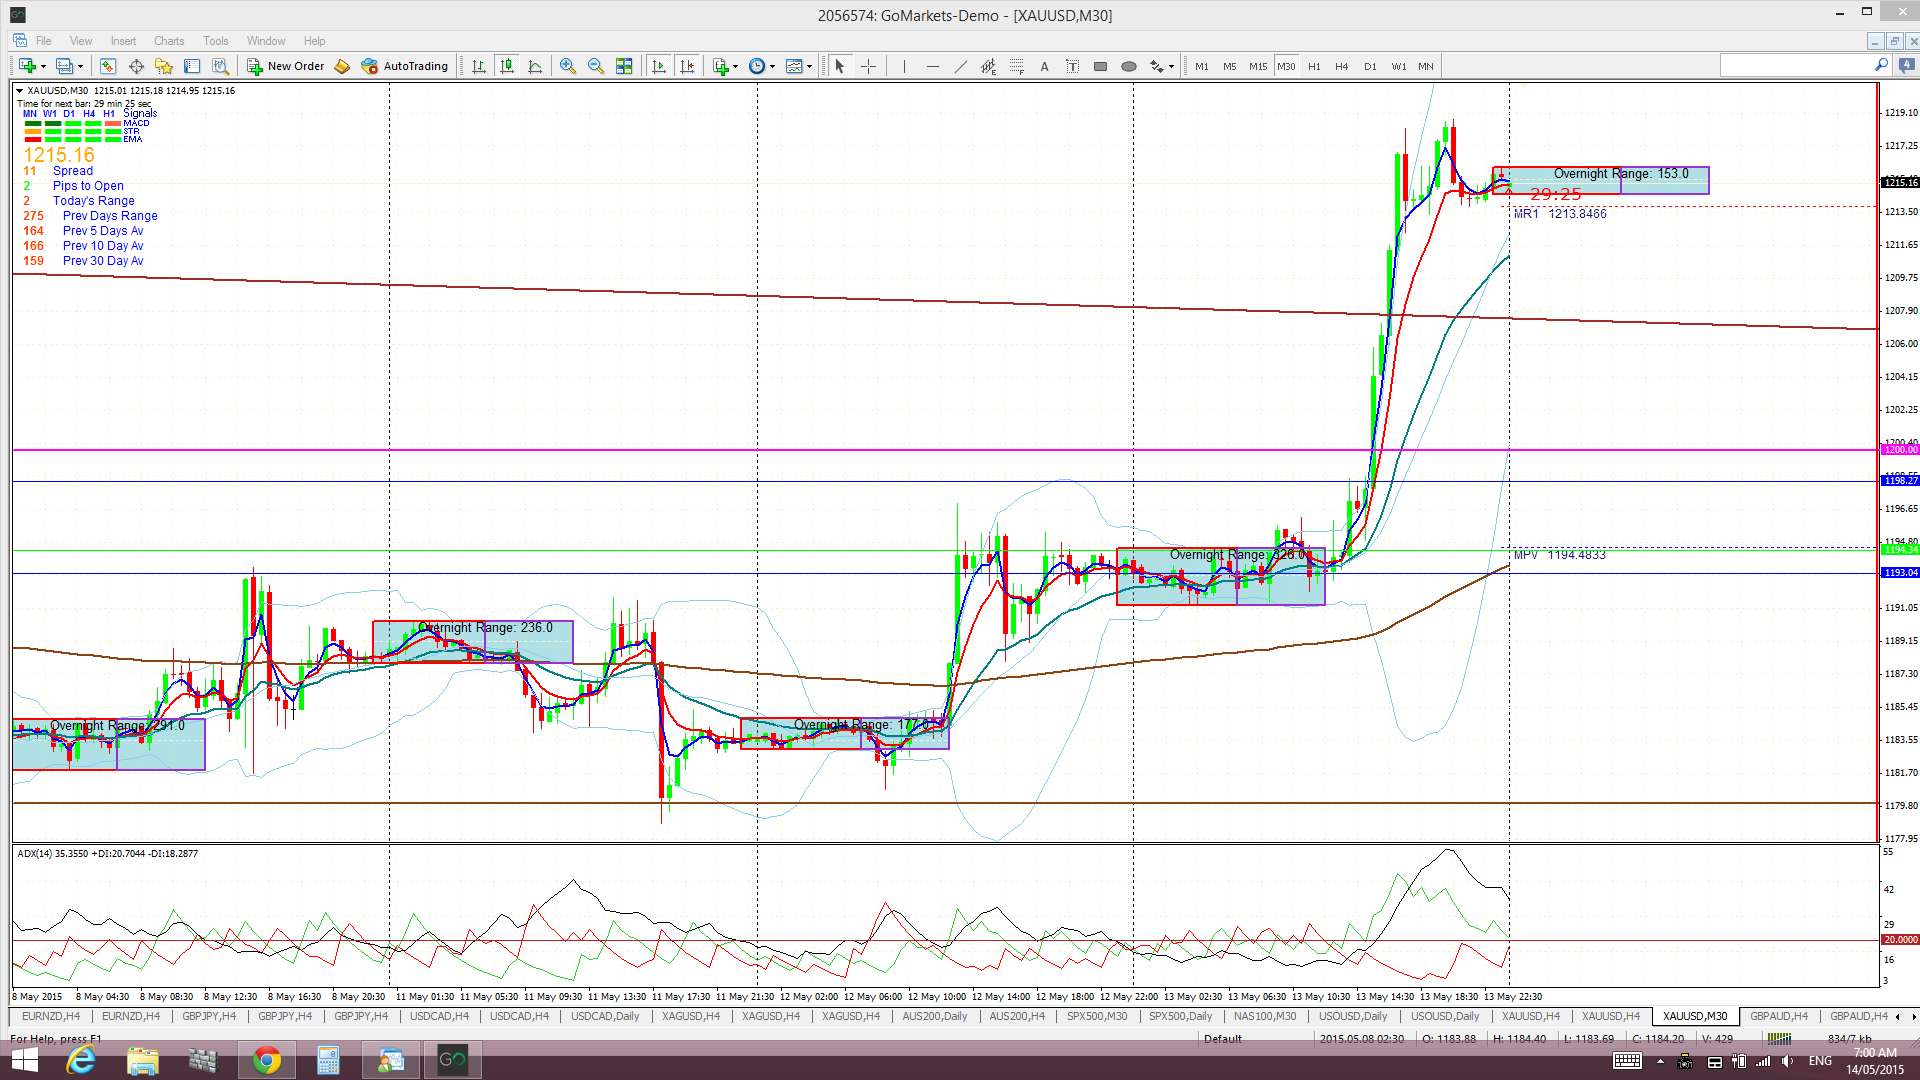
Gold 30 min: as with Silver, most of the move came during the US session and after the US Retail Sales data was released:
Gold daily: a daily triangle breakout will evolve here:

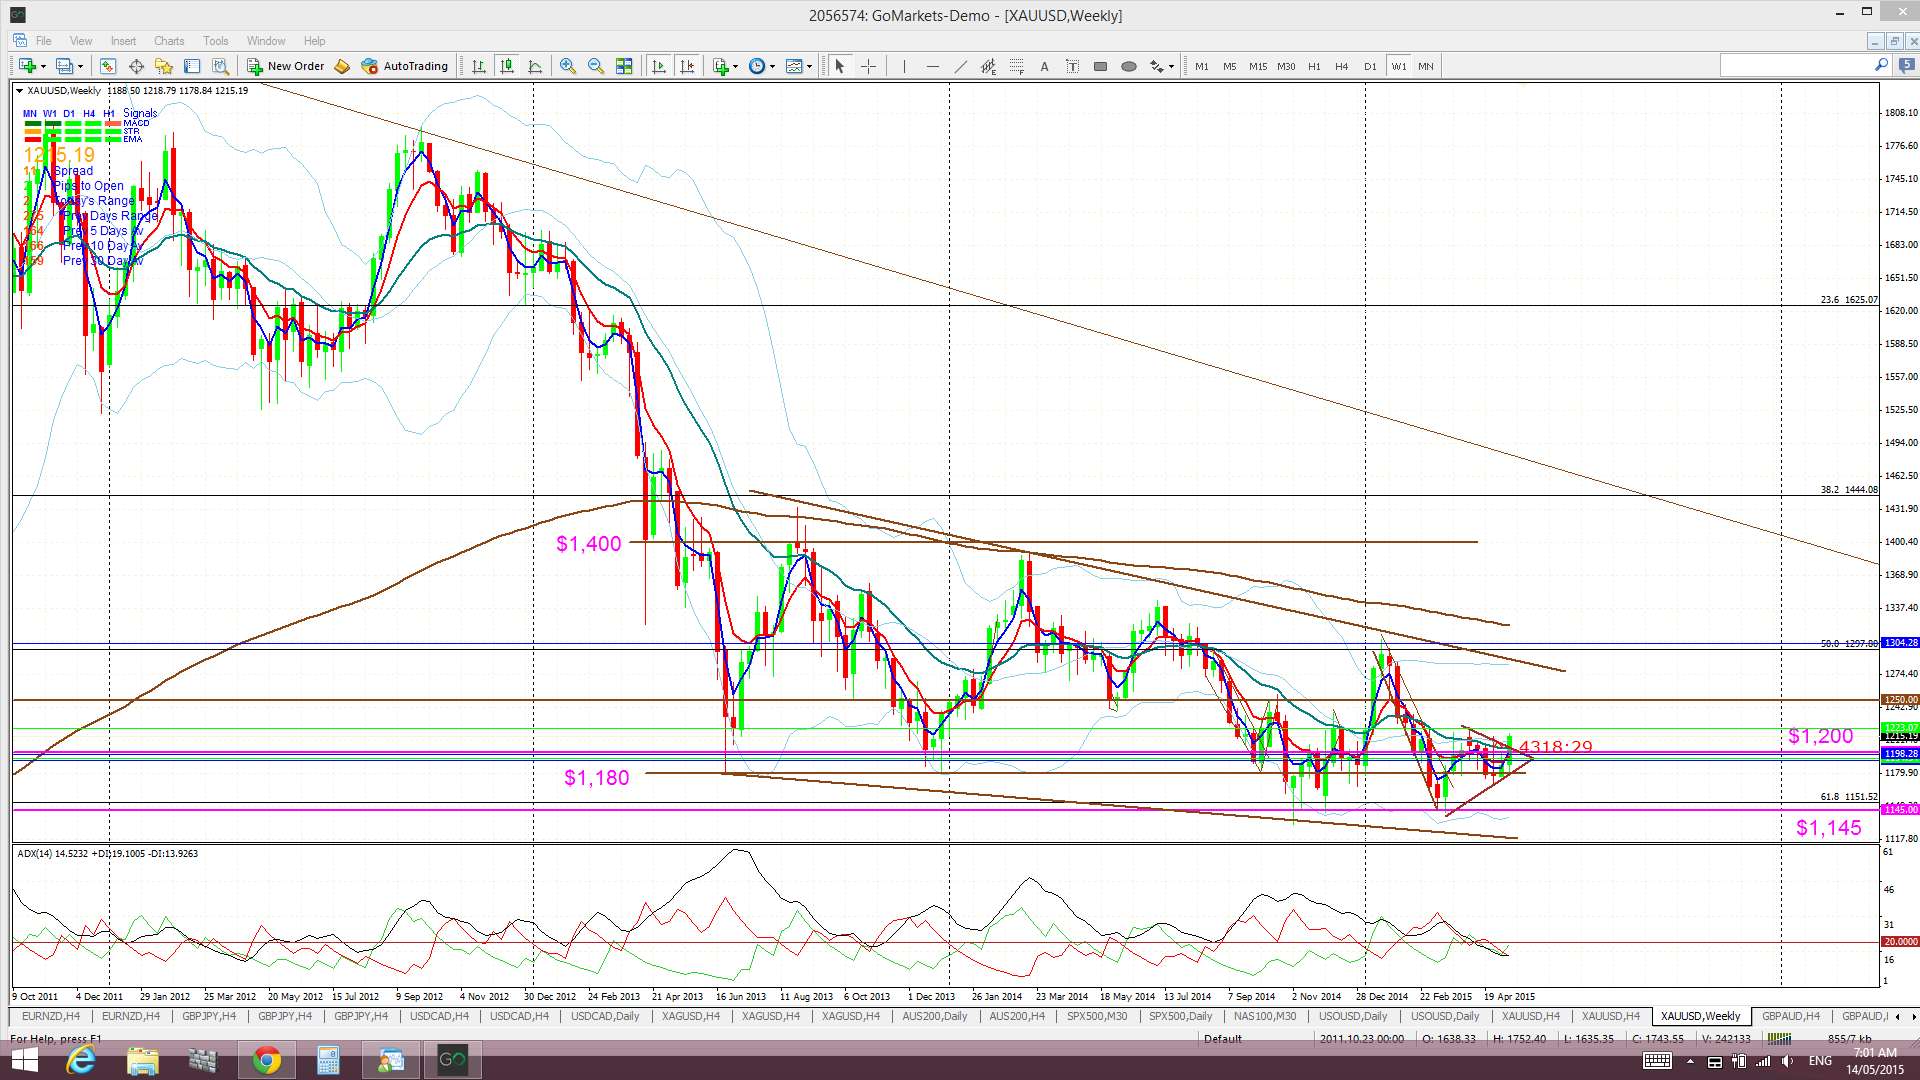
Gold weekly: this triangle is set within a weekly-chart descending trading channel though so this breakout move might target these channel trend lines. Worth watching for:
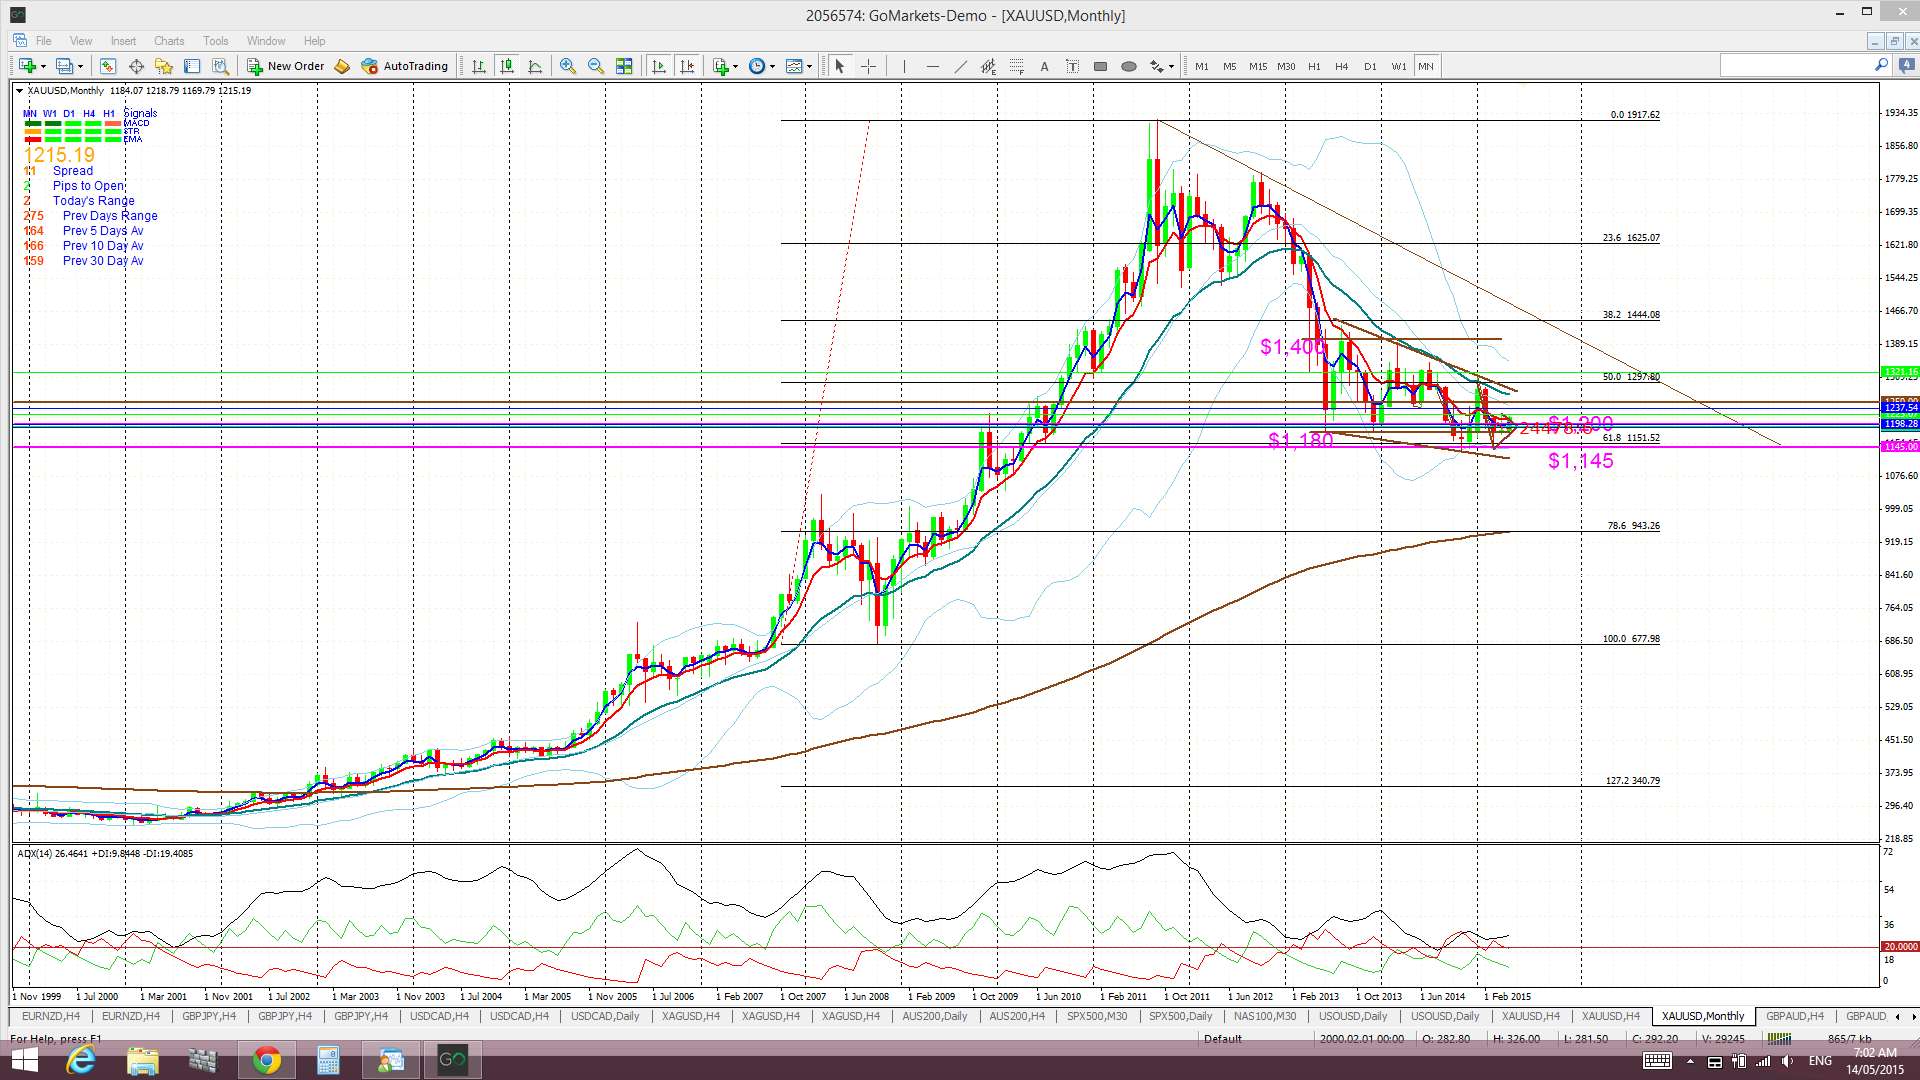
Gold monthly: and then the weekly chart’s trading channel is set within a monthly chart triangle. Thus, more trend lines on the horizon for any bullish follow through:
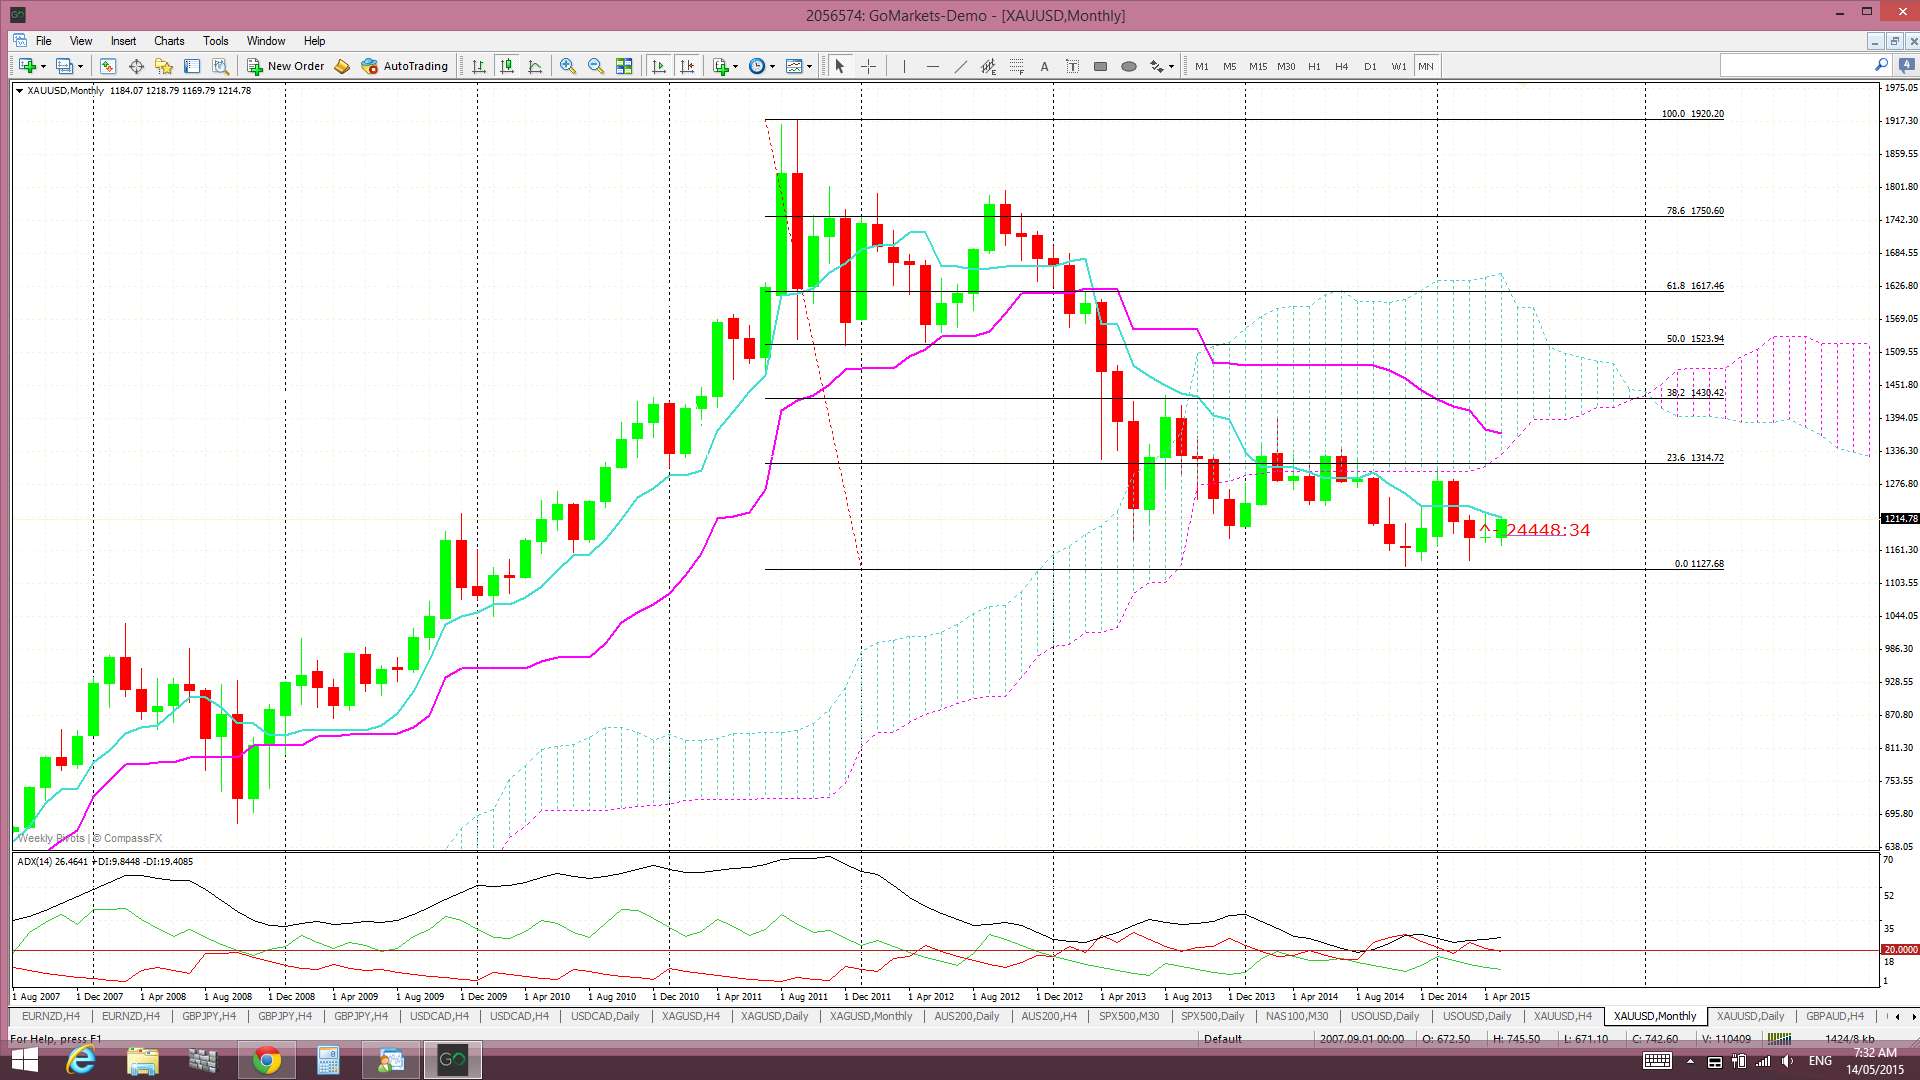
Gold monthly Cloud: Fib levels of the major swing low move here might also help to identify pullback targets:
Summary: US$ weakness has led to 4hr and daily chart breakout moves on both Silver and Gold. Continued US$ weakness may lead to higher time frame charting breakout moves:
- Silver: watch for a weekly and monthly close above the monthly triangle pattern to support continuation.
- Gold: watch for any continuation to test weekly chart channel trend lines and, then, monthly chart triangle trend lines.
The post Silver & Gold: breakout starting? appeared first on www.forextell.com.