Dovish sentiment from many other Central Banks will no doubt be putting pressure on the US Federal Reserve and their intentions to start to lift US interest rates. This week’s FOMC will be a closely watched event for guidance about the timetable of any US rate rise. The S&P500 has rallied over recent sessions and one would think that any rate hike delay would only help to further underpin the current market. The following charts give a snap-shot of the S&P500 as it is currently shaping up.
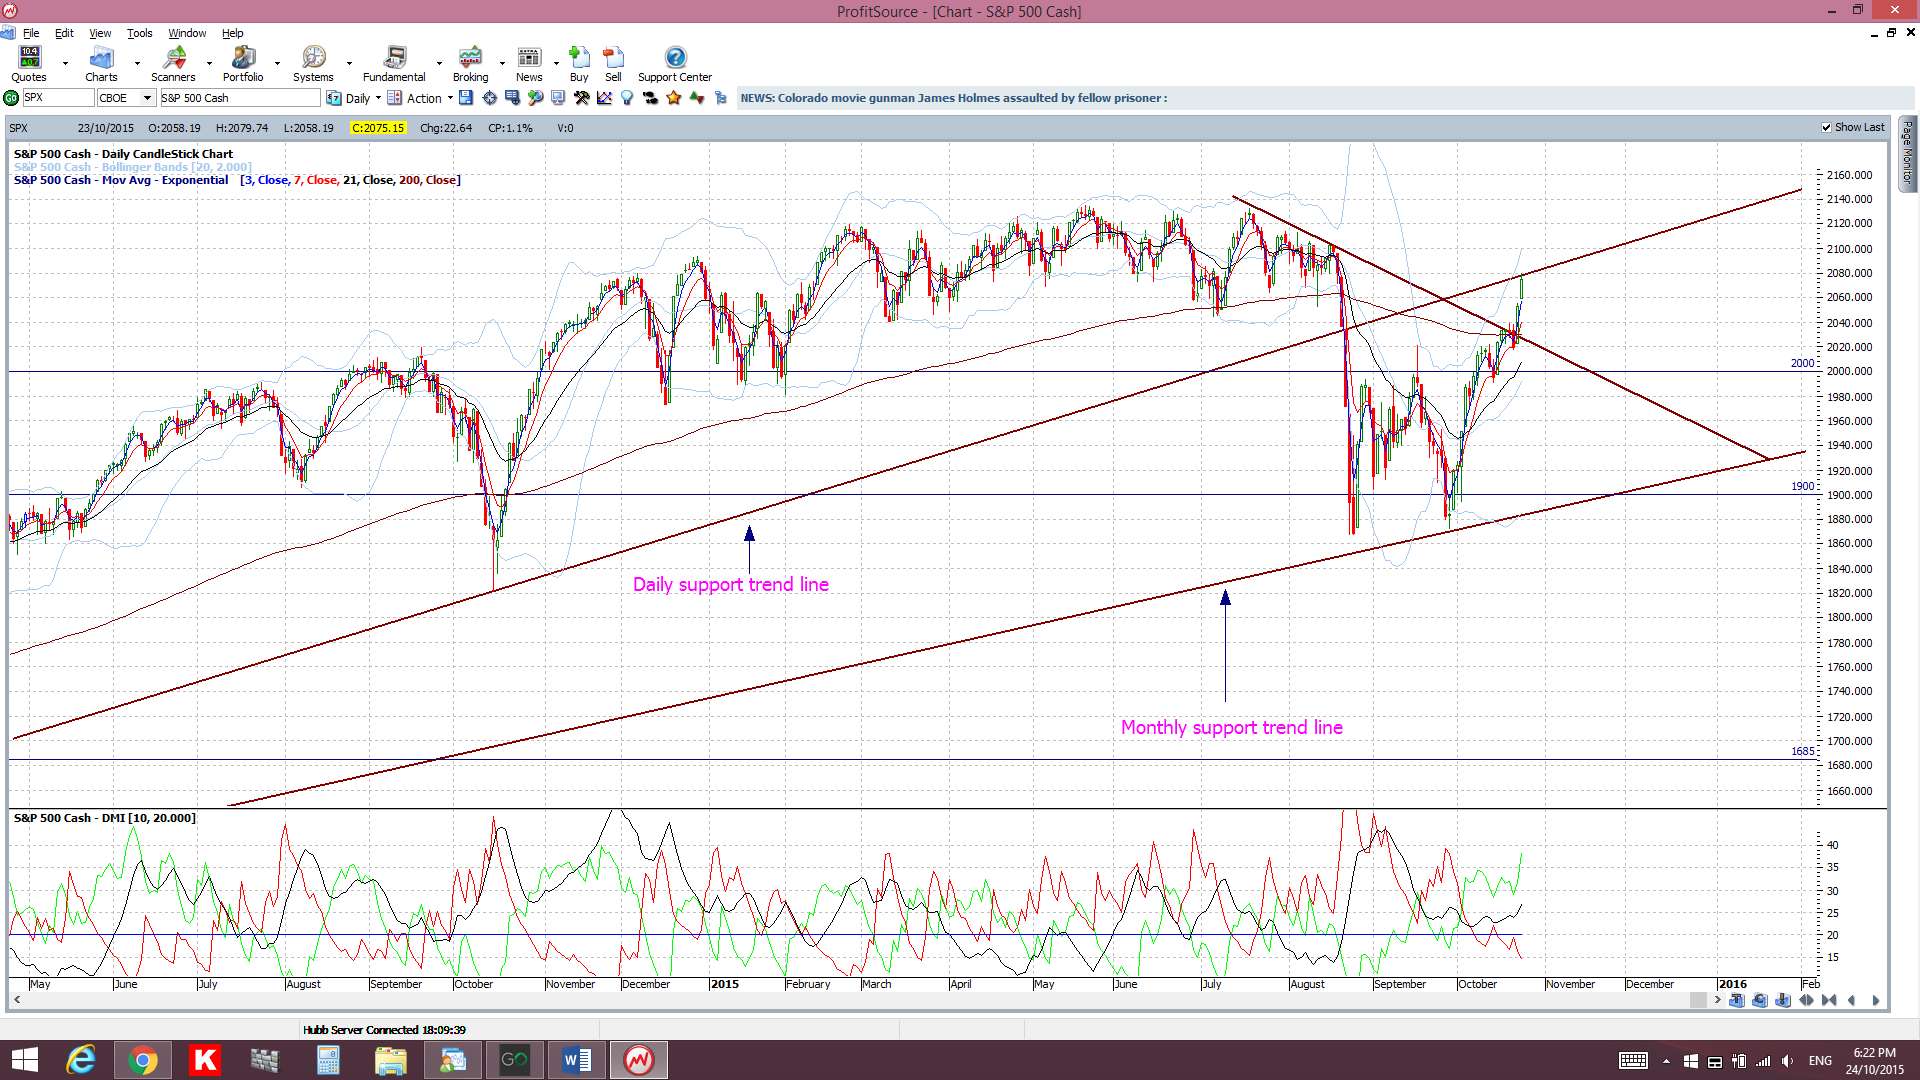
S&P500 daily: price is back above the key 2,000 level but has not made it back above the previous daily support trend line. This will be a level to watch in coming sessions and, after that, the previous high near 2,135 will be in focus:
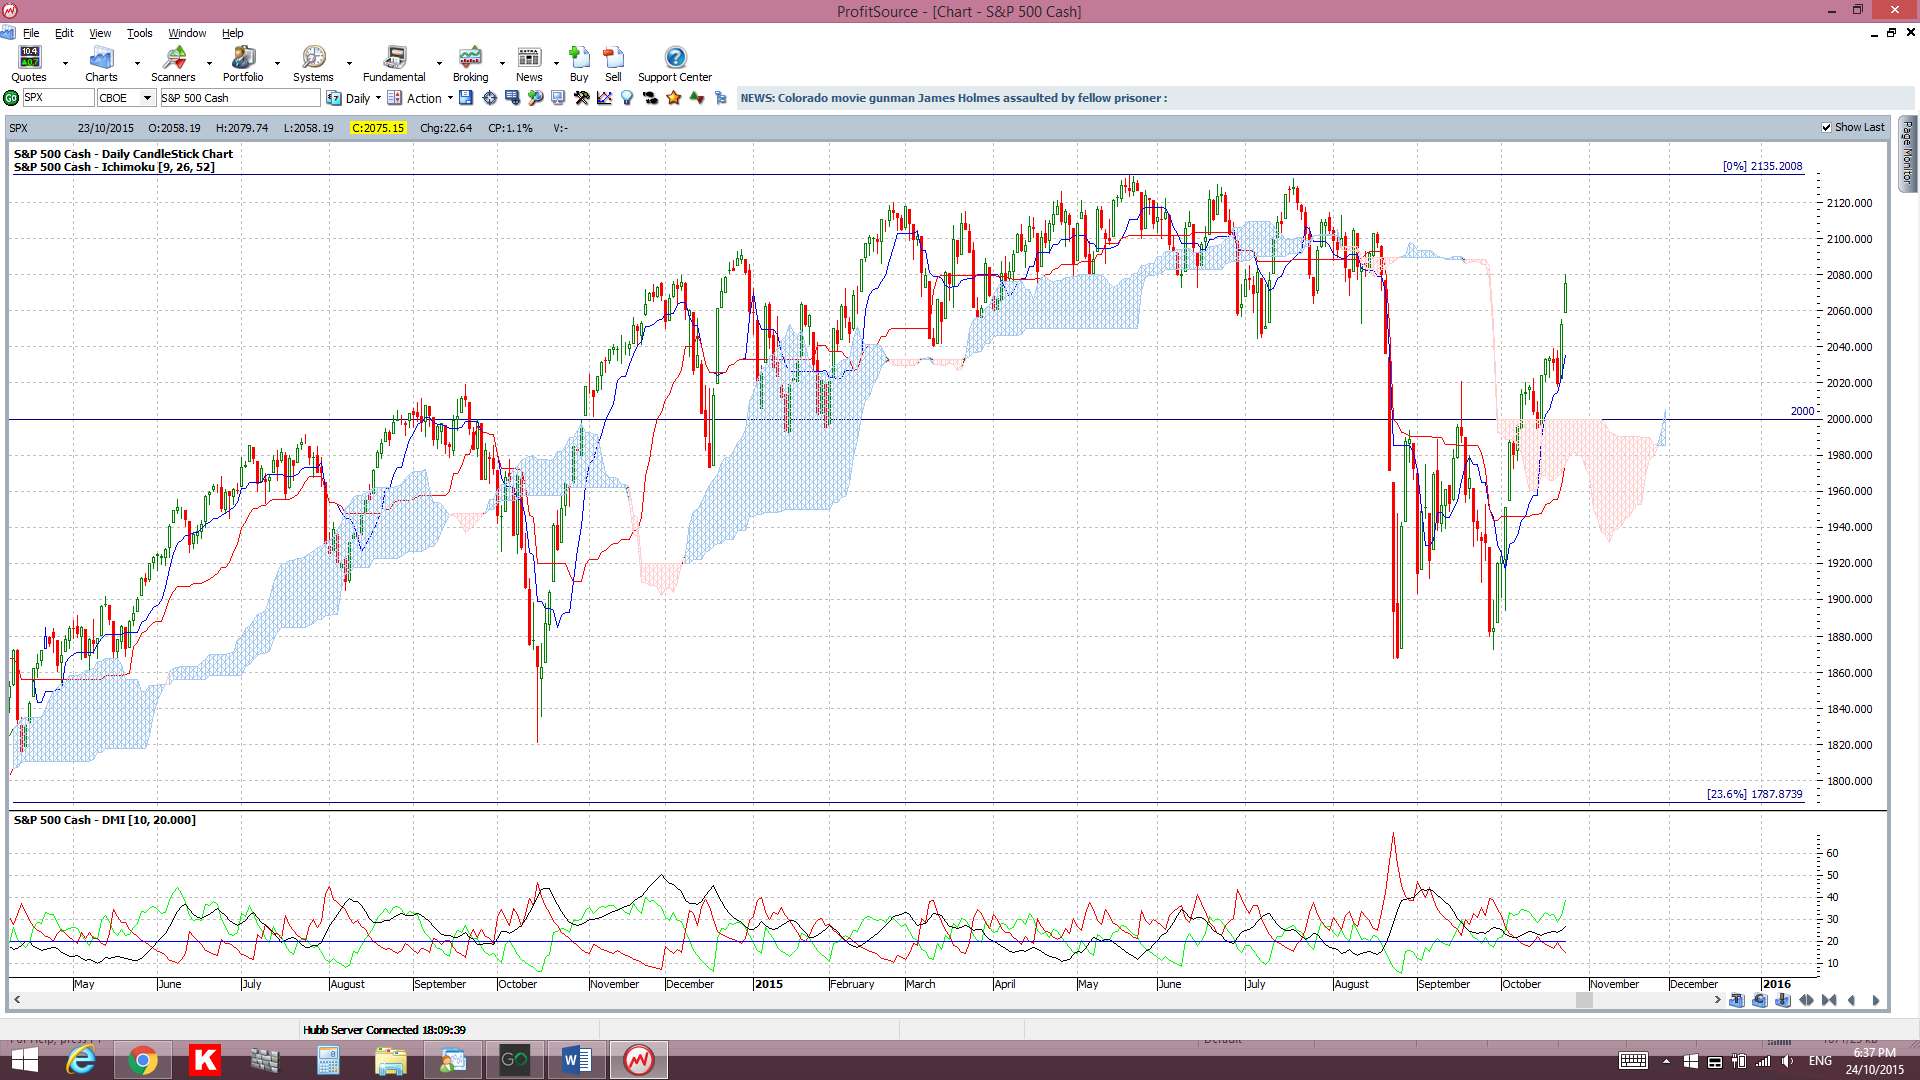
S&P500 daily Cloud: price is above the daily Cloud and there has been a recent bullish Tenkan/Kijun cross; both are bullish signals.
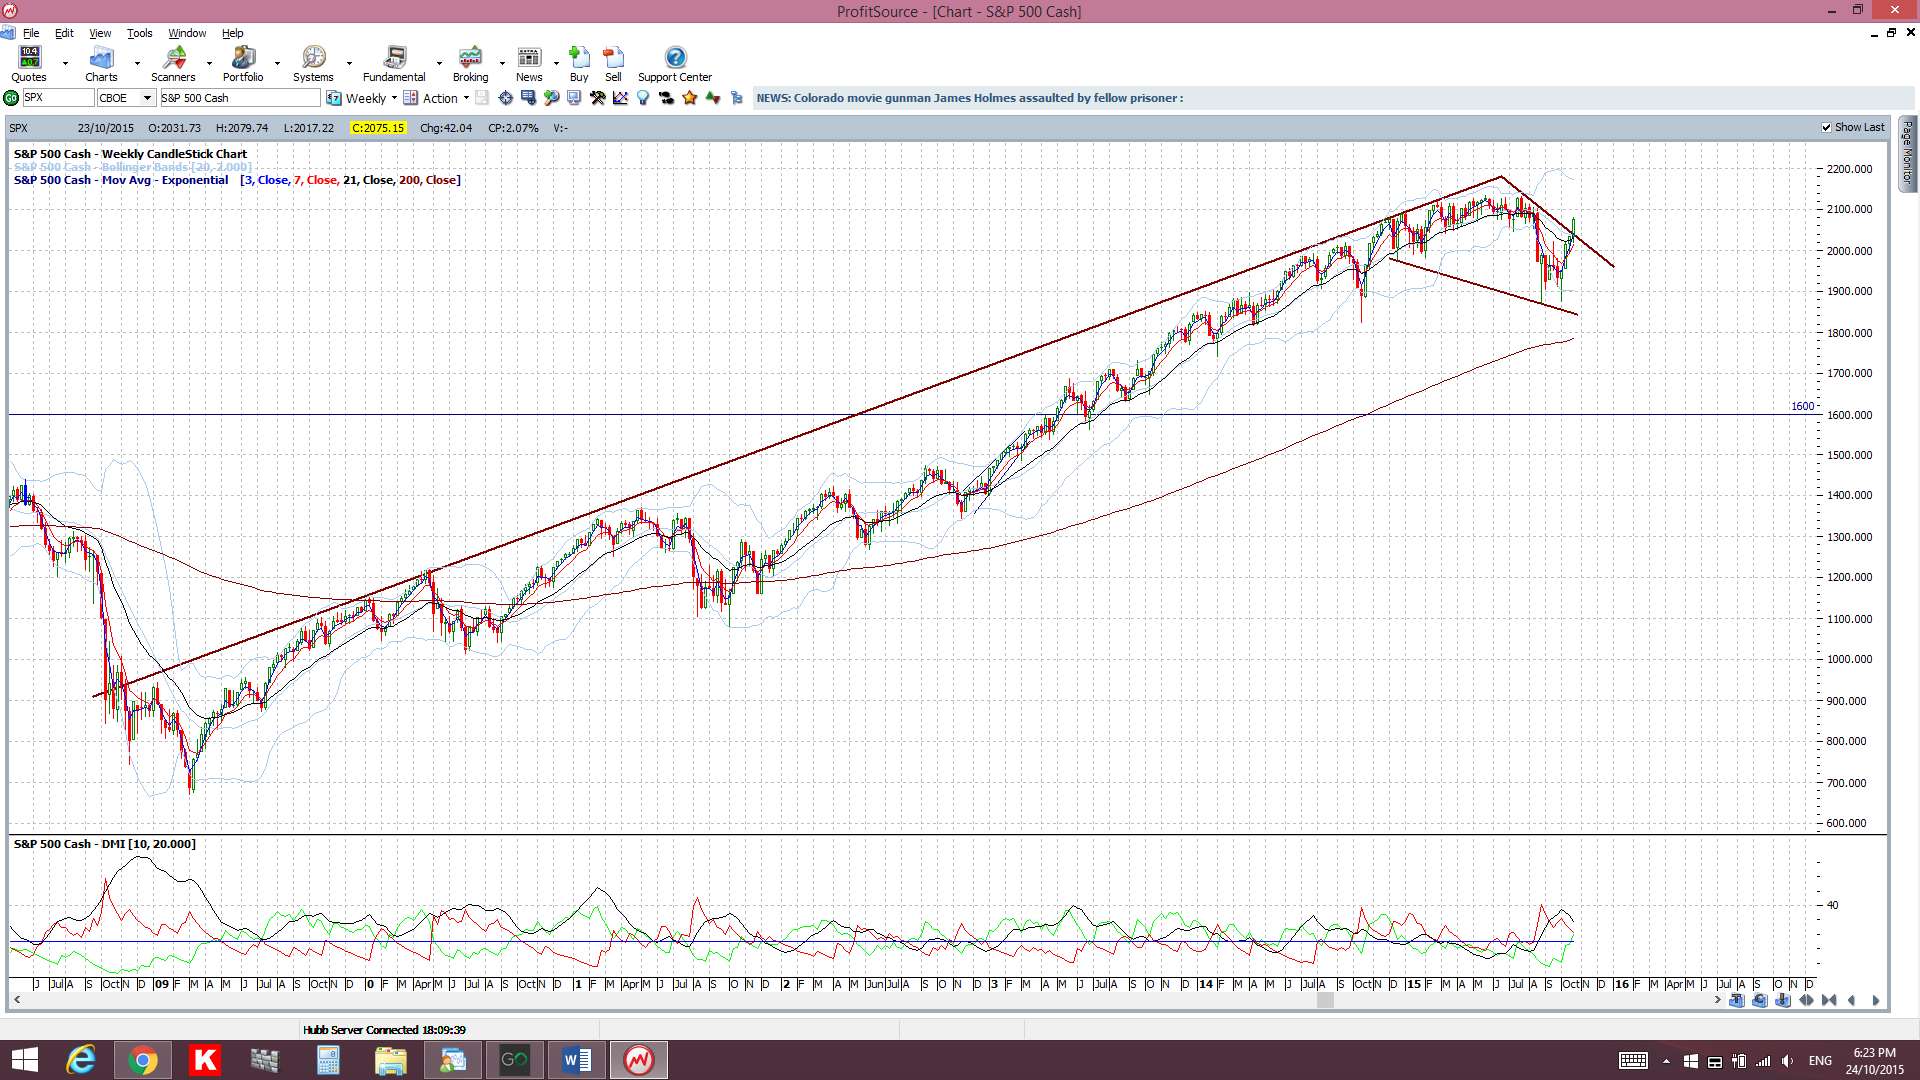
S&P500 weekly: this does have a bit of a Bull Flag appearance:
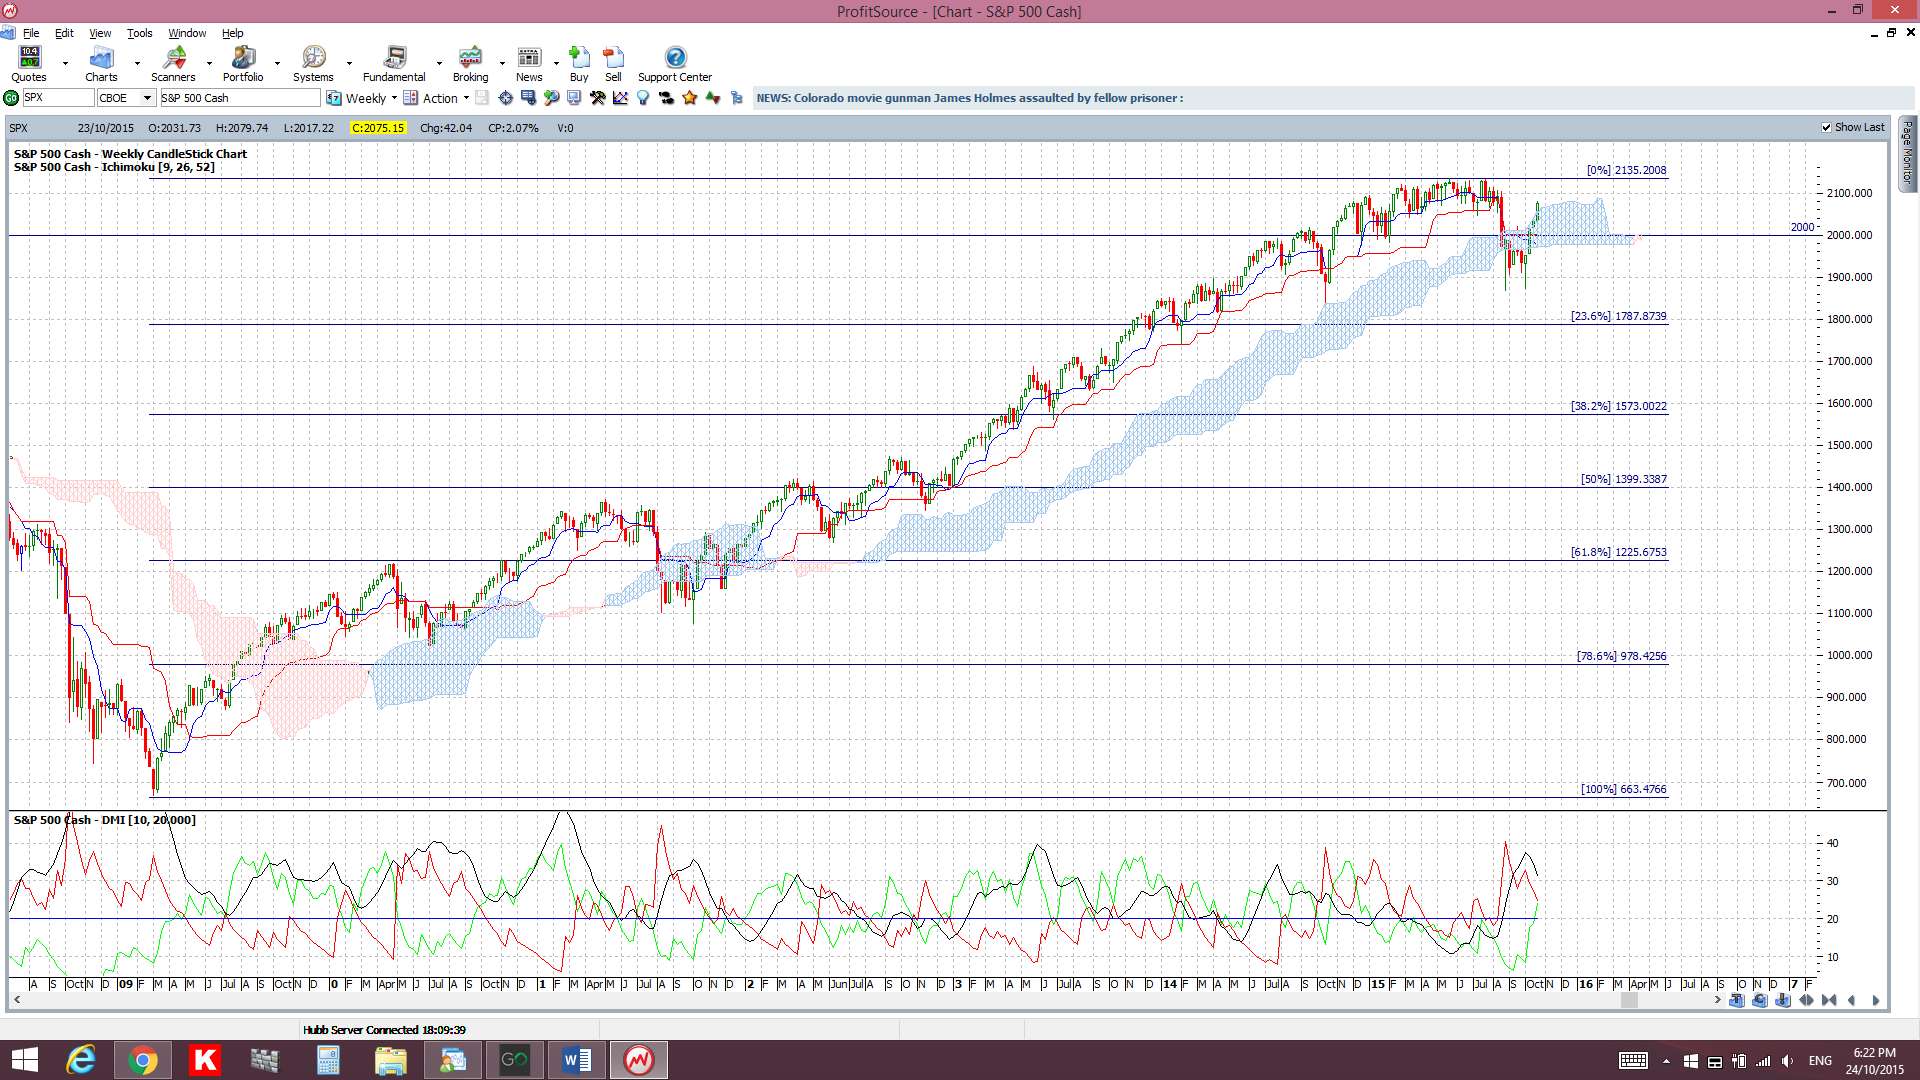
S&P500 weekly Cloud: price is now back above the weekly Cloud which is a new bullish signal:
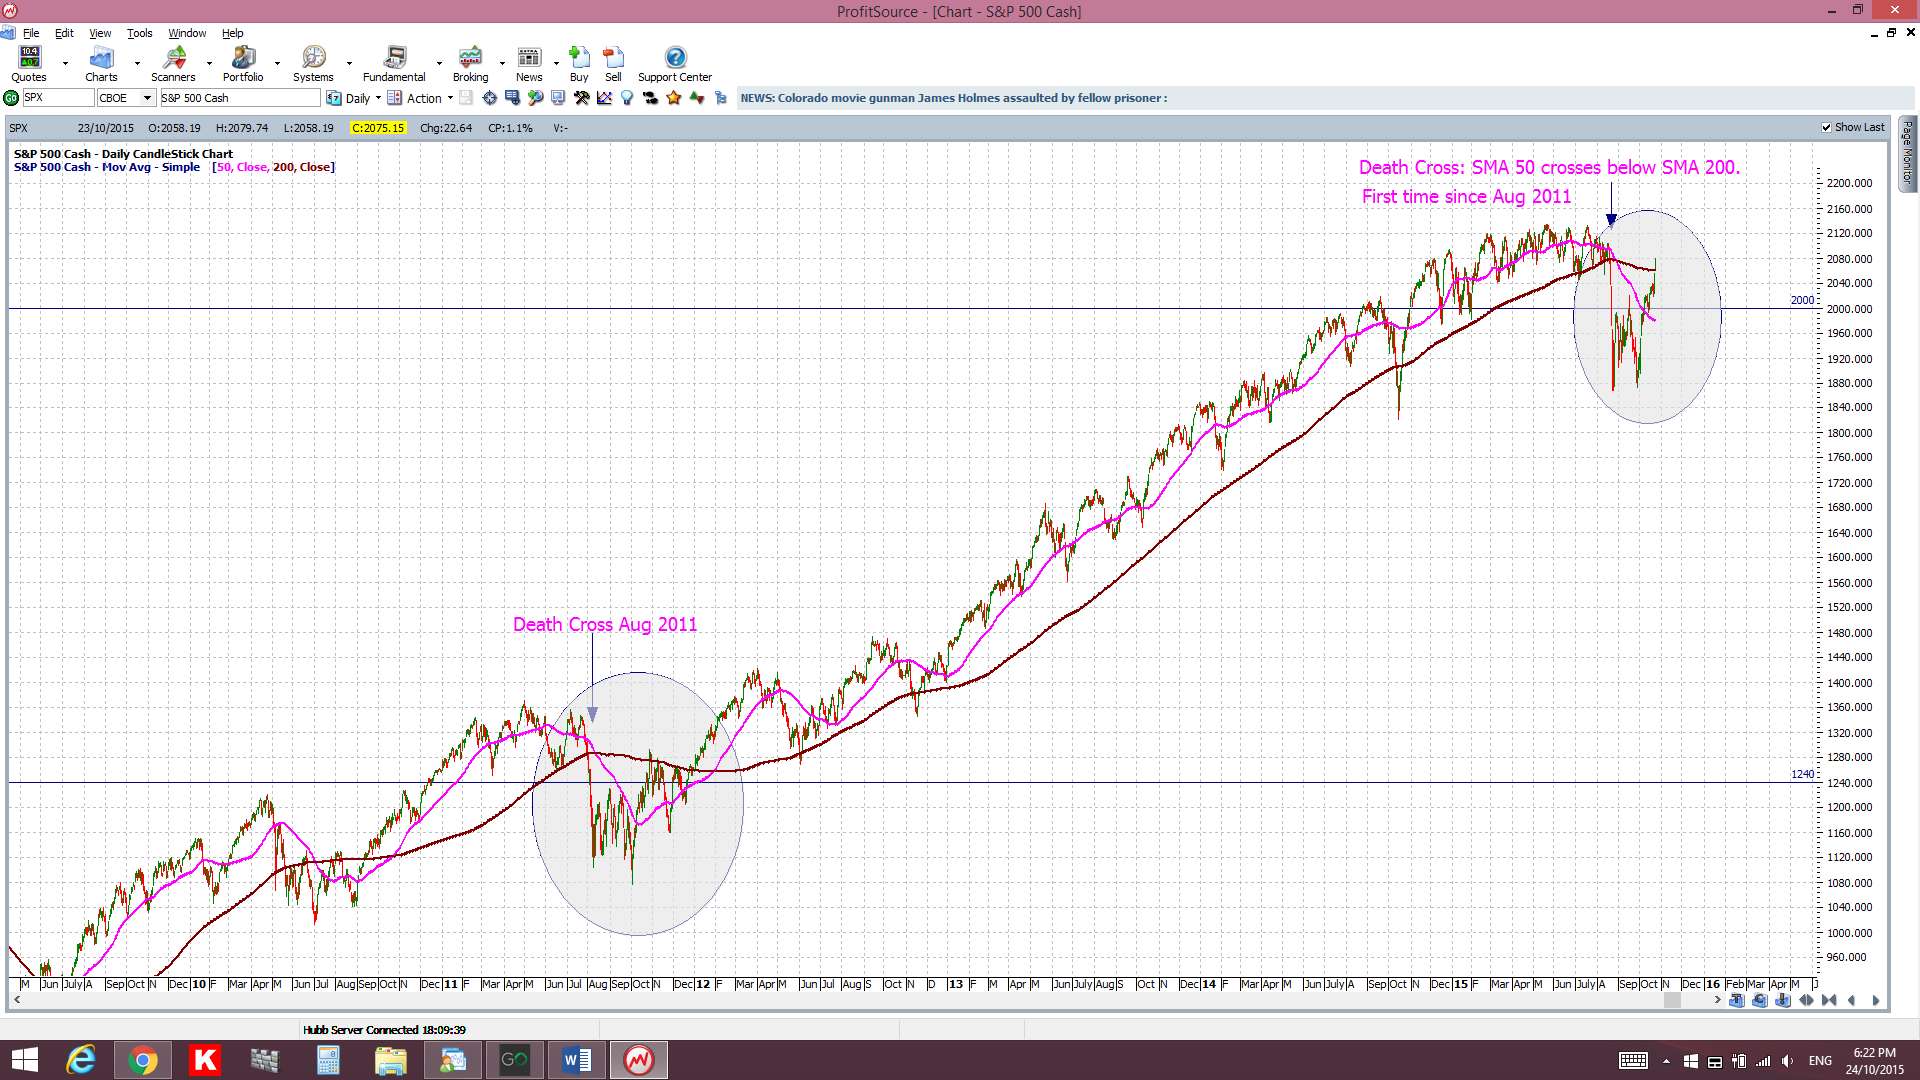
S&P500 weekly Death Cross: I’m wondering if the recent ‘Death Cross’ will be as short-lived as the last one!
S&P500 monthly: I, and my Elliott Wave indicator, had been looking for a pull back to test the major 1,600 region but this has not evolved.
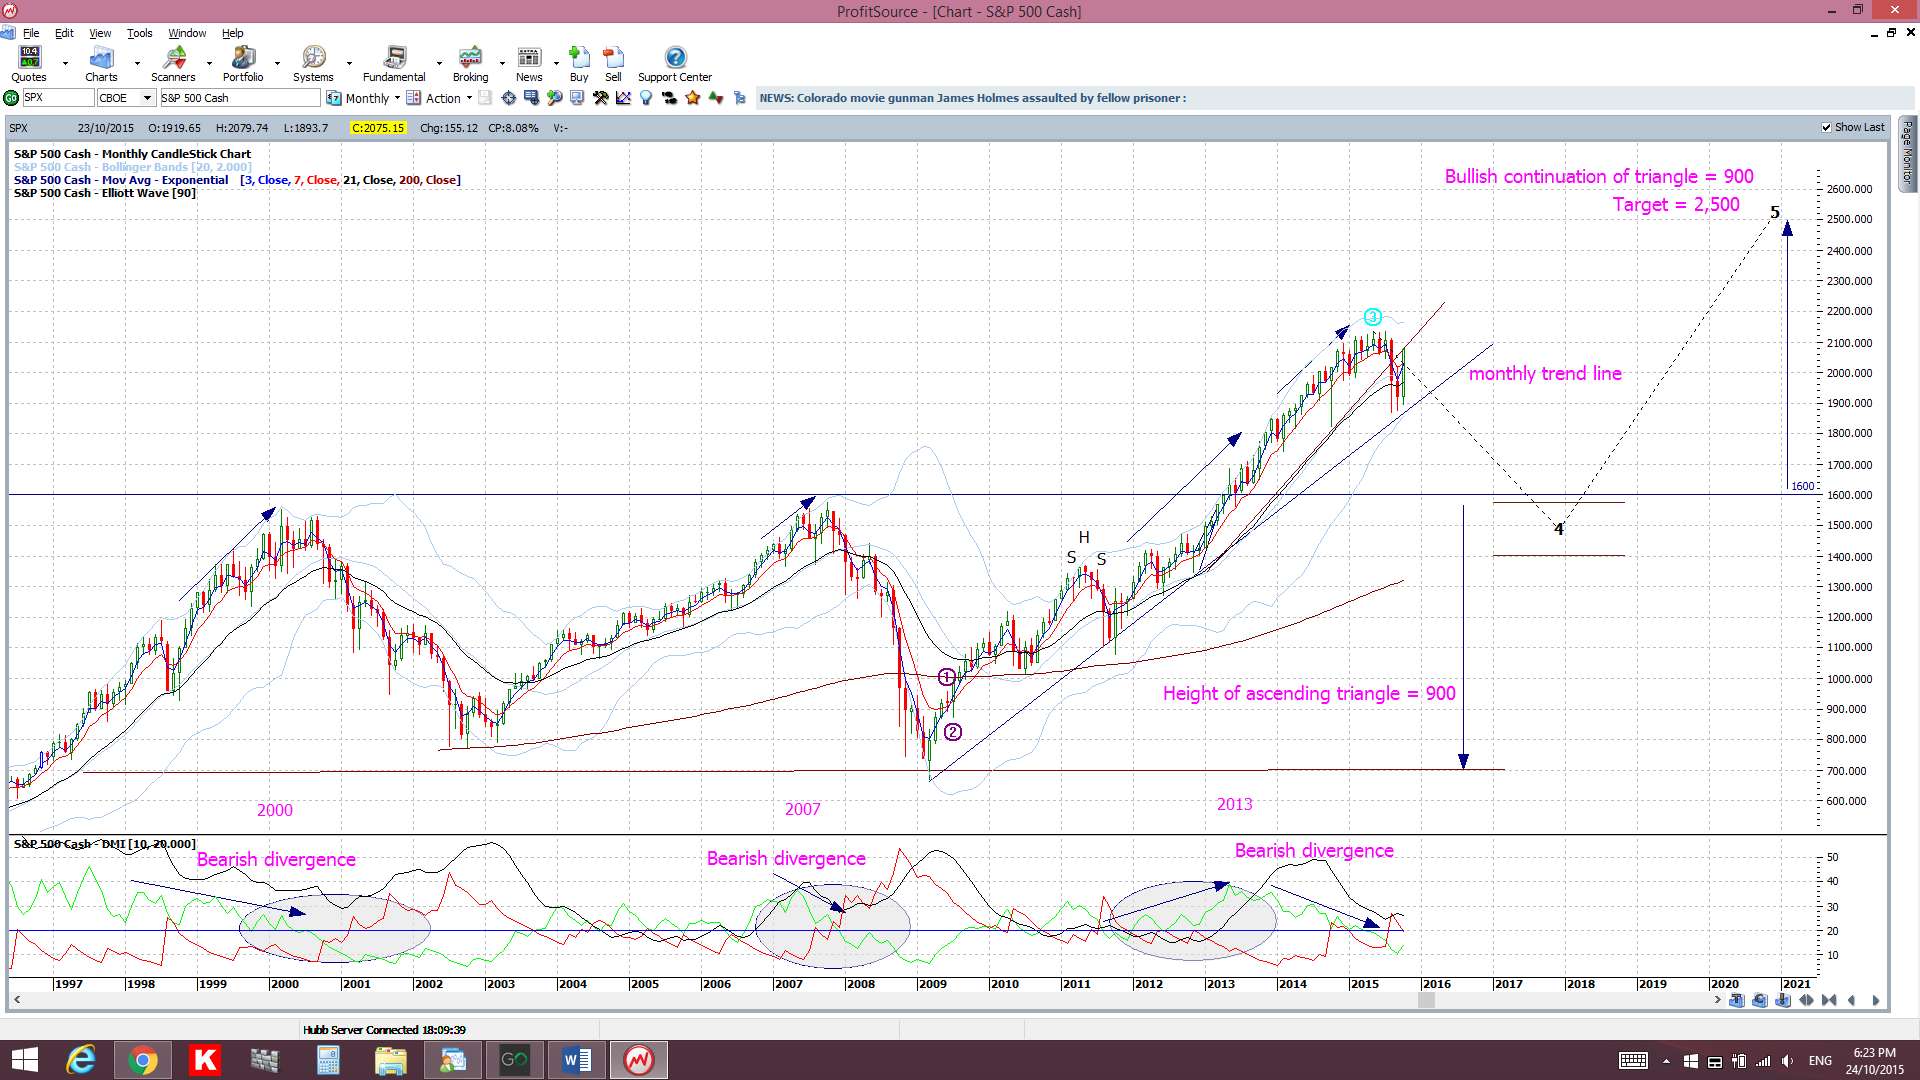
S&P500 70 Year chart: We have not seen a test of the 1,600 breakout range yet, as per the previous breakout period. I’m wondering if this will evolve at all though 

Summary: There are key levels to watch on the S&P500 with this week’s FOMC:
- Bullish levels: the previous daily trend line and, then, the 2,135 region.
- Bearish levels: the 2,000 level.
The post S&P500 ahead of FOMC. appeared first on www.forextell.com.