Here is how I’m seeing the daily chart of some stock Indices shaping up this week (and one 4hr chart). Not a lot has changed since my w/e post. I did write a separate article over the w/e noting that I am looking for healthy pullback on some of the Indices and this remains a work in progress. I hold a bullish view for stocks over the longer term BUT trends do not travel in straight lines forever.
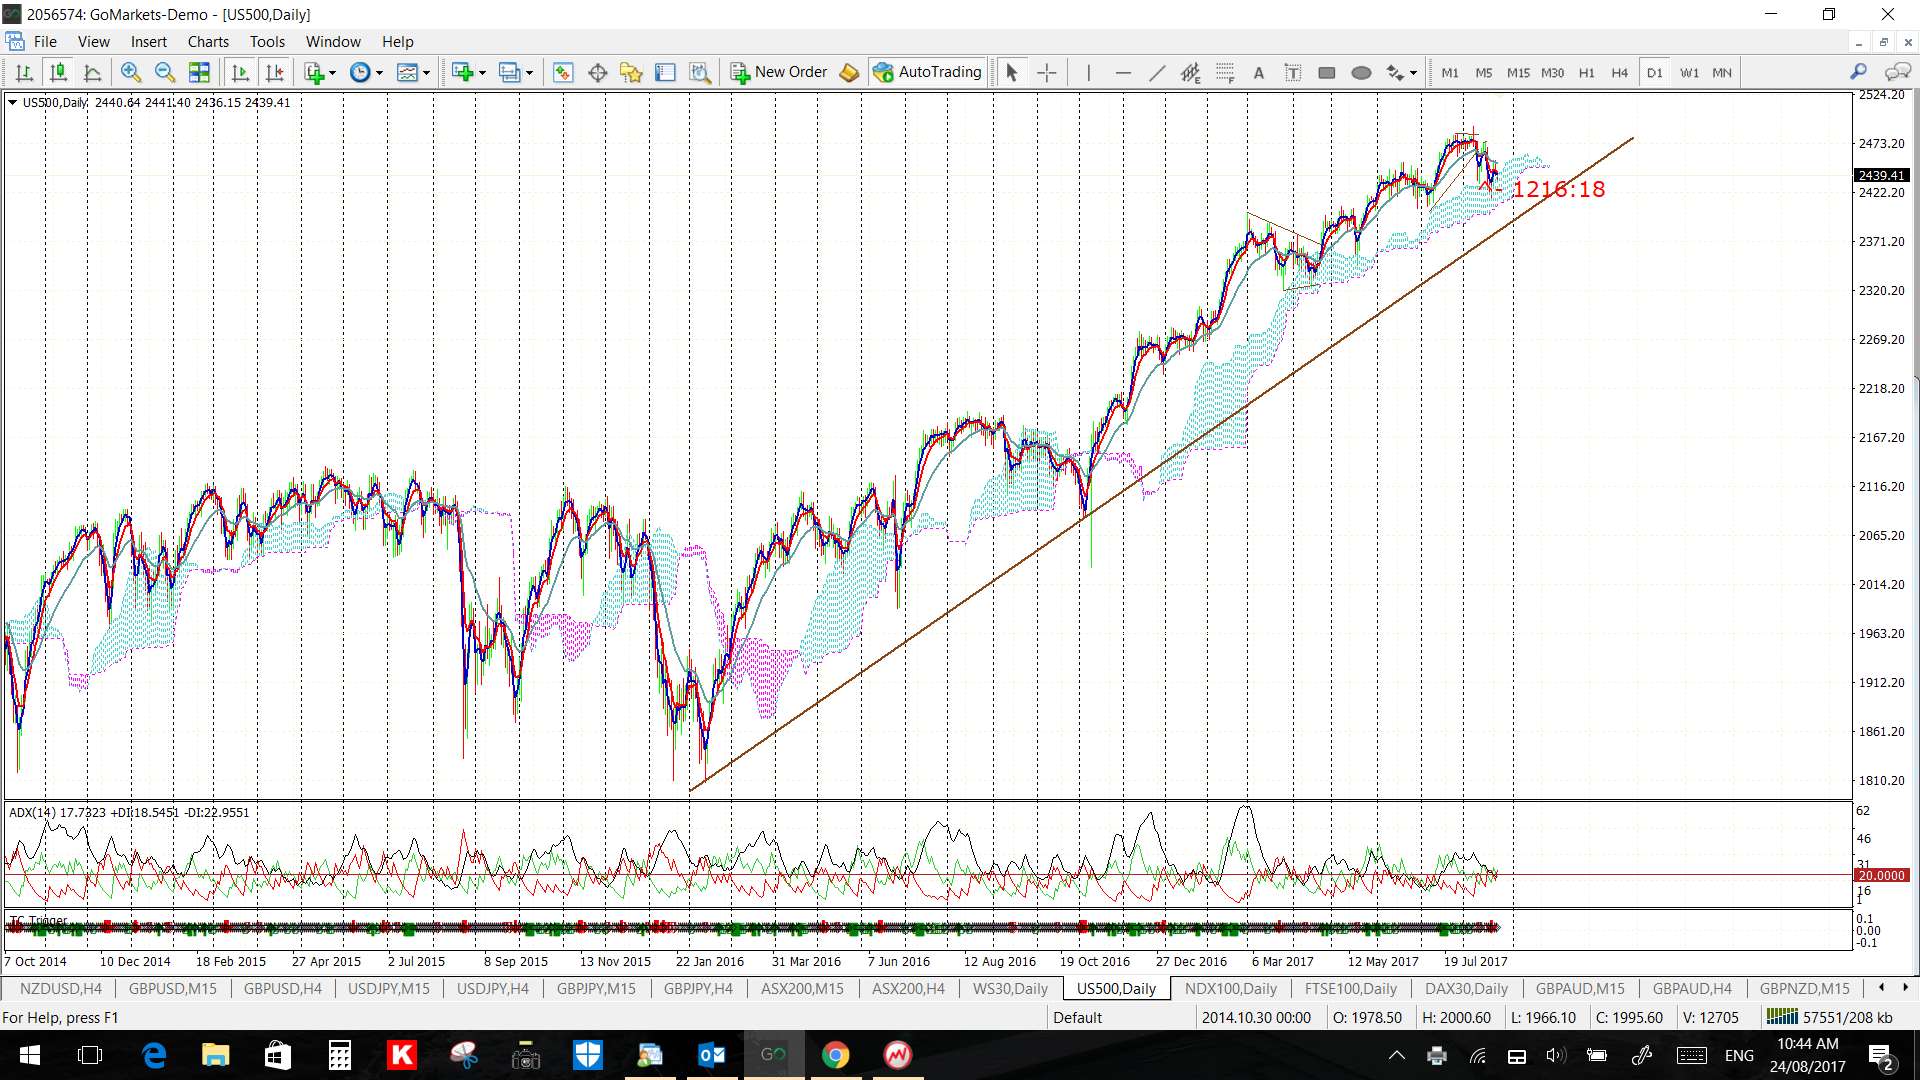
S&P500 daily: this latest uptrend is of 19 month duration so watch the trend line for any new make or break activity. Any breakdown could then lead to a Bull Flag though so I’ll map that if and when that might evolve:
S&P500 multi-year chart: this chart needs to be updated for recent price action BUT it is the overall pattern that is key here. I still think a test of 1,600 would be healthy; painful but healthy! My wish? A short sharp, fat finger style dip and then recovery! Now…what could trigger that? I have my thoughts. You?

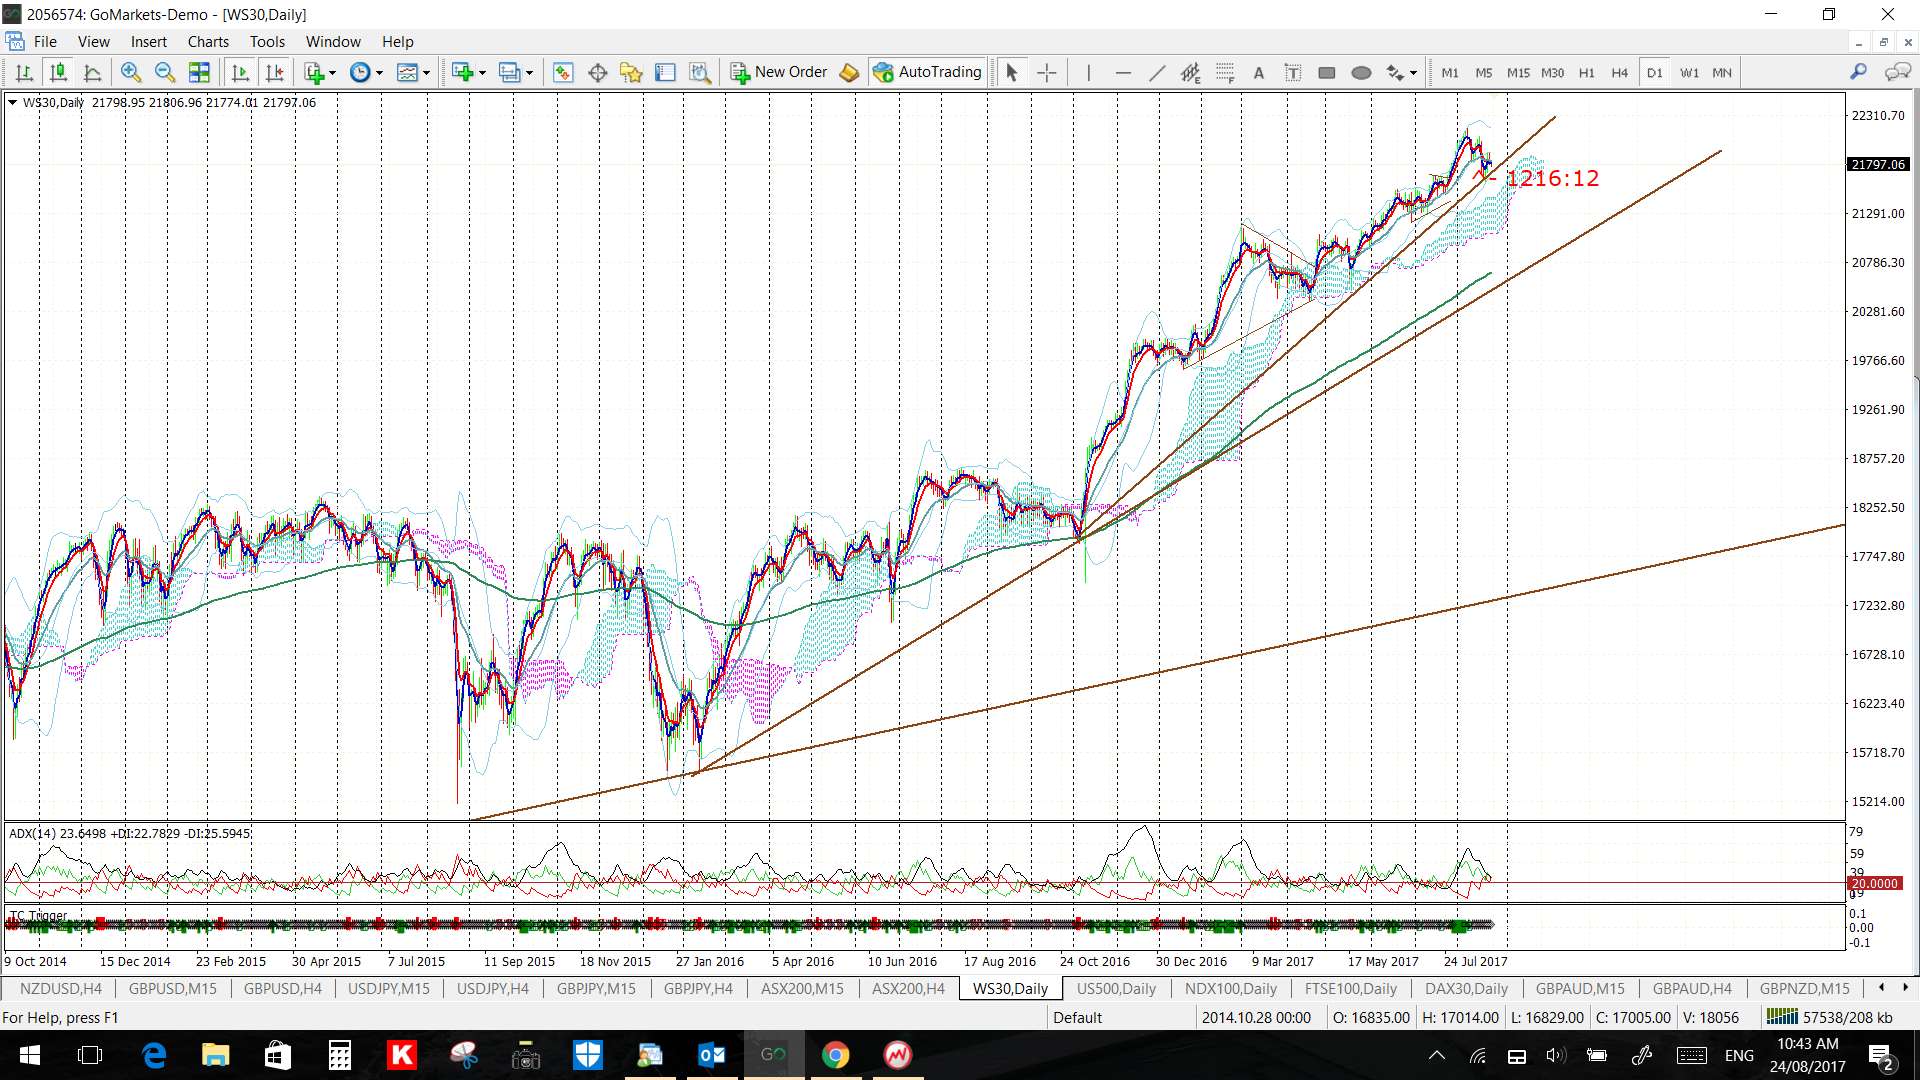
DJIA daily: as for the S&P500 daily chart here.
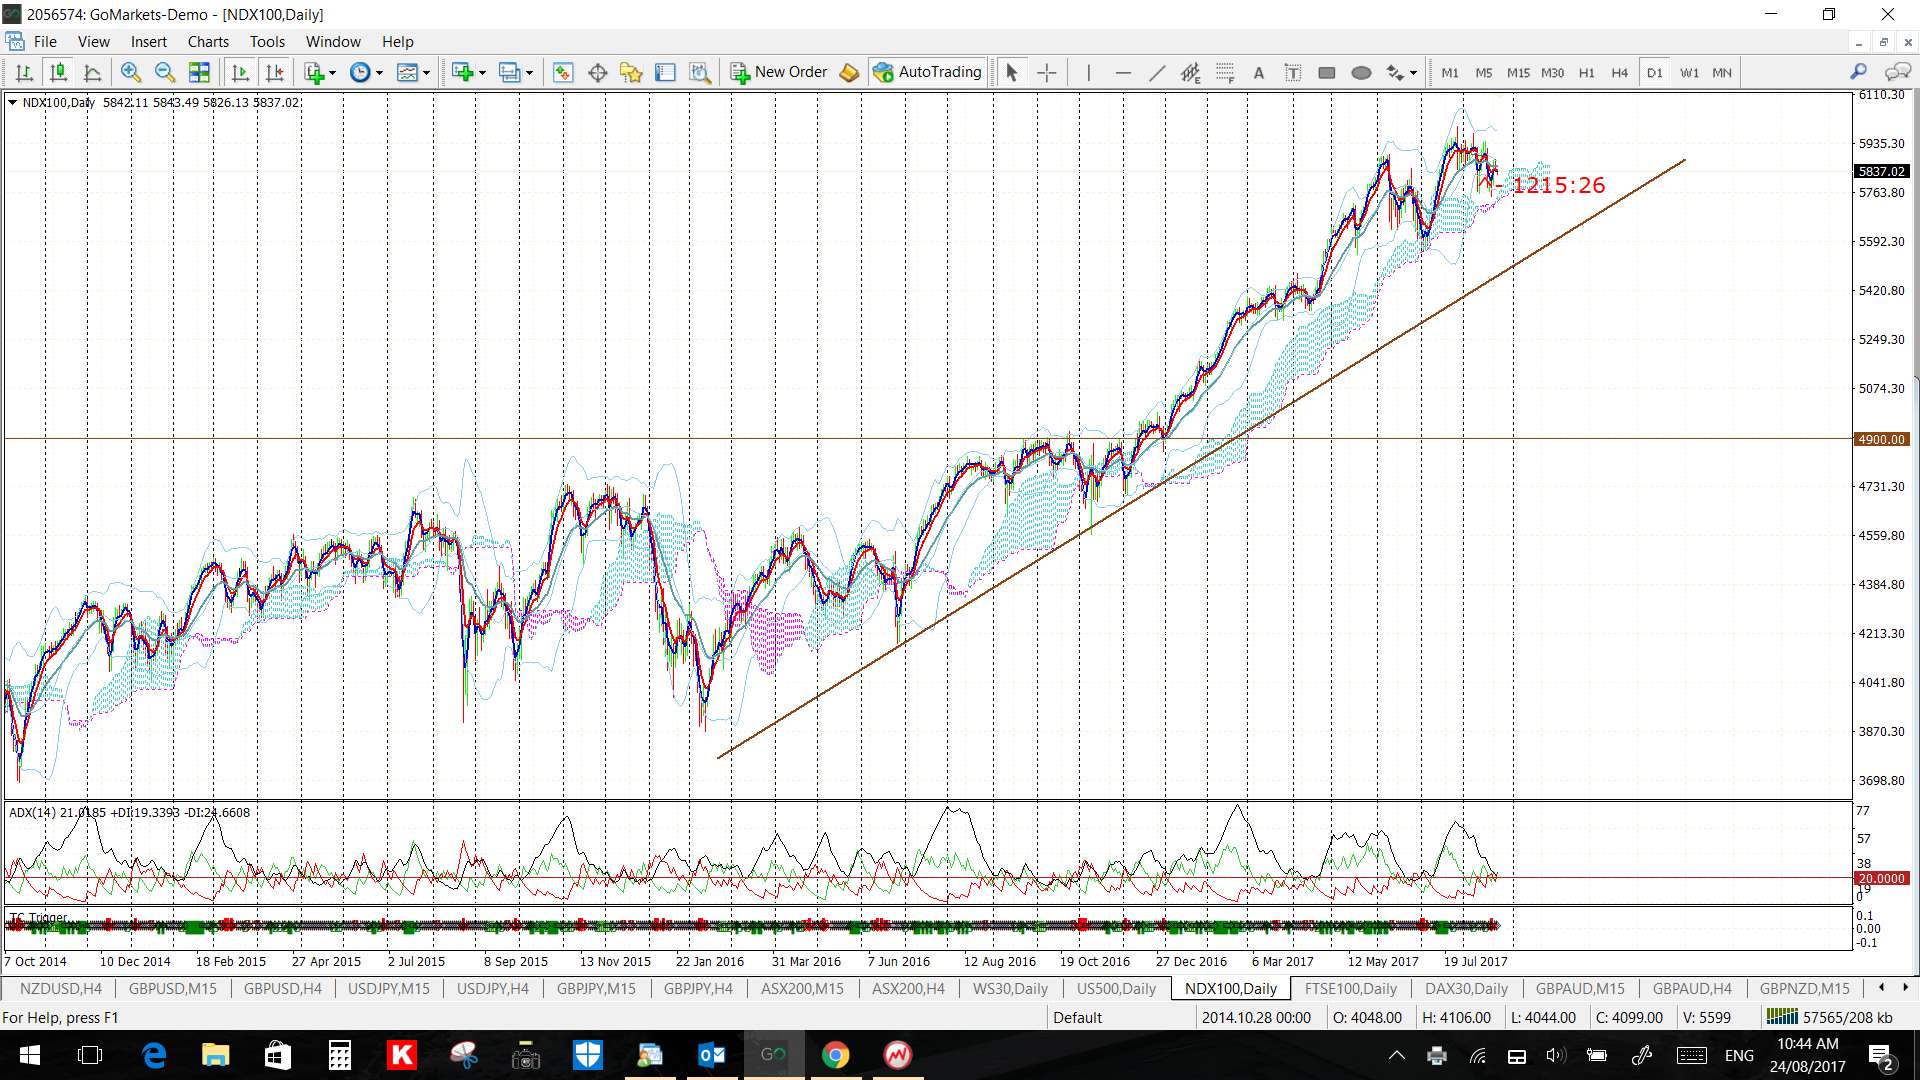
NDX daily: and ditto here too:
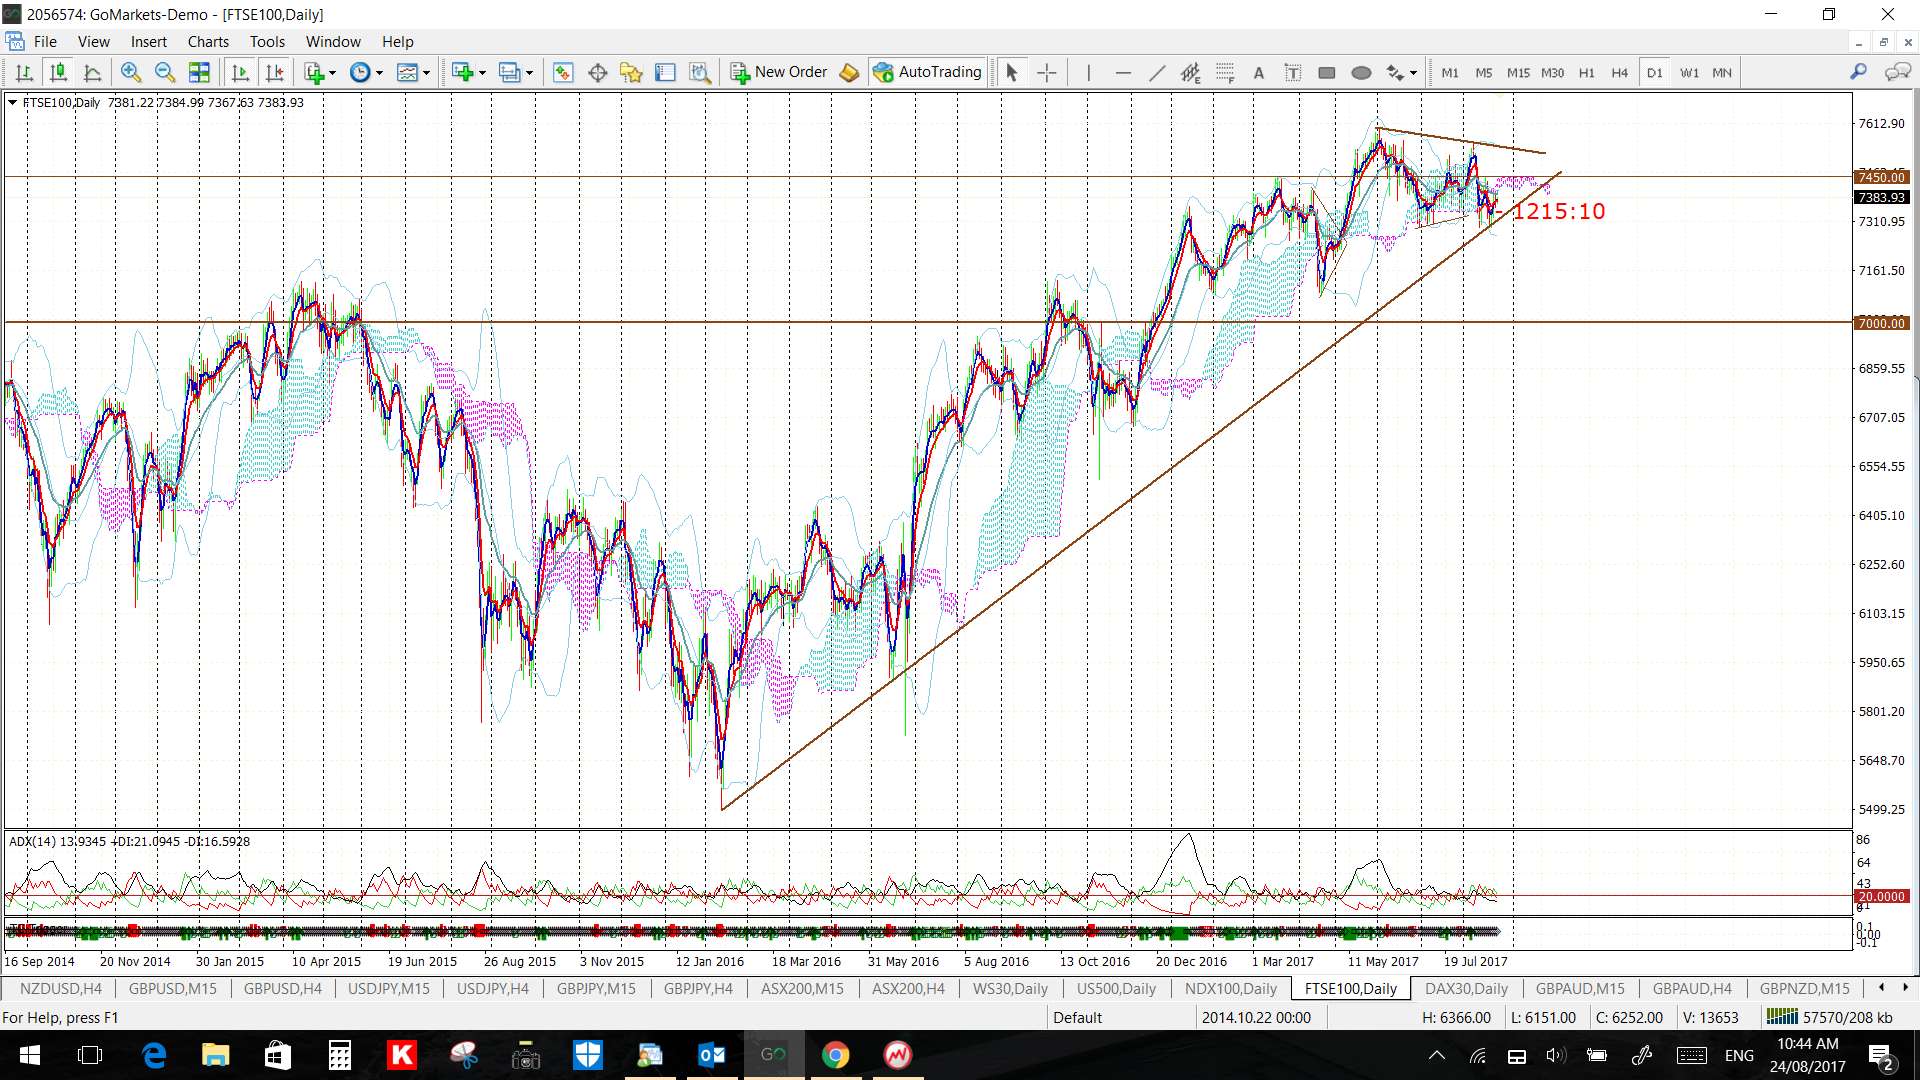
FTSE daily: pretty much the same scenario here too:
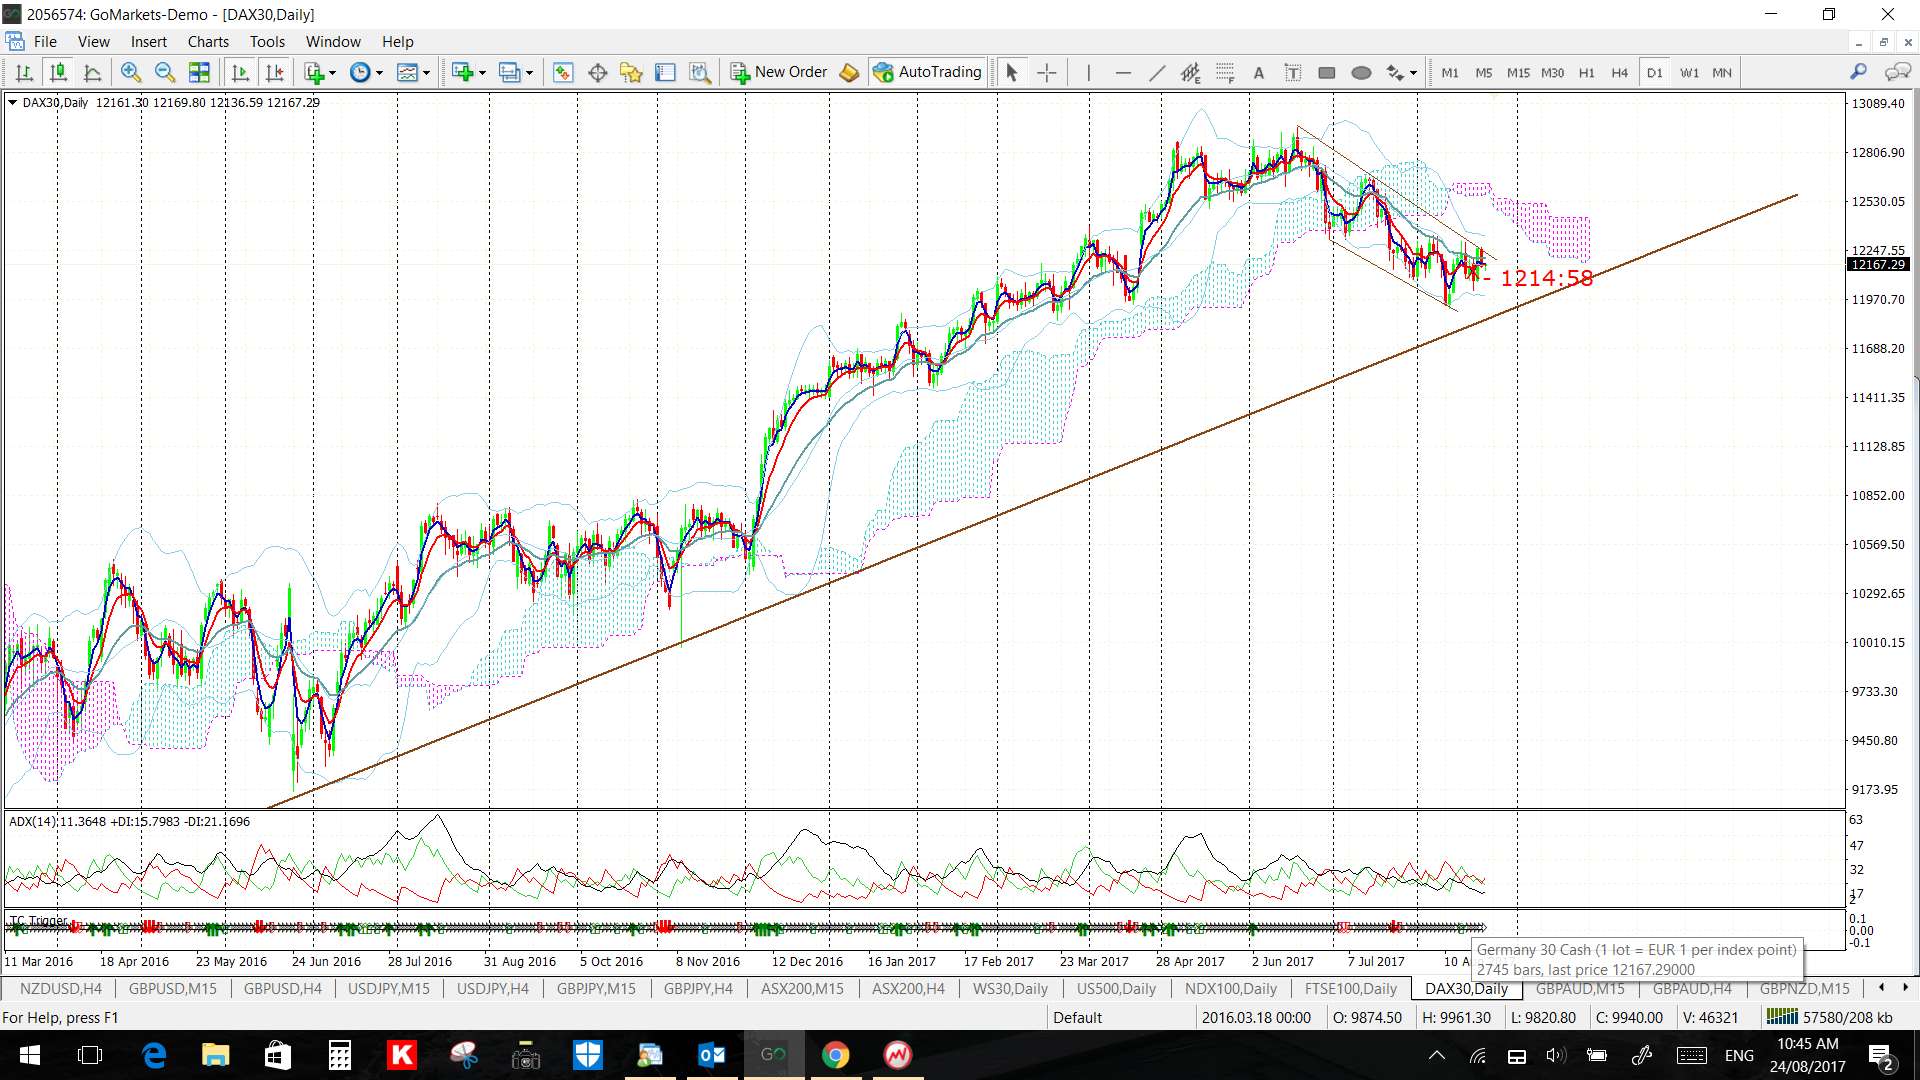
DAX daily: this already has a bit of a Bull Flag thing happening so watch the trend lines for any new breakout.
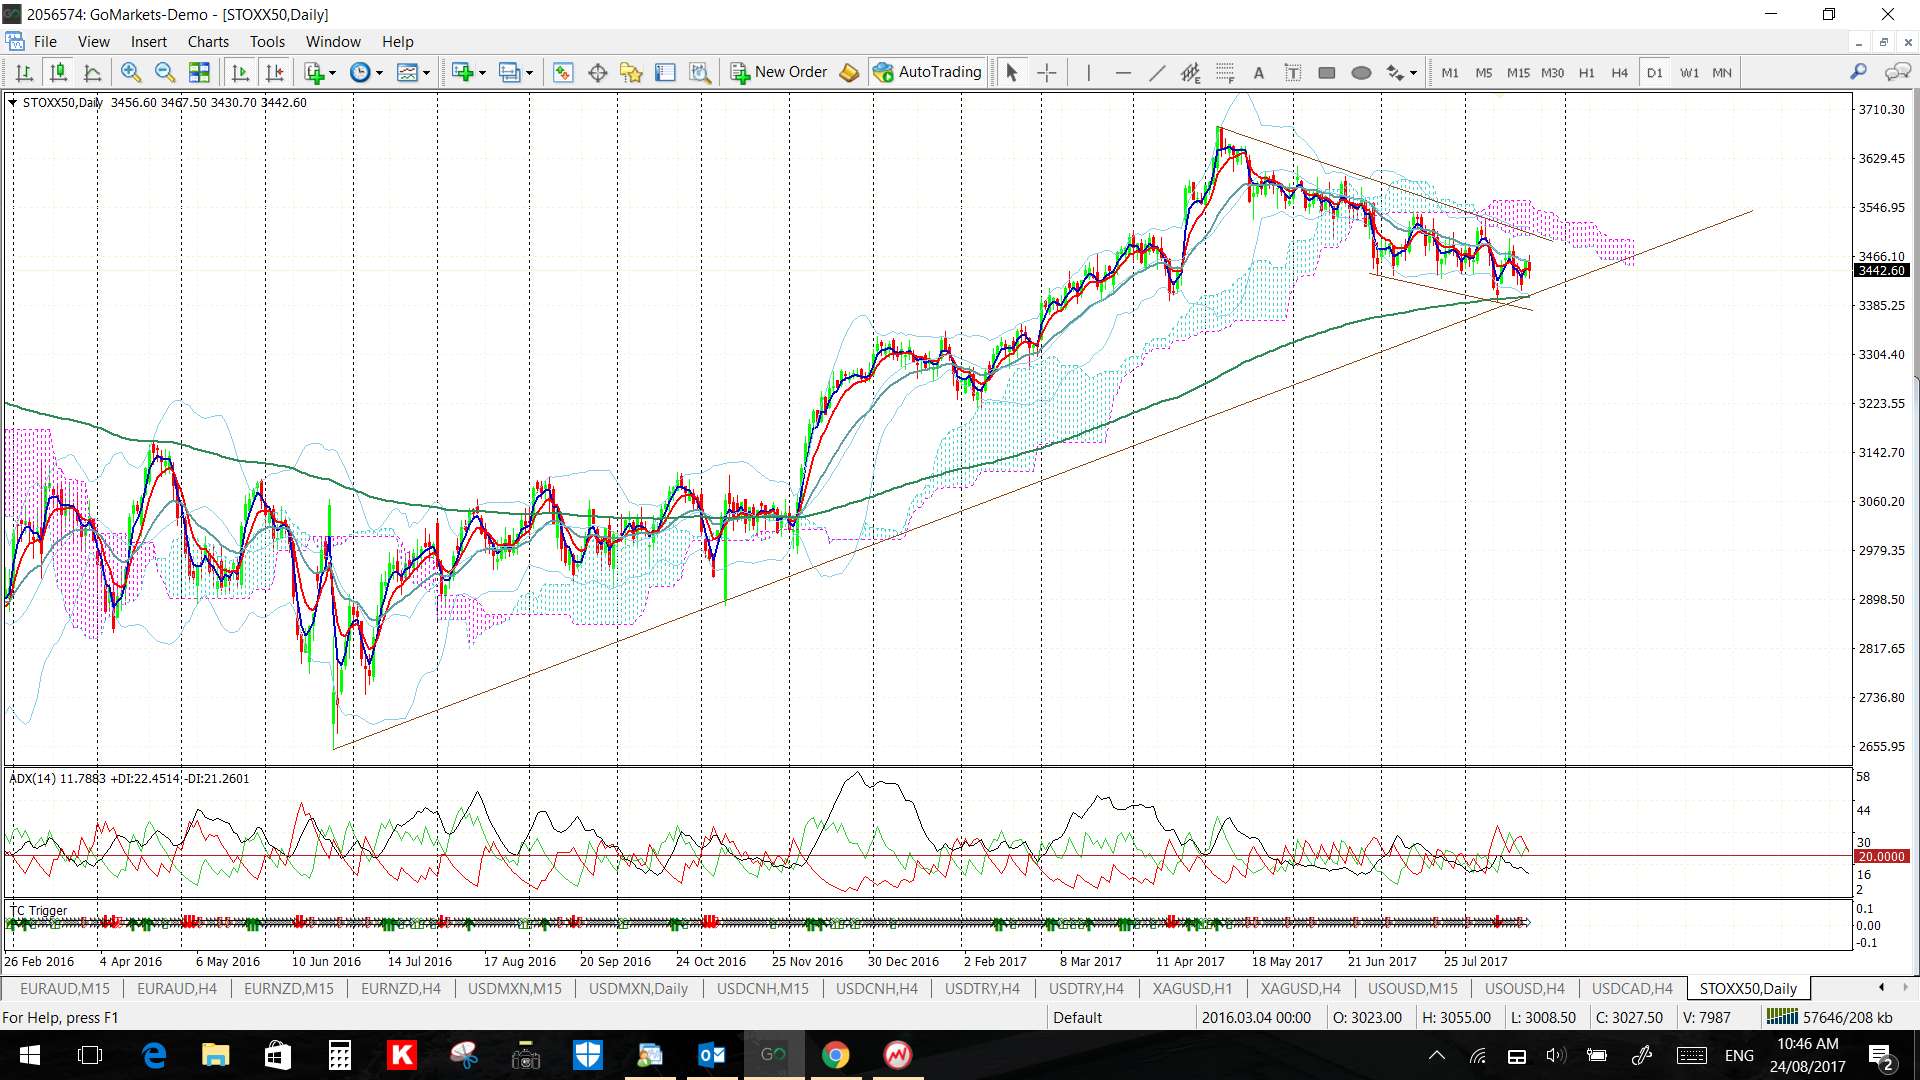
STOXX-50 daily: ditto here:
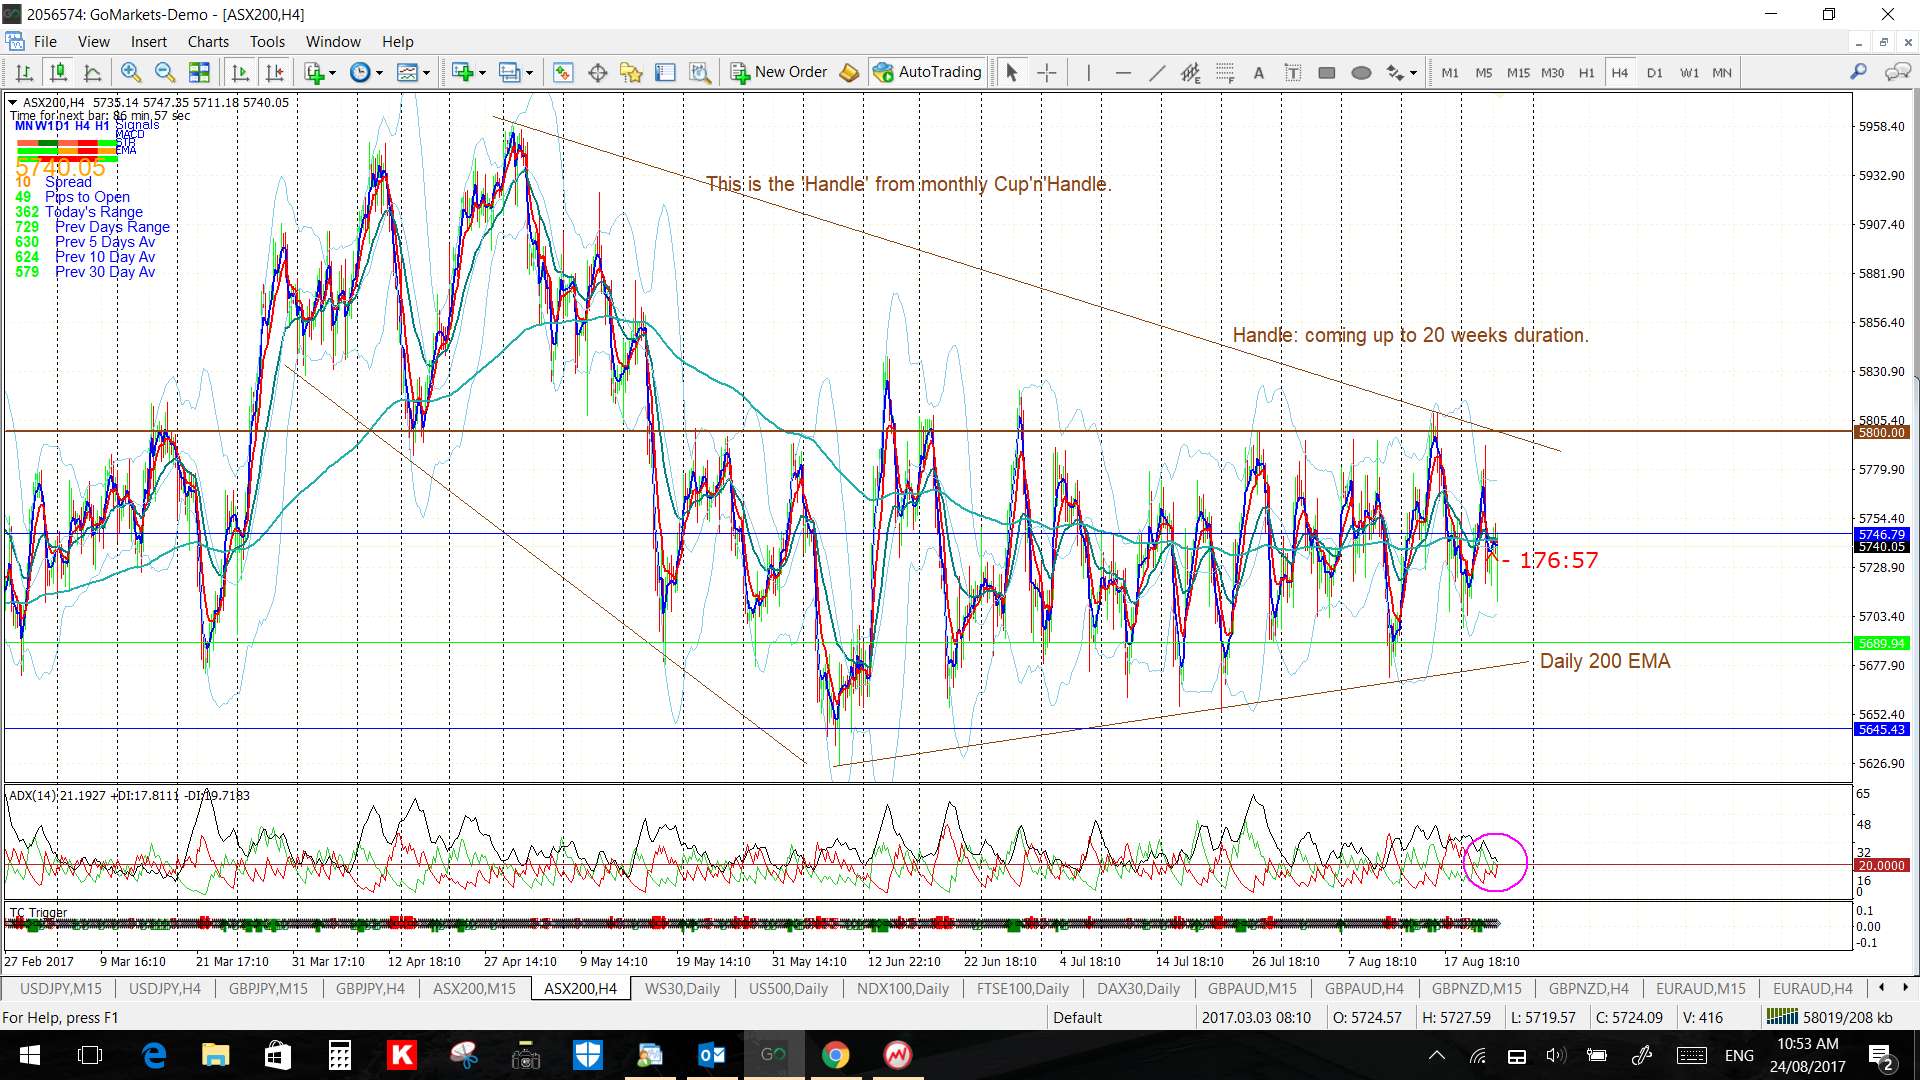
ASX-200 4hr: this wedge is from the monthly chart’s Cup ‘n’ Handle but watch the trend lines for any breakout: