Many stock indices are looking quite bullish at the moment and a few are in the process of breaking up through major resistance levels. This is how I am seeing them and, also, a couple of commodities and a few different stocks.
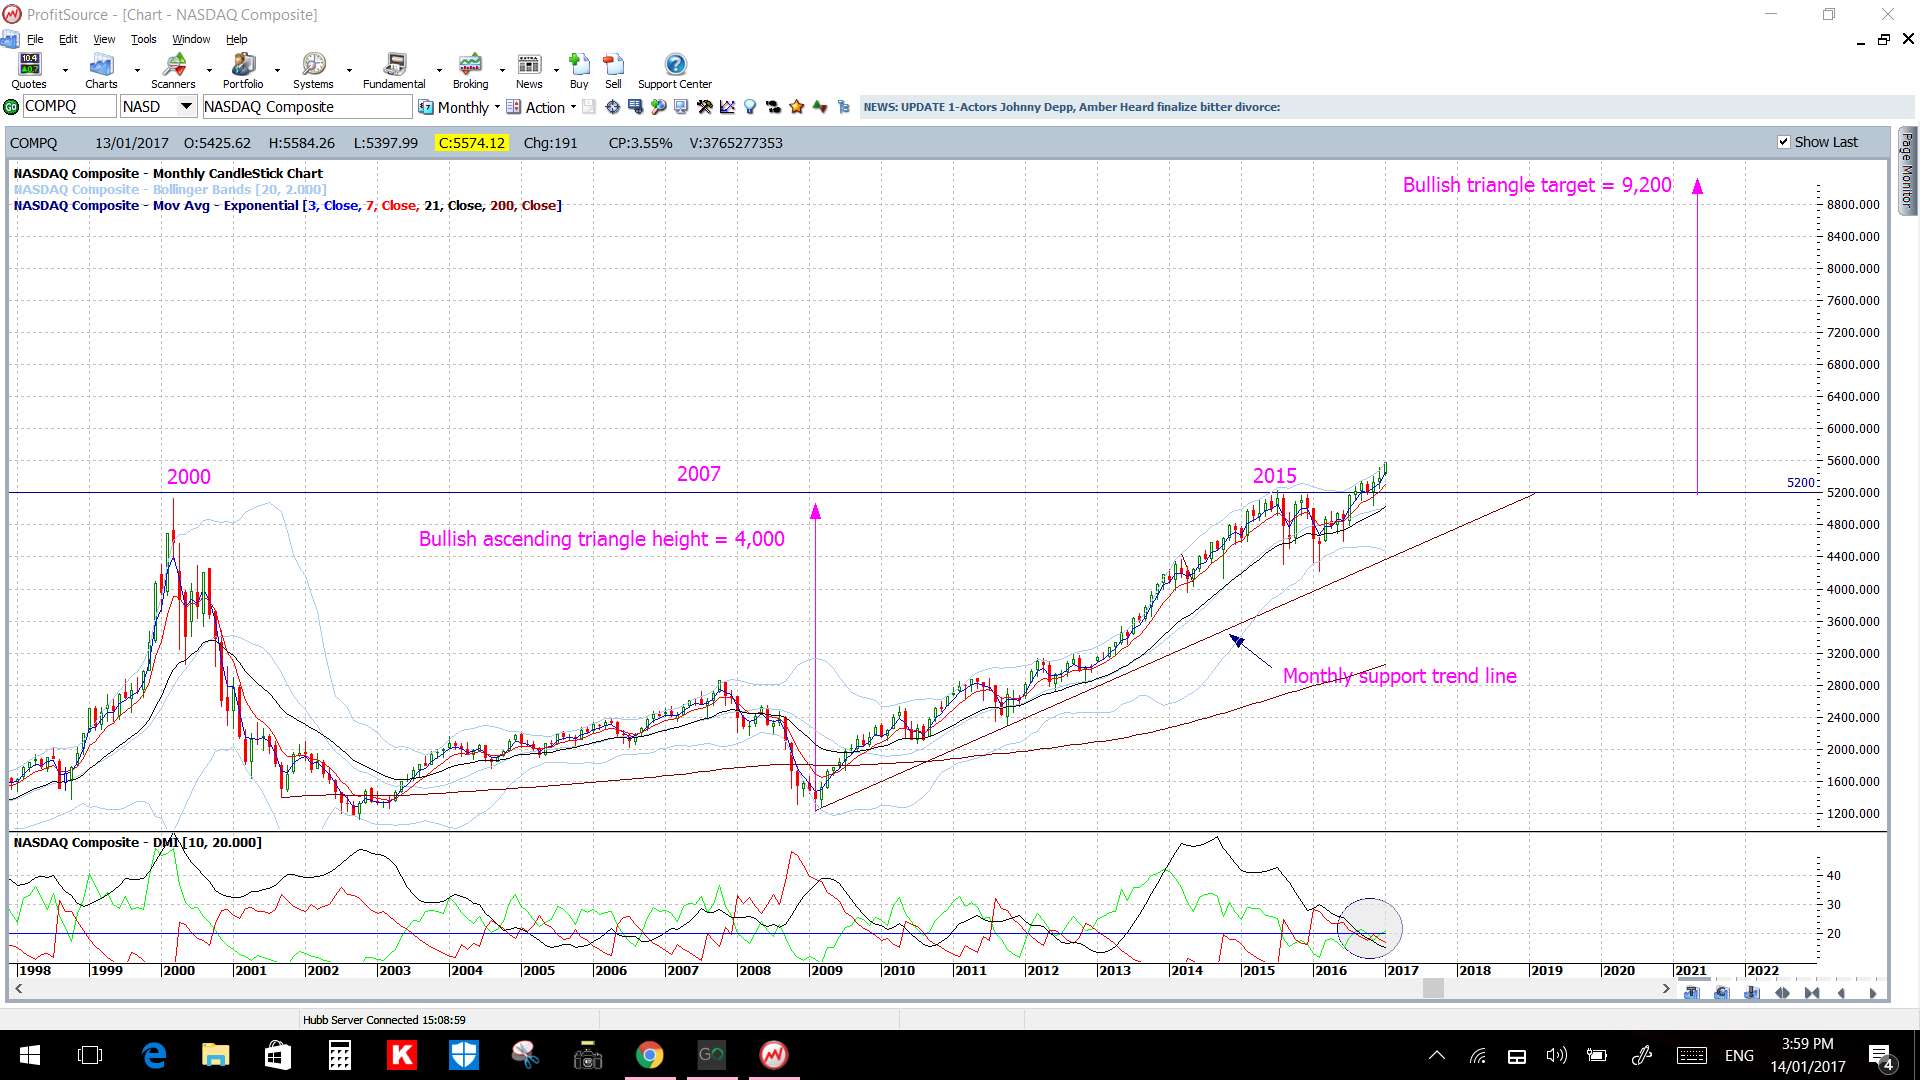
NASDAQ monthly: I have been tracking this bullish triangle breakout since September 2014, that is, for over two years! I gave some presentations about this breakout in 2015 but, clearly, I was a bit premature. Maybe not now though it seems! I’m on the lookout for any continuation move to head towards the 9,000 region and, if so, this would have consequences for many NASDAQ stocks, some of which are posted further down within this post. The ascending triangle breakout move that looks to be in progress here follows on from those already in play on the S&P500 and DJIA indices:
S&P500 monthly: the bullish breakout is still in play here:

DJIA monthly: here too:

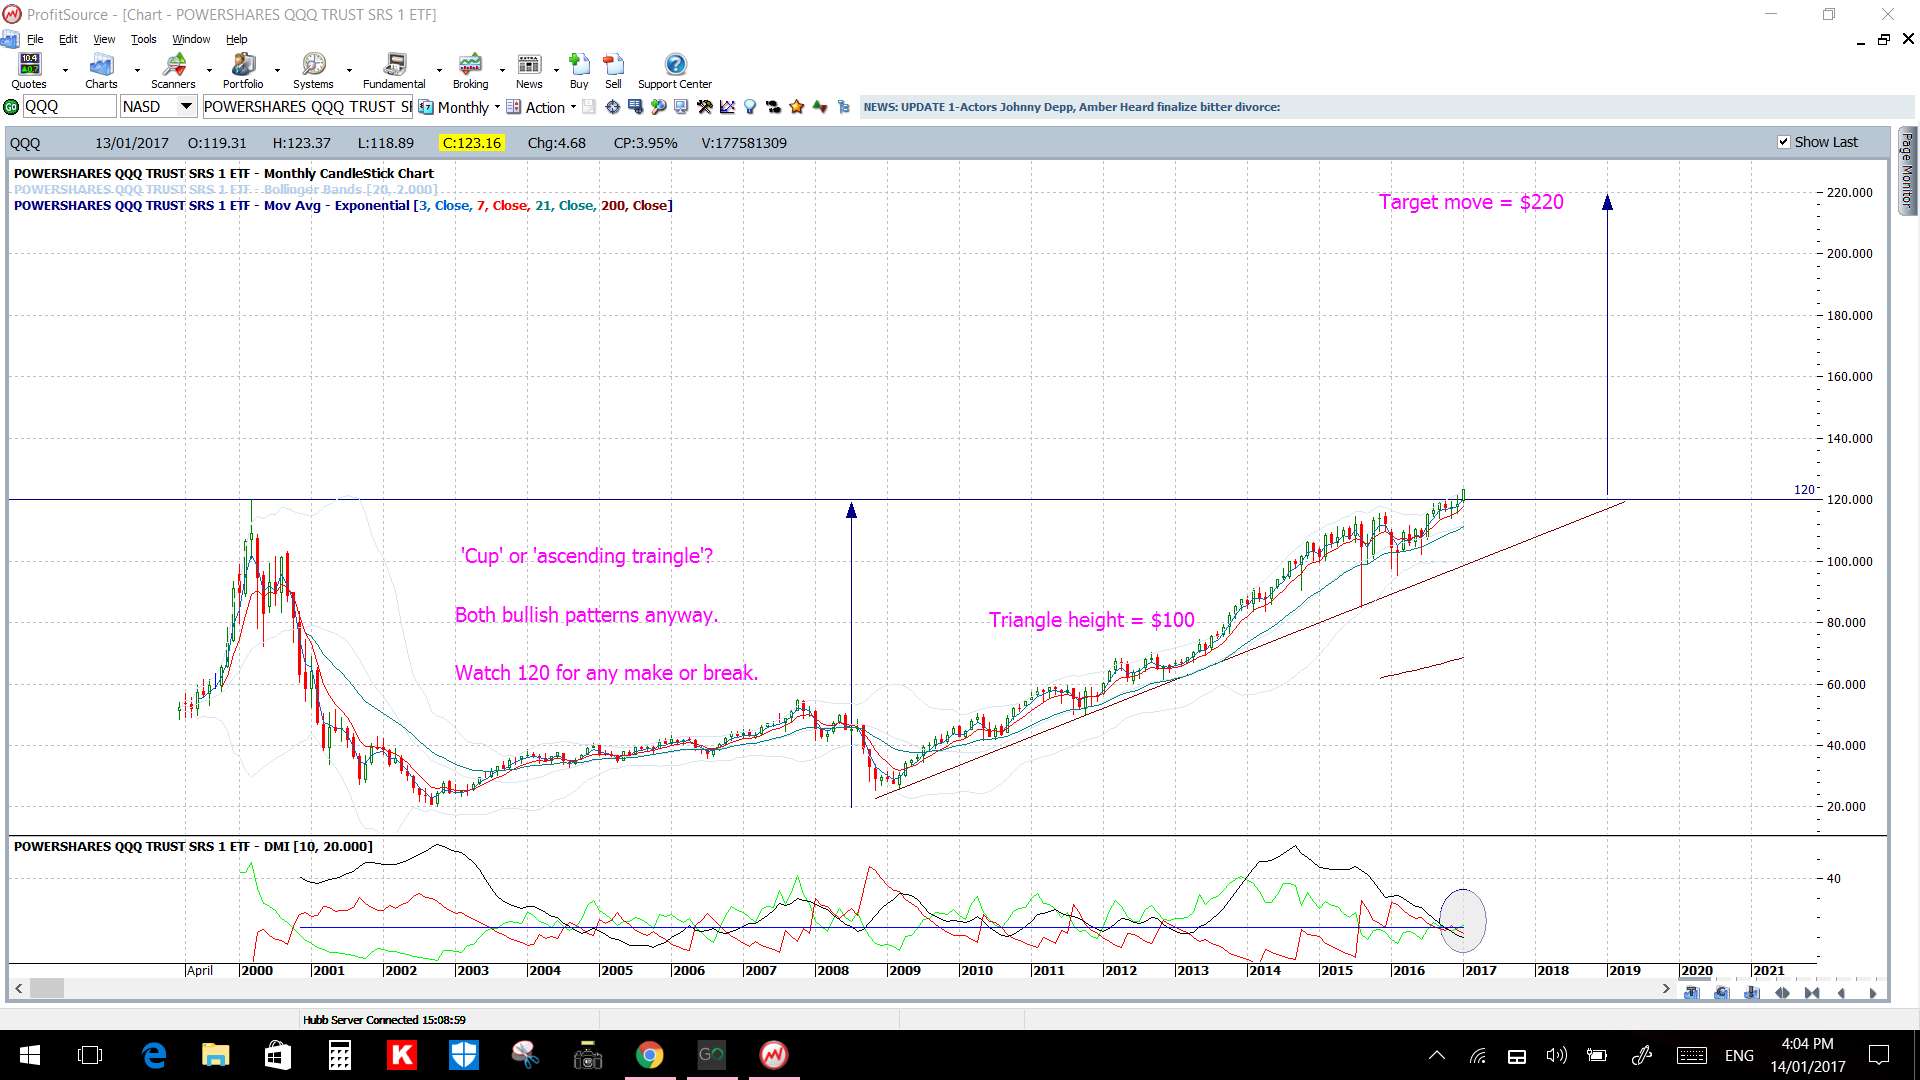
QQQ monthly: the NASDAQ-100 ETF: a new monthly close above 120 would trigger a bullish ascending triangle breakout here too:
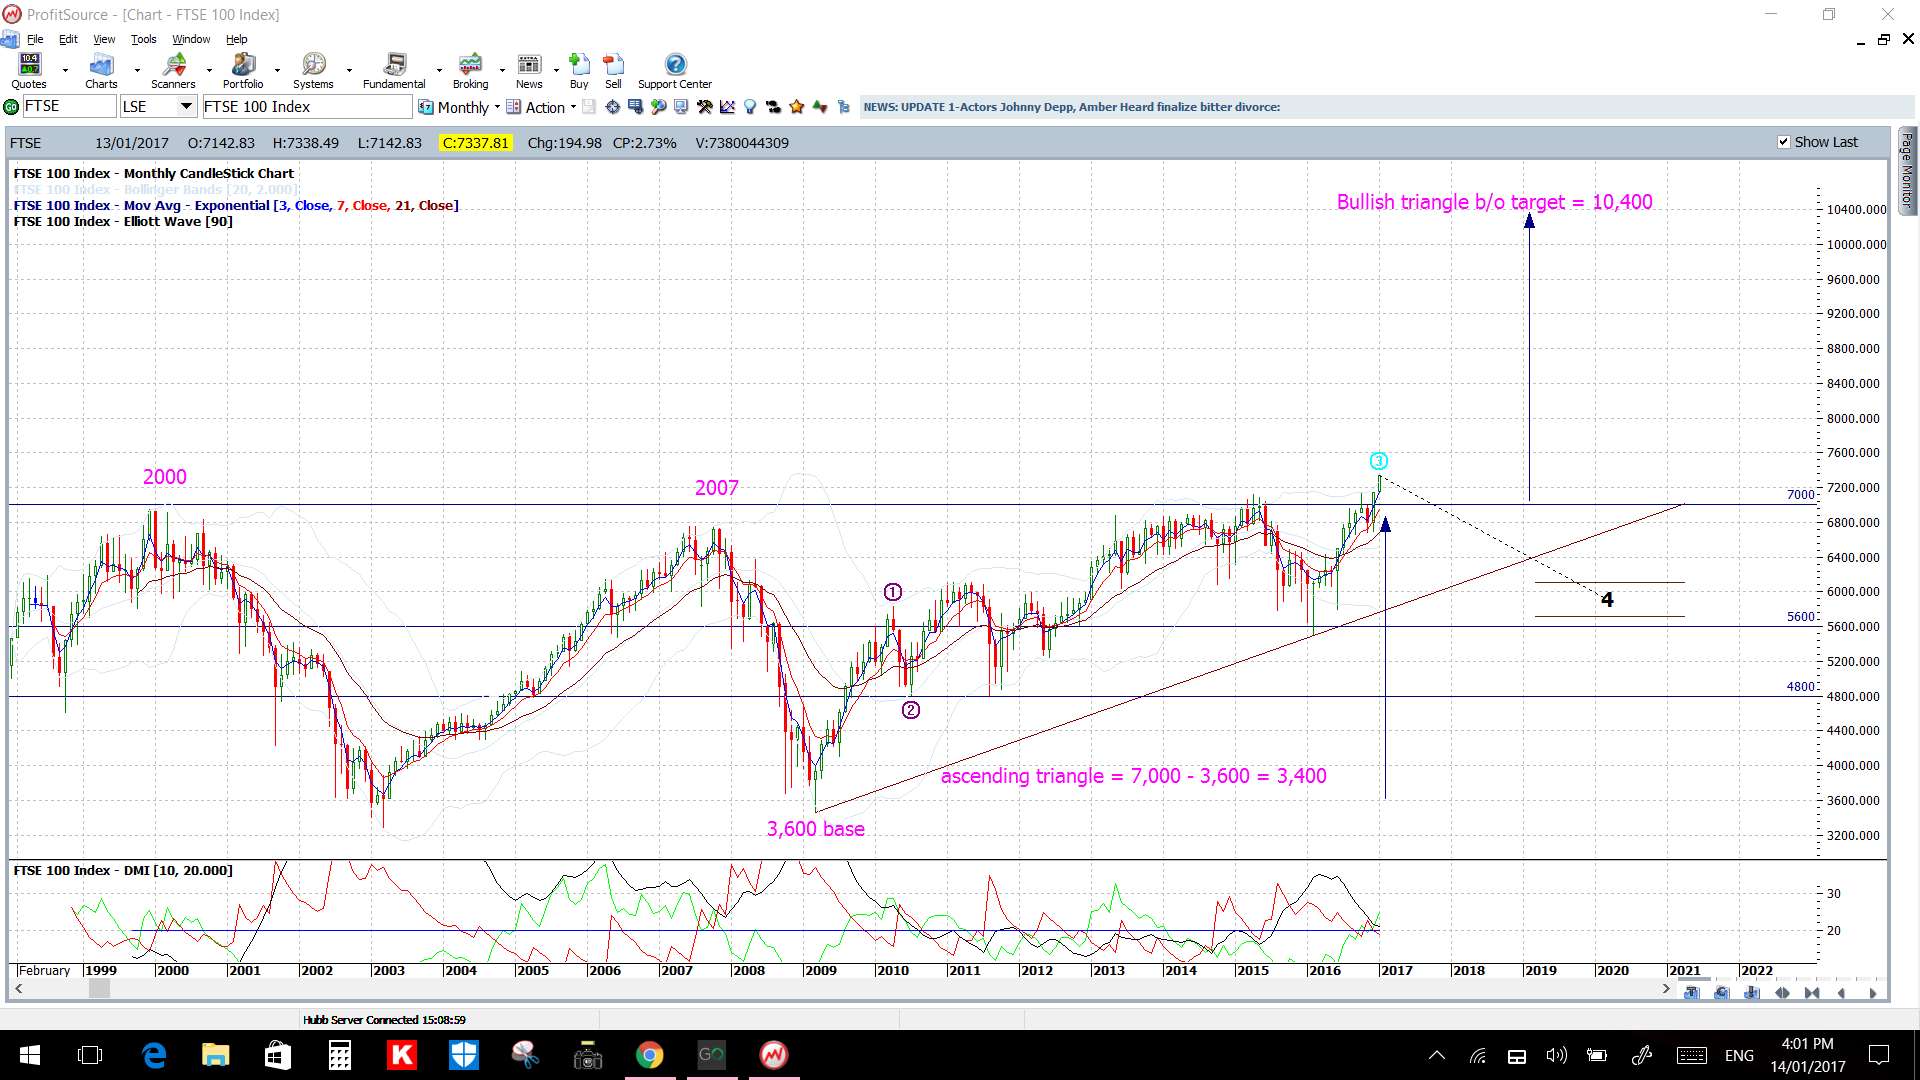
FTSE-100 monthly: this index also looks to be embarking on a bullish ascending triangle breakout with a target up near 10,000:
TSX monthly: Canadian stocks look to be building up for a potential breakout as well. Keep an eye on the 15,750 level:

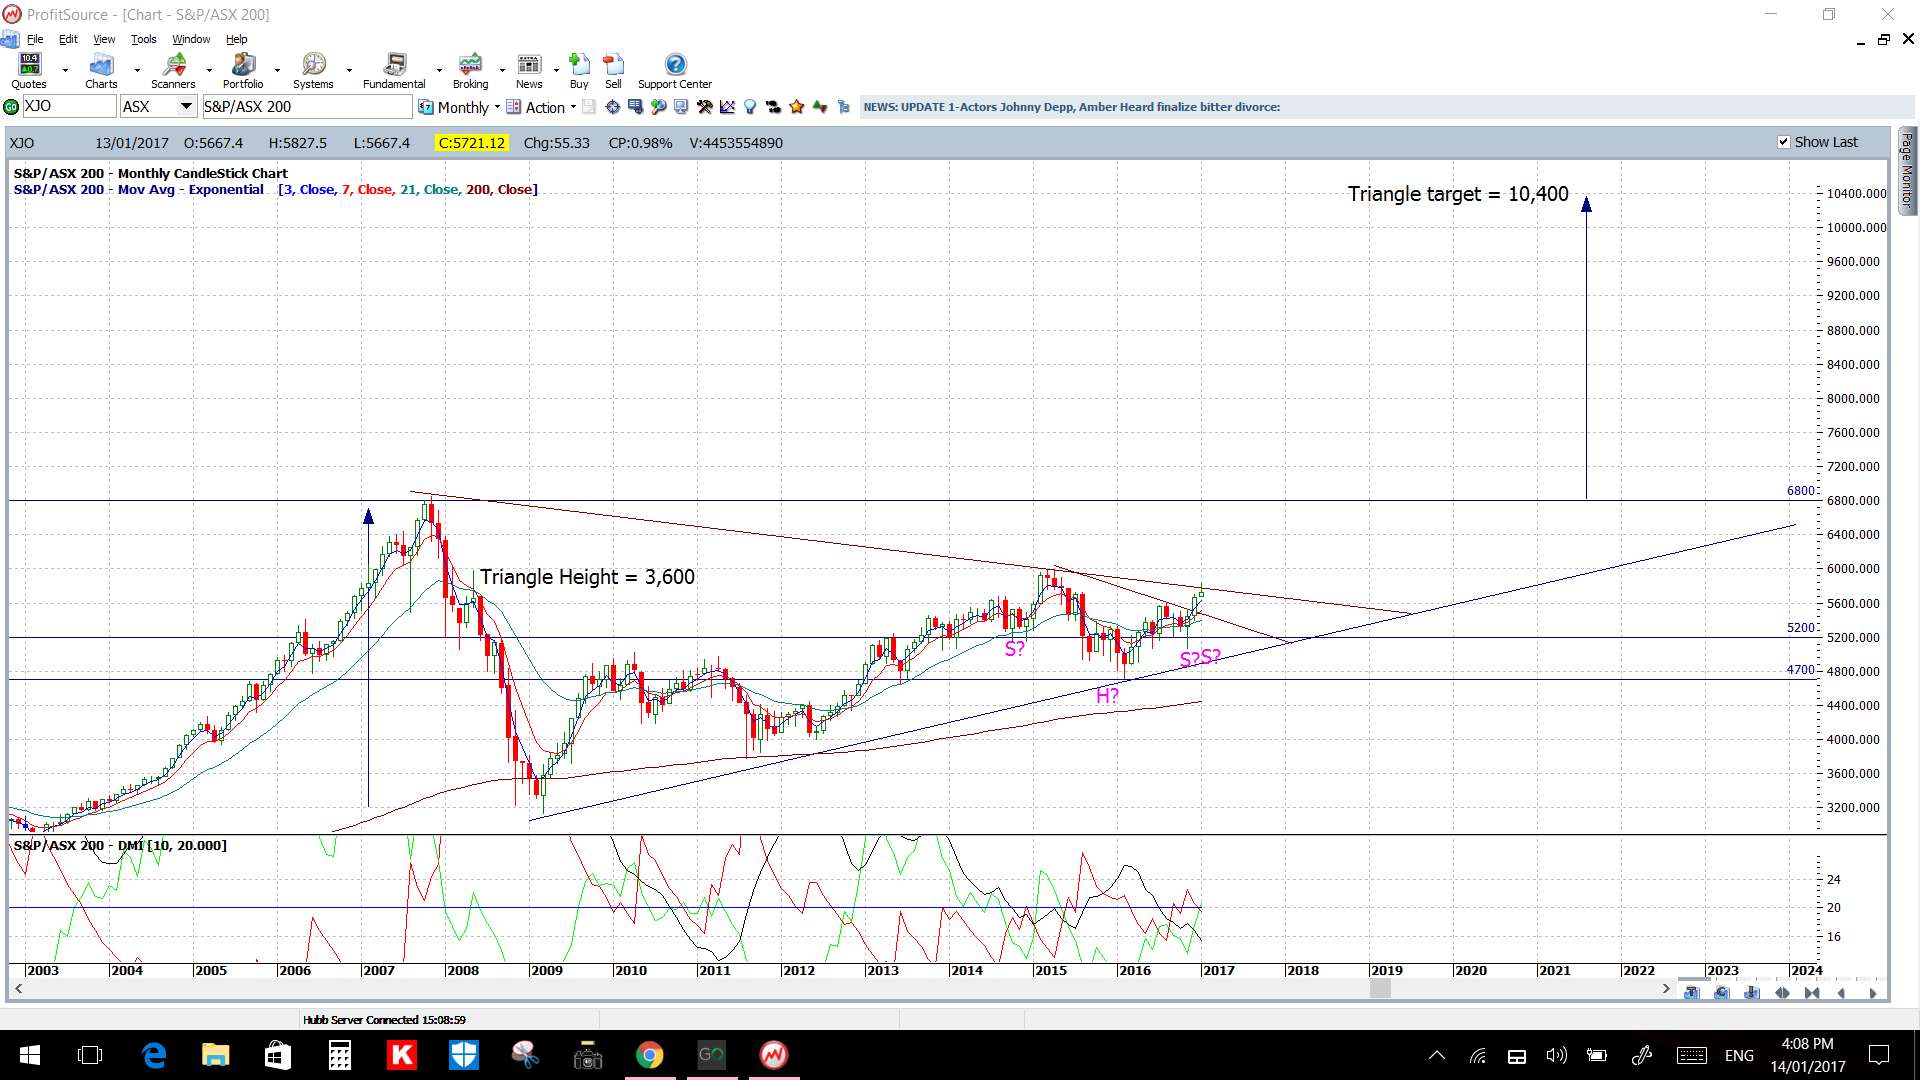
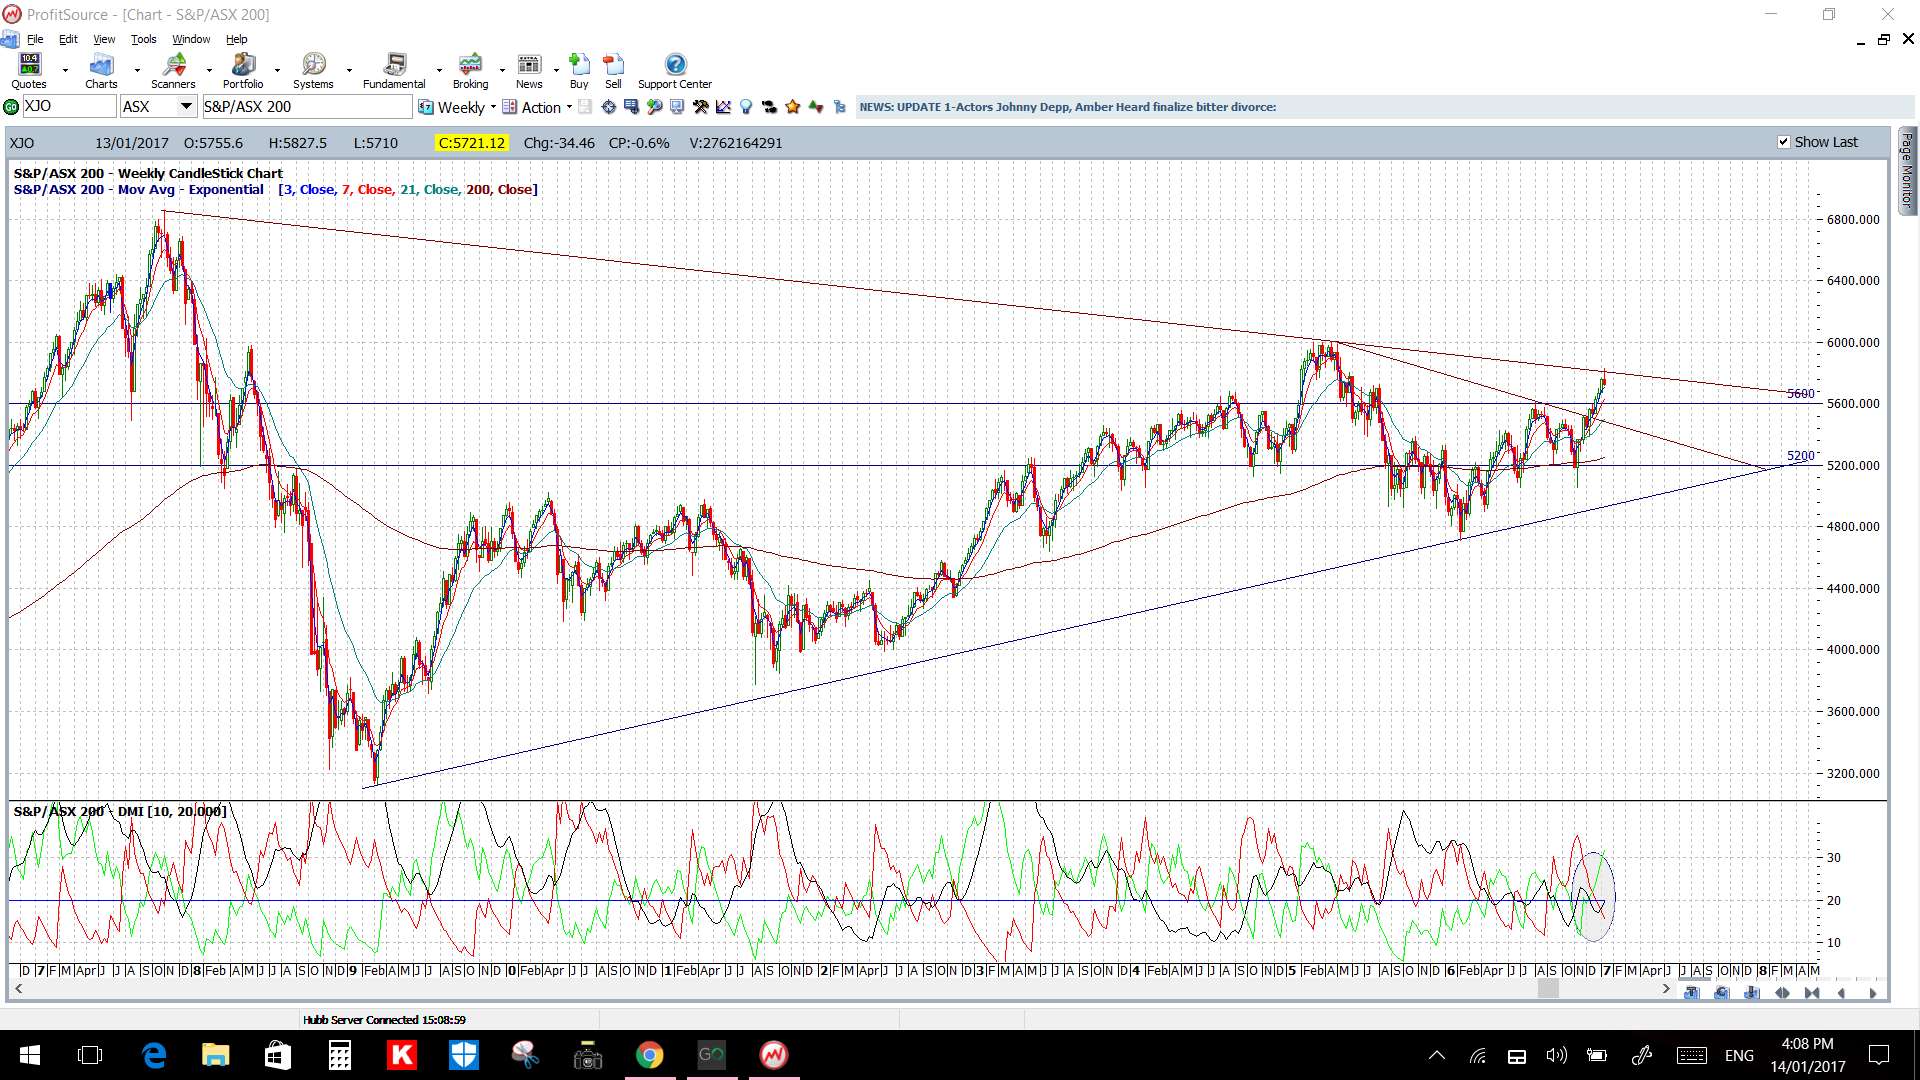
XJO: Aussie ASX top 200: there is a triangle breakout effort brewing here too so keep an eye on the 5,800 level and the monthly chart’s bear trend line. This bear trend line has been in play for almost 10 years and so any monthly candle close above this resistance would be significant:
XJO monthly:
XJO weekly:
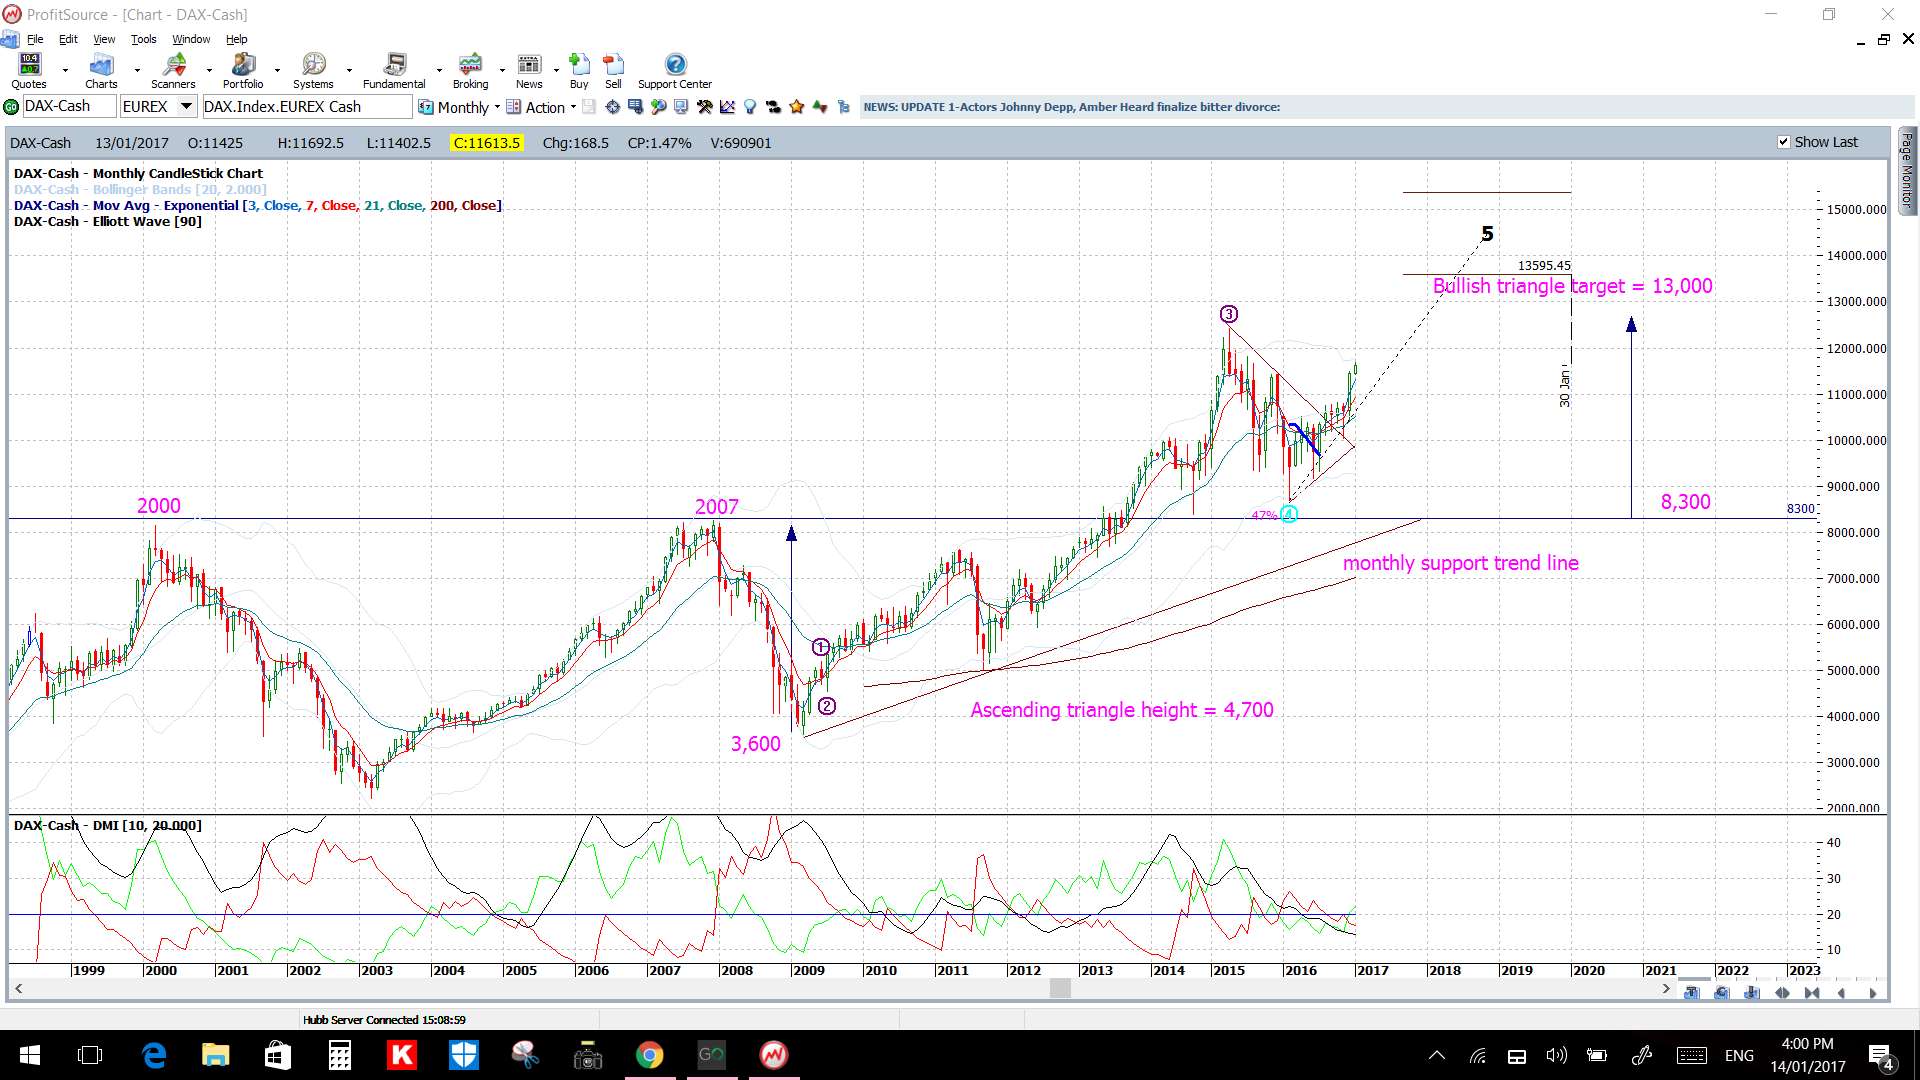
DAX monthly: the target here is up near 13,000:
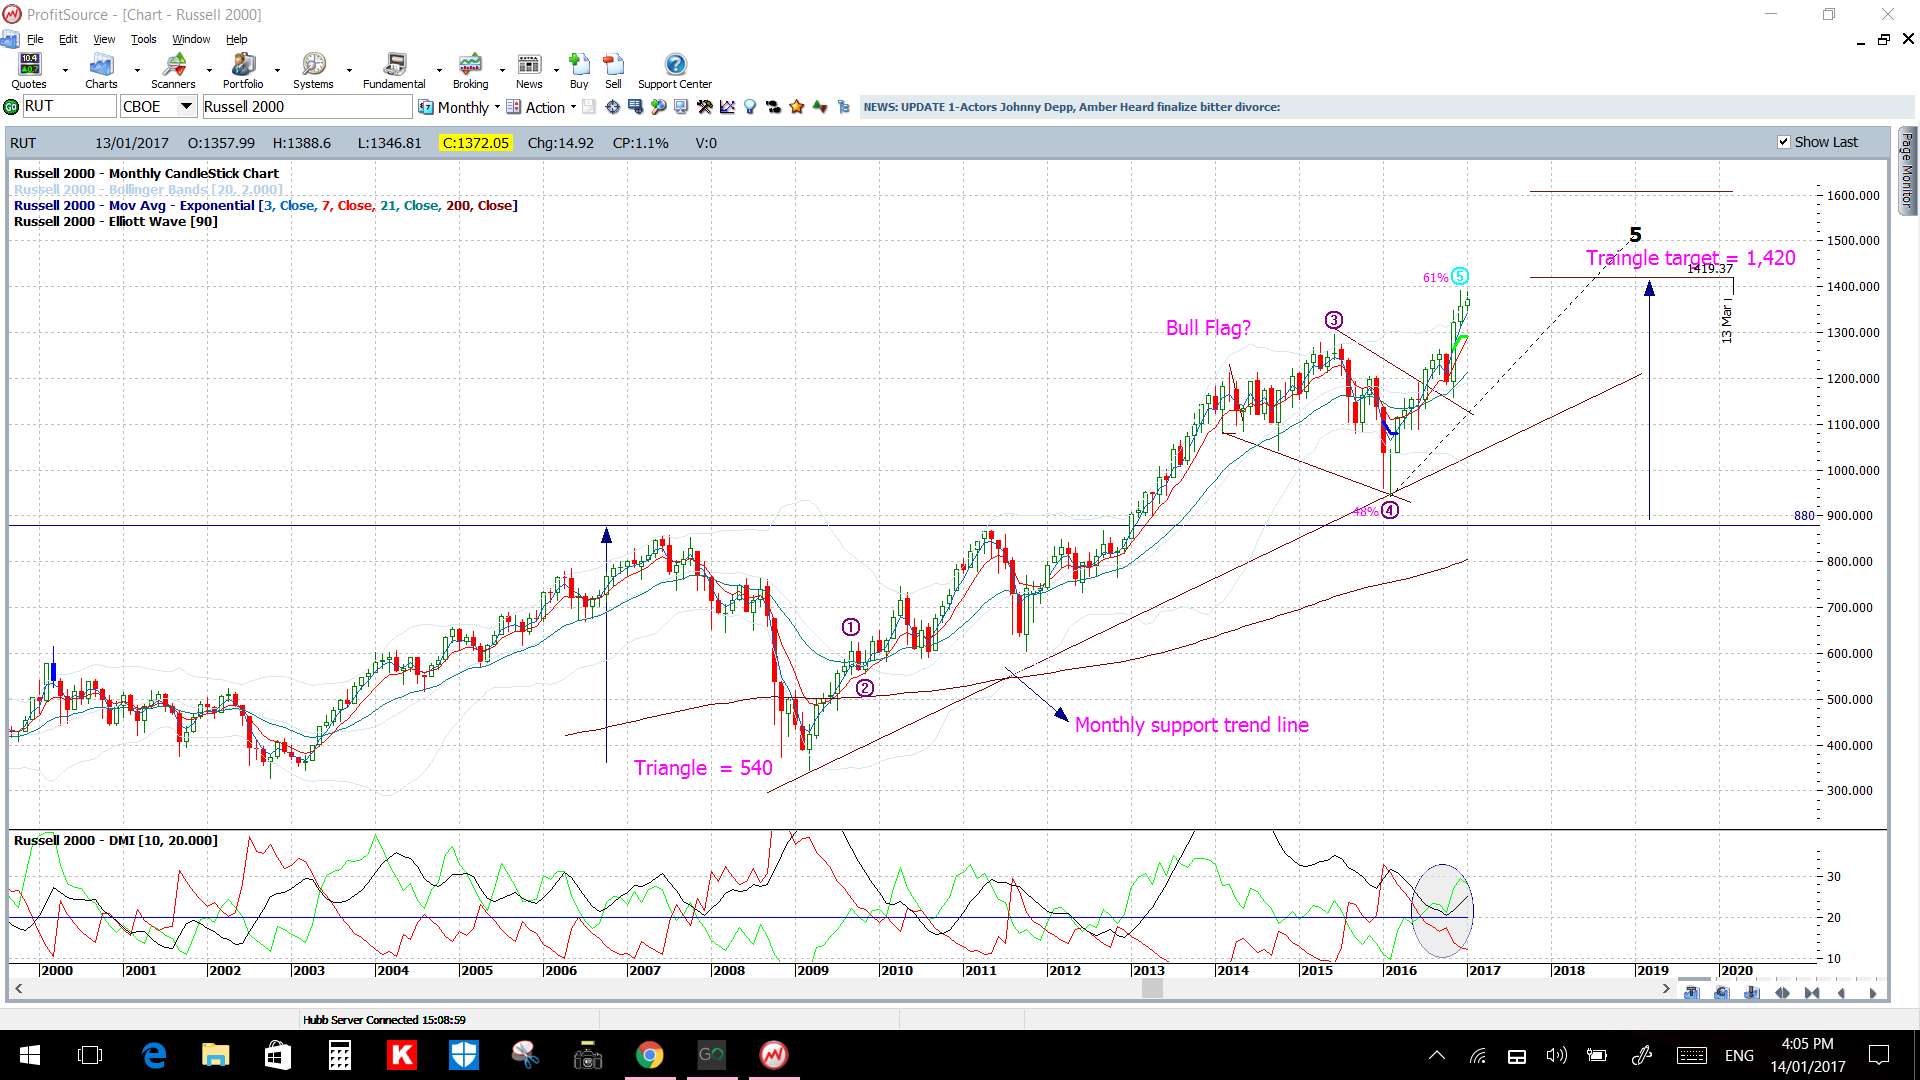
RUT monthly: the US small caps index looks to be nearing its bullish target:
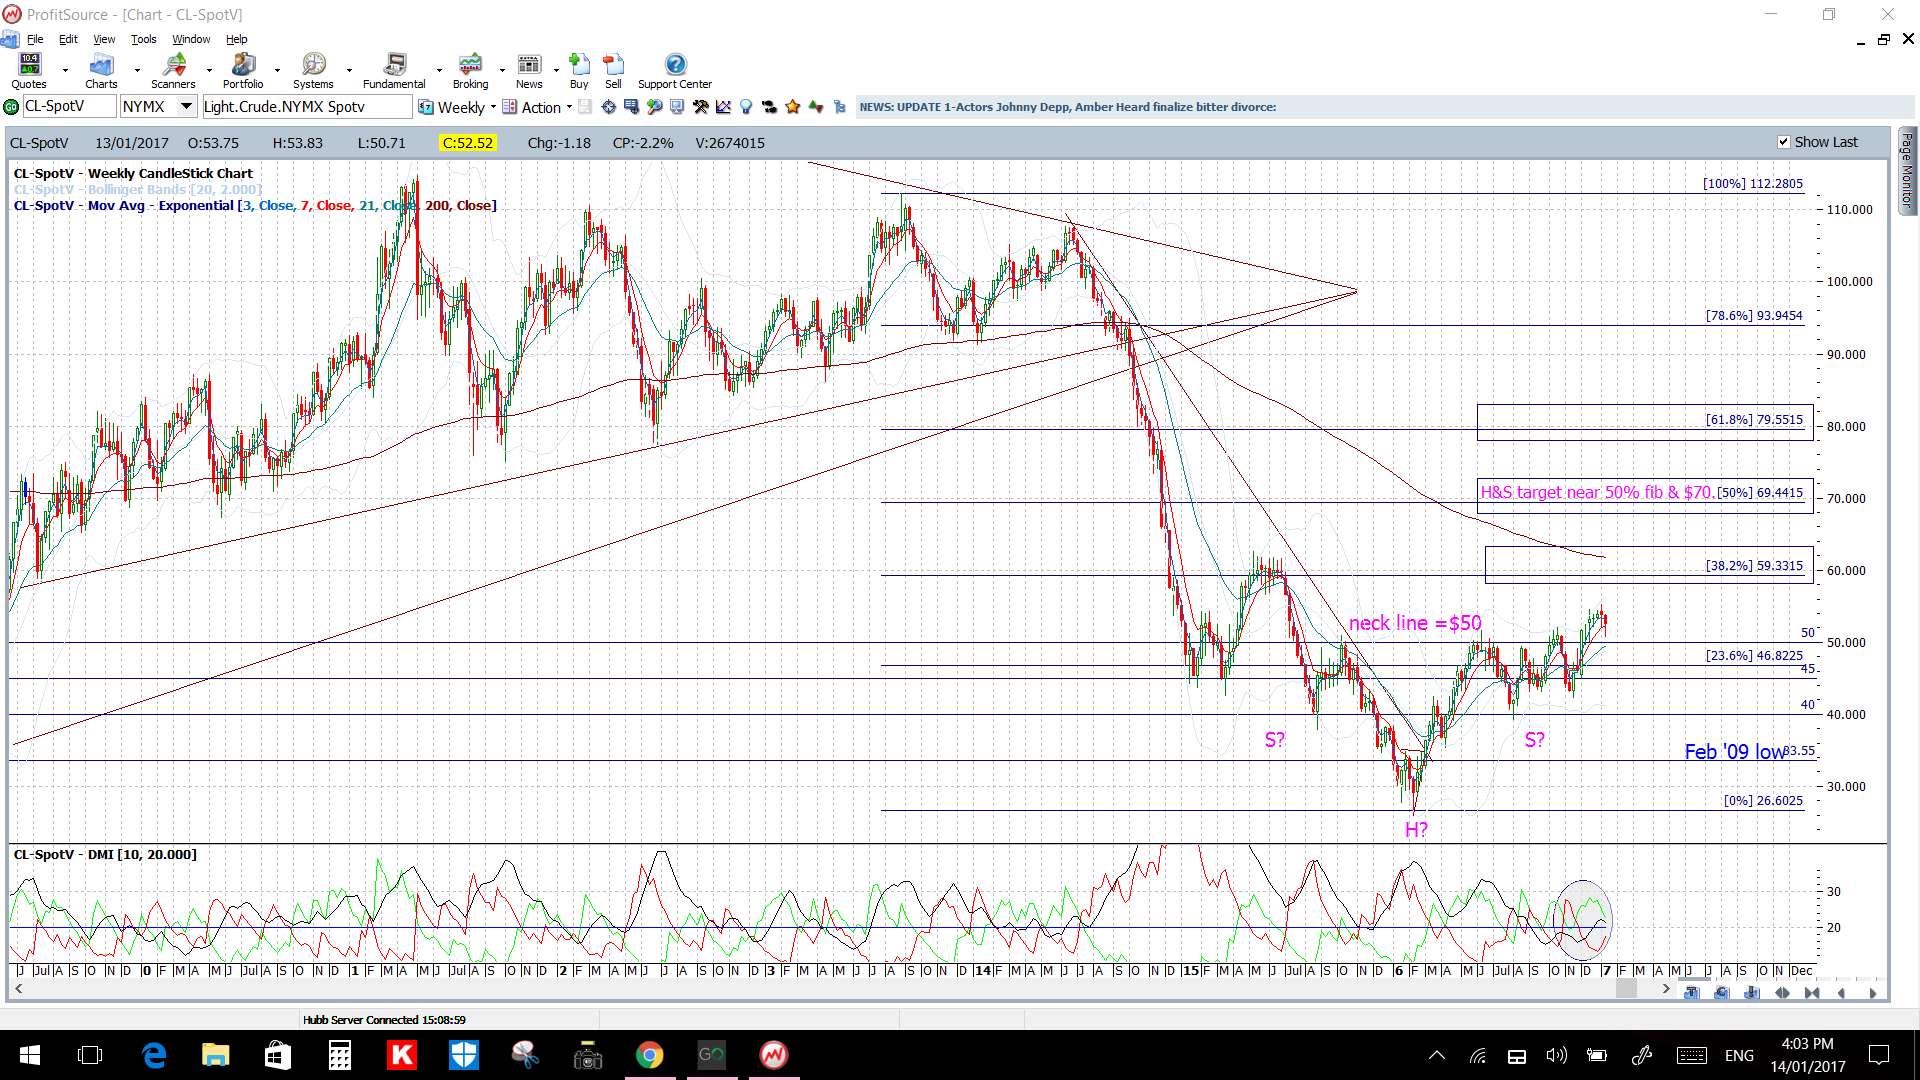
CL weekly: the target for this bullish inv H&S breakout is $70:
HG weekly: Copper looks to be headed to test 3.50! A bullish ‘copper’ augers well for general market health:

Some Stocks worth watching: many of these are NASDAQ stocks but, with the NASDAQ index embarking on a bullish breakout, it’s not surprising that NASDAQ stocks may also be bullish. For all of these charts it is much the same: watch for any momentum-based trend line breakout:
EBAY weekly:

INTC weekly:

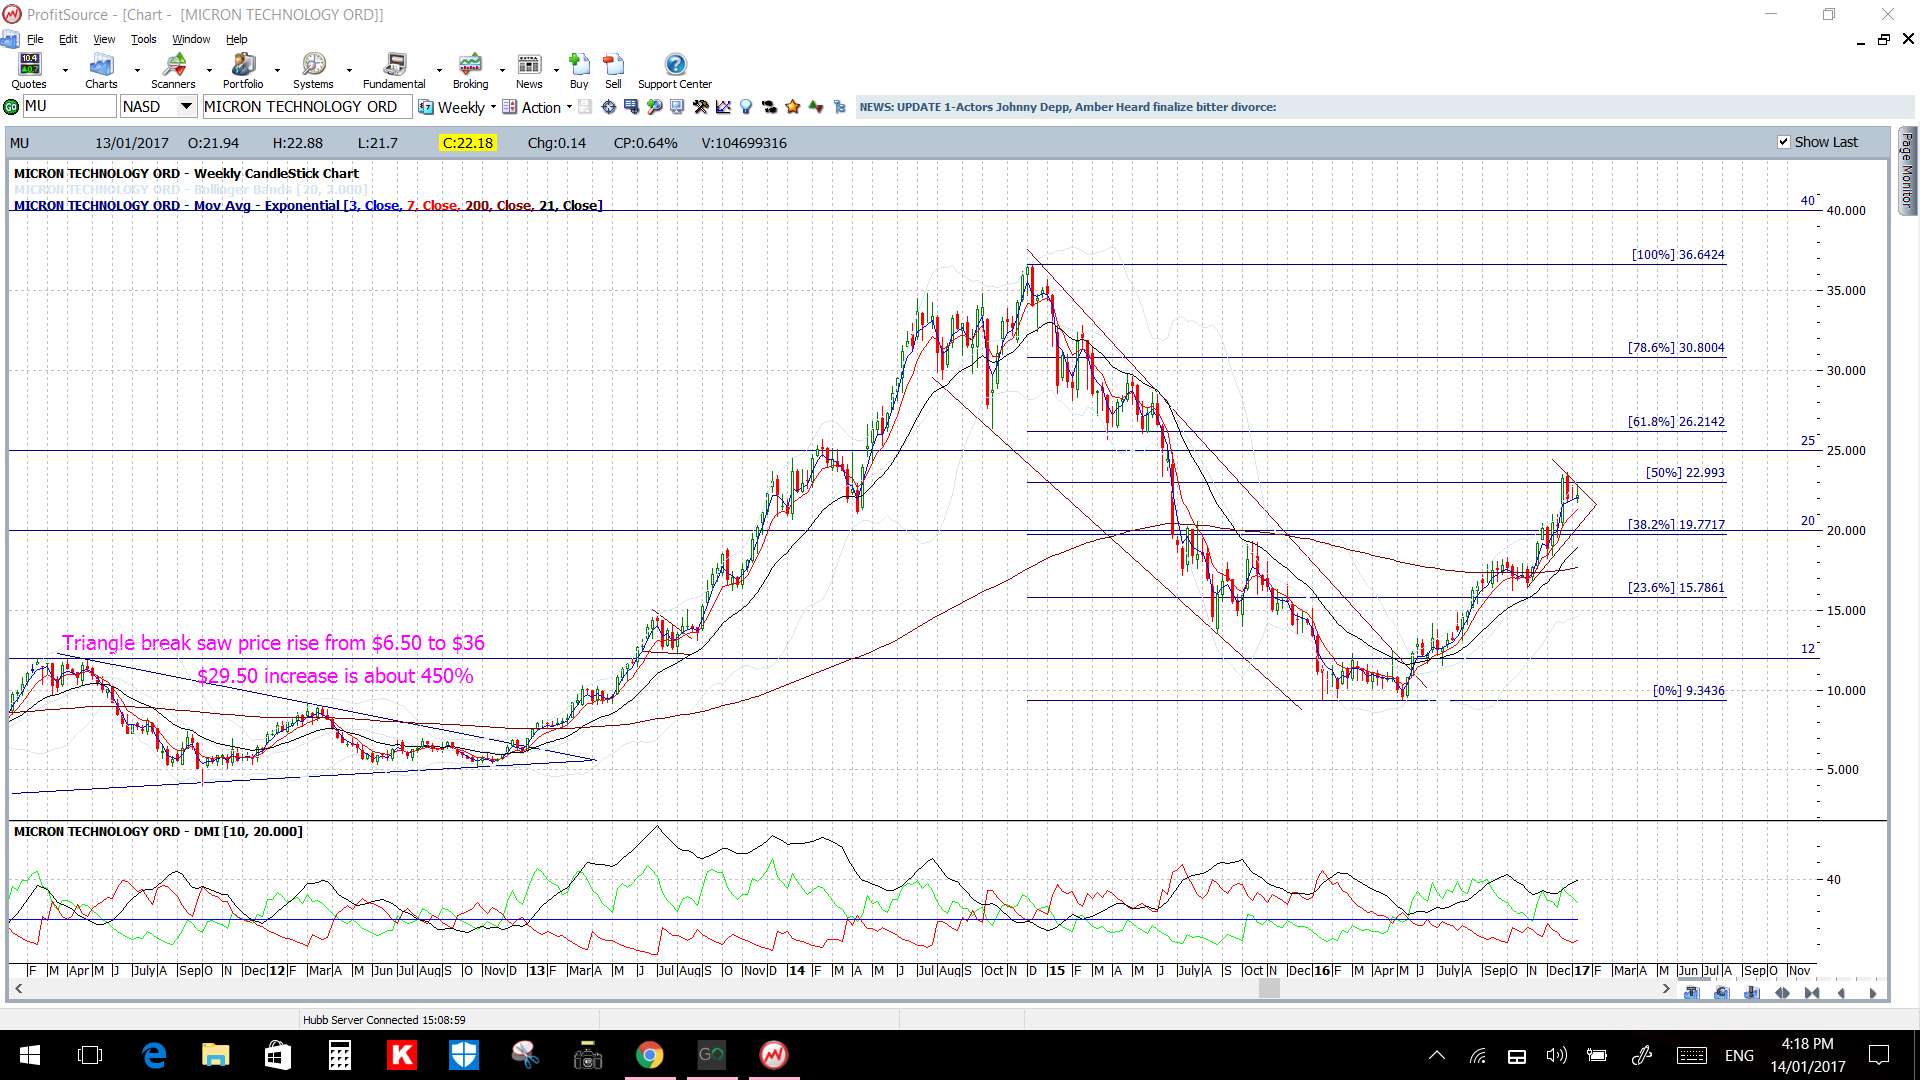
MU weekly:
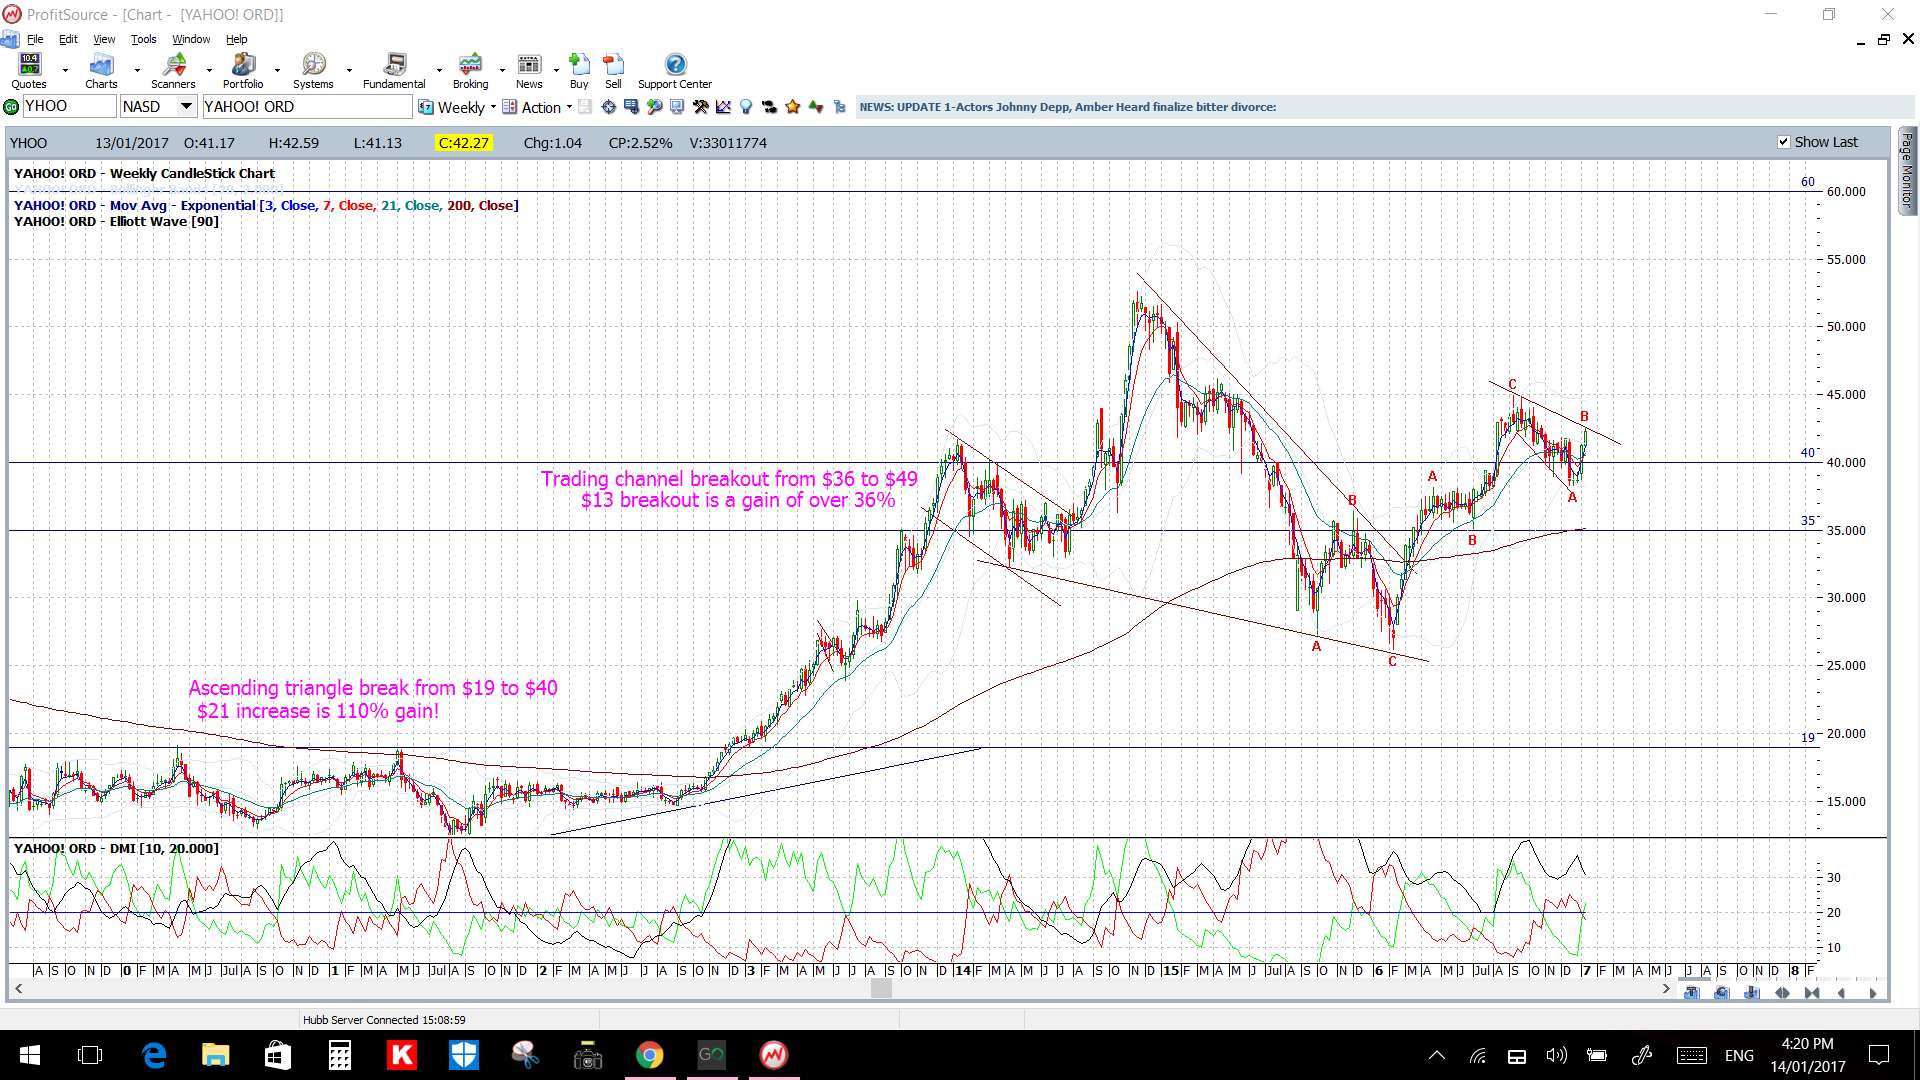
YHOO weekly:
AMD daily:

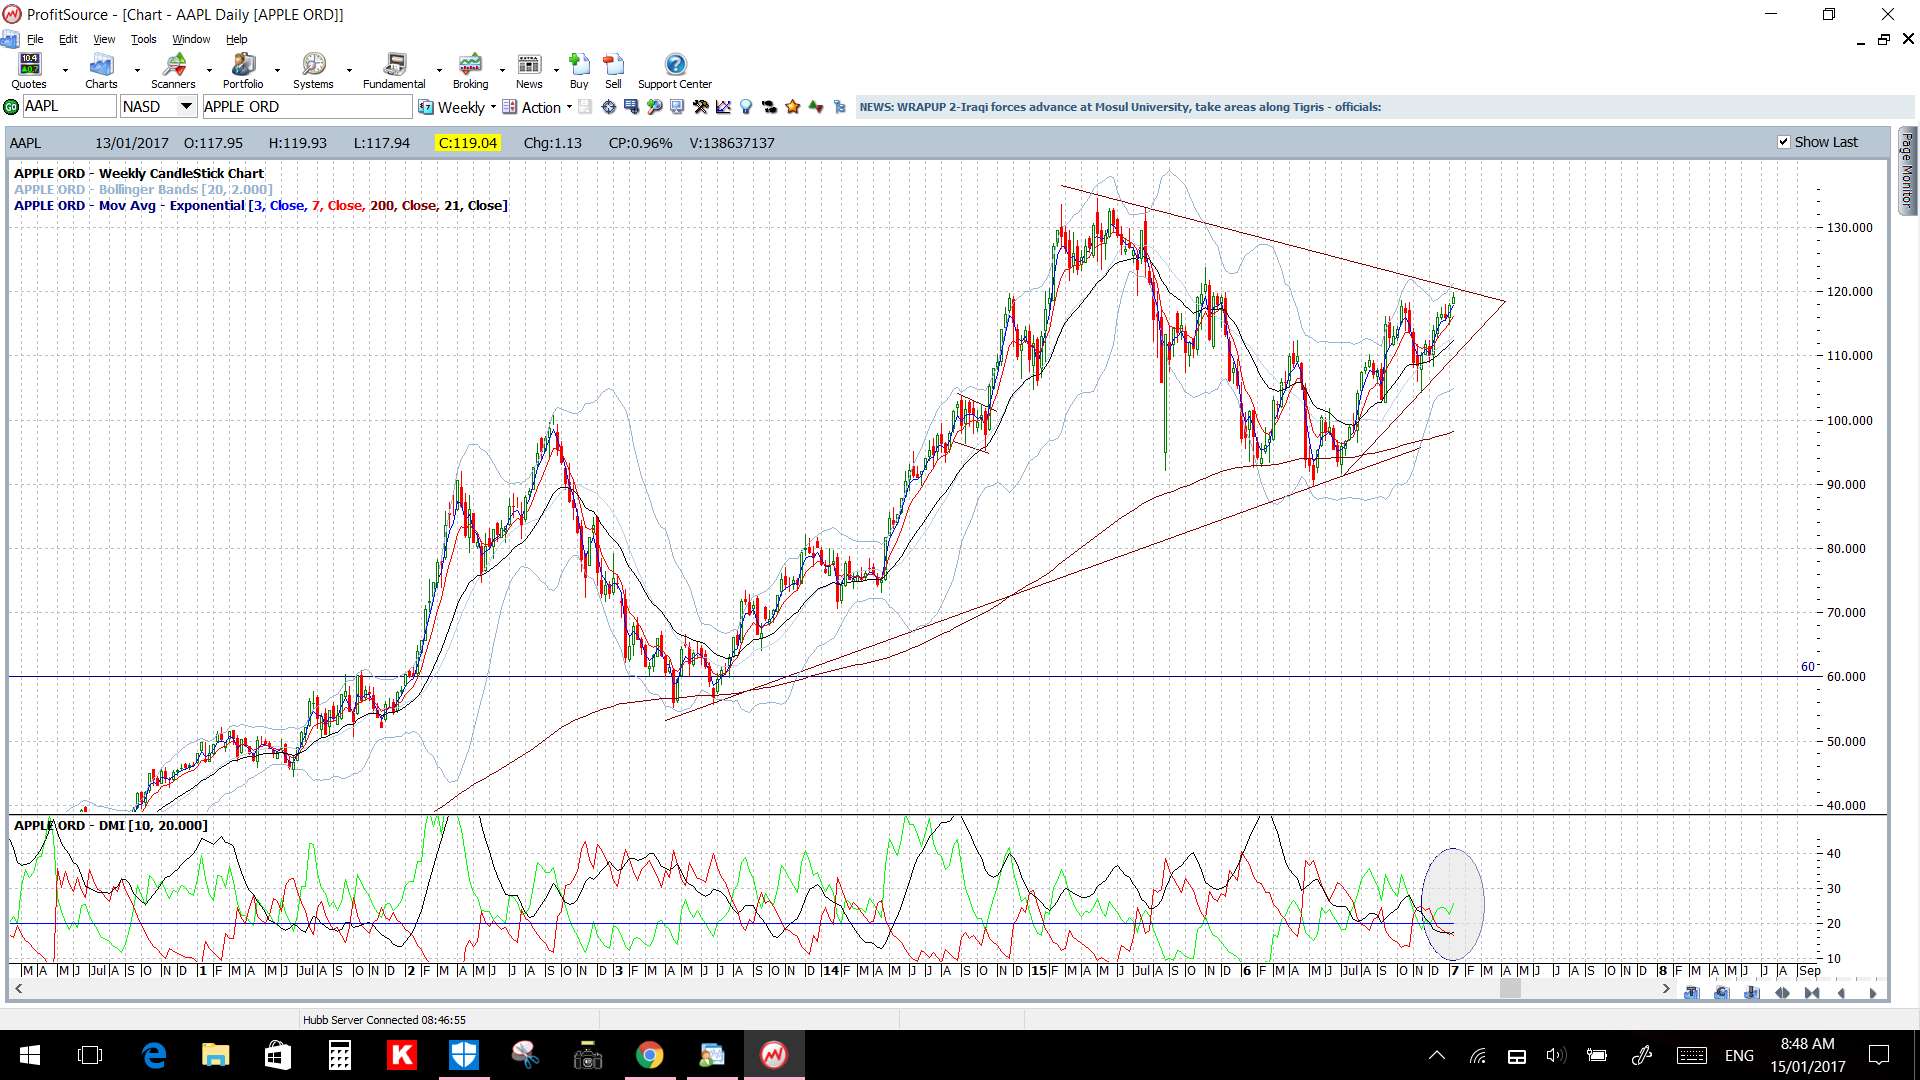
AAPL weekly:
ABT weekly:

BBBY weekly:

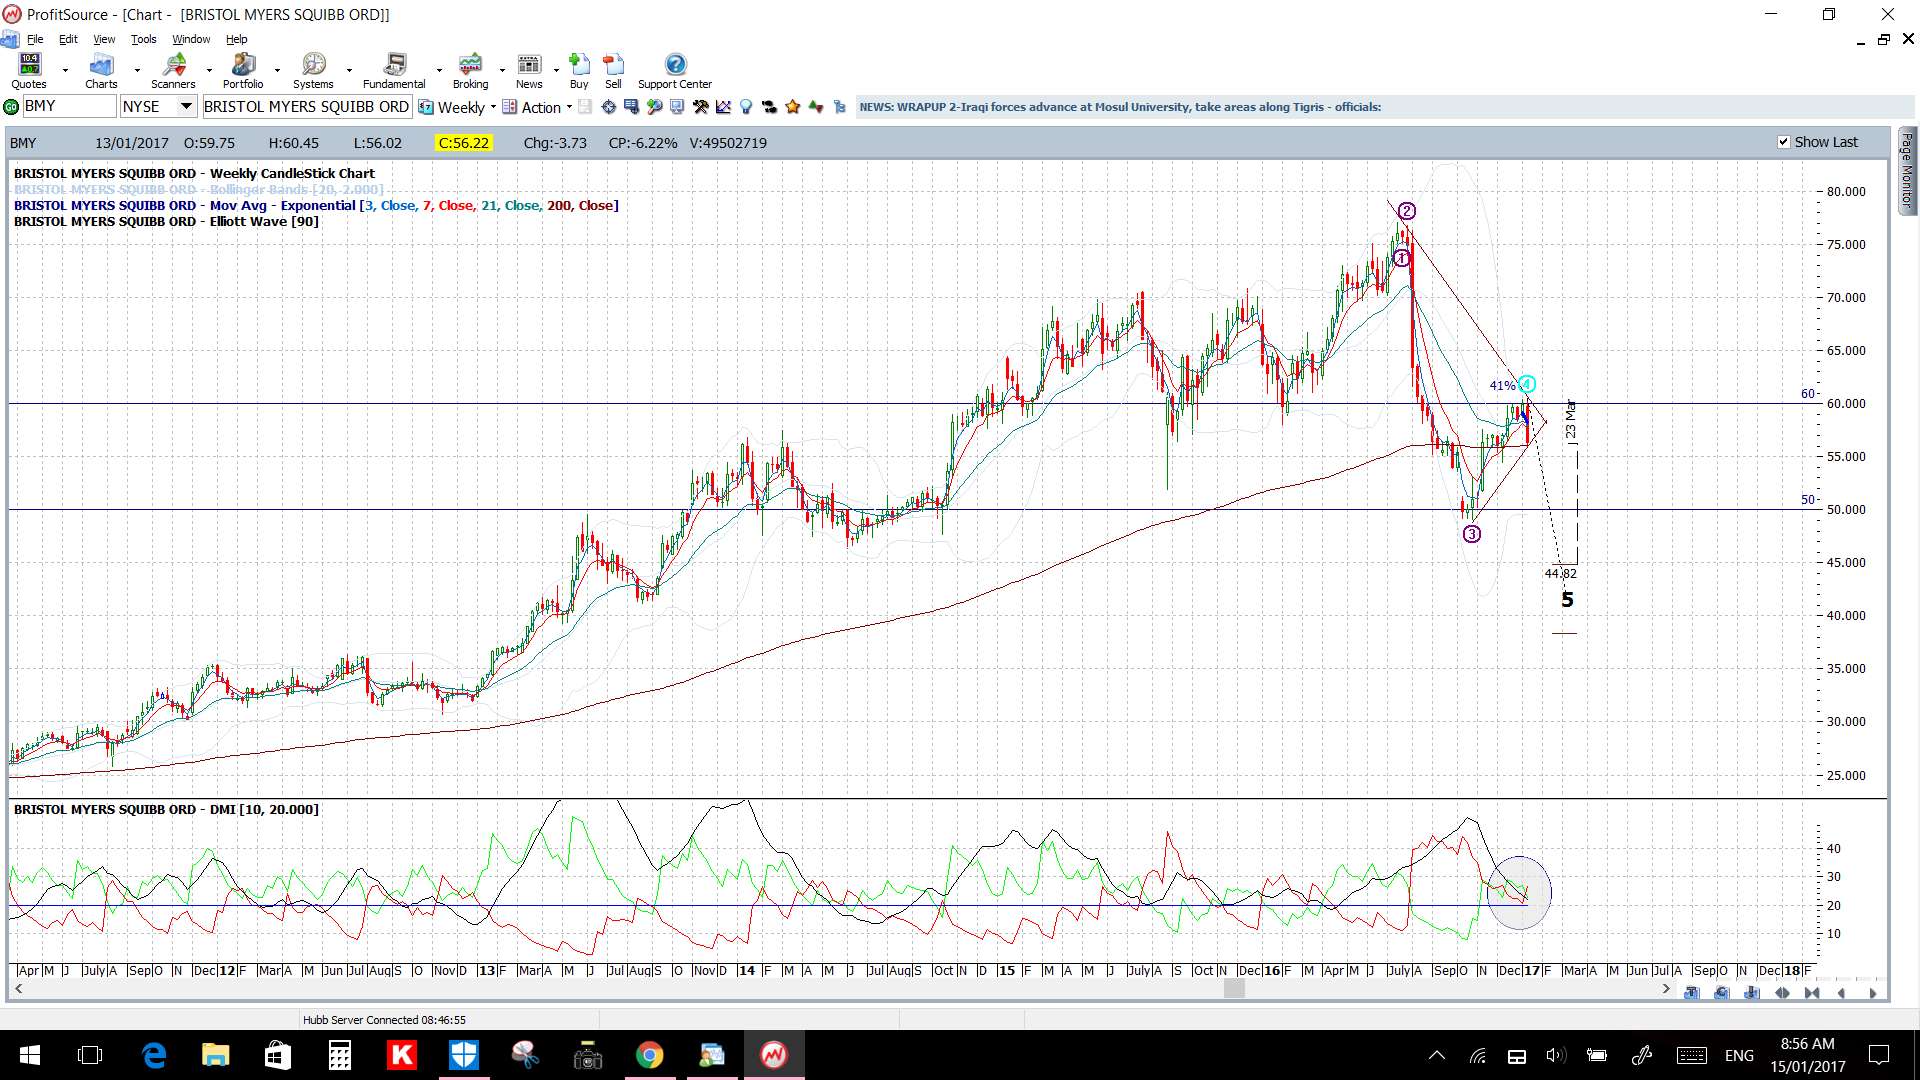
BMY weekly:
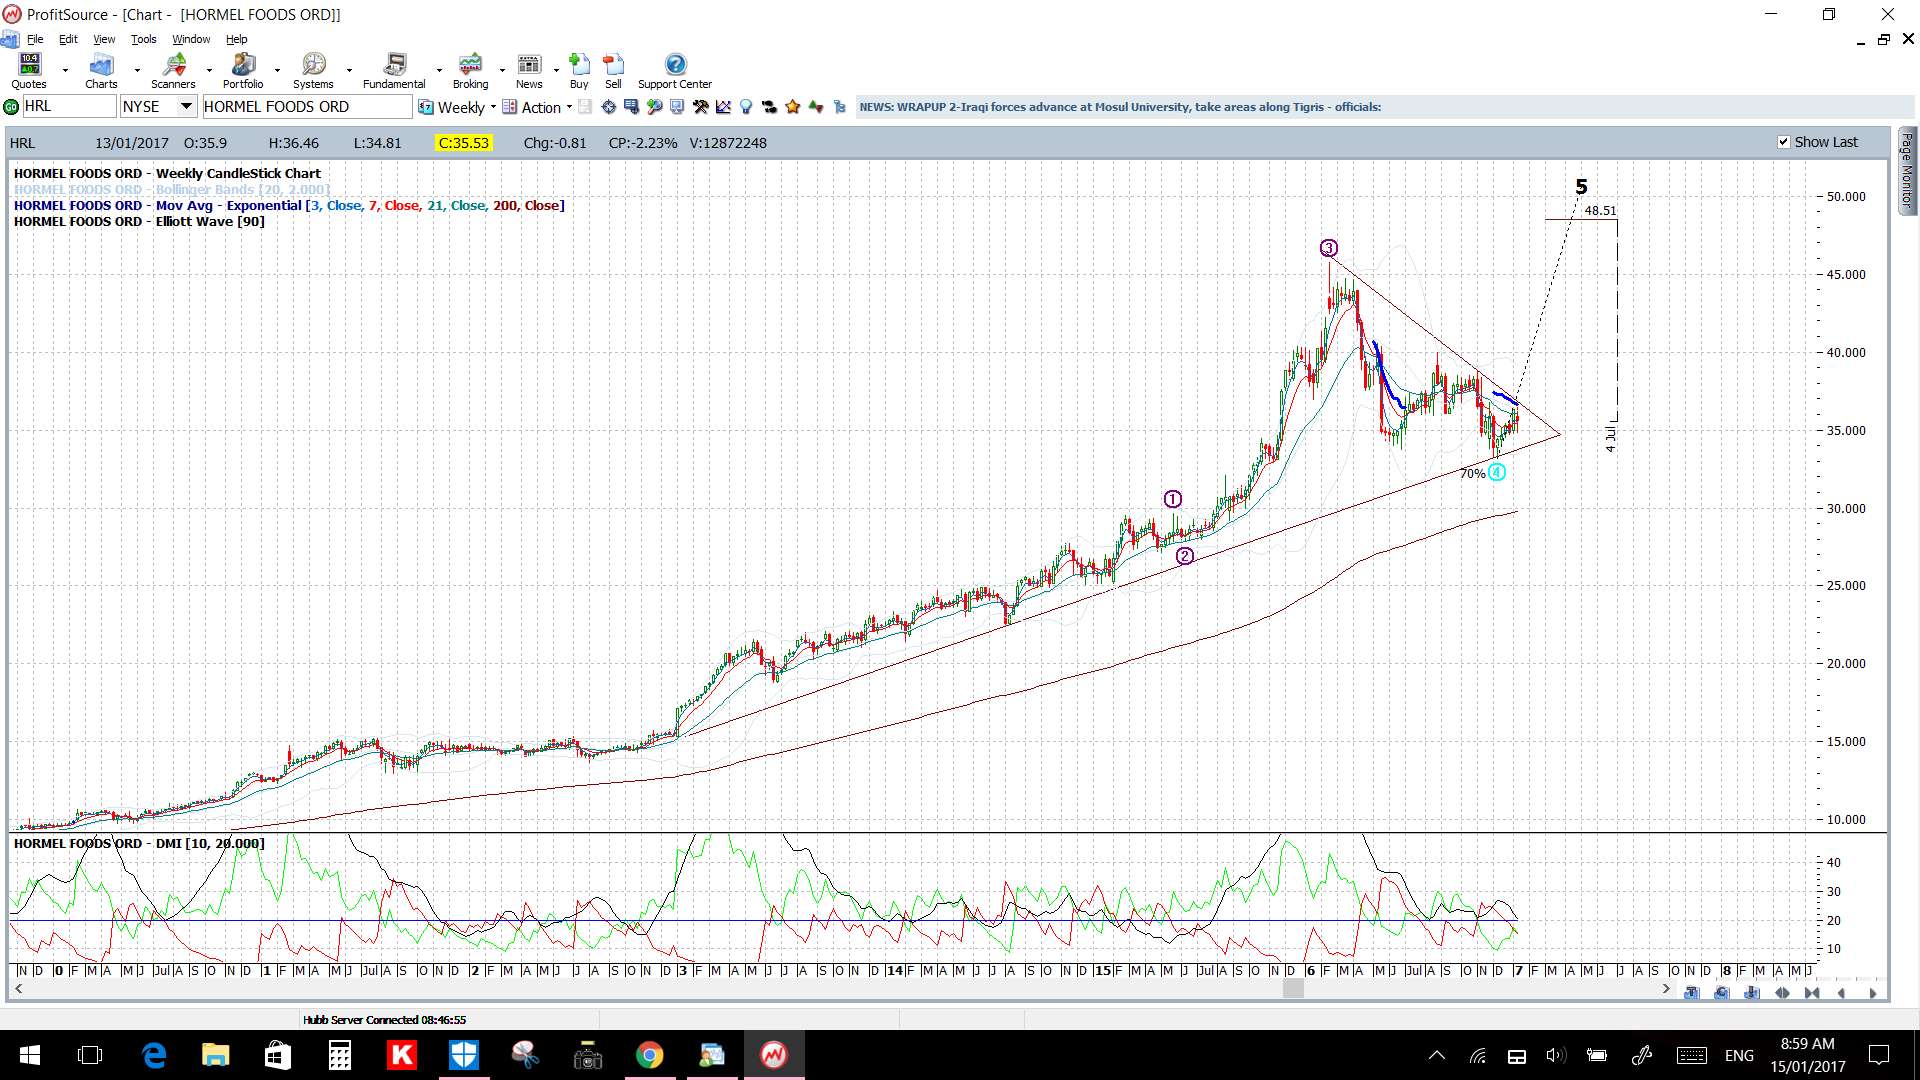
HRL weekly:
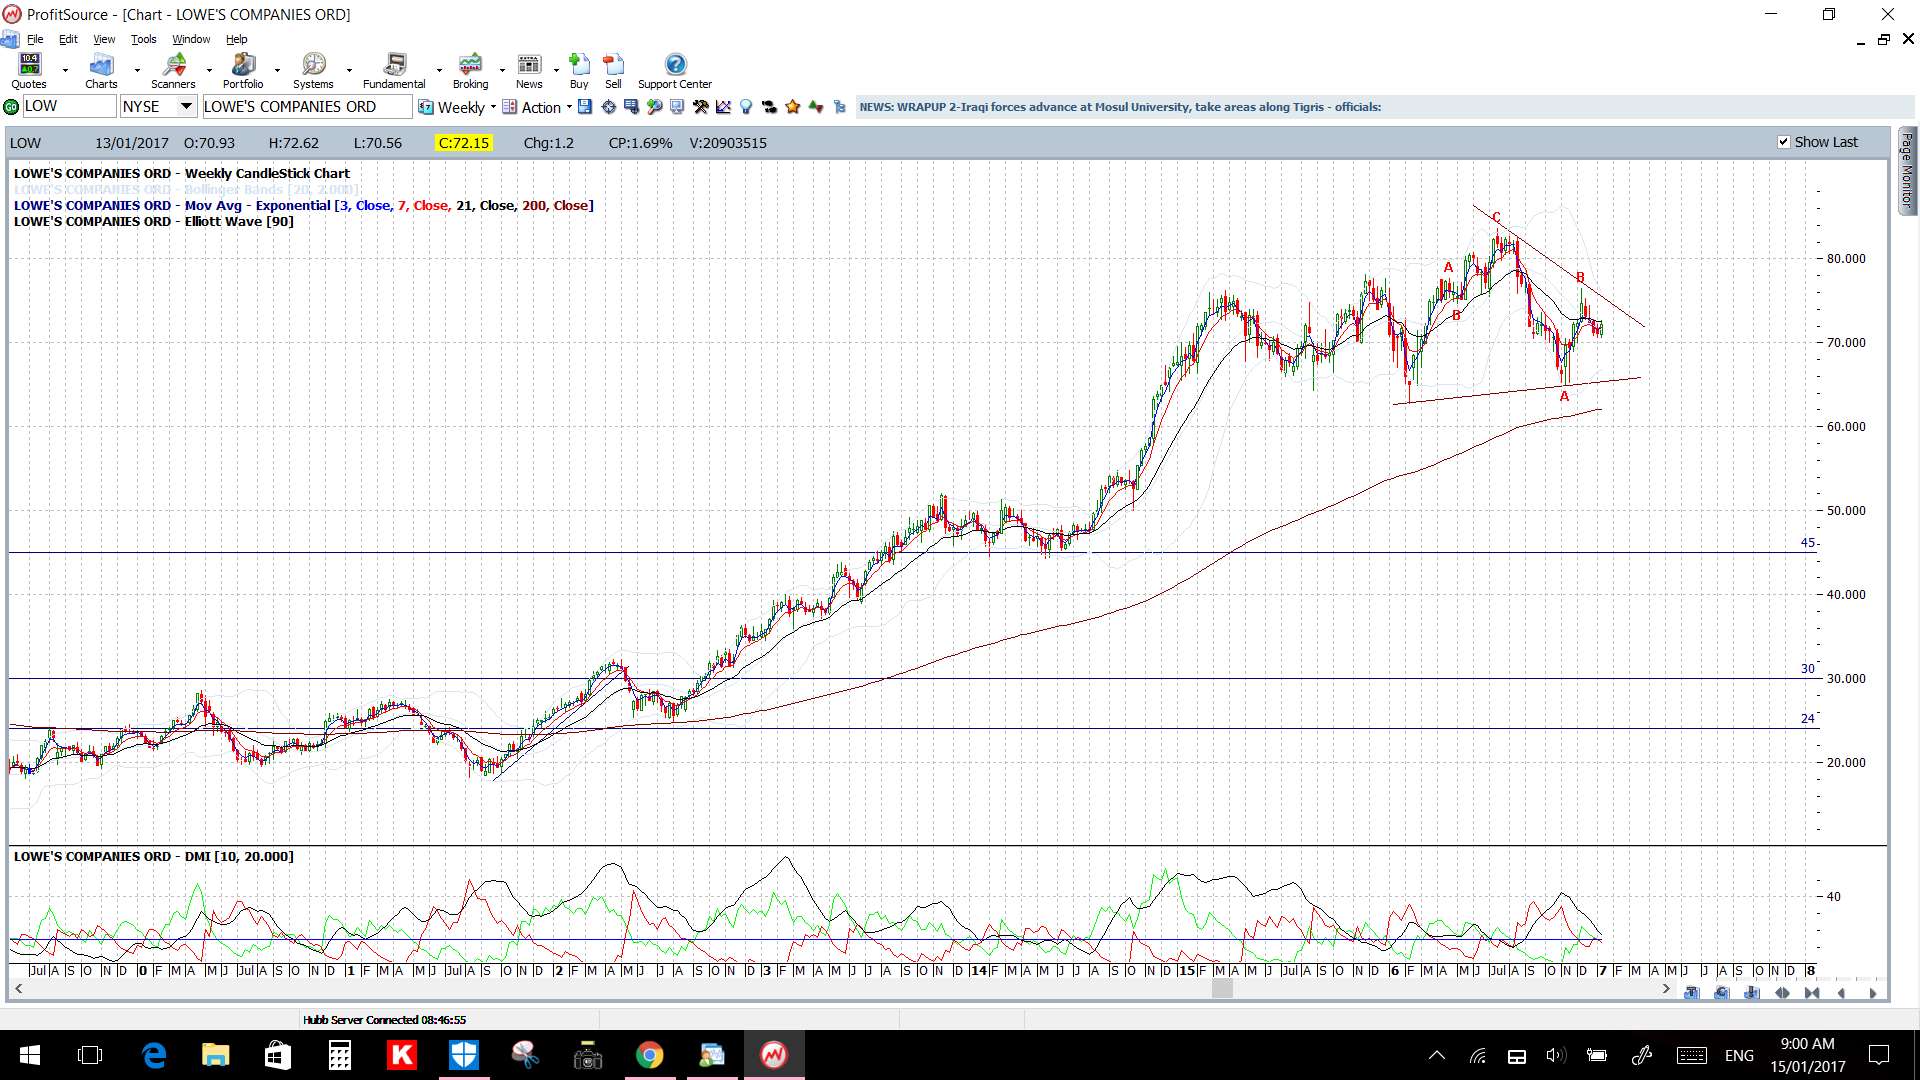
LOW weekly:
MCD weekly:

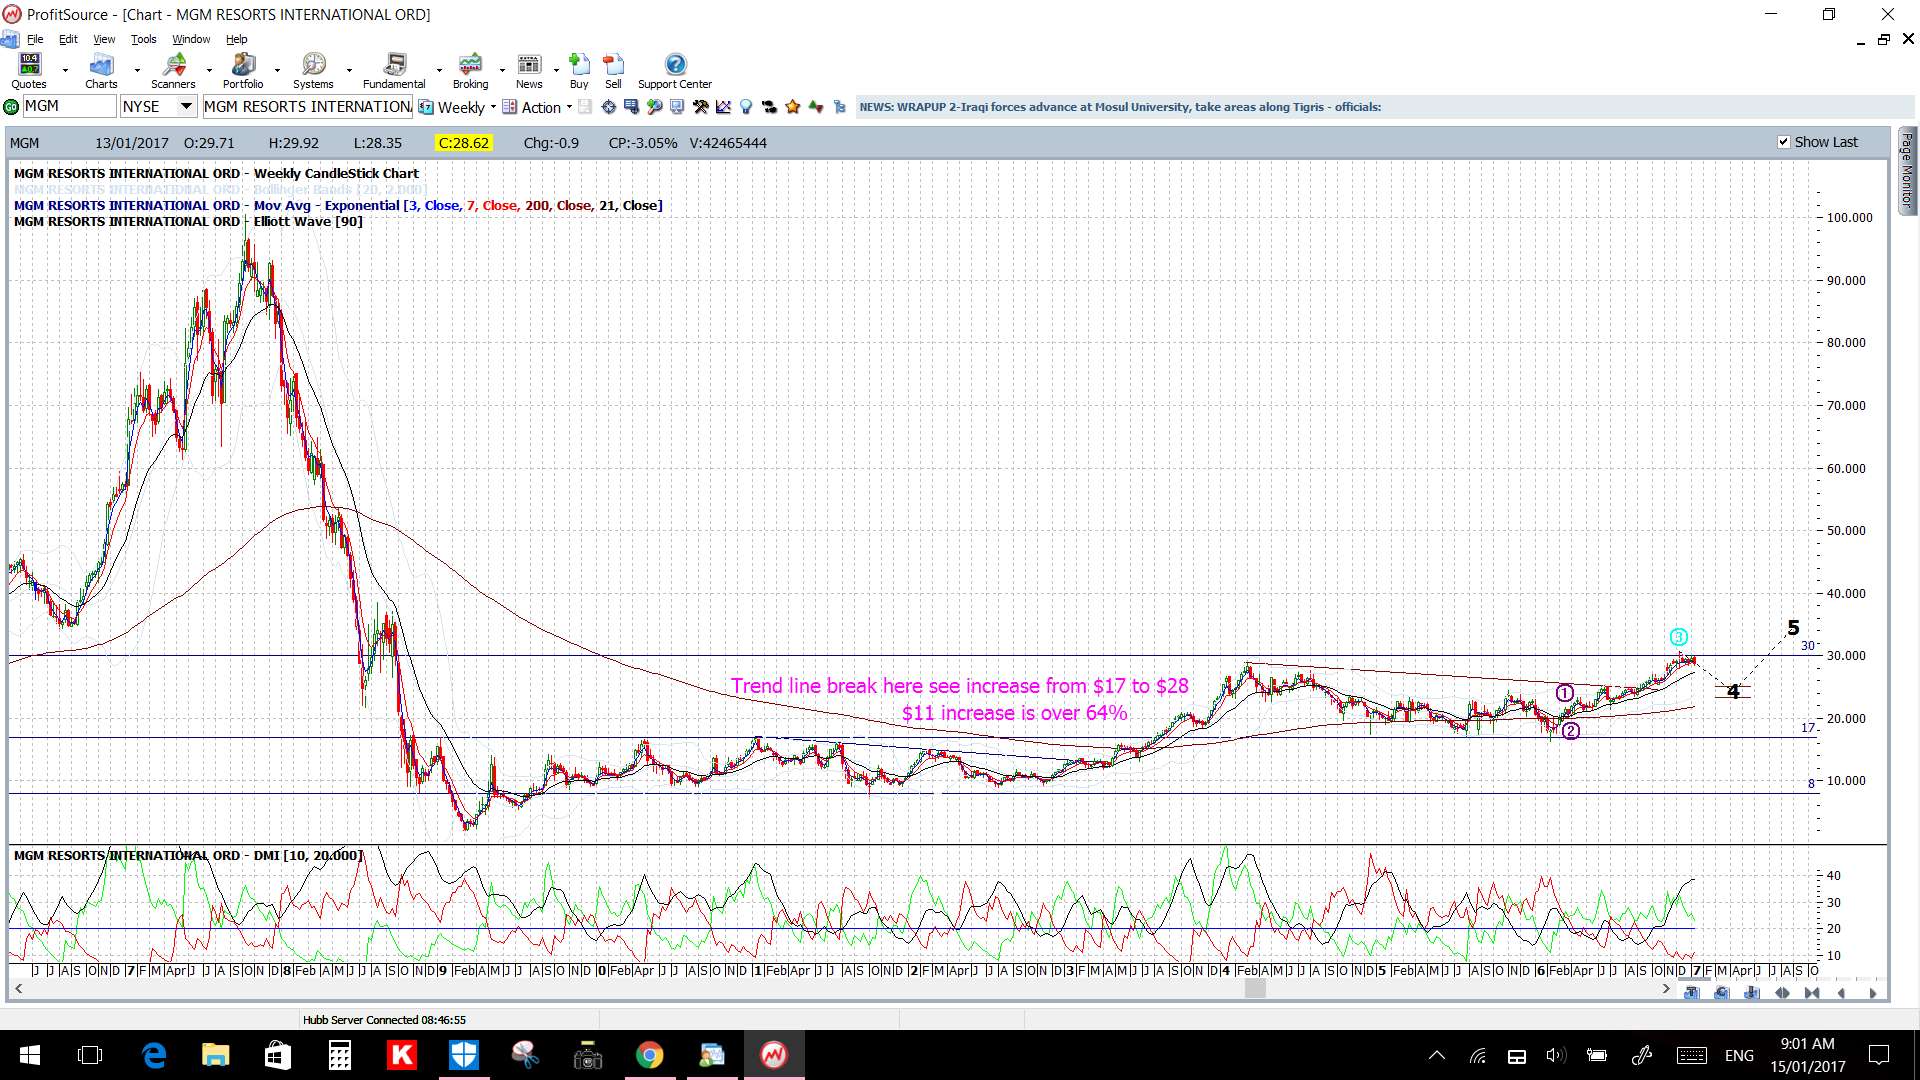
MGM weekly: keep an eye out for any close and hold above $30:
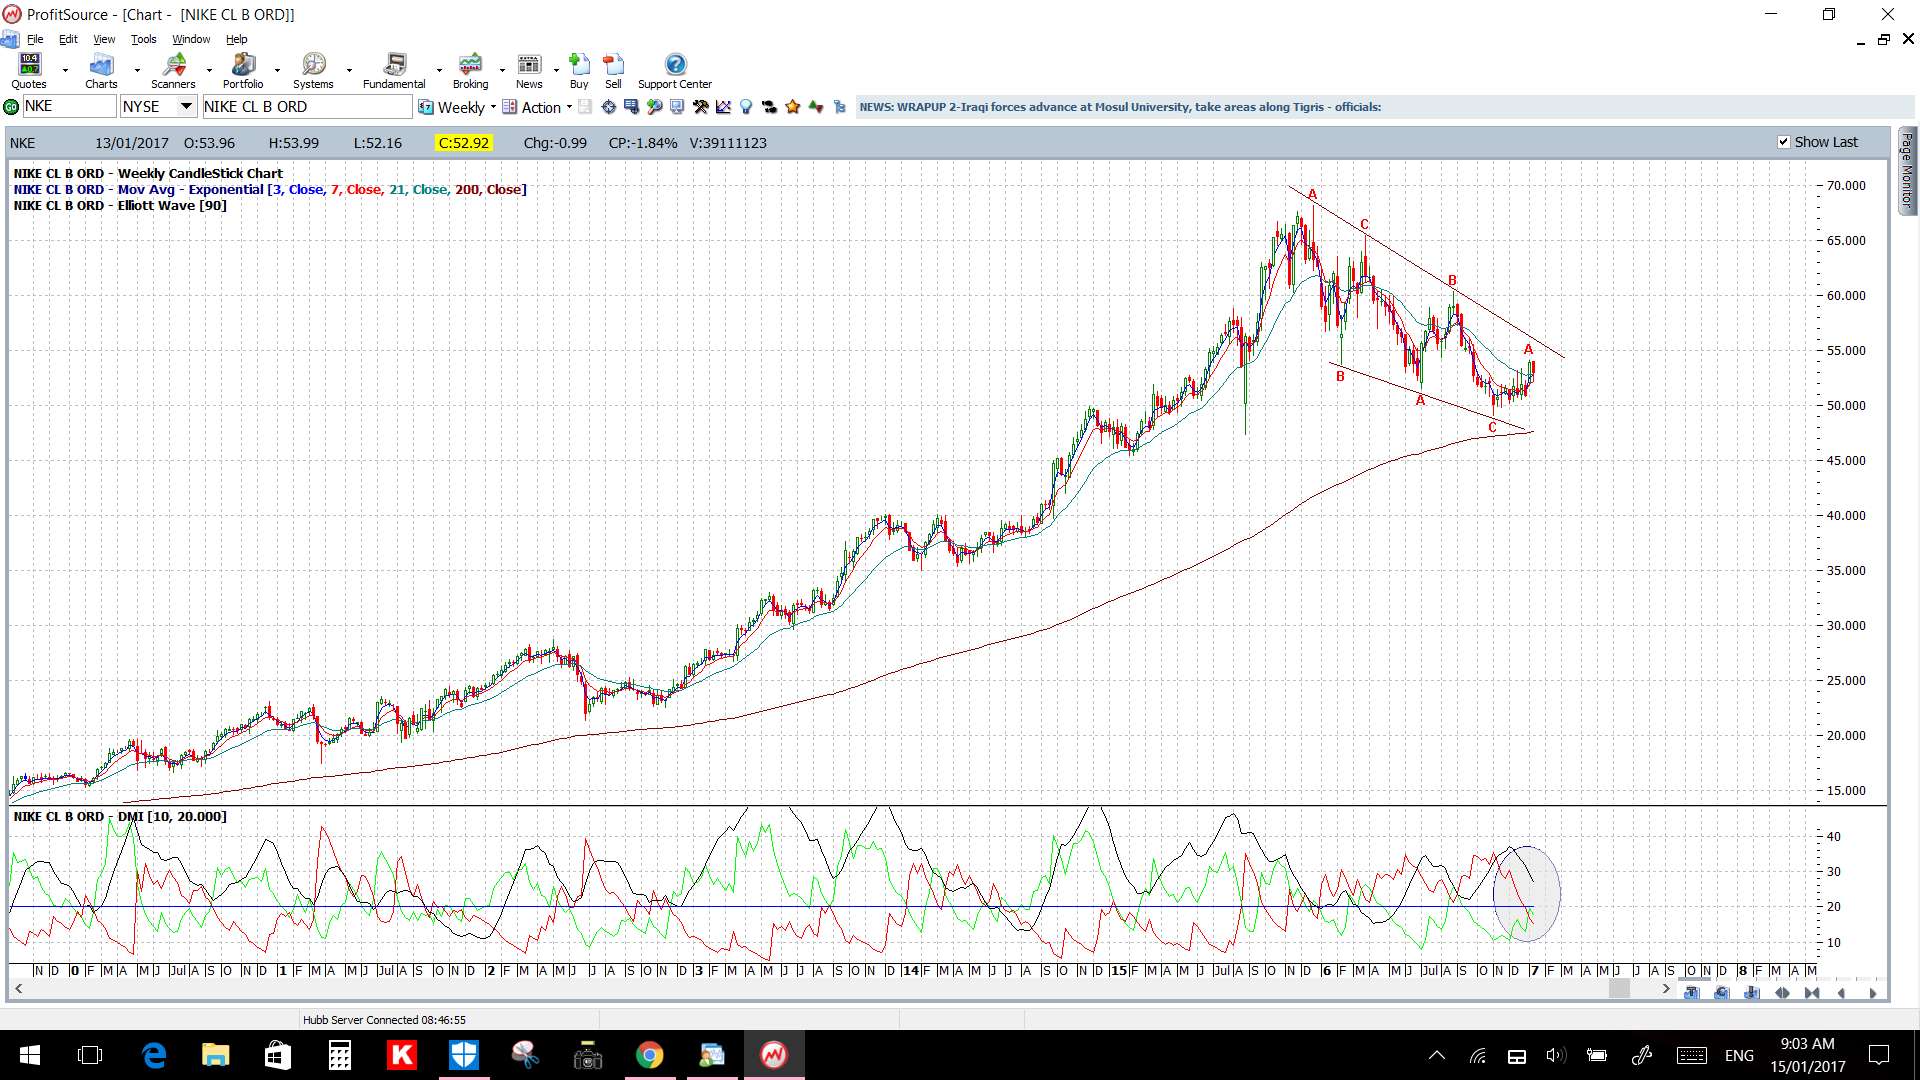
NKE weekly:
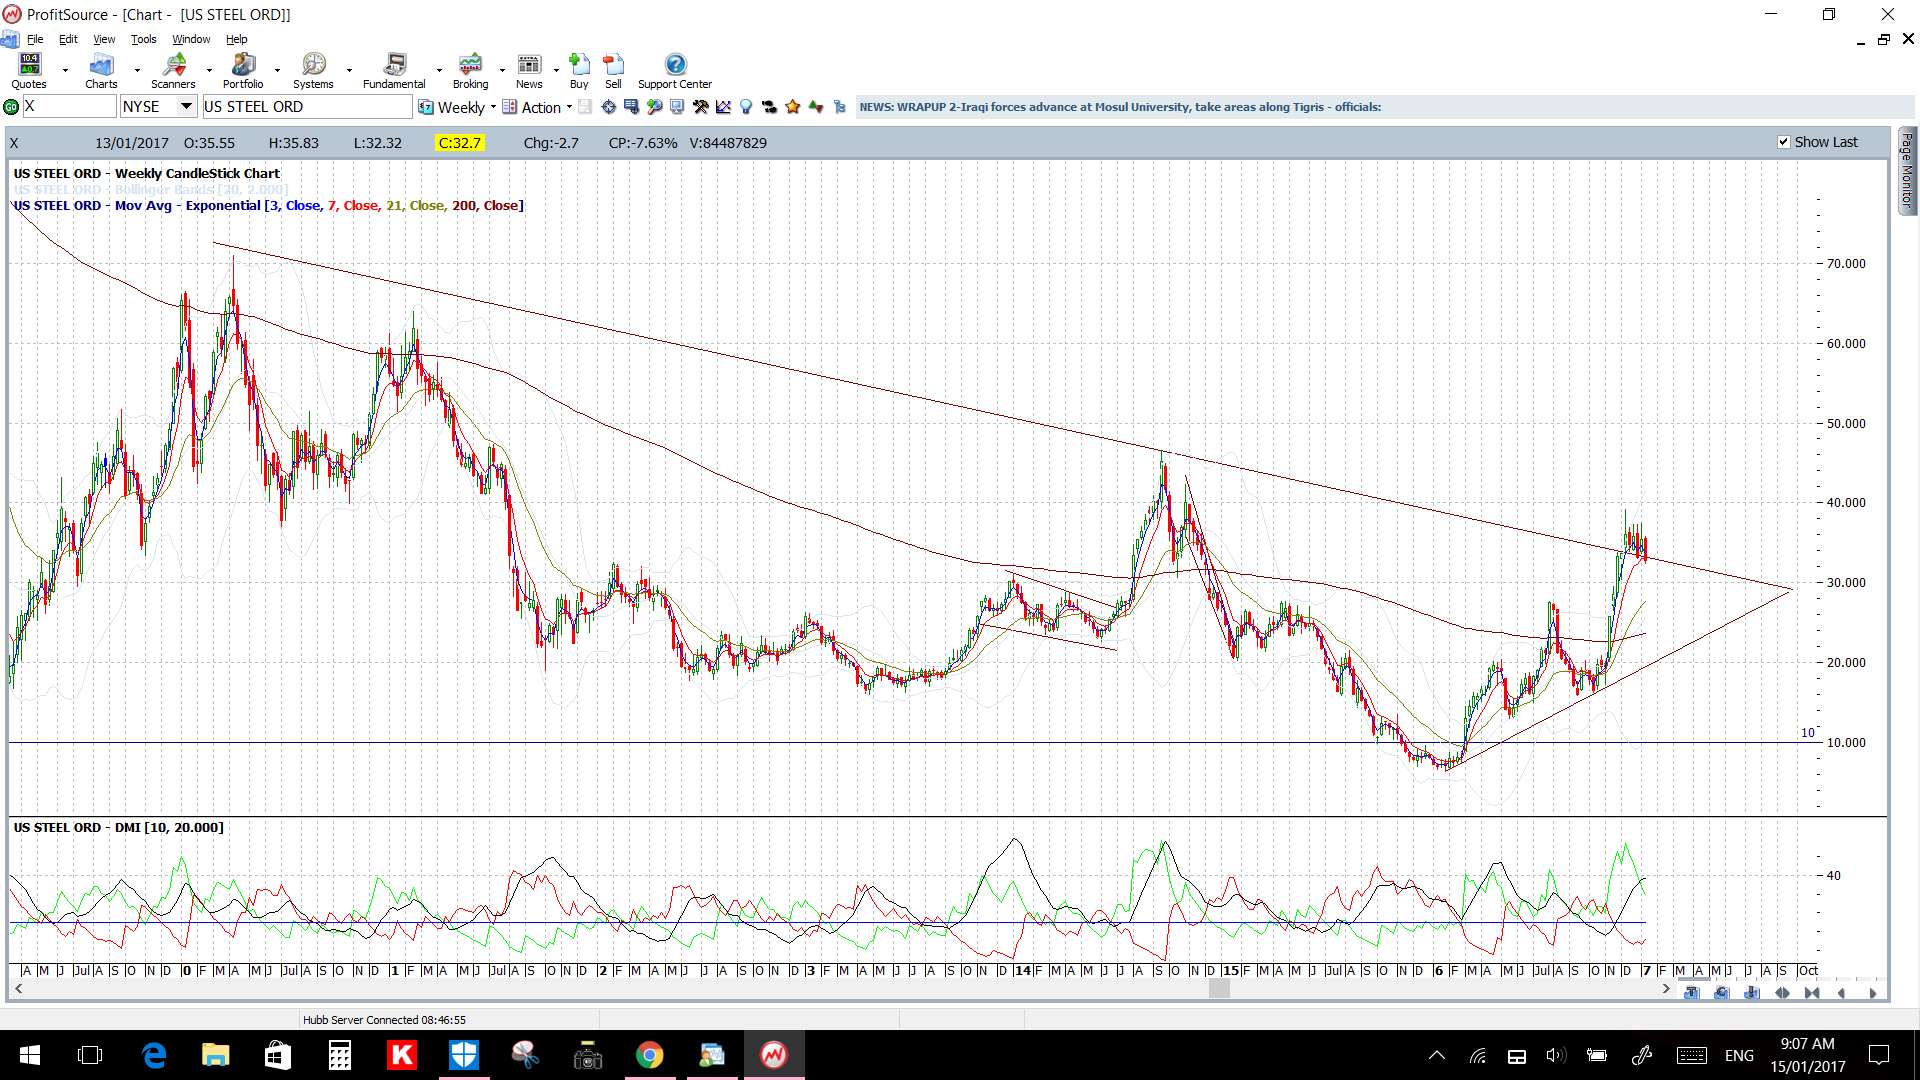
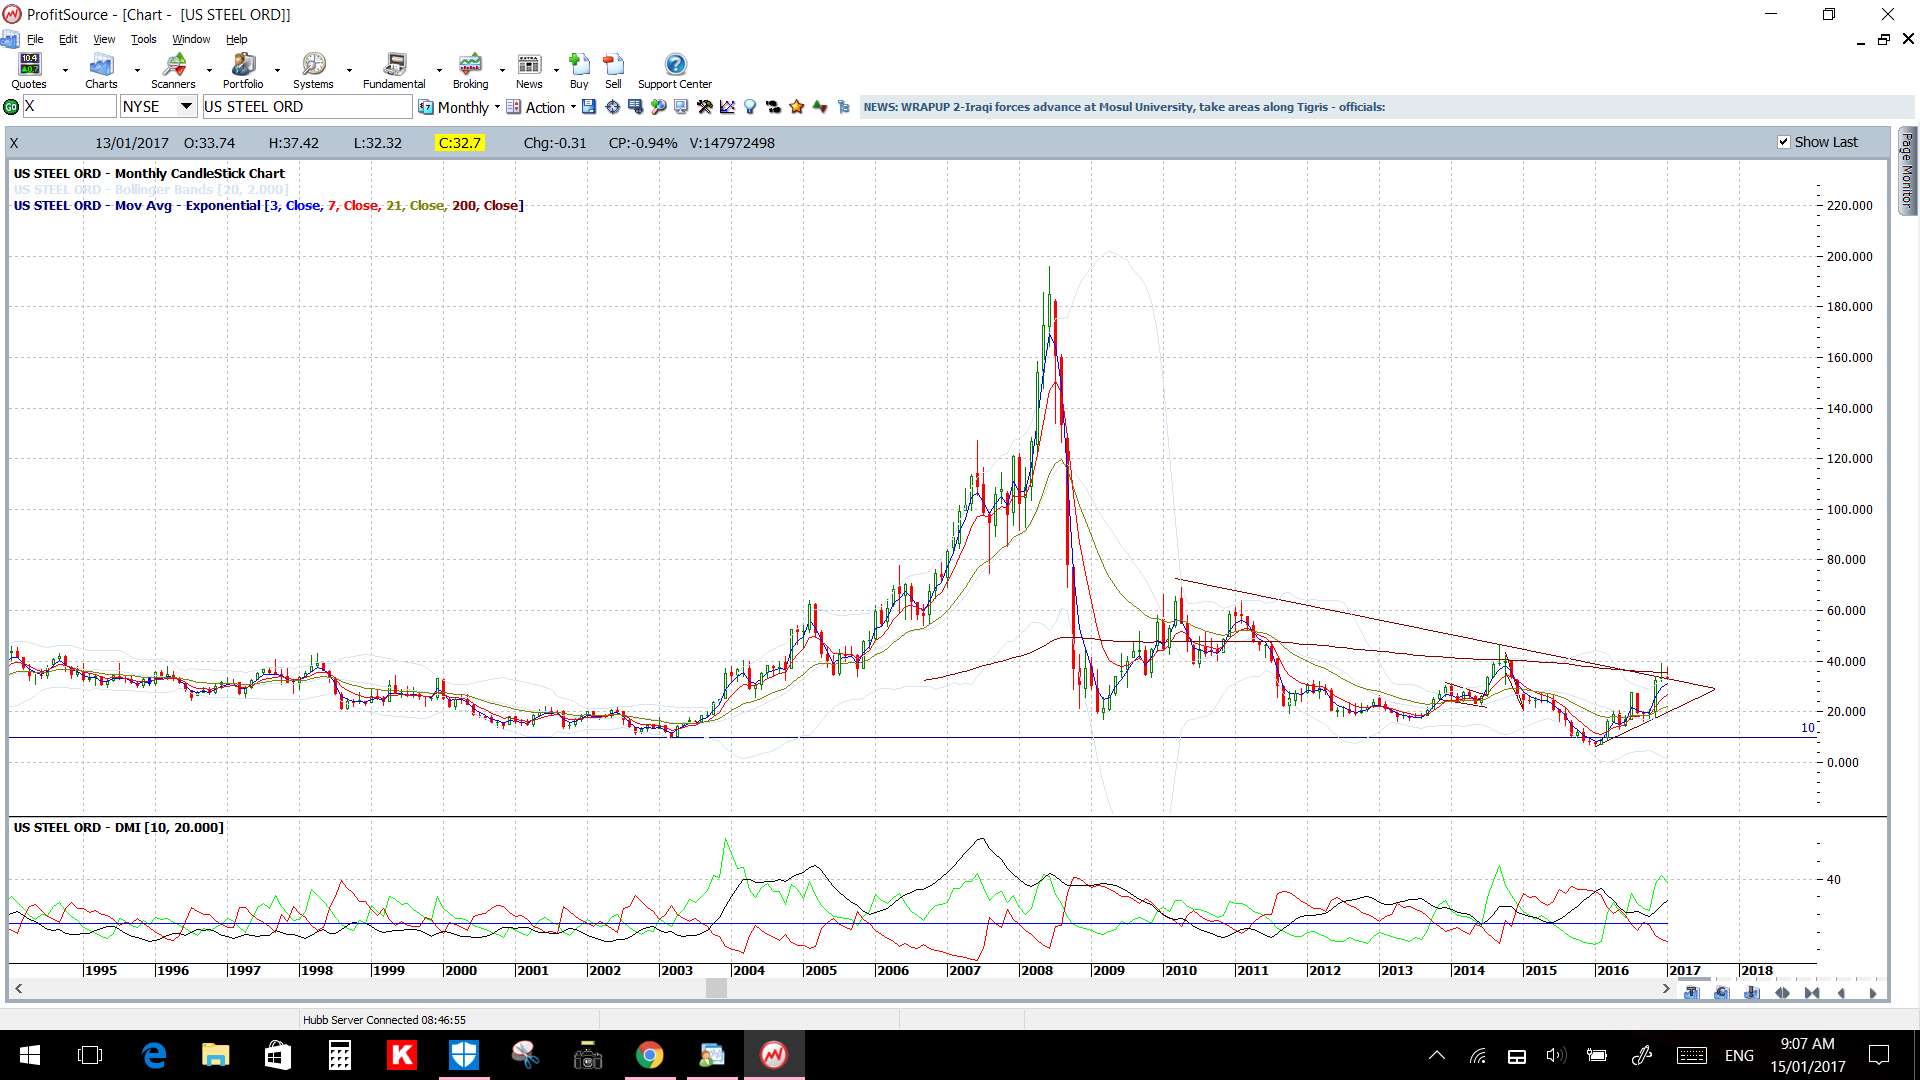
X: US steel is looking bullish and has lots of scope for upward recovery:
X weekly: a trend line breakout already:
X monthly:
The post Stock indices: looking bullish for now. appeared first on Trade Charting.
The post Stock indices: looking bullish for now. appeared first on www.forextell.com.