Last week: It was a bit of a choppy week for the start of my TC Trial and I hope this isn’t the northern summer markets starting to impact; I’m hoping it was just a brief pause following a period of rather active Forex market movement. The stock indices were strong performers last week and warrant continued monitoring with revised charts of these to be found at the end of this post.
I refer back to a comment I made in my update last w/e:
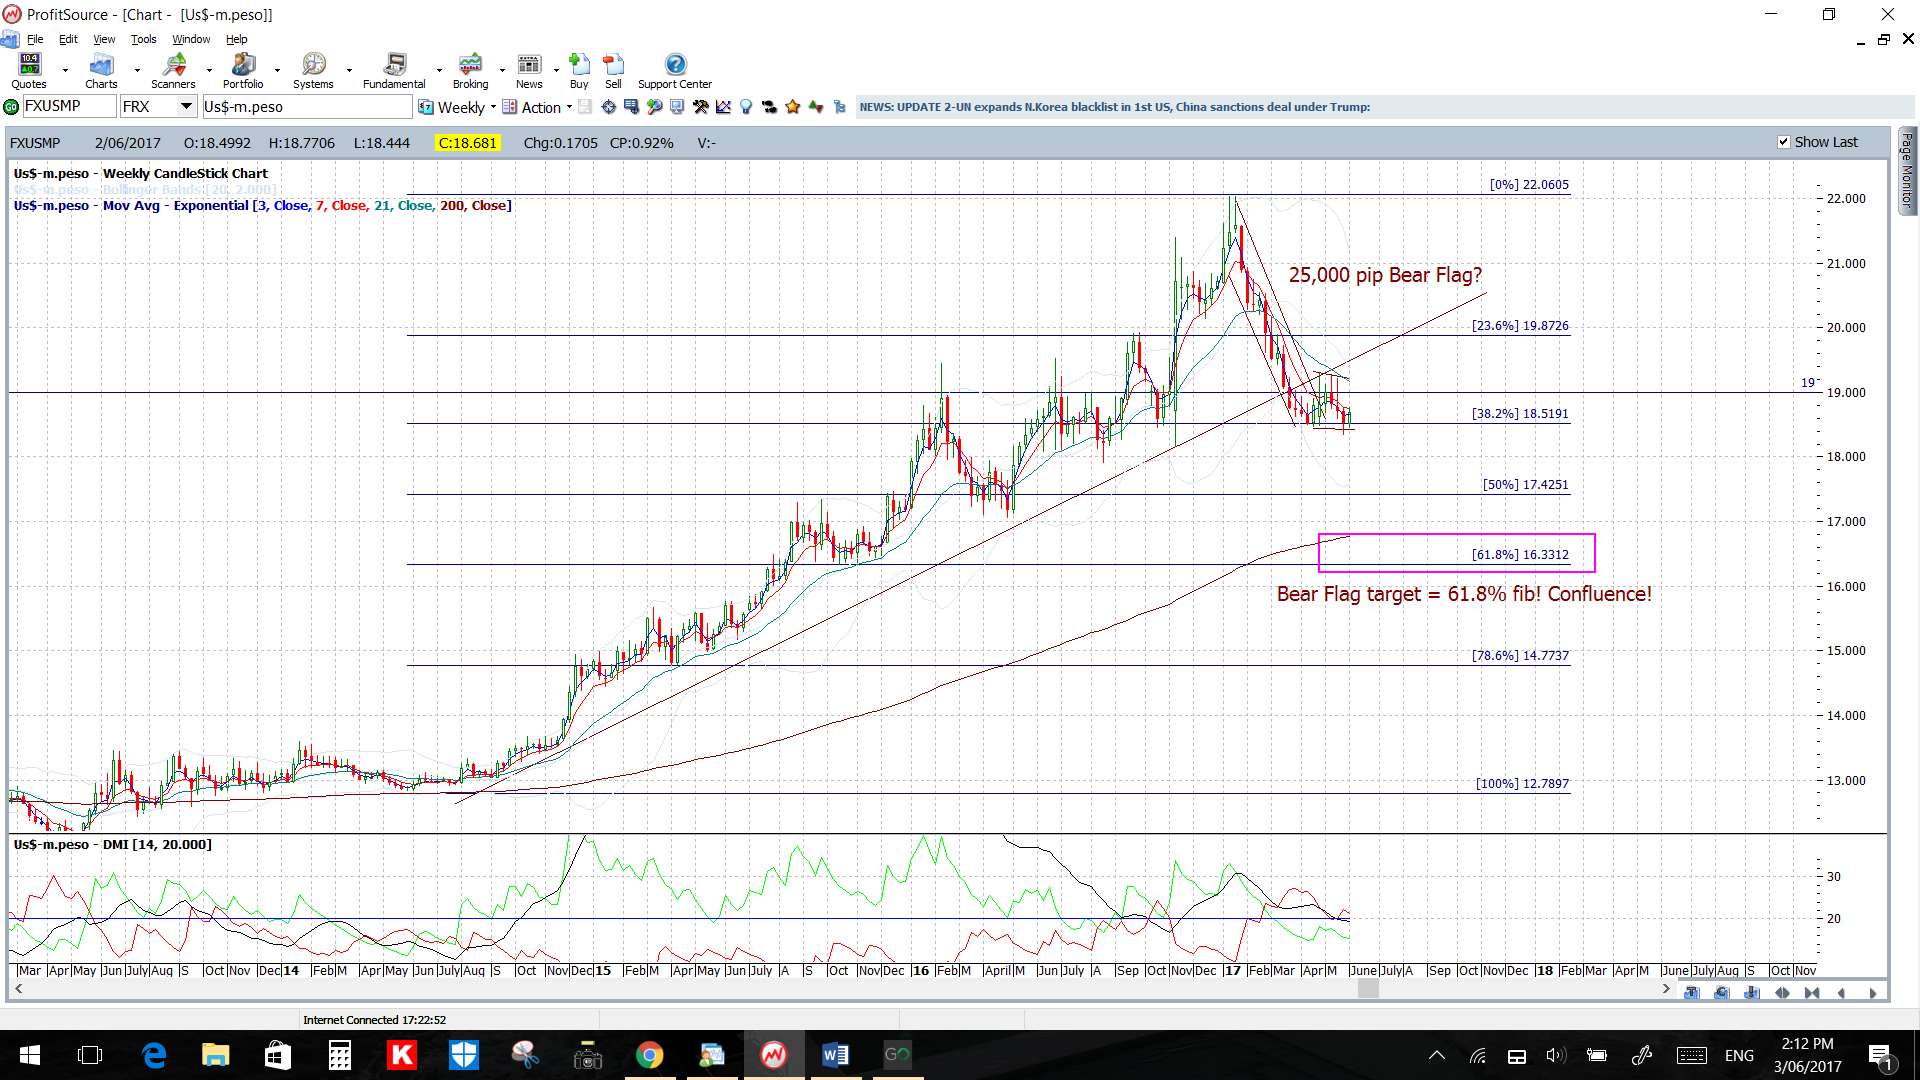
‘Any continued US$ weakness could herald some big moves in pairs such as the USD/MXN and USD/CNH. The USD/MXN could be starting a huge bear Flag and the USD/CNH is testing a multi-year support trend line with lots of room to fall.’
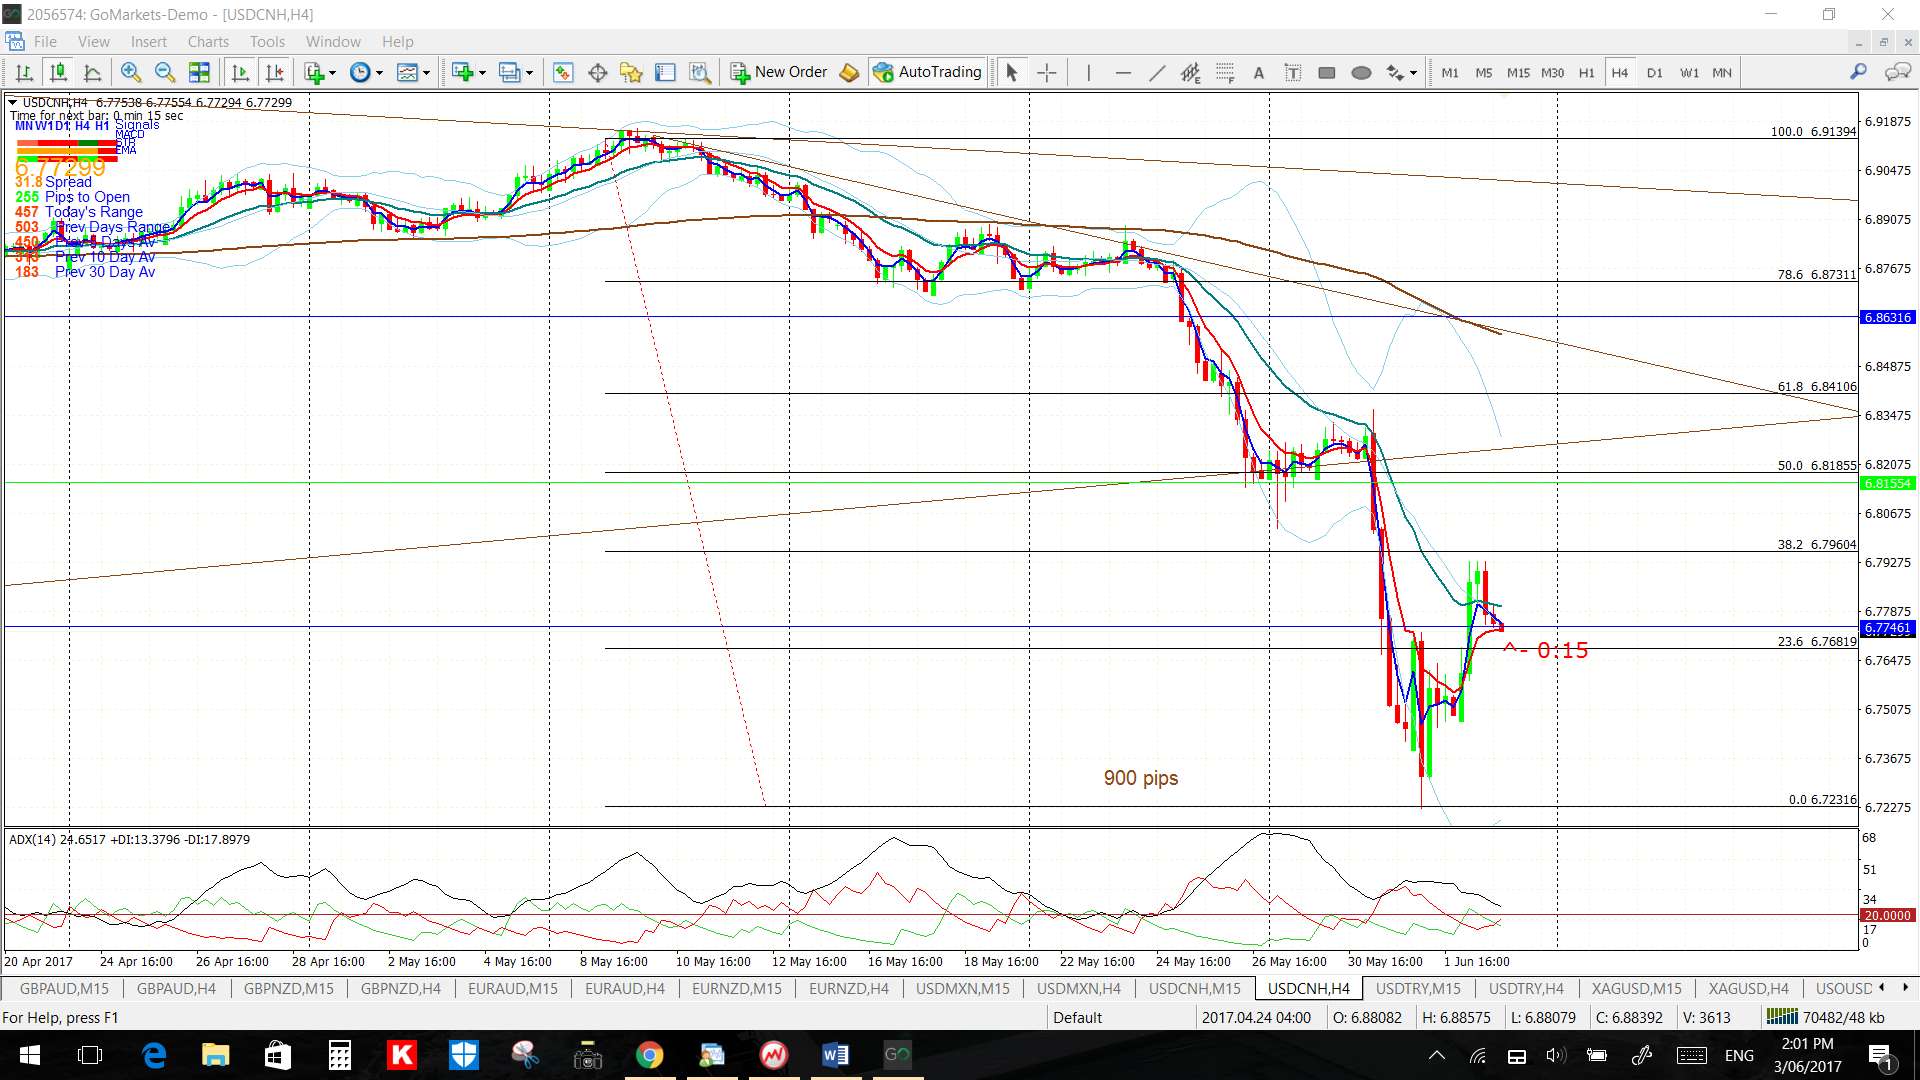
There was a bit of US$ weakness to start last week yet a huge trend line breakout move evolved on the USD/CNH for up to 900 pips! The USD/MXN gave what might be considered a counter intuitive move to the upside but, like with many breakout moves on this pair, it was a huge one worth 2,400 pips. The good news is that there are more Forex, Commodity and Stock Index technical patterns to monitor in the coming week.
Trend line breakout trades: Despite the choppiness there were still quiet a few trend line breakouts although they weren’t very smooth travelling. Pip and point tally moves on the following were noted here, here, here and here.
- Oil: 150 pips.
- Gold: 80 pips.
- EUR/USD: 230 pips.
- USD/MXN: 2,400 pips.
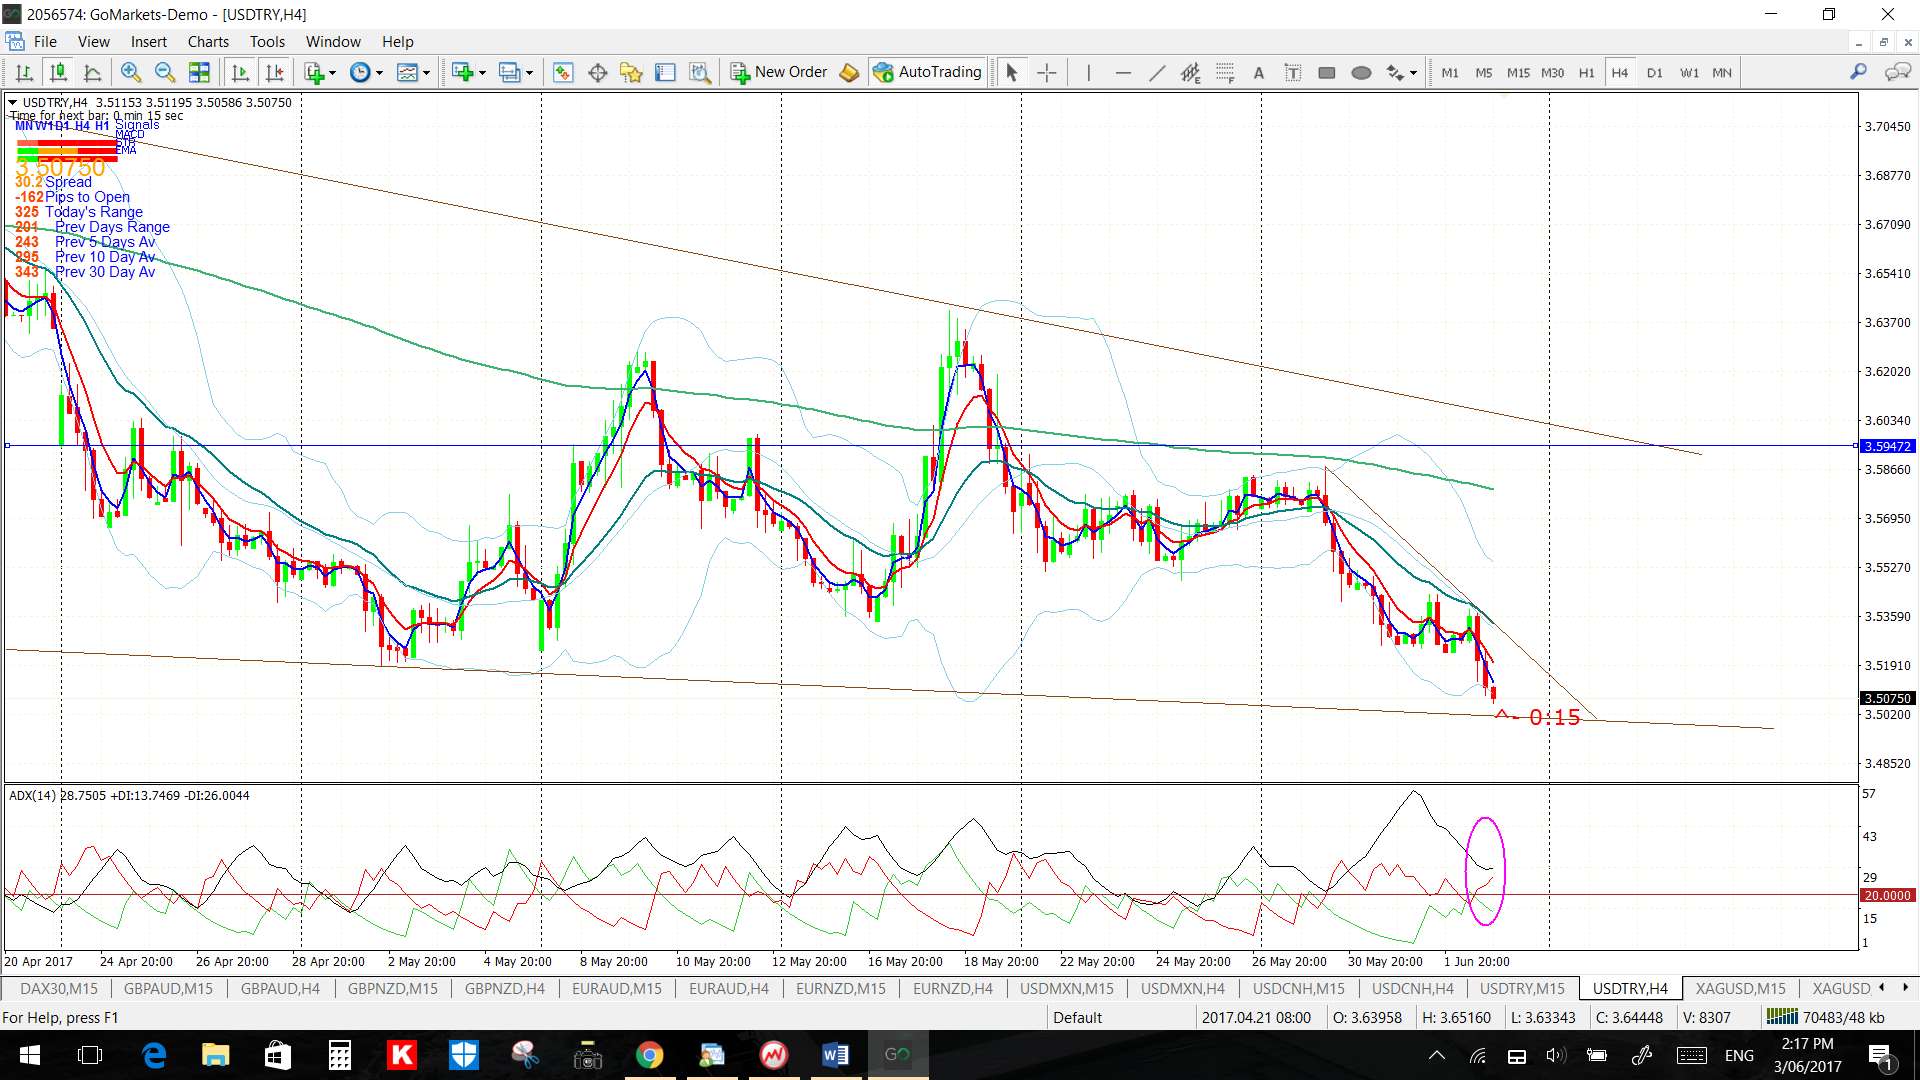
- USD/TRY: 300 pips.
- USD/CNH: 900 pips.
- GBP/AUD: 190 pips.
- EUR/NZD: 100 pips.
- EUR/AUD: 100 pips.
- GBP/NZD: 120 pips.
- DJIA: 170 points.
- S&P500: 20 points.
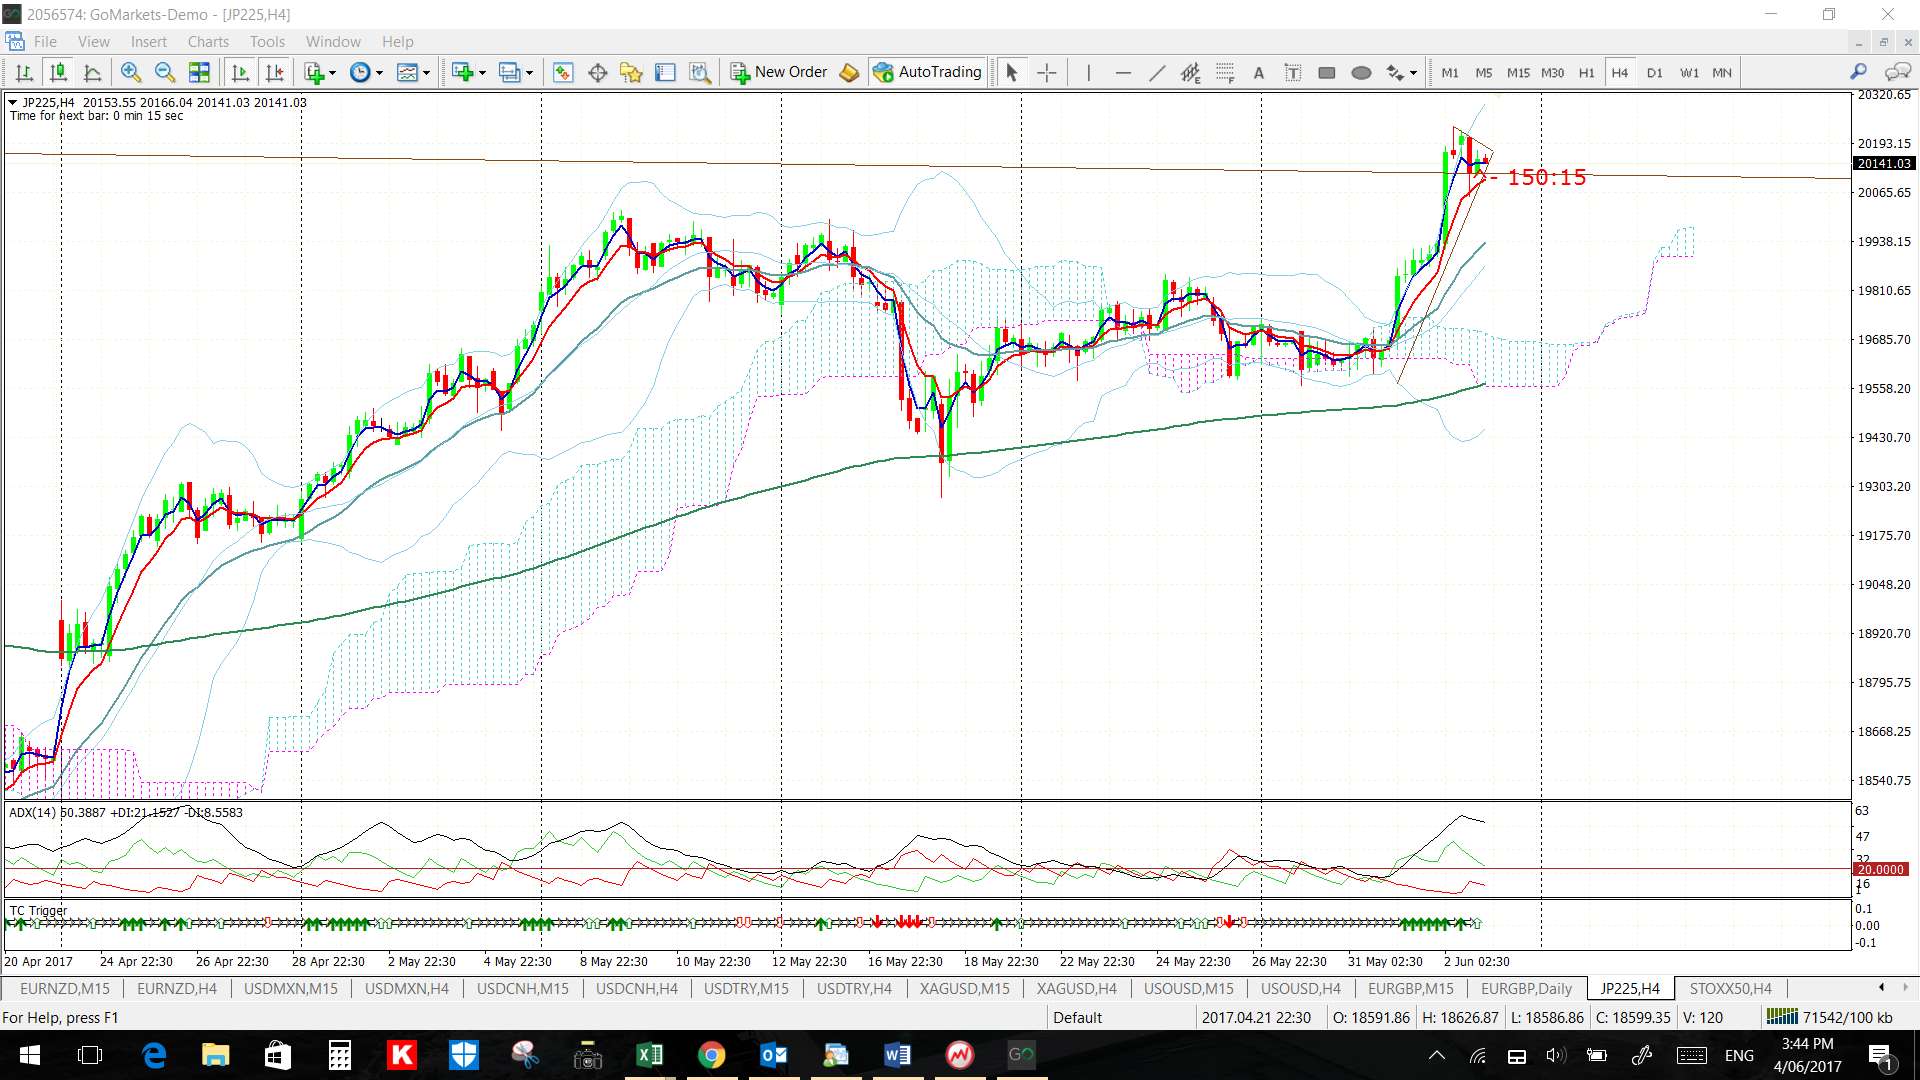
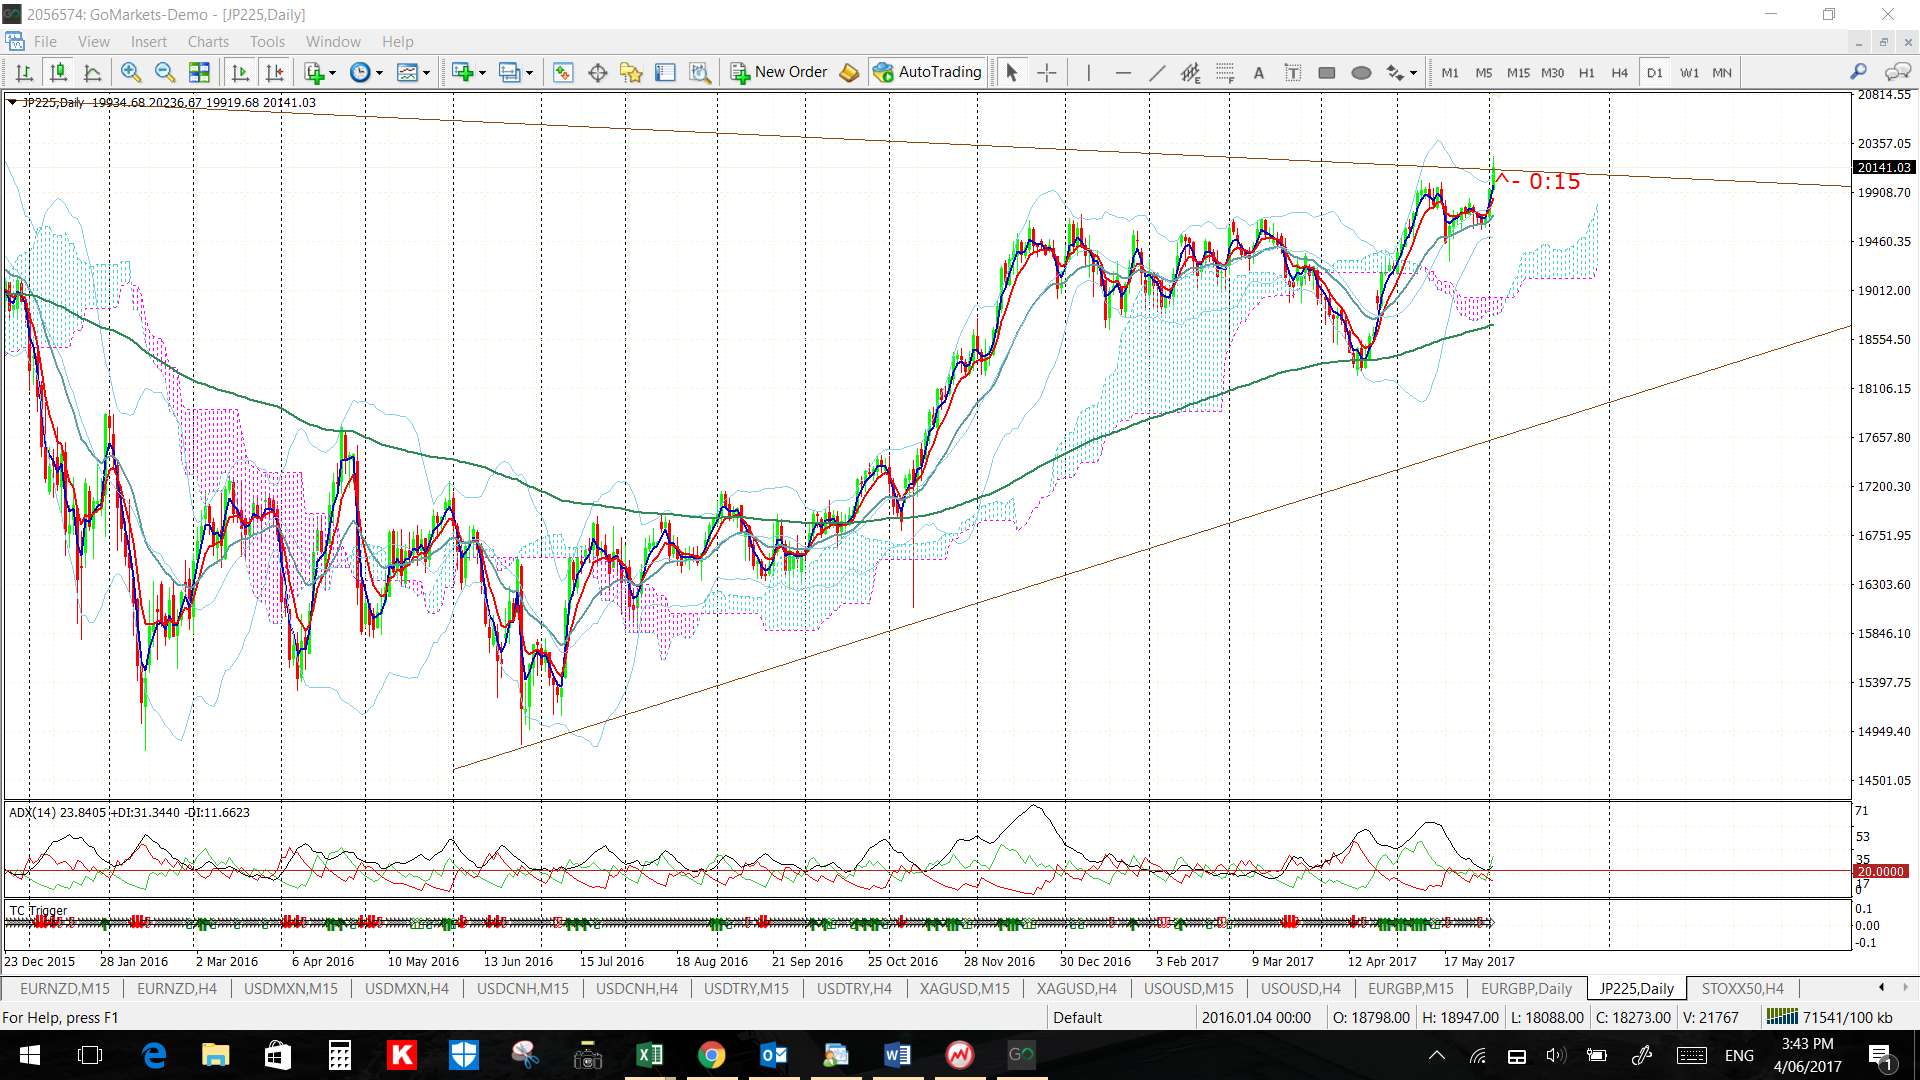
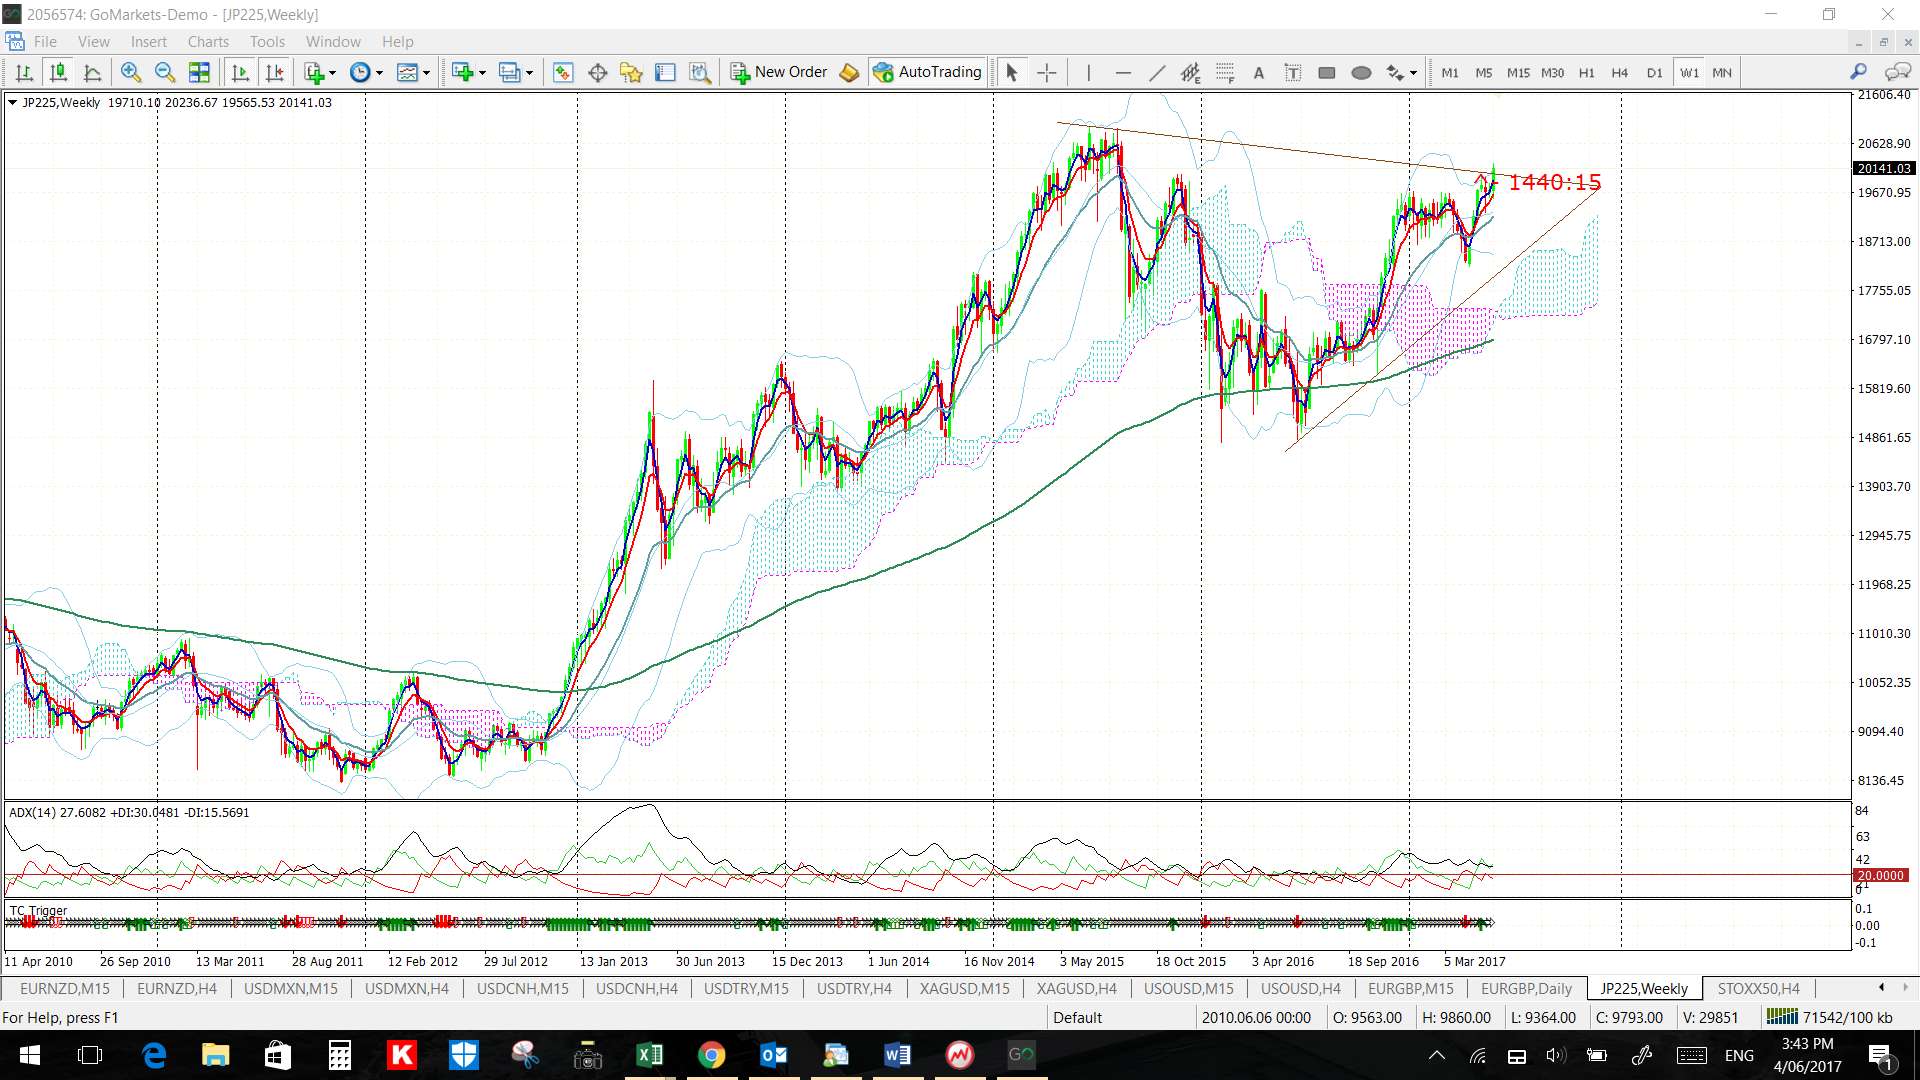
- UJ225: 46 points: updated here.
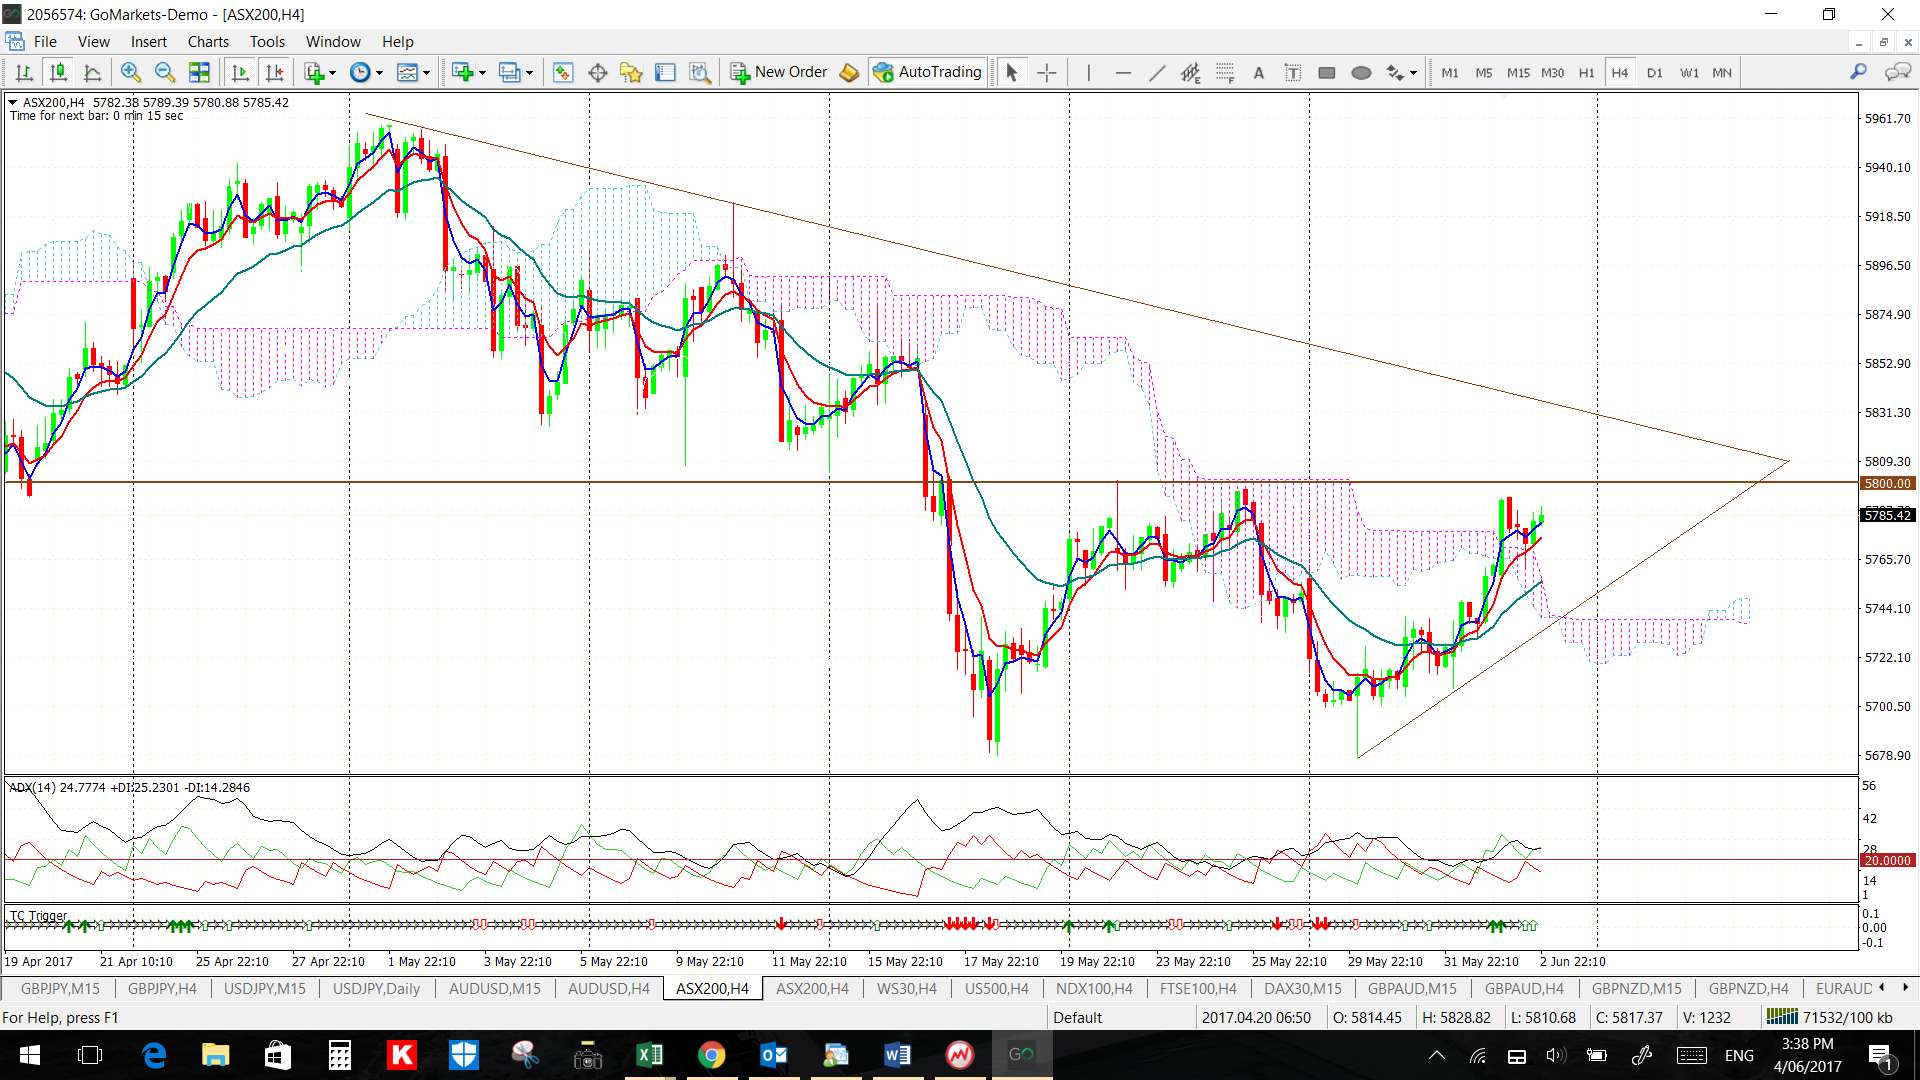
- ASX-200: 40 points updated here.
- NASDAQ: 50 points
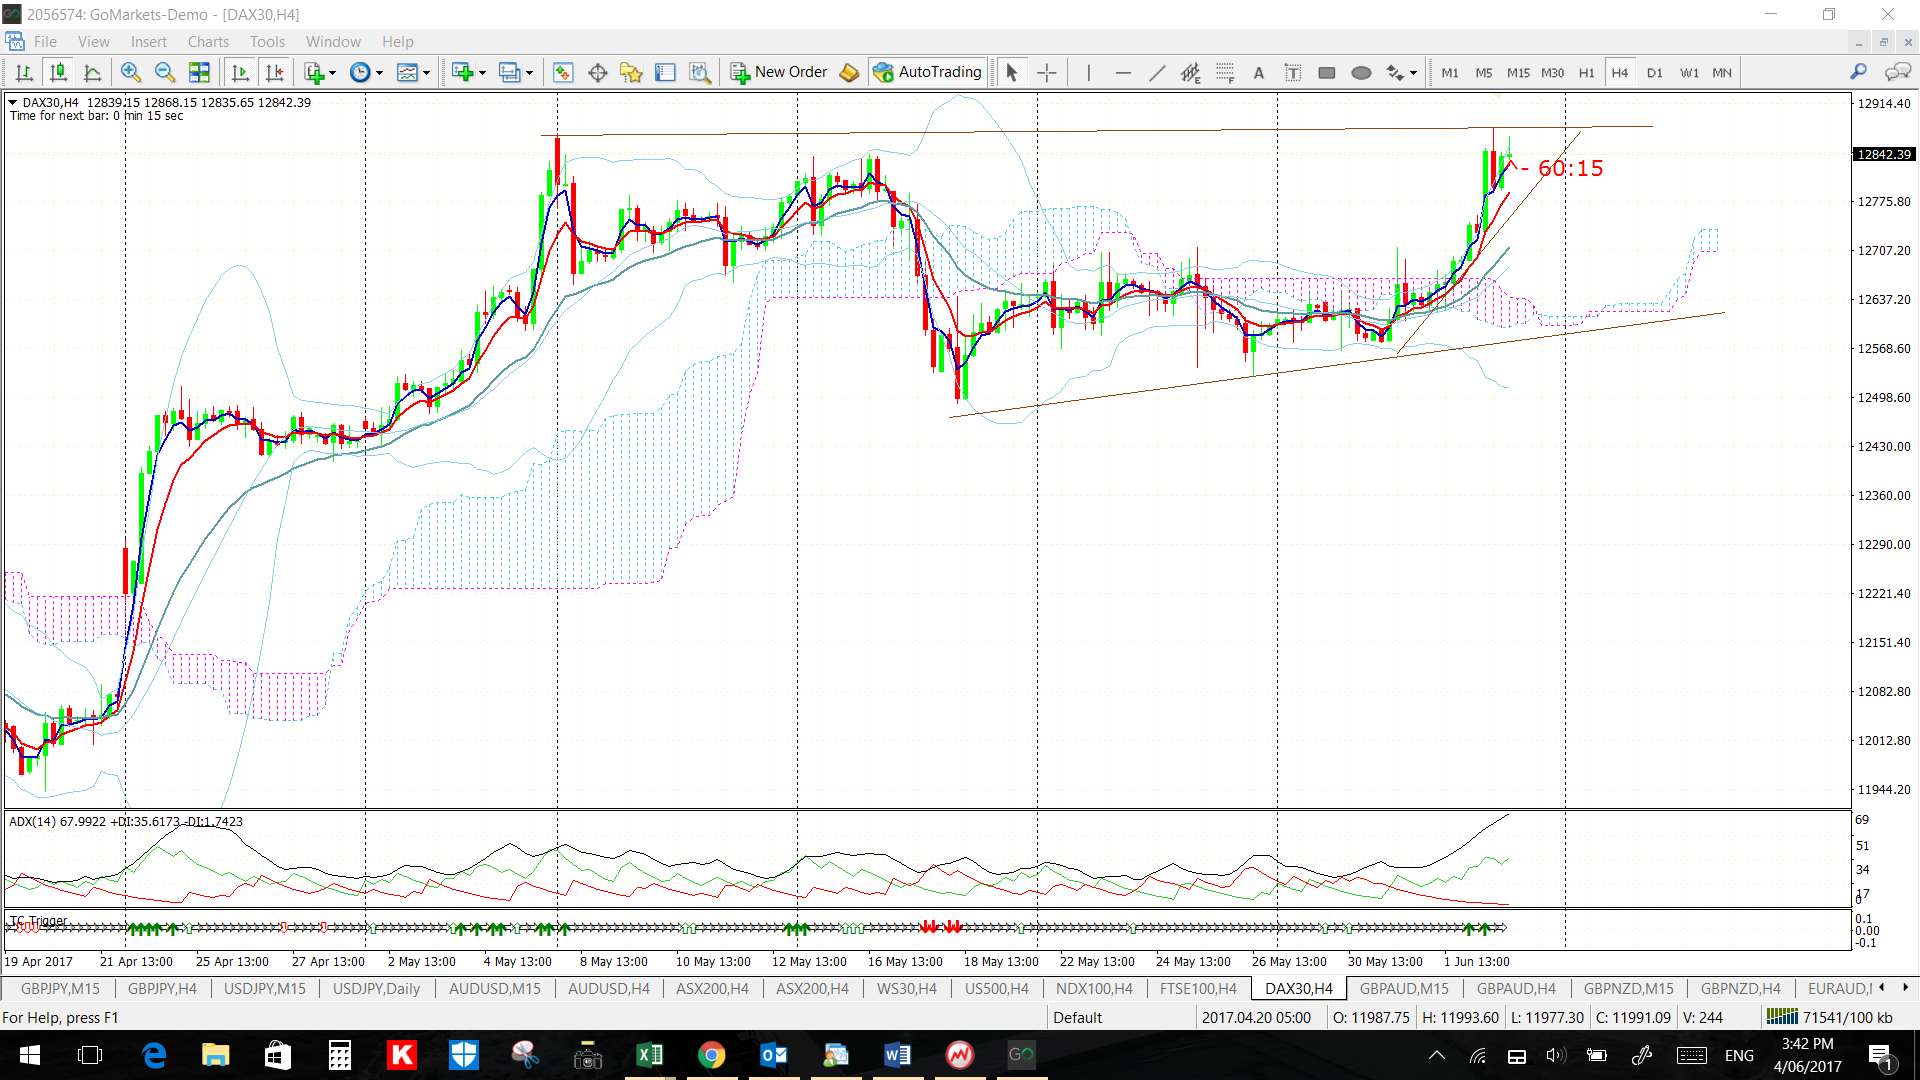
- DAX: 170 points from wedge breakout.
This week:
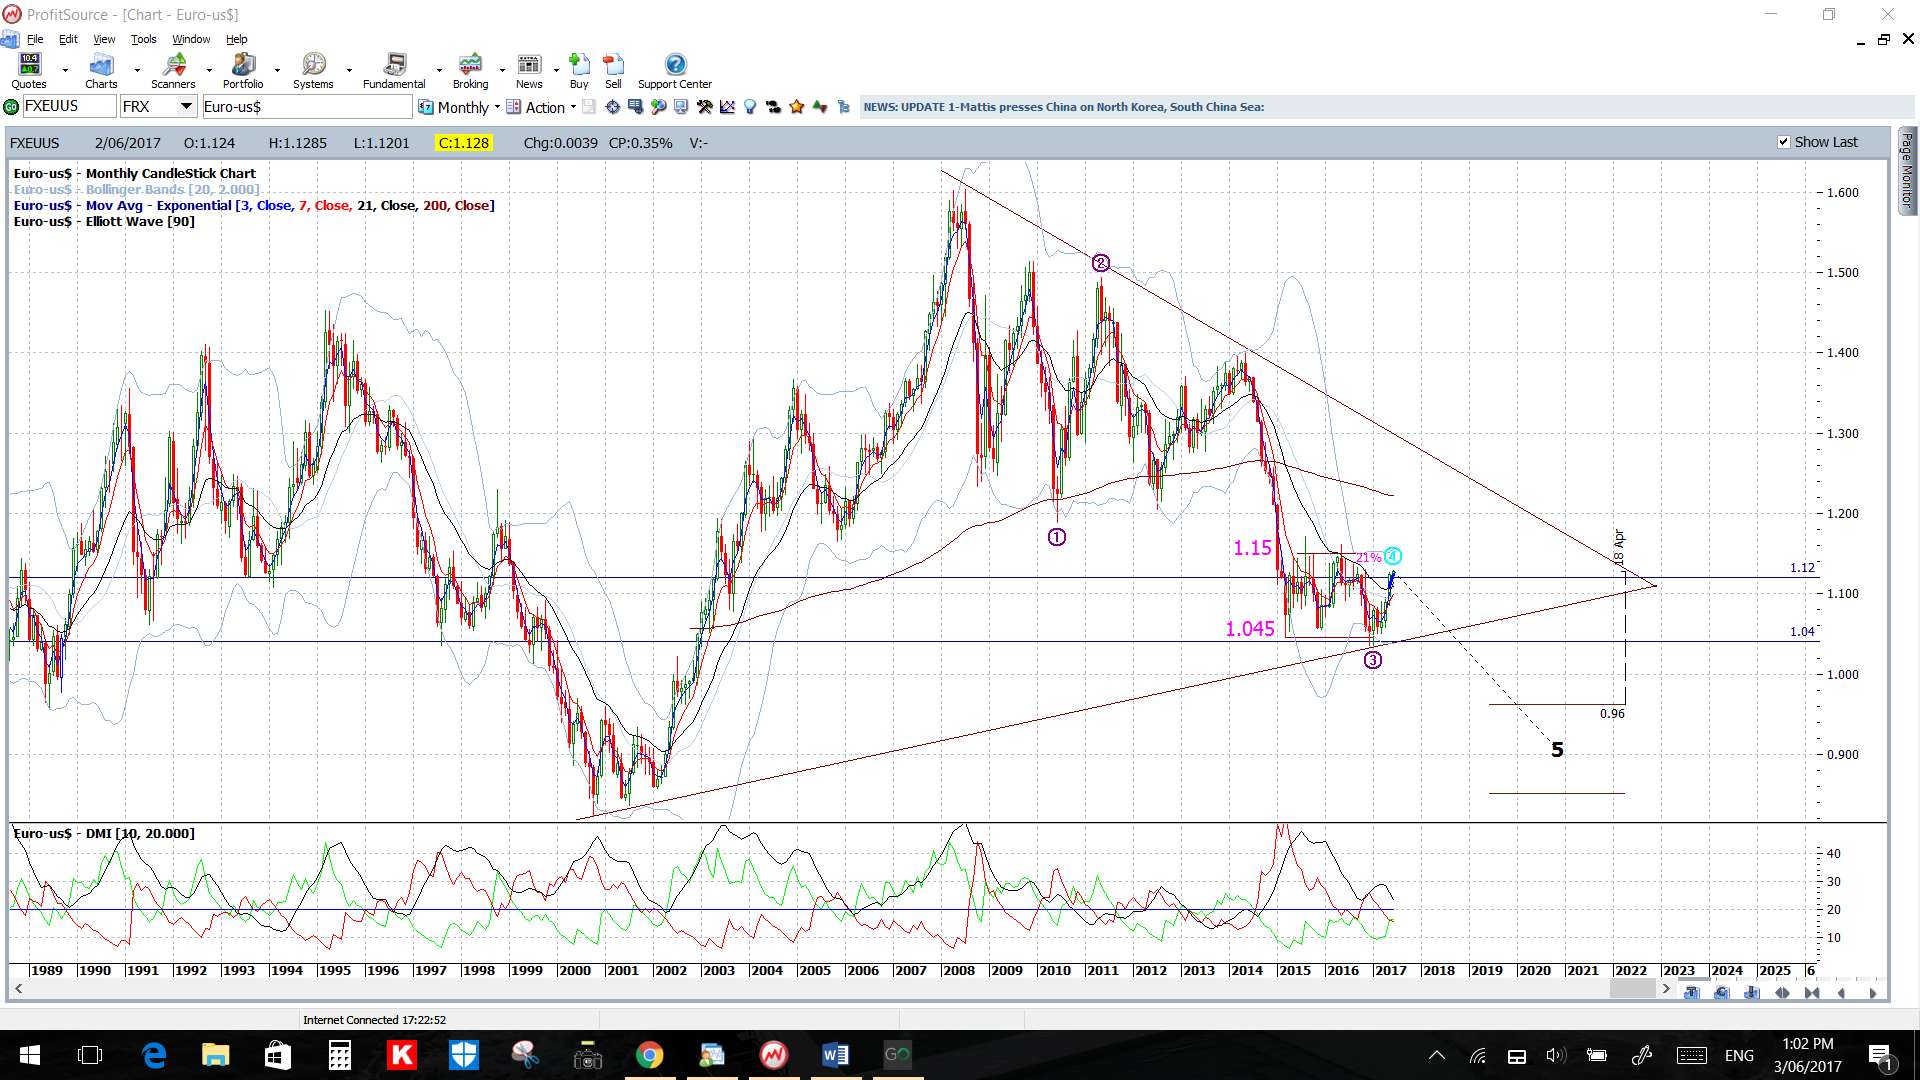
- US$: the US$ remains below a major 3-year support trend line and has now broken below the weekly Ichimoku Cloud which adds weight to continued bearish sentiment. I’m wondering if we’re about to get some US$ reversion to the mean activity following three years of incline? Trends do not travel in straight lines forever and so a Fib pullback would not surprise, even if there is to be overall continuation in the longer-term. Traders need to watch for any continued US$ weakness as this might create better trading opportunities on USD-based pairs and some cross-pairs could become choppy. A review of the FX Indices can be found through this link.
- UK Elections: the UK election are held this week so caution is needed with all GBP pairs.
- Data: it’s a big data week some currencies. The AUD has an RBA interest rate update, GDP and Trade Balance data, the GBP has Services PMI, Parliamentary Elections and Manufacturing data whilst the EUR also has an interest rate update.
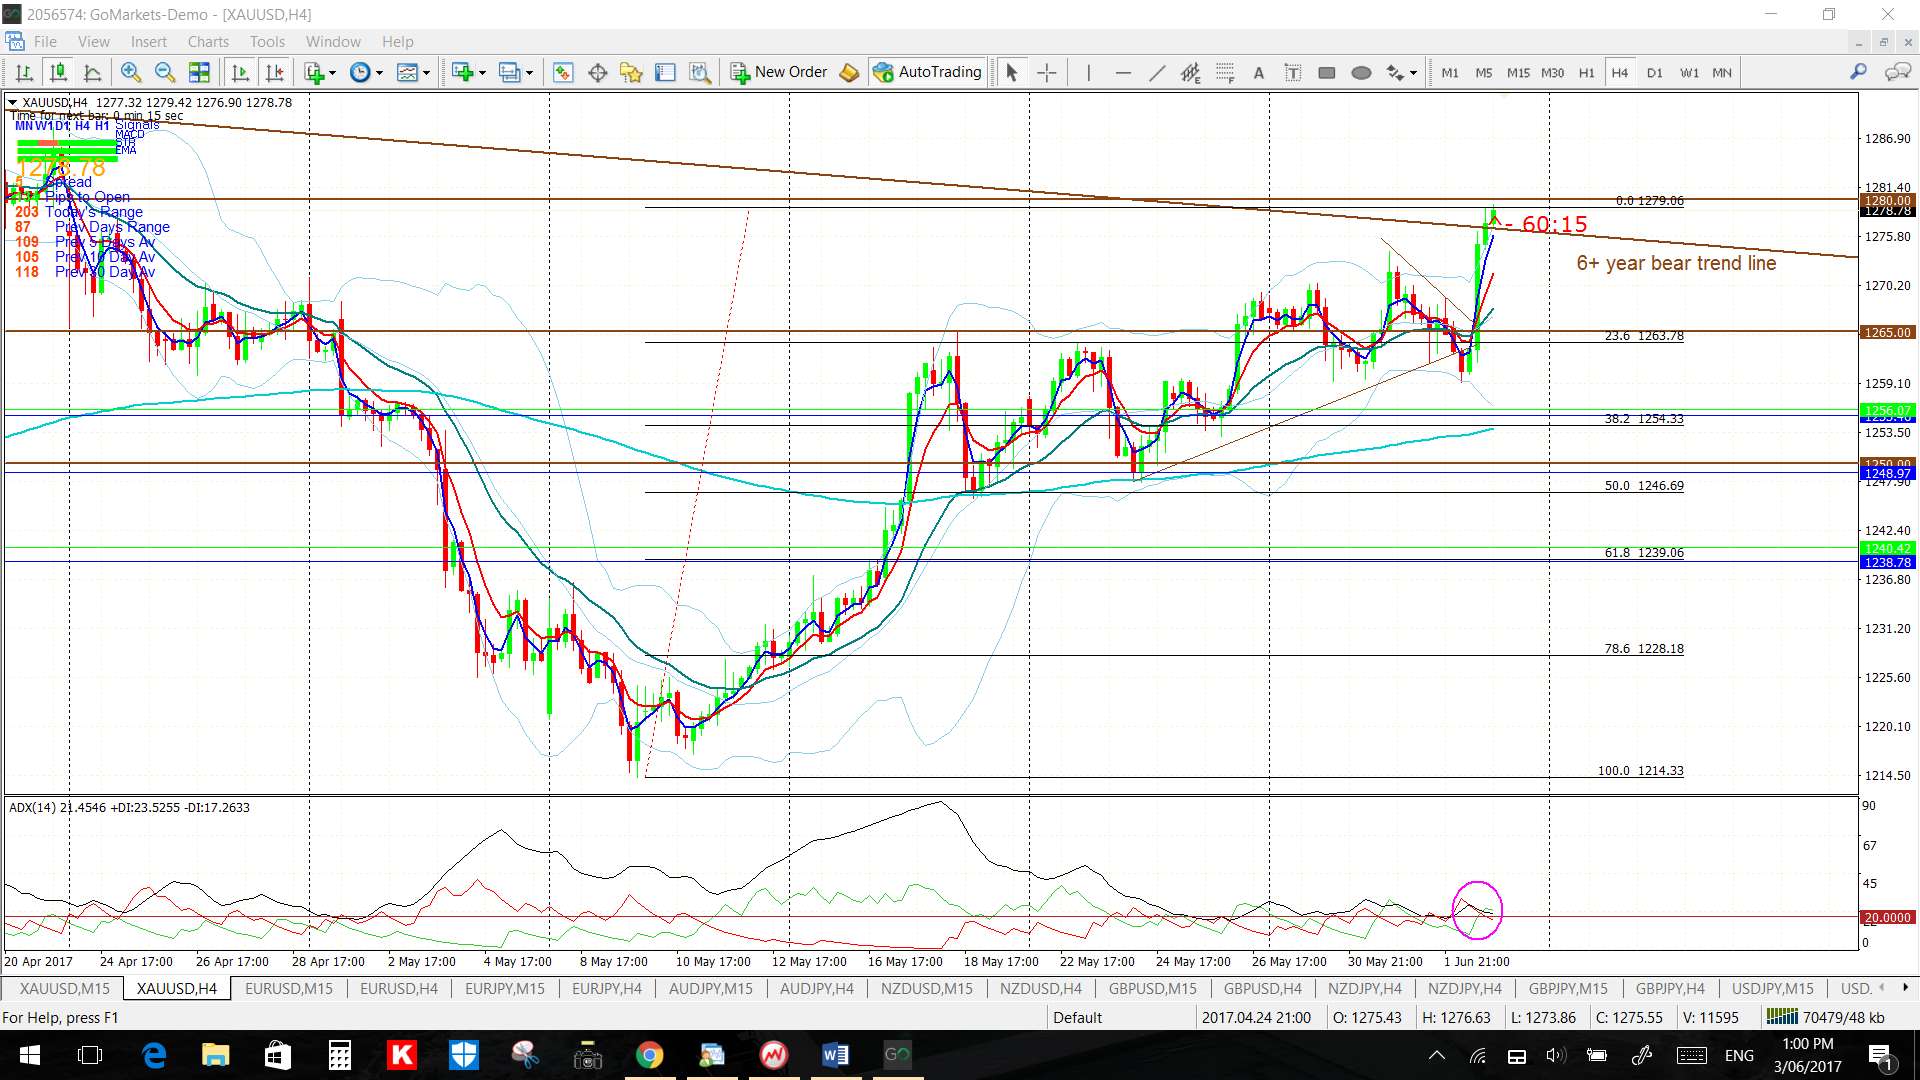
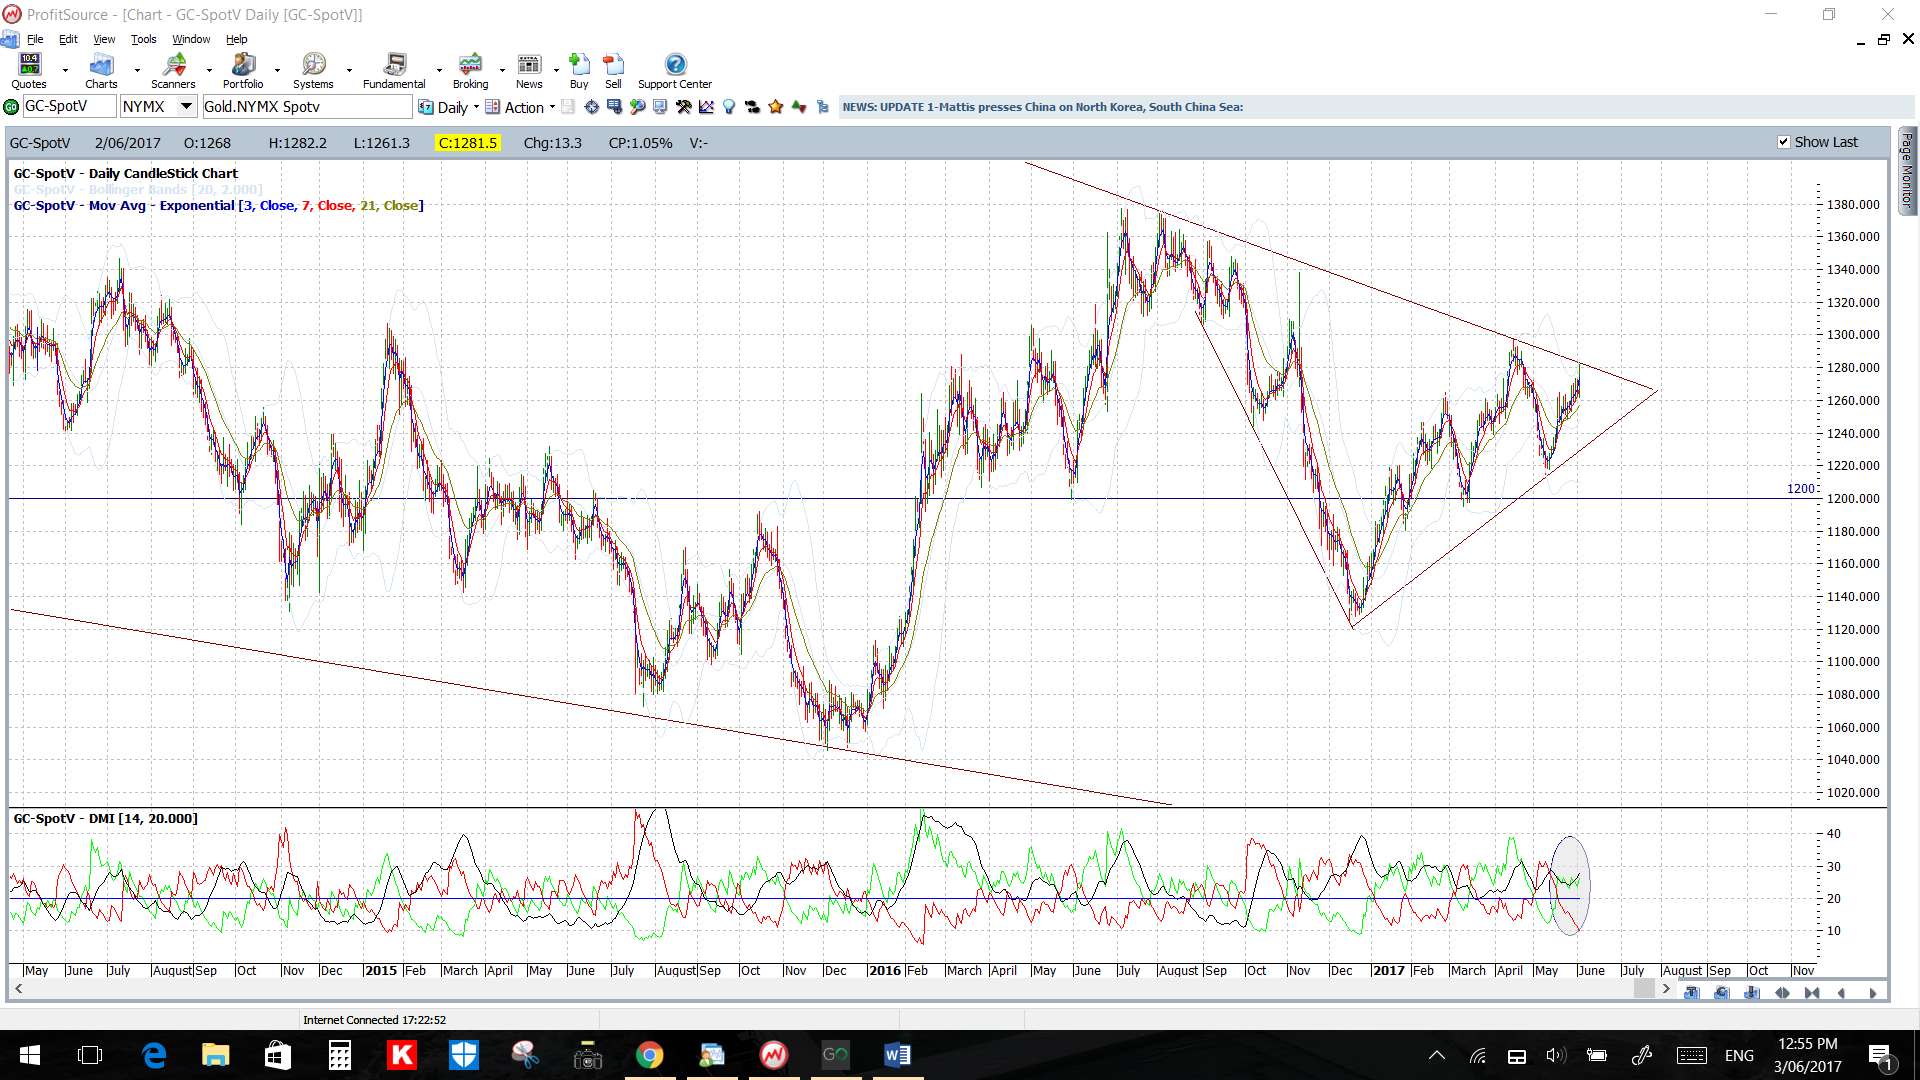
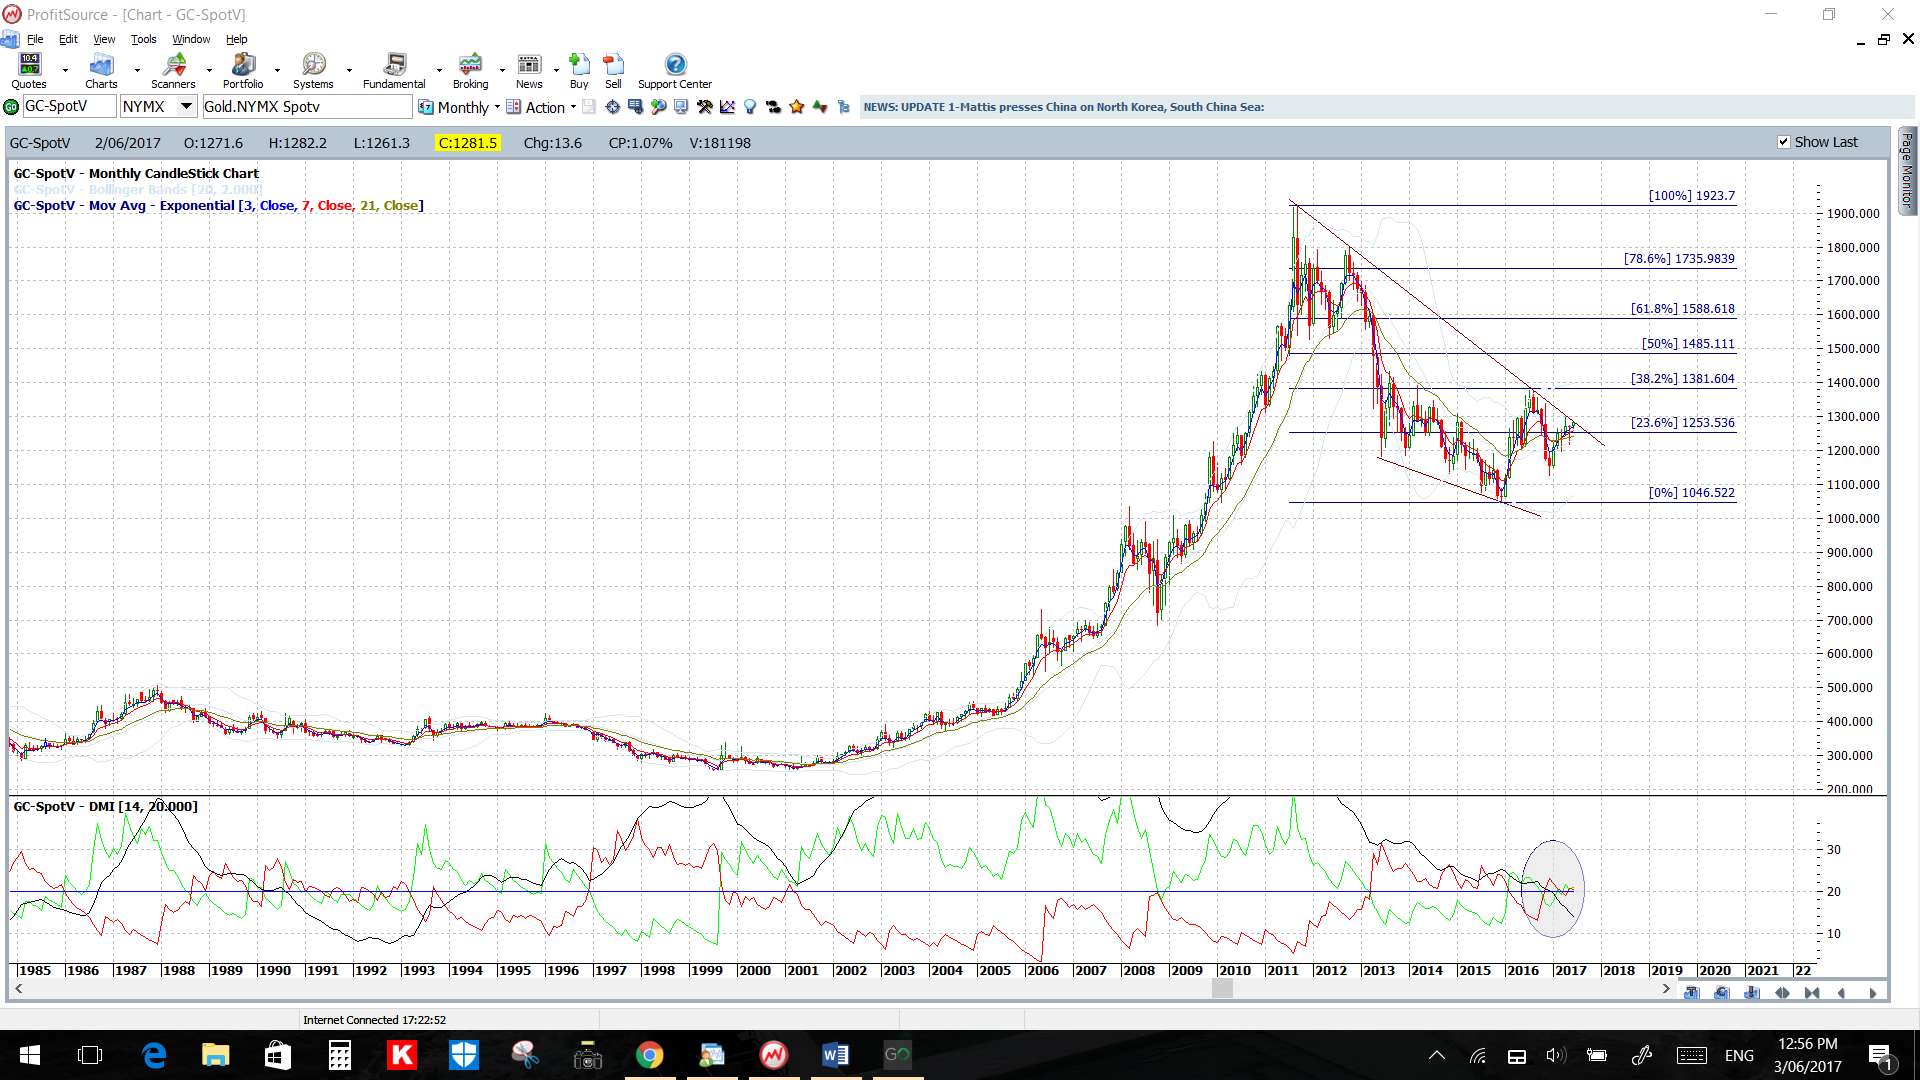
- Gold: is now sitting up near a 6-year bear trend line and threatening a major breakout move.
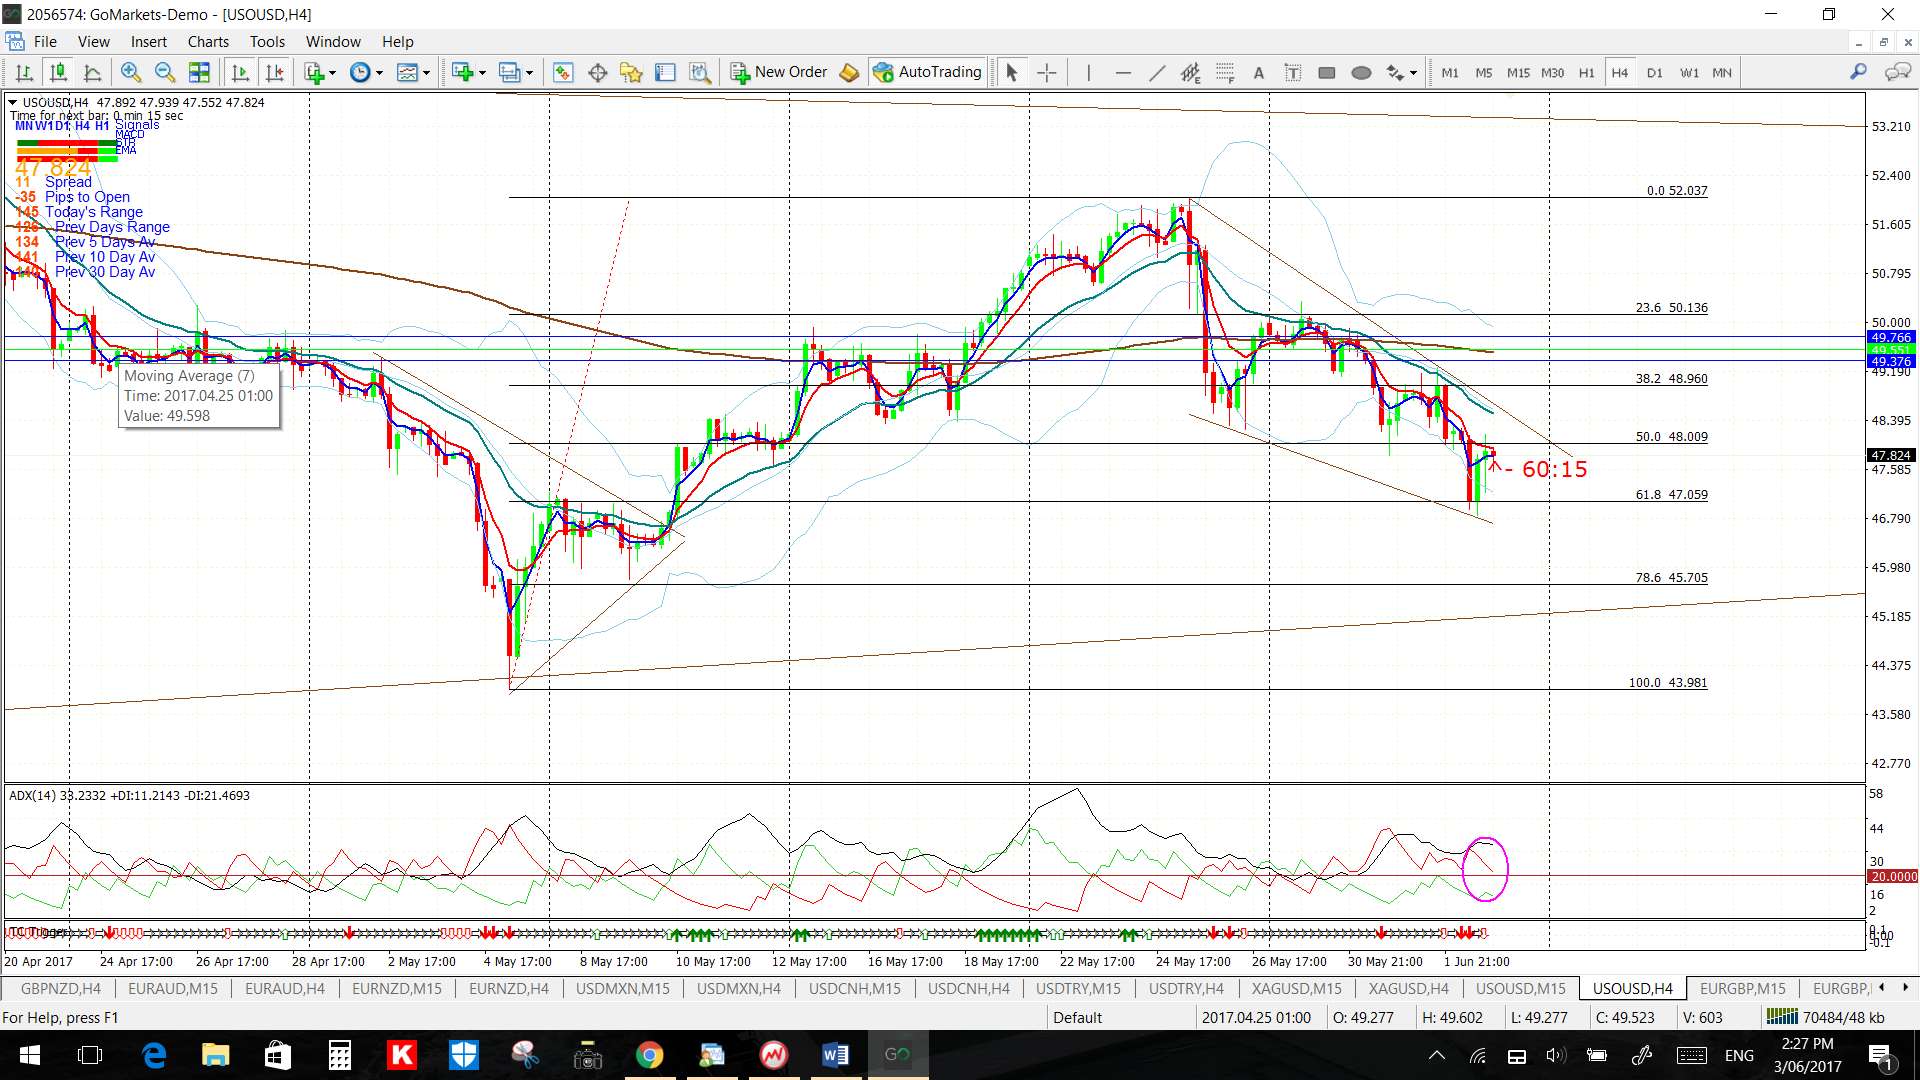
- Oil: this stopped at my ‘line in the sand level’ of the 4hr chart’s 61.8% fib. Watch this level for any new make or break move.
- GBP/NZD: I have adjusted the monthly chart’s bear trend line here due to lack of follow-through.
- GBP/AUD and GBP/JPY: both of these pairs continue chopping under 20+ month bear trend lines so watch for any make or breakactivity. These trend lines form part of triangle patterns that technical theory suggests are worth over 4,000 pips so these are well worth monitoring.
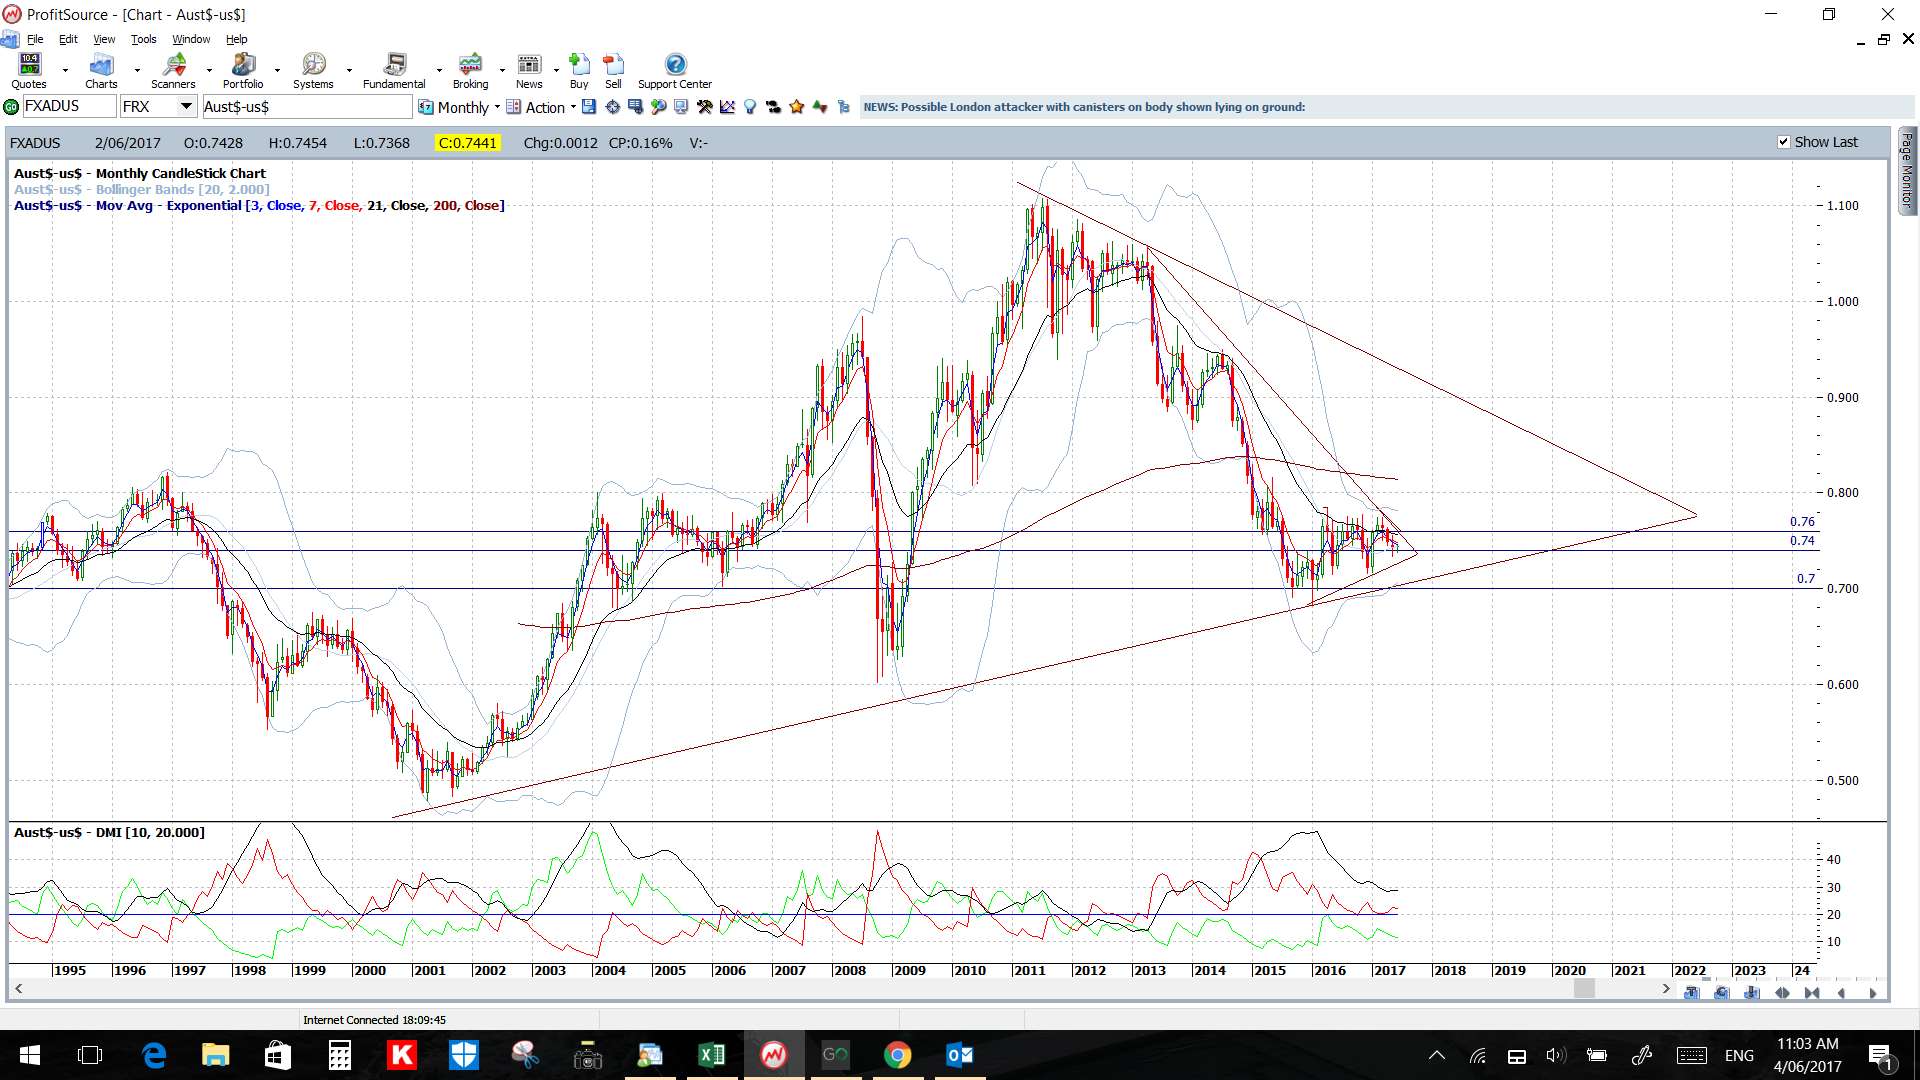
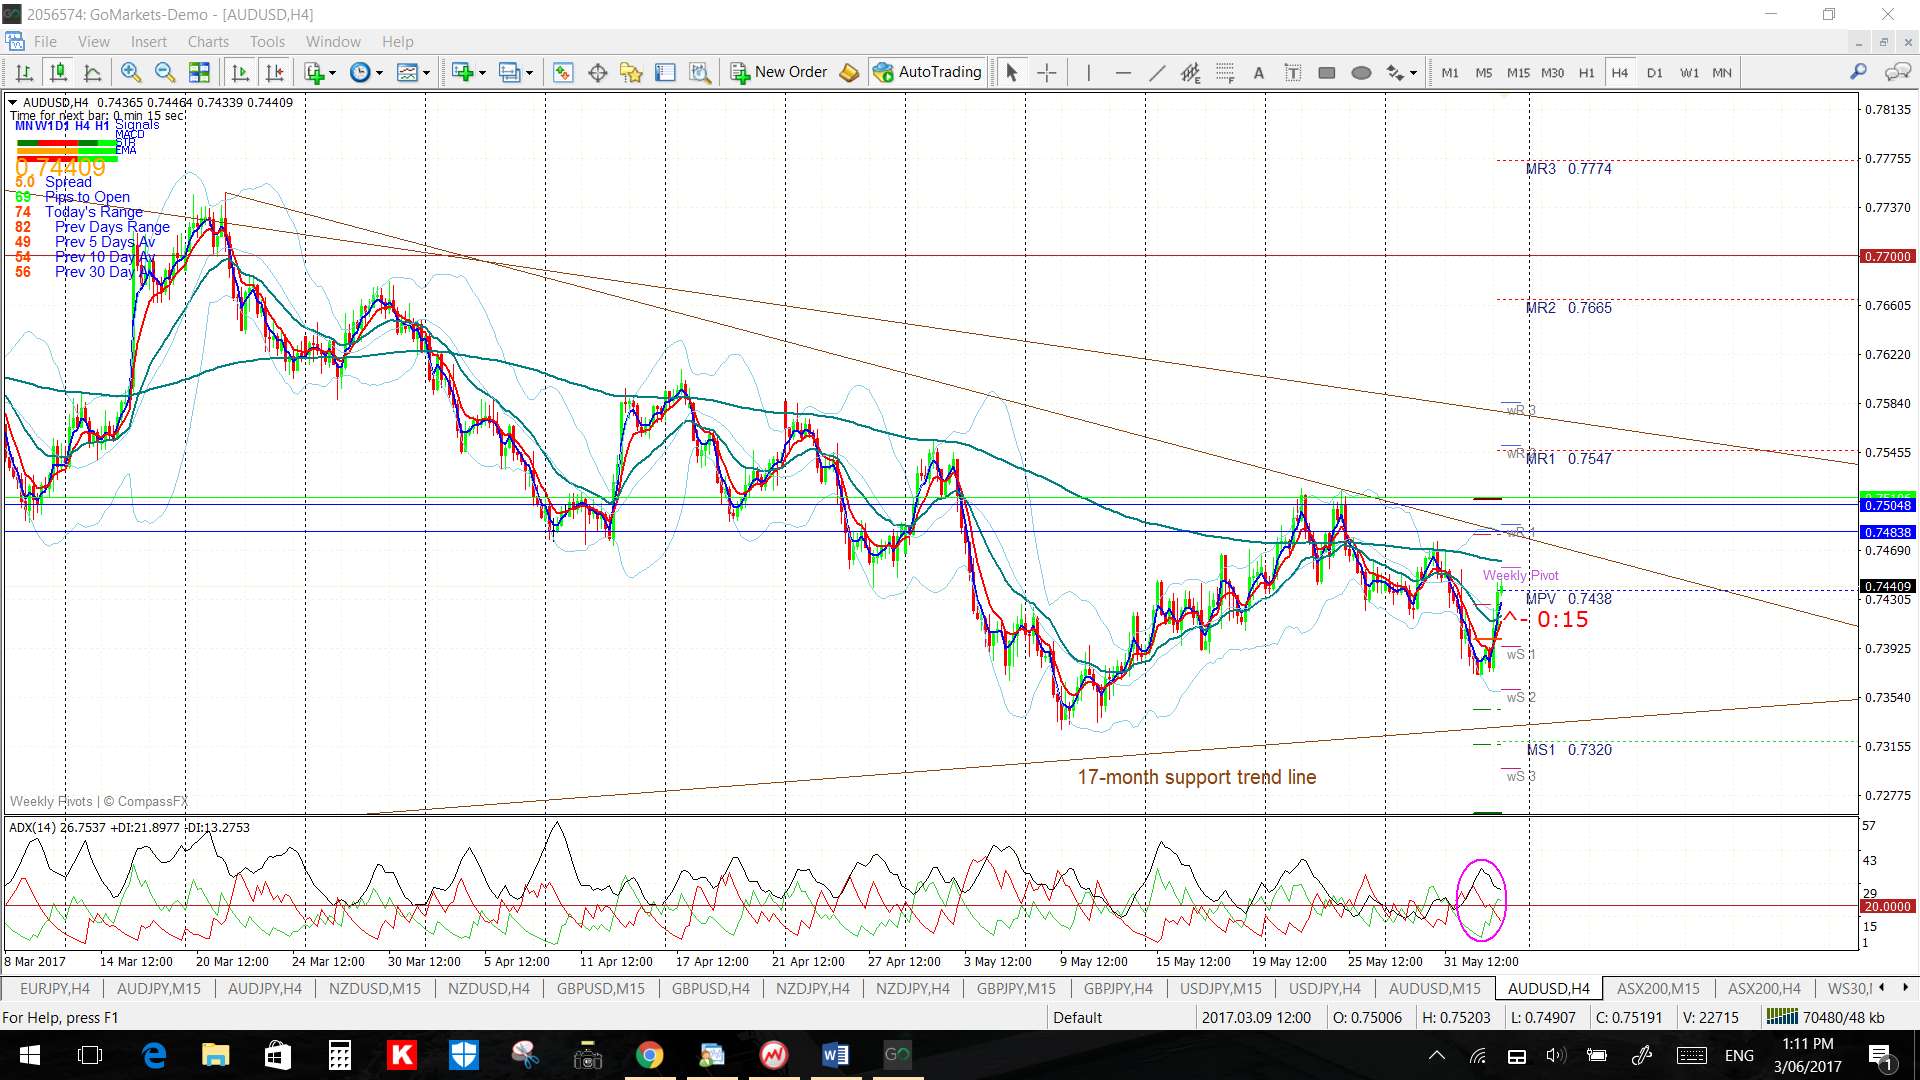
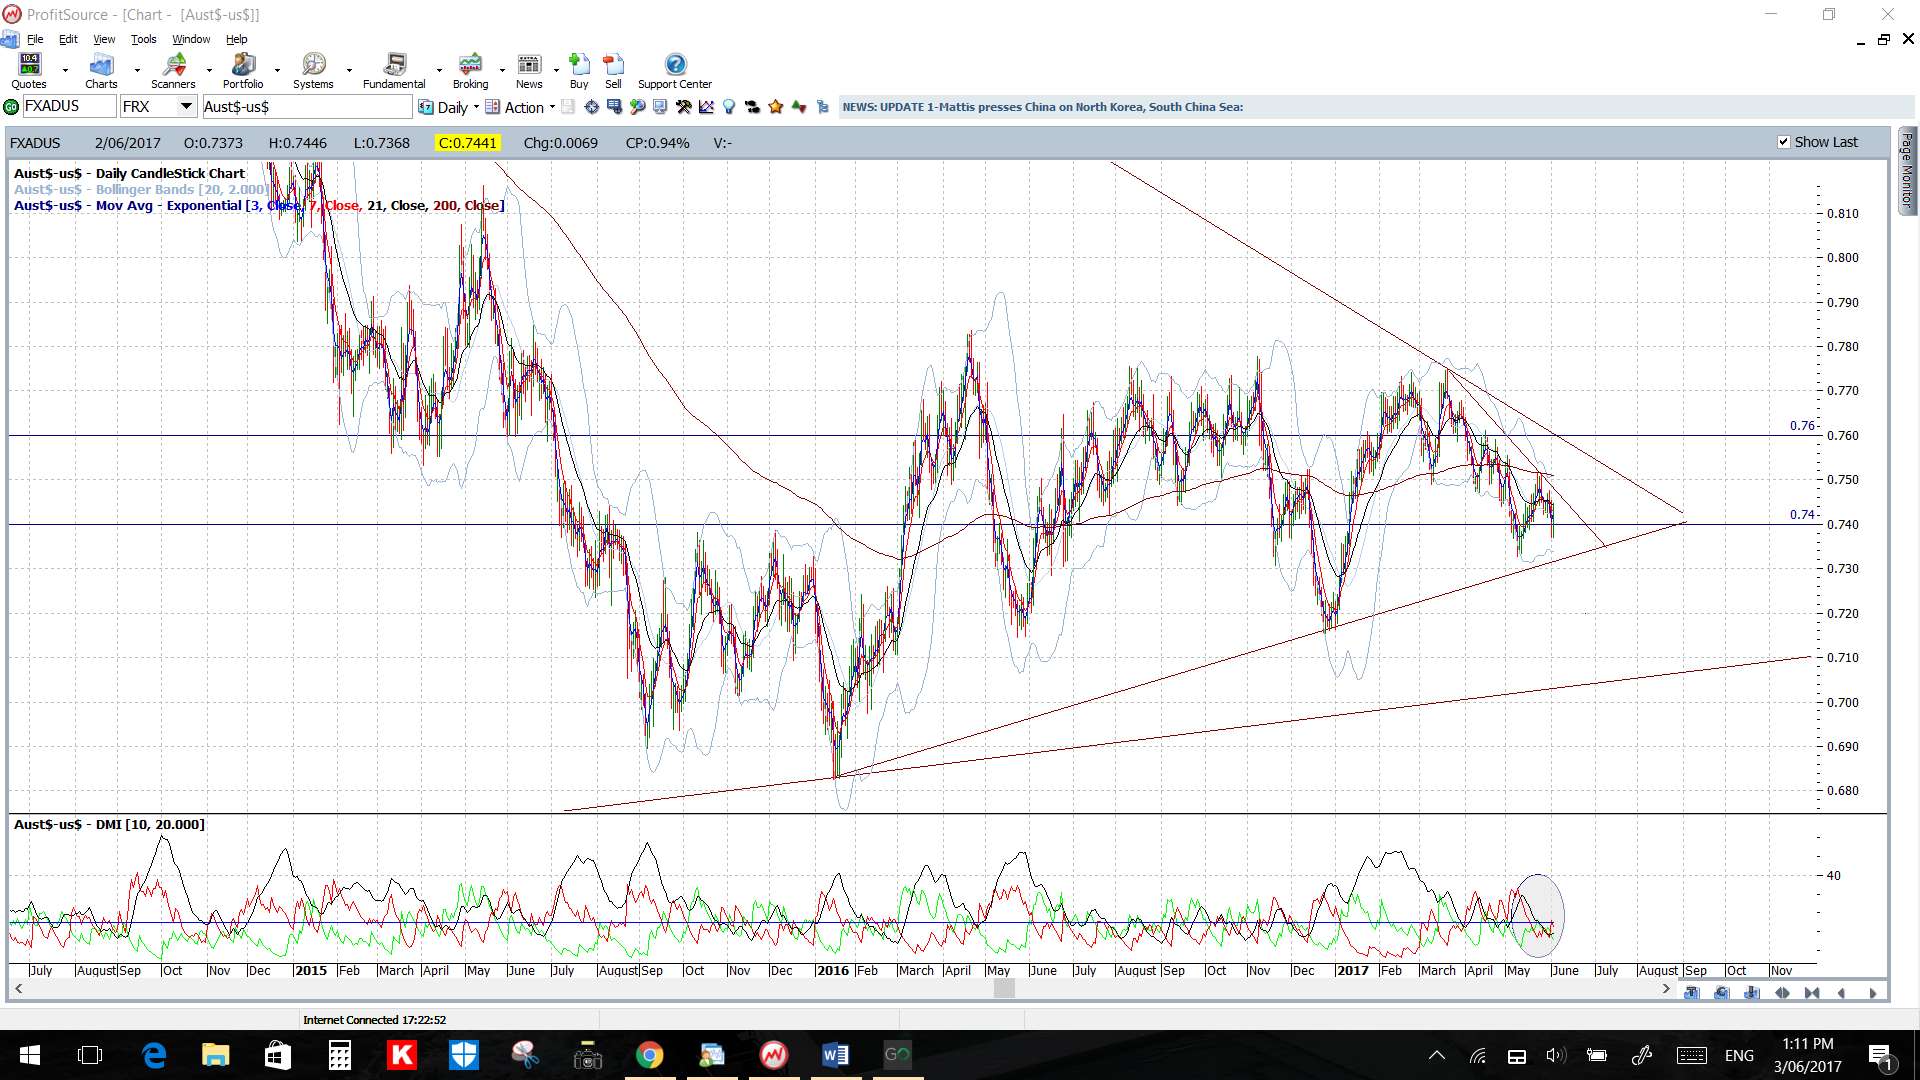
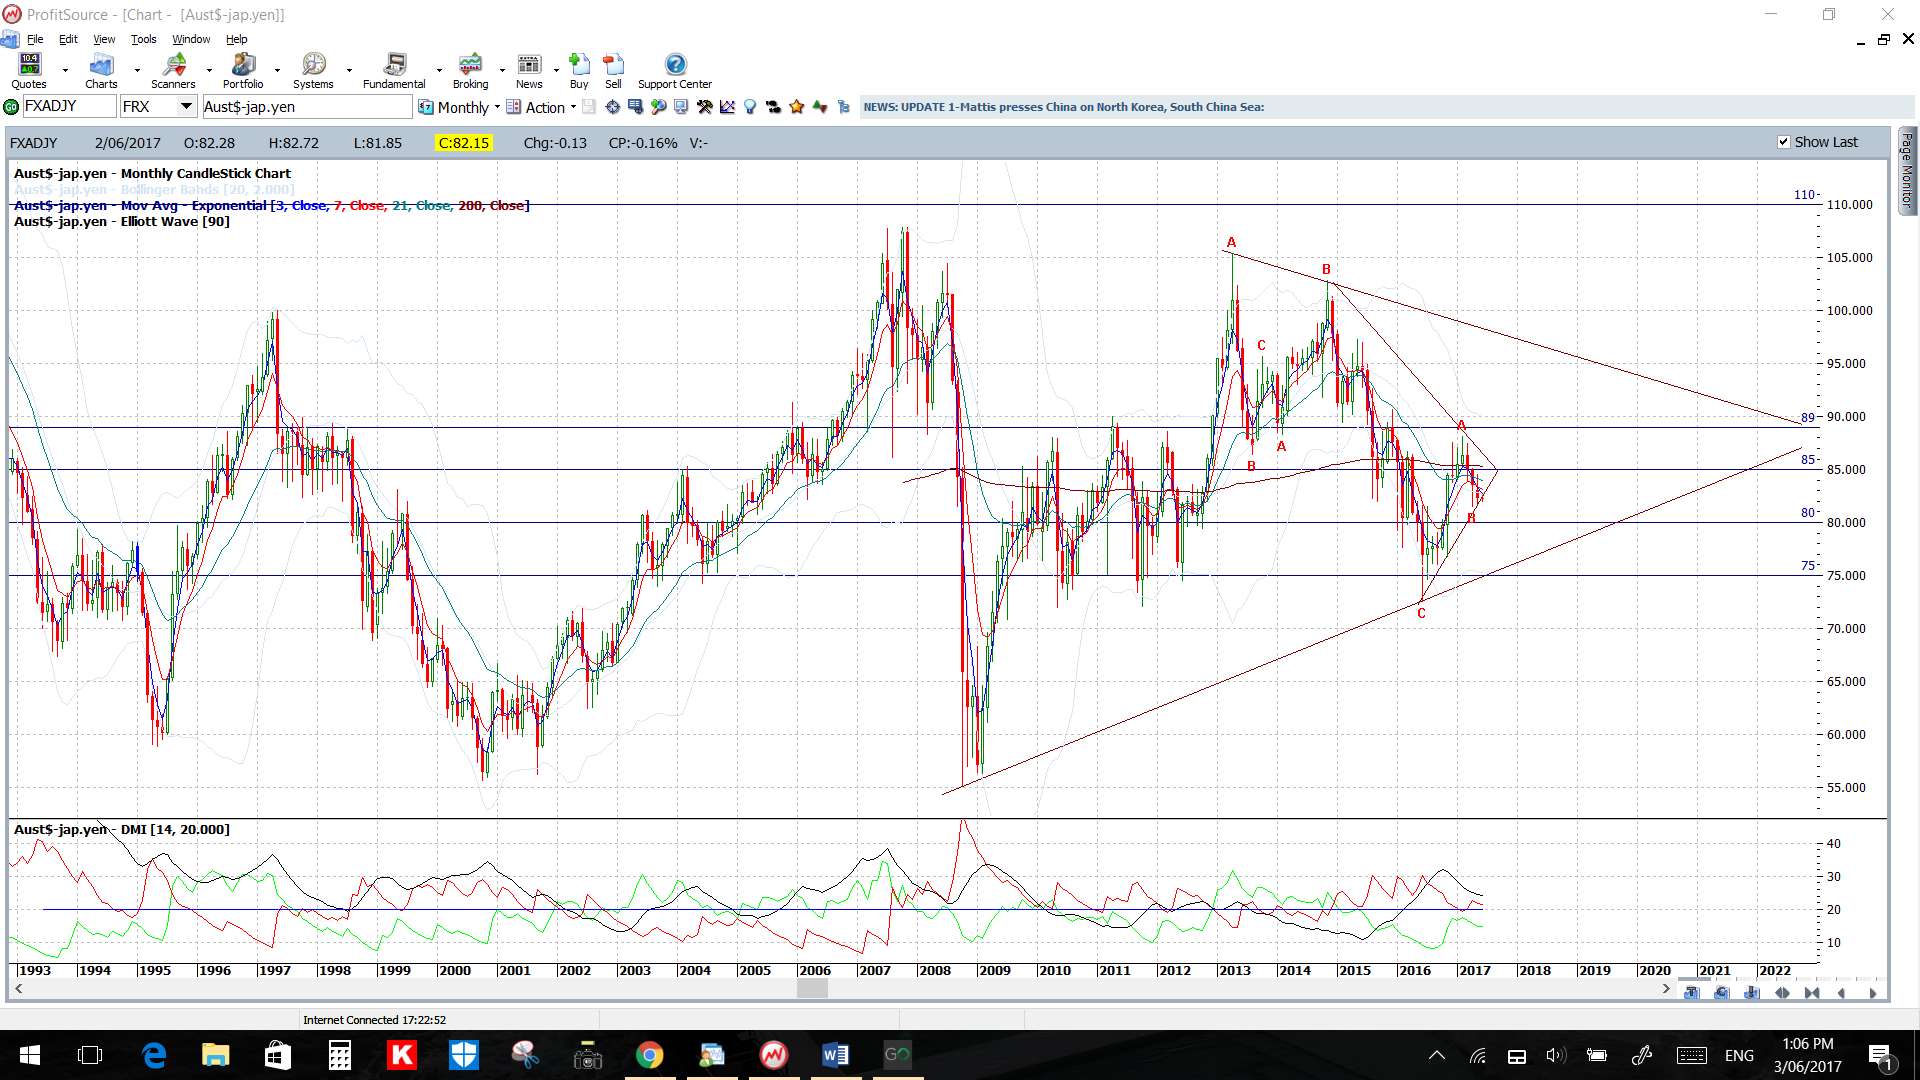
- AUD/USD: the Aussie has essentially gone sideways for 2 1/2 years! I’m wondering if the weaker US$ and this week’s AUD might help to trigger a triangle breakout? It’s getting rather squeezed towards the apex here! (click on chart to enlarge).
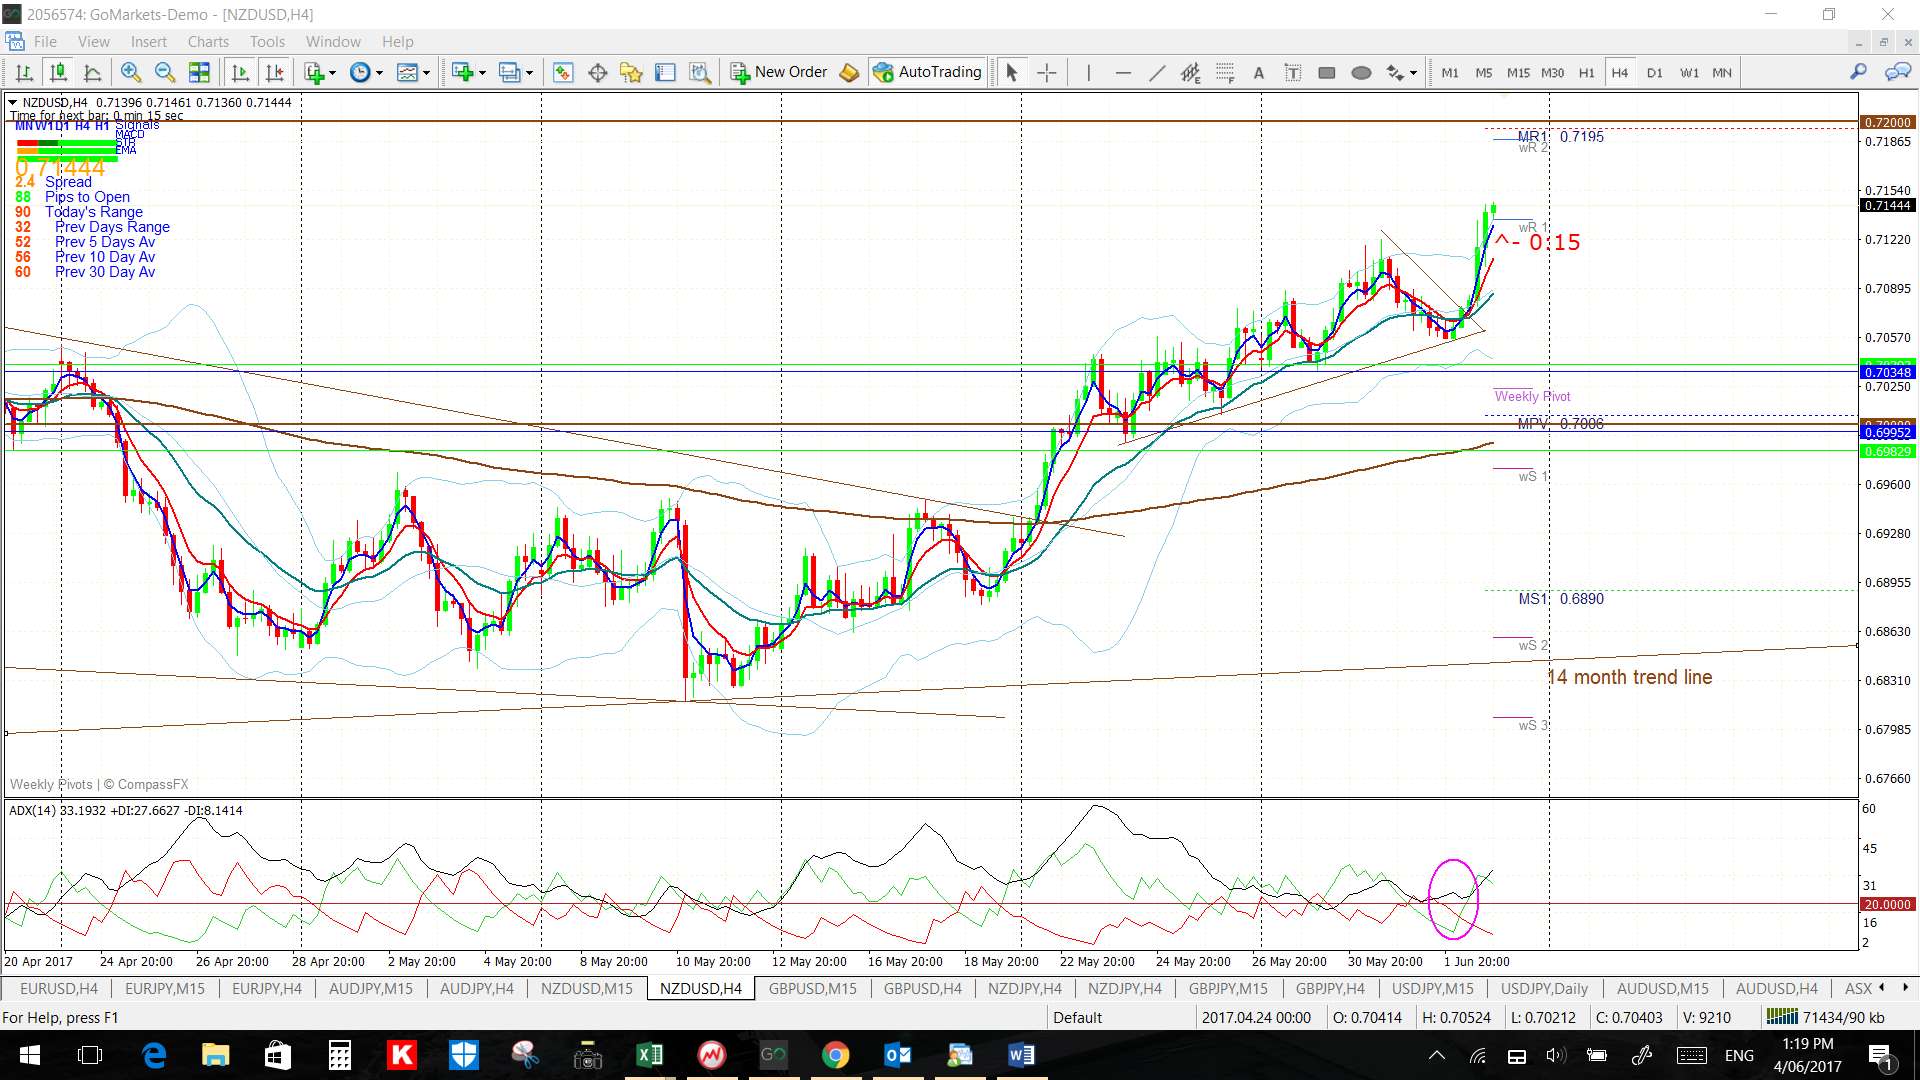
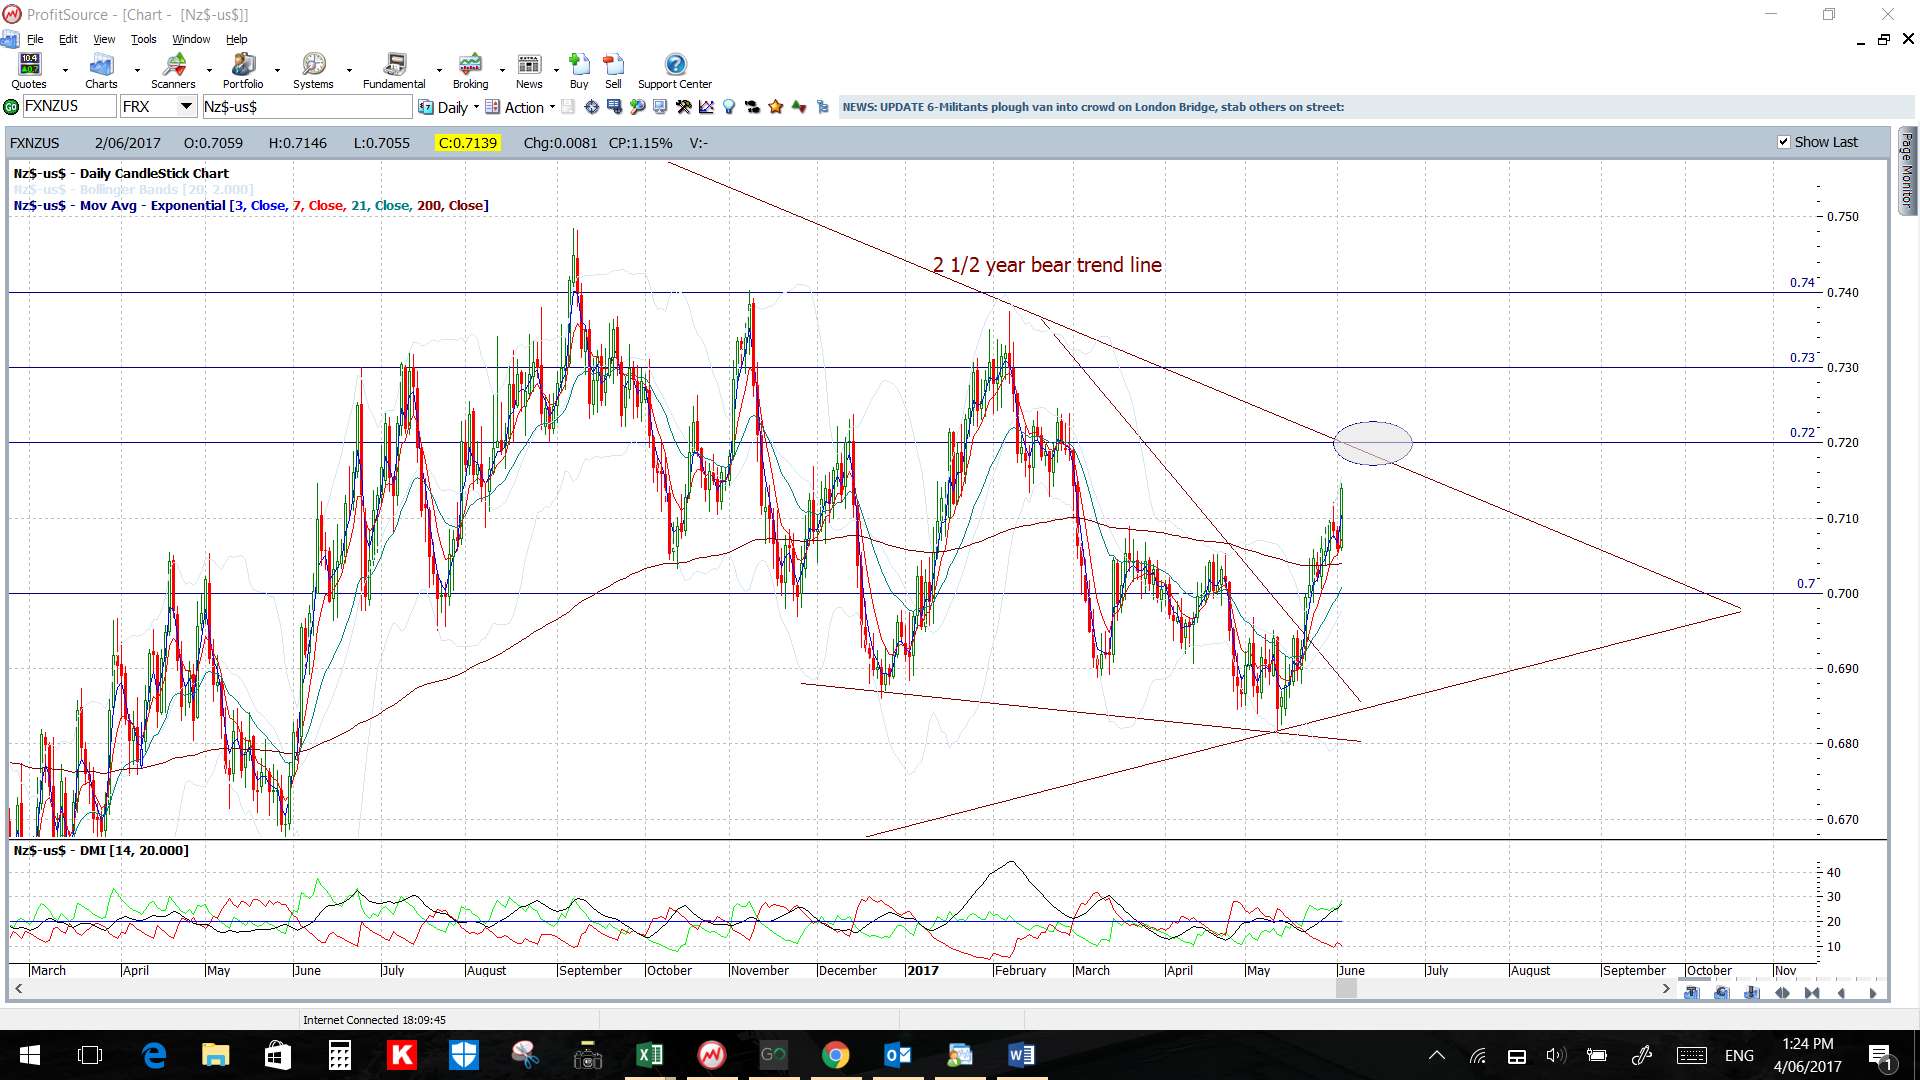
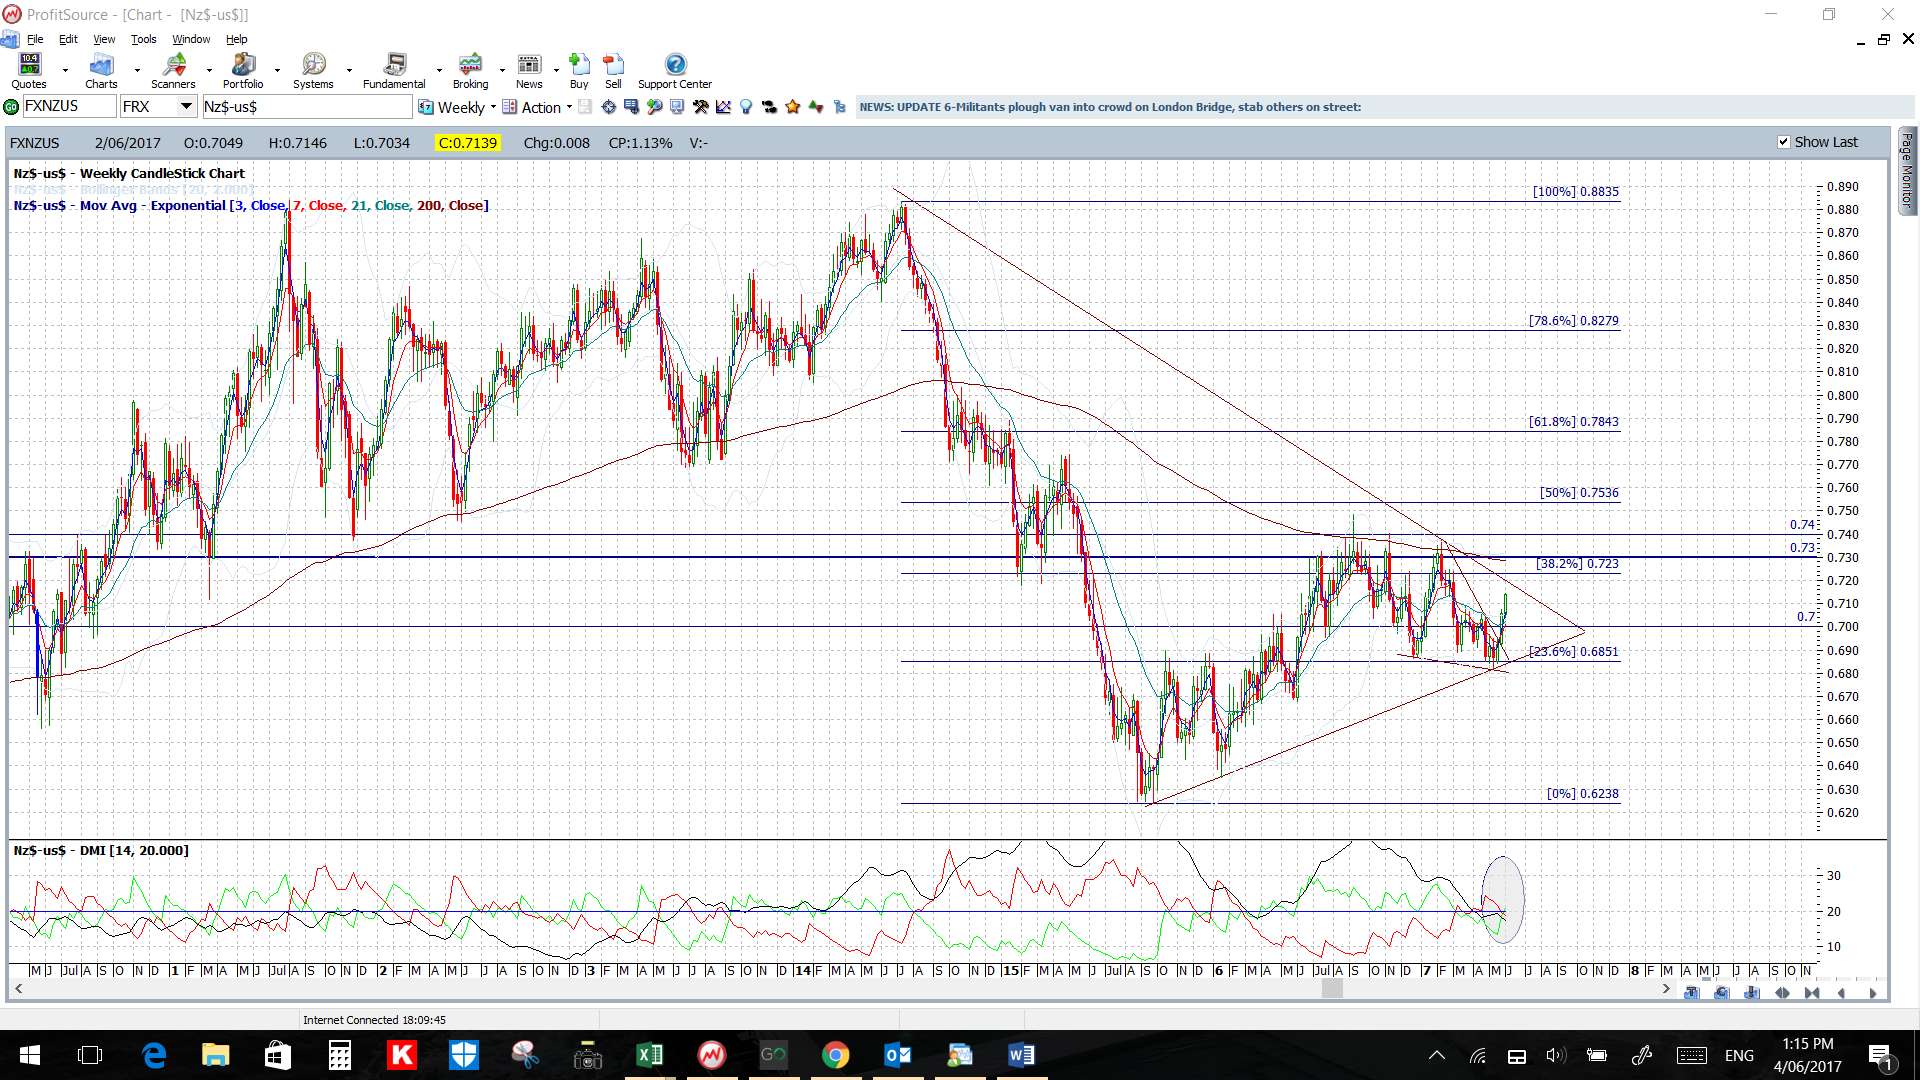
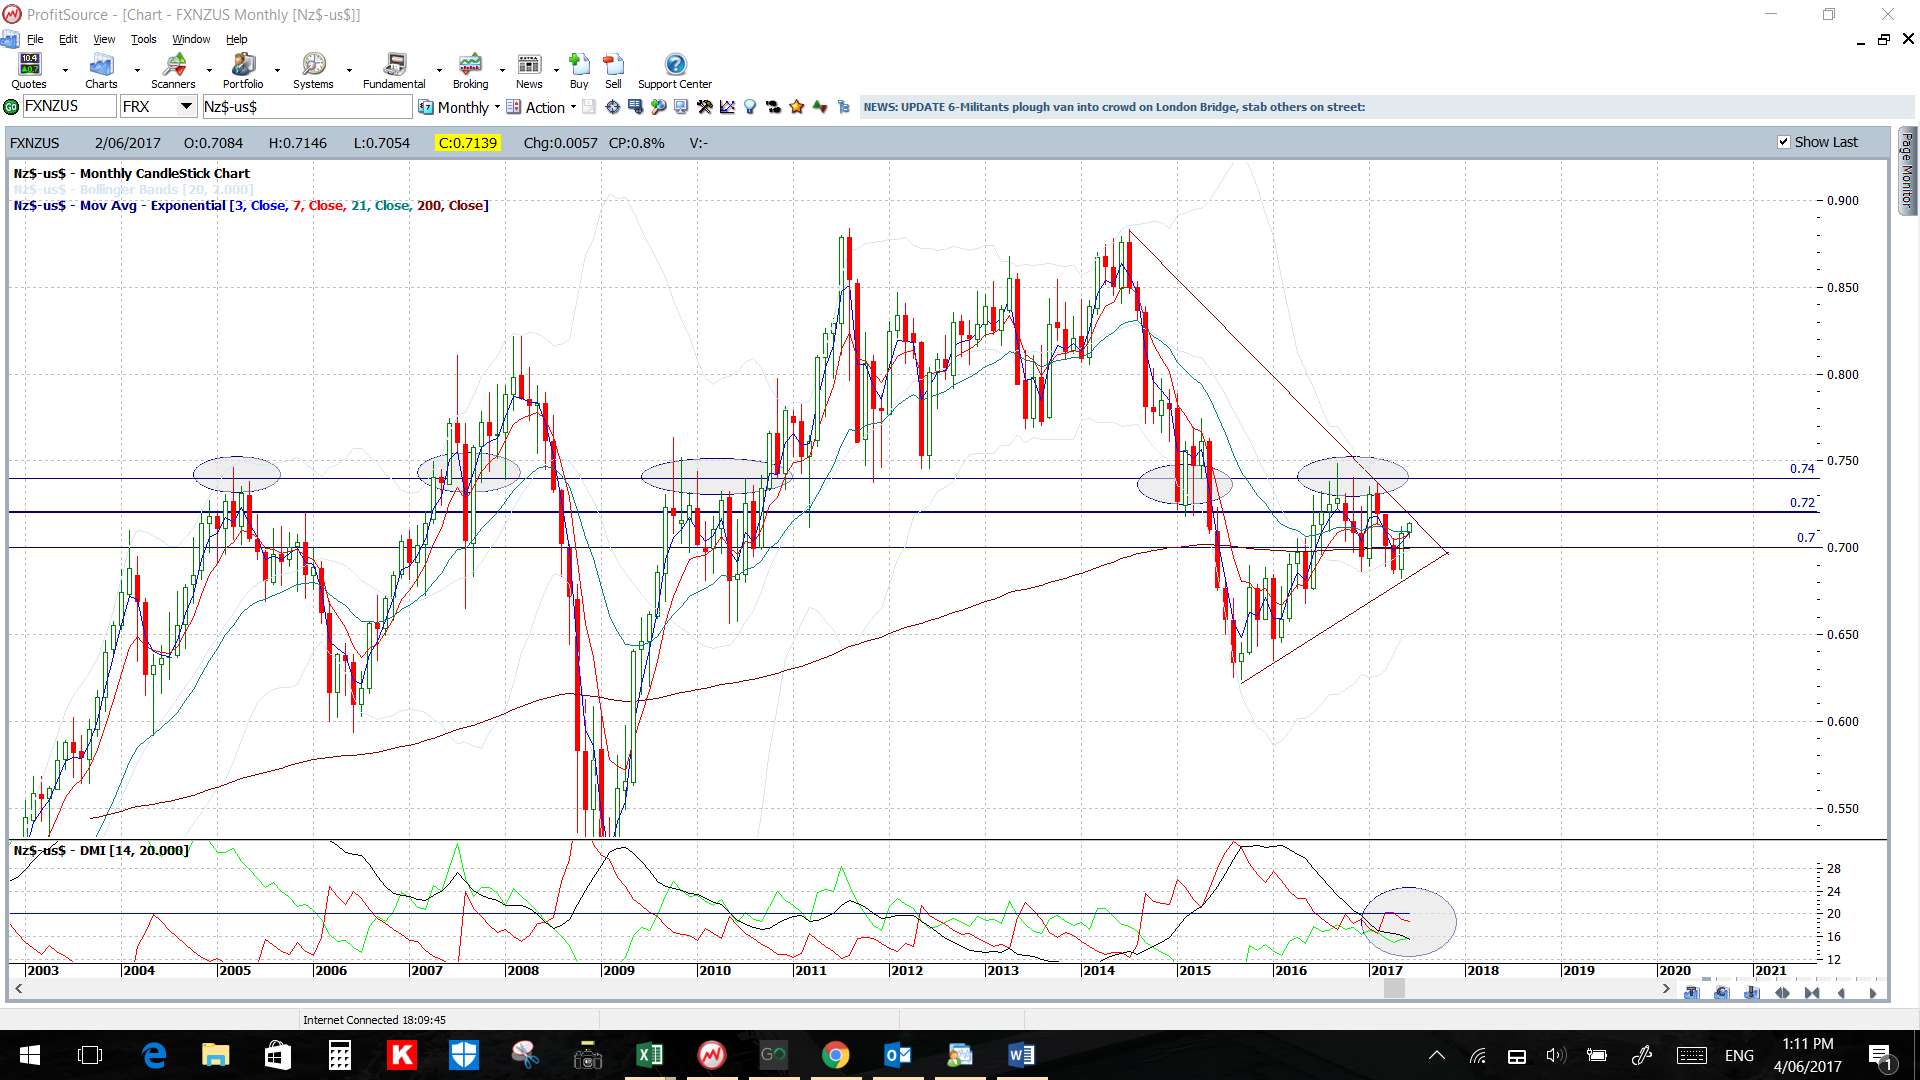
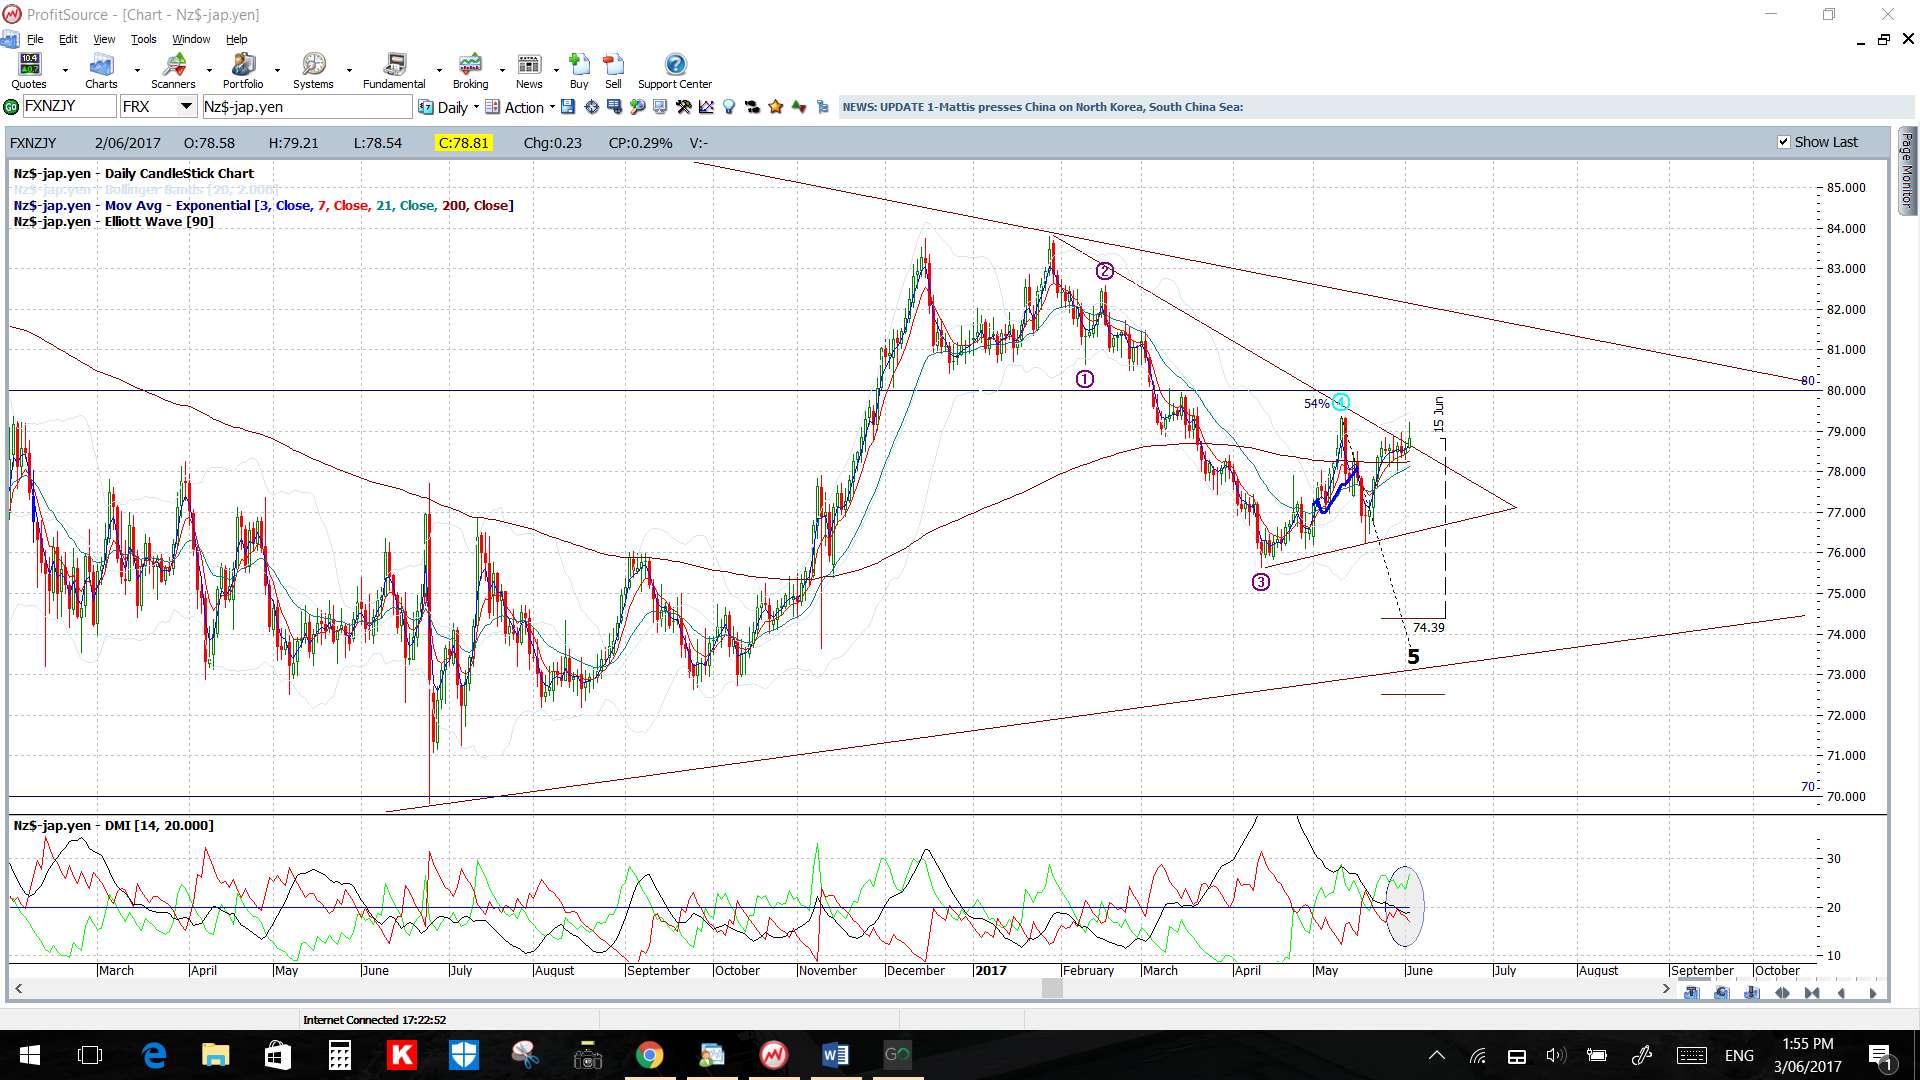
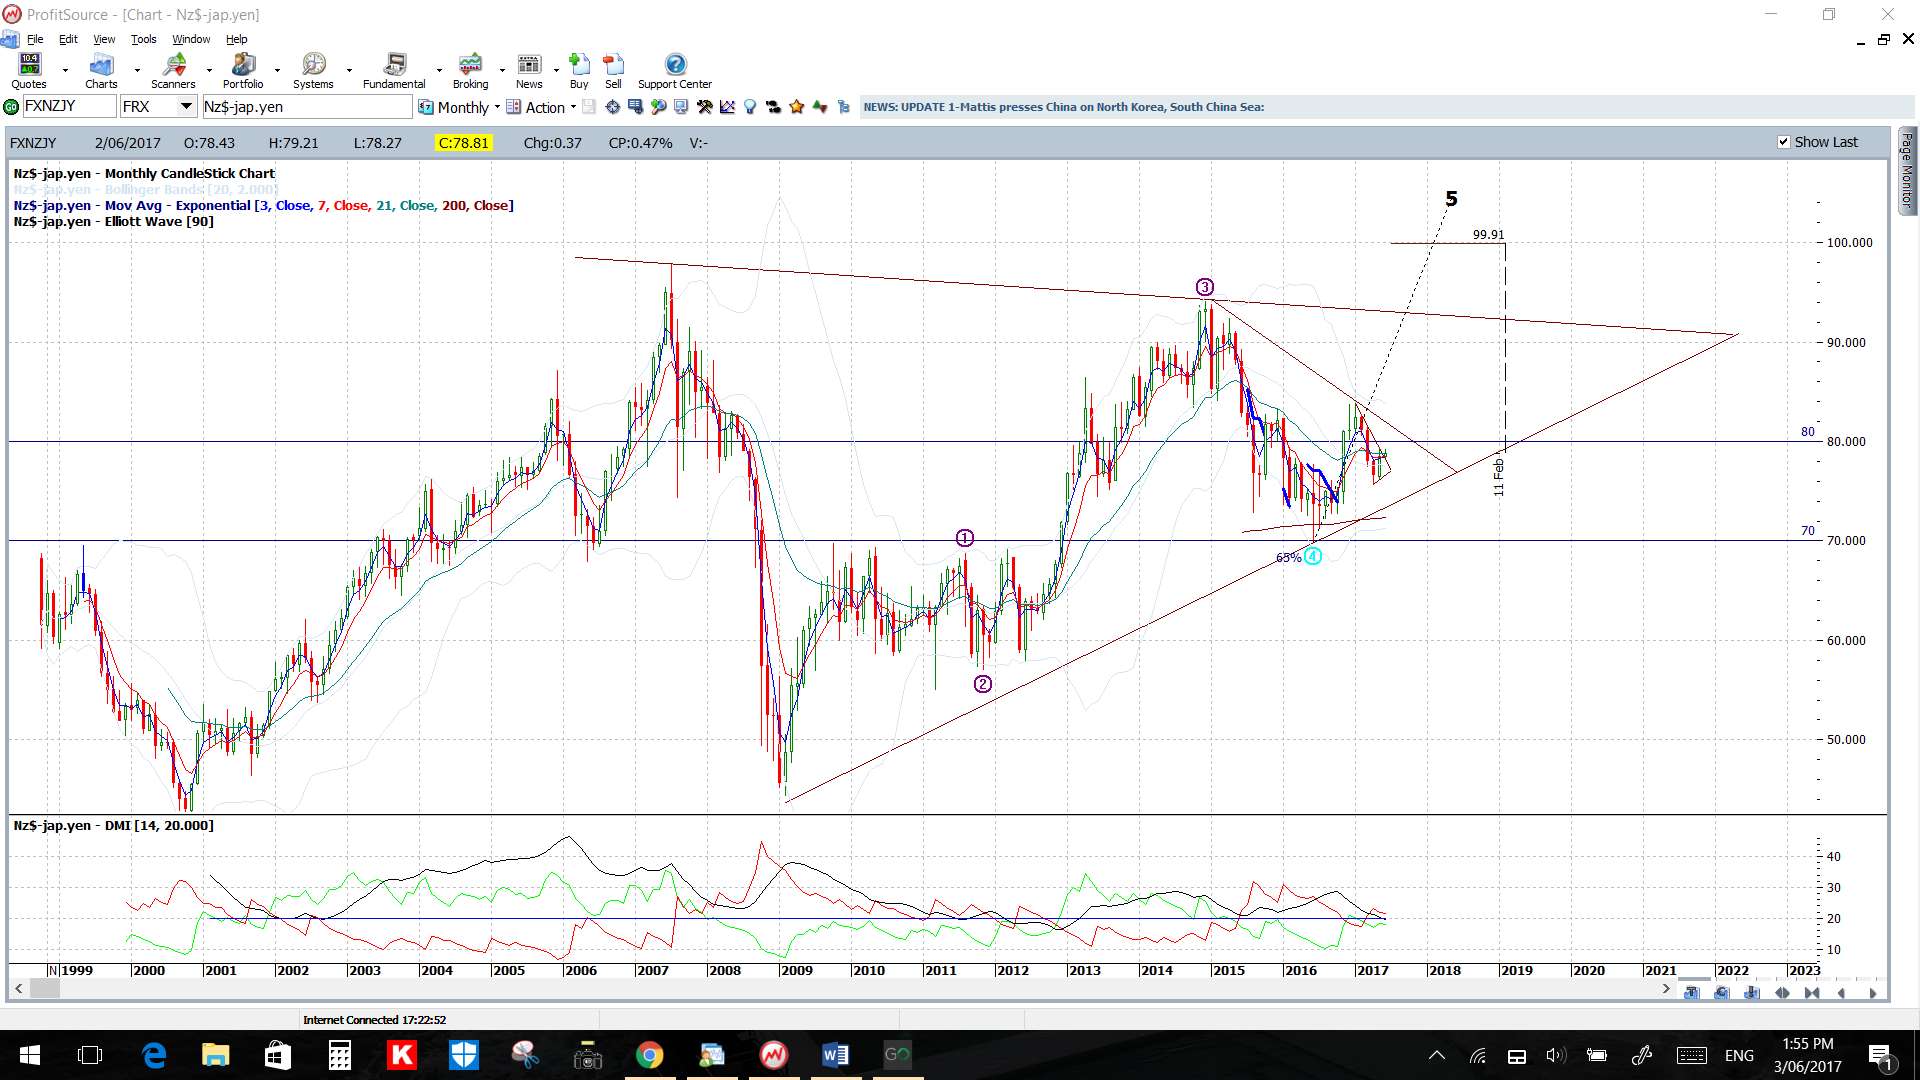
- Kiwi: I’ve revised the monthly chart trend lines on the NZD/USD and the bear trend line of 2 1/2 years intersects near the key 0.72 level; obviously one to watch tin coming sessions:

- USD/MXN: I have adjusted the Bear Flag’s bottom trend line here due to lack of follow-through.
- Stocks: I posted an article earlier today about my efforts to find a replacement for Micron technology that can be found through this link.
Calendar:
- Mon 5th: NZD, EUR (some) and CHF Bank Holiday. GBP Services PMI. USD ISM Non-Manufacturing PMI.
- Tue 6th: AUD RBA Cash rate.
- Wed 7th: AUD GDP. USD Crude Oil Inventories.
- Thurs 8th: CNY & AUD Trade Balance. UK Election. EUR ECB Min Bid Rate update & Press Conference. USD Weekly Unemployment Claims.
- Fri 9th: GBP Manufacturing PMI. CAD Employment data.
Forex:
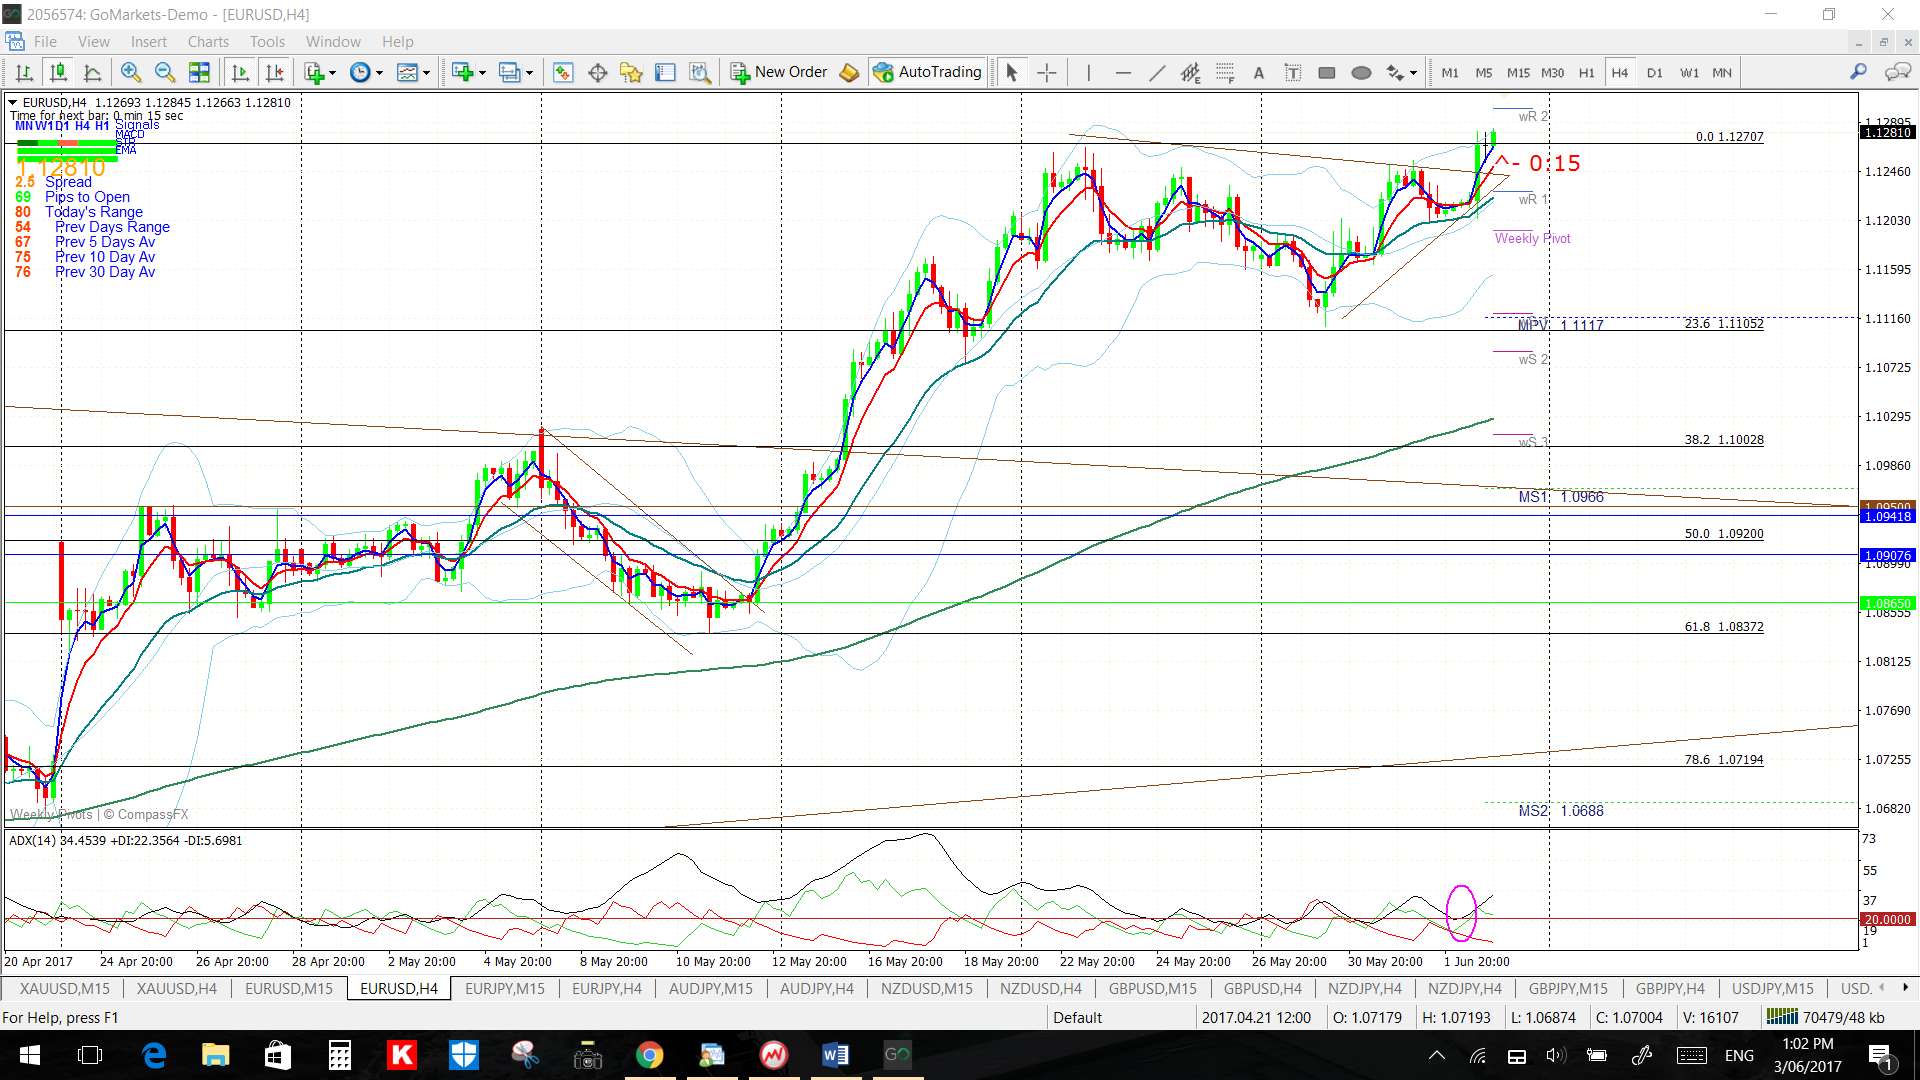
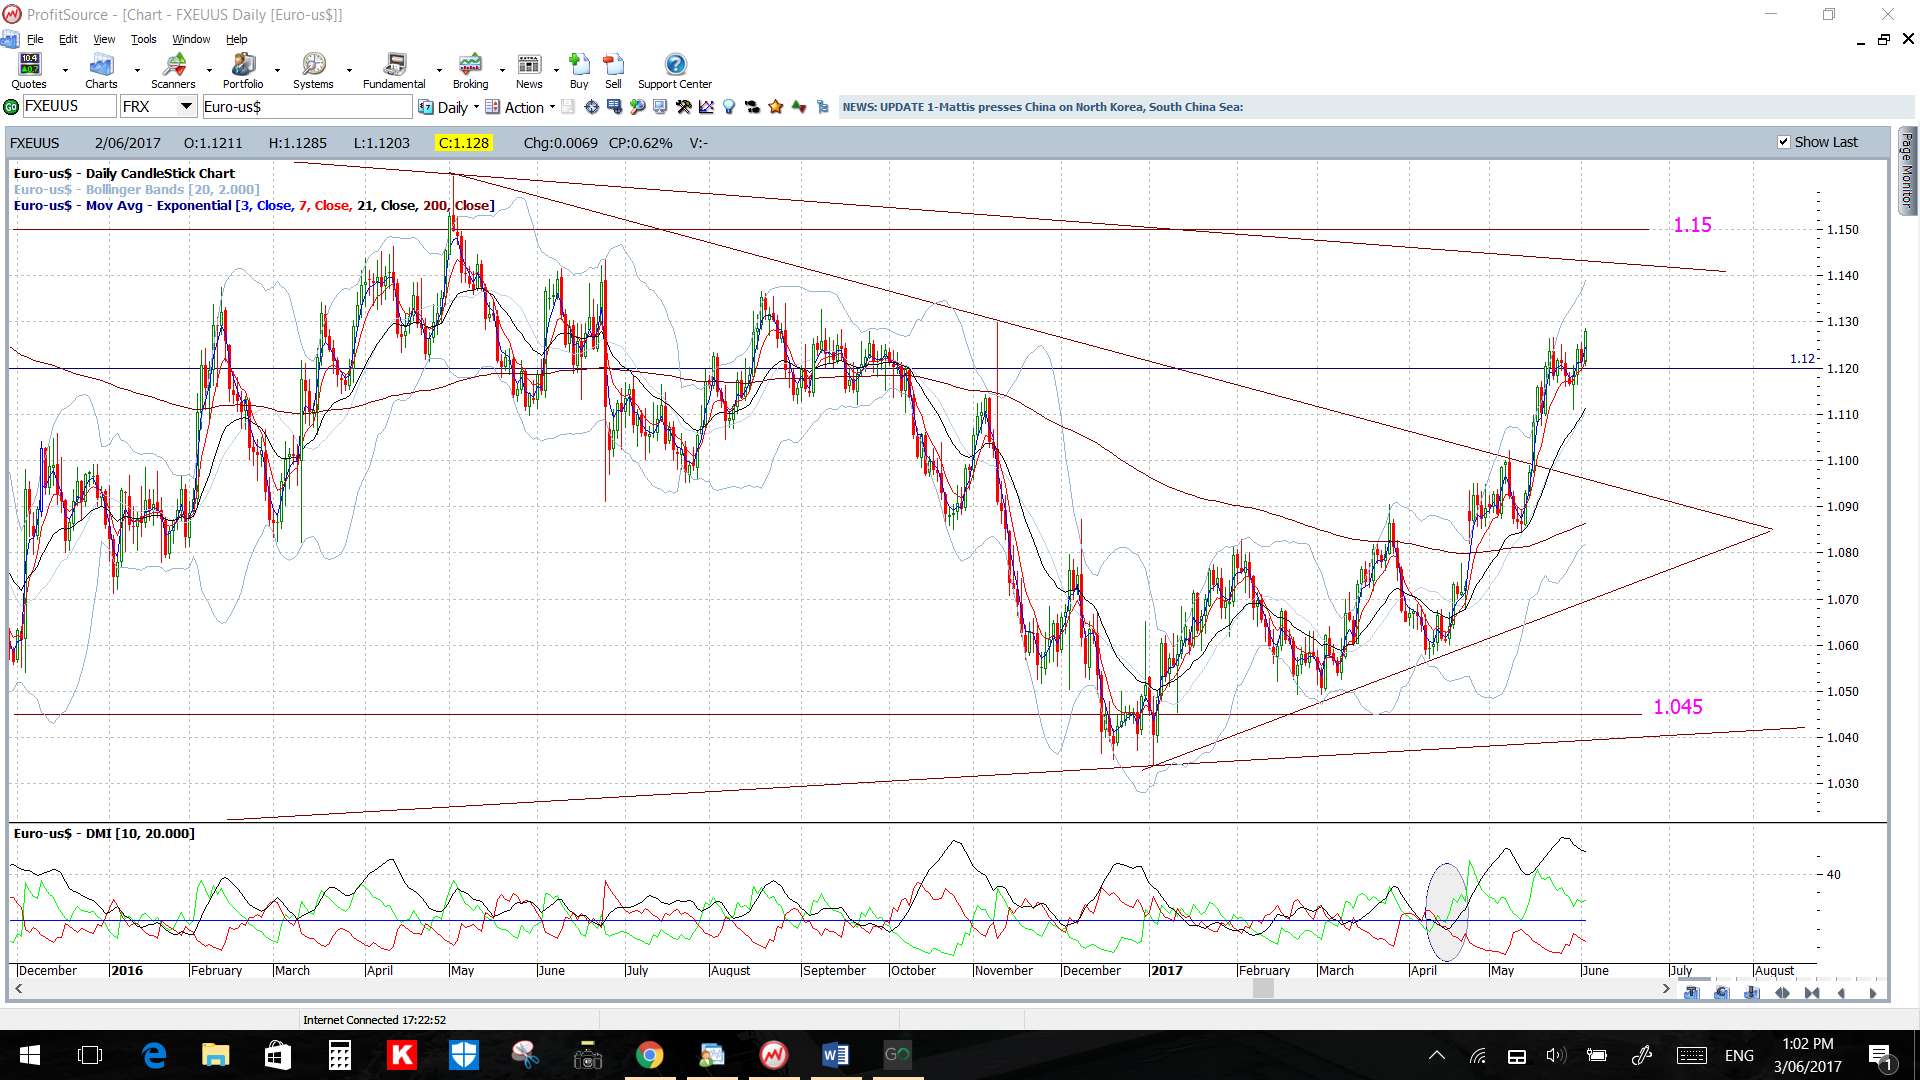
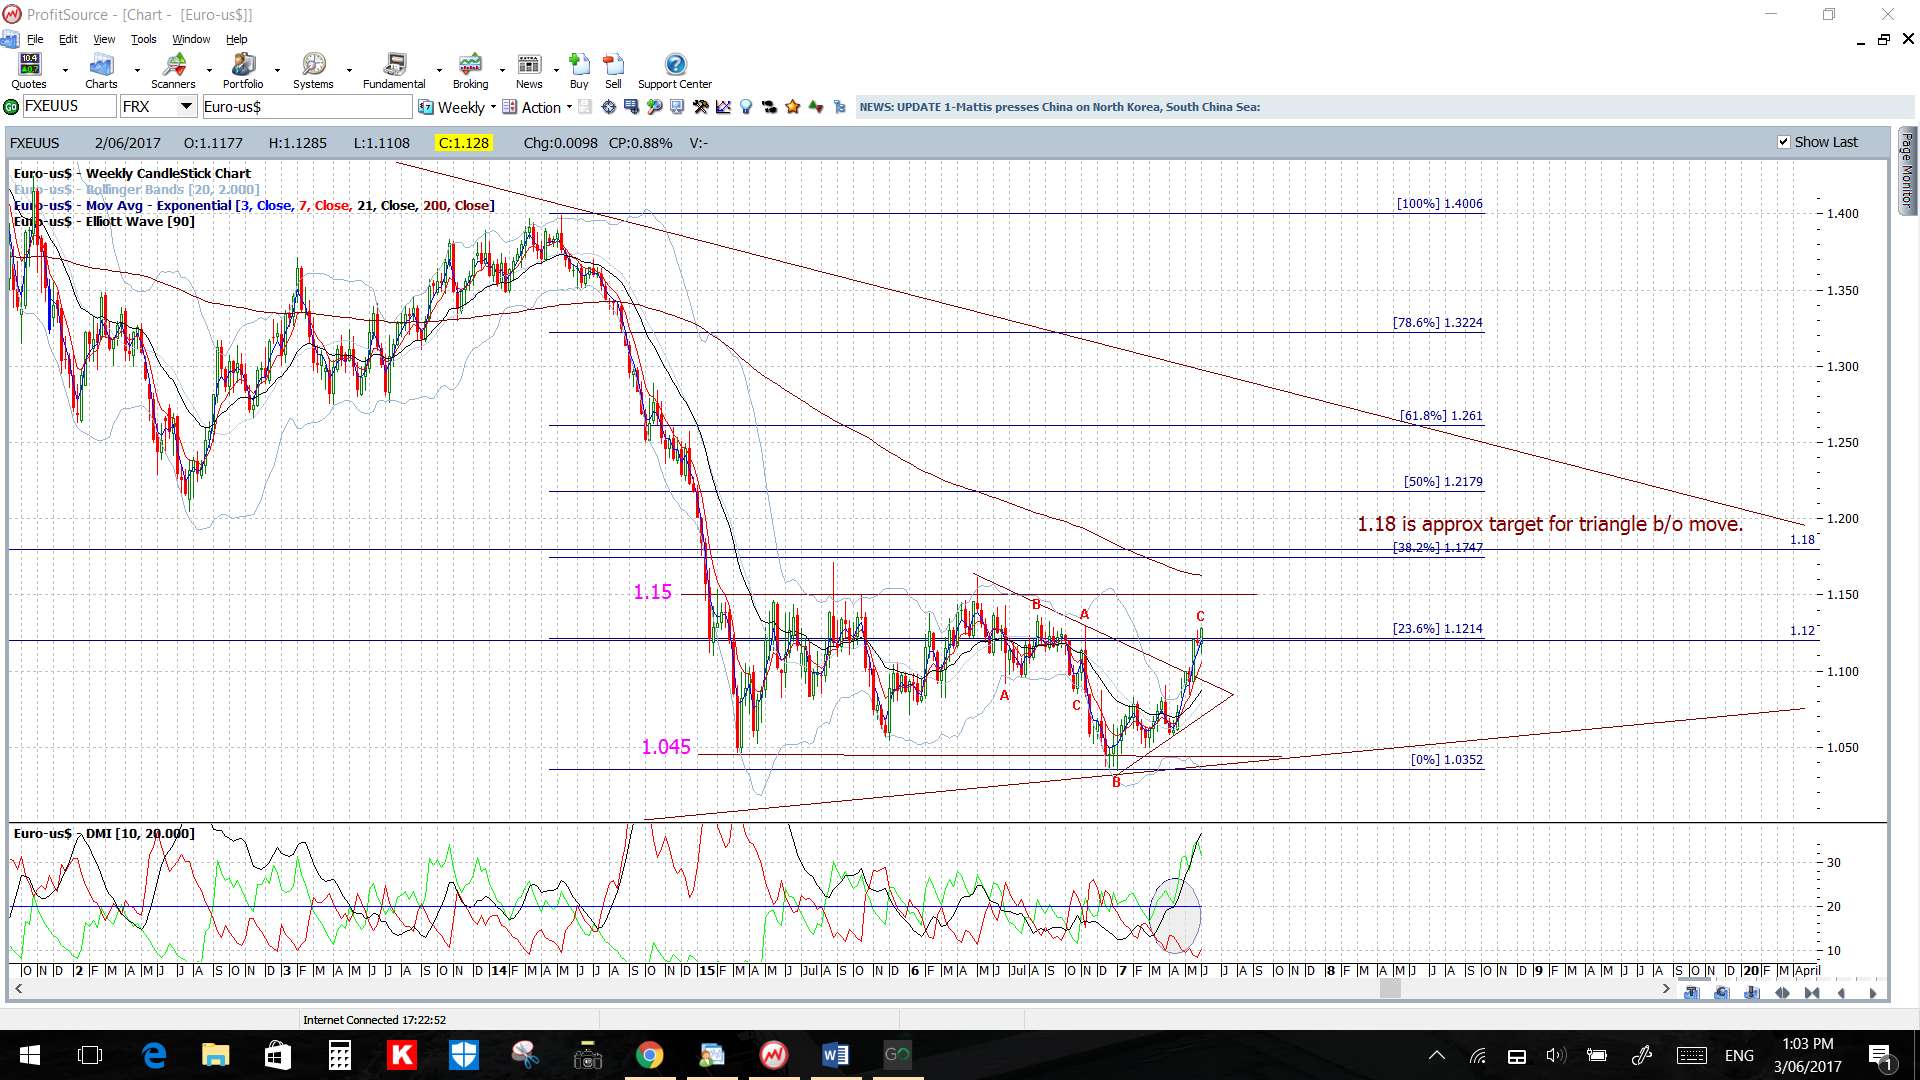
EUR/USD: The triangle breakout from the daily chart is still in progress and, whilst the yield thus far has only been 280 pips, the whole breakout move could be worth up to 800 pips.
The target for the daily triangle breakout move is up near 1.18 and this is near the upper edge of the trading range for this pair since the start of 2015 (shown on the weekly chart below).
Watch for any continuation from 4hr chart’s breakout move:
- Upper targets: 1.15 as previous S/R followed by 1.18 as the daily chart triangle breakout target.
- Lower targets: any pullback would have me looking for a test of the daily chart’s broken trend line. After that, the 4hr chart’s 61.8% Fib.
There is the ECB rate update to monitor this week.
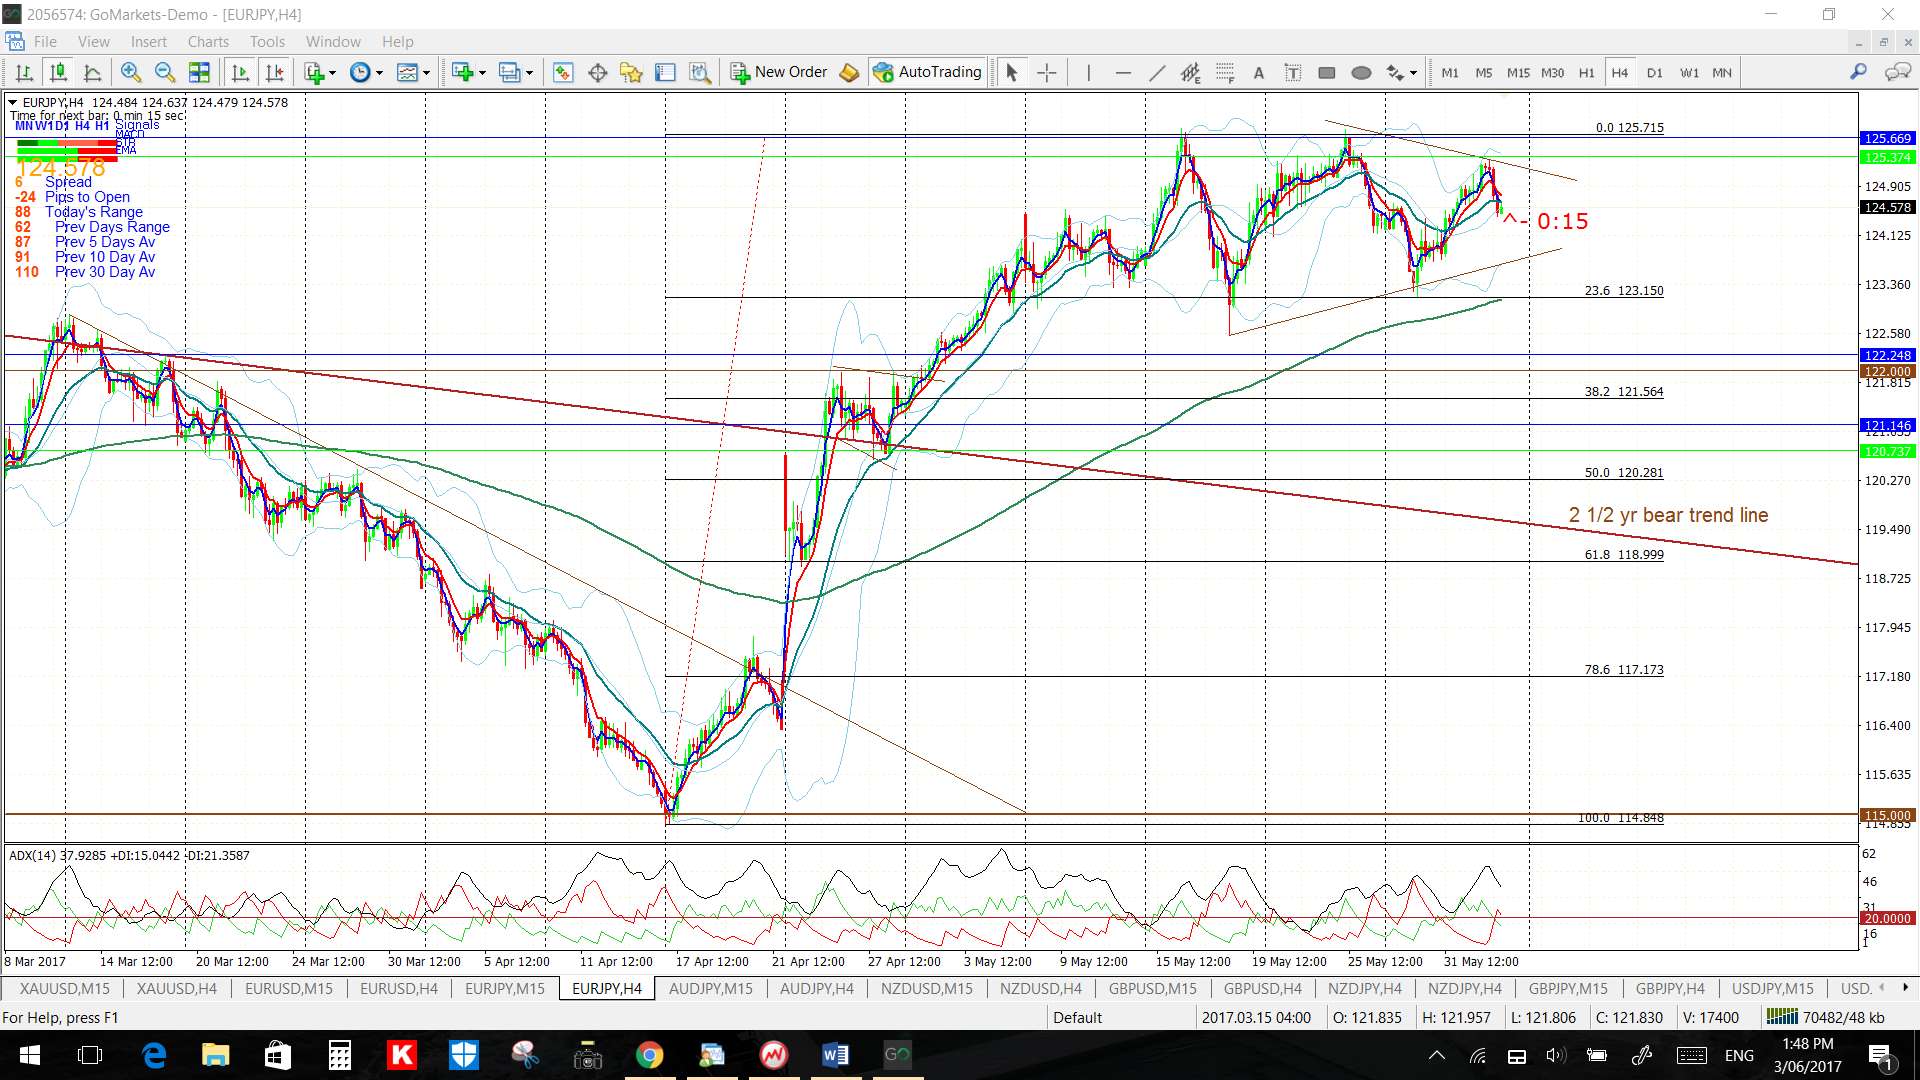
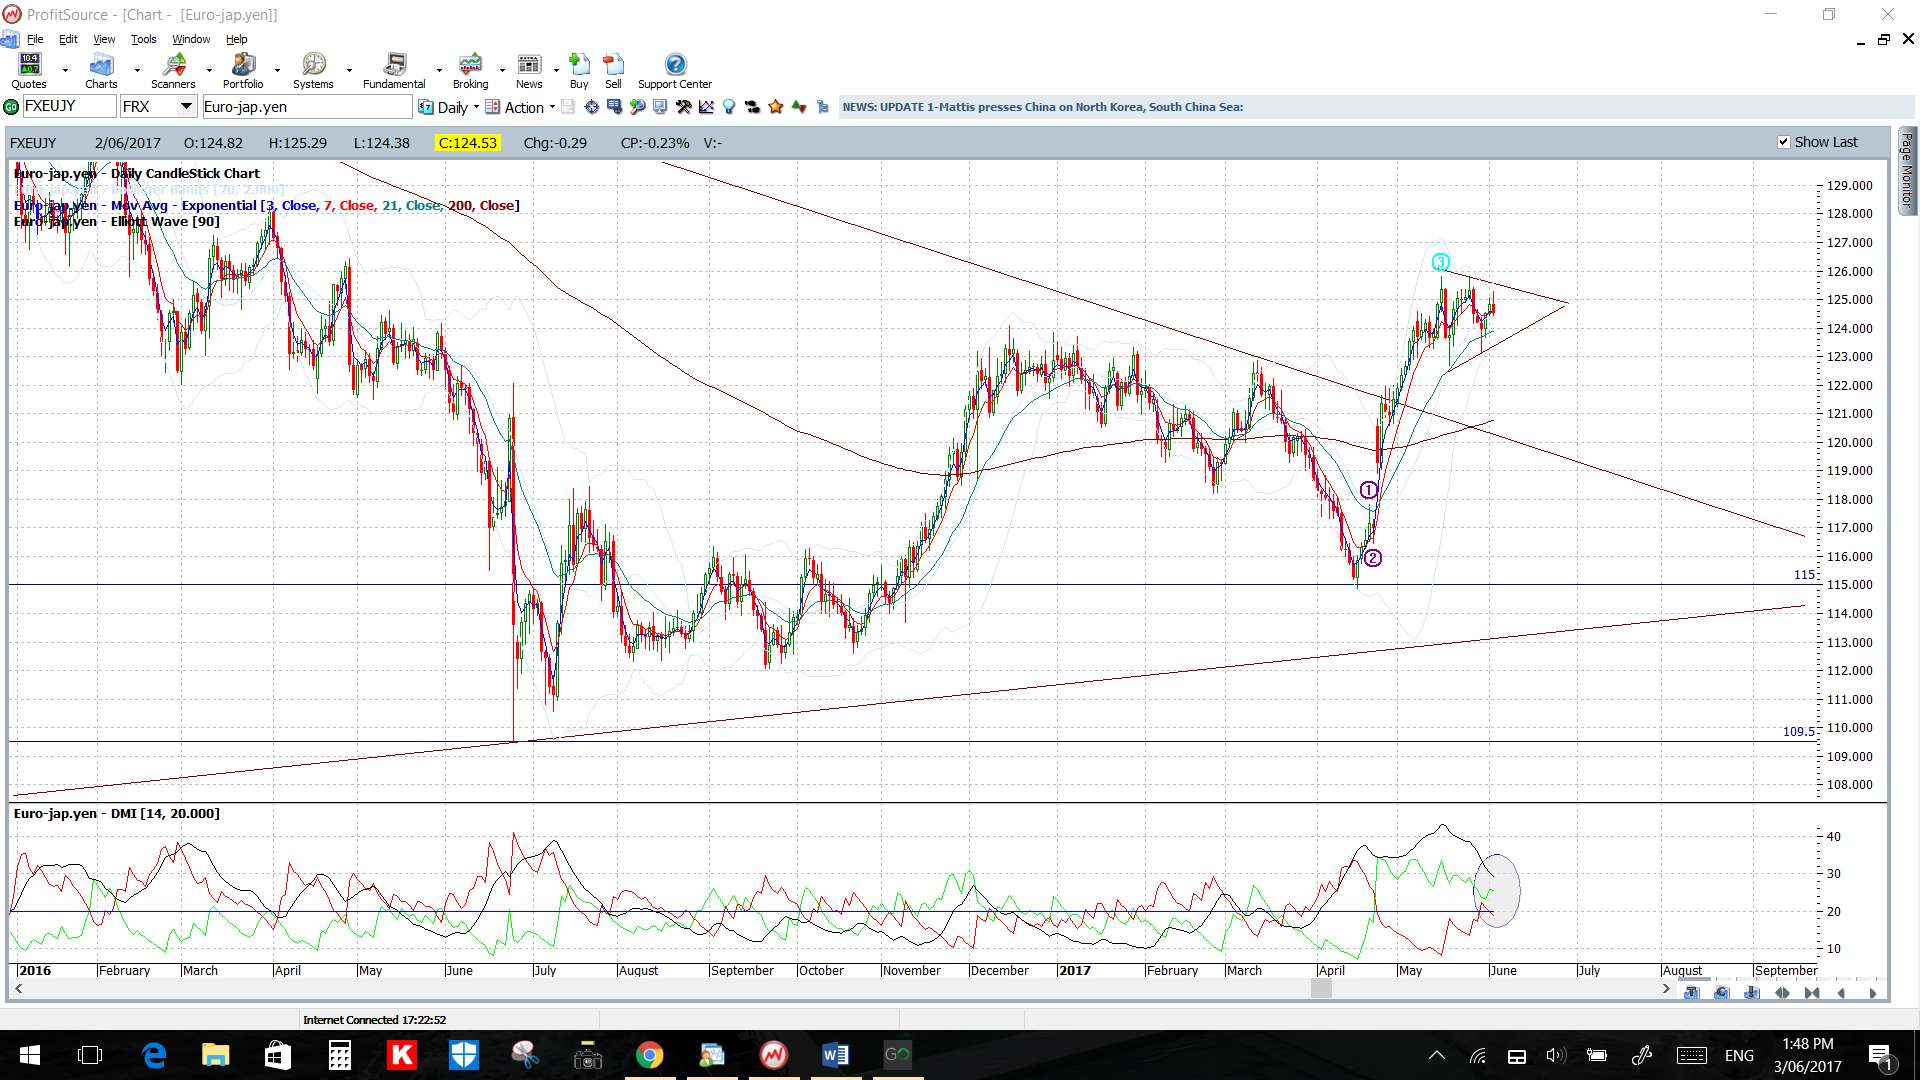
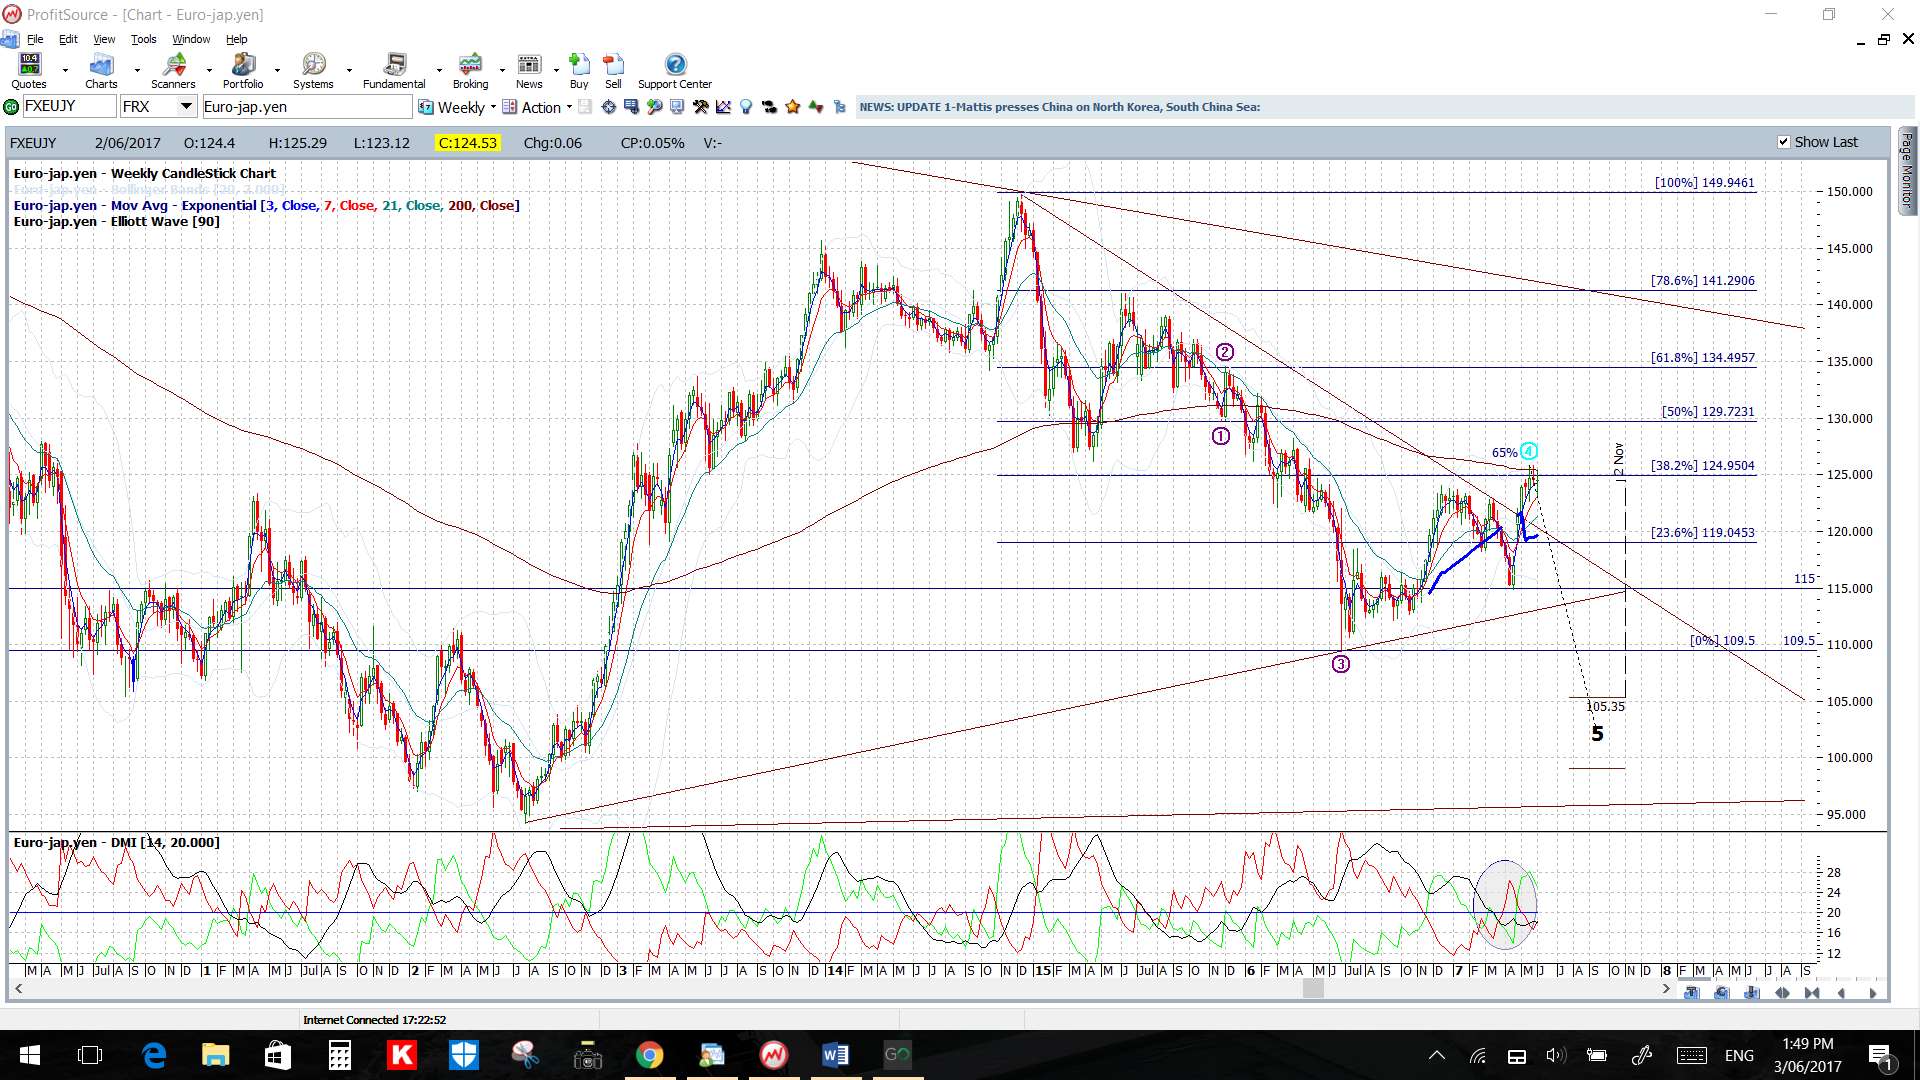
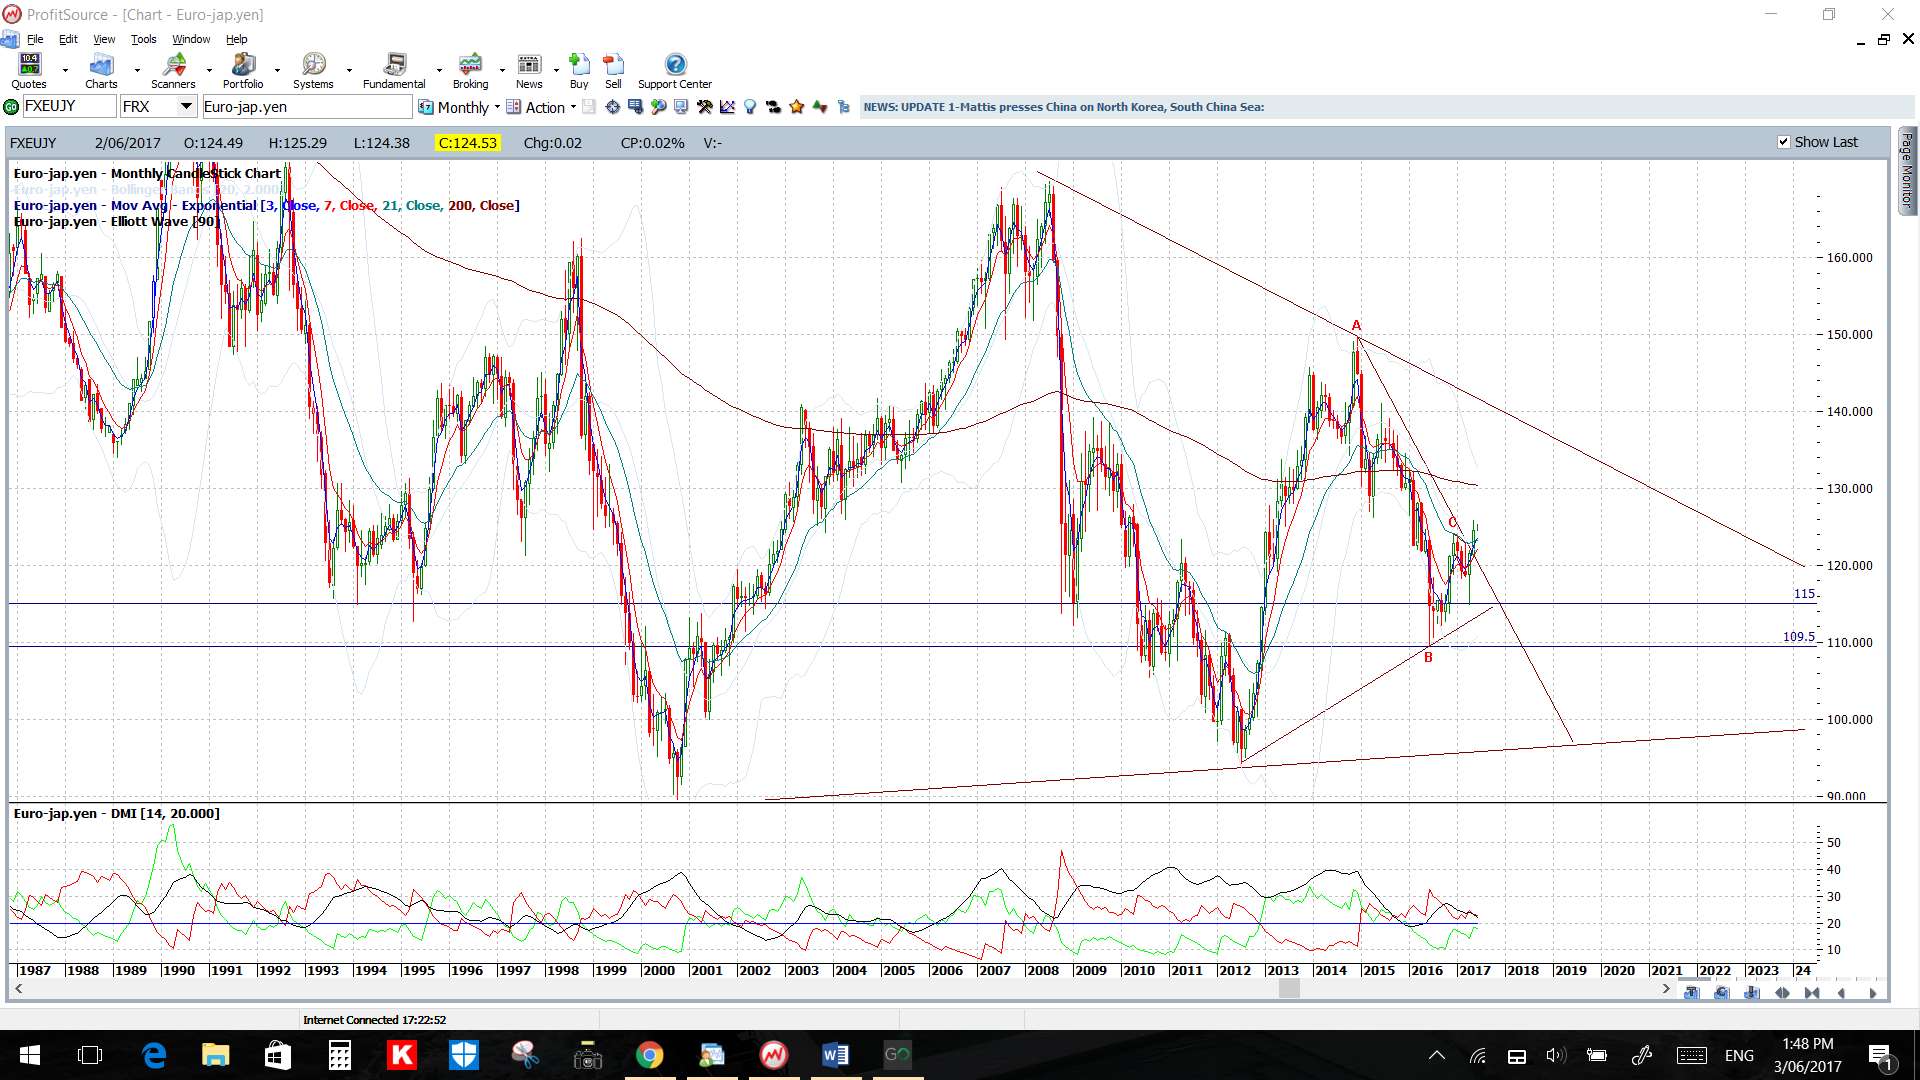
EUR/JPY: This pair remains above a broken 2 ½ bear trend line! Watch the 4hr chart’s revised wedge trend lines for any new breakout:
- Upper targets: the weekly chart’s 61.8% Fib near 135.
- Lower targets: any pullback would have me looking for a test of the daily chart’s broken 2 ½ bear trend line which is near the 4hr chart’s 50% Fib.
There is the ECB rate update to monitor this week.
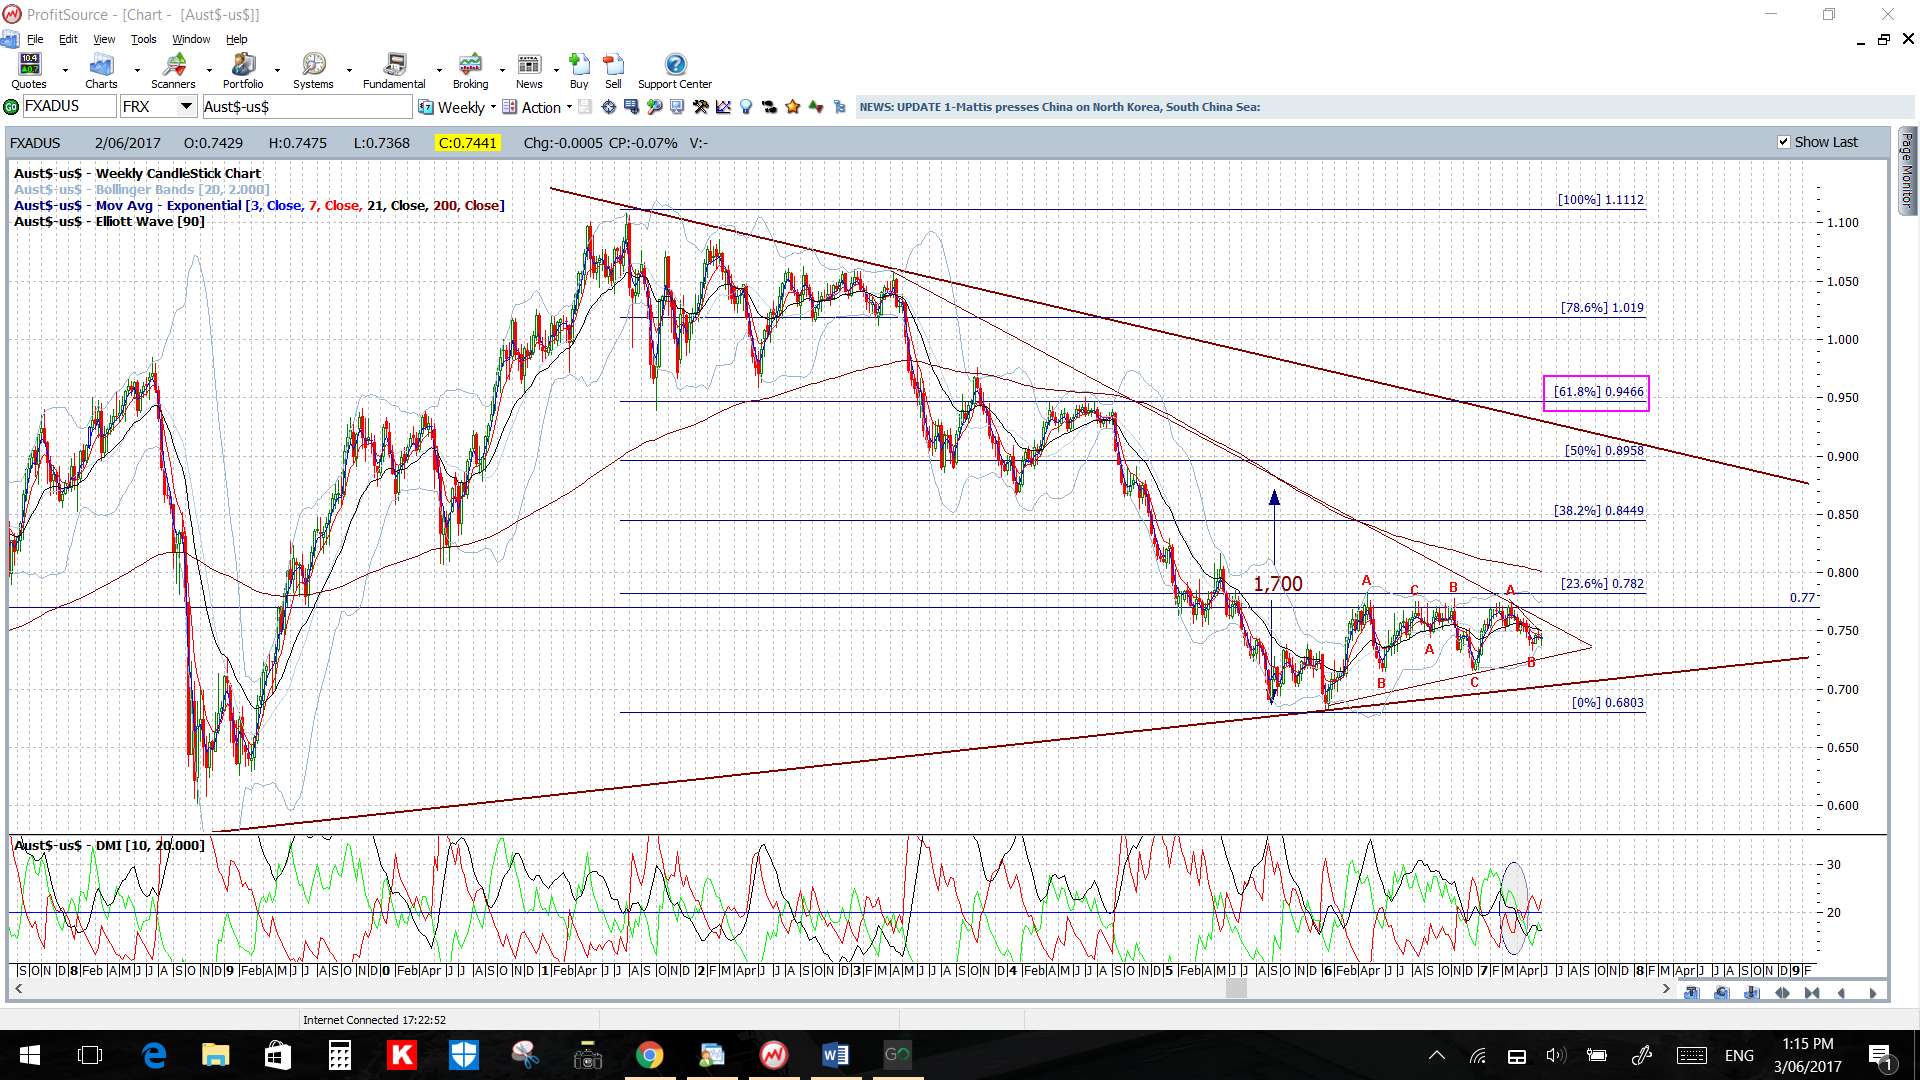
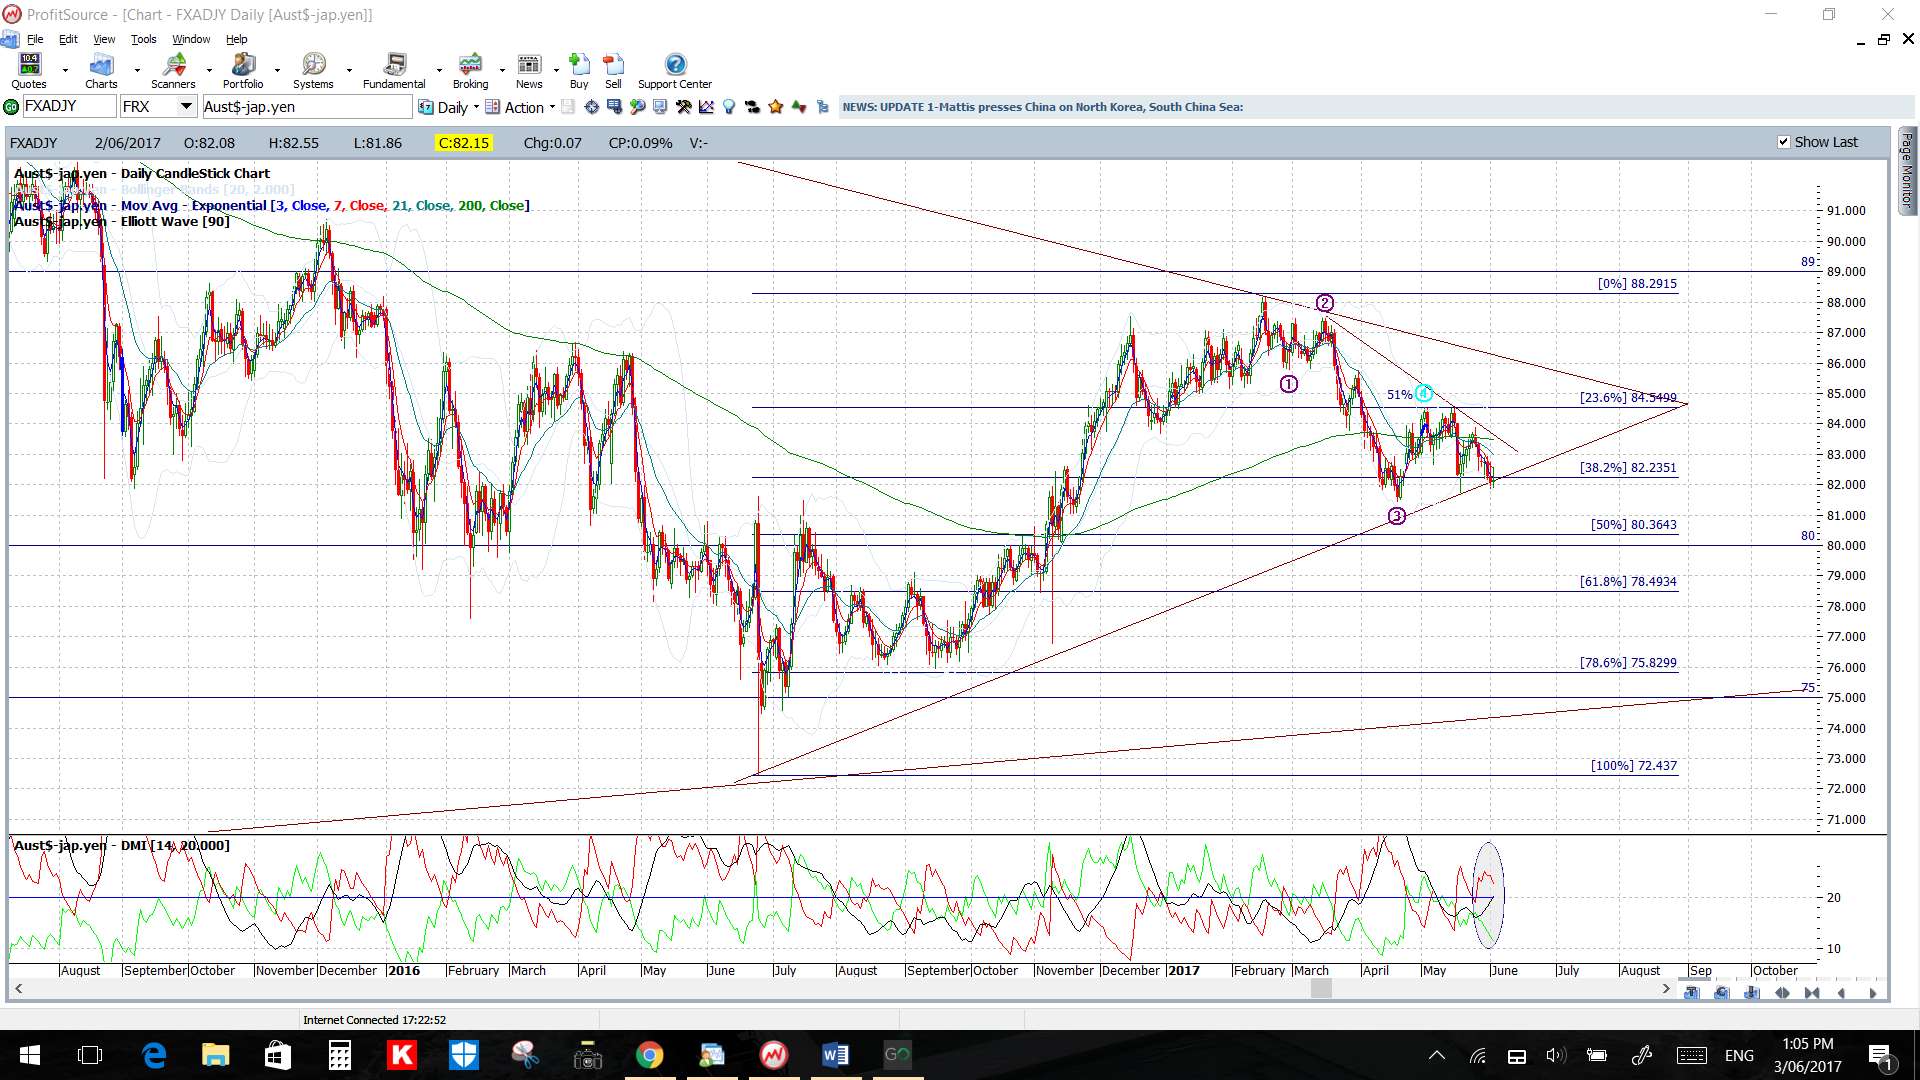
AUD/USD: There is a lot of data to impact the AUD again this week so watch the daily chart’s 17-month support trend line. The Aussie is becoming increasingly squeezed into the apex of a daily, and then 1,700 pip weekly, chart triangle so watch these trend lines for any new breakout:
- Upper targets: The 4hr chart bear trend line, then 0.76 as prev S/R and which is also near the daily chart’s triangle bear trend line.
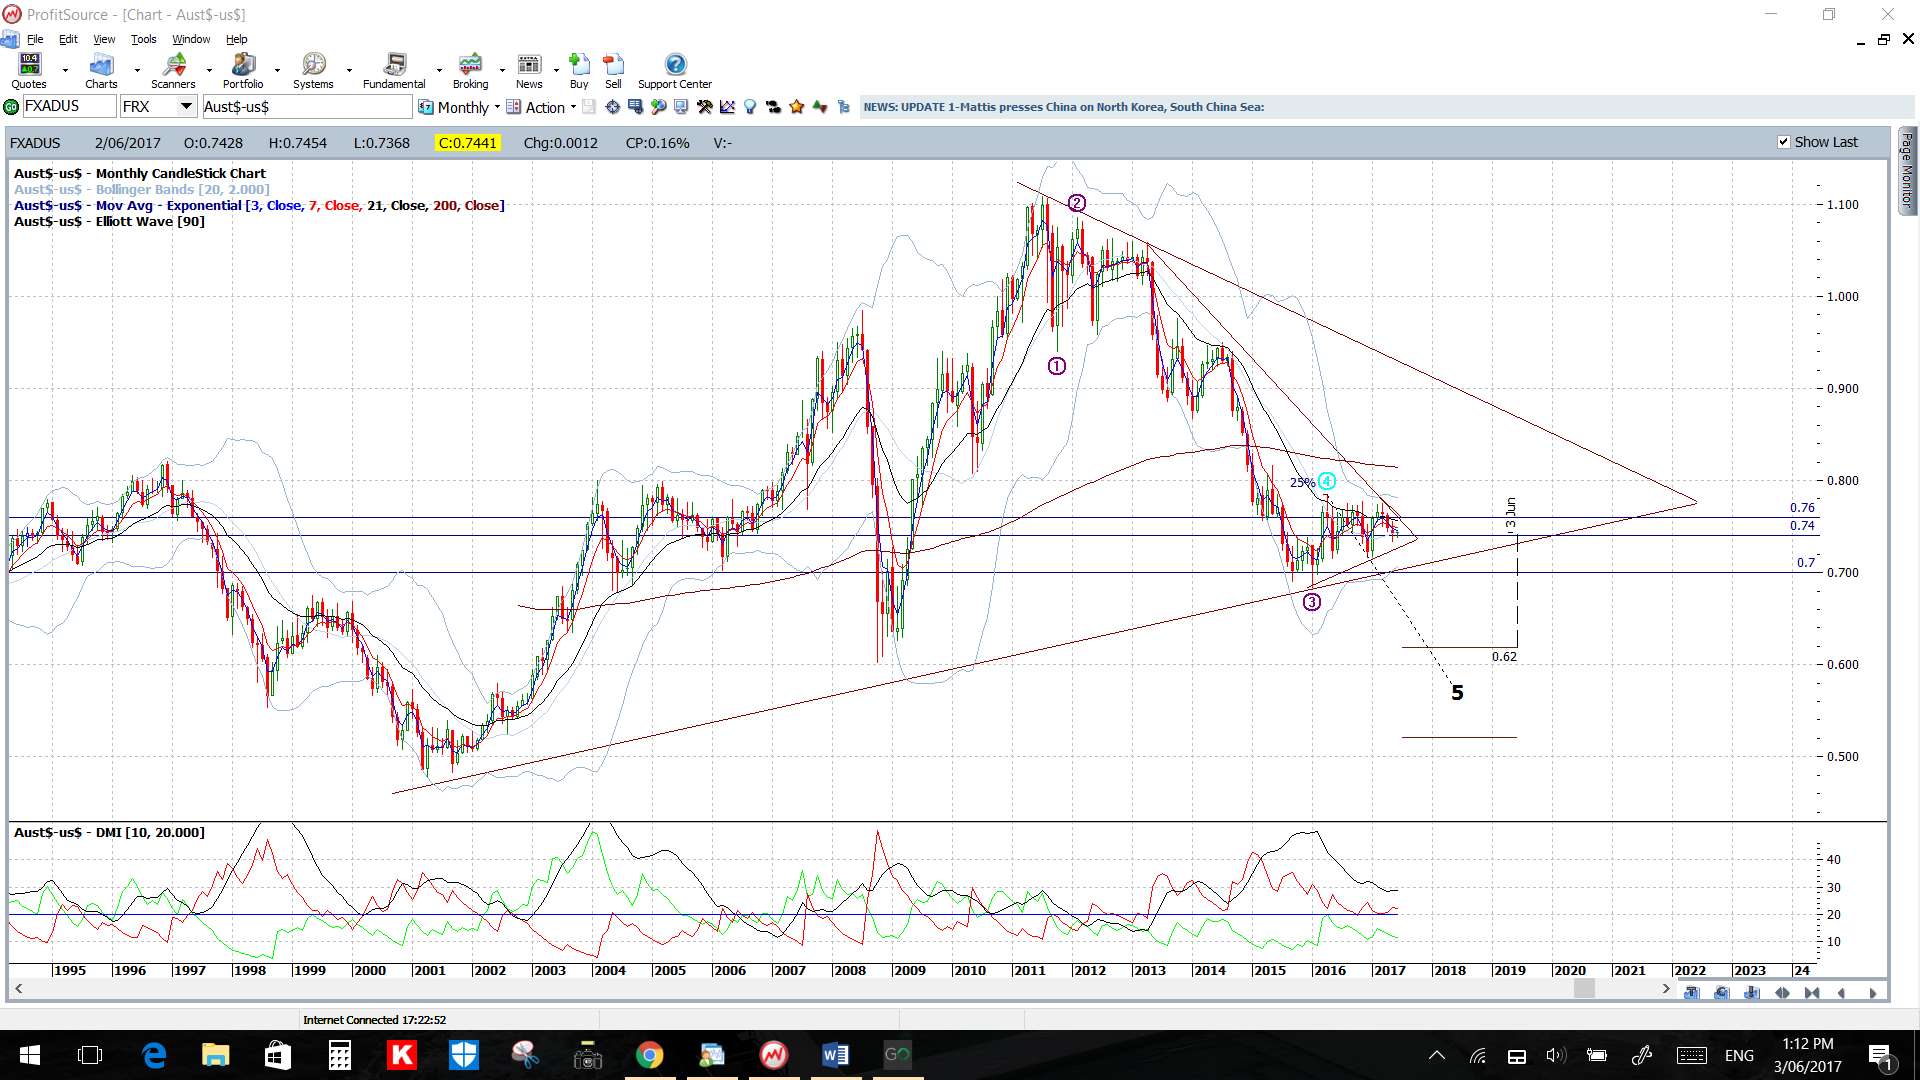
- Lower targets: any pullback would have me looking for a test of the daily chart’s 17-month support trend line and, after that, the monthly chart’s 61.8% fib which is near 0.72.
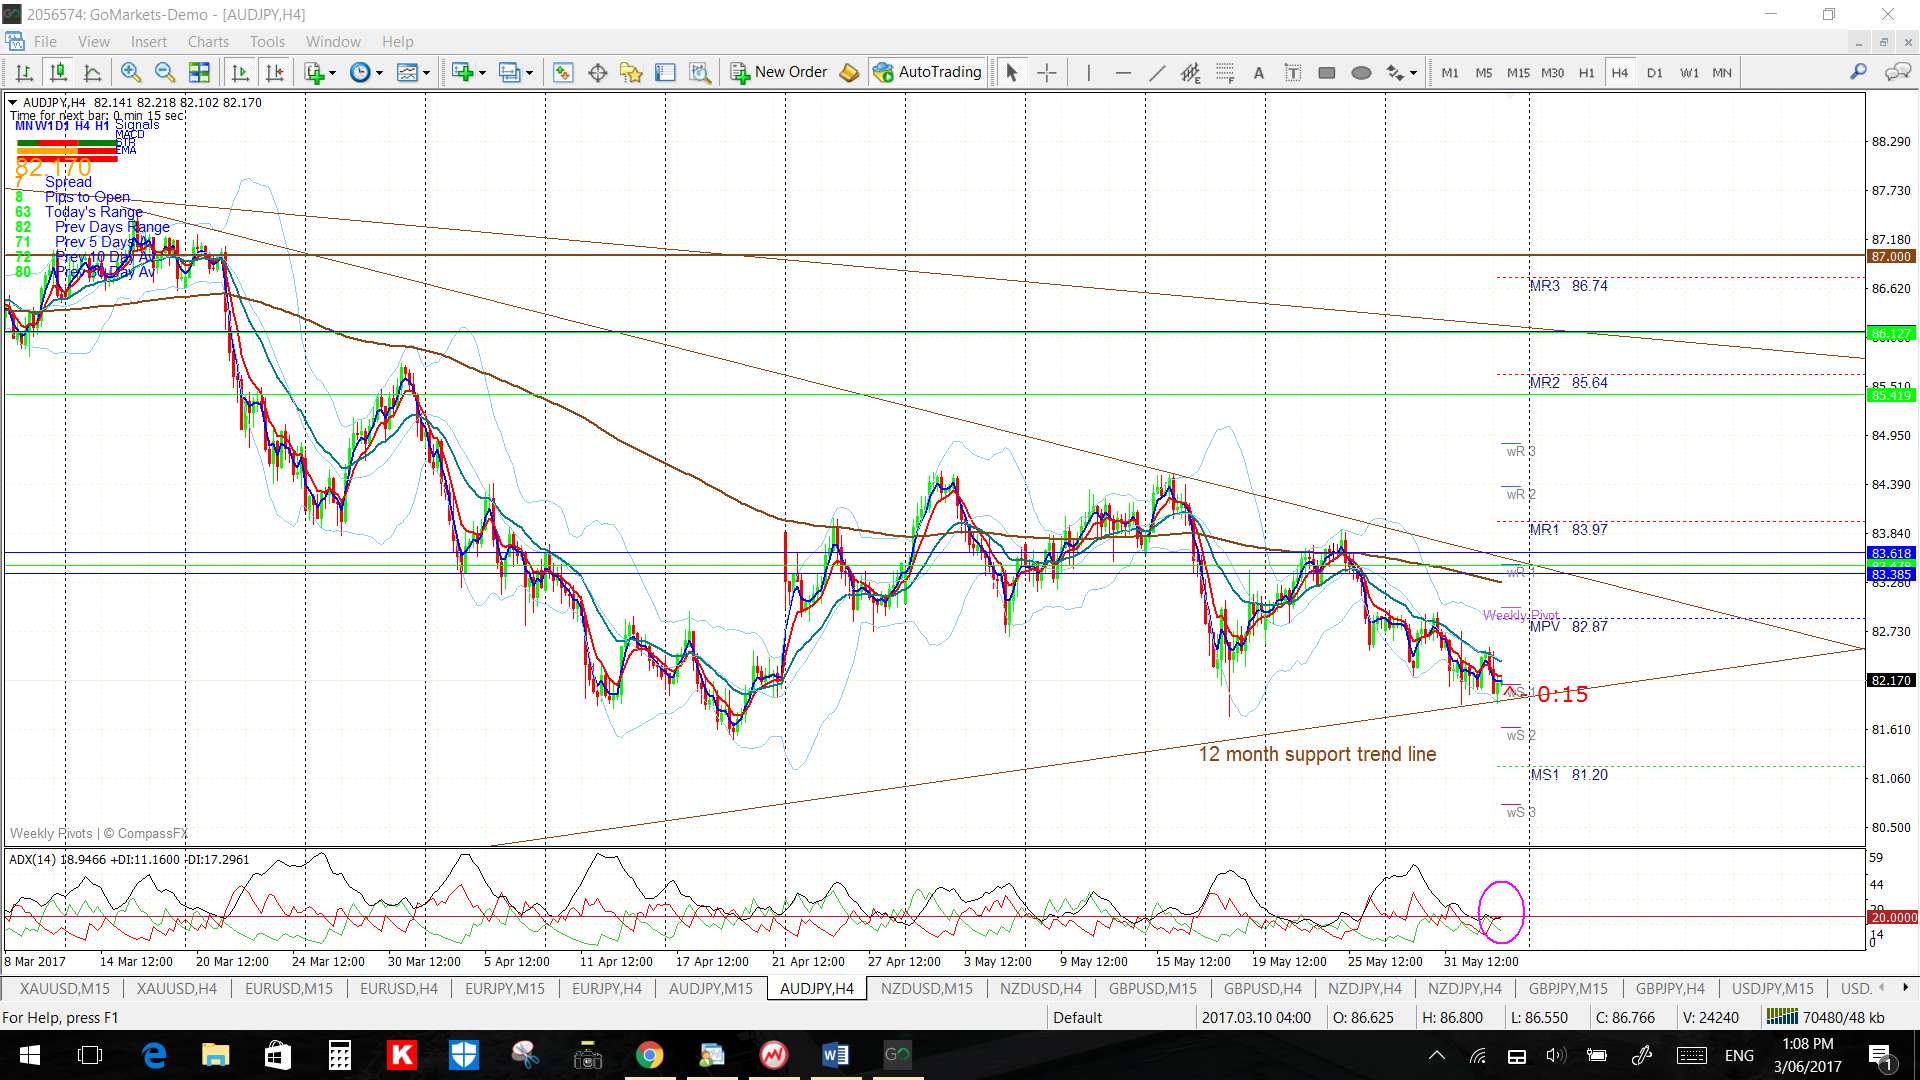
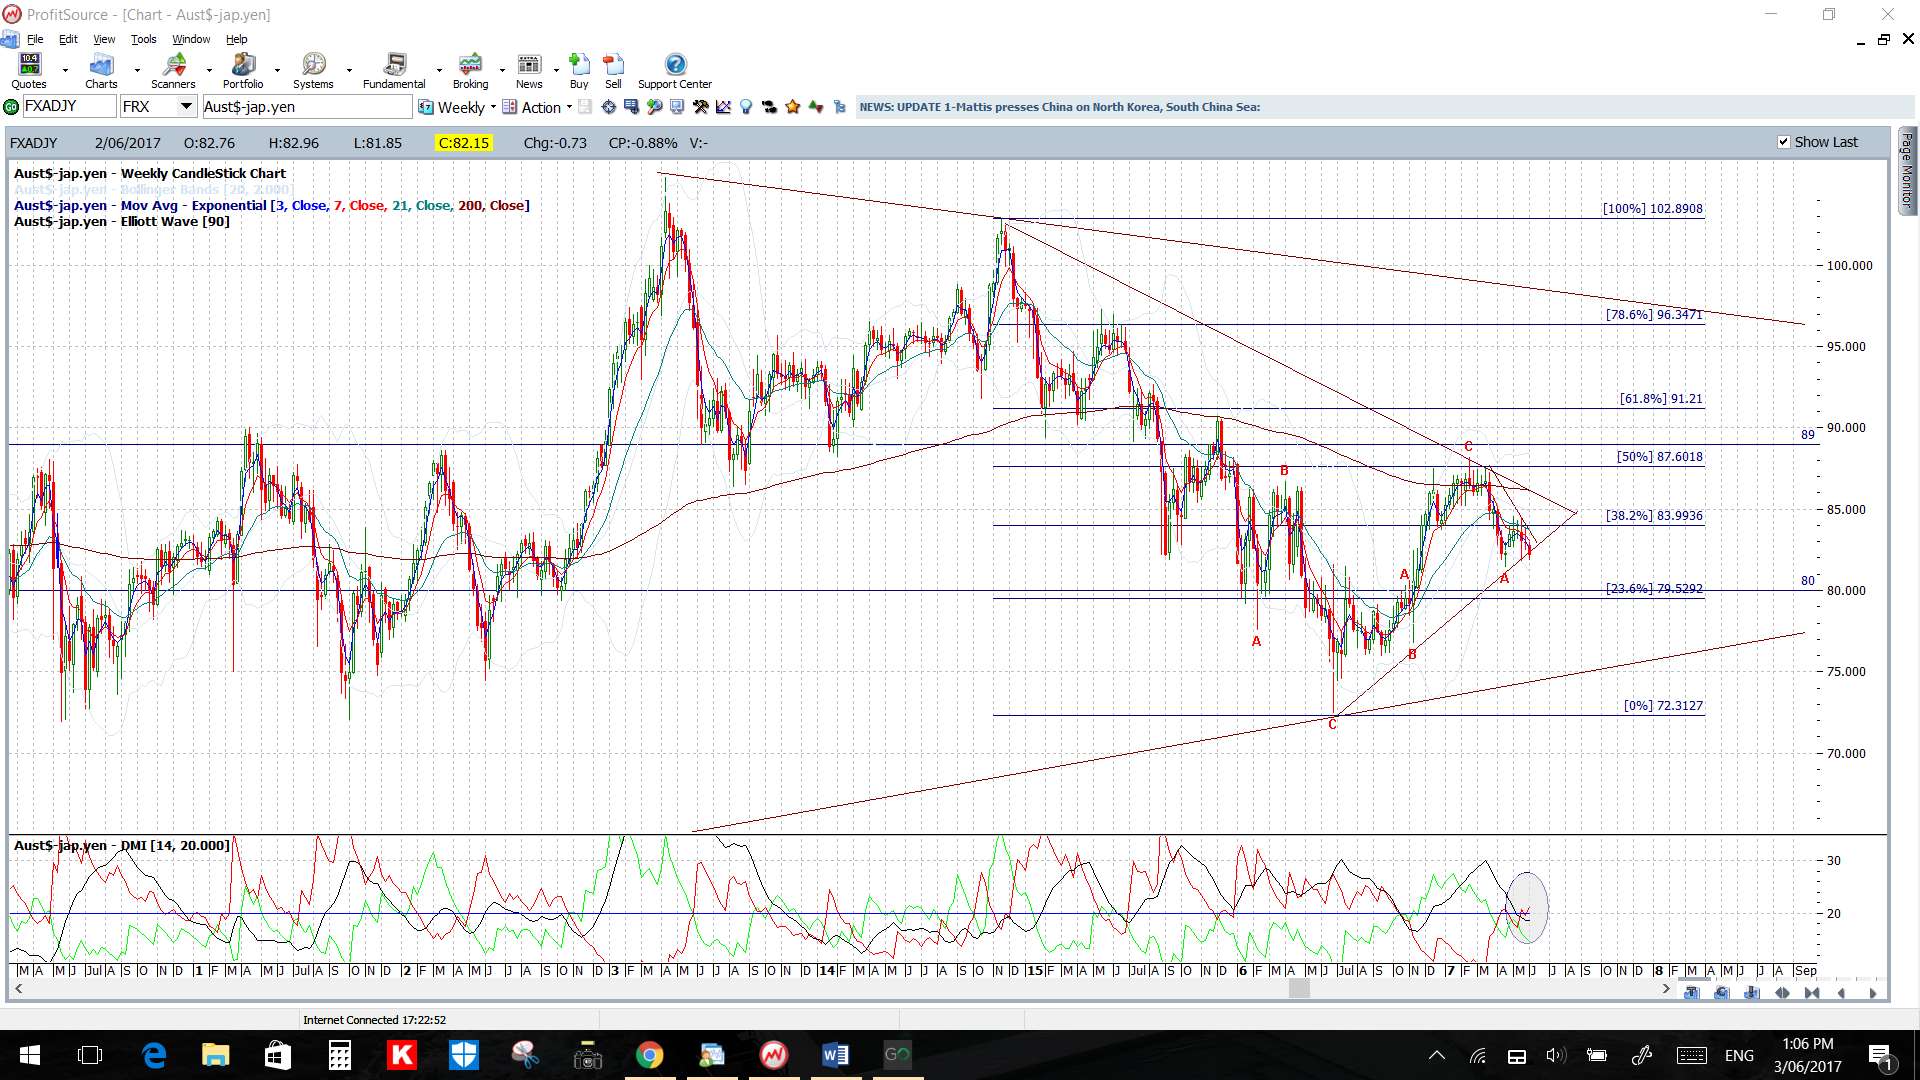
AUD/JPY: Watch the daily chart’s bottom triangle trend line for any make or break. Care is needed here though as this pair is highly correlated with the S&P500:
- Upper targets: the upper triangle trend line from the 4hr chart then the daily chart and, after that, the 87 S/R level.
- Lower targets: any pullback would have me looking for a test of 80 S/R and then the daily chart’s 61.8% Fib near 79 S/R and then 75.
NZD/USD: The Kiwi gave a great 70 pip 4hr chart triangle breakout so watch for any follow-through. The 0.72 level is just above current price so this might be the level to monitor this week for any make or break activity.
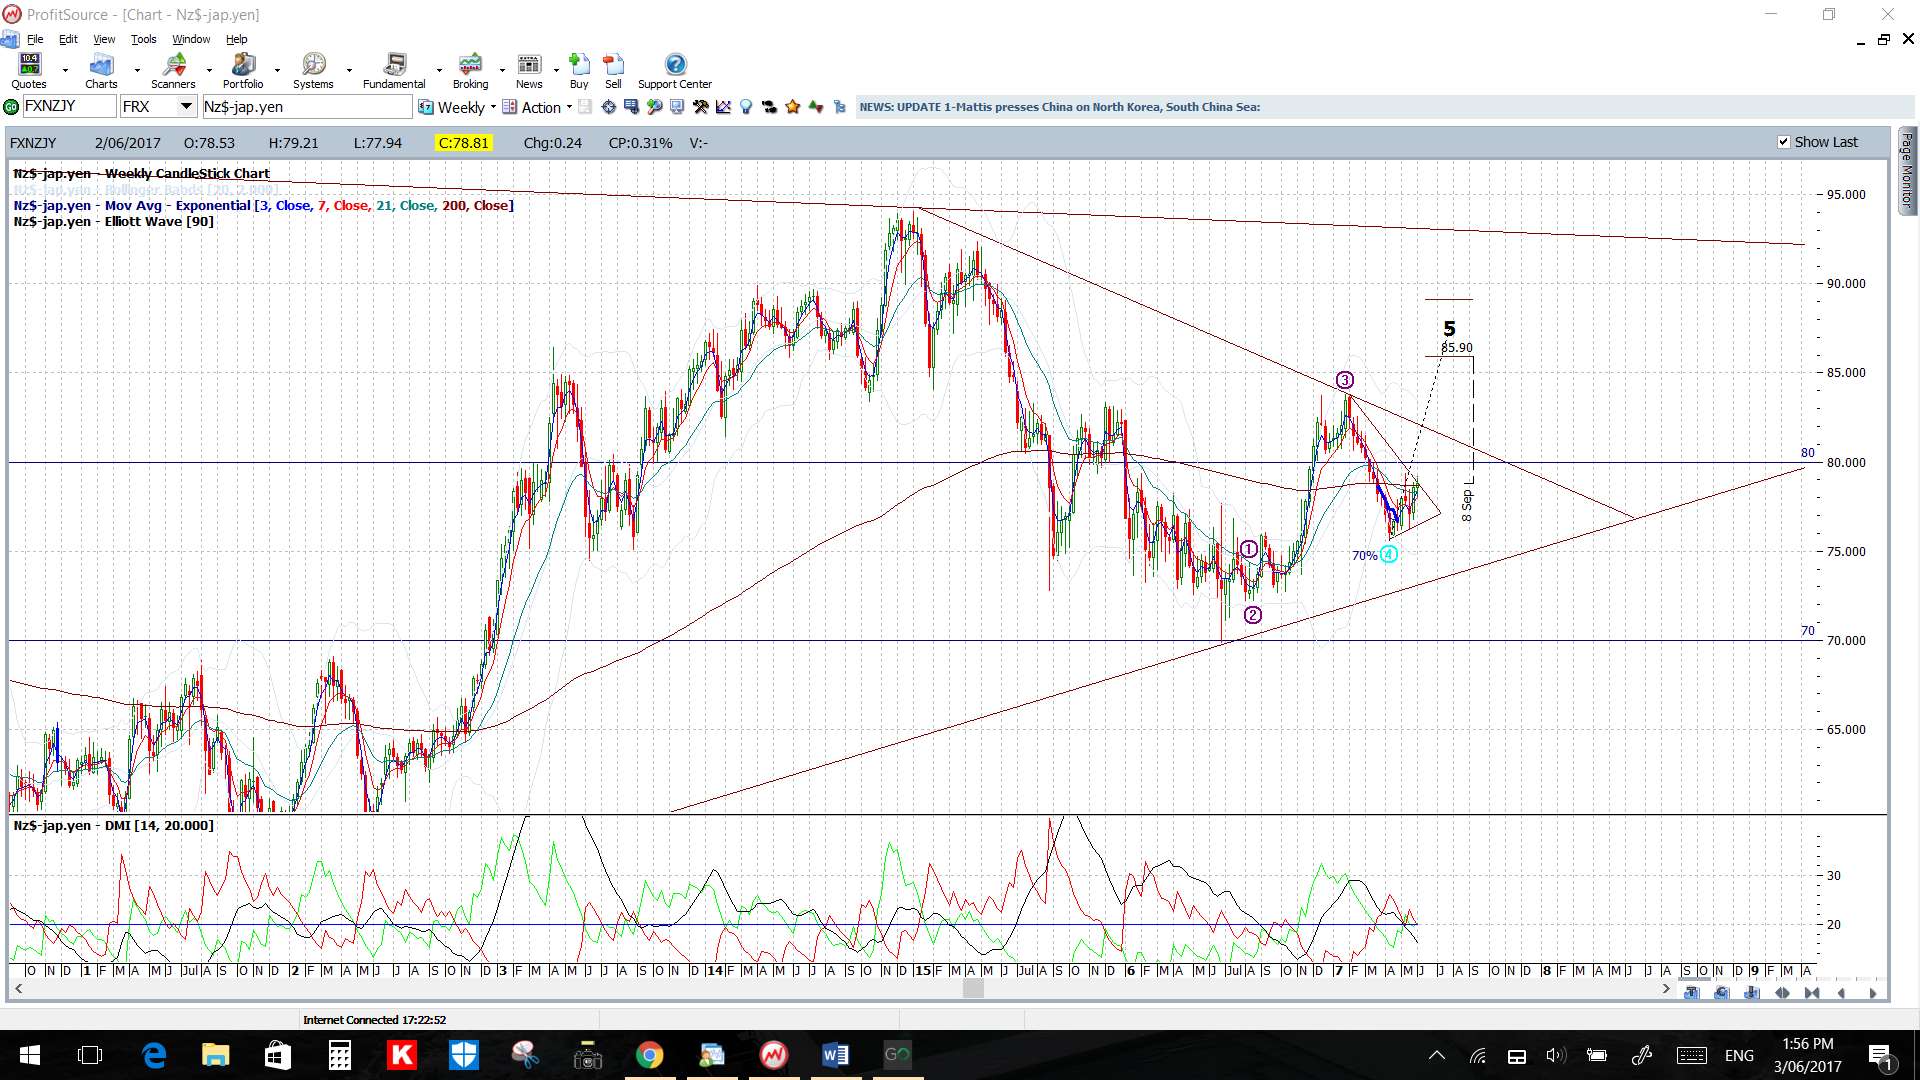
Note that I have revised the monthly chart trend lines here. As with the Aussie, there seems to be a large triangle brewing and the bear trend line of this Kiwi triangle intersects near the 0.72 level so it seems to be a rather important level for this pair:
- Upper targets: 0.72 as previous S/R and intersection of monthly triangle trend line, then 0.73 and 0.74 as previous S/R.
- Lower targets: 70 and 0.67.
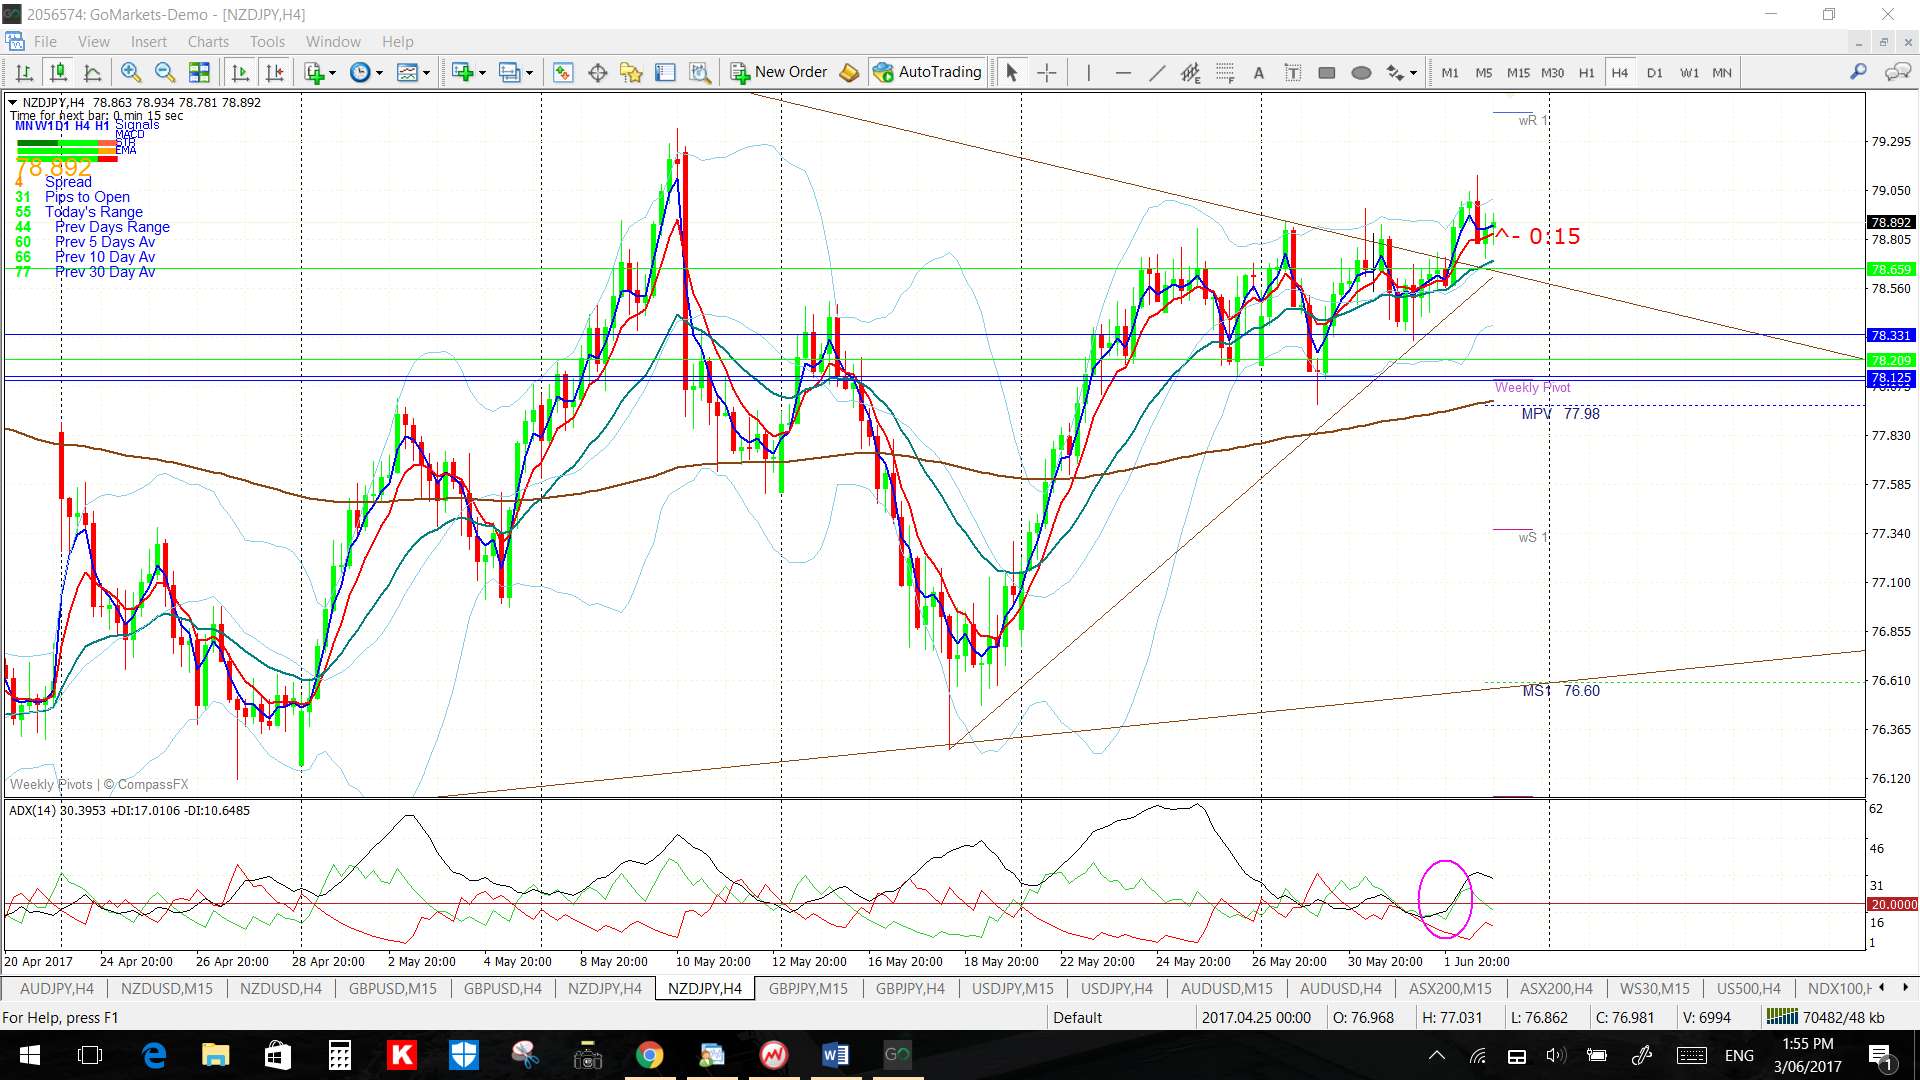
NZD/JPY: A 4hr chart triangle looks to be broken so watch for any bullish follow-through.
- Upper targets: the 80 level and then the upper daily chart triangle trend line.
- Lower targets: the daily chart’s lower triangle trend line.
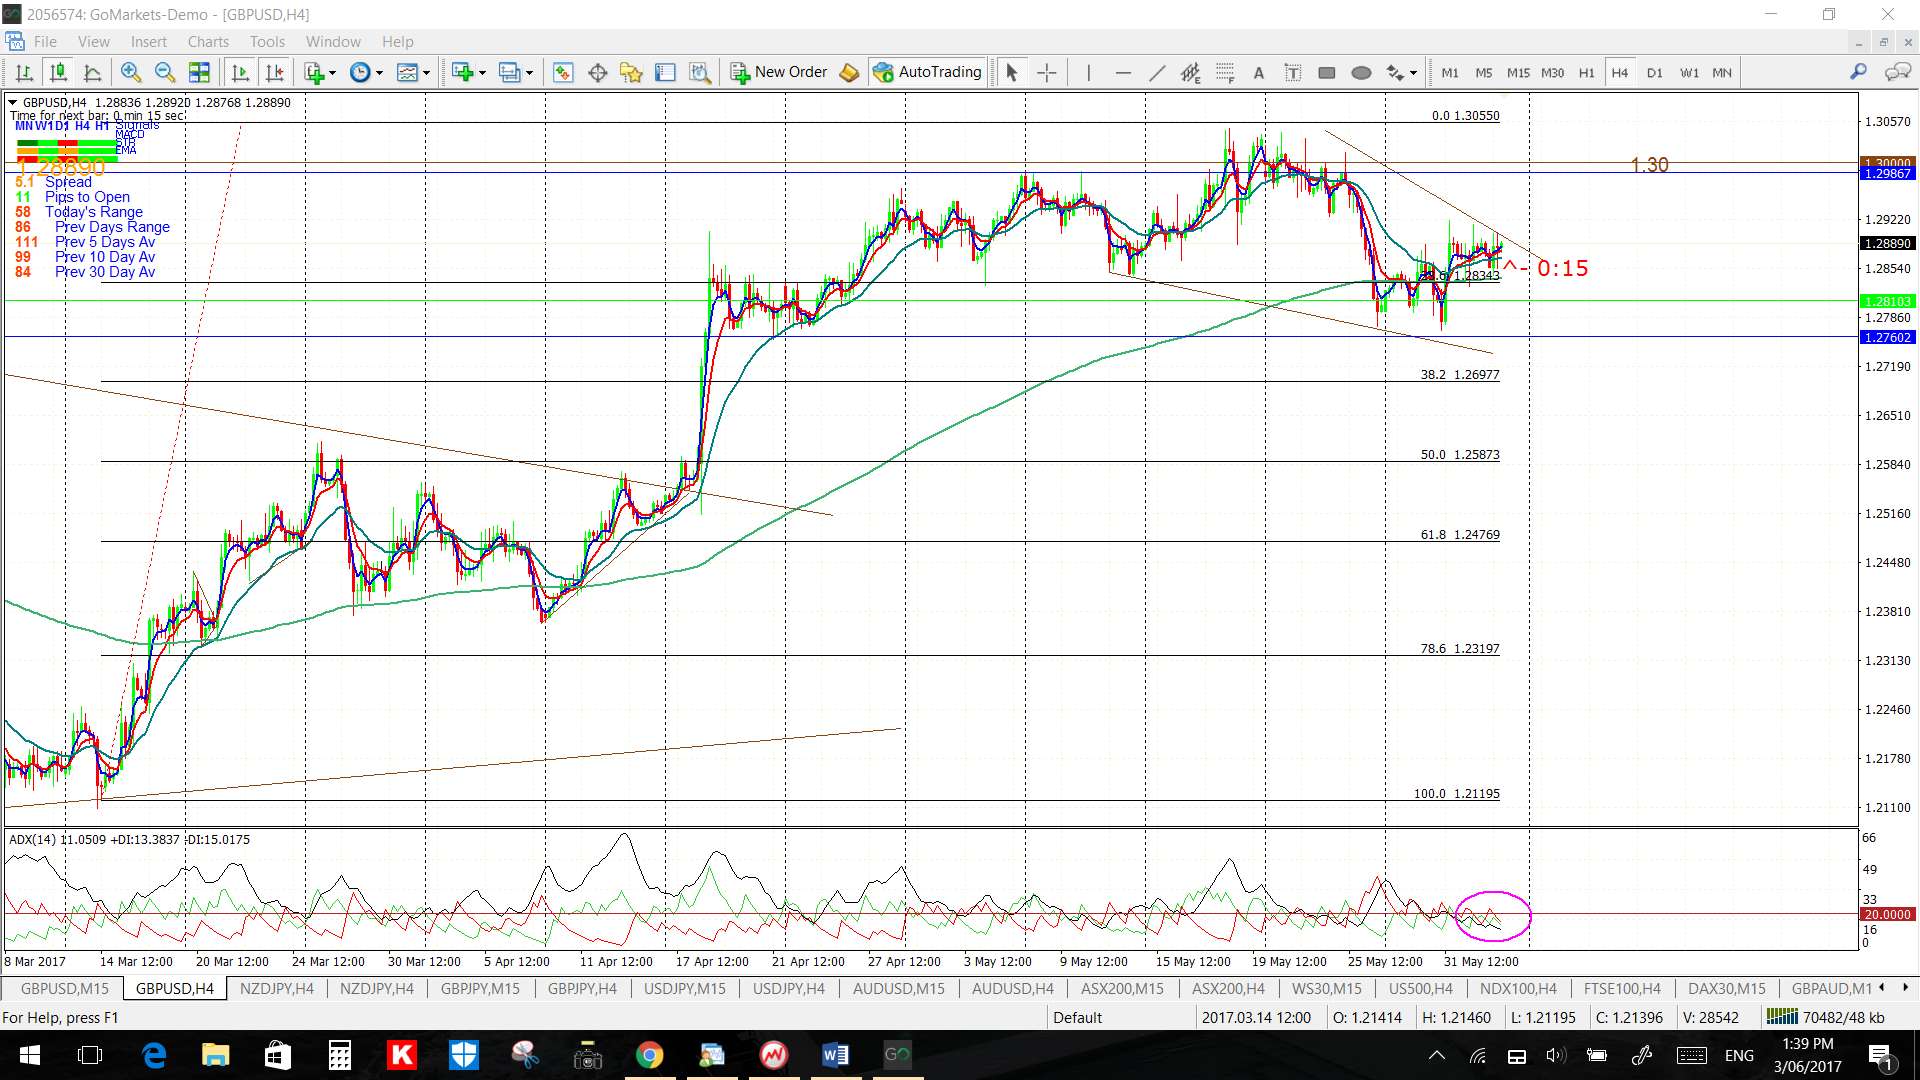
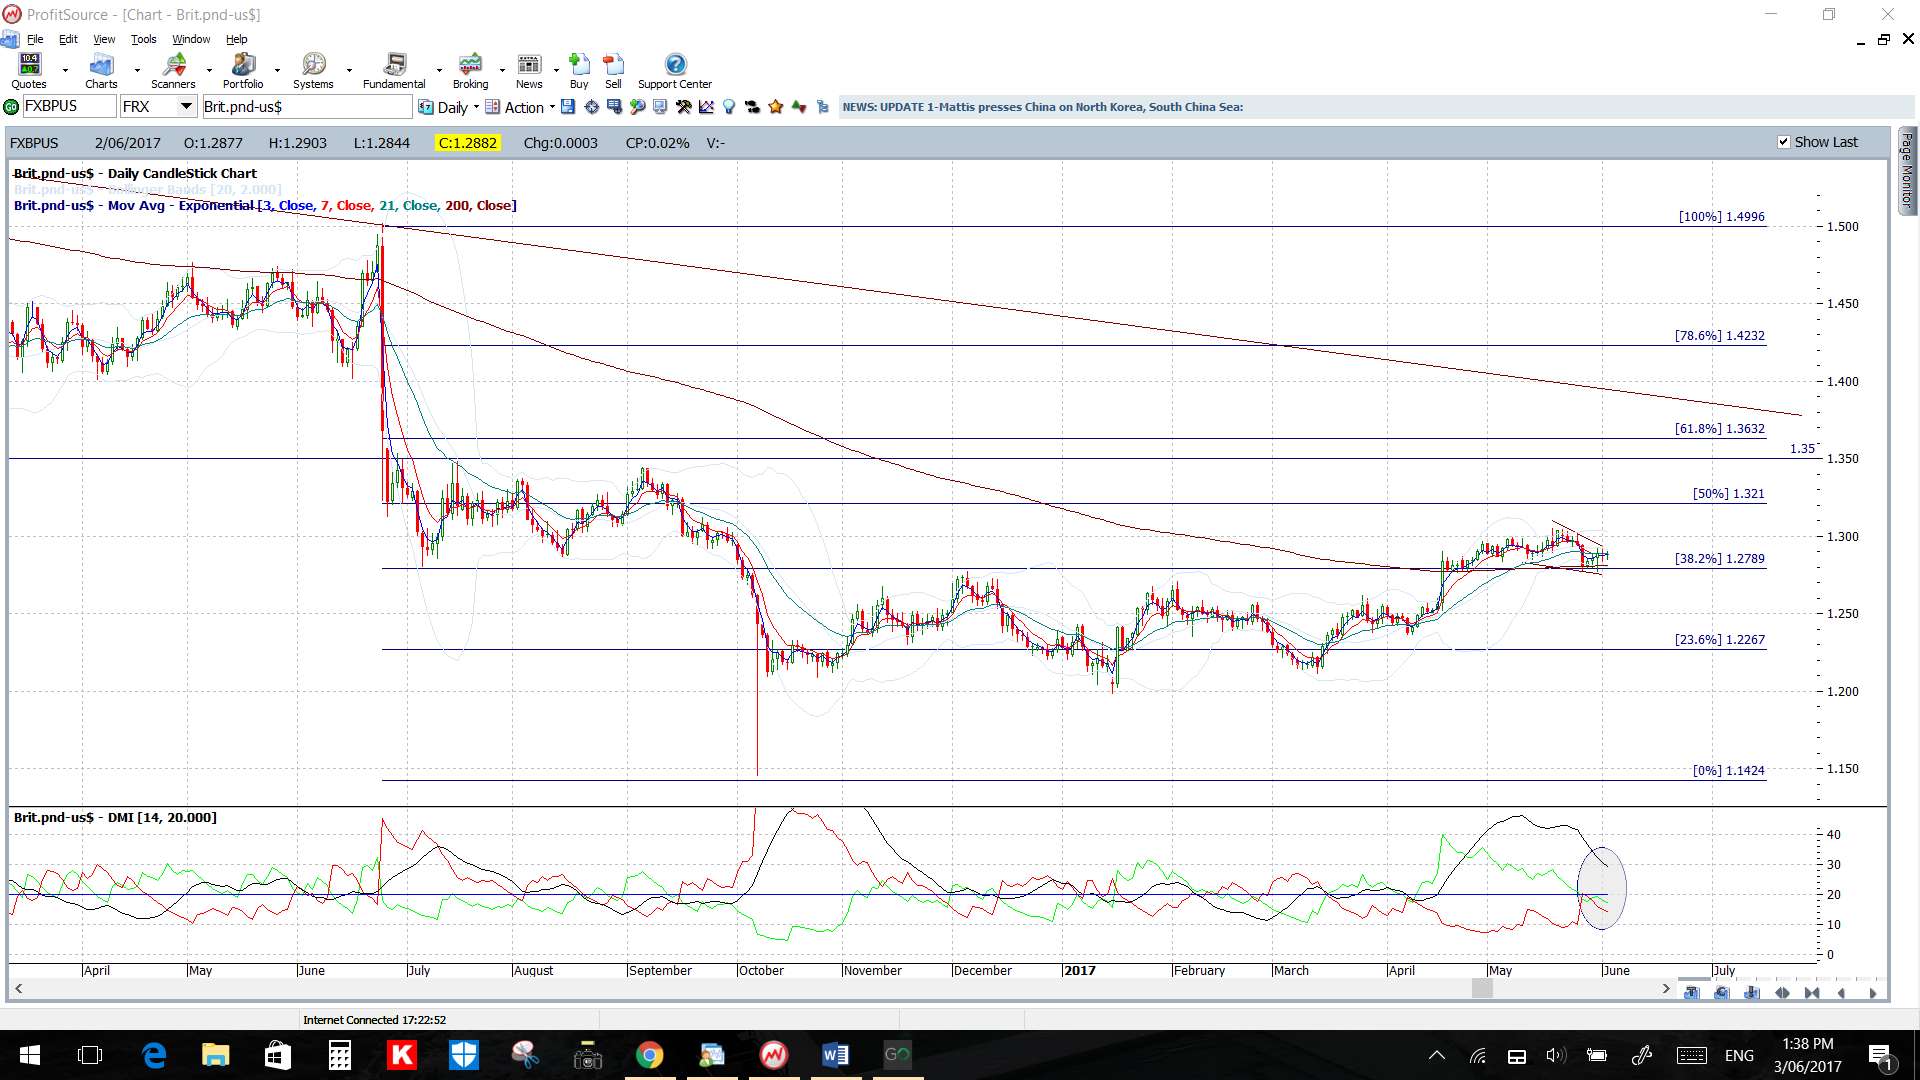
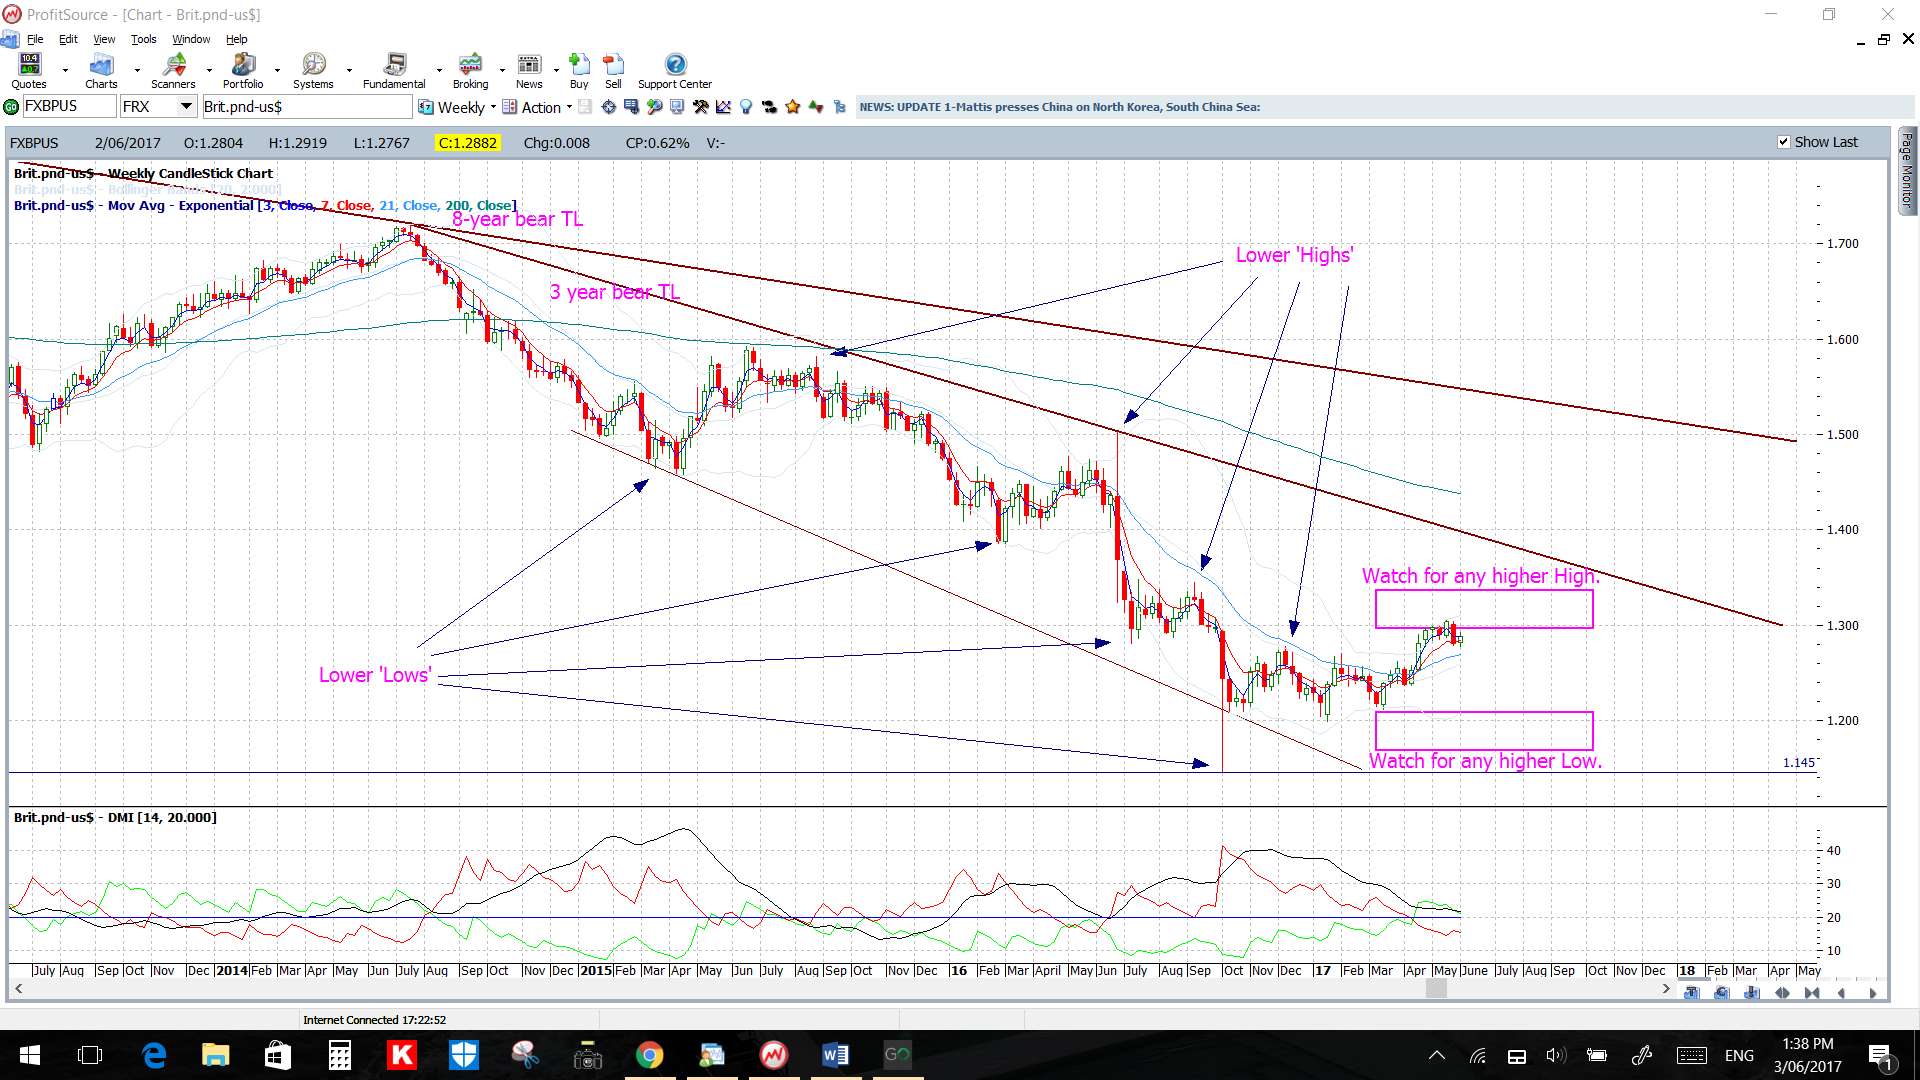
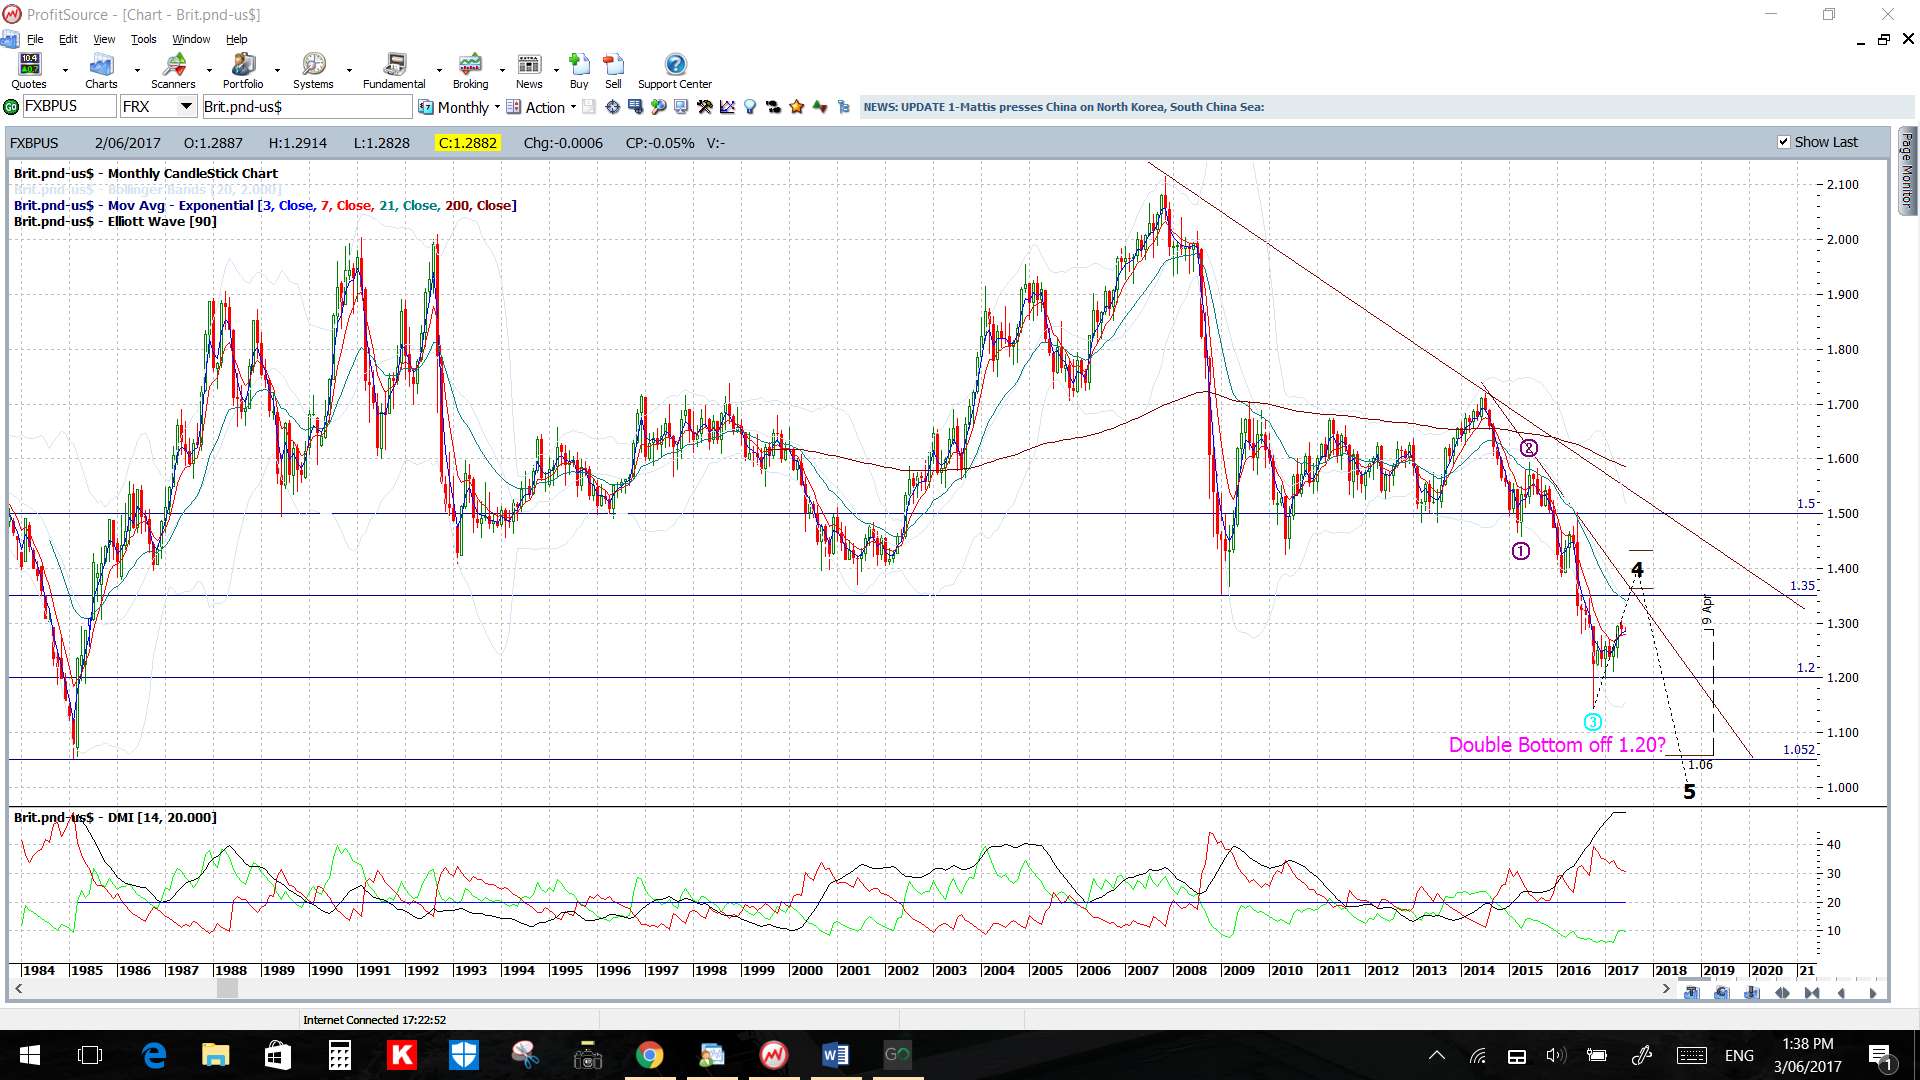
GBP/USD: This pair has been choppy of late and best left until after the UK election. Check out the shadows on the 4hr chart!
- Upper targets: 1.30 and then 1.35 as previous S/R followed by 1.40, which is near the 3-year bear trend line.
- Lower targets: any continued pullback would have me looking for a test of the 4hr chart’s 61.8% Fib near 1.25.
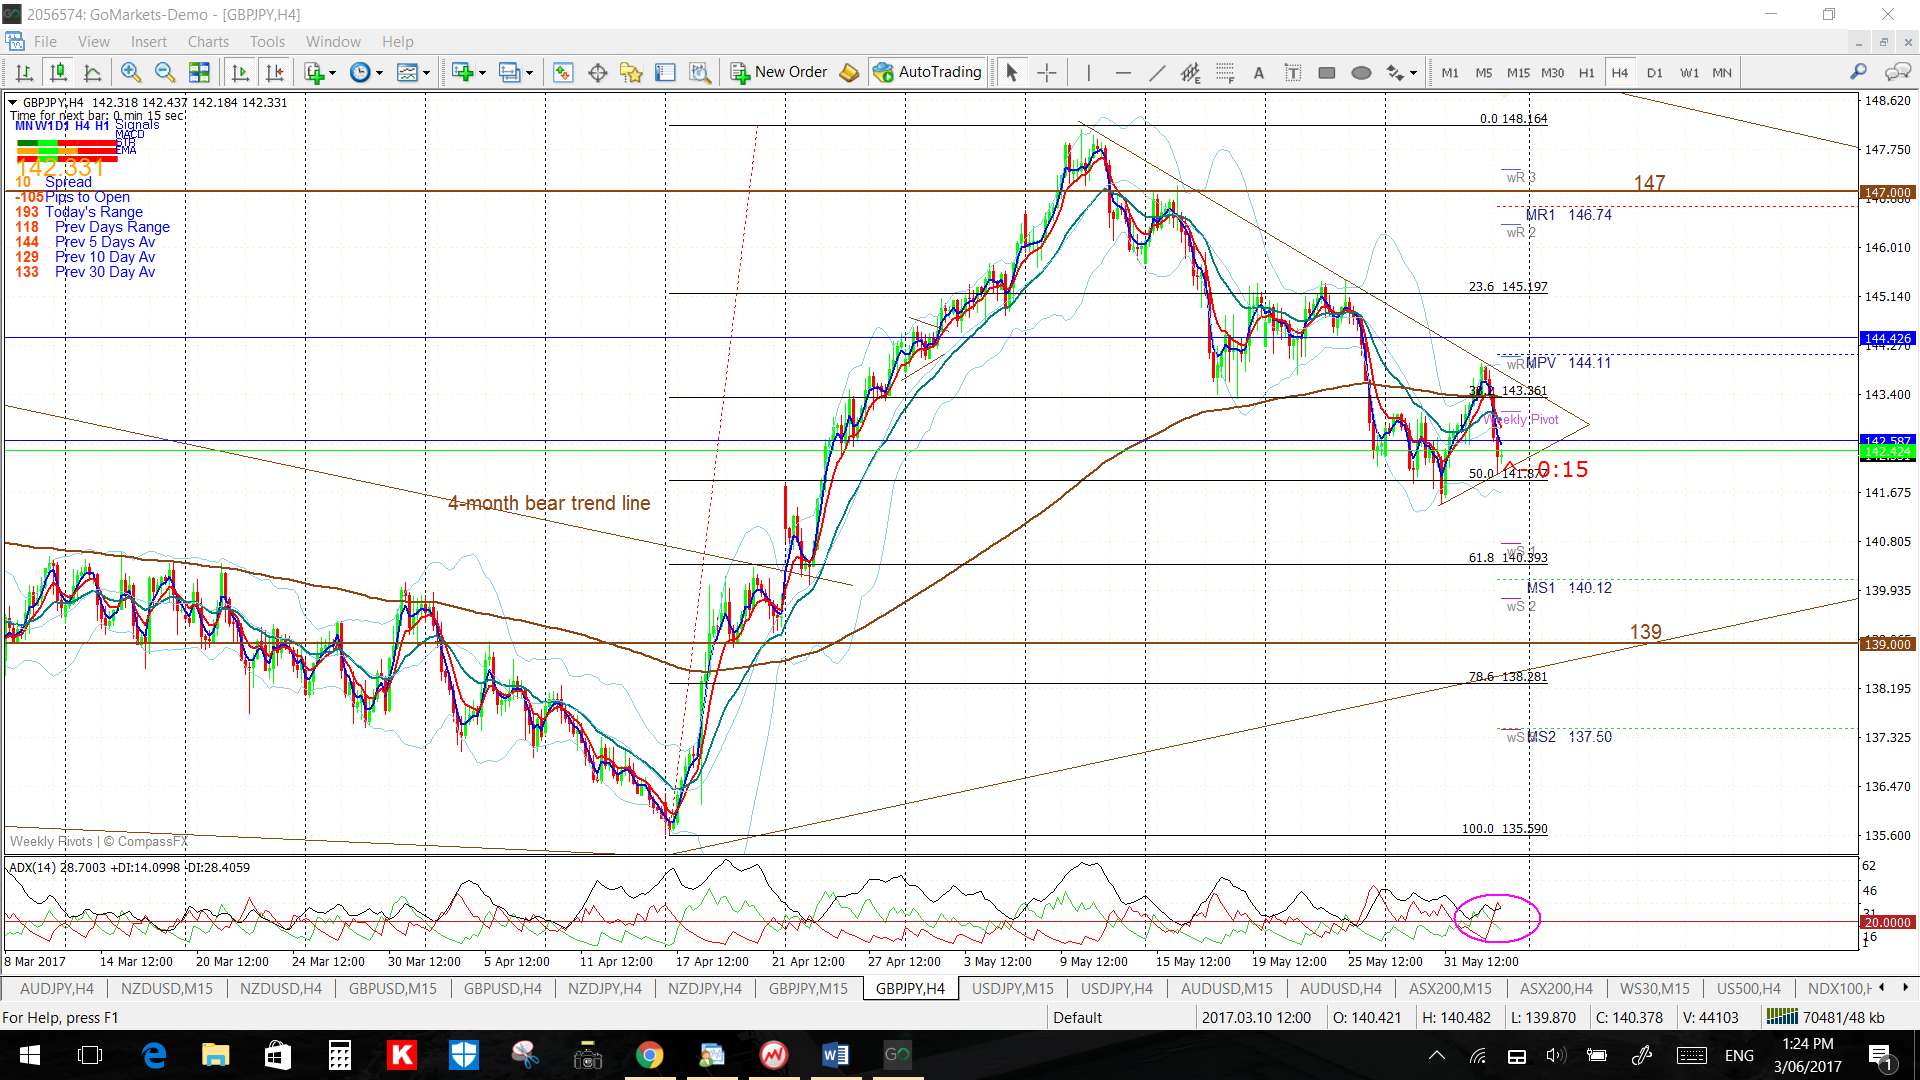
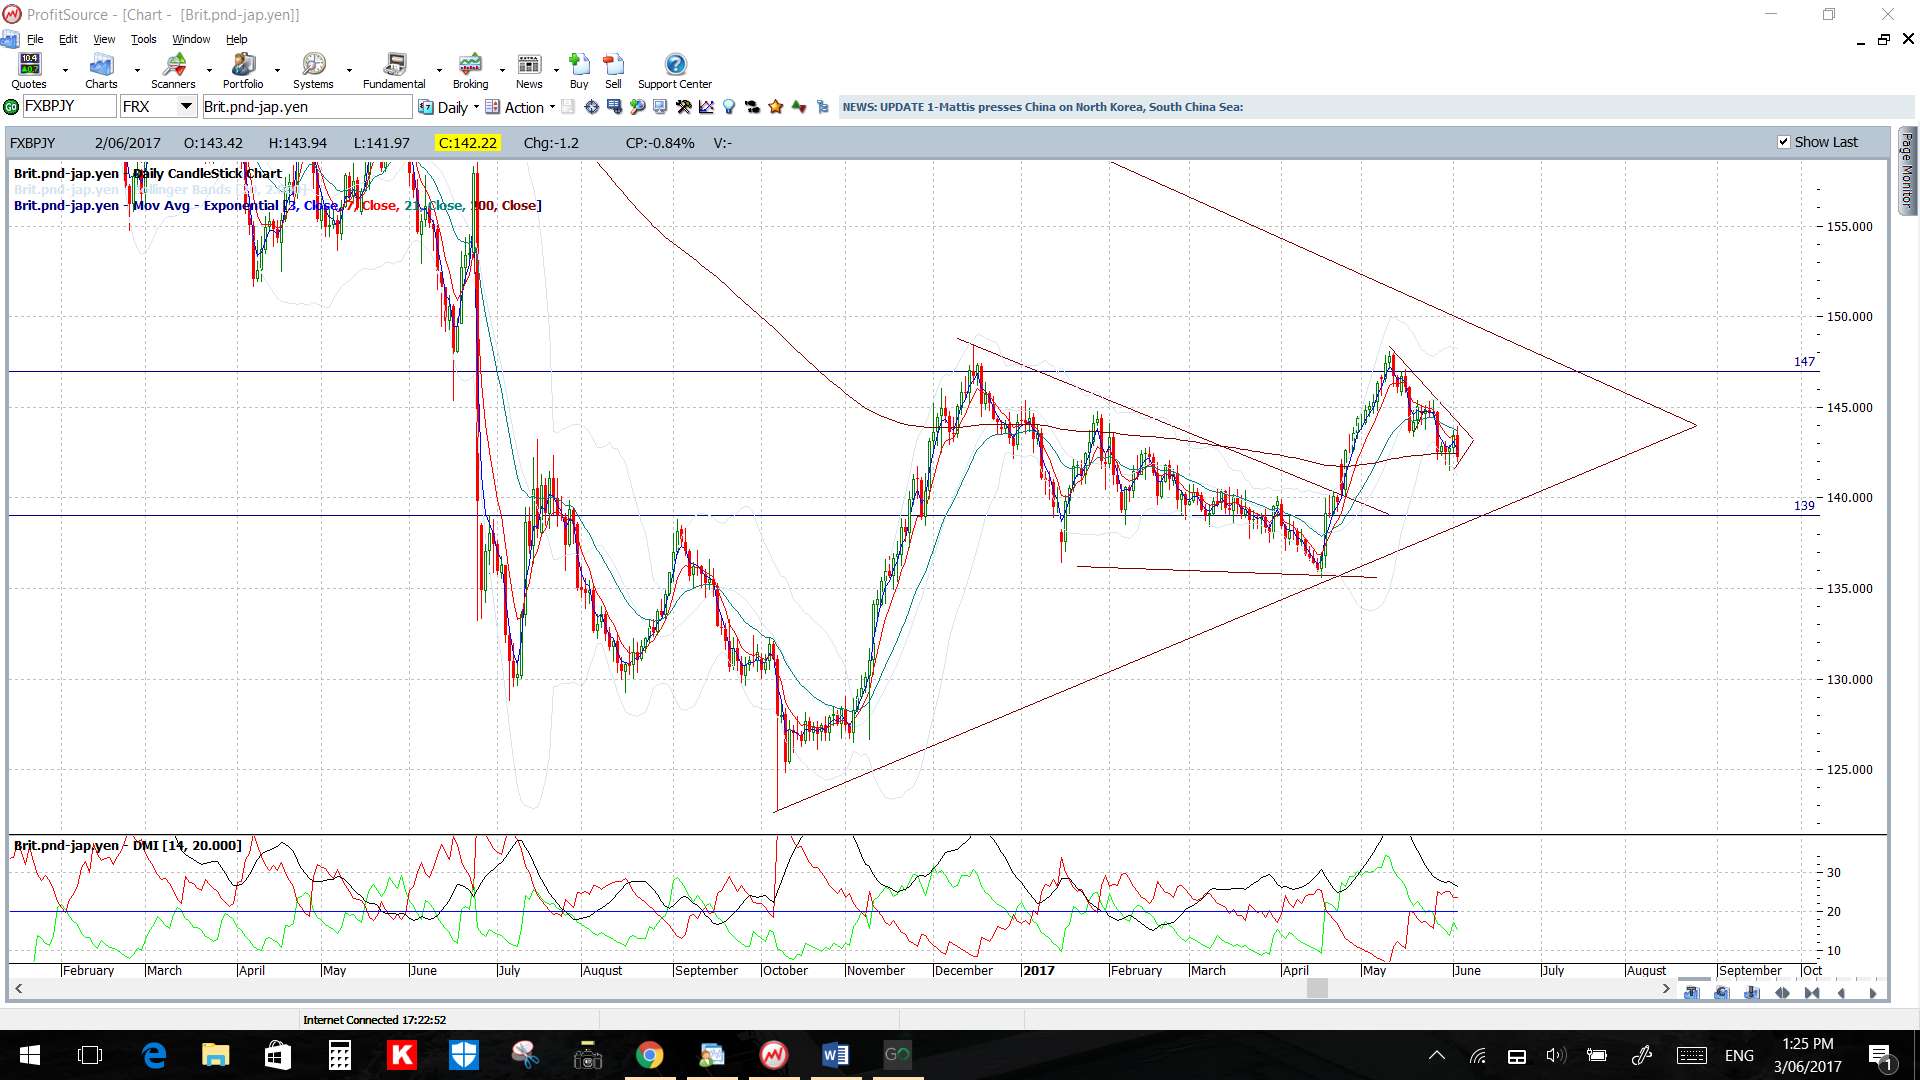
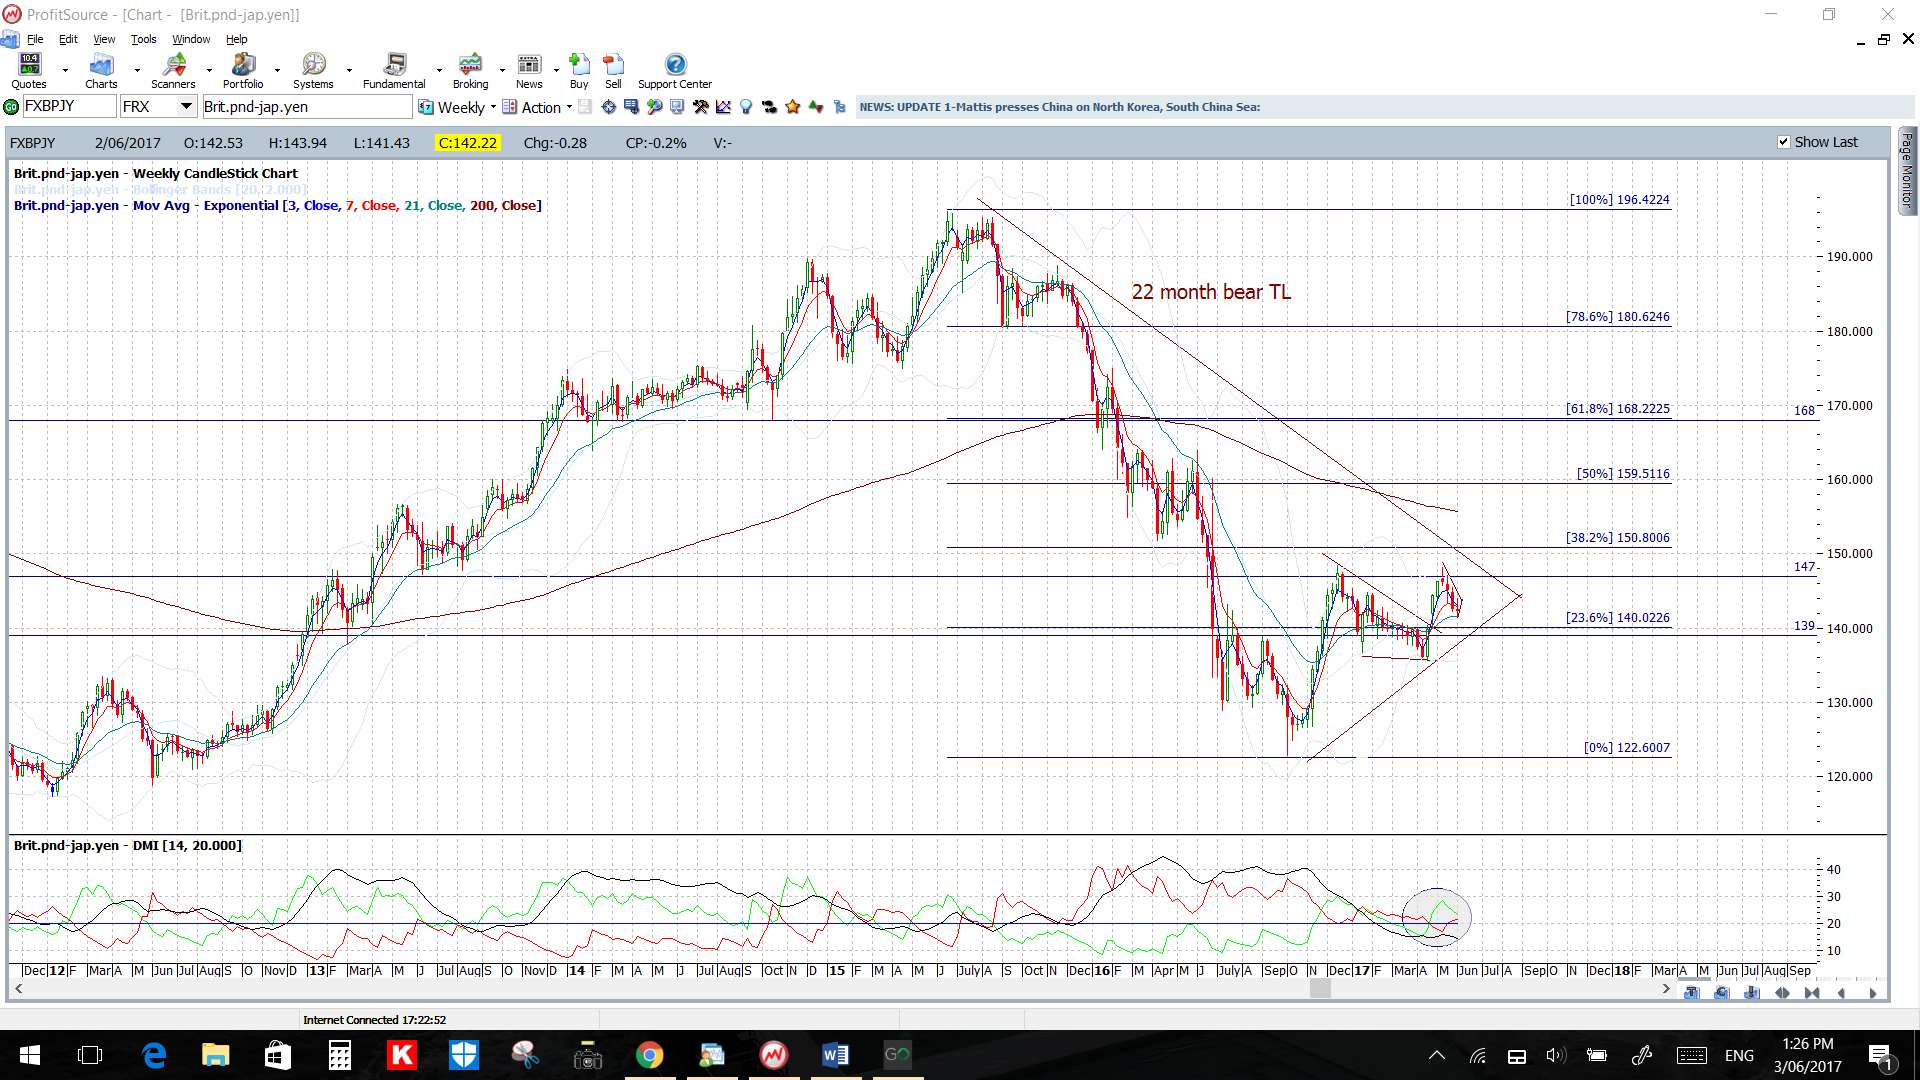
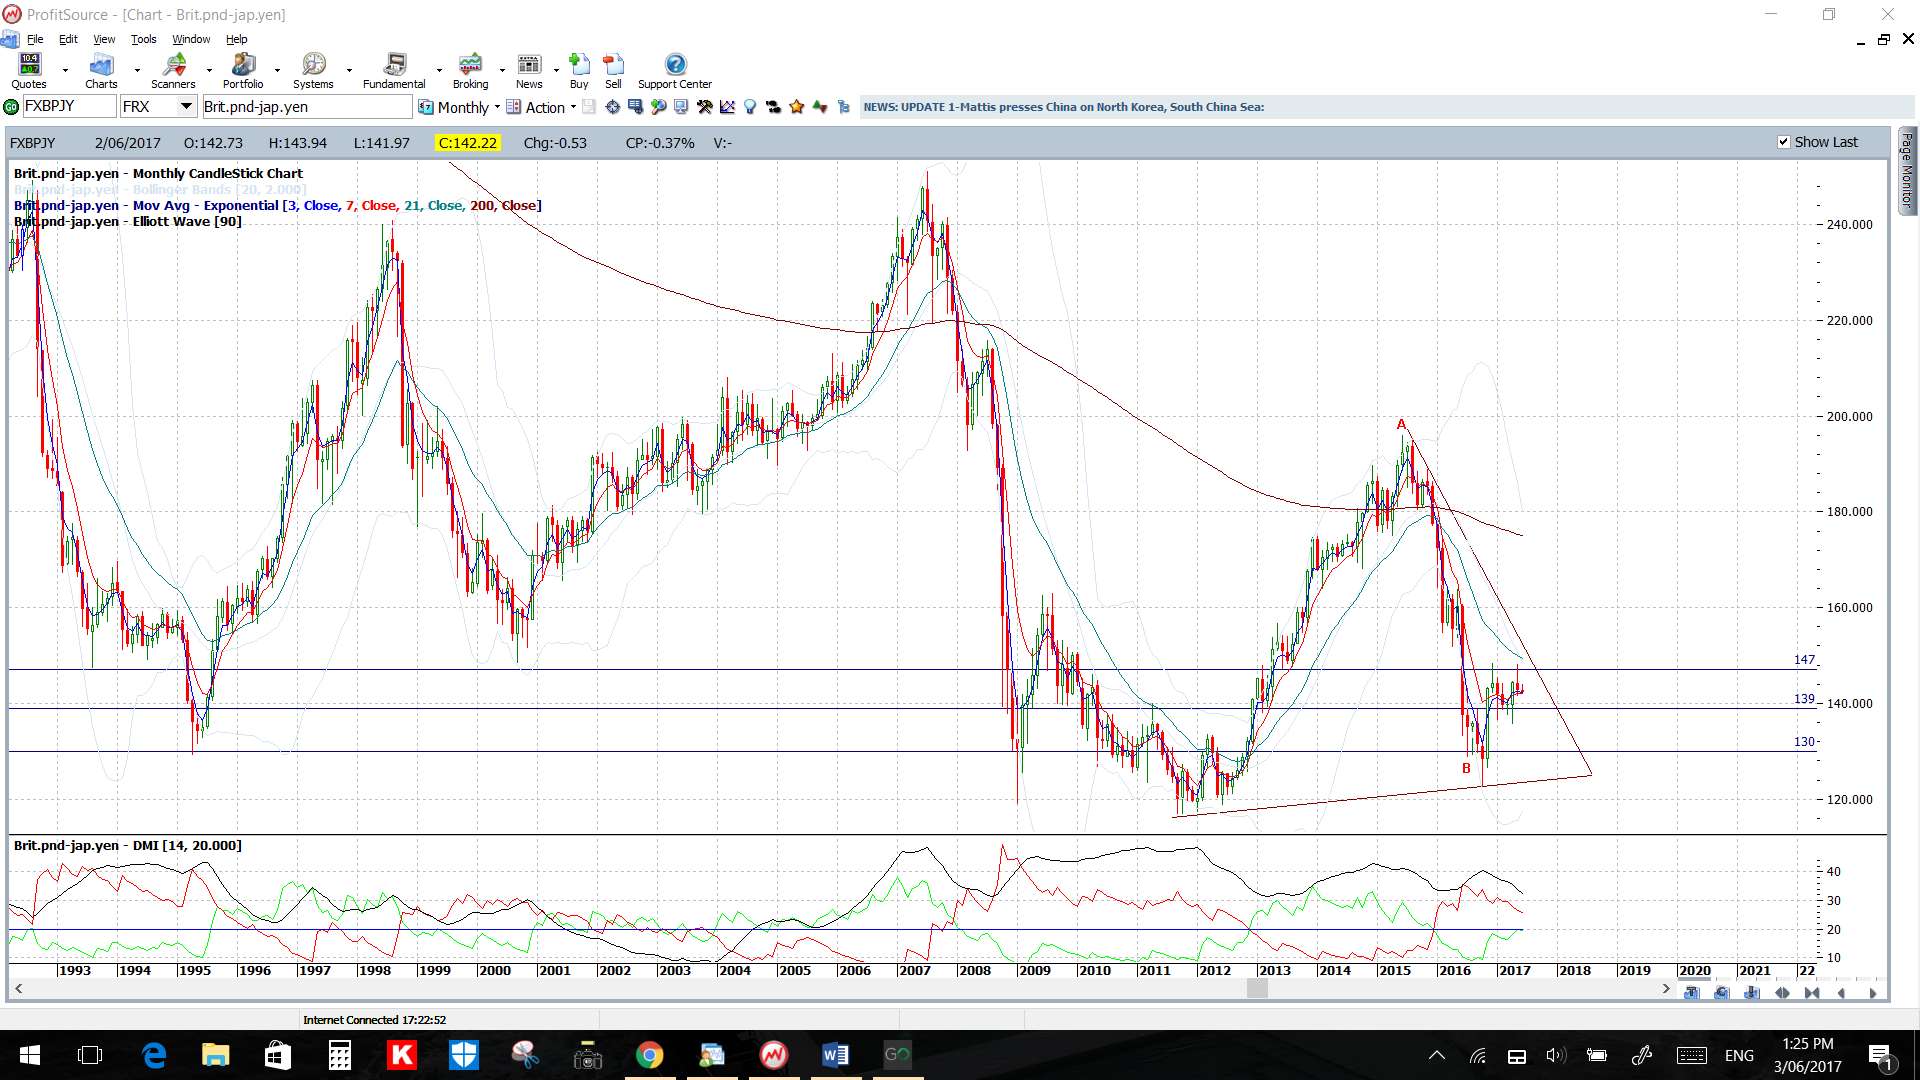
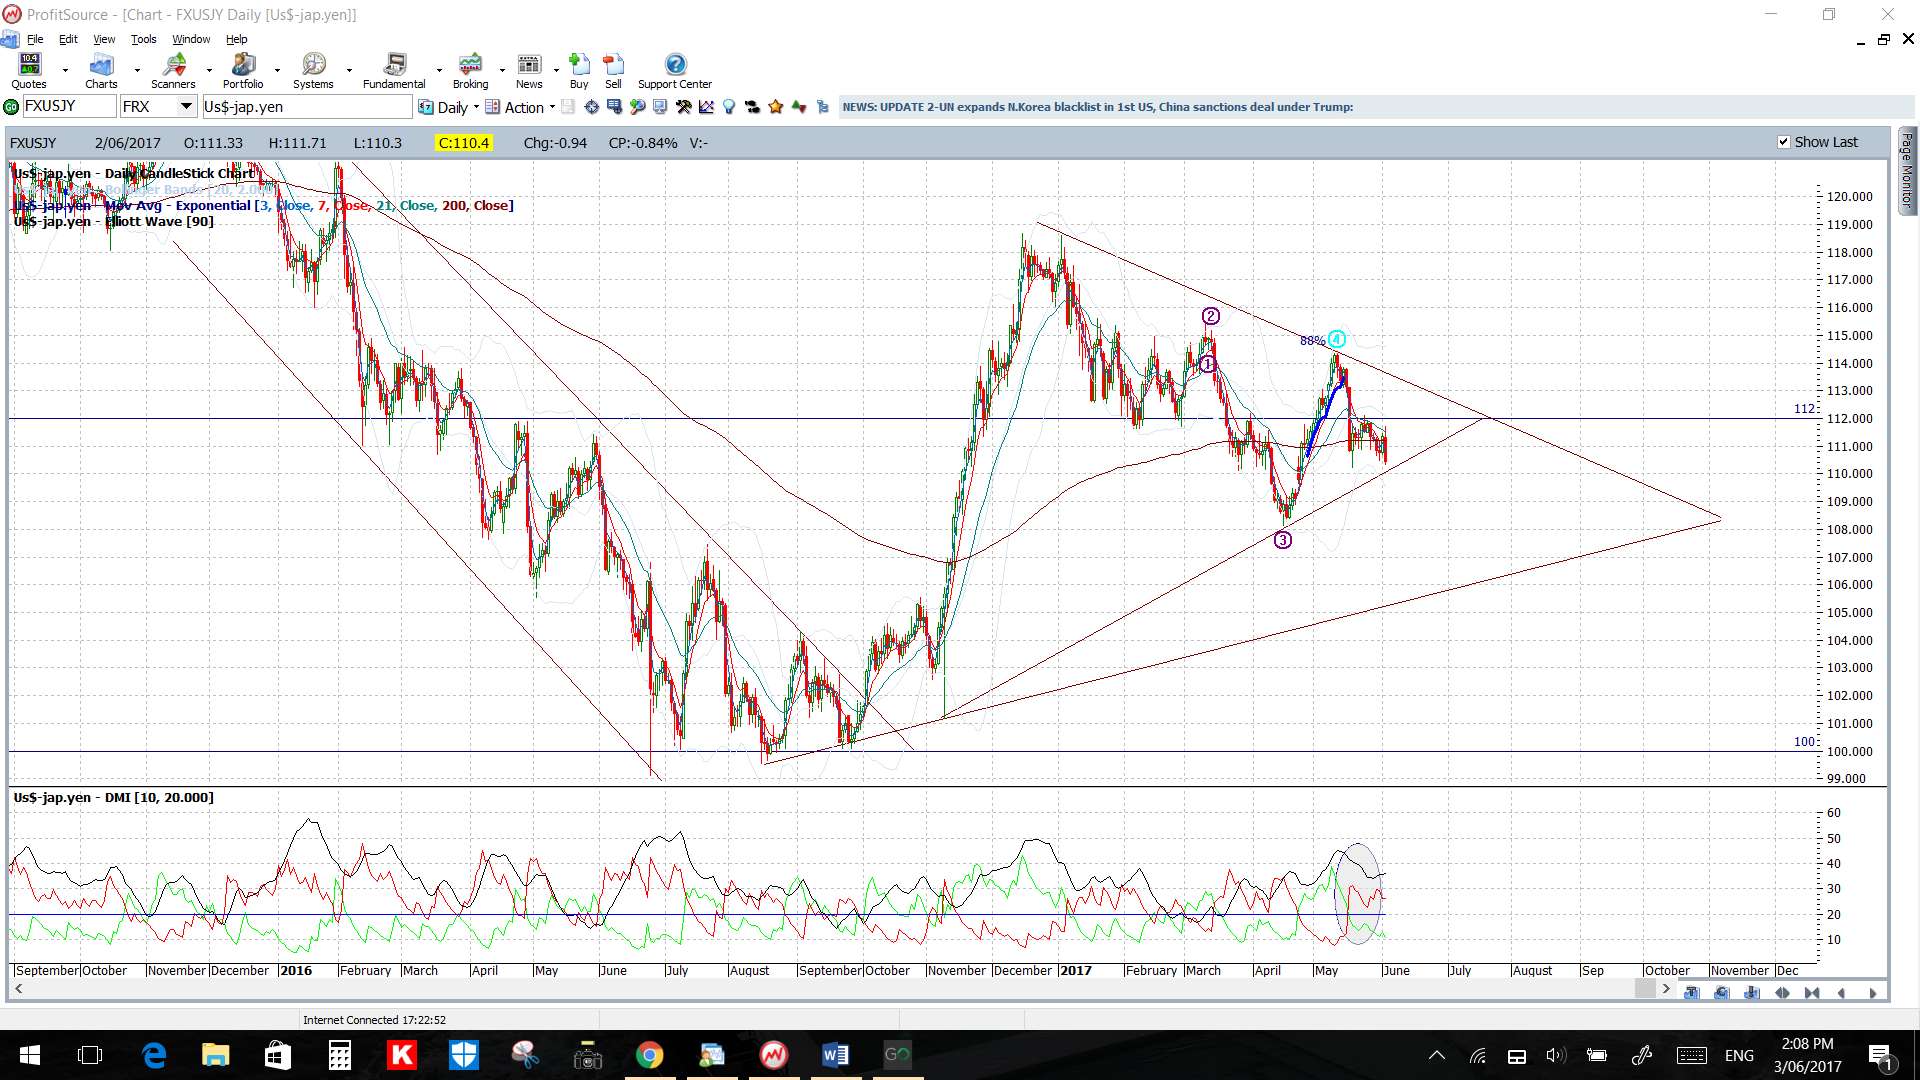
GBP/JPY: This pair gave a great 100 pip trend line breakout trade after NFP. Watch the 4hr chart’s revised triangle trend lines though for any new breakout but take care in the days leading up to the UK election:
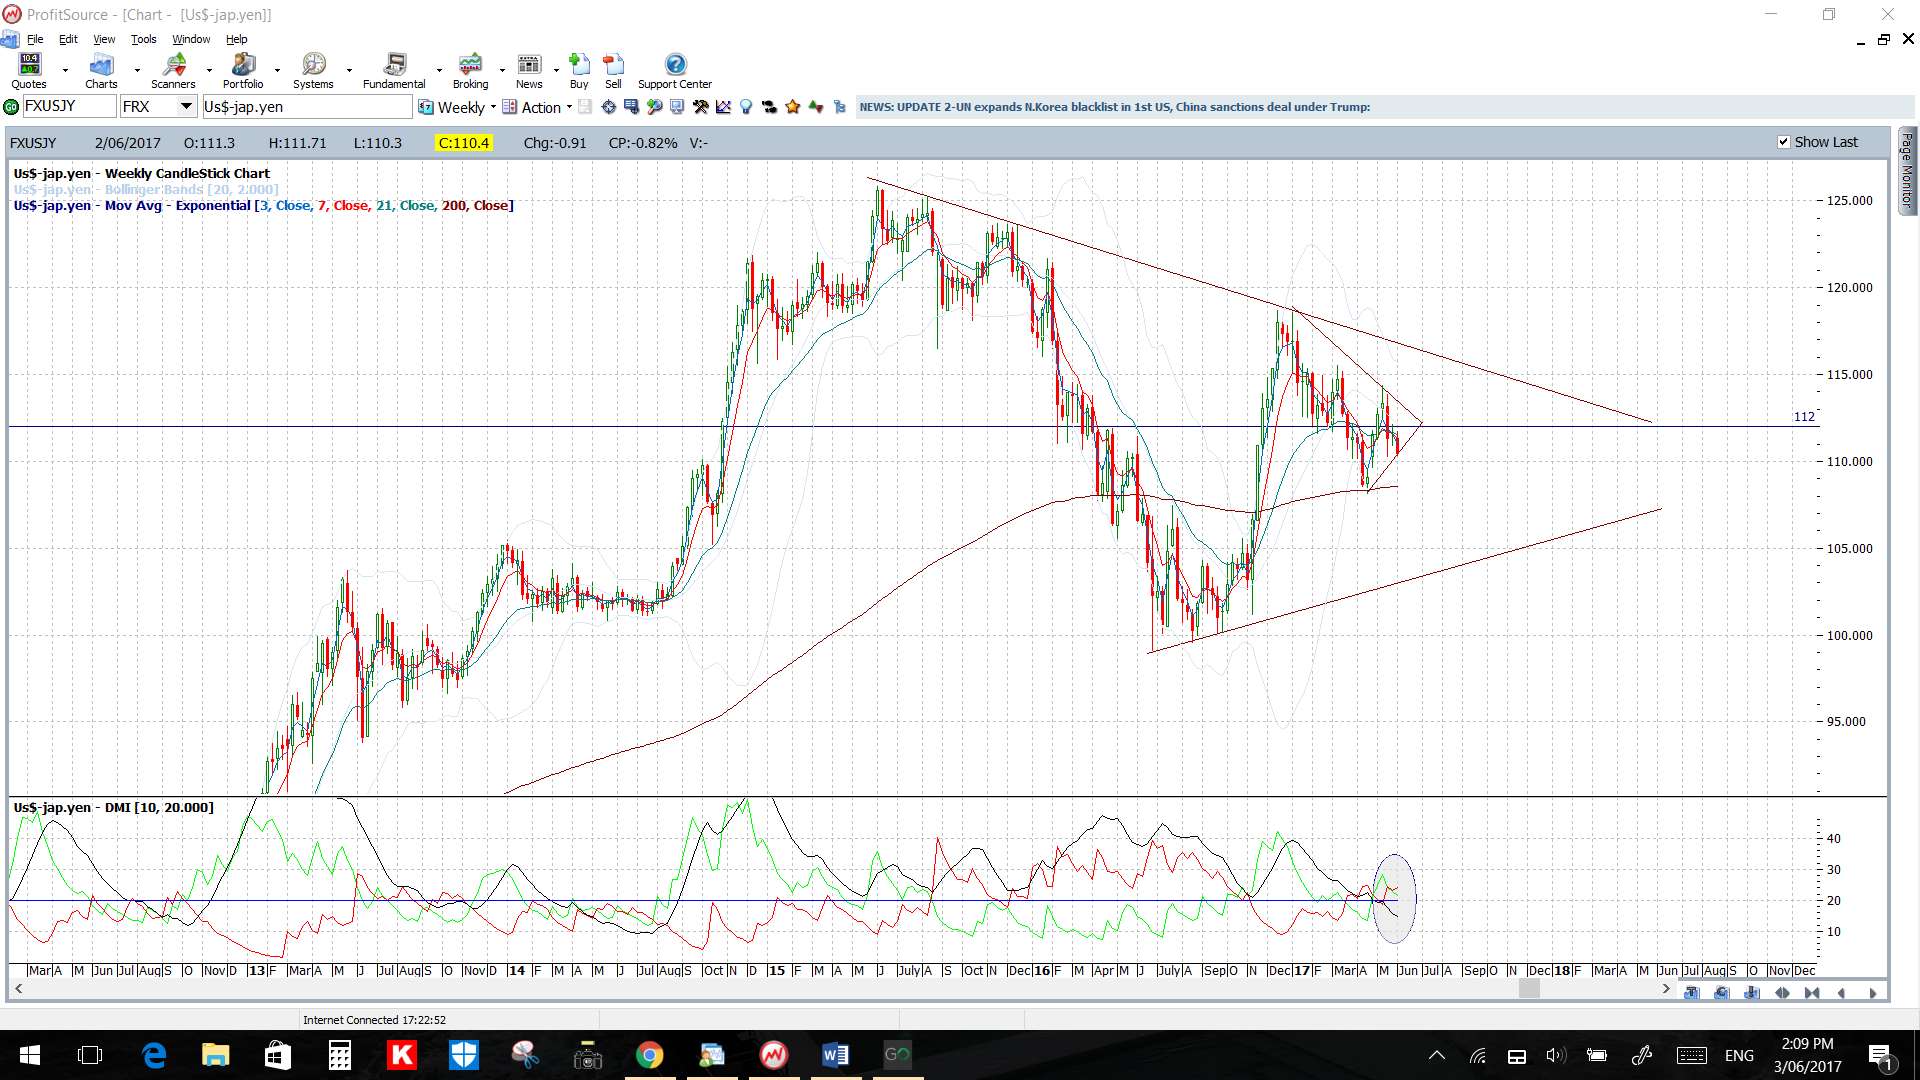
- Upper targets: 147 as previous S/R and, then, the 22 month bear trend line, which is about 700+ pips away, followed by the weekly chart’s 61.8% Fib which is up near 168.
- Lower targets: any pullback would have me looking for a test of the 4hr chart’s 61.8% Fib and, after that, the 139 level.
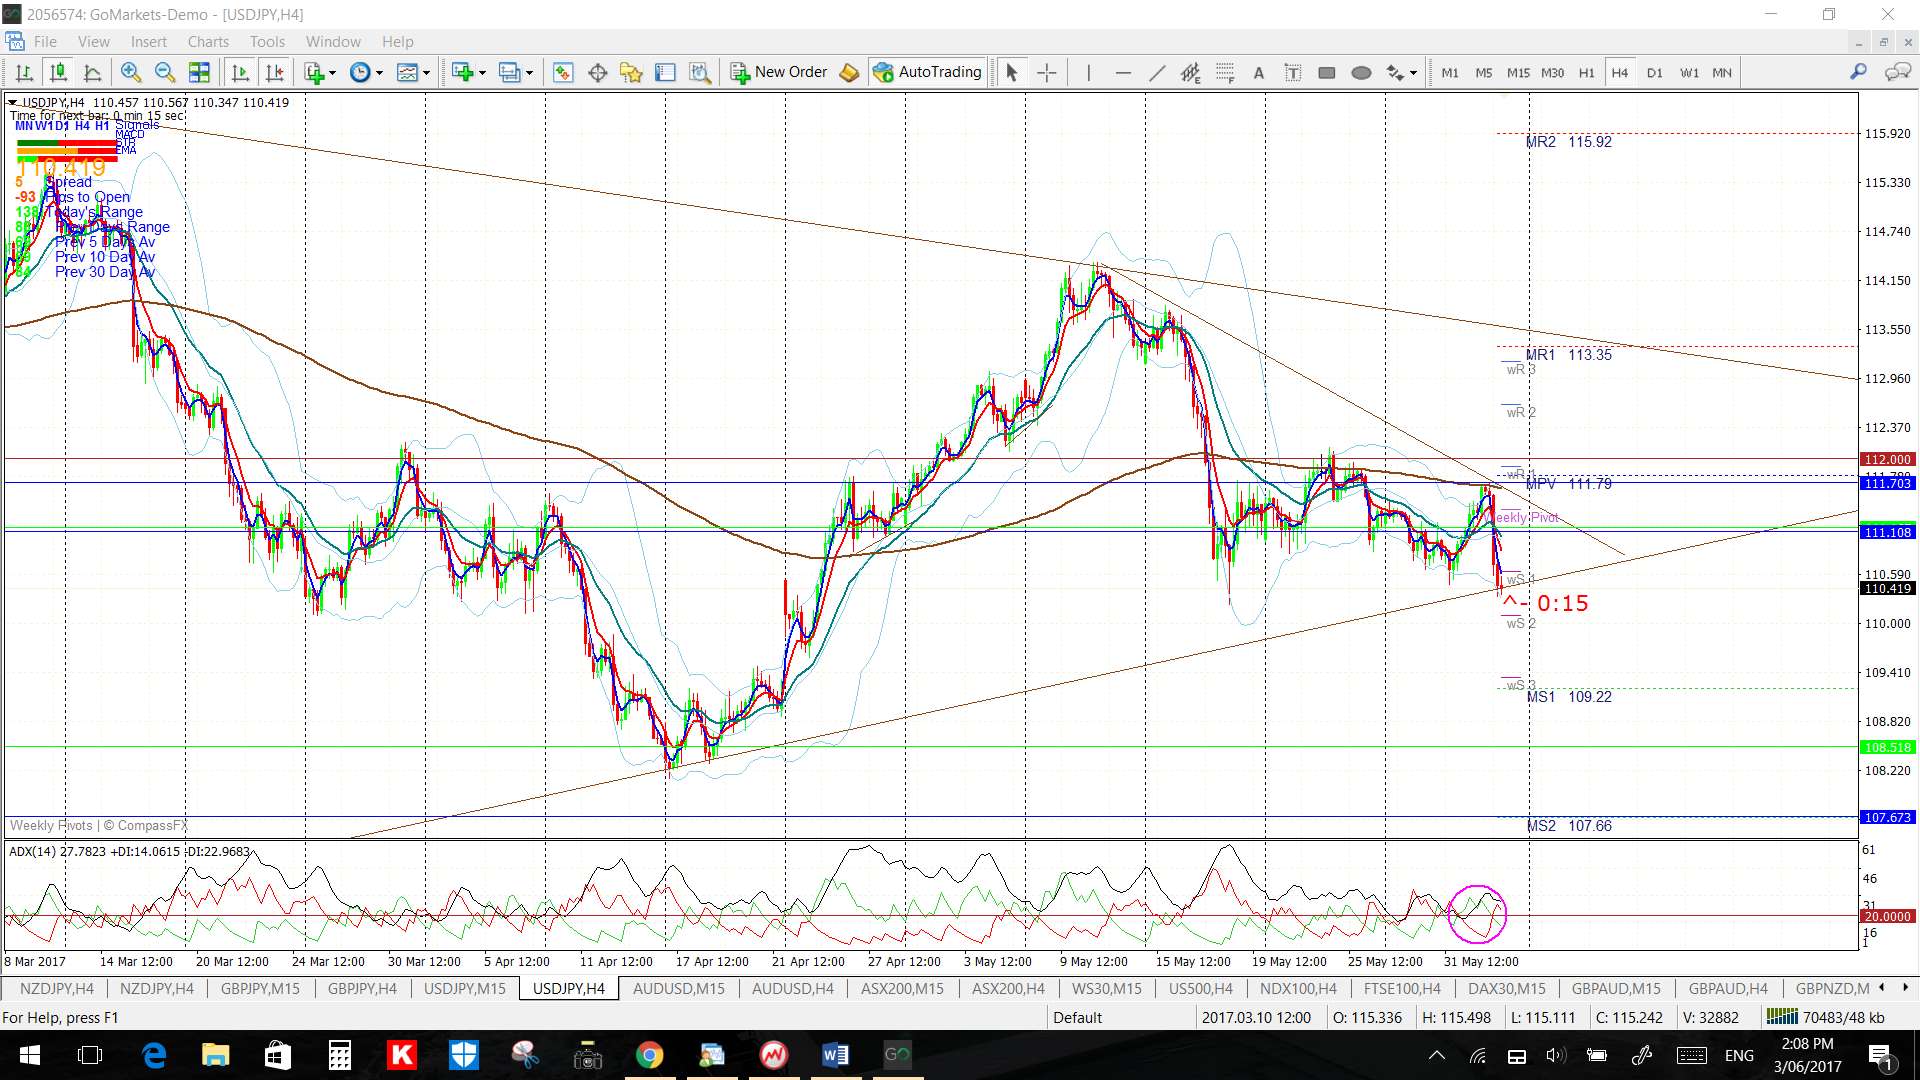
USD/JPY: Watch the 4hr chart’s triangle trend lines for any breakout:
- Upper targets: the 4hr chart’s bear trend line followed by the daily chart’s upper triangle trend line.
- Lower targets: the daily chart’s lower triangle trend line.
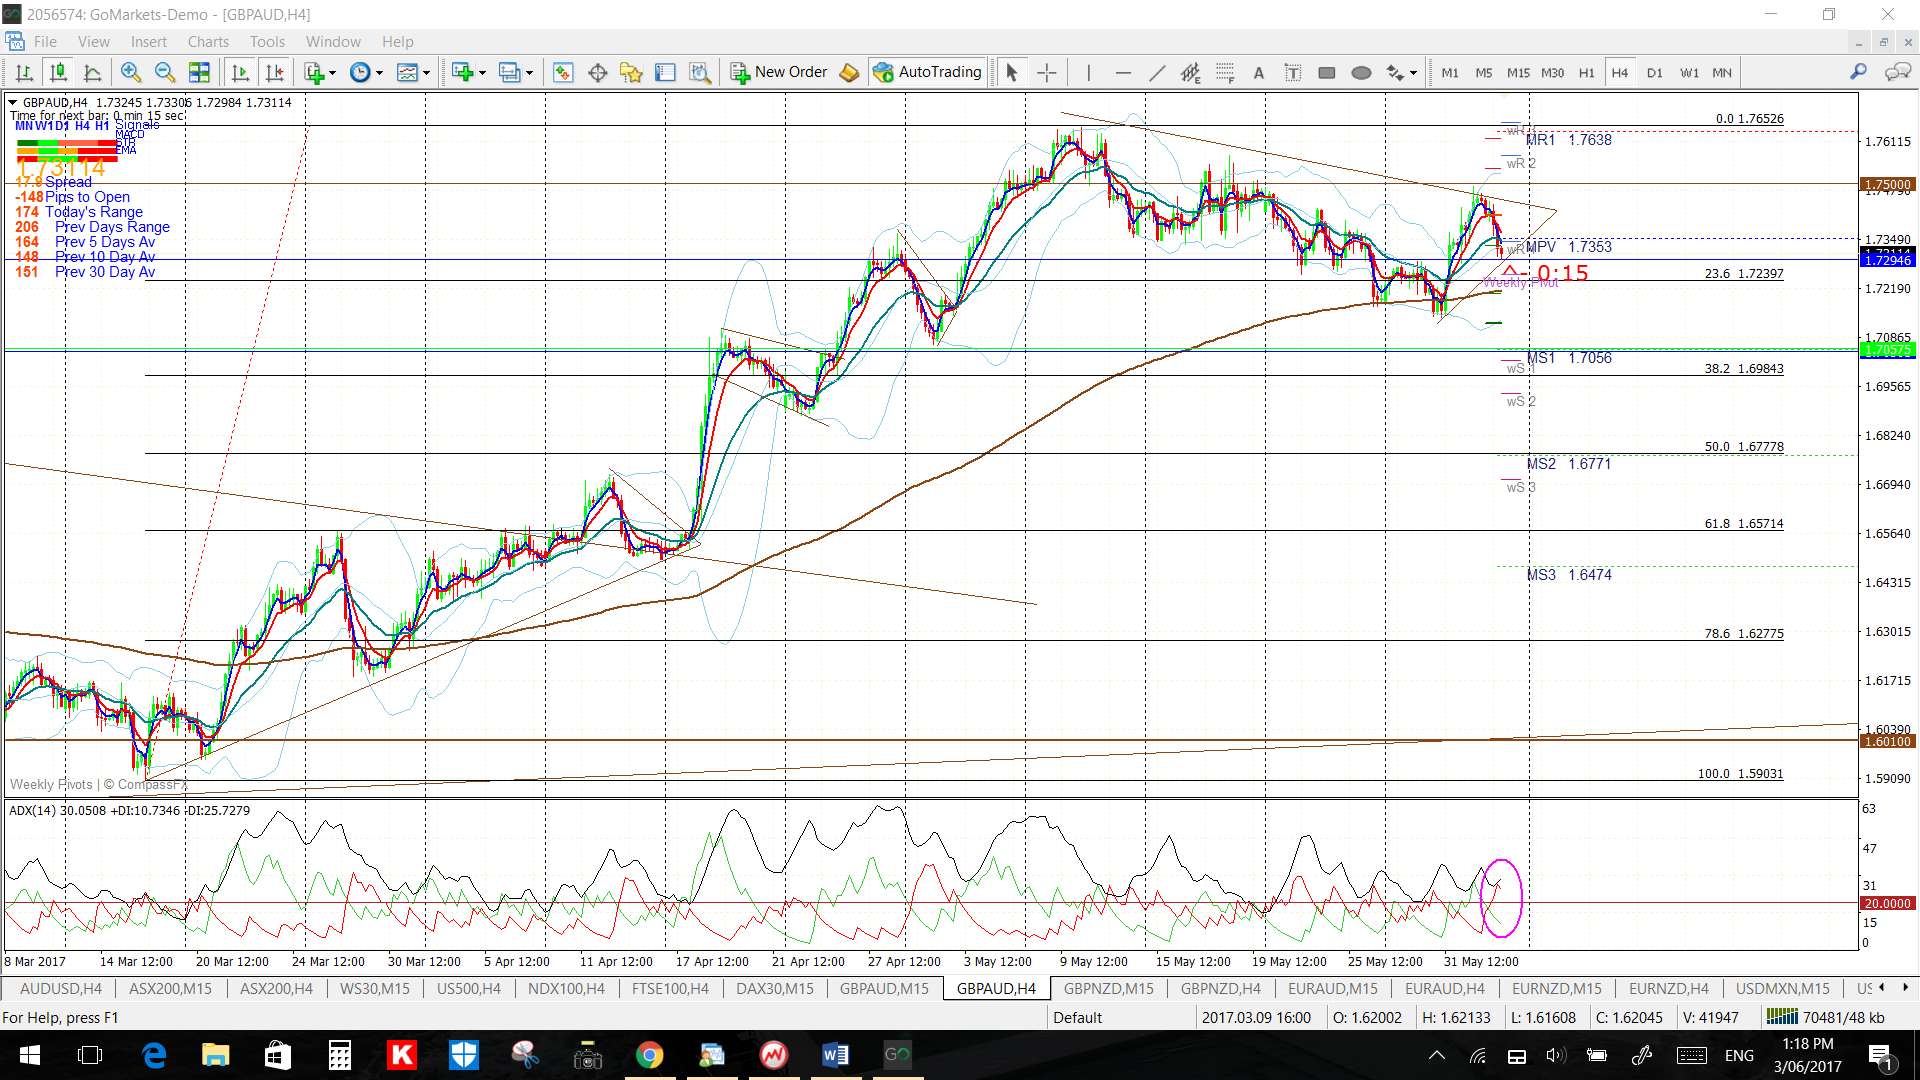
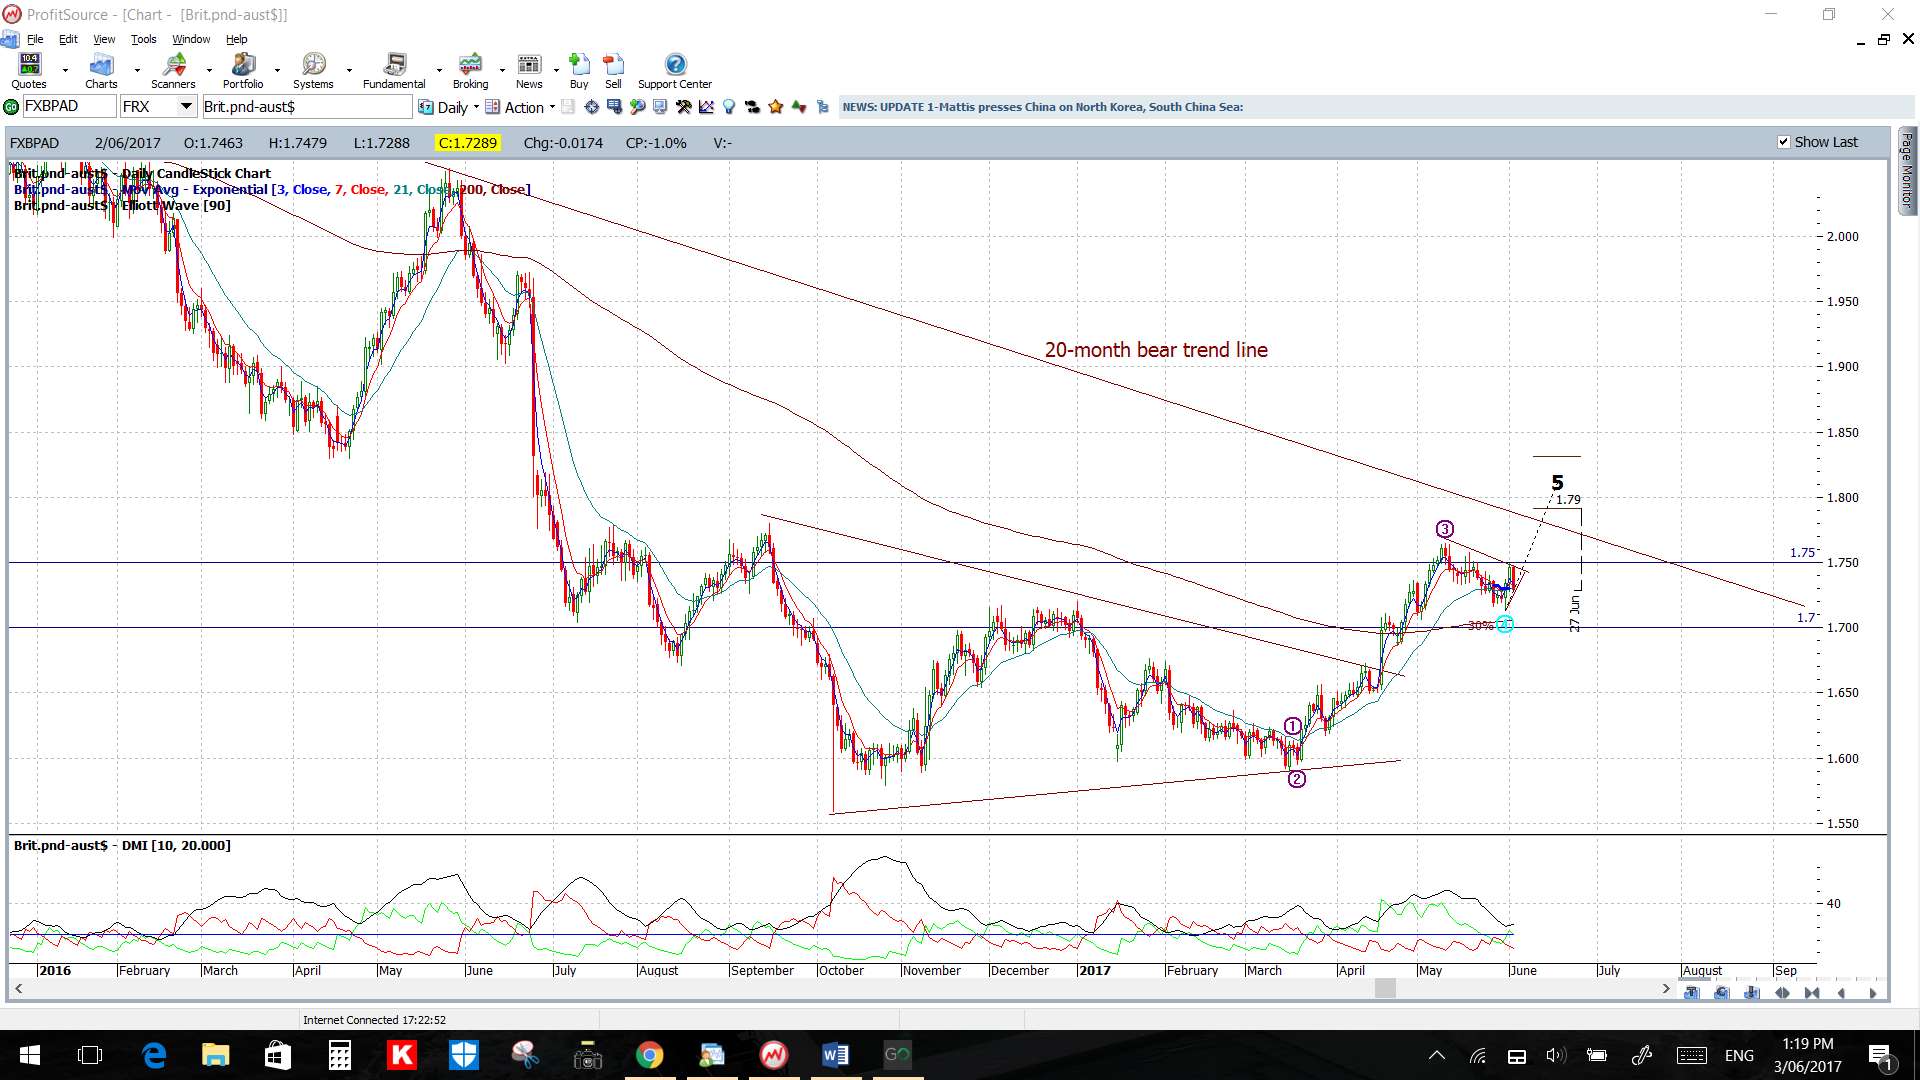
GBP/AUD: Watch the revised 4hr chart triangle for any breakout but take care in the days leading up to the UK election:
- Upper targets: The 1.75 level, then 1.80 as previous S/R, now some 700 pips away and, then, the 20-month bear trend line that is some 900+ pips away.
- Lower targets: any pullback would have me looking for a test of the 4hr chart’s 61.8% Fib near 1.65.
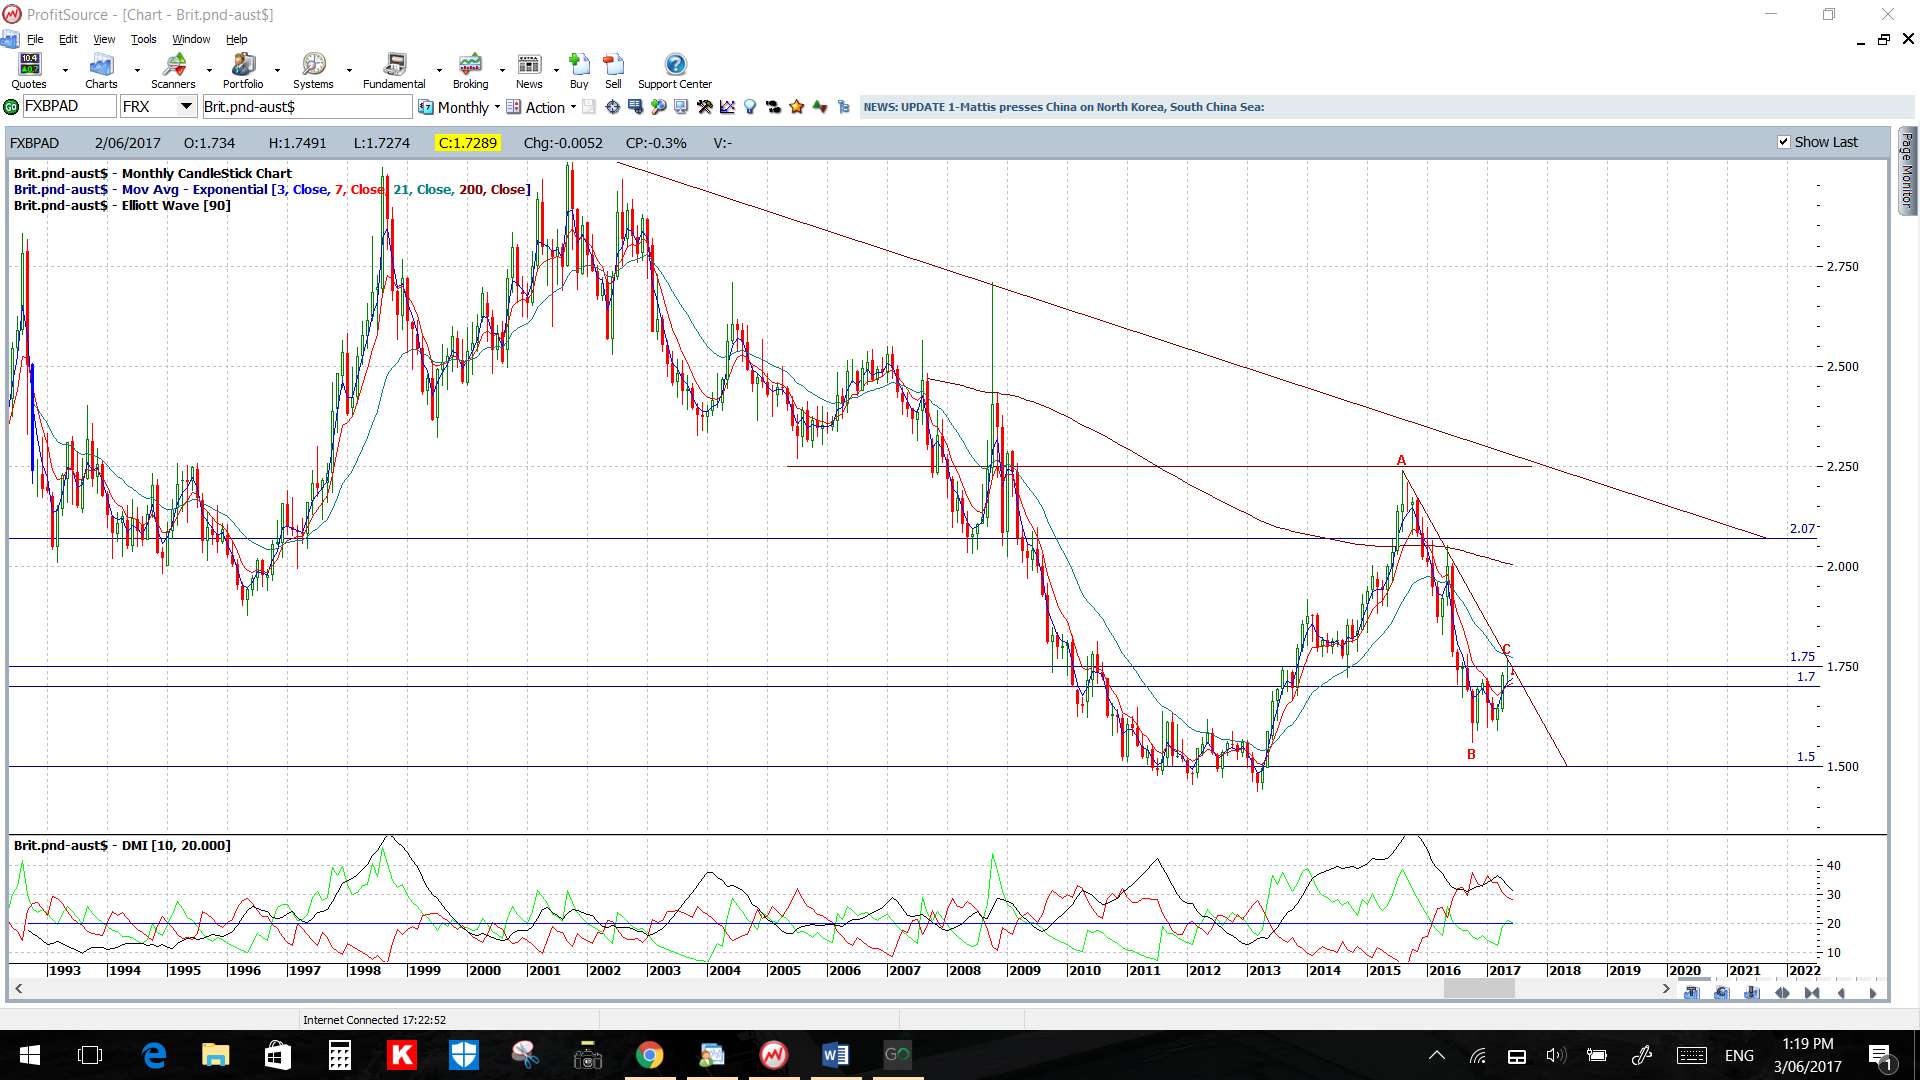
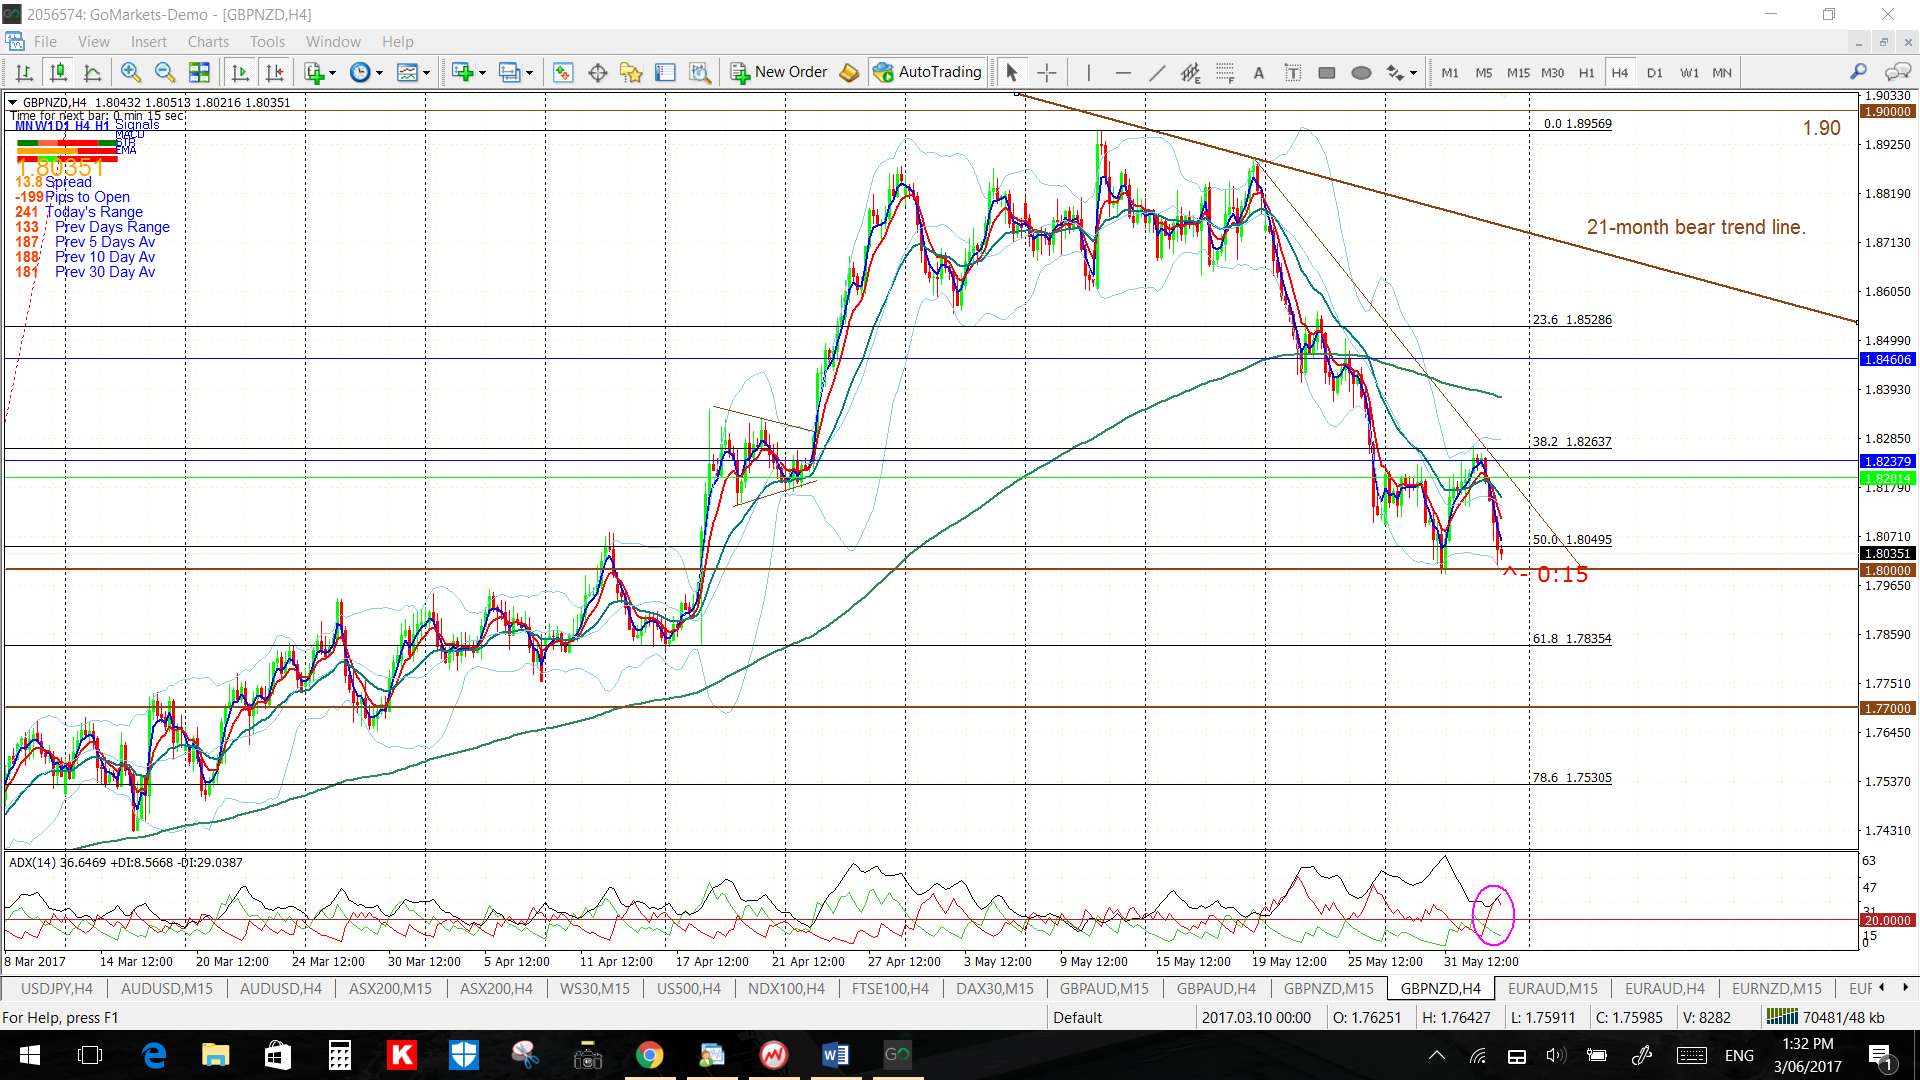
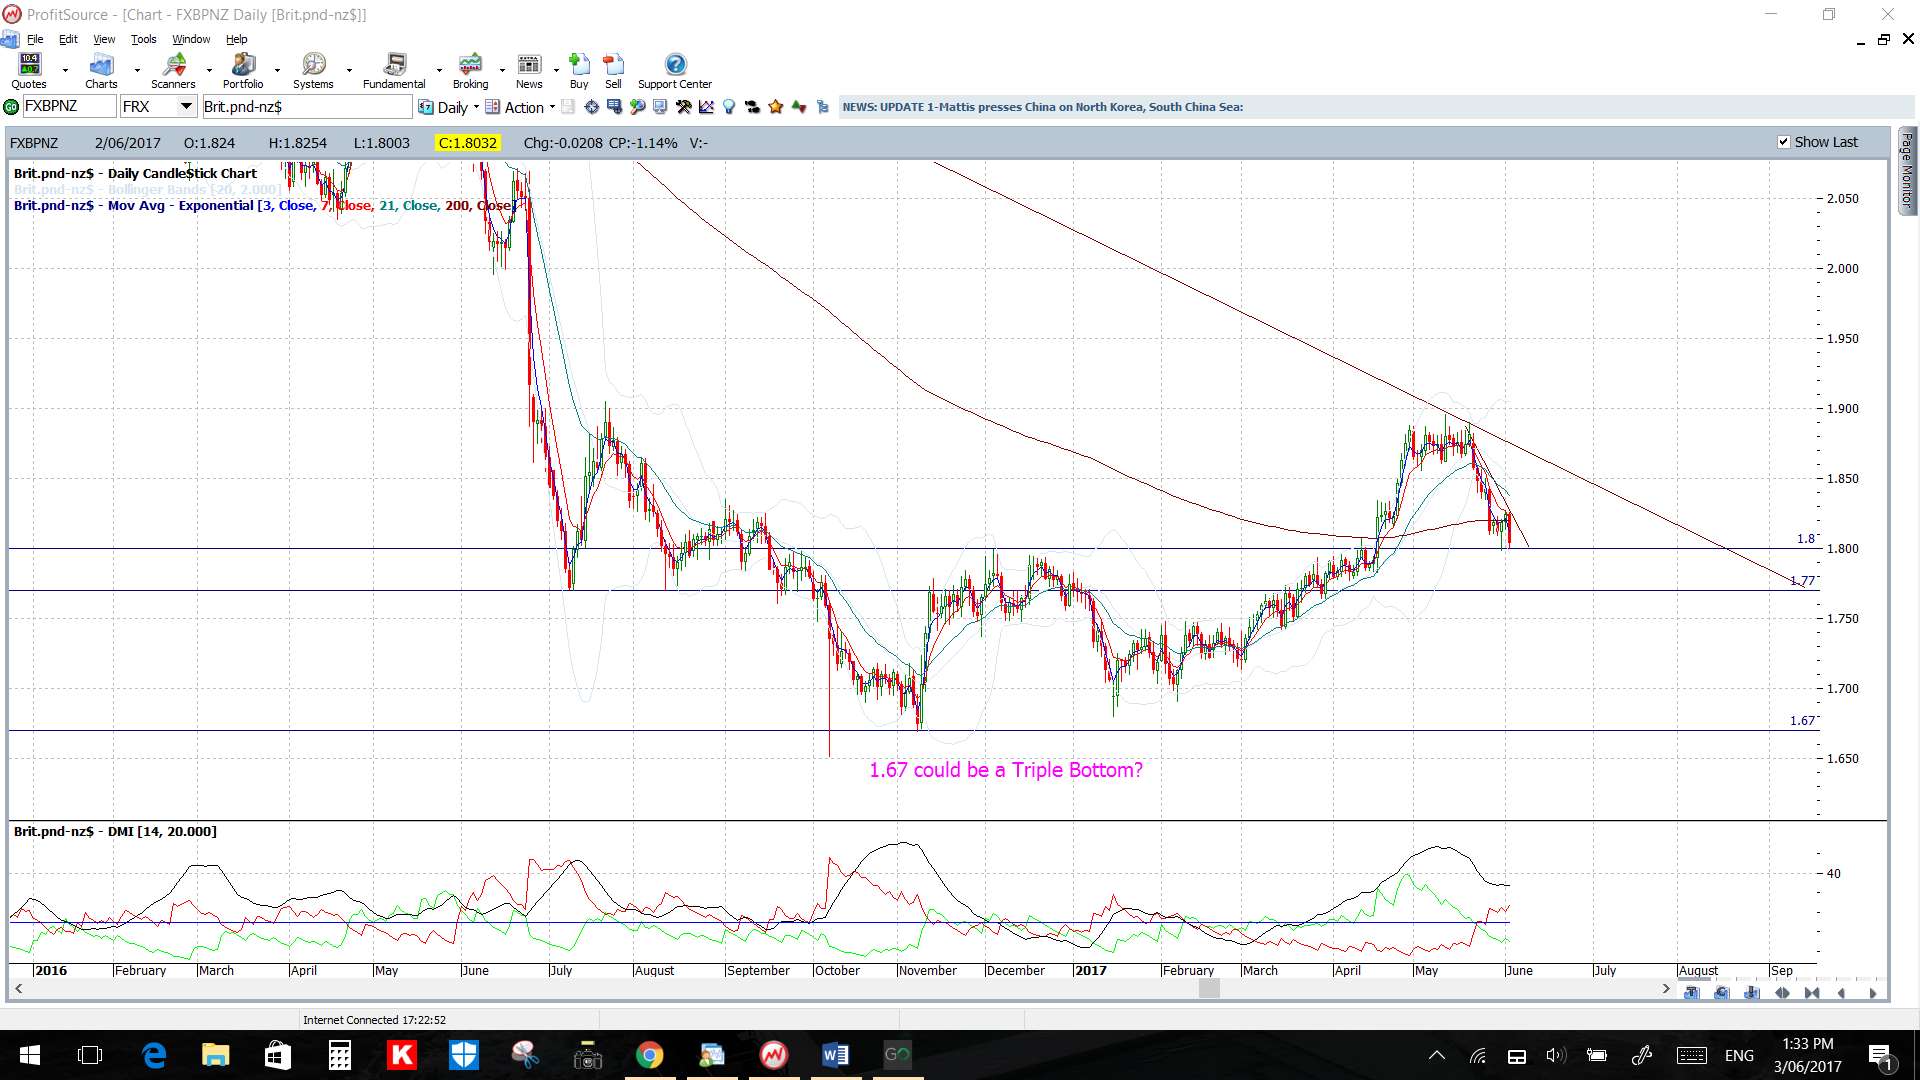
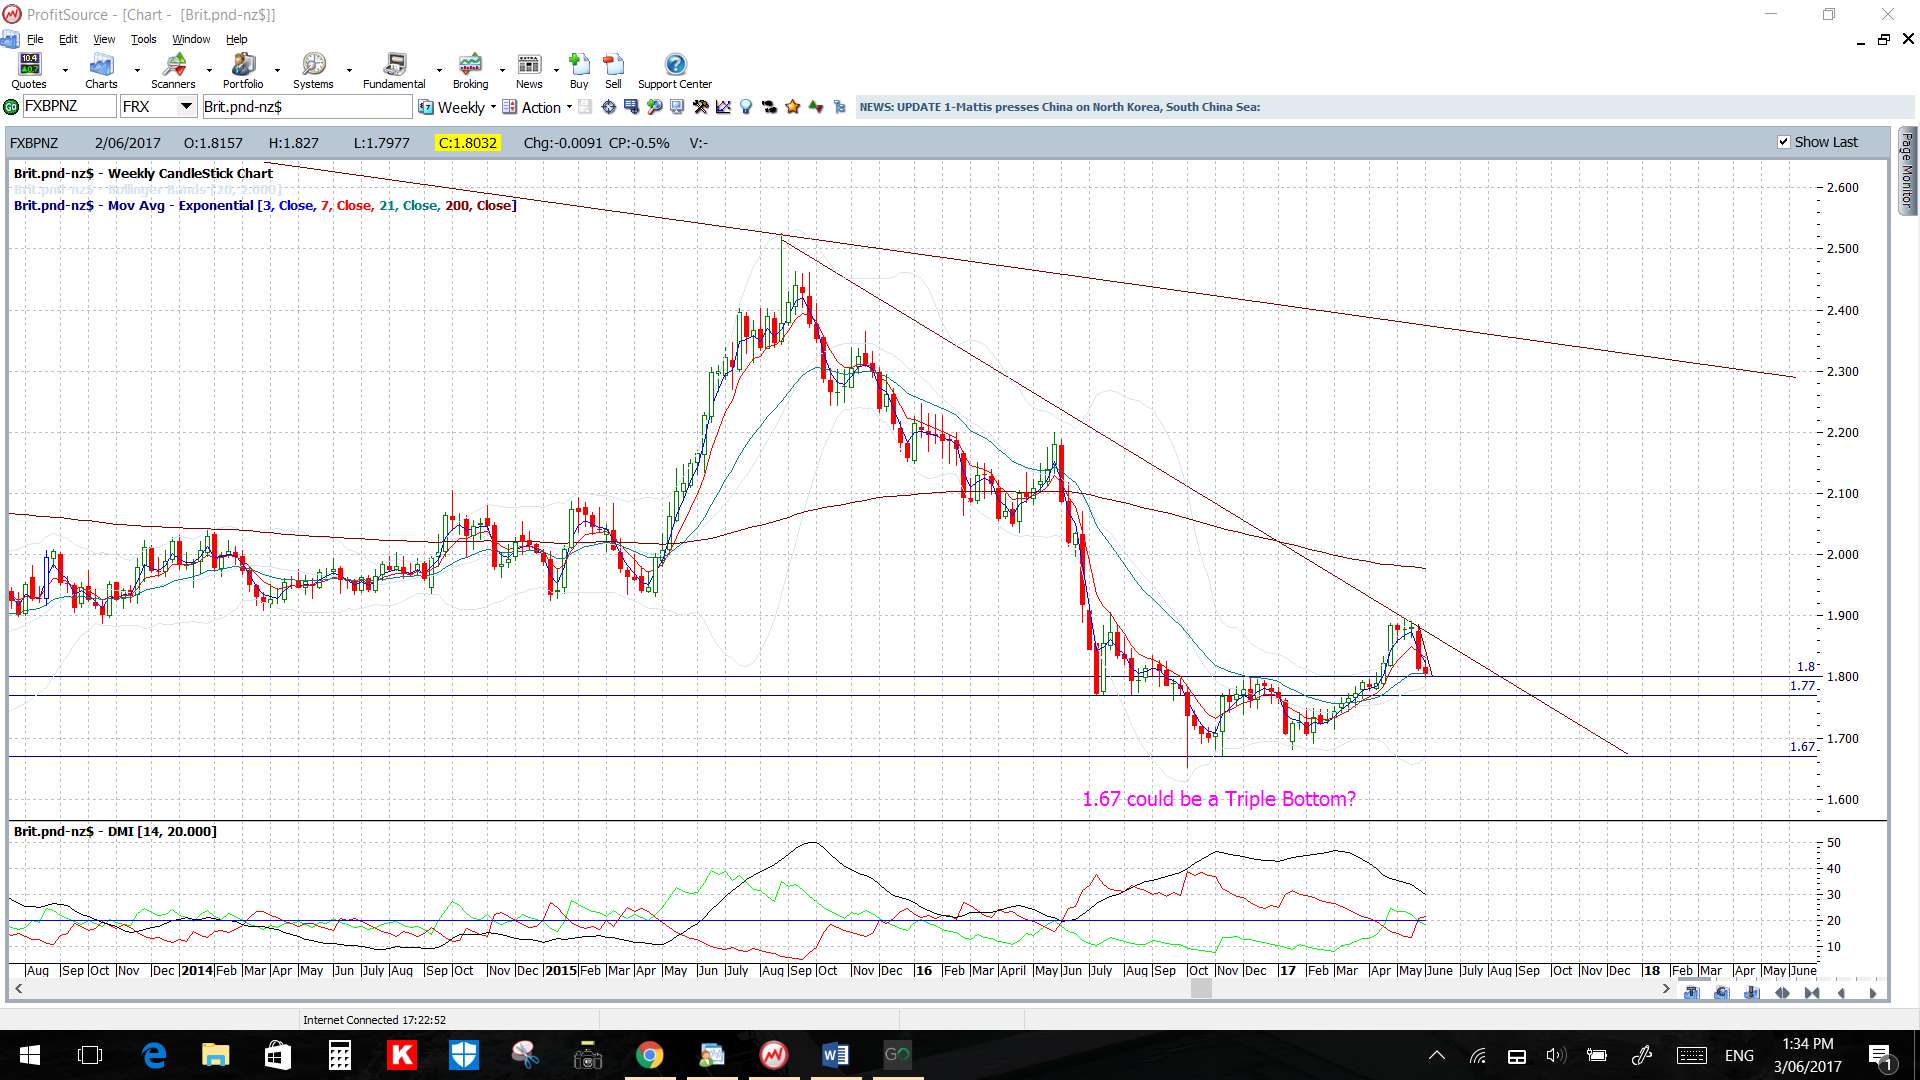
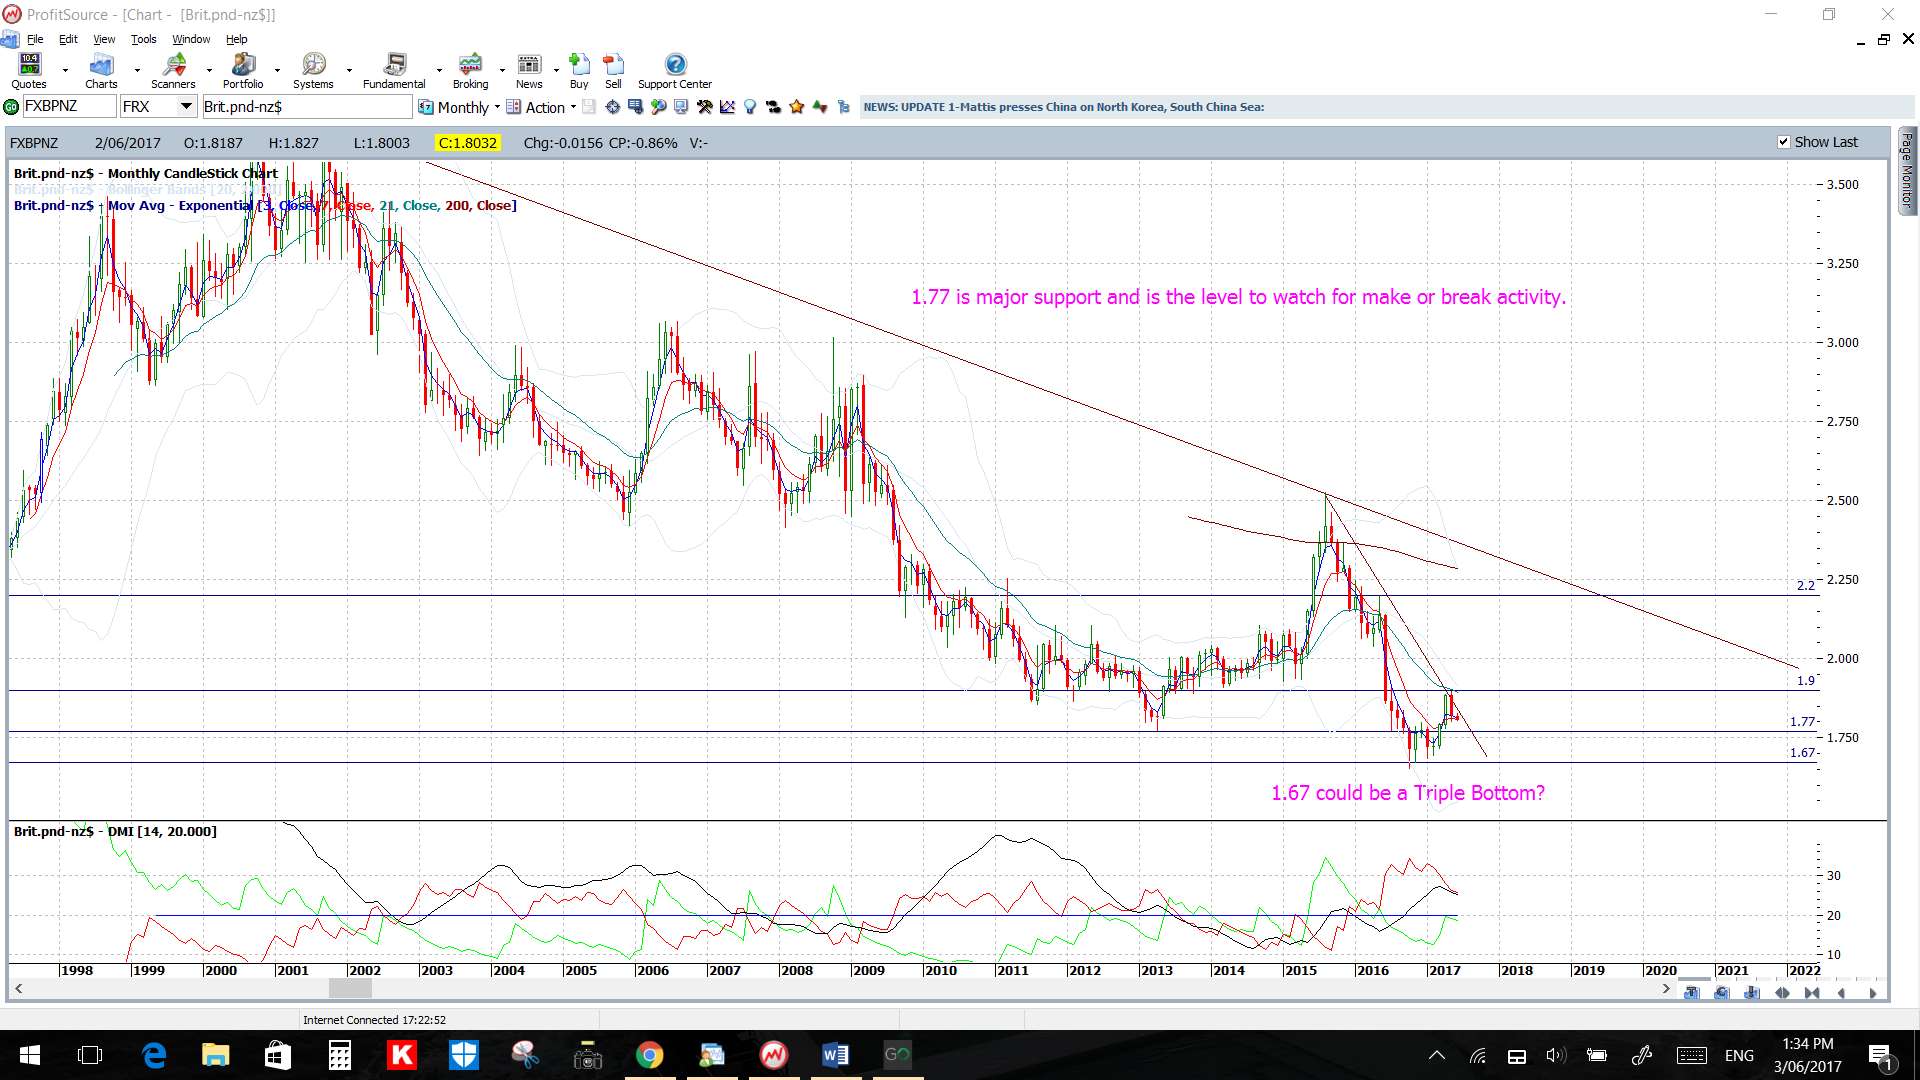
GBP/NZD: This pair also gave a great 100 pip trend line breakout trade after NFP. I have revised the monthly chart’s major bear trend line here though due to failed follow through. Watch the 4hr chart’s revised triangle trend lines for any new breakout and especially the 1.80 bottom level. Take care in the days leading up to the UK election:
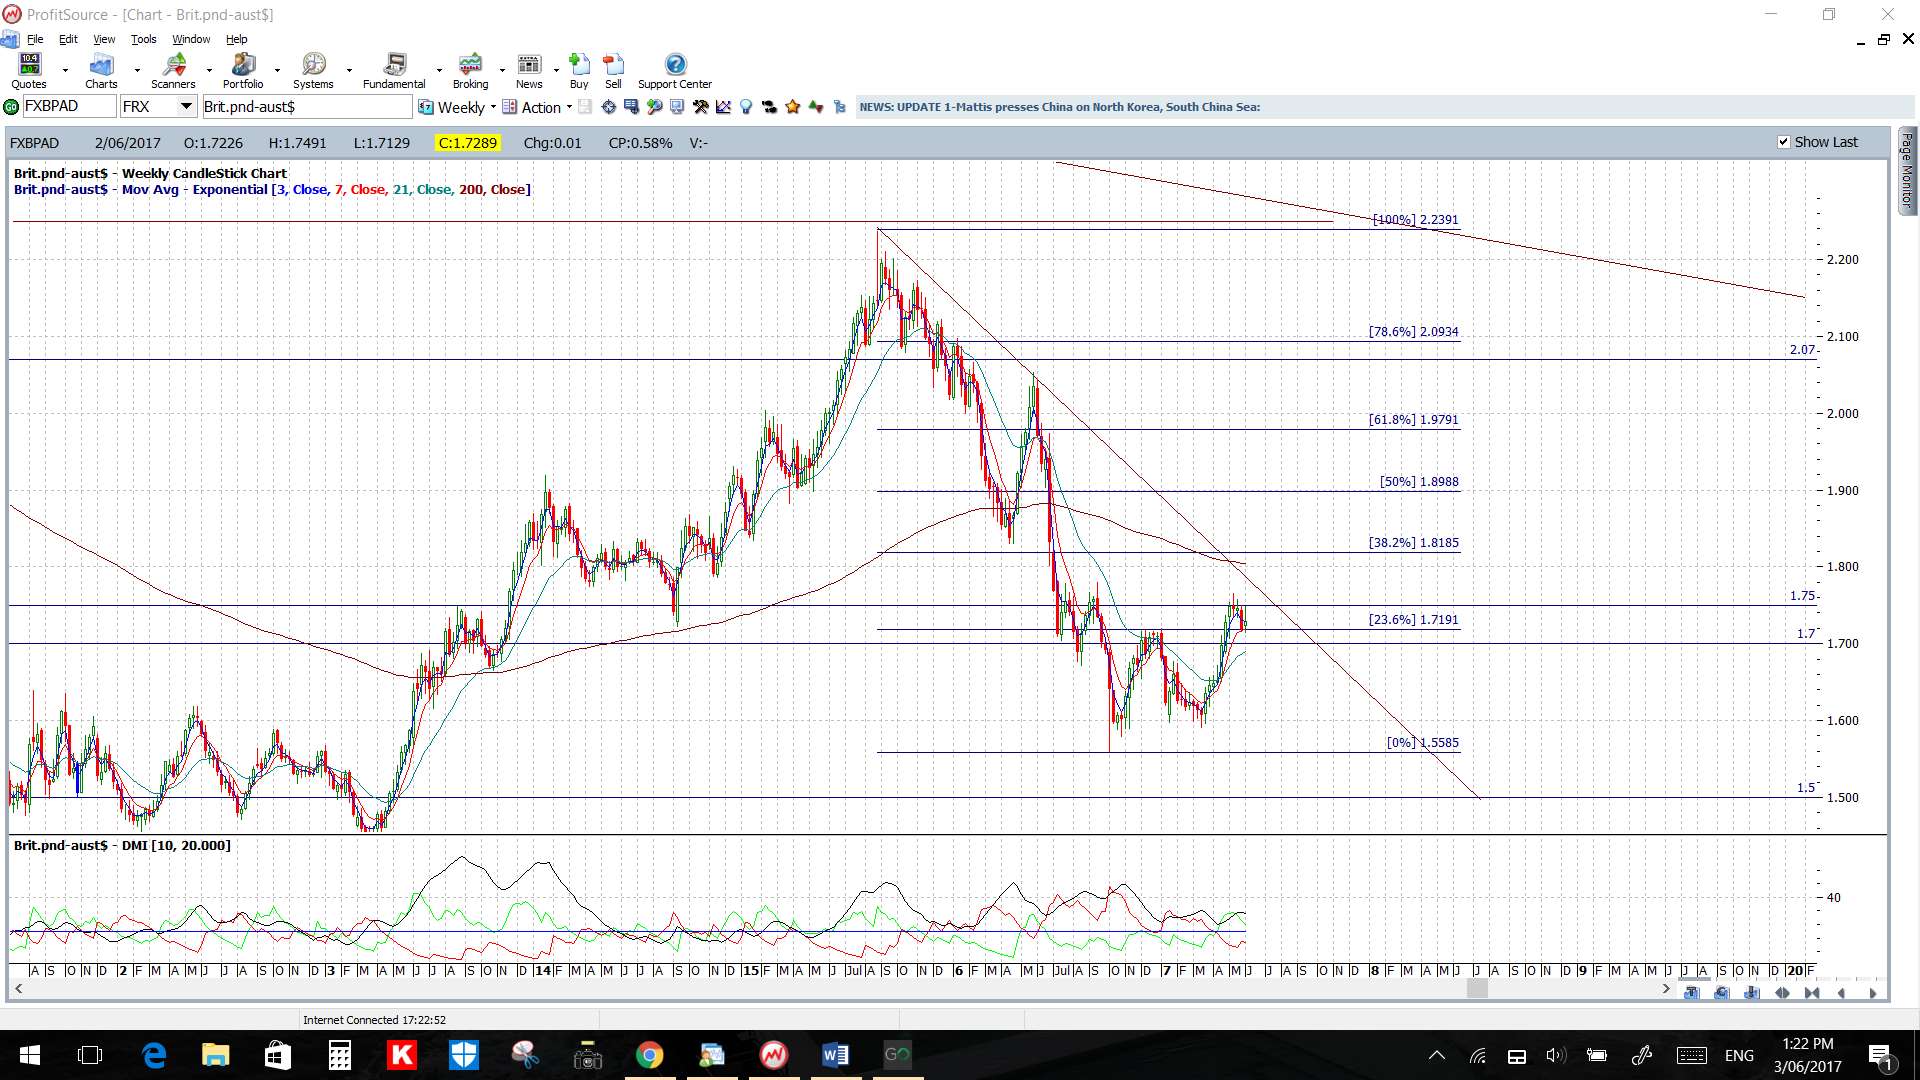
- Upper targets: The monthly charts revised monthly bear trend line, then the 1.90 as previous S/R and, after that, the weekly chart’s 61.8% Fib near 2.20 S/R.
- Lower targets: any deeper pullback would have me looking for a test of the 4hr chart’s 61.8% fib near 1.78 and then 1.77 S/R
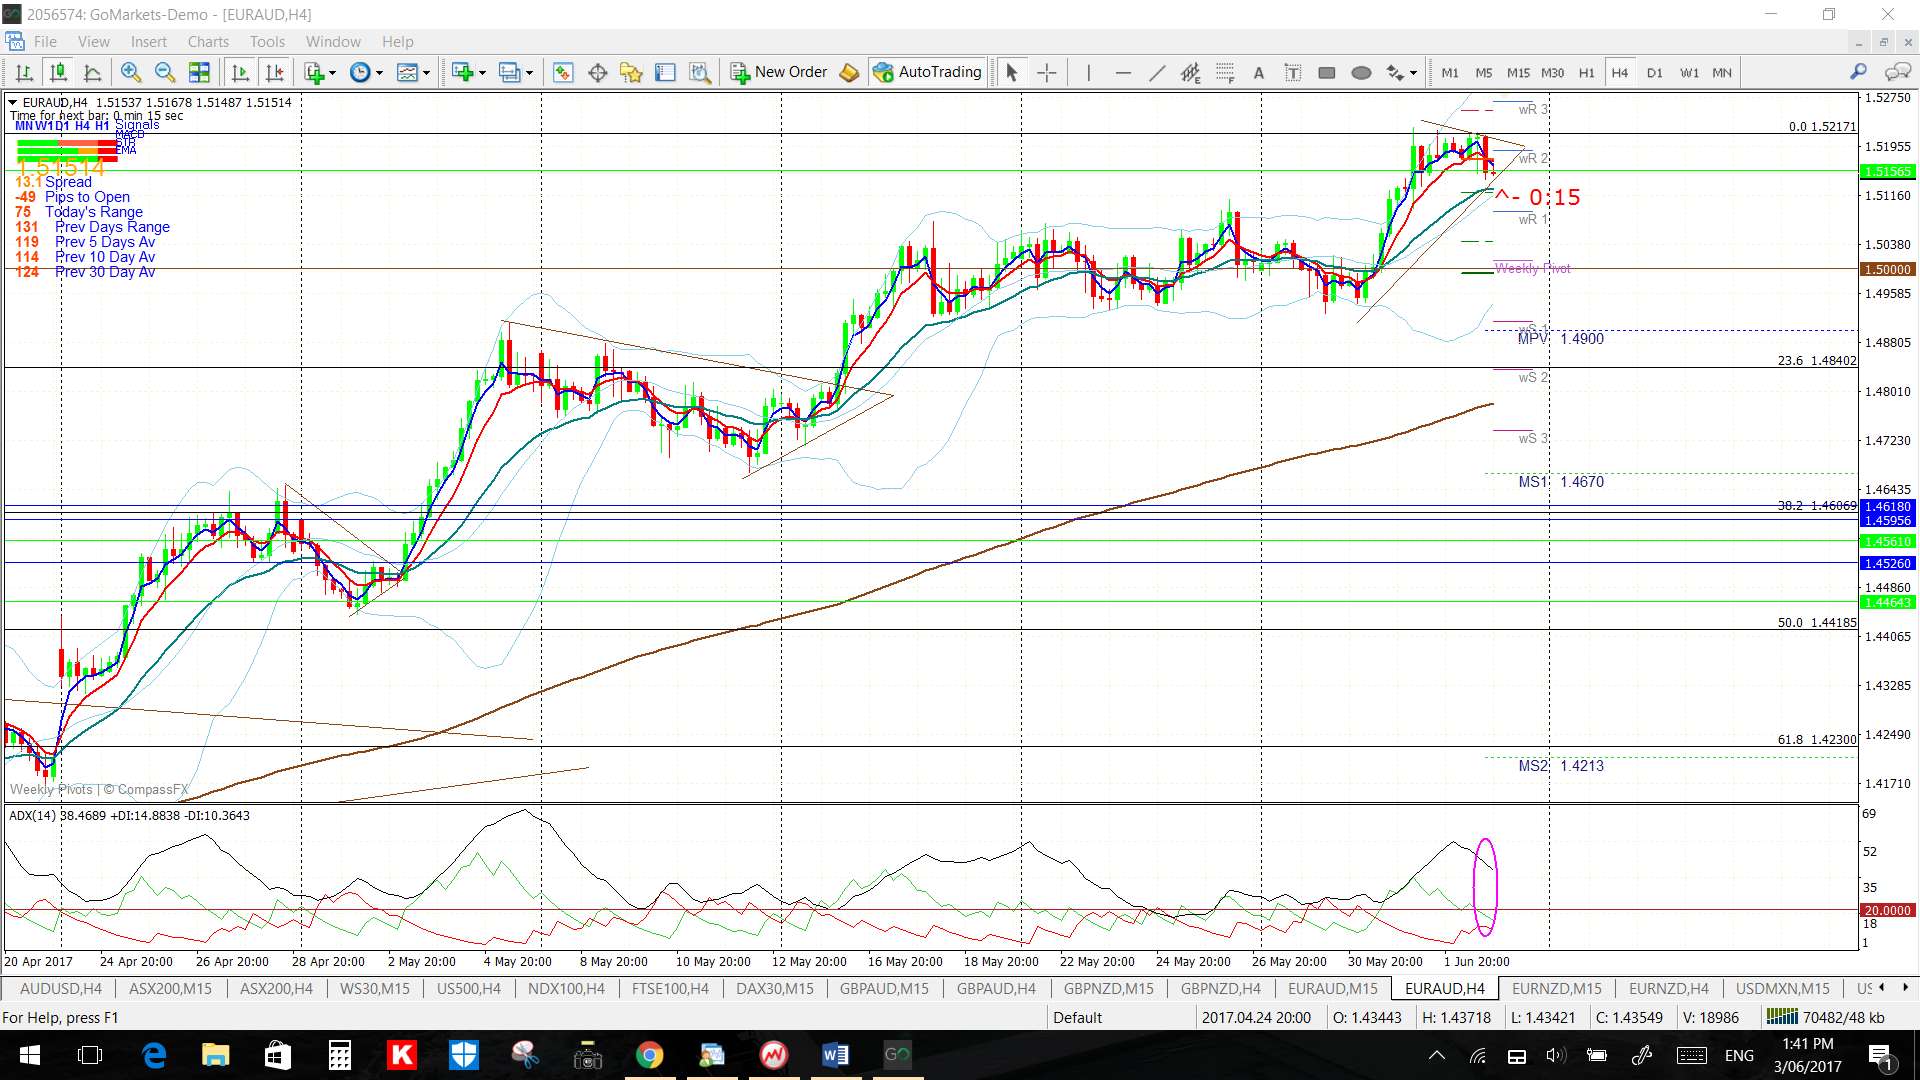
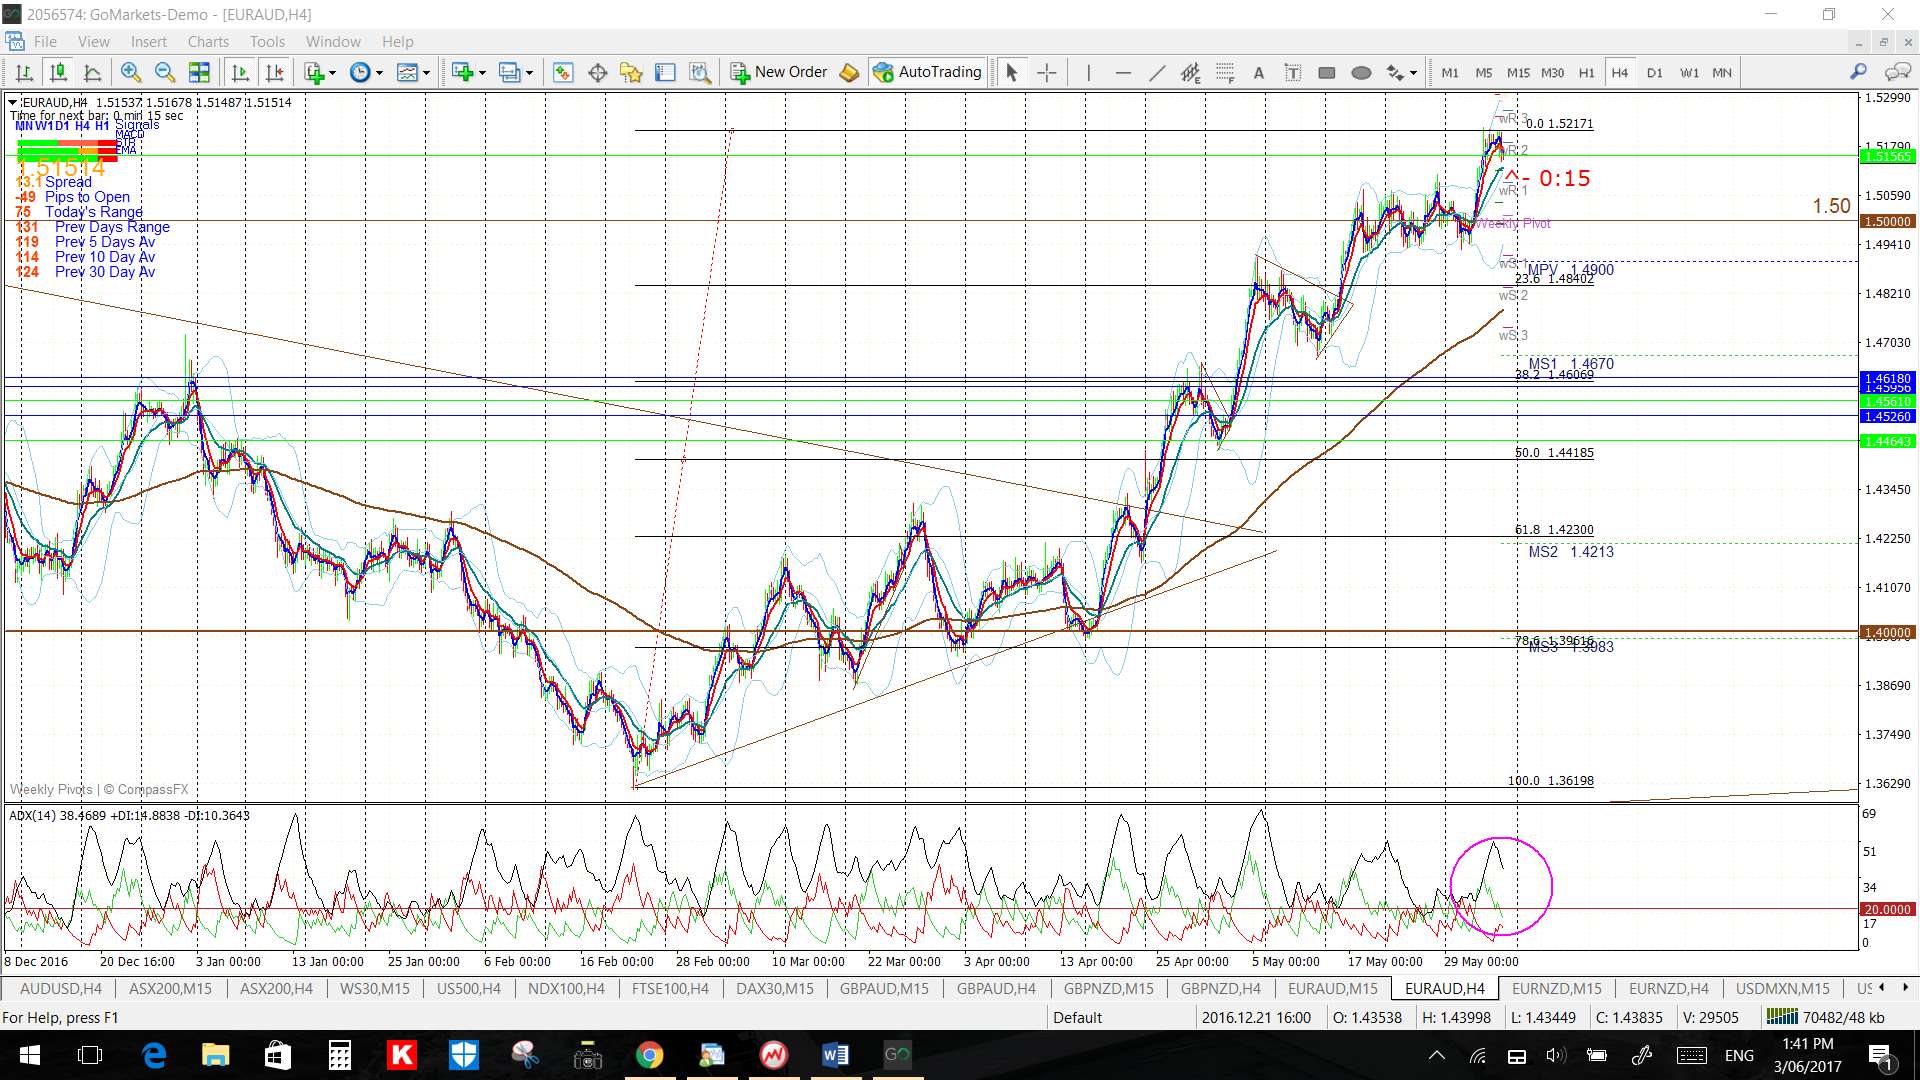
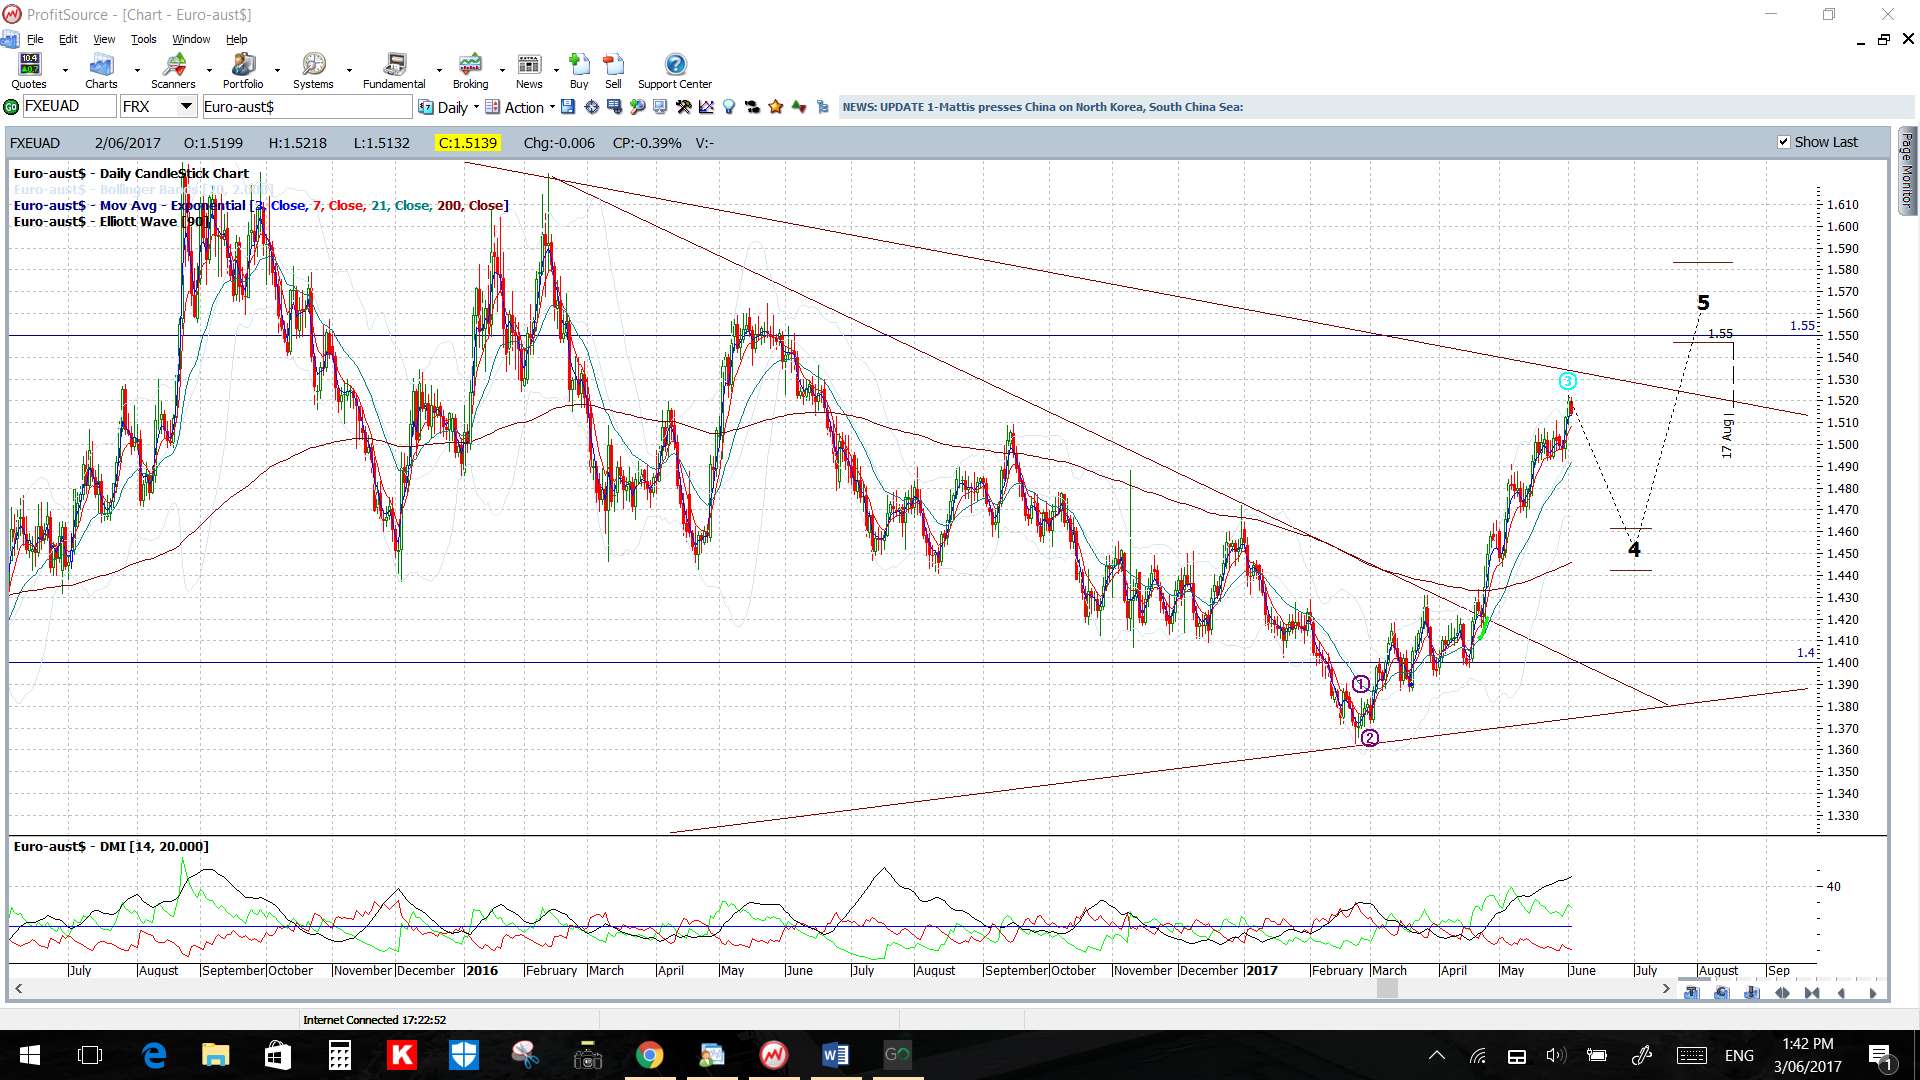
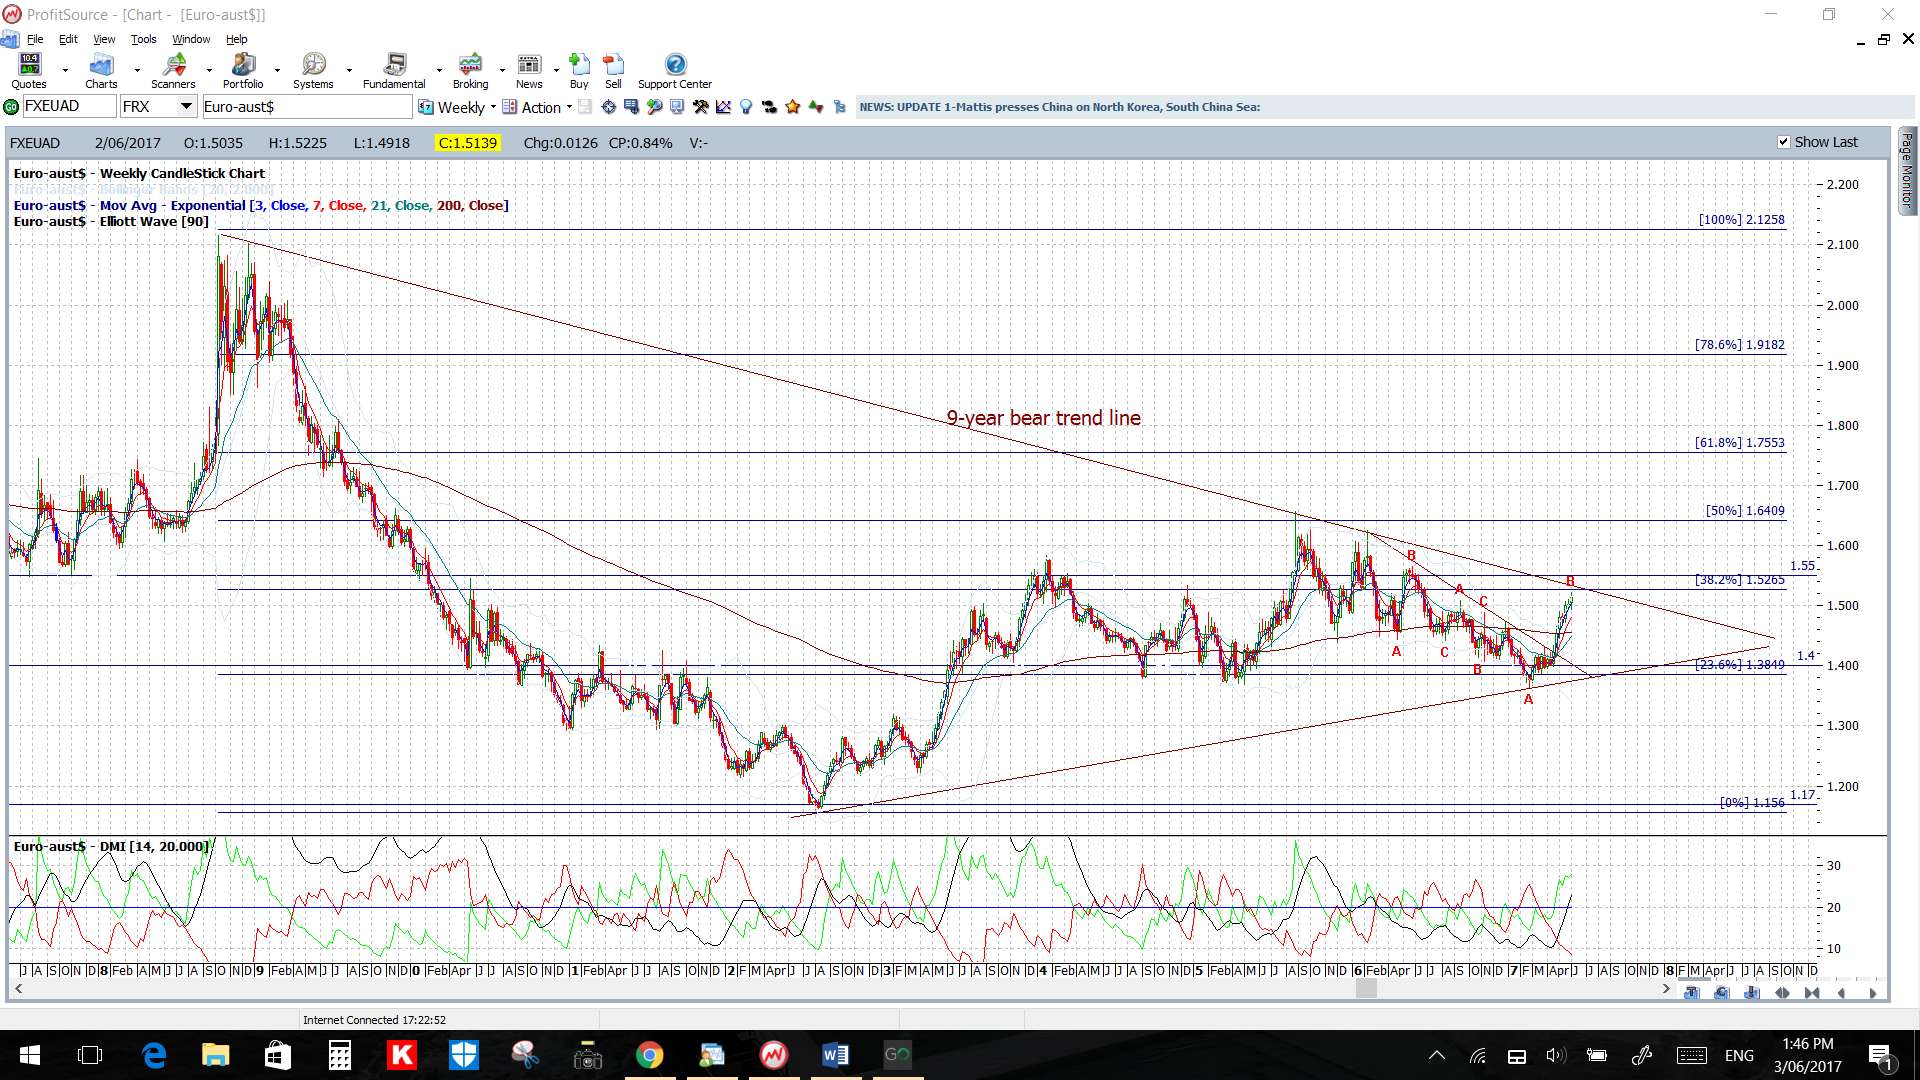
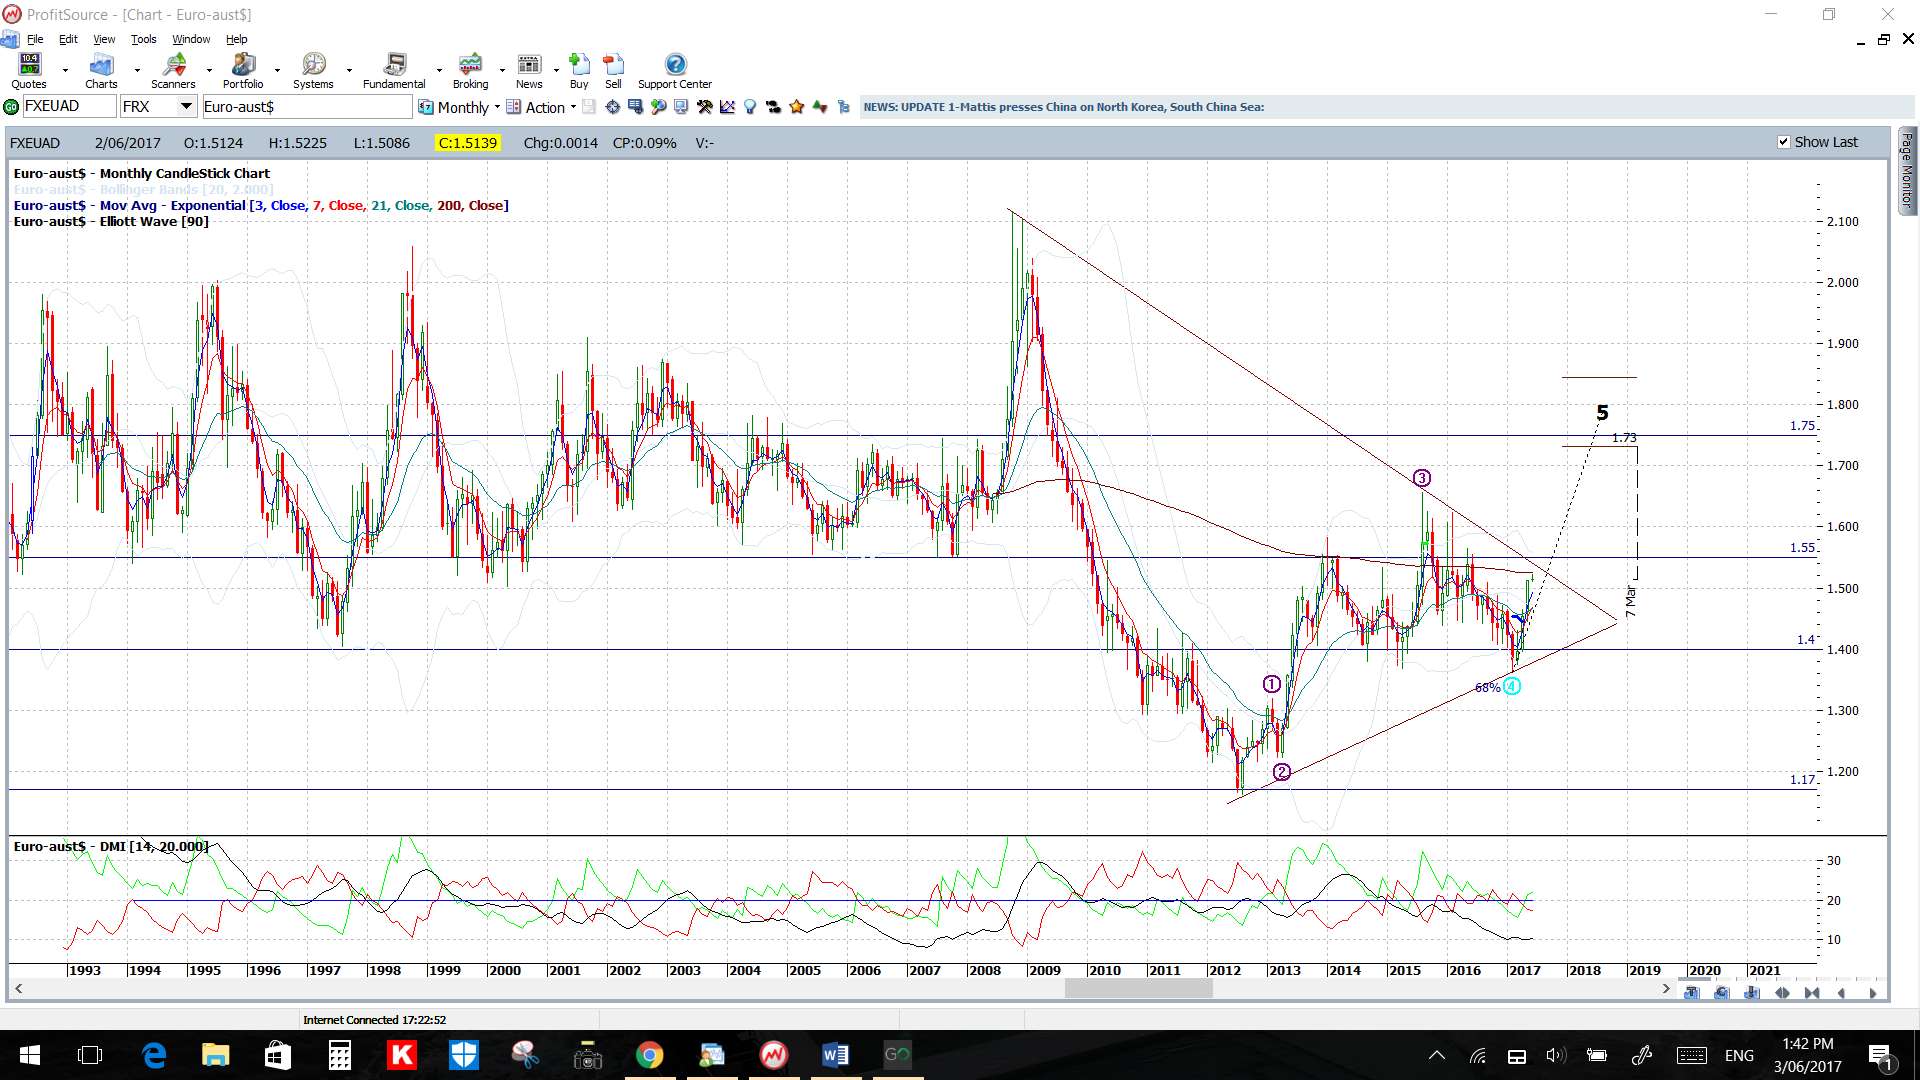
EUR/AUD: This pair seems to be slowing and becoming choppy as it nears the 9-year bear trend line. Watch the 4hr chart’s triangle trend lines for any breakout:
- Upper targets: this pair is heading towards a 9-year bear trend line and this is just below the previous S/R level of 1.55. Note this is still about 350 pips away and so worth stalking!
- Lower targets: any pullback would have me looking for a test of 1.50 S/R and, after that, the 4hr chart’s 50% Fib near 1.44.
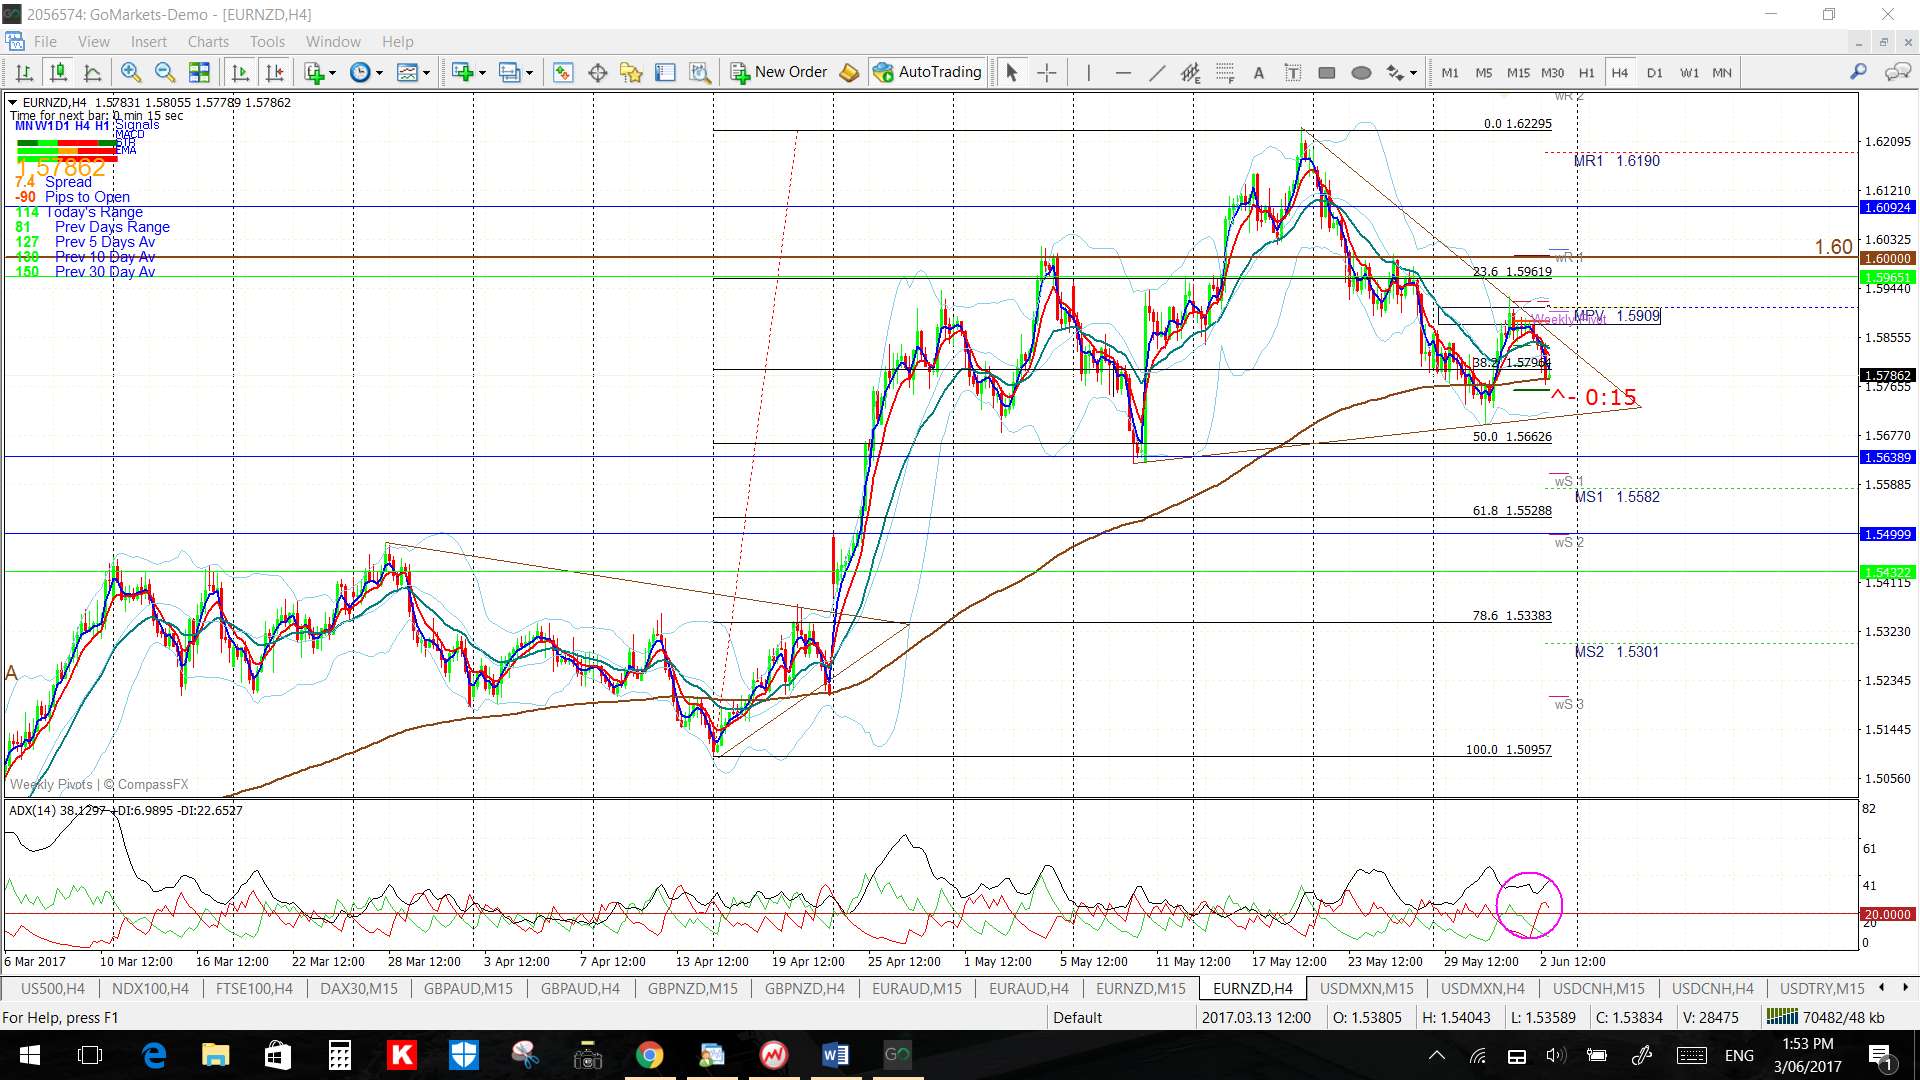
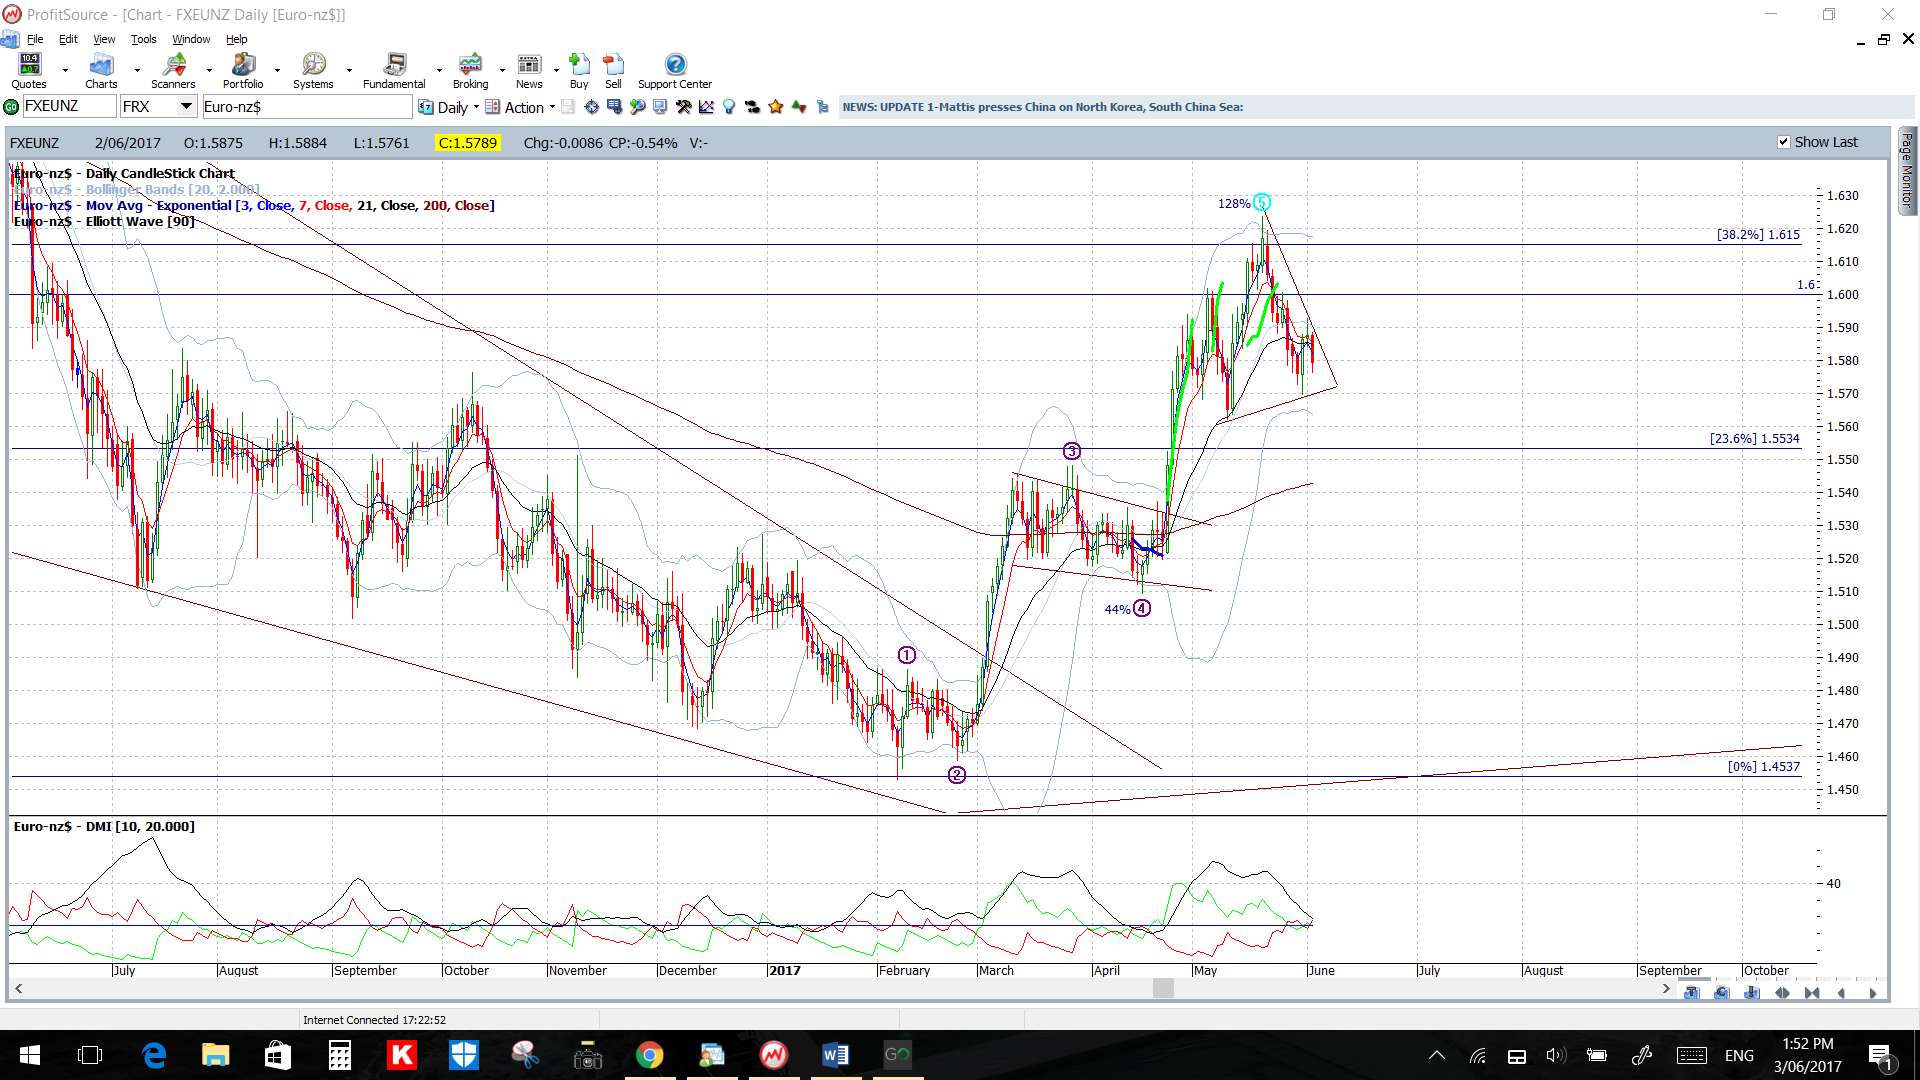
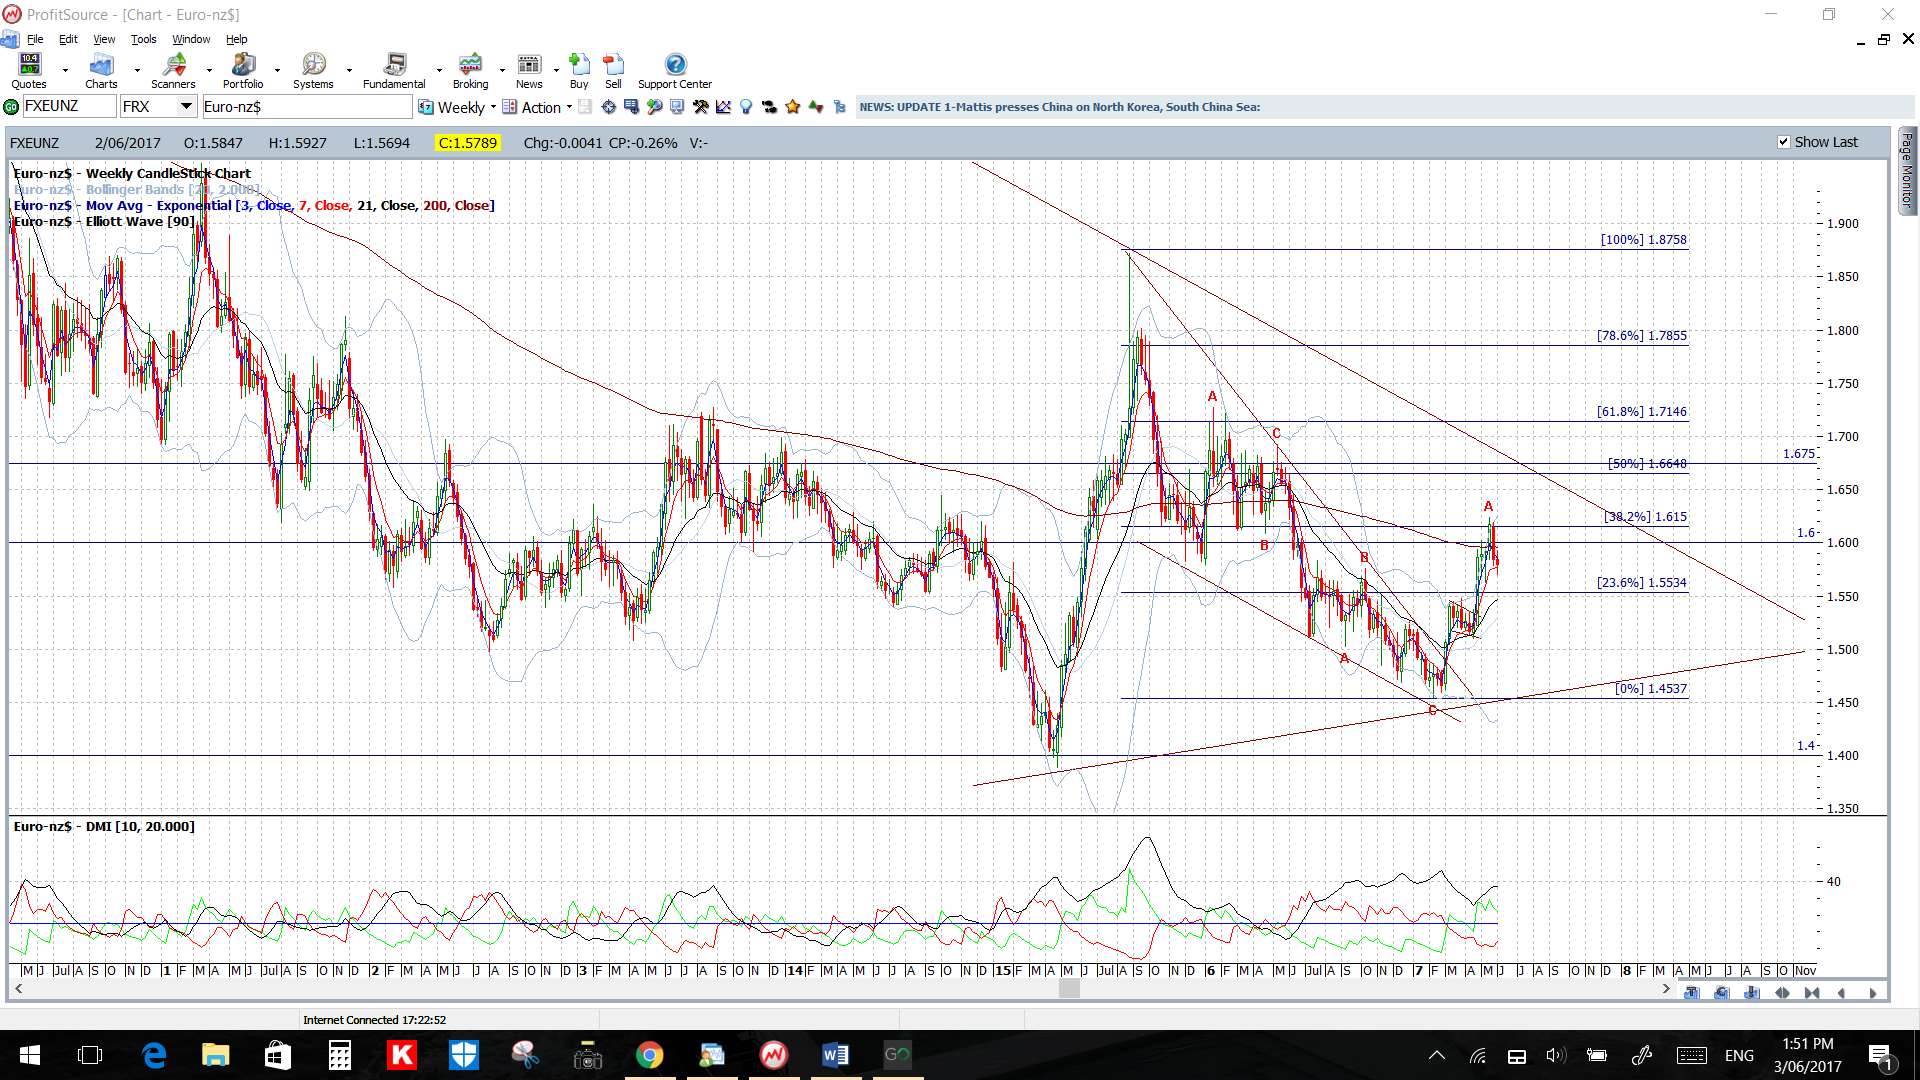
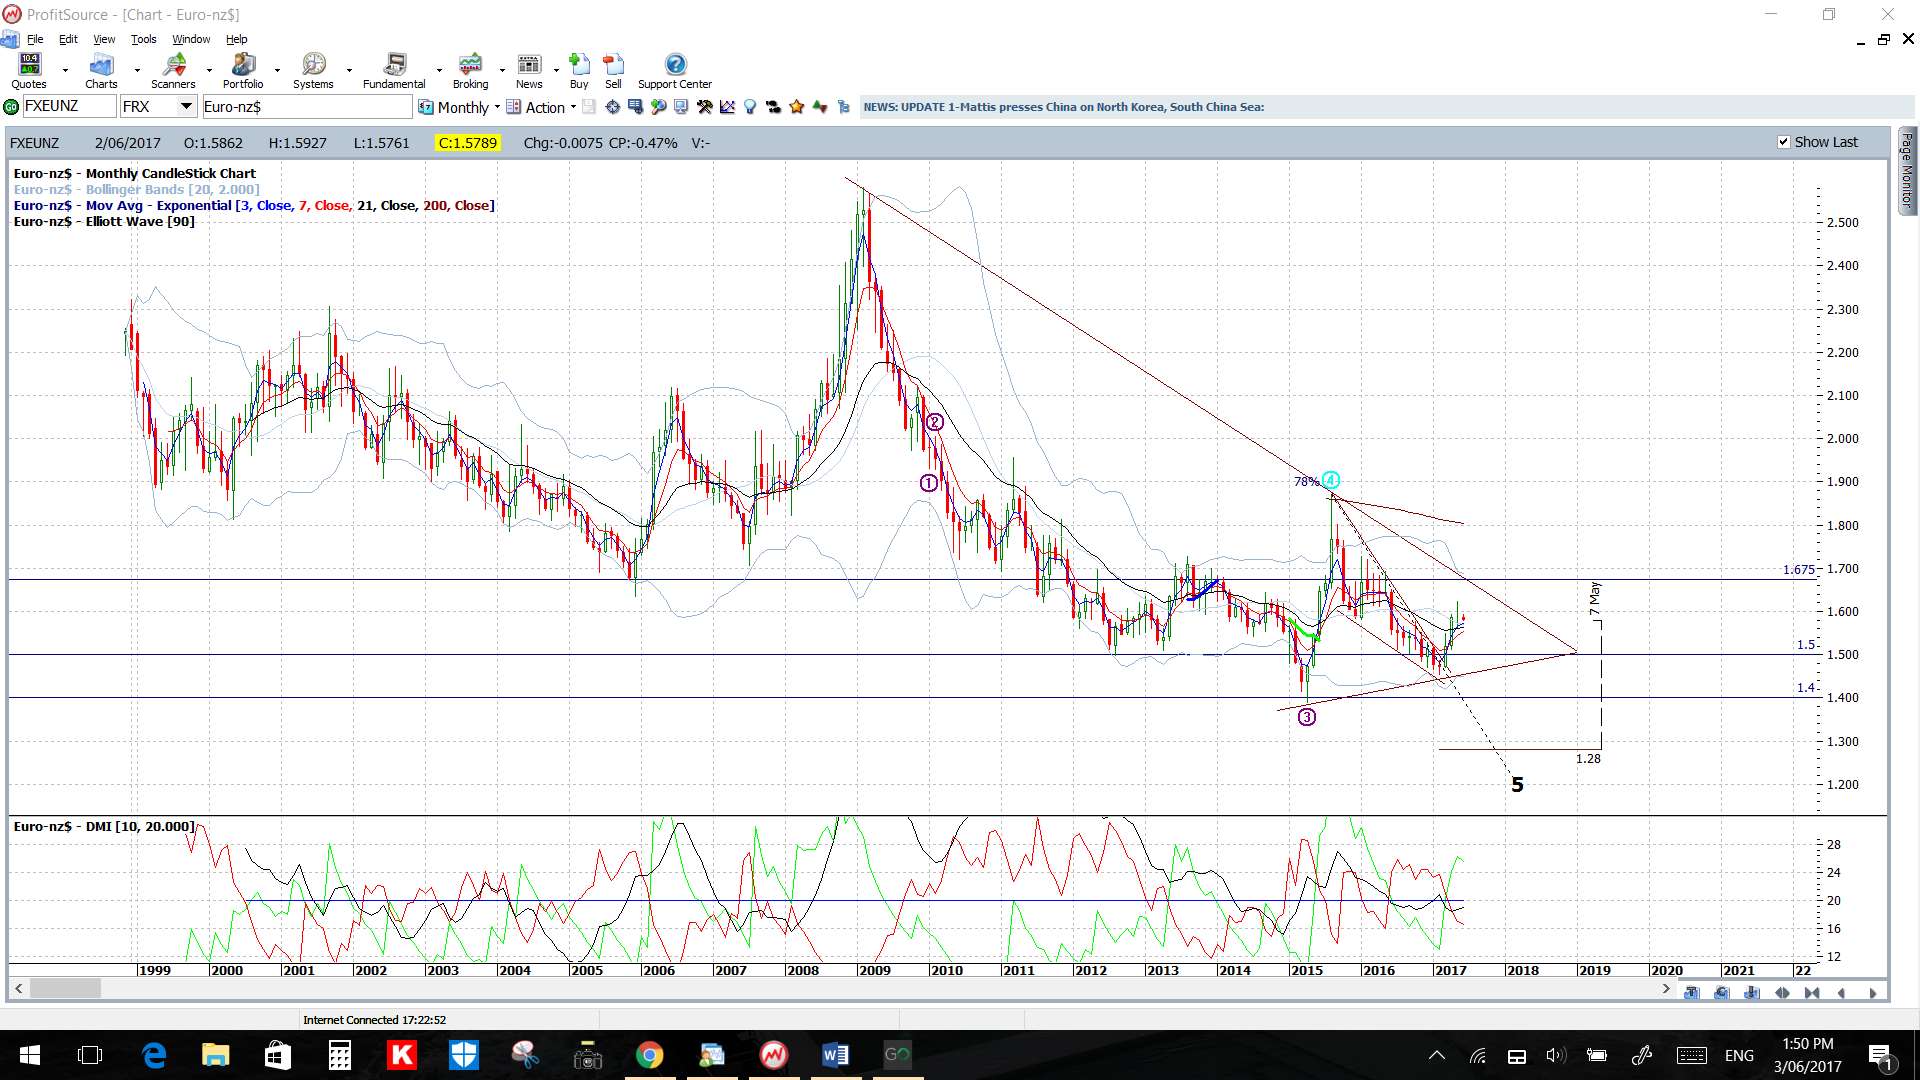
EUR/NZD: Watch the 4hr chart’s revised triangle trend lines for any breakout:
- Upper targets: The key 1.60 and then the 1.675 S/R region, which is about 900+ pips above current price and, then, there is the 9-year bear trend line.
- Lower targets: any continued pullback would have me looking for a test of the 4hr chart’s 61.8% Fib near 1.55.
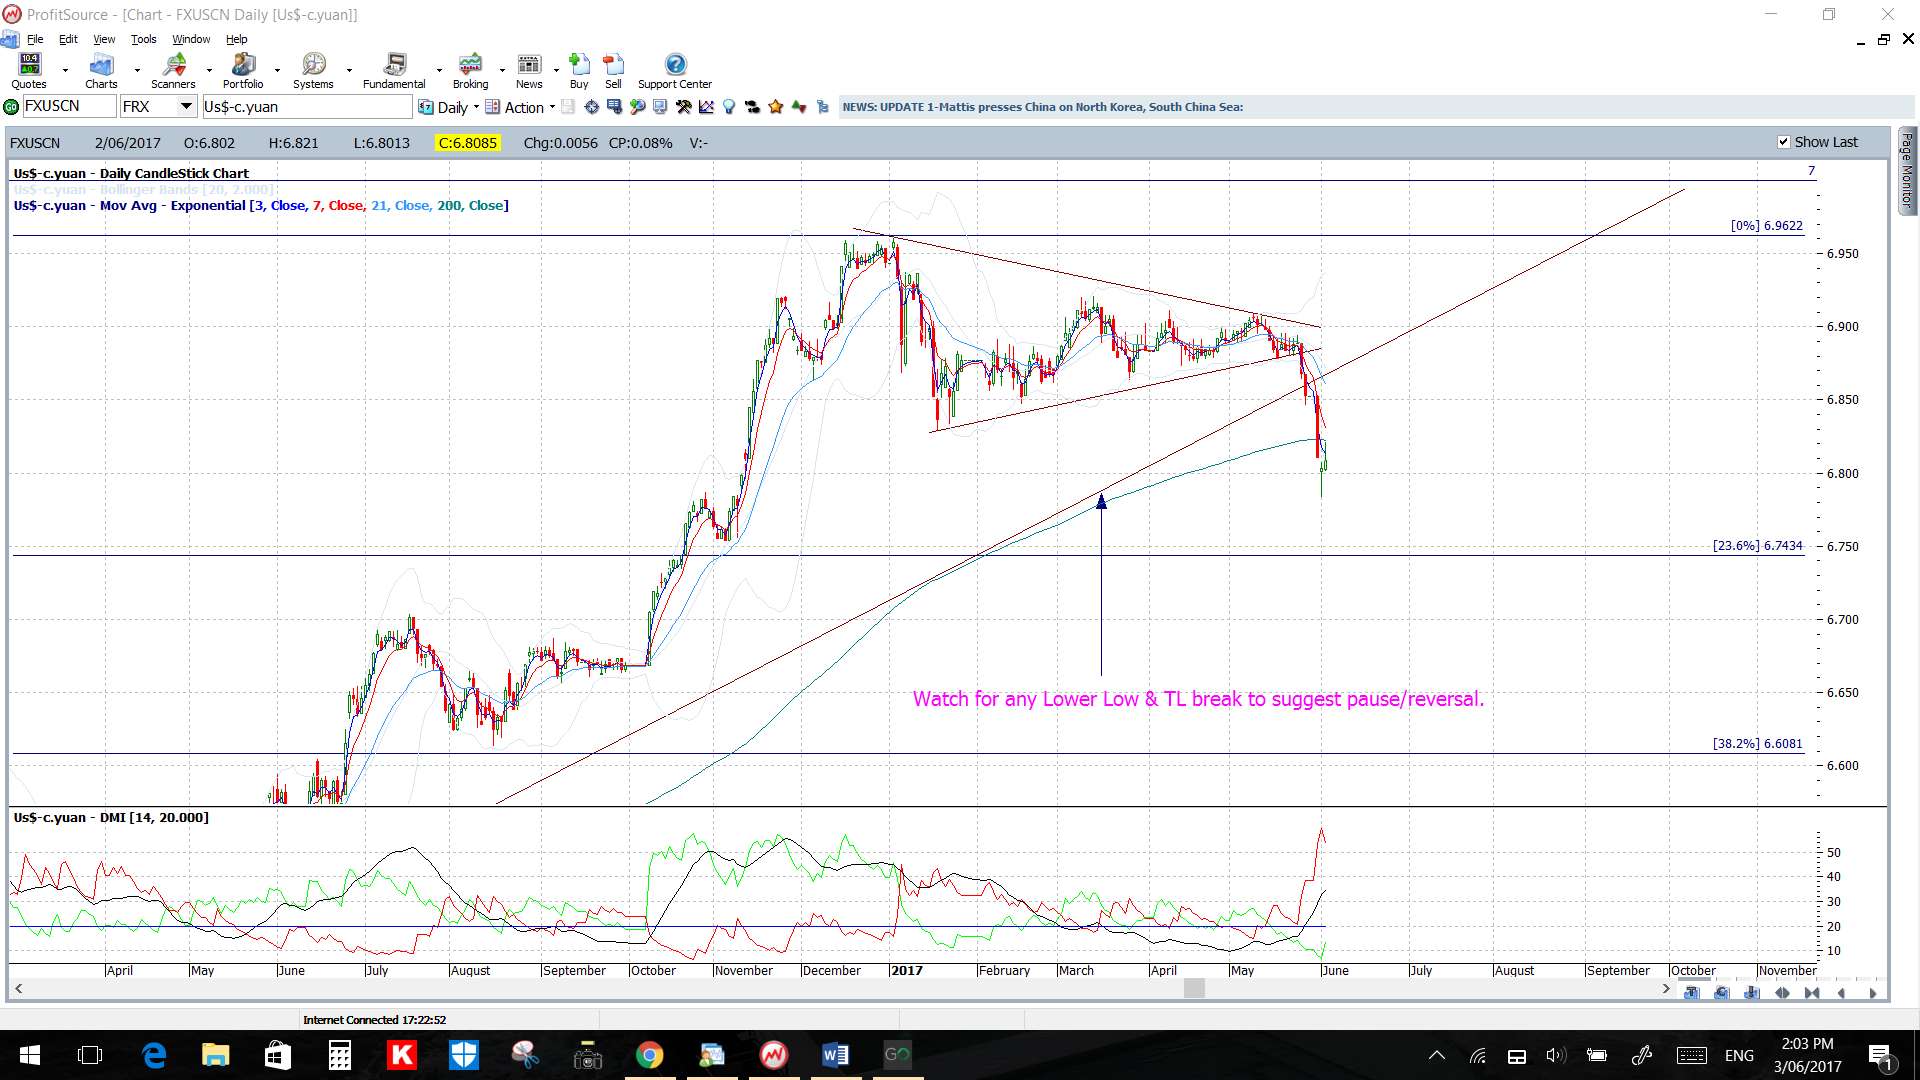
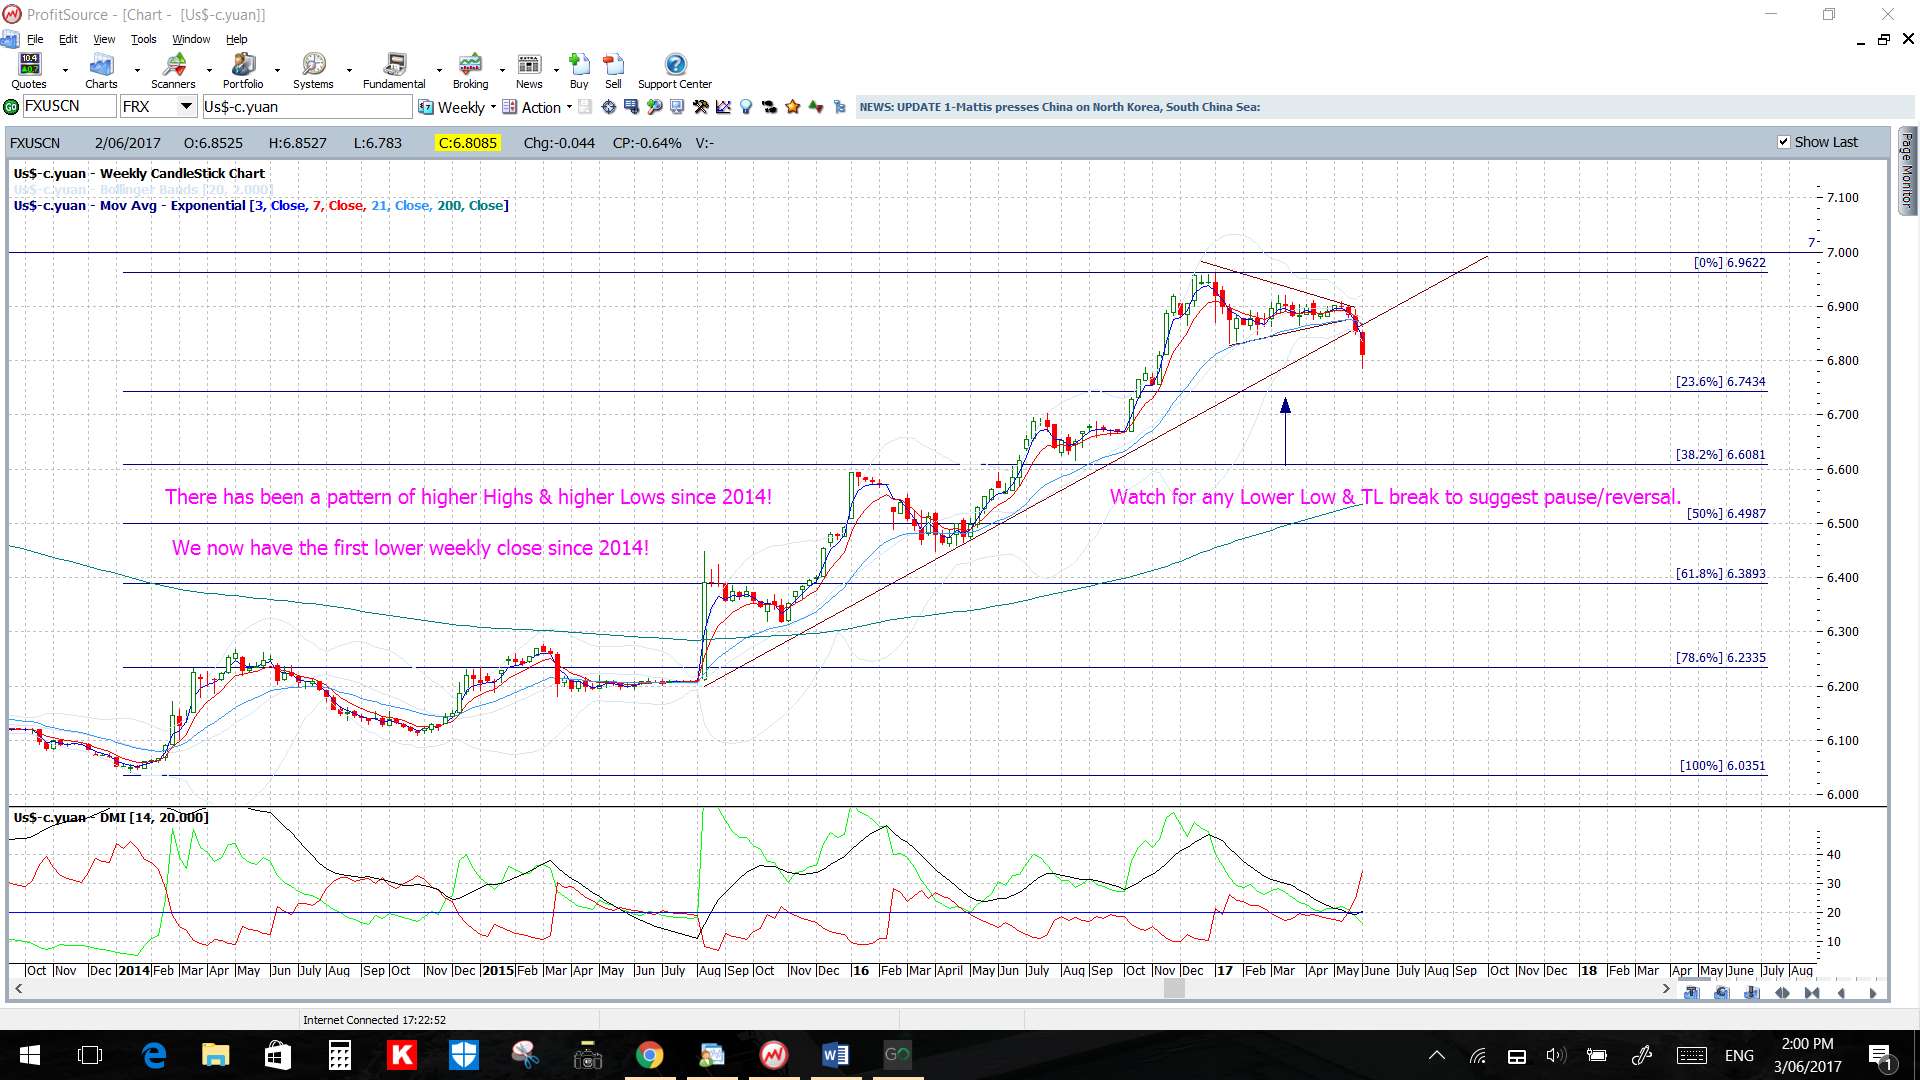
USD/CNH: This pair broke down through a major 2-year support trend line last week and gave up to 900 pips. In doing so, this pair has now broken the pattern of weekly chart higher Highs and higher Lows for the first time since 2014 which is significant. Care needs to be taken here though in case it develops an extended Flag pattern. Price came to rest below the 6.8 level so I’m watching this for any new make or break:
- Upper targets: a re-test of the broken trend line as this is also near the 61.8% fib of the last swing low move (see 4hr chart).
- Lower targets: any continued pullback below the weekly chart’s bottom trend line would have me looking for a test of the weekly chart’s 50% fib near the previous S/R level of 6.50.
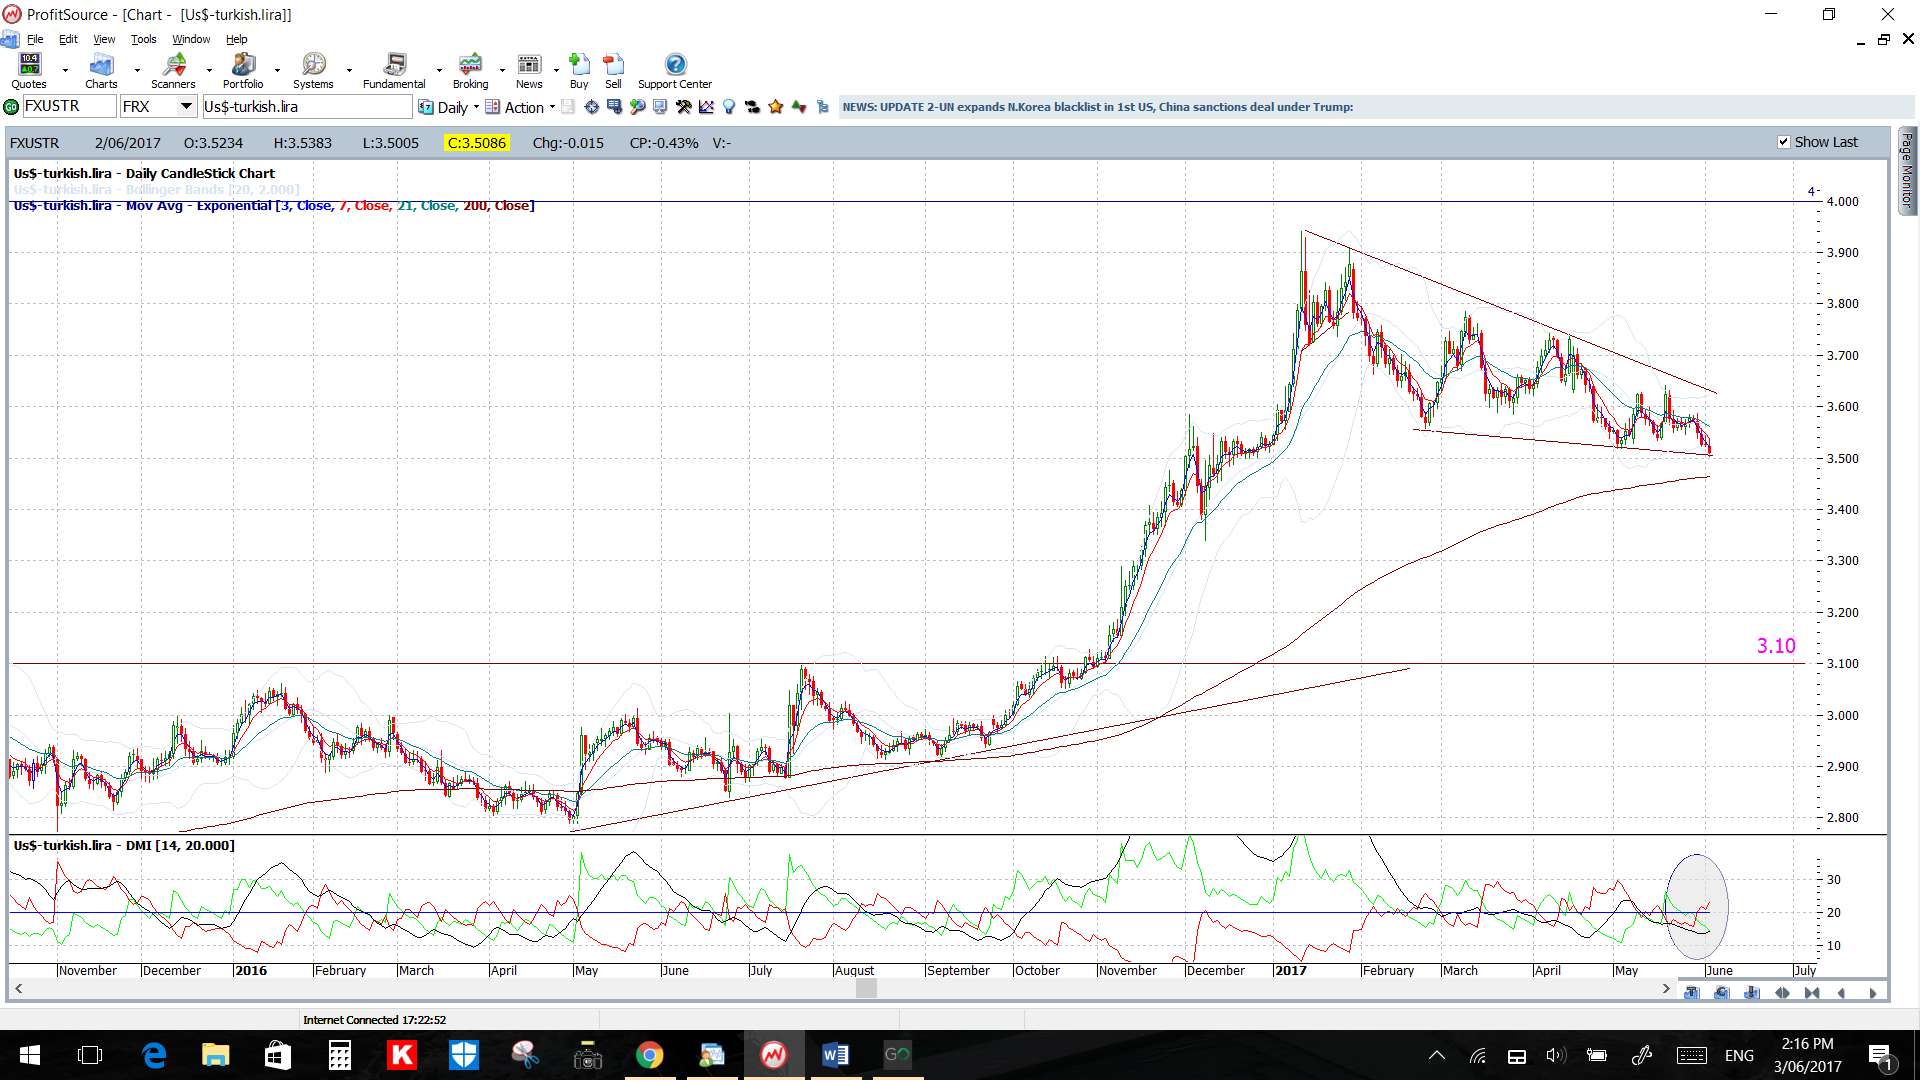
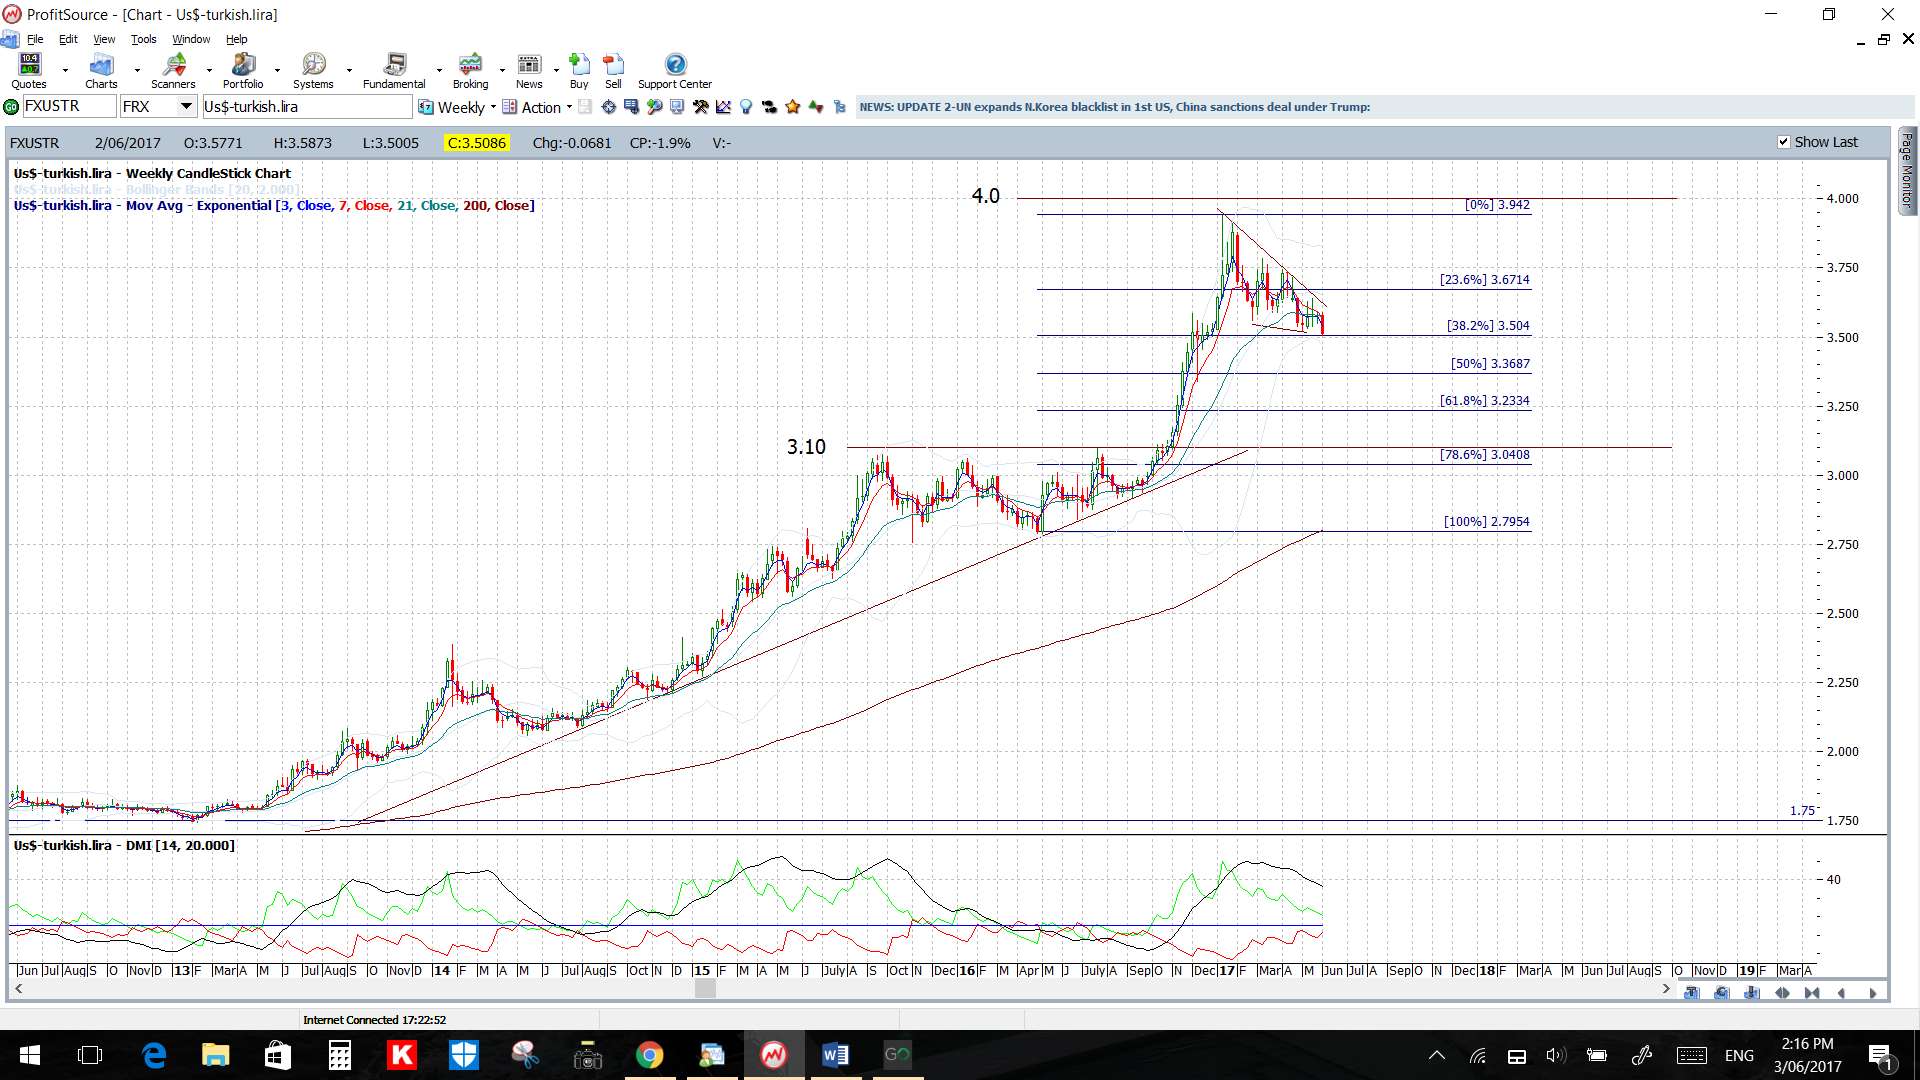
USD/TRY: Watch the daily chart’s channel support trend line for any make or break:
- Upper targets: The daily chart’s upper wedge trend line followed by the key 4 level as long-term resistance.
- Lower targets: any break below the daily chart’s lower wedge trend line would have me looking for a test of the weekly chart’s 61.8% fib and, after that, the 3.10 region as previous S/R.
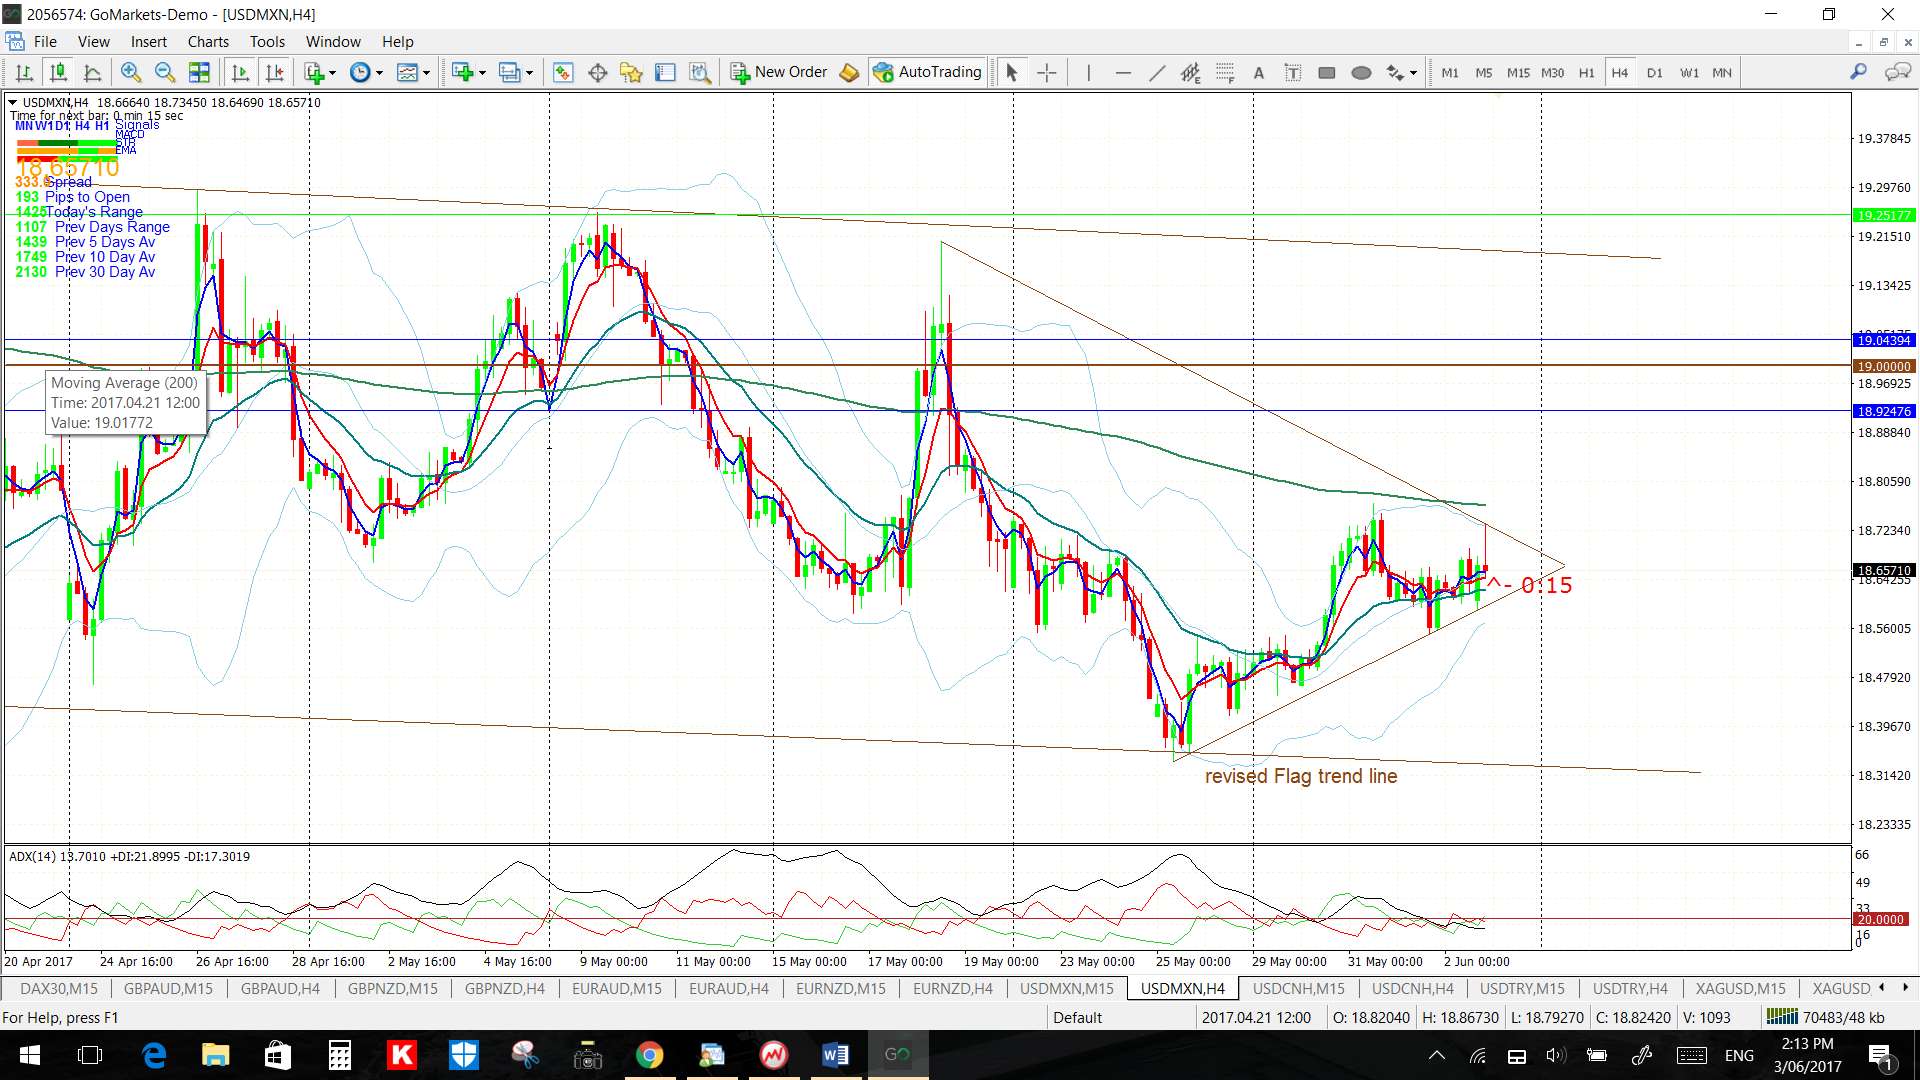
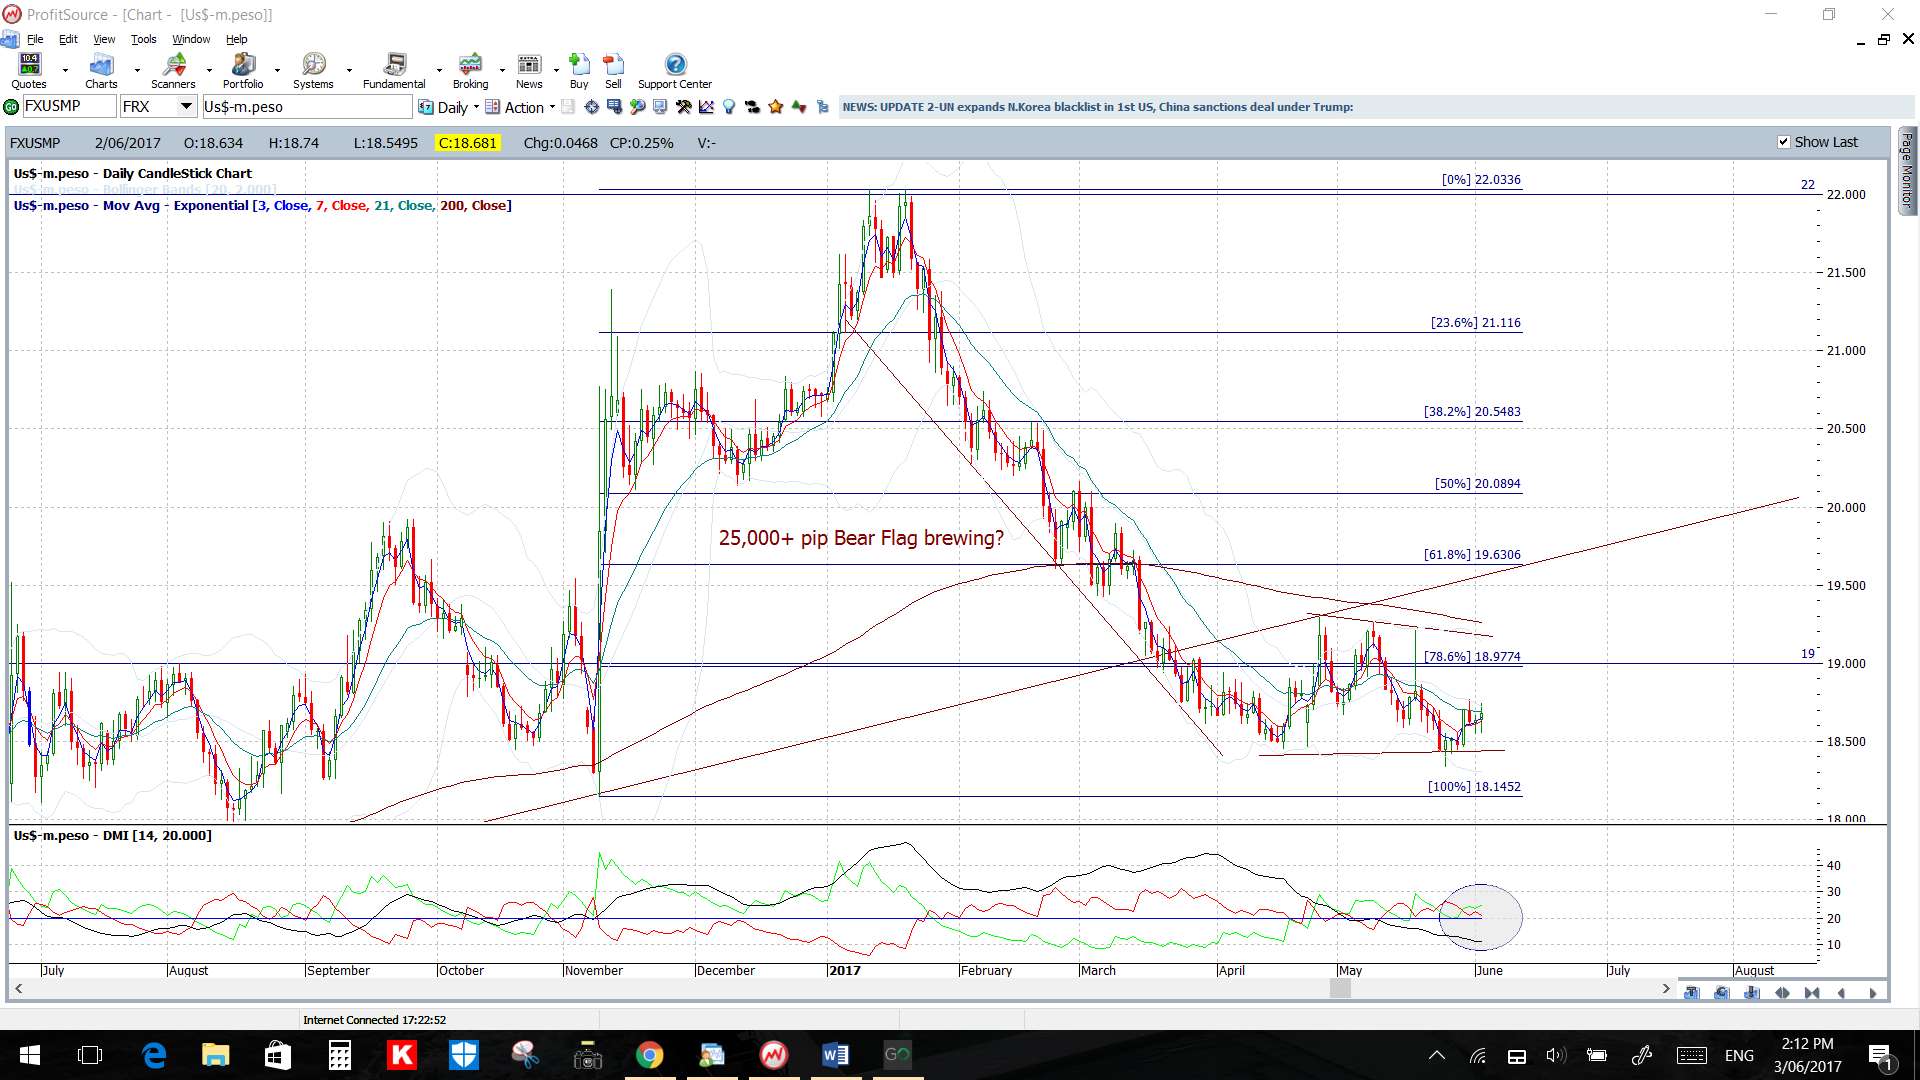
USD/MXN: I’ve revised the weekly support Flag trend line given the lack of follow-through. This still represents a potential 25,000+ pip Bear Flag move so watch the 4hr chart’s triangle trend lines for any breakout move:
- Upper targets: 19 followed by the upper Flag trend line.
- Lower targets: the lower Flag trend line and, if this breaks, then the weekly chart’s 61.8% fib near previous S/R of 16.
Commodities:
Gold: Gold gave a great trend line breakout trade after NFP for over 100 pips. The main point to note here now is that price closed right at the 6-year bear trend line near the $1,280 level and this will be the level to watch for any make or break in the coming week.
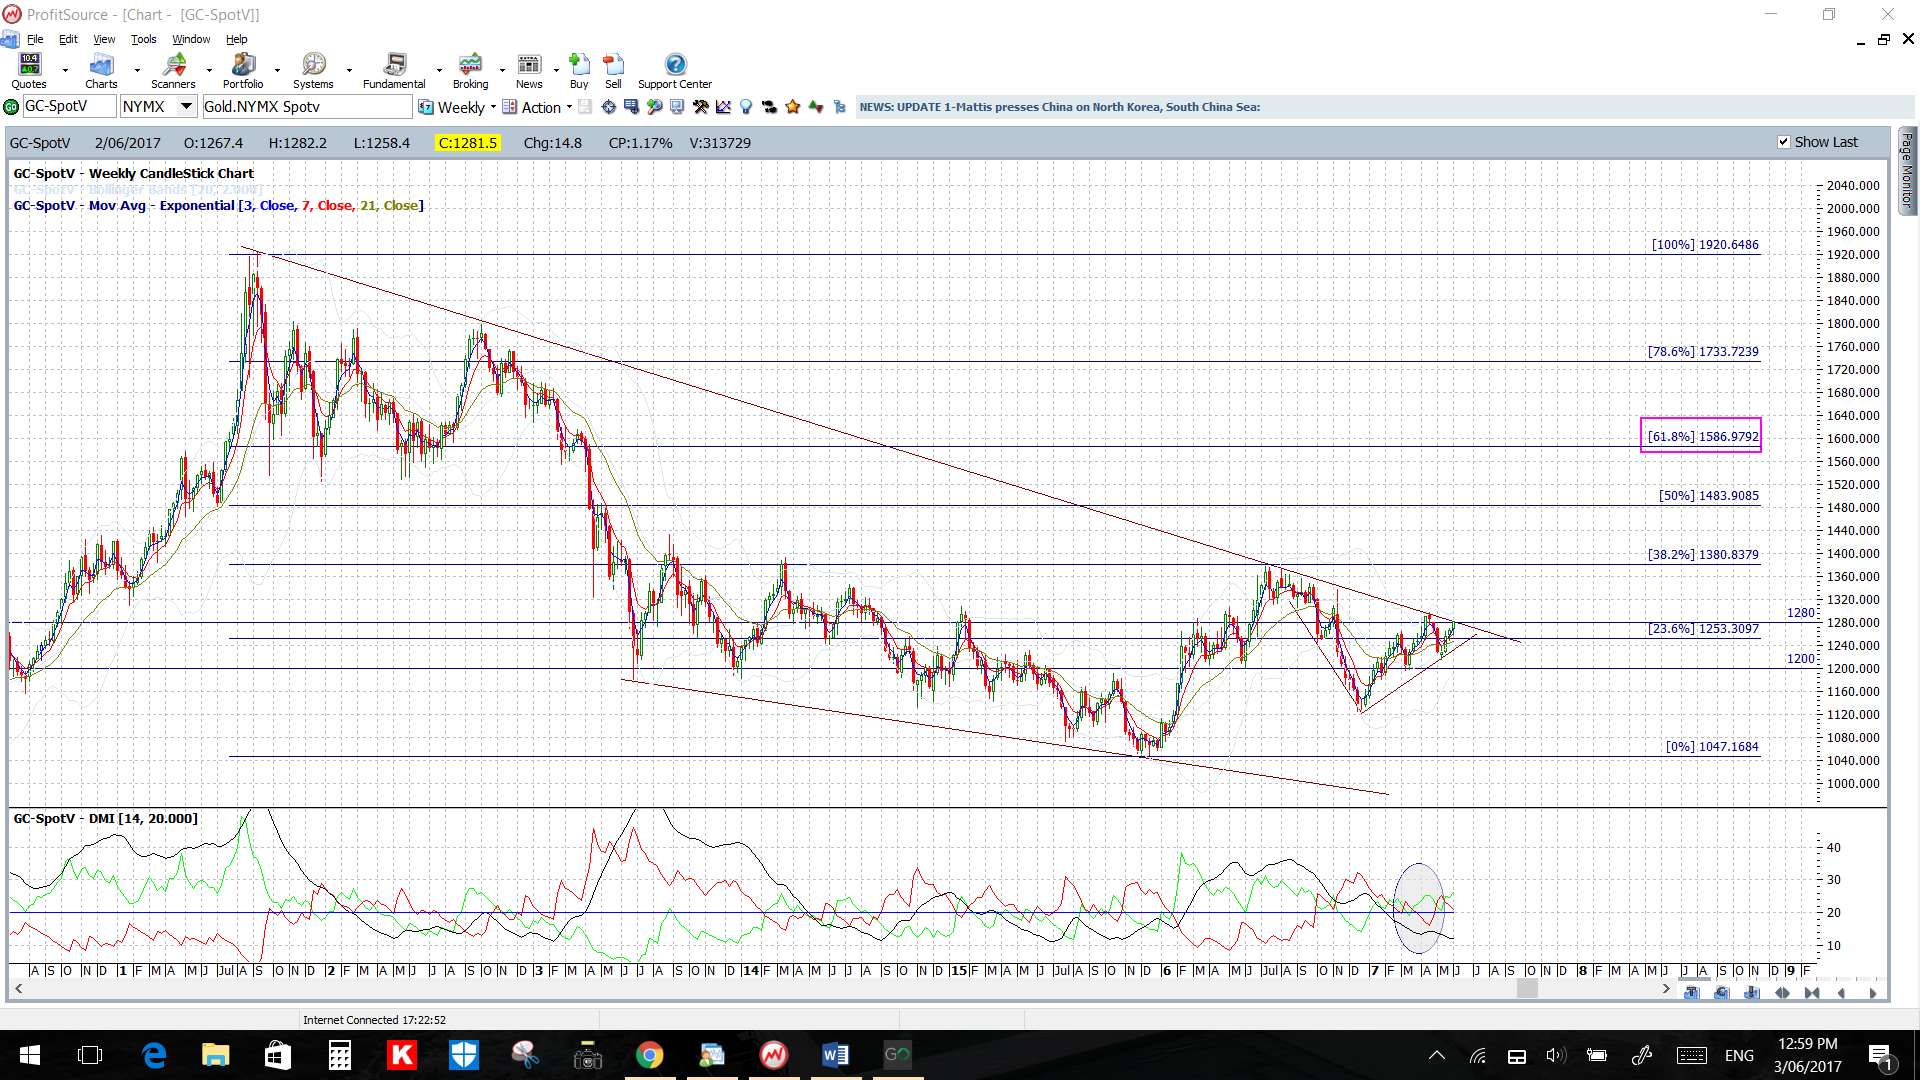
- Upper targets: the weekly chart’s 61.8% fib near $1,600.
- Lower targets: any pullback would have me looking for a test of the $1,250 region followed by the 4hr chart’s 61.8% fib level near $1,240.
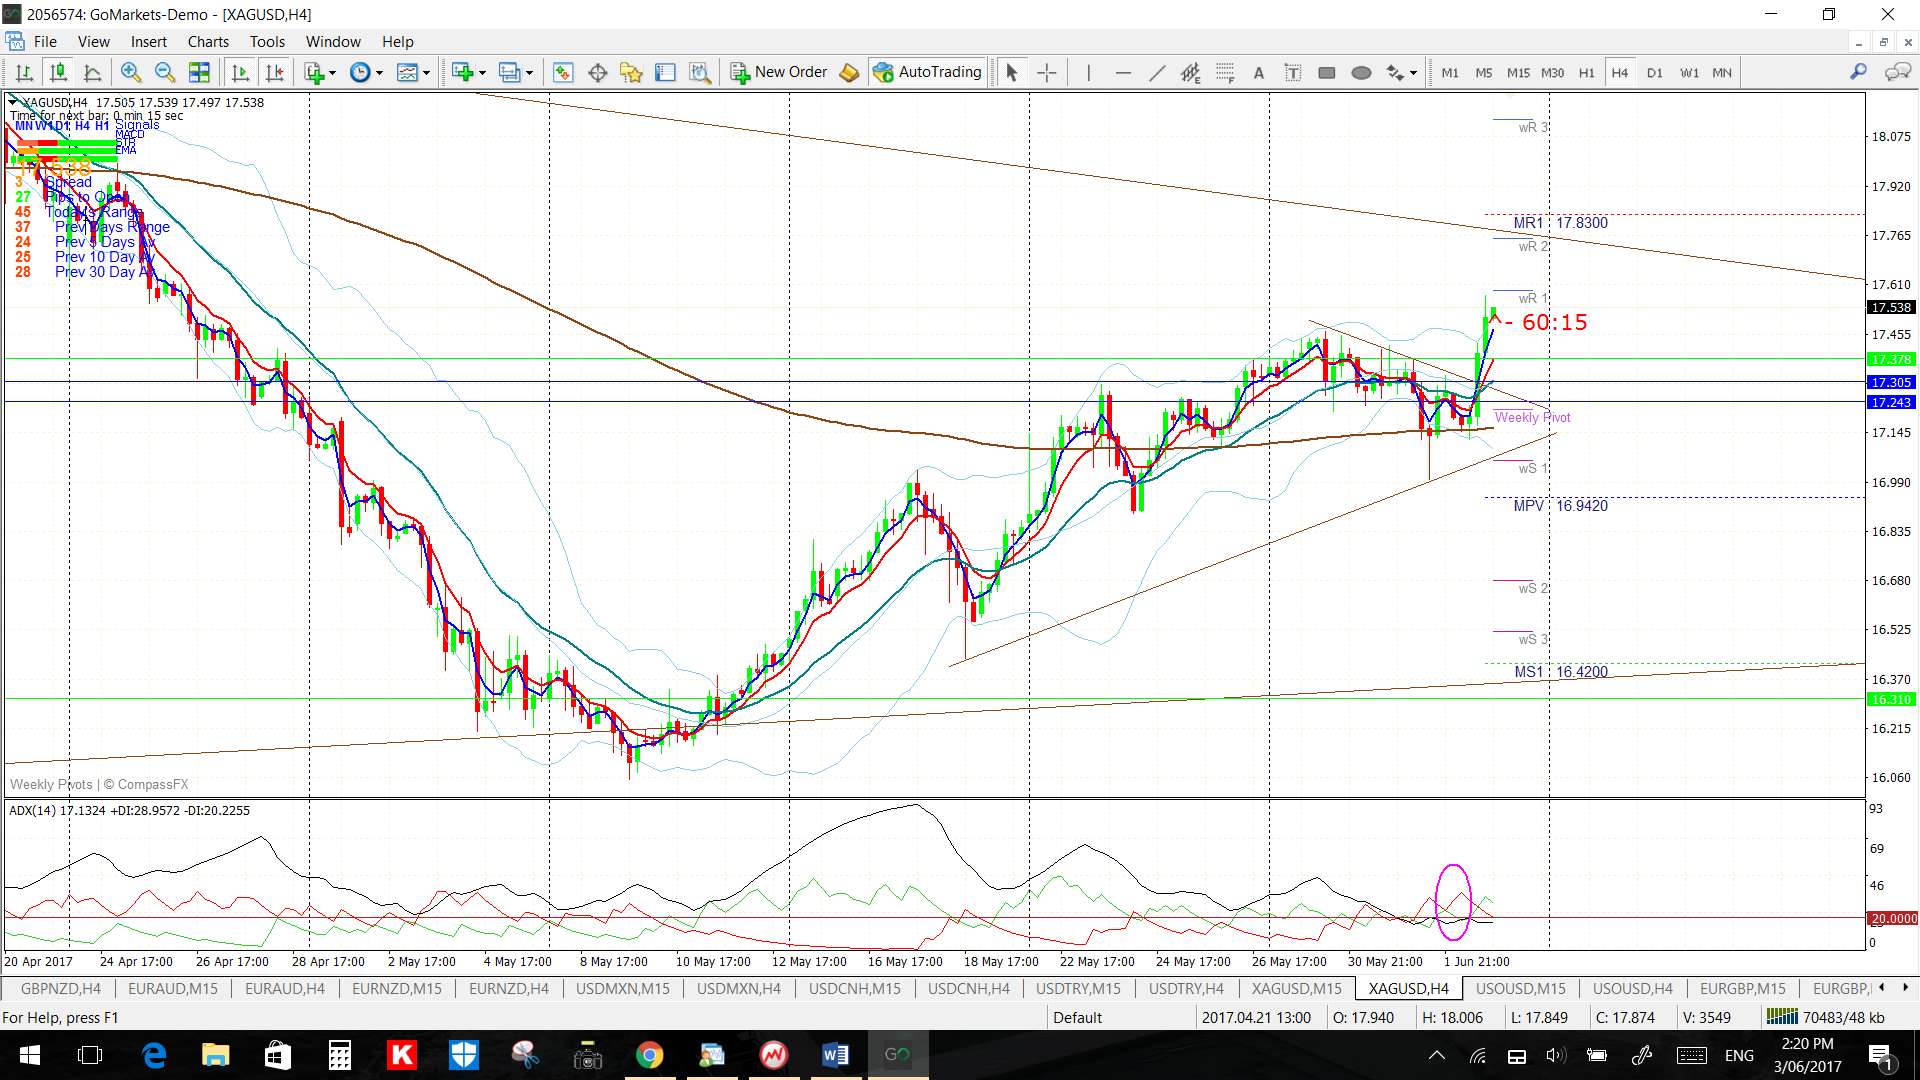
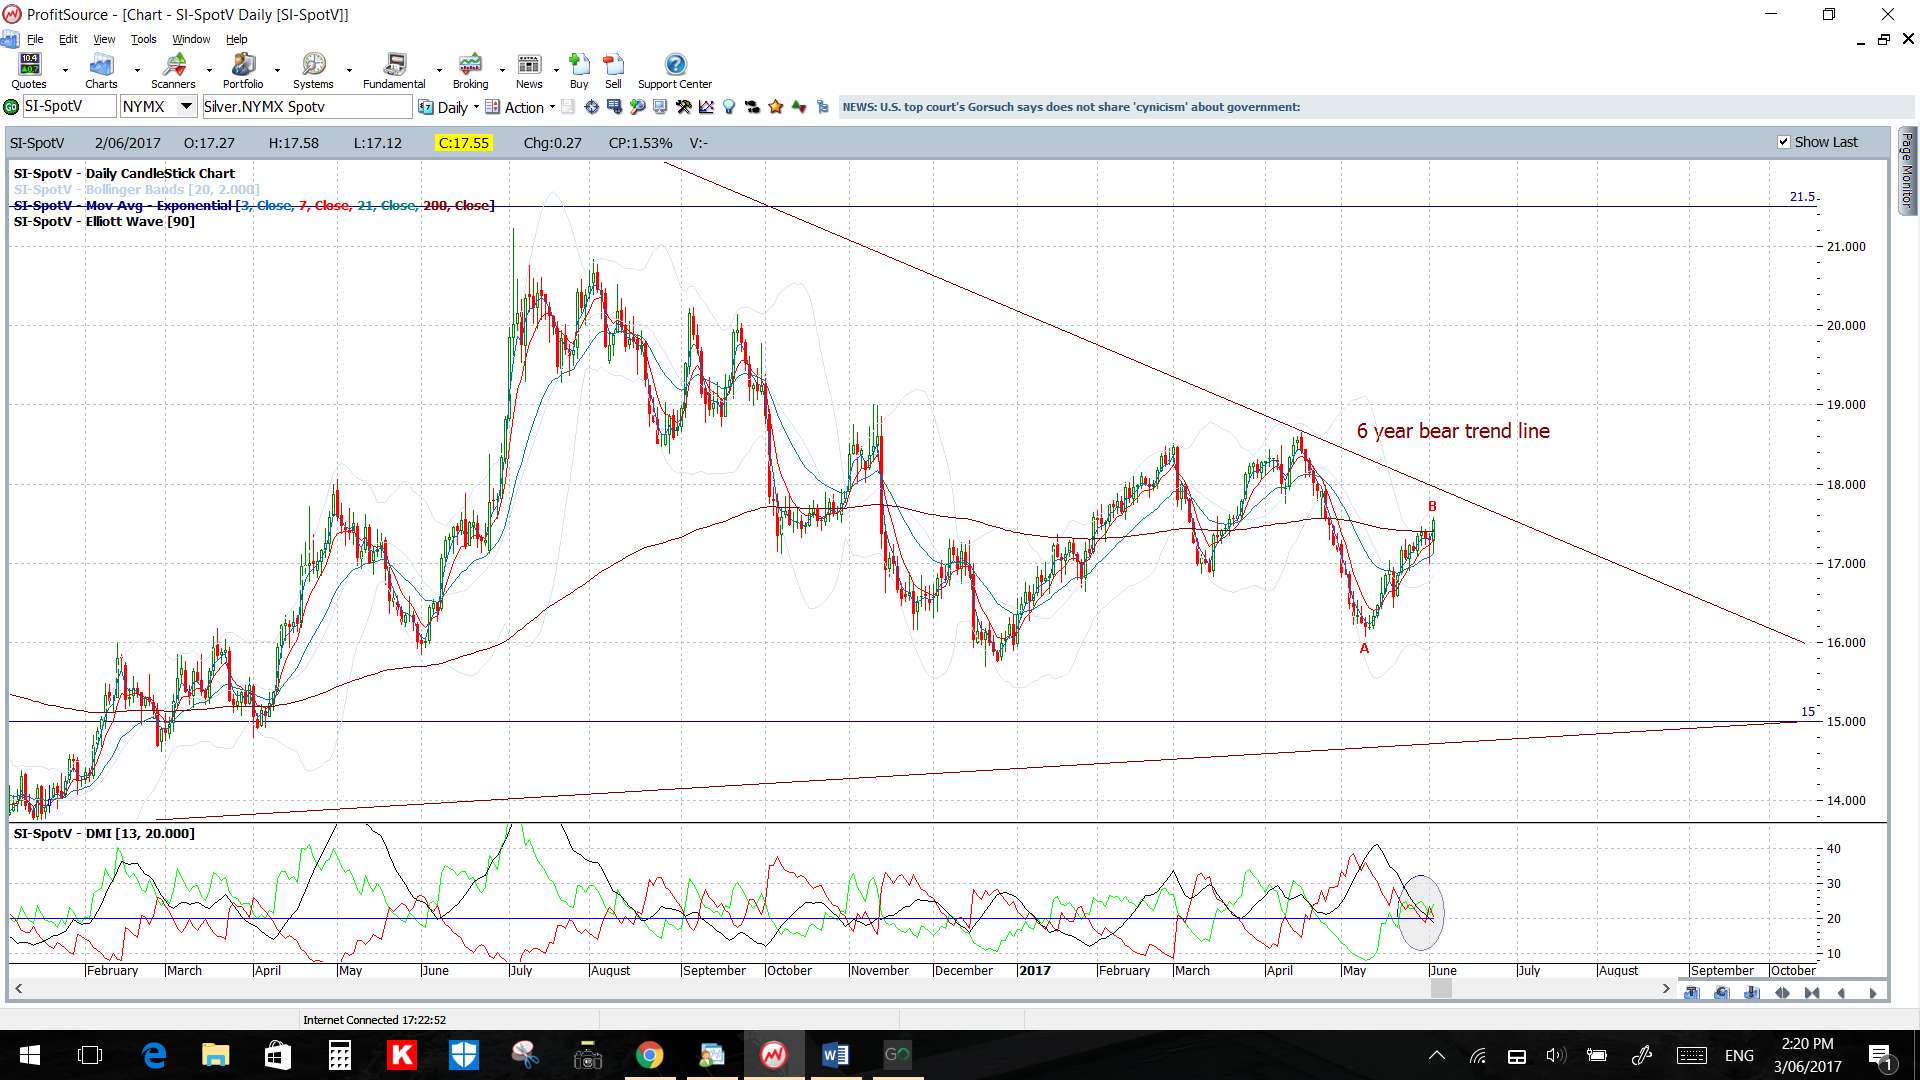
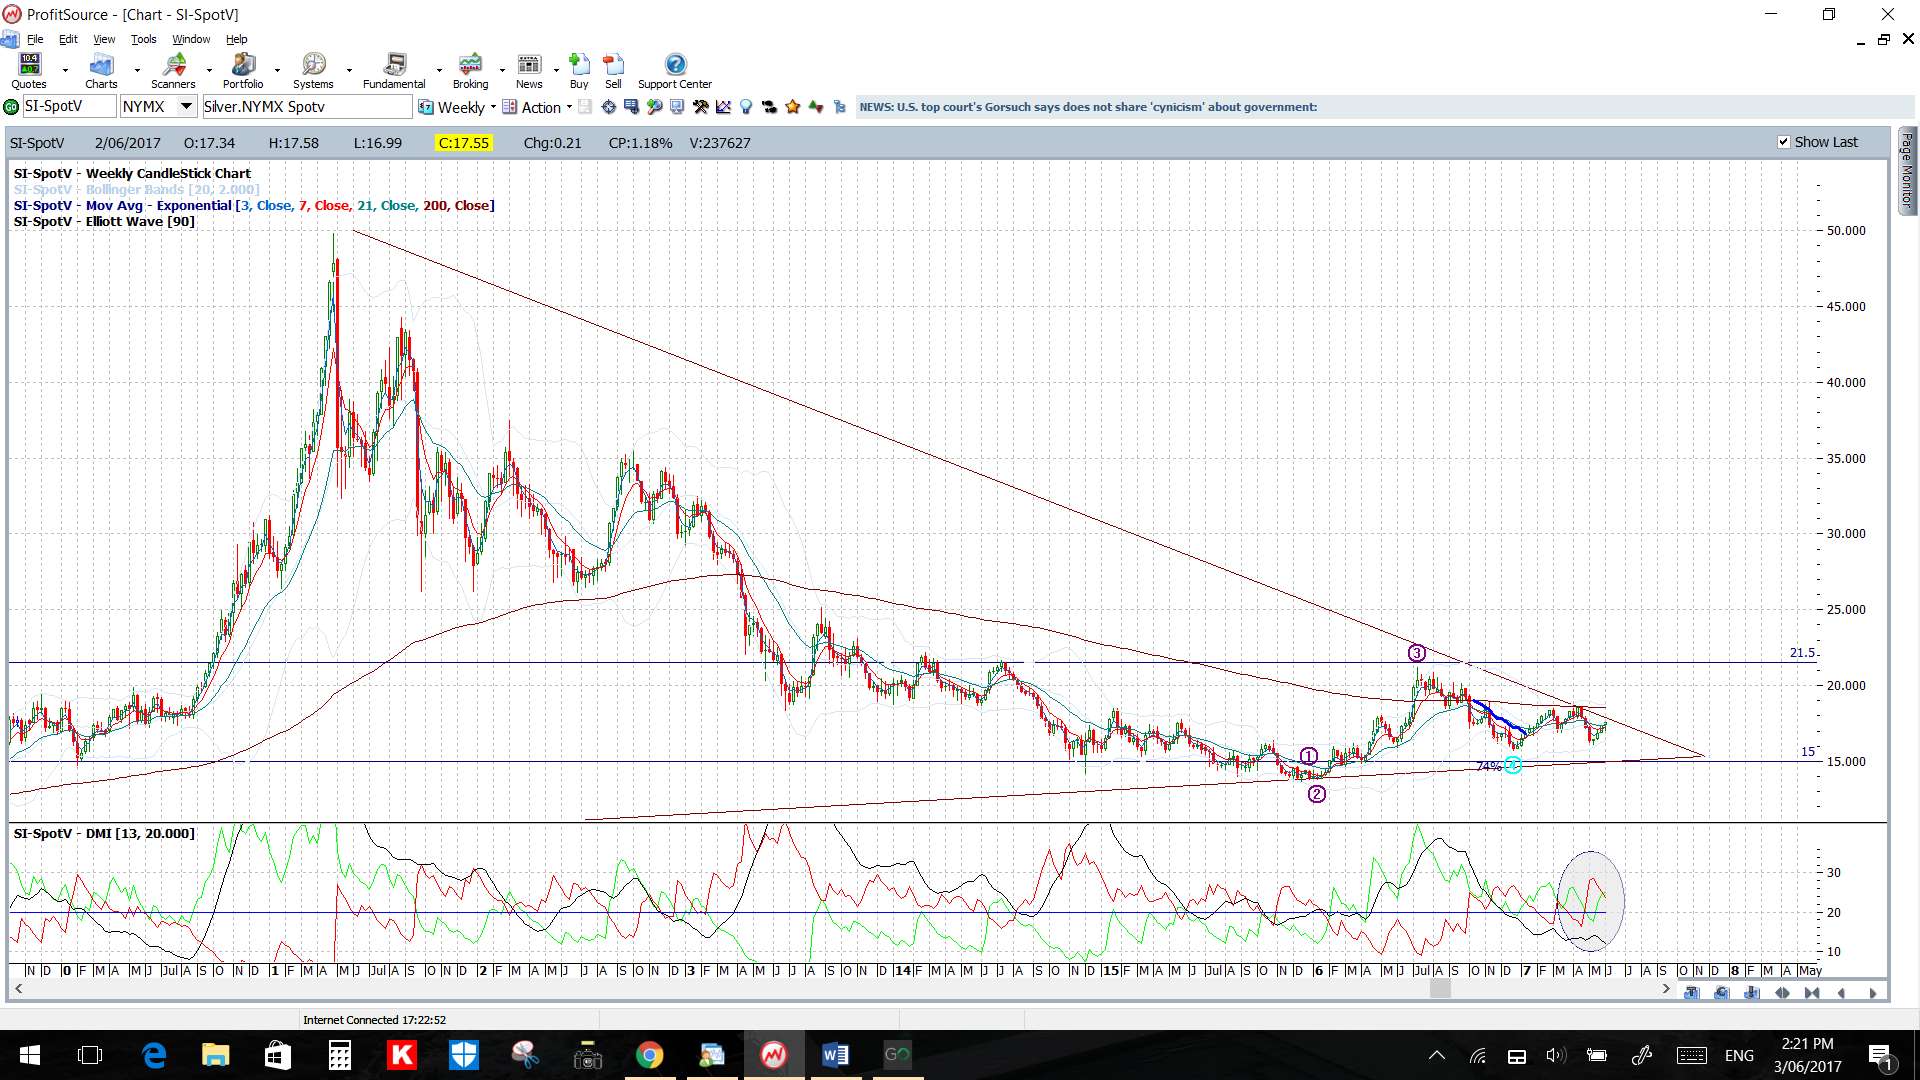
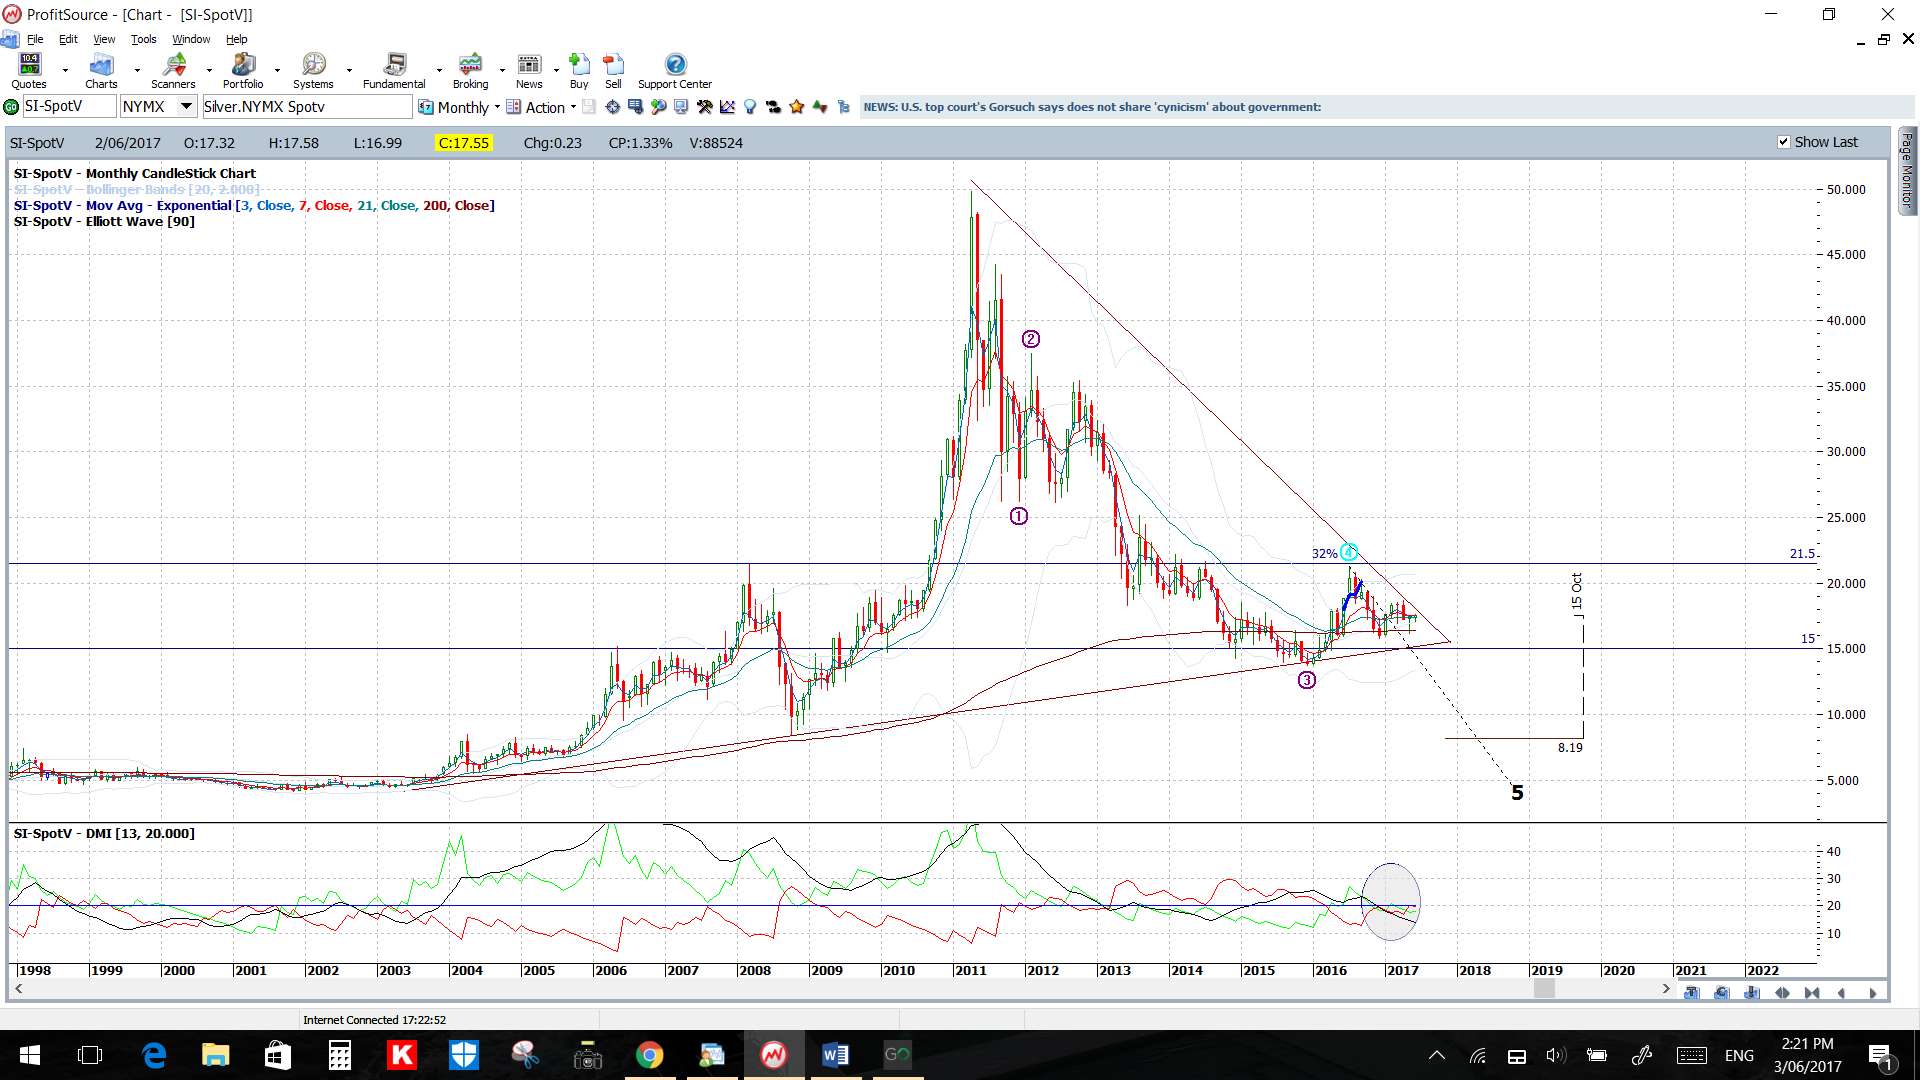
Silver: Watch the 4hr chart for any continuation of the recent breakout move up to the long-term bear trend line (100 pips away):
- Upper targets: the daily/weekly/monthly chart’s upper triangle trend line (now just 25 pips away!!).
- Lower targets: the daily chart’s bottom triangle trend line.
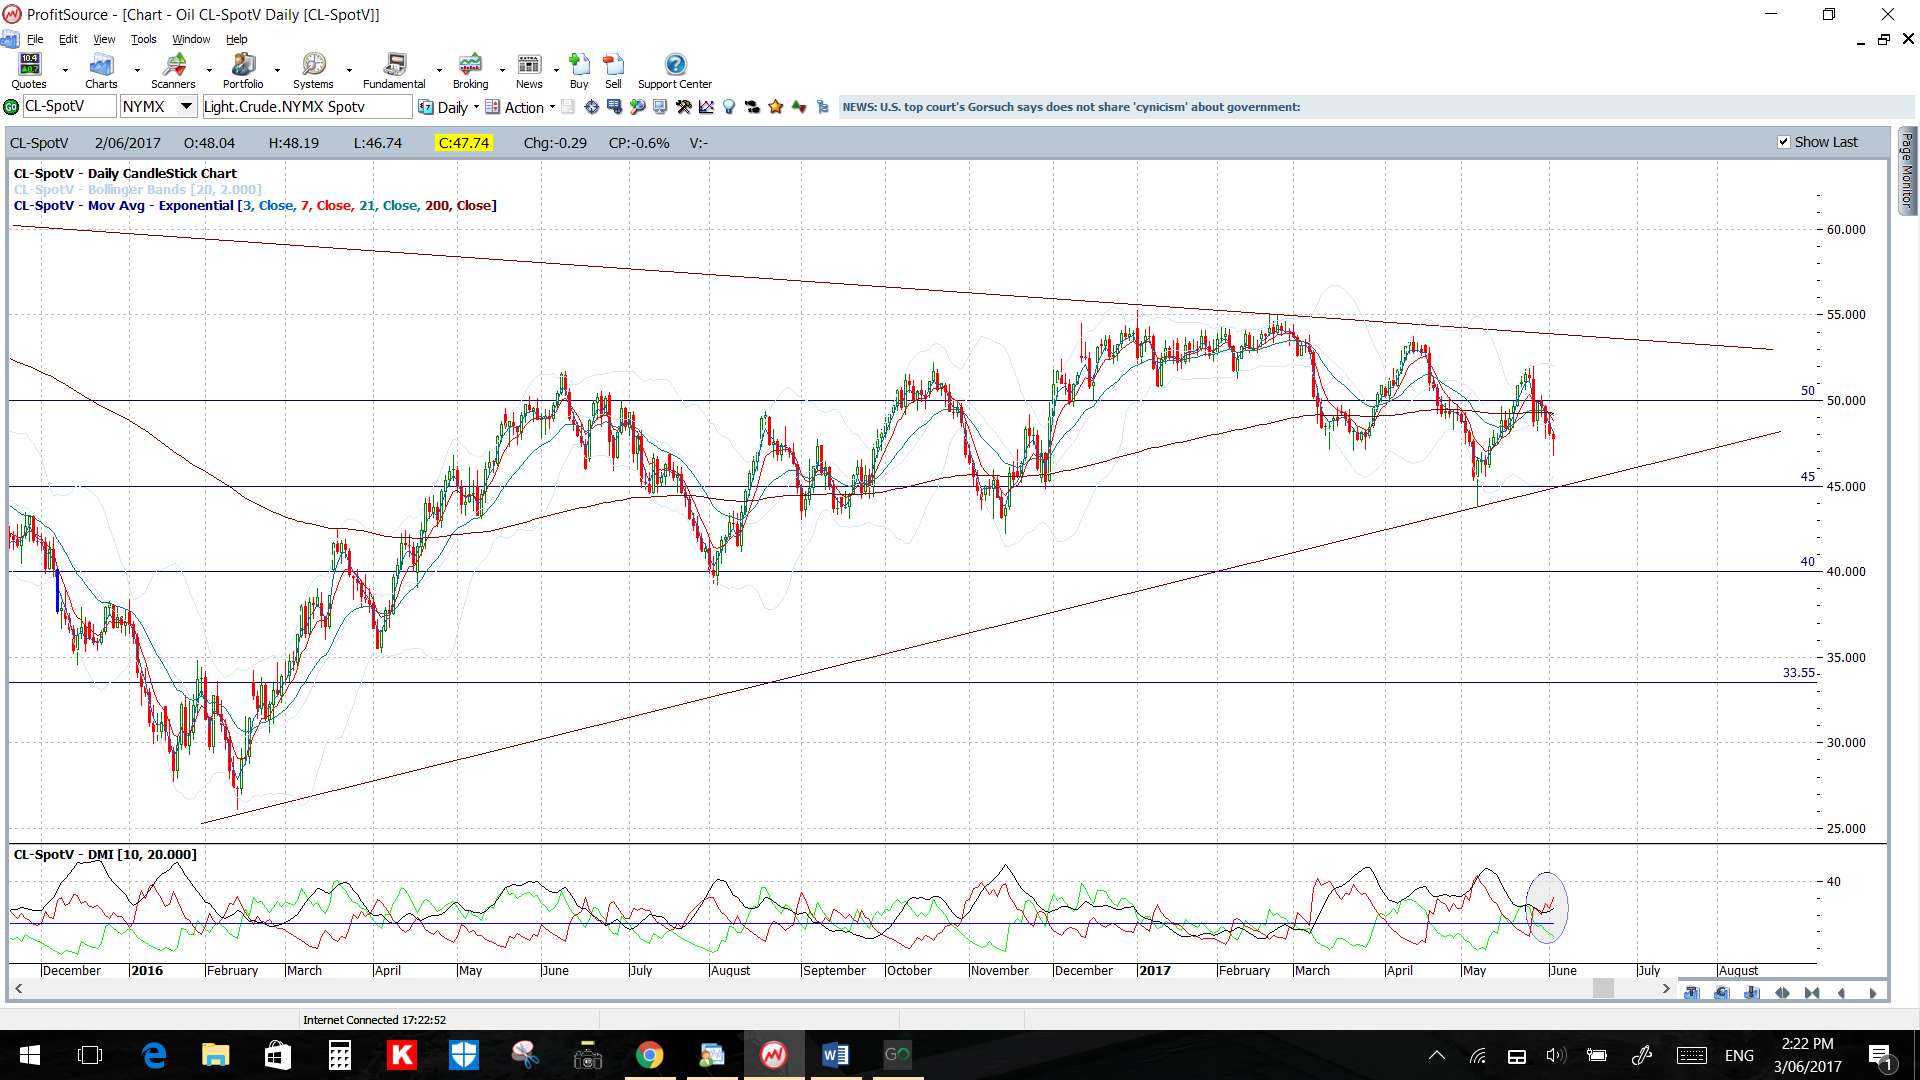
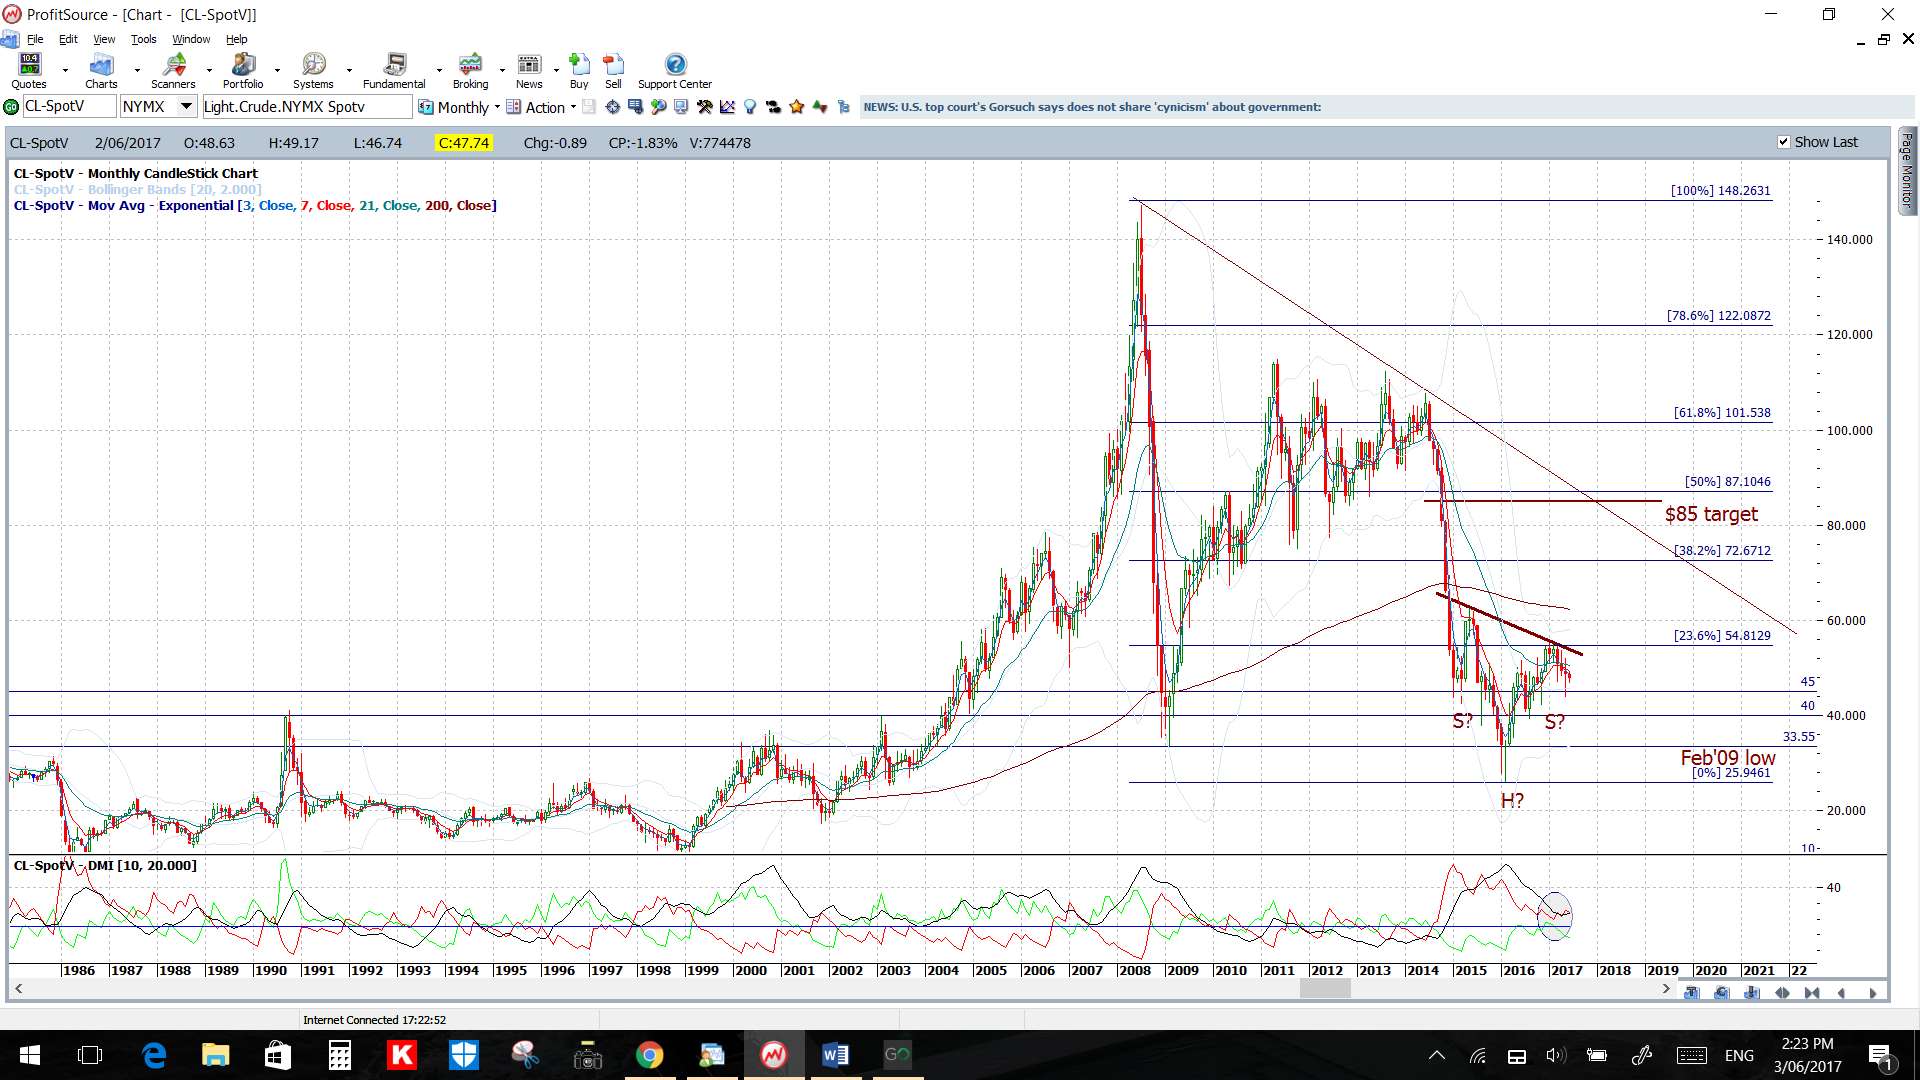
Oil: Note how price bounced up from the 4hr chart’s 61.8% Fib! I’d mentioned in my write up last week that this was the line in the sand for me here and it has held for now! Thus, watch this level and the 4hr chart’s descending wedge trend lines for any breakout:
- Upper targets: the daily/weekly/monthly chart’s upper trend line (now 550+ pips away).
- Lower targets: the daily/weekly chart’s bottom triangle trend line.
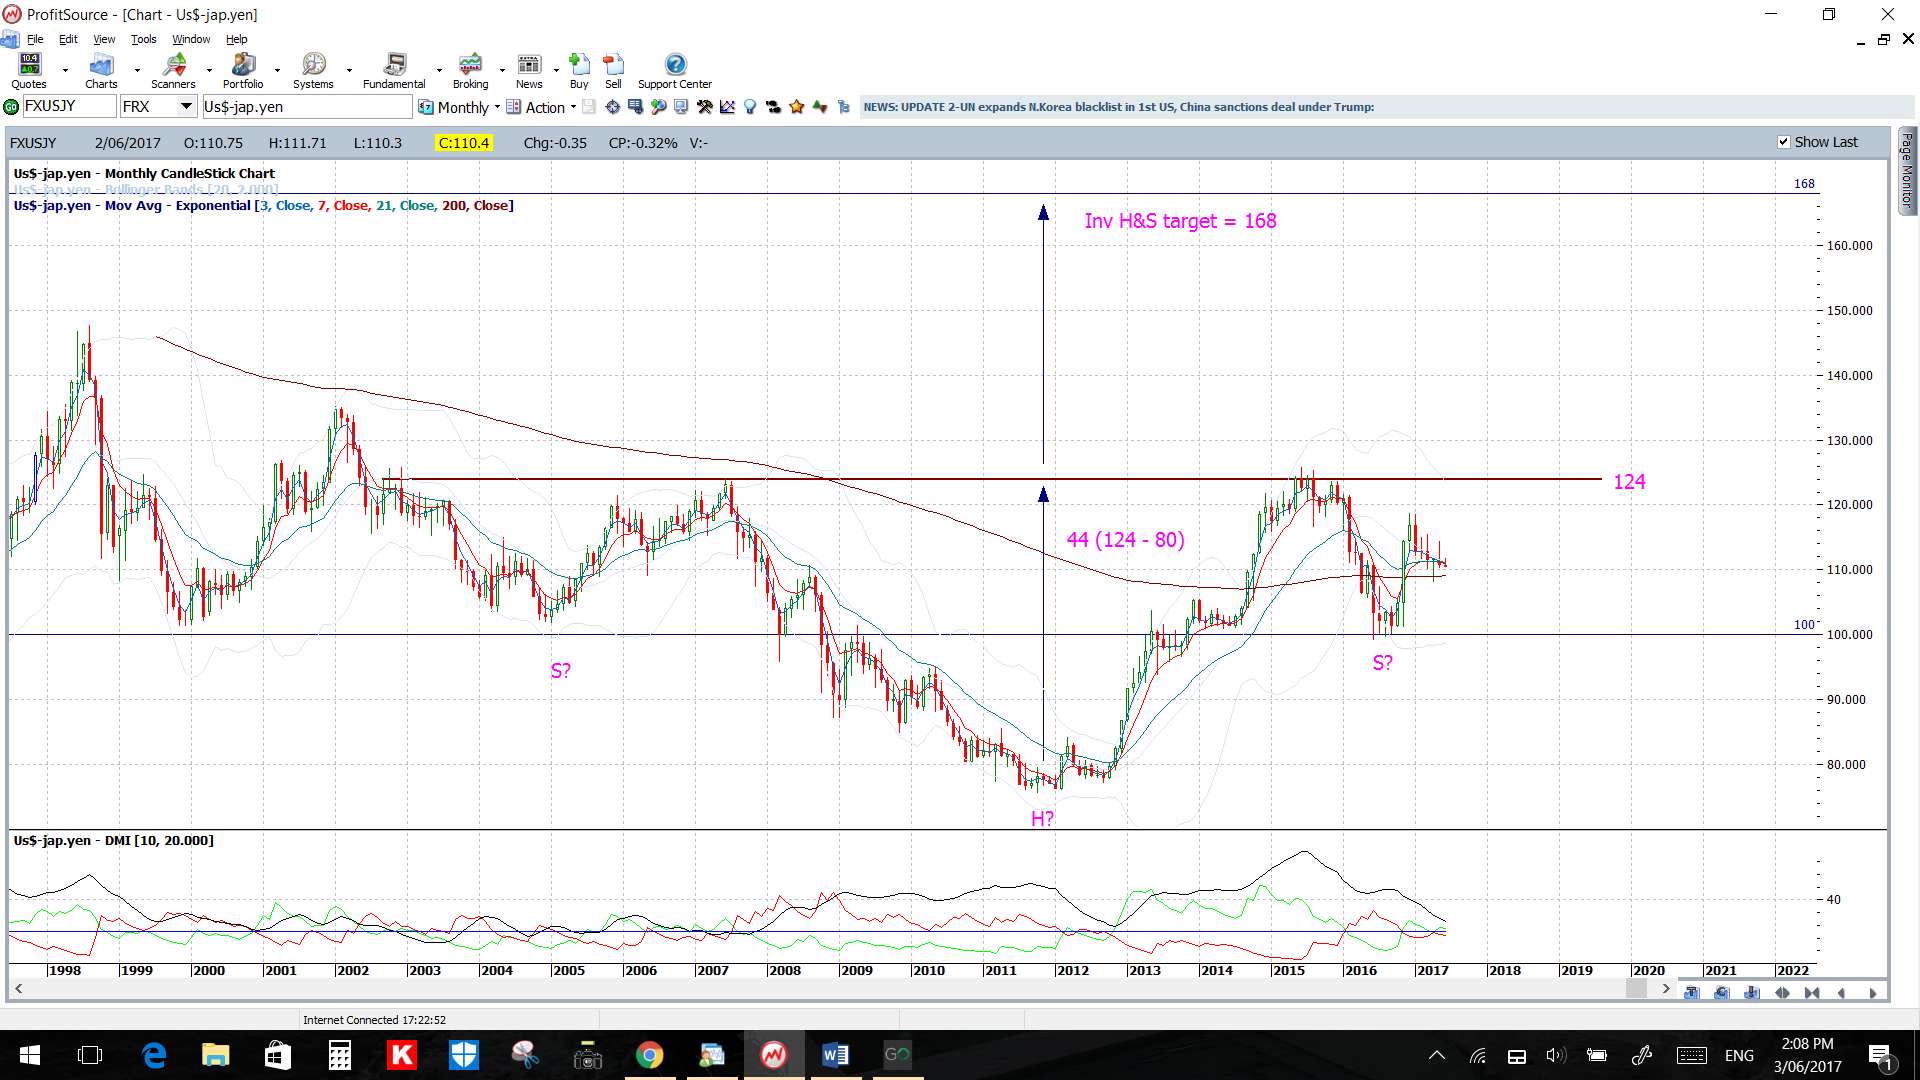
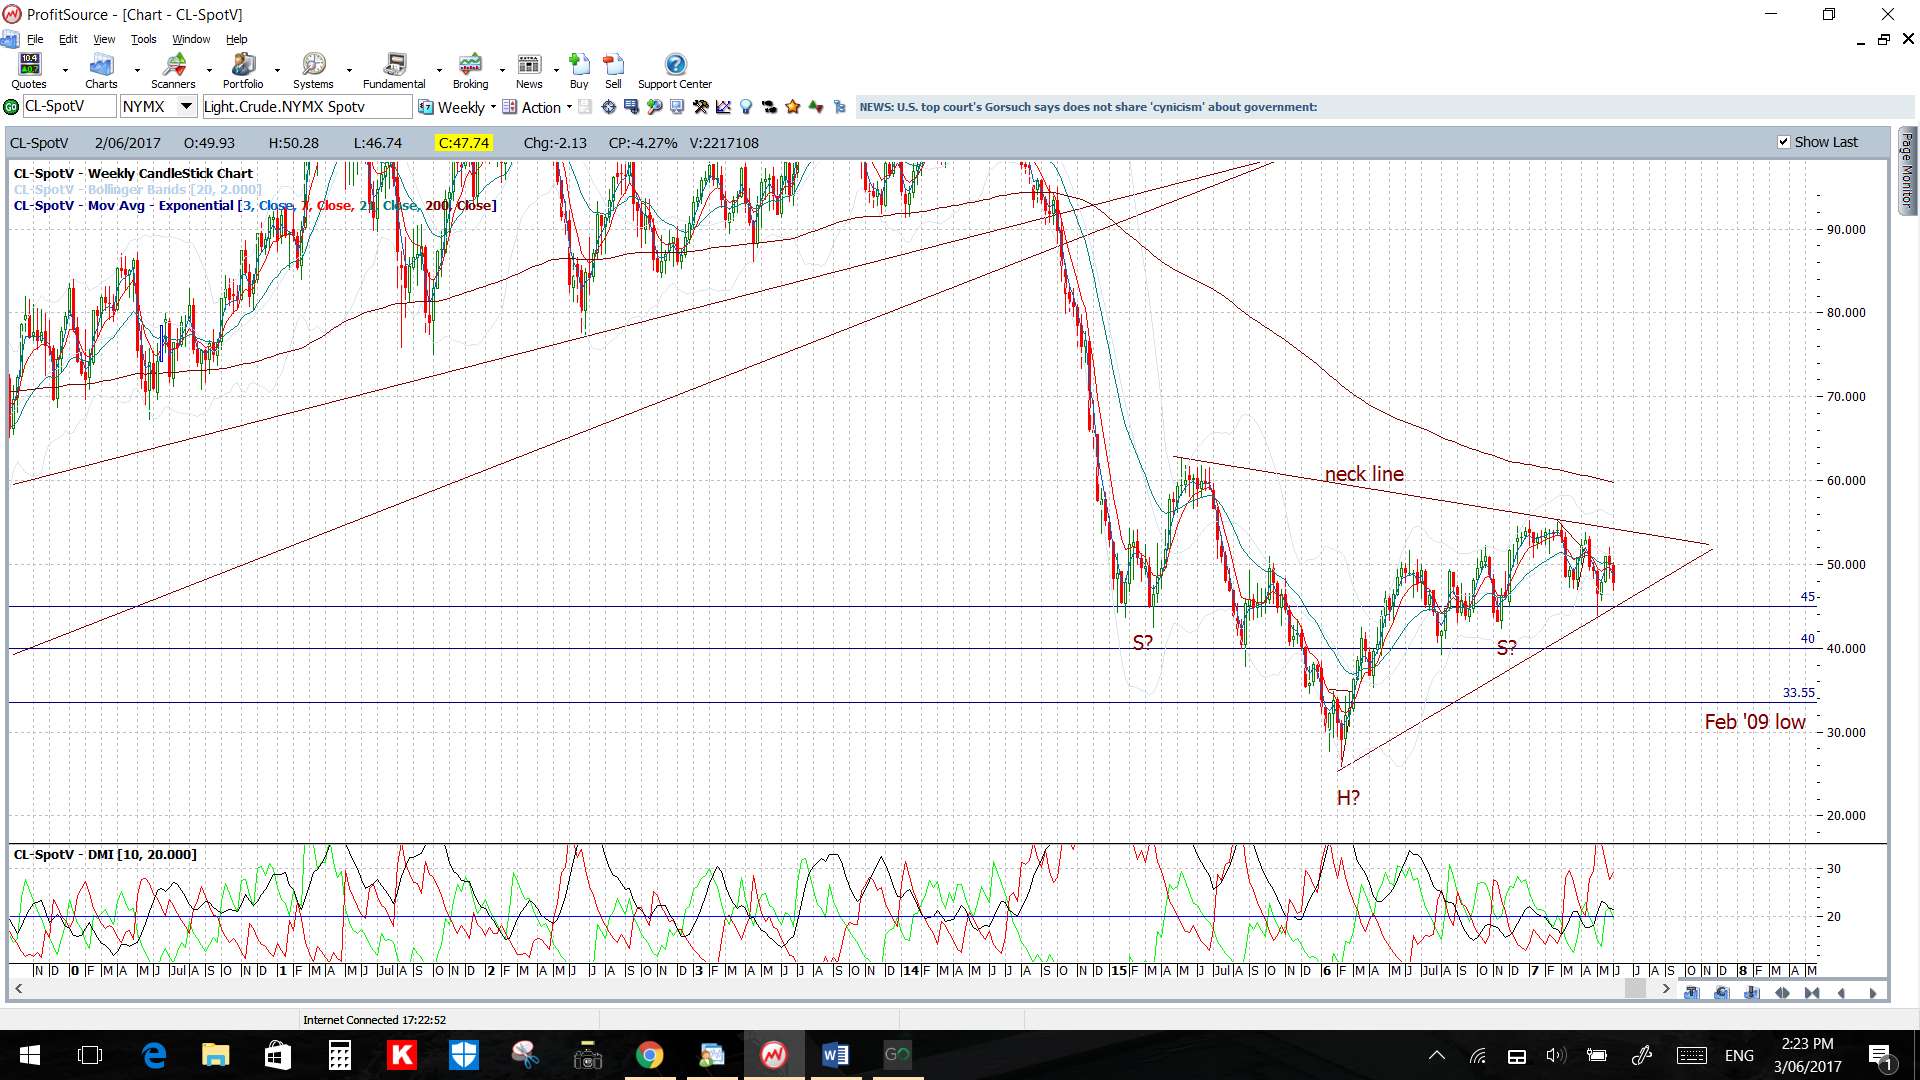
Note: There is 2-year bear trend line above current price and this also forms the monthly chart’s ‘Neck Line’ for a potential ‘Inverse H&S’ pattern. This pattern has a height of approximately $30 or 3,000 pips and this puts the target for any breakout move up near the $85 level which ties in with the 50% Fibonacci of the 2008-2016 swing low move.
Stock Indices:
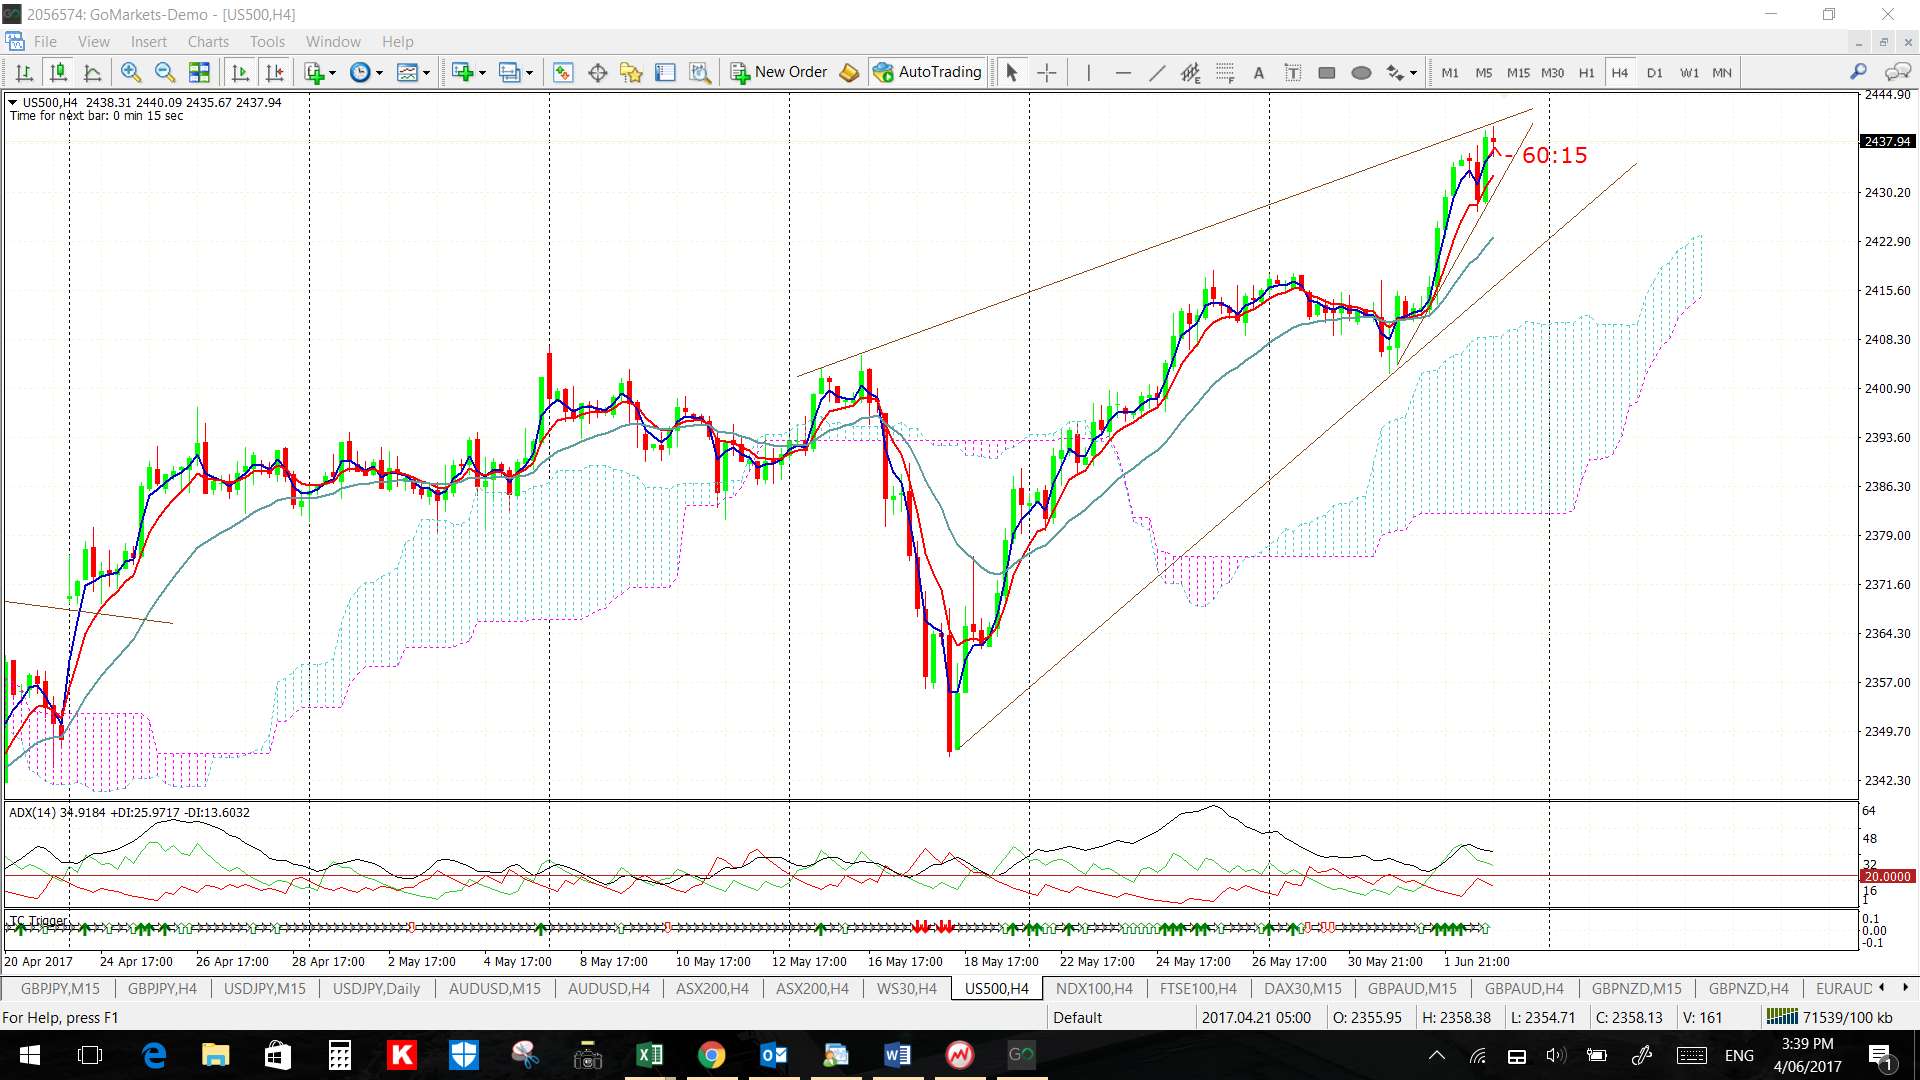
S&P500 4hr:
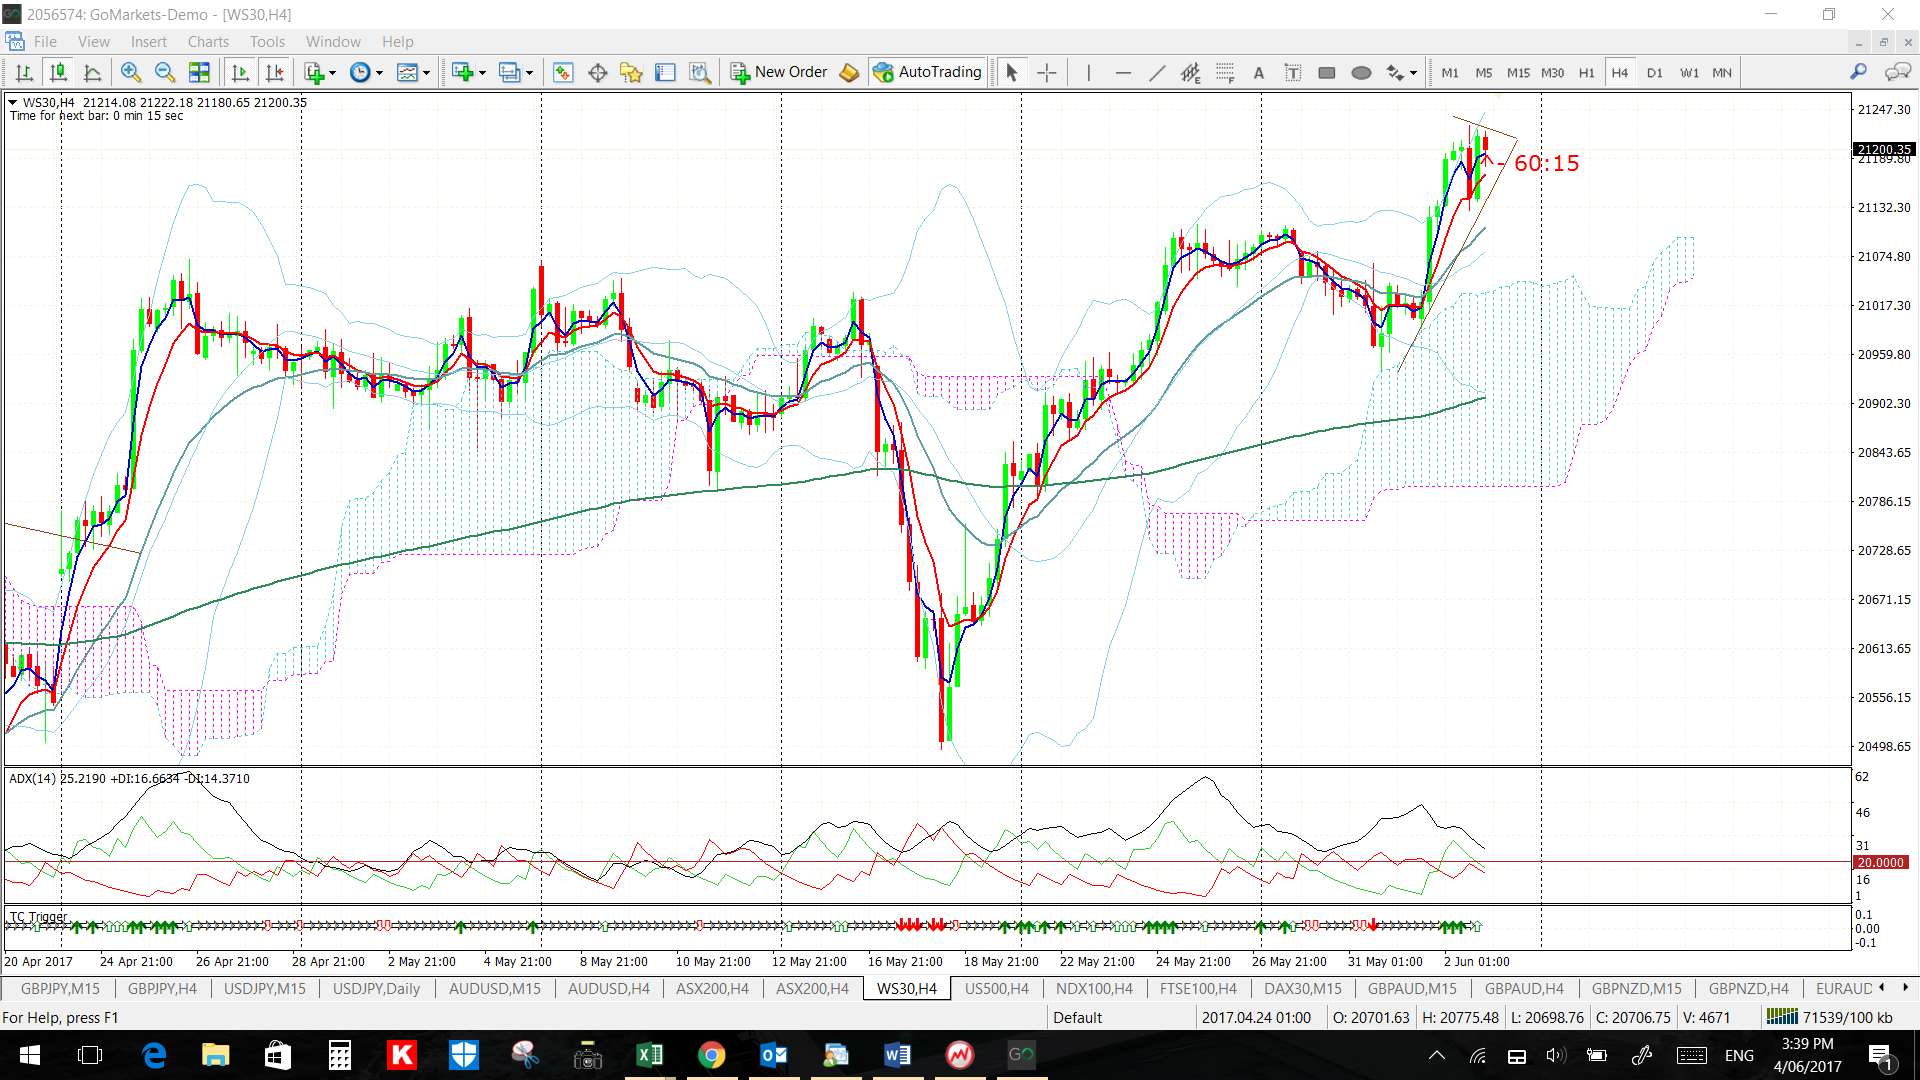
DJIA 4hr:
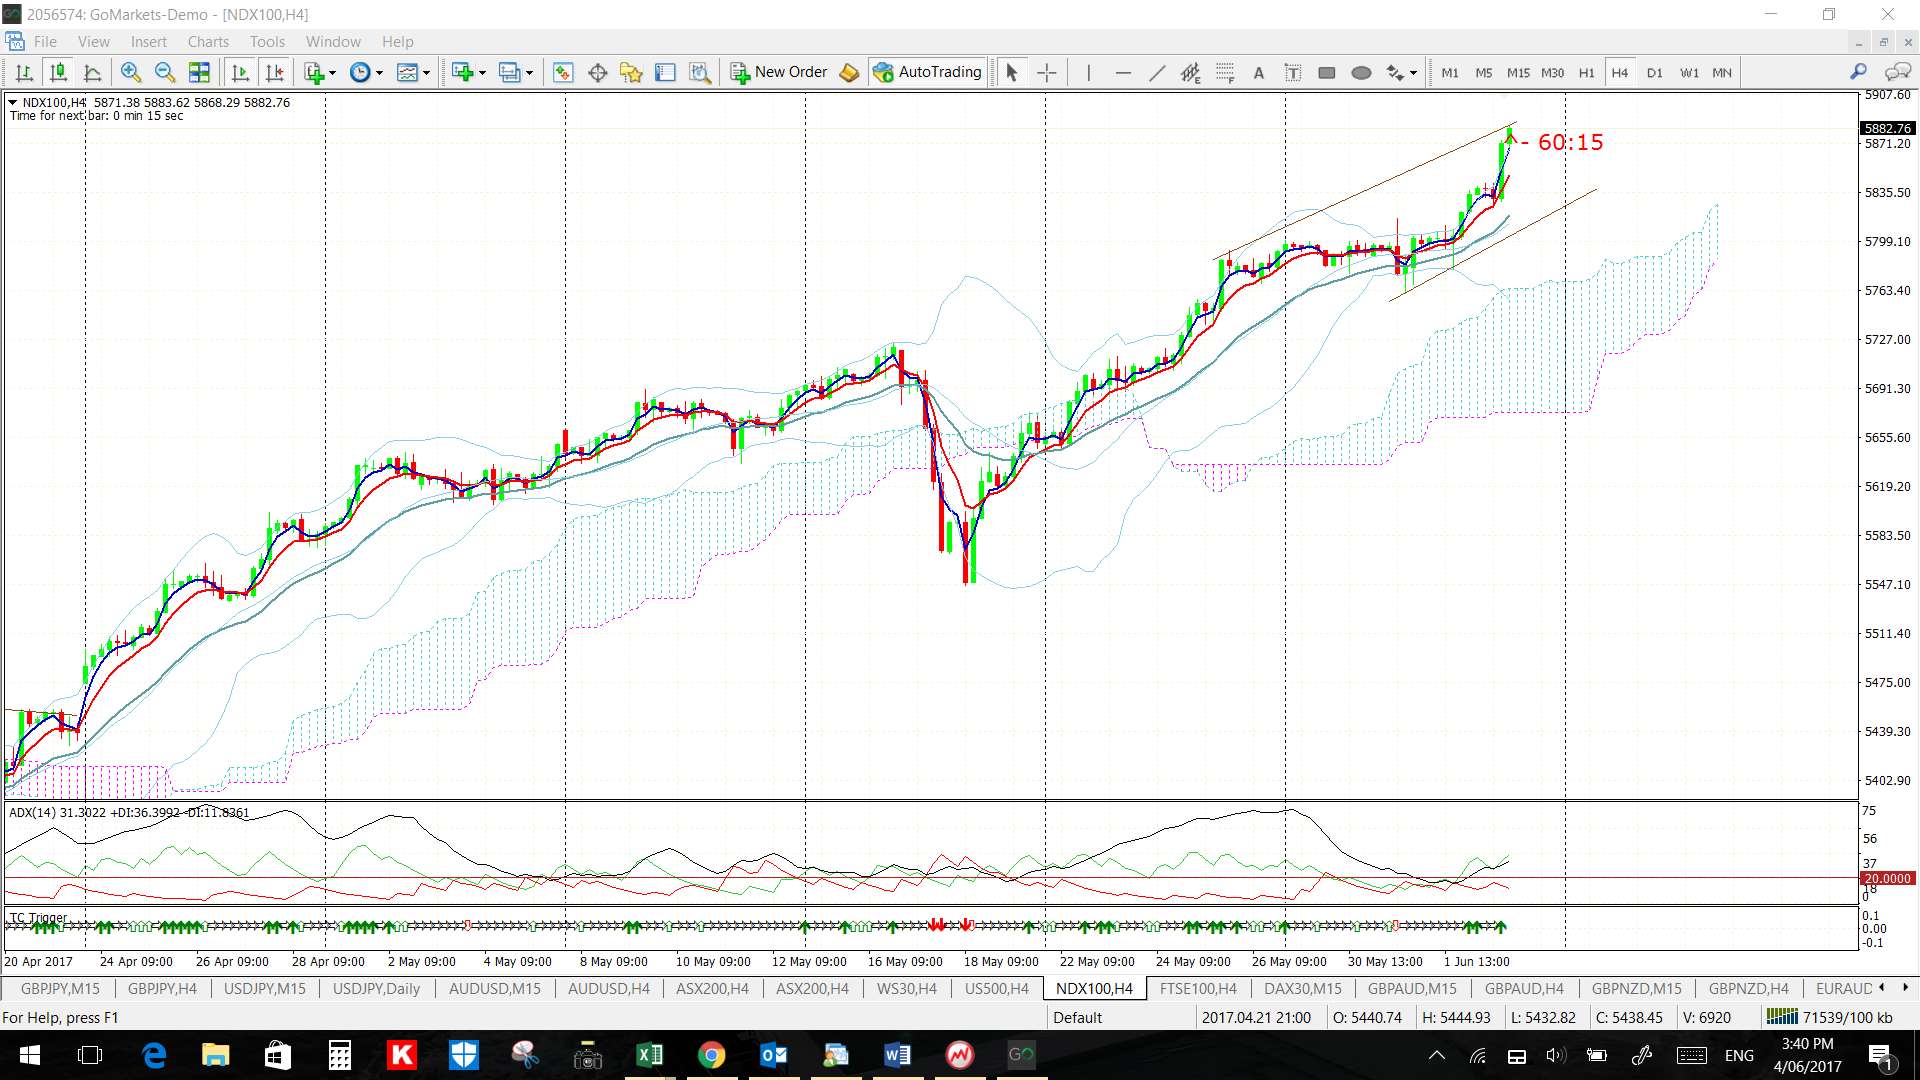
NASDAQ-100 4hr:
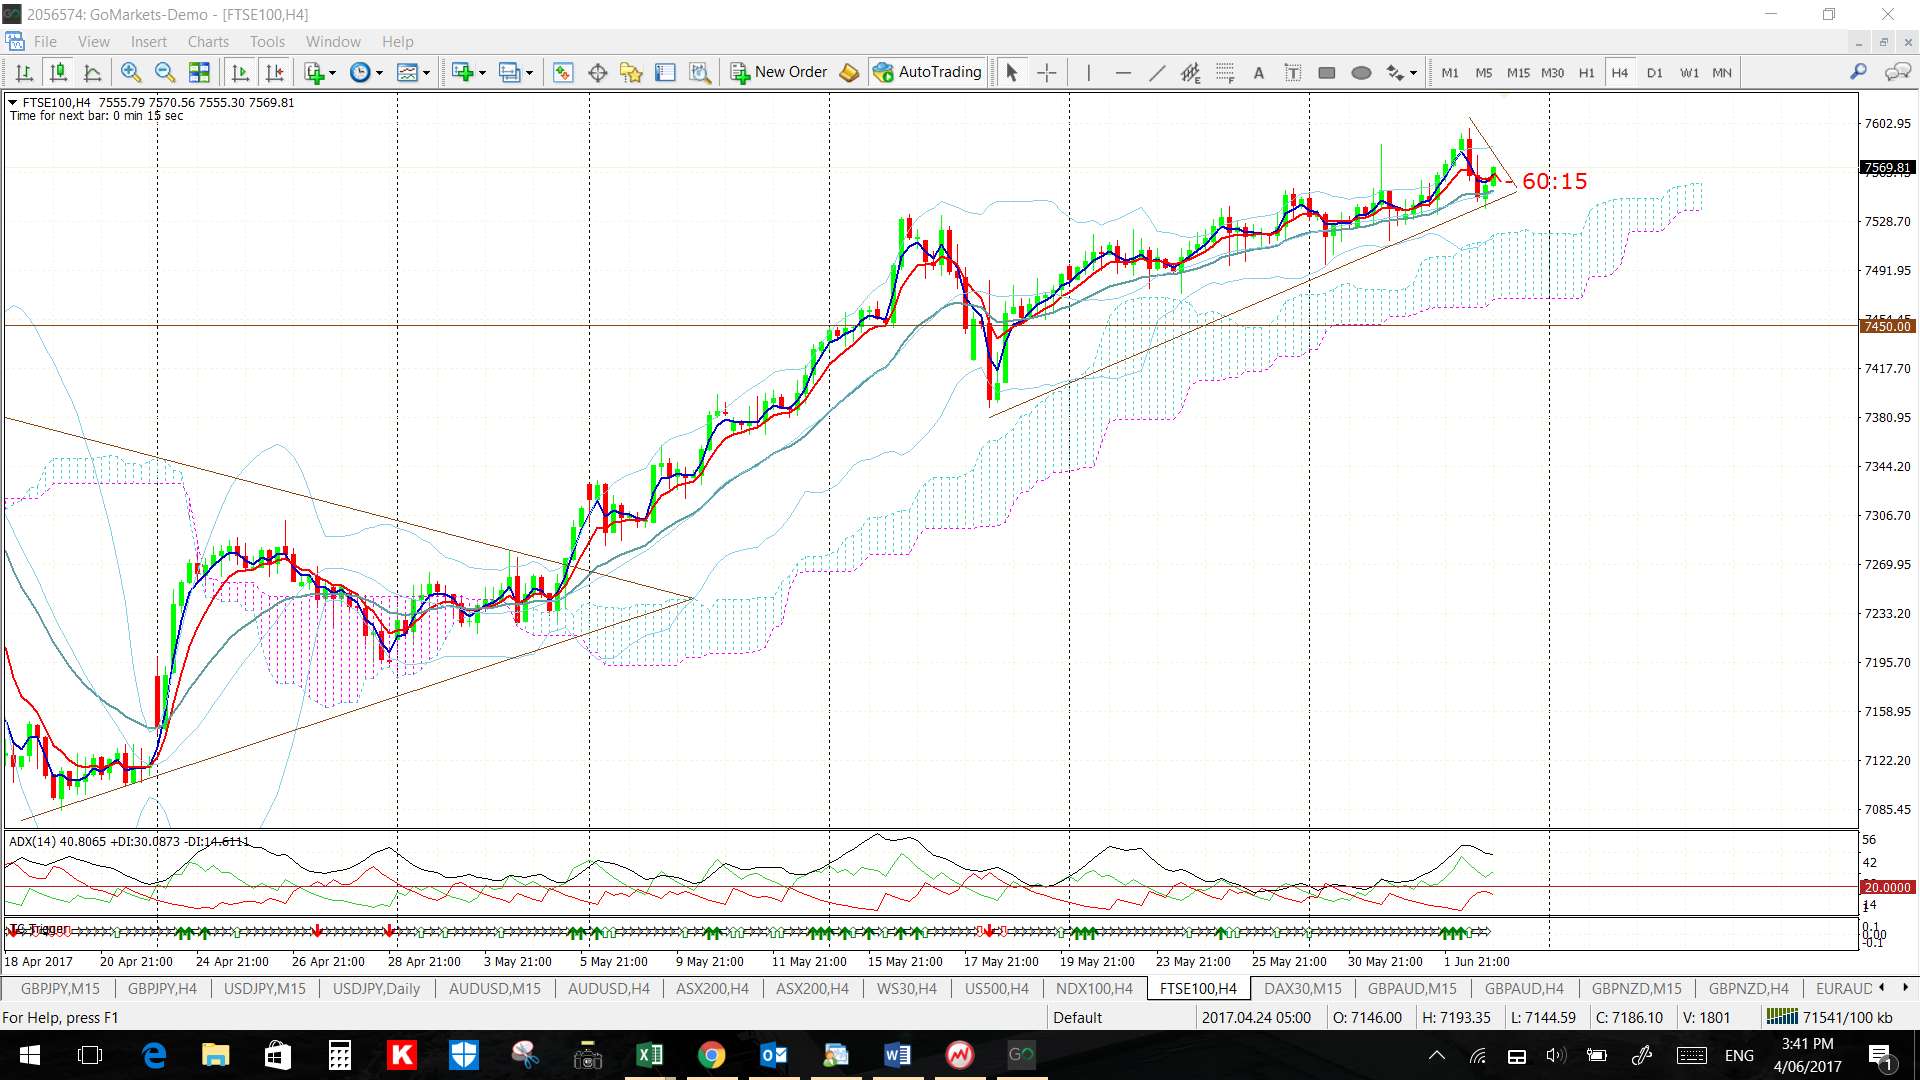
FTSE-100 4hr:
DAX-30 4hr:
ASX-200 4hr:
JP225: 4hr, daily and weekly charts shown here:
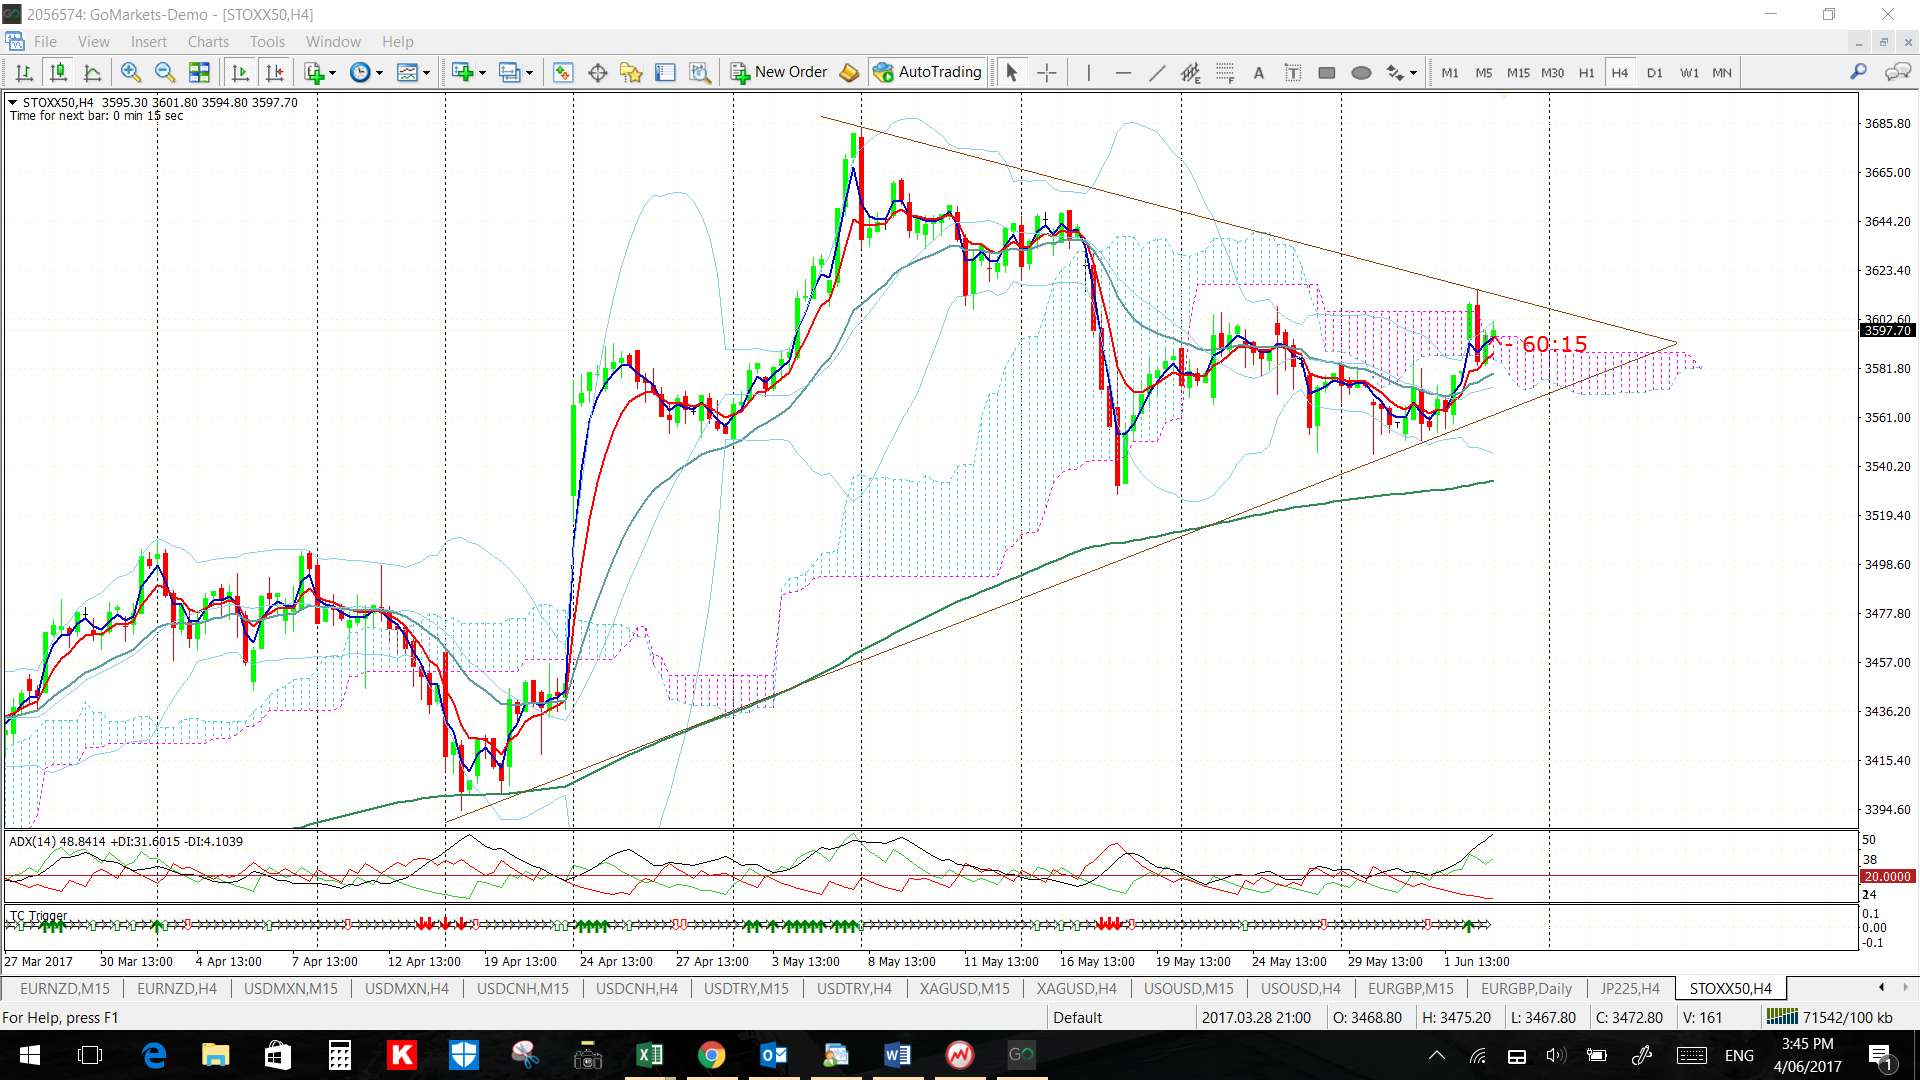
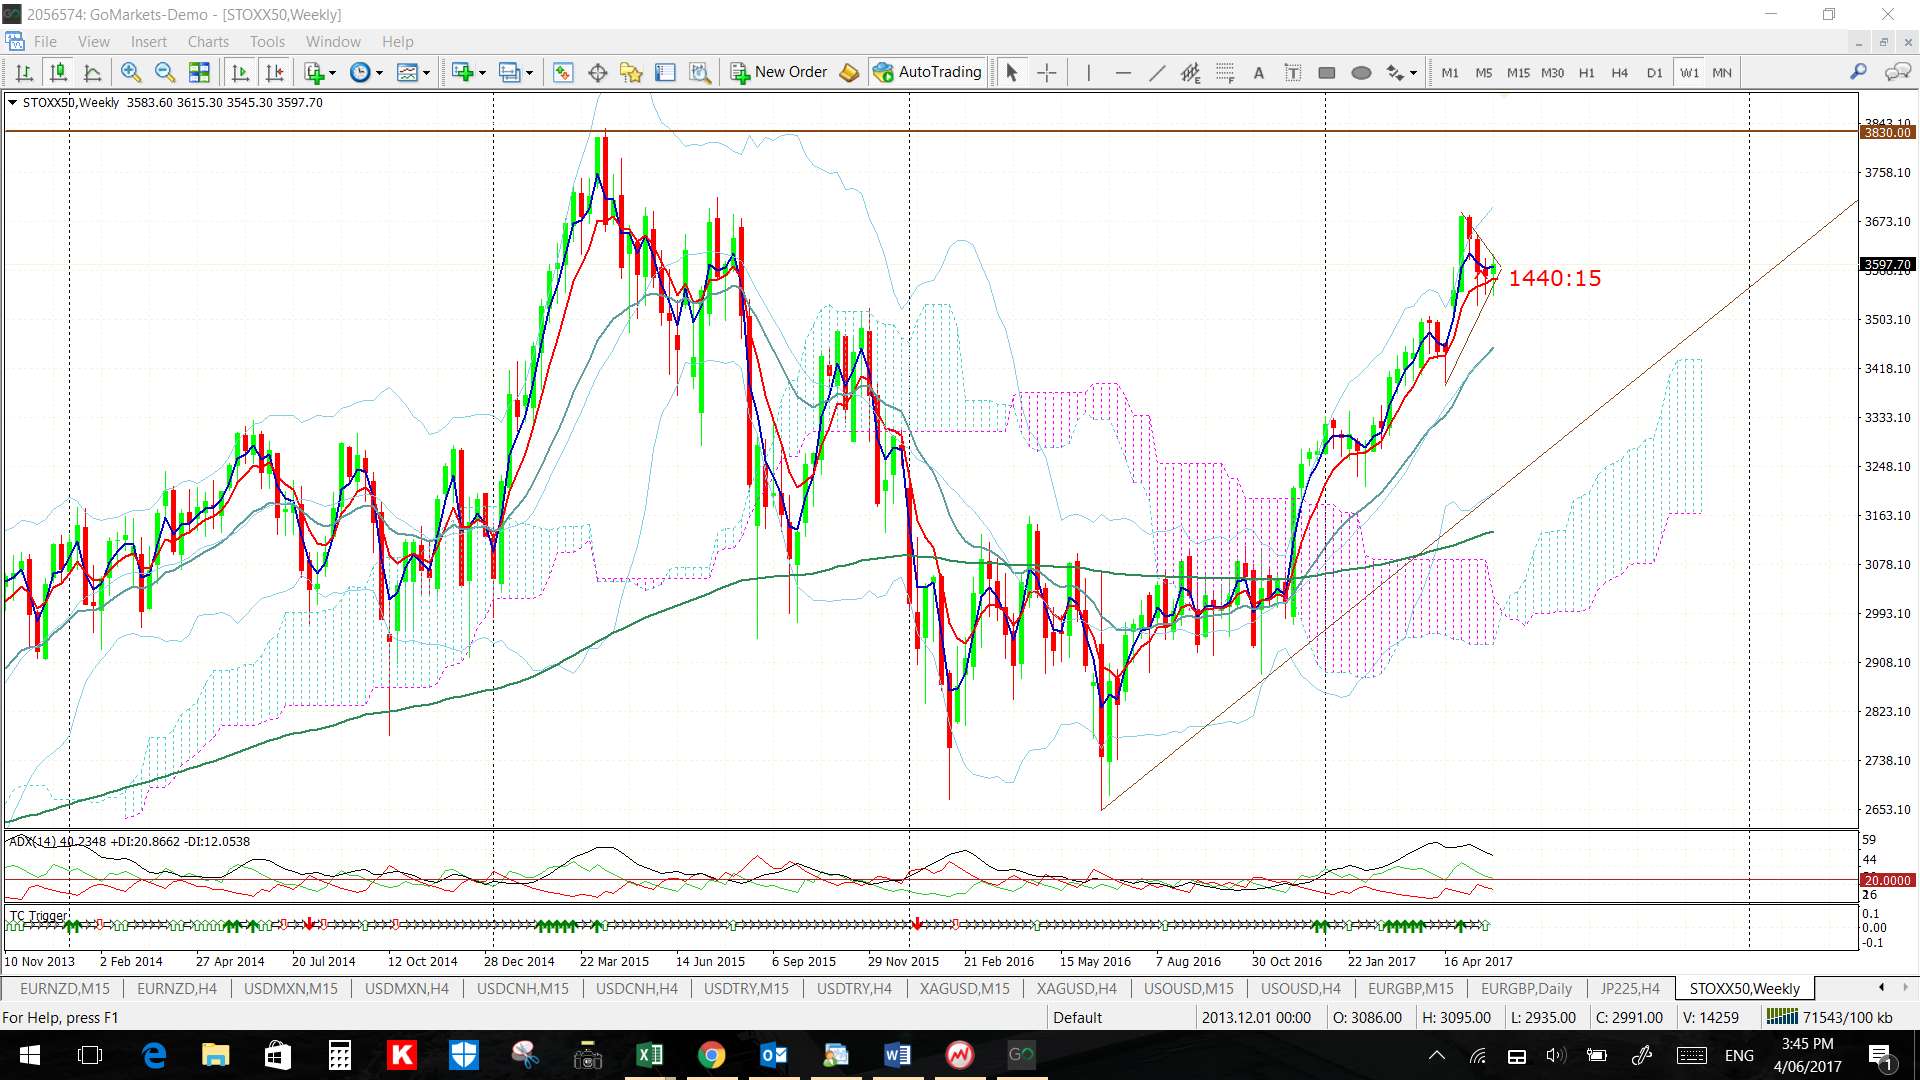
STOXX50: 4hr and weekly charts shown: