Last week: Last week was another great one for trend line breakout trades with the pip tally yielding over 2,800 pips. This is a huge haul and to think it was possible to grab these moves by simply watching for the break of a trend line! Even better news is that there are further patterns with trend lines to watch for potential breakout trades in the coming week; some existing and some new. Potential breakout trades are been monitored on the EUR/USD, EUR/JPY, AUD/USD, AUD/JPY, NZD/USD, GBP/USD, USD/JPY, GBP/JPY, GBP/AUD, USD/MXN, USD/TRY, EUR/GBP, EUR/NZD, Gold and the GBP/NZD.
The following is a summary of the successful breakout trades from last week including links to posts where they were described/updated.
- GBP/AUD: gave 120 pips in a triangle breakdown.
- AUD/JPY: gave 50 pips in a triangle breakout.
The following trades were most recently described in the post found through this link however up to date chart tallies can be found within this post:
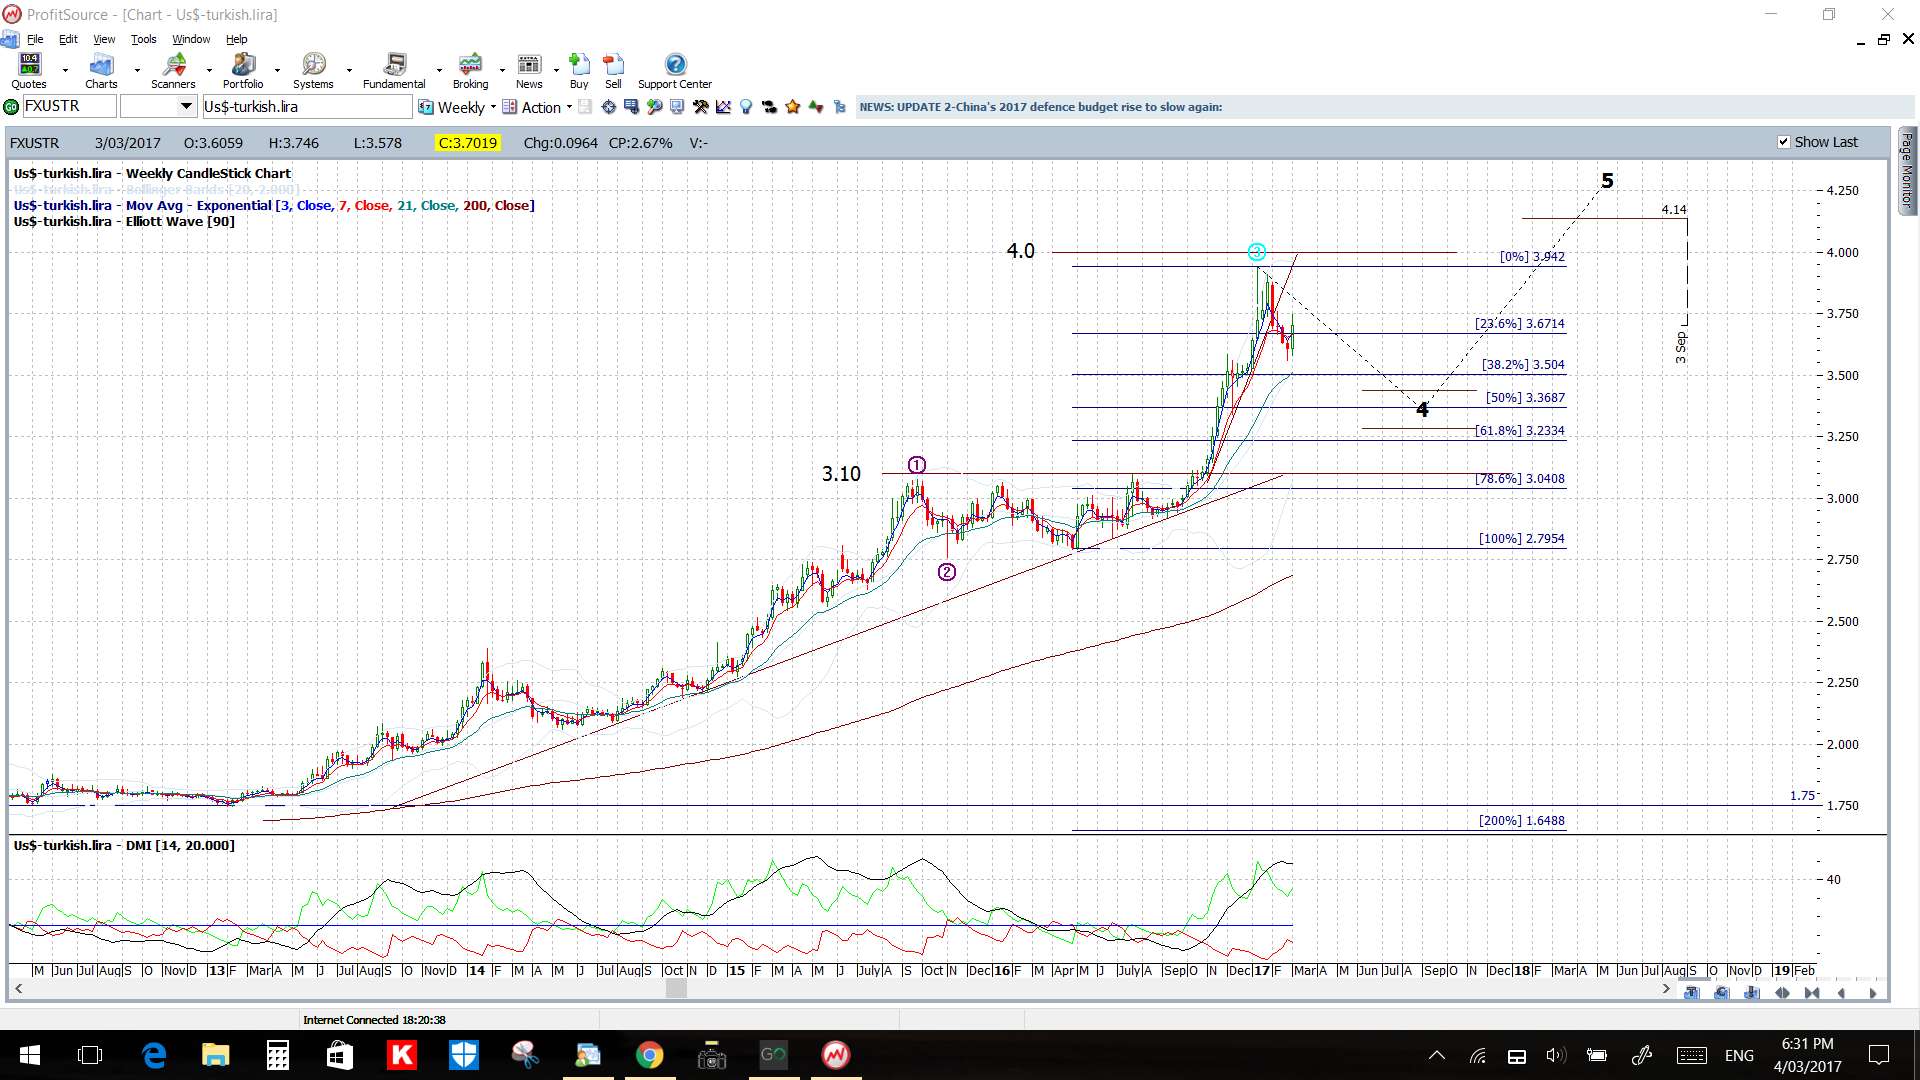
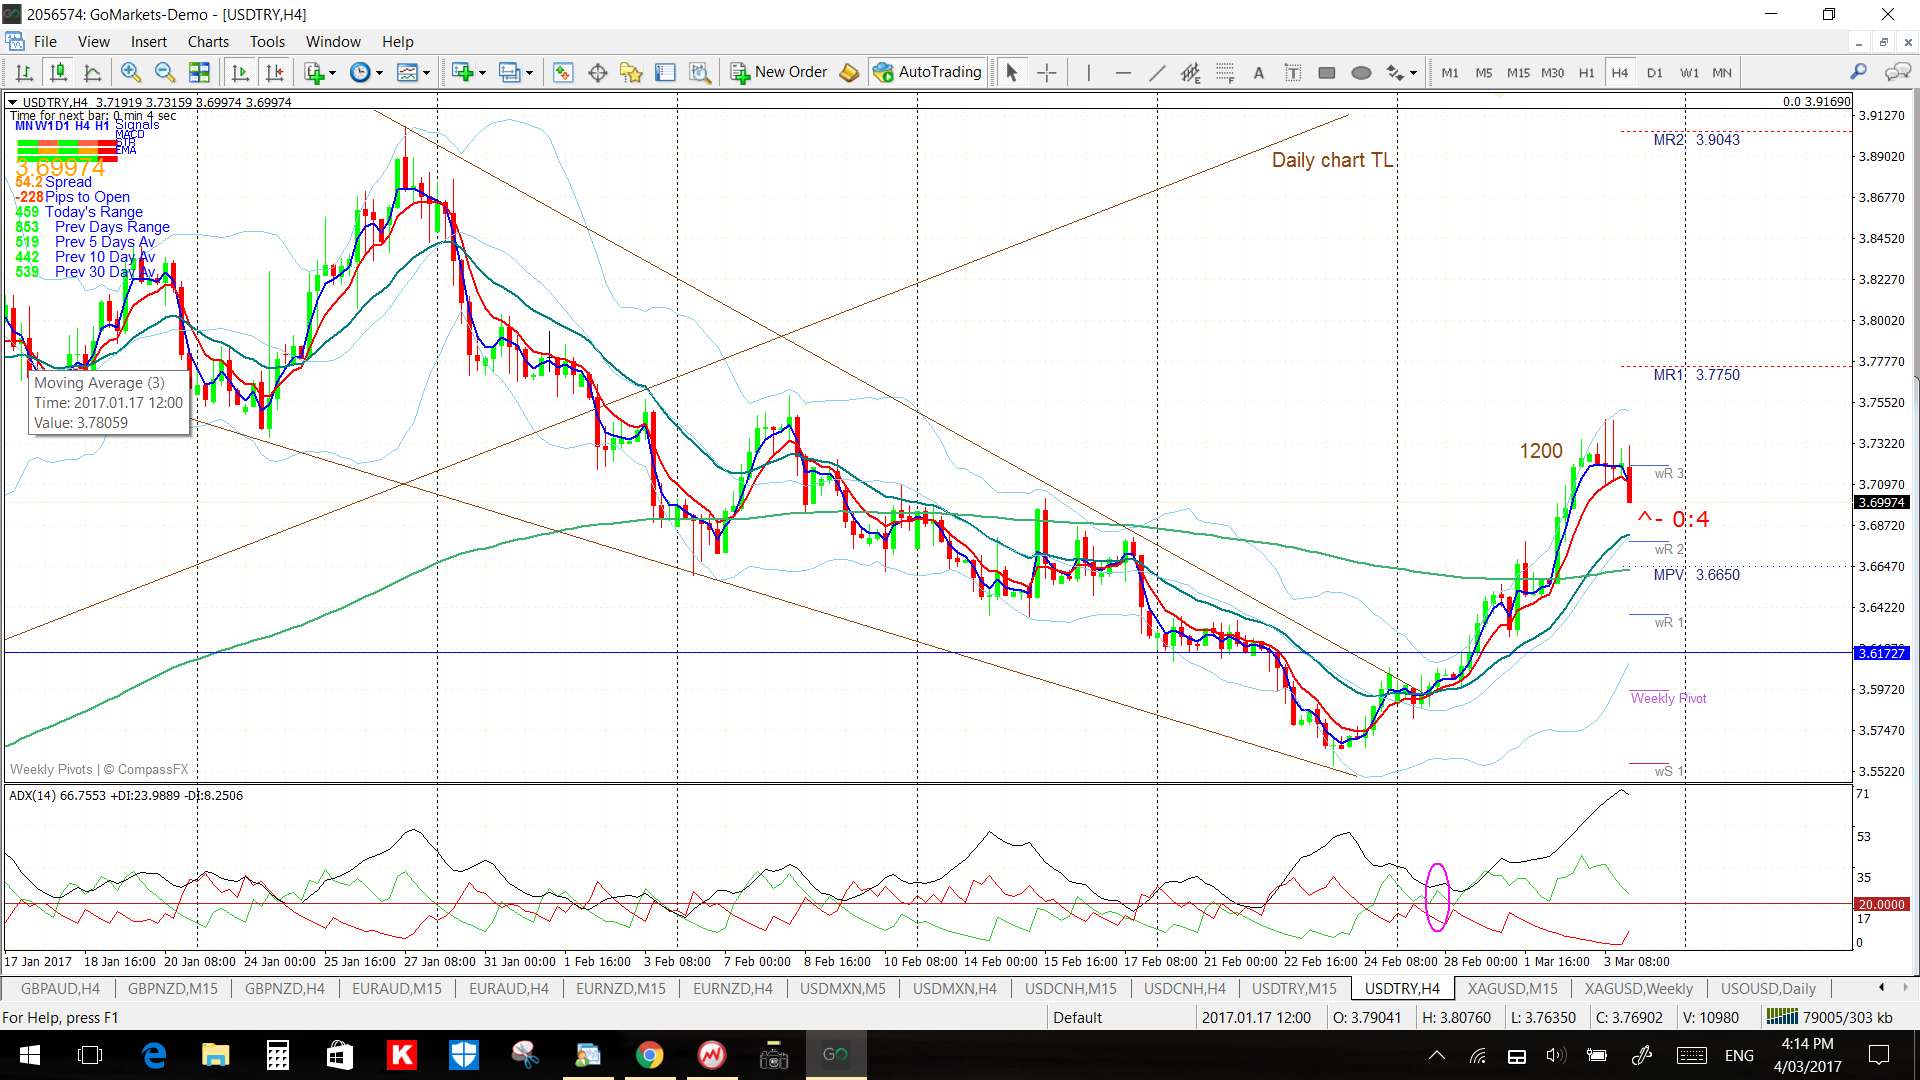
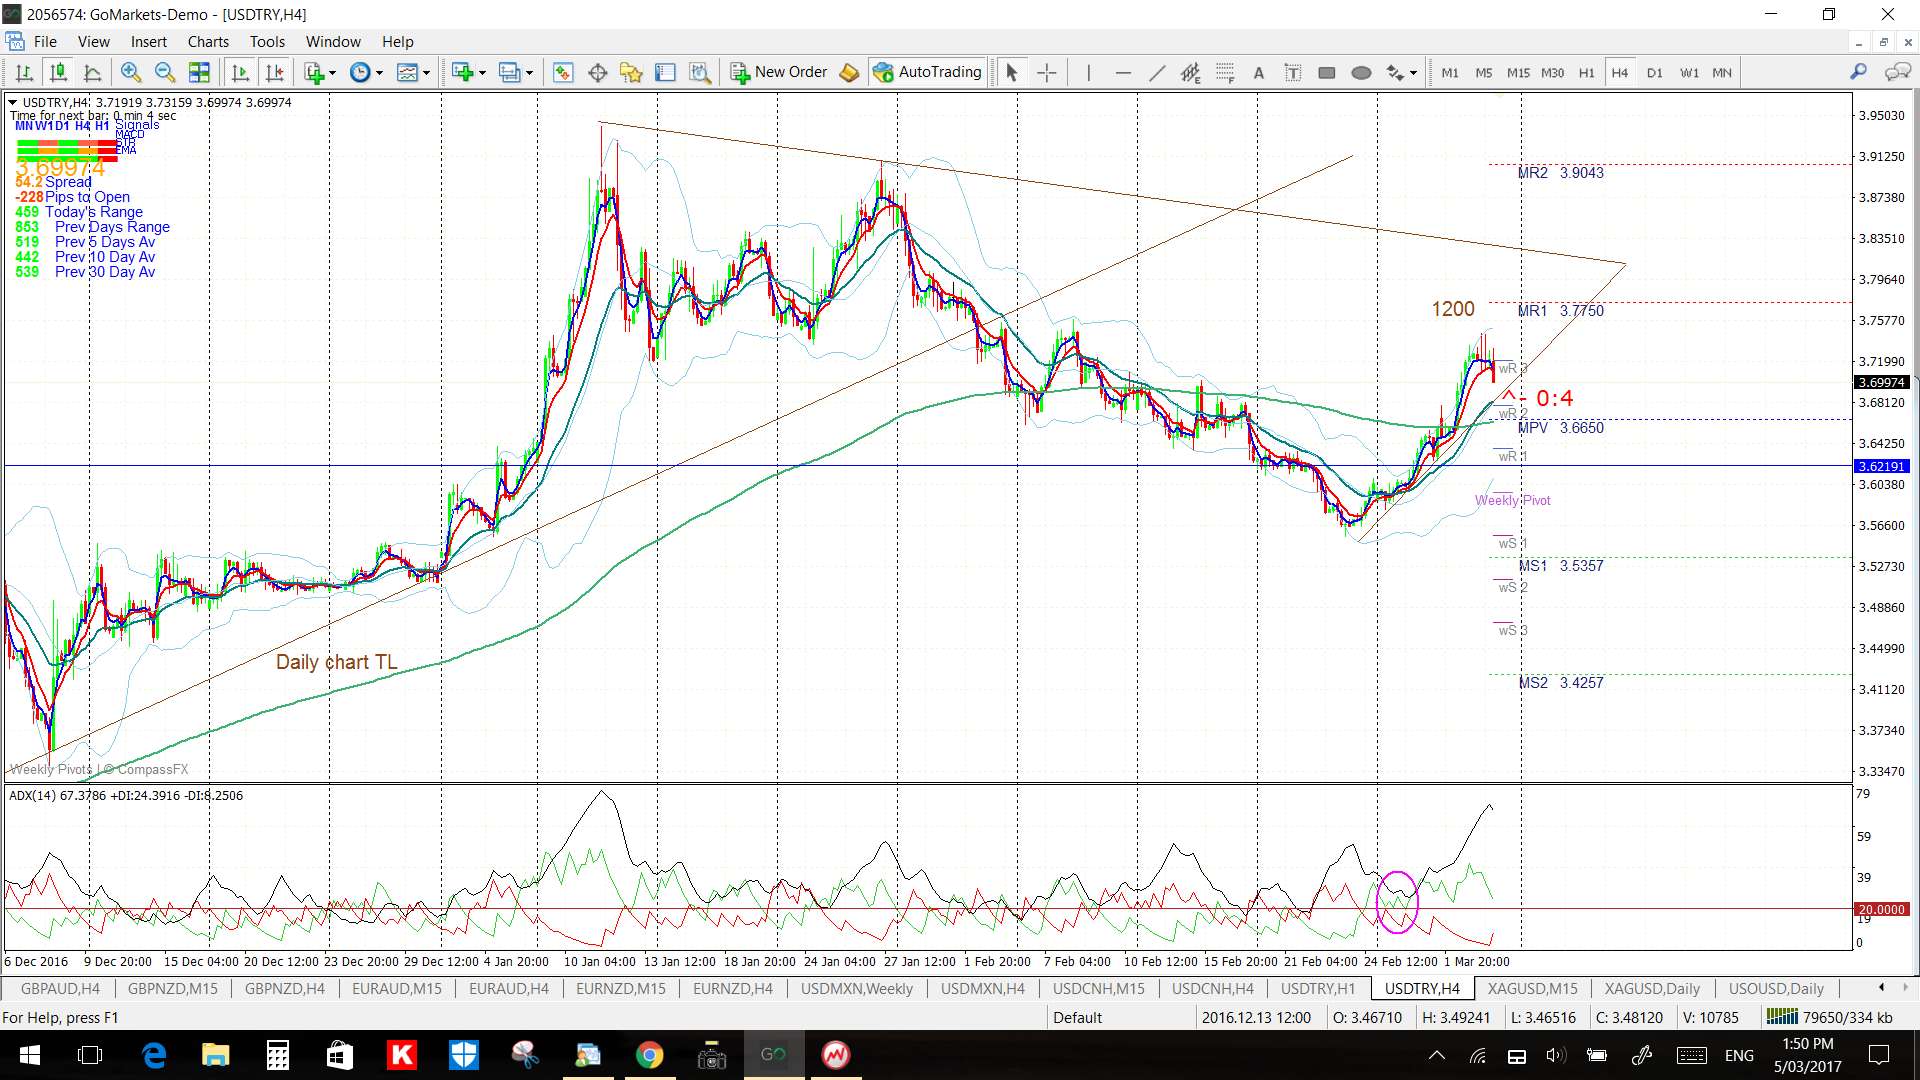
- USD/TRY: gave 1,200 pips in a wedge breakout.
- USD/JPY: gave 170 pips in a triangle breakout.
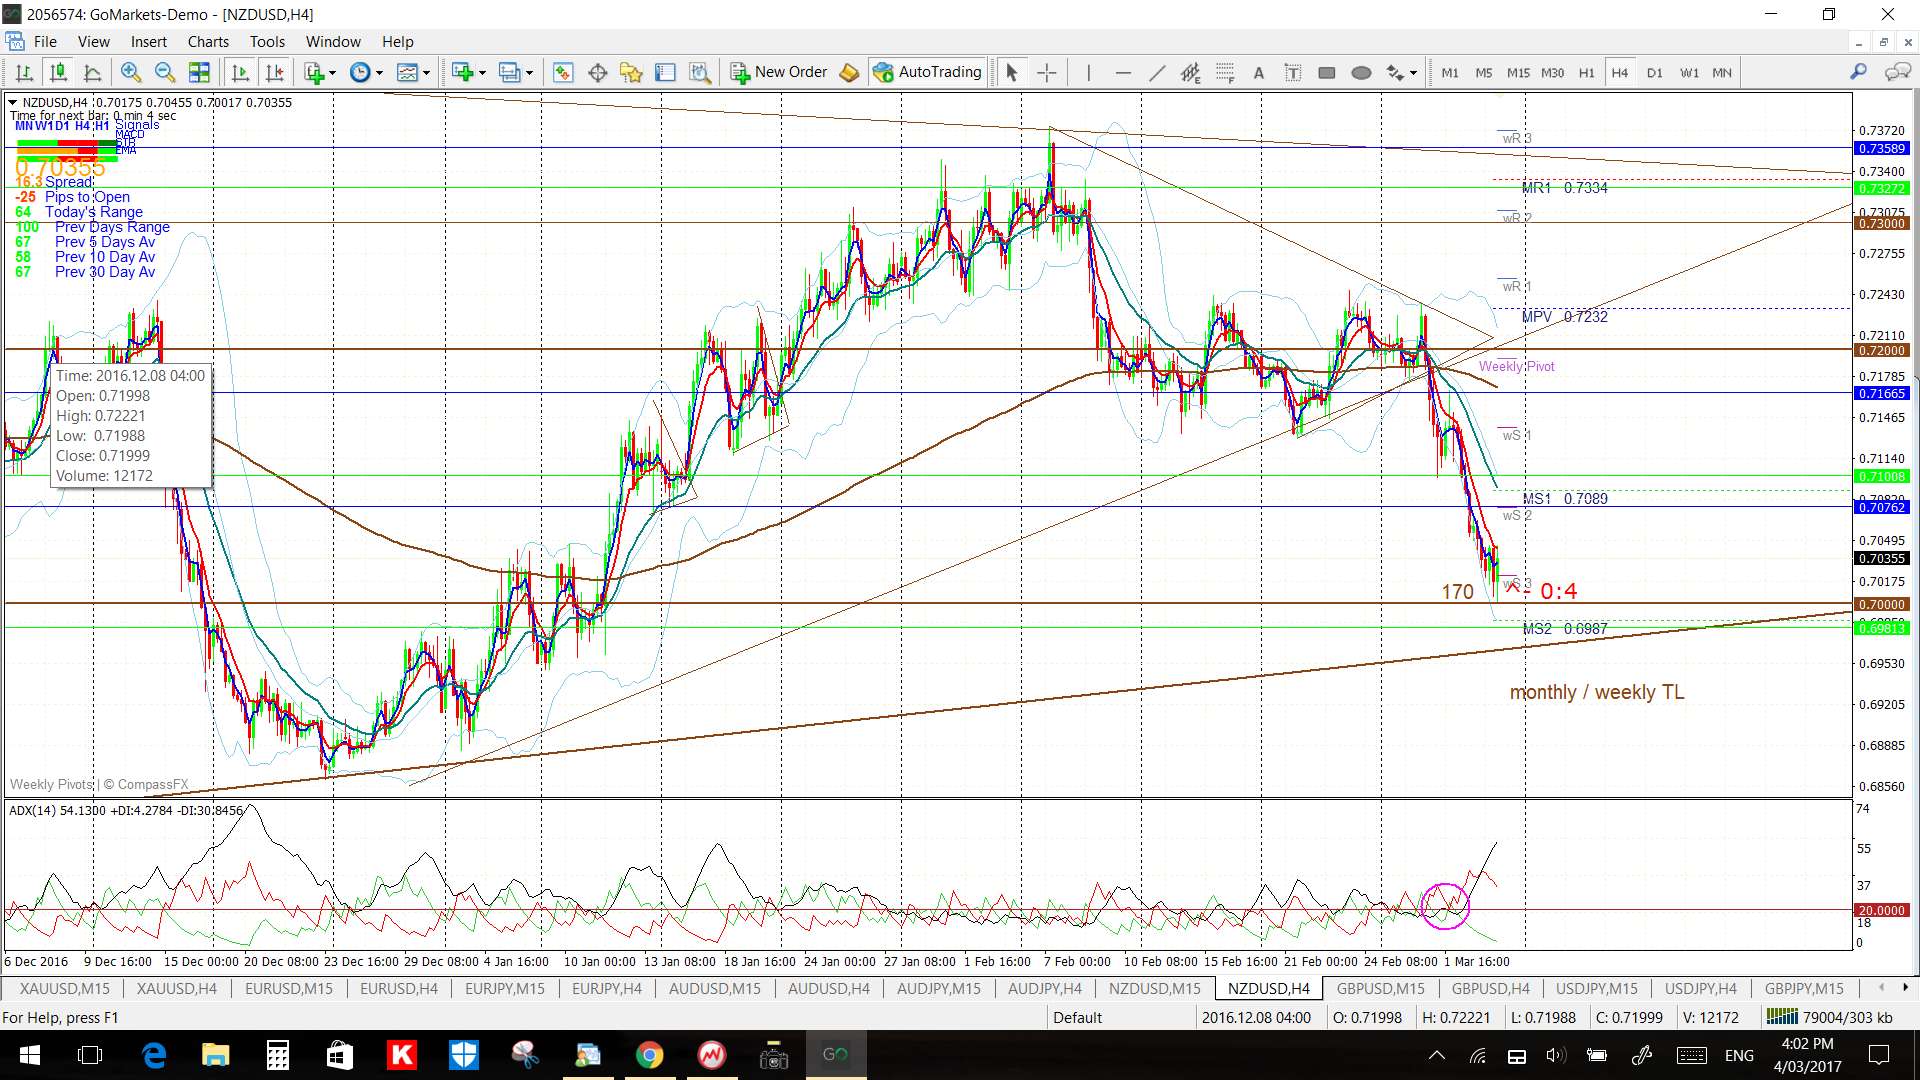
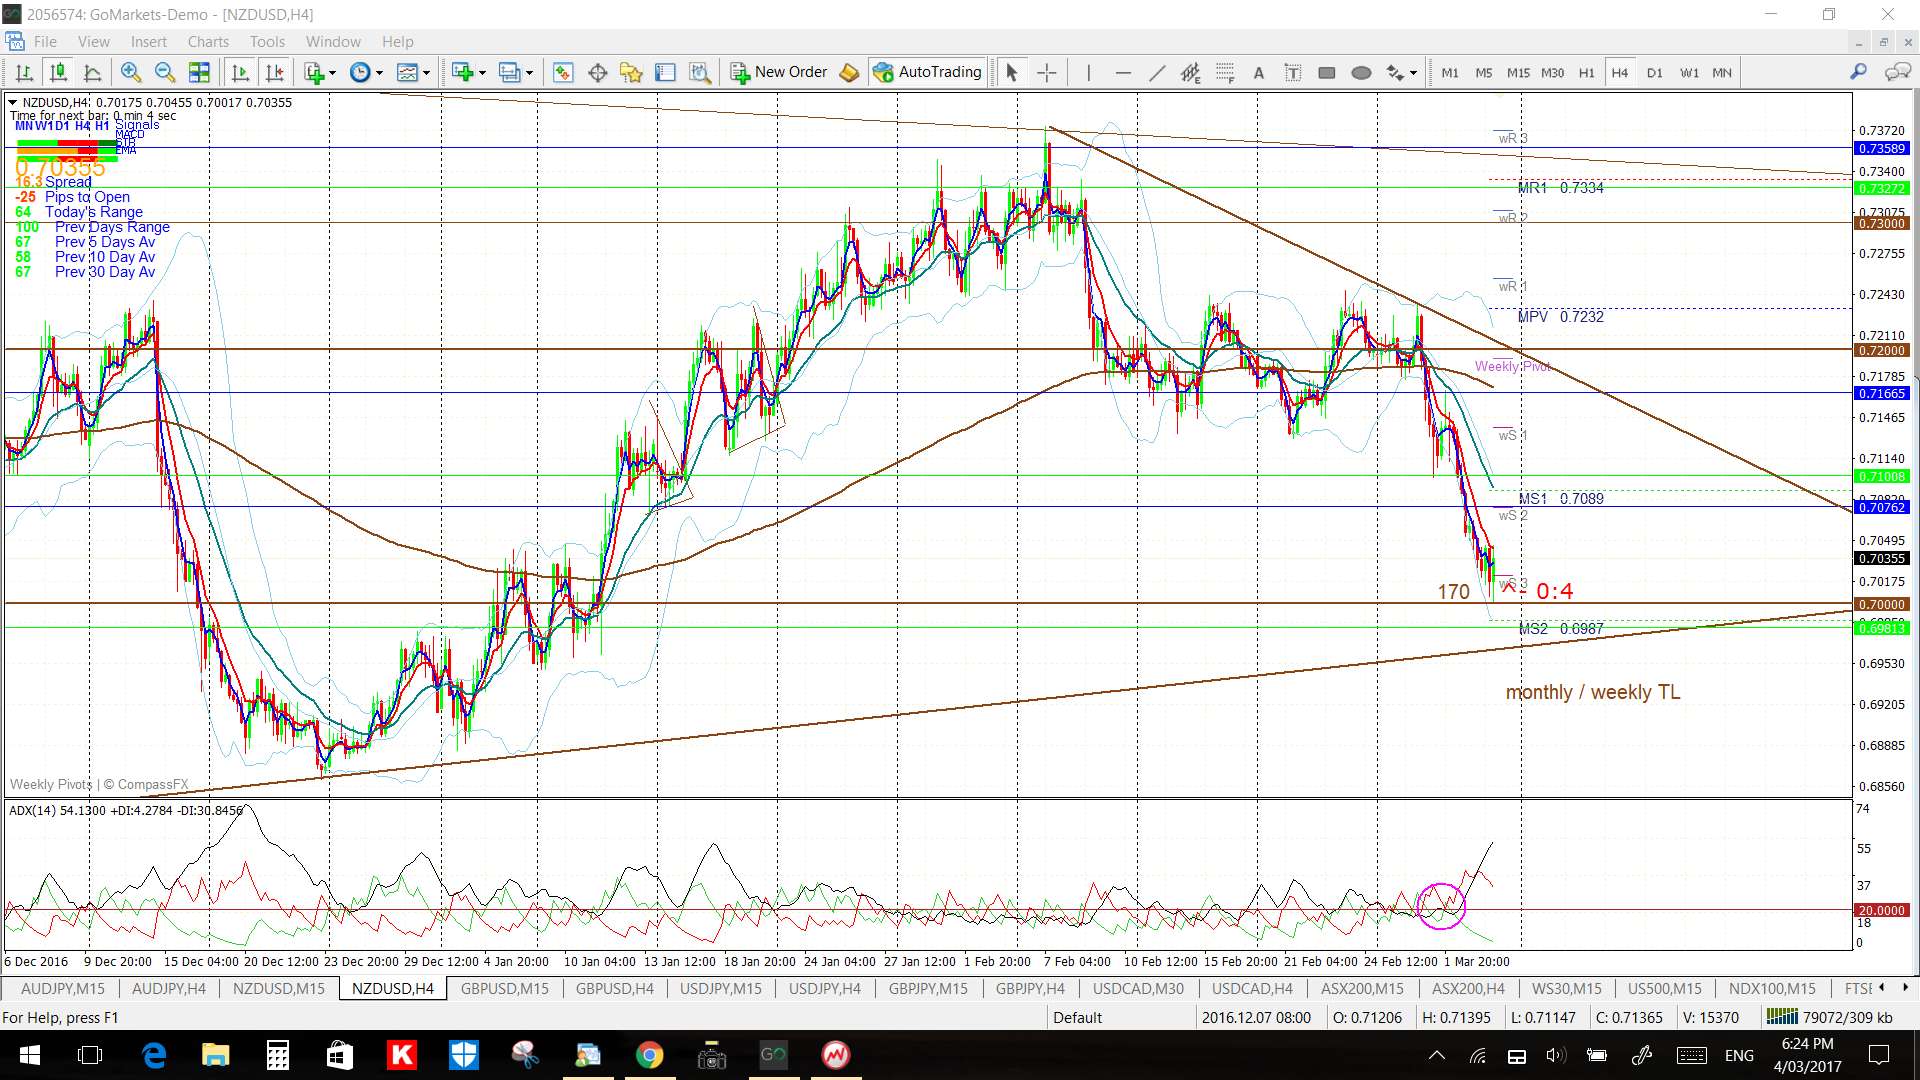
- NZD/USD: gave 170 pips in a triangle breakdown.
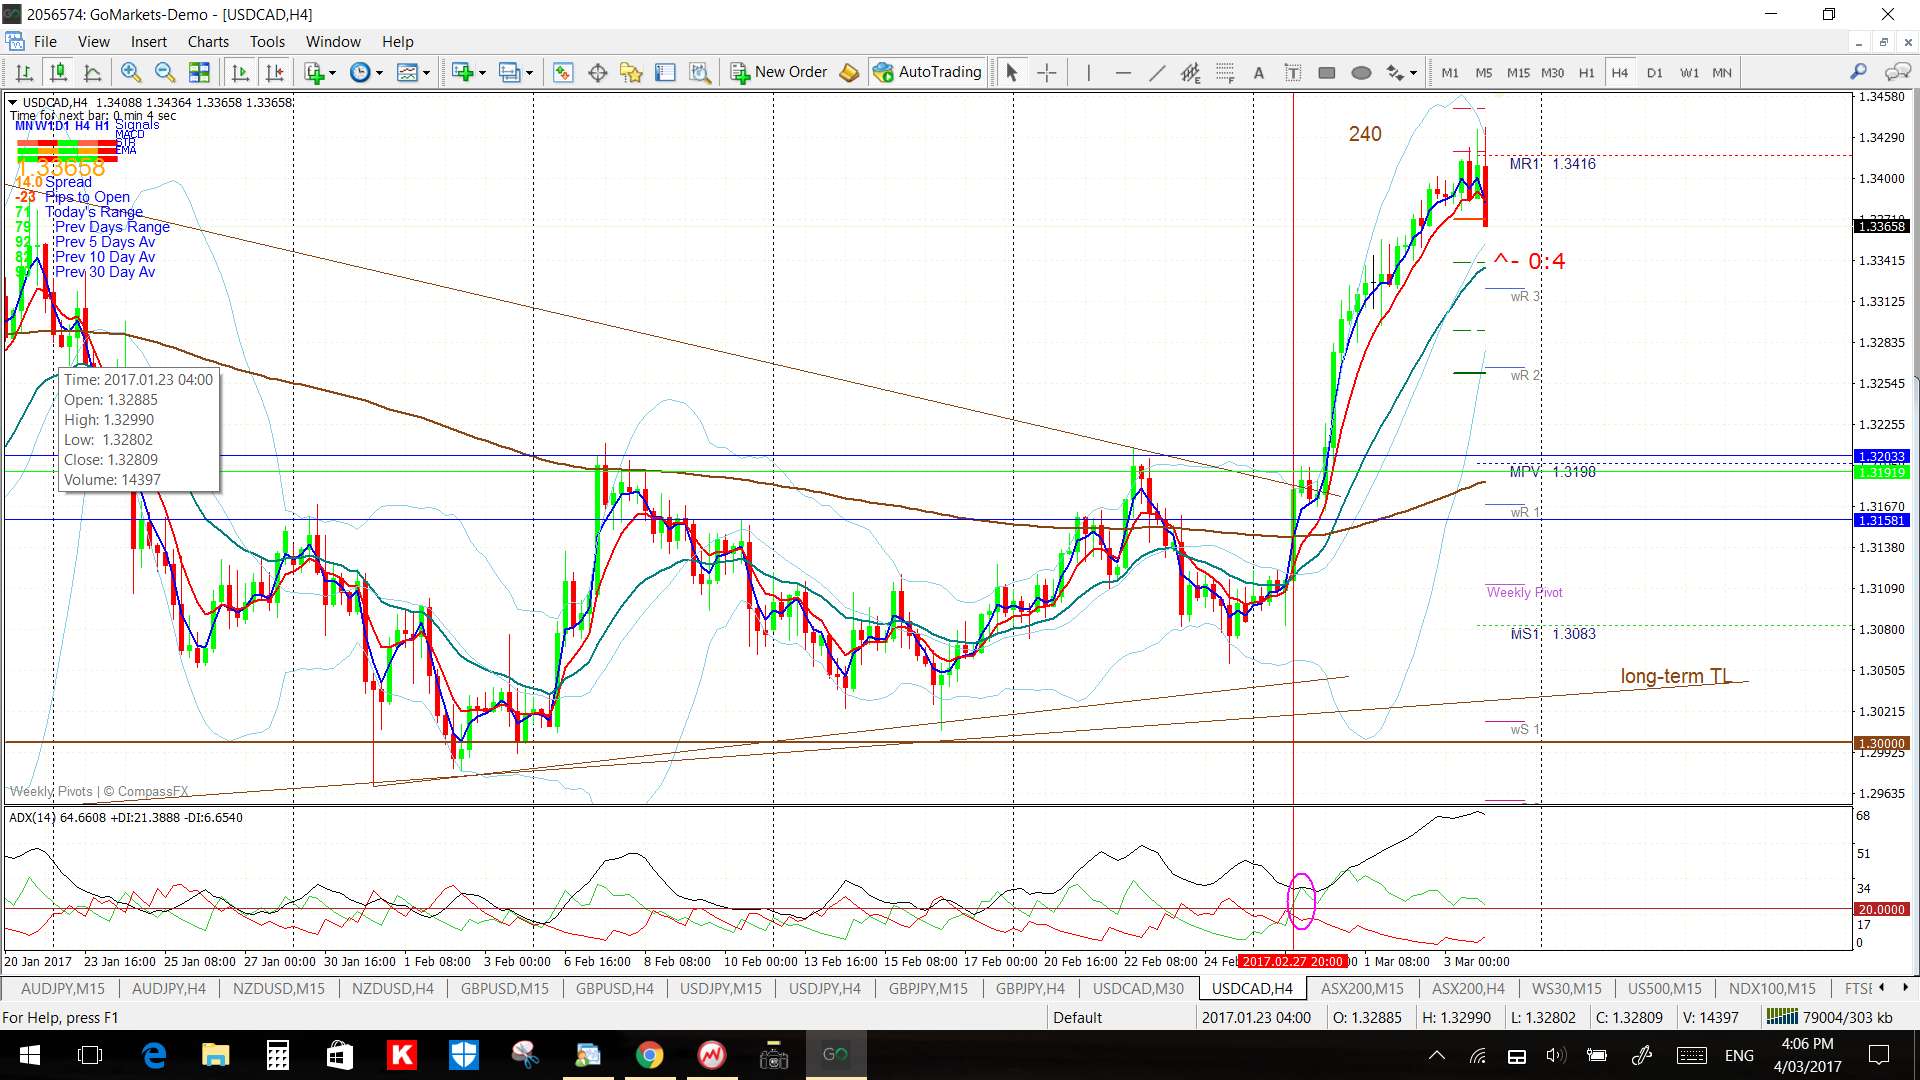
- USD/CAD: gave 240 pips in a triangle breakout.
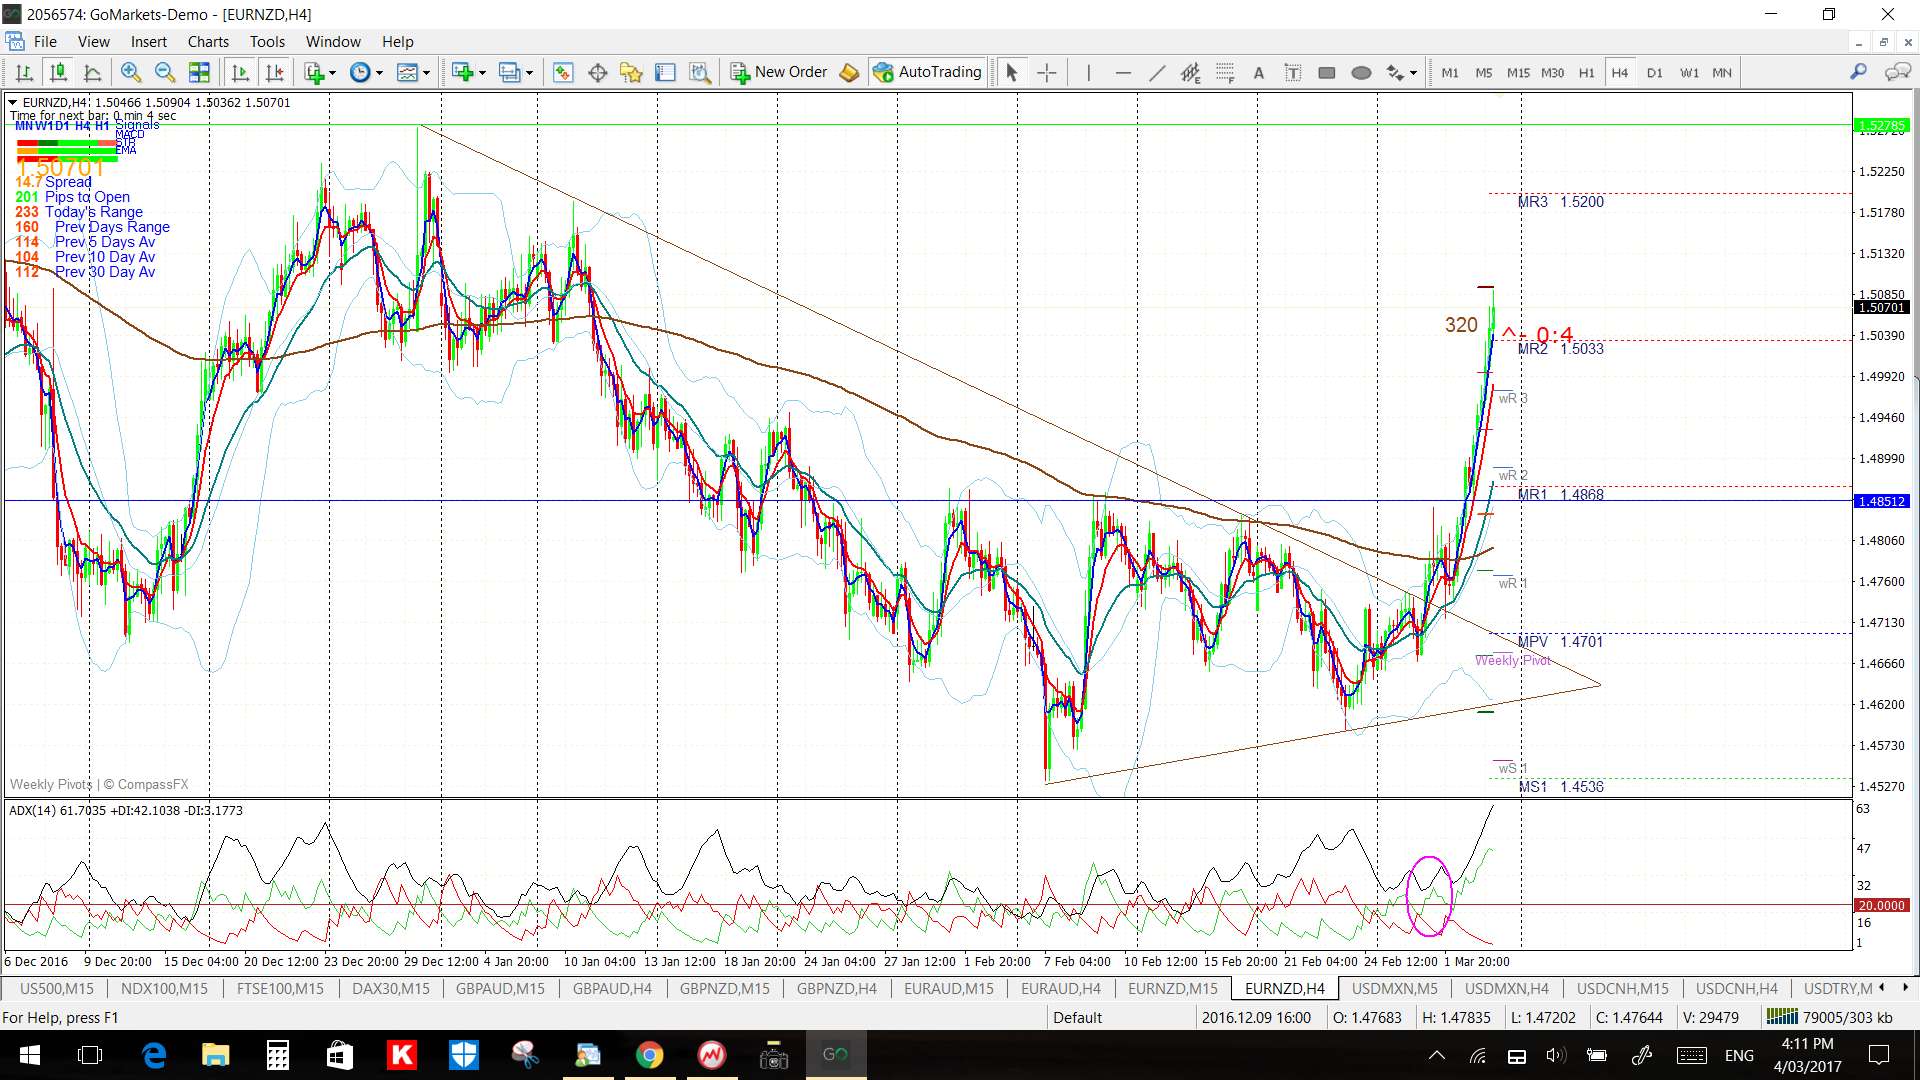
- EUR/NZD: gave 320 pips in a choppy triangle breakout.
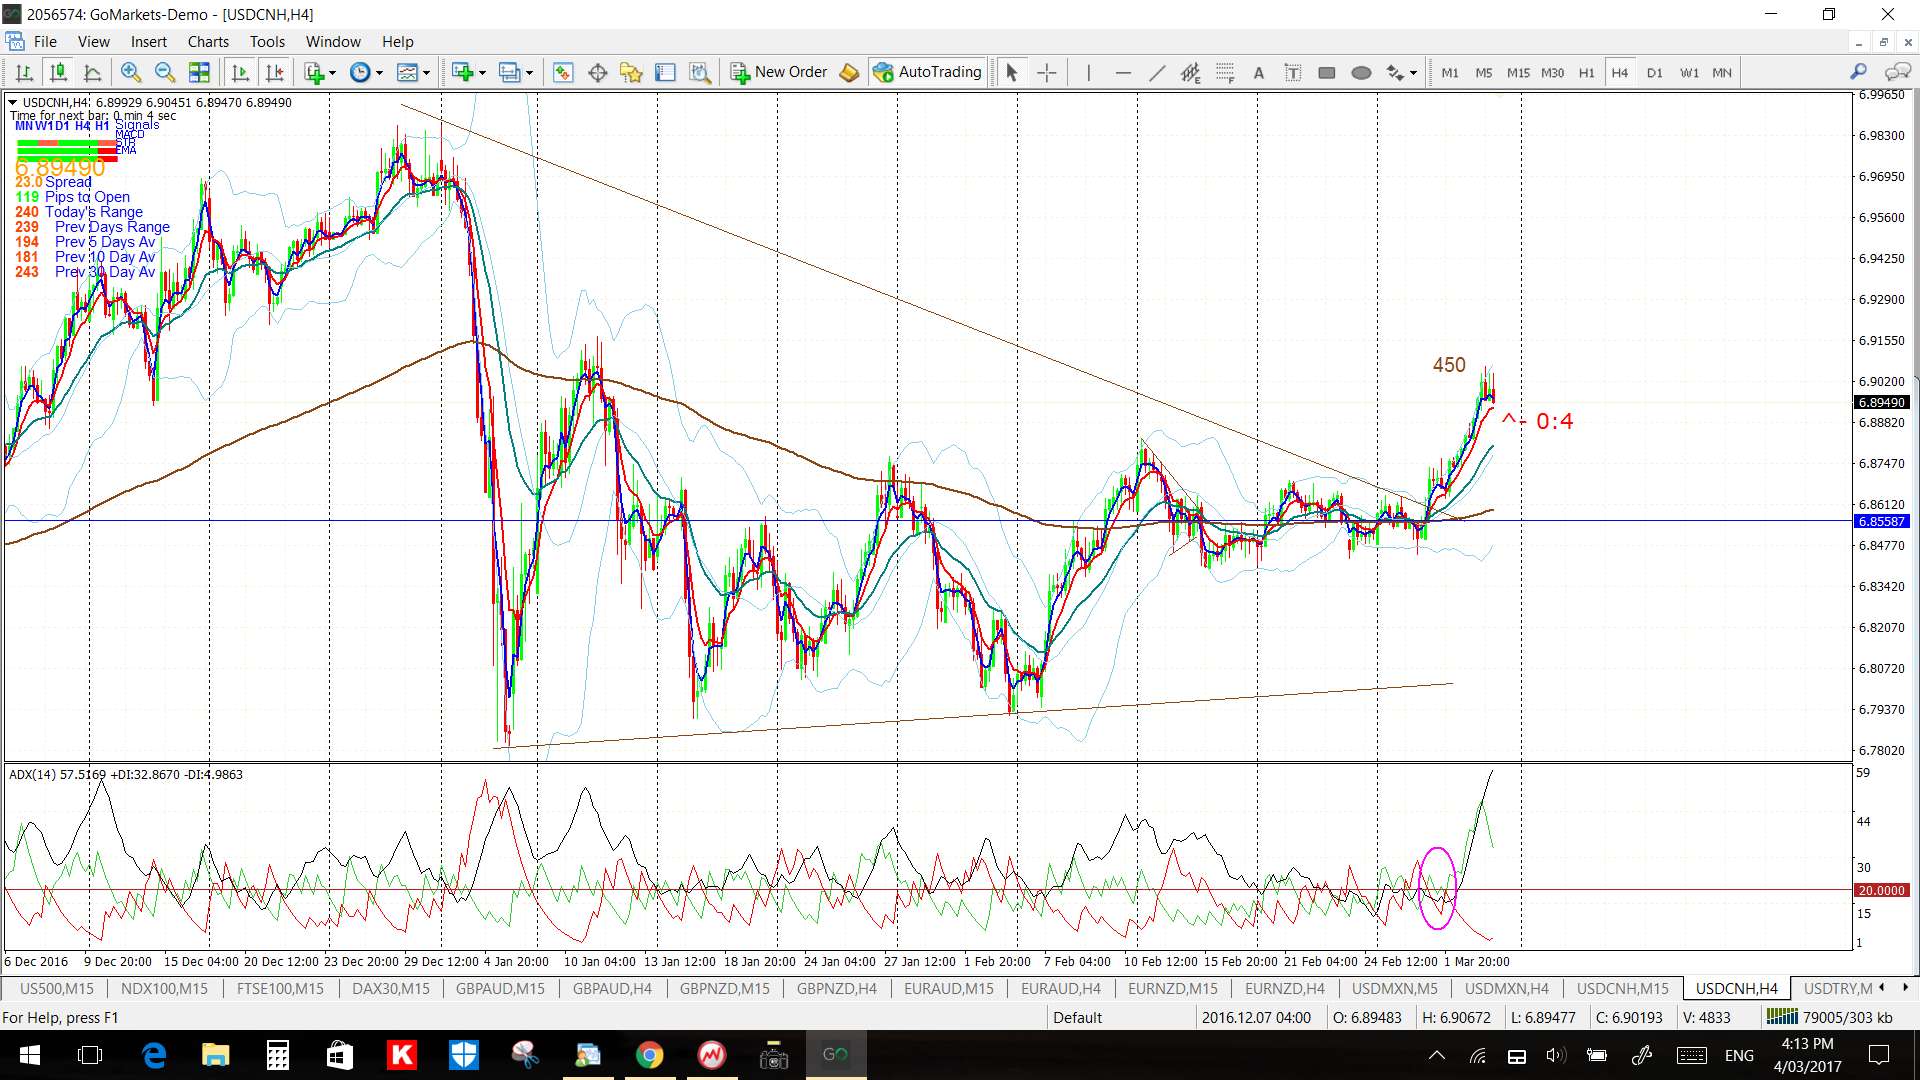
- USD/CNH: gave 450 pips in a triangle breakout.
- AUD/USD: gave 70 pips in a triangle breakdown.
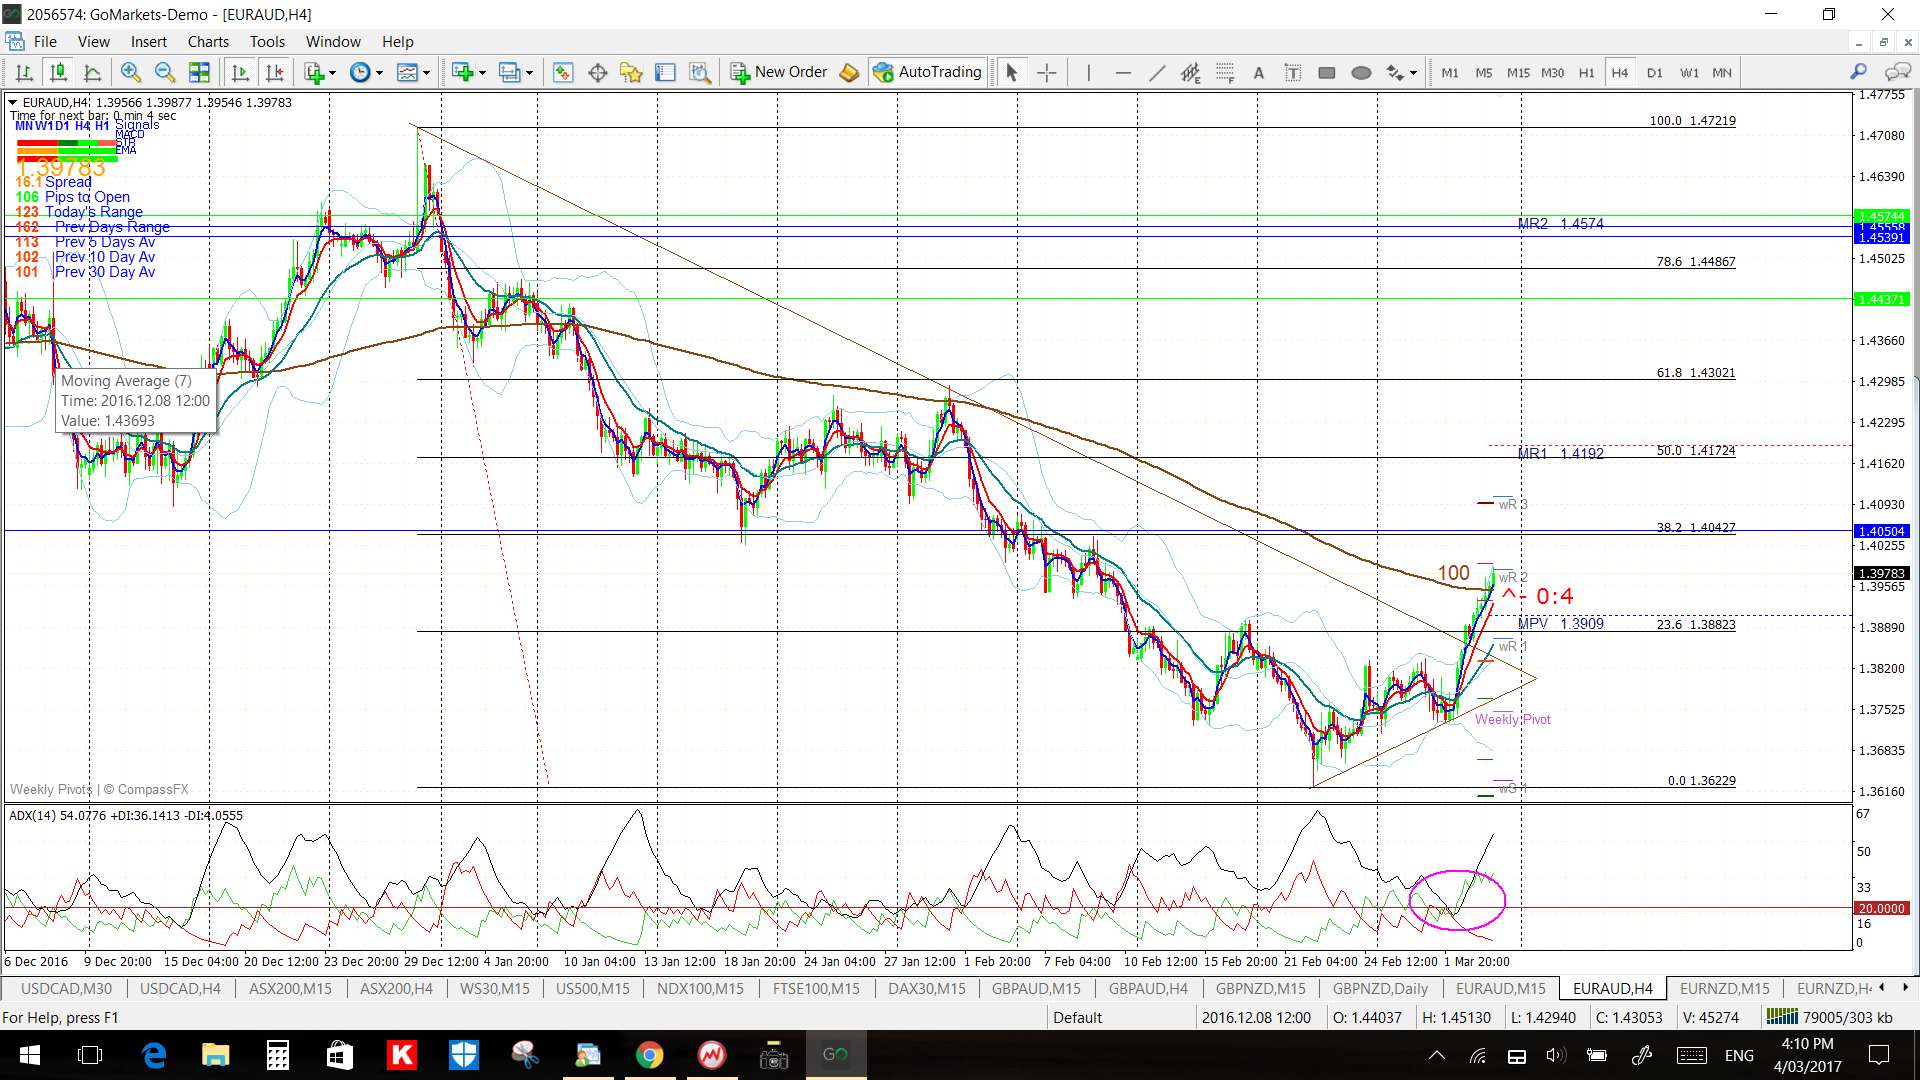
- EUR/AUD: has given 100 pips over Friday’s session as seen later in this post.
This week:
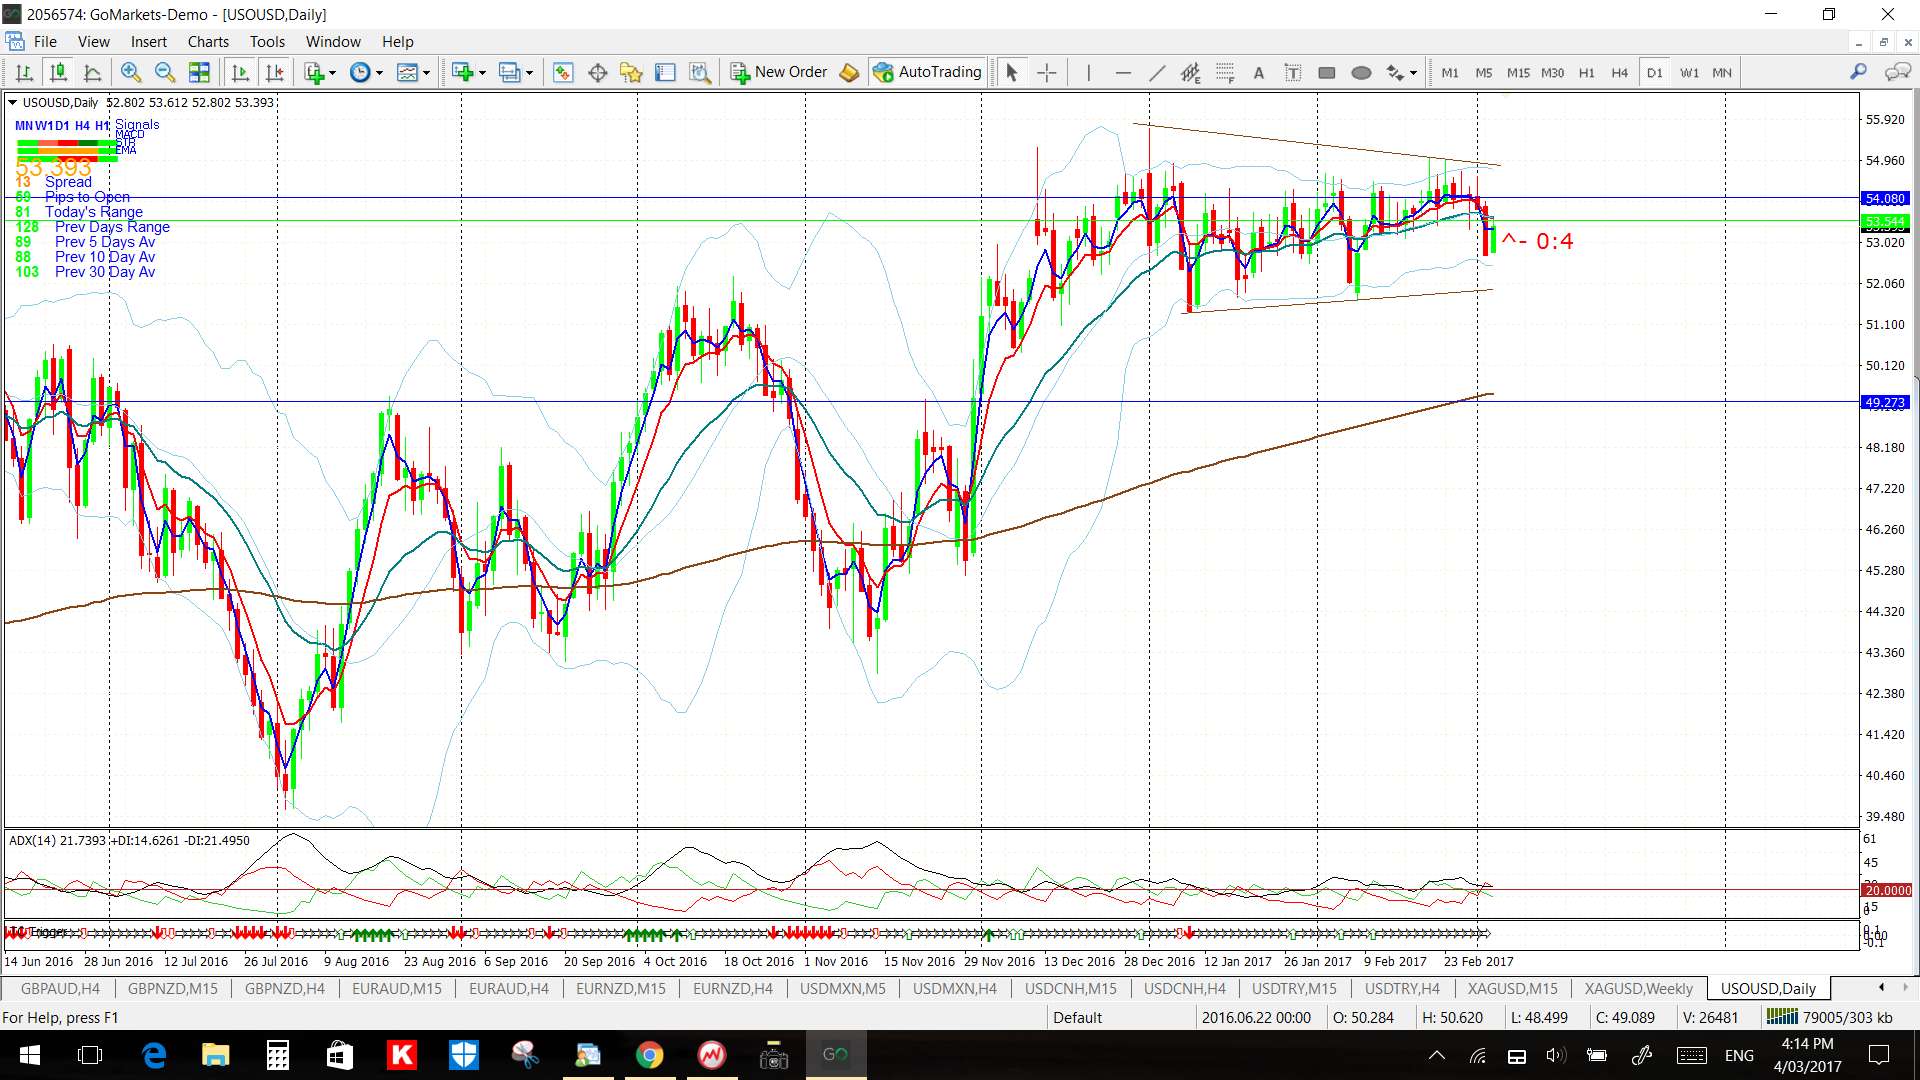
- US$: the US$ failed to hold above a major S/R level and this 102 level will be in focus again this week with NFP. A review of the index can be found through this link.
- Data: this week brings US NFP but there are also two Central banks reporting rate updates: RBA (AUD) and the ECB (EUR).
- Trend line breakouts: as mentioned above, there are lost of trend lines in focus for a number of currency pairs this week and these include: the EUR/USD, EUR/JPY, AUD/USD, AUD/JPY, NZD/USD, GBP/USD, USD/JPY, GBP/JPY, GBP/AUD, USD/MXN, USD/TRY, EUR/GBP, EUR/NZD, Gold and the GBP/NZD.
- Next w/e: updates may be delayed until the Monday as I am busy over the w/e.
Forex:
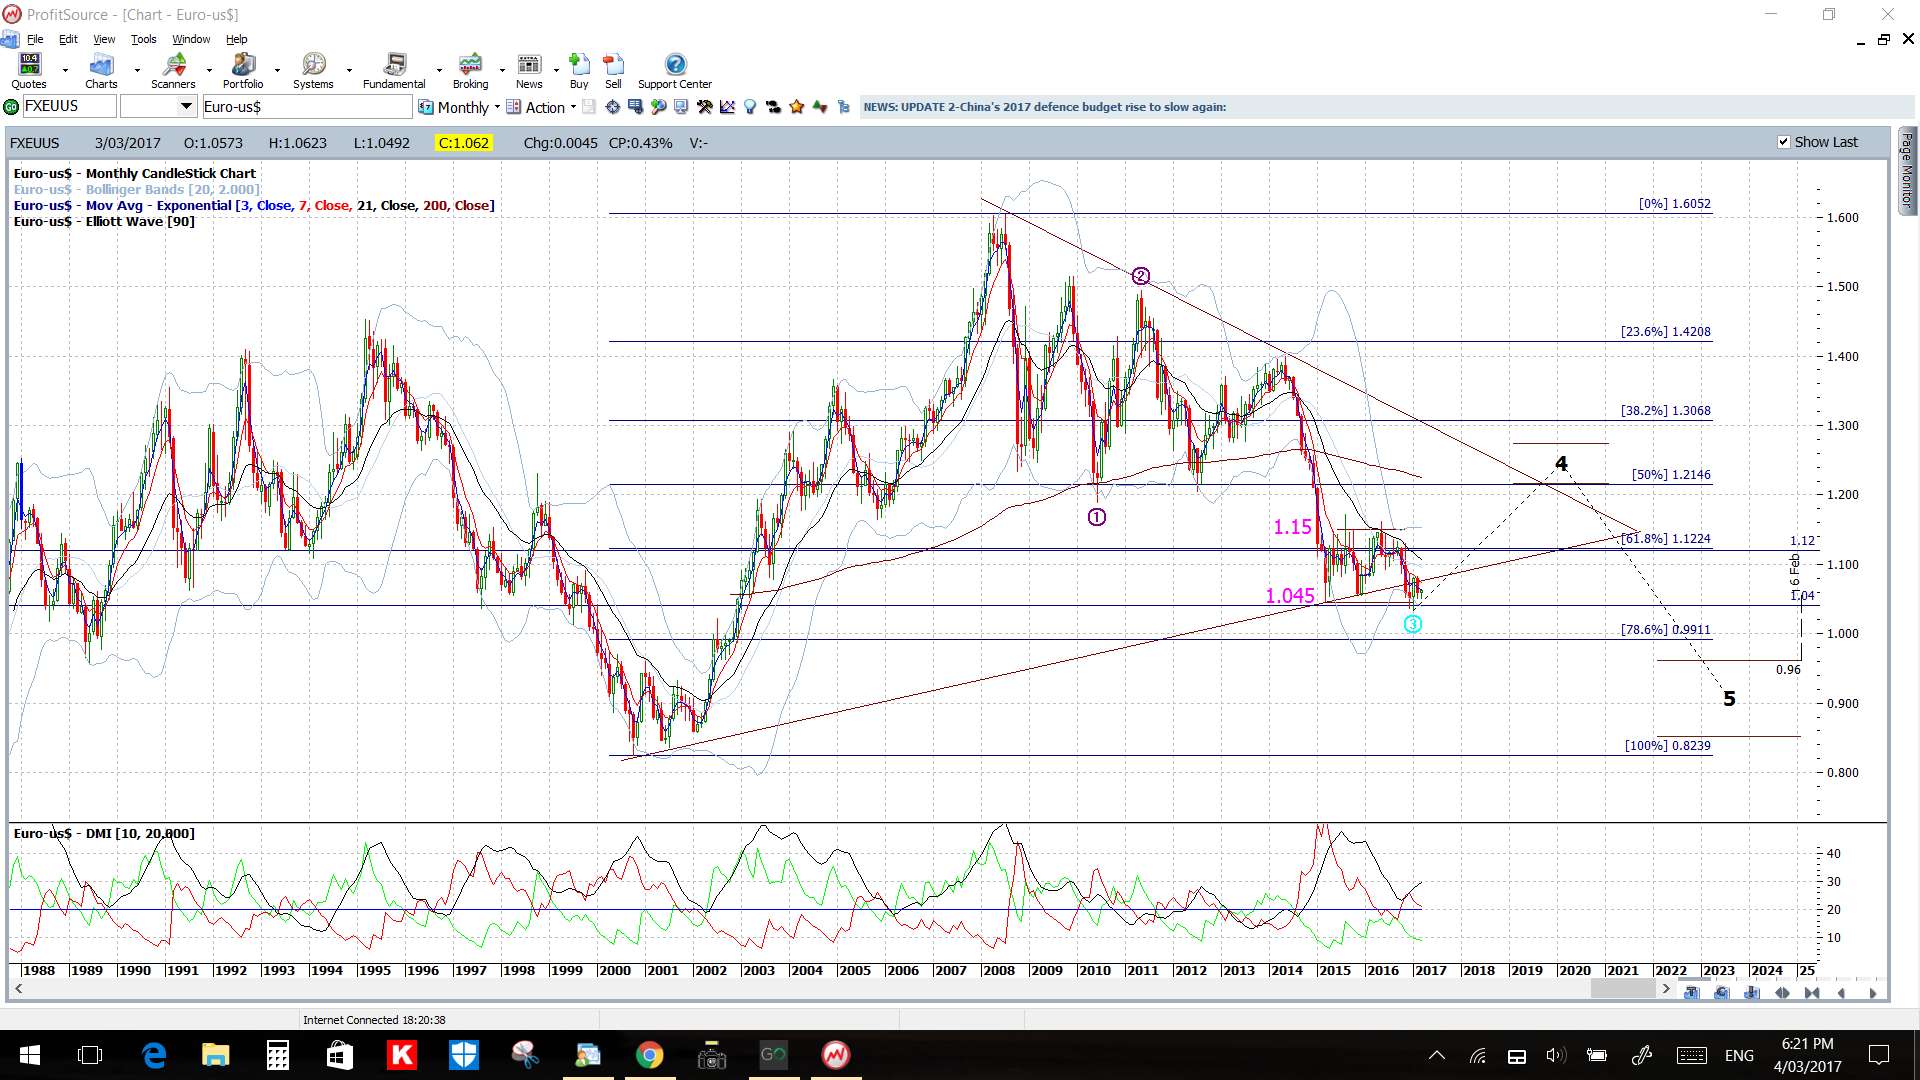
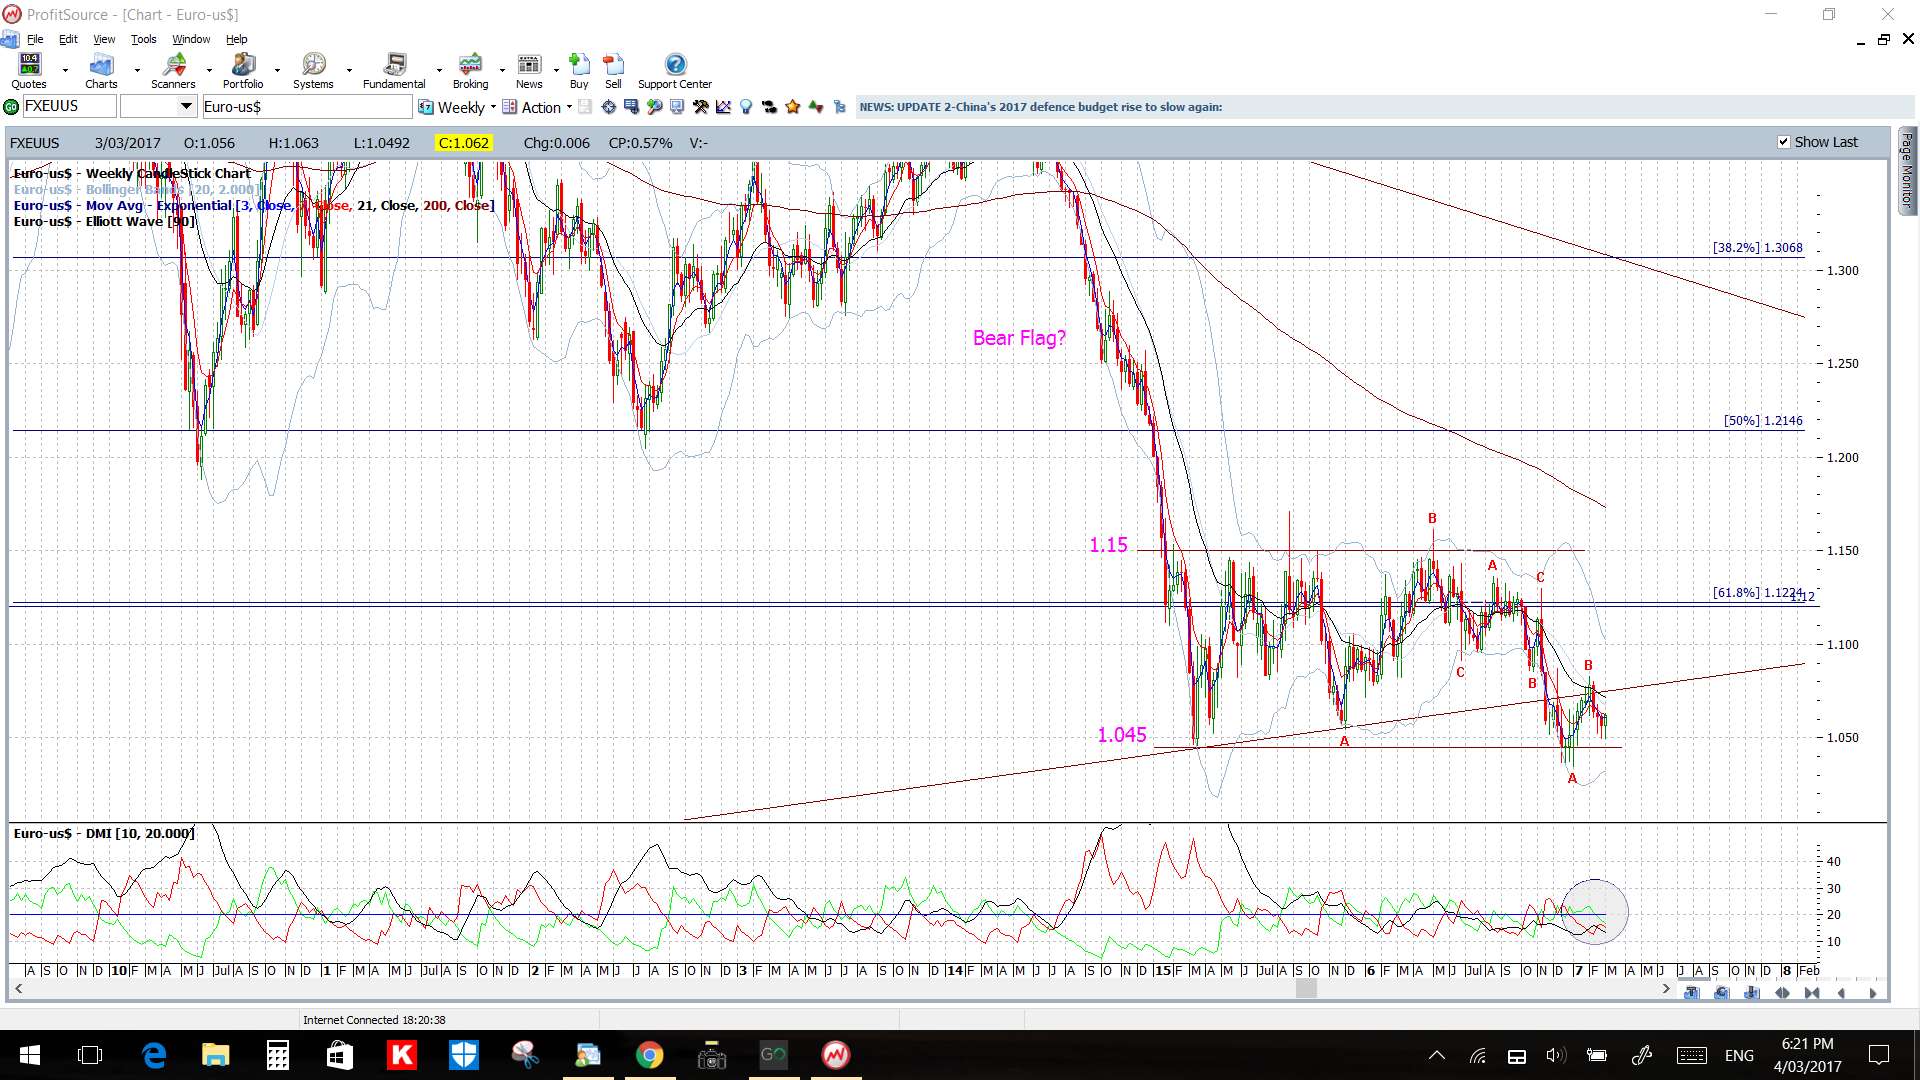
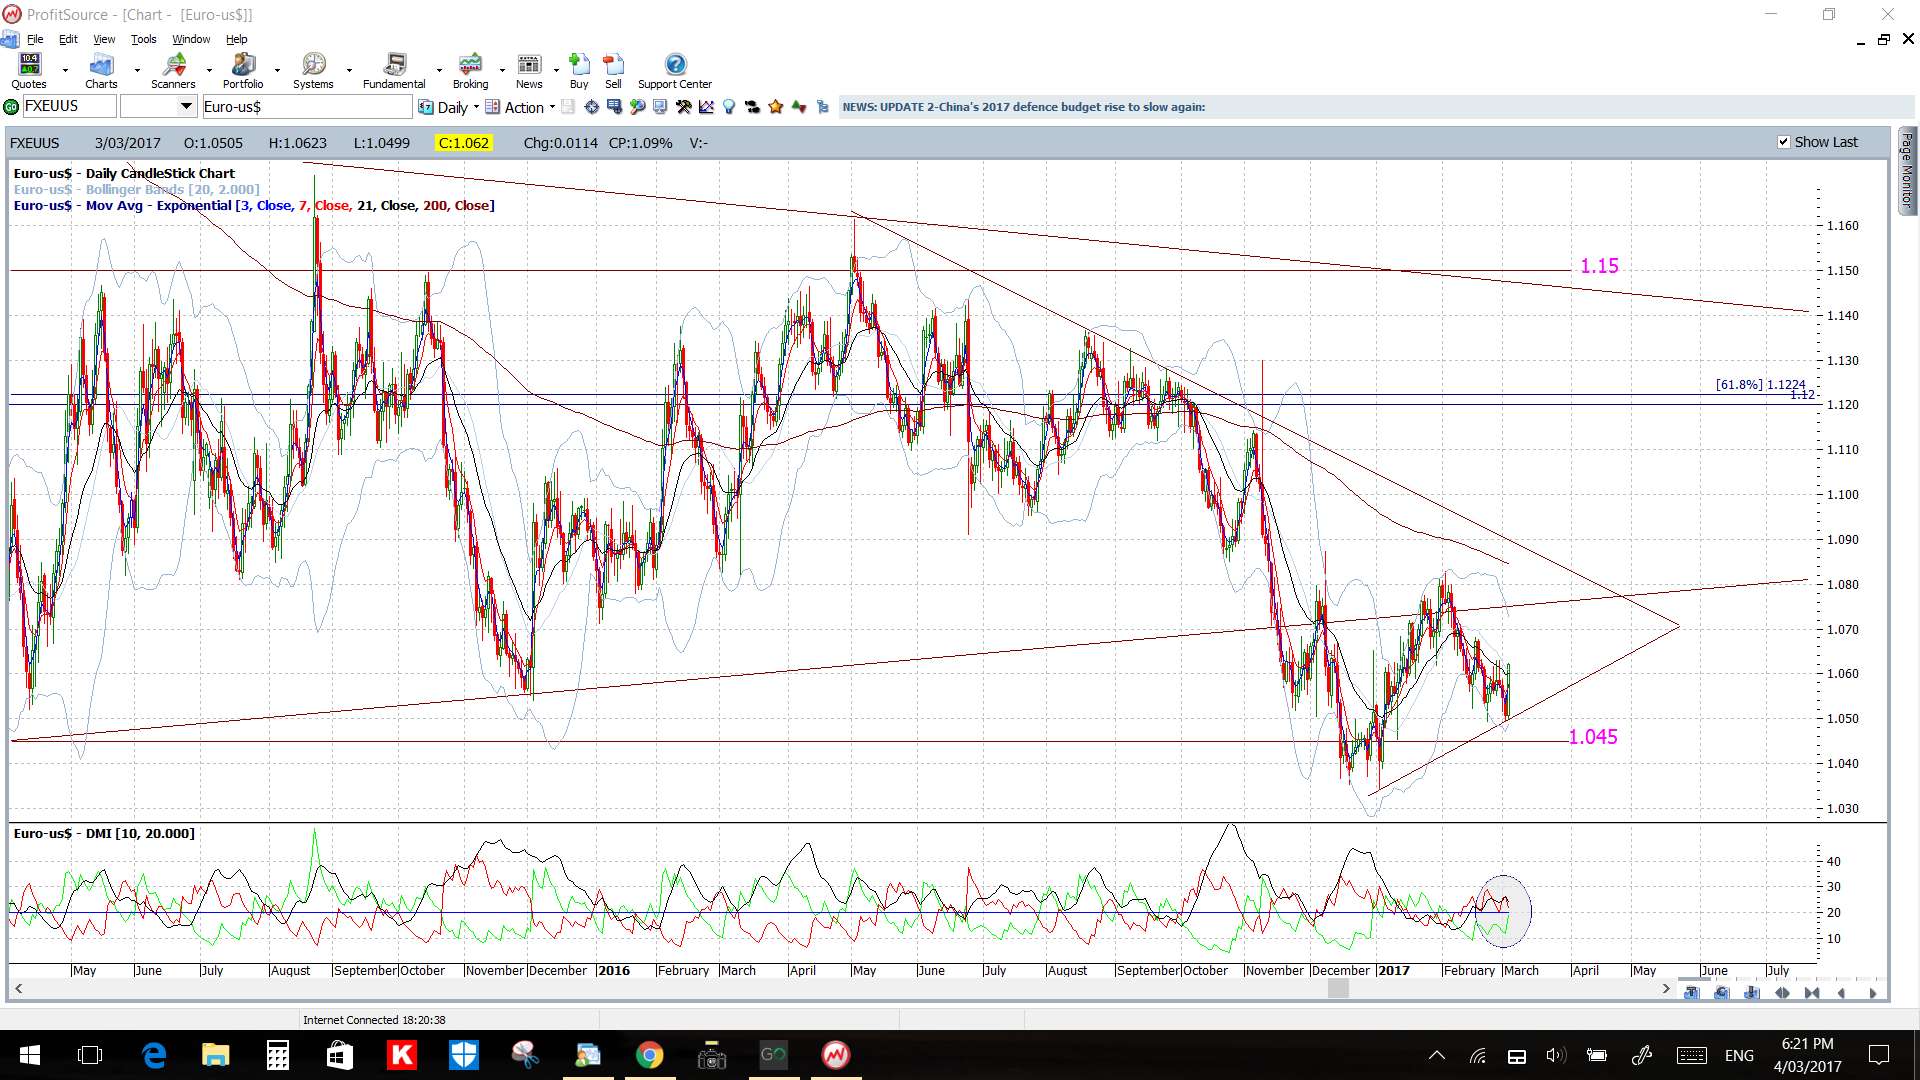
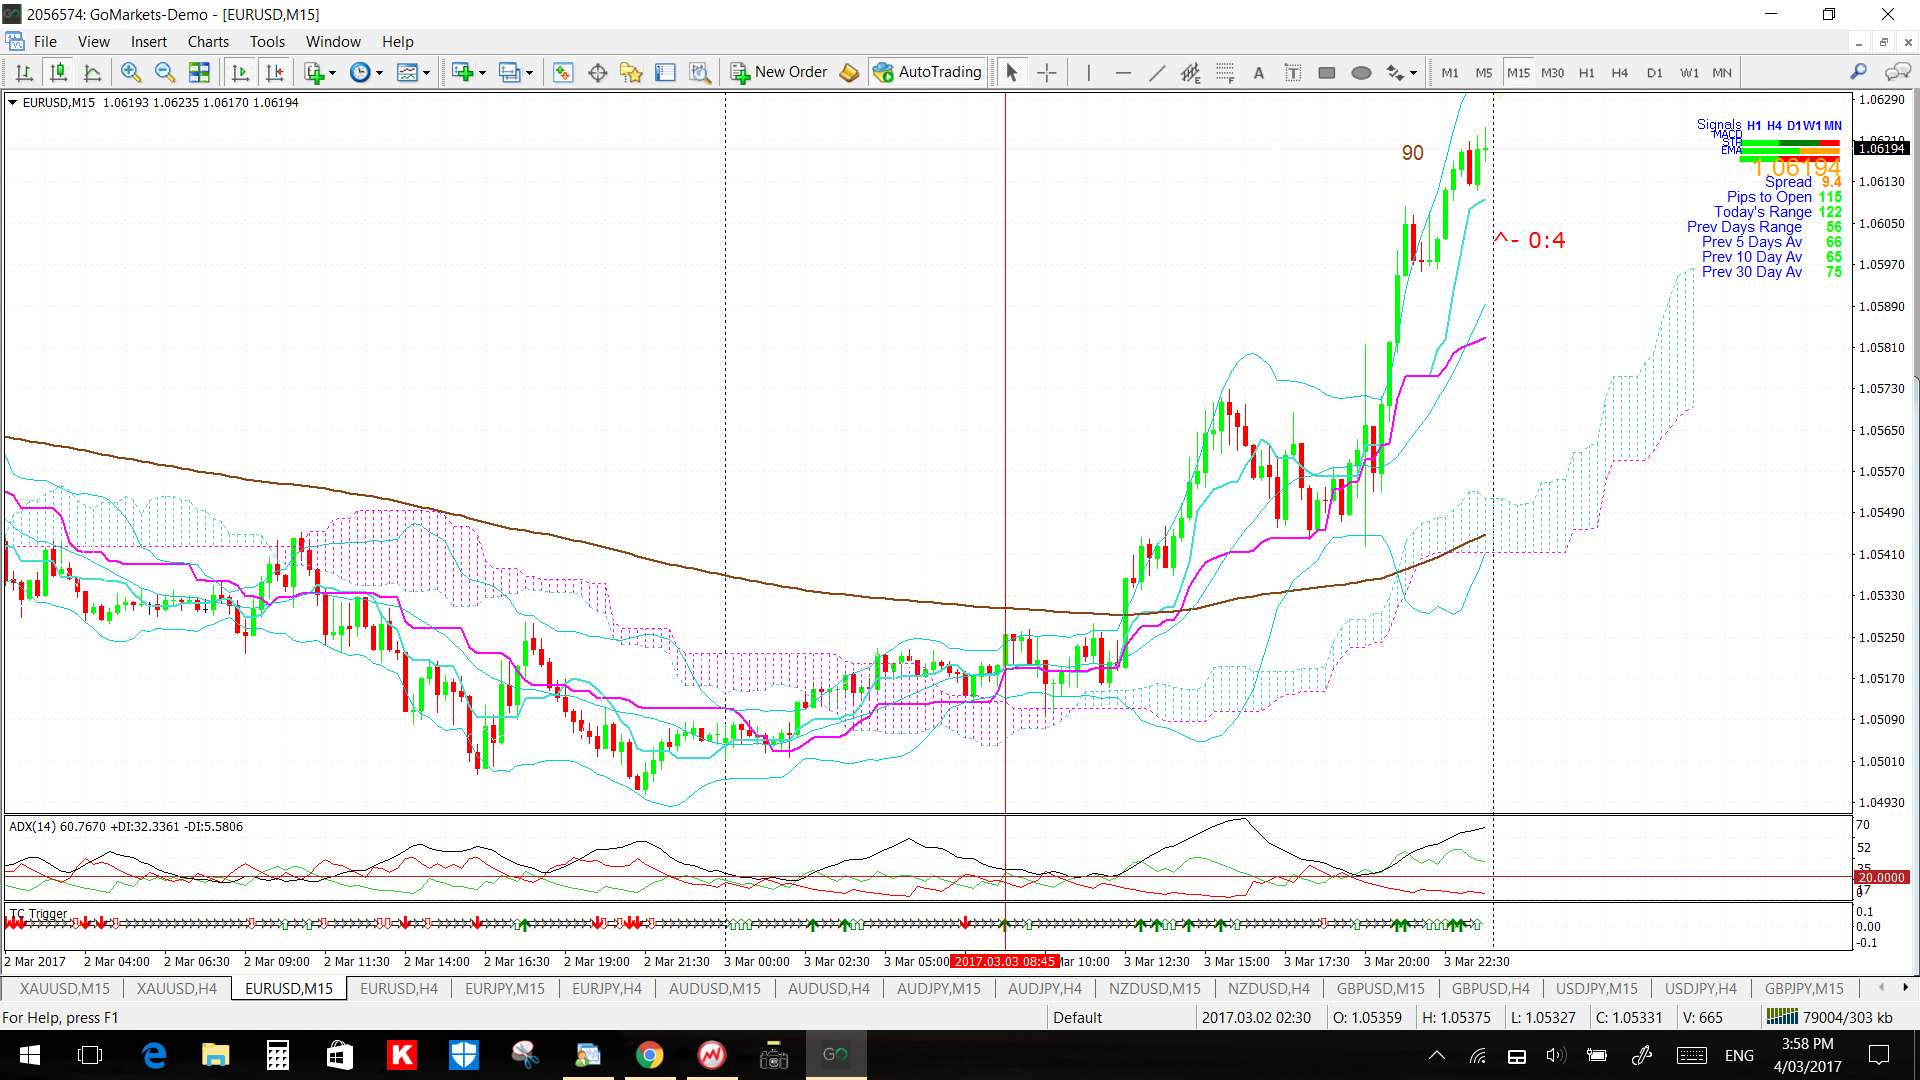
EUR/USD: Price tested the bottom trend line of the daily chart’s triangle last week but recovered from this on Friday to close the week with a bullish candle. The 15 minute chart below illustrates how moves are best picked up here at the moment on the shorter time frame. Despite the choppiness there was a great 15 min trend trade on Friday using my TC algo that gave up to 90 pips.
Price is above the 4hr Cloud and just above the daily Cloud which is bullish.
The weekly candle closed as bullish and almost engulfing.
Watch for impact from the ECB rate update and US NFP.

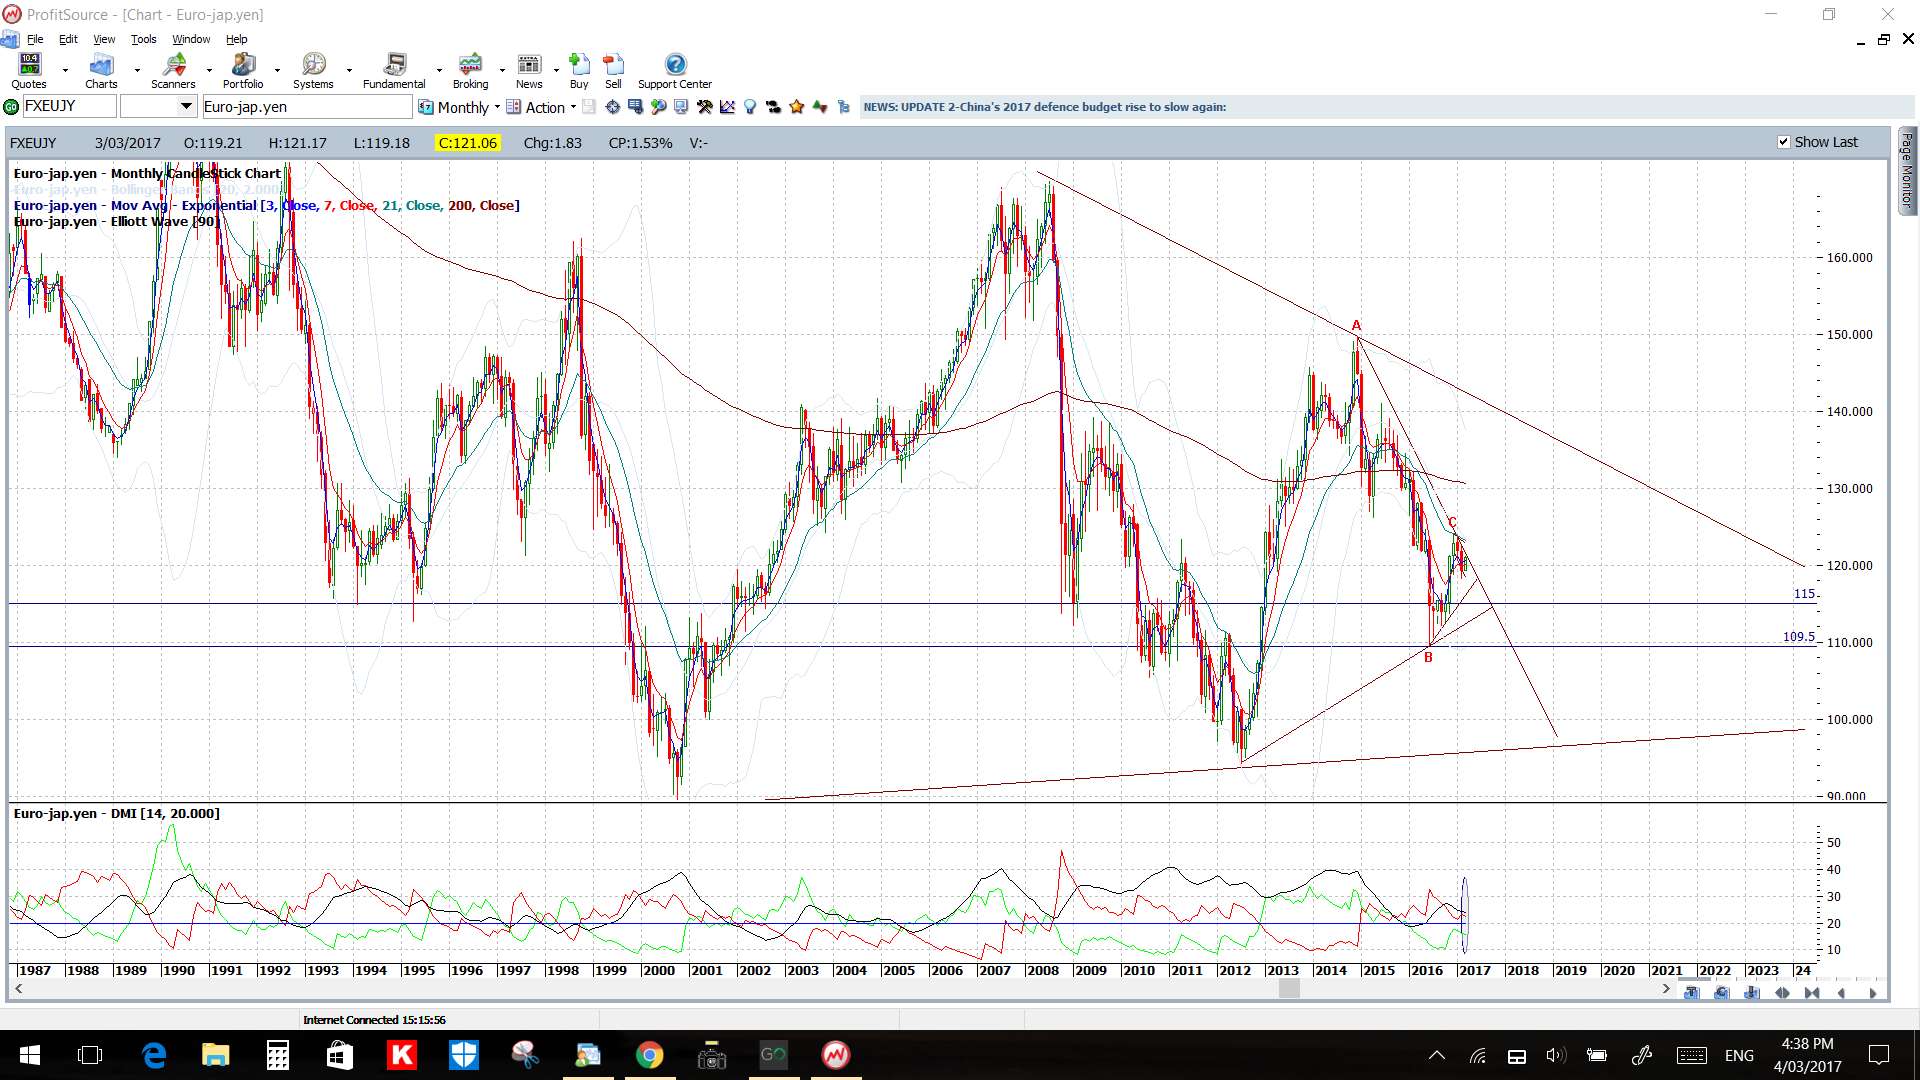
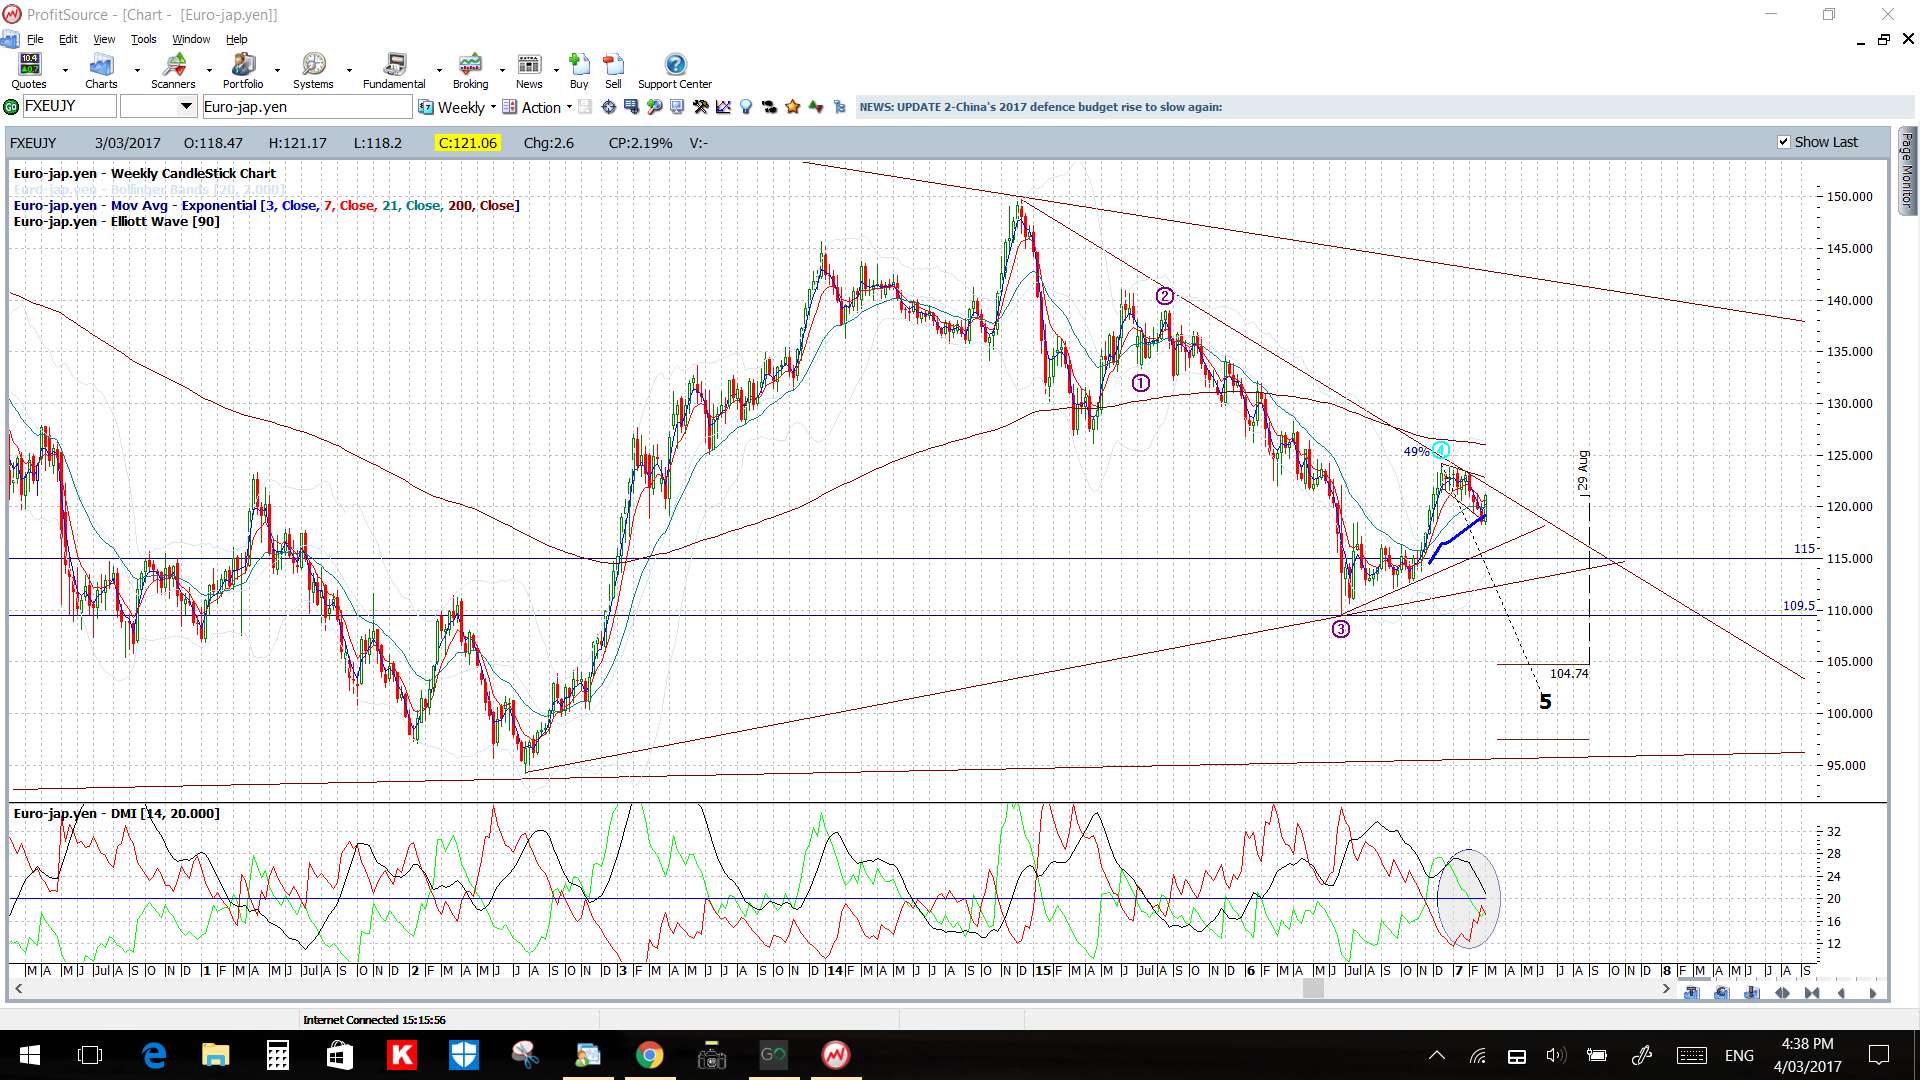
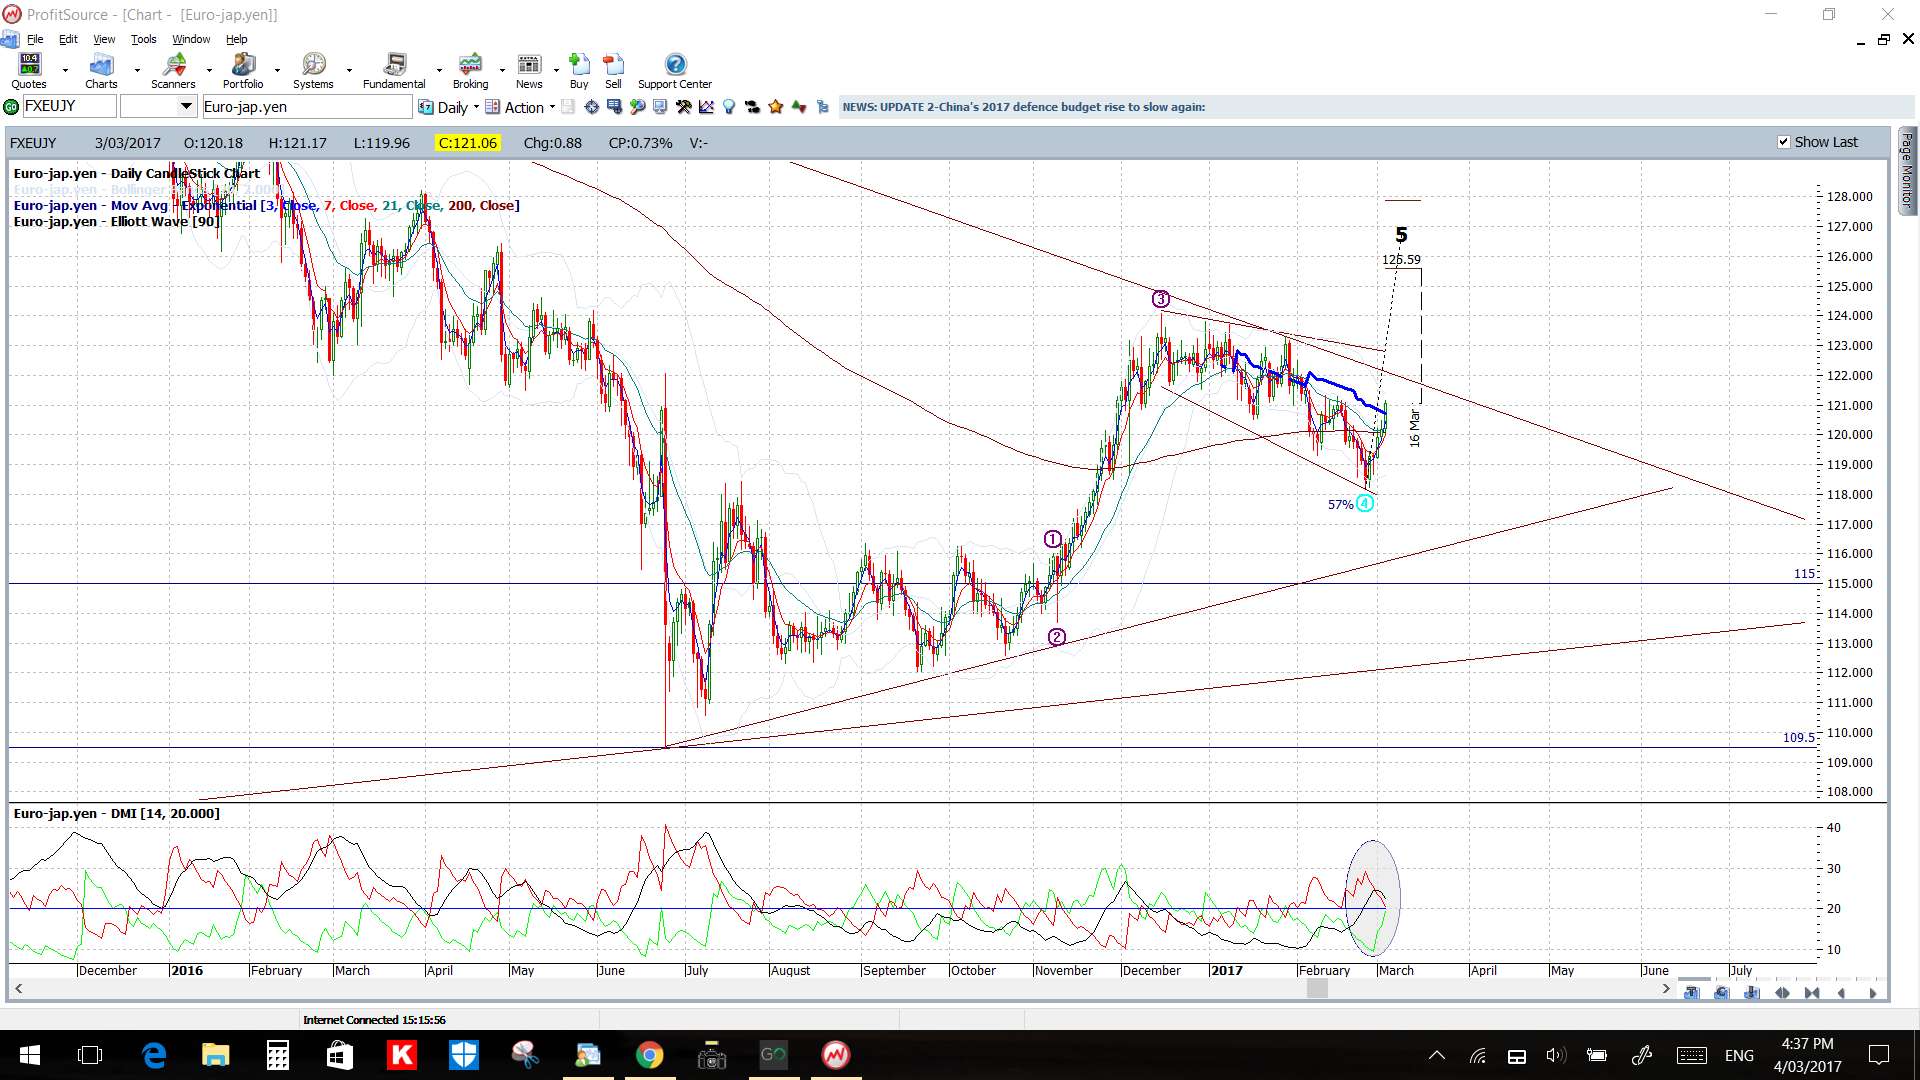
EUR/JPY: This pair essentially continues to trade within a daily Flag but is heading back up to test the upper trend line of this pattern. Note that this is also the boundary of a bear trend line that has been in play since the end of 2014 and so is a significant S/R zone. Momentum is declining for now on the weekly chart but watch for any uptick with this and for any make or break at this upper resistance zone.
Price is above the 4hr Cloud but in the daily Cloud.
The weekly candle closed as bullish and engulfing.
Watch for impact from the ECB rate update and US NFP.

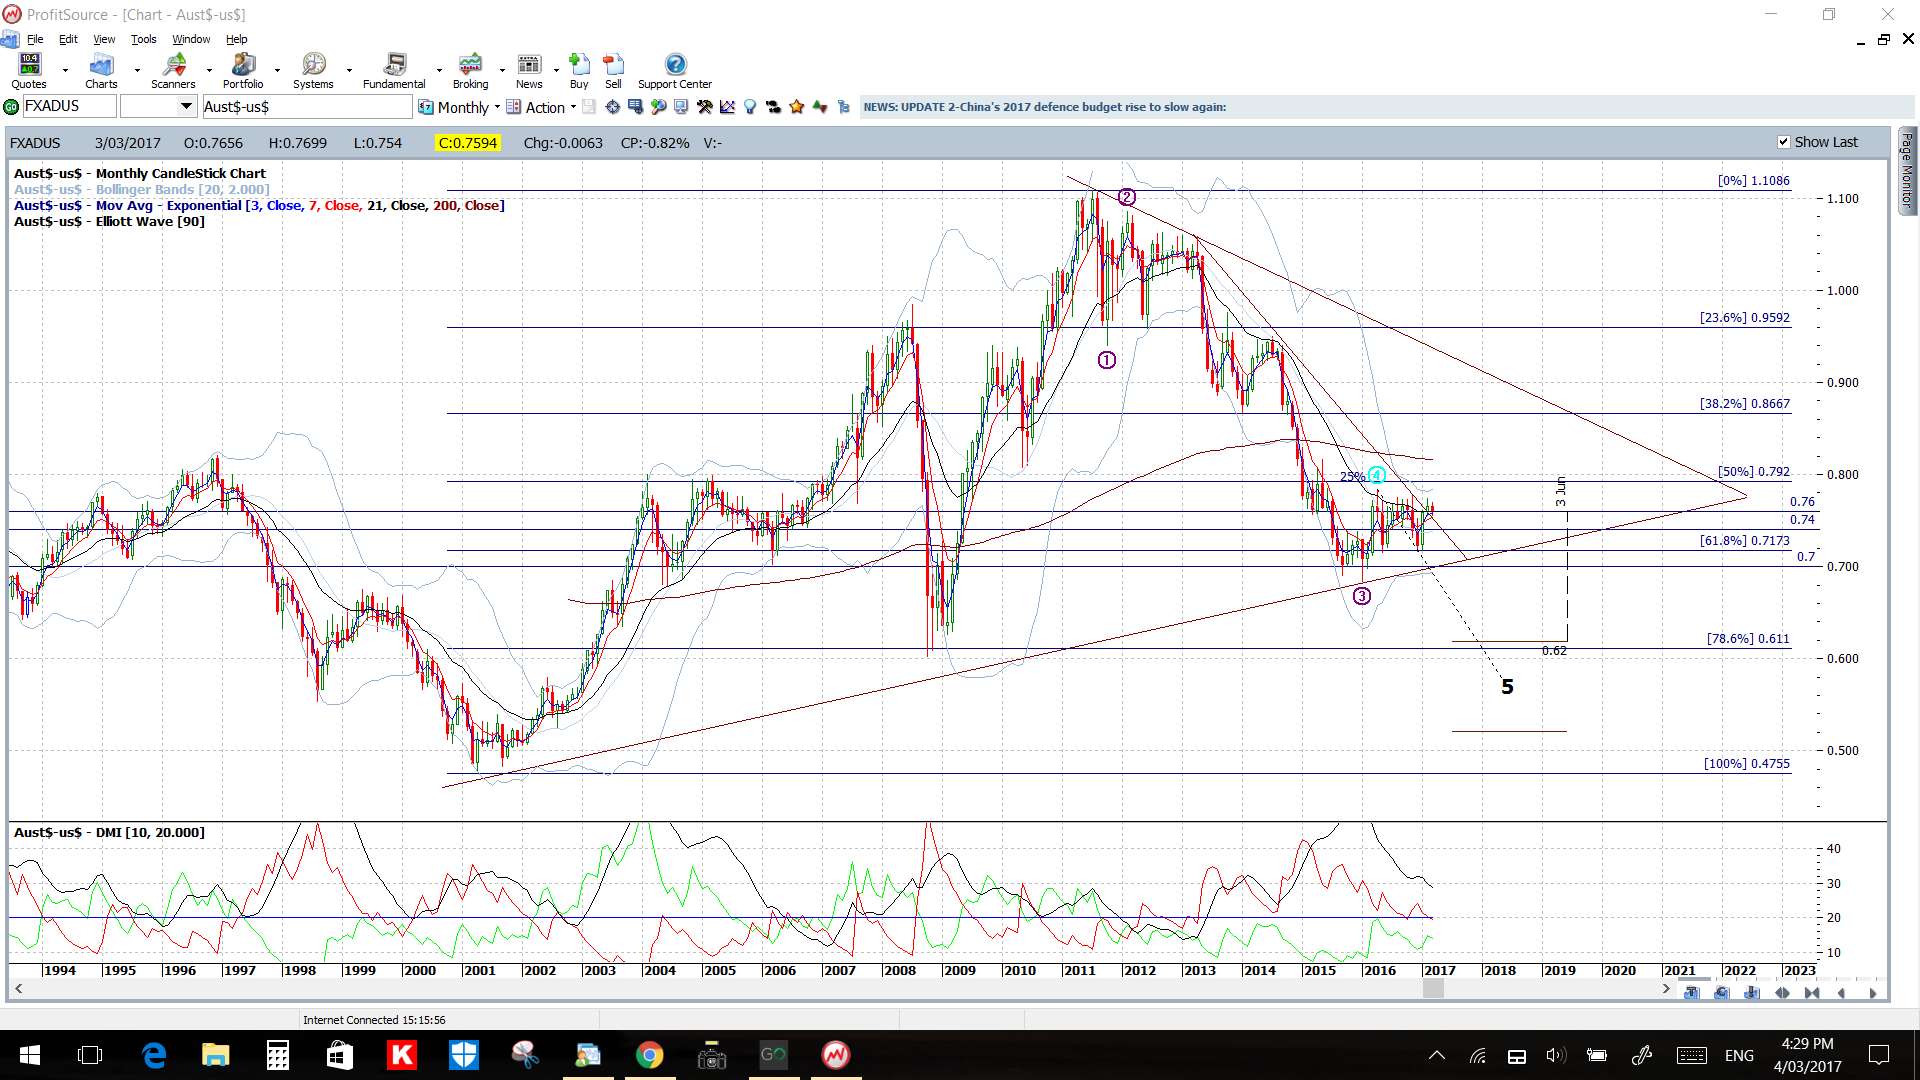
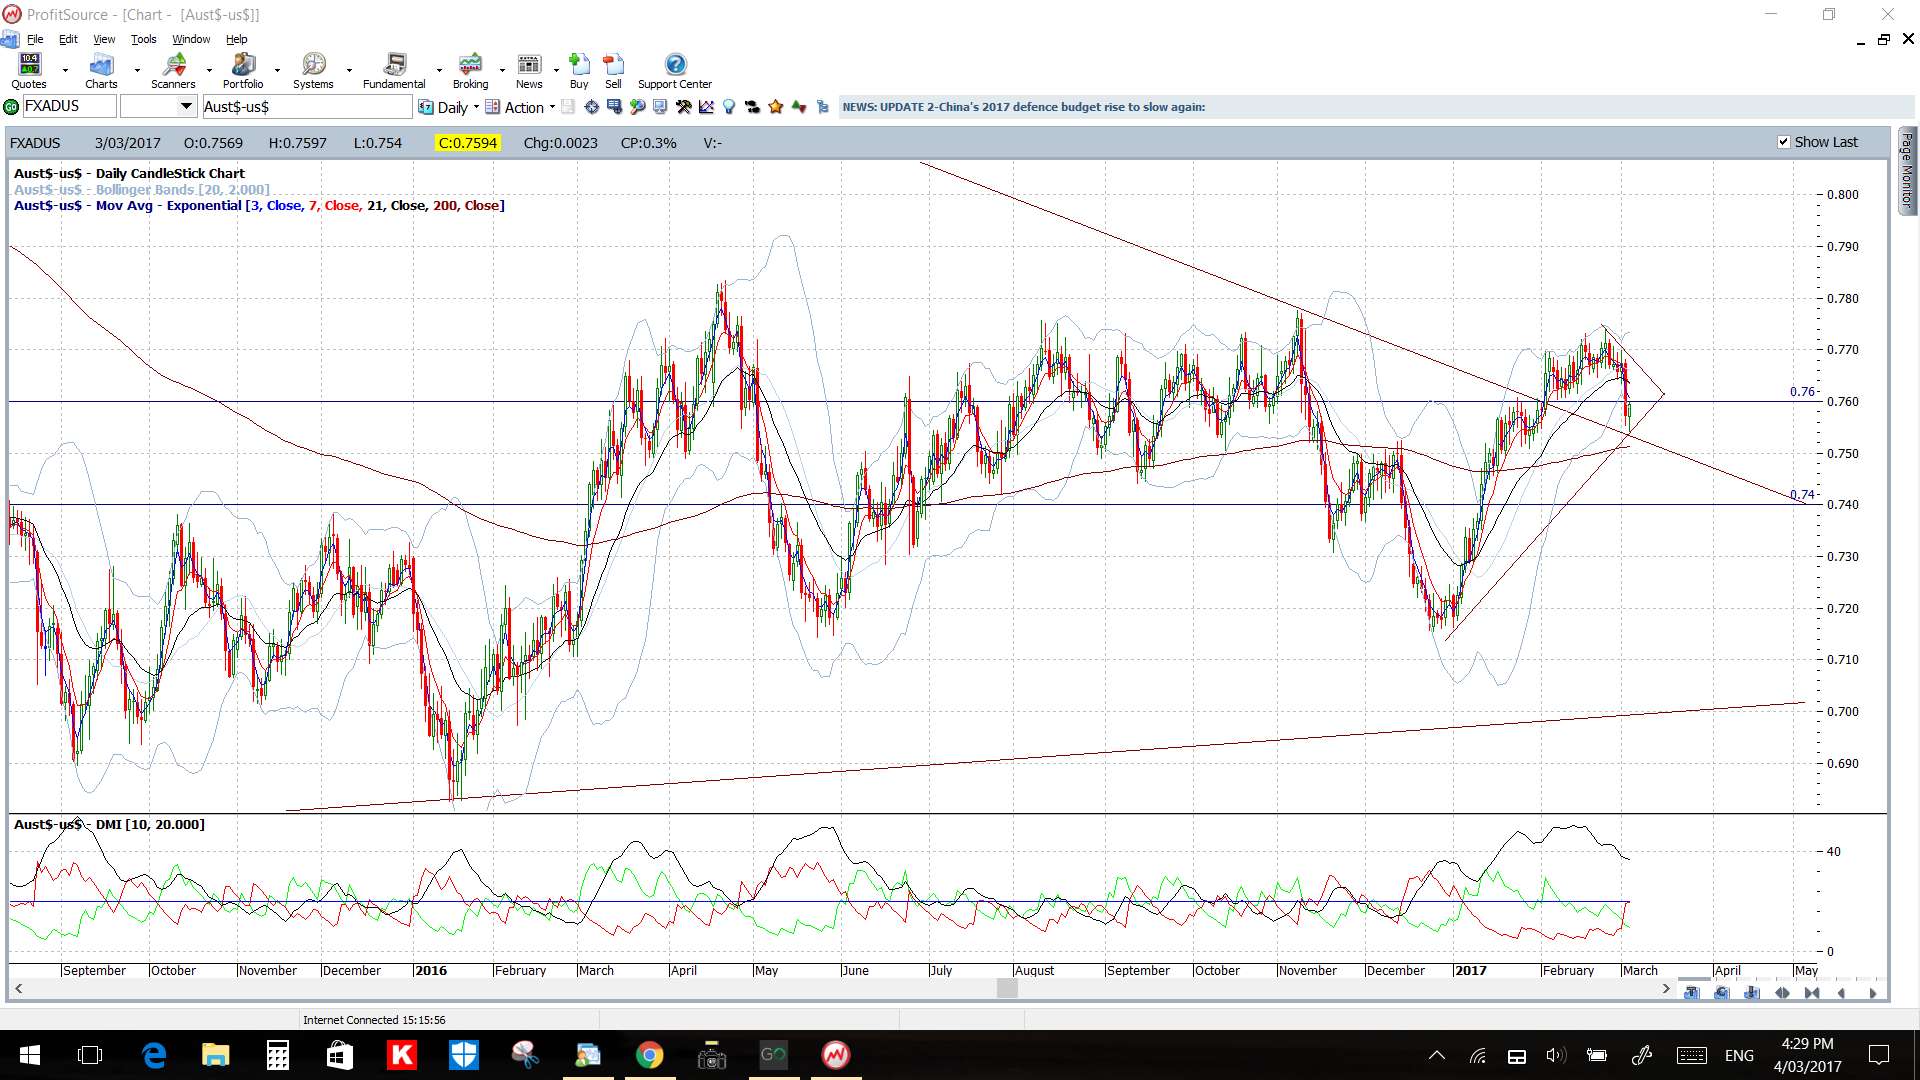
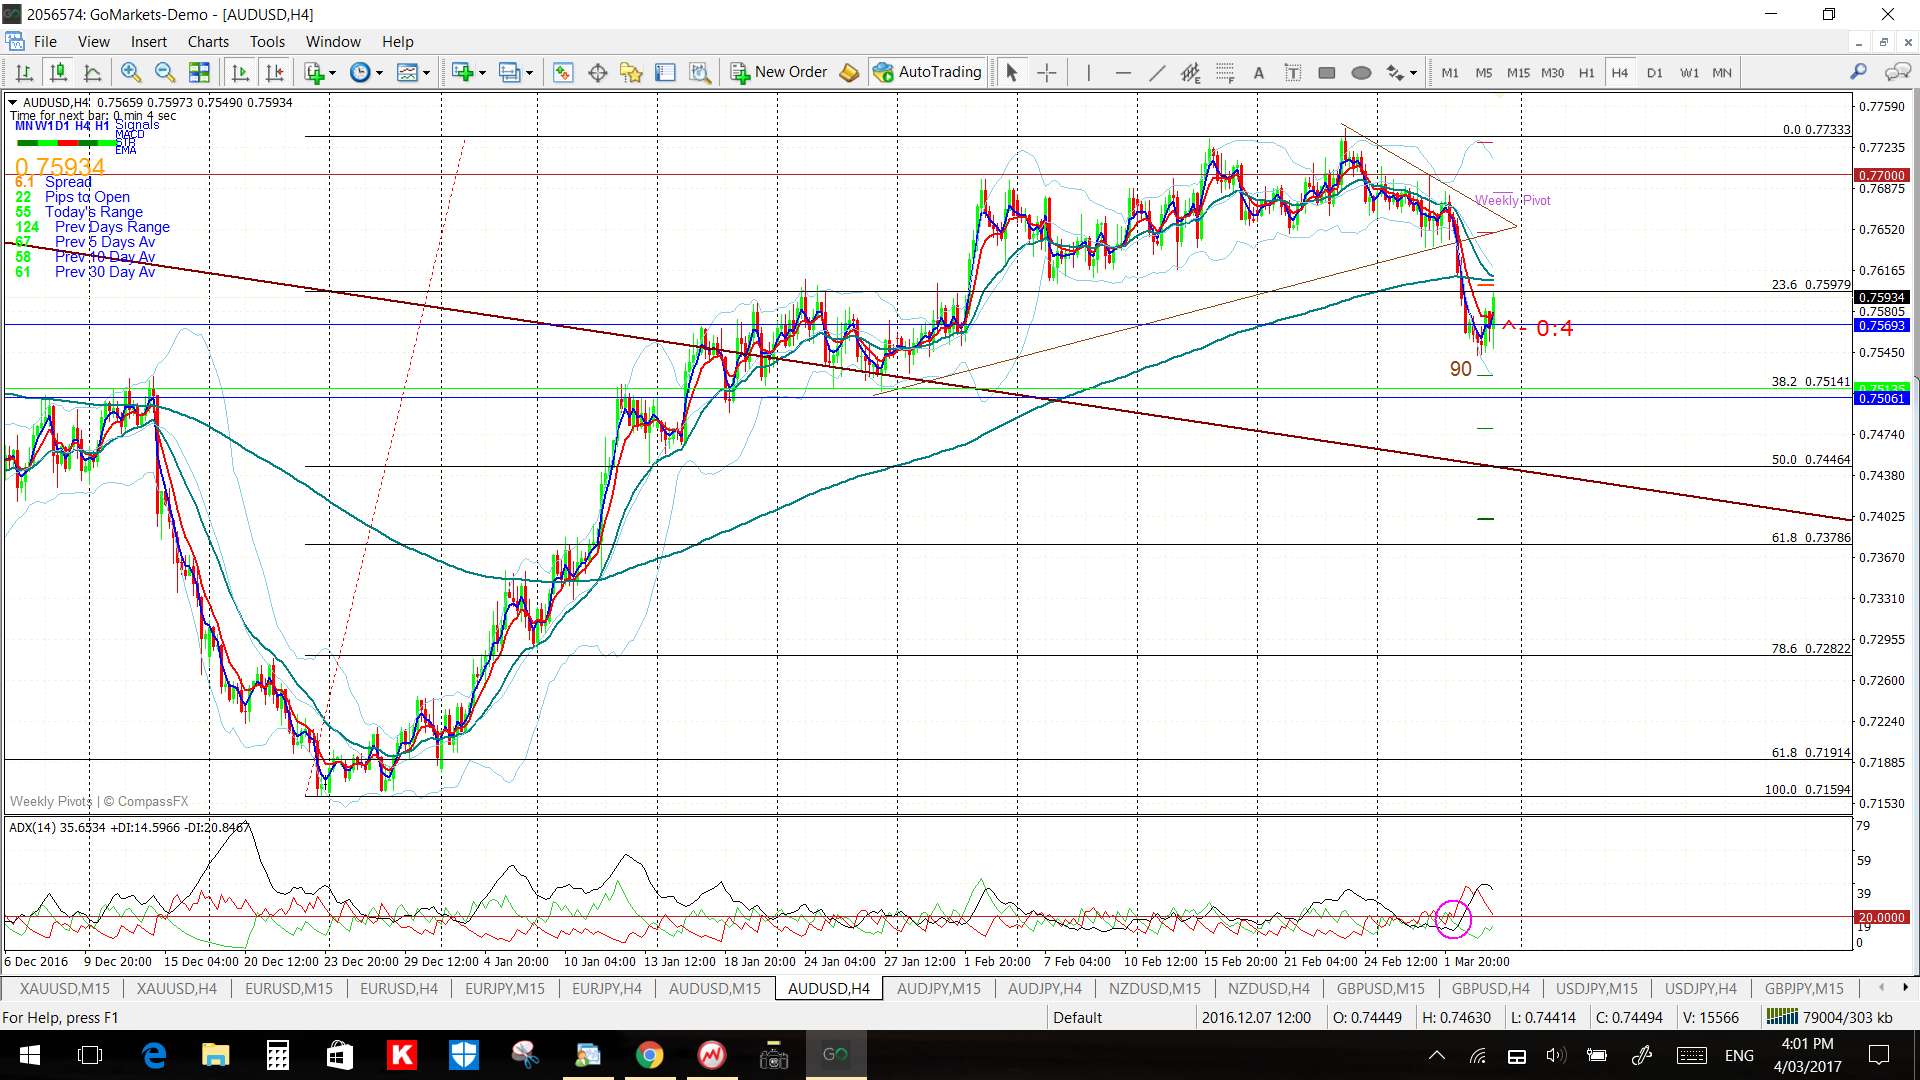
AUD/USD: A triangle break last week on the 4hr chart for this pair gave up to 90 pips but, given this bearish move slowed, I have recast triangle trend lines here.
Price still looks to be consolidating under the 0.77 S/R level as there is declining momentum on the daily chart suggesting the next move, higher or lower, is yet to be defined.
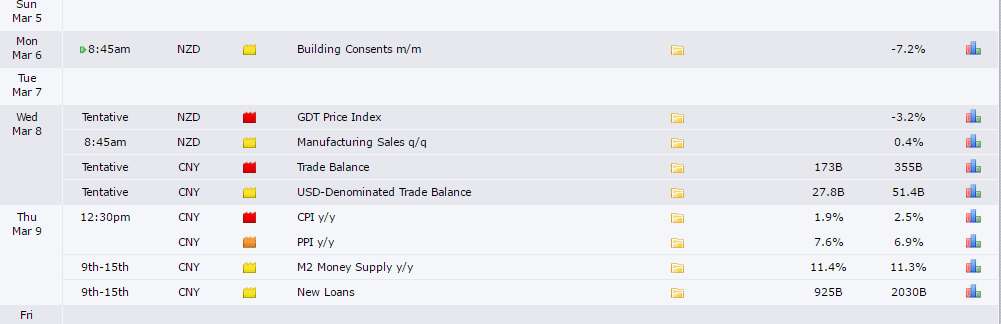
Watch for impact next week from the following AUD and CNY items but also from Friday’s US NFP:


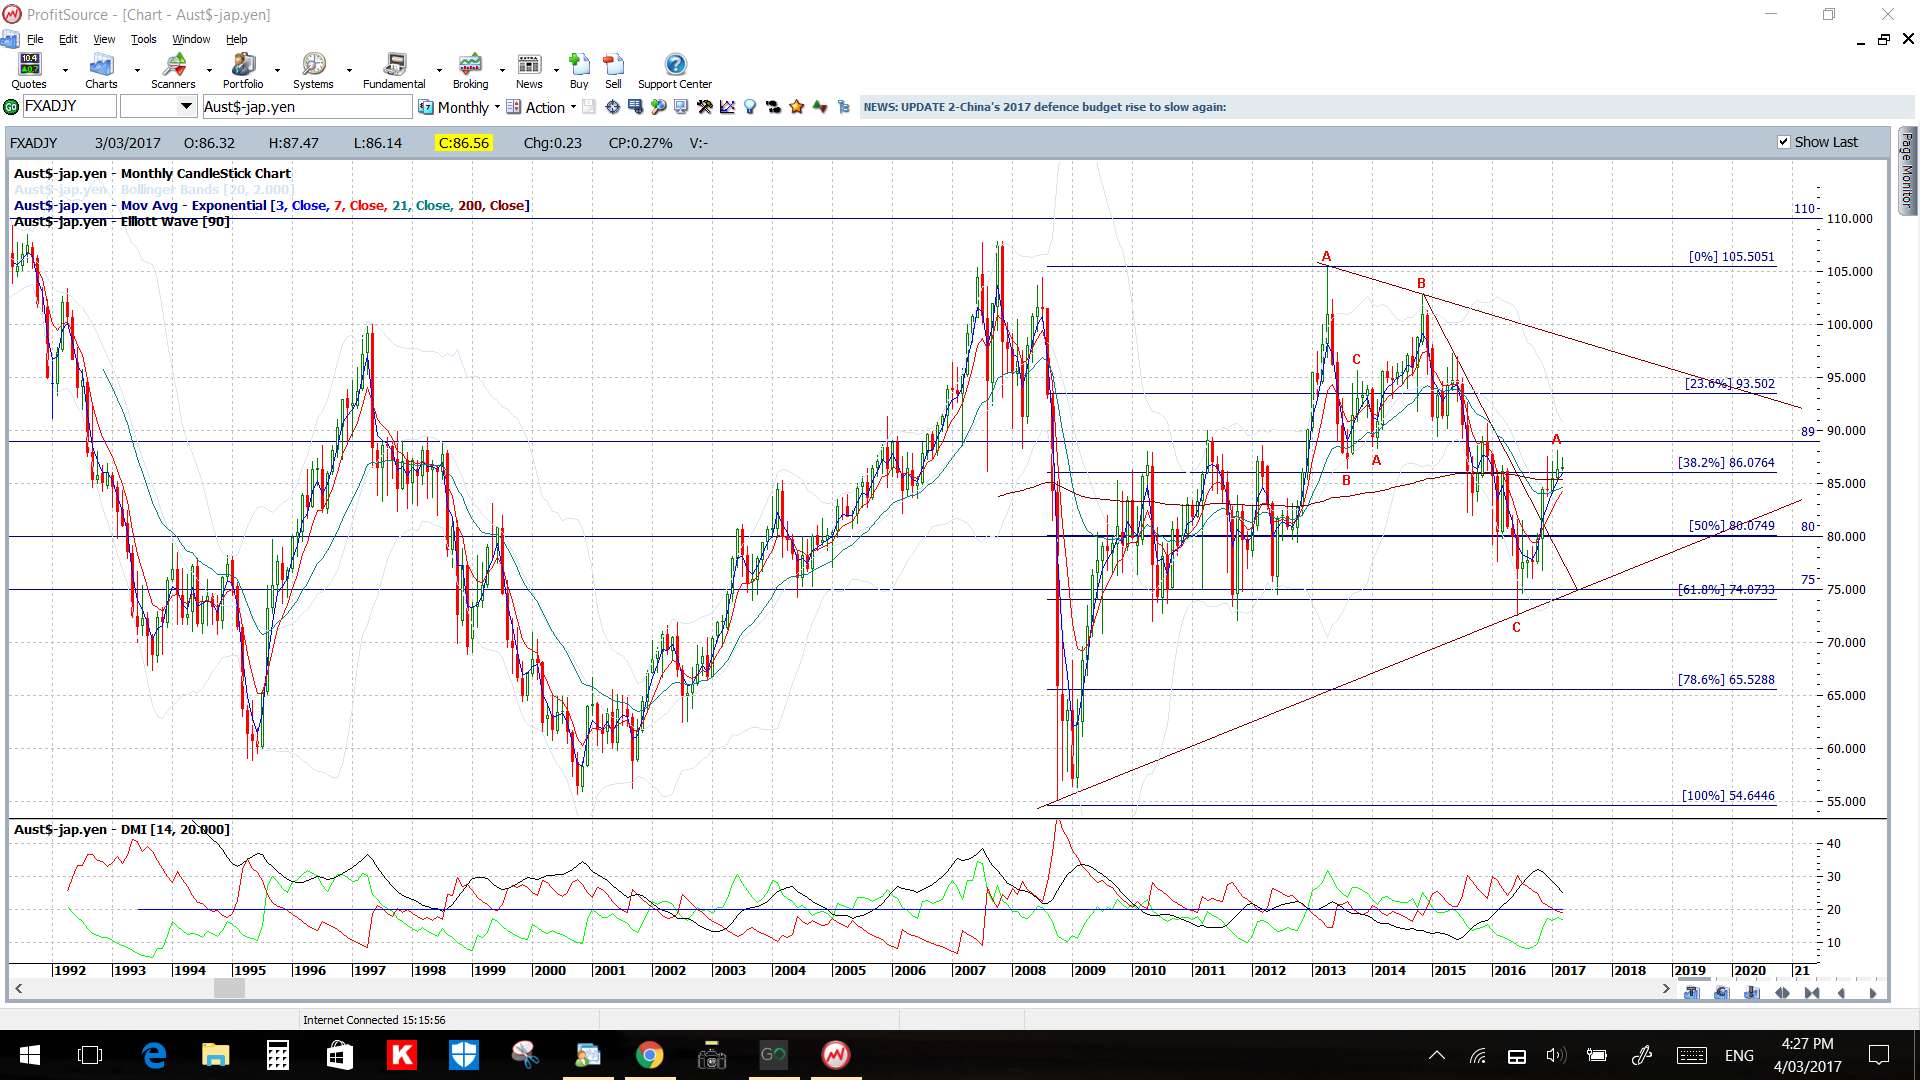
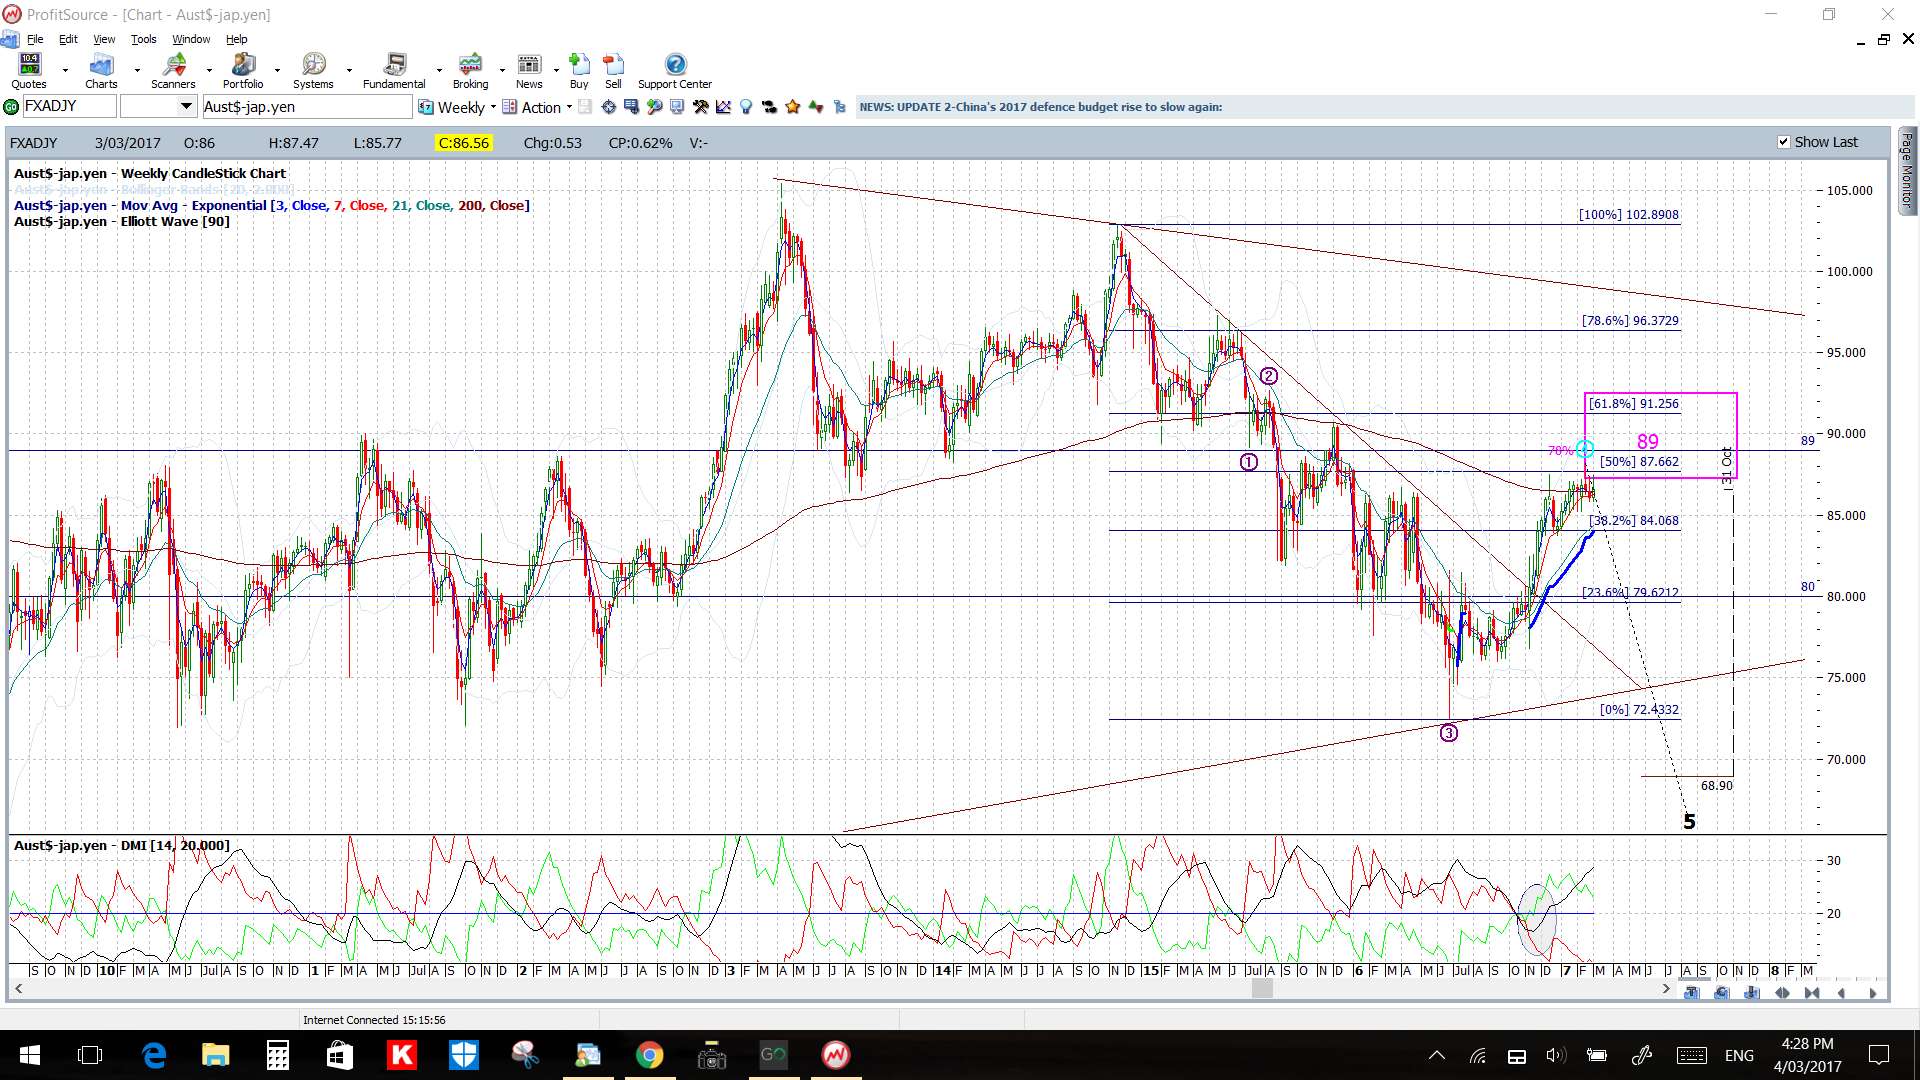
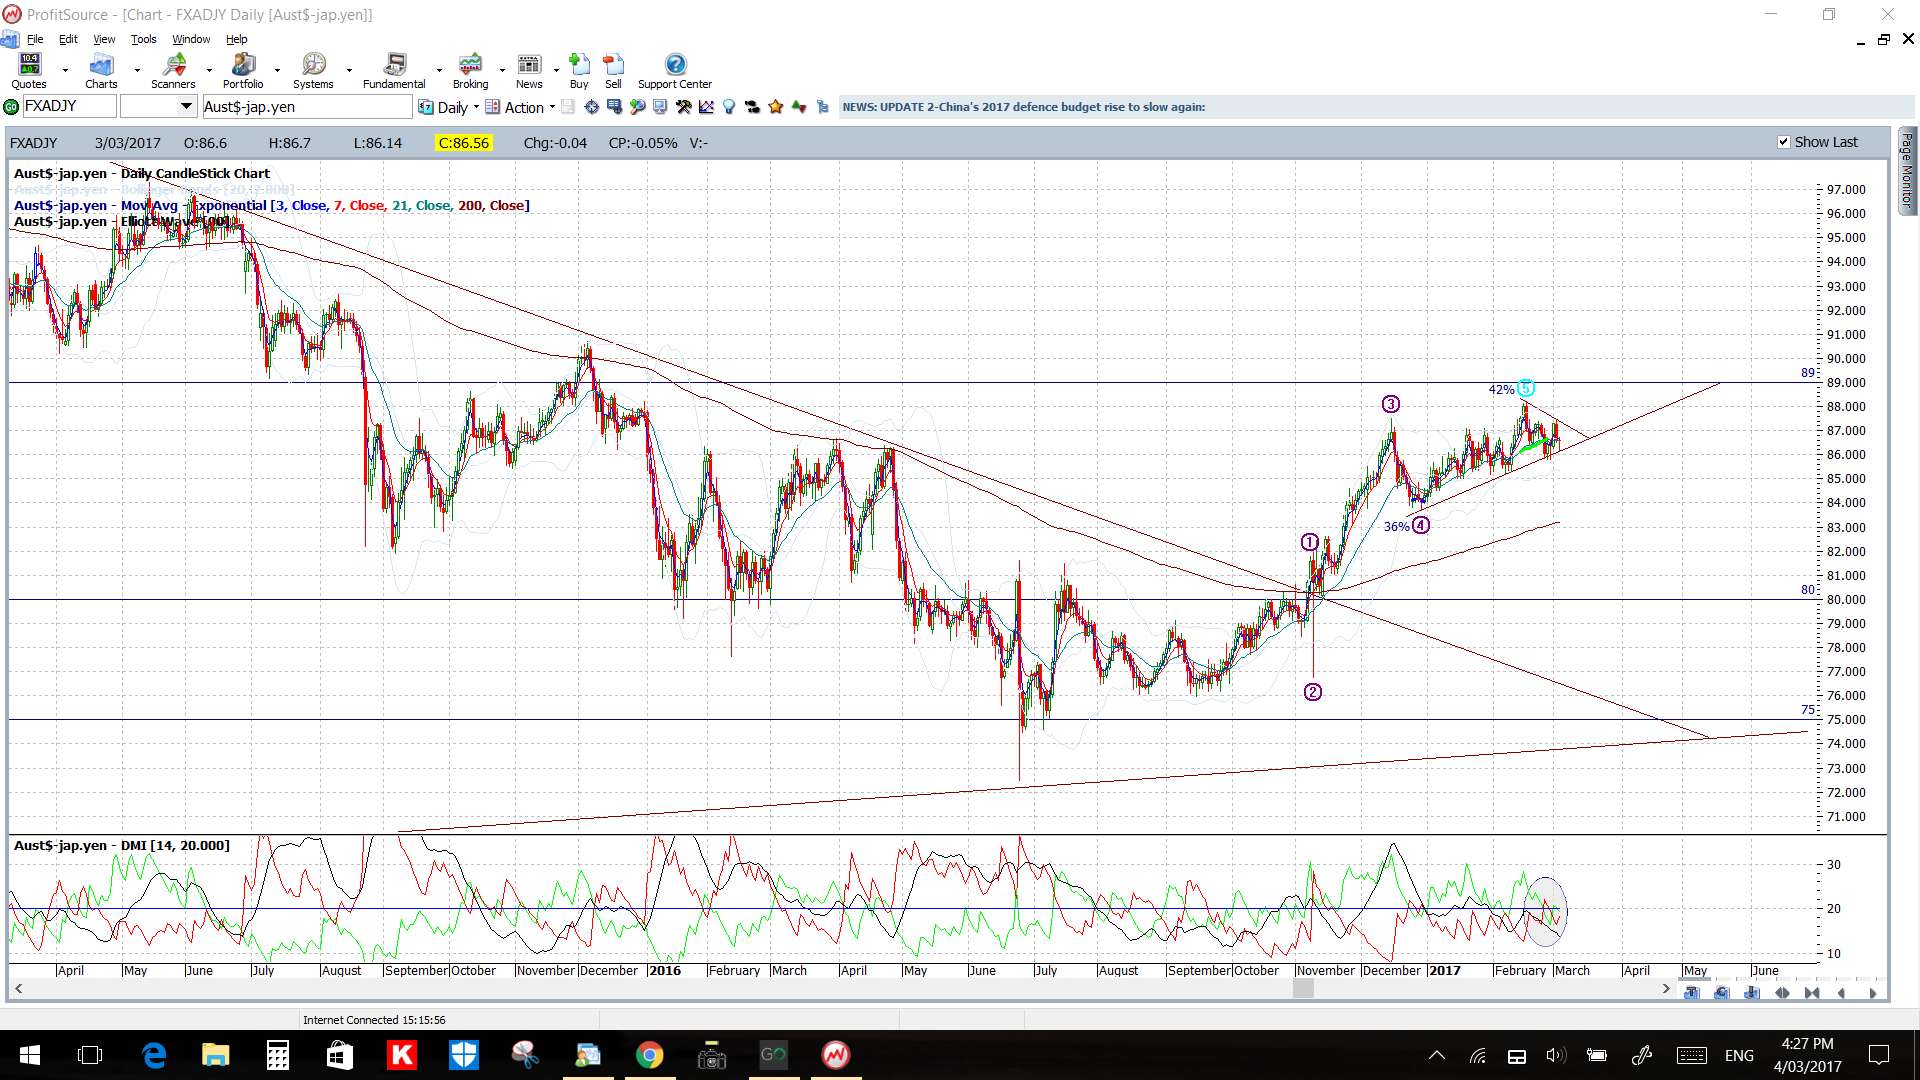
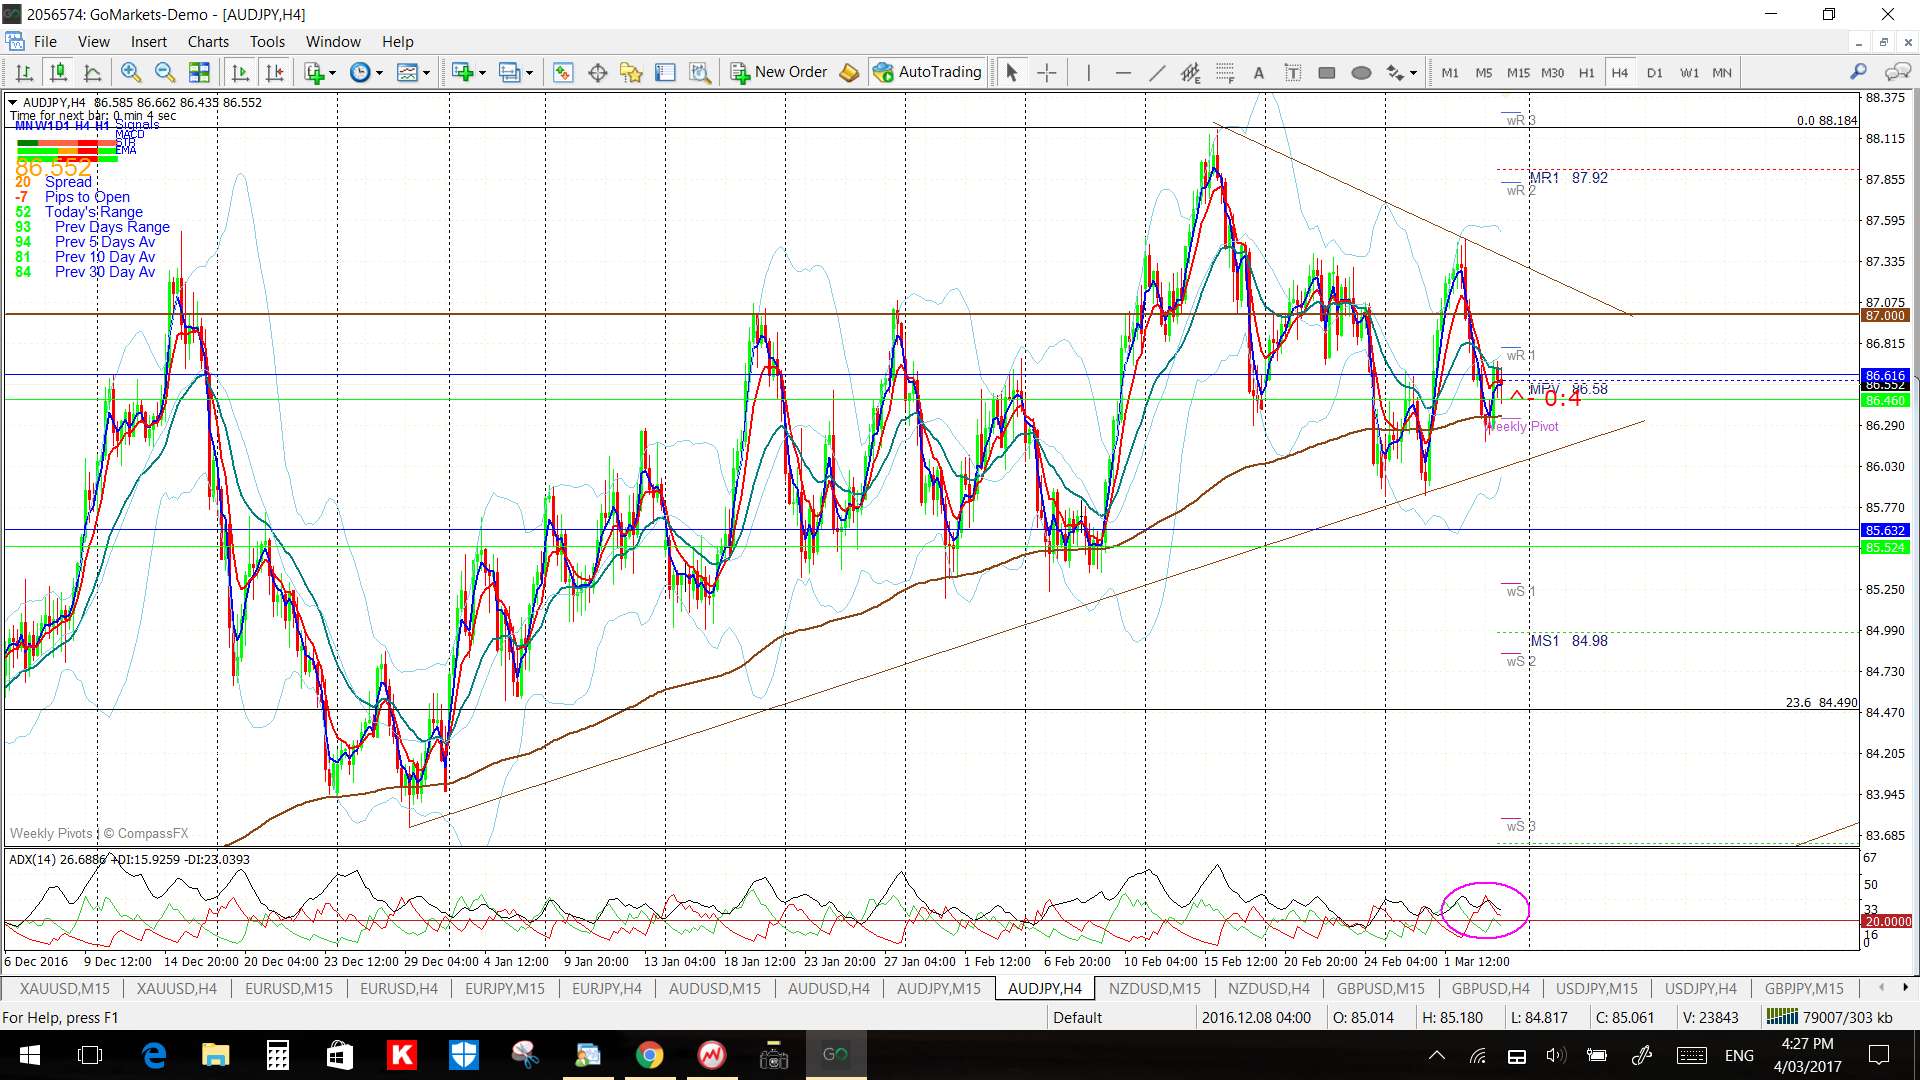
AUD/JPY: The AUD/JPY stil looks to be consolidating under the major S/R level of 89 but at least we have trend lines to watch for any breakout.
Price is in the 4hr Cloud but above the daily Cloud.
The weekly candle closed as bullish coloured ‘Inside’ candle reflecting indecision.
Watch for impact from the RBA rate update, CNY data and Friday’s US NFP.
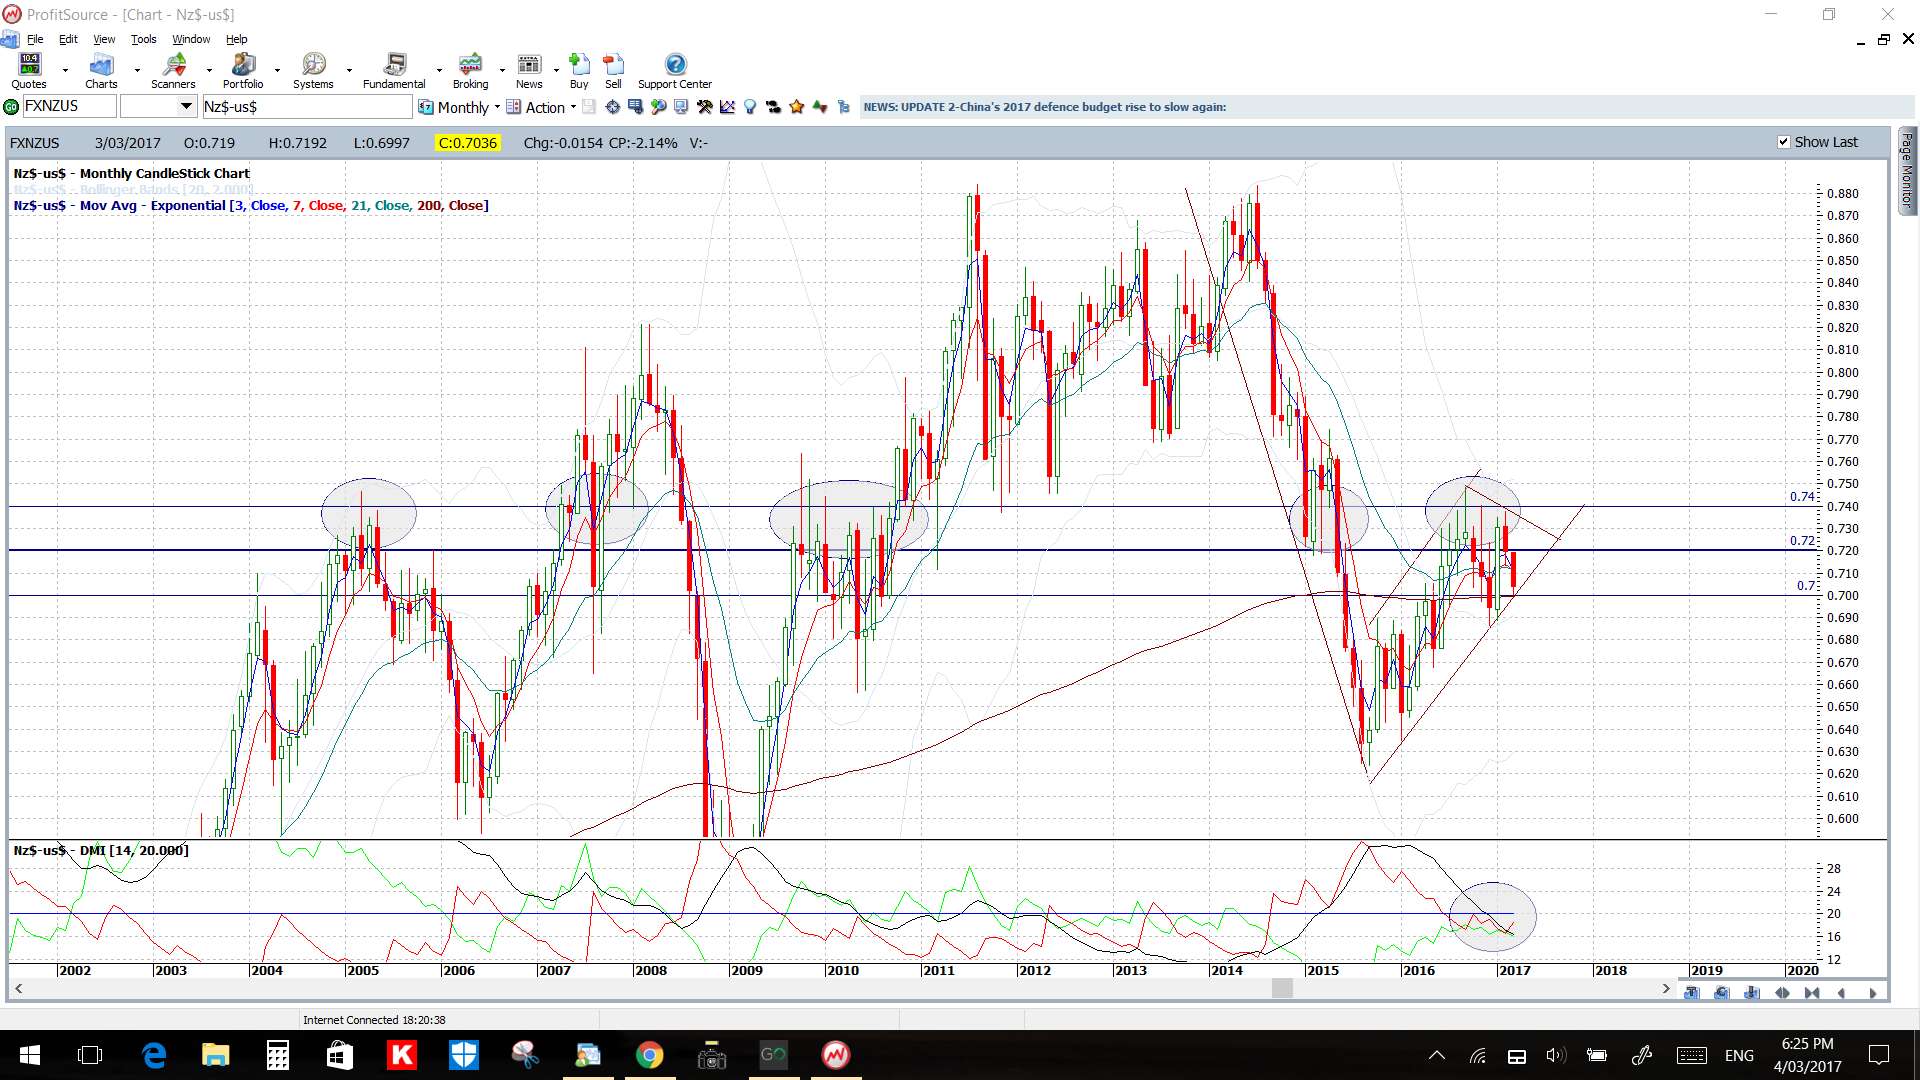
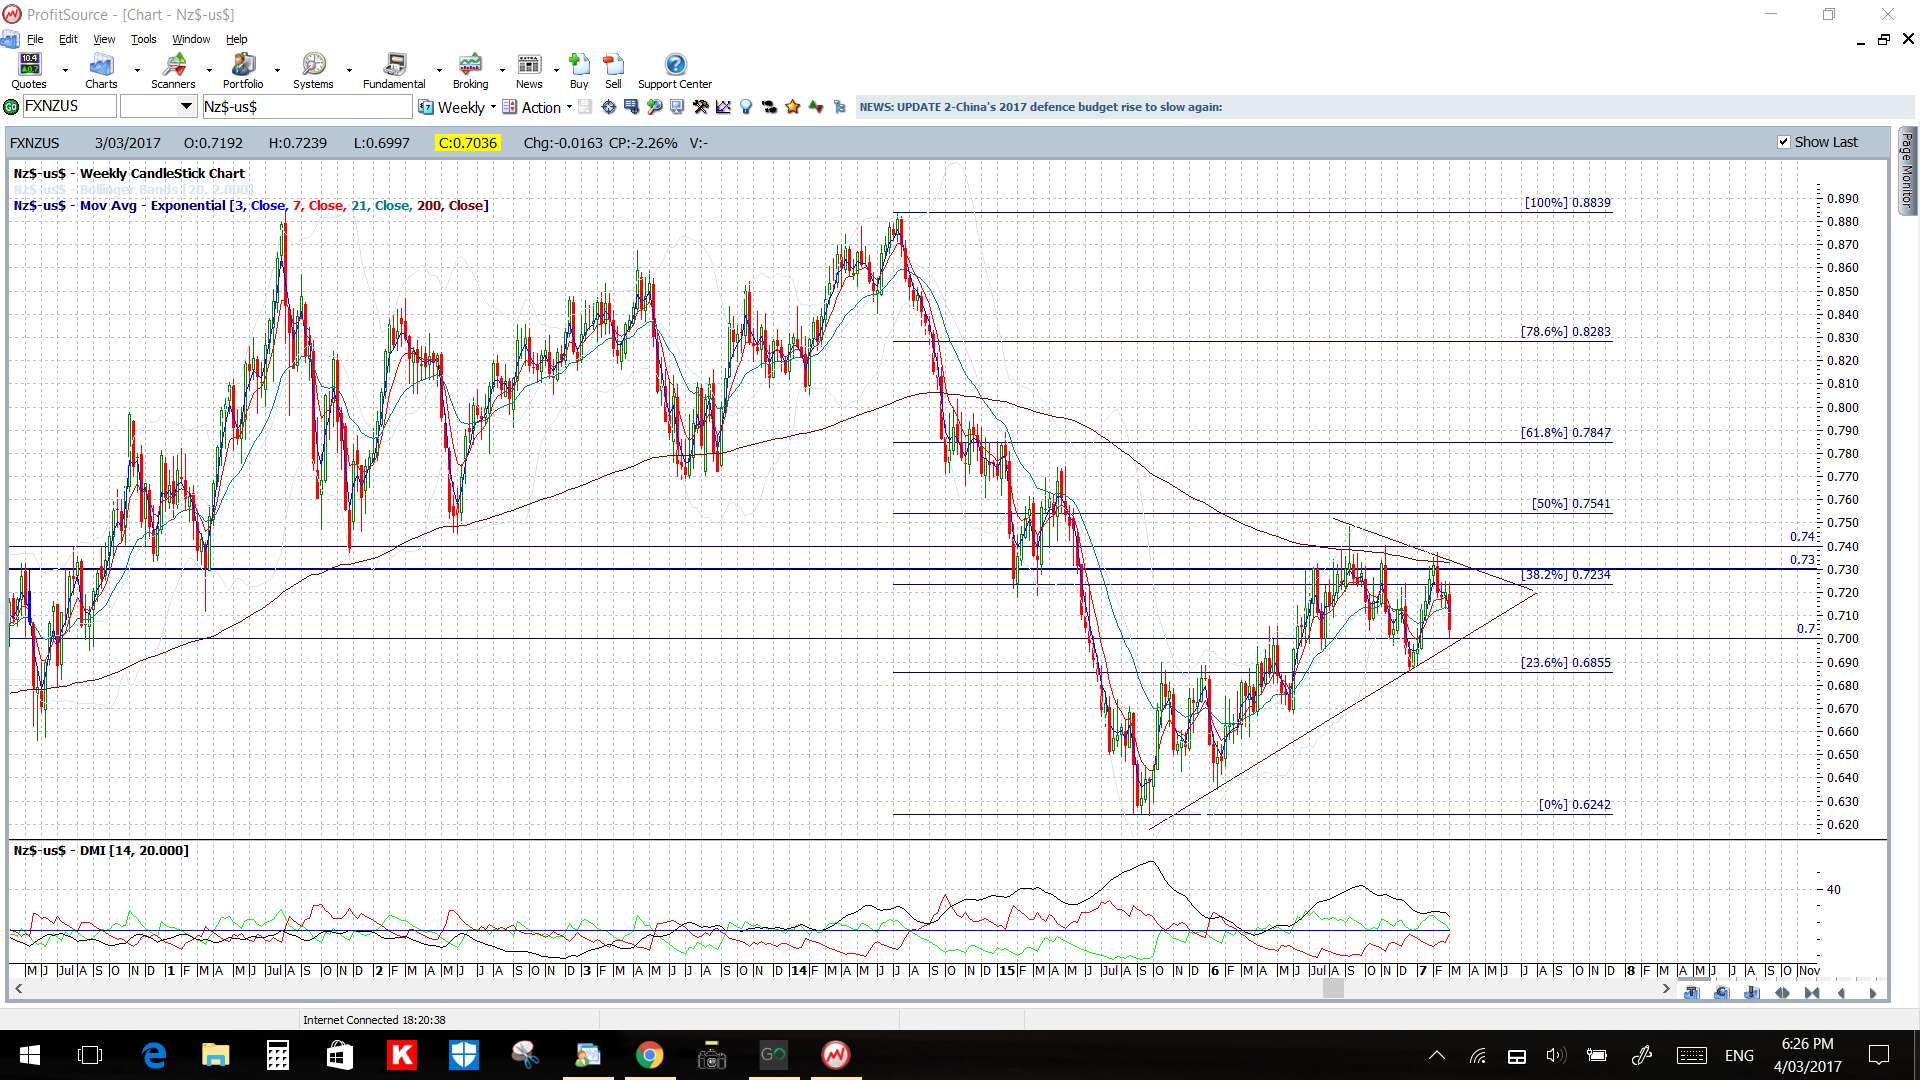
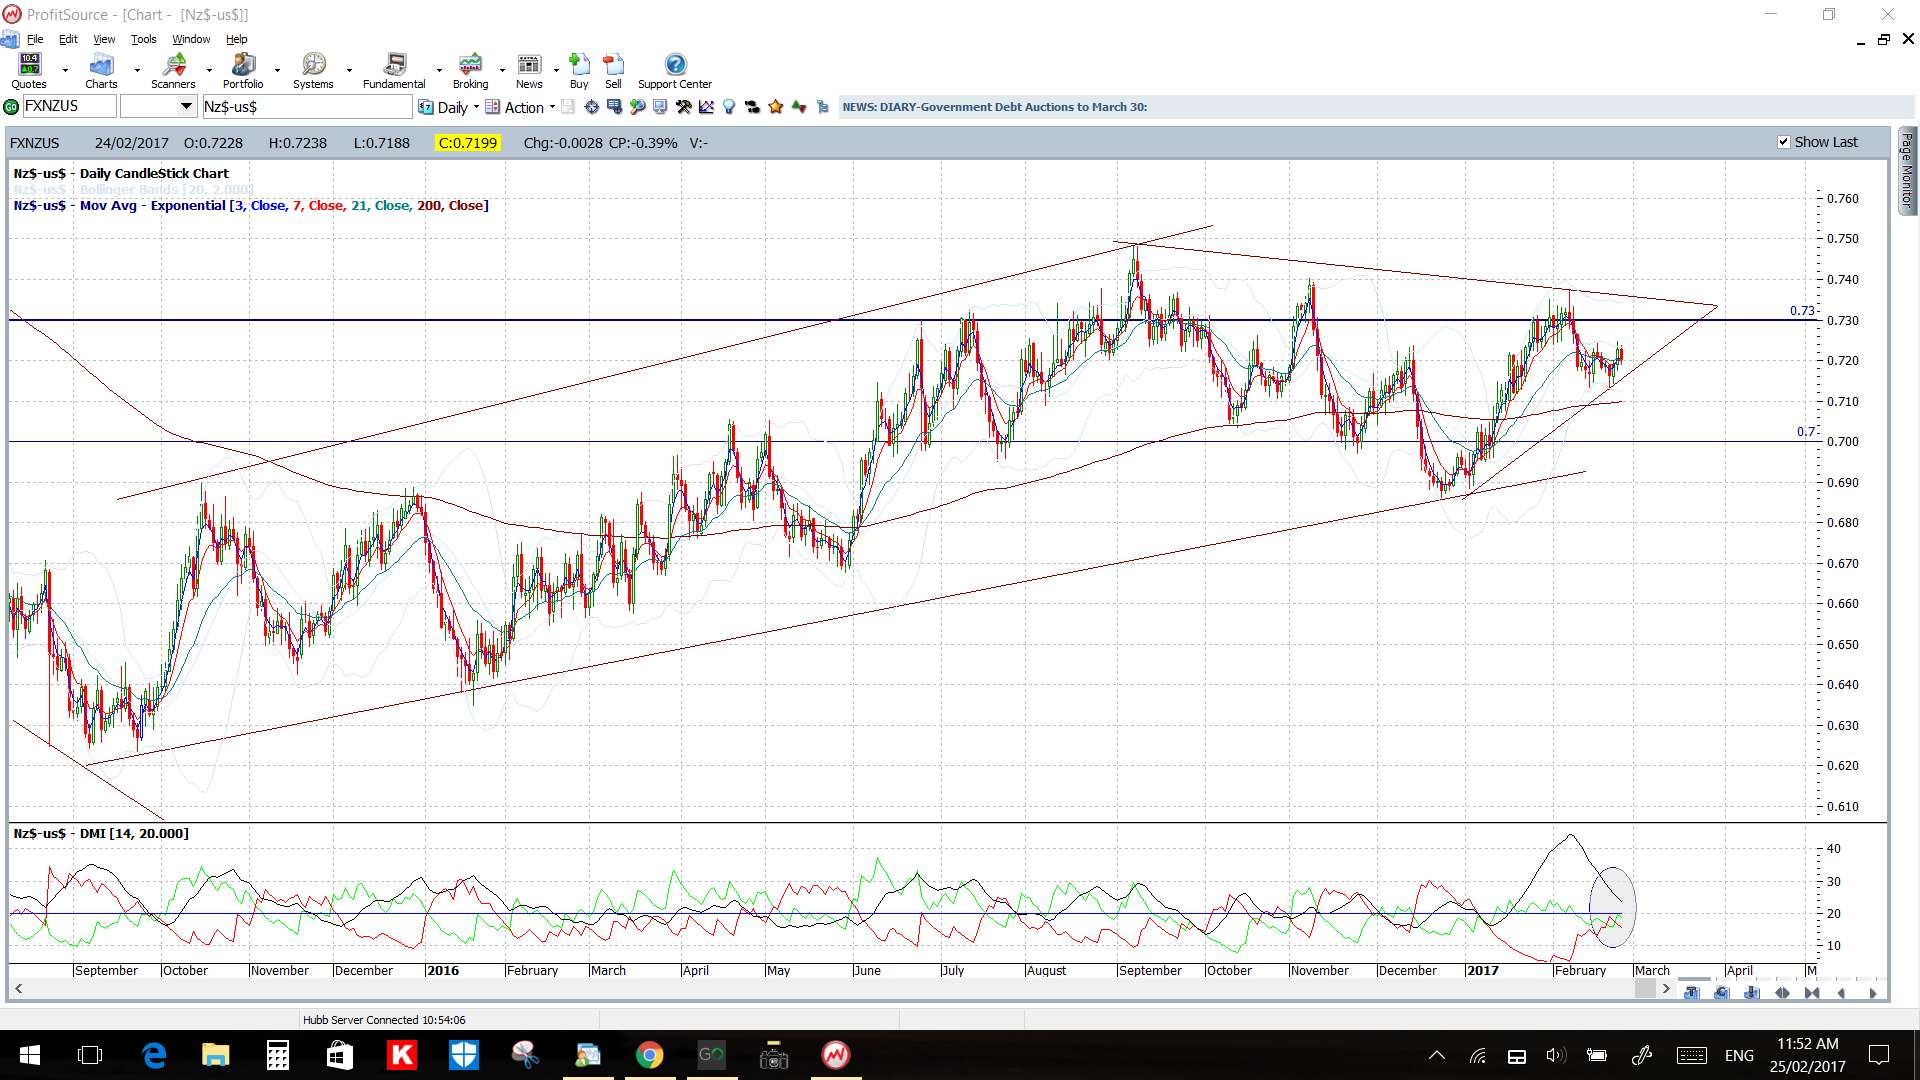
NZD/USD: A triangle break last week on the 4hr chart for this pair gave up to 170 pips but, given this bearish move stalled at the 0.70 S/R level, I have recast triangle trend lines here too. There is a daily chart triangle in play and this is set within a larger weekly chart triangle. The bottom trend line here is just below 0.70 and so this is the support region to monitor next week for any make or break activity.
Price is below the 4hr and daily Cloud which is bearish.
The weekly candle was bearish.
Watch for impact from the following NZD and CNY data as well as Friday’s US NFP.
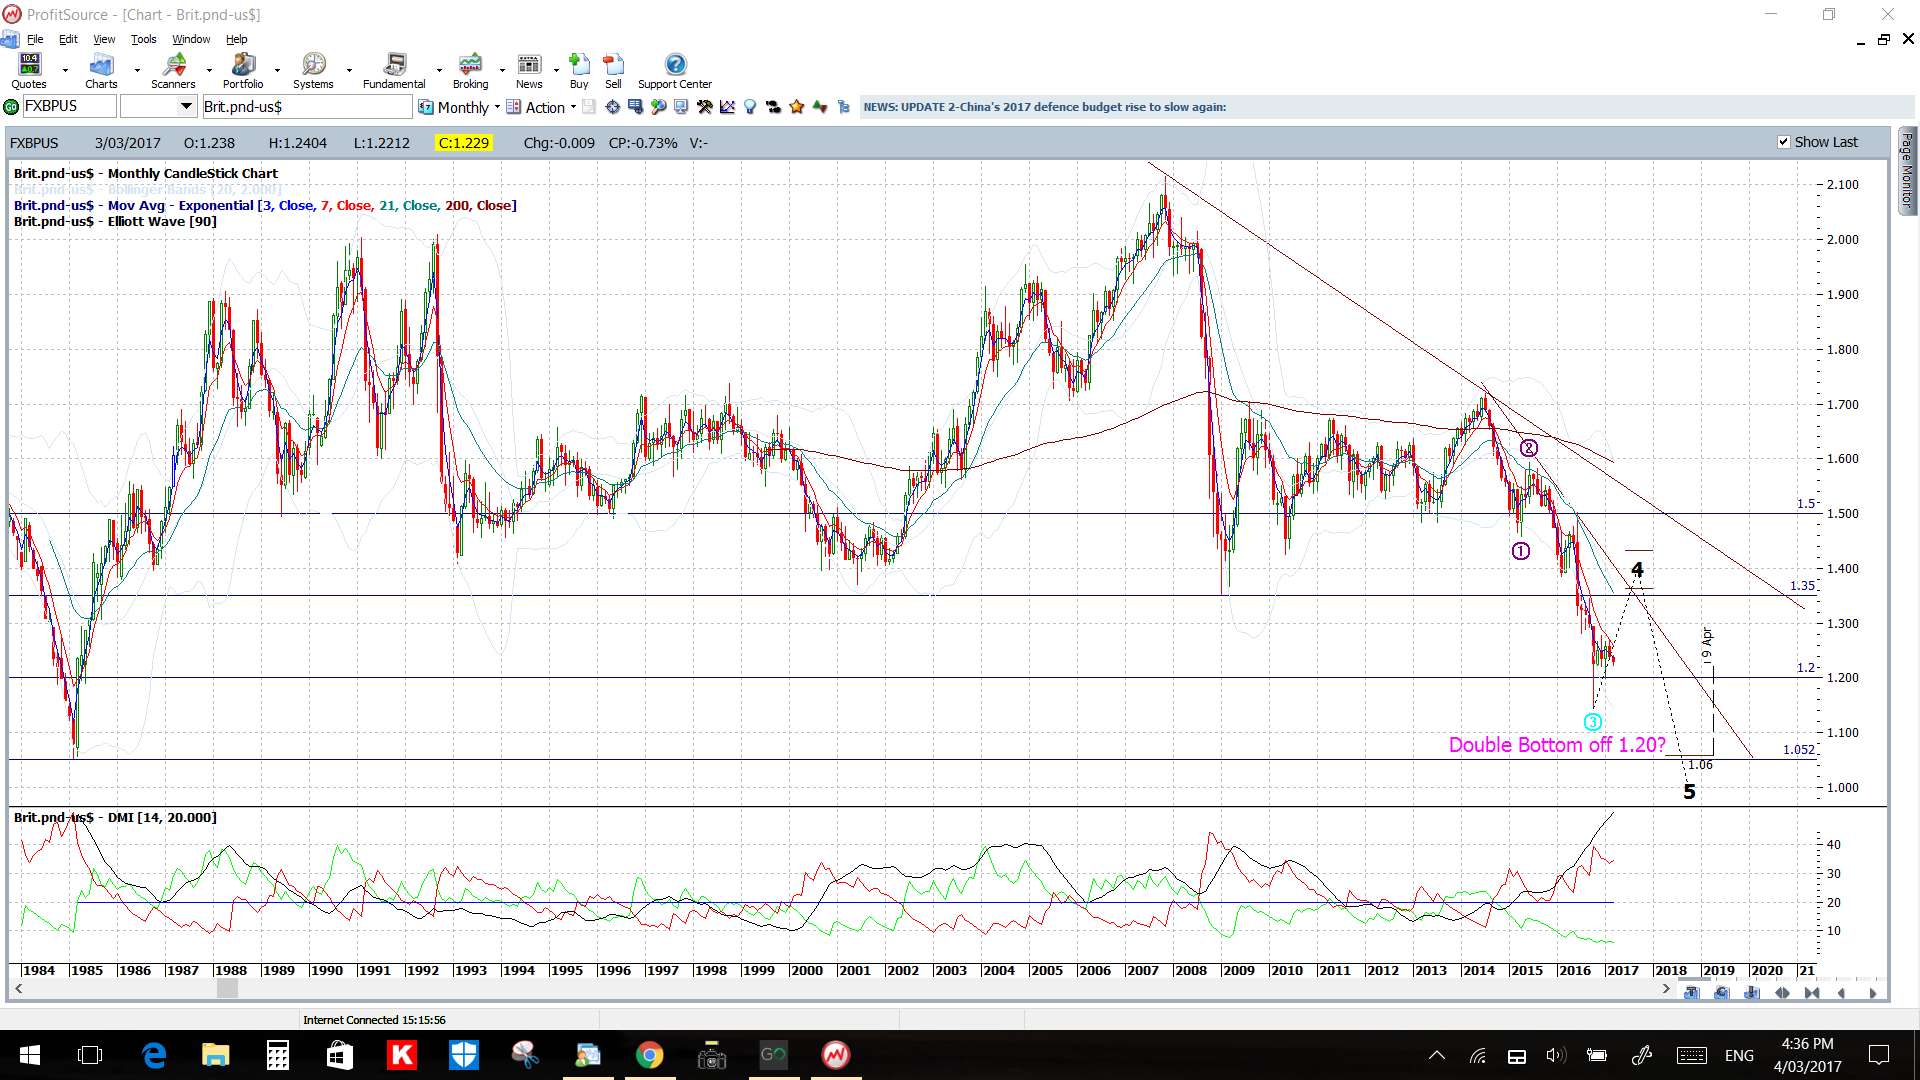
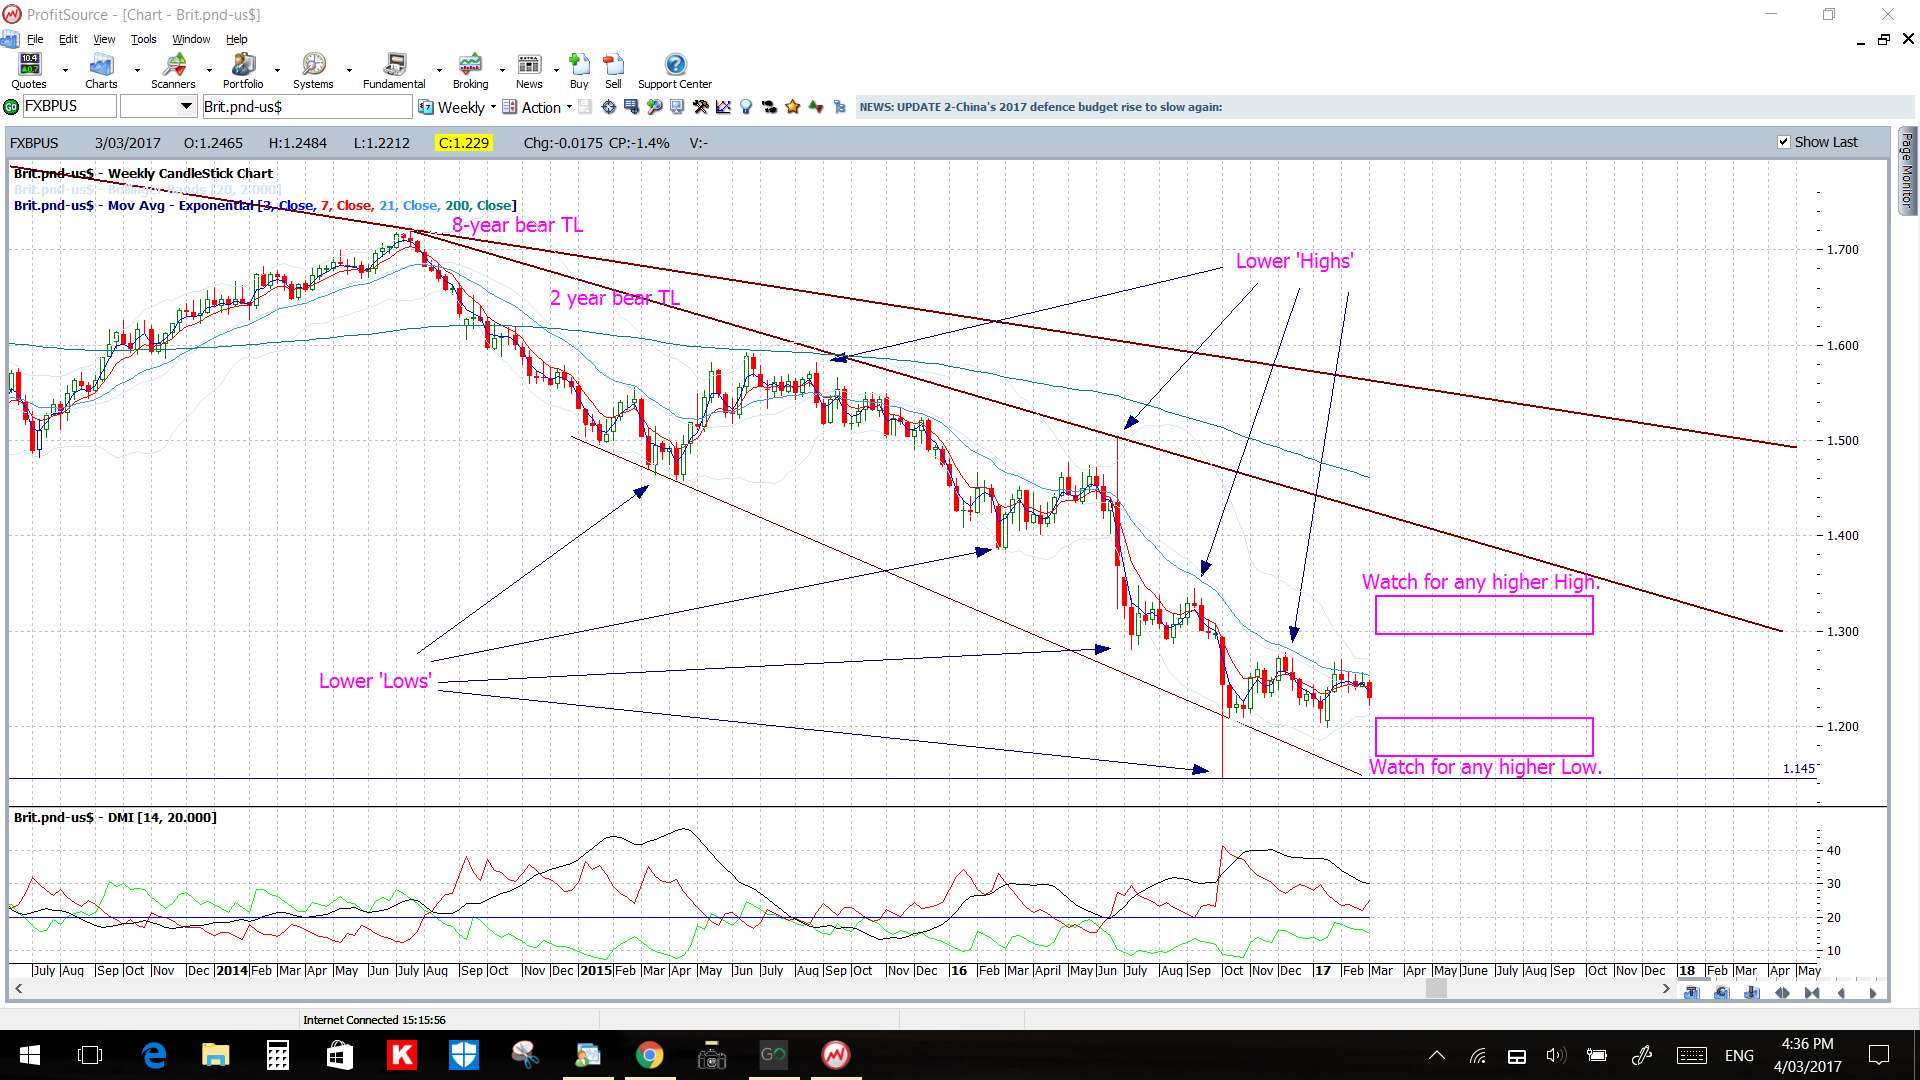
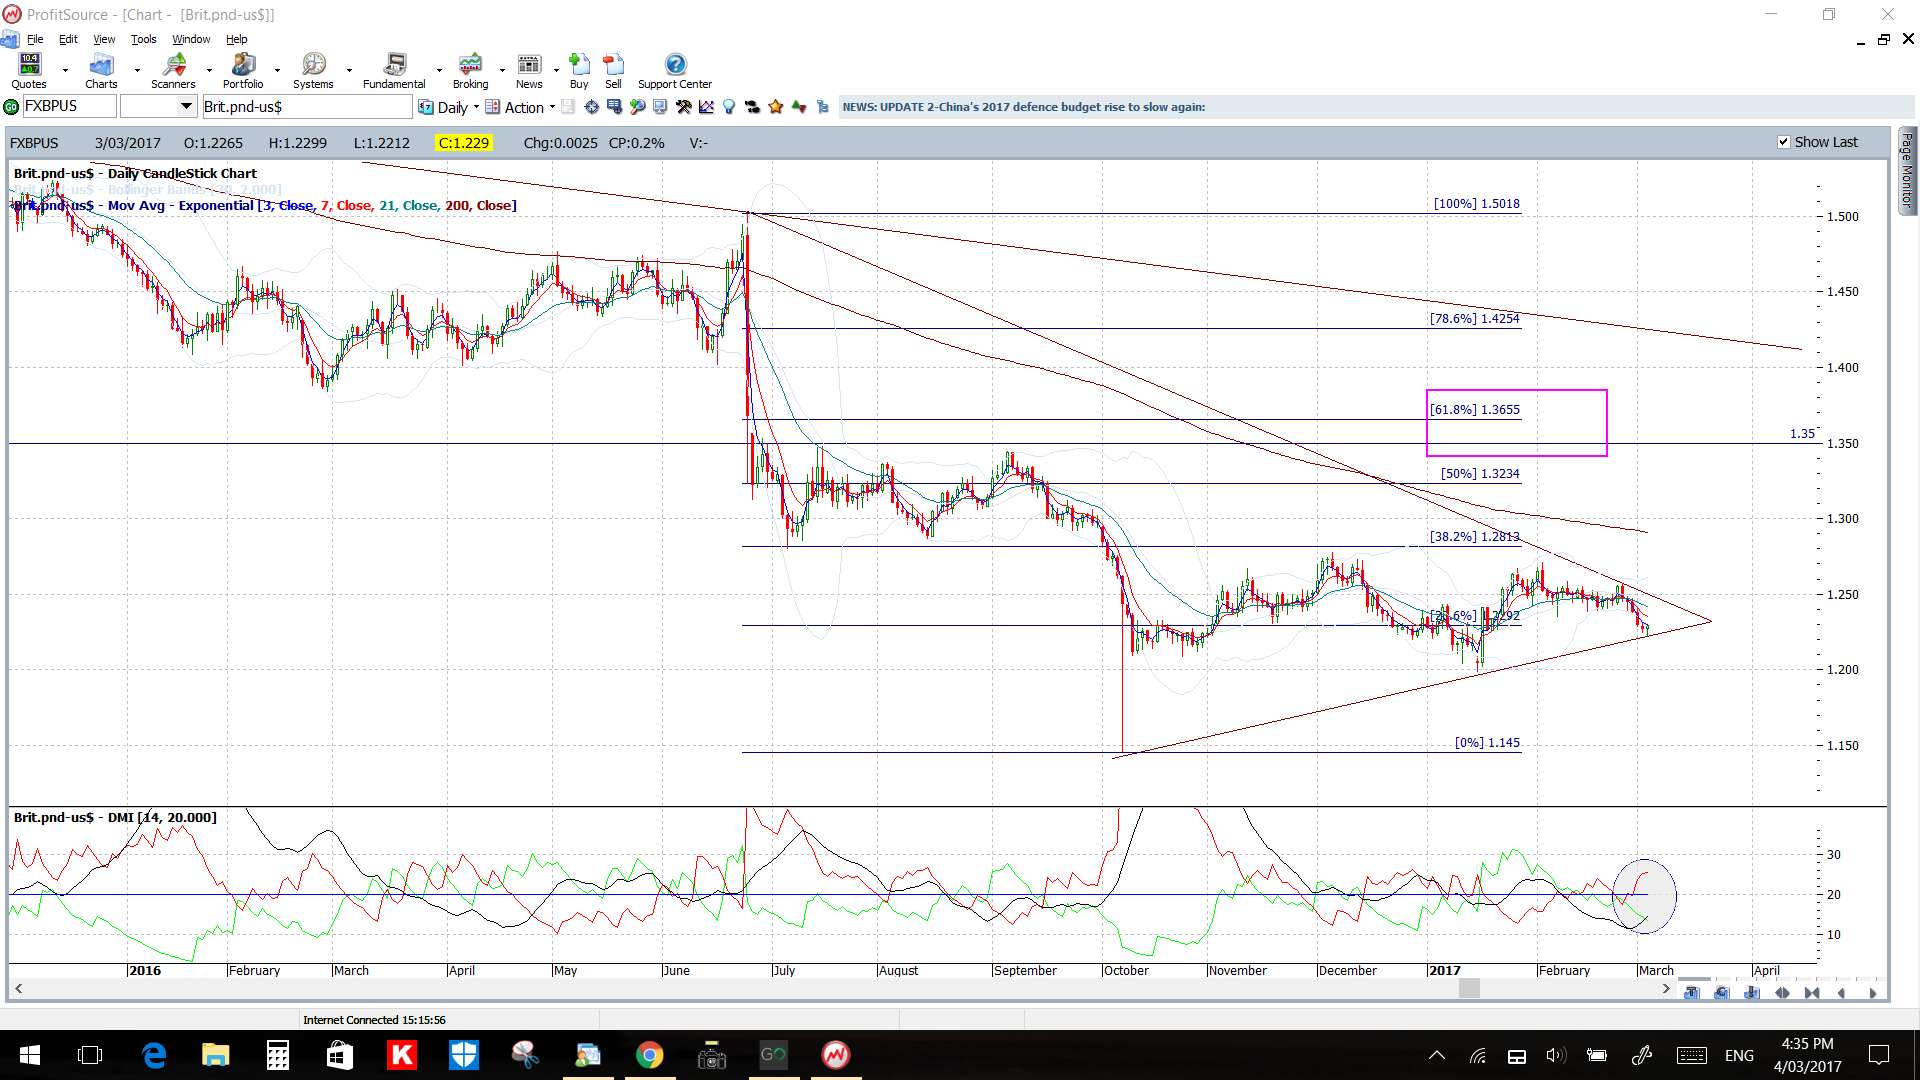
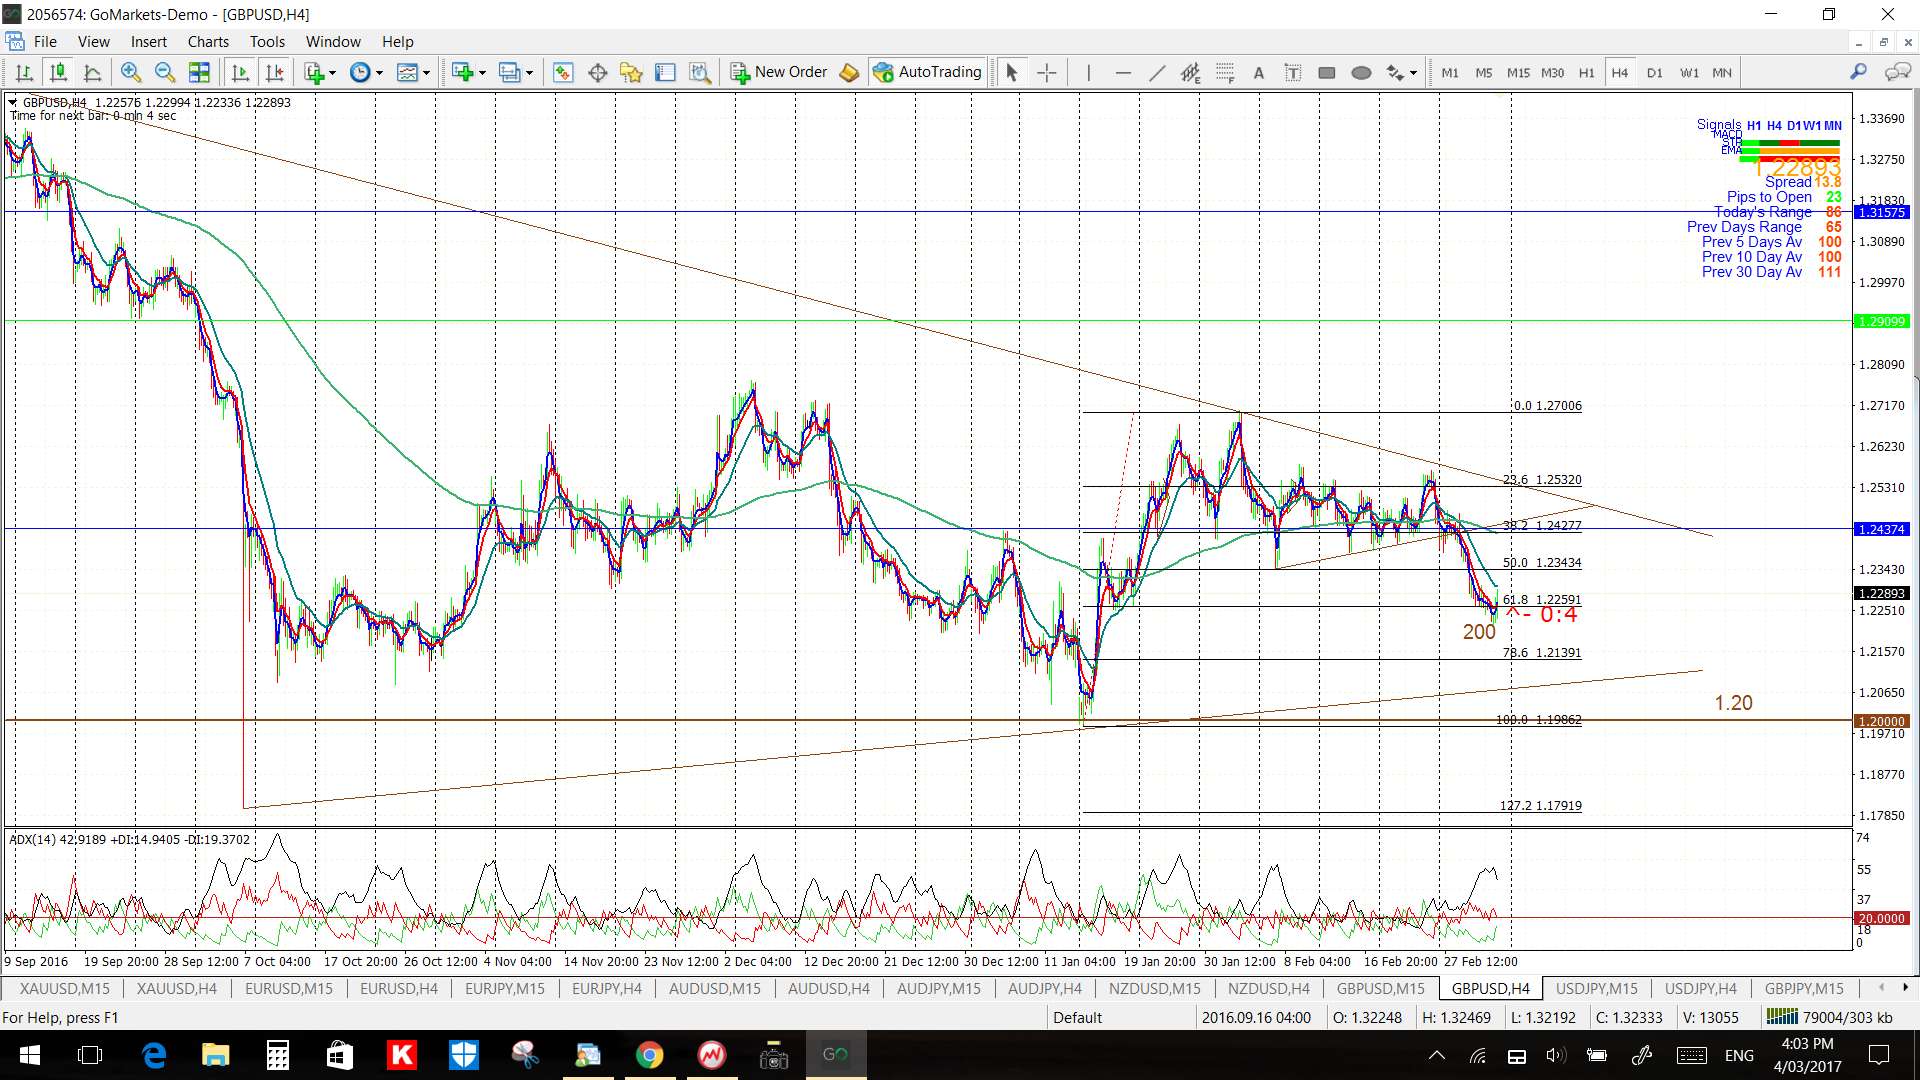
GBP/USD: A triangle break last week on the 4hr chart for this pair gave up to 200 pips but this move slowed at the daily chart’s 61.8% and this remains the level to watch for any make or break activity.
Note that price action is still trading within a larger daily chart triangle so watch those trend lines too if they come under pressure. The daily chart shows that price has essentially been tracking sideways for the last 5 months so I’m hoping that this consolidation will eventually deliver a decent breakout move.
Price is below the Cloud on the 4hr and daily chart.
The weekly candle was bearish and engulfing.
Watch for impact from GBP data and Friday’s US NFP:
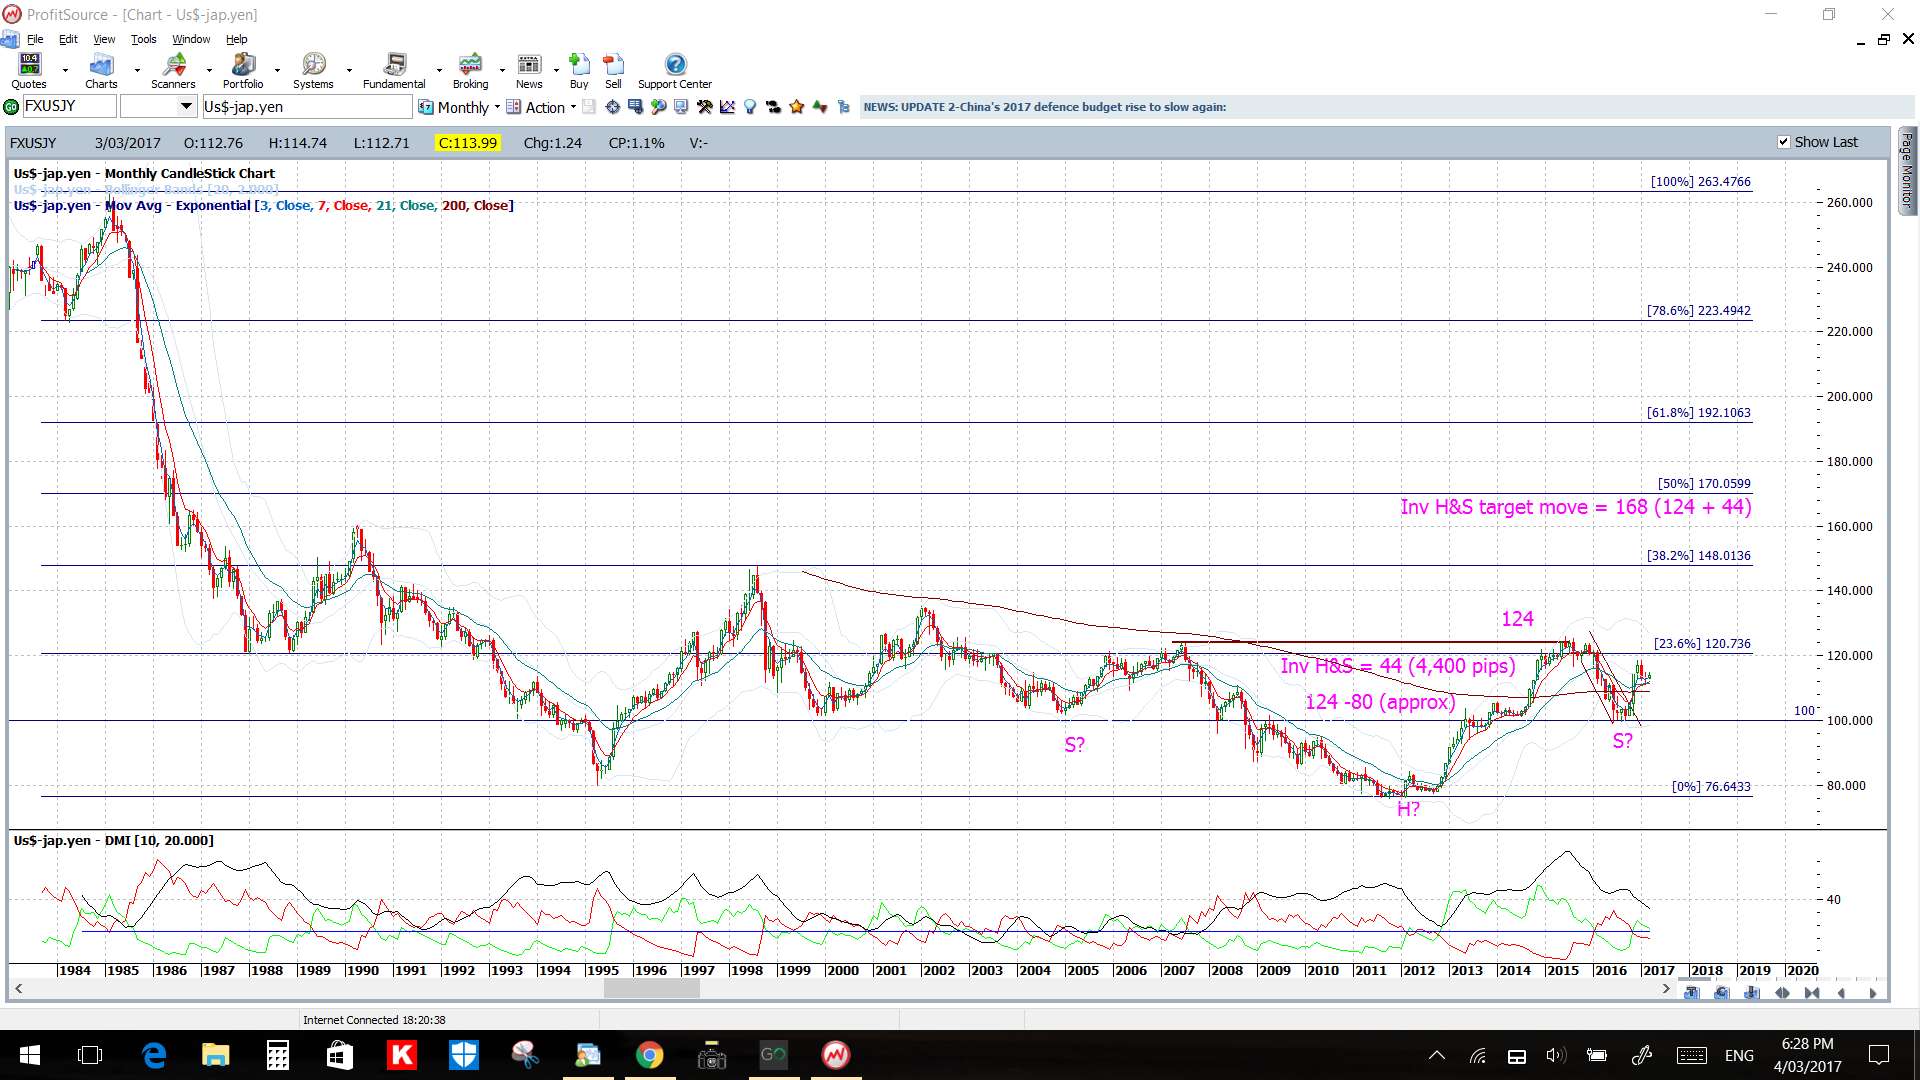
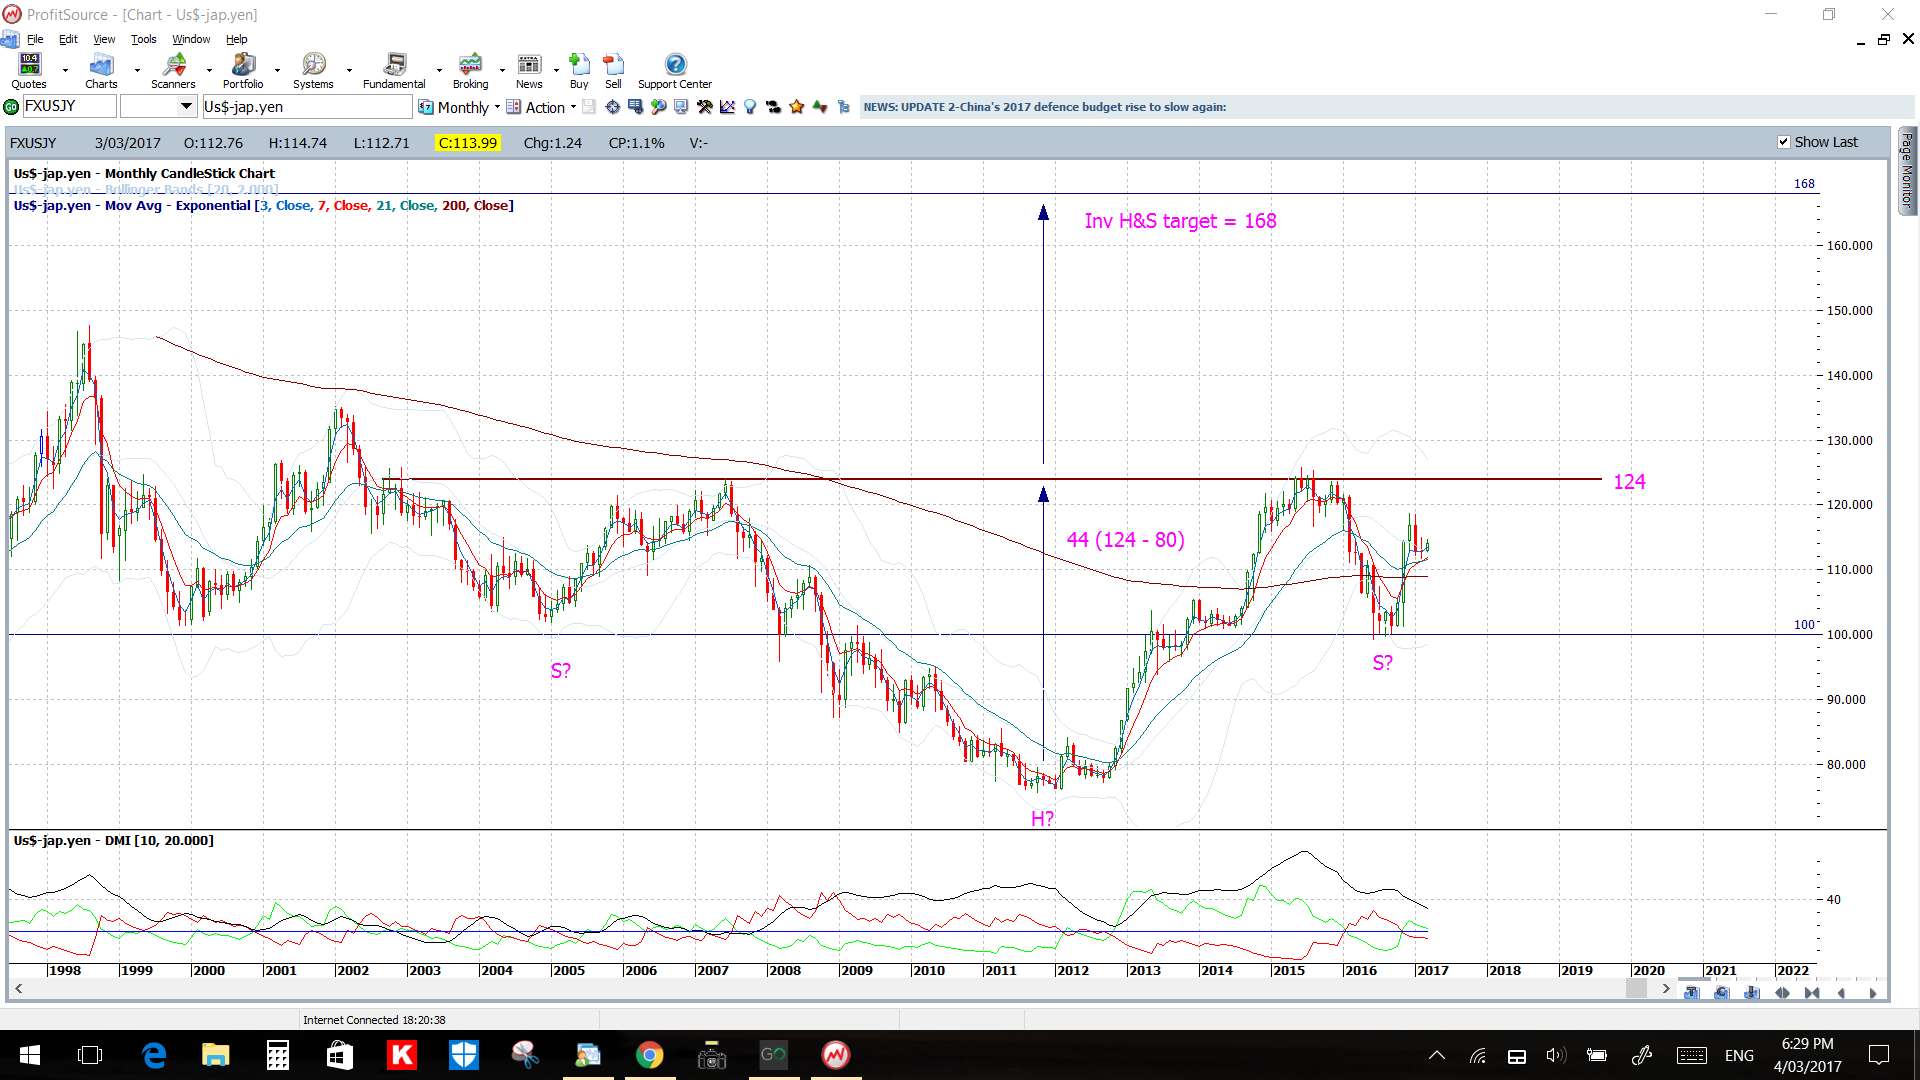
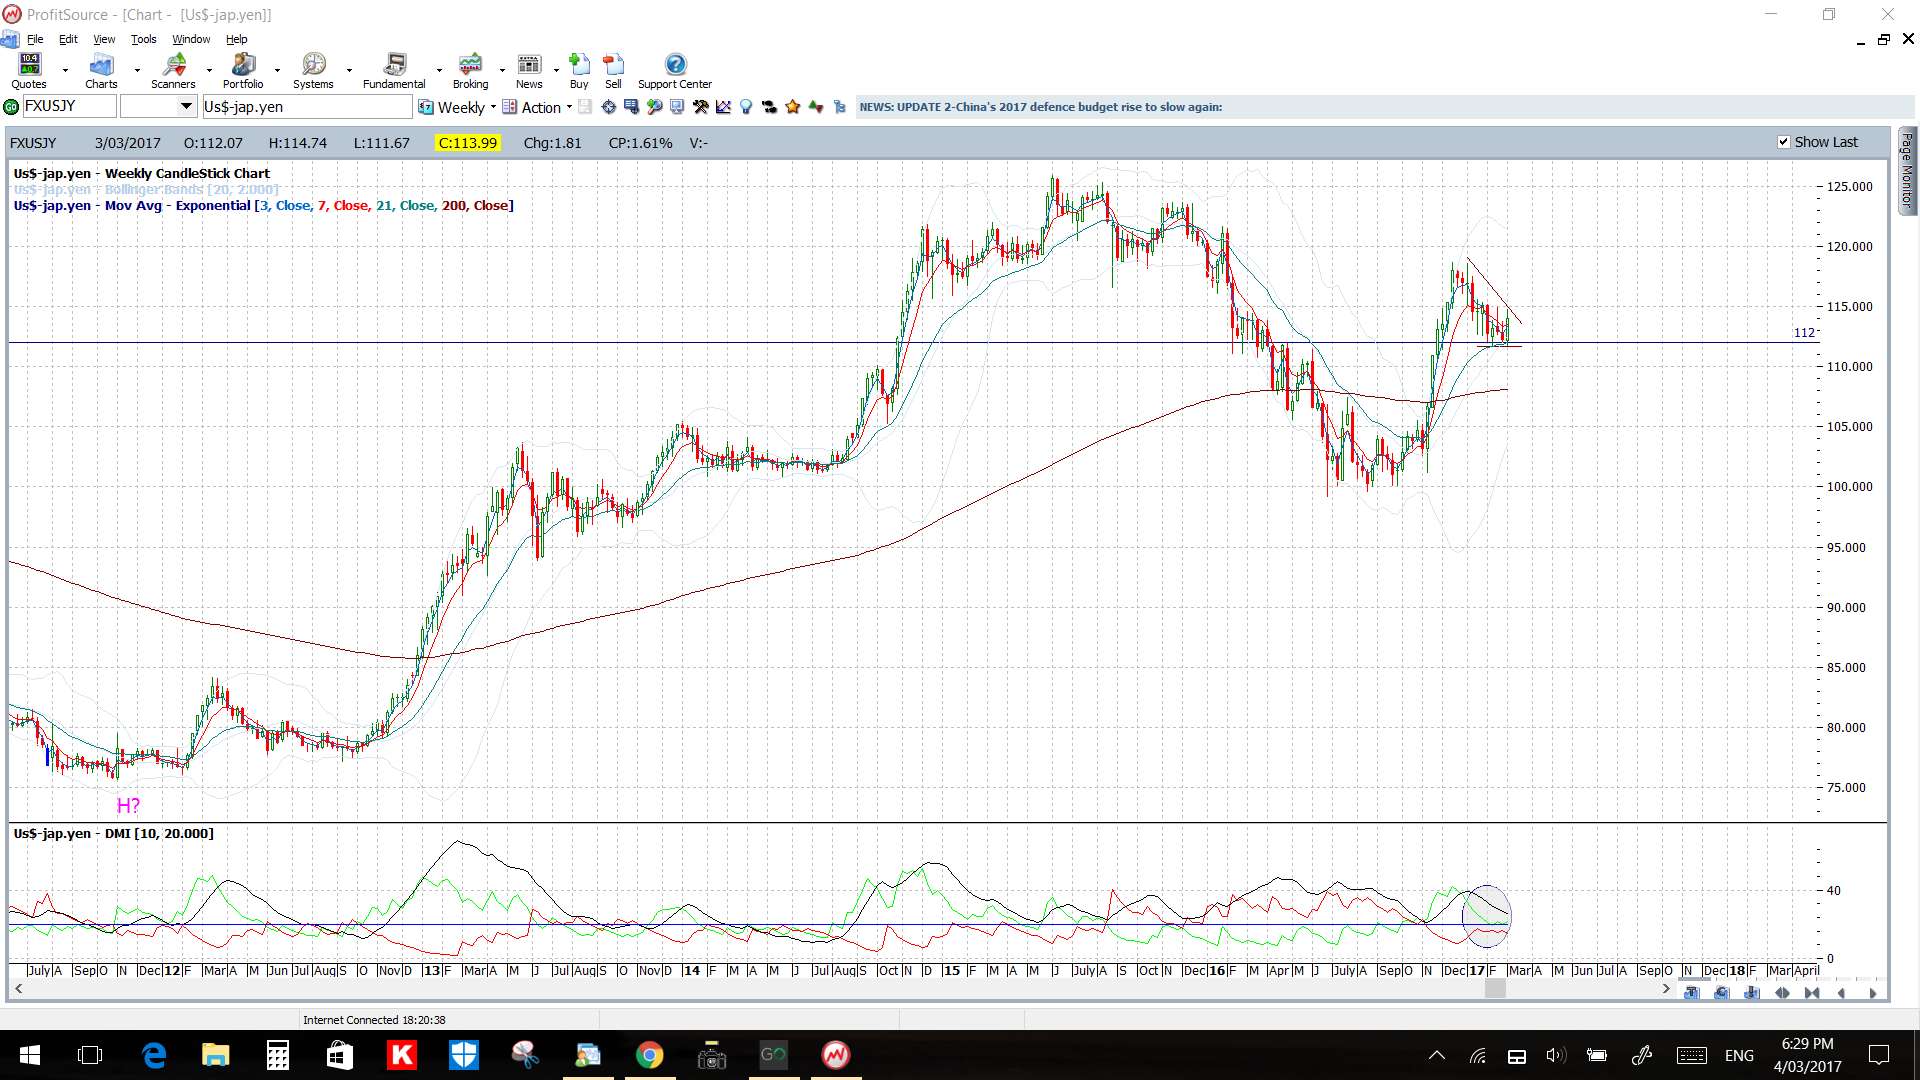
USD/JPY: A triangle break last week on the 4hr chart for this pair gave up to 170 pips but, given this bearish move slowed, I have recast triangle trend lines here too.
Price is above the 4hr Cloud but in the daily Cloud.
The weekly candle was bullish and almost engulfing.
There isn’t any high impact JPY data but watch for impact from USD data and especially Friday’s US NFP.


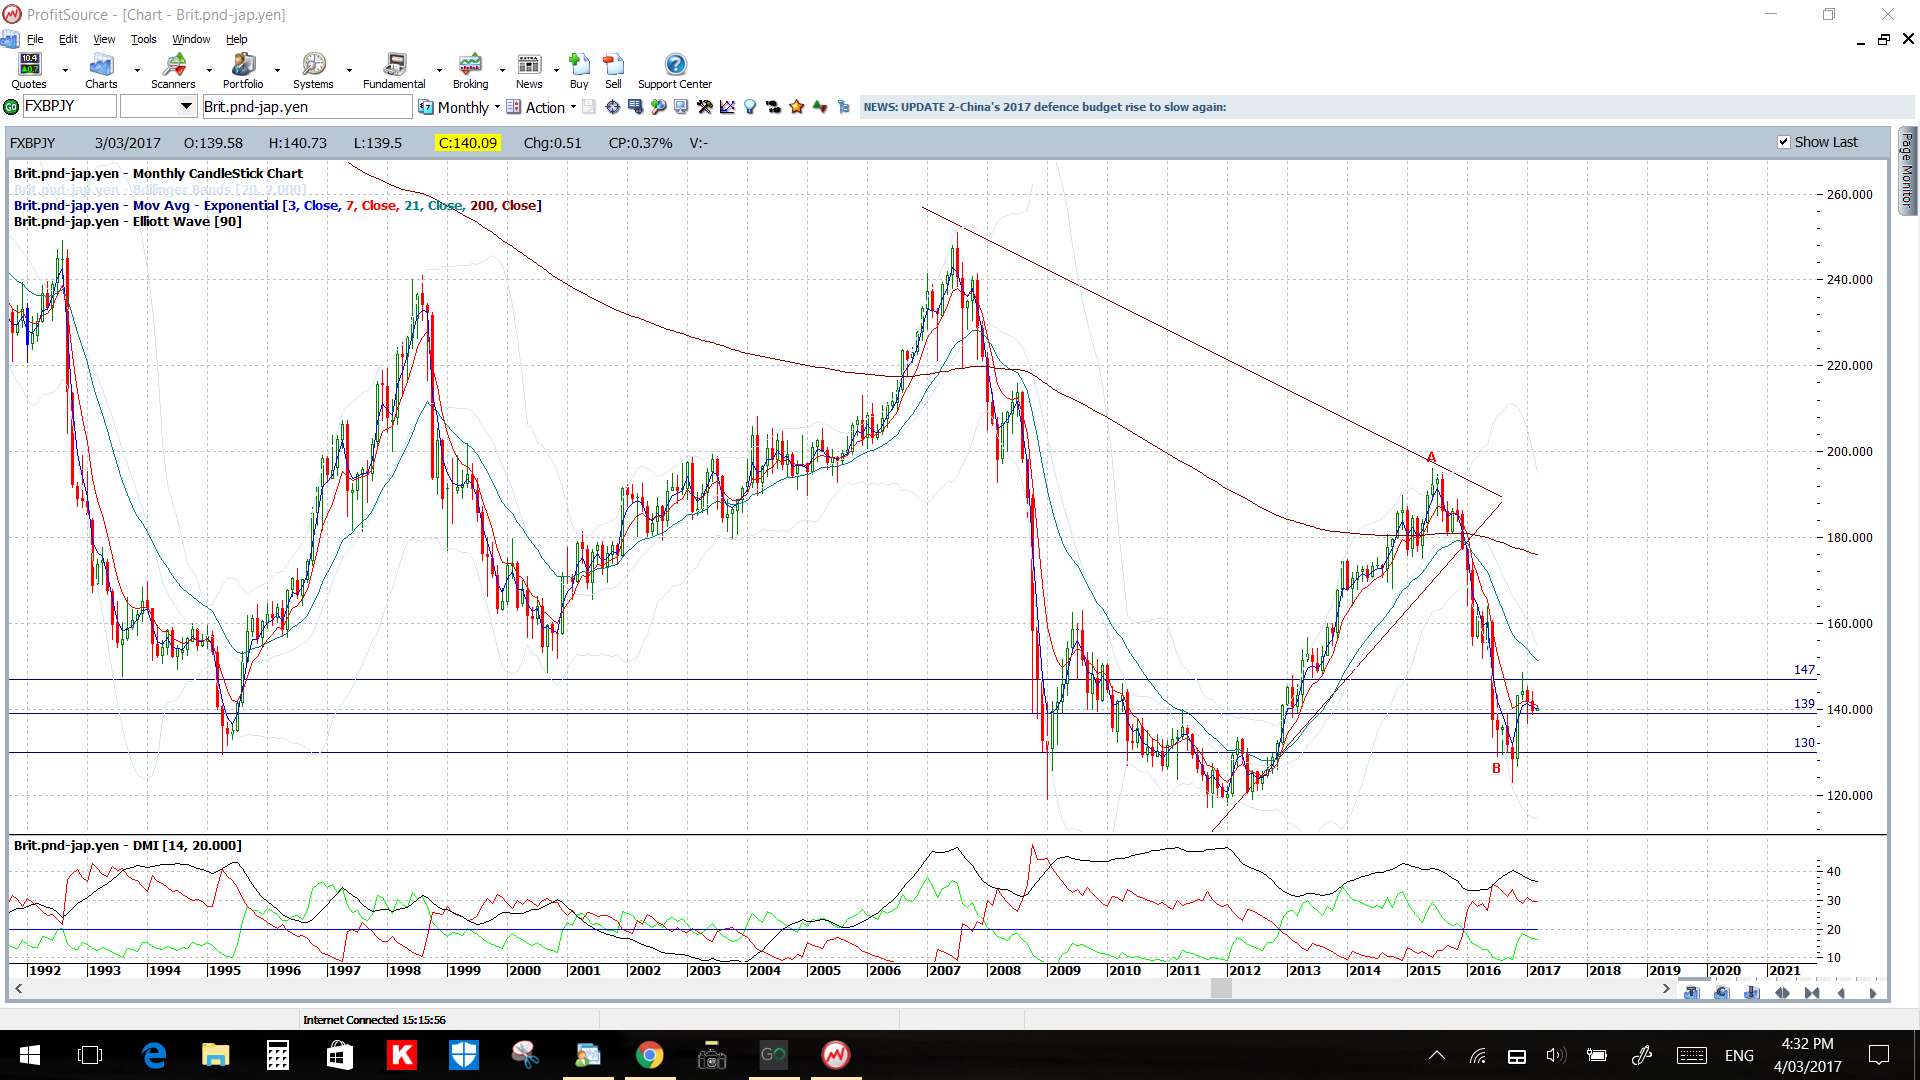
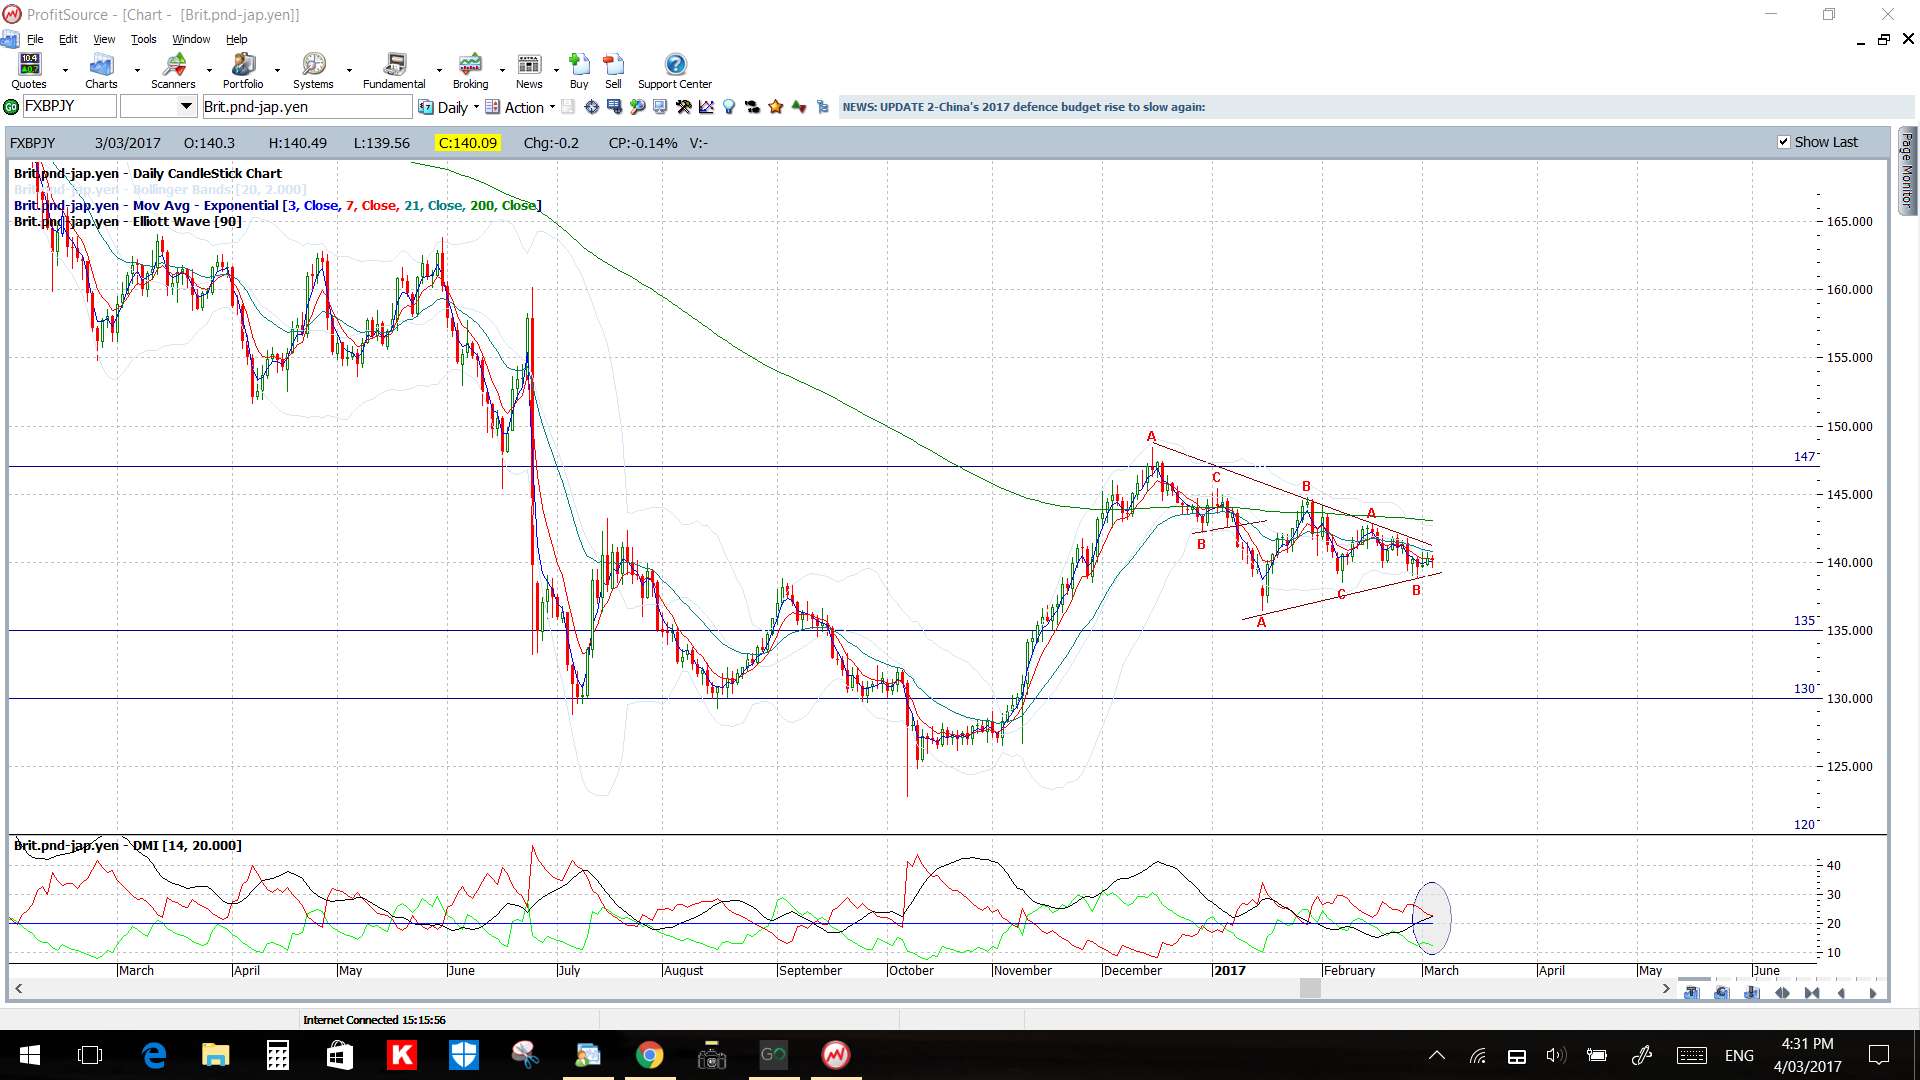
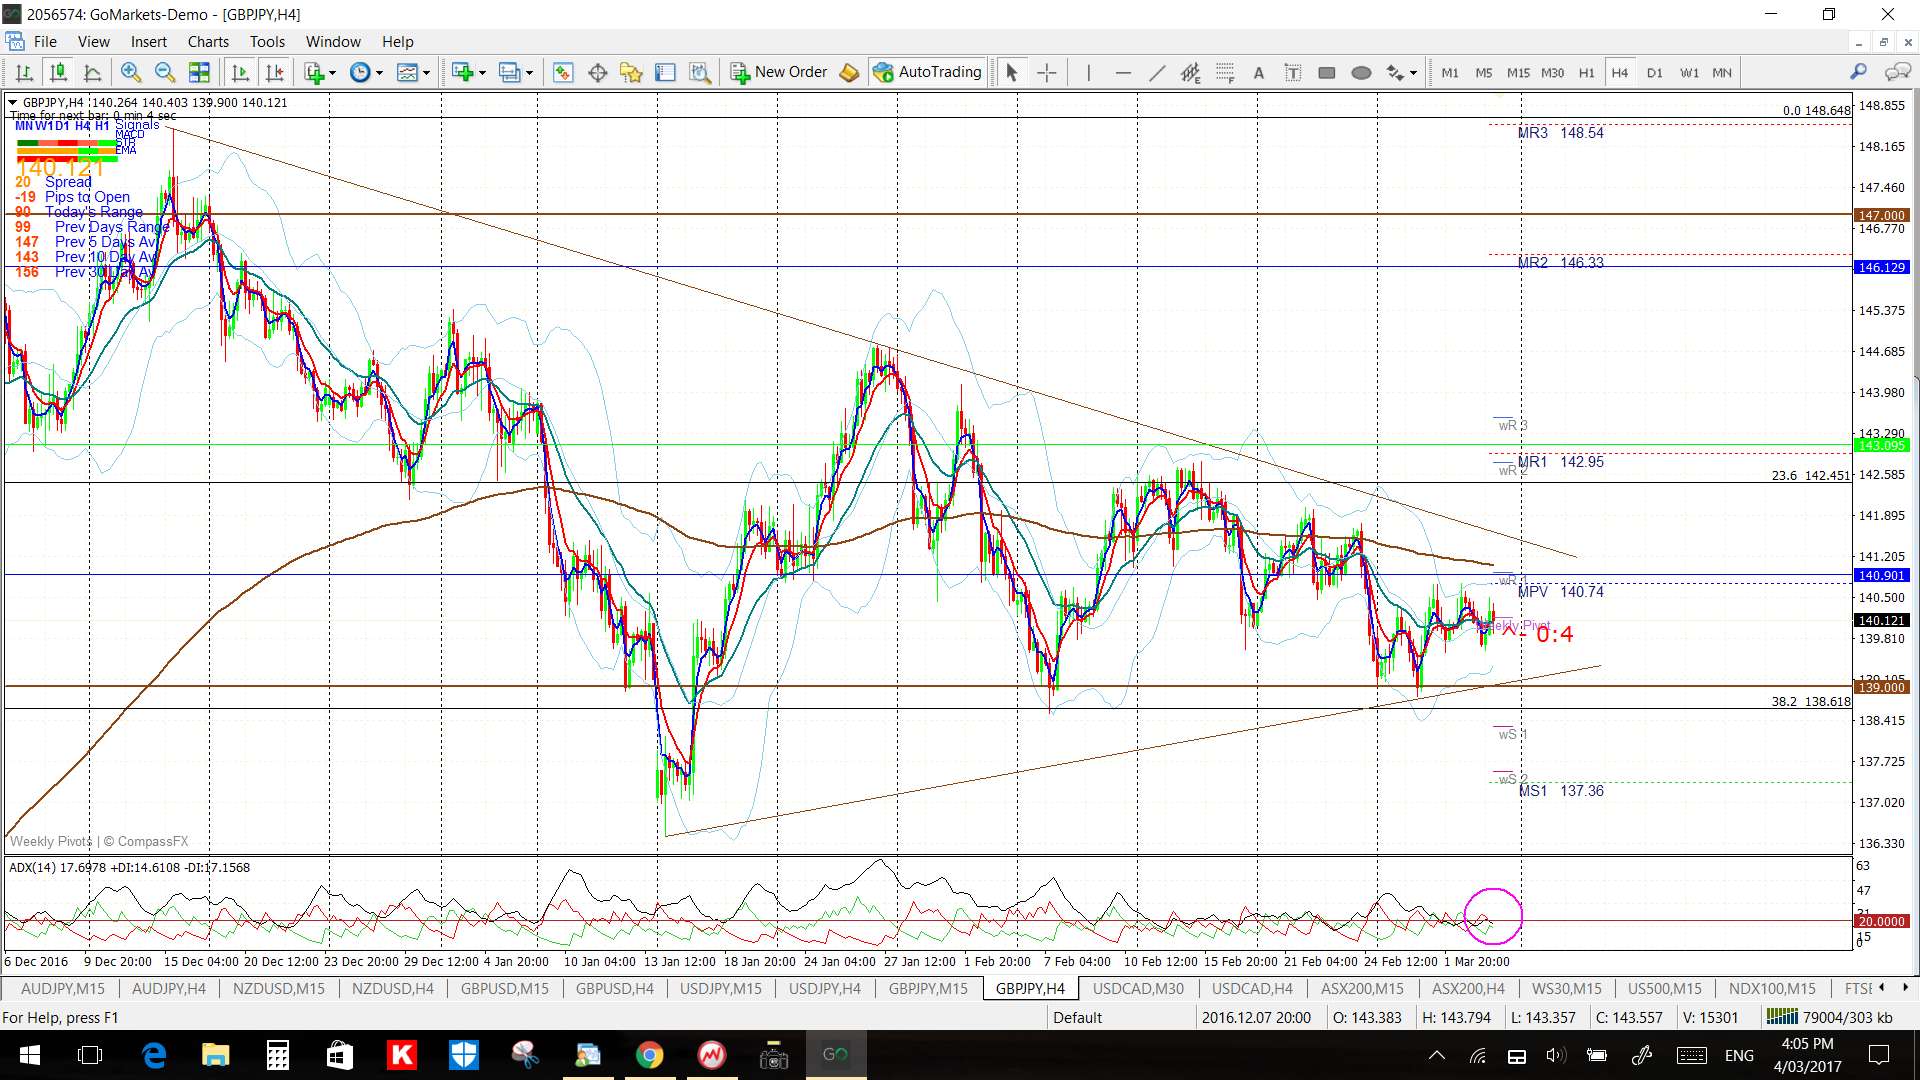
GBP/JPY: I’m still watching the daily chart’s triangle for any breakout here and hoping that the longer this coils then the better the breakout will be!
Price is below the 4hr and daily Cloud.
The weekly candle closed a bullish coloured ‘Spinning Top’ reflecting indecision.
Watch for impact from GBP, JPY and Friday’s NFP data.

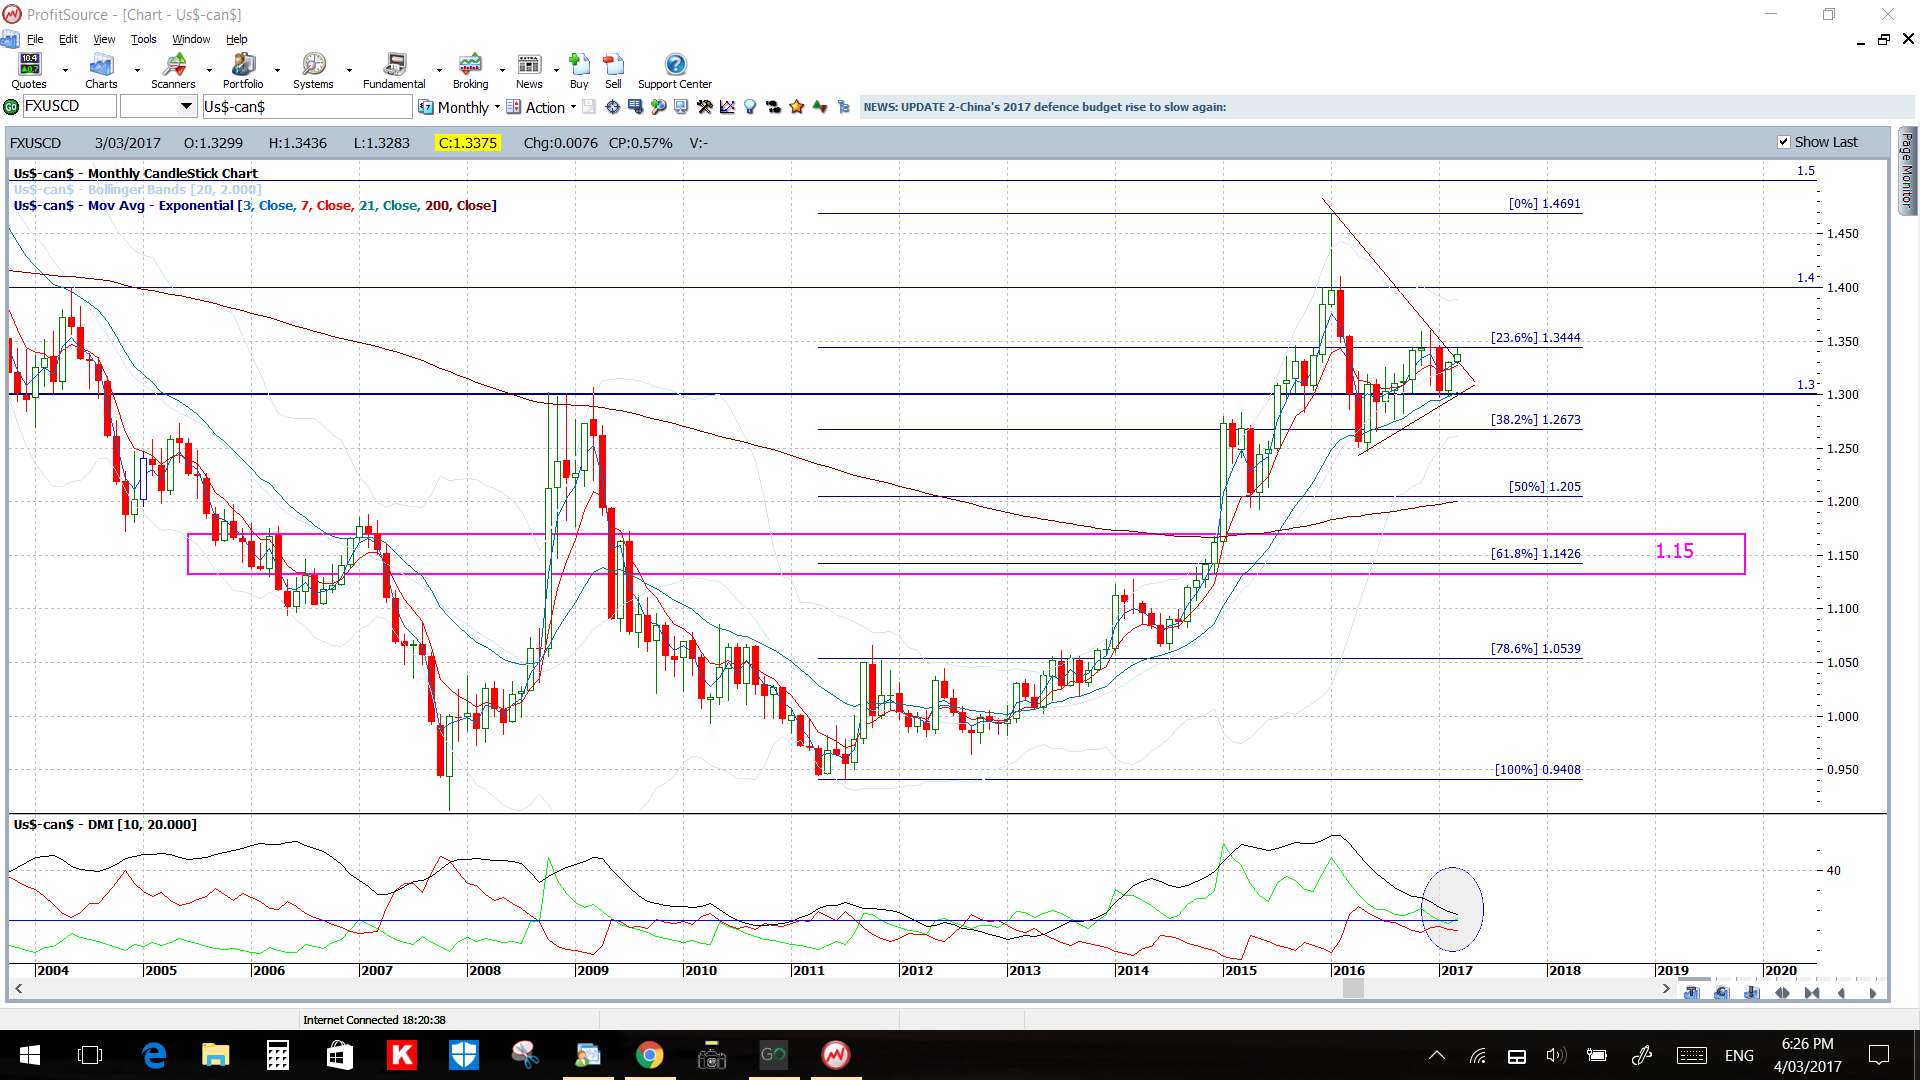
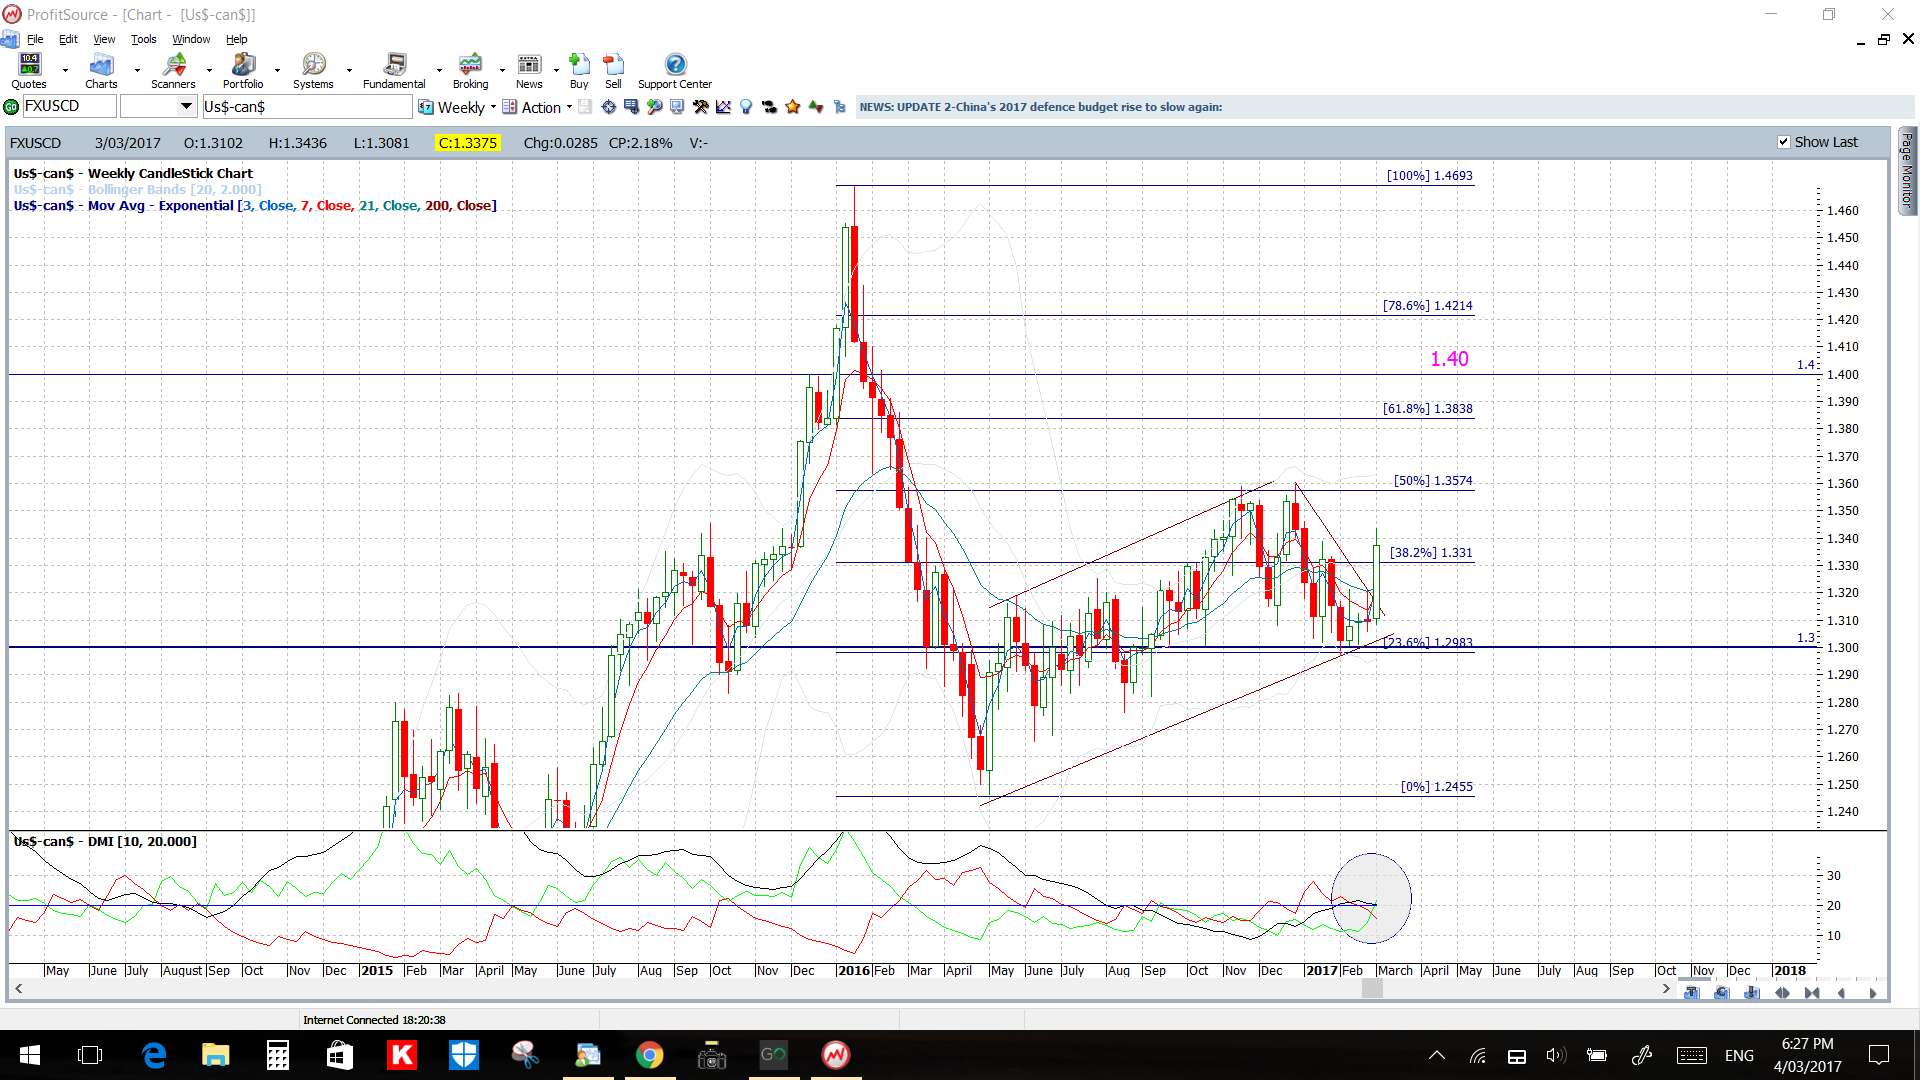
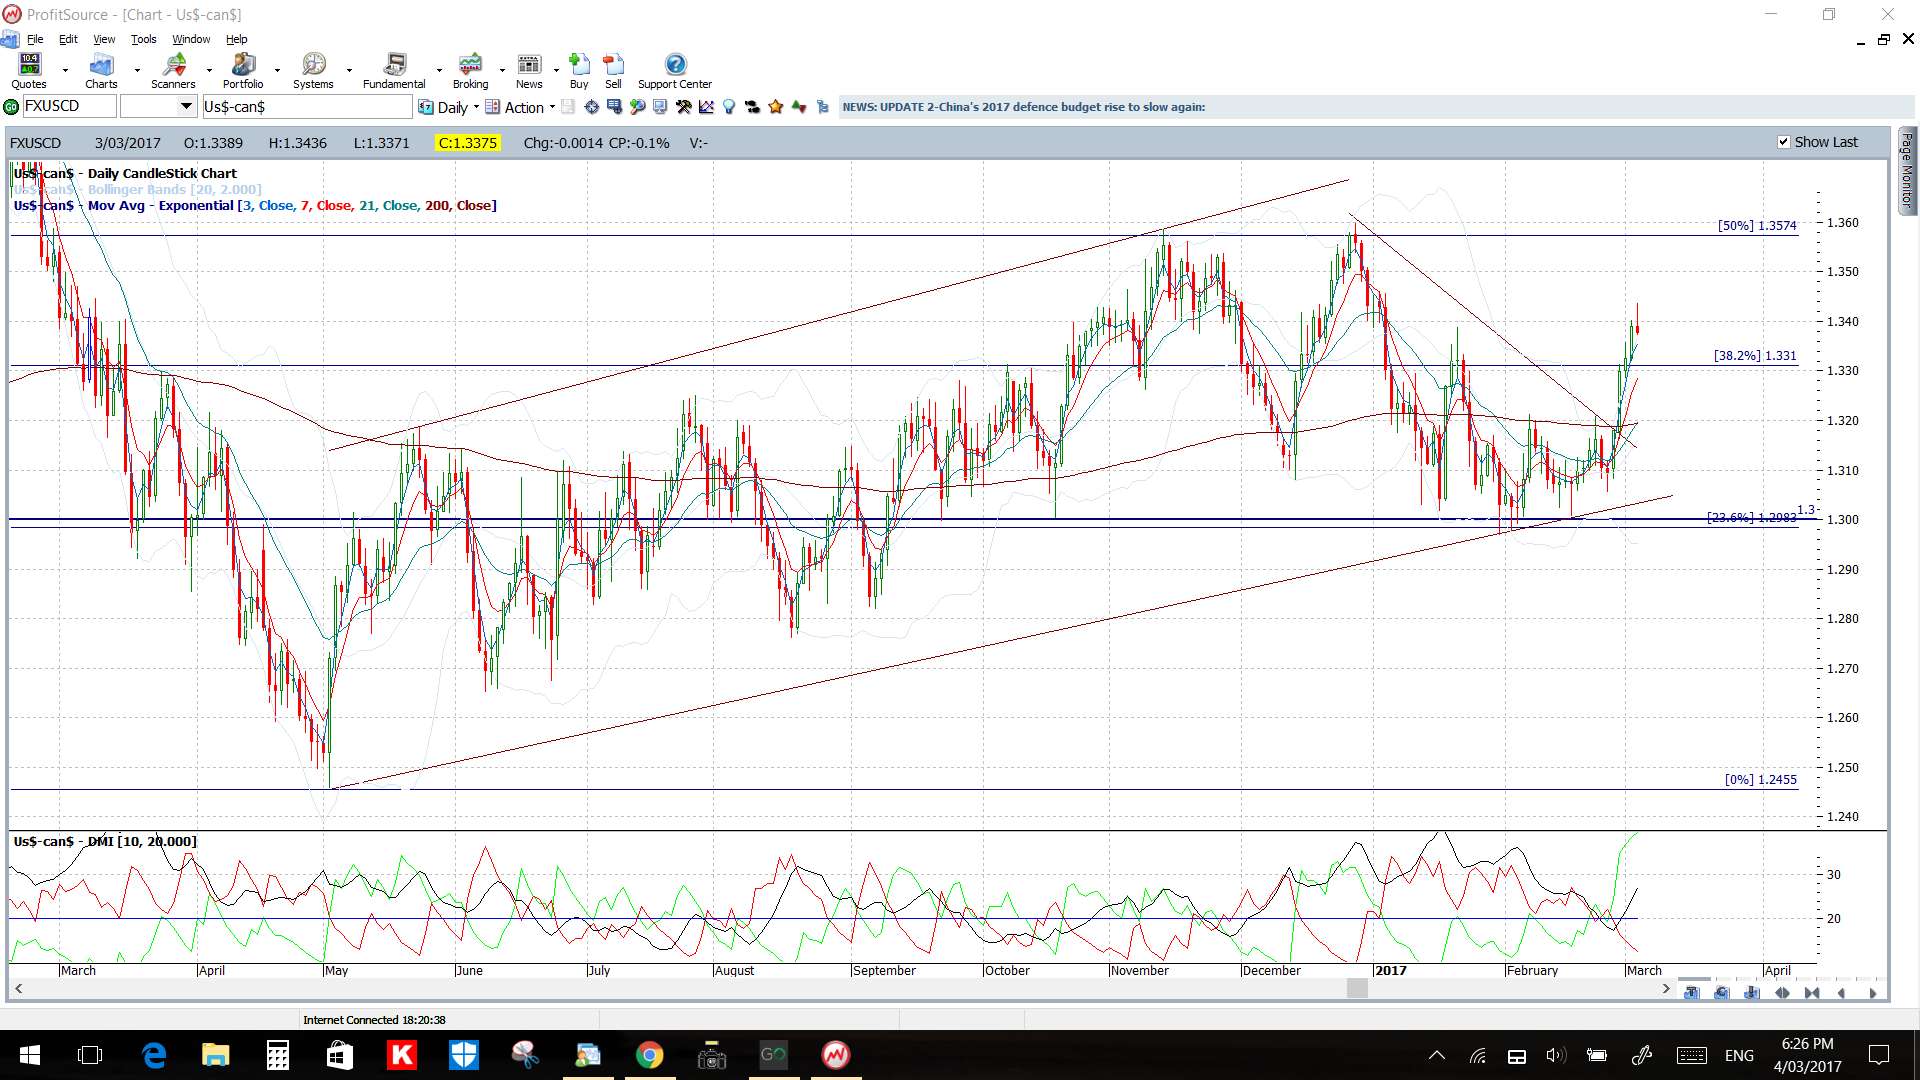
USD/CAD: A wedge break last week on the 4hr chart for this pair gave up to 240 pips. Price action is back to trading within an ascending channel on the daily chart, however, a triangle on the monthly chart looks to be being tested.
Price is above the Cloud on the 4hr and daily chart.
The weekly candle was large and bullish.
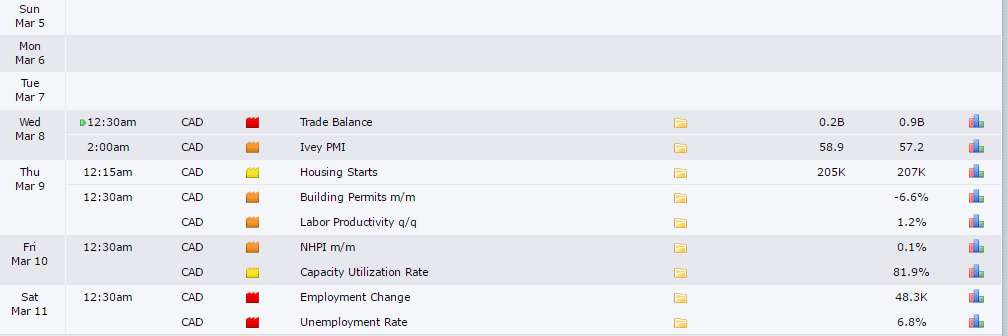
Watch for CAD Trade Balance and Employment data this week and Friday’s US NFP:
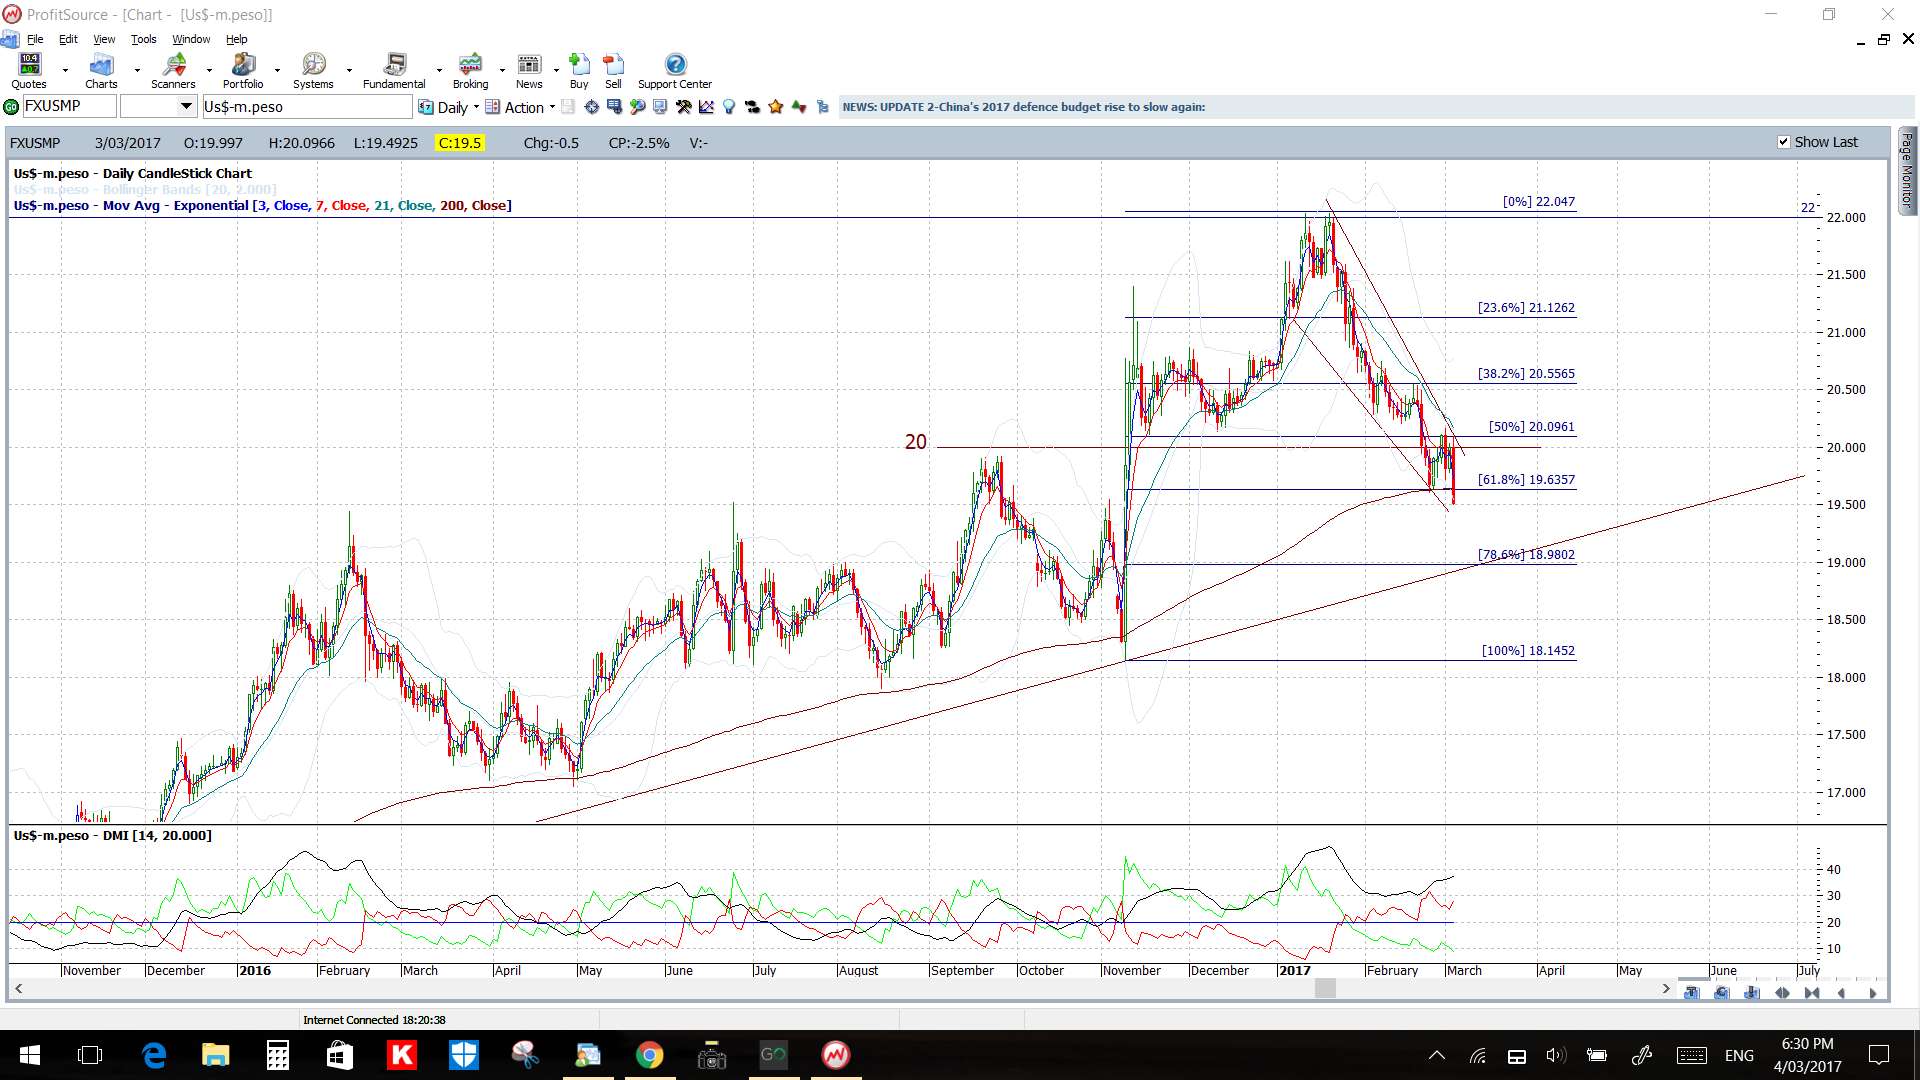
USD/MXN: I had mentioned last week to watch for any test of the 20 / 20.15 region and we got this test to the pip!
Price action remains in a descending channel on the weekly/daily chart but last week it finally broke below the support of the daily chart’s 61.8% fib.
Price is below the 4hr and daily Cloud.
The weekly candle was bearish.
The weekly chart shows a support trend line in play and so that would be the next support zone I’d focus on to monitor as this also aligns near the whole-number 19 level.
Watch for impact from USD-sensitive data, especially Friday’s US NFP, and from any press about Mexico and the ‘Wall’.


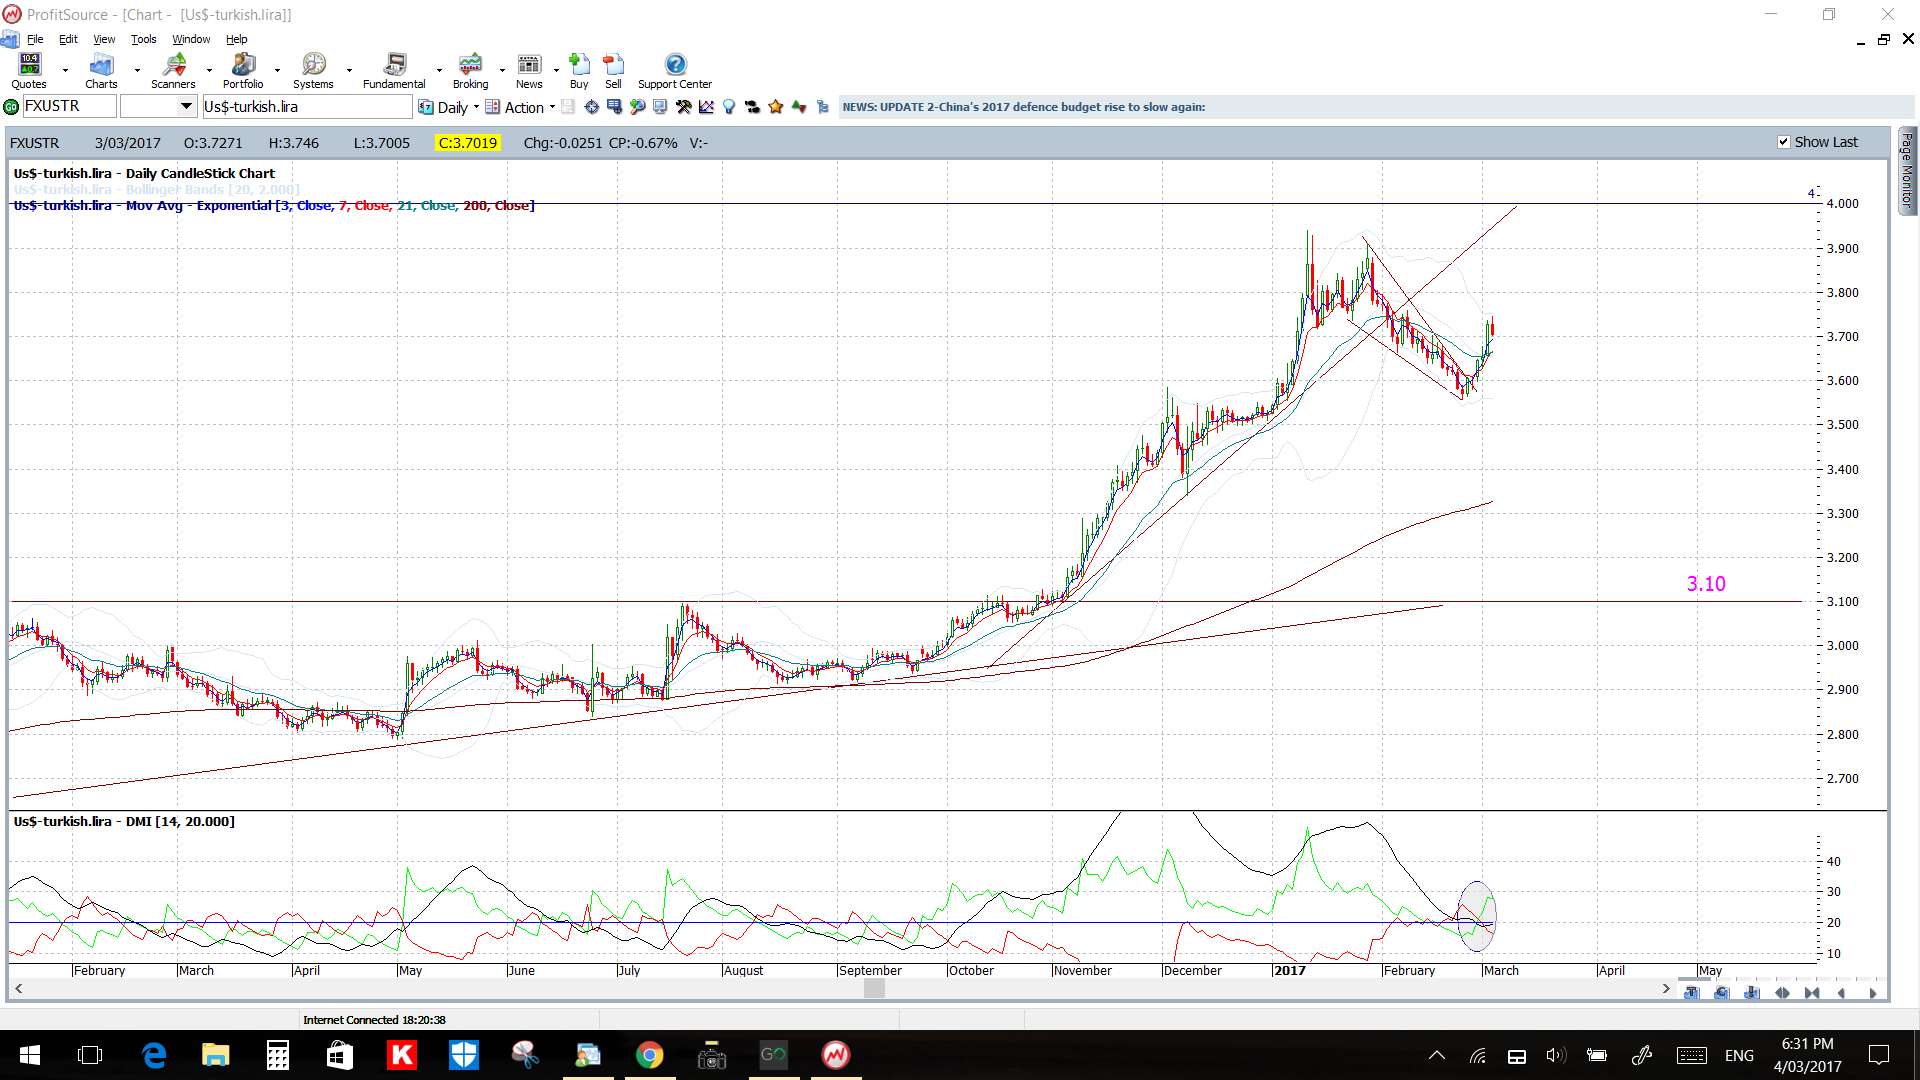
USD/TRY: The bullish-reversal descending wedge breakout triggered last week and gave a move worth over 1,200 pips but price action stalled after it met with the 50% fib of the last swing low move. Thus, I have recast the trend lines on the 4hr chart and have a new triangle to watch for any momentum-based breakout.
I am reading that concern over Syria was thought to be behind this recent bout of Lira weakness. Traders need to keep in mind though that the Turkish Government is trying to support the Lira and, thus, should be on the lookout for any return to weakness with this pair, especially if US$ weakness resumes.
My algo on the 15 min chart has been great for picking up shorter-term moves here and so I will keep an eye out for these trades as well.

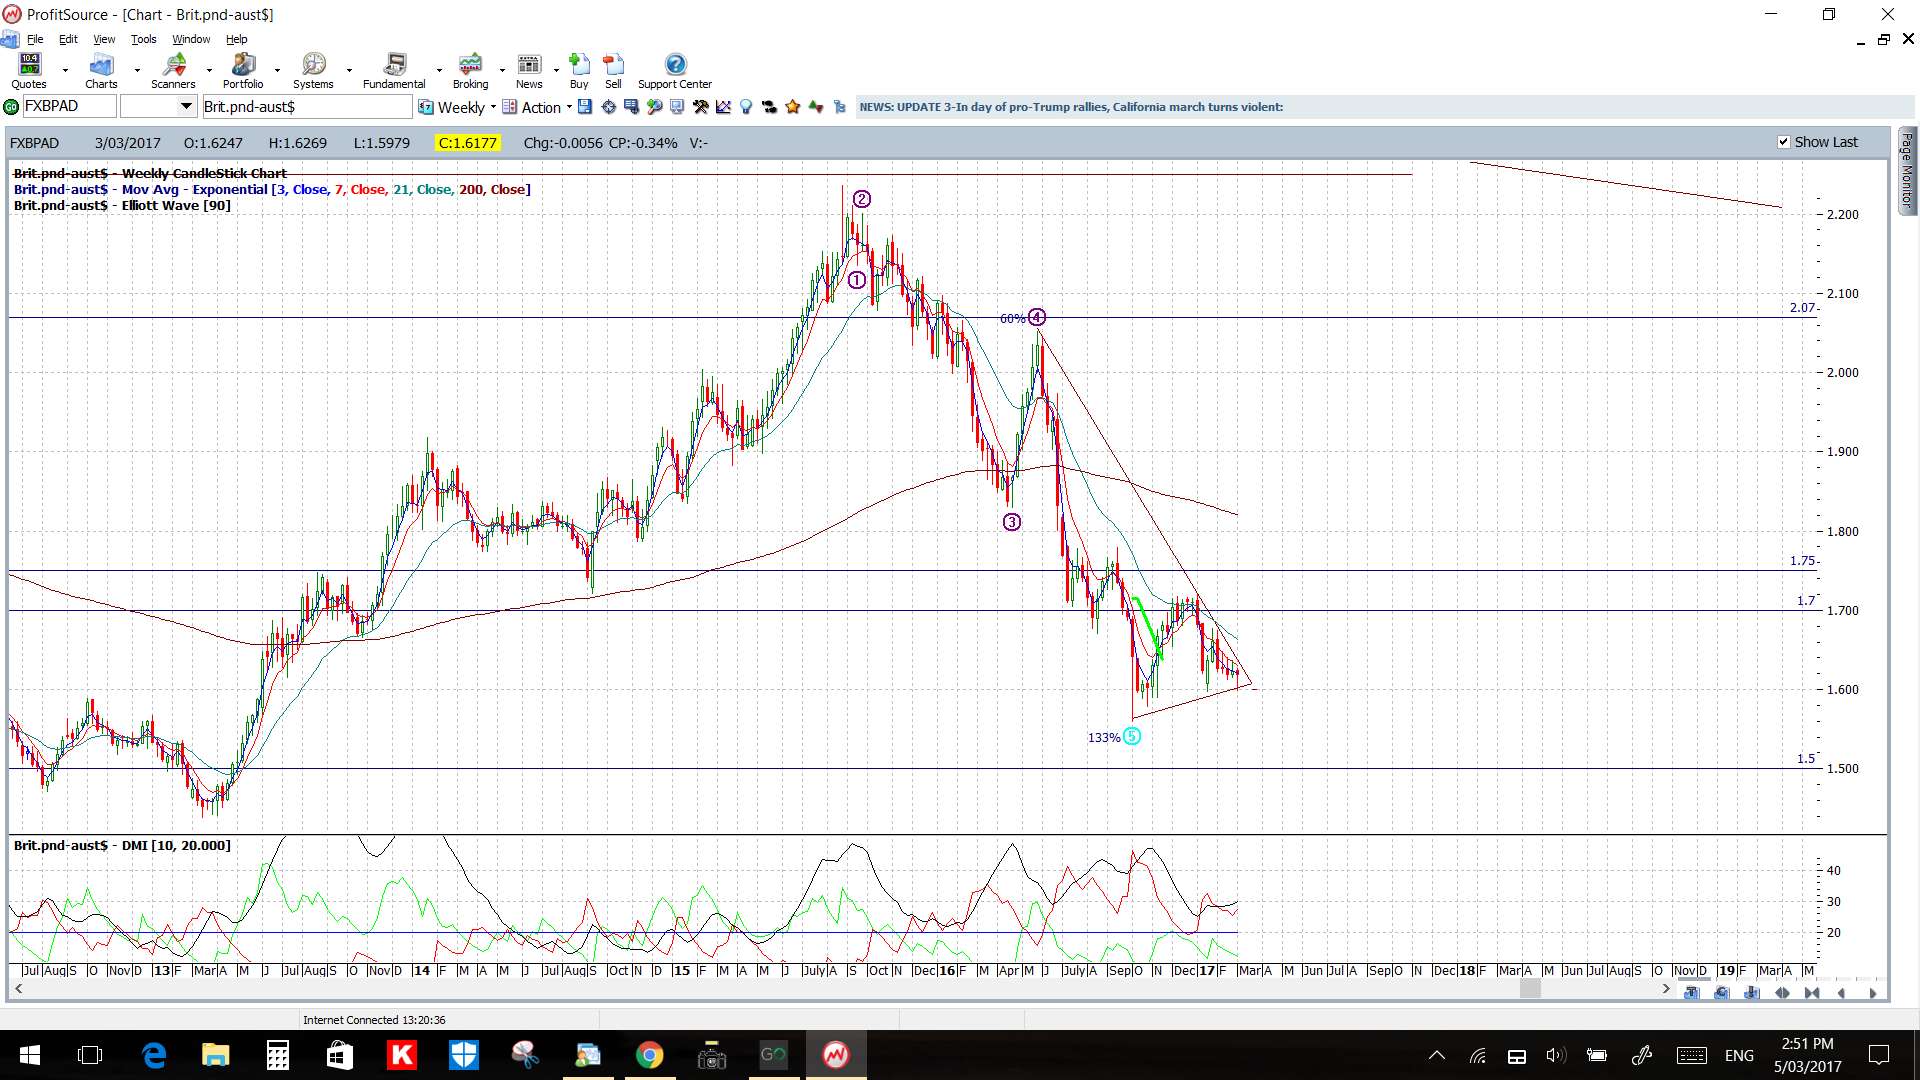
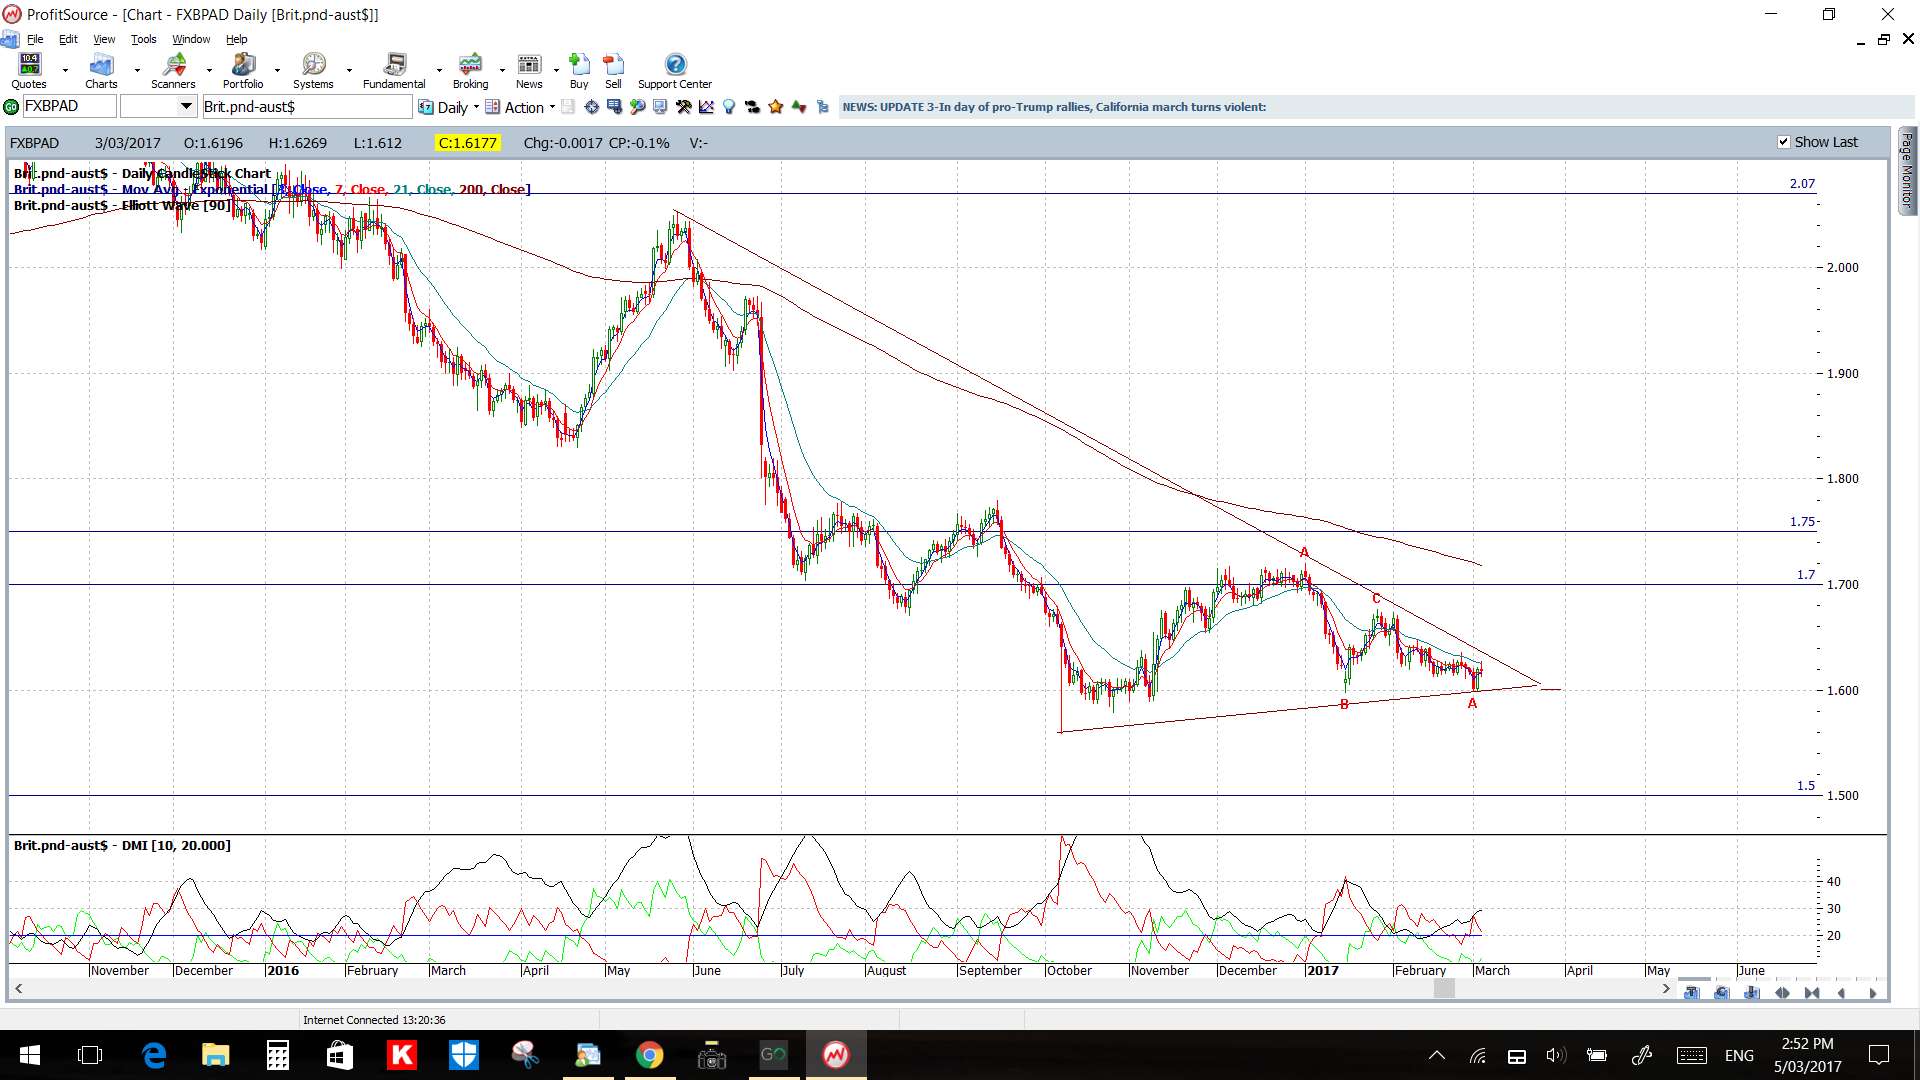
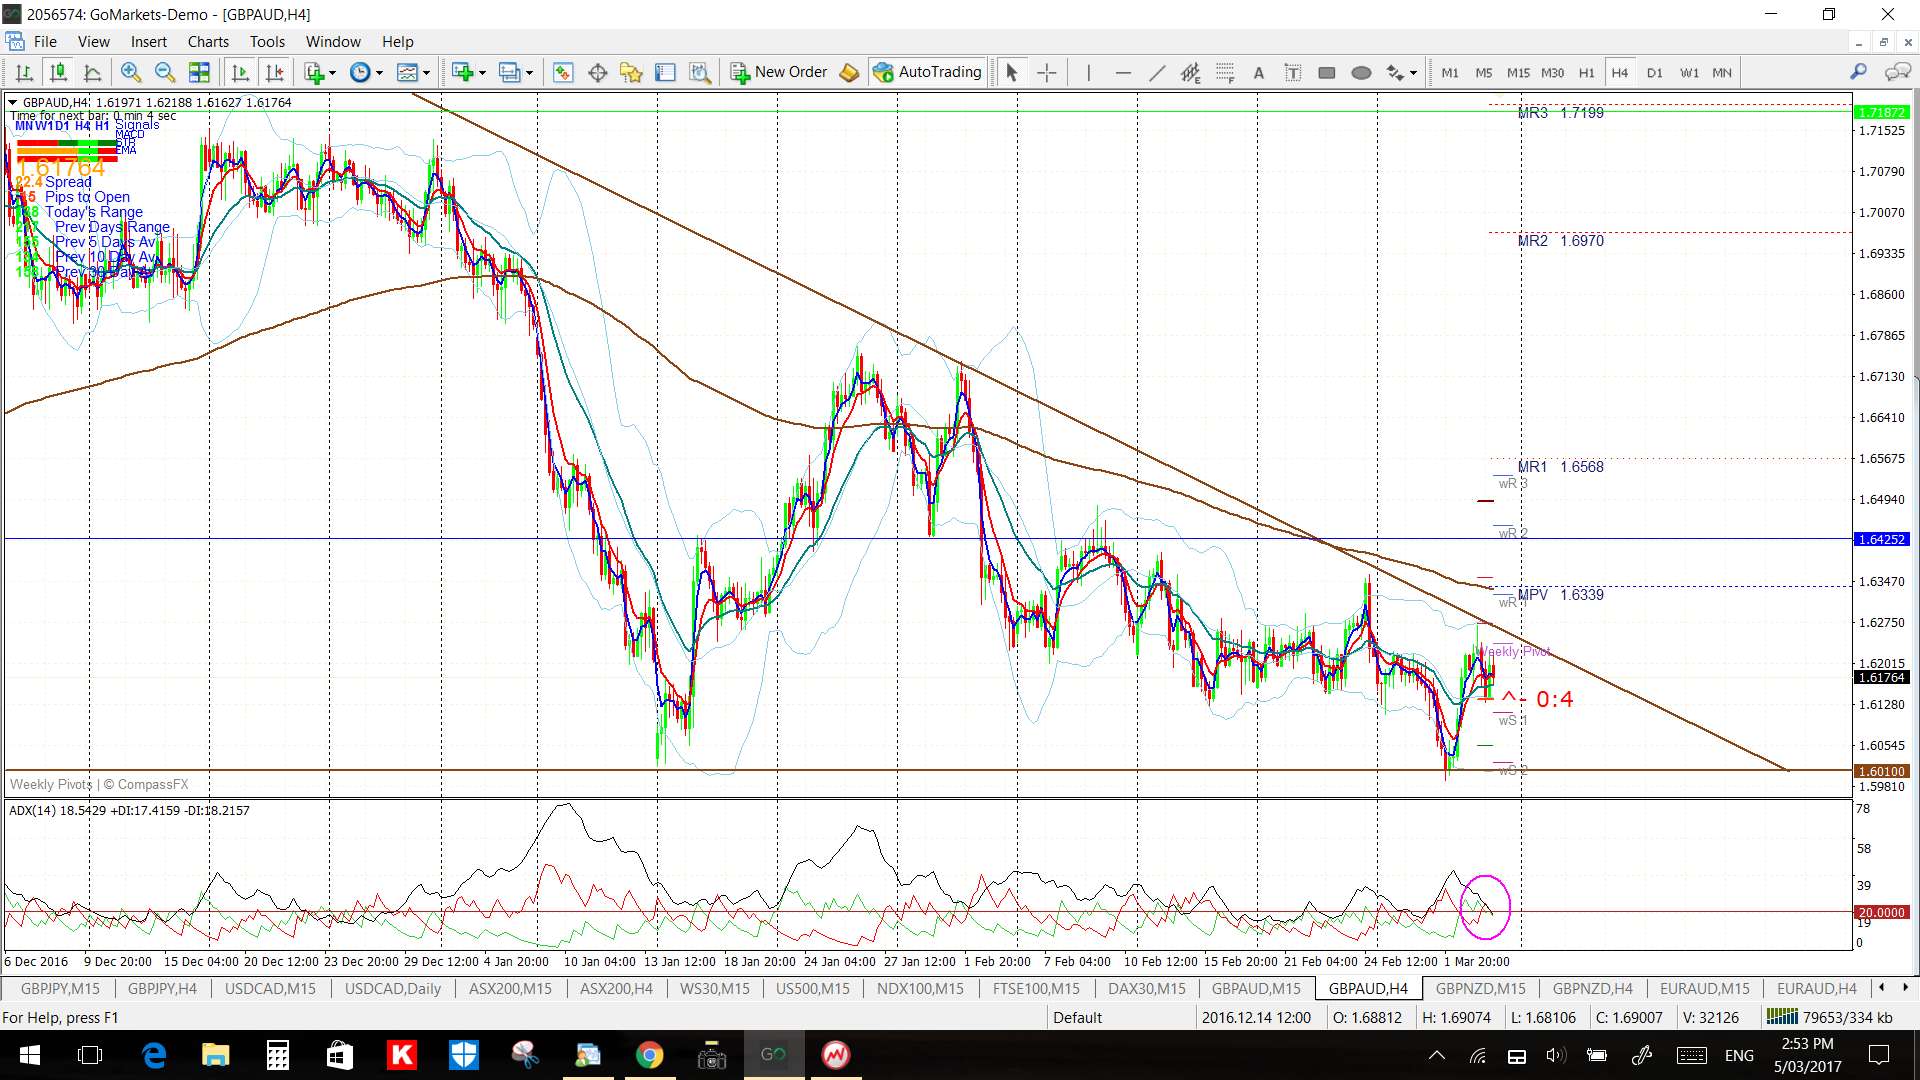
GBP/AUD: A triangle break last week on the 4hr chart for this pair gave up to 120 pips before stalling at previous S/R from the 1.601 level.
This recovery now has price action trading within a new triangle that can be seen on the weekly, daily and 4hr charts. Note how price is becoming increasingly squeezed towards the apex of this pattern so watch for any potential momentum-based breakout.
Price is below the 4hr and daily Cloud.
The weekly candle was a bearish coloured ‘Spinning Top’ reflecting indecision.
Watch for impact from both GBP and AUD data.
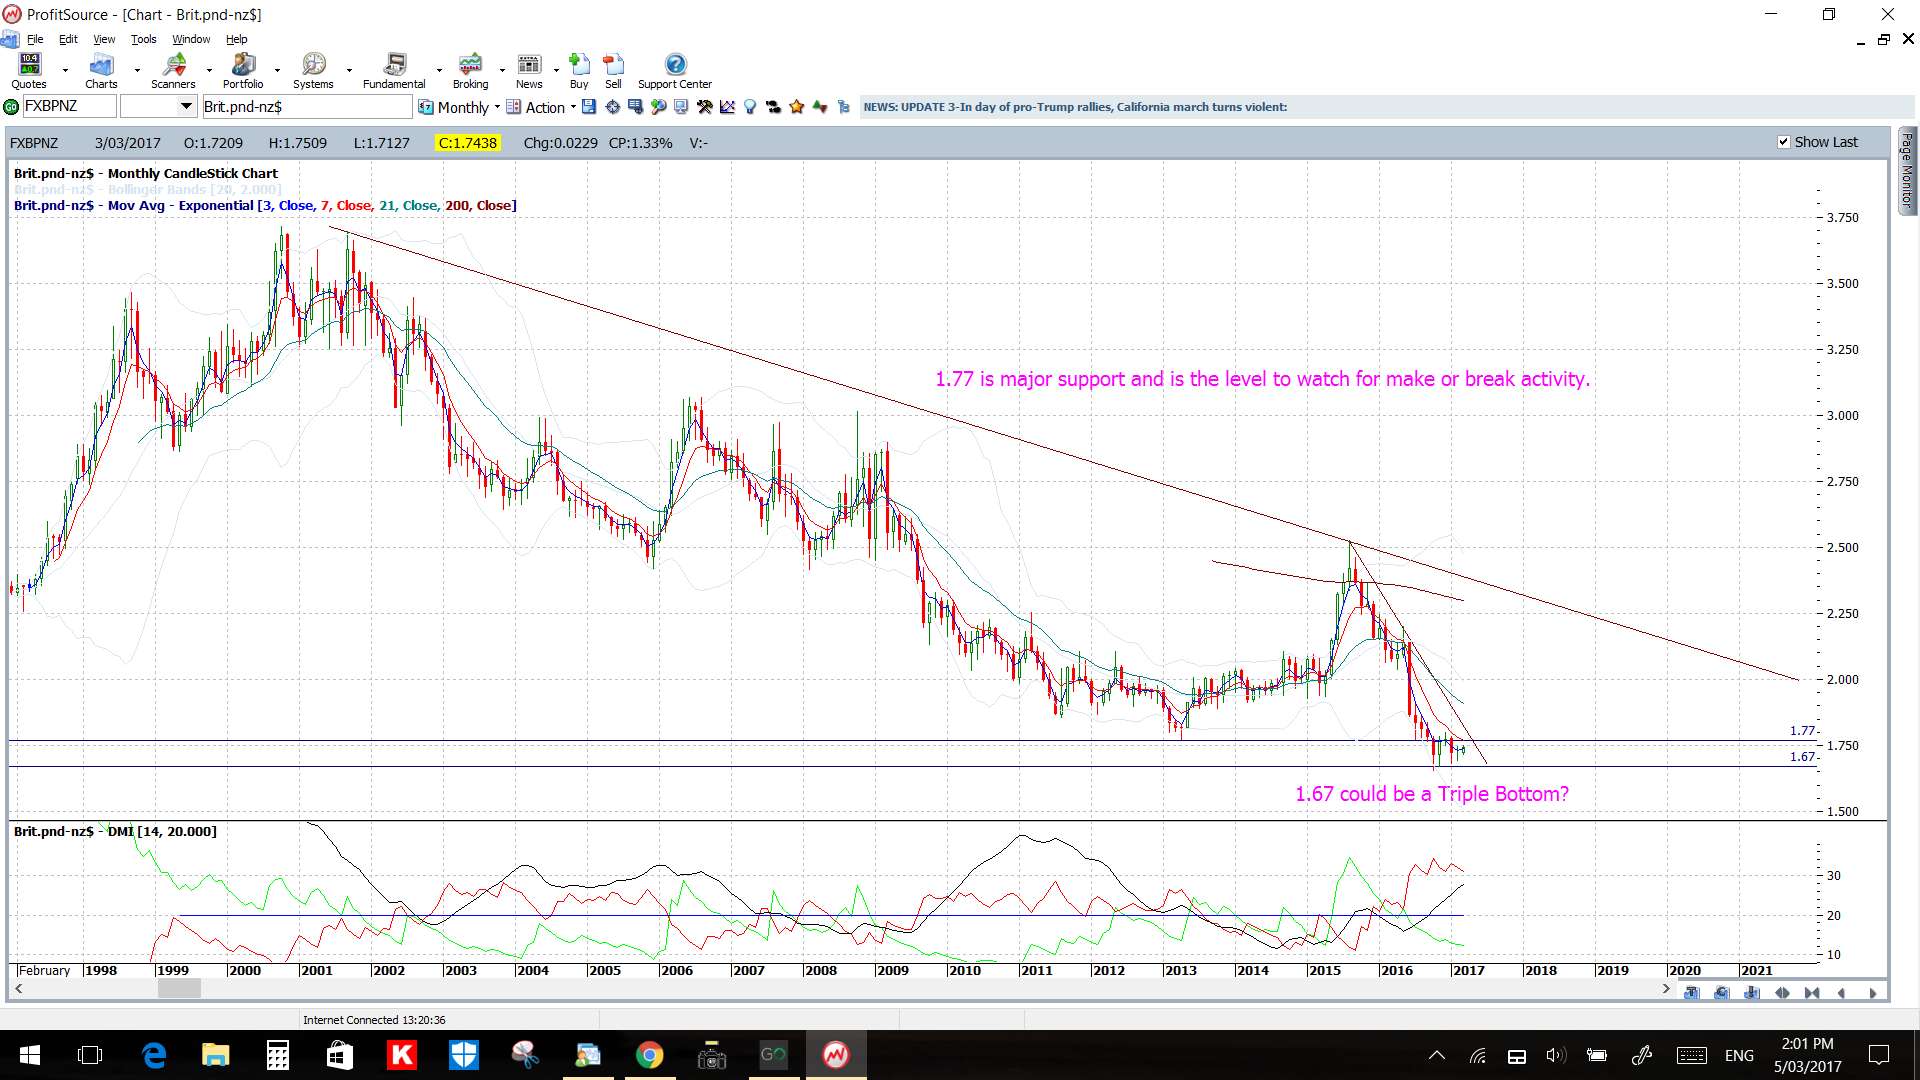
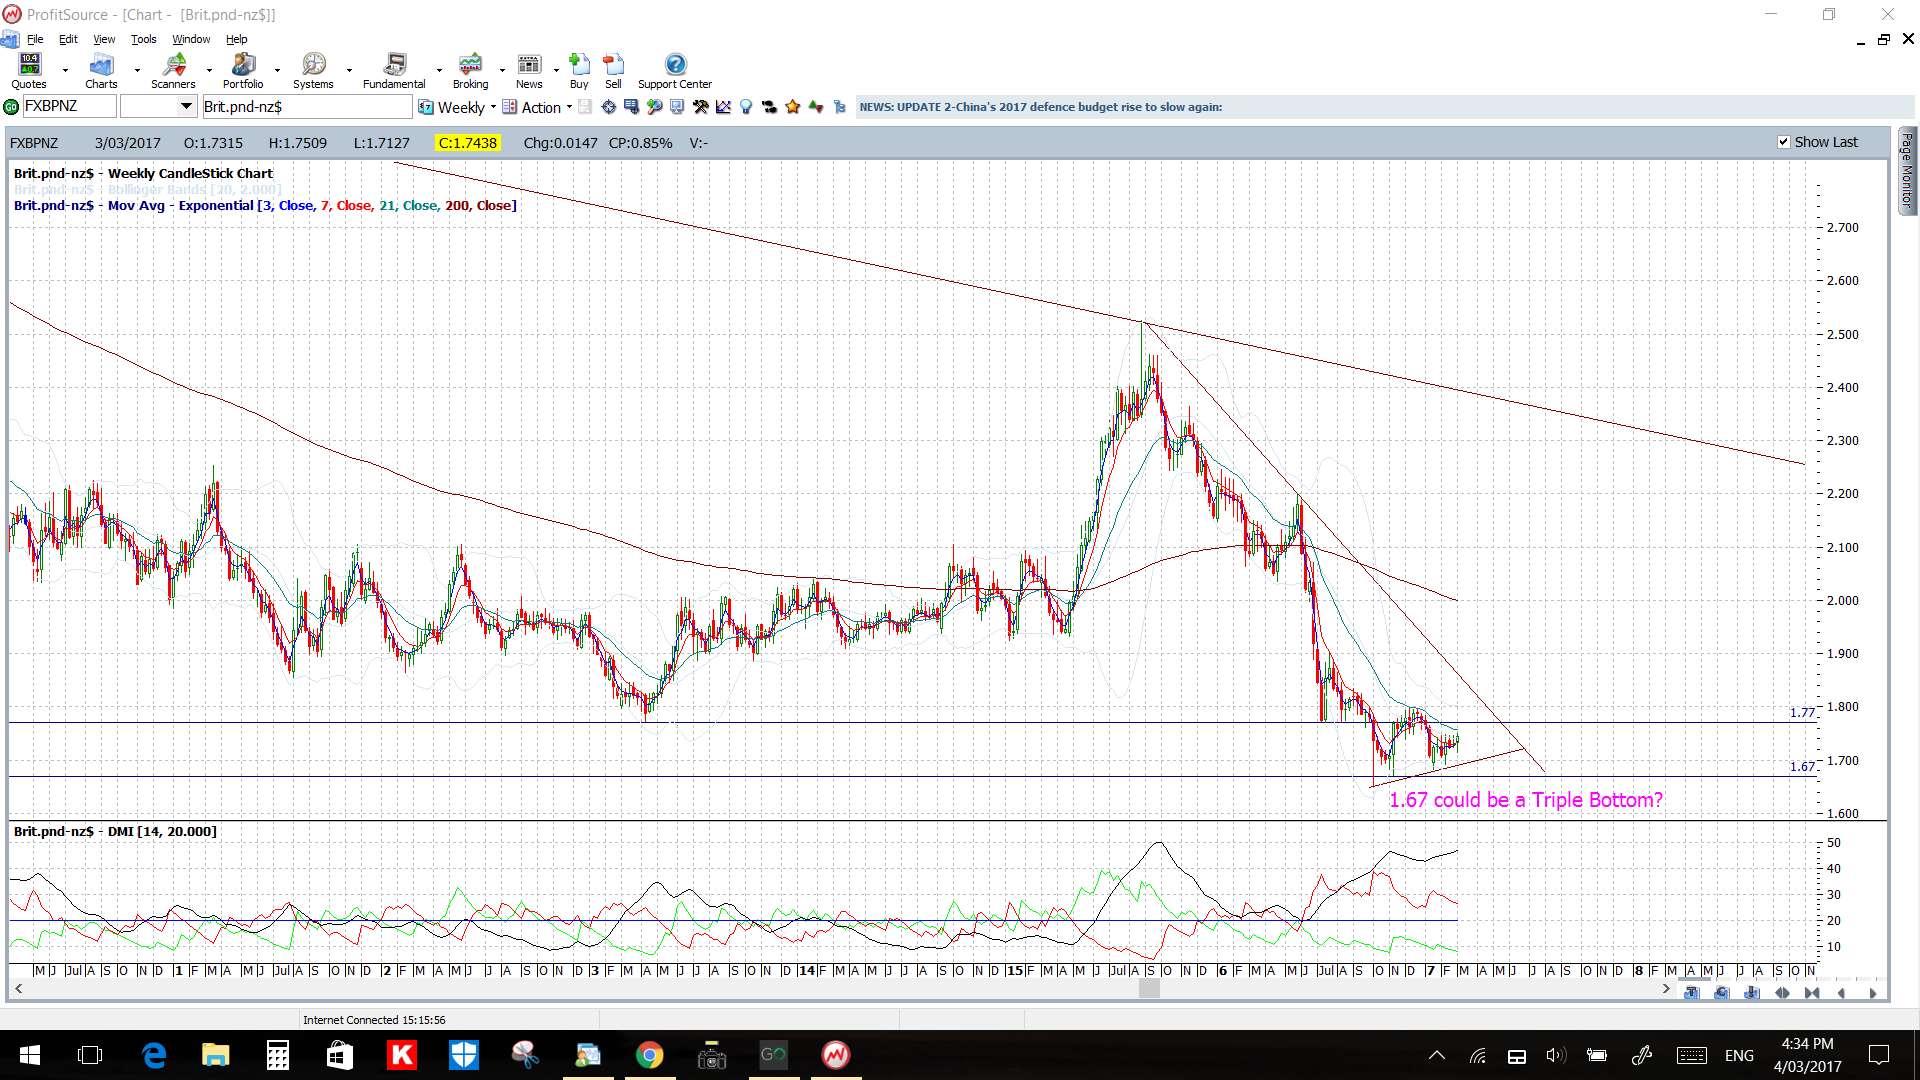
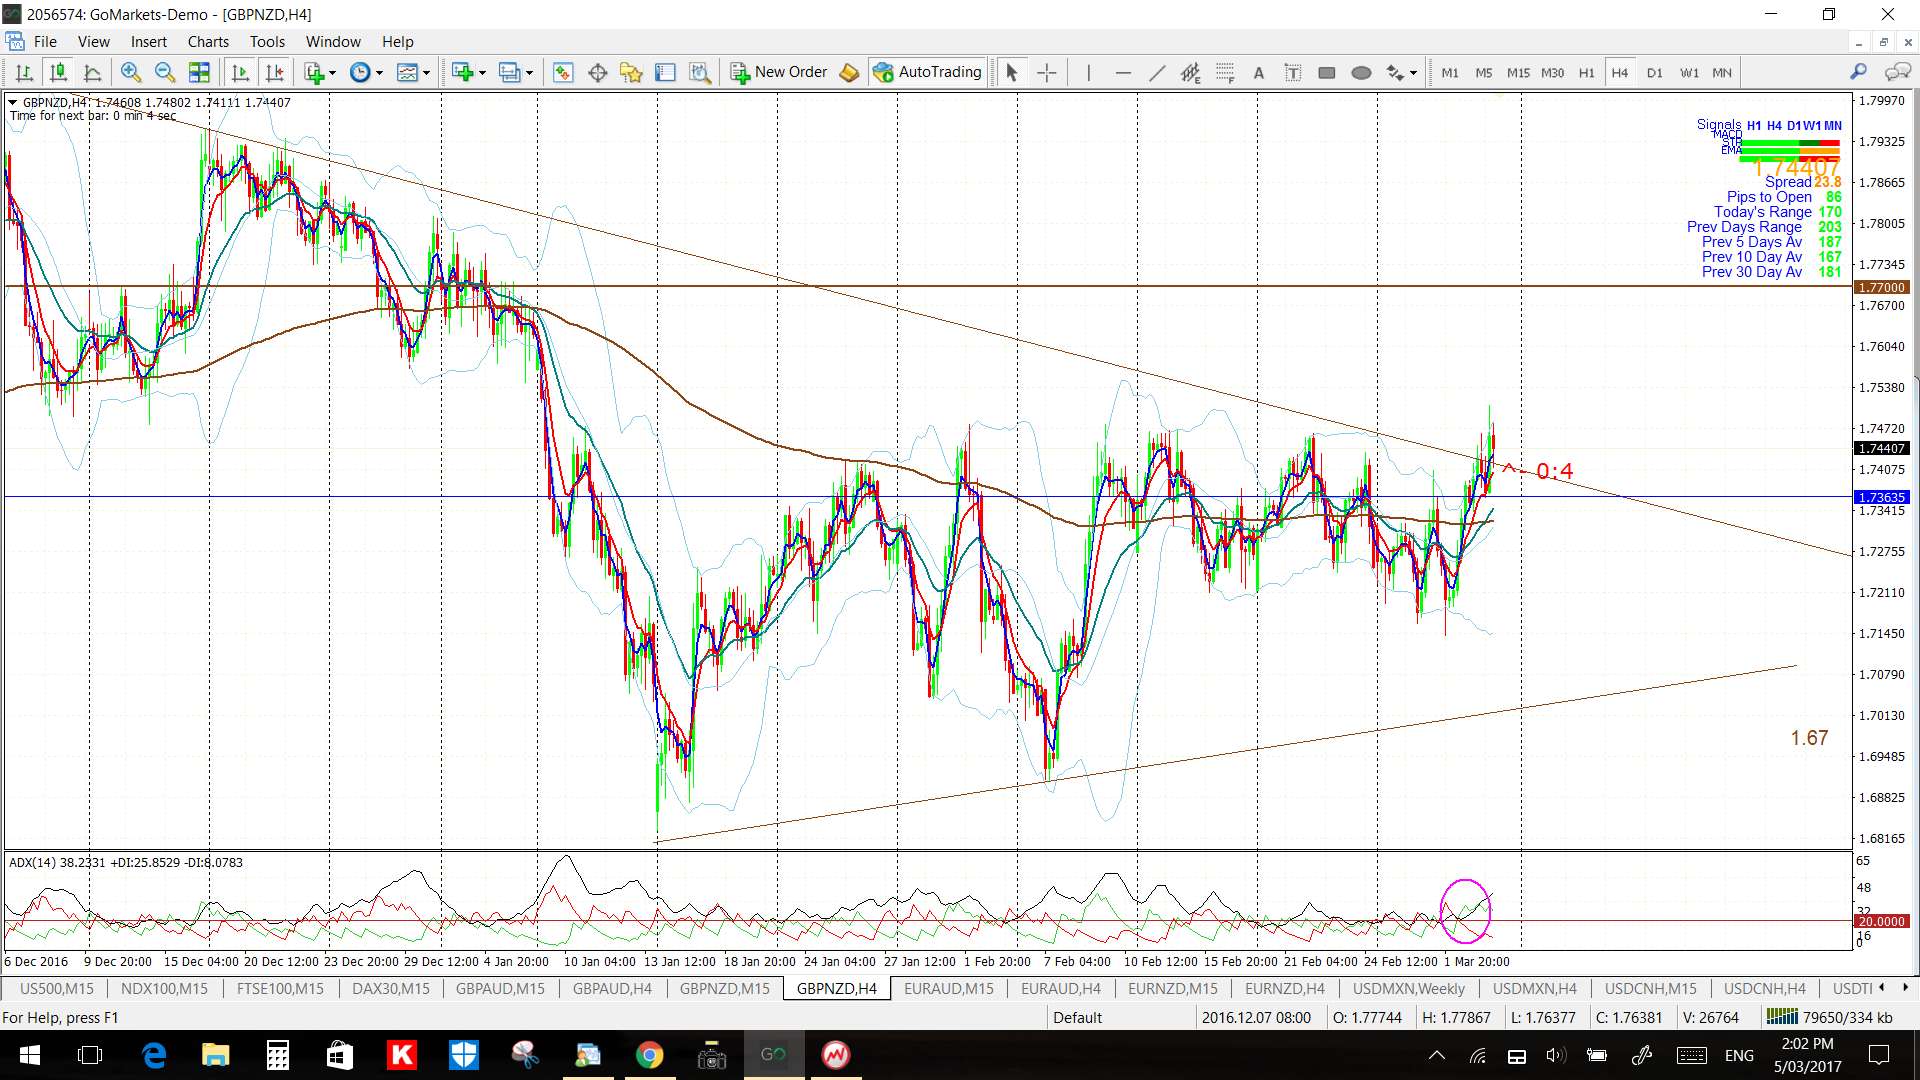
GBP/NZD: The 4hr chart of this pair shows price action attempting a bullish triangle breakout and so I will watch for any continuation move here.
Panning out to the monthly and weekly charts reminds me that 1.77 was previous significant S/R and so I’ll be watching to see if any continued bullish momentum targets this region. If so, the ‘Triple Bottom’ I’ve been monitoring over recent weeks may really start to take shape.
Price is above the 4hr and daily (just) Cloud.
The weekly candle was bullish.
Watch for impact from GBP and NZD related data.

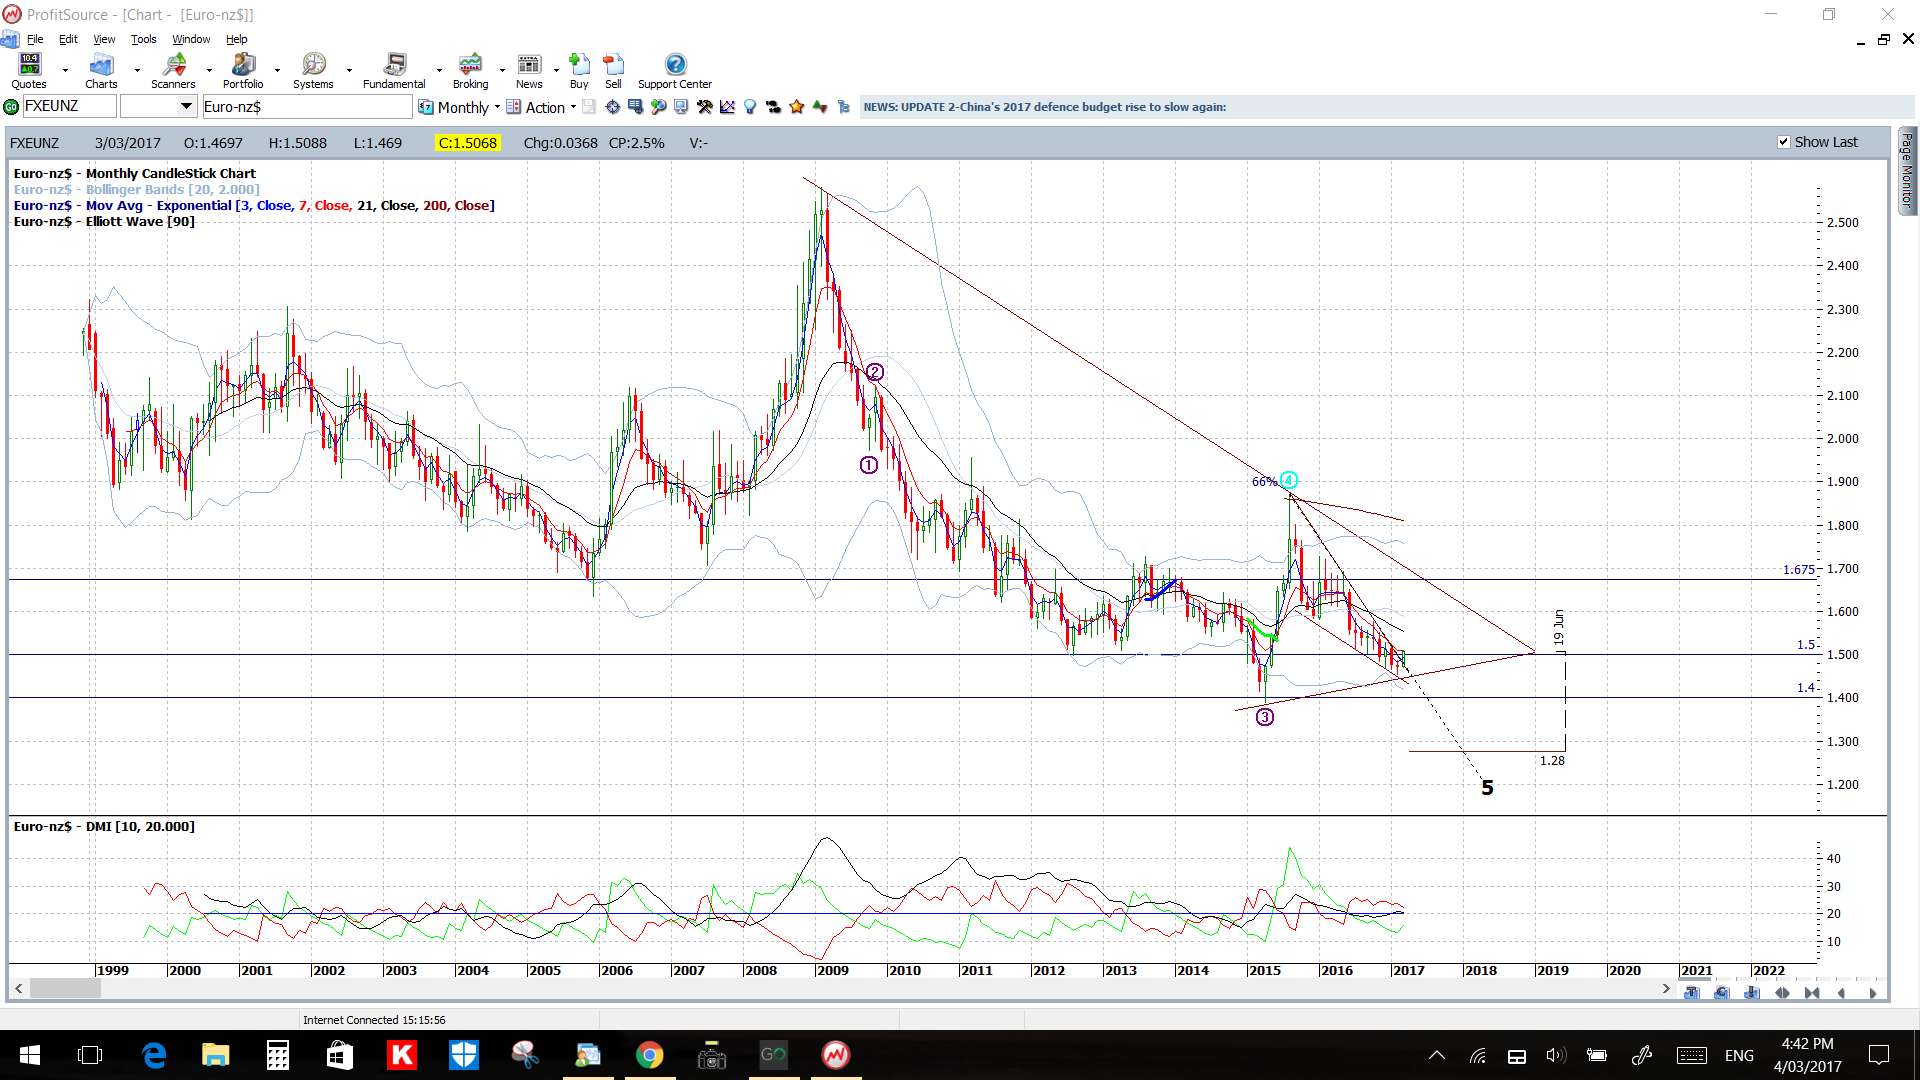
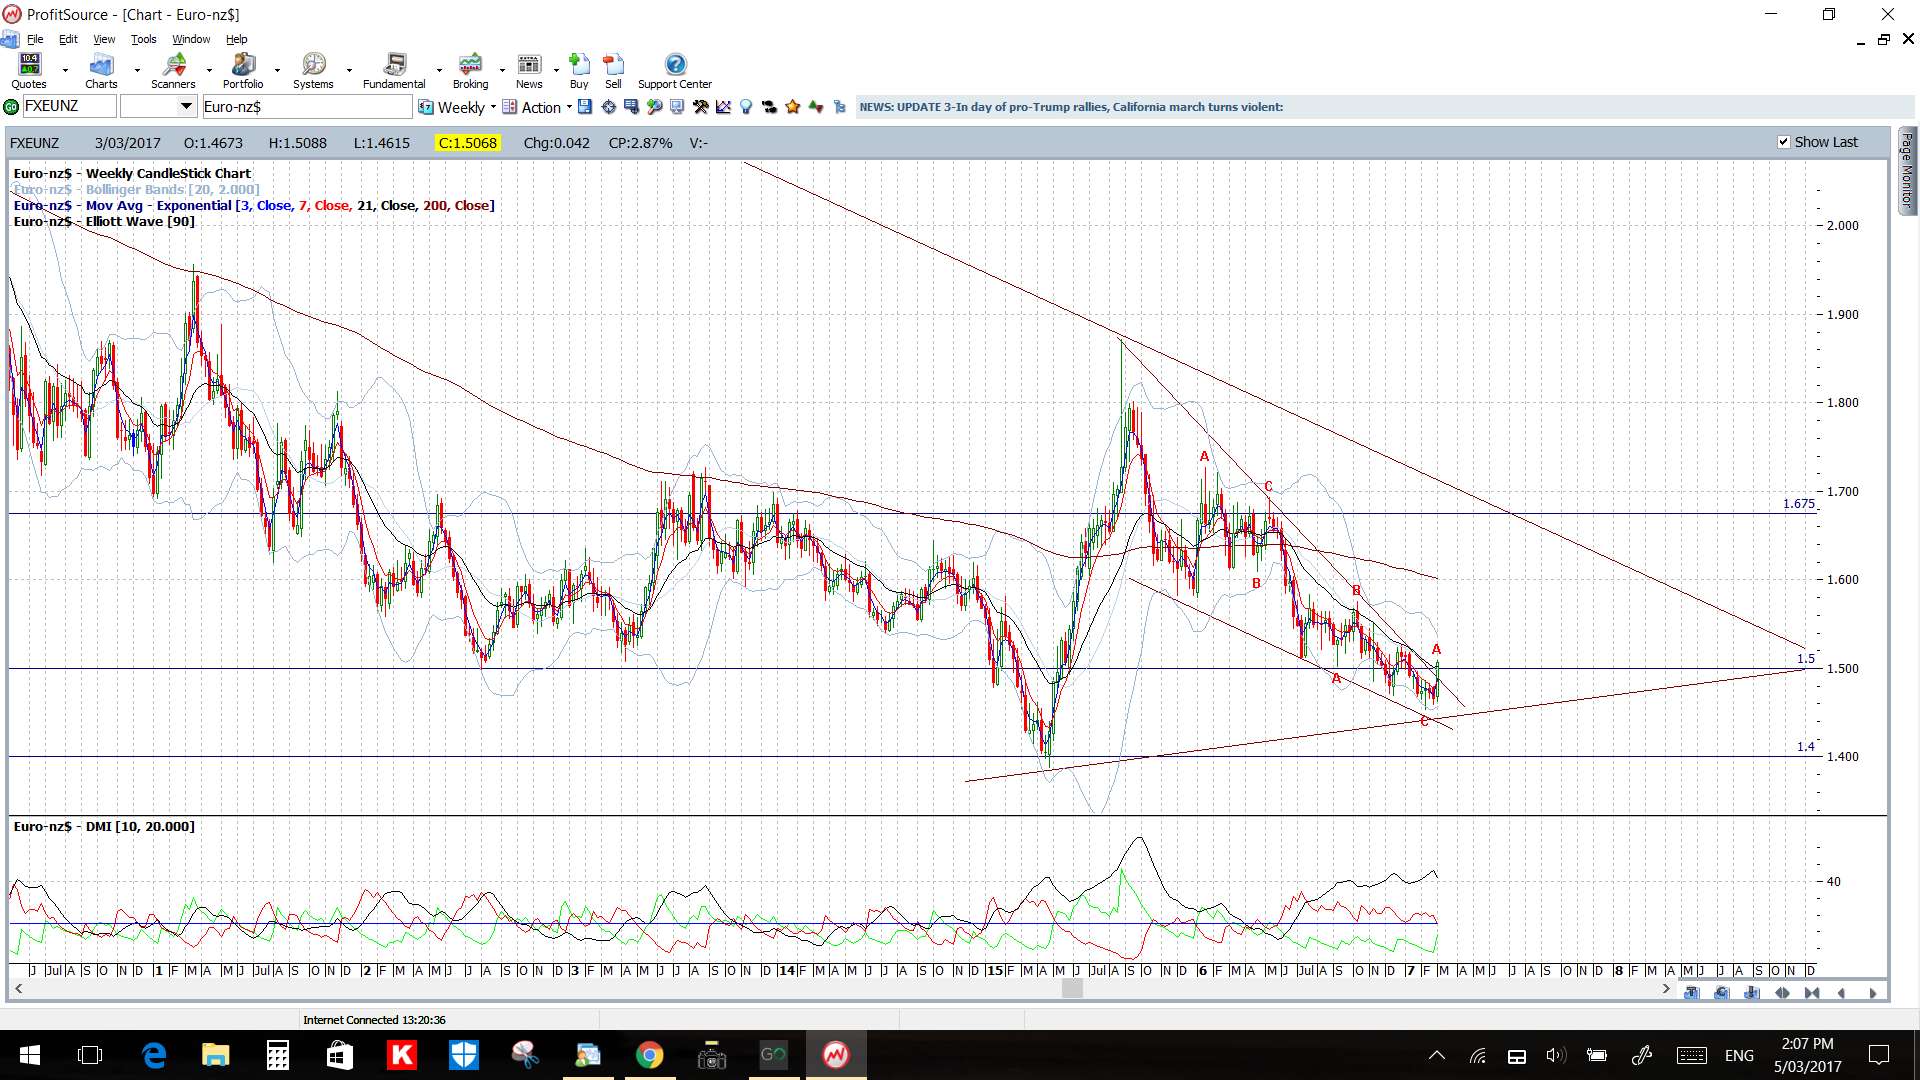
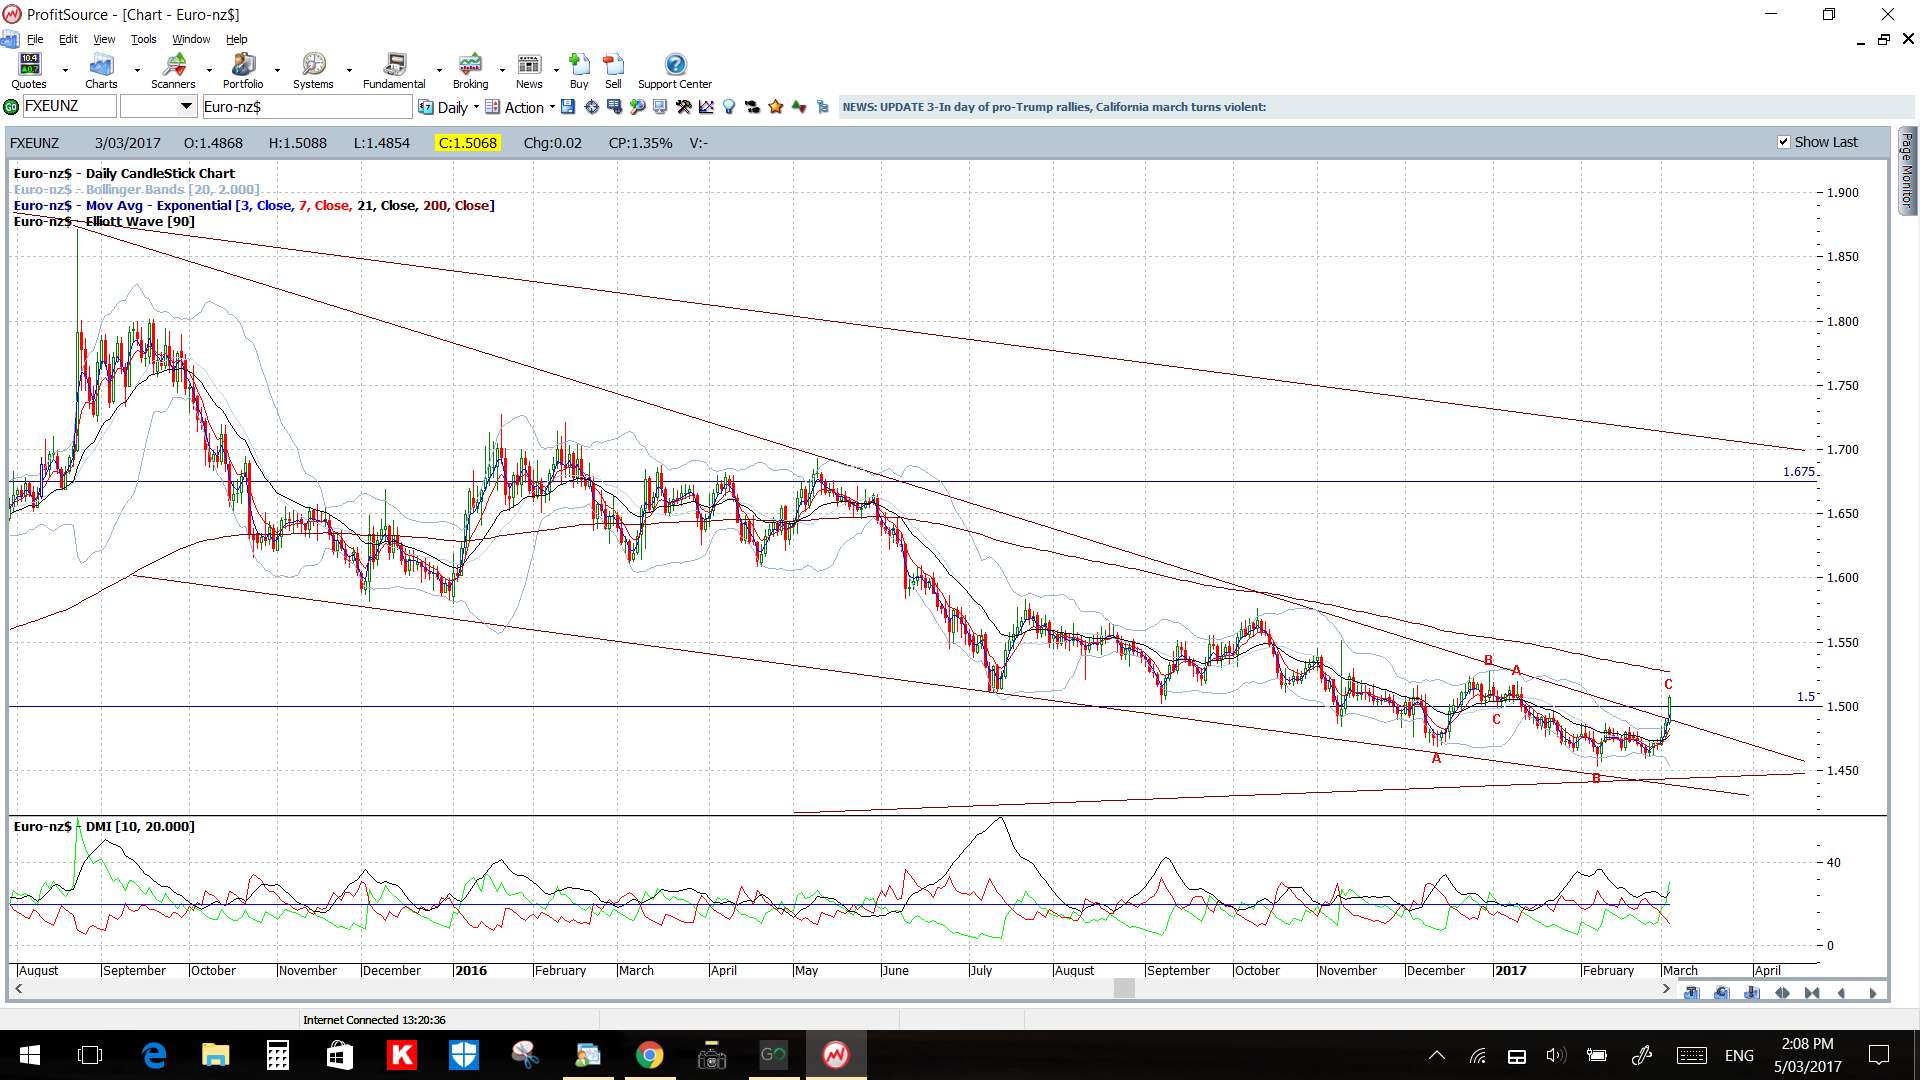
EUR/NZD: A triangle break last week on the 4hr chart for this pair gave up to 320 pips. The previous HIGH is up near the daily 200 EMA and so I will be watching to see if price action targets this region.
The monthly, weekly and daily chart time frames show that this 4hr chart triangle breakout ties in with a larger descending wedge breakout and so I am open-minded about bullish continuation here.
Price is above the 4hr and daily Cloud.
The weekly candle was bullish.
Watch for impact from EUR and NZD related data.
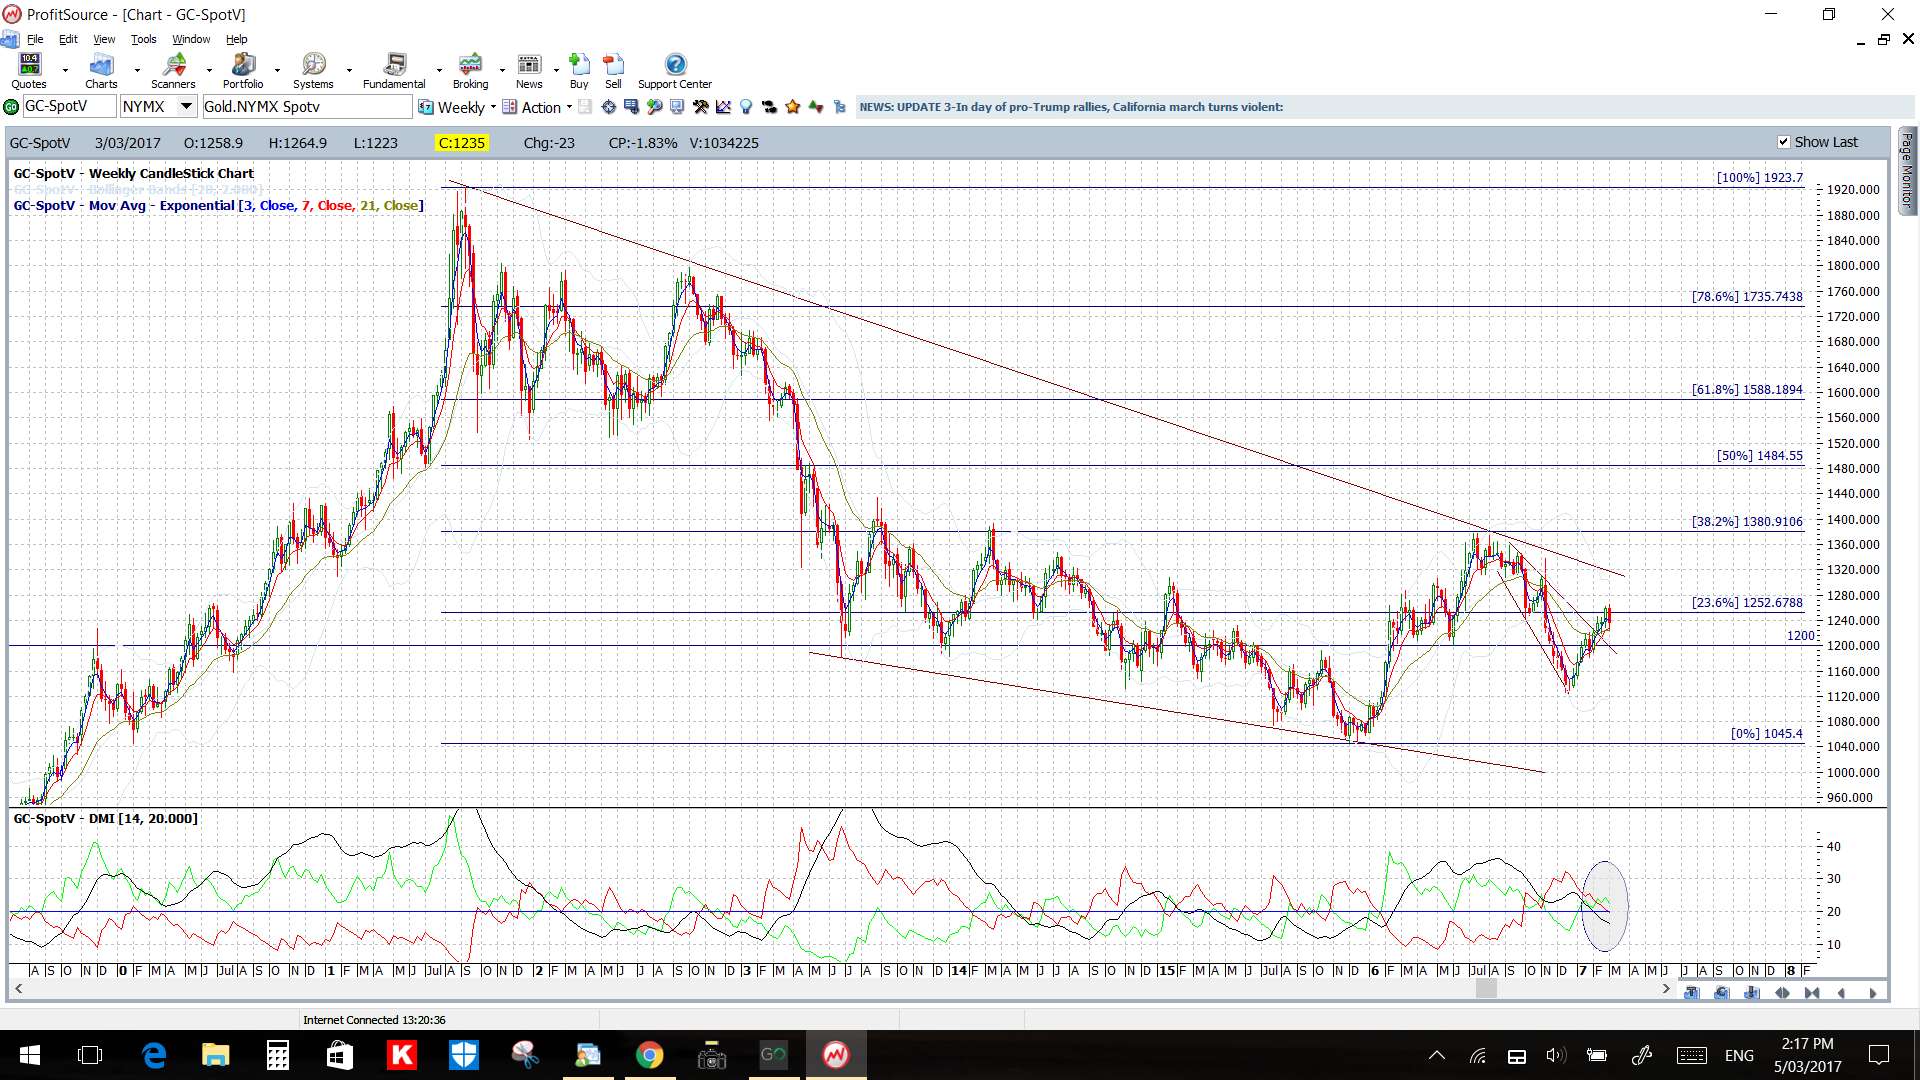
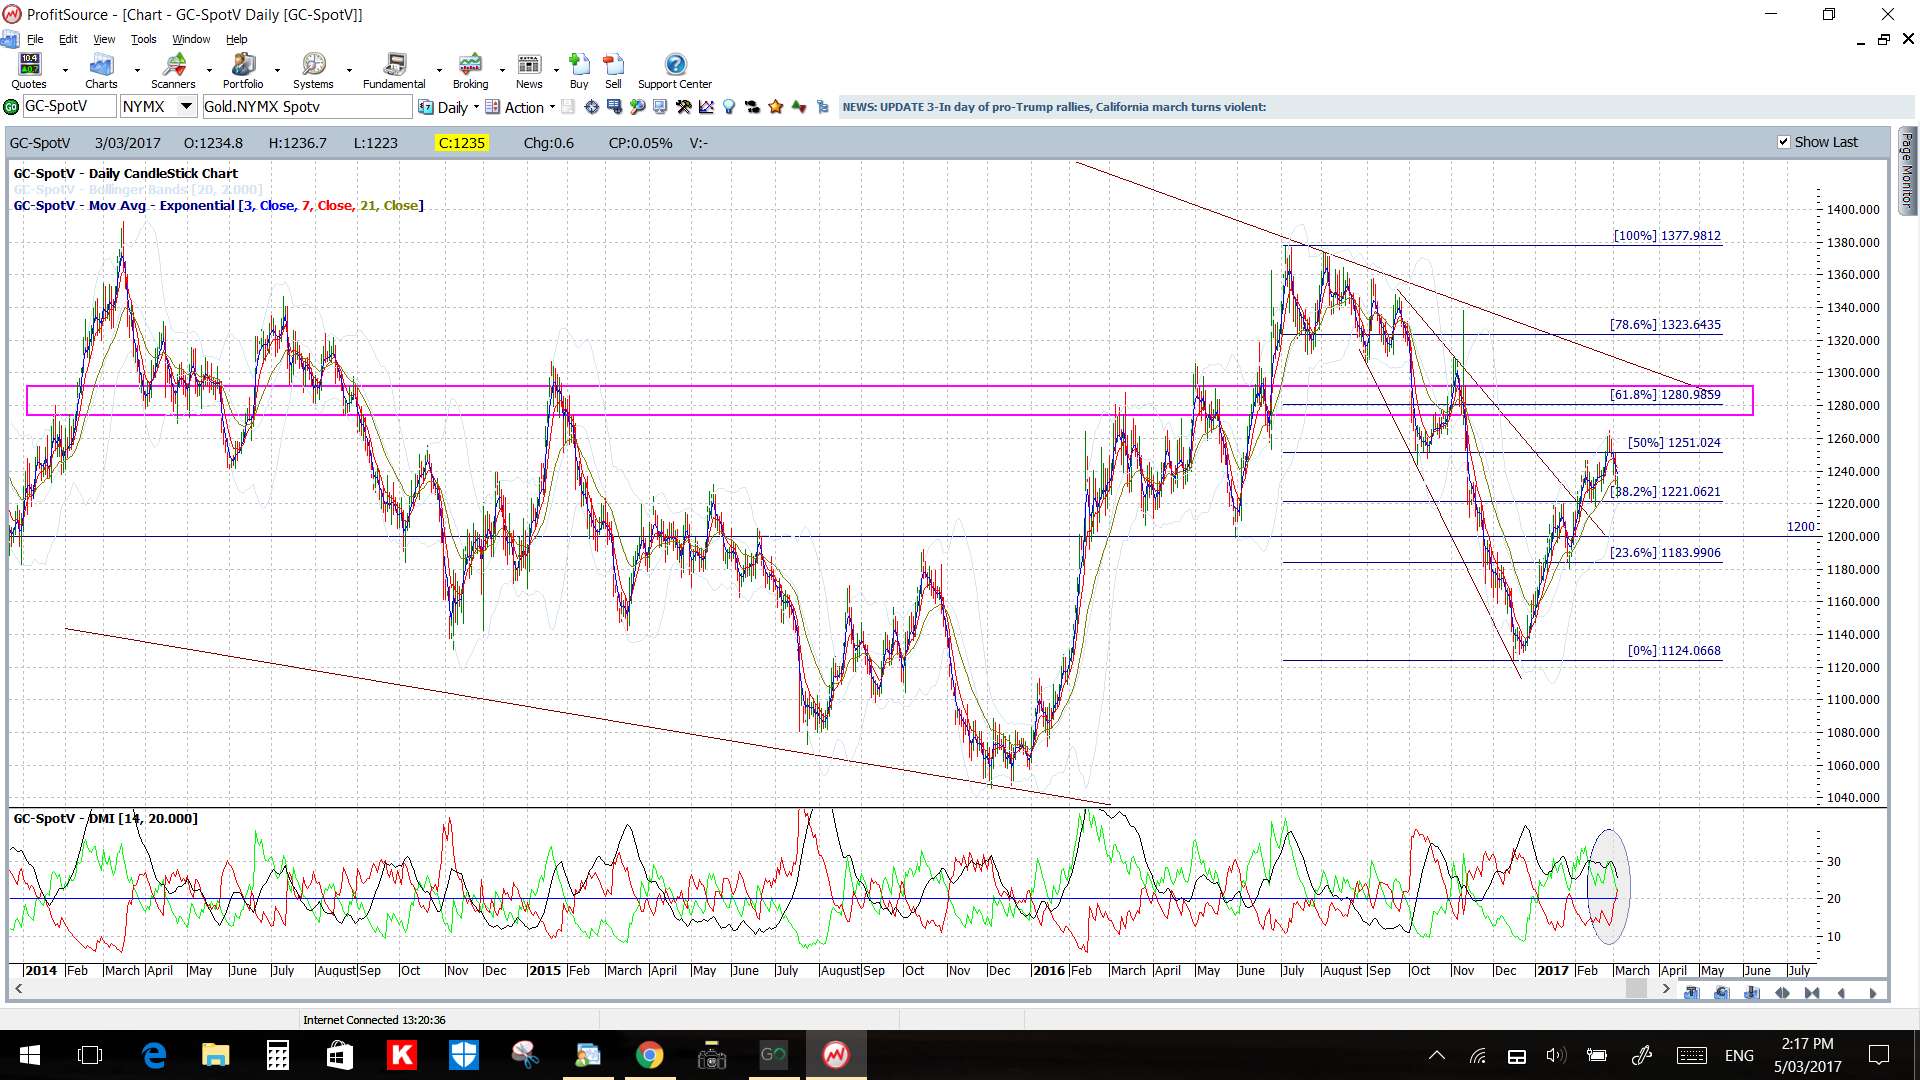
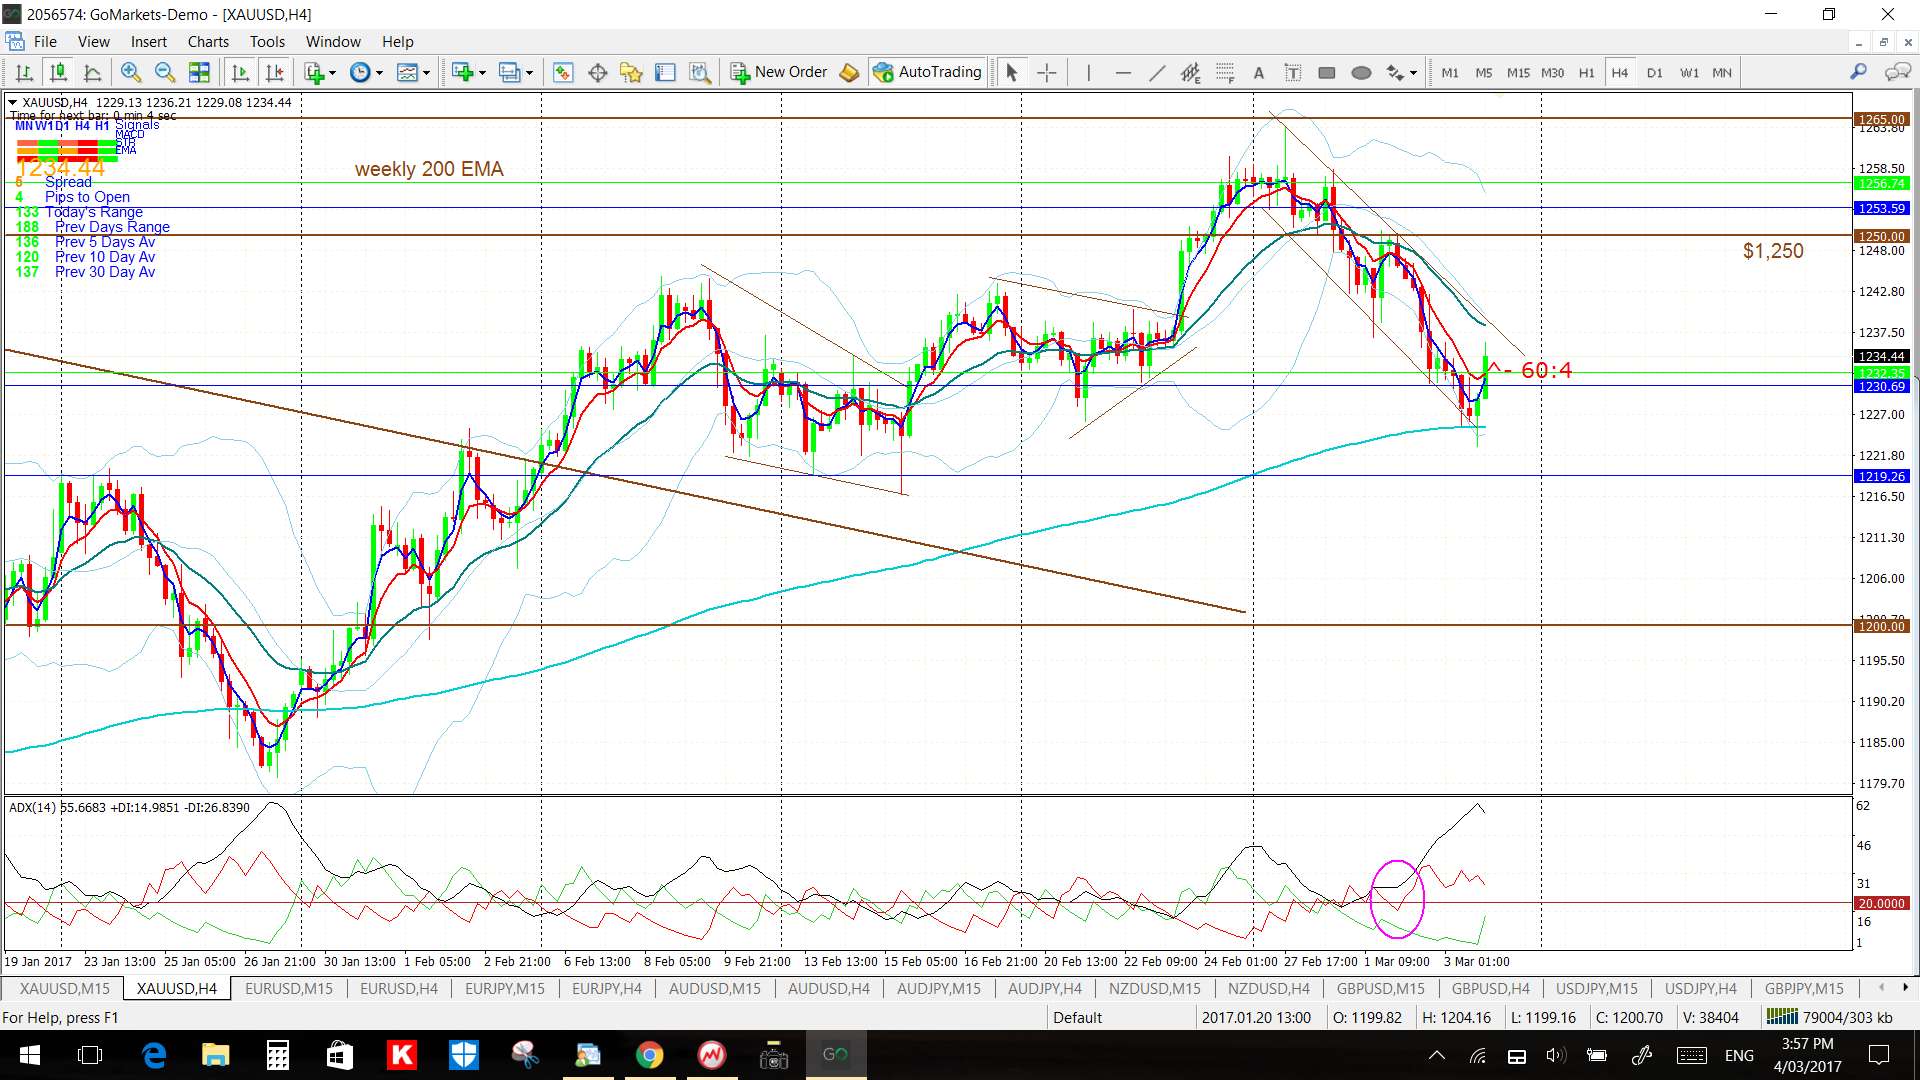
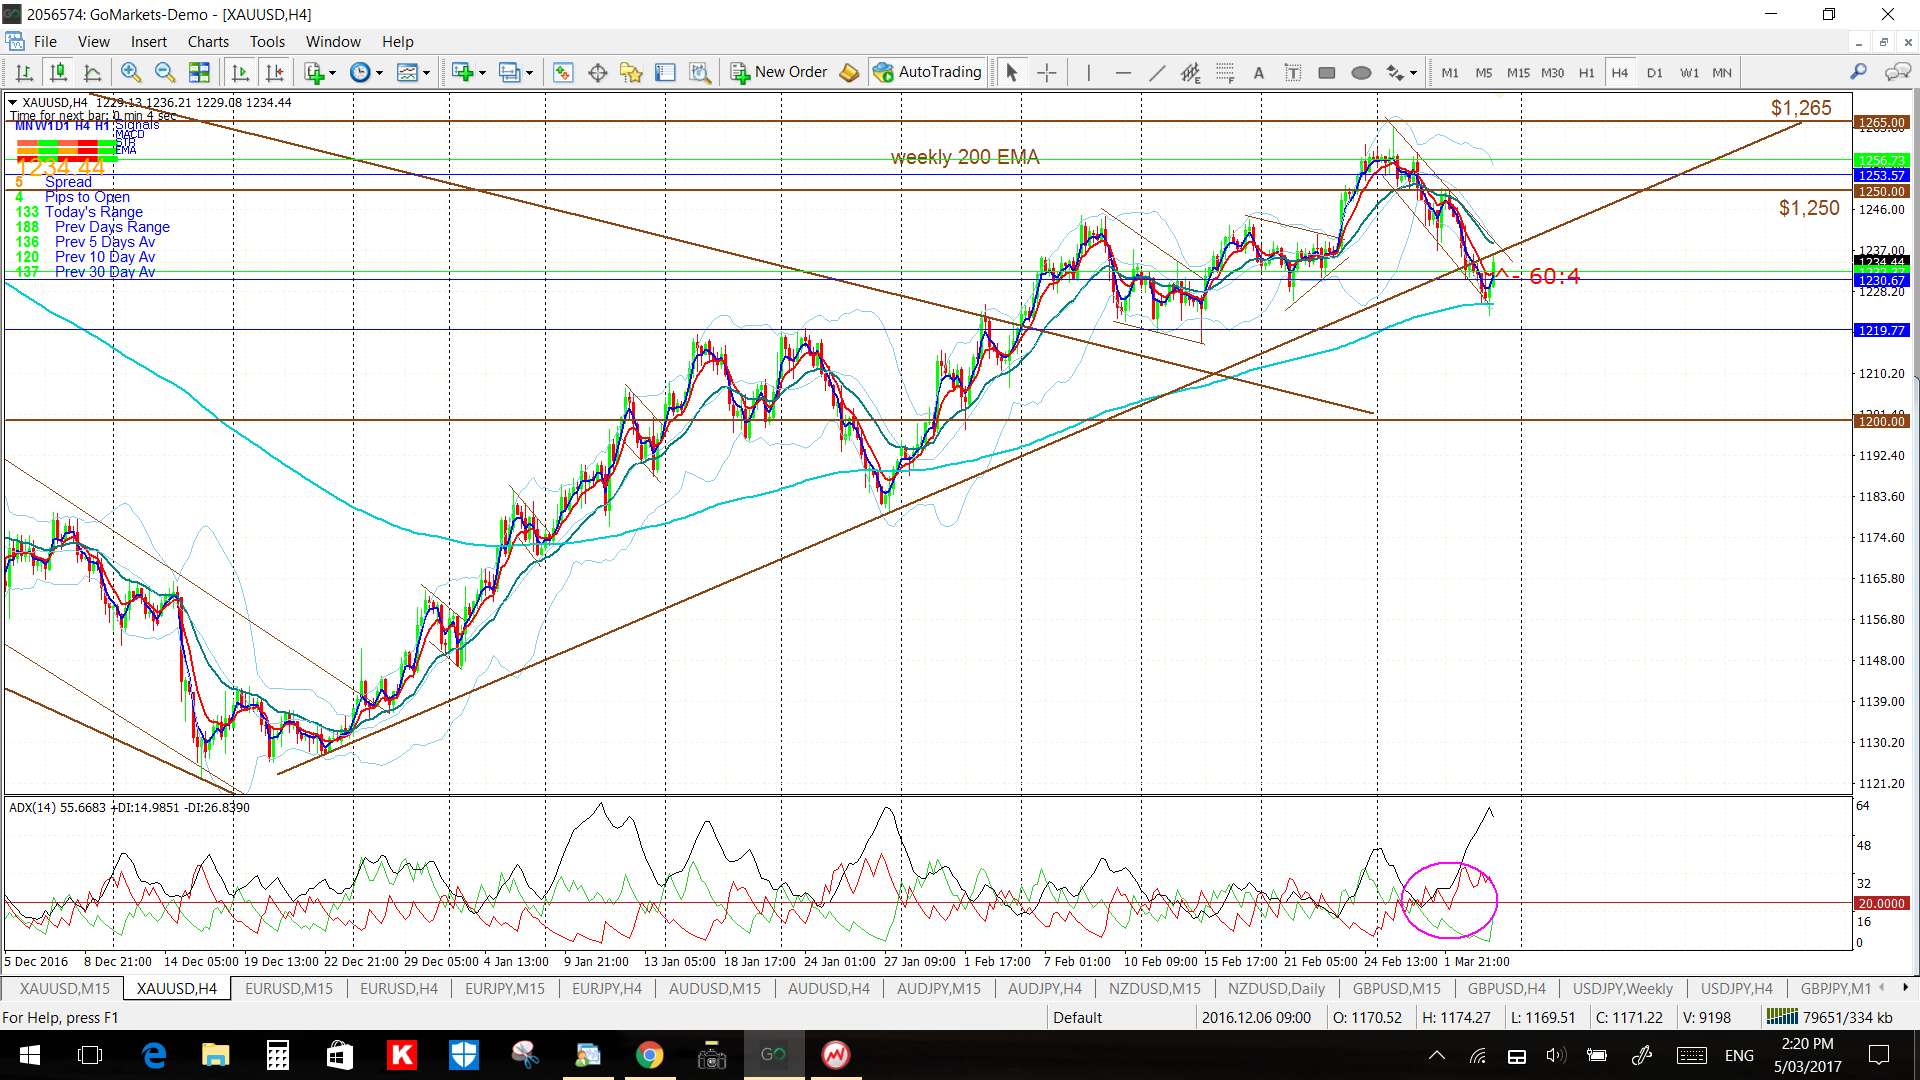
Gold: The 4hr chart for Gold shows that a support trend line, in play since December 2016, was broken last week and price has now pulled back to test this broken support. Whilst this might seem like a classic bearish breakdown move the 4hr chart also shows price trading within a Flag and so I would prefer to see the Flag trend lines broken to add substance to any bearish move.
Price is below the 4hr Cloud but above the daily Cloud.
The weekly candle was bearish and, essentially, engulfing.

Others:
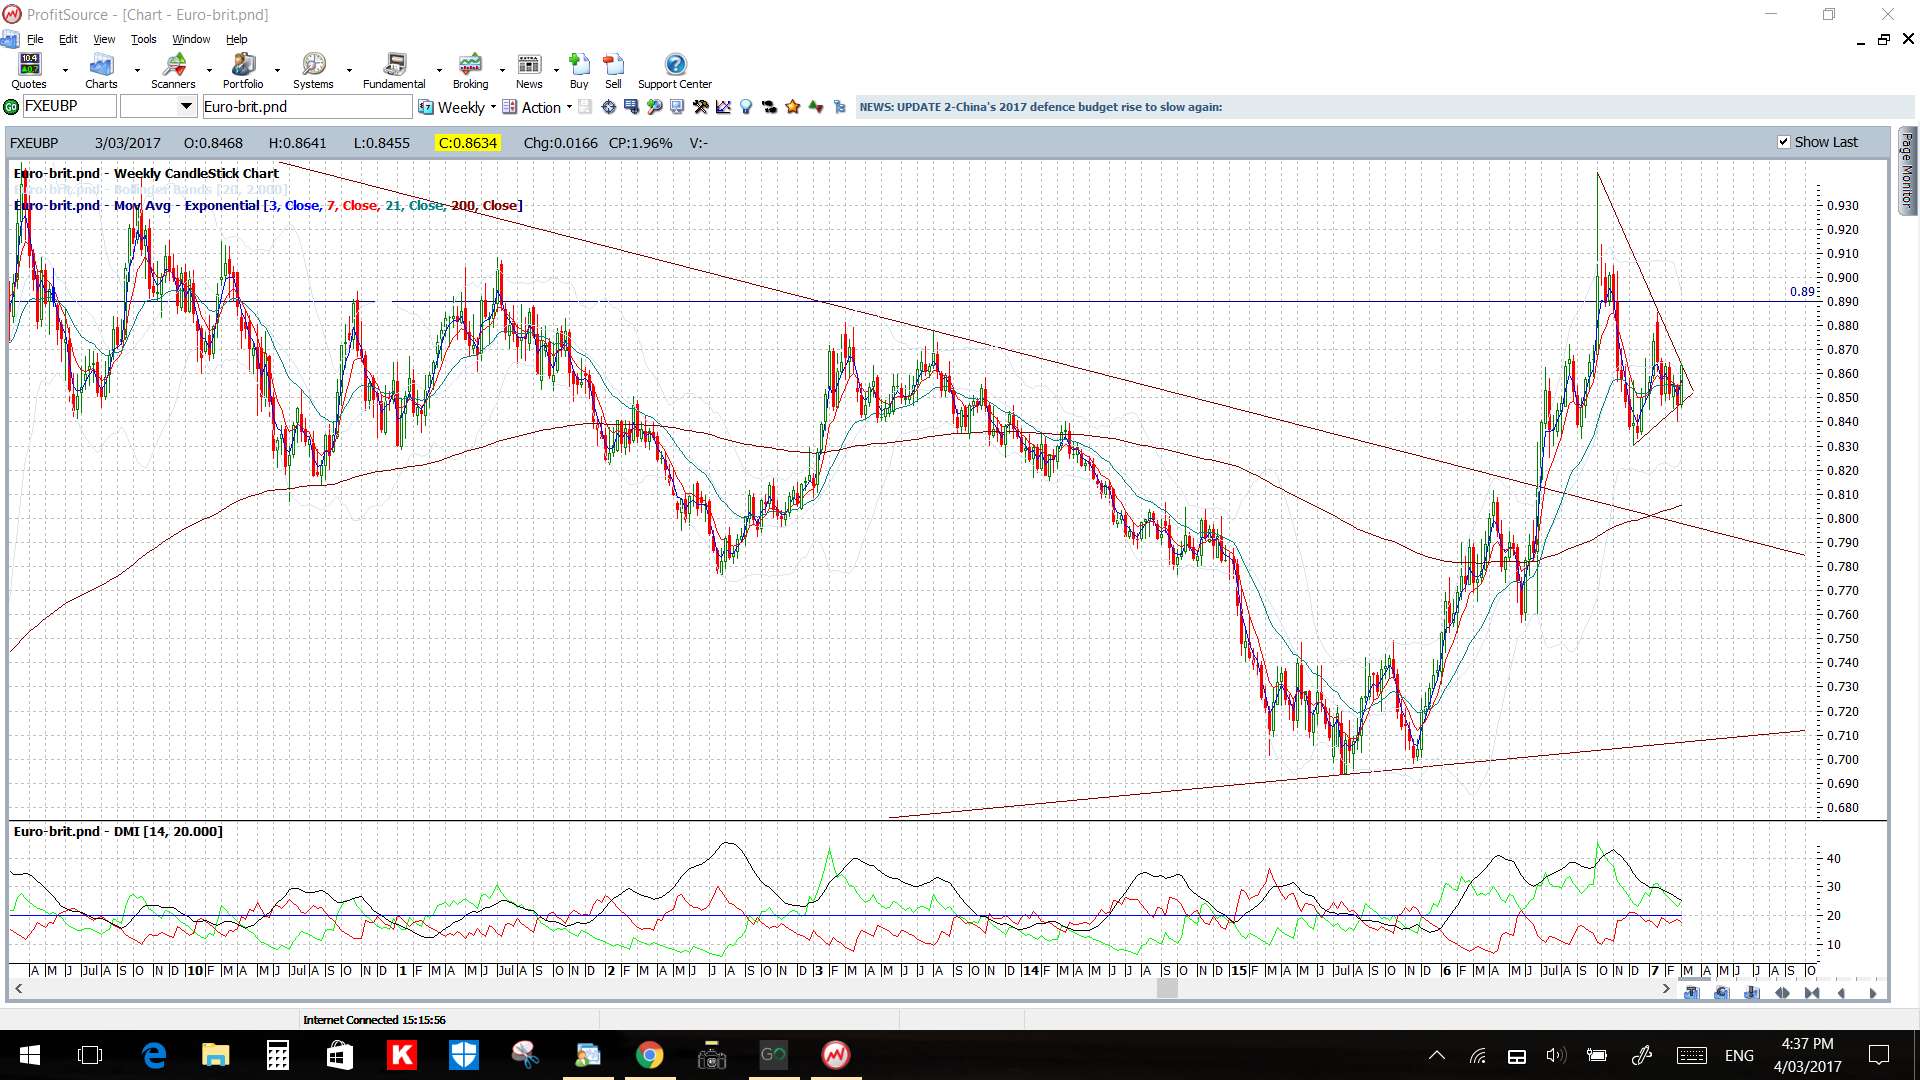
EUR/GBP weekly: watch for any momentum-based trend line breakout:
EUR/AUD 4hr: A triangle break last week on the 4hr chart for this pair gave up to 100 pips so watch for any continuation.
USD/CNH 4hr: A triangle break last week on the 4hr chart for this pair gave up to 450 pips so watch for any continuation.
Oil daily: watch for any momentum-based trend line breakout:
The post TL breakouts: the gift that just keeps giving! appeared first on Trade Charting.
The post TL breakouts: the gift that just keeps giving! appeared first on www.forextell.com.