Last week: There were no TC signals last week; not because there wasn’t movement BUT because the moves that occurred were too big and that meant that any TC signals that formed were not valid.
There has been TC success though with these recent technical pattern moves:
- E/U H&S completing its 500 pip move.
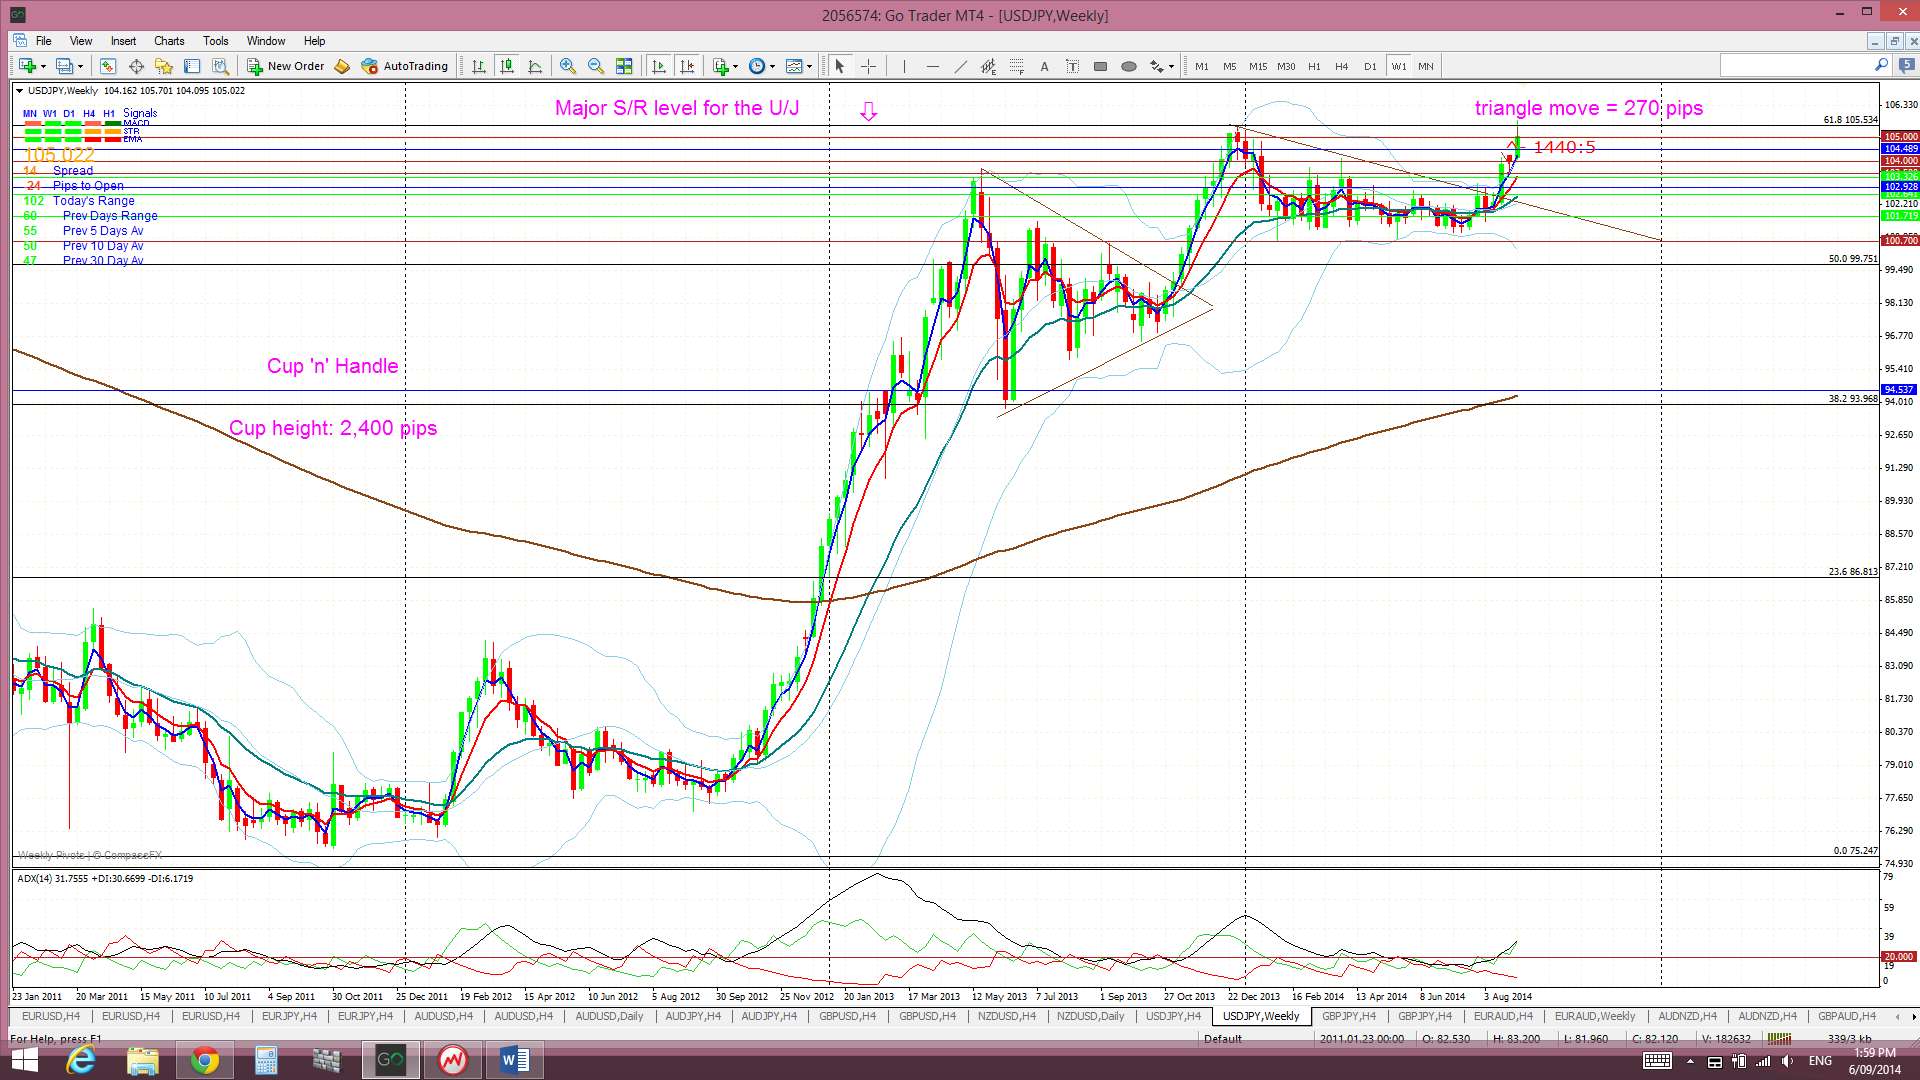
- U/J weekly chart triangle breakout giving 270 pips and the
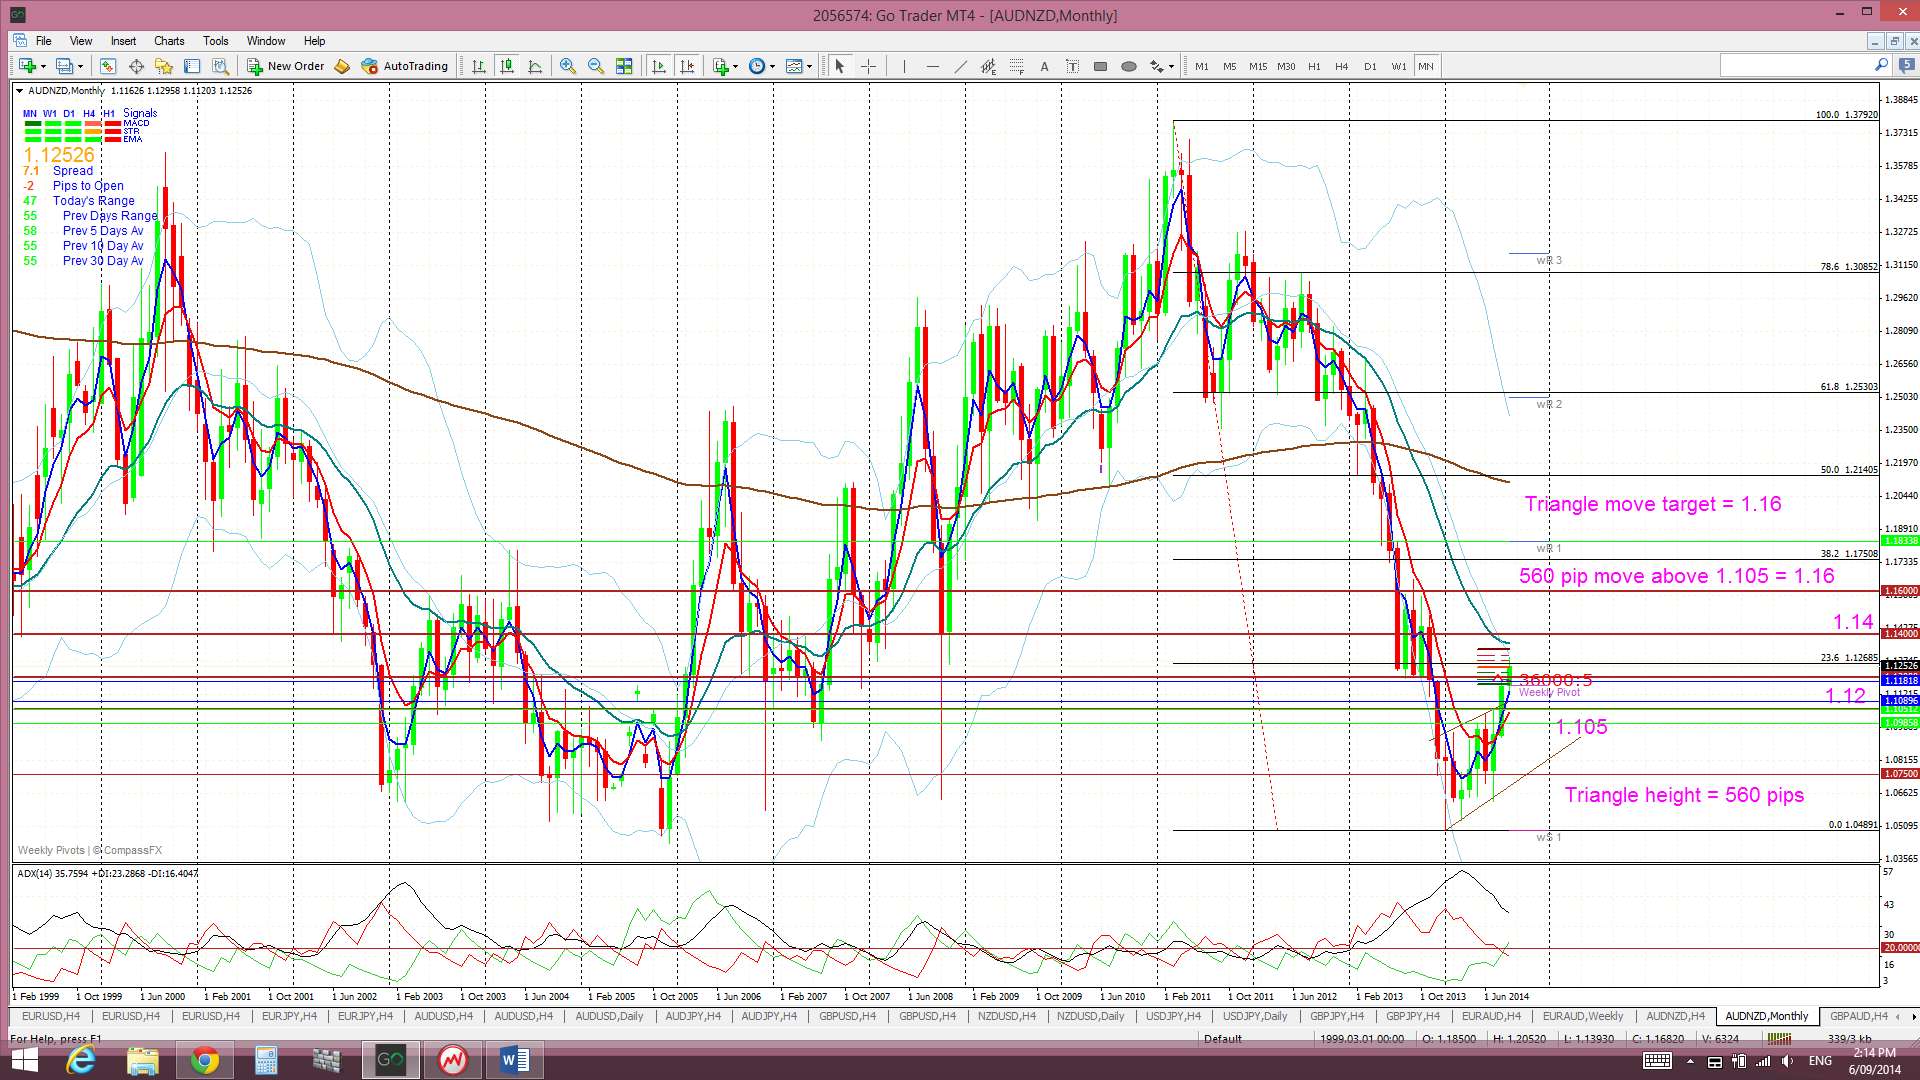
- AUD/NZD ascending triangle breakout giving over 200 pips of a potential 560 pip move.
This week:
The USDX has made a second weekly close above the 61.8% fib level of the 2010-2011 bear move and is still trading above the Ichimoku Cloud on the hourly, 4 hr, daily, weekly and monthly time frame which is bullish. Even more significantly, the index has closed above the monthly 200 EMA and a sustained hold above this level may signal bullish continuation. A review of this index can be found through this link. However, NFP was weaker than expected so there is the possibility of a pause or even a pull back on the index in light of this perceived weakness. This will possibly have implications for the U/J as well.
It is a relatively light week for scheduled ‘high impact’ data but worth noting is Thursday’s NZD Interest Rate announcement and three items of Chinese data released on Monday, Thursday and Saturday.
Some FX instruments are sitting near key levels that are worth monitoring:
- GBP/AUD: the 1.74 level.
- EUR/JPY: the 136 level.
- U/J: the 105.5 level.
- E/U: the 1.30 level.
- EUR/AUD: the 1.381 level.
- AUD/NZD: the 1.12 level.
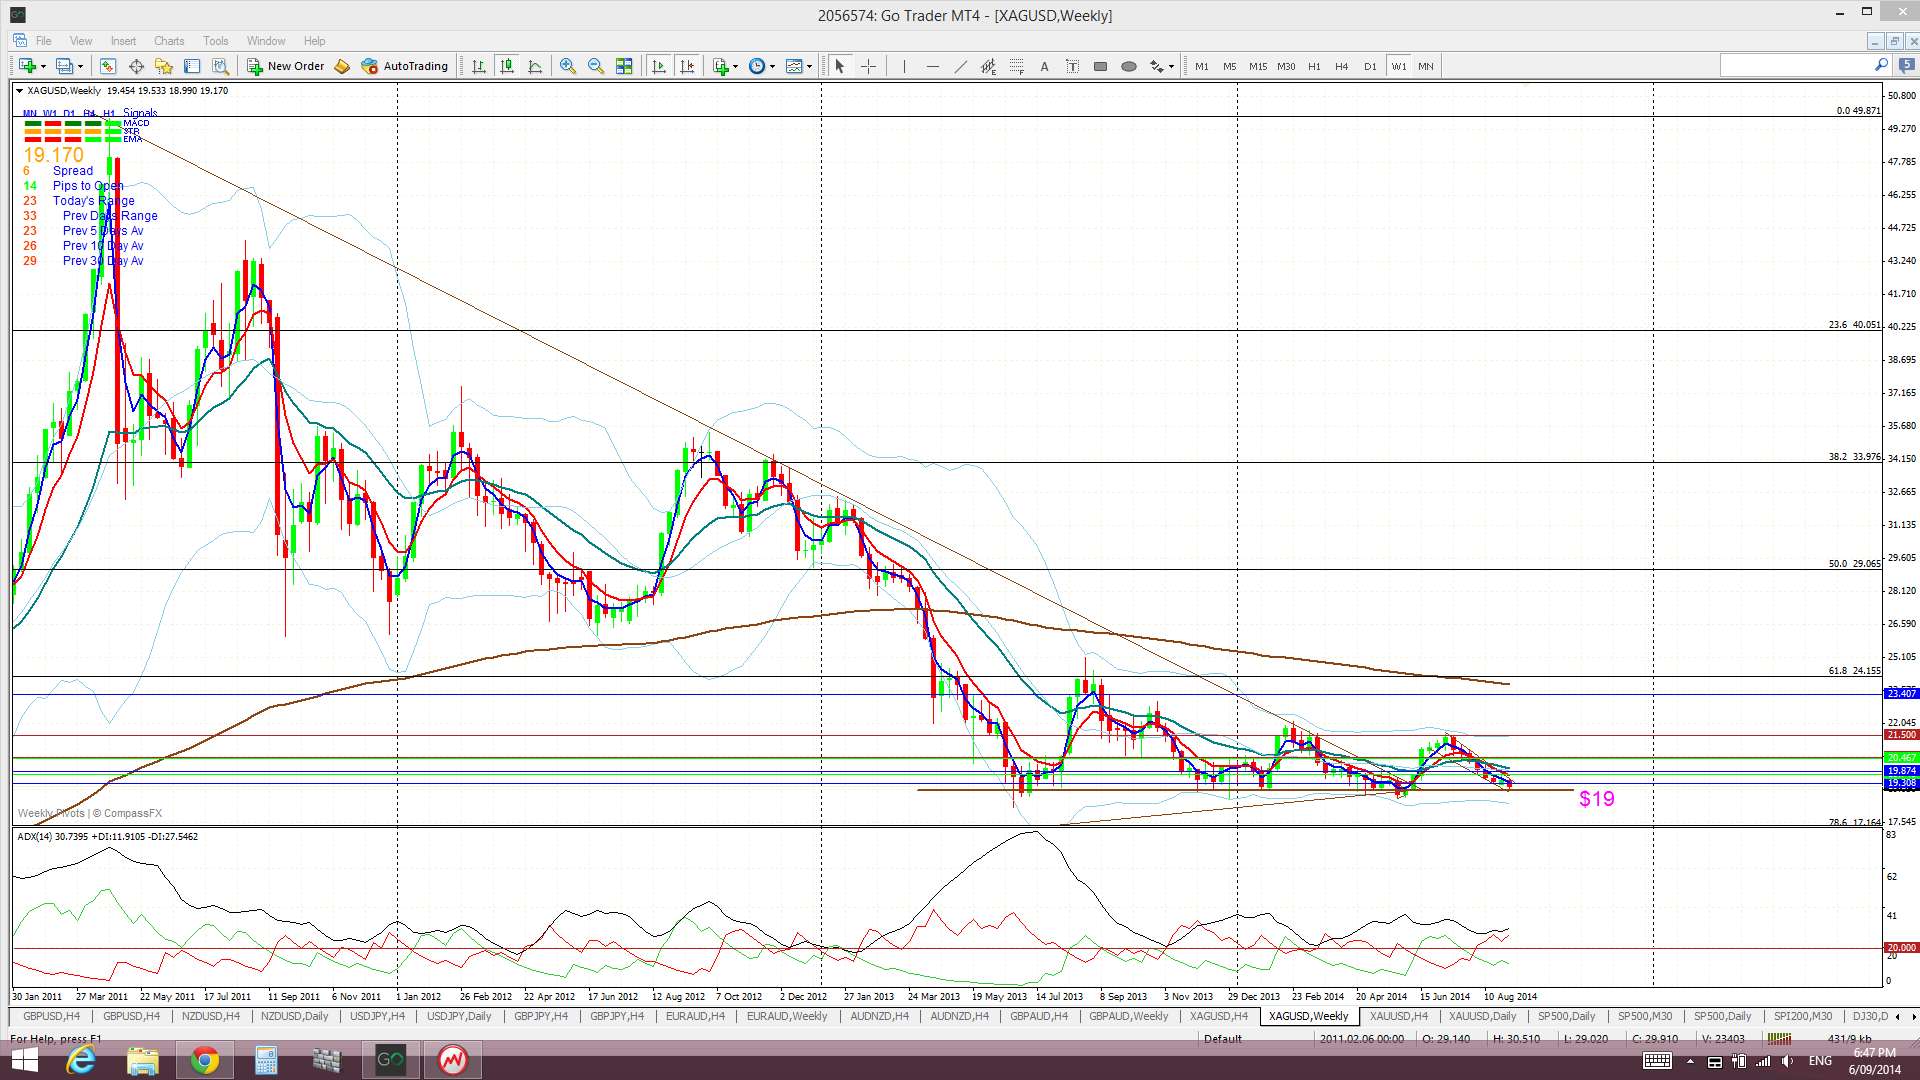
- Silver: the $19 level.
The ‘September 11th’ Anniversary falls on Thursday of this week and seems more poignant this year in light of recent global events.
Events in the Ukraine and the Middle East continue to have the potential to undermine any developing ‘risk’ appetite and needs to be monitored.
Stocks and broader market sentiment:
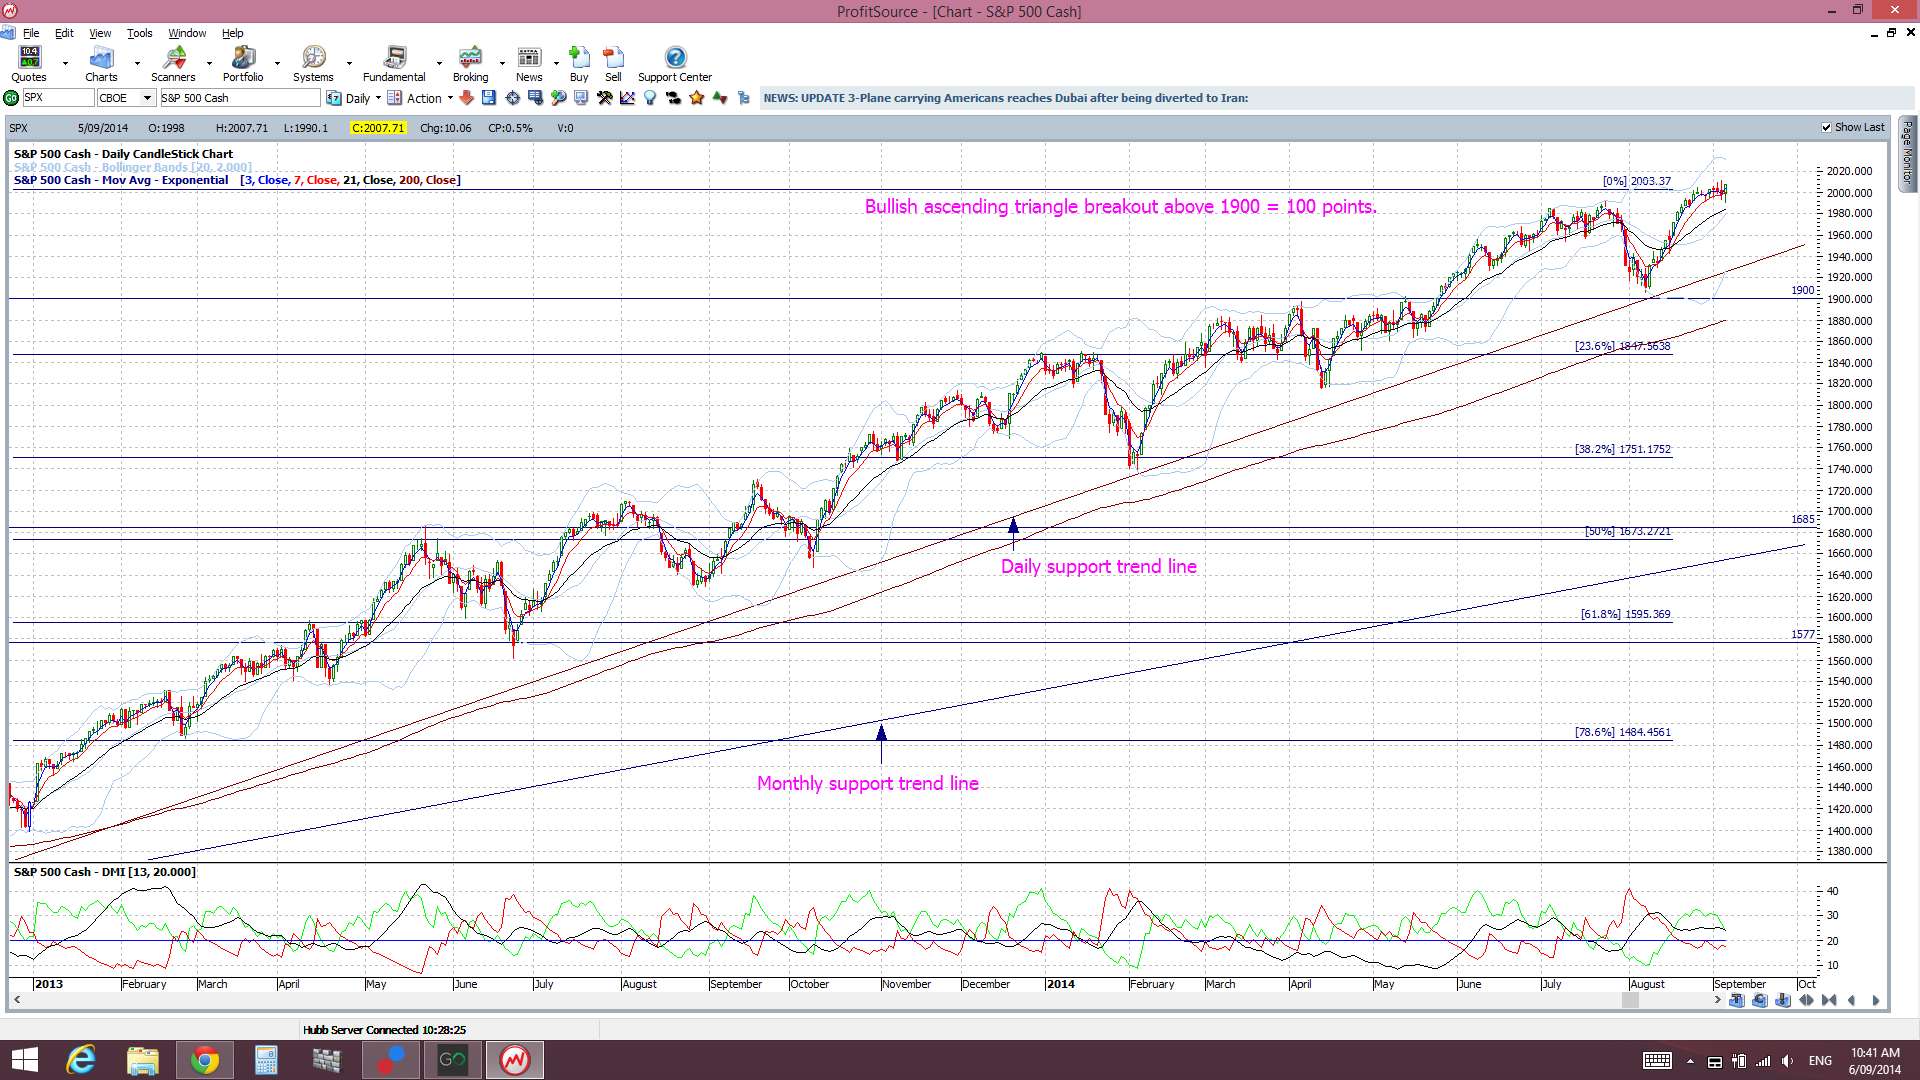
The S&P500 index has closed again above the key psychological level of 2,000 and at a new high. Whilst the S&P500, DJIA, NASDAQ and Russell 2000 all printed indecision style ‘Spinning Top’ or Doji candles, they have maintained their hold above daily support trend lines.
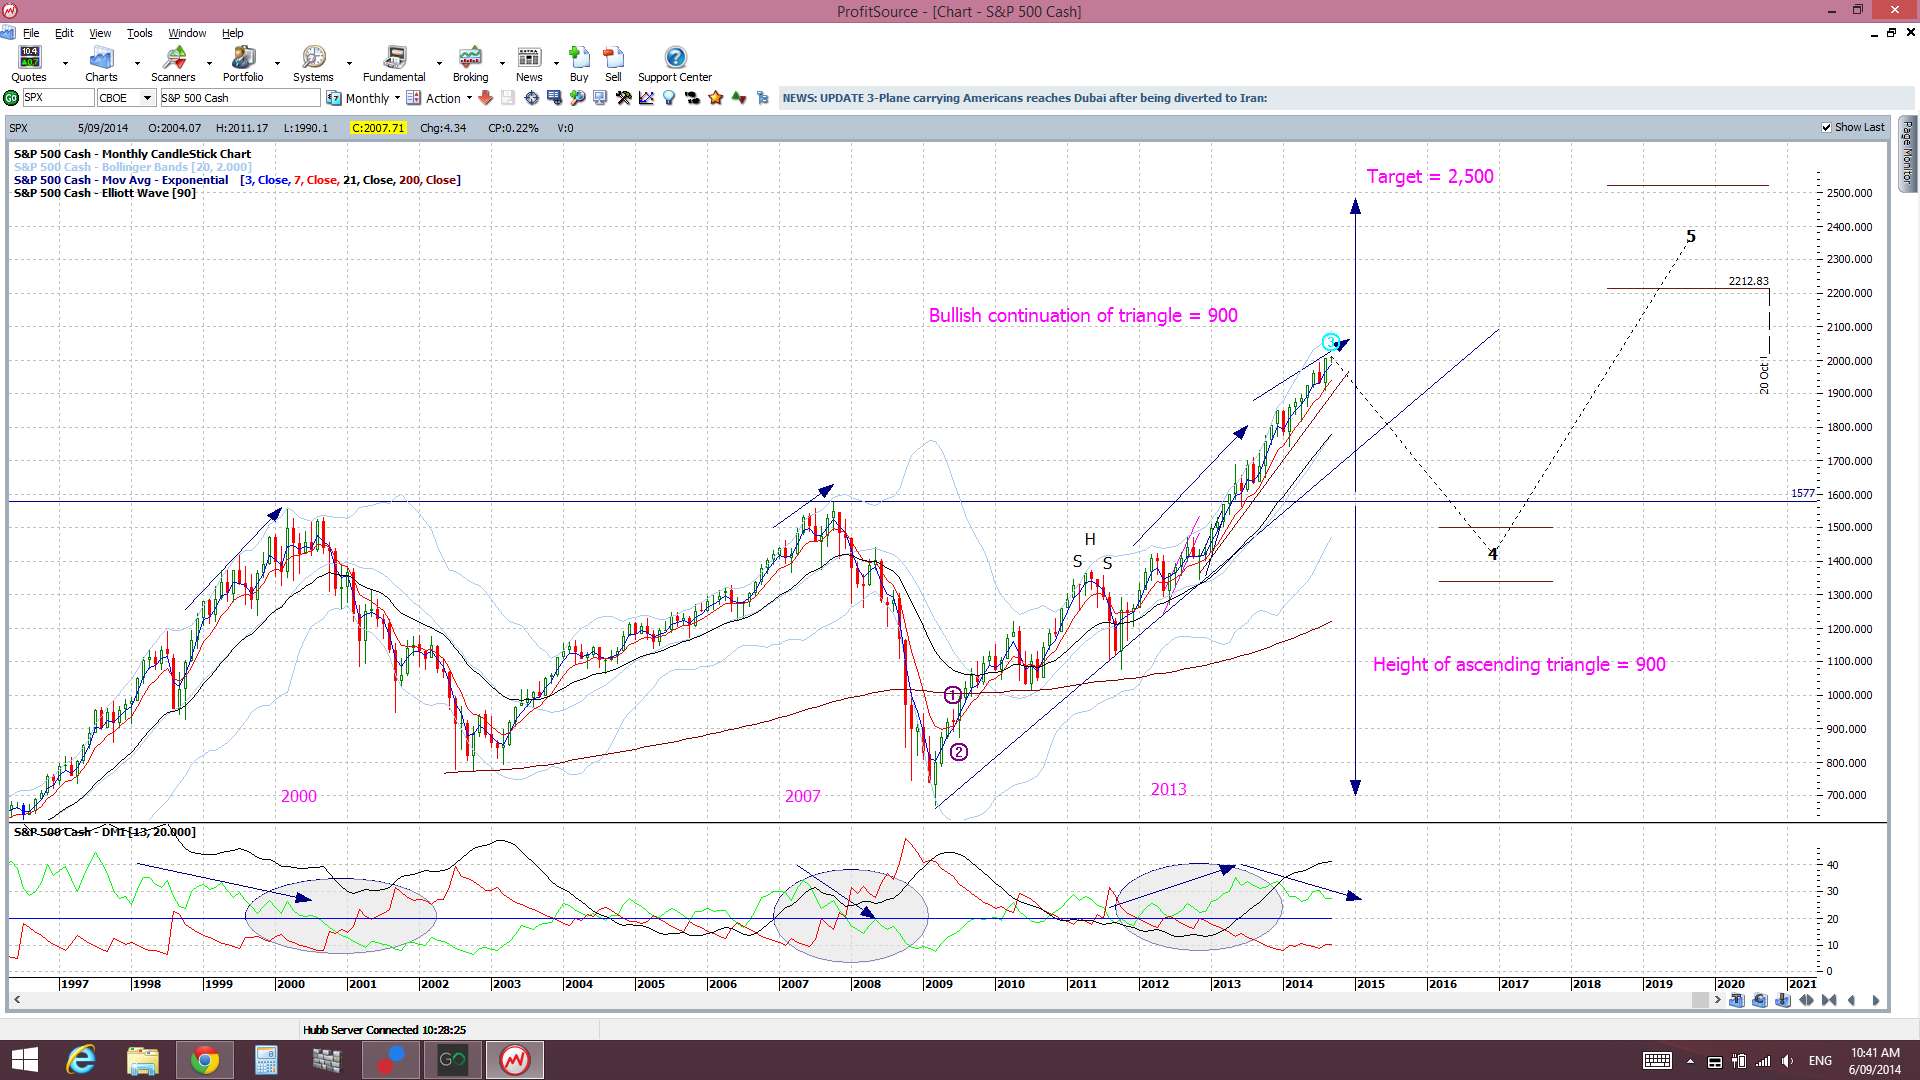
However I am still seeing divergence on the monthly S&P500 monthly chart though and whilst this might just be warning of a pause, as the index navigates new highs, the chance of a pullback cannot be ruled out either. There has not been any real deep pull back since the break up through the 1,577, 1,600, 1,700 and 1,800 levels and the major break of the 1,577 level was only tested once. Thus, I am still being cautious here now even though the daily support of the S&P500 has not been broken.
It is worth noting that a 61.8% fib pull back of the recent bull run (Nov 2012-present) would bring price down to near the 1,577 area. This remains significant as it is the breakout level of the previous highs from the 2000 and 2007 peaks. I would expect this region could be a target if there was any pullback on the S&P500.
Thus, with all of this, I continue to watch out for further clues as to any new momentum move, long or short though! In particular I’m looking out for:
S&P500 daily chart: I’m watching for any break of the daily trend line but price is holding above this for the time being. The index also continues to hold above the top trend line of the bullish ascending triangle (1,900).
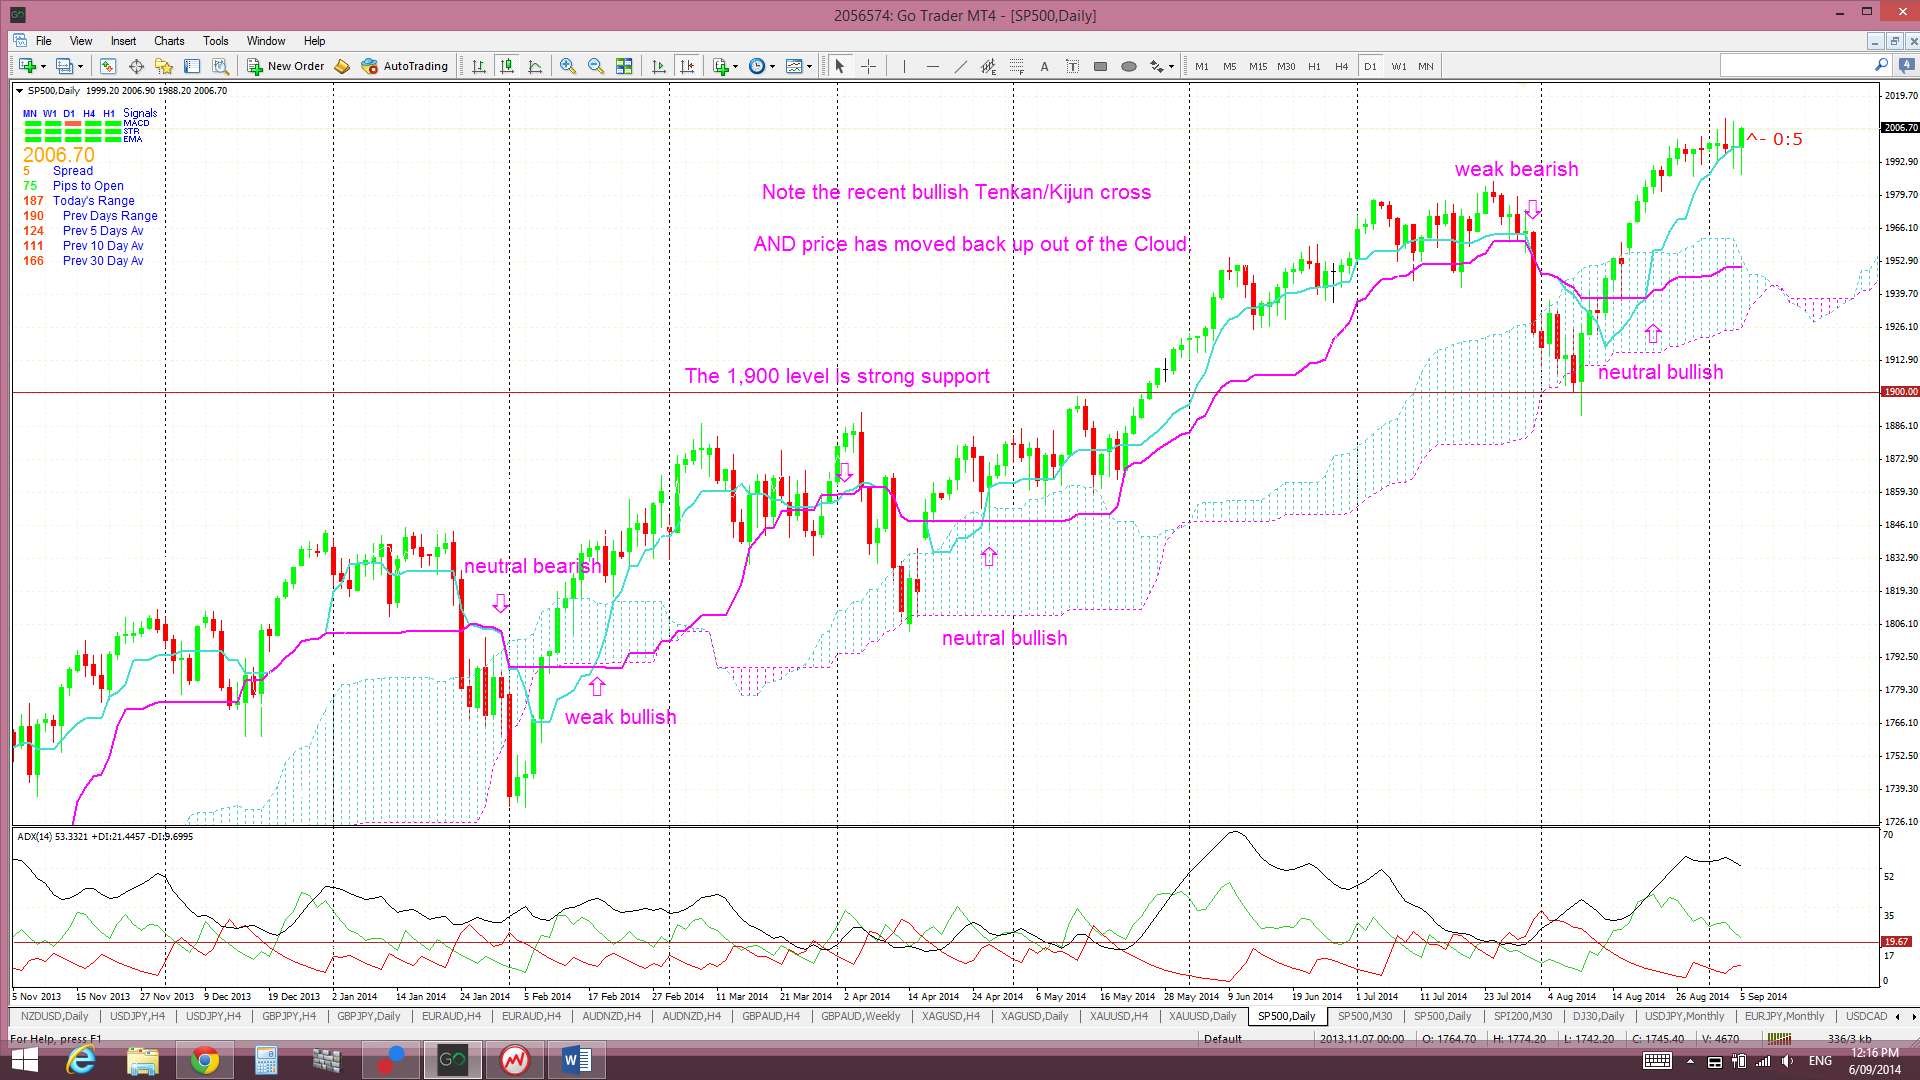
Ichimoku S&P500 chart: a clear cross of the blue Tenkan-sen line below the pink Kijun-sen line. However, there was a recent bullish Tenkan/Kijun cross on the index and it is still trading above the Cloud which is rather bullish. This latest bullish cross is deemed a ‘neutral’ signal though as it evolved within the Cloud.
S&P500 monthly chart: a break of the monthly support trend line (see monthly chart). The monthly trend line remains intact. A break of this support level would suggest to me of a more severe pull back or correction.
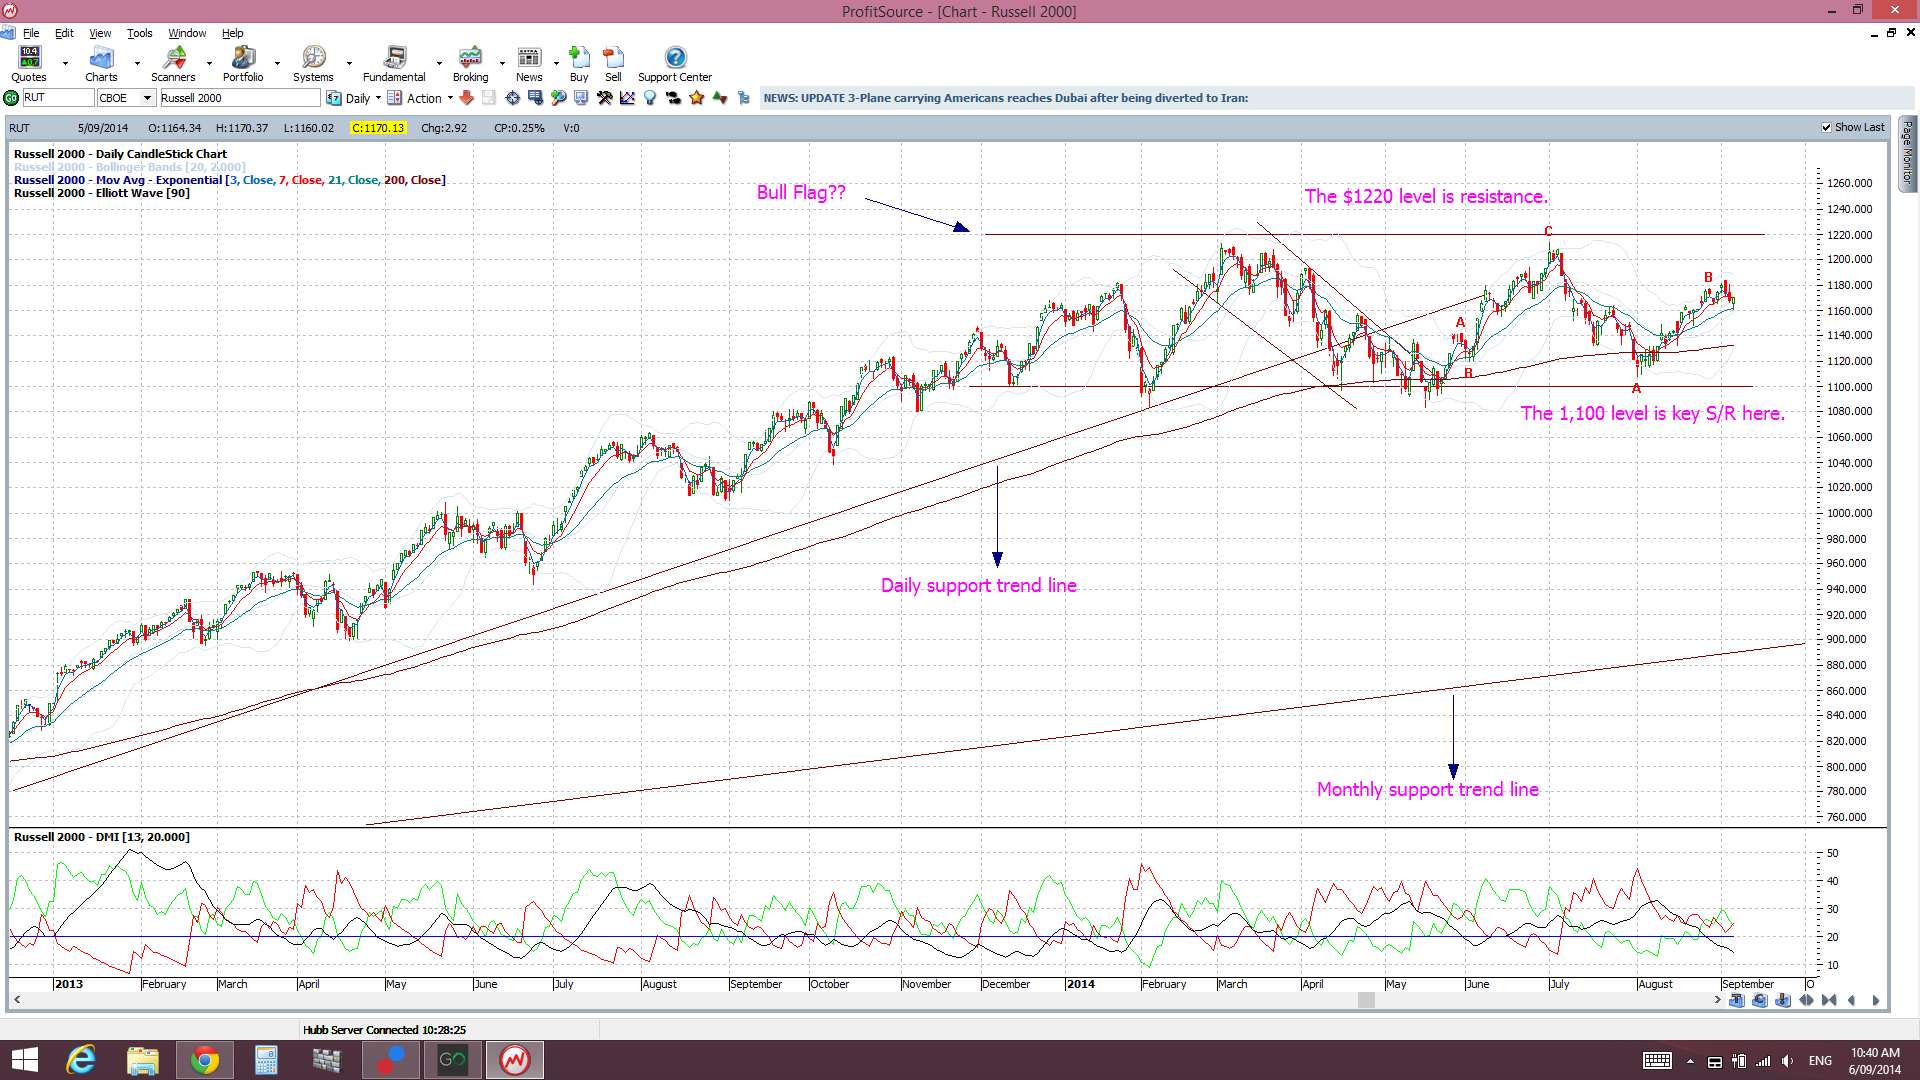
Russell 2000 Index: this small caps index is a bit of a US market ‘bellwether’ and I see the 1,100 level as key support here. The index continues to hold above this support for the time being:
Trading Calendar Items to watch out for:
- Mon 8th: CNY Bank Holiday & Trade Balance. CAD Building Permits.
- Tue 9th: AUD NAB Business Confidence. GBP BoE Gov Carney speaks, Manufacturing Production & Trade Balance.
- Wed 10th: GBP Inflation Report Hearings.
- Thurs 11th: NZD Official Cash Rate & RBNZ statement. AUD Unemployment rate. CNY CPI. USD Unemployment claims.
- Fri 12th: BoJ Gov Kuroda speaks. USD Retails Sales, Import Prices & Prelim UoM Consumer Sentiment.
- Sat 13th: CNY Industrial Production.
Forex:
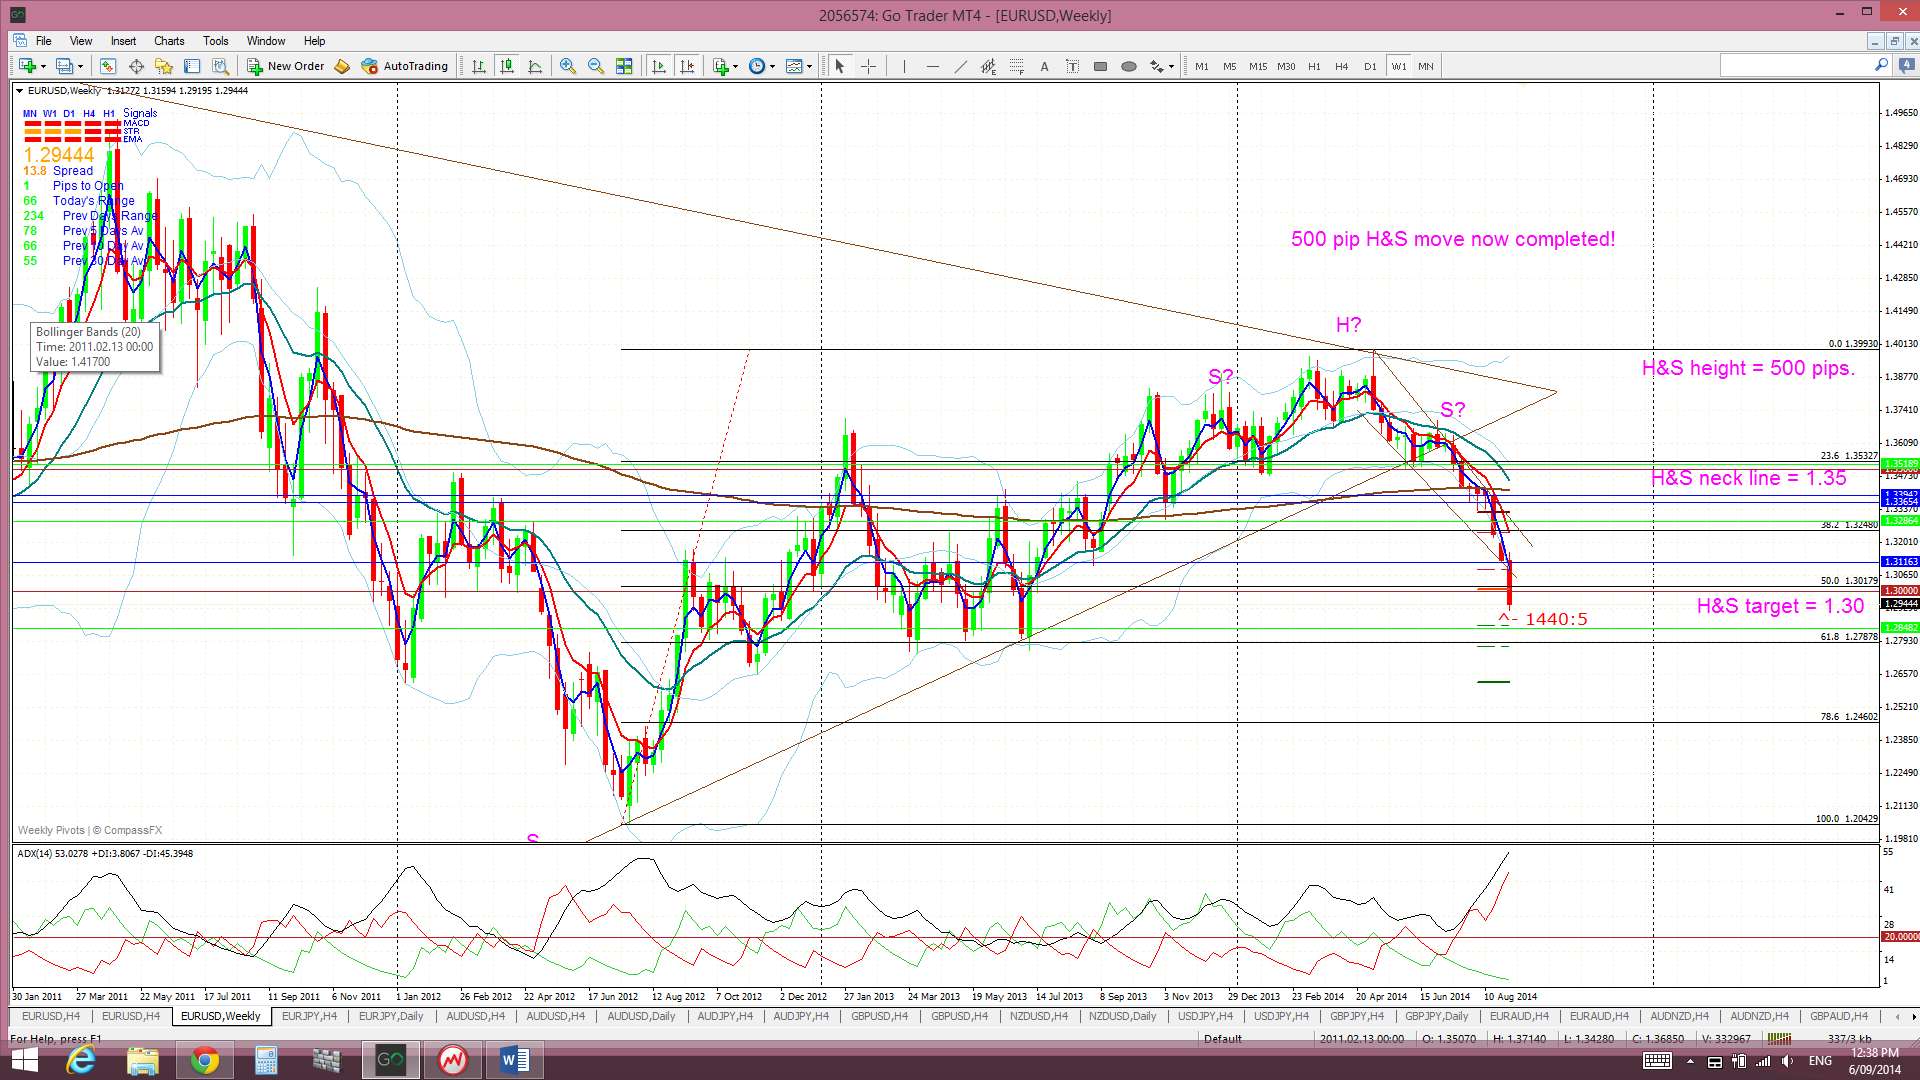
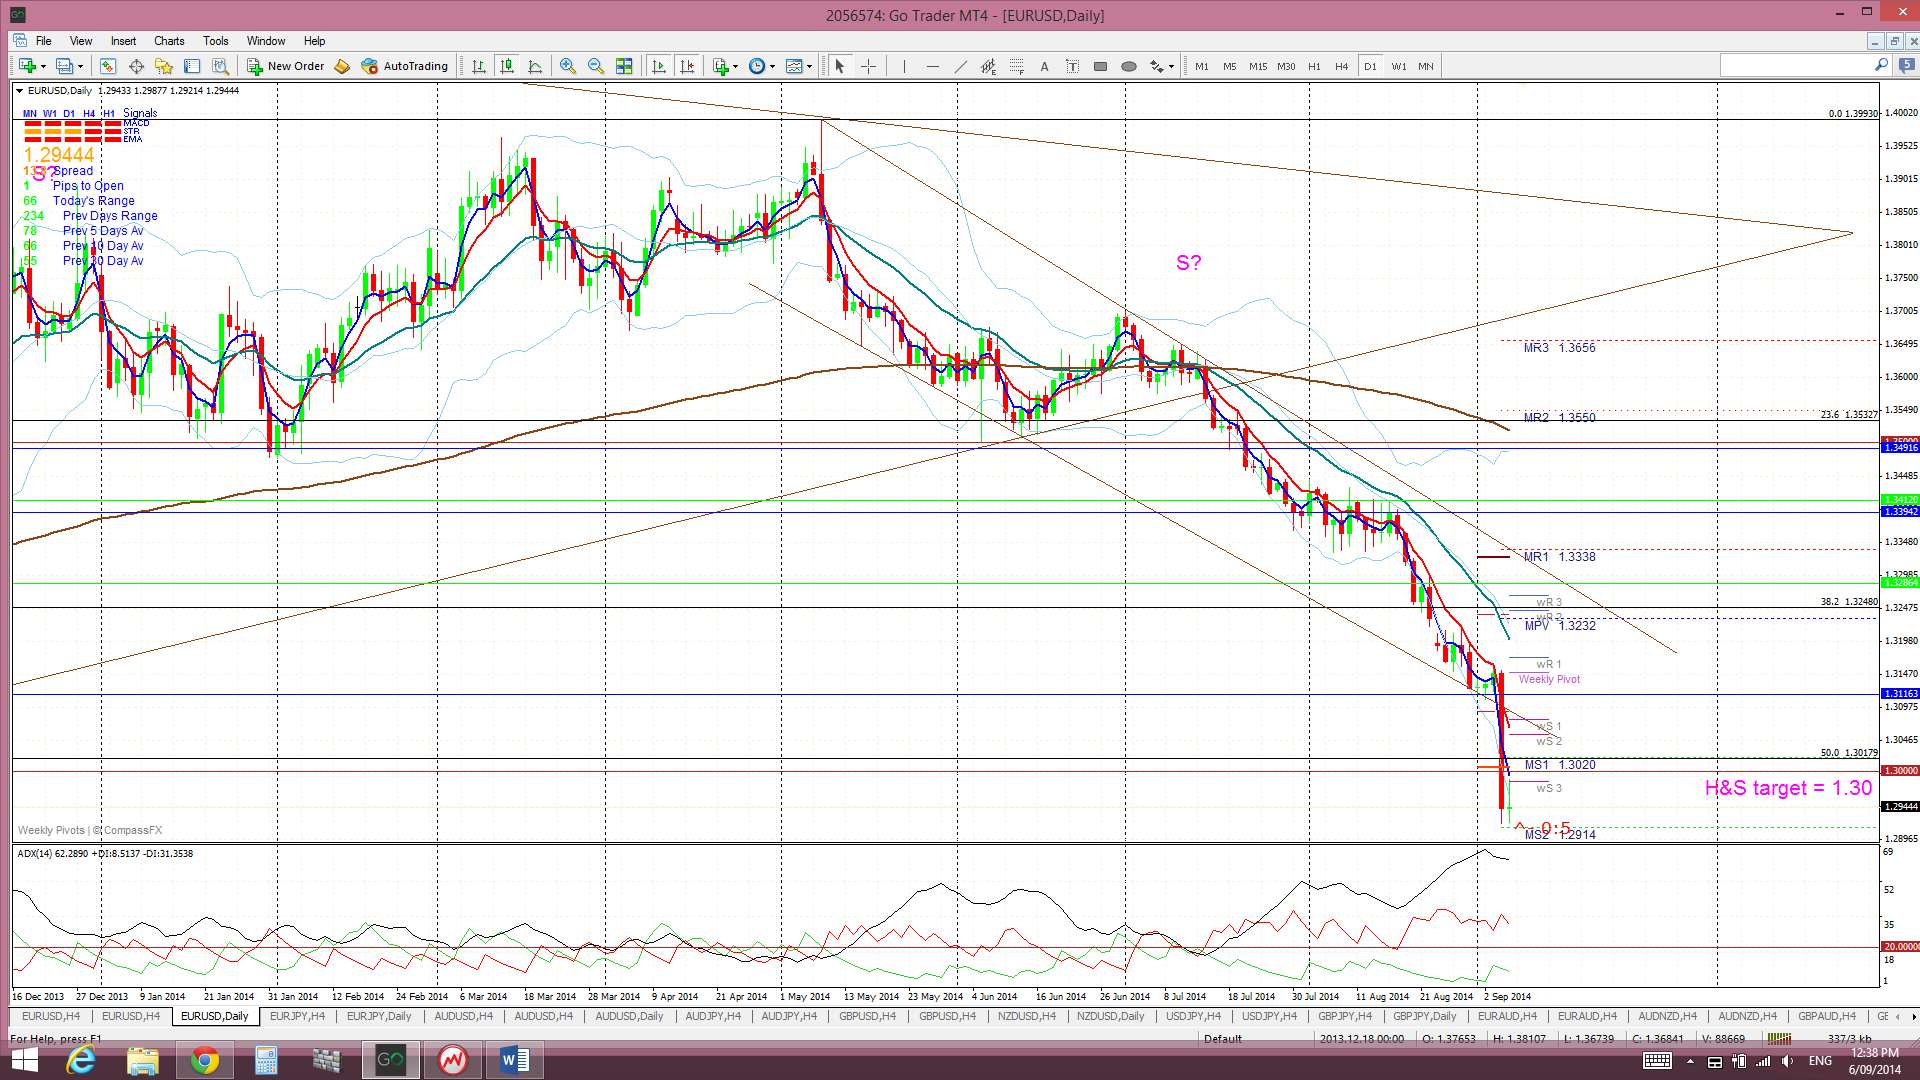
E/U: The E/U drifted a bit lower to start the week but the ECB rate cut on Thursday accelerated these losses and it broke down below the 1.30 level following this news. This close below 1.30 completed the weekly chart’s H&S pattern and delivered the target 500 pip haul.
Weekly H&S The weekly chart’s bearish ‘H&S’ has now completed. This move began when the ‘neck line’ at 1.35 was broken. The height of this weekly H&S pattern was about 500 pips. The theory of these technical patterns is that any bearish follow through can be expected to extend by the same order of magnitude as the height of the pattern. Thus, the projected target for this H&S pattern was 500 pips below the 1.35 level. This predicted the E/U to target the 1.30 level and price has now reached this target.
I am now expecting that we may see the broken 1.30 level tested before possible further bearish follow through given that this is a major whole number and psychological level and the 50% fib of the latest bull move. Support levels below current price remains as the:
- monthly 200 EMA near 1.285 AND
- 8% fib level of this latest Bull Run near 1.28.
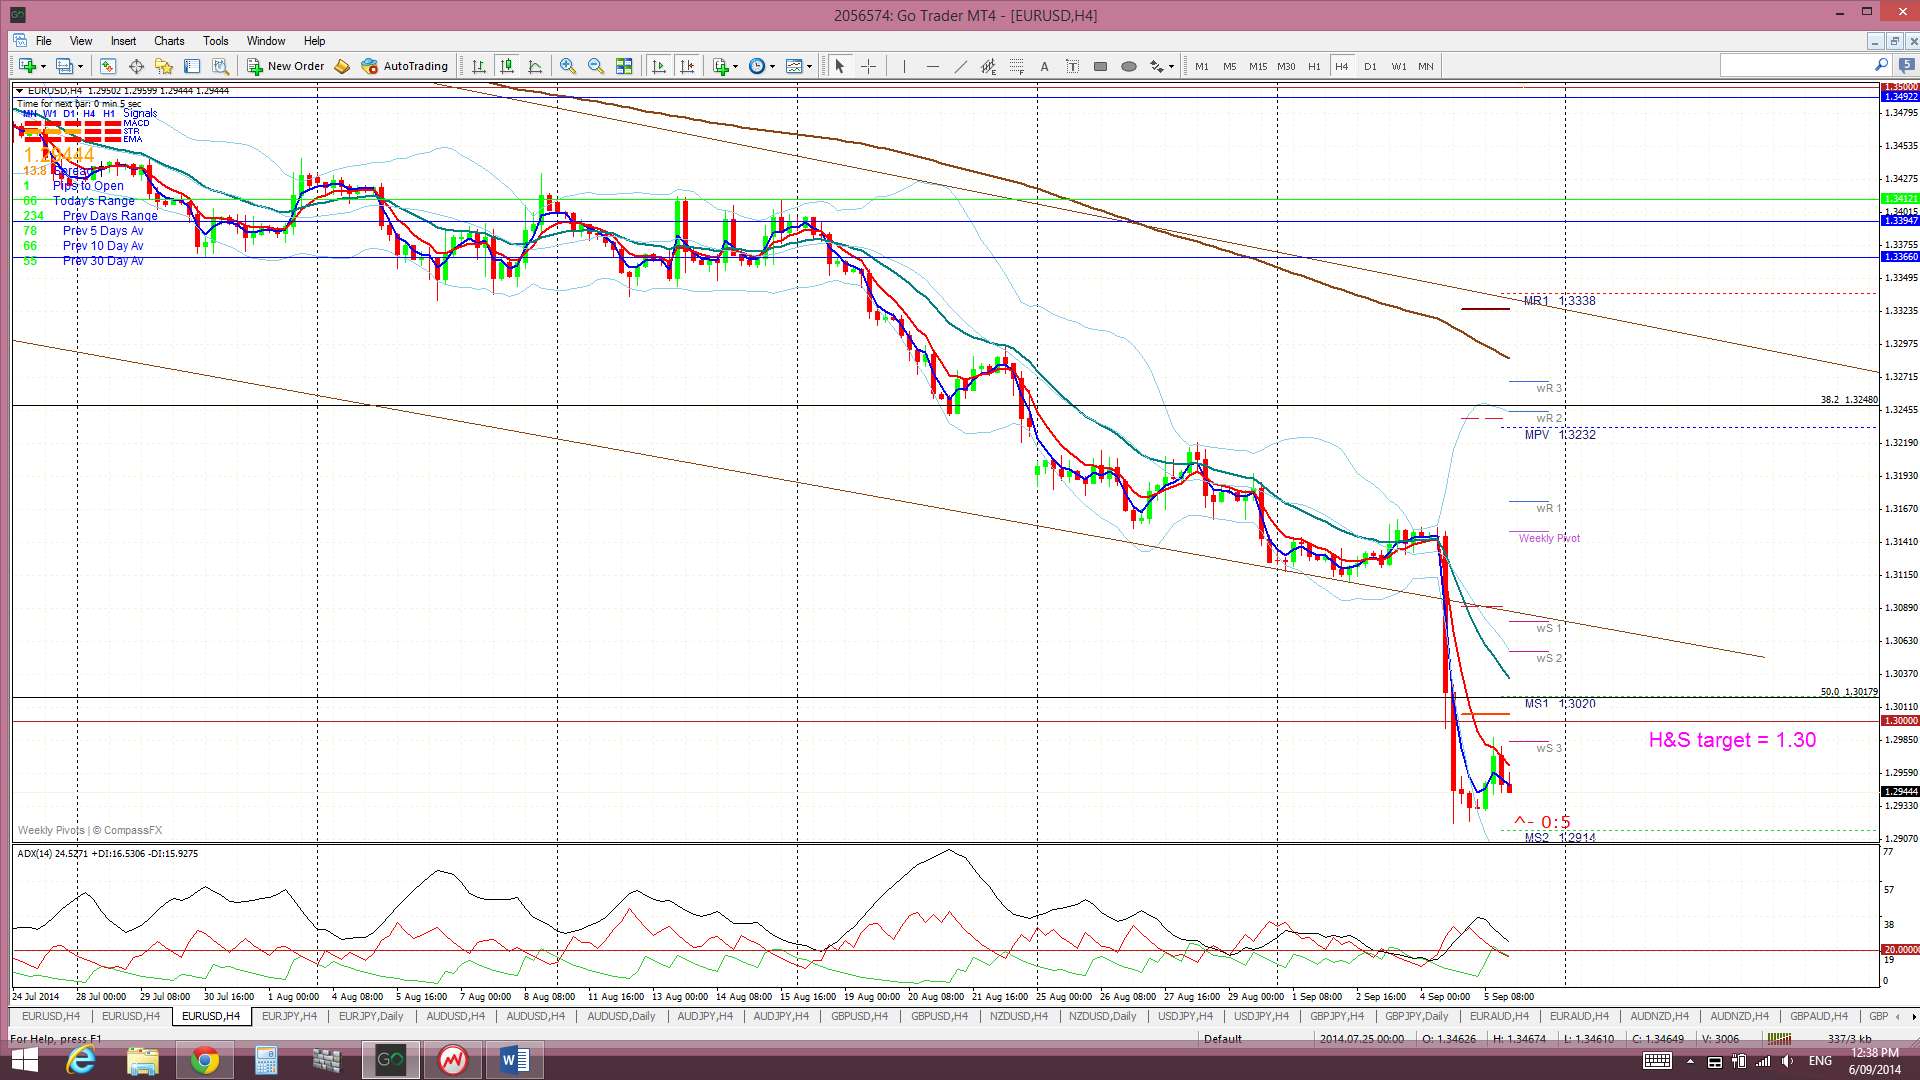
Price is still trading below the Ichimoku Cloud on the 4hr, daily chart, weekly and monthly charts which is bearish.
The weekly candle closed as a large bearish candle.
- I’m watching for any new TC signal and the 1.30 level.
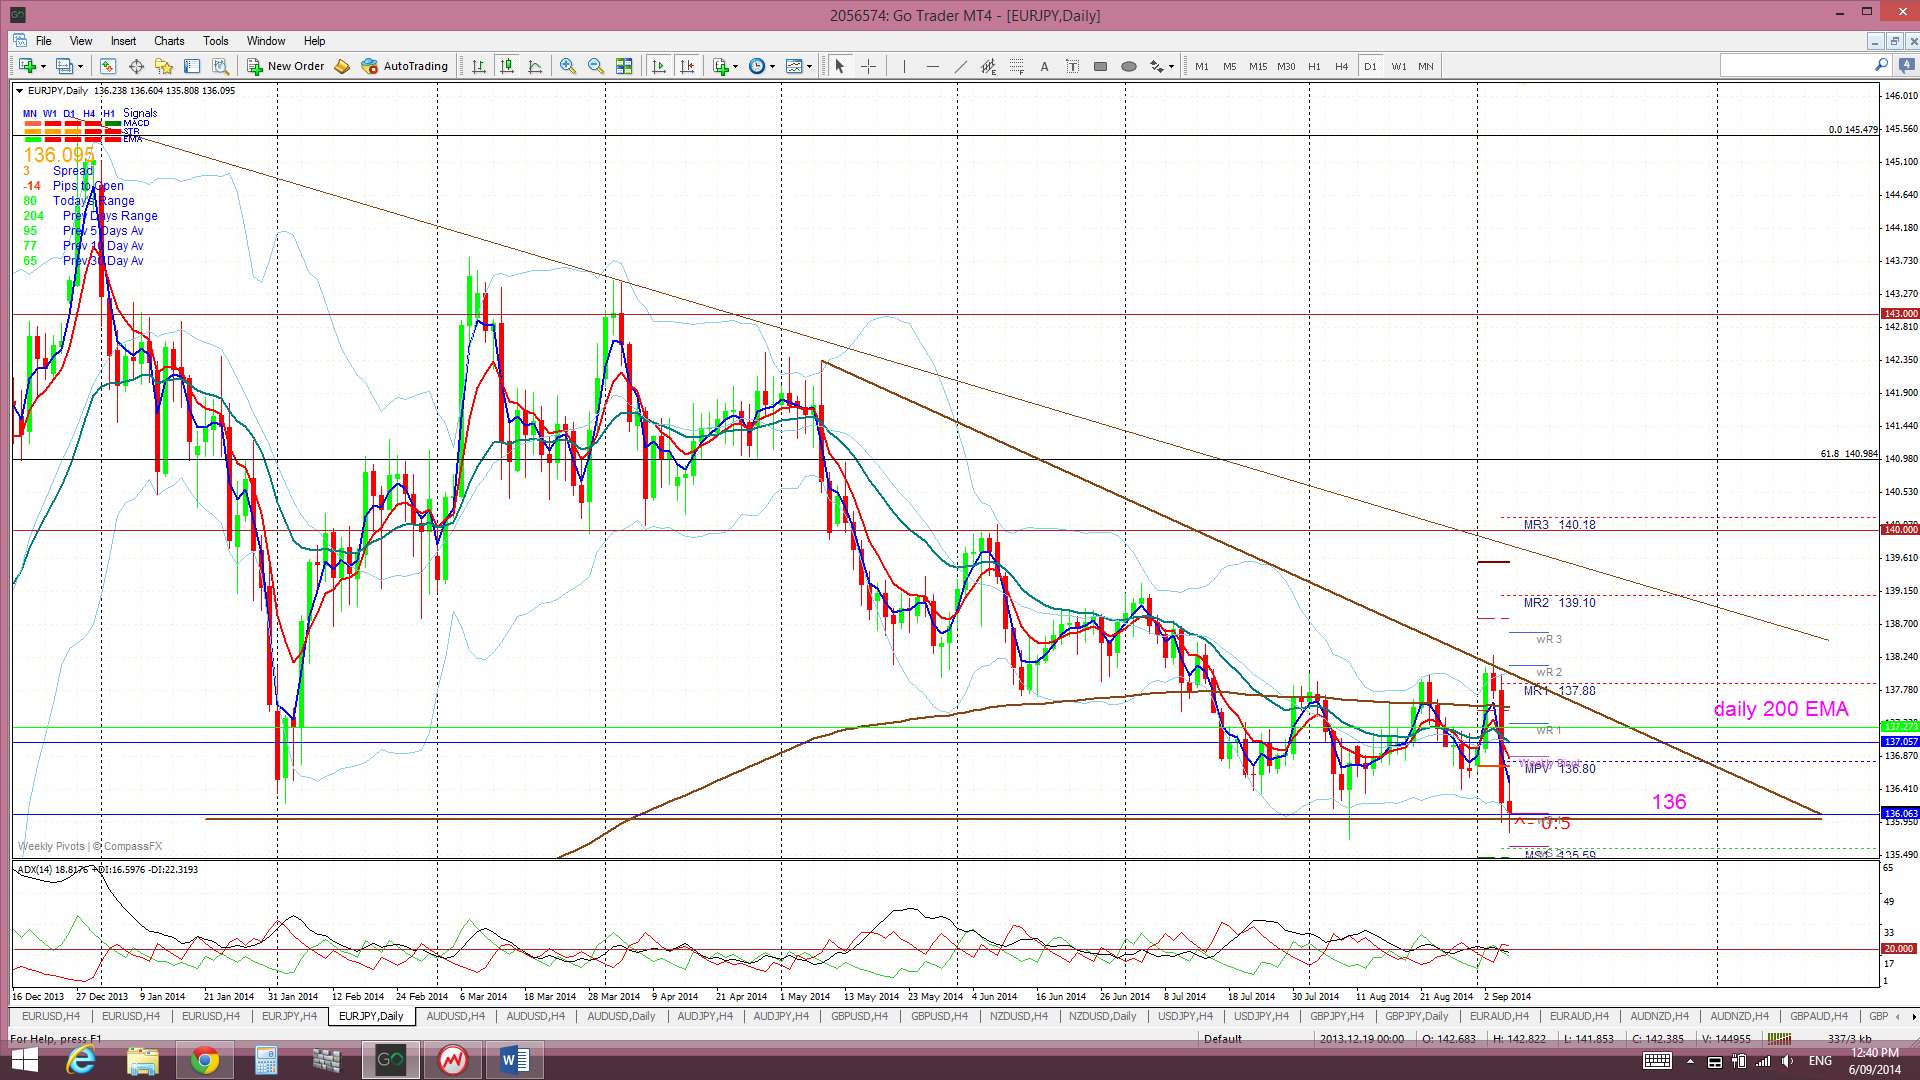
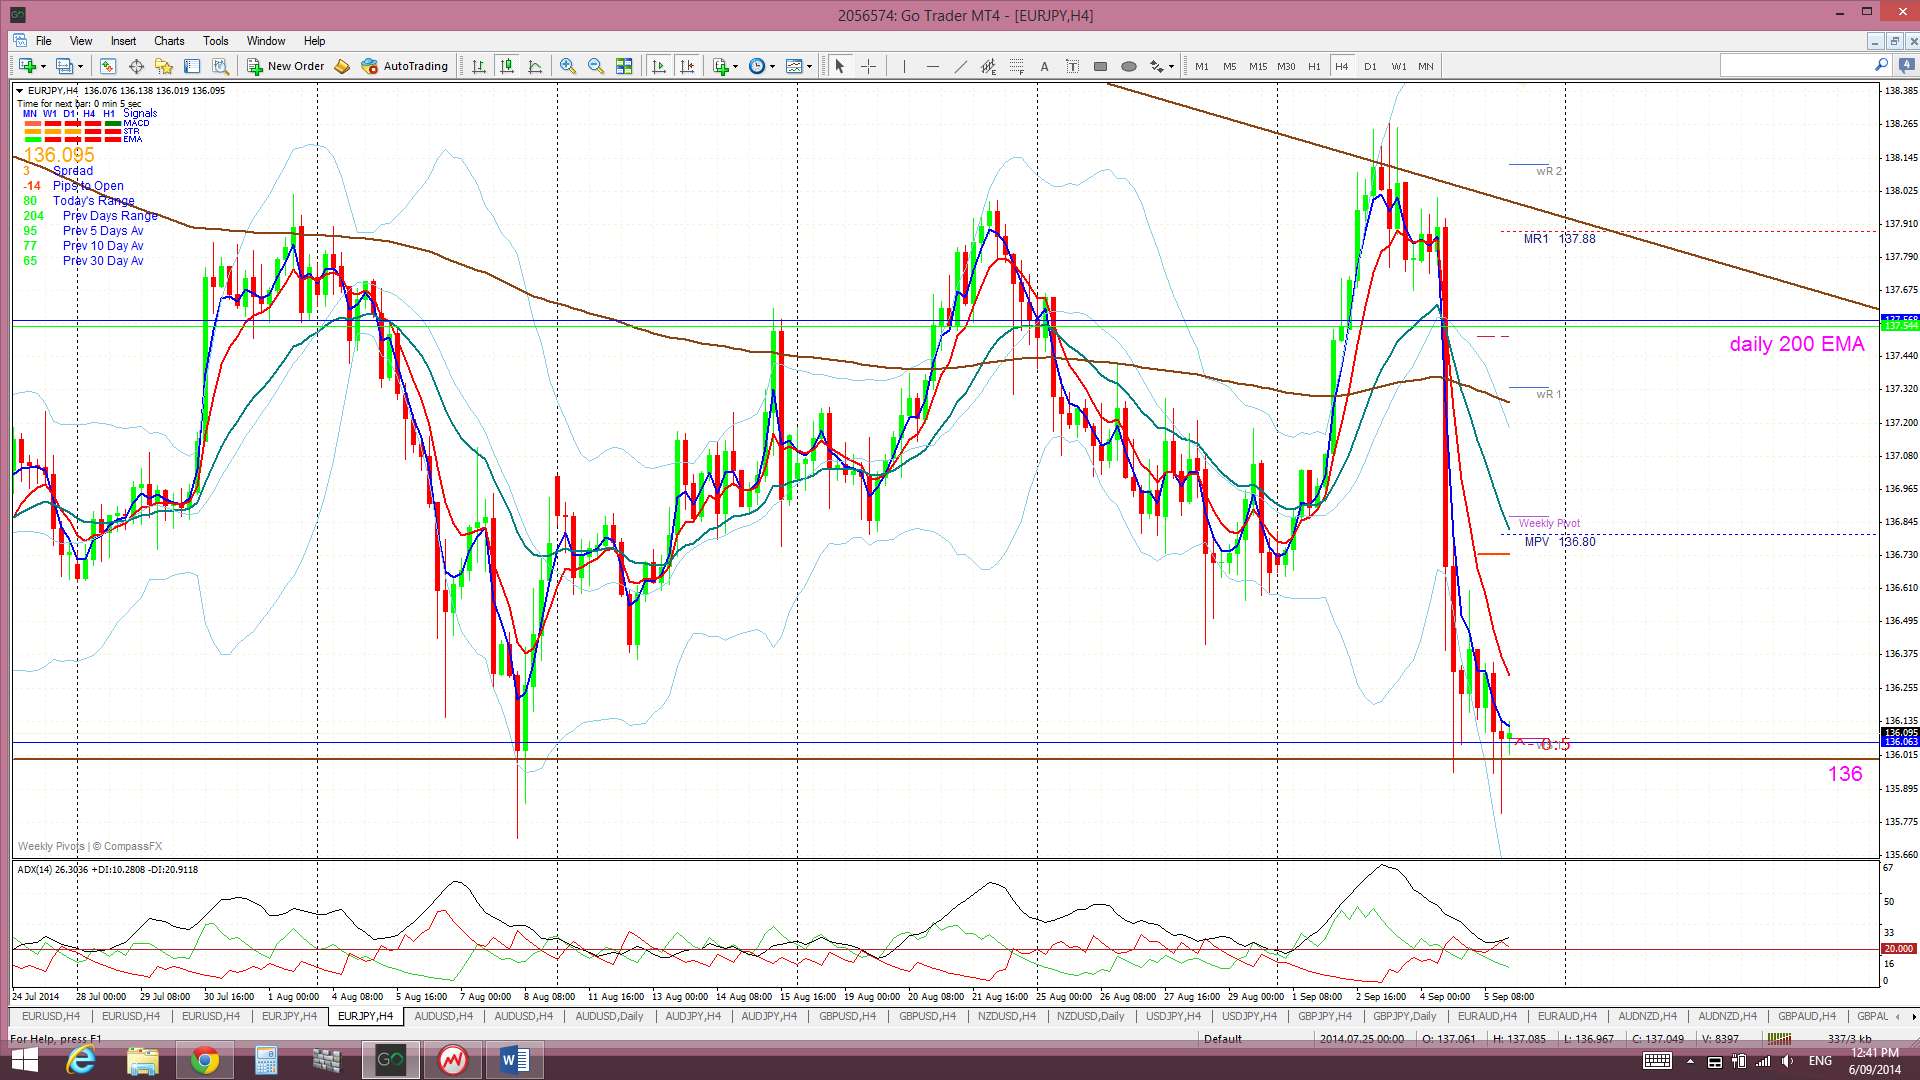
E/J: The E/J has been looking messy over recent weeks but it now looks to have formed up into a descending triangle on the daily chart that is set within the larger, weekly chart triangle pattern. I wrote a separate article on the E/J last Friday and this can be found through this link.
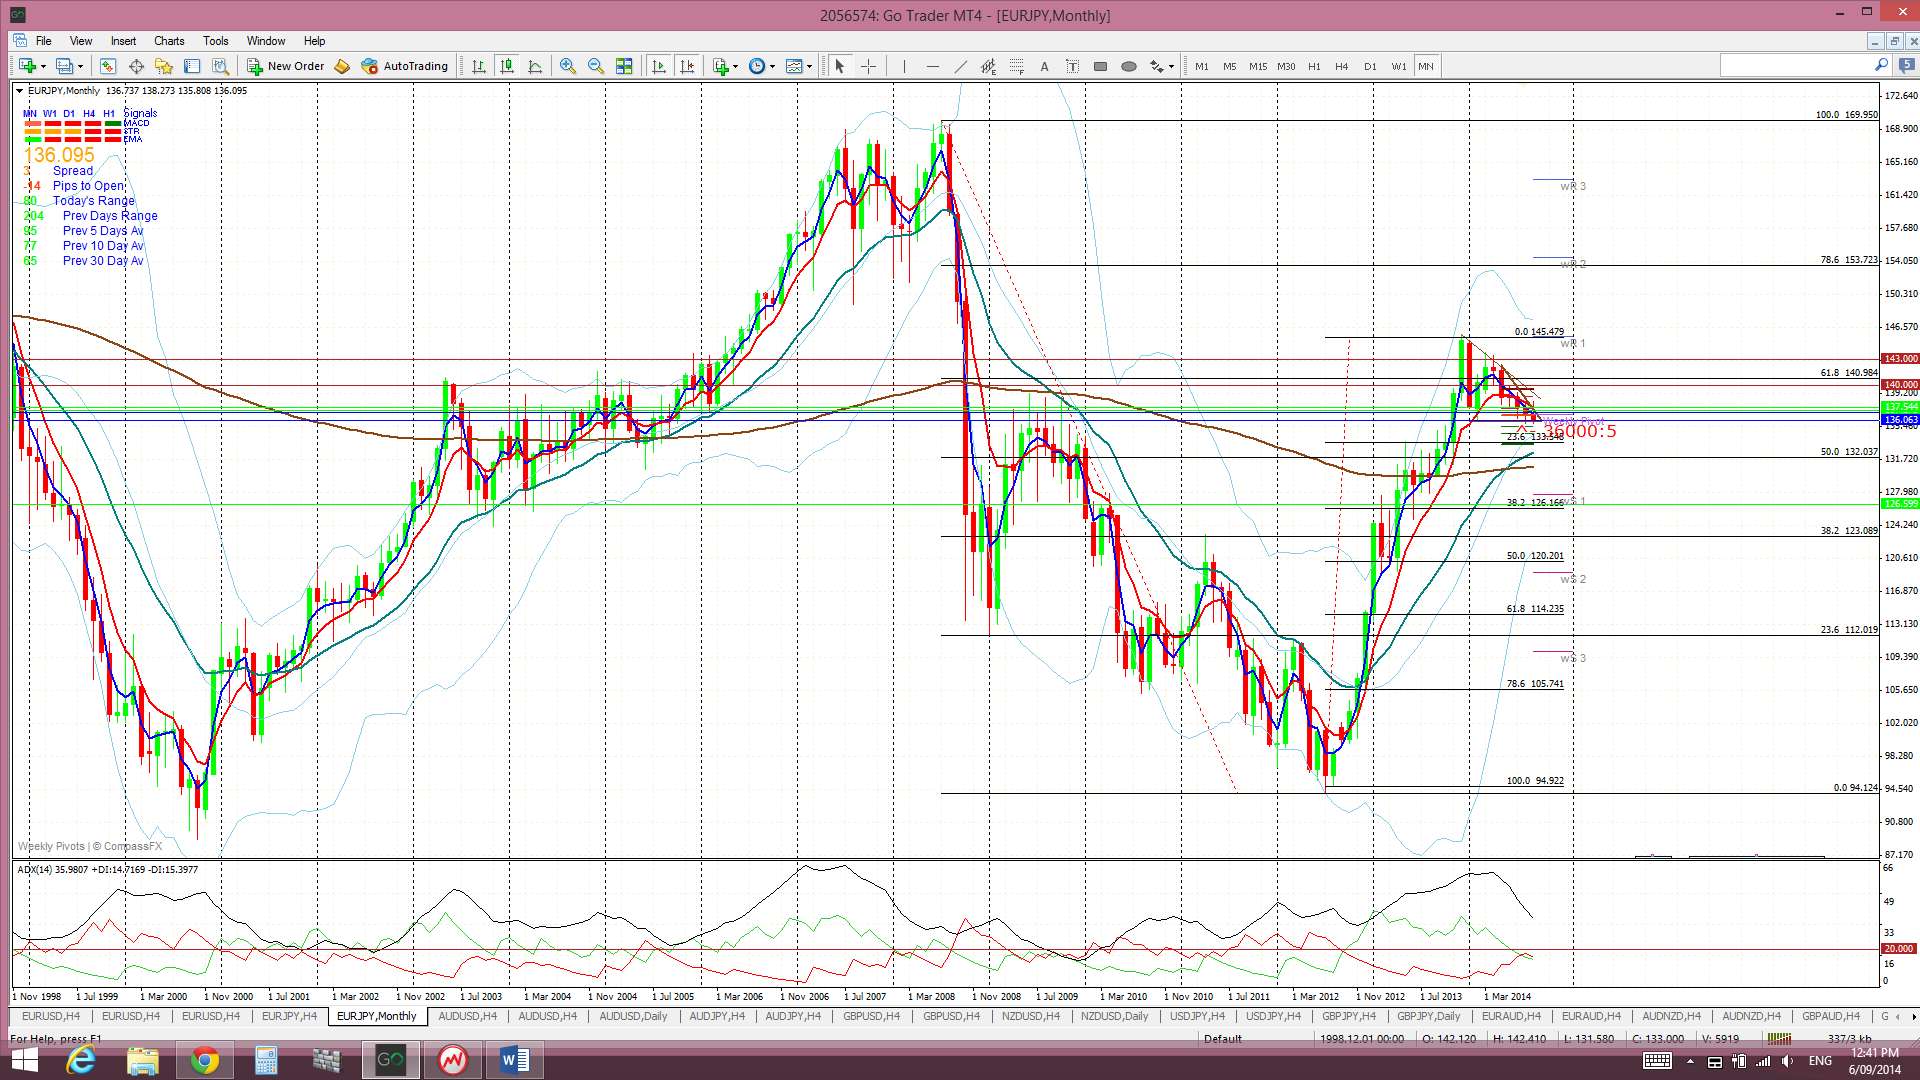
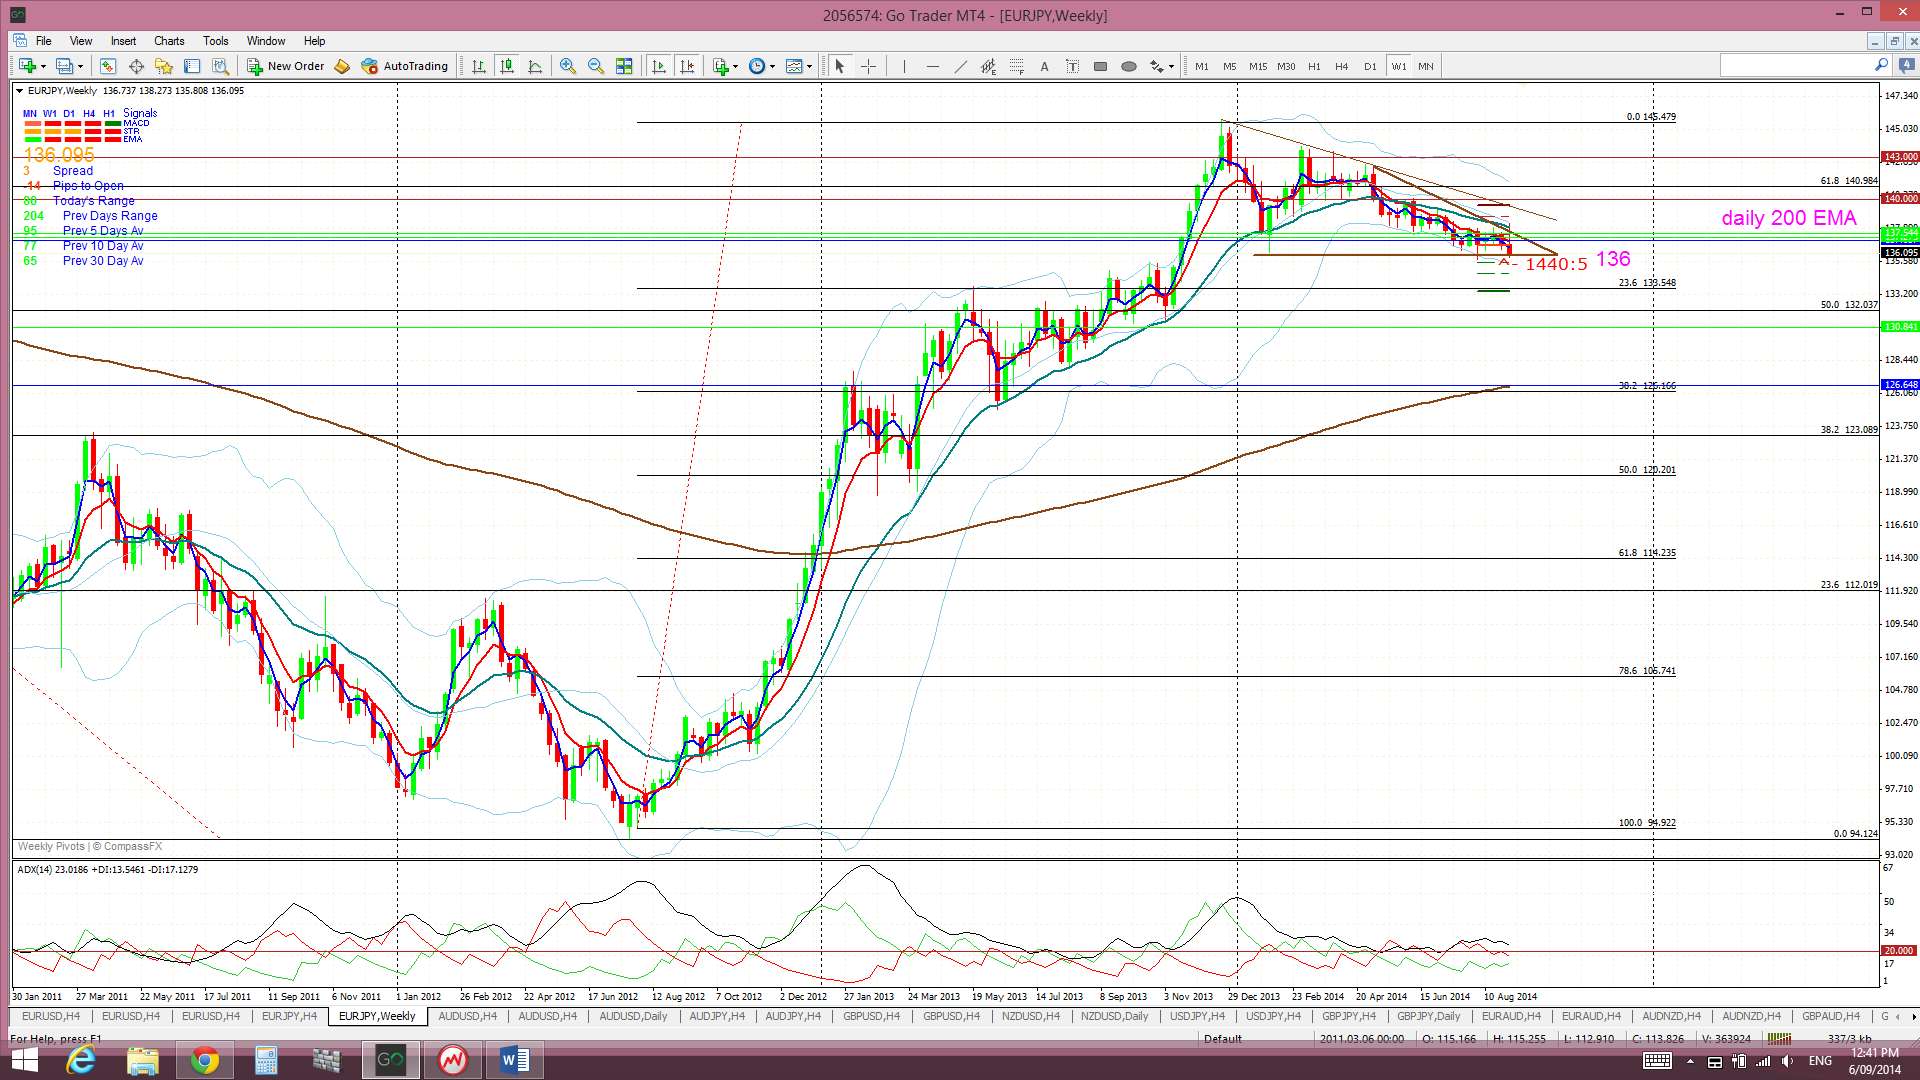
I am keenly watching the 136 level as this has been a major support level for the E/J throughout this year. I am particularly watching for any weekly break and hold below this 136 level and would see this as suggesting bearish continuation.
I have added fib levels of the recent bull move to the E/J weekly chart to help identify potential bearish targets for any close and hold below 136. These targets include the levels of:
- 126: looks obvious as a whole number value, the 38.2% fib and the weekly 200 EMA.
- 120: is also a whole number and the 50% fib.
- 114: is the 61.8% fib.
Whilst the short Yen trade has been popular I’m keeping an open mind here about possible E/J weakness in light of Fridays NFP. A pull back on the E/J could be aided by any weakness and pull back on the U/J, even if only short term, and this is a distinct possibility given the weaker than expected NFP result.
Price is now trading below the Cloud on the 4hr and daily chart, in the Cloud on the weekly but above the Cloud on the monthly chart. This represents a bearish shift although the November and December candles were the first to close above the resistance of the monthly Ichimoku Cloud since 2008.
The weekly candle closed as a small bearish candle.
- I’m watching for any new TC signal on this pair and the 136 level.
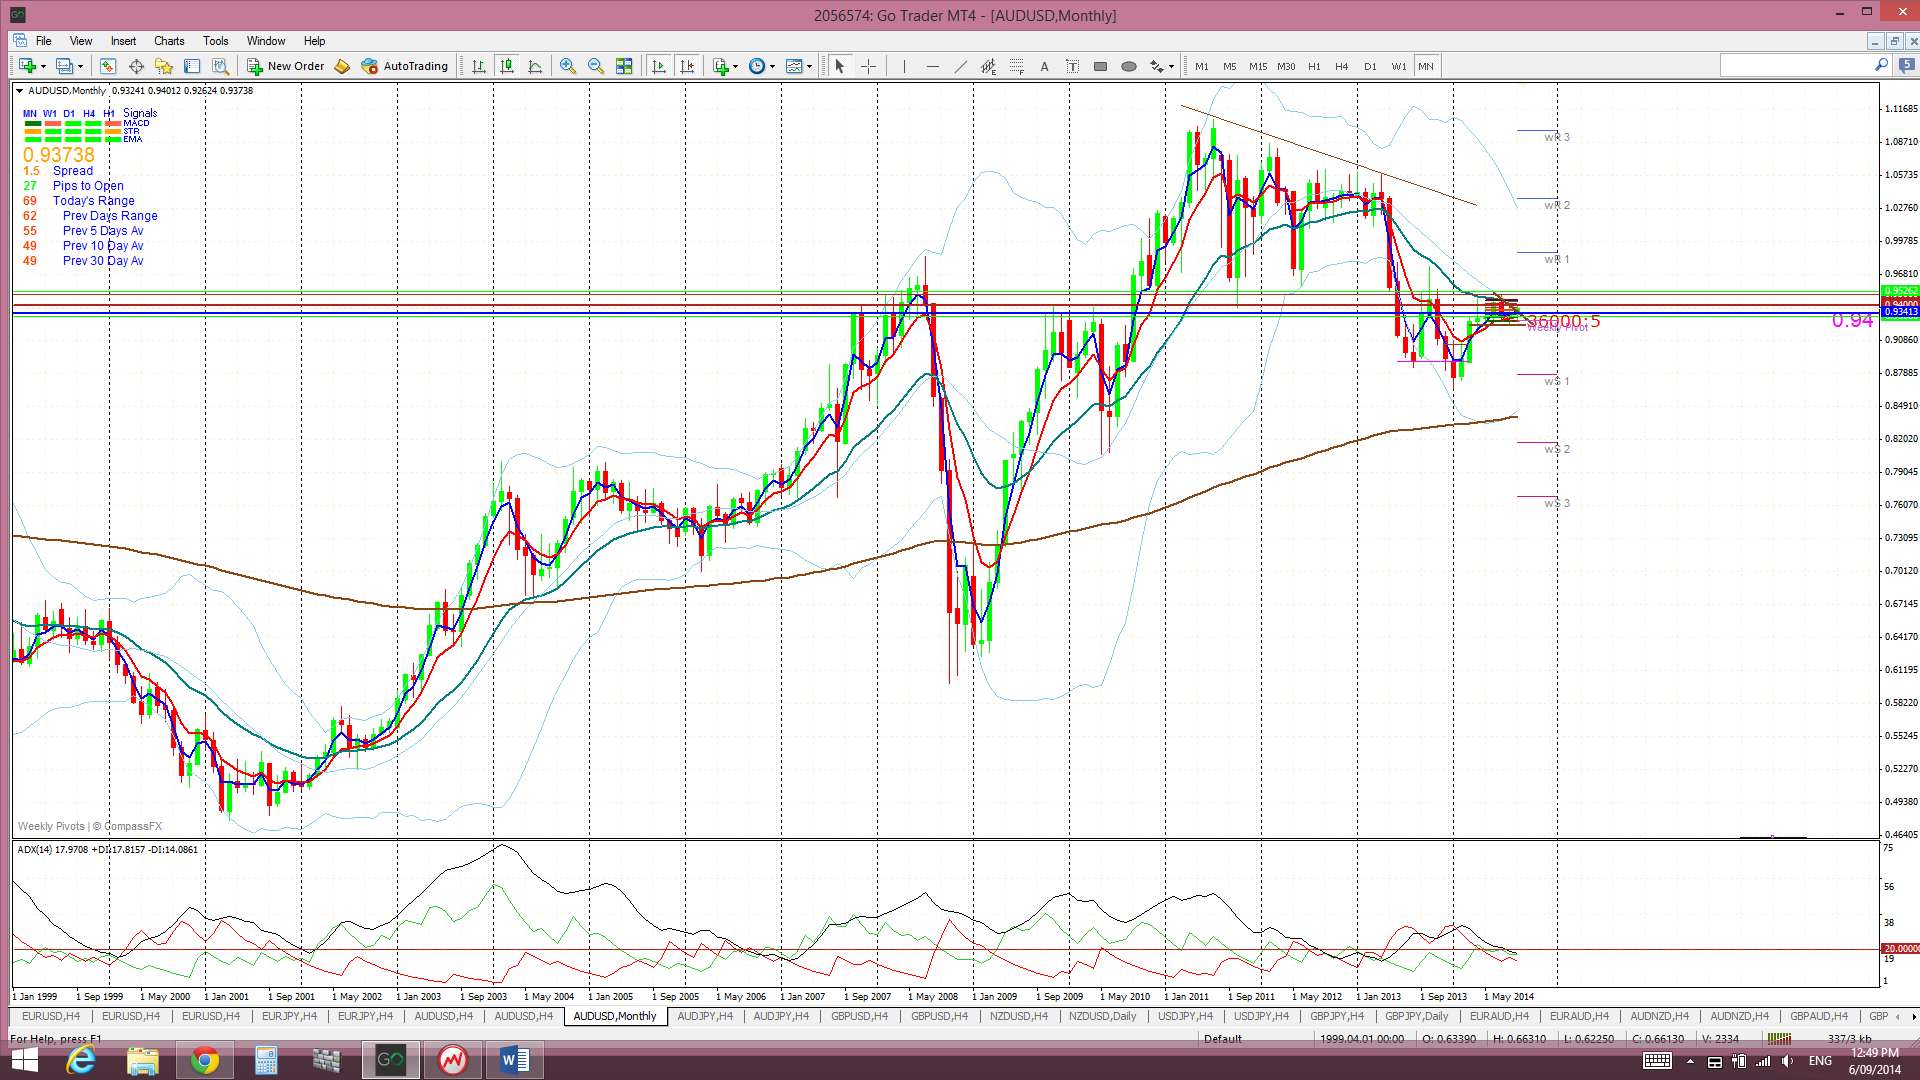
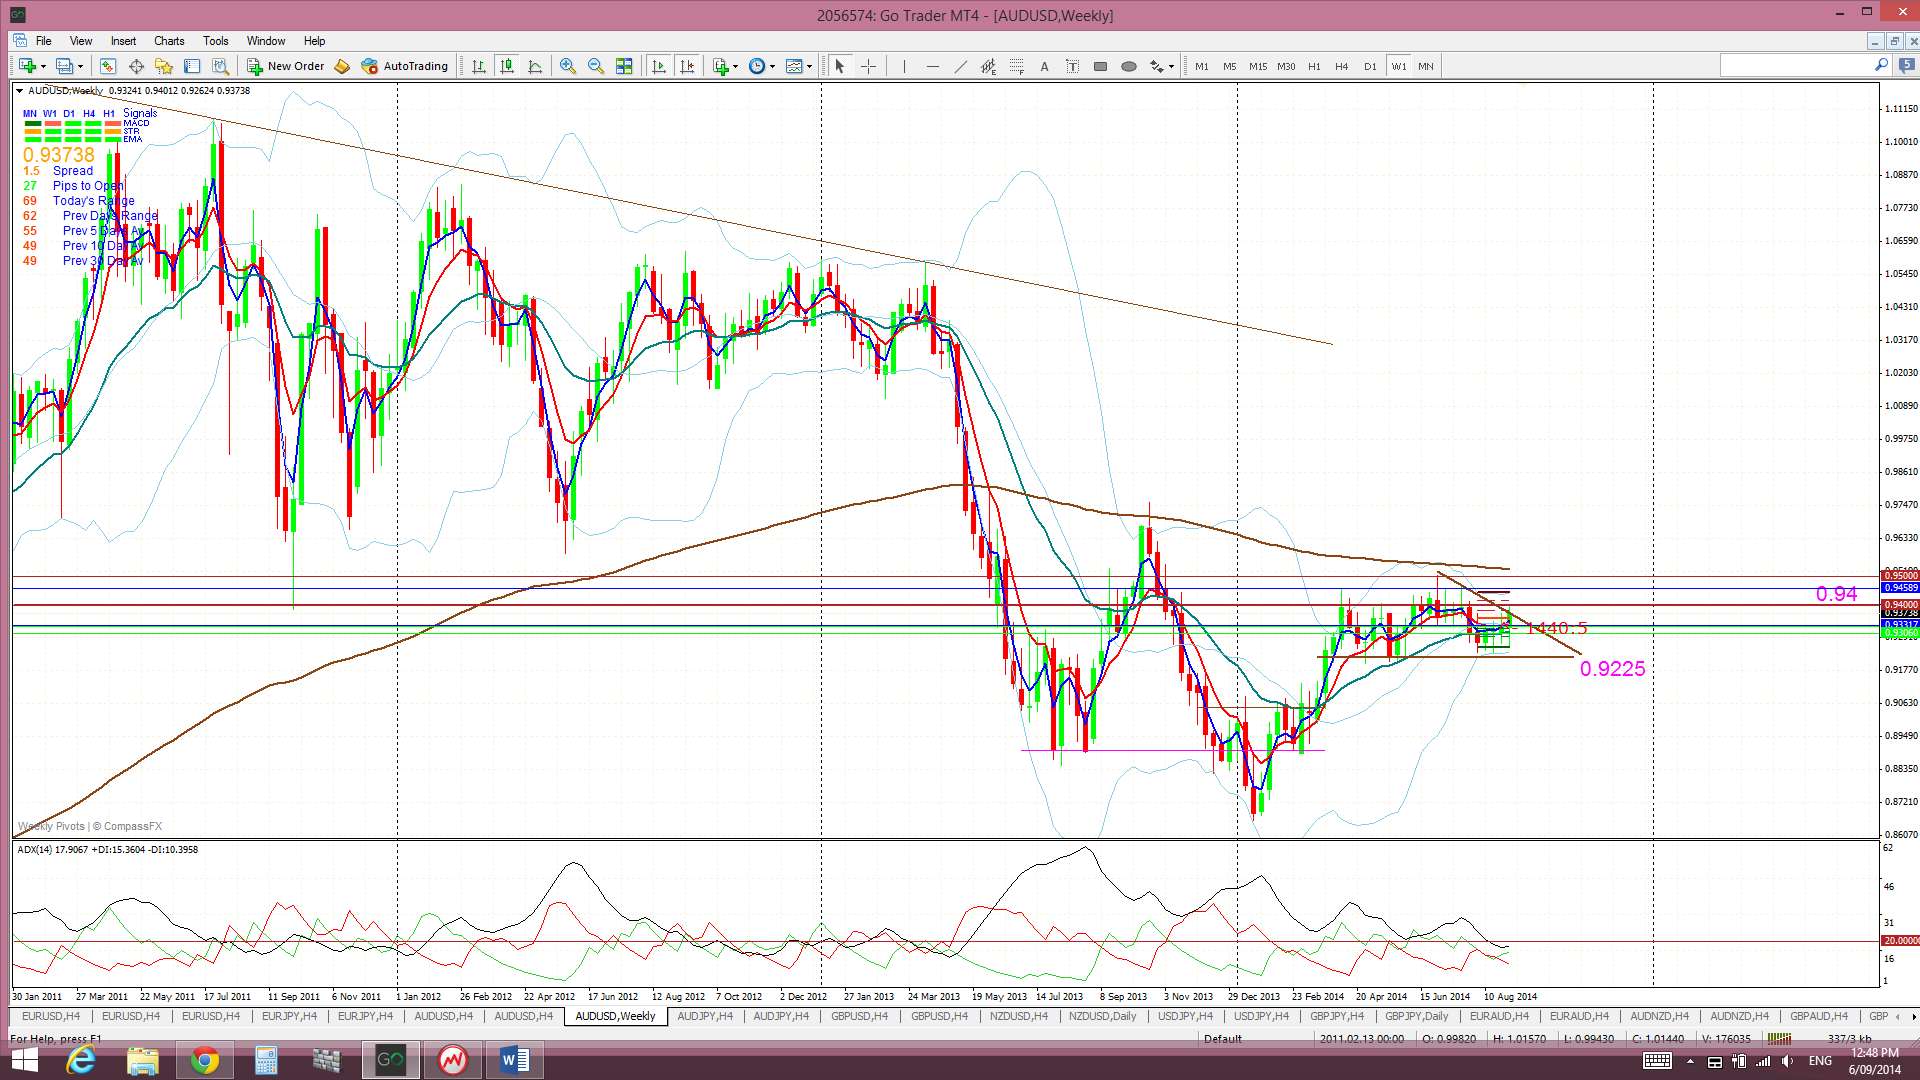
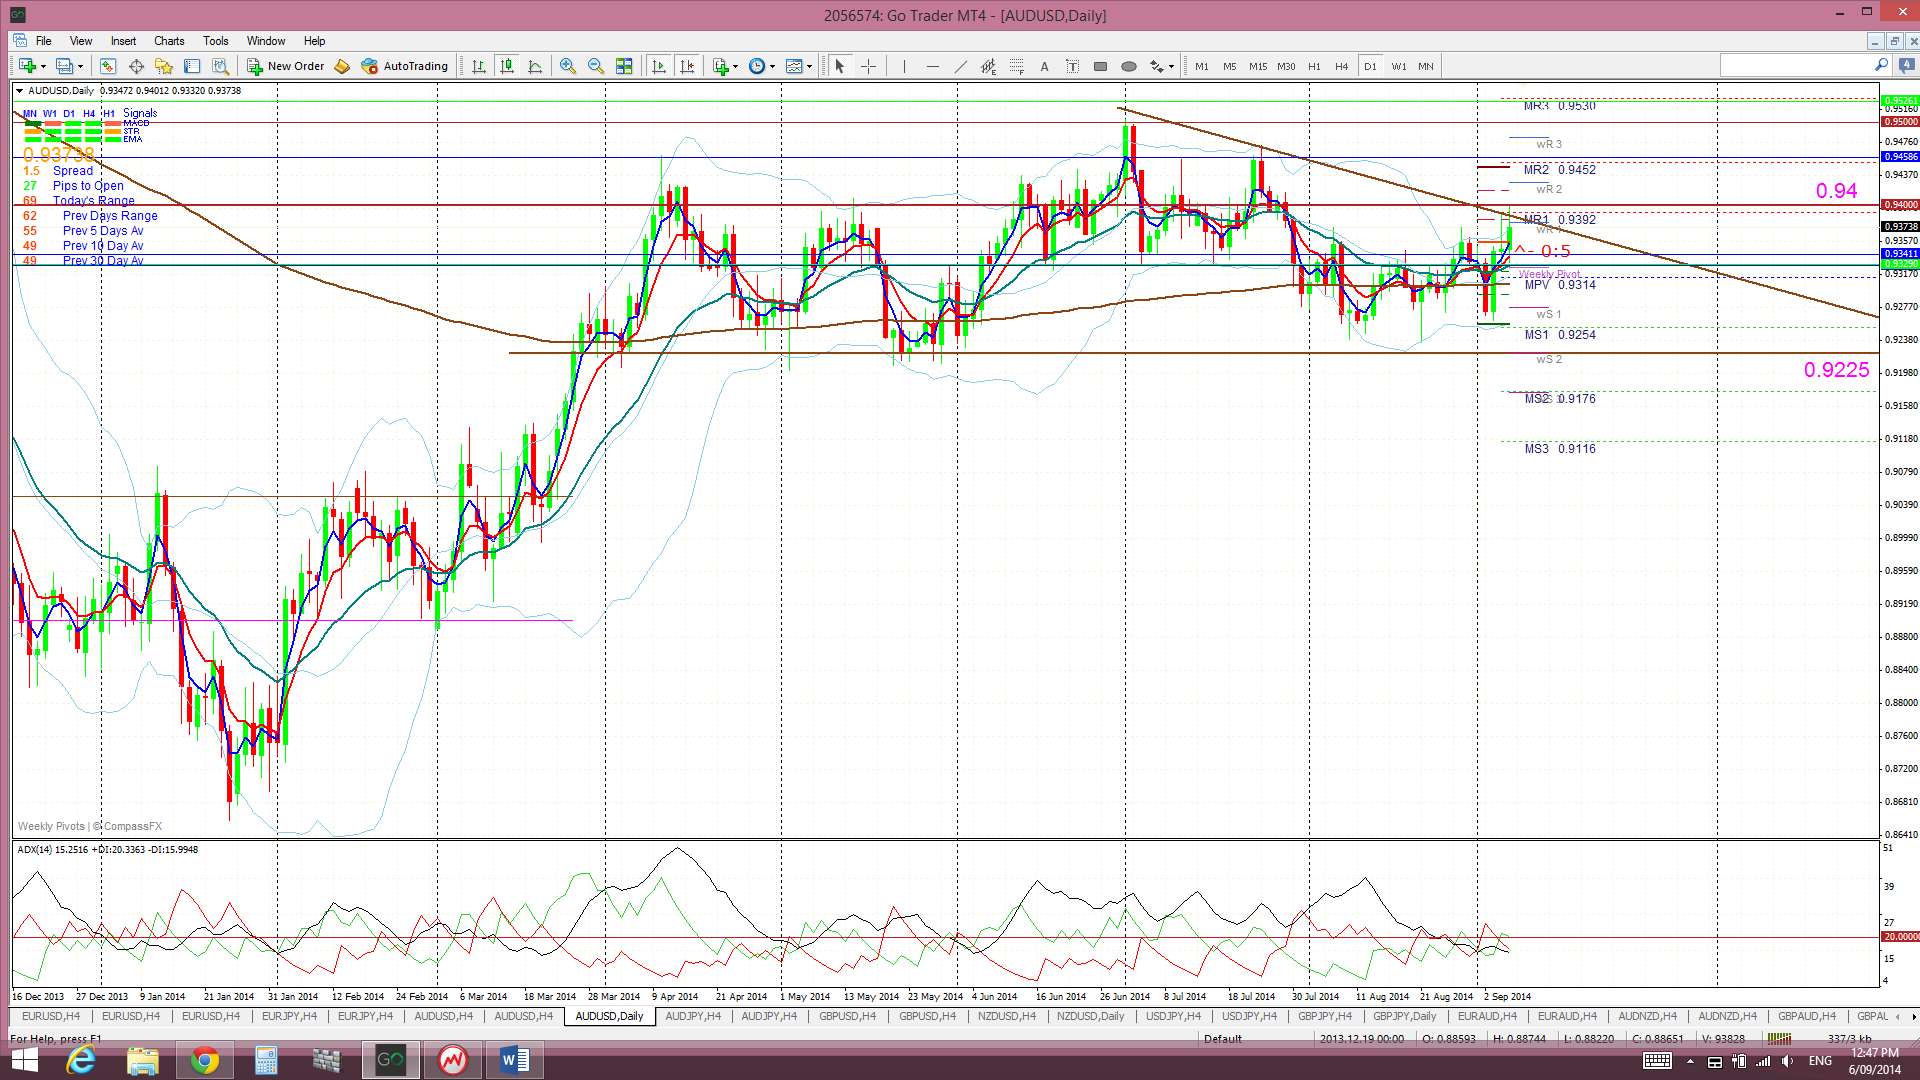
A/U: In much the same way as the E/J, I have been struggling to ‘read’ this pair. However, the A/U now also looks to have formed up into a technical pattern on the daily chart. I’m seeing a descending triangle pattern and I wrote a separate article about this last Wednesday which can be found through this link.
The daily chart shows how the A/U tested this upper triangle trend line and the 0.94 level throughout Friday’s trade.
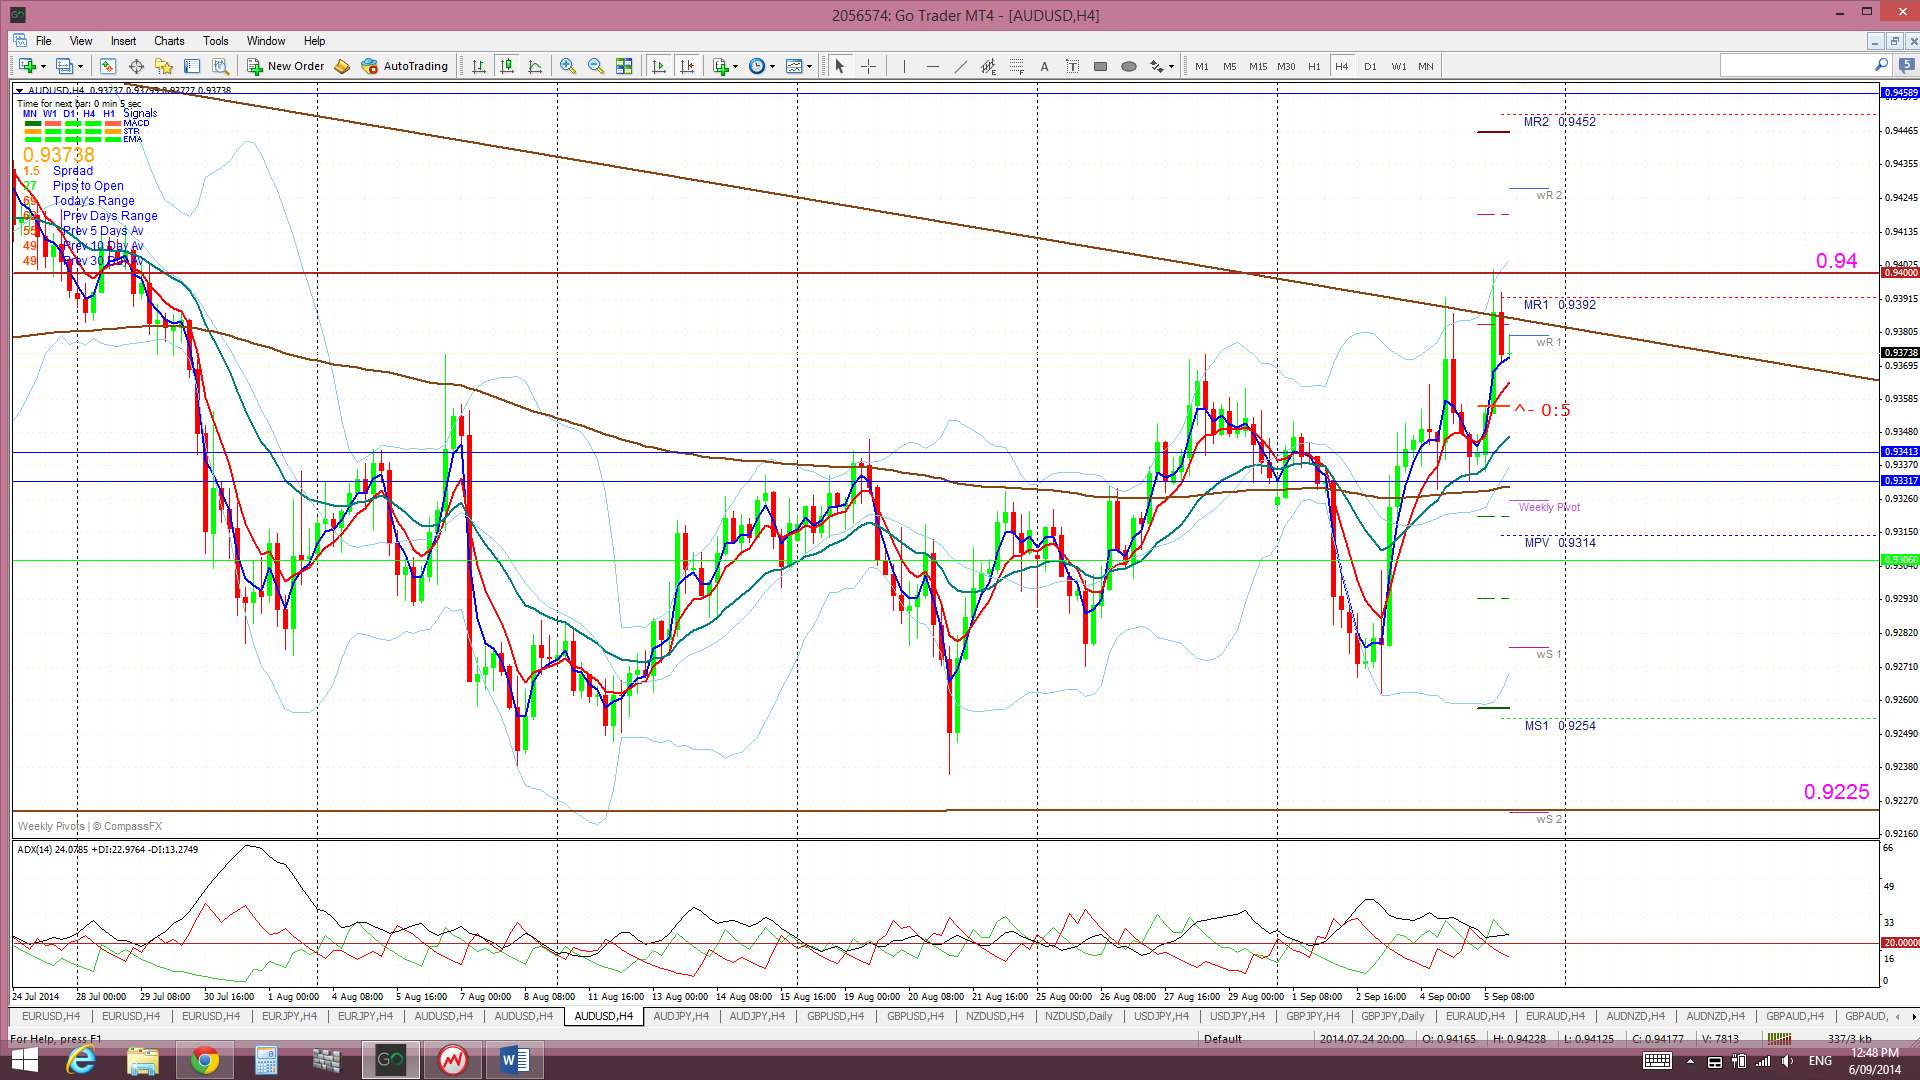
Price is still trading above the Cloud on the 4hr chart, below the Cloud on the daily chart and in the middle of the Cloud on the weekly and monthly charts.
The weekly candle closed as a small bullish candle.
- I’m watching for any new TC signal on this pair, the triangle trend lines & the 0.94 level.
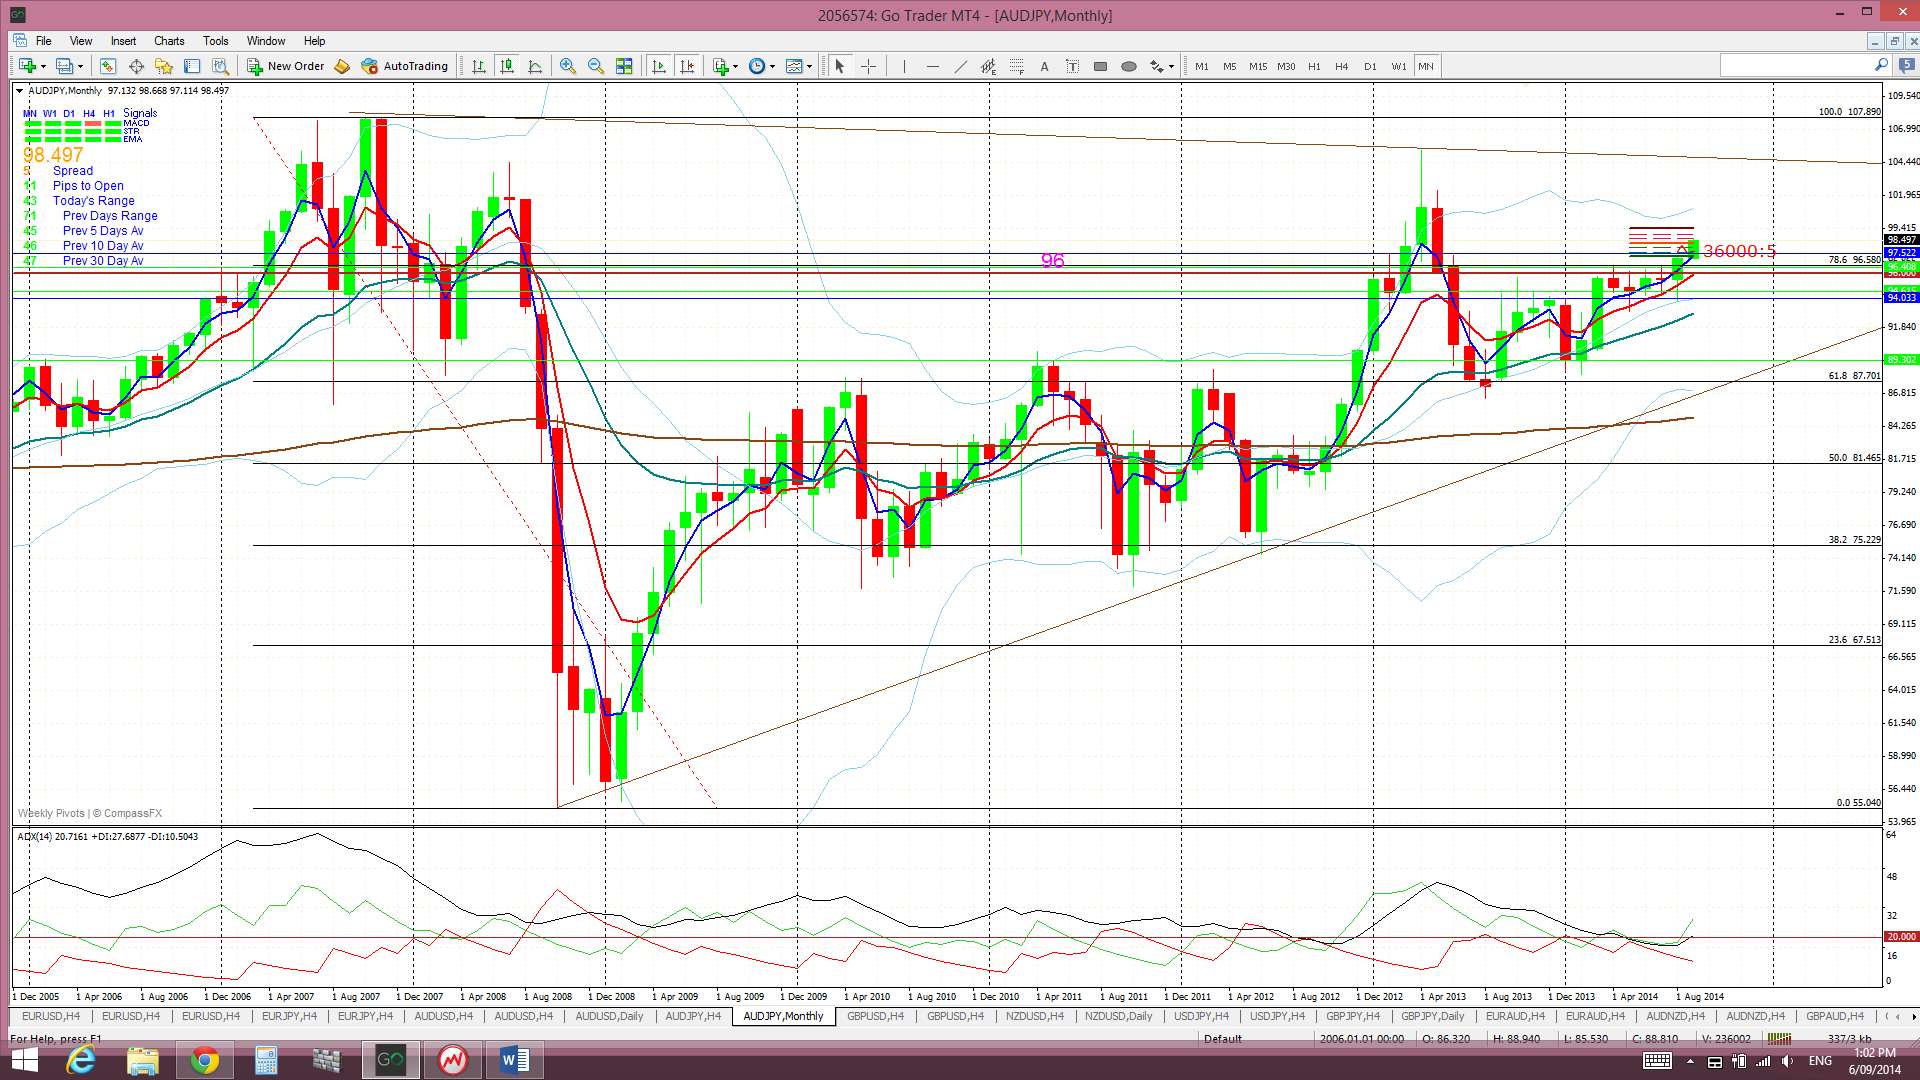
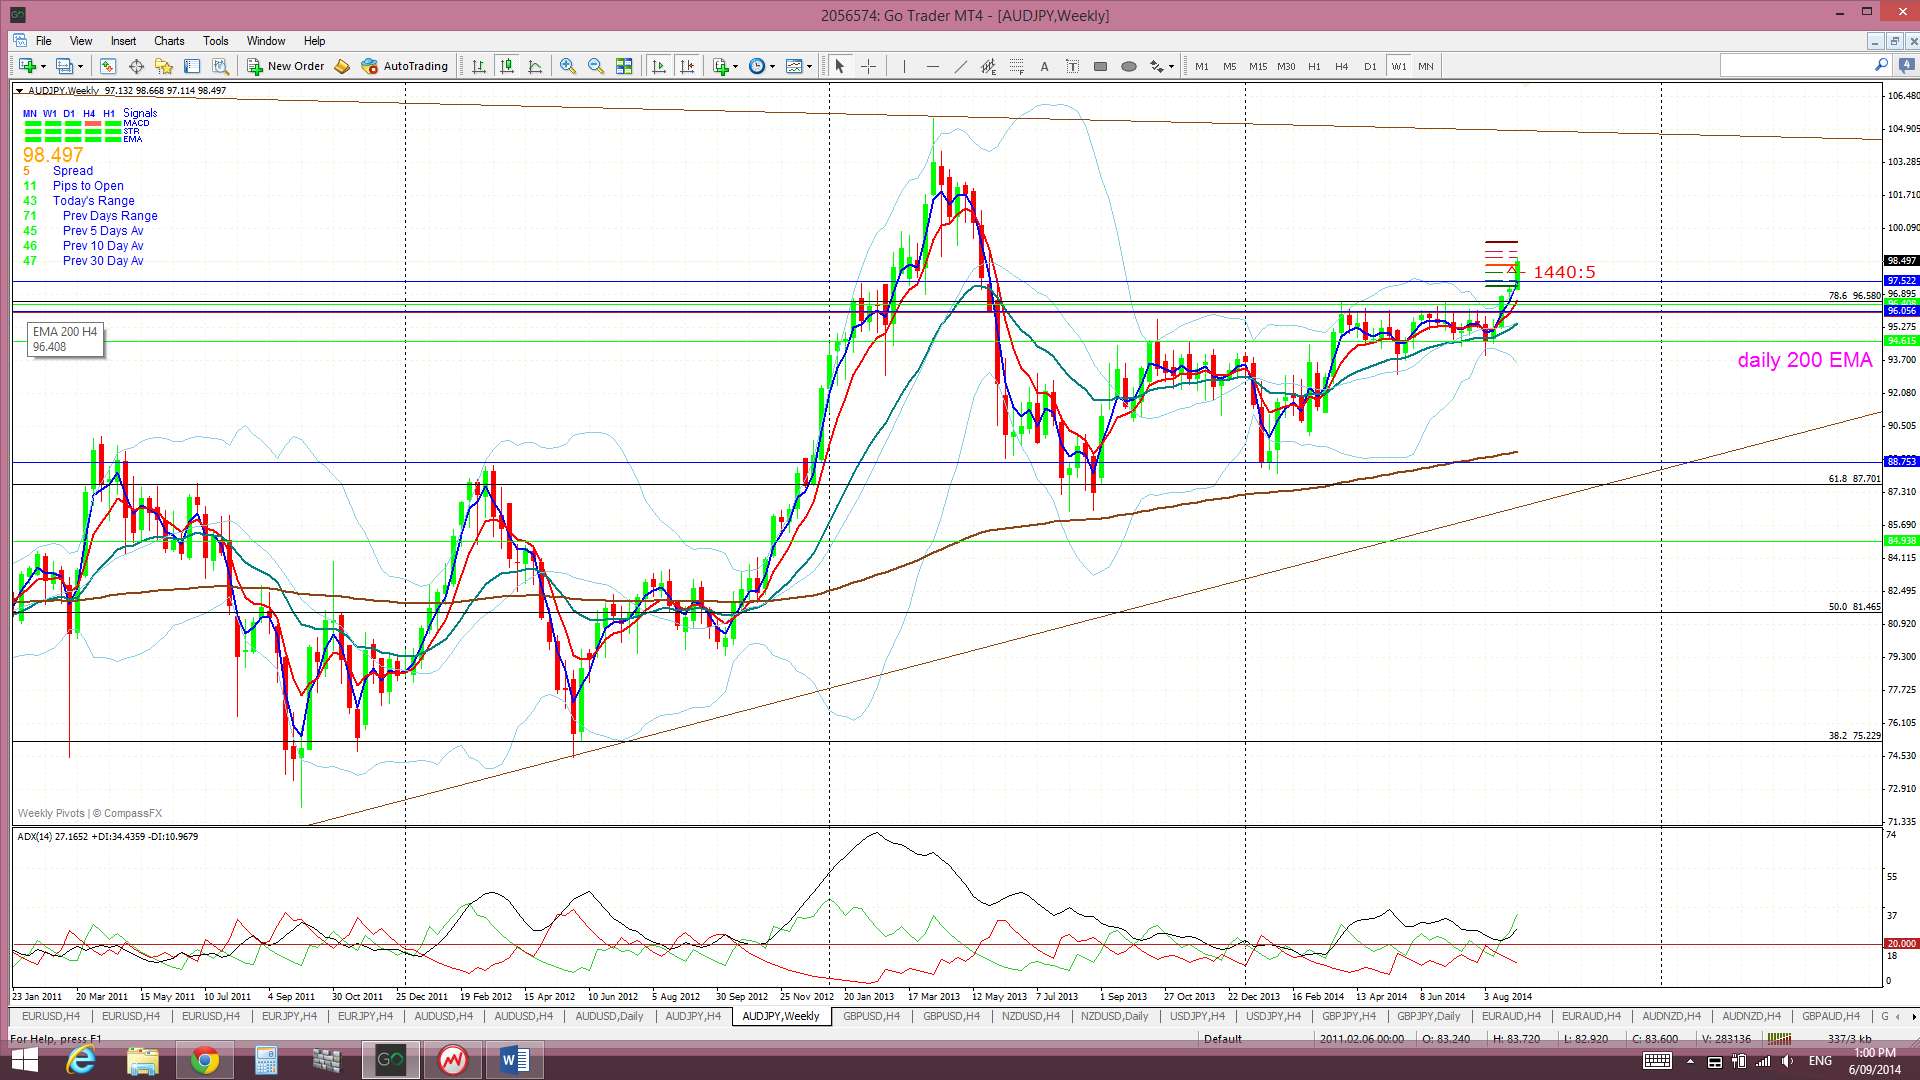
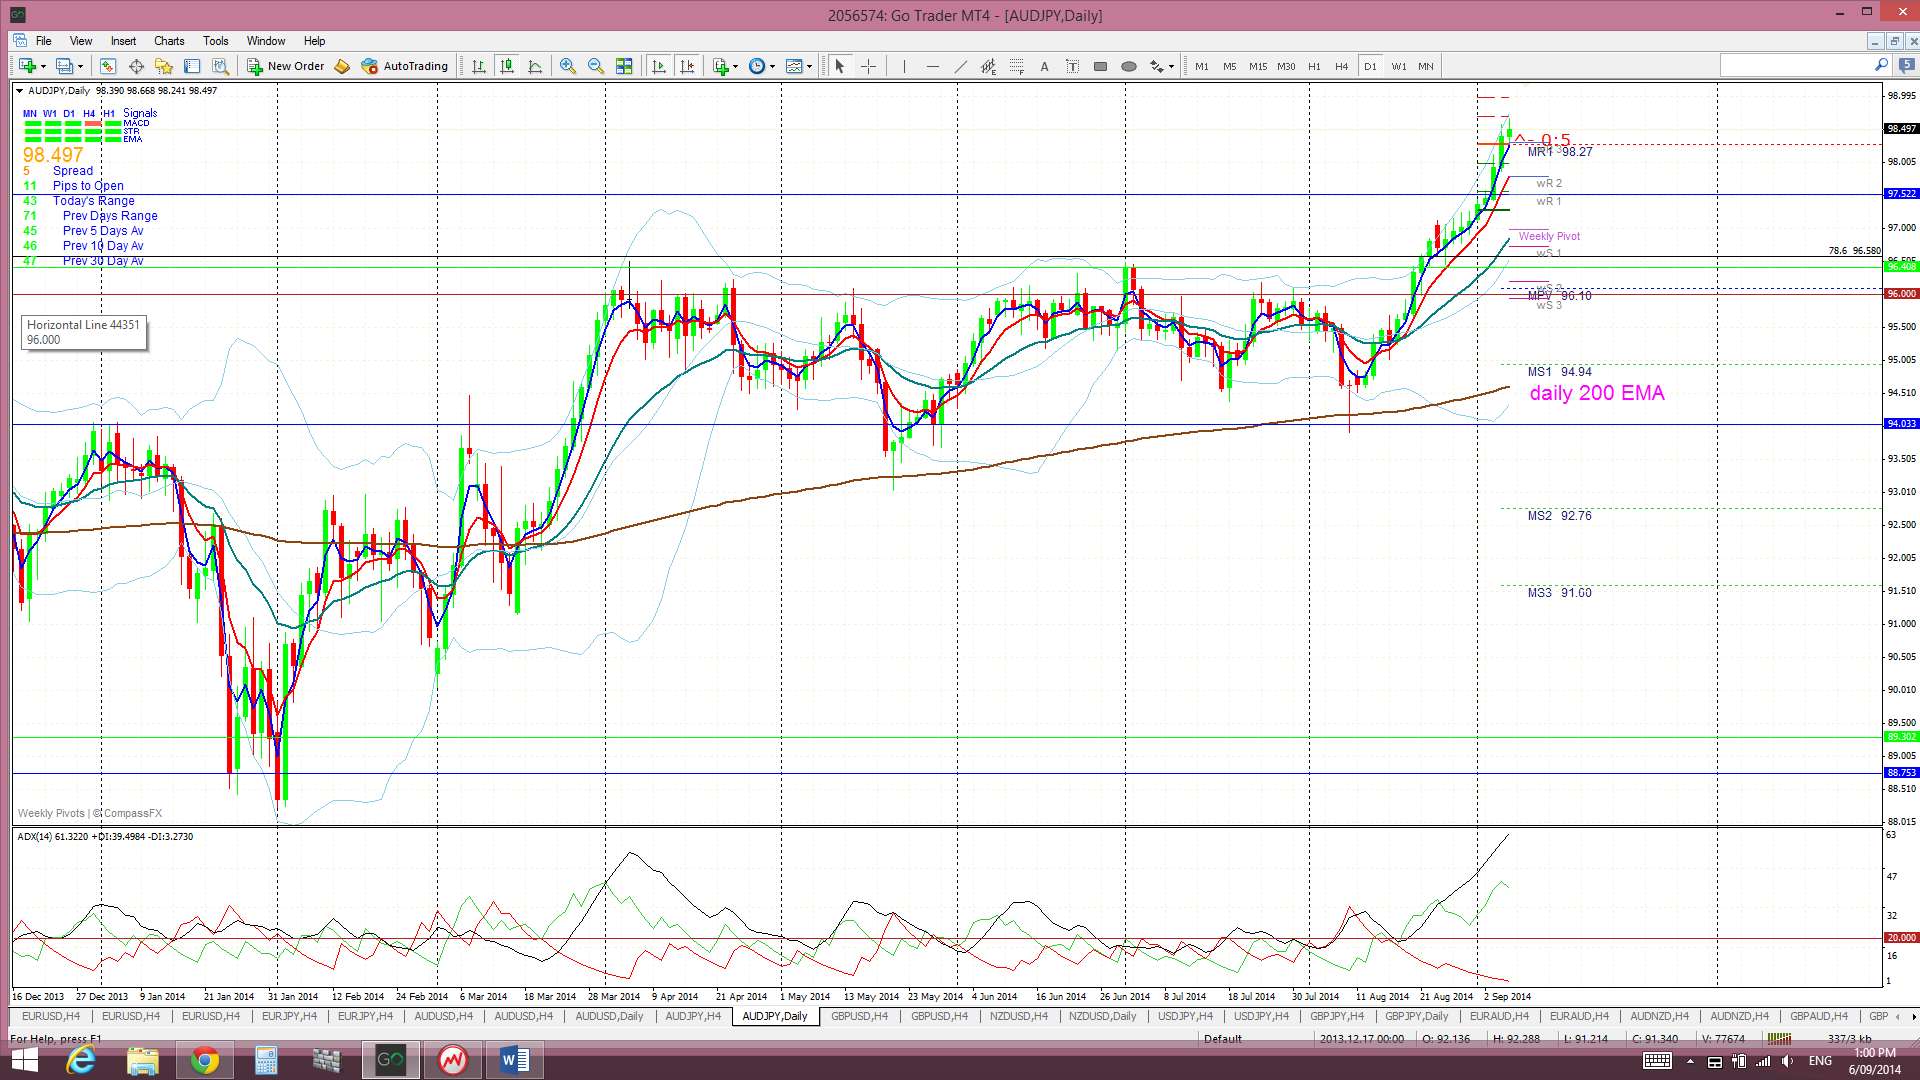
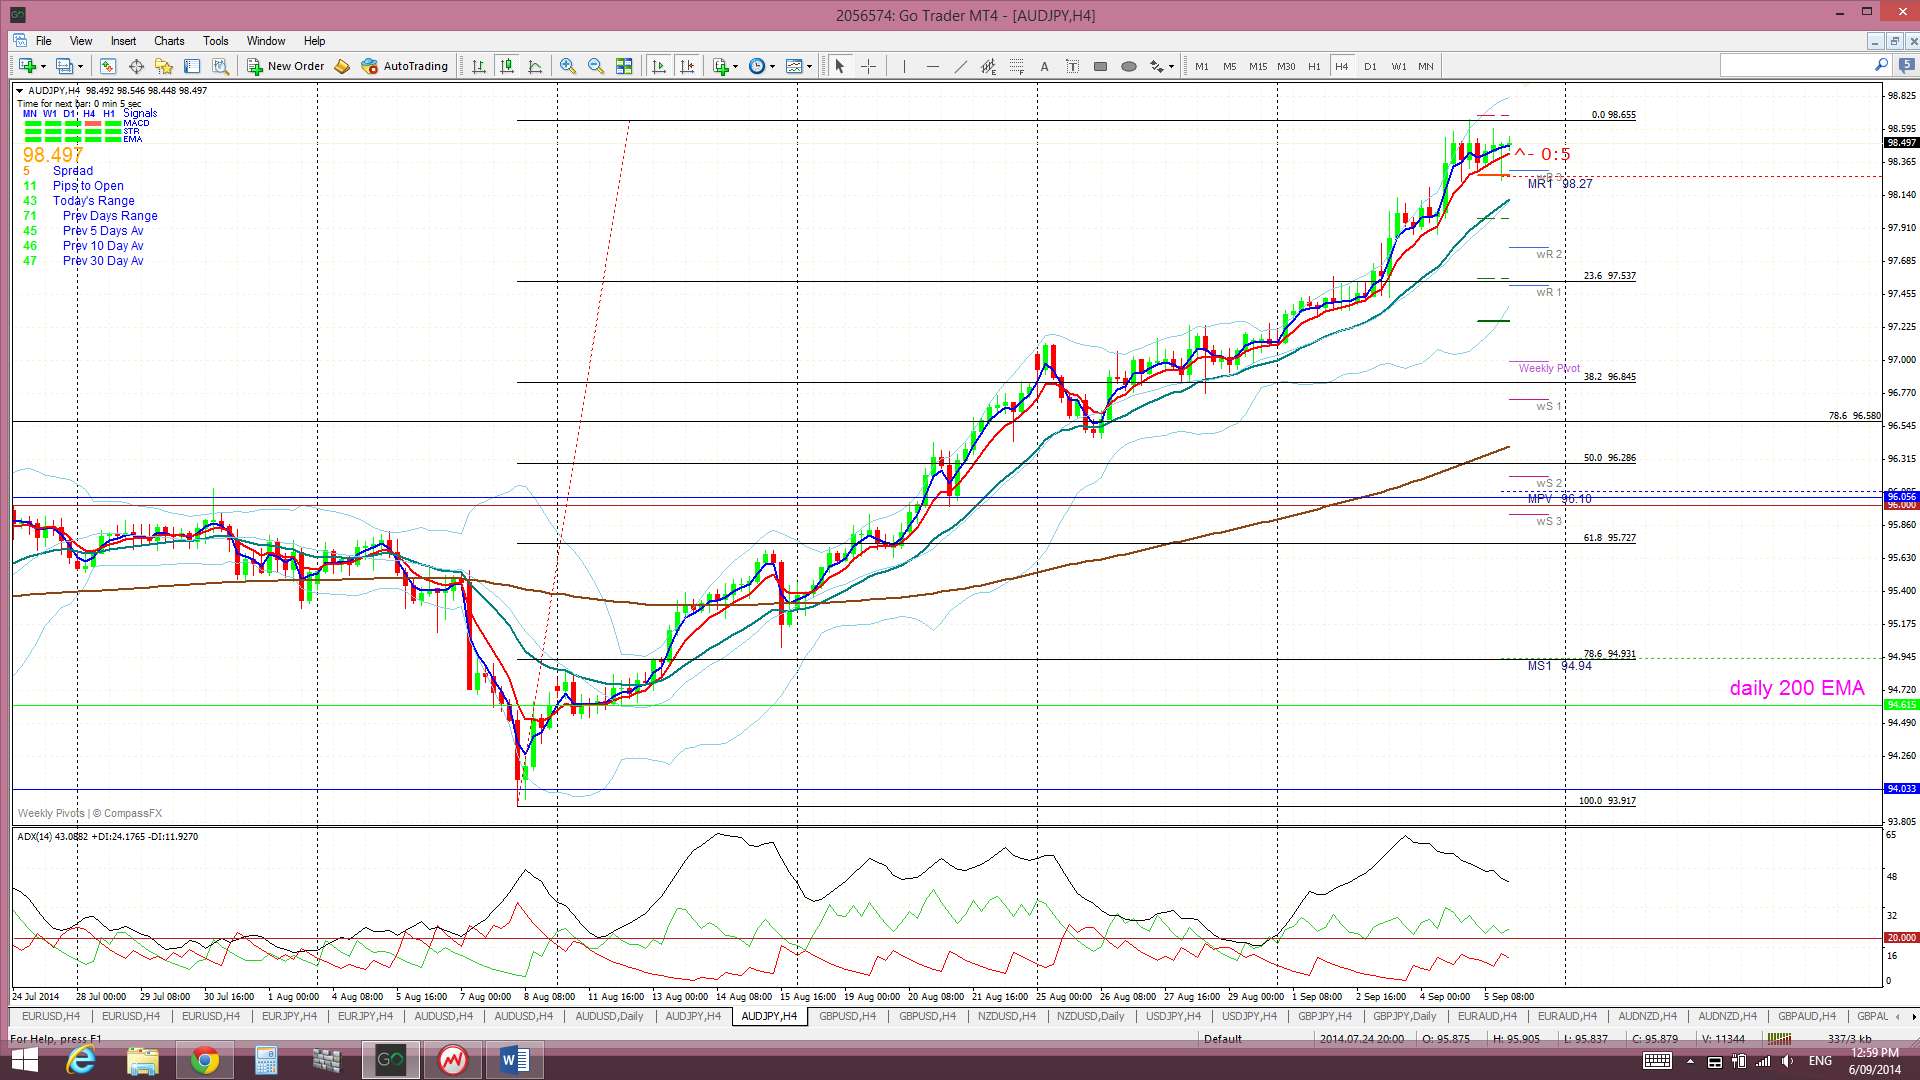
A/J: The A/J hasn’t really looked back since breaking up above the key 96 S/R level. The second weekly close above this level is quite bullish and the monthly chart reveals the significance of this 96 level.
However,given that this 96 level is so significant I would not be surprised to this level tested again, even if there is to be long term bullish continuation. Applying fib levels on the 4hr chart to the recent bull move shows that the 96 level falls right between the 50% and 61.8% fib levels and, thus, is added confluence to target this level for any possible pull back. As with the E/J, an A/J pull back could be assisted by any weakness and pull back on the U/J and this is a distinct possibility given the weaker than expected NFP result.
Price is still trading above the Cloud on the 4hr, daily, weekly and monthly charts which is bullish.
The weekly candle closed as a bullish candle.
- I’m watching for any new TC signal on this pair and the 96 level.
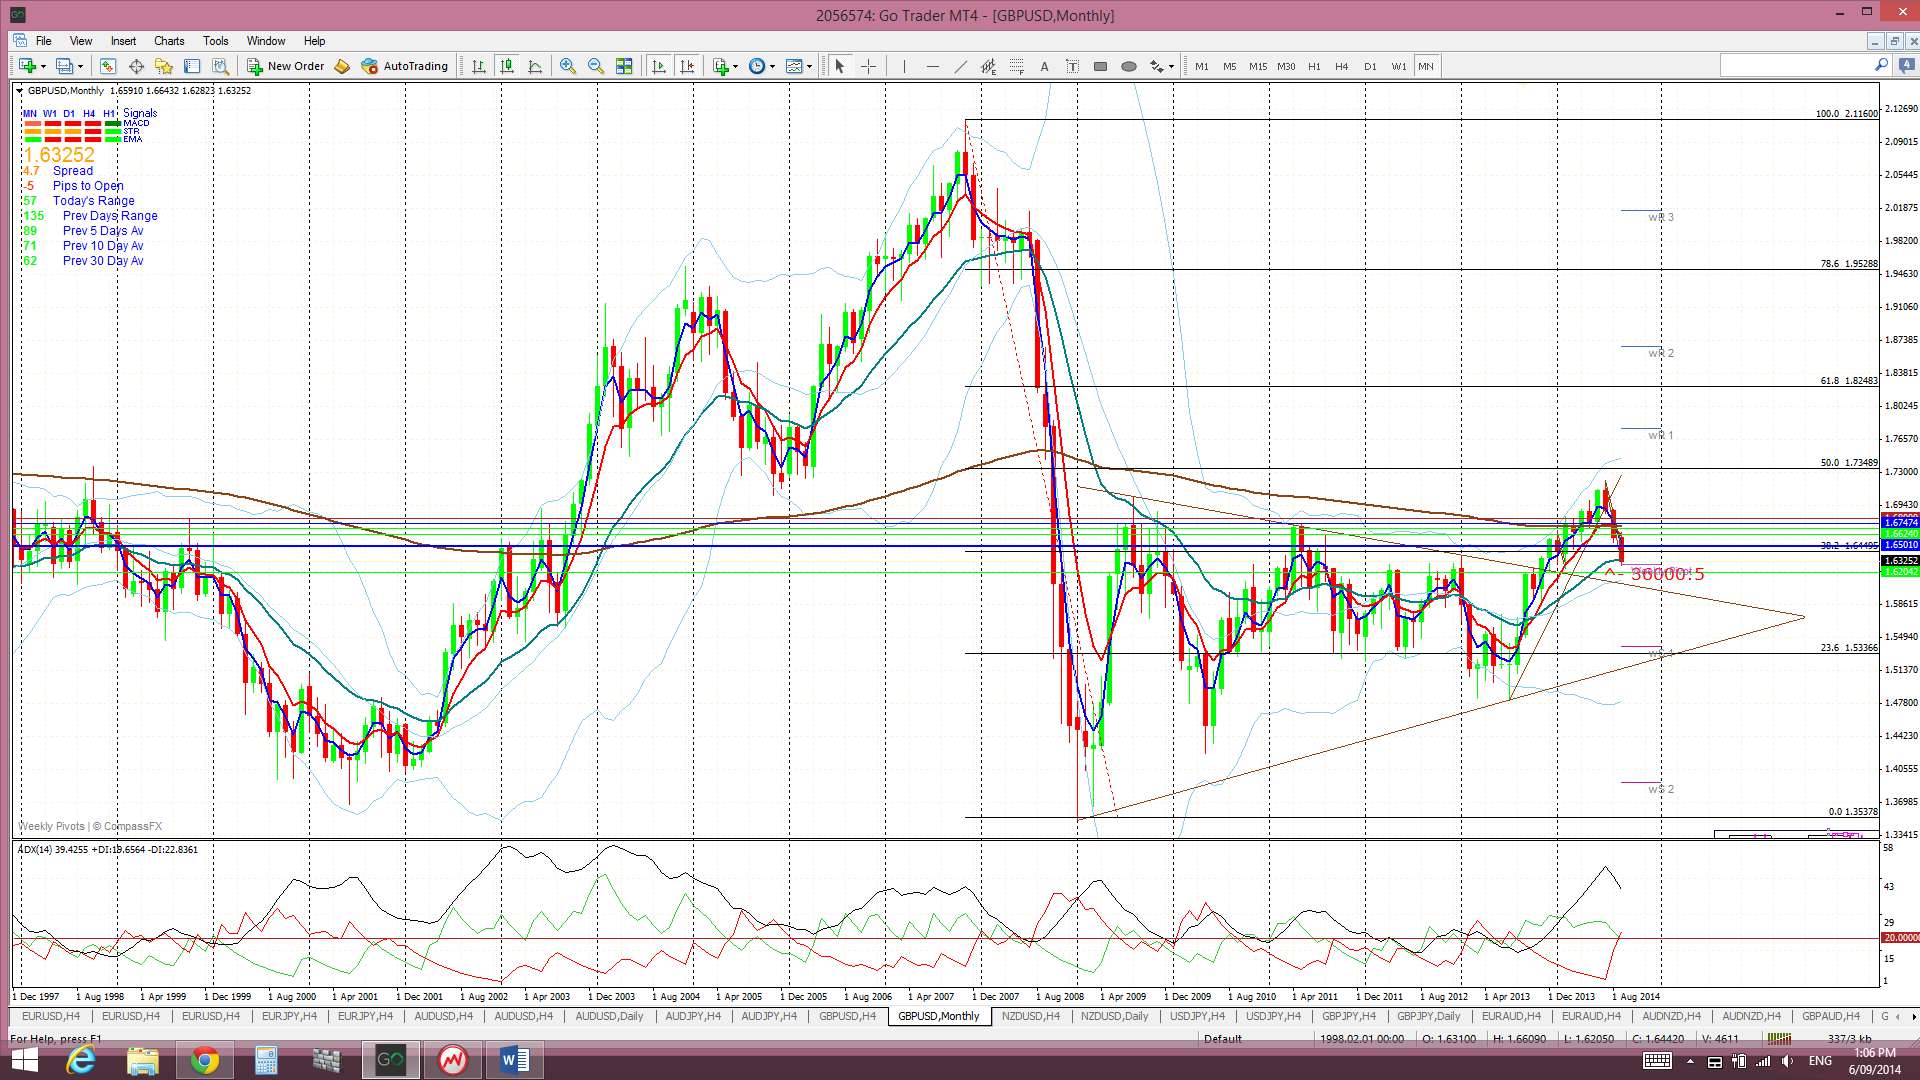
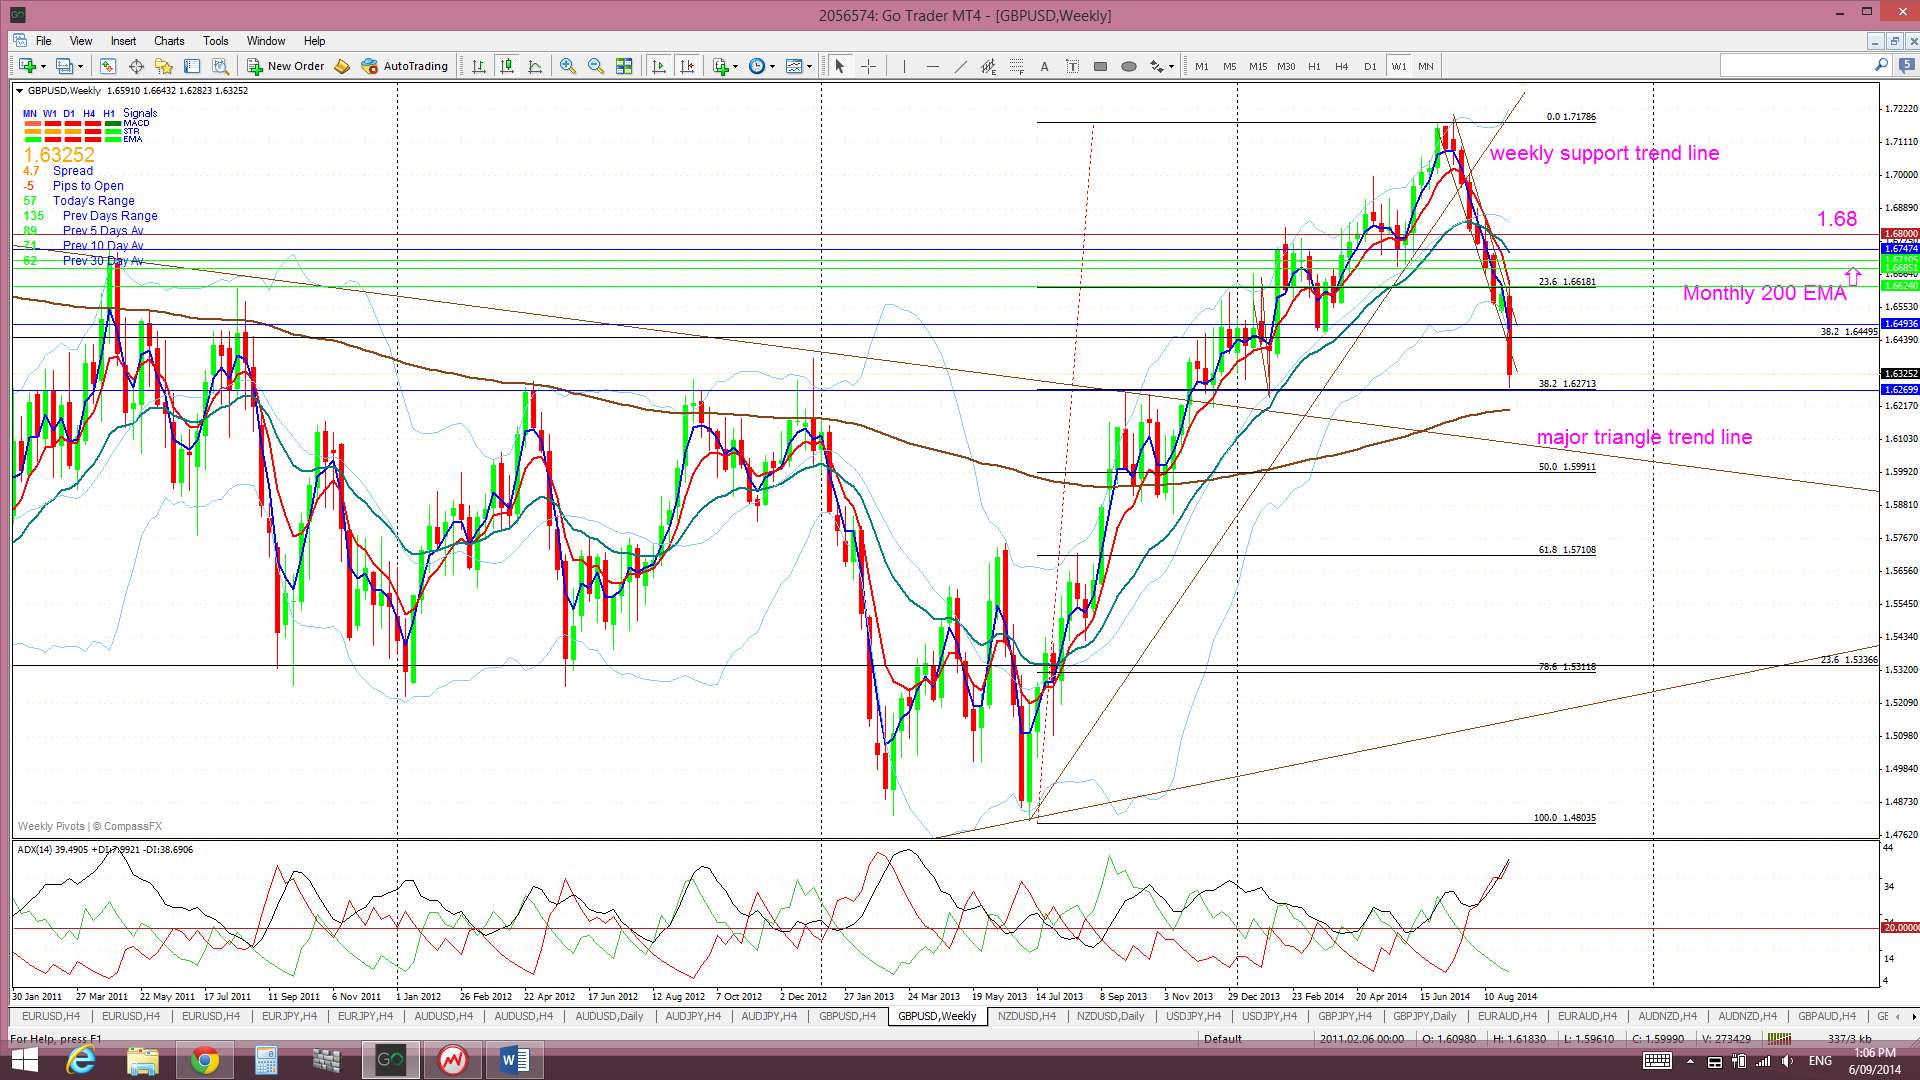
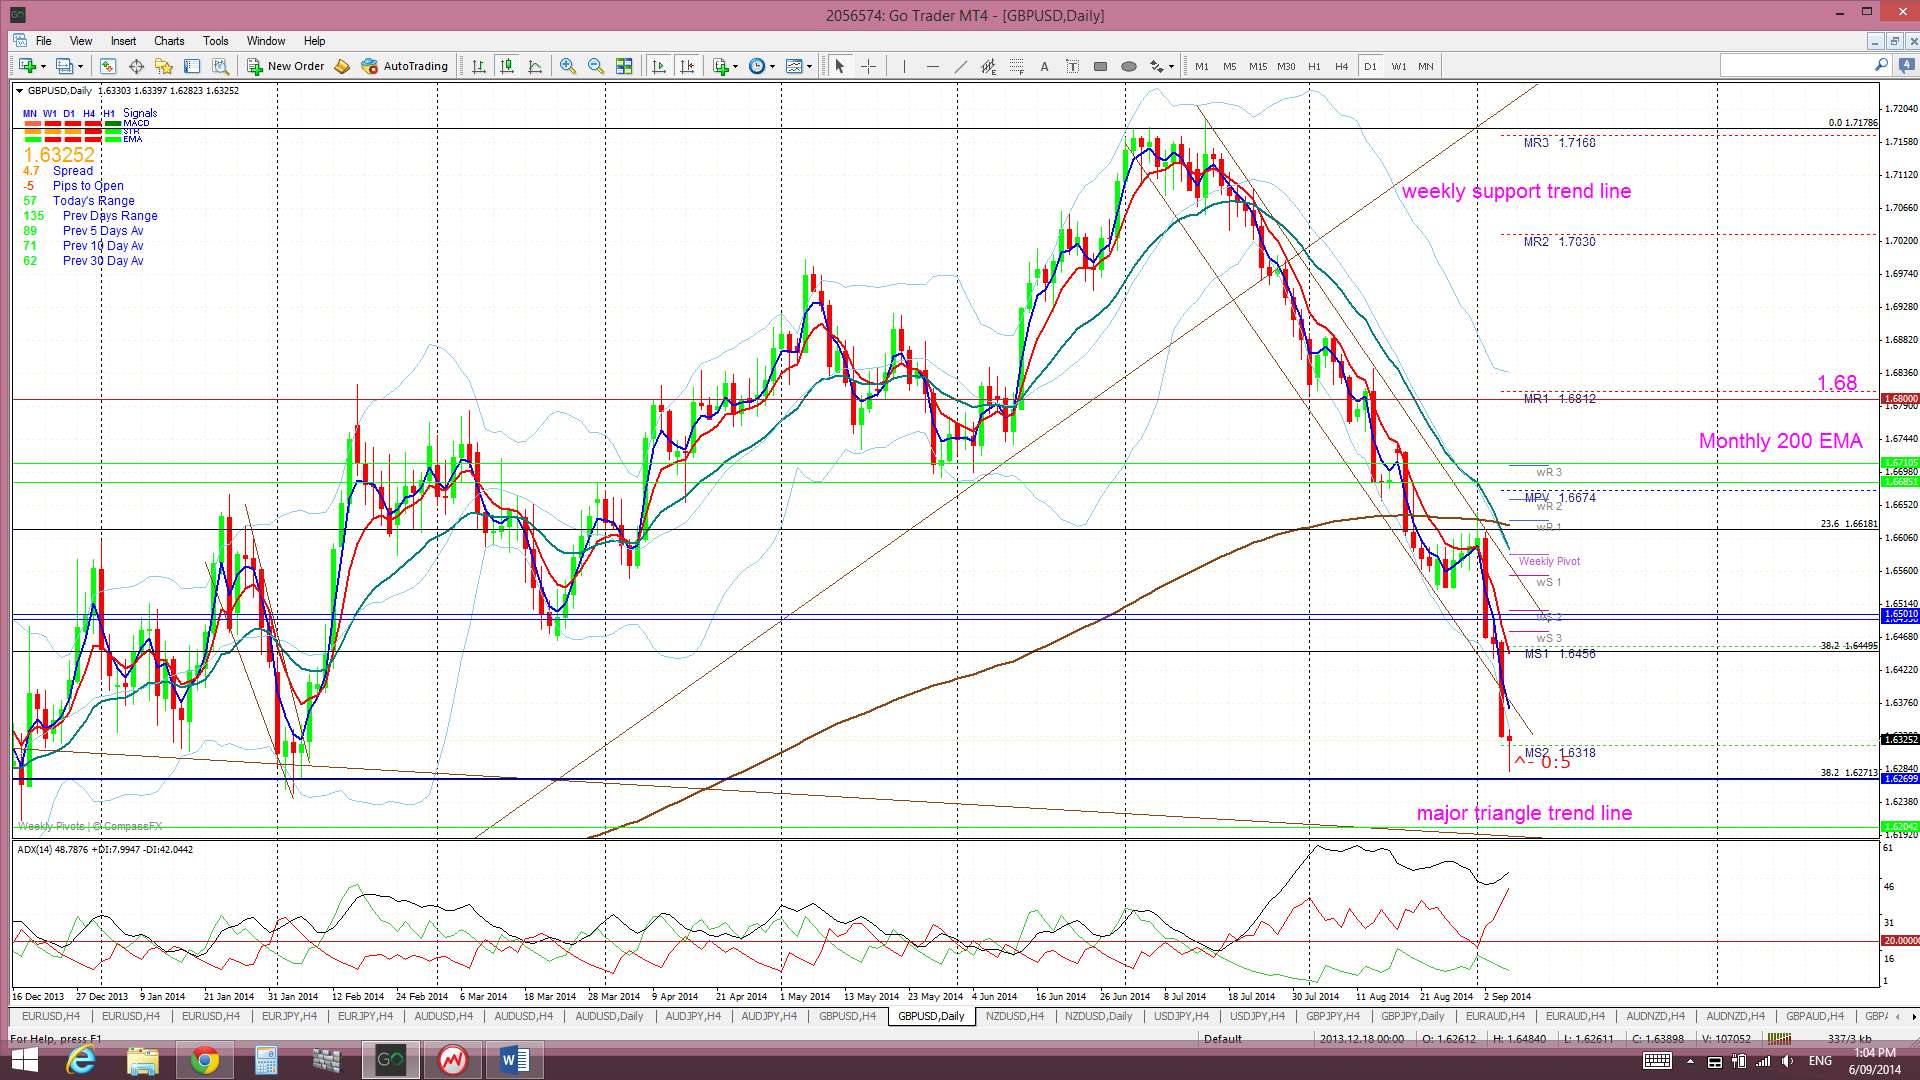
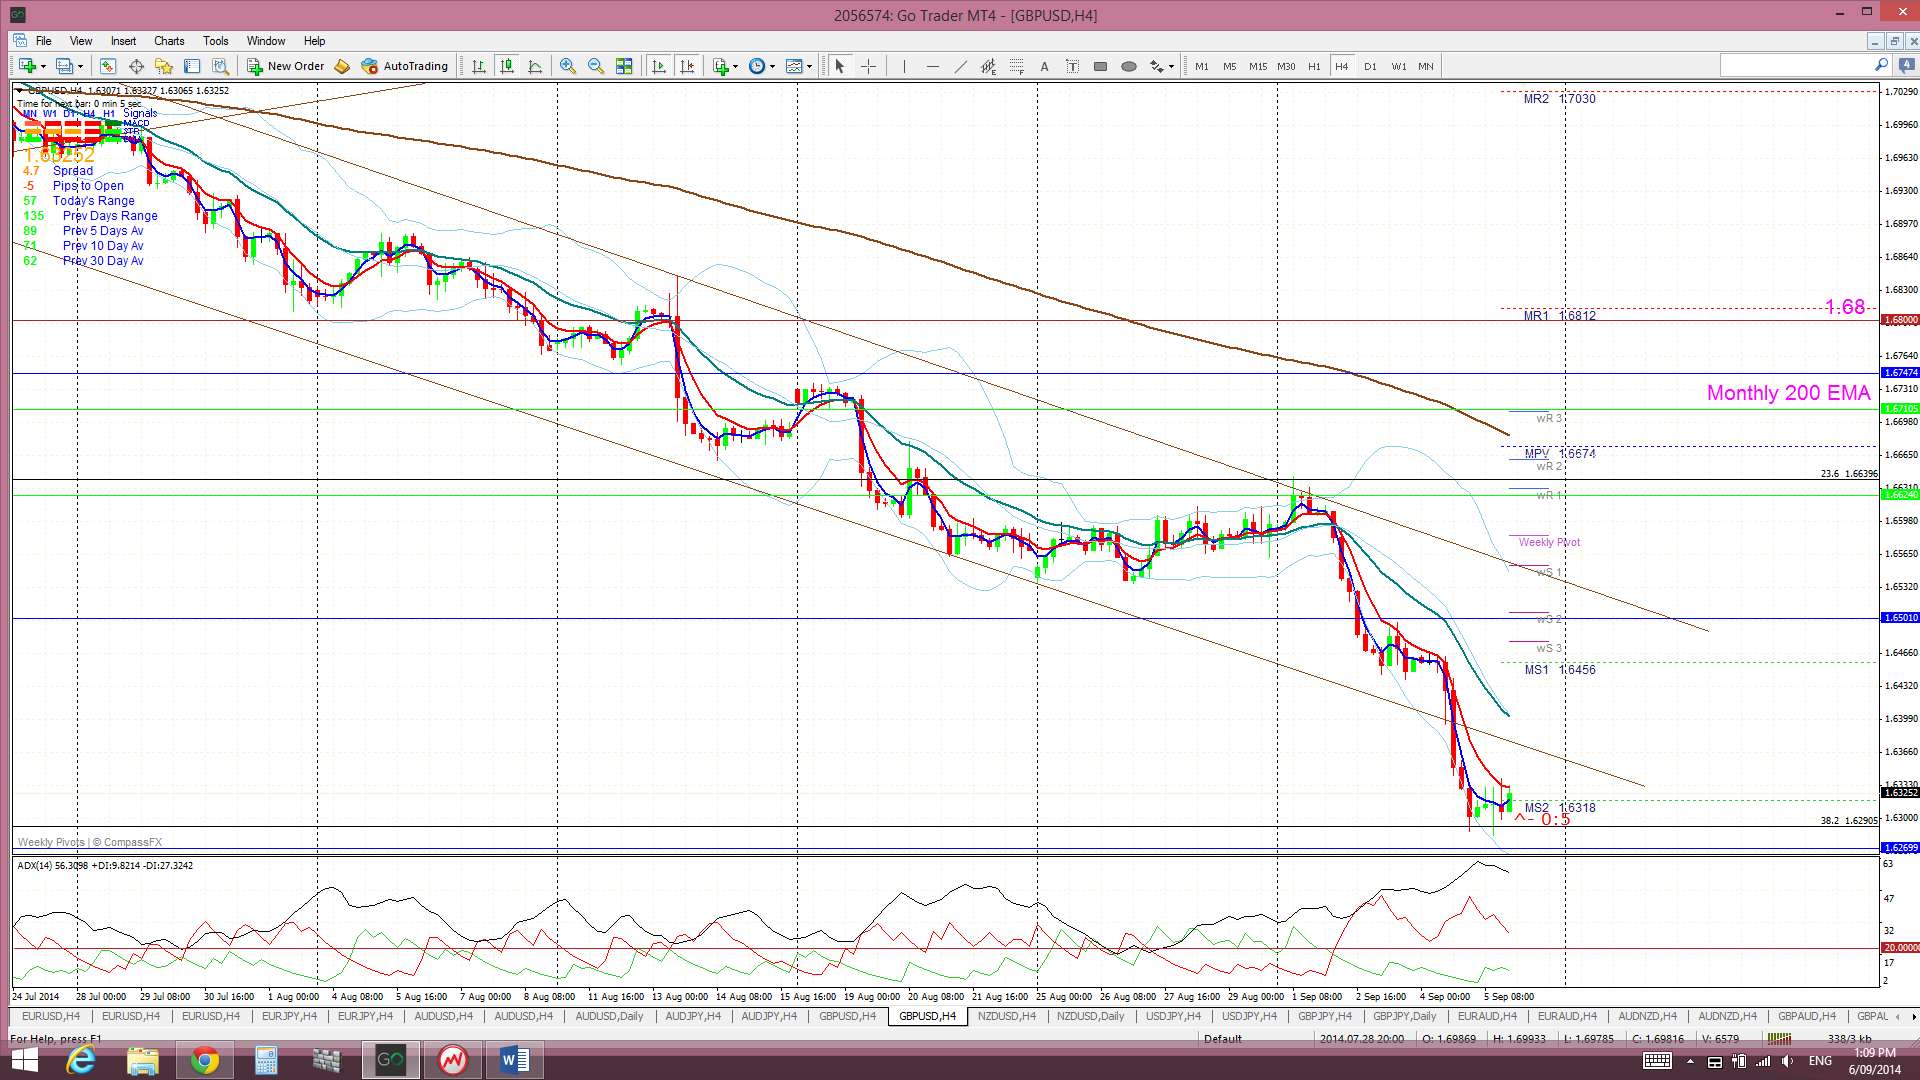
GBP/USD: The Cable tried to make a bullish breakout from the descending trading channel earlier in the week but this effort failed. It then resumed its channel trading until Thursday when it made a bearish breakdown from this pattern. It finished for the week sitting just above the 38.2% fib of the recent bull move.
Although there was some positive GBP data released last week this latest GBP weakness seems to be stemming from the Scottish referendum situation. The Scottish Independence vote is not until Sept 19th and, thus, we may see this weakness and/or choppiness persist a bit longer.
The bearish breakdown from the trading channel suggests further falls here and, given that it is almost 2 weeks until the Independence vote, there might be time and room for the Cable to fall further. Possible bearish targets still include:
- The weekly 200 EMA, just below the 38.2 % fib of the recent bull move (near 1.62).
- The monthly chart’s previously broken trend line (near 1.60). This is also the 50% fib of the recent bull move. When you look at the monthly chart it seems entirely reasonable that the Cable would pull back to at least test this triangle trend line. This trend line had been in effect for the best part of 5 years and, thus, was very significant and worthy of testing.
Bullish targets for any return back above the monthly 200 EMA: This level remains a key level to watch here and any new move back above this level would be quite bullish. It is important to remember that February was the first monthly close above this S/R level since September 2008 and, also, the highest monthly close since the bear move of 2007-2009. These were major achievements. A possible target for any continued bullish movement is best determined from the monthly chart. The 50 % fib level of the 2007-2009 bear move is up at around the 1.73 region and the 61.8 % fib is at the 1.82 region. Both of these levels might be possible profit targets. The 61.8% fib level is now about 1,900 pips away.
Price is trading below the Cloud on the 4hr and daily charts, in the top edge of the Cloud on the weekly and in the middle of the Cloud on the monthly chart.
The weekly candle closed as a large bearish, almost ‘engulfing’ candle.
- I’m watching for any new TC signal on this pair, the monthly 200 EMA and the top of the weekly Cloud.
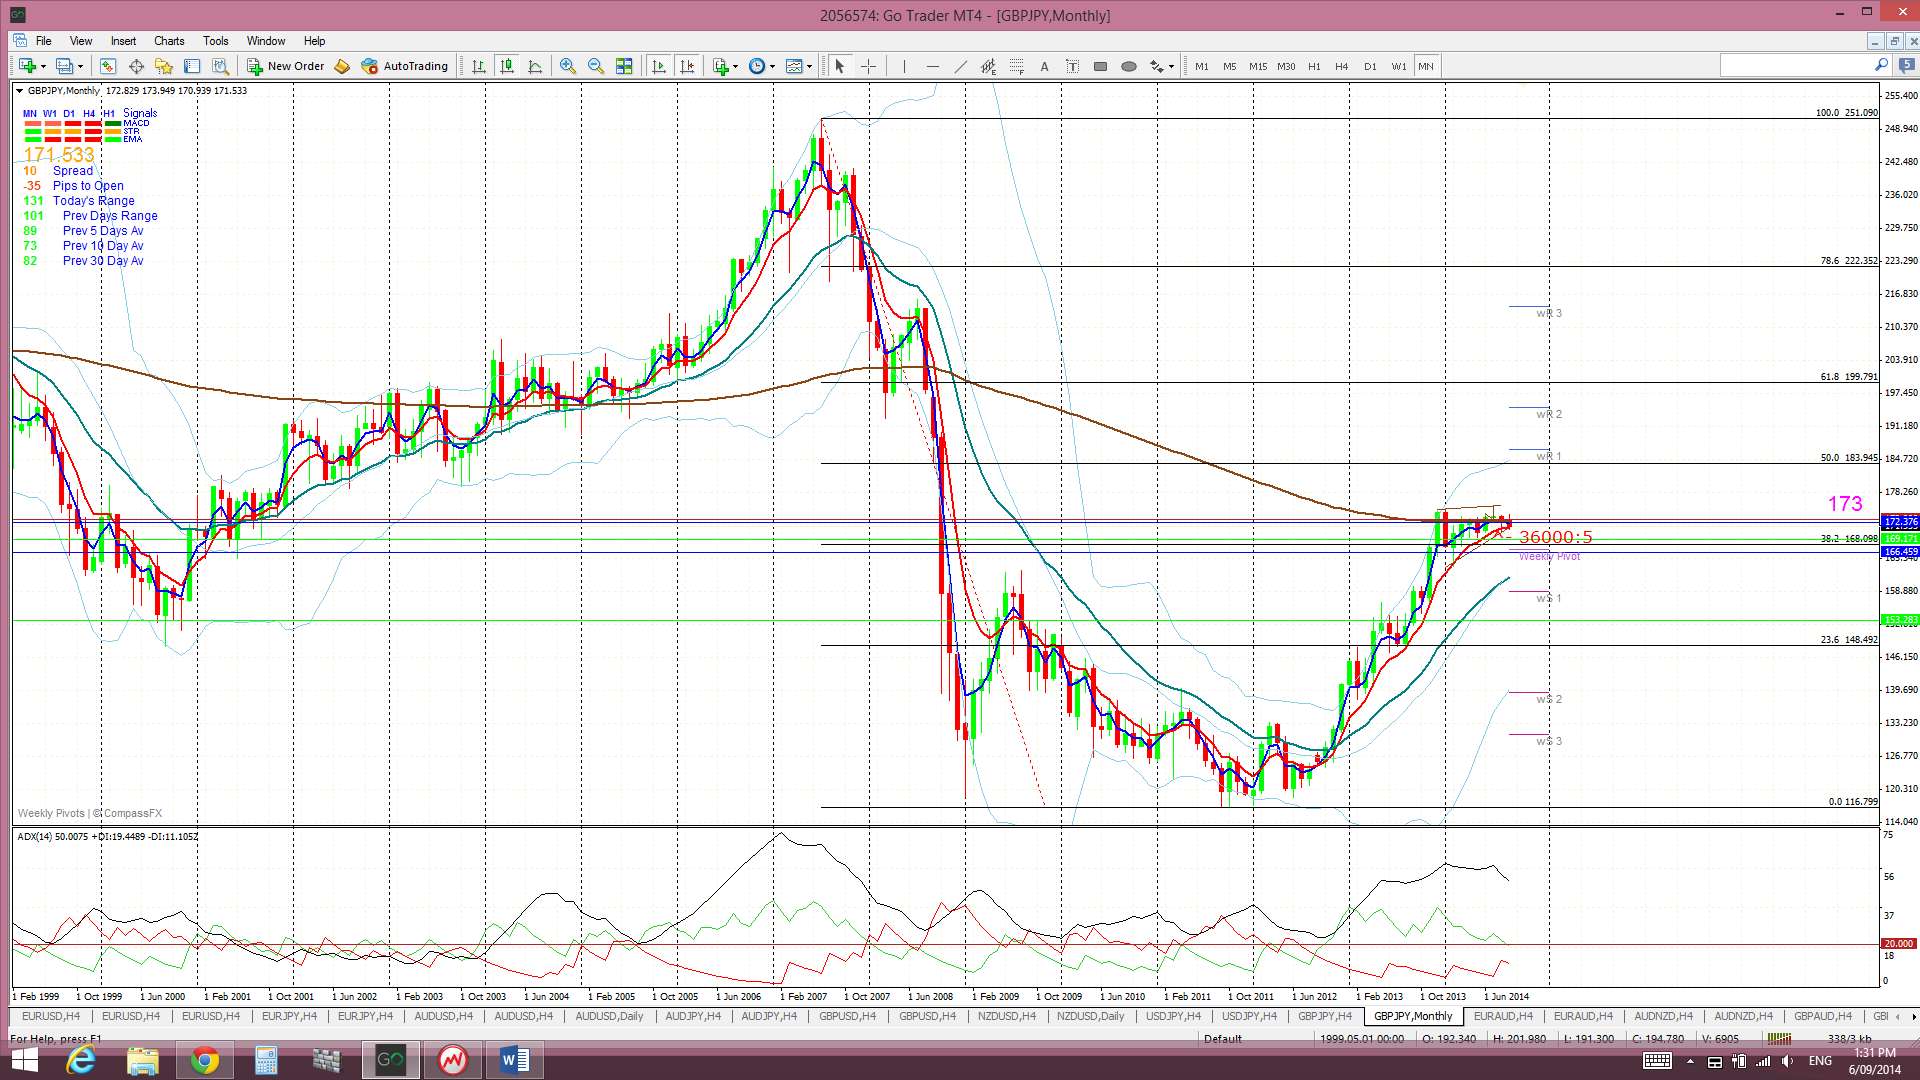
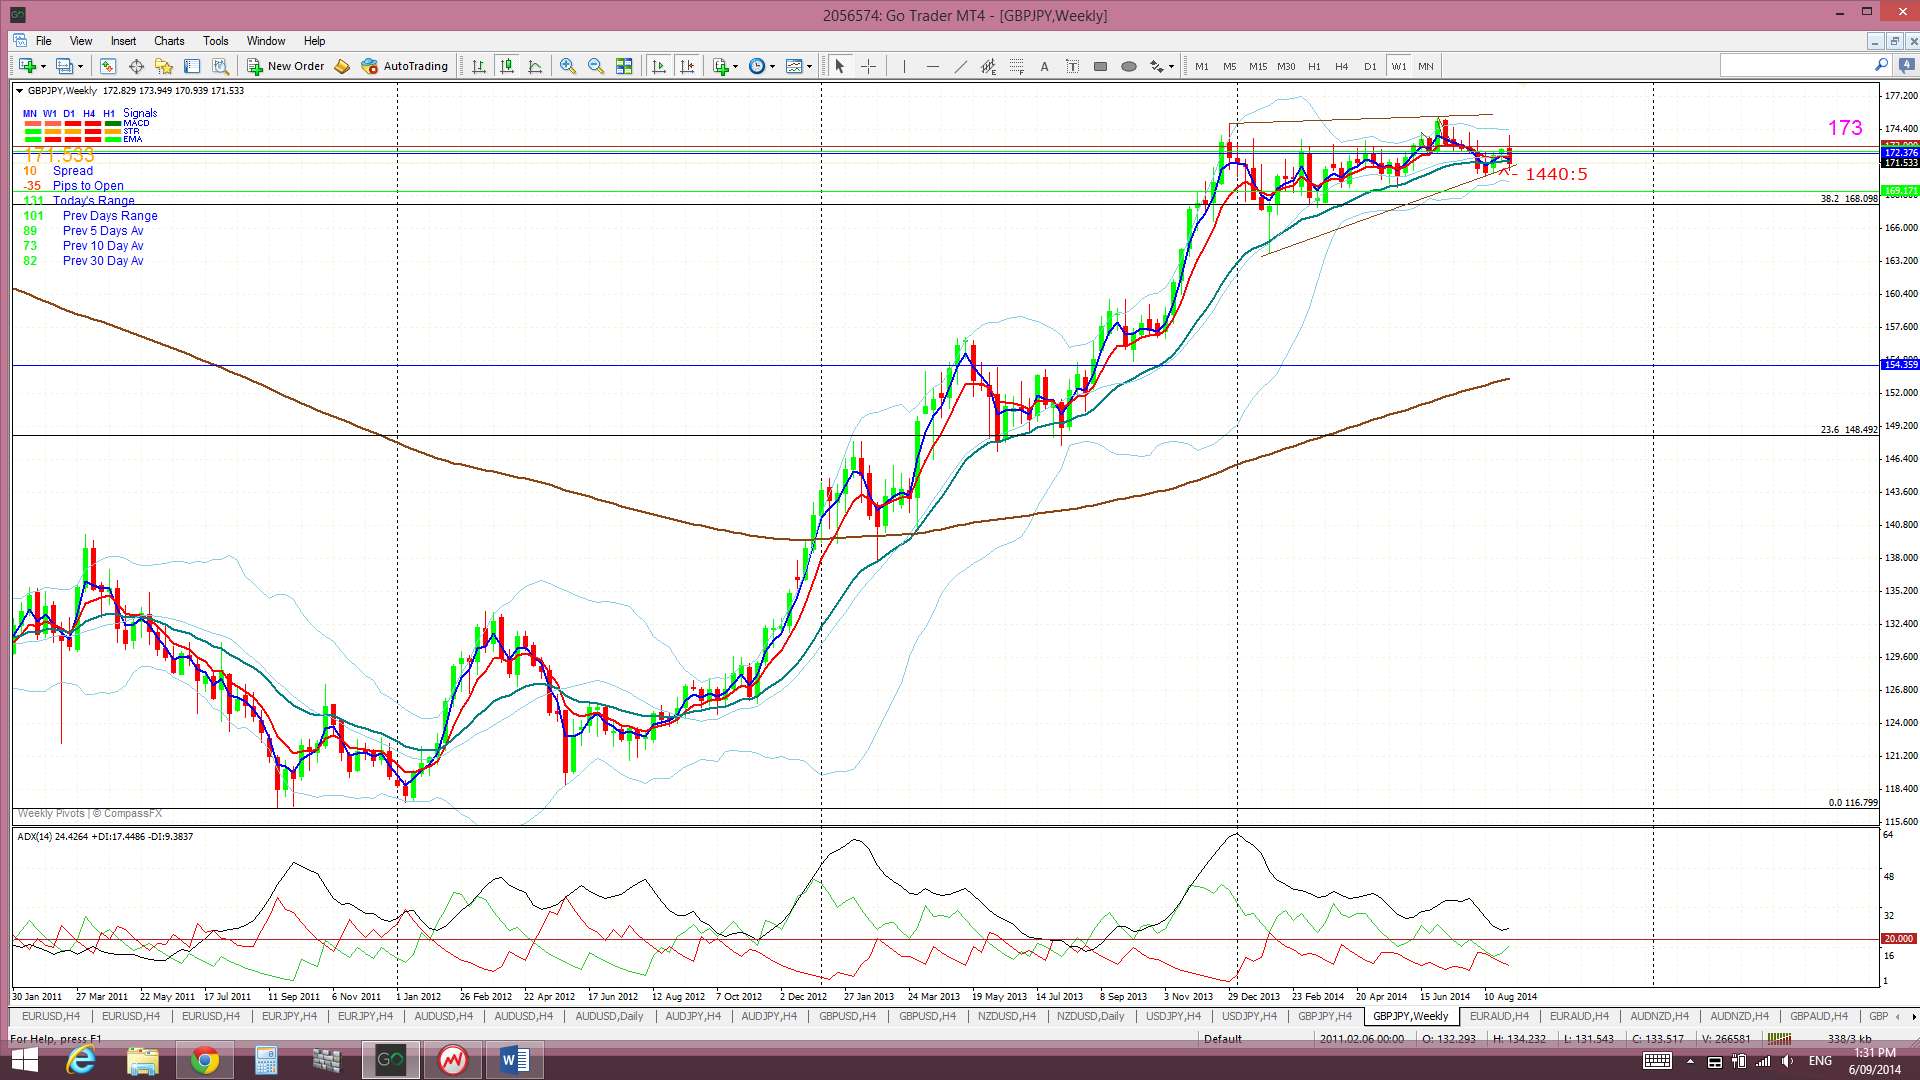
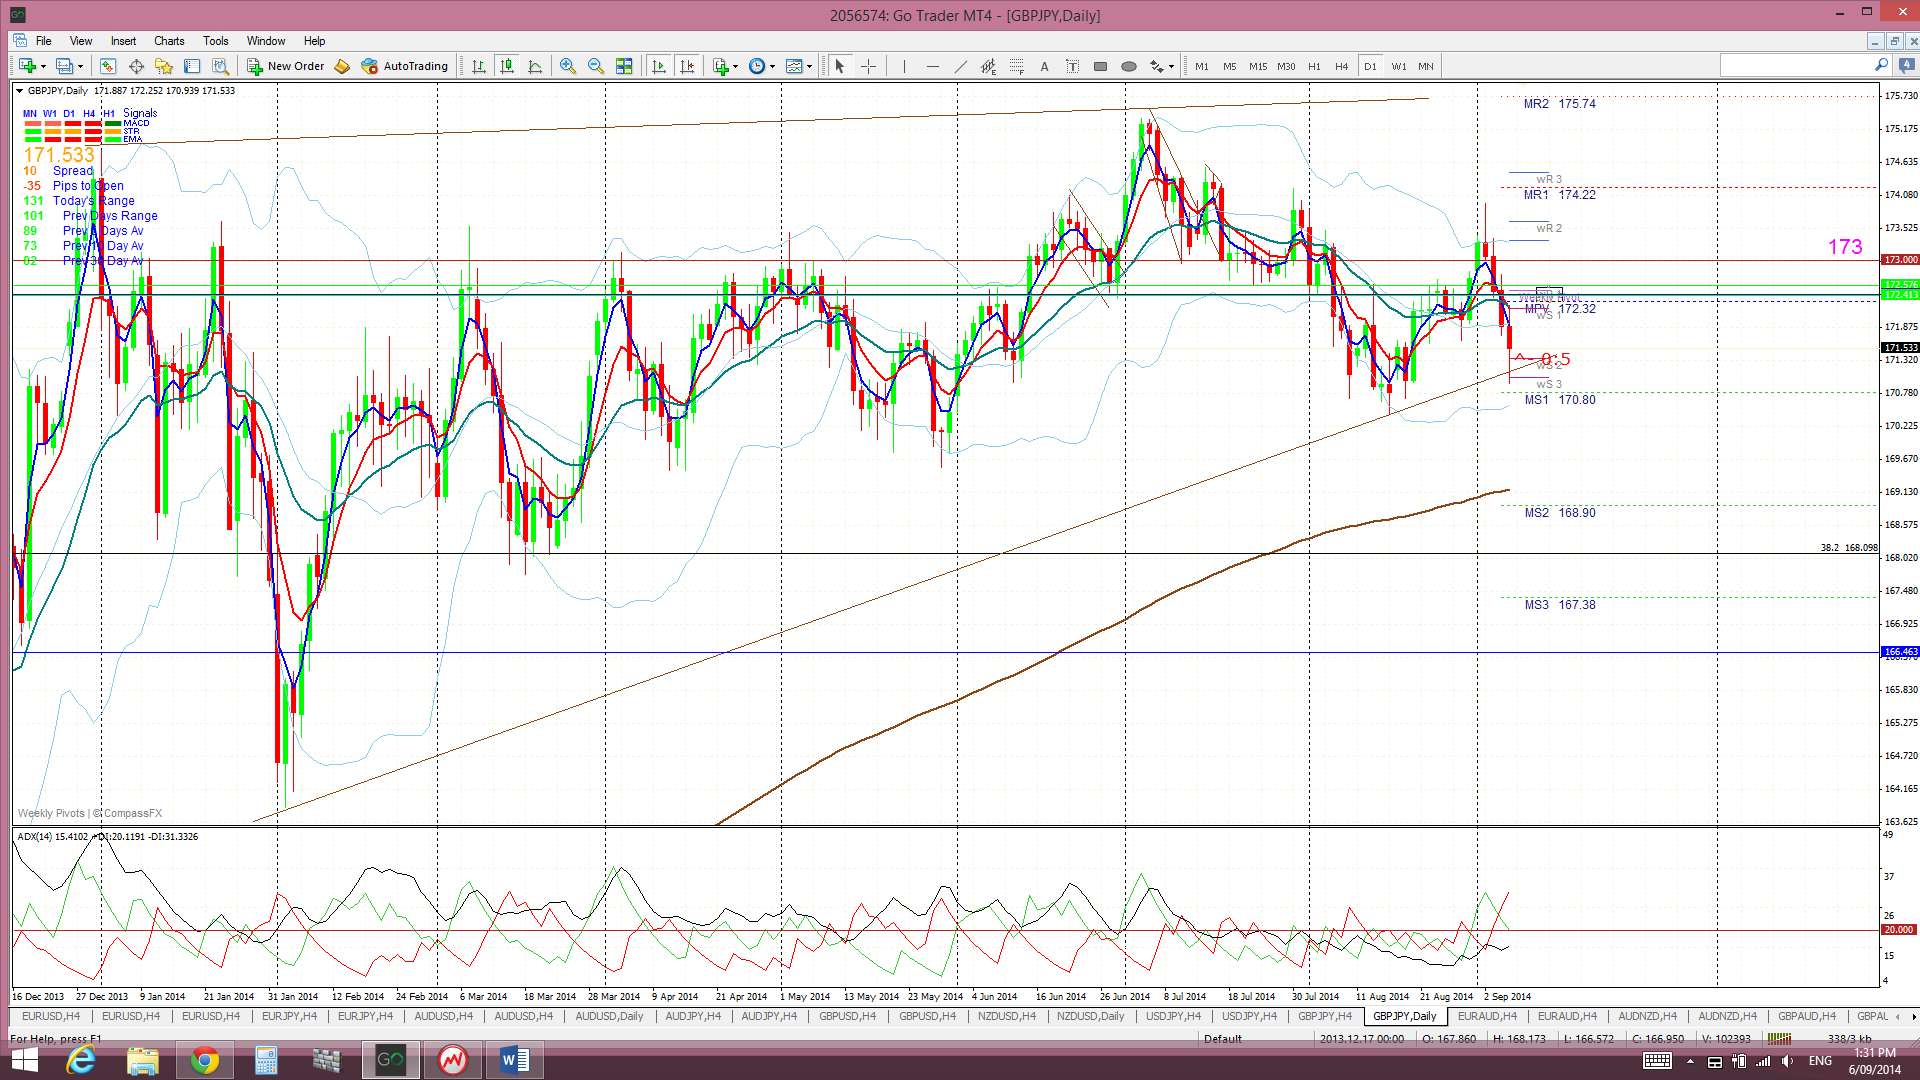
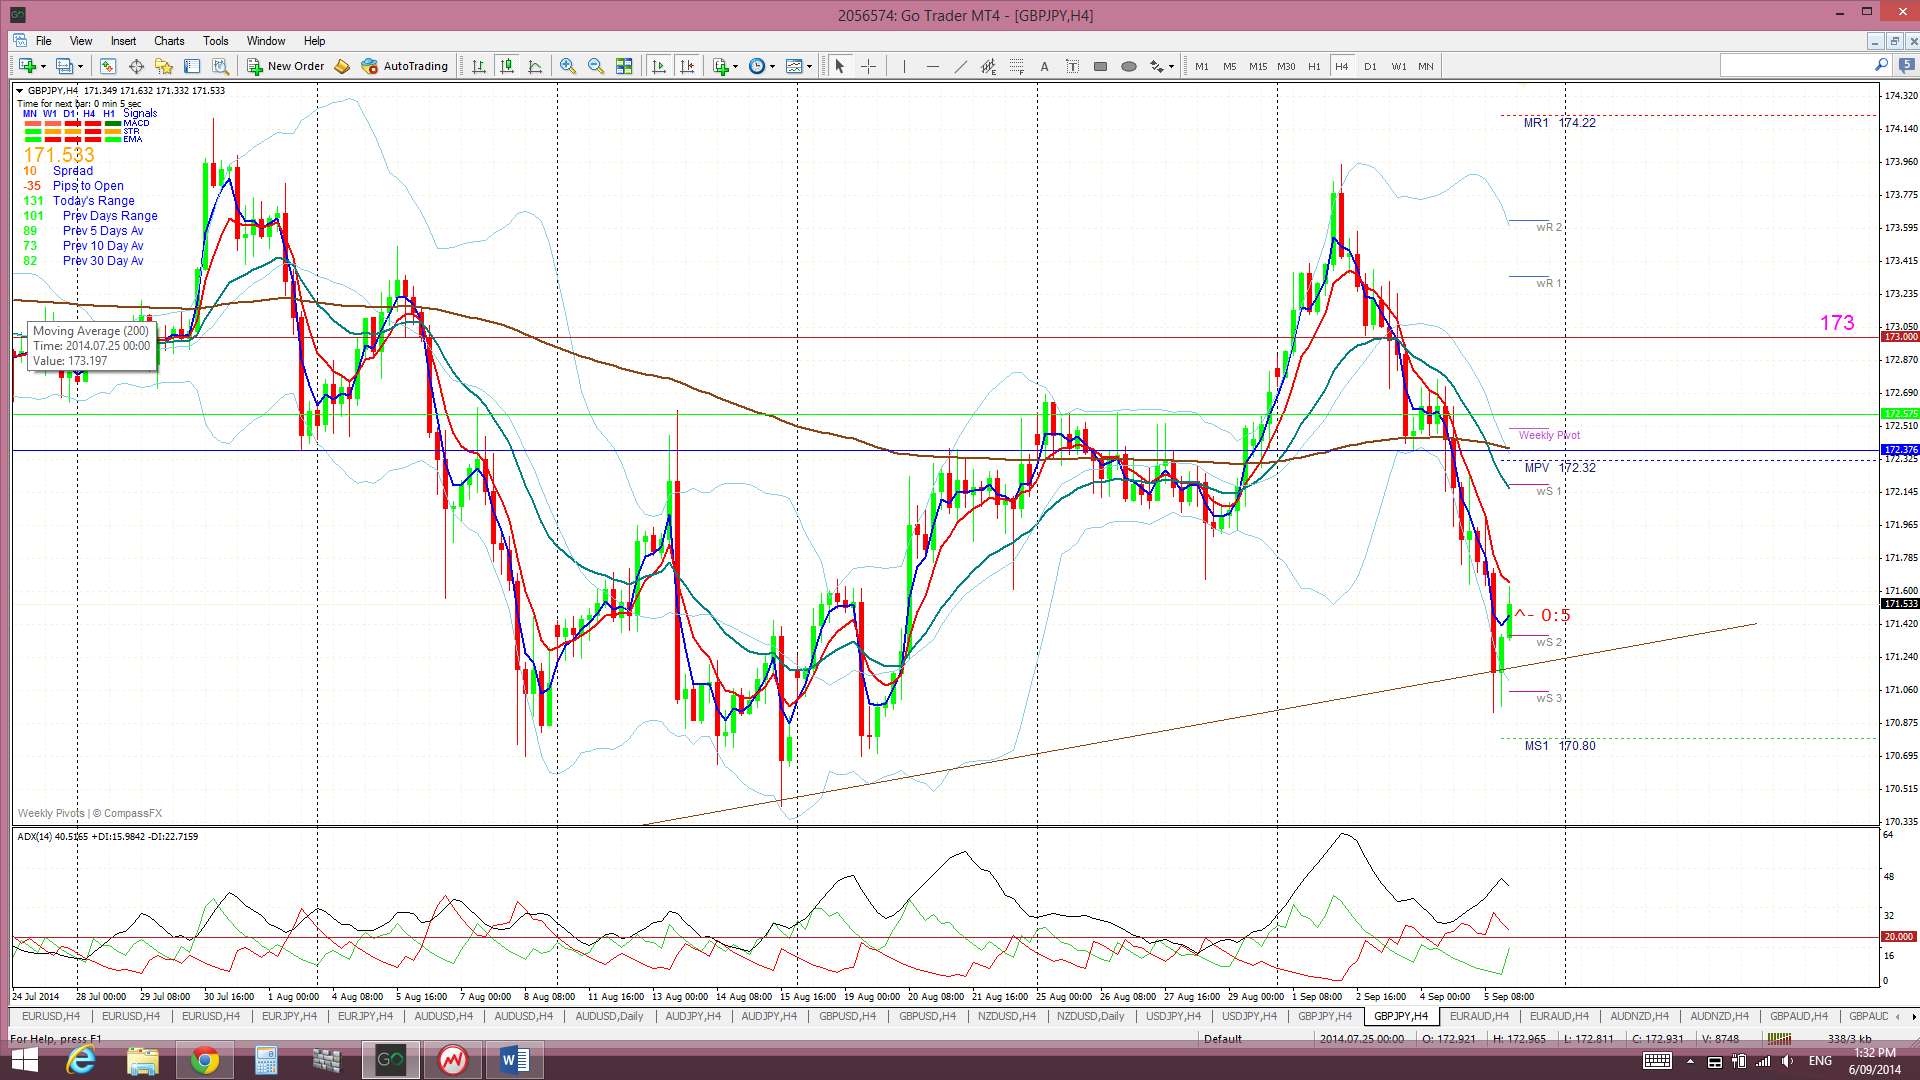
GBP/JPY: The GBP/JPY moved lower last week and suffered due to the GBP weakness. When you look at the monthly chart though you can see how there has been a battle going on around the 173 level for the whole of this year! This is clearly a major level and one to keep an eye on.
I am still seeing a bearish ascending wedge pattern on the weekly chart but this also still looks like a ‘Bull Flag’ pattern on the monthly chart! I can only suggest to watch trend line breaks for clues here but there may not be a lot of clarity until after the Scottish Independence vote and this is still 2 weeks away. This may be a pair to leave until after this vote.
Price is now trading below the Ichimoku Cloud on the 4hr chart and daily chart but above the Cloud on the weekly and monthly charts.
The weekly candle closed as a bearish candle.
- I’m watching for any new TC signal on this pair, the 173 level and the wedge trend lines.
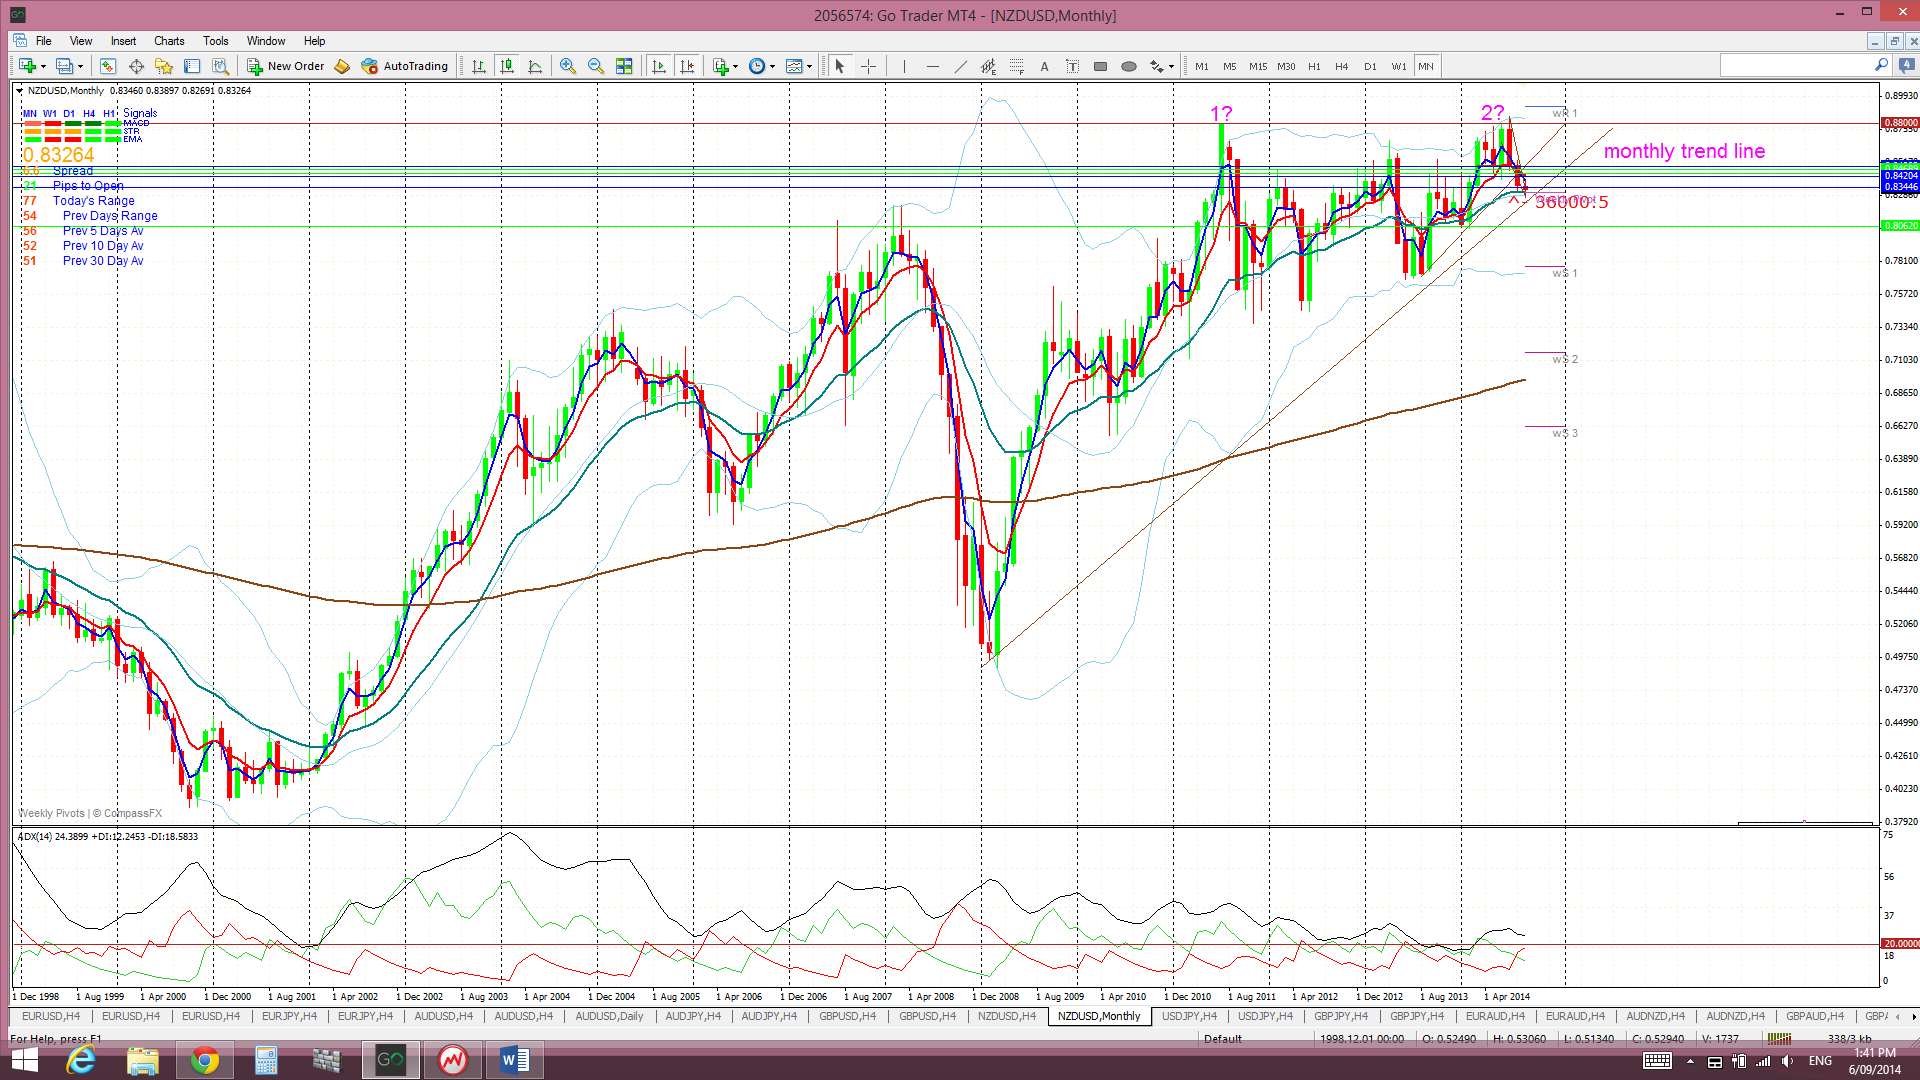
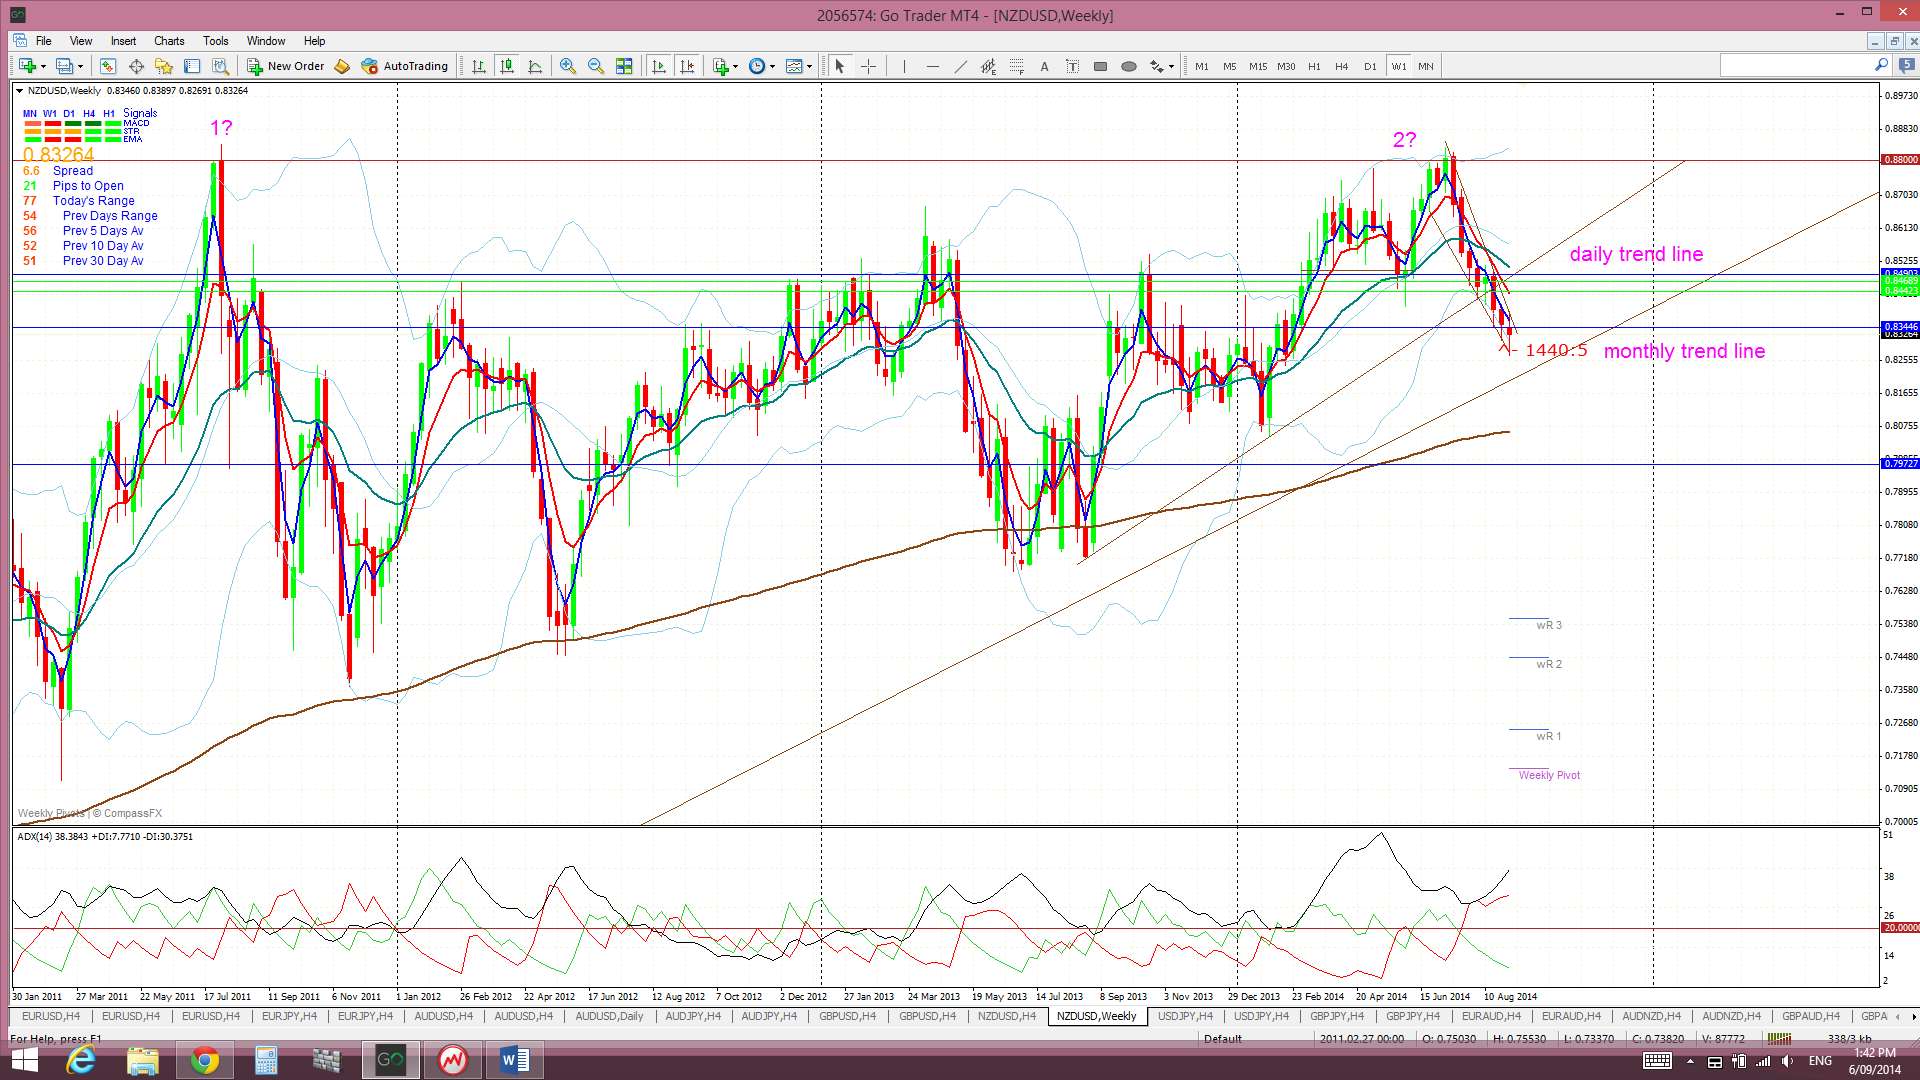
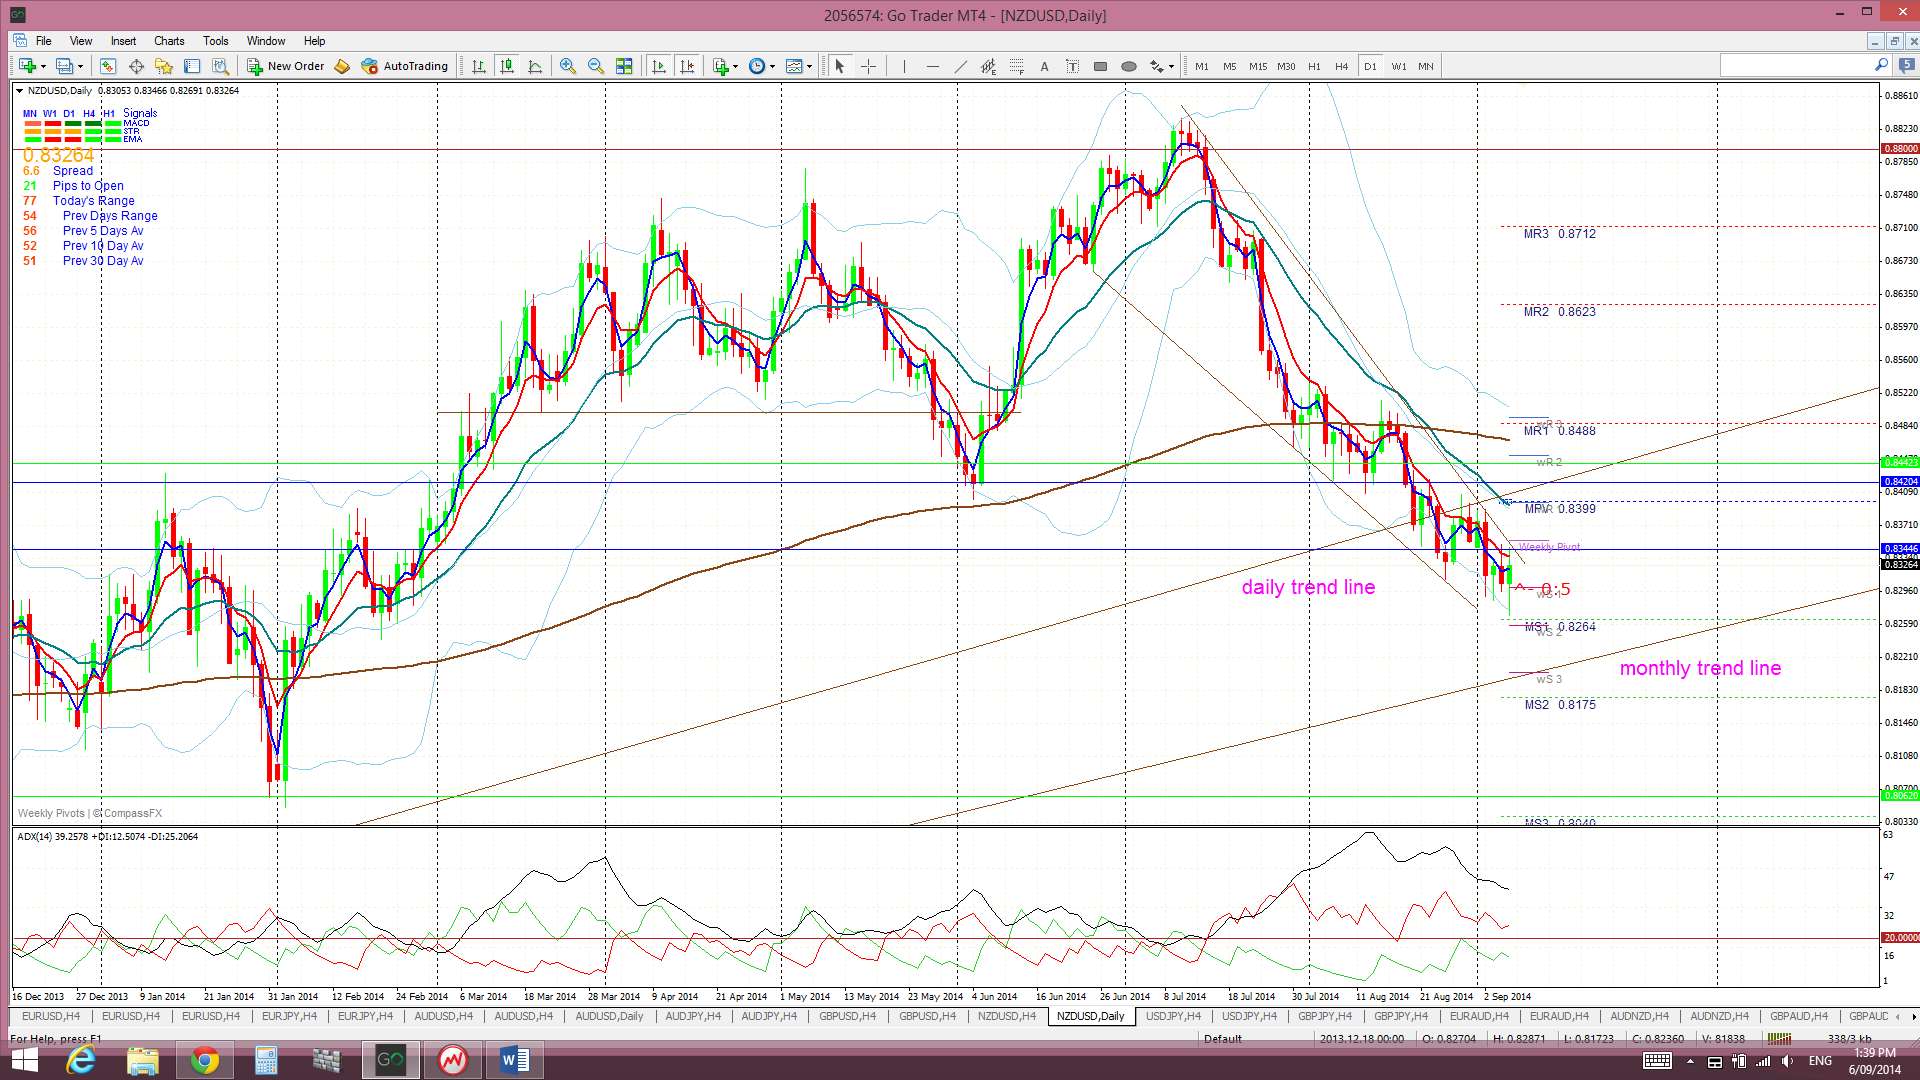
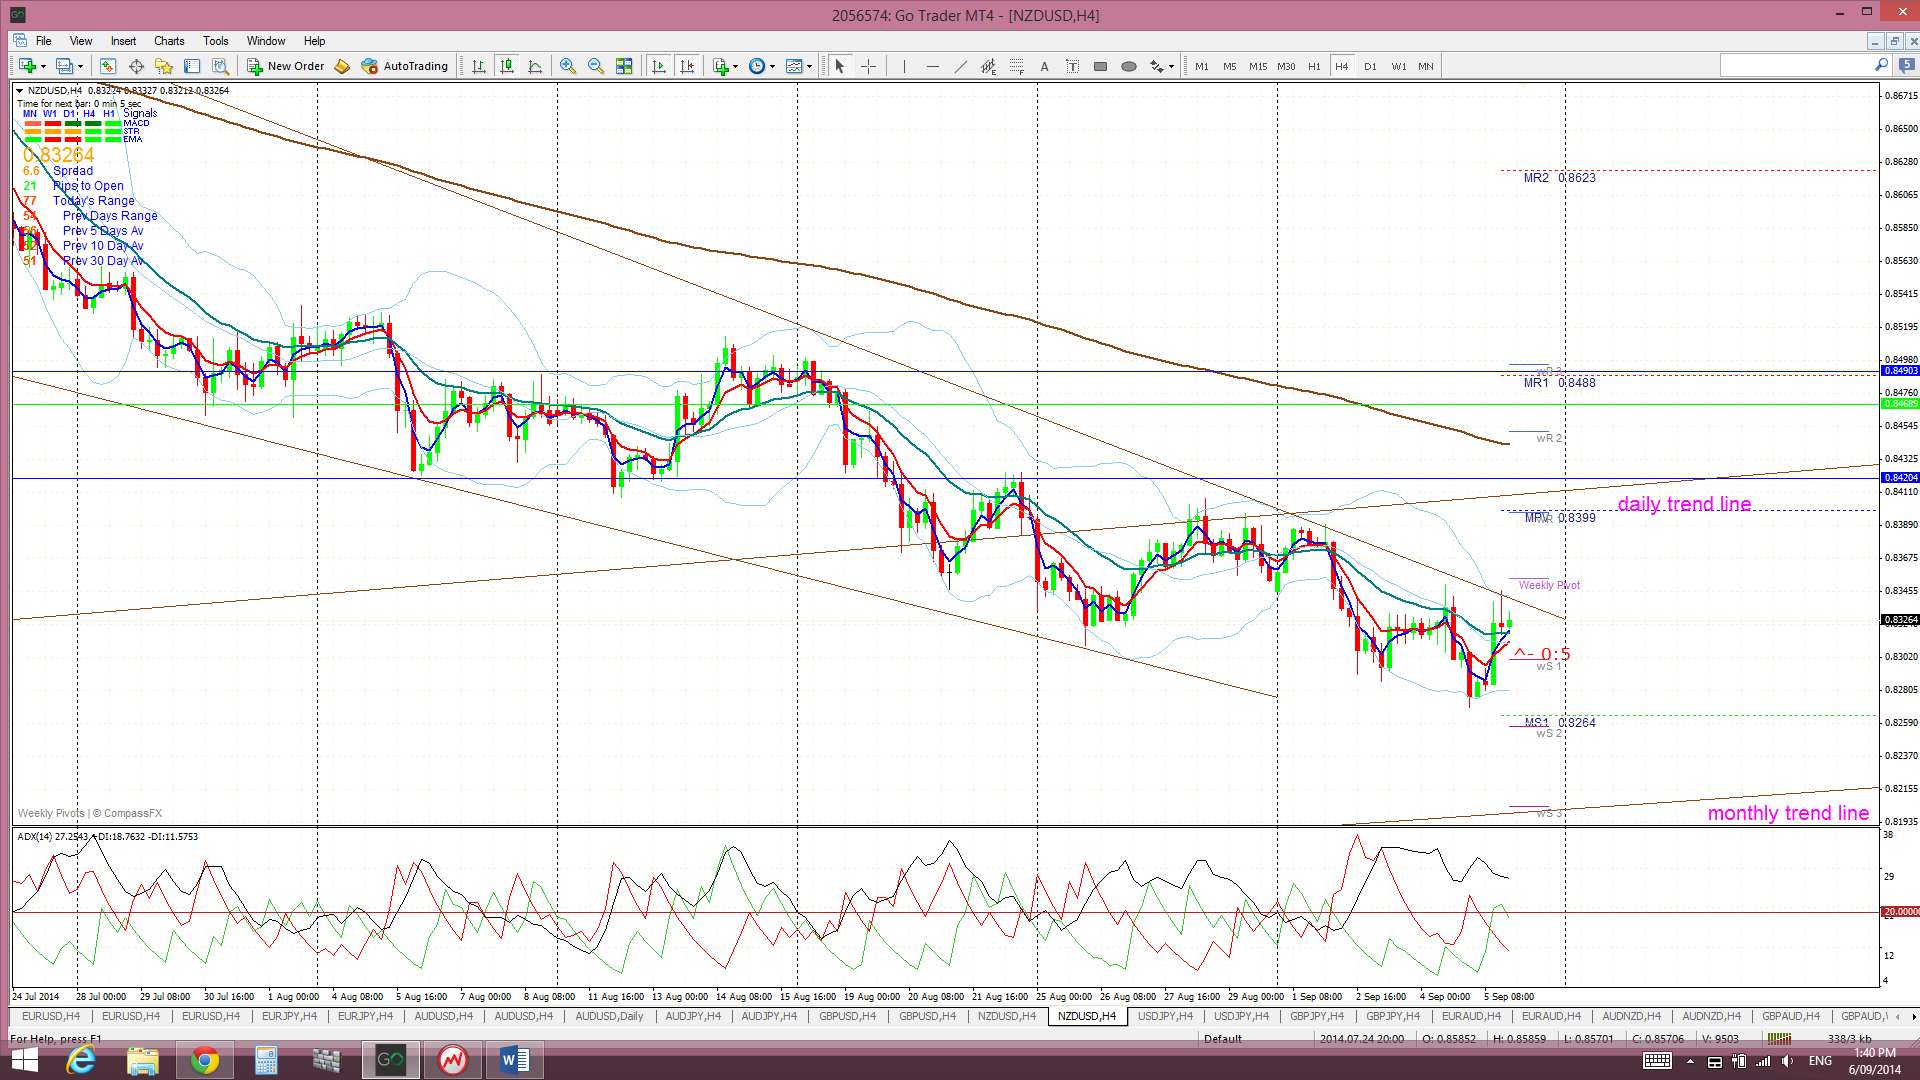
Kiwi: NZD/USD: The Kiwi continued lower last week after previously falling through the daily support trend line. Price action has formed up into a bullish ‘descending wedge’ pattern on the daily chart.
It now looks like the Kiwi is stuck in ‘no man’s land’ though as it trades between the daily and monthly support trend lines. There is key NZD Interest Rate data this week though that might help to shift the Kiwi out of this zone.
Price is now trading below the Ichimoku Cloud on the 4hr and daily charts, just above on the weekly chart and above on the monthly chart.
The weekly candle closed as a bearish coloured ‘Spinning Top’ candle reflecting this recent indecision.
- I’m watching for any new TC signal on this pair, the wedge trend lines and the monthly support trend line.
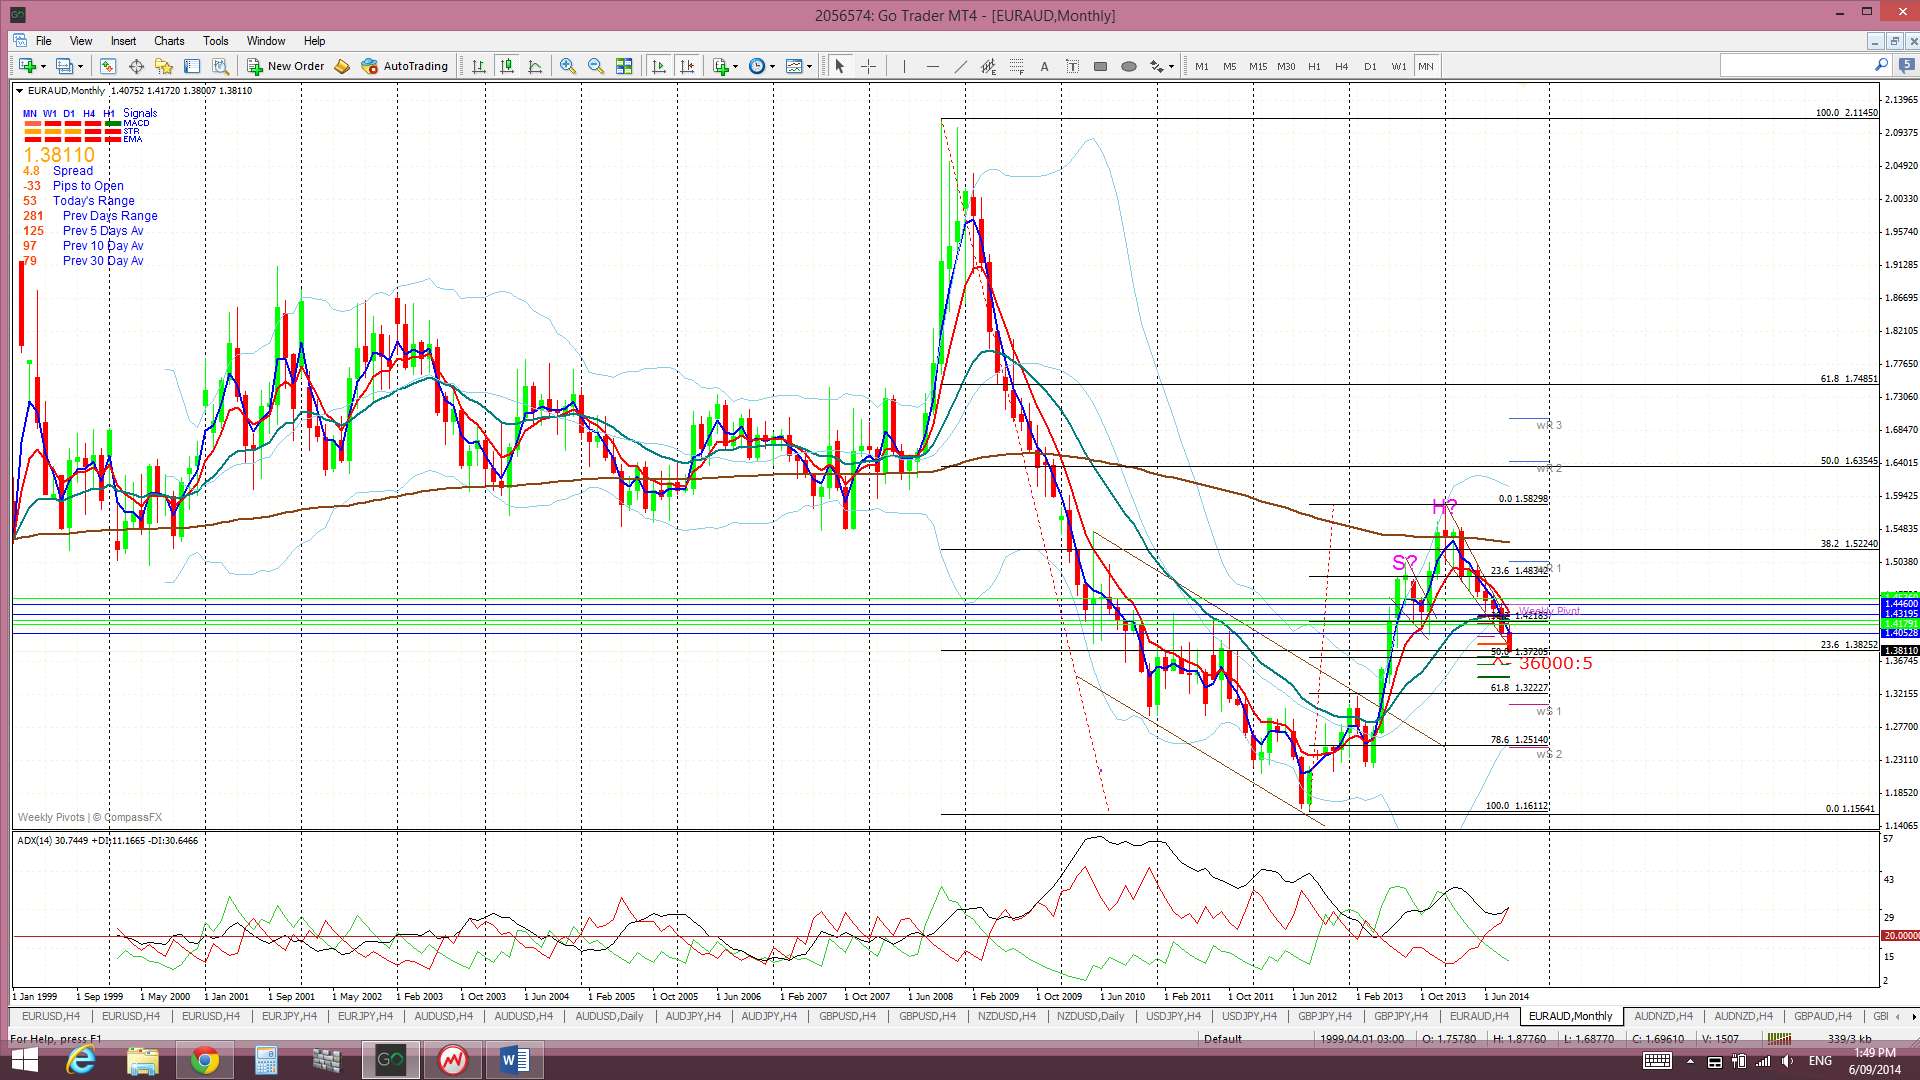
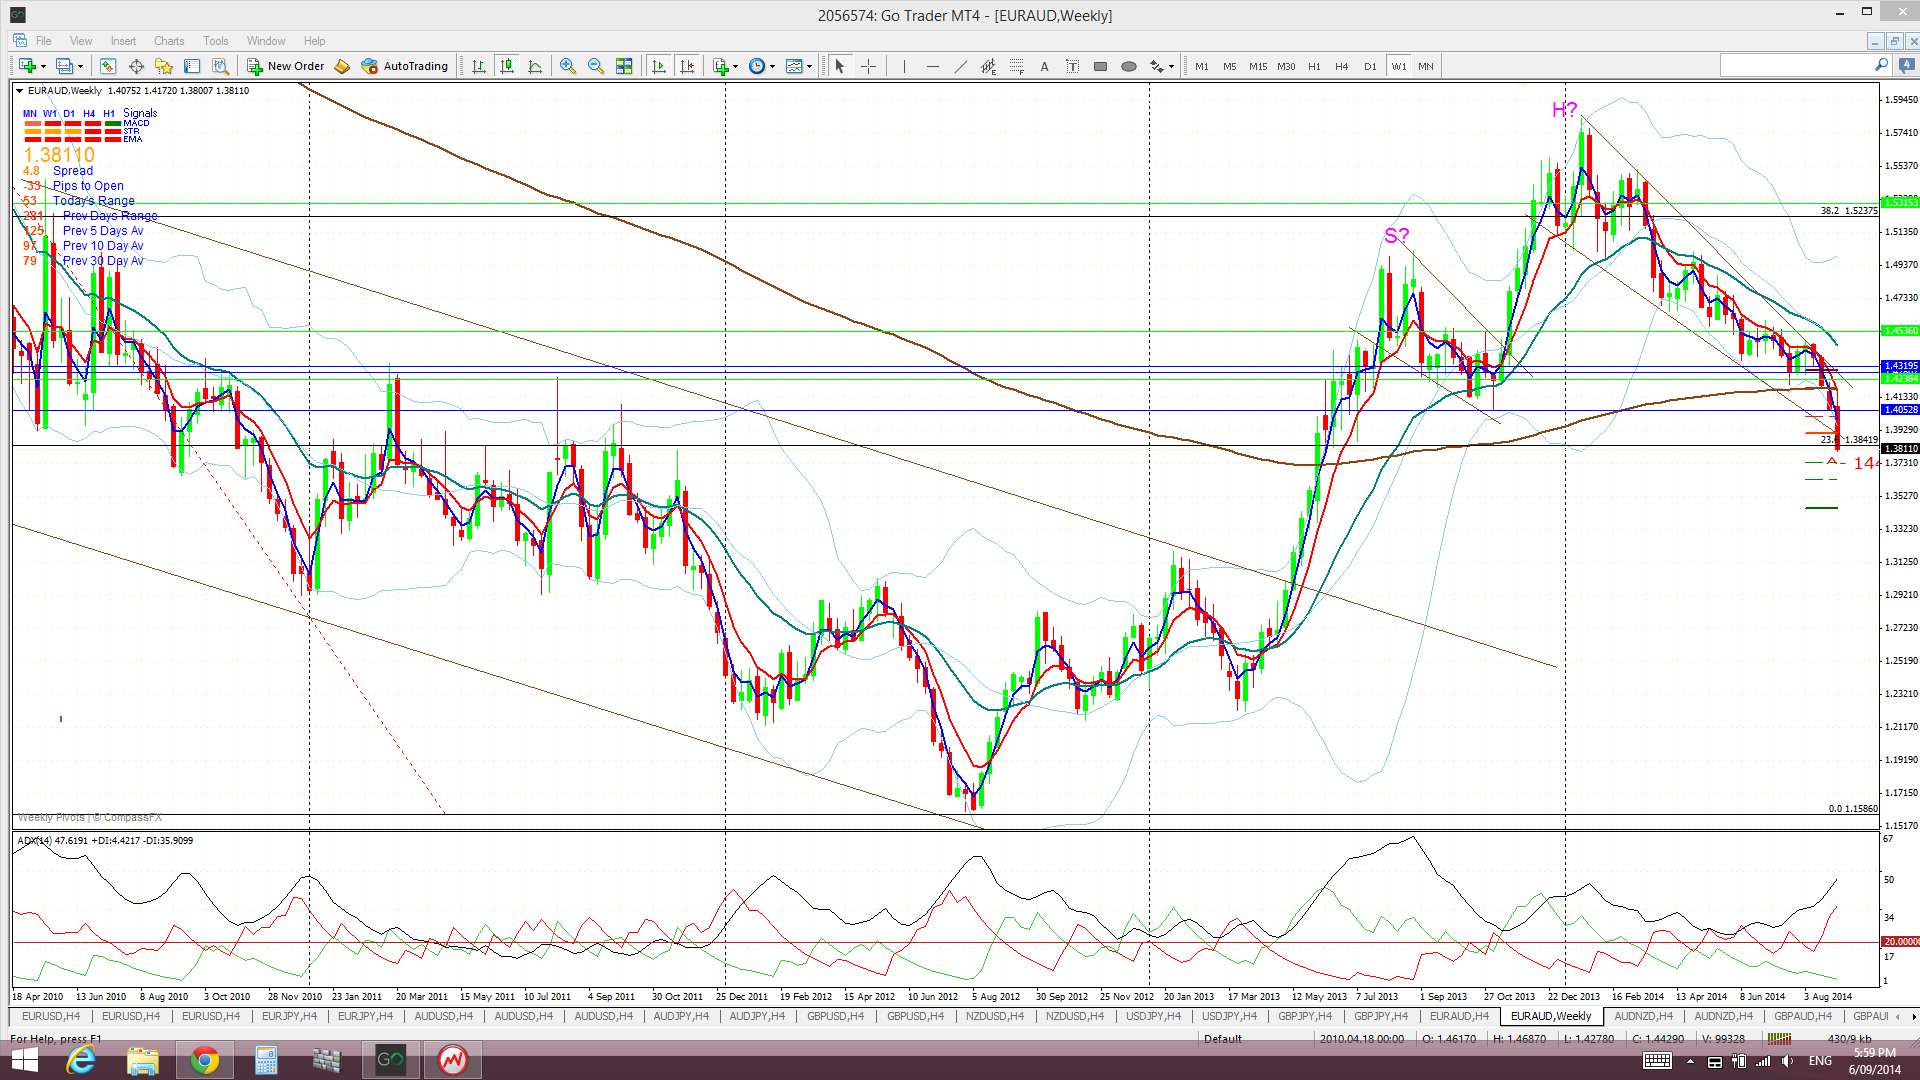
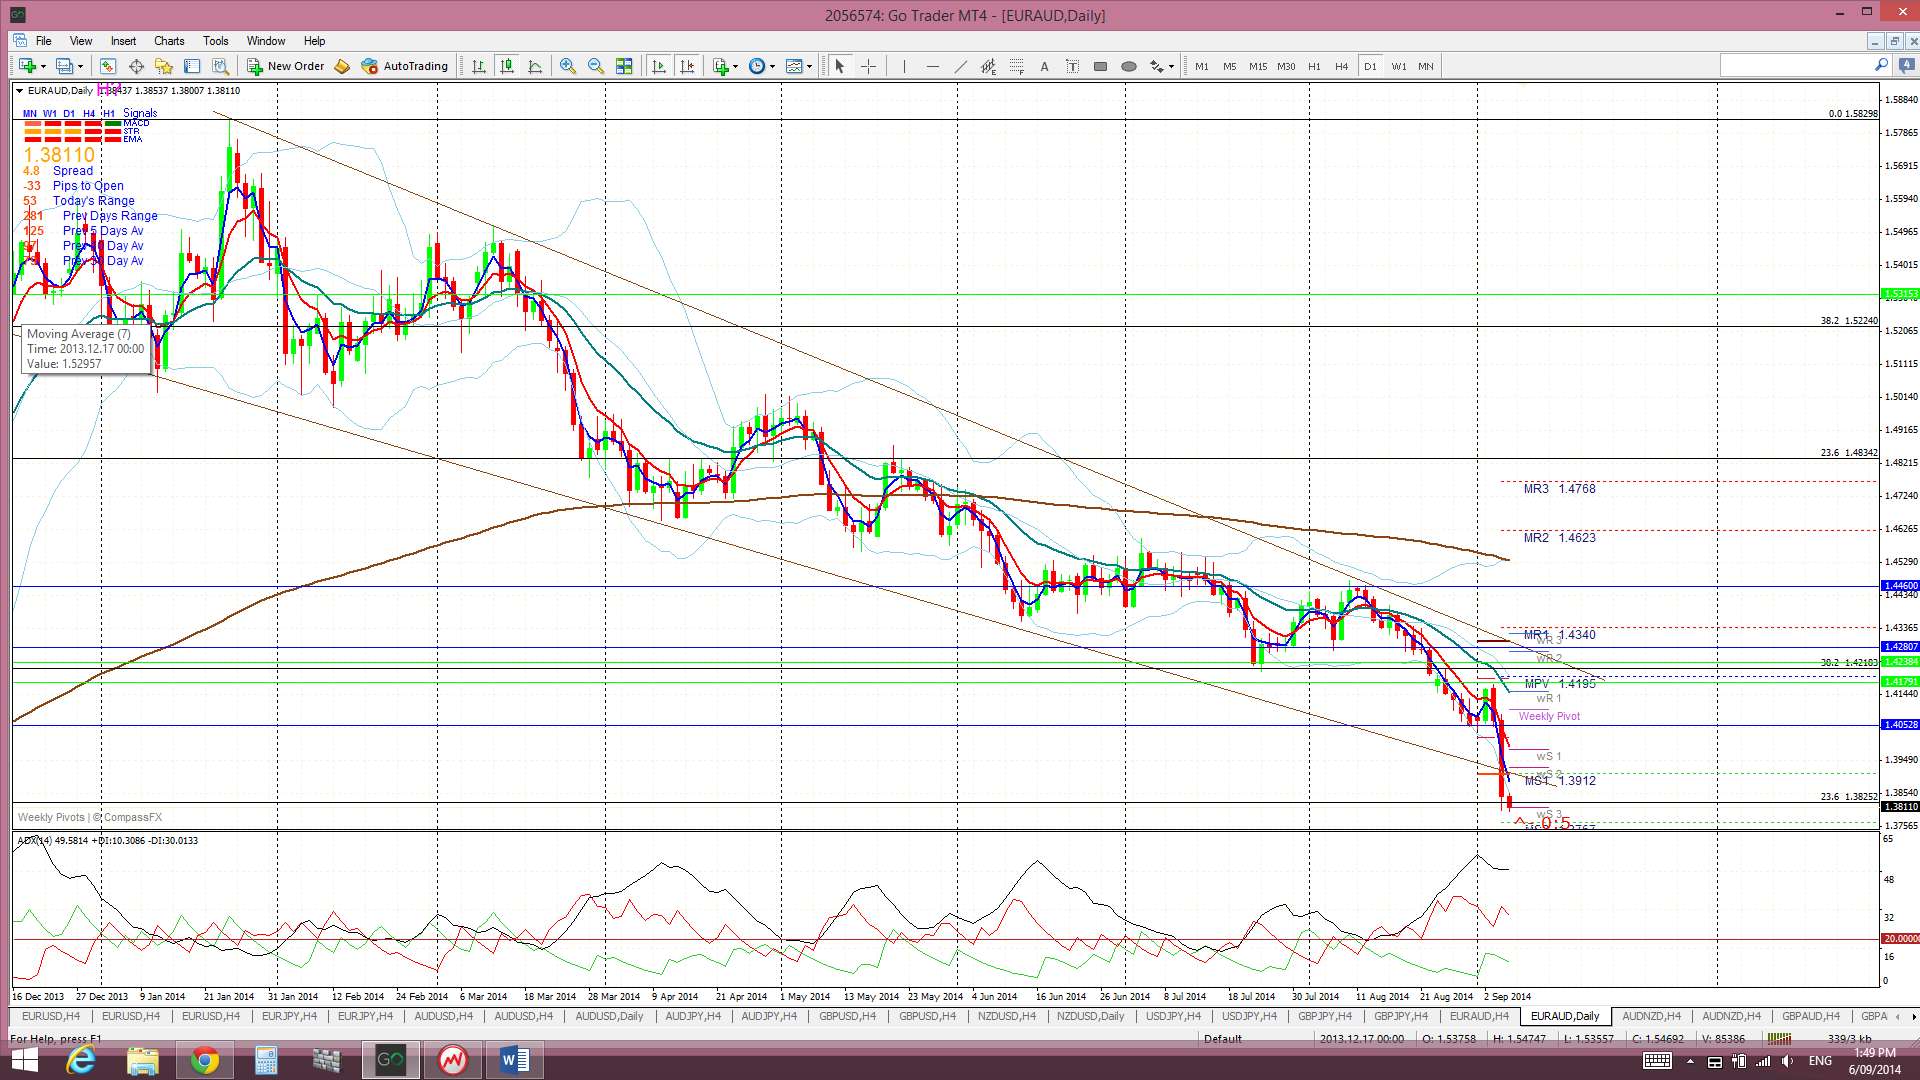
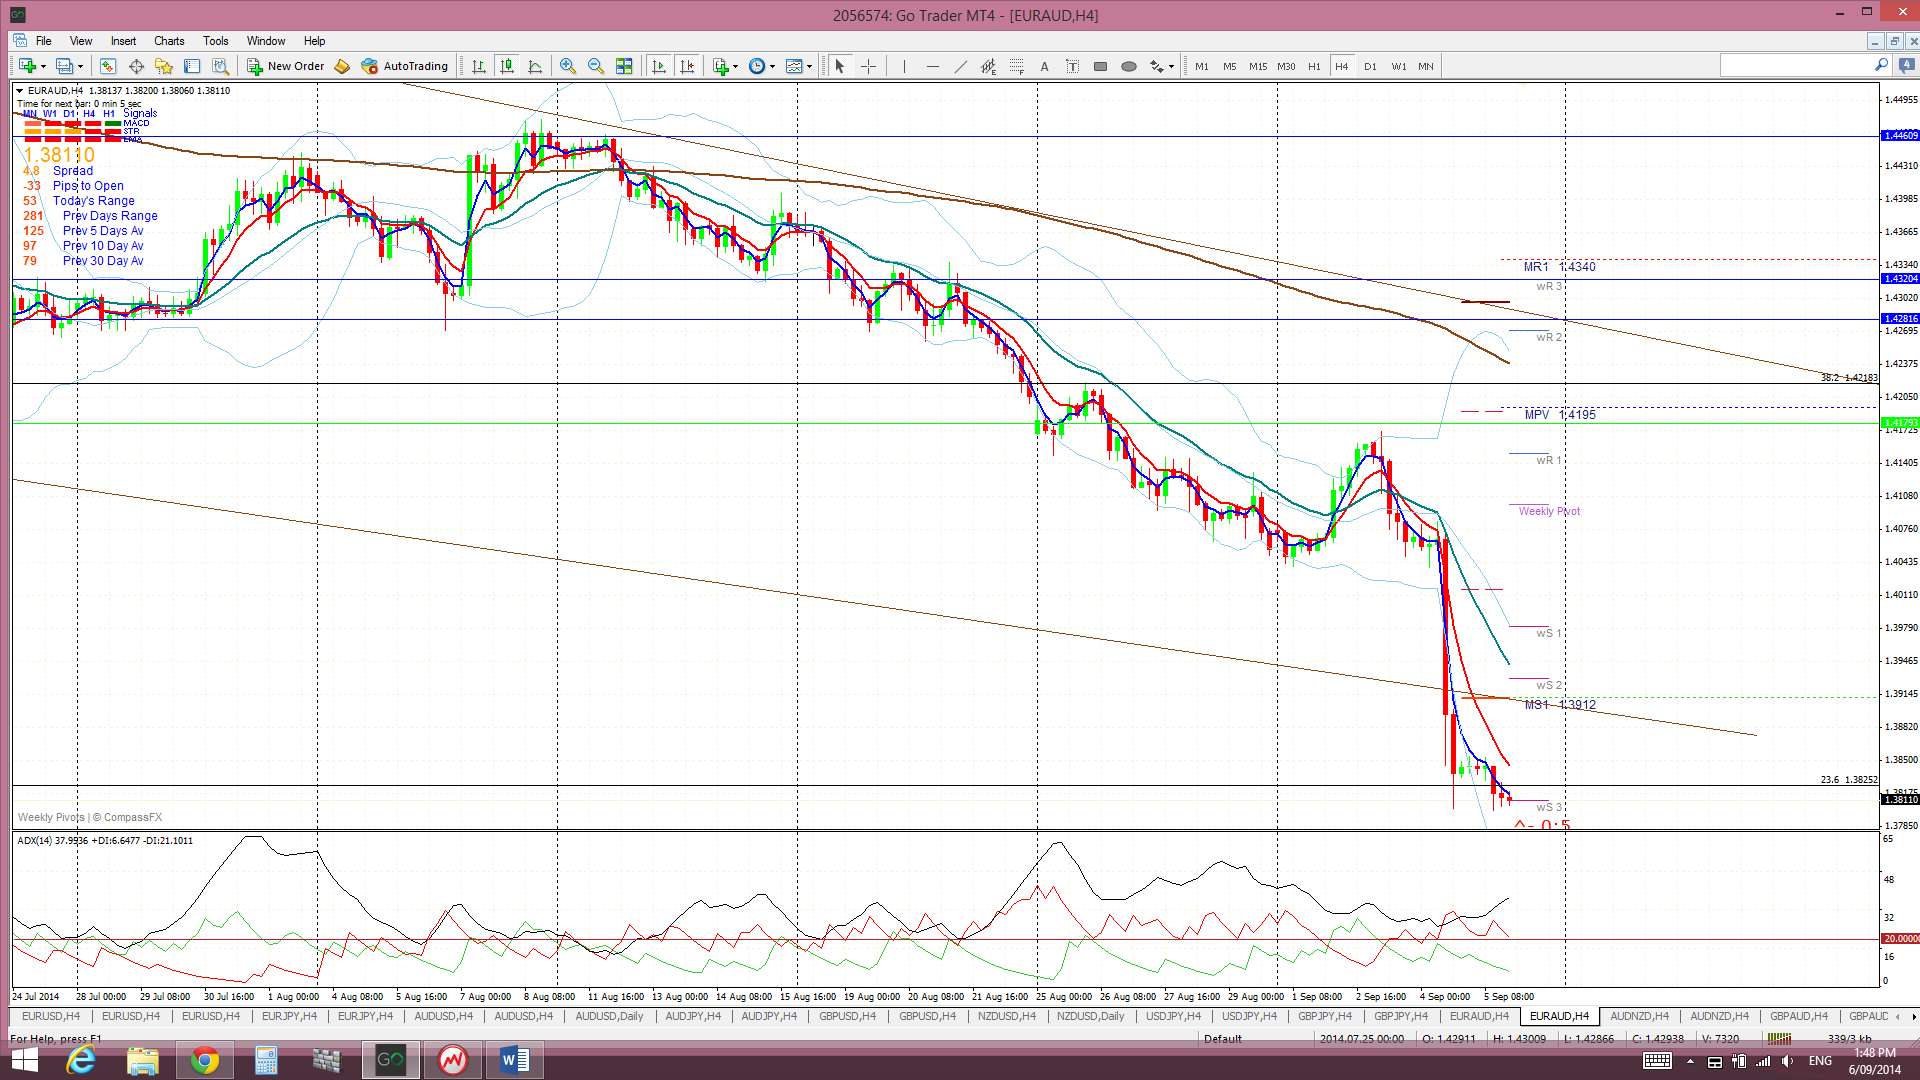
EUR/AUD: I have been saying for weeks that I would prefer to wait for any wedge breakout that occurs WITH momentum before trading this pair and, that is what we got last week. The ECB rate cut decision on Thursday was the catalysts to trigger this breakout move.
The E/A found some support at the 23.6% fib of the 2008-2012 bear move on Friday though. The 1.381/1.383 region, just below this fib, has offered significant support and resistance in the past and this can be best seen from the weekly chart. Price actually closed the week below this fib and just above the 1.381 level. I would prefer to see a close and hold below the support of the 1.381 level before being confident taking any technical short trade.
The wedge breakout was a bearish breakout and thus conflicts with the possible H&S I thought might have been building on the weekly chart. I’m keeping an open mind here though.
The E/A is now trading below the Cloud on the 4hr, daily and weekly charts which is bearish.
The weekly candle closed as a large bearish candle.
I’m watching for any new TC signal on this pair, the descending wedge trend lines and the 1.381 support level.
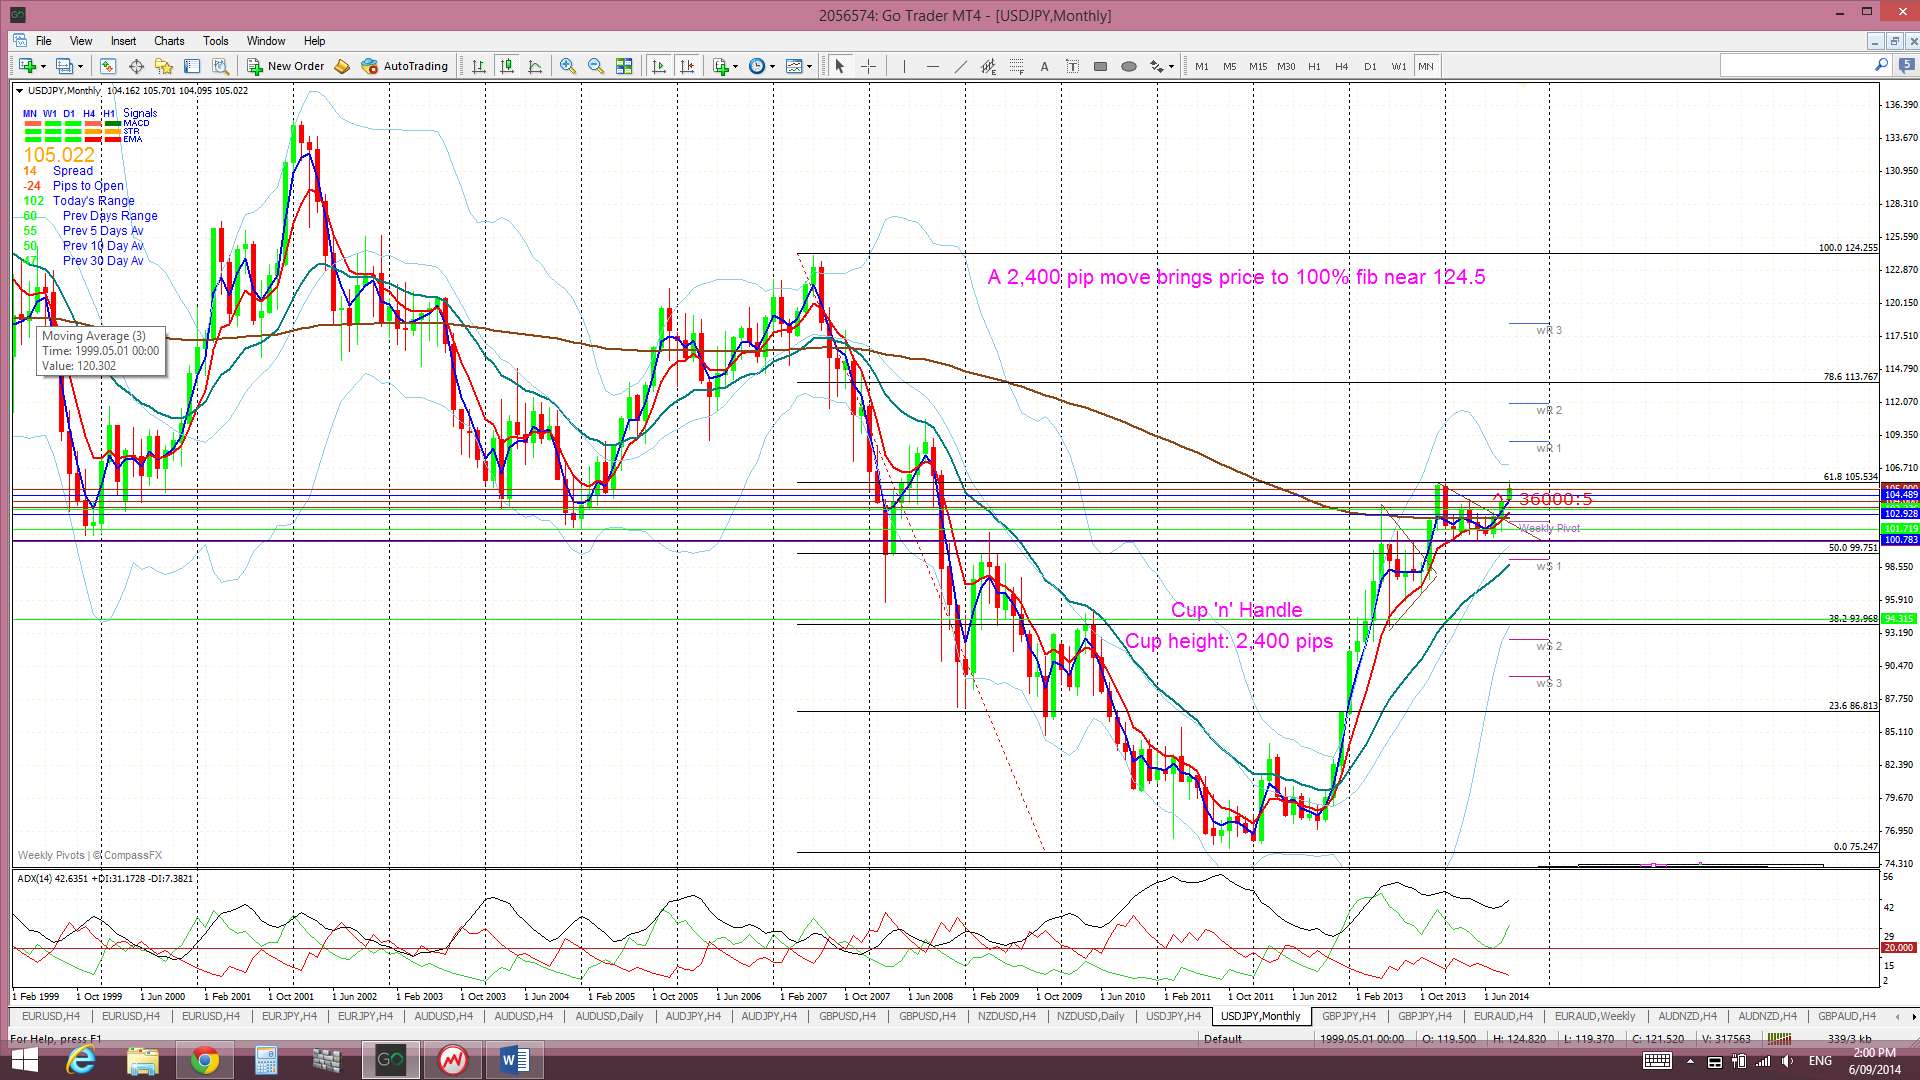
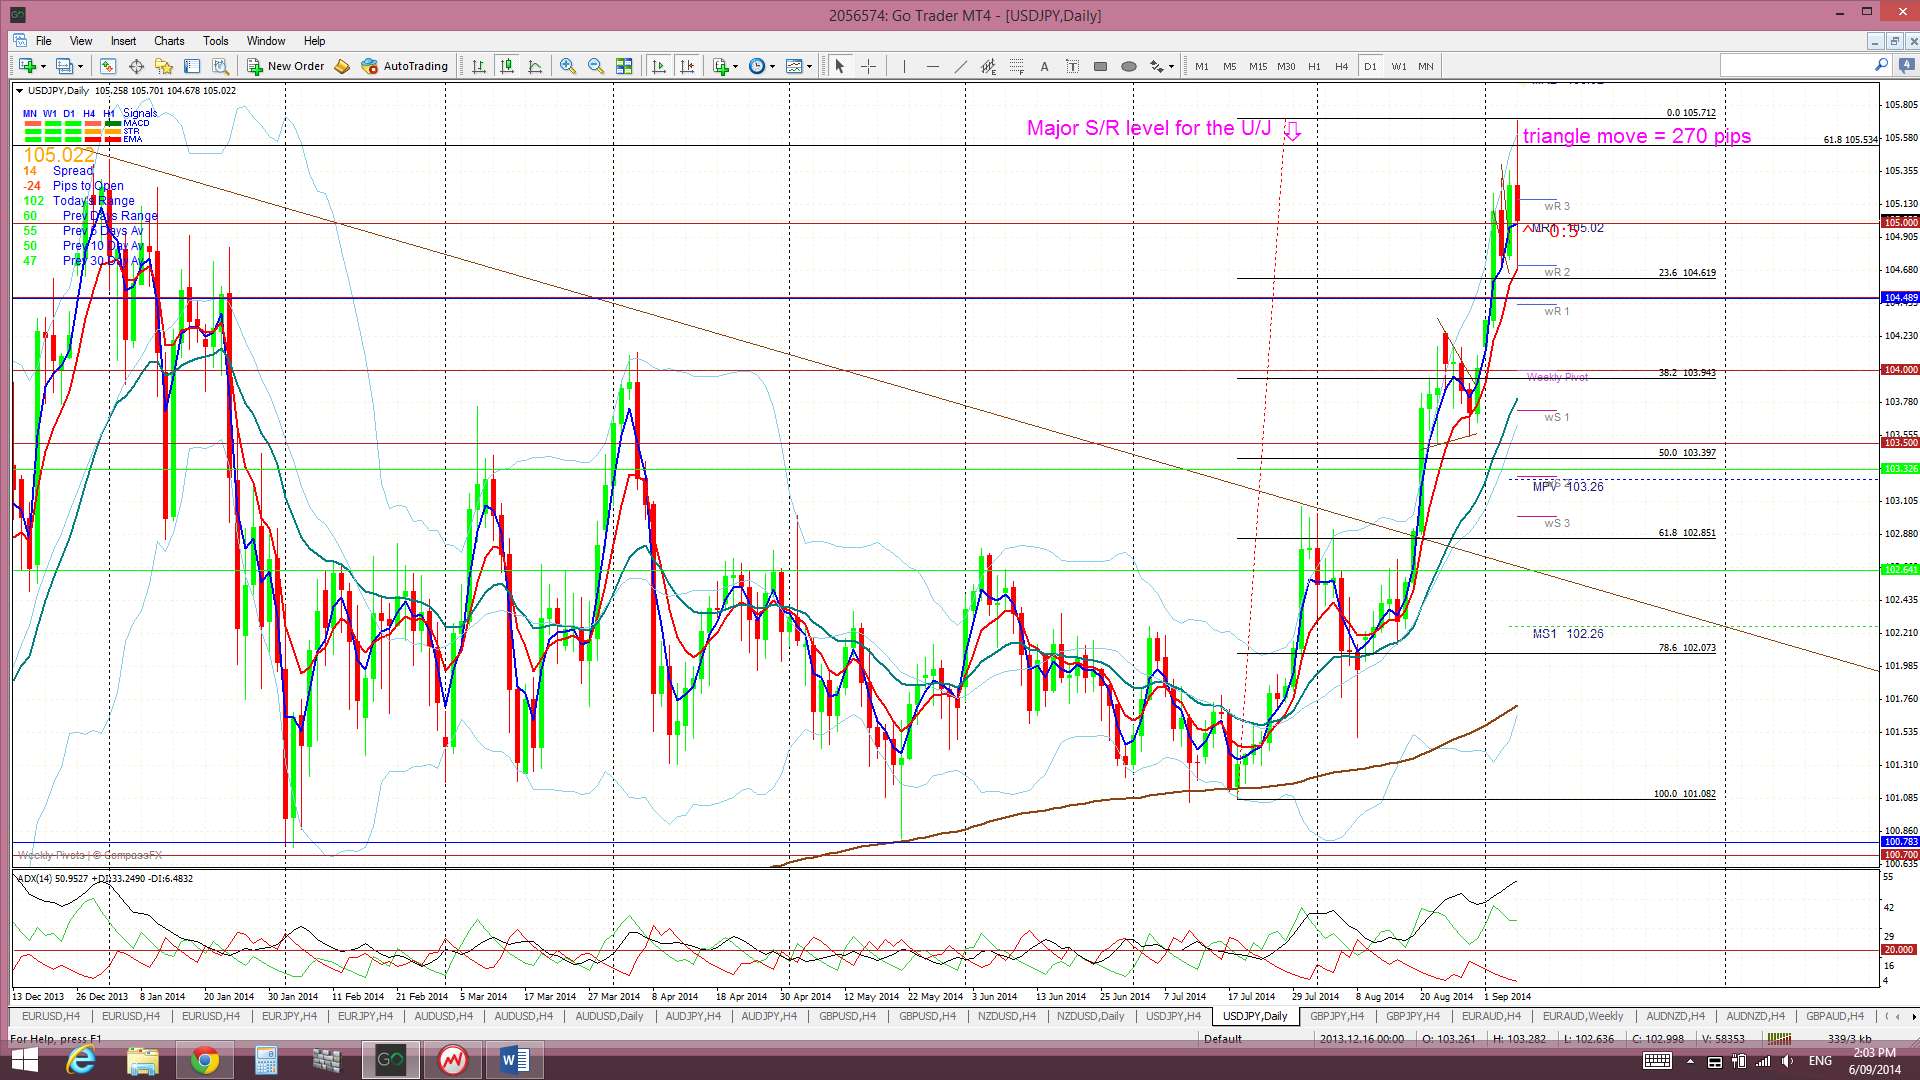
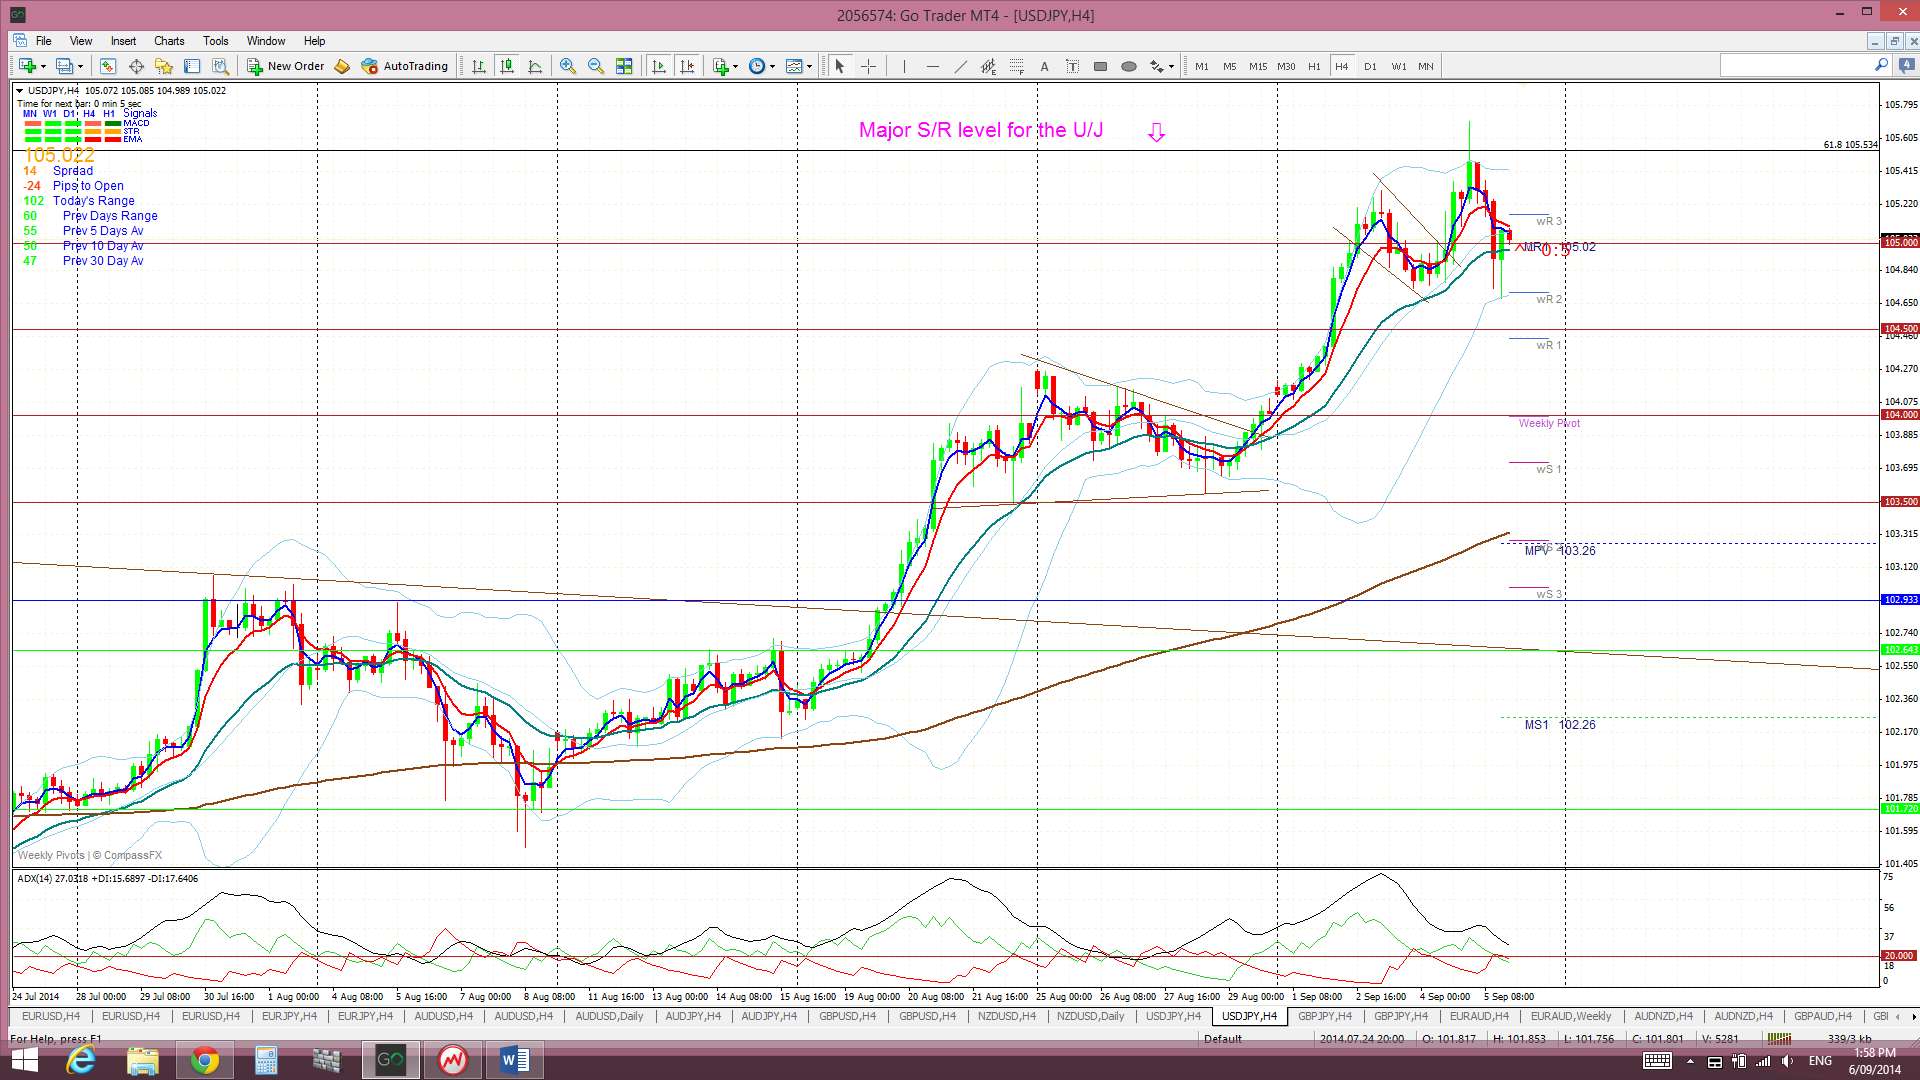
The Yen: U/J: The U/J has had another bullish week. It achieved another ‘Bull Flag’ breakout on the 4hr chart and broke up through the 104.5 and 105 resistance levels. It went into NFP Friday sitting under the major resistance level of the 61.8% fib of the 2007-2012 bear move at 105.5 but the weak NFP result meant that the U/J couldn’t manage a weekly close above this major resistance.
I wrote a plan out for this pair on Friday depending how it finished up after NFP. This article can be found through this link and remains valid for when, and if, there is a close above the 105.5. The weaker than expected NFP may give the U/J an excuse for a pause or even a bit of a pull back. I have fibbed the latest bull run on the daily charts to identify possible pull back levels if there is any new U/J weakness. Possible targets include:
- 104 which is near the 38.2% fib.
- 103.5 which is near the 50% fib.
- 103 which is between the 50% and 61.8% fib and near the monthly pivot.
Price is still trading above the Cloud on the 4hr, daily, weekly and monthly charts which is bullish though so any pull back might be brief. November was the first monthly candle close above the Ichimoku Cloud since mid-2007 and the bullish hold above the monthly Cloud continues to be noteworthy.
The weekly candle closed as a bullish candle.
Weekly Chart Bullish Cup’ n’ Handle pattern: I am still seeing this pattern building on the weekly chart and the recent weekly chart triangle breakout supports the continued development of this pattern. The theory behind these patterns is that the height of the ‘Cup’ pattern is equivalent to the expected bullish move from the ‘handle’ breakout. The height of the Cup for the U/J weekly chart is around 2,400 pips. The interesting point here is that a 2,400 pip bullish move up from the ‘Handle’ would put price up near the 124 level. This level is the last major swing high for the U/J from back in 2007 and represents the 100% fib pullback for the move down in 2007 to the lows of 2012. Possible targets along the way include the 61.8% fib retrace level at the 105.5 region and the 78.6% fib up near the 112 region.
- I’m watching for any new TC signal and the 105.5 level.
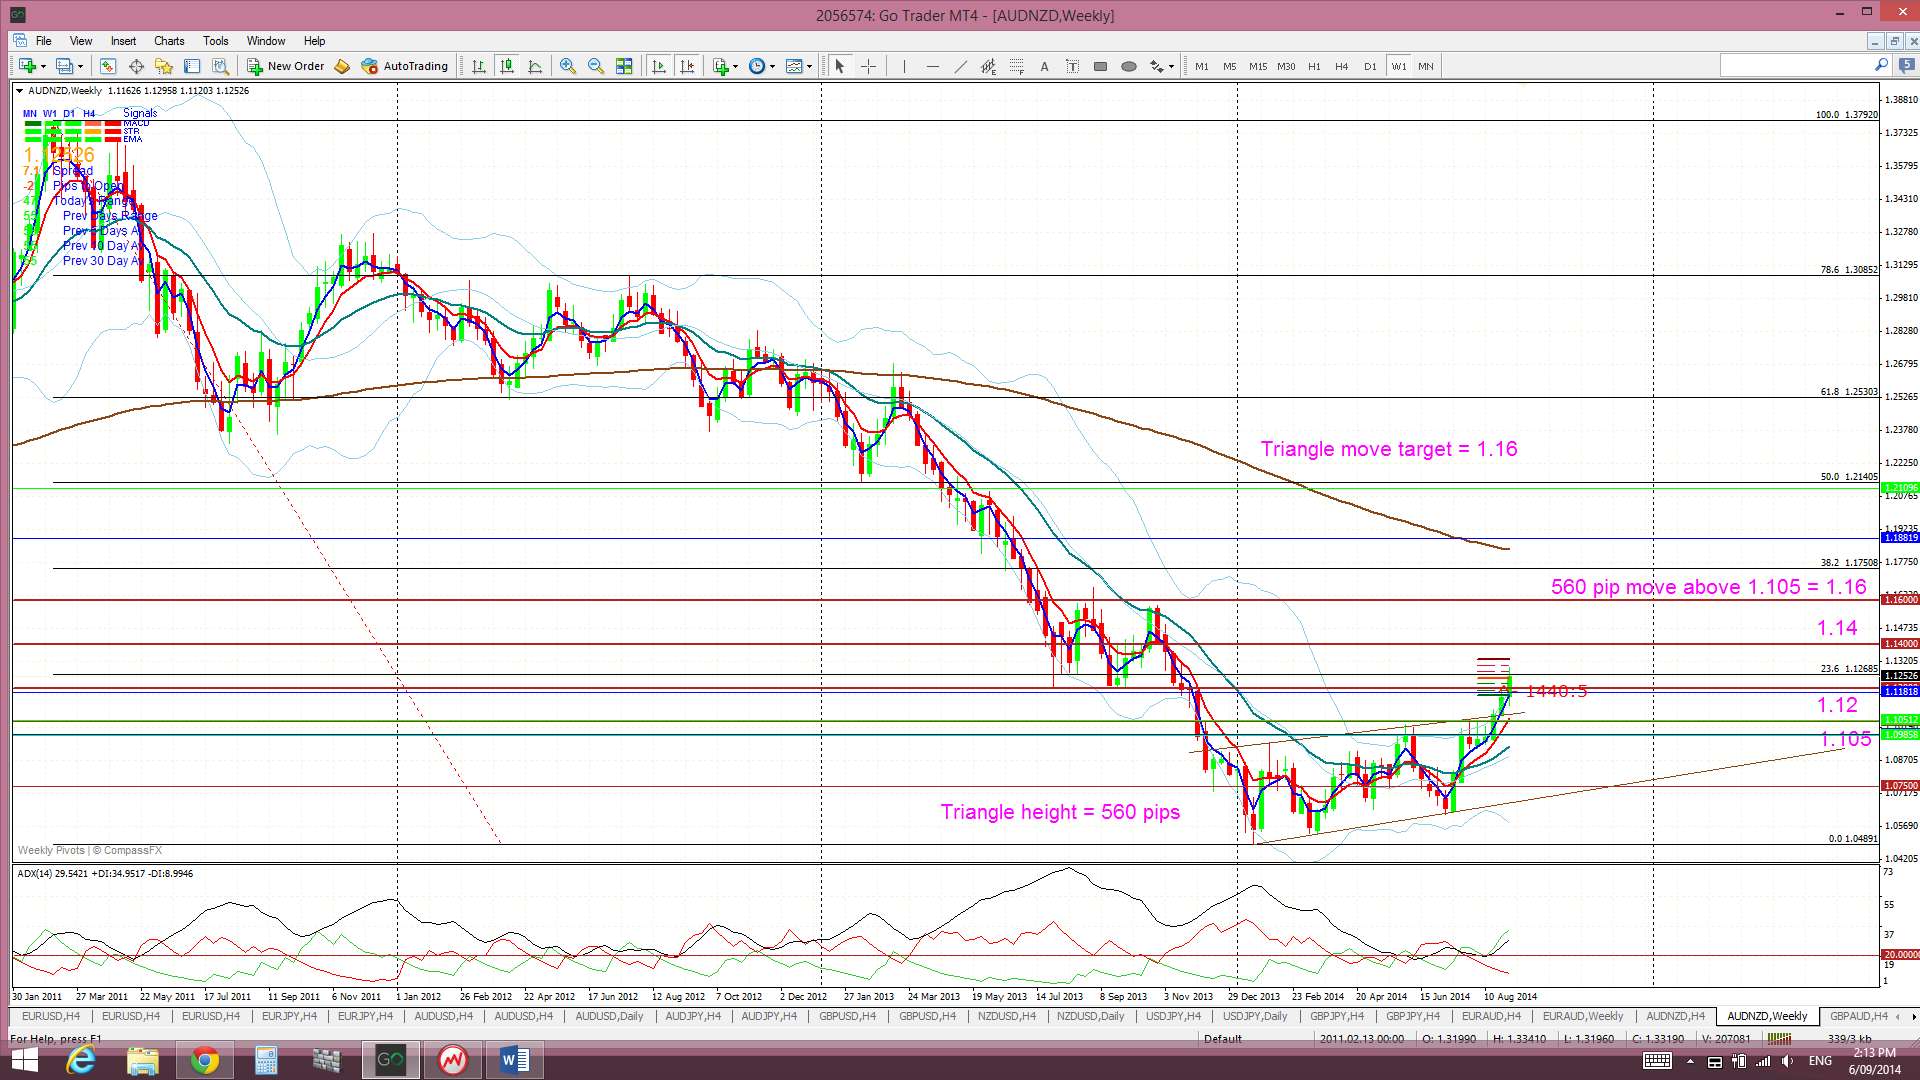
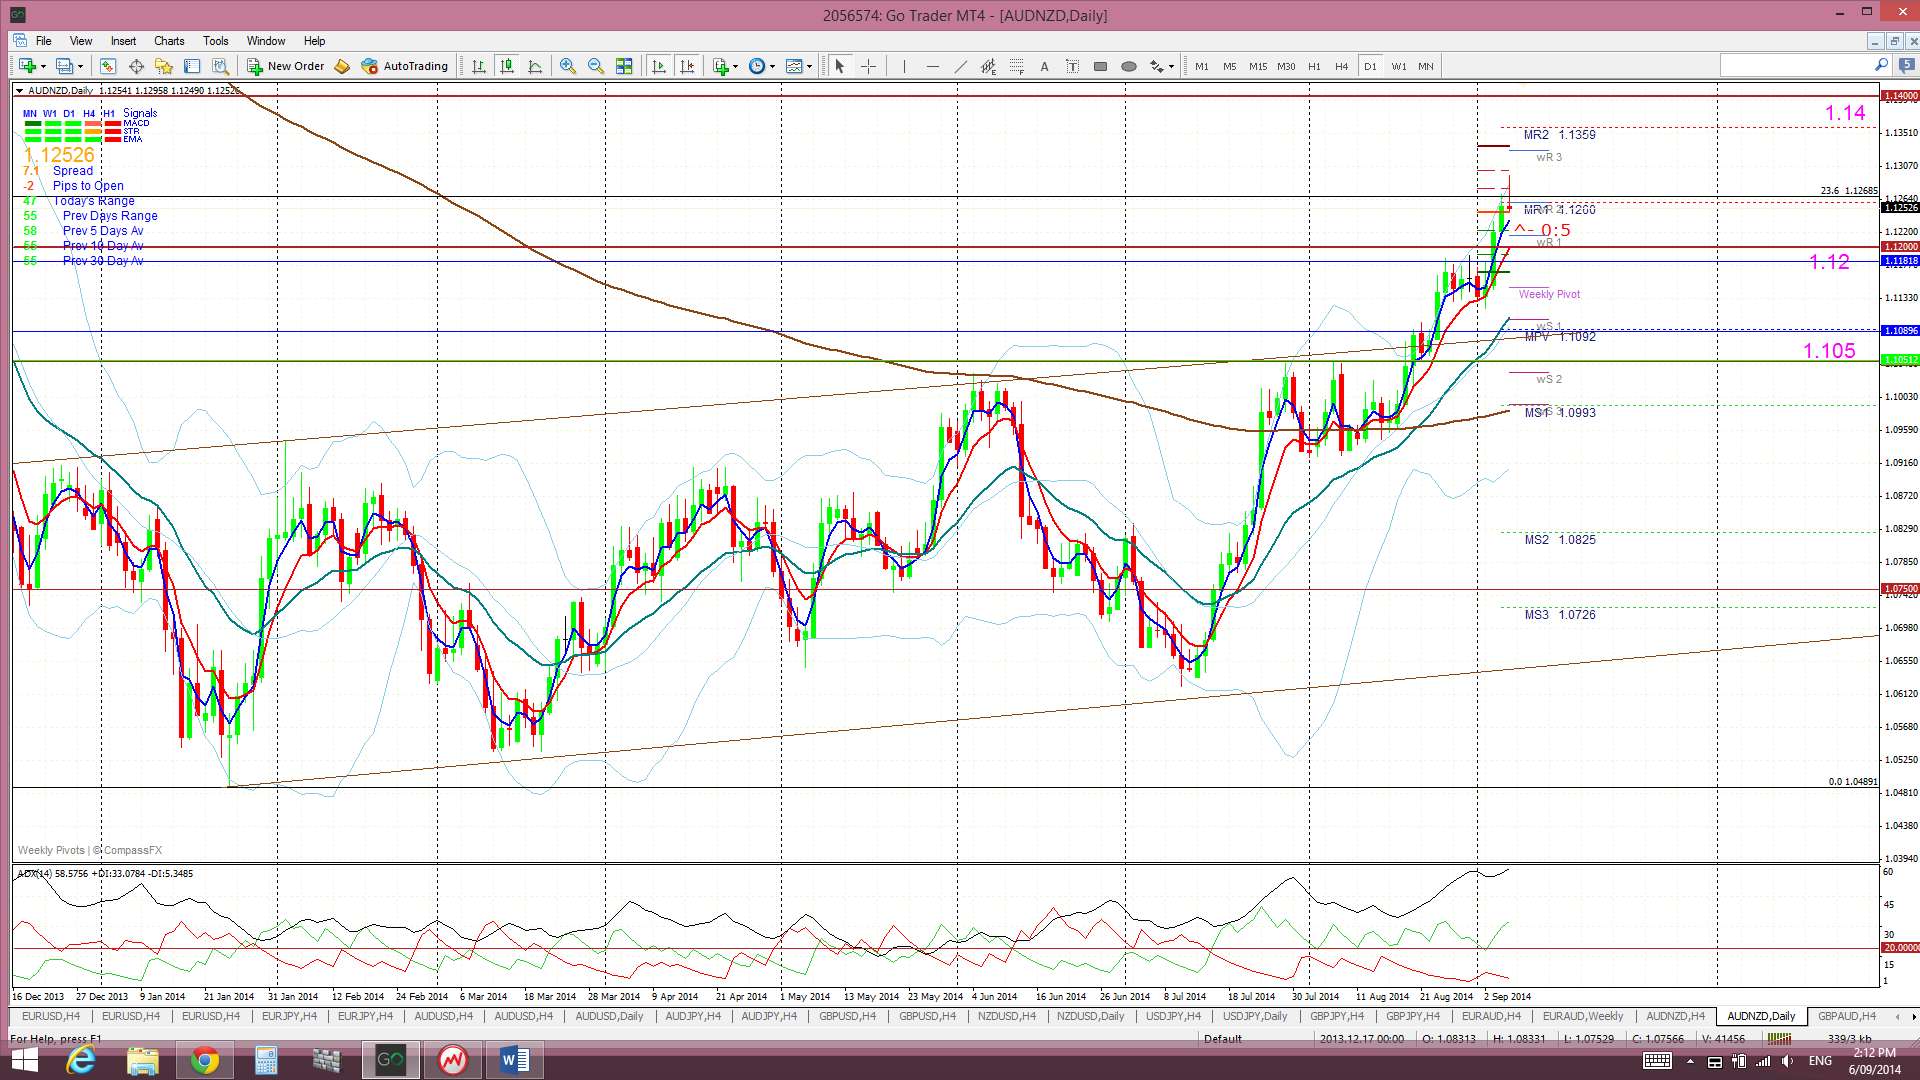
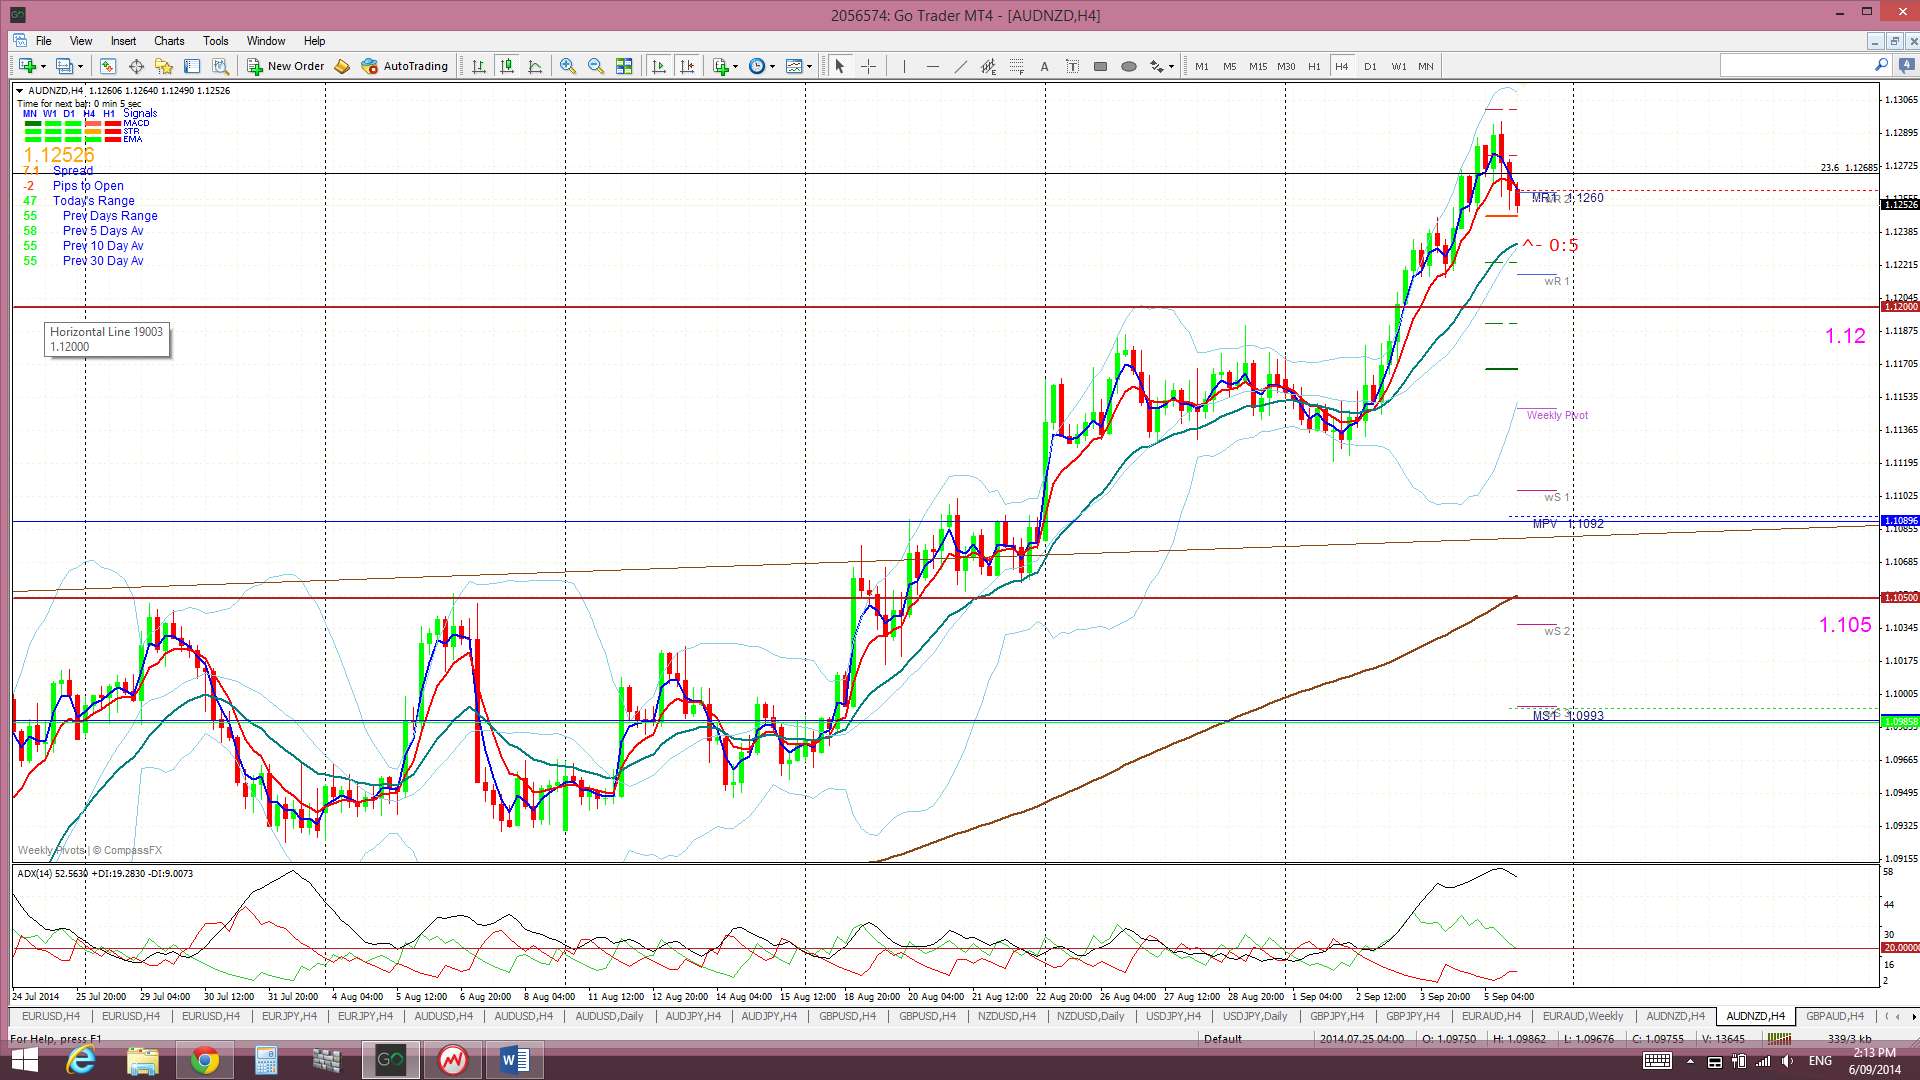
AUD/NZD: Price has continued to rally since closing above the 1.105 and making the bullish ascending triangle breakout. I reviewed this pair on Friday and this article can be found through the following link. Essentially though, I’m looking at the 1.16 level as the target for this bullish triangle breakout move.
The RBNZ announce their NZD interest rate decision on Thursday and this could impact on this move so needs to be monitored. This might be sufficient to trigger a test of the 1.12 level before possible continuation.
Bullish ascending triangle move: The AUD/NZD made a bullish ascending triangle breakout when it closed and held above the 1.105 level. The height of this triangle was about 560 pips. Thus, technical theory would suggest to extrapolate by this order of magnitude up from the 1.105 level so as to determine the possible bullish target for this move. 560 pips above the 1.105 level is at about 1.16, a nice whole number value and previous S/R for this pair. The breakout move has already delivered over 200 pips so there are plenty more here, potentially, on offer.
The AUD/NZD is still trading above the Cloud on the 4hr and daily charts which is bullish. The AUD/NZD continues to move up through broad weekly Cloud and so any bullish continuation move could still be a bit choppy.
The weekly candle closed as a bullish candle.
- I’m watching for any new TC signal, the 1.12 and the 1.16 levels.
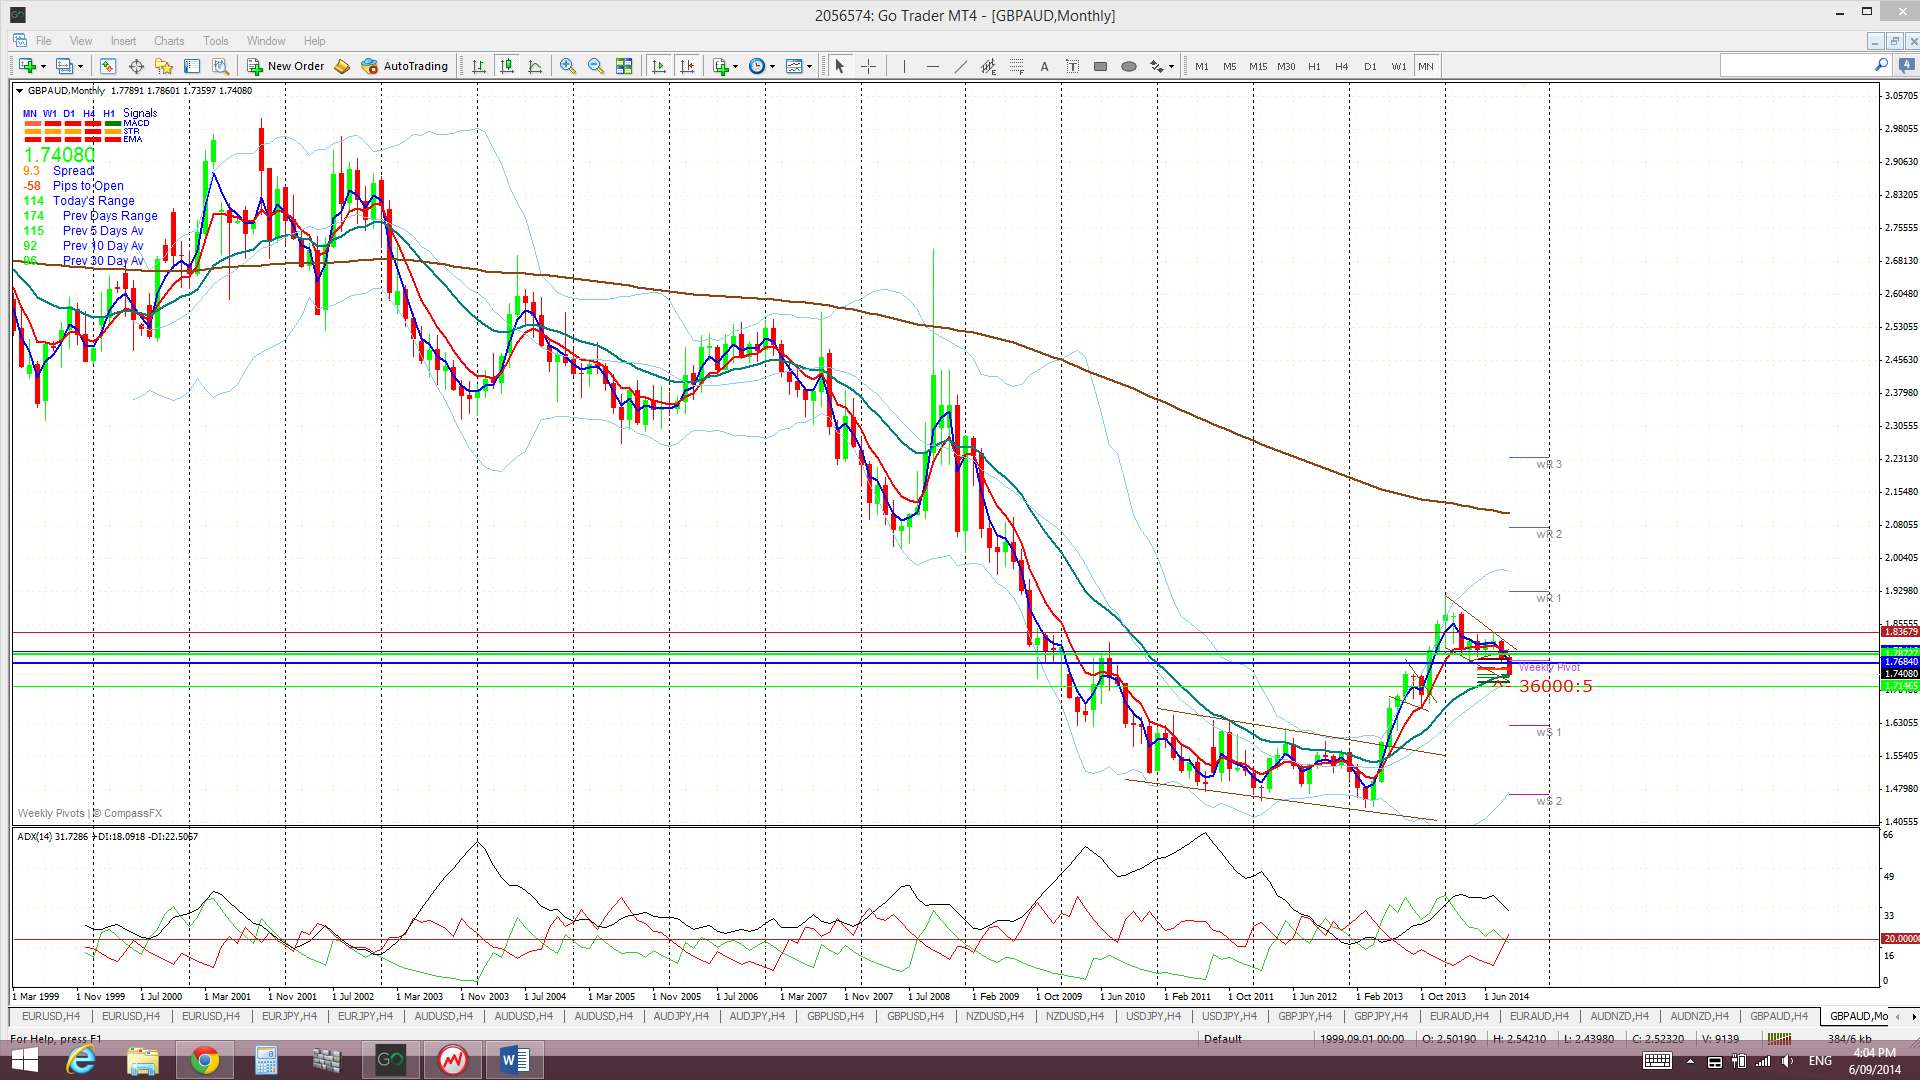
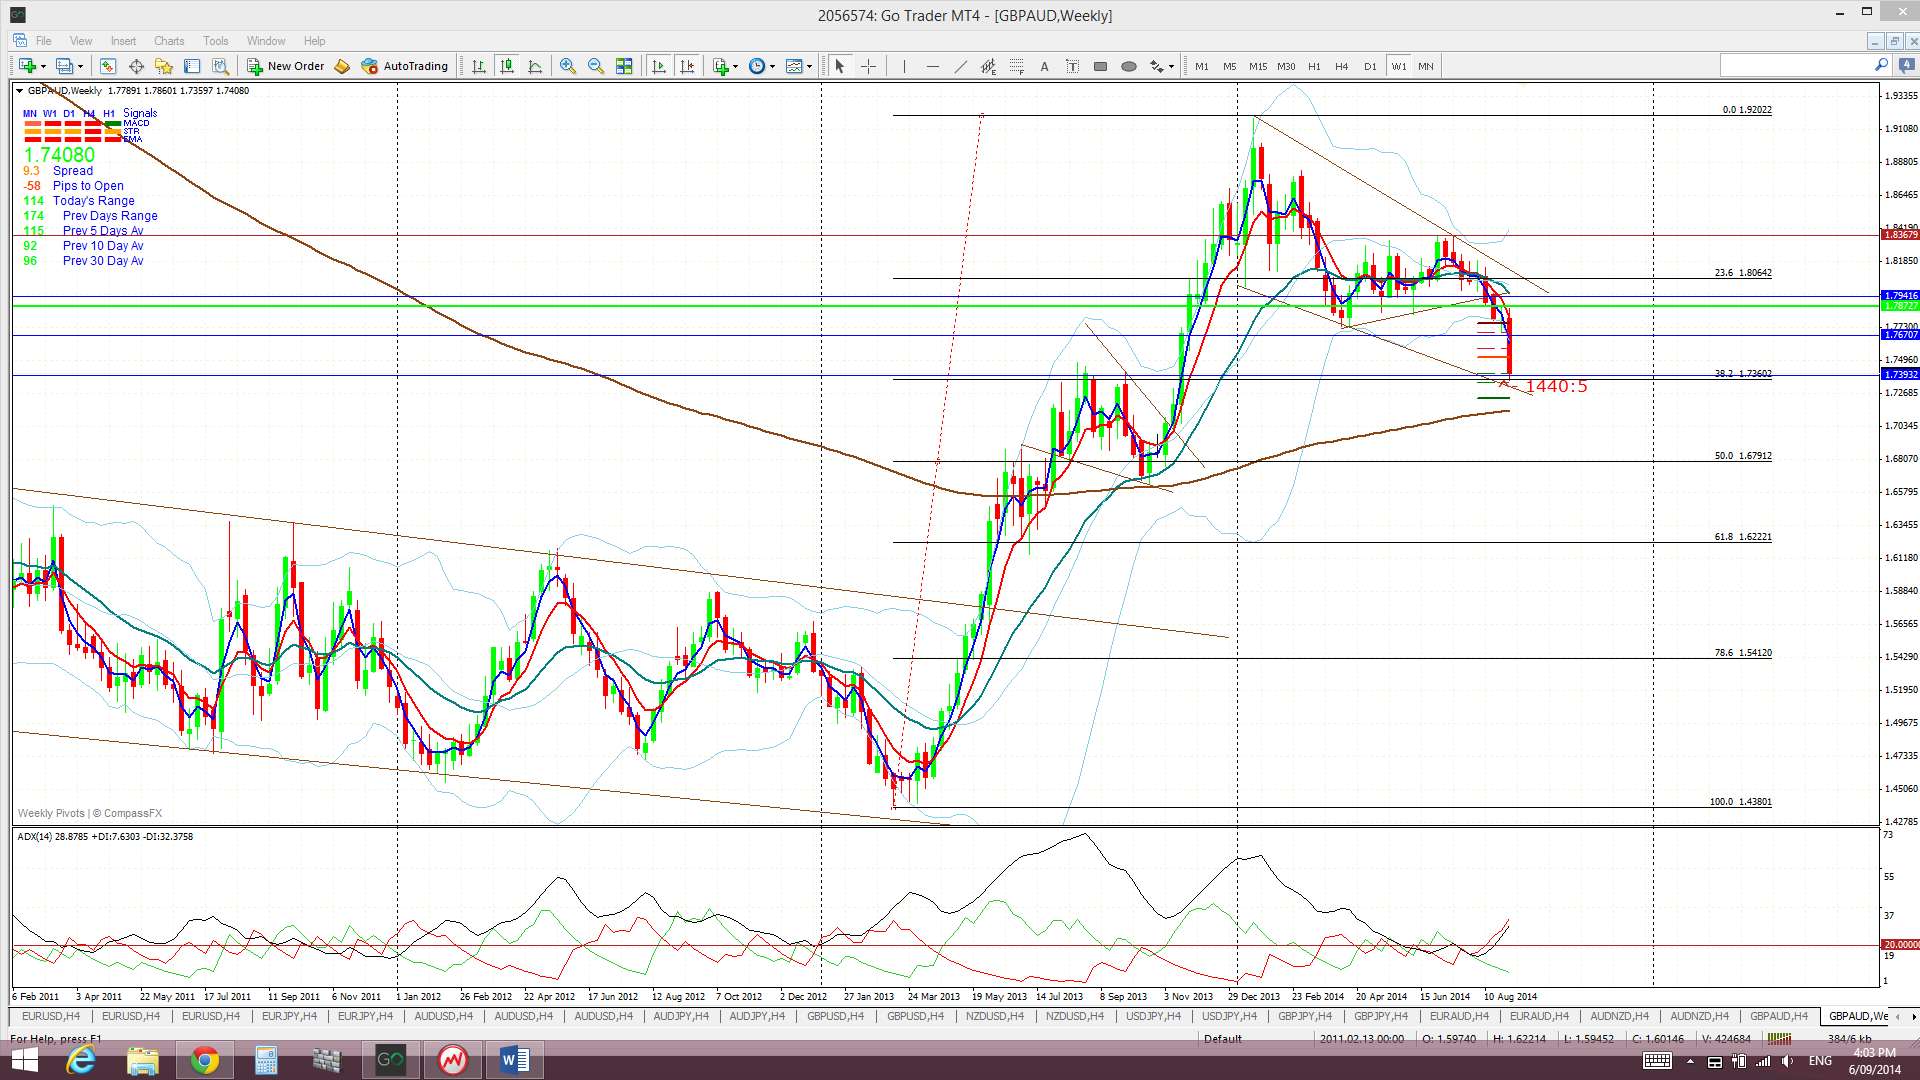
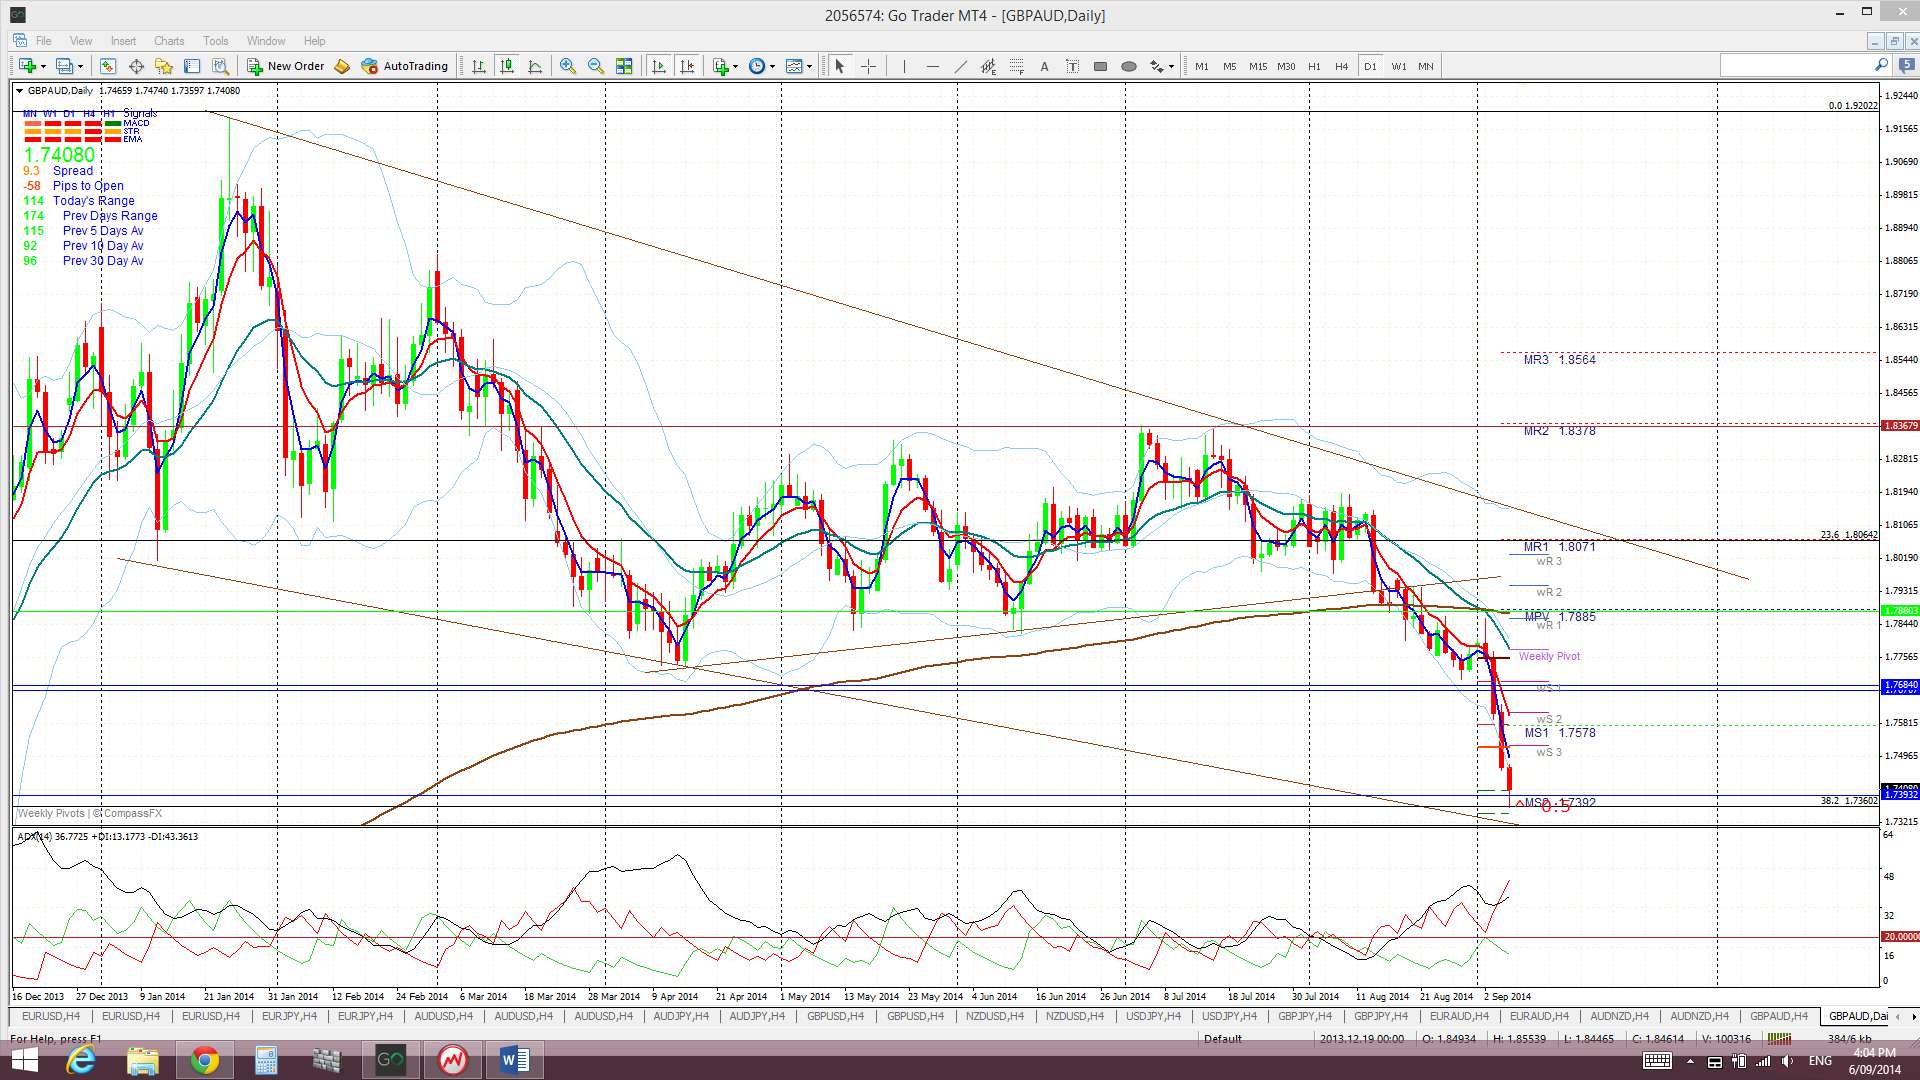
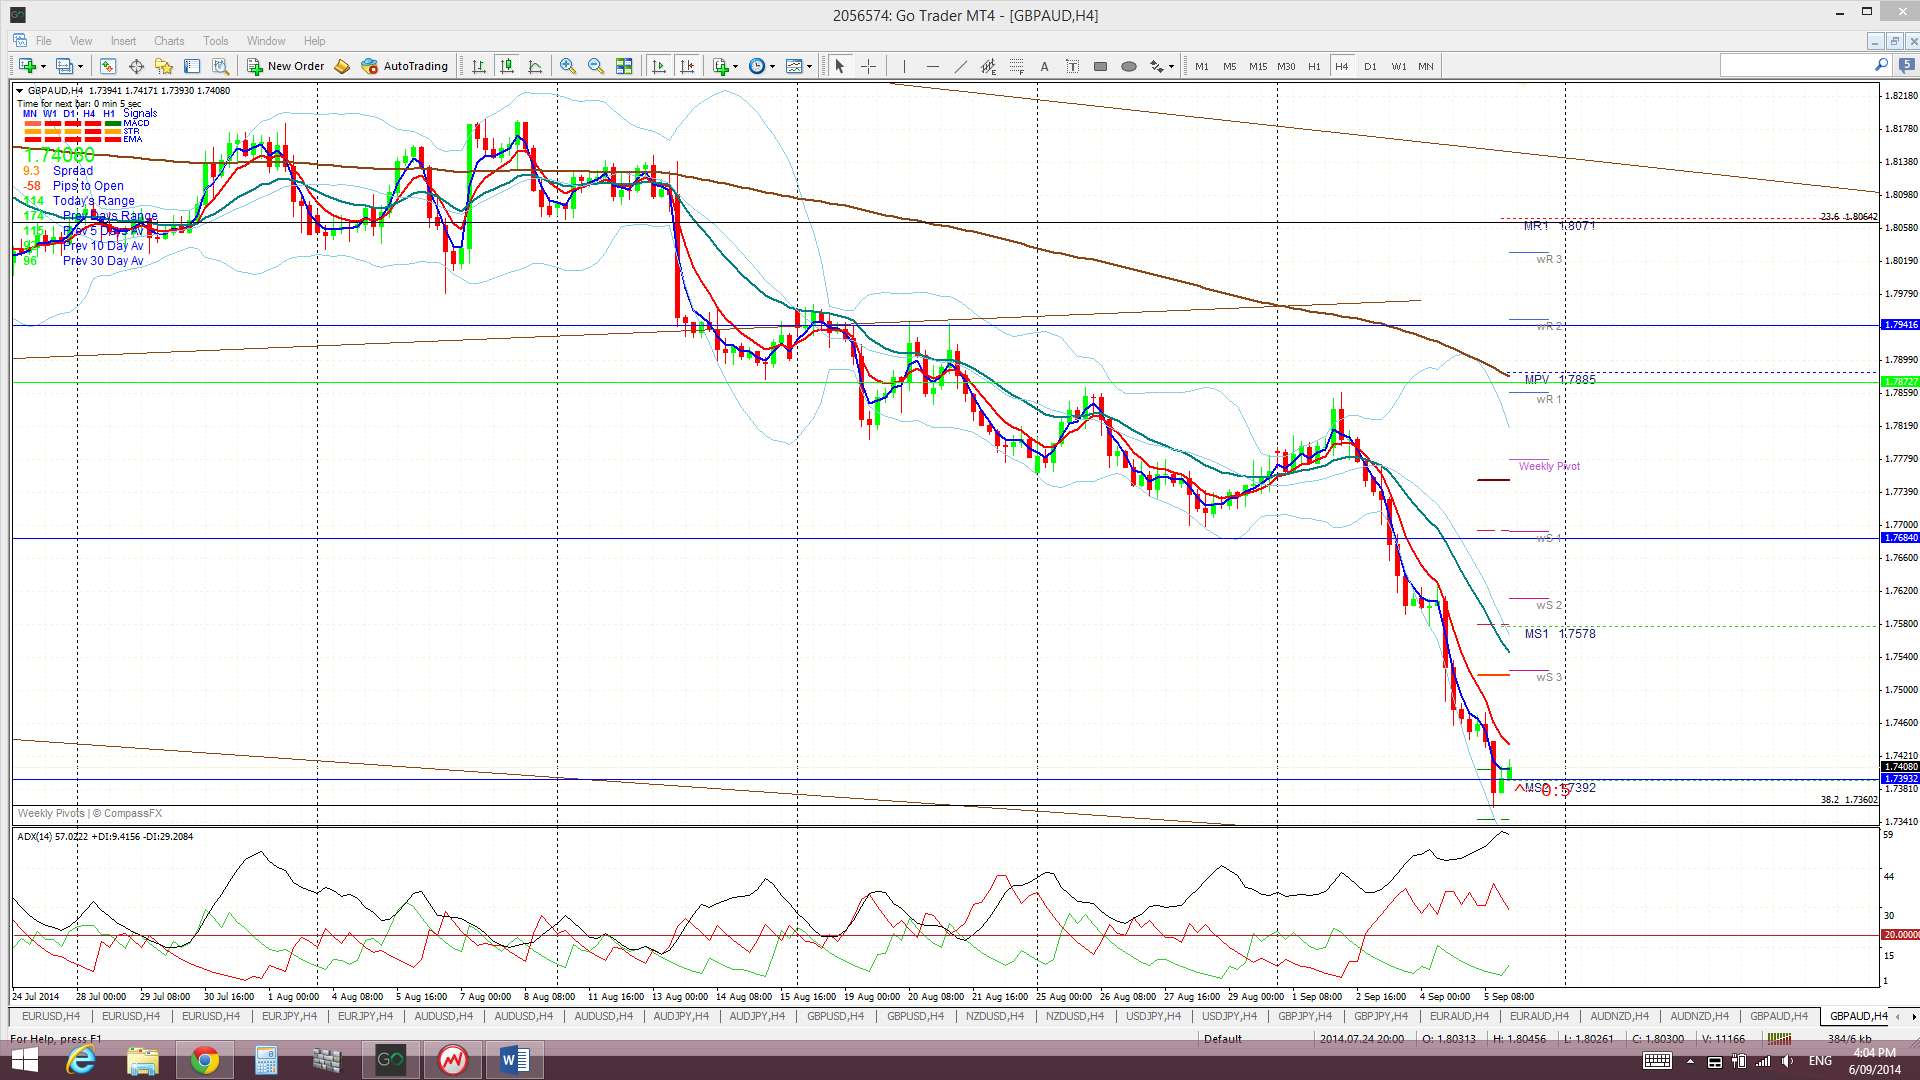
GBP/AUD: This pair suffered a substantial fall last week but continued trading within the daily chart’s descending trading channel pattern. It is reaching down to the bottom trend line support here so watch for any reaction at this region. Unfortunately I missed seeing a TC signal on this pair during the week.
The GBP/AUD is trading at other interesting levels apart from trading at the bottom trend line of the trading channel. The first to mention is that it is trading just above the 1.74 level and this has been a key S/R level over the last two years as can be seen on the weekly chart. Secondly, the GBP/AUD is trading just above the 38.2% fib level of the recent 2013 bull move. Thus, there is a lot of support below current price and a breach of this support would be very bearish. Traders need to watch for any close and hold below the 1.74 level for shorting opportunities.
Price is still trading below the Ichimoku Cloud on the 4hr and daily charts.
The weekly candle closed as a large bearish engulfing candle.
- I’m watching for any new TC signal, the trading channel trend lines and the 1.74 level.
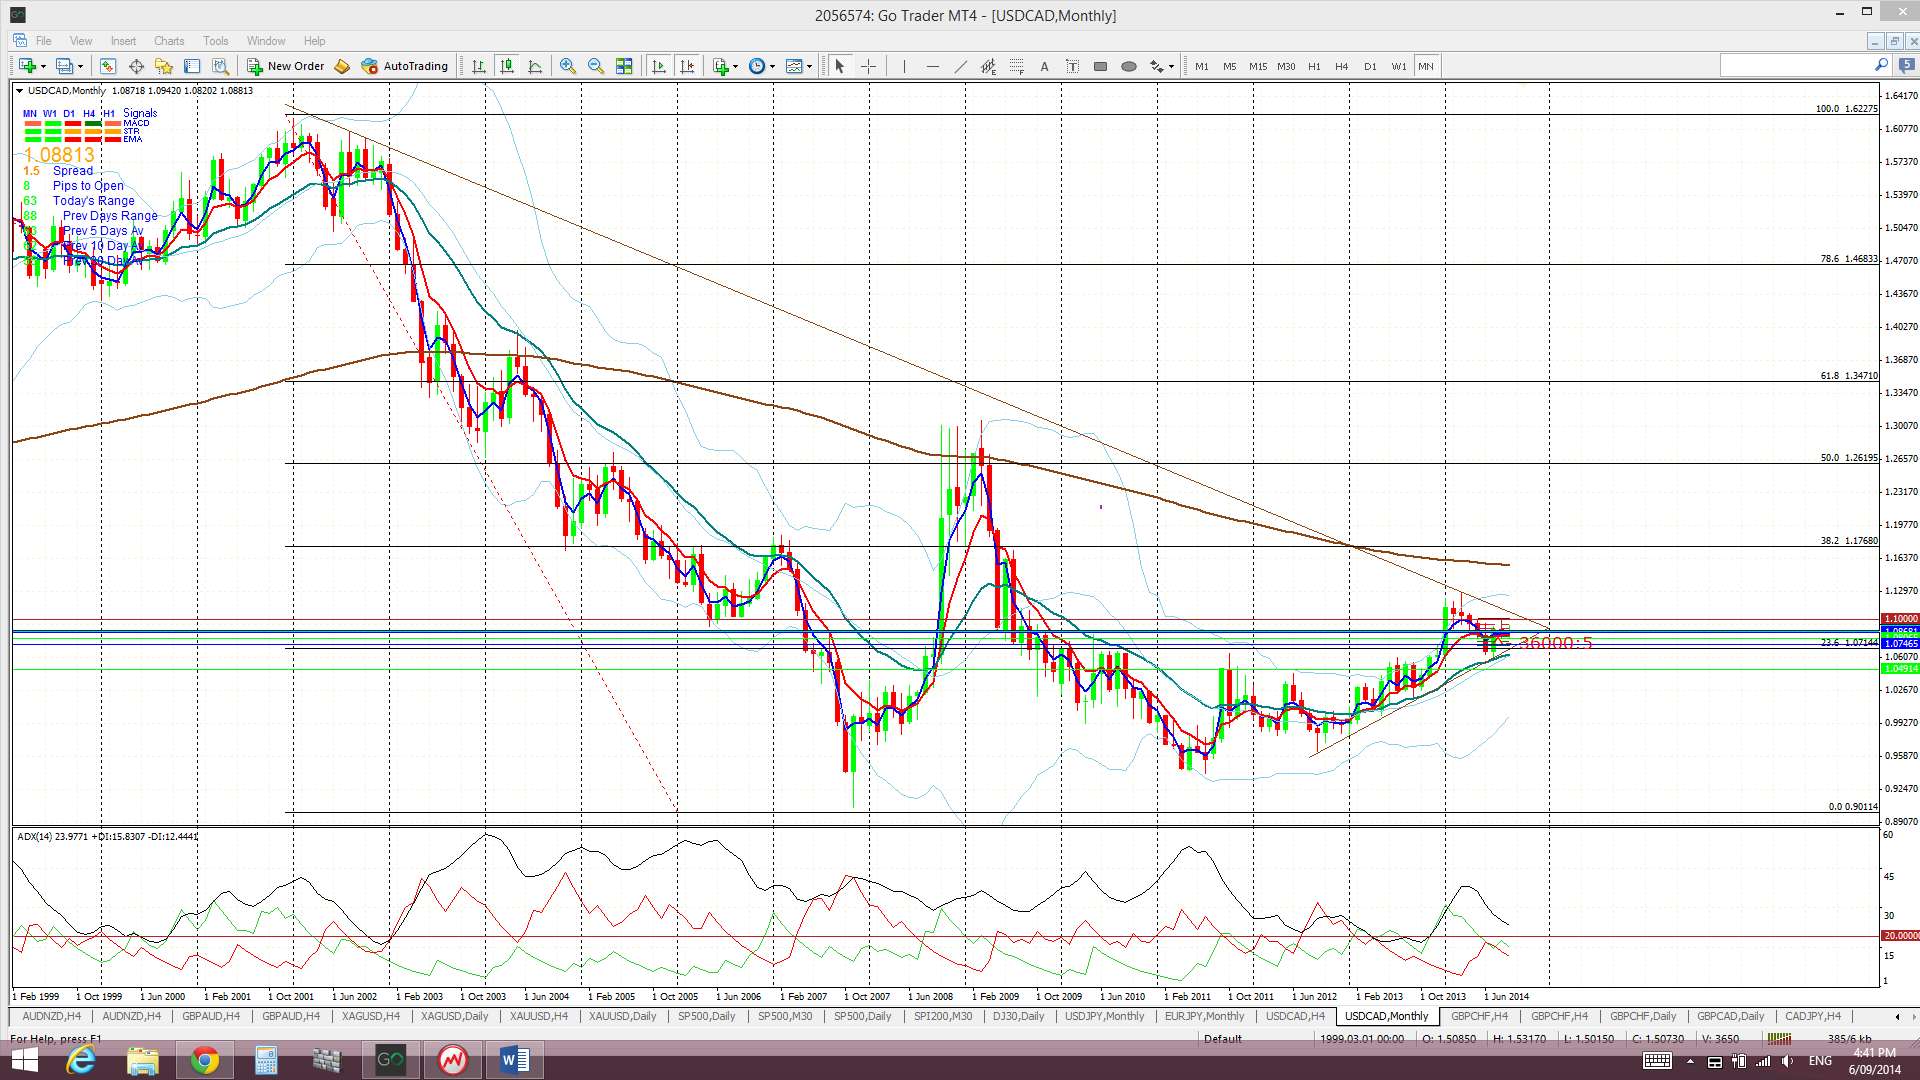
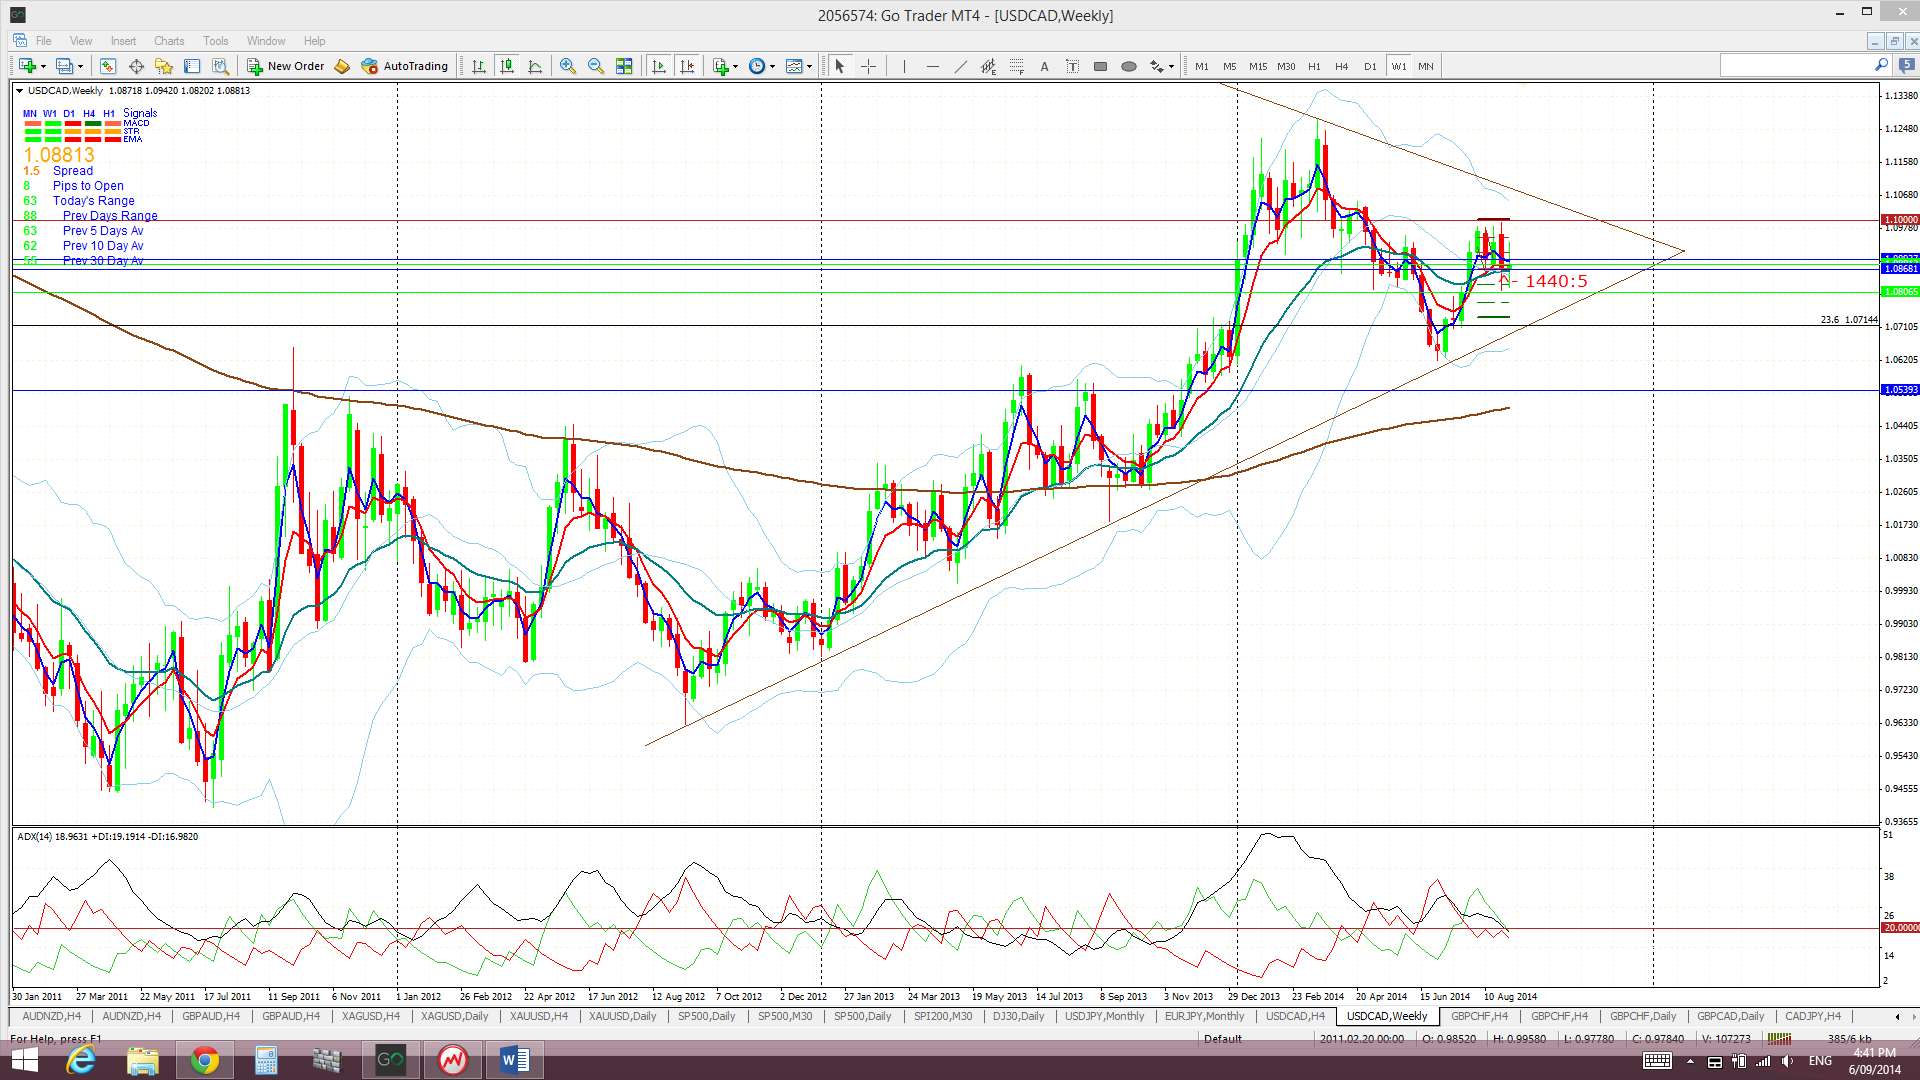
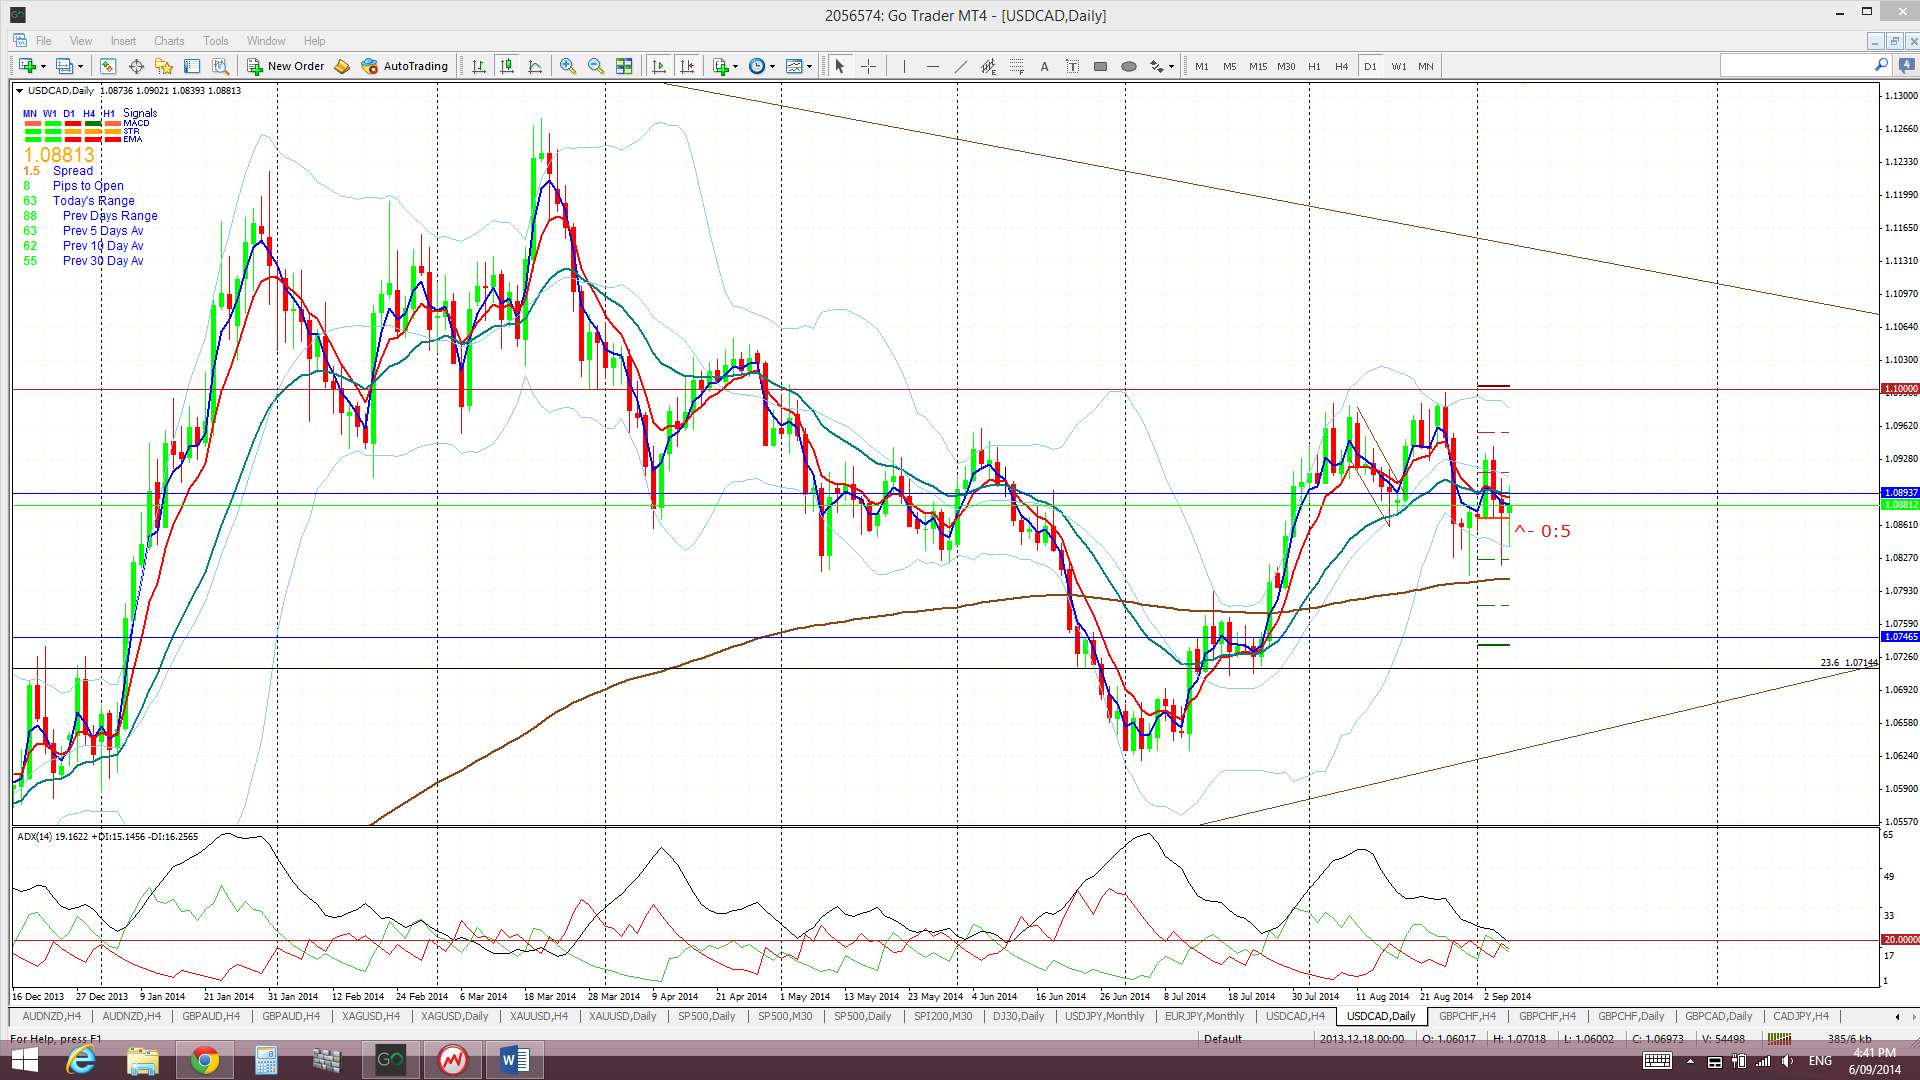
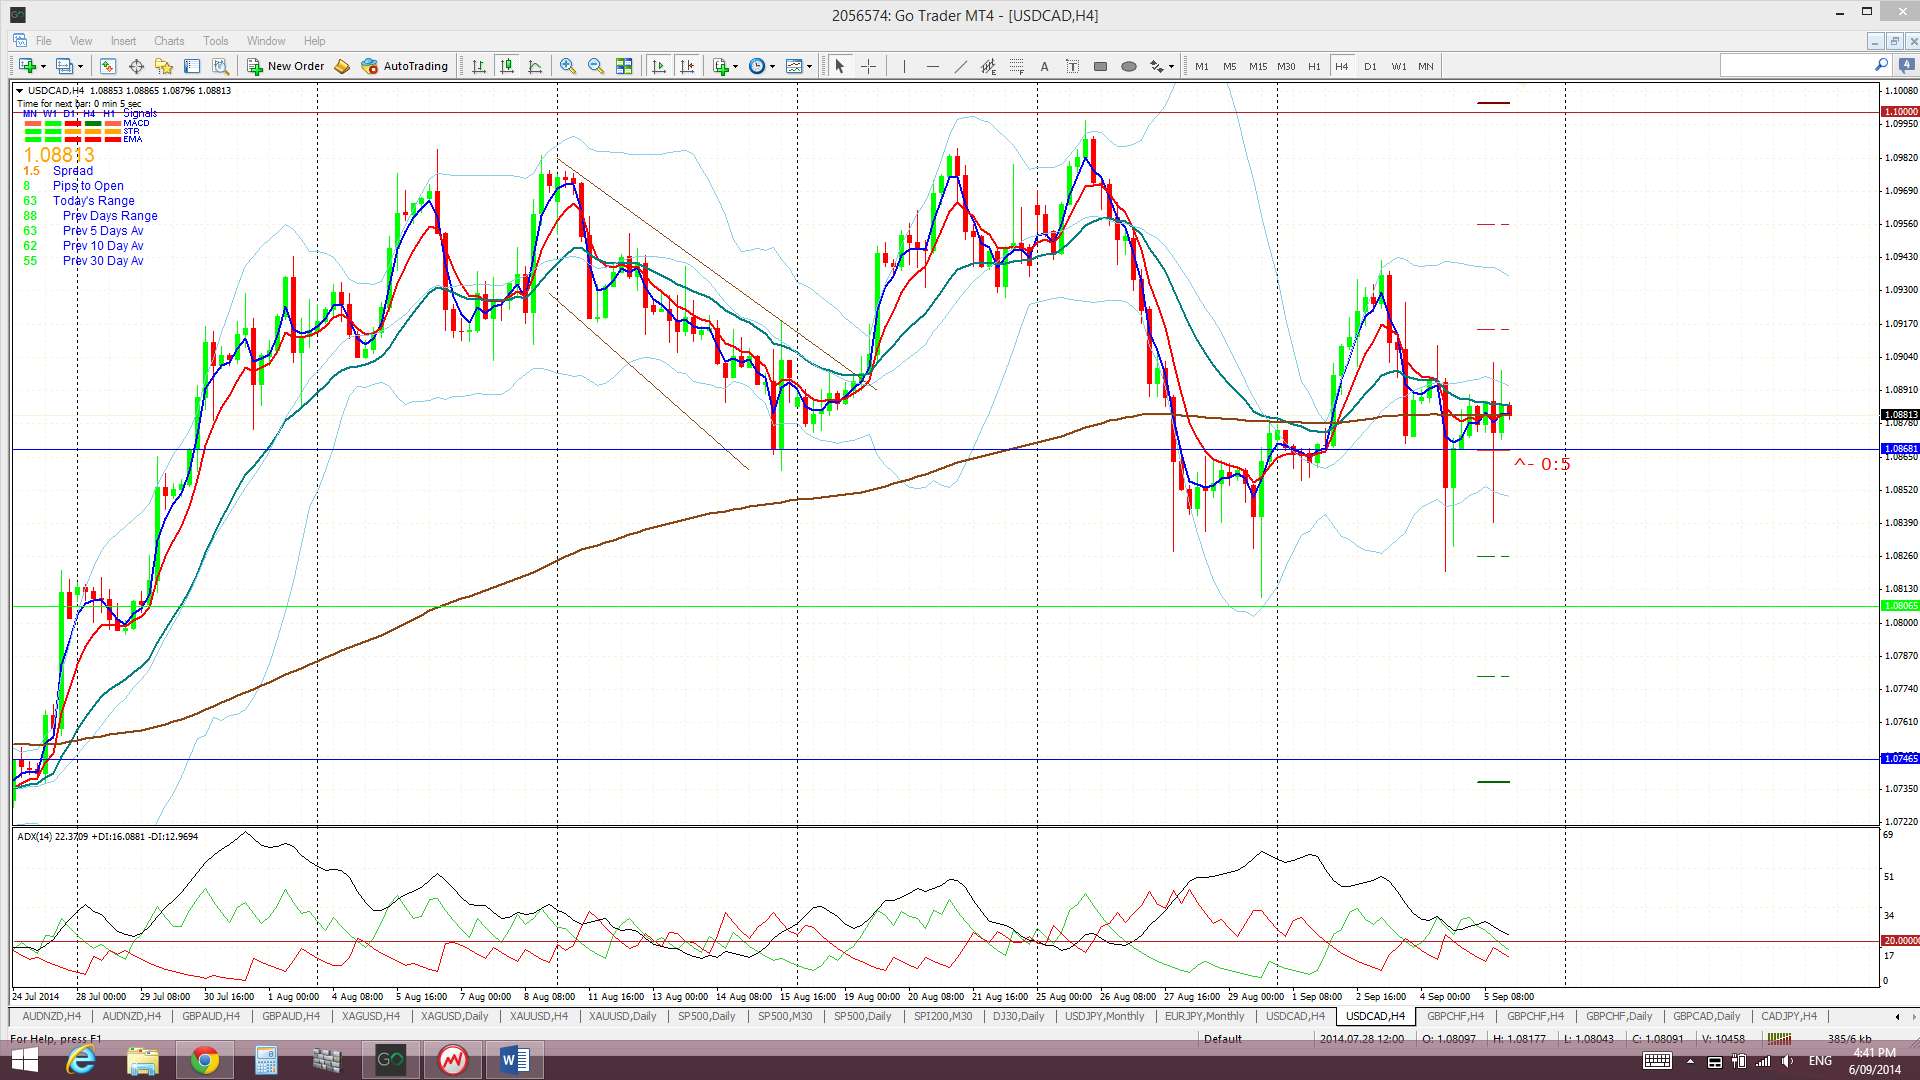
Loonie USD/CAD: I have been saying for the last few weeks that the Loonie might continue being choppy given it is edging towards the apex of the monthly chart’s triangle pattern. This is exactly what we continue to see as last week price chopped up and down but still under the key 1.10 resistance level. Check out all the long shadows on the daily candles!
The bear trend line of the triangle pattern is still about 250 pips above current price BUT has been in play since 2001. Hence the importance of this resistance and the building choppiness.
Price is now trading in the Cloud on the 4hr chart but above on the daily chart suggesting choppiness.
The weekly candle closed as a bullish coloured ‘Spinning Top’ candle reflecting this recent choppiness and indecision.
- I’m watching for any new TC signal and the monthly chart’s triangle pattern.
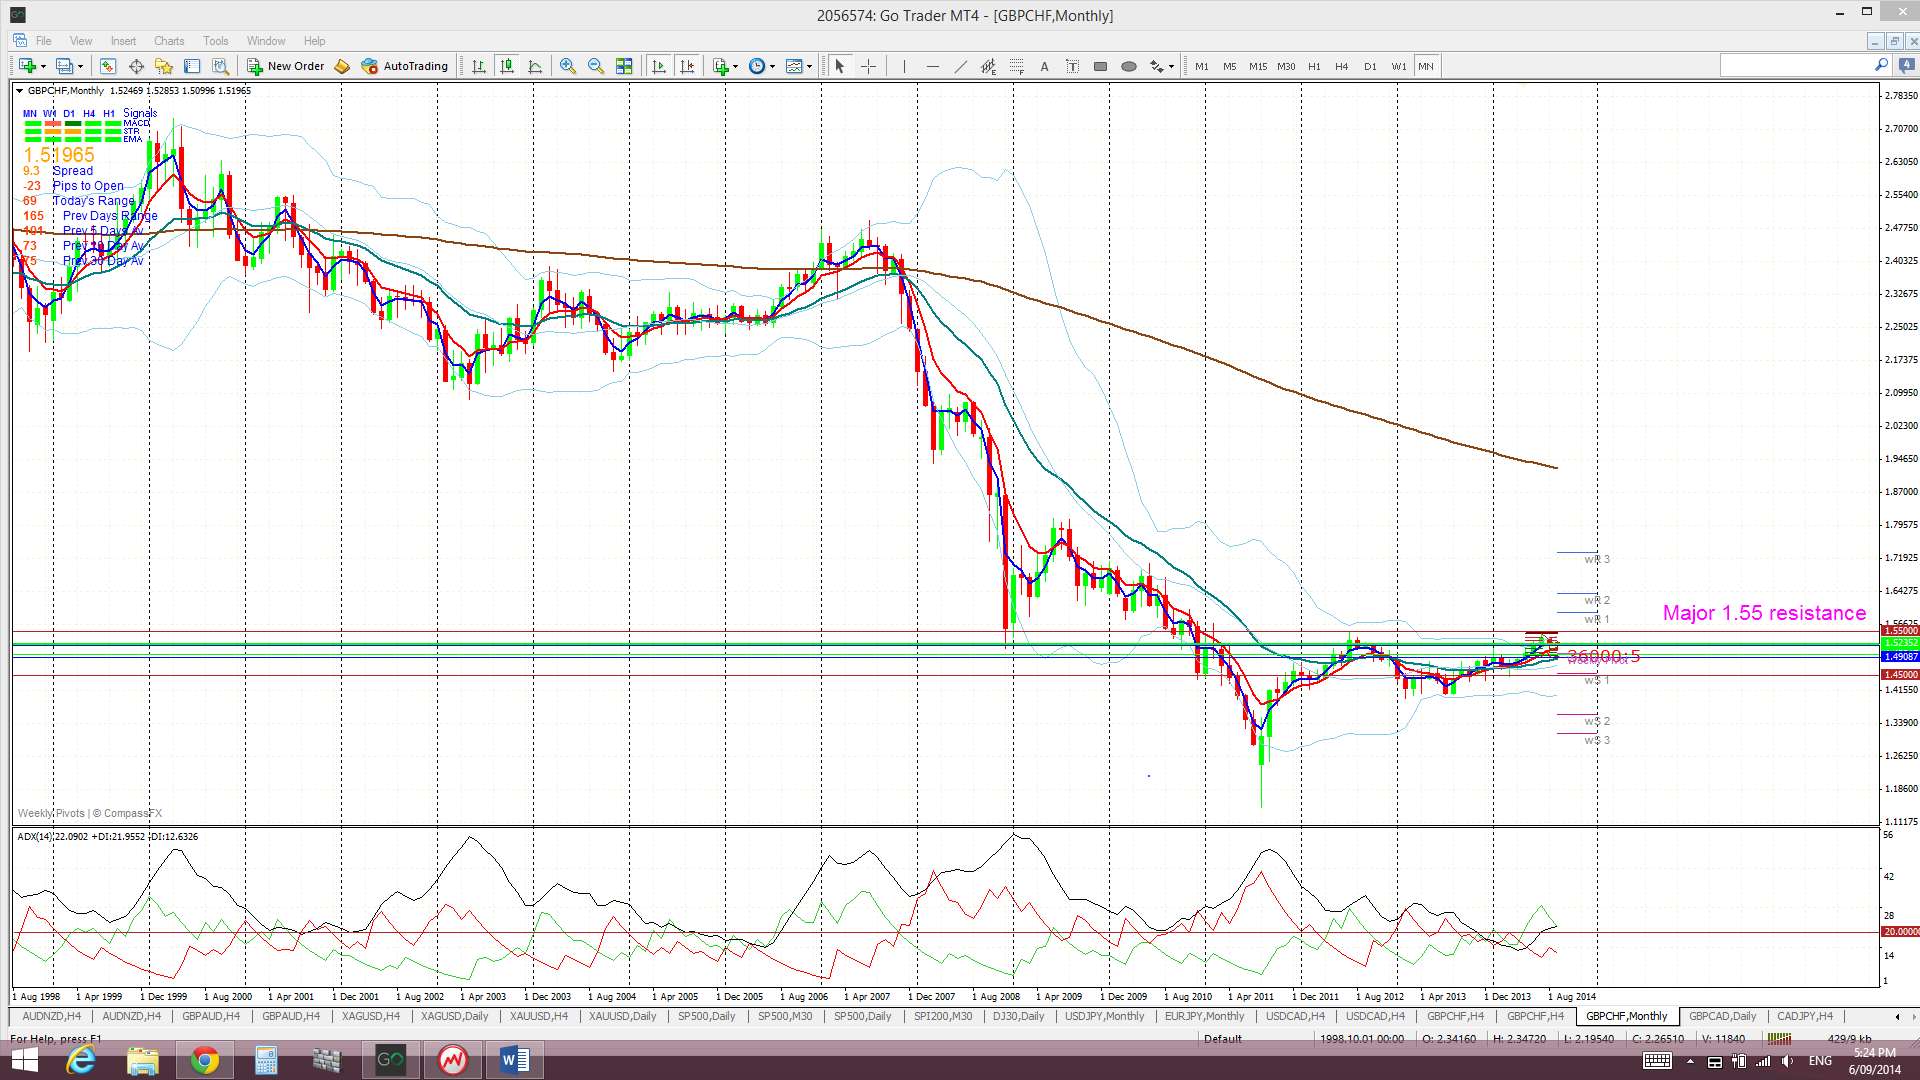
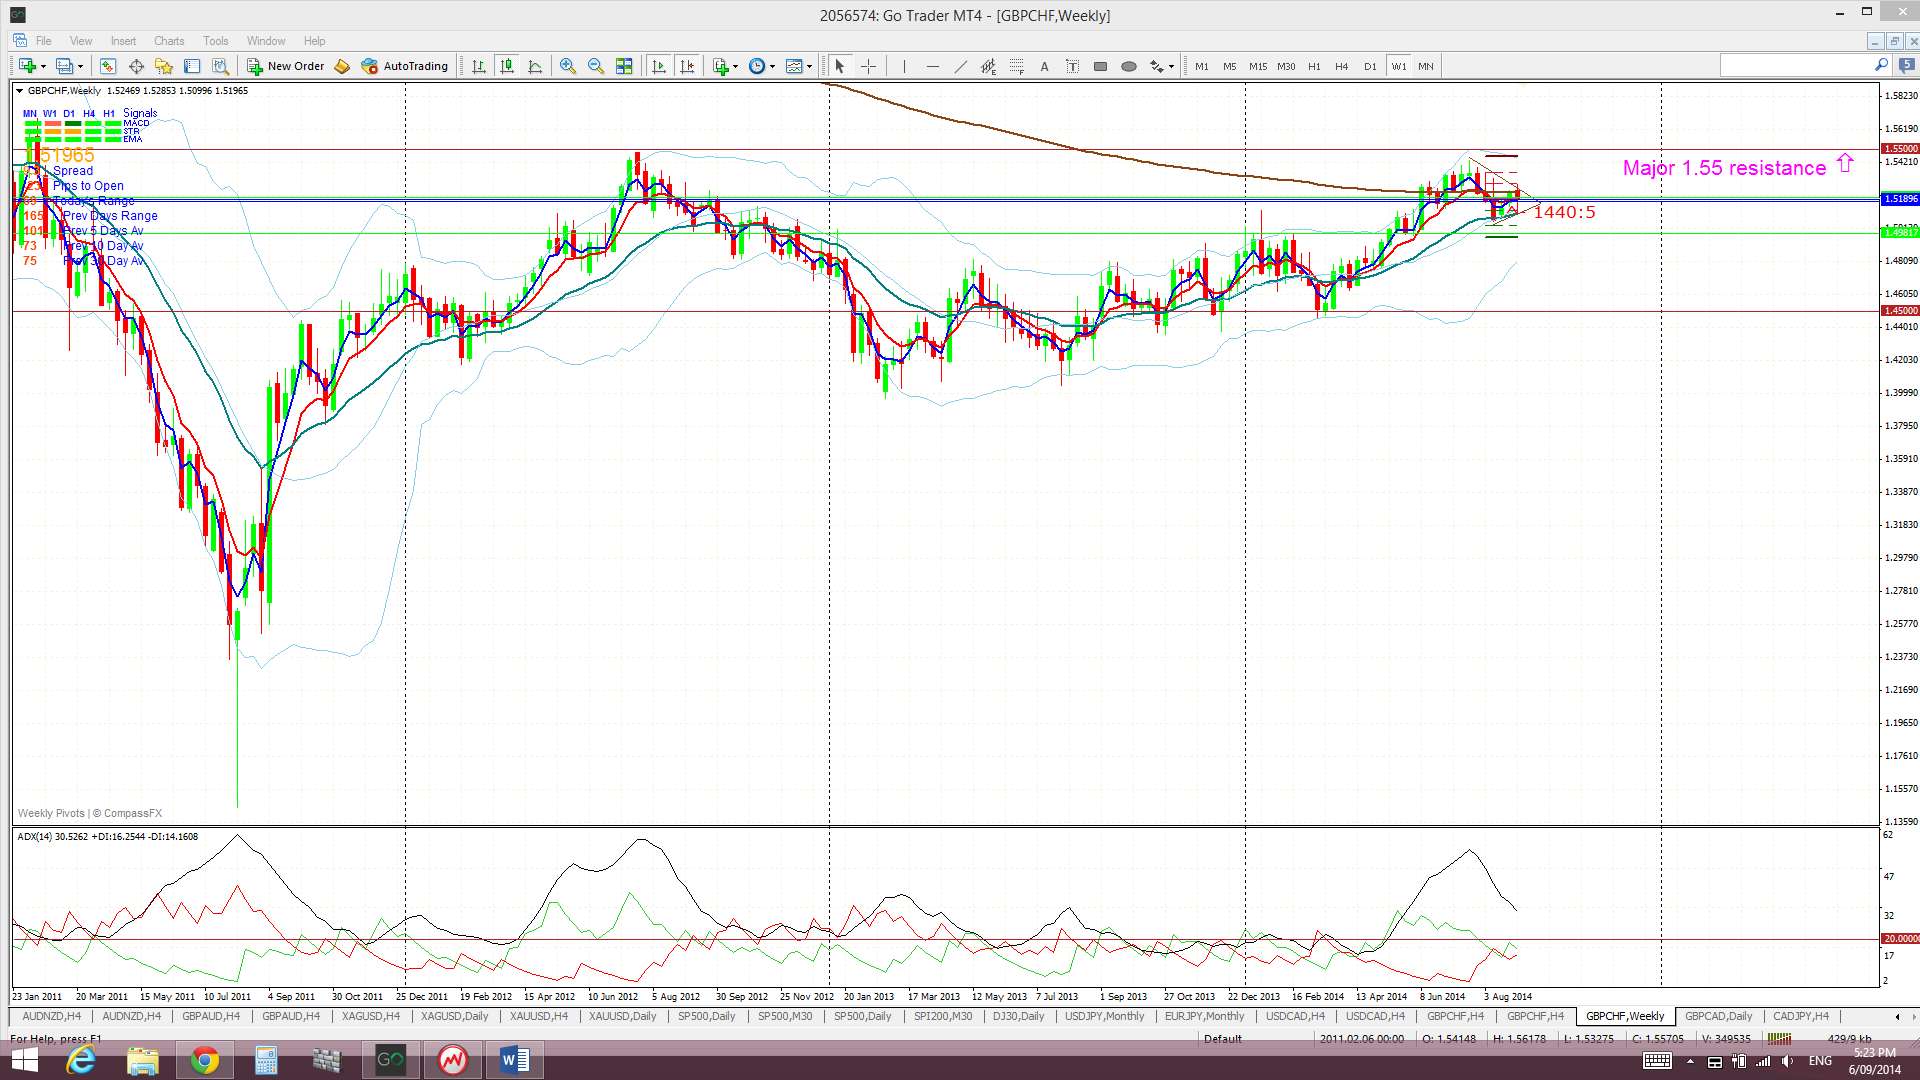
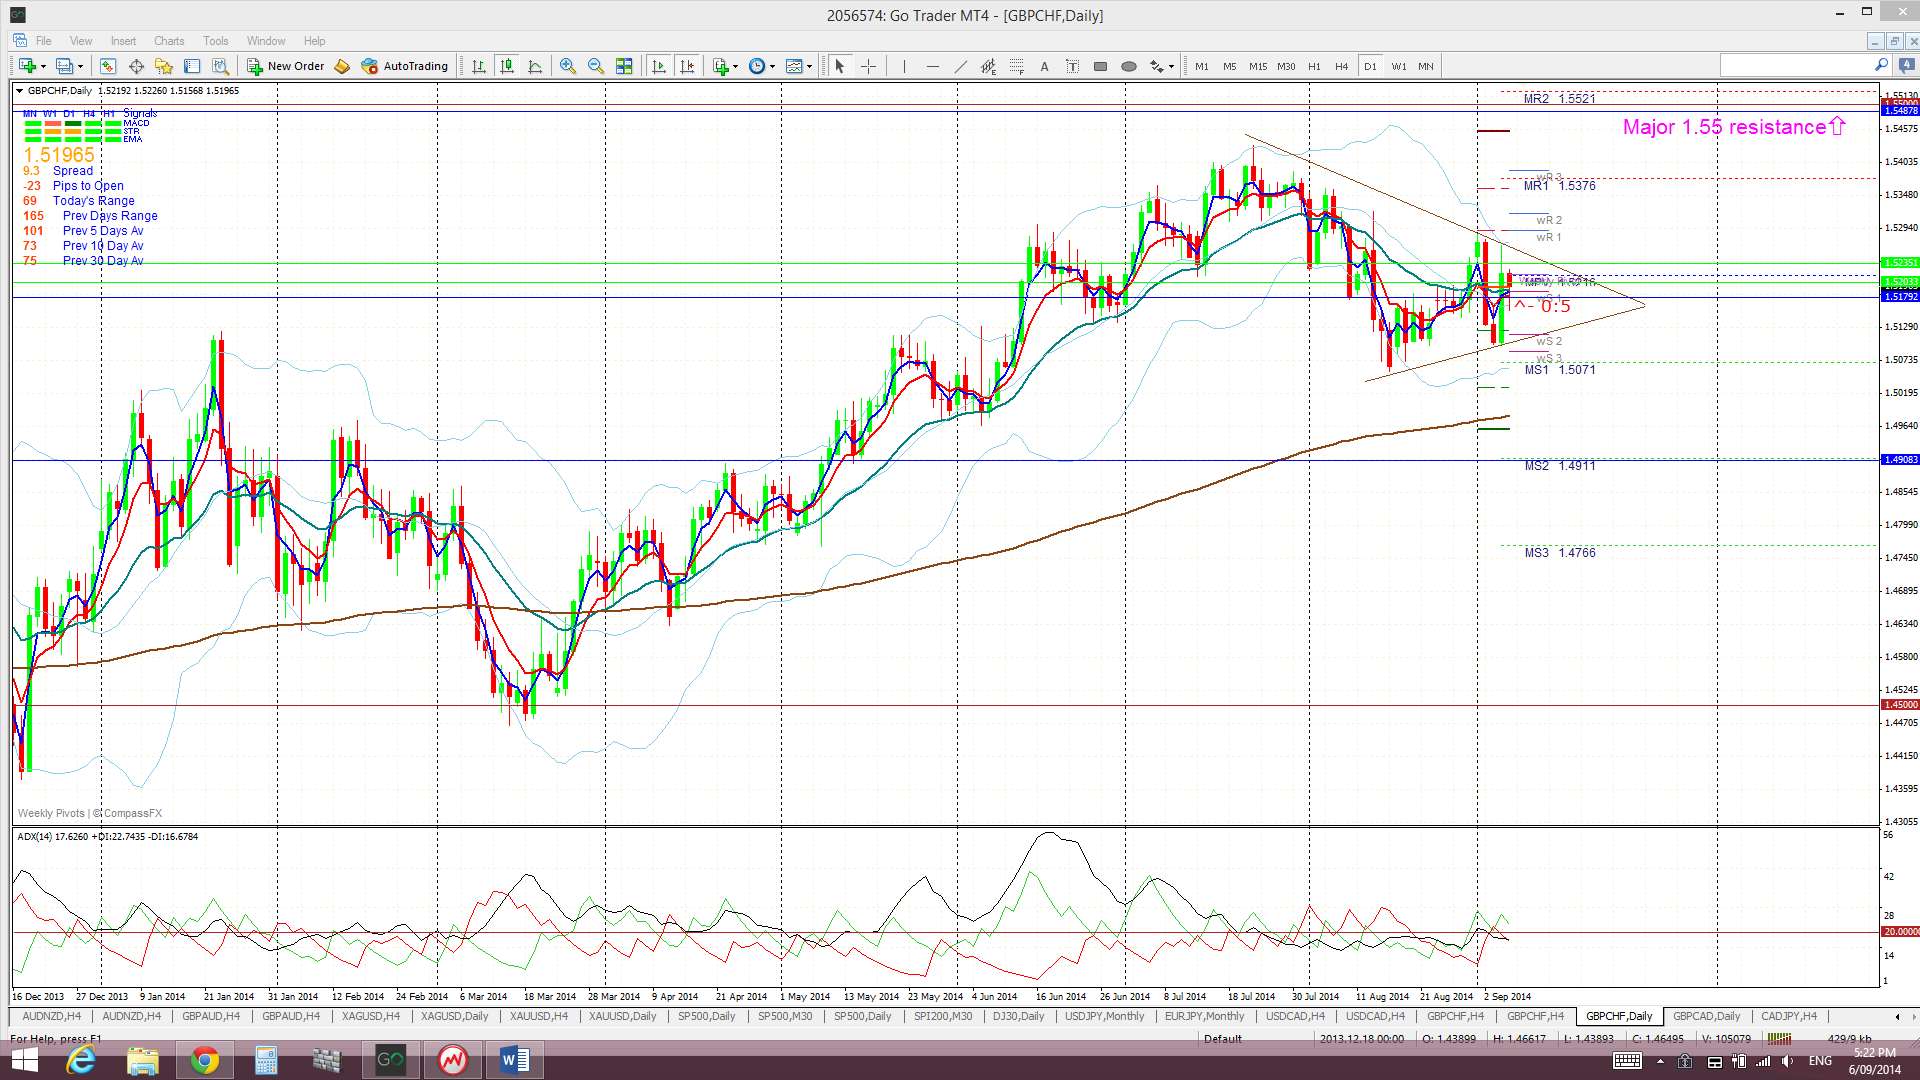
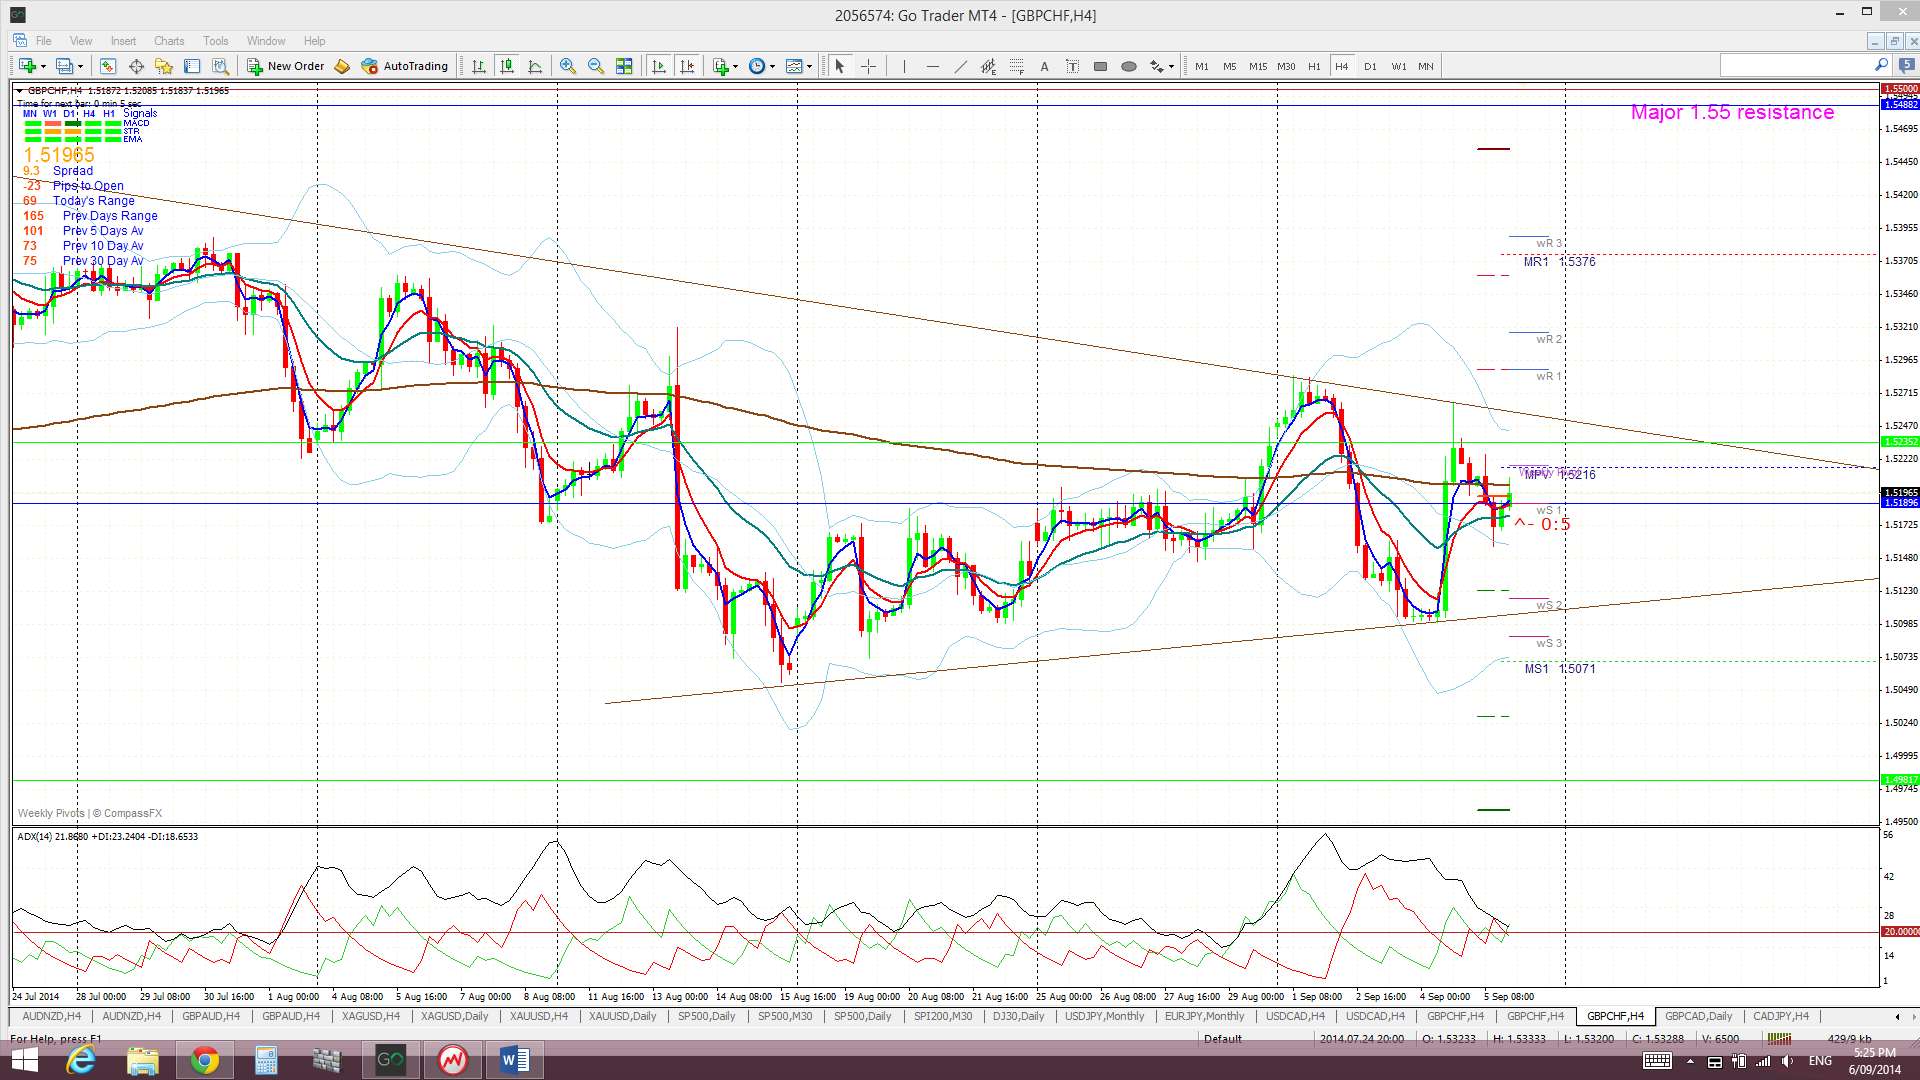
GBP/CHF: The GBP/CHF was choppy last week and suffered falls on GBP weakness. The daily charts how price action is now consolidating within a triangle pattern under the key 1.55 resistance level. Whilst recent action has been on the more bearish side of choppy the daily chart does have another ‘Bull Flag’ look to it again!
The GBP/CHF is now trading in the 4hr Cloud and in the bottom of the Cloud on the daily chart.
The weekly candle closed as a bearish candle with long shadows reflecting this choppiness.
- I’m watching for any new TC signal, the triangle trend lines and the 1.55 level.
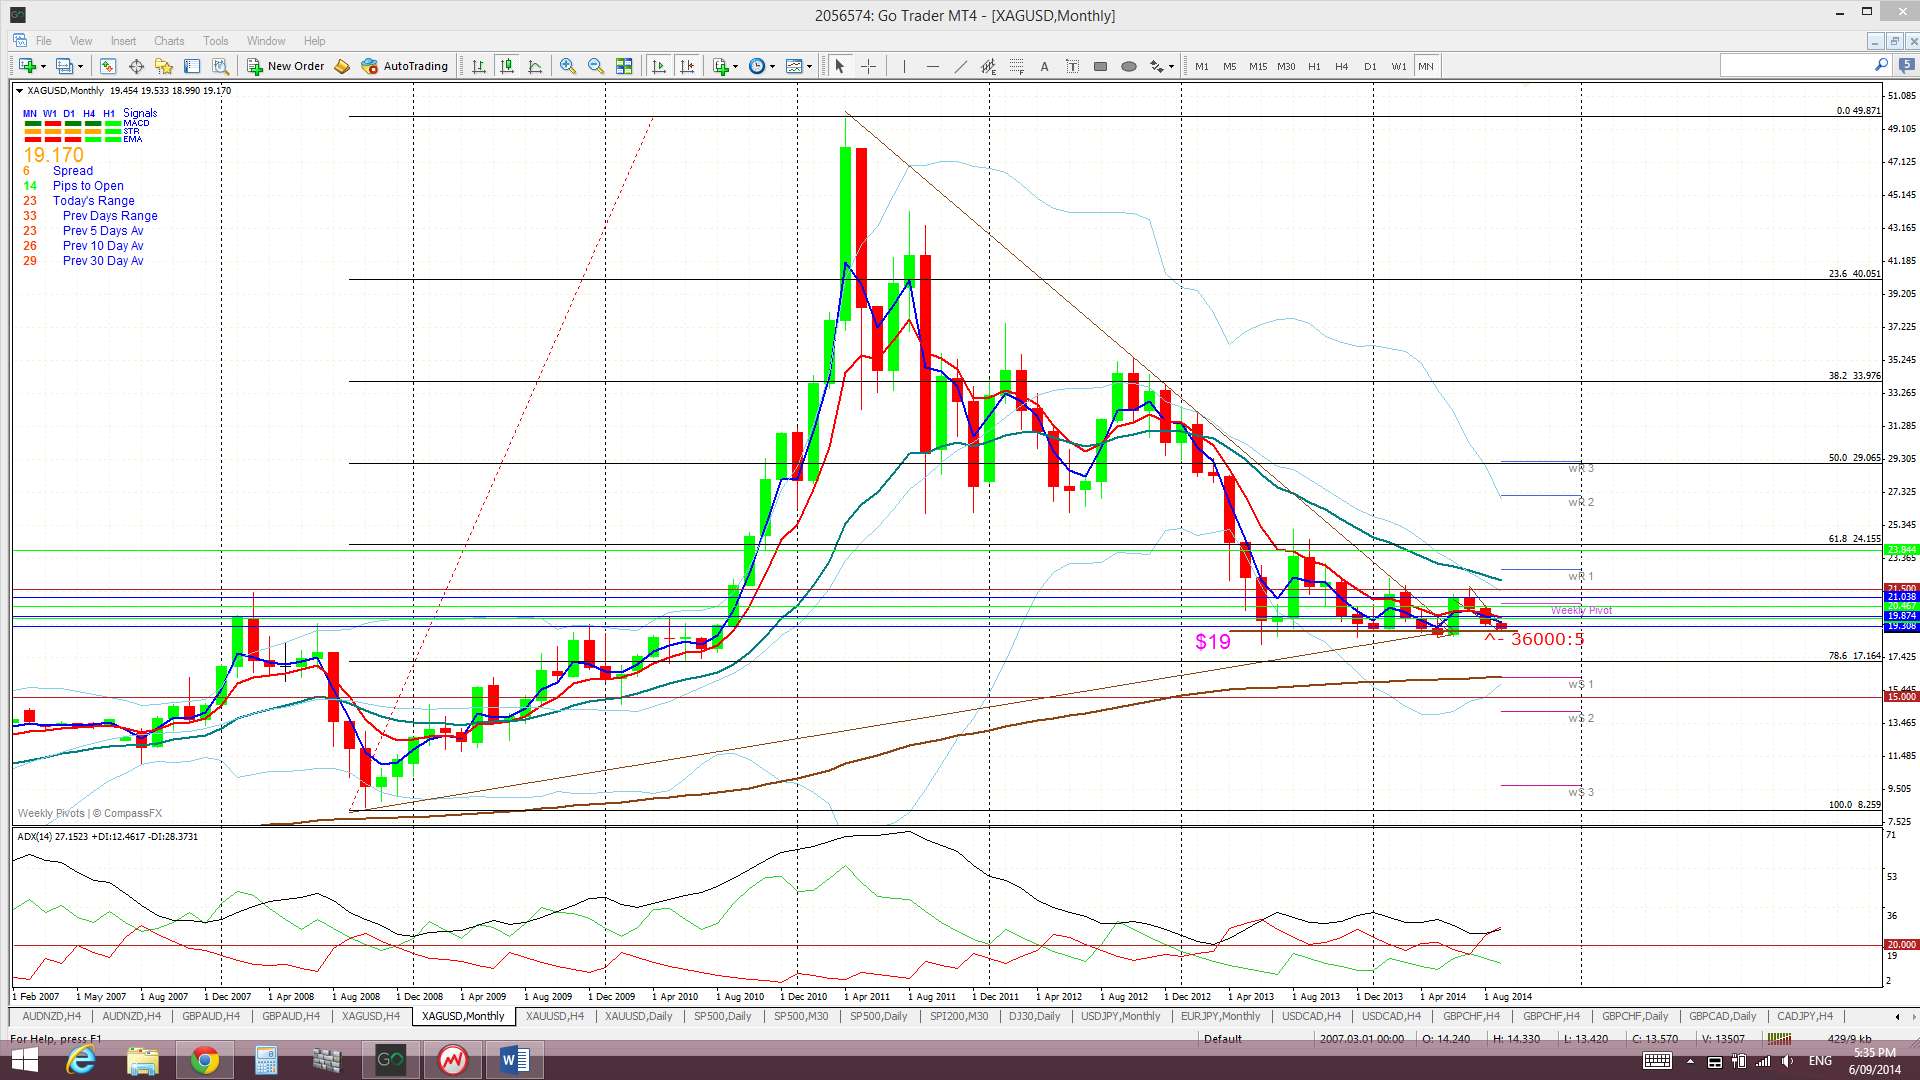
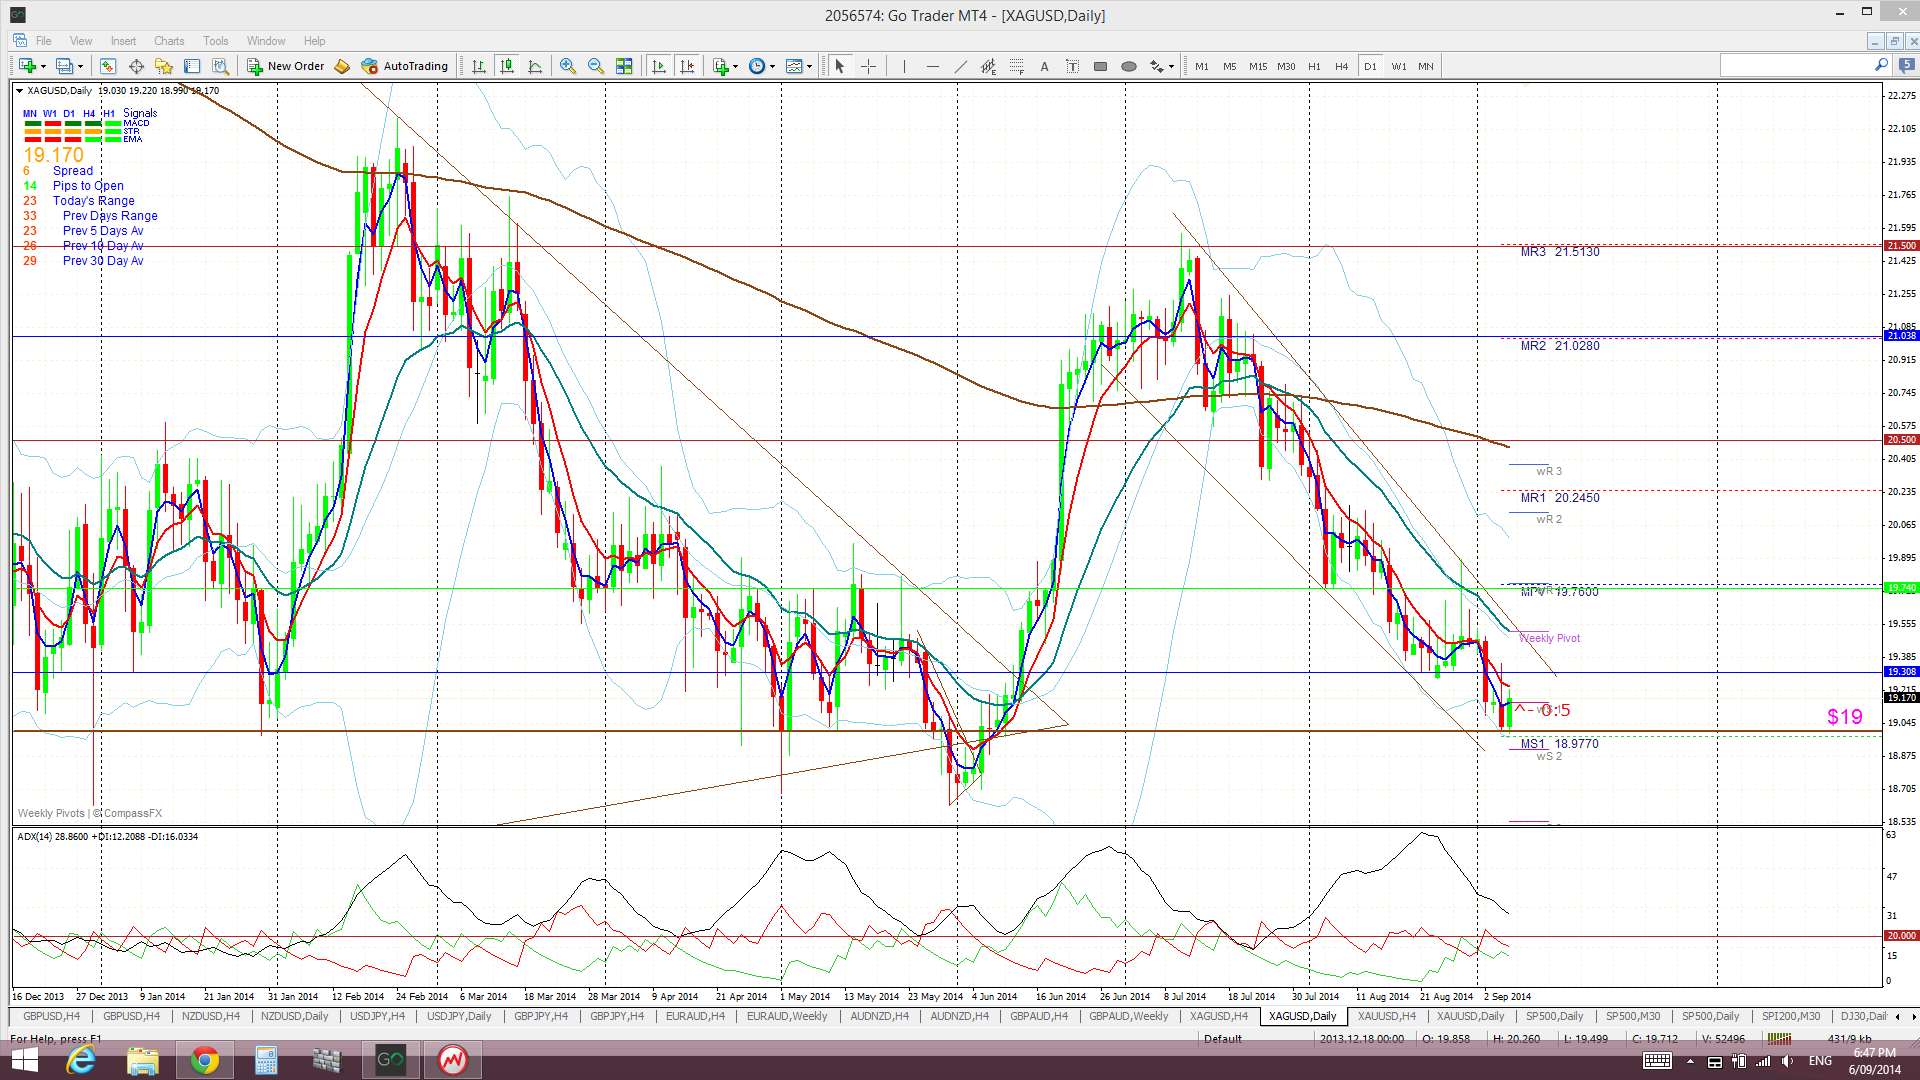
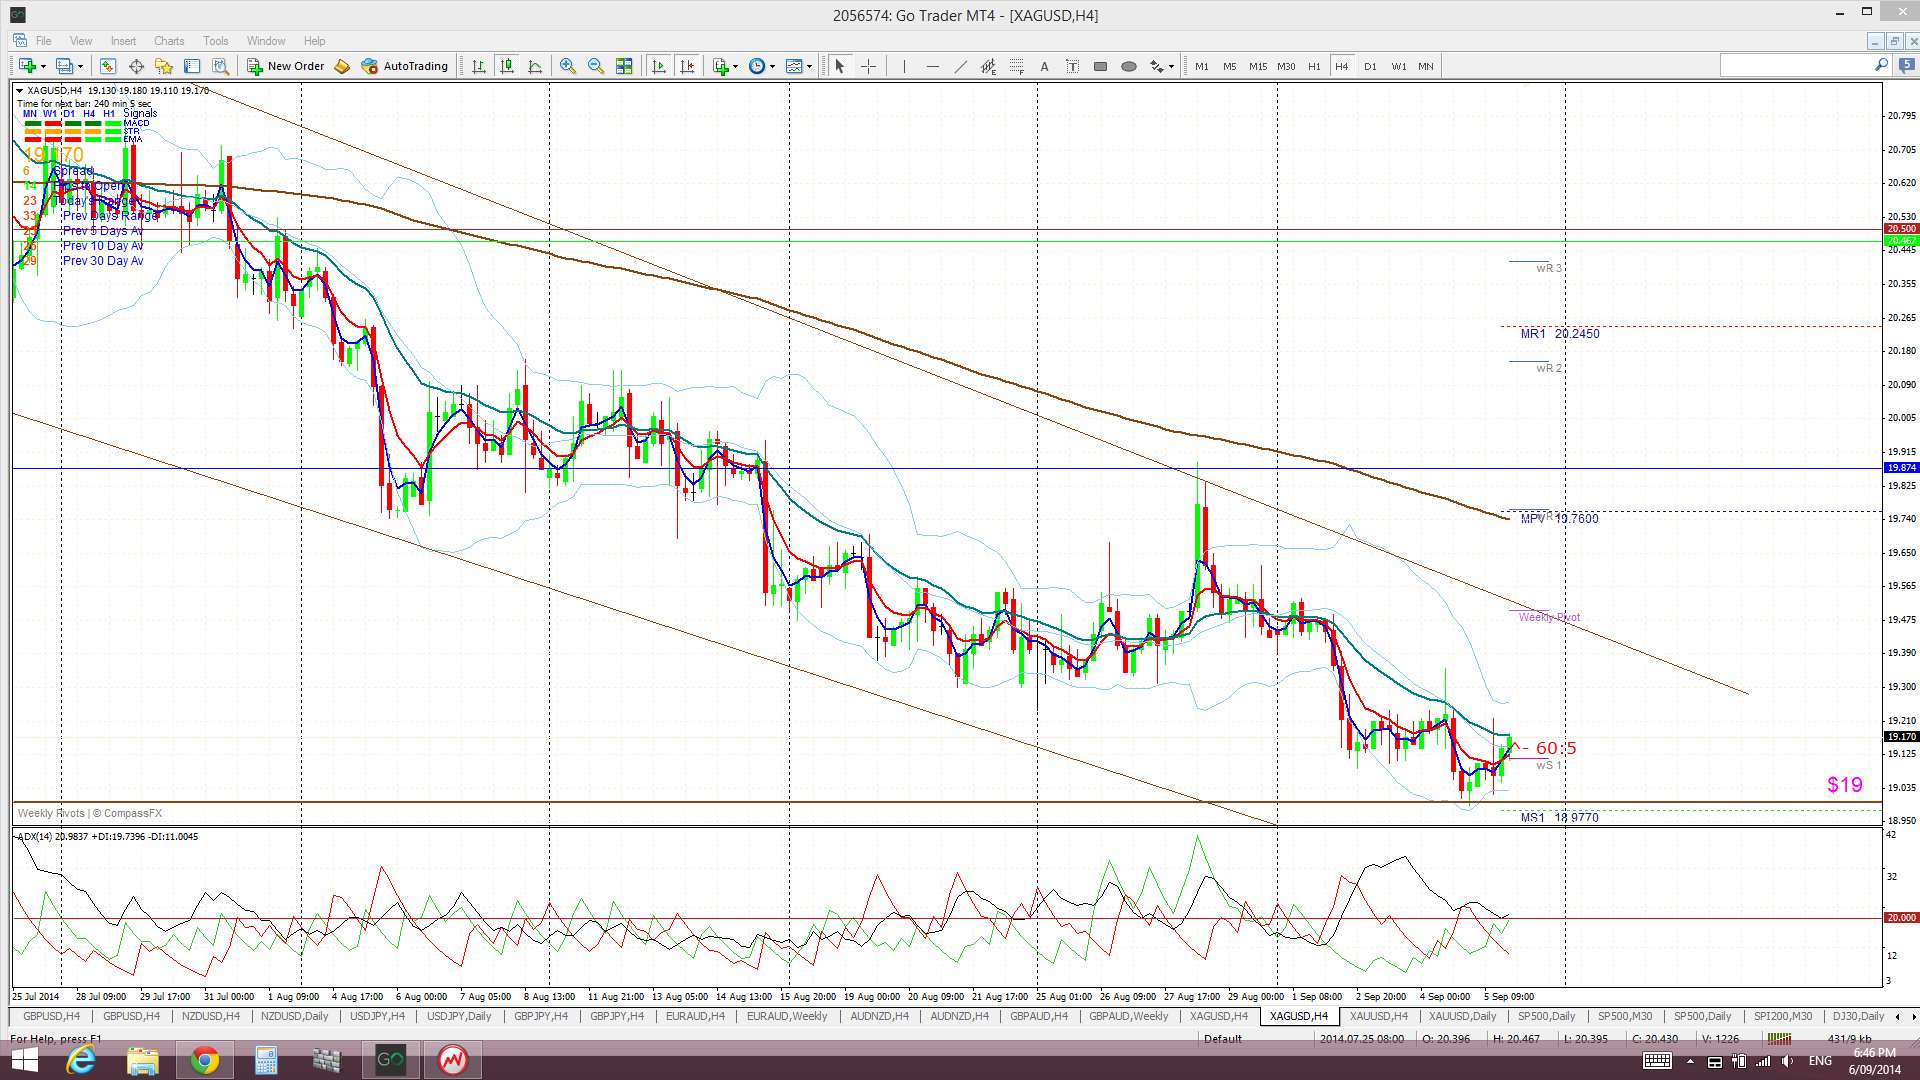
Silver: Silver chopped lower last week with the increasing USD strength. It is still trading within the descending trading channel on the daily chart but is holding above $19 support. The weekly chart shows how crucial this $19 support has been of late.
Silver is still trading below the Ichimoku Cloud on the 4hr, daily, weekly and monthly charts which is bearish.
The weekly candle closed as a bearish candle.
- I’m watching for any new TC signal, the trading channel trend lines and the $19 level.
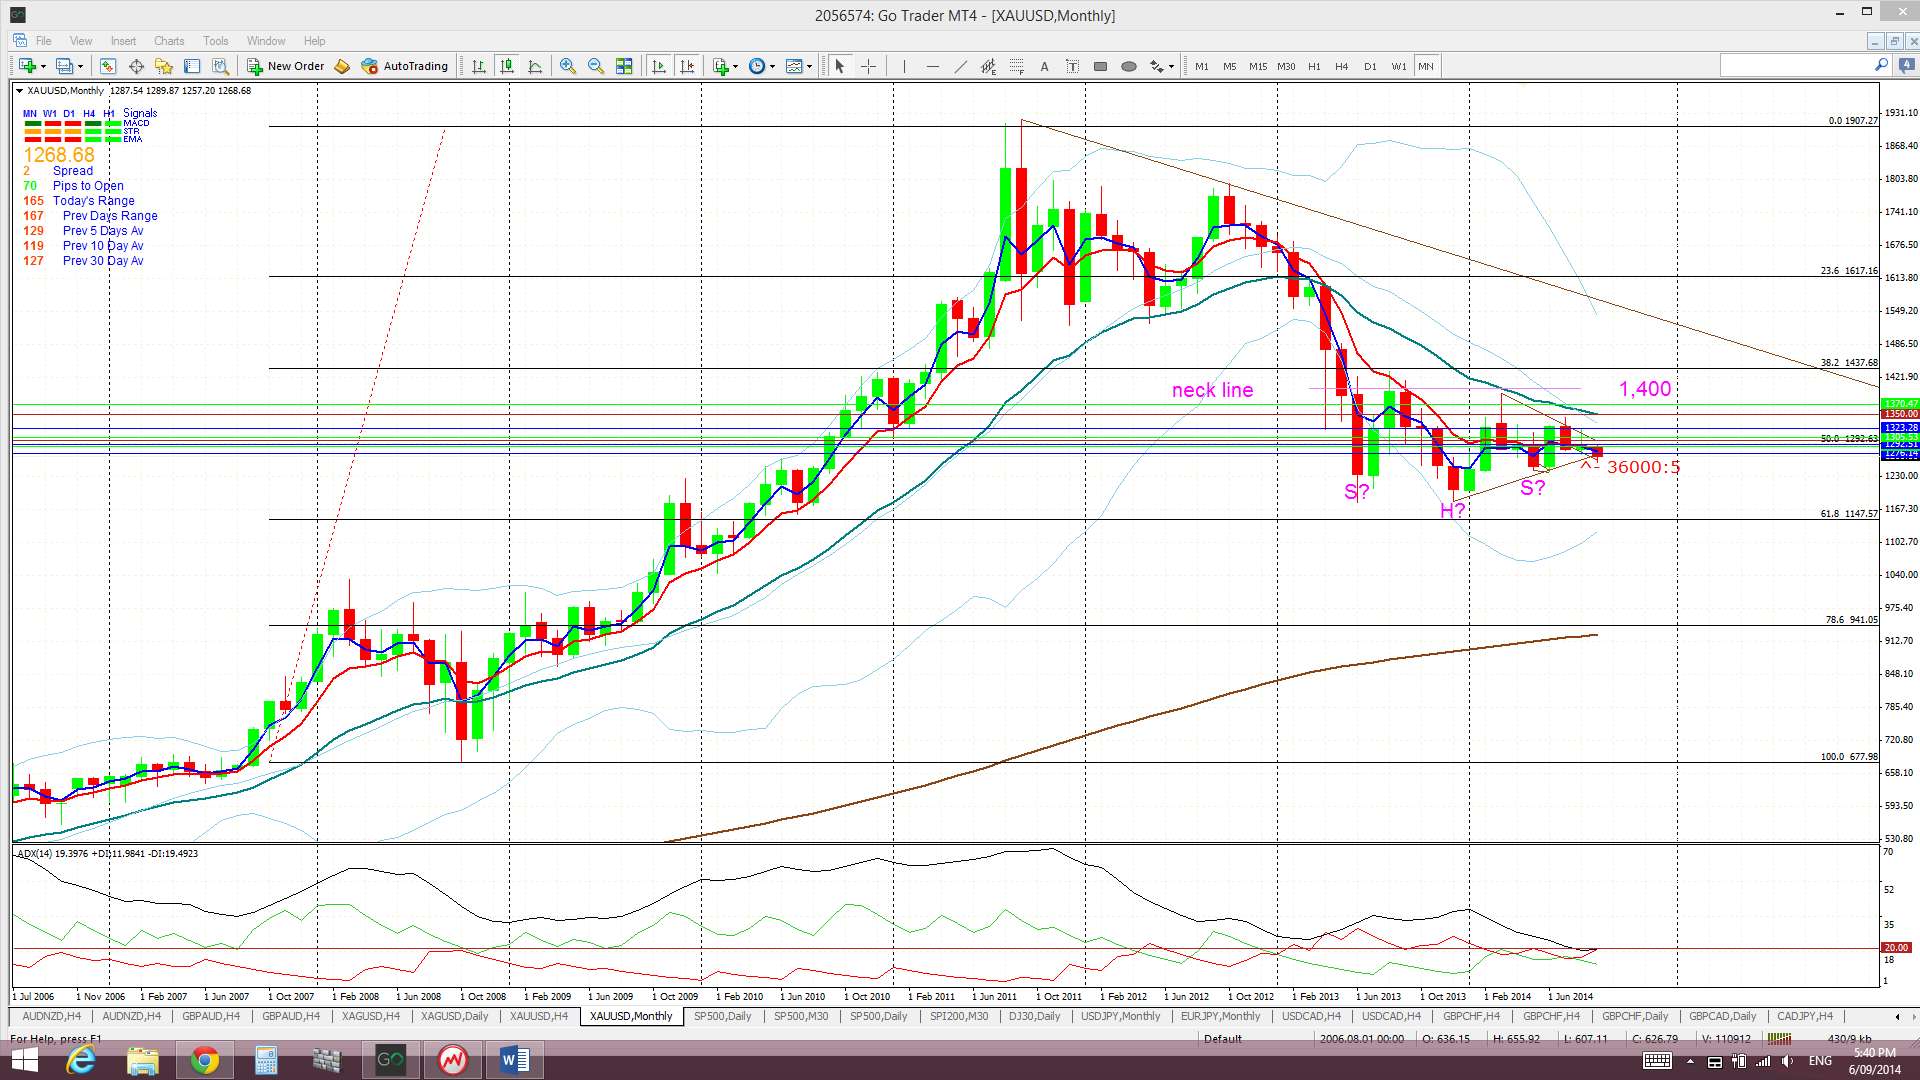
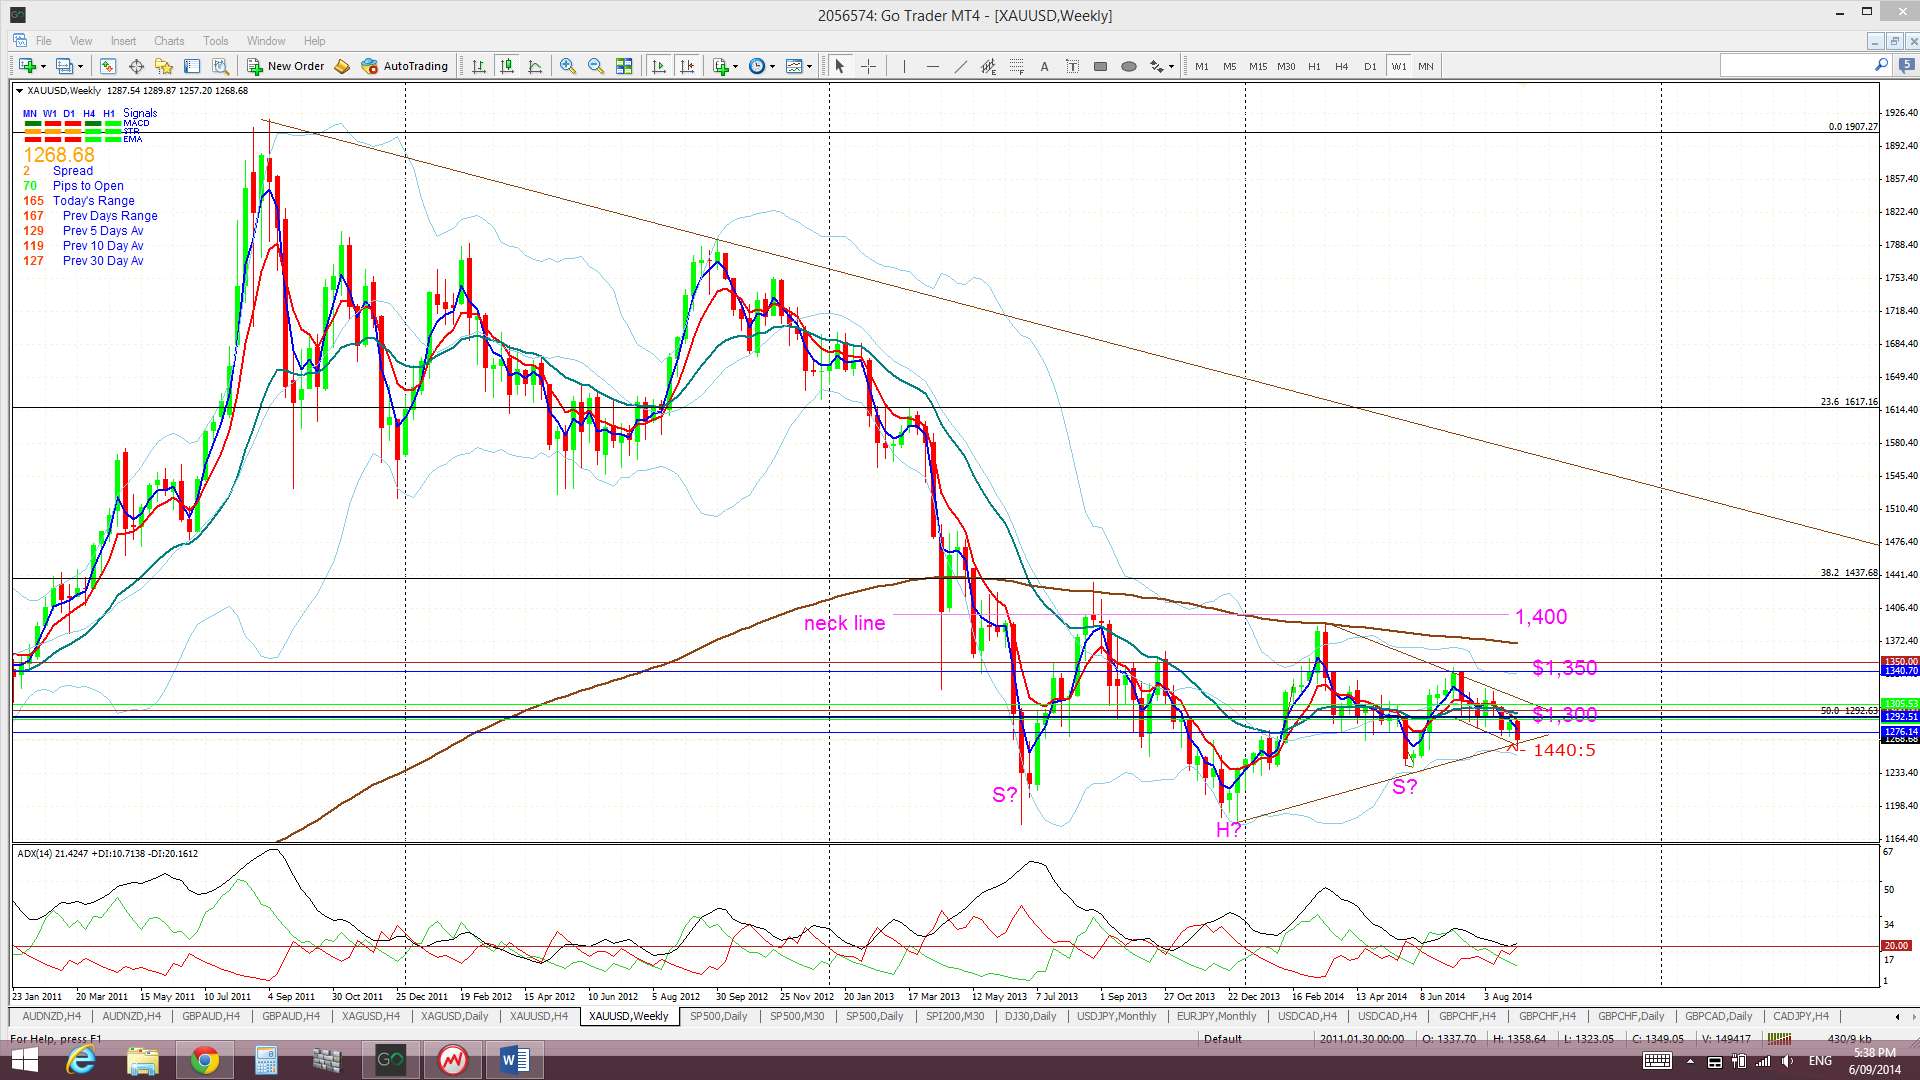
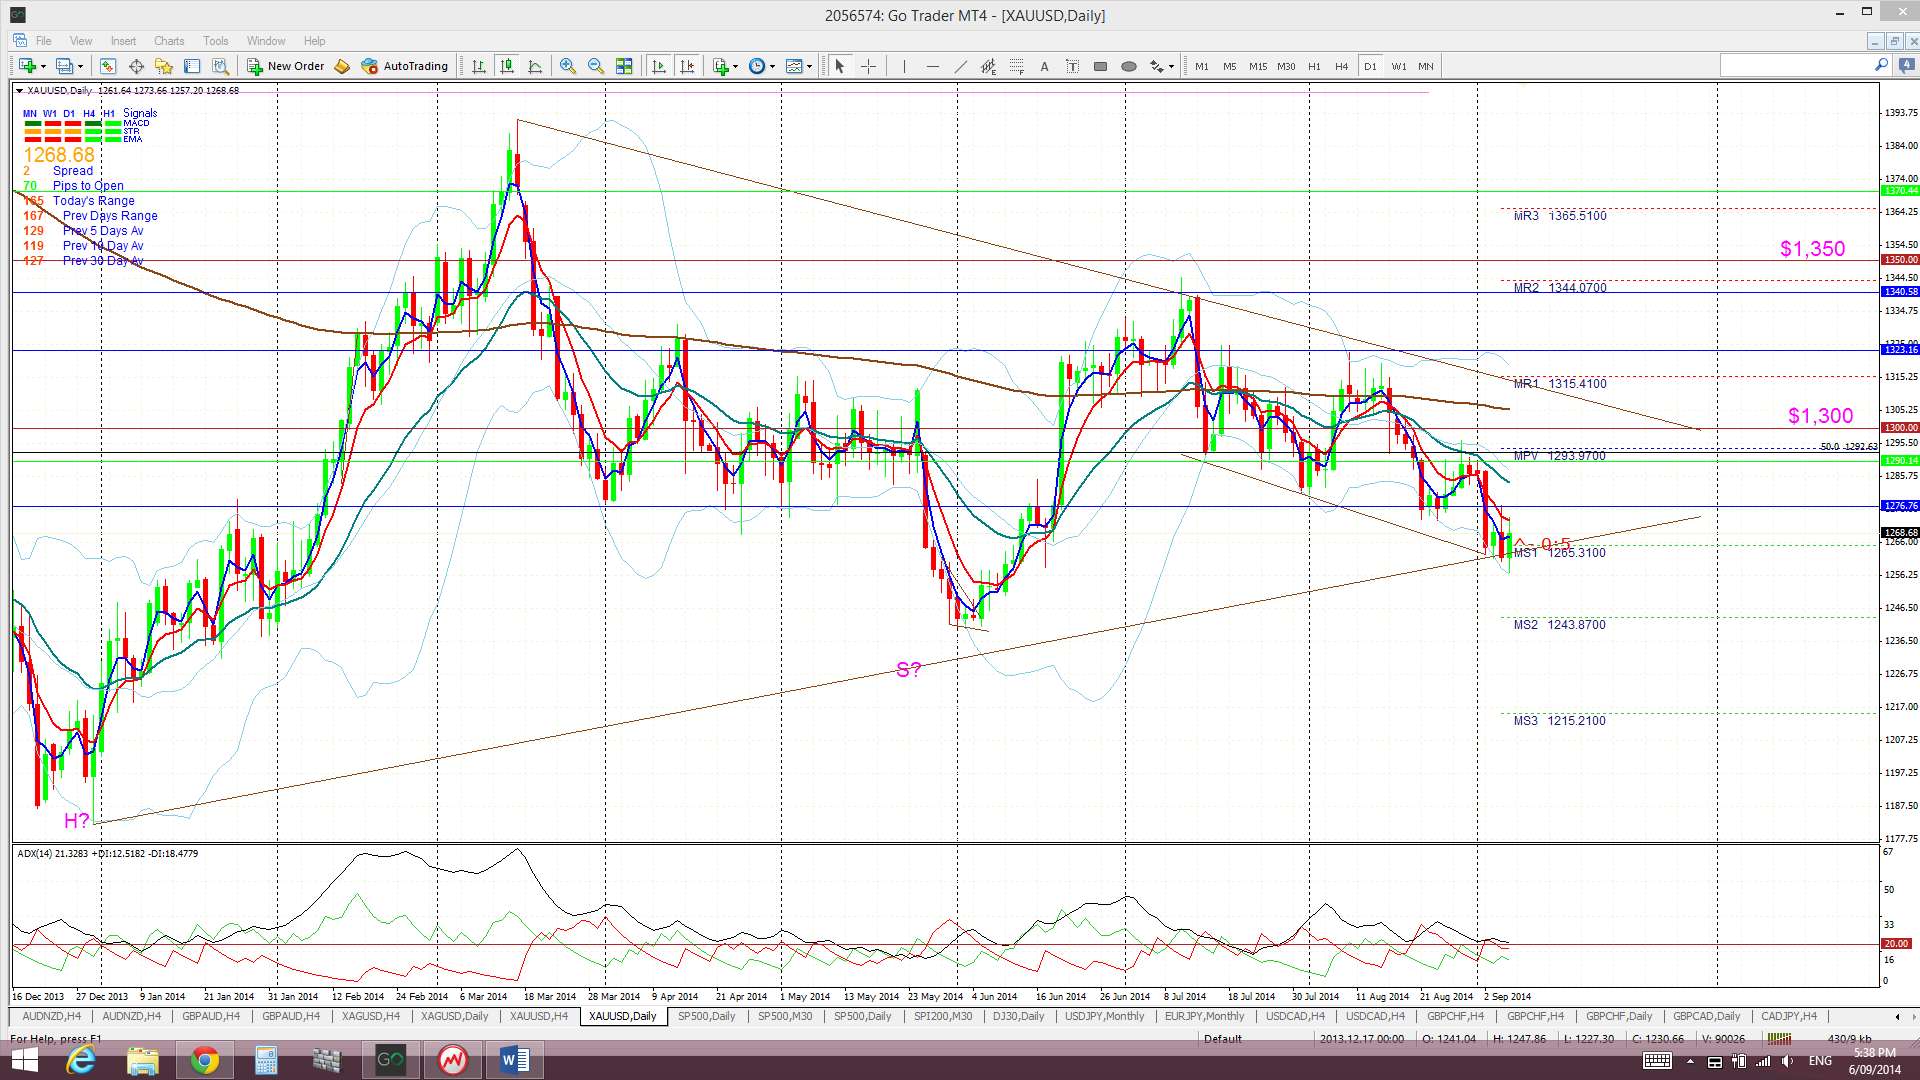
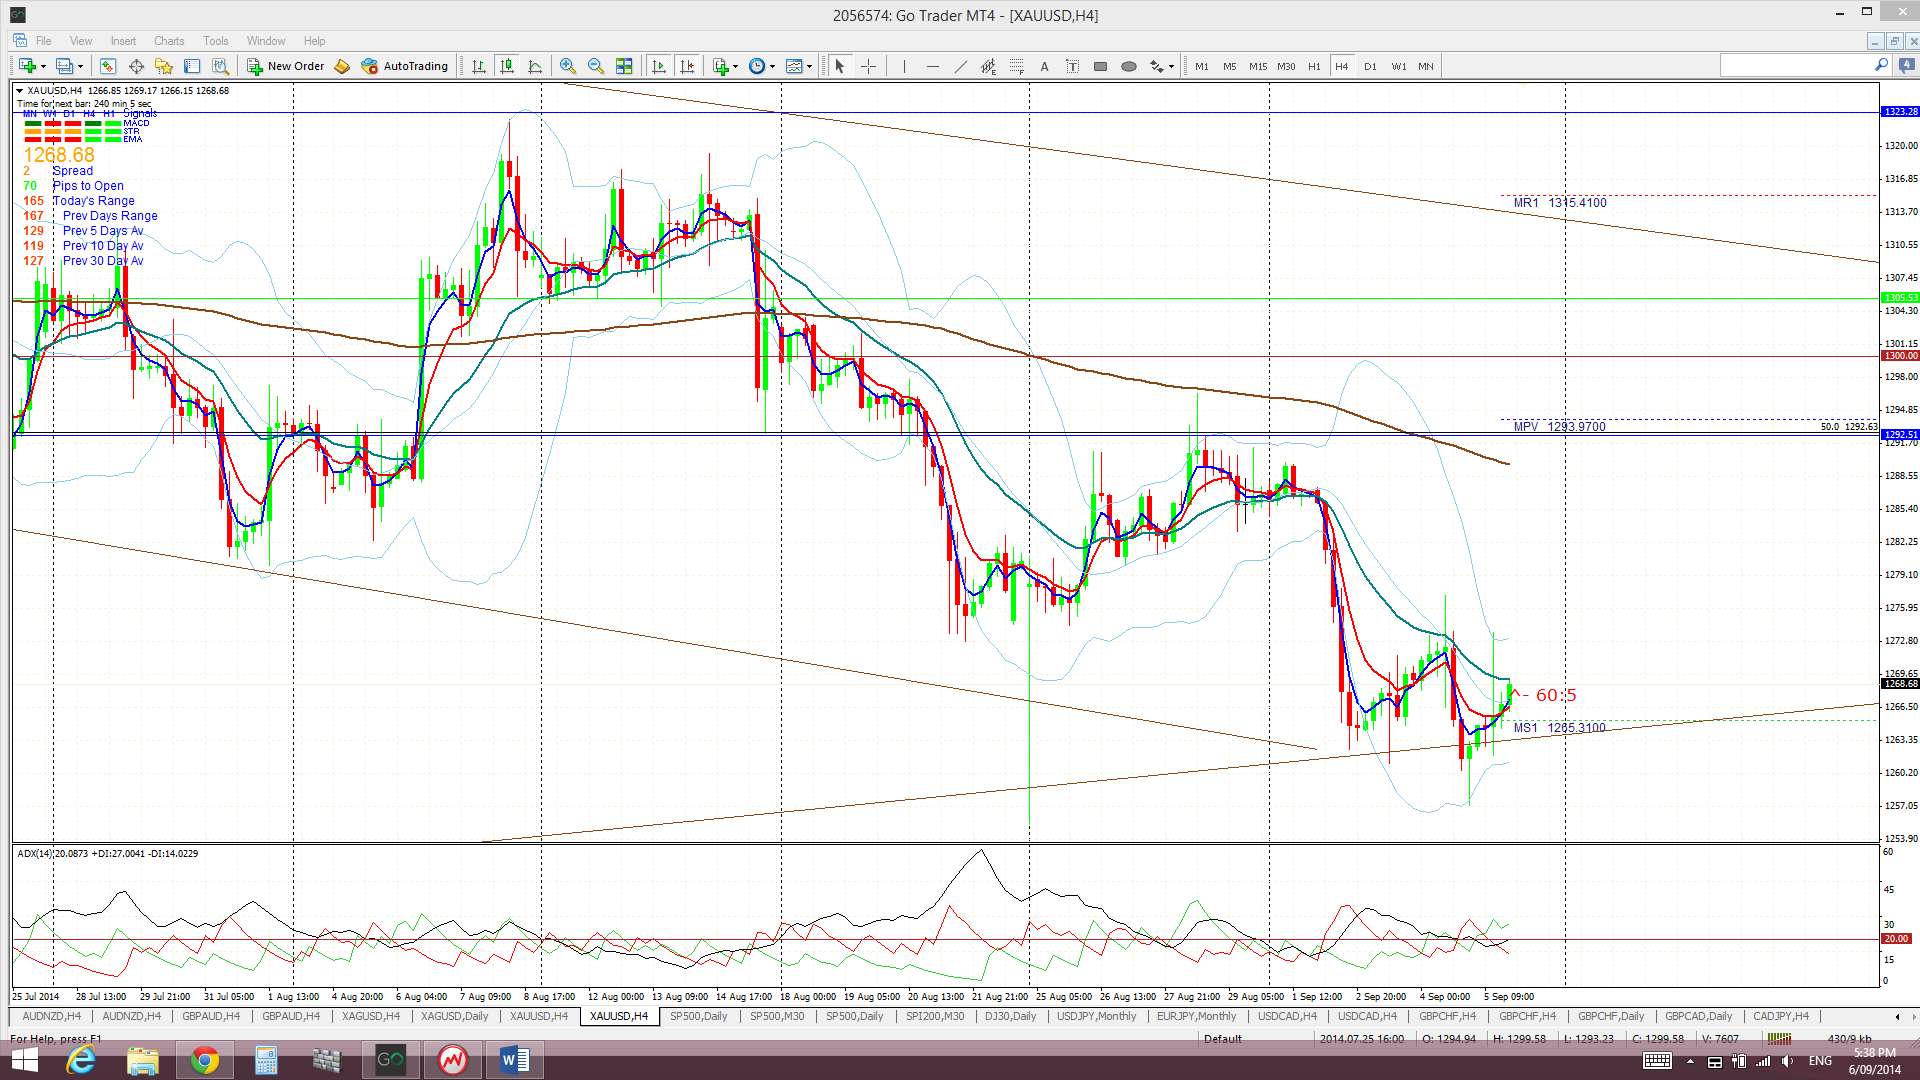
Gold: Like Silver, Gold has been chopping lower due to increasing USD strength. This metal appears to be forming up within a symmetrical triangle pattern on the daily chart and price bounced up off the bottom trend line here on Friday. This triangle is set within the weekly chart’s inverse H&S pattern.
The bullish ‘inverse H&S’ pattern can still be seen forming up on the weekly chart but it is looking a bit messy. The ‘neck line’ of this inverse H&S is still up around the $1,400 region, which is also up near the weekly 200 EMA level.
Gold is trading below the Ichimoku Cloud on the 4hr, daily, weekly and monthly charts which is bearish.
The weekly candle closed as a bearish engulfing candle.
I’m watching for any new TC signal on this pair and the ‘Inverse H&S’ pattern on the weekly chart.
The post Trade Week Analysis for 08/09/14 appeared first on www.forextell.com.