Last week: There was only one TC signals in another choppy week: U/J= -20.
It was another rather choppy week marked by continued geo-political tension across the Middle East and the Russia/Ukraine region. The lack of 4 hr chart momentum trades continues to be noteworthy.
This week:
There is a lot of ‘high impact’ data next week and particularly for the USD. This is especially so on Friday with the ‘Big Kahuna’ of them all in US NFP. The heavy load of USD sensitive data might be pivotal for the USD this week as the USD index trades up towards a major resistance trend line that has capped price for the last 10 months. It is getting close to ‘make or break’ time here again. This could make trading USD pairs quite tricky this week. A review of the USDX and EURX can be found through this link.
Also note that G20 meetings are on Thursday and Friday and, given the current global climate, there might be a higher probability of ‘market moving comments’ emerging from such a gathering.
Thursday is the final day of the month and so watch on Friday for monthly candle close patterns and for new monthly pivots.
Gold and Silver both closed slightly lower for the week but fought back from their lows, in spite of a strengthening USD, to close back above key support levels. This seems rather bullish to me but may simply be a reactionary move to current tension with the Ukraine situation.
The Loonie made a bullish breakout on Friday from trading within a bullish descending wedge. There was no new TC signal with this move but traders might be best looking for ‘longs’ after any test of the broken trend line.There is a lot of USD sensitive ‘high impact’ data though next week though so caution will be required.
Events in the Ukraine and the Middle East continue to have the potential to undermine any developing ‘risk’ appetite and needs to be monitored.
Stocks and broader market sentiment:
US stocks closed lower on Friday but some are noting this as mere profit taking following on from a reasonable run of decent earnings reports and gains. Friday’s sell-off resulted after some US market ‘heavy weights’, Visa and Amazon, released earnings with a mixed outlook and Goldman Sachs released a ‘neutral’ view on stocks.
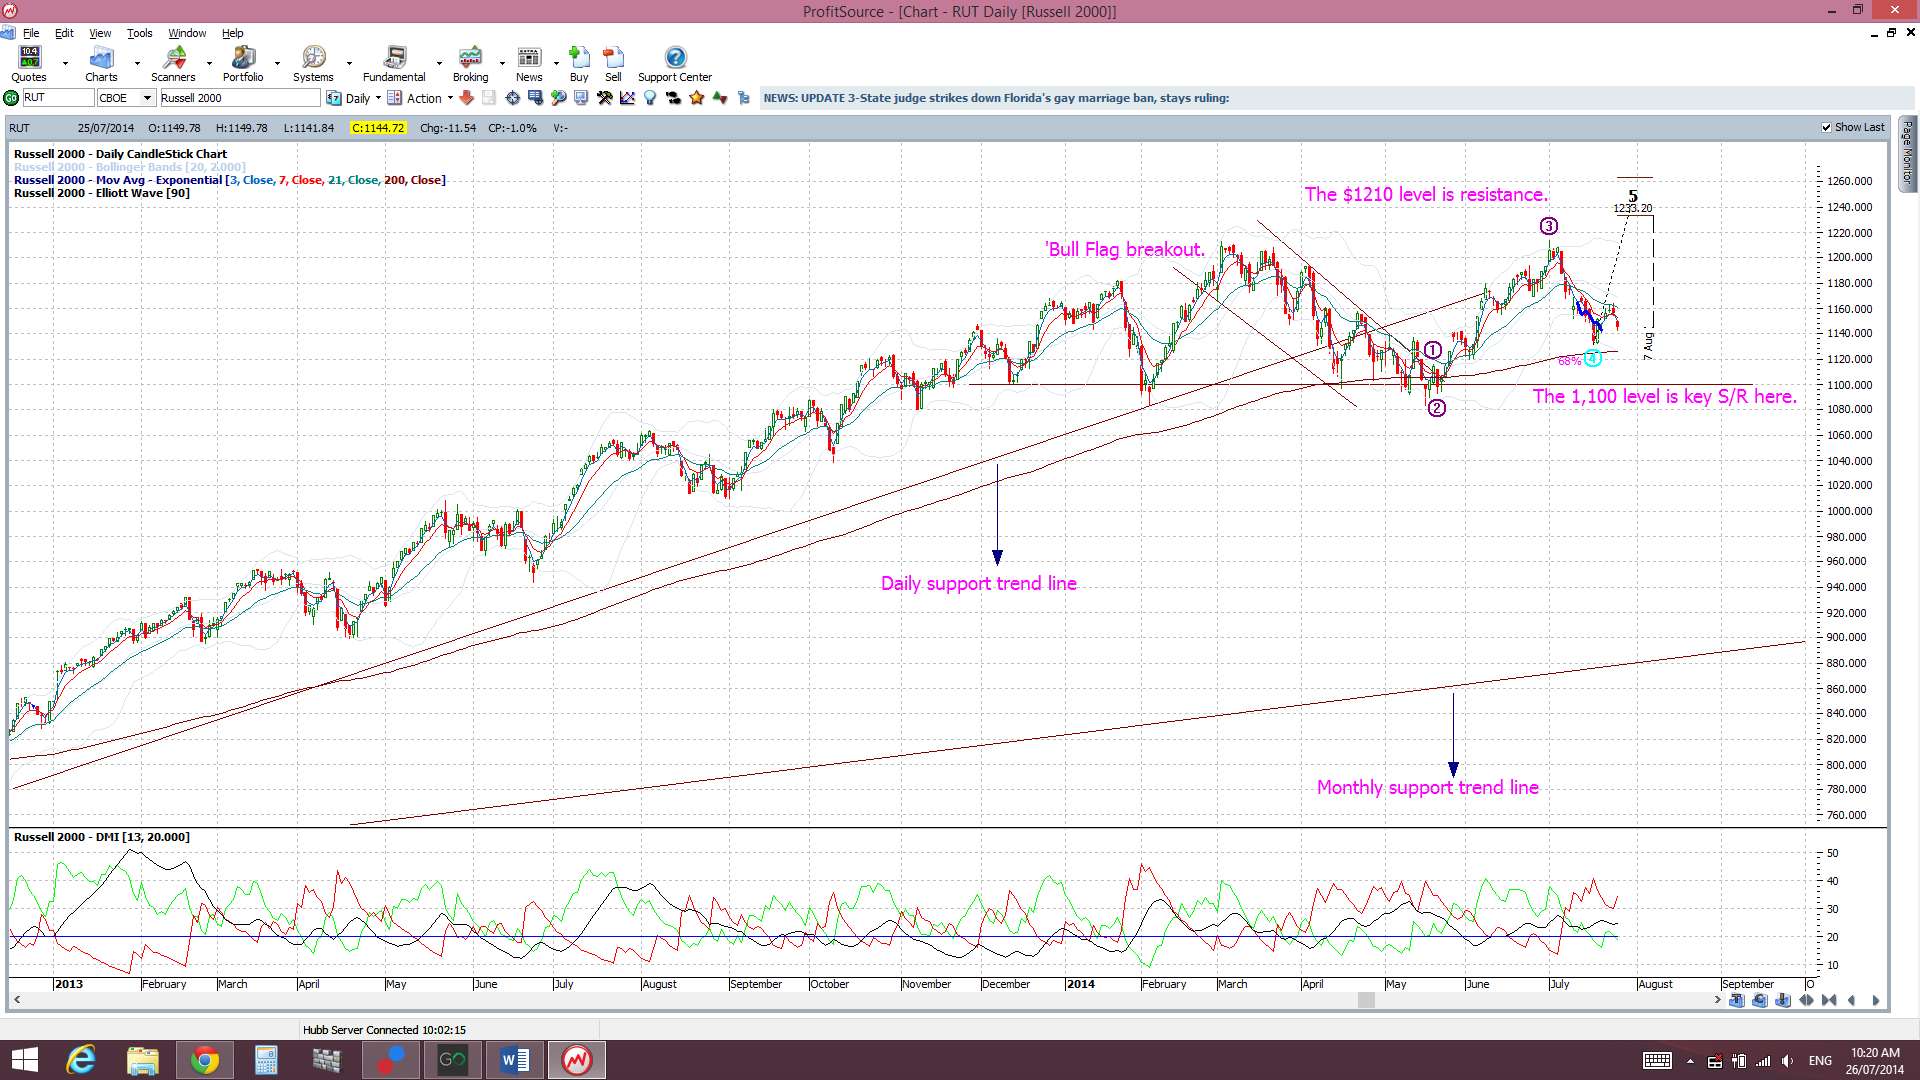
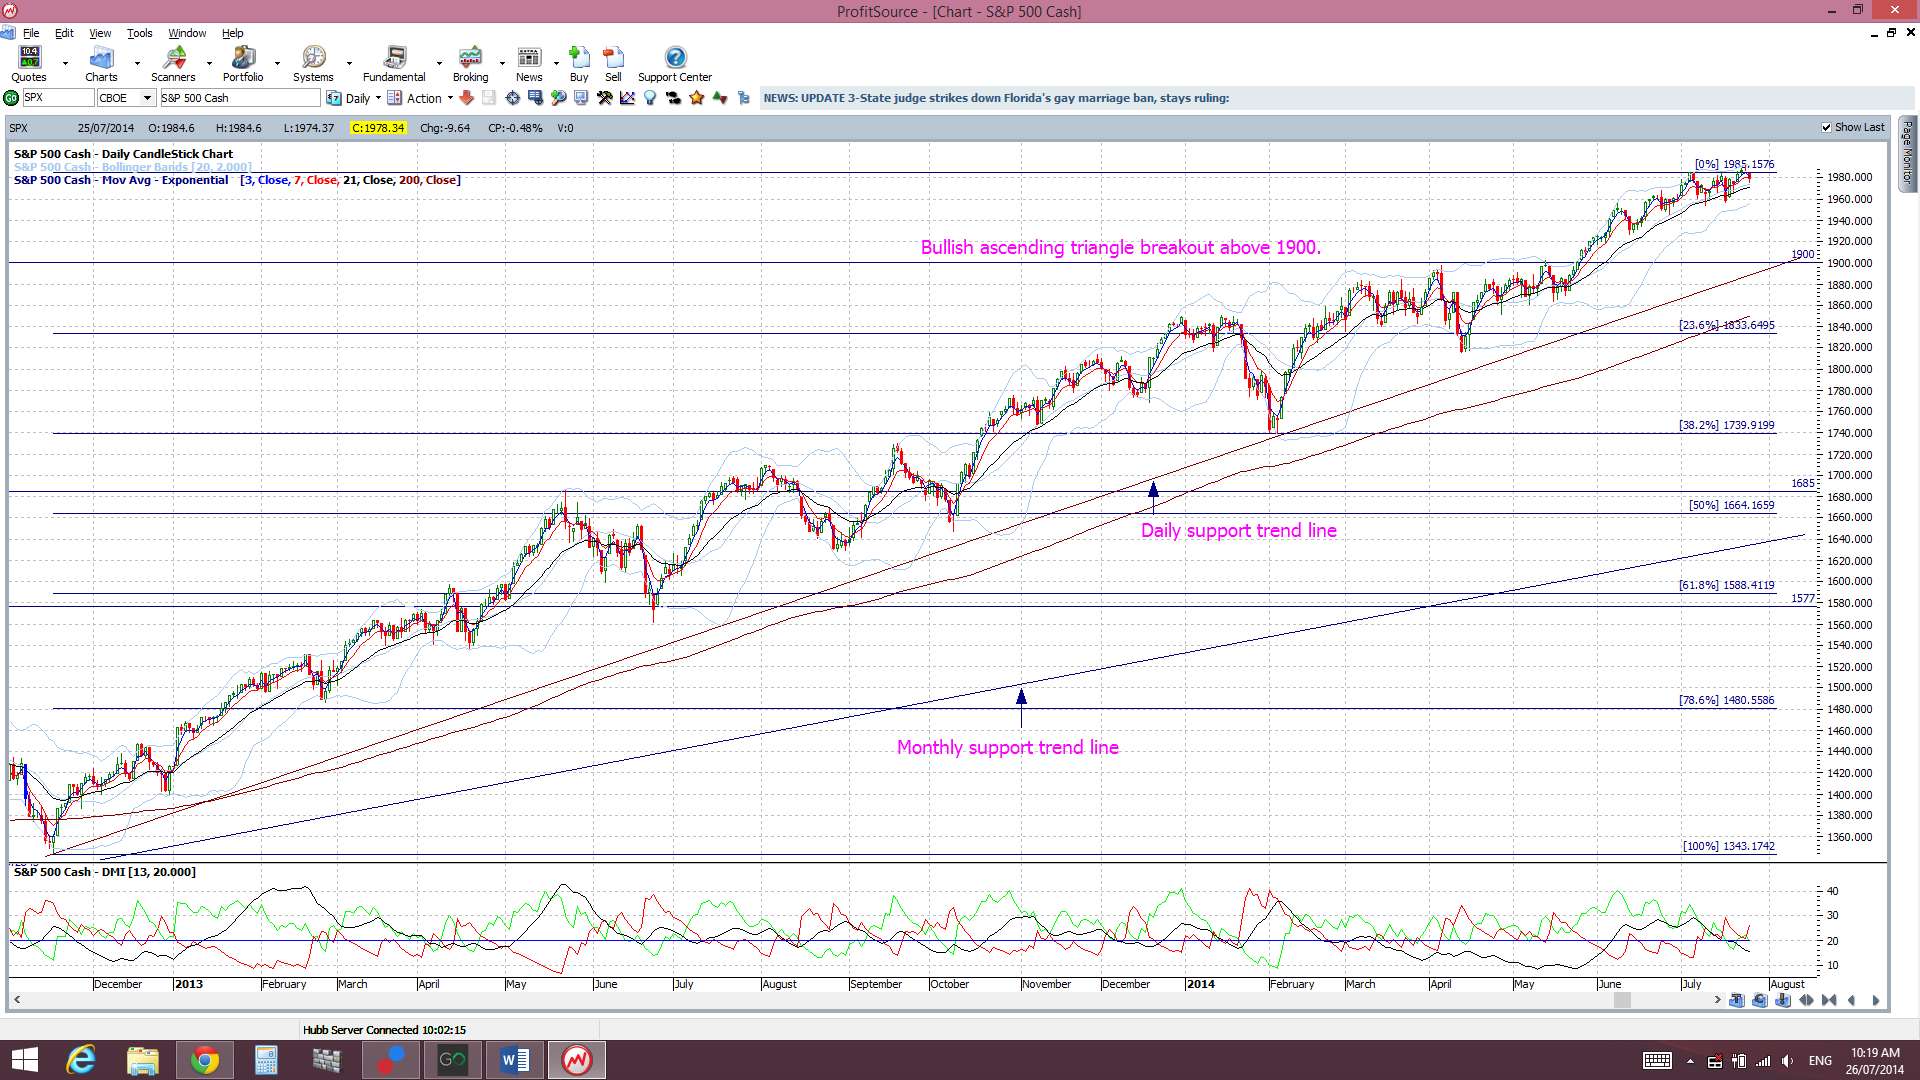
With all of this, however, the S&P500 is still above its 1,900 ascending triangle breakout level, the DJIA is still above its 16,900 ascending triangle breakout level the NASDAQ is still above the 4,400 level. The NASDAQ actually printed a bullish engulfing candle for the week, the S&P500 printed a bullish coloured ‘Spinning Top’ candle and the DJIA printed a bearish coloured ‘inside’ candle. The latter two candles reflecting some indecision here with stocks whilst trading at these high levels. Even with a mixed weekly close for the three these indices, they are all still trading above their daily support trend lines and the ‘bellwether’ Russell 2000 index is still trading above its 1,100 support level. Thus, Friday’s sell off needs to be seen in light of this larger picture:
Russell 2000 ‘Bellwether’ index:
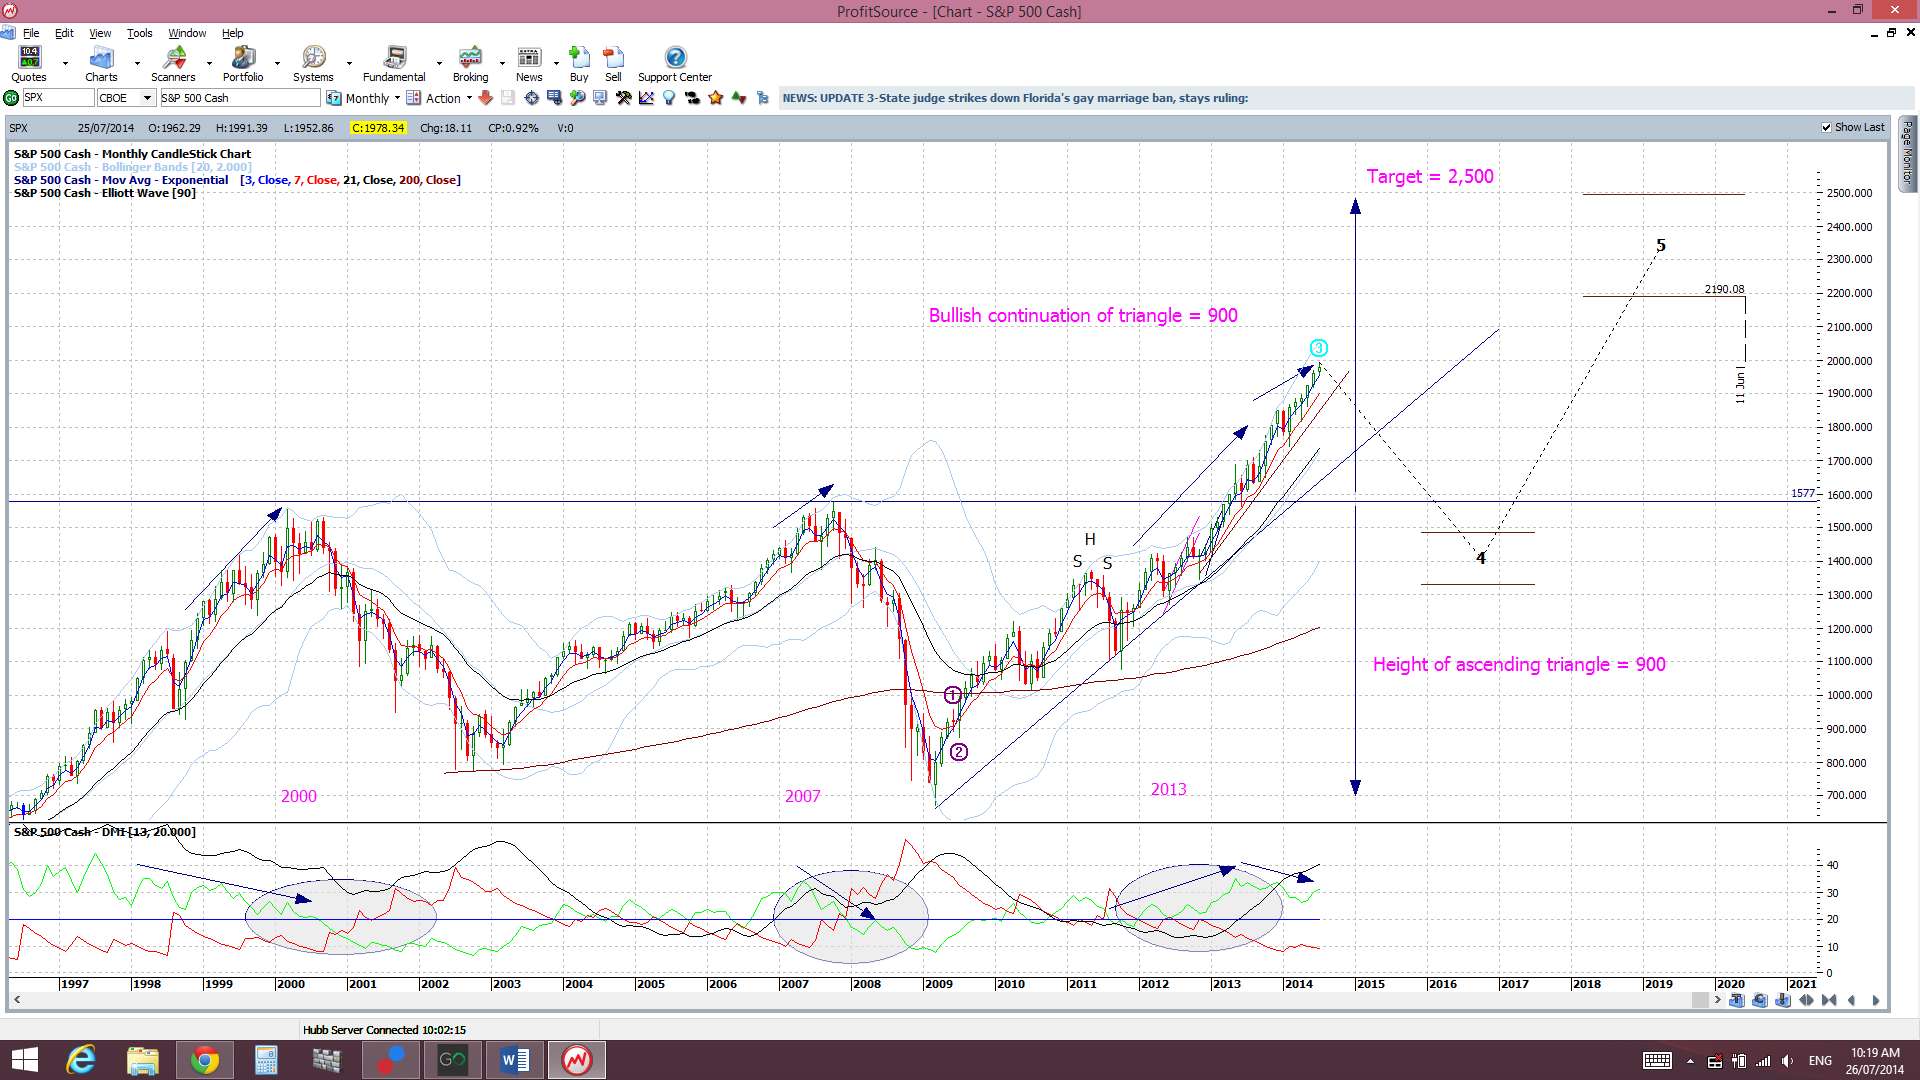
I do have an ultimate, longer term bullish target on the S&P500 of 2,500 though and I noted an article today on CNBC with a not too different target! However, the pathway to any bullish target may not travel in a straight line and I am therefore on the lookout for potential pull backs. It is also worth noting that Aussie stocks, after chopping sideways for months, may be on the march higher now as well. I have posted some Aussie index charts in an article that can be found through this link.
I am still seeing divergence on the monthly S&P500 monthly chart though and whilst this might just be warning of a pause, as the index navigates new highs, the chance of a pullback cannot be ruled out either. There has not been any real deep pull back since the break up through the 1,577, 1,600, 1,700 and 1,800 levels and the major break of the 1,577 level was only tested once. Thus, I am still being cautious here now even though the daily support of the S&P500 has not been broken.
It is worth noting that a 61.8% fib pull back of the recent bull run (Nov 2012-present) would bring price down to near the 1,577 area. This remains significant as it is the breakout level of the previous highs from the 2000 and 2007 peaks. I would expect this region could be a target if there was any serious pullback on the S&P500.
Thus, with all of this, I continue to watch out for further clues as to any new momentum move, long or short though! In particular I’m looking out for:
S&P500 daily chart: I’m watching for any break of the daily trend line but price is holding above this for the time being. The index continues to hold above the top trend line of the bullish ascending triangle.
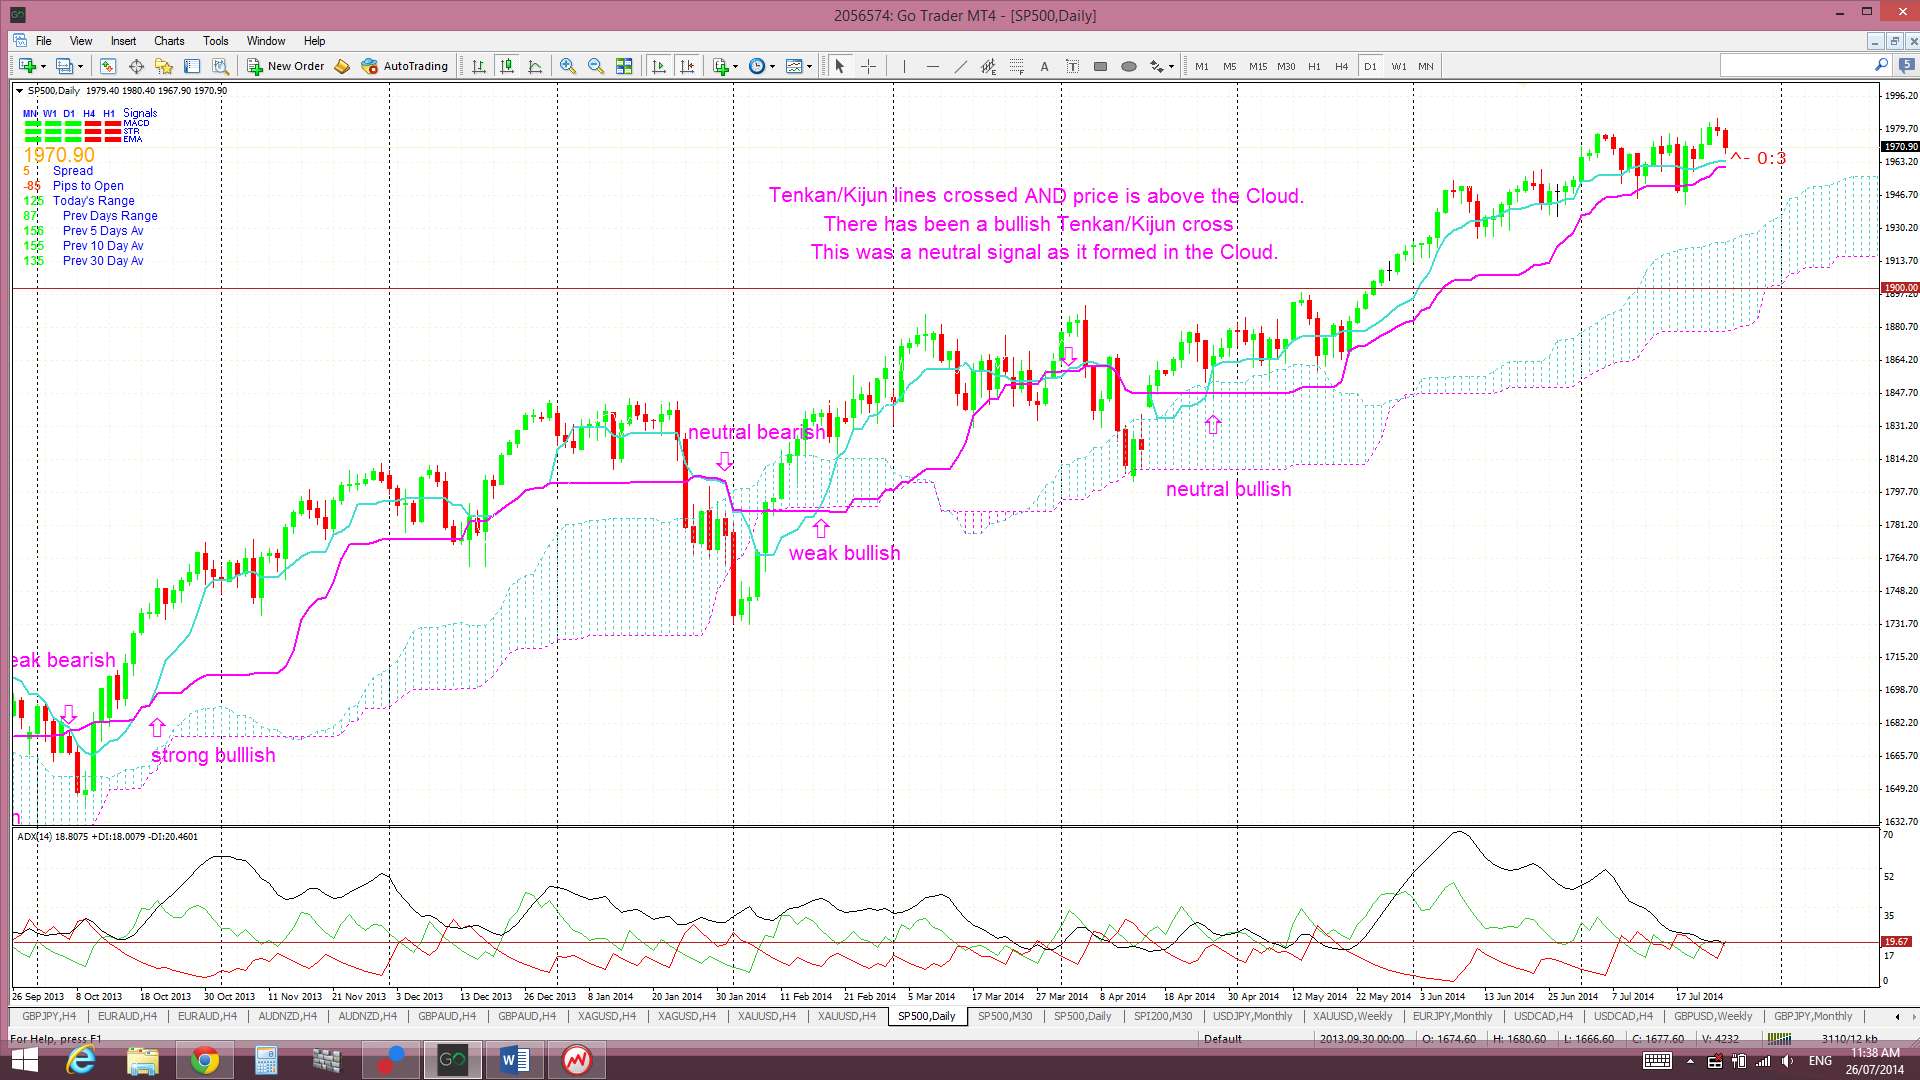
Ichimoku S&P500 chart: a clear cross of the blue Tenkan-sen line below the pink Kijun-sen line. There was a Tenkan/Kijun bullish cross a while ago and price is still above the Cloud which is bullish.
S&P500 monthly chart: a break of the monthly support trend line (see monthly chart). The monthly trend line remains intact. A break of this support level would suggest to me of a more severe pull back or correction. The look of this ‘market top’ still appears quite different to that of the previous two market tops from back in 2000 and 2007. I am seeing divergence on the monthly chart though. This may just be as the index pauses and ponders this new high or it could be warning of a pull back. Elliott wave suggest a big correction here though. I am still thinking that the 1,600 level might be the new base line for this index. The saying that ‘Old resistance becomes new Support’ holds here. I still believe that it would not be at all surprising to this 1,600 level tested again. It has only been tested once by a monthly candle since the bullish breakthrough and I would expect a significant level such as this to be tested more than once. Maybe I’m wrong here though as there have now been twelve consecutive months of candles that have closed above this key level, and, without testing this region at all. To add to this thought of bearish pull back potential, the previous candle close ‘highs’ from back in 2000 and 2007 were down near the 1577/1580 area so it is entirely feasible that price may even test this region again before any continued move upwards. I actually won’t be too comfortable with any bullish continuation move on the S&P500 until this 1,577 level is tested again but, for the moment, the trend seems to be continuing higher.
EURX: The EURX used to be quite positively correlated with general risk appetite and the S&P500. This correlation has not been as evident over recent months and so I am removing this component from this analysis.
Items to watch out for:
- Mon 28th: USD Pending Home Sales.
- Tue 29th: USD CB Consumer Confidence.
- Wed 30th: EUR German Prelim CPI. USD ADP Non-Farm employment change, Advance GDP & FOMC statement.
- Thurs 31st: G20 meetings. AUD Building approvals. EUR CPI Flash Estimates. USD Unemployment claims. CAD GDP.
- Fri 1st: G20 meetings. CNY Manufacturing PMI & HSBC Final Manufacturing PMI. AUD PPI. JPY Gov Kuroda speaks. GBP Manufacturing PMI. USD NFP, Unemployment Rate & ISM Manufacturing PMI.
Forex:
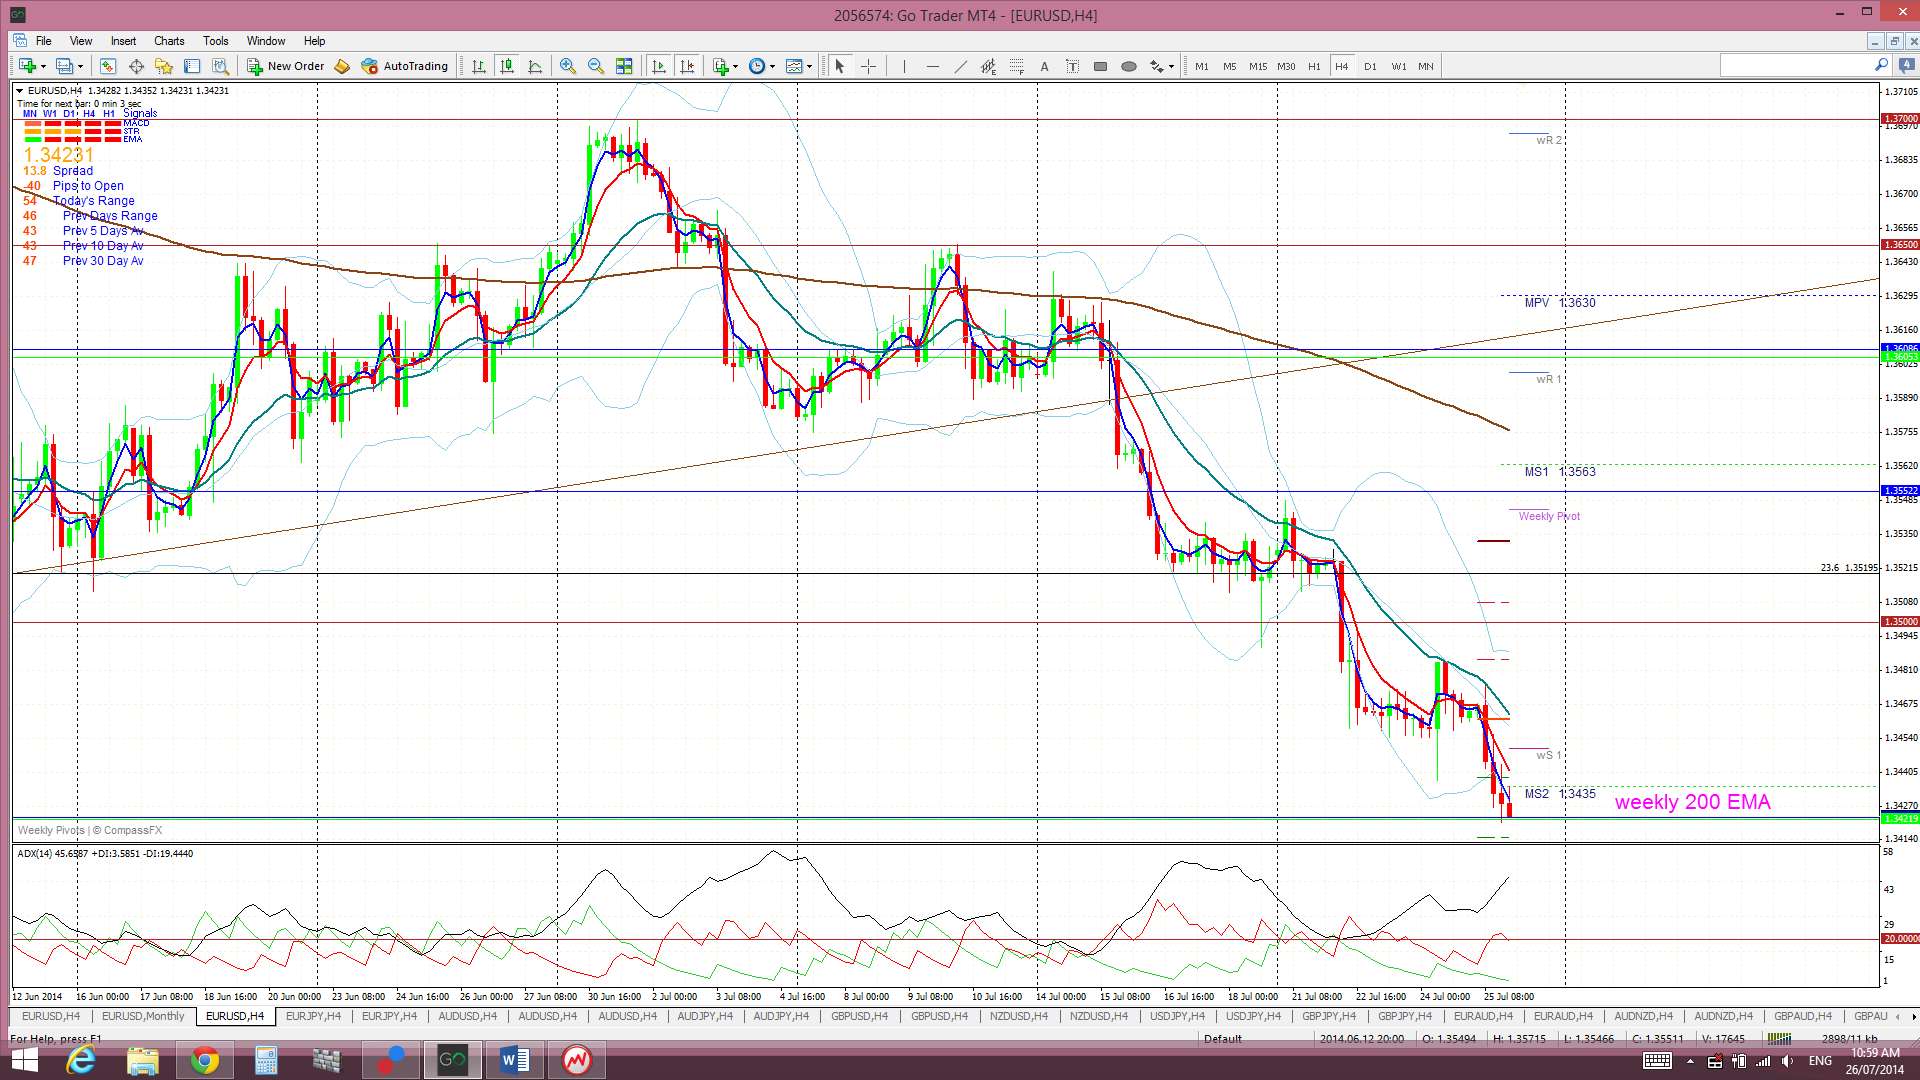
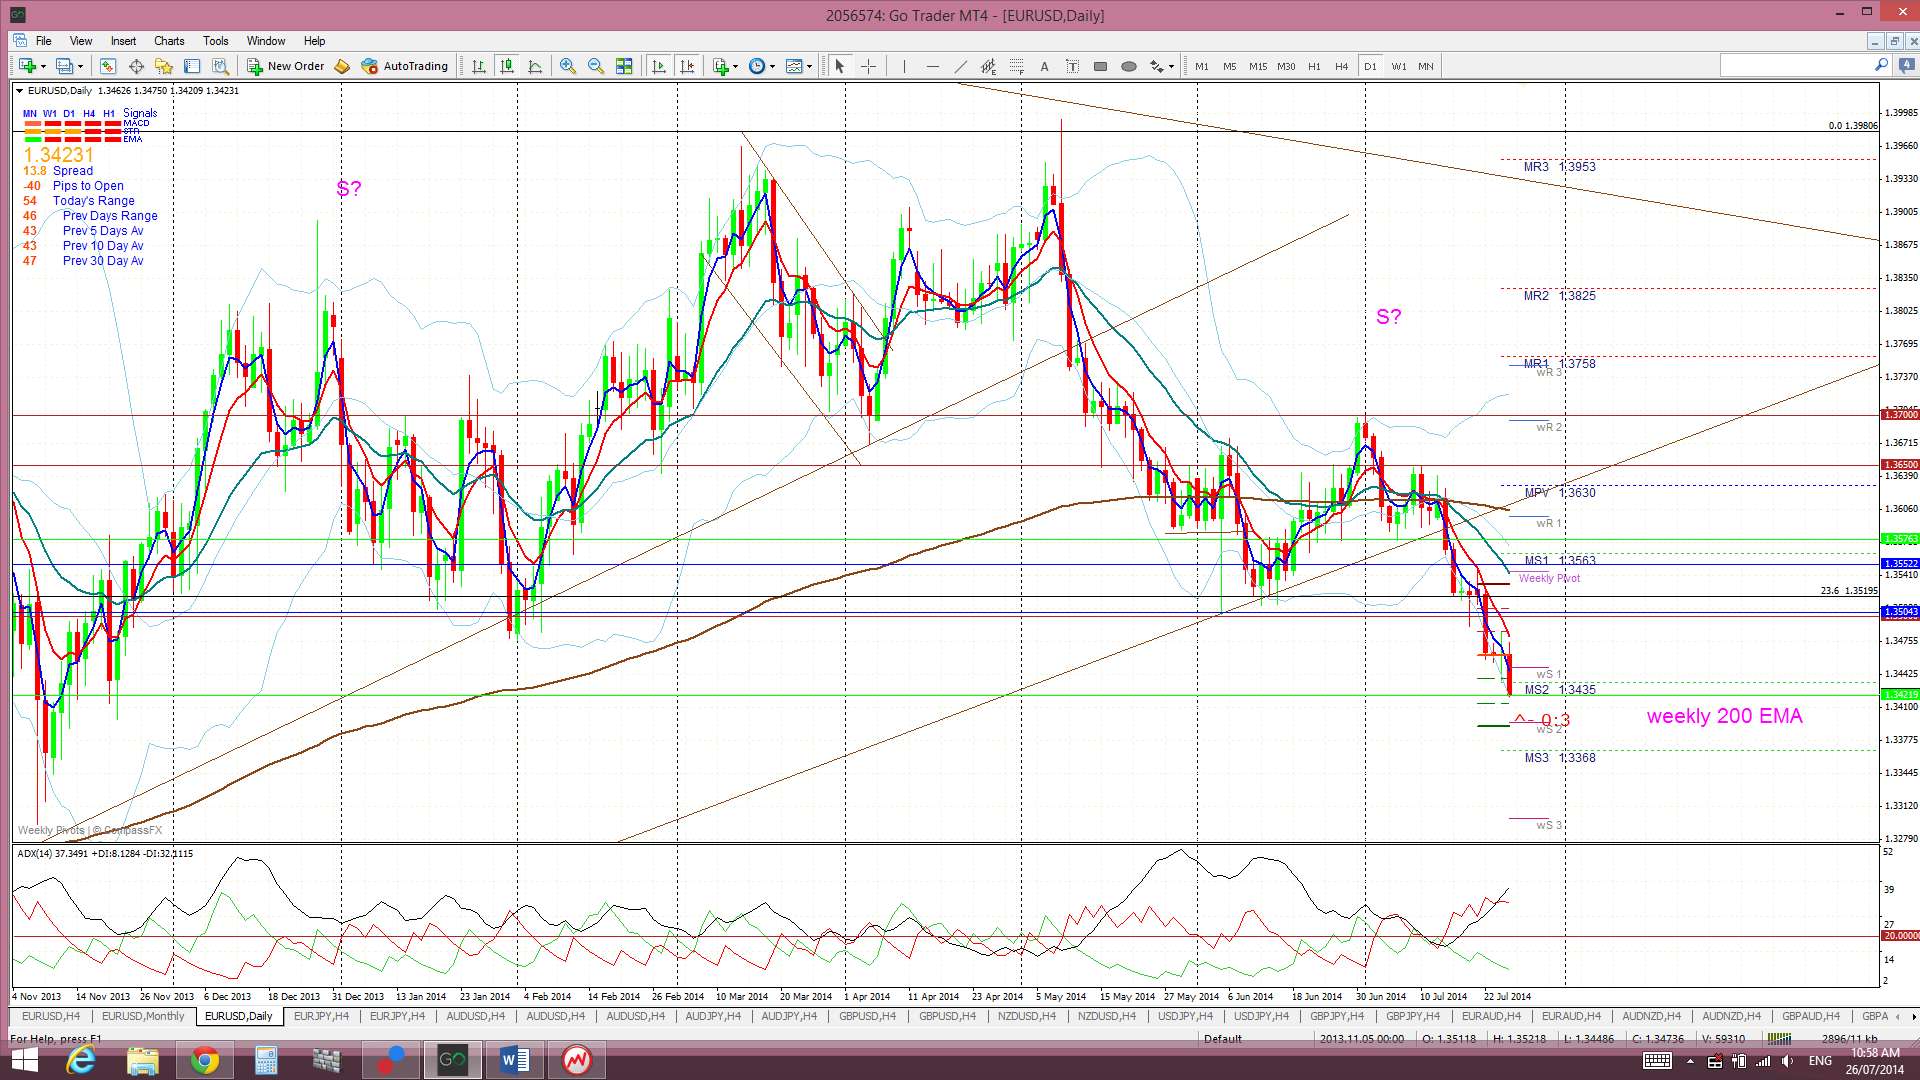
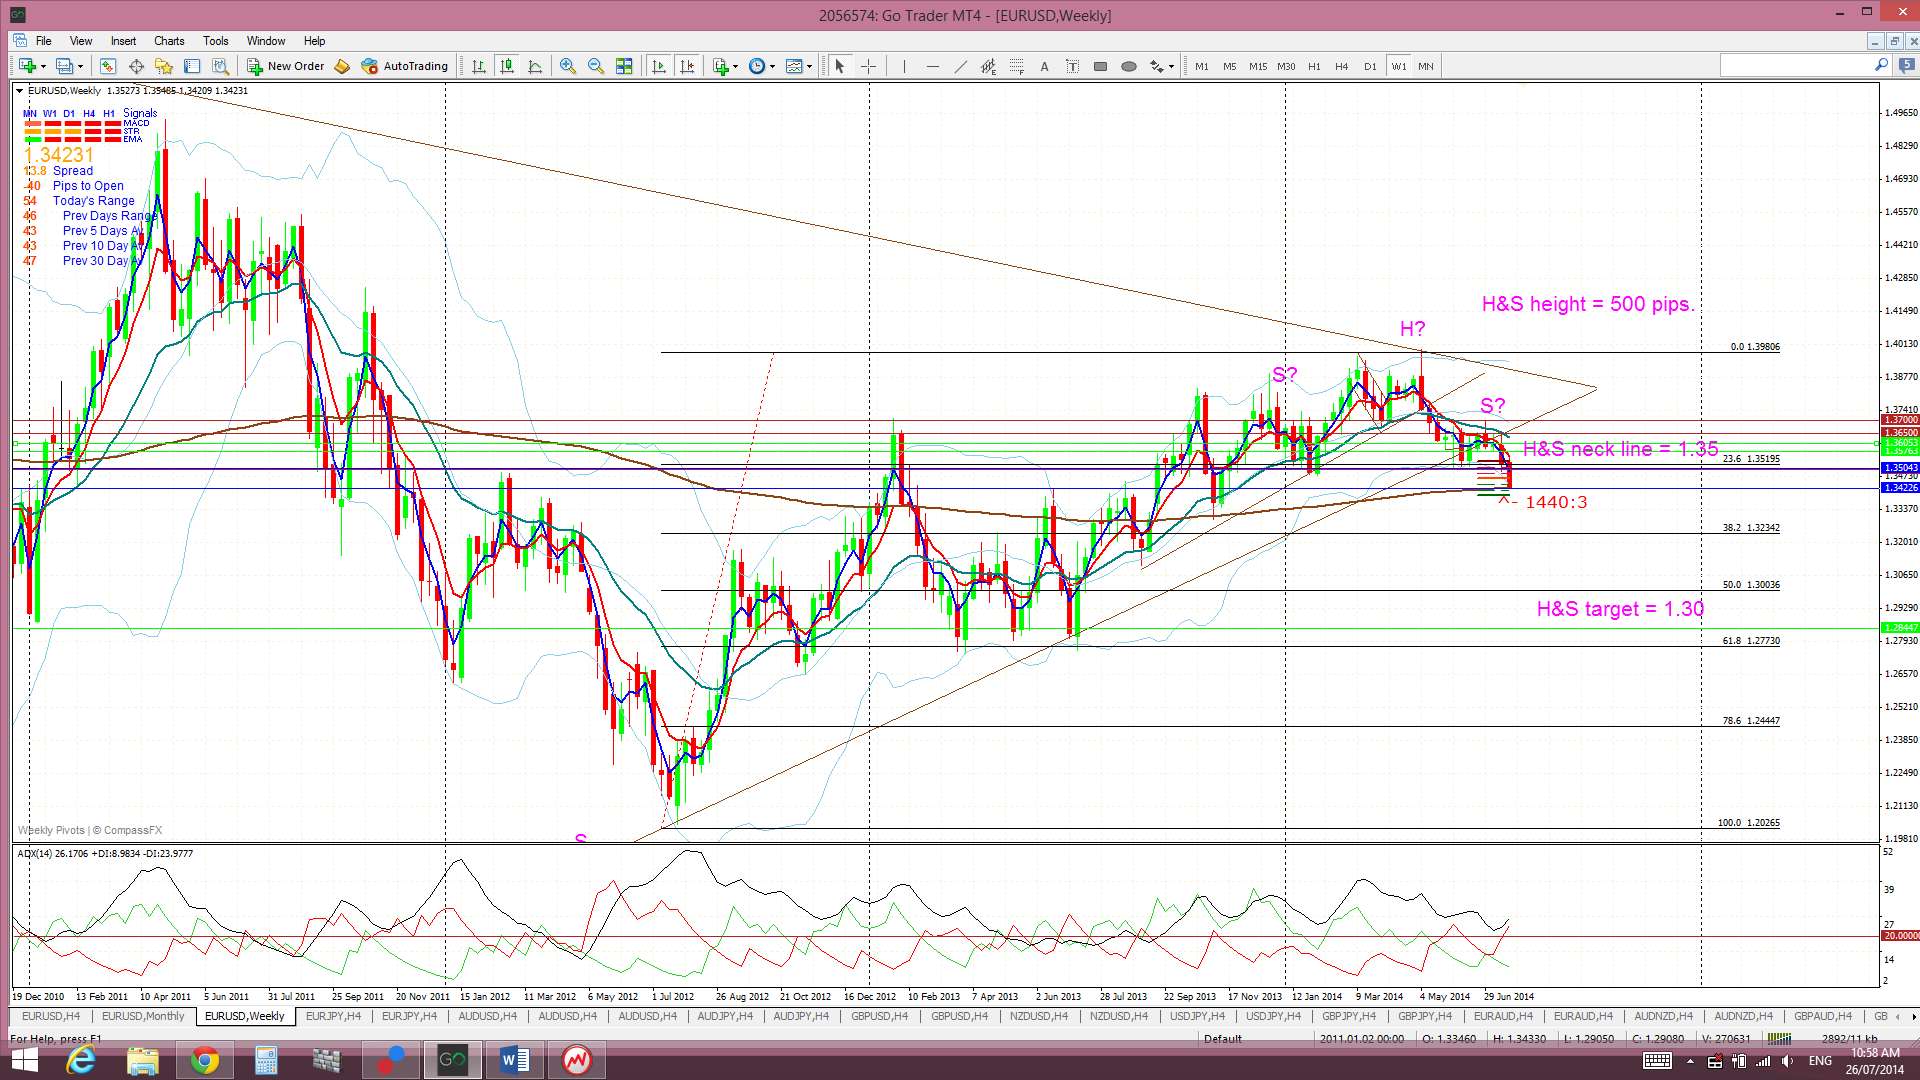
E/U: The 1.35 support gave way for the E/U early in the week and it closed the week below this key support but still just above the support of the weekly 200 EMA.
Weekly H&S? The weekly chart’s bearish ‘H&S’ appears to have evolved given that the ‘neck line’ region of 1.35 has now been clearly broken. The height of this weekly H&S pattern is about 500 pips. The theory of these technical patterns is that any bearish follow through can be expected to extend by the same order of magnitude as the height of the pattern. Thus, the projected target for this H&S pattern is 500 pips below the 1.35 level. This would predict the E/U to target the 1.30 level which is also near the 50% fib of the 2012-2014 bull move for added confluence. Technical theory would suggest shorting this pair from a re-test of the 1.35 broken neck line.
There is still a lot of support below this 1.35 level though and any bearish follow through may be choppy. Support levels can be seen on the weekly Ichimoku chart below and include the:
- weekly 200 EMA.
- bottom of the weekly Ichimoku Cloud.
- 50% fib level of this latest bull run.
- monthly 200 EMA AND
- 61.8% fib level of this latest bull run.
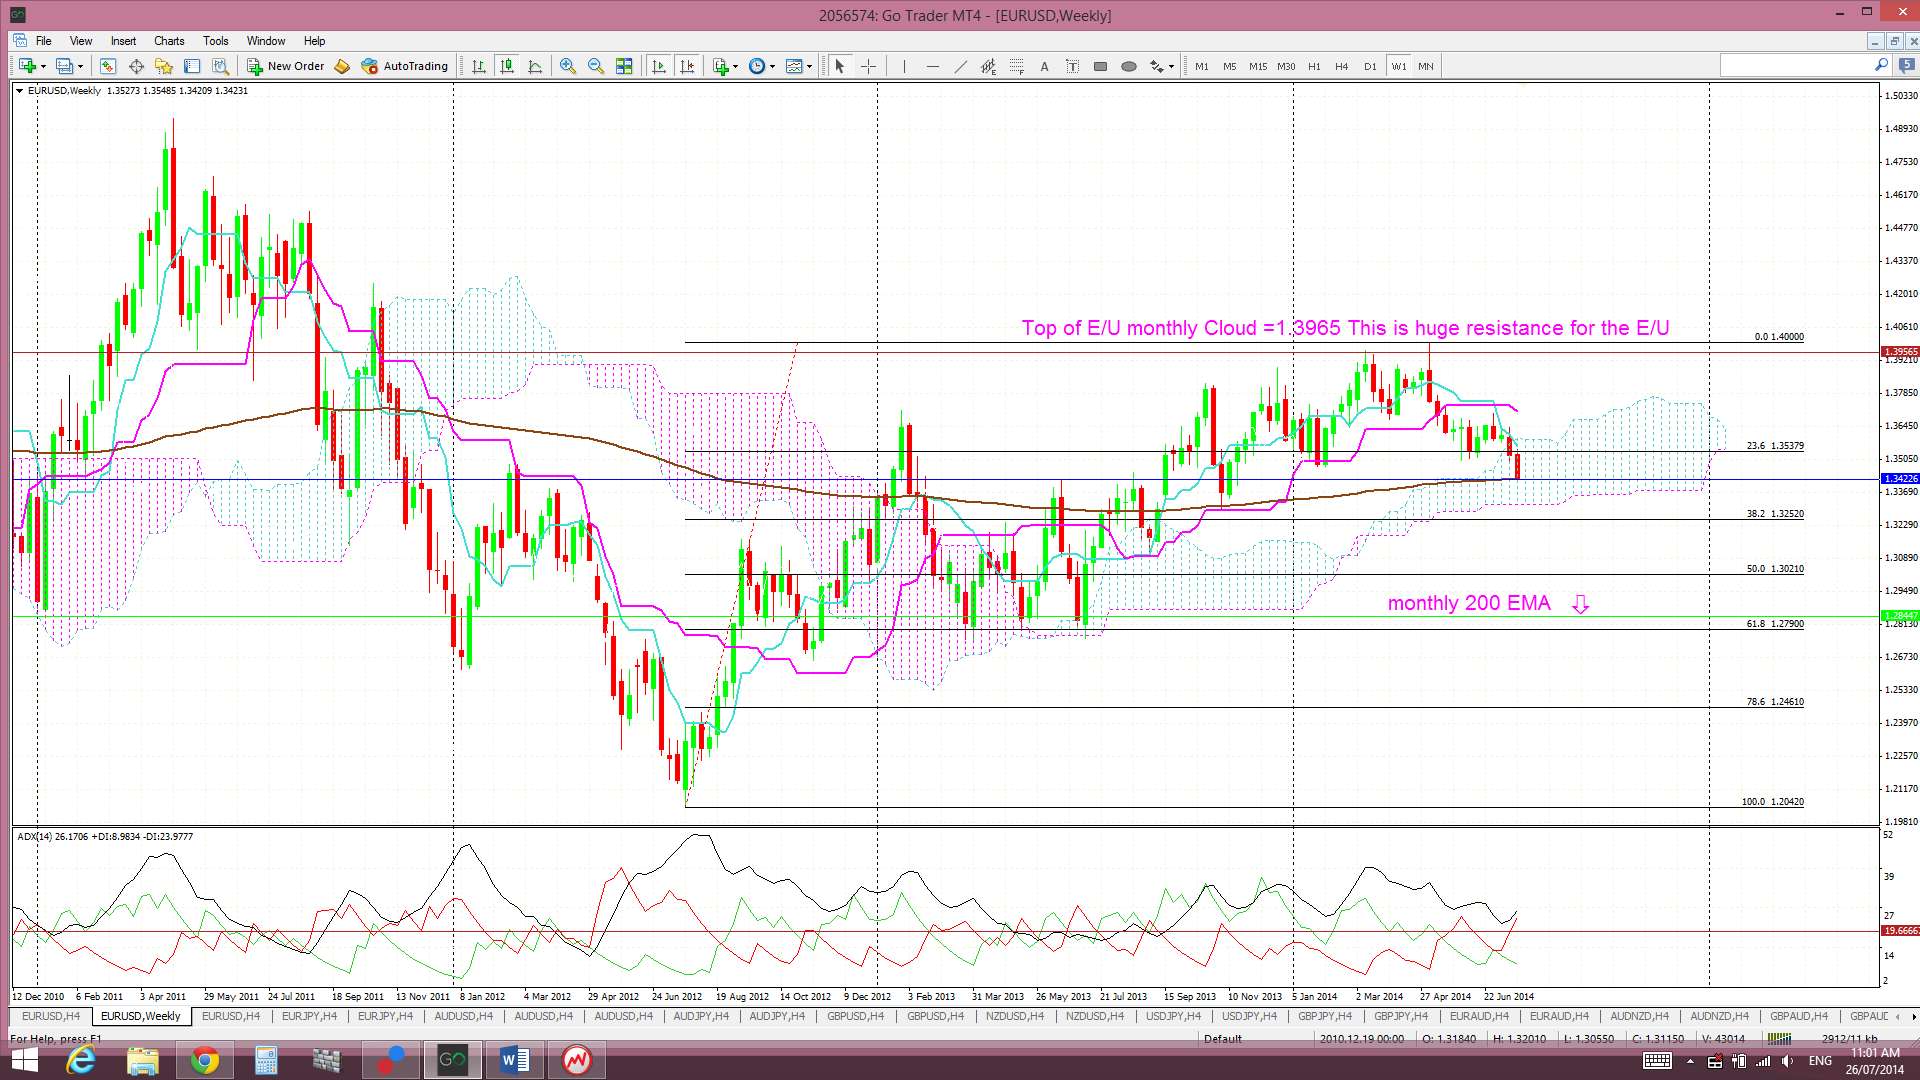
A word of caution: whilst the E/U looks ‘technically’ quite bearish there are quite a few data and fundamentals items this week that could surprise here. The USD index is approaching a major resistance level and any failure there could see a bounce/reversal with the E/U, even back up through the 1.35 level.
Price is now trading below the Ichimoku Cloud on the 4hr and daily charts, in the middle of the Cloud on the weekly chart and near the bottom of the Cloud on the monthly chart.
The weekly candle closed again as a bearish candle.
- I’m watching for any new TC signal on this pair and the 1.35 level.
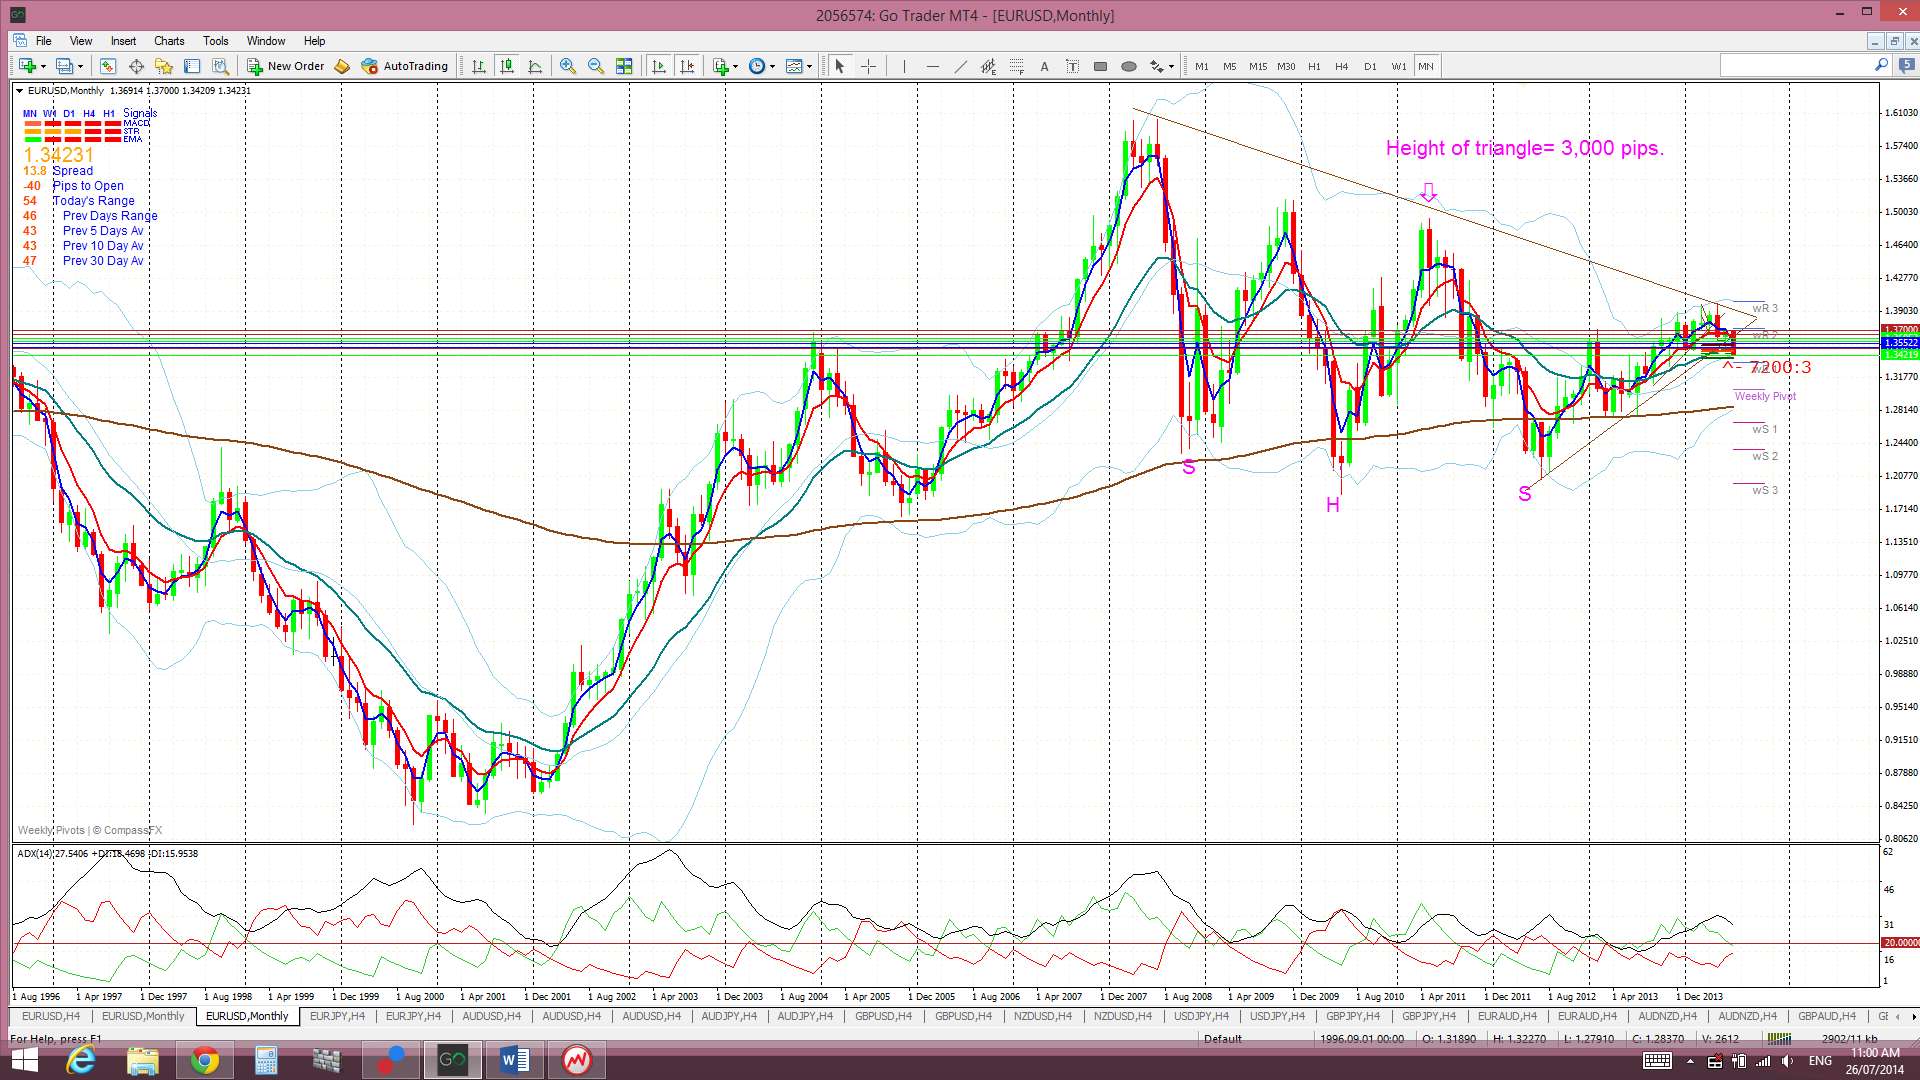
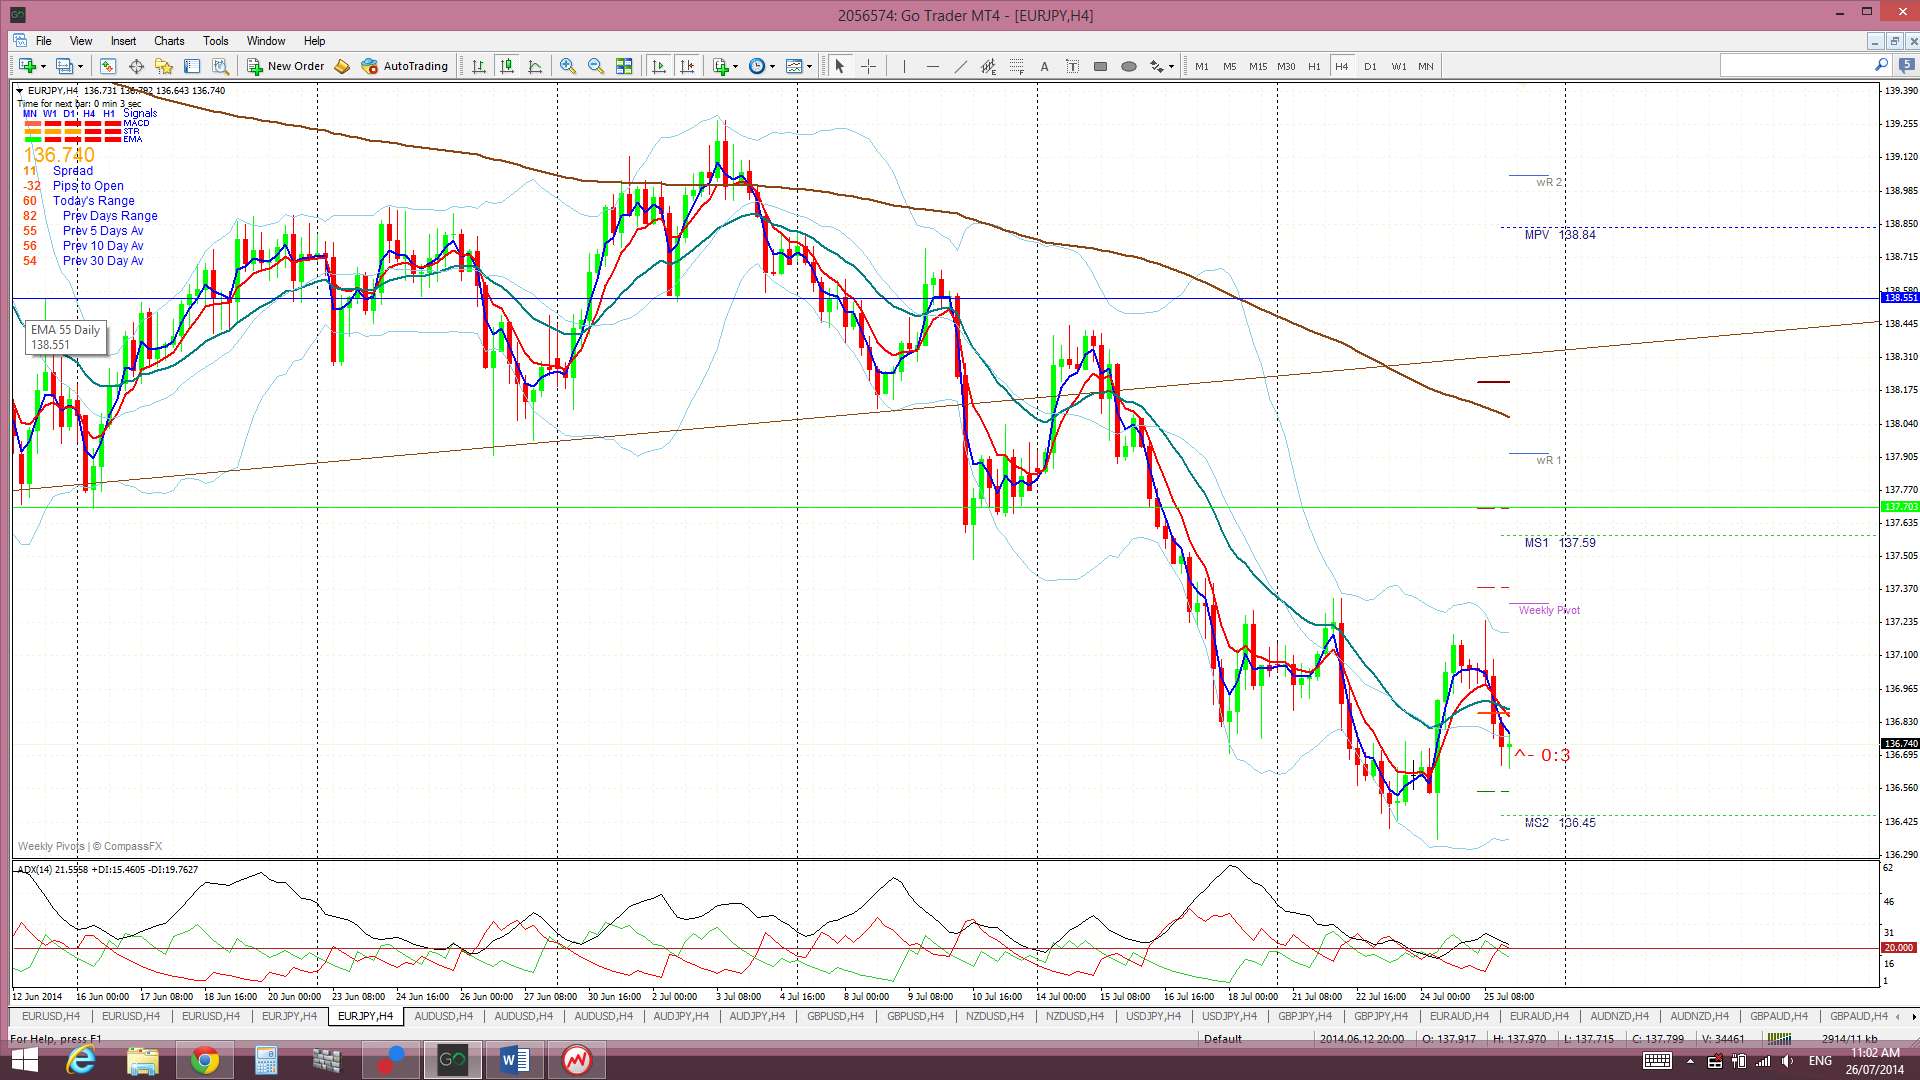
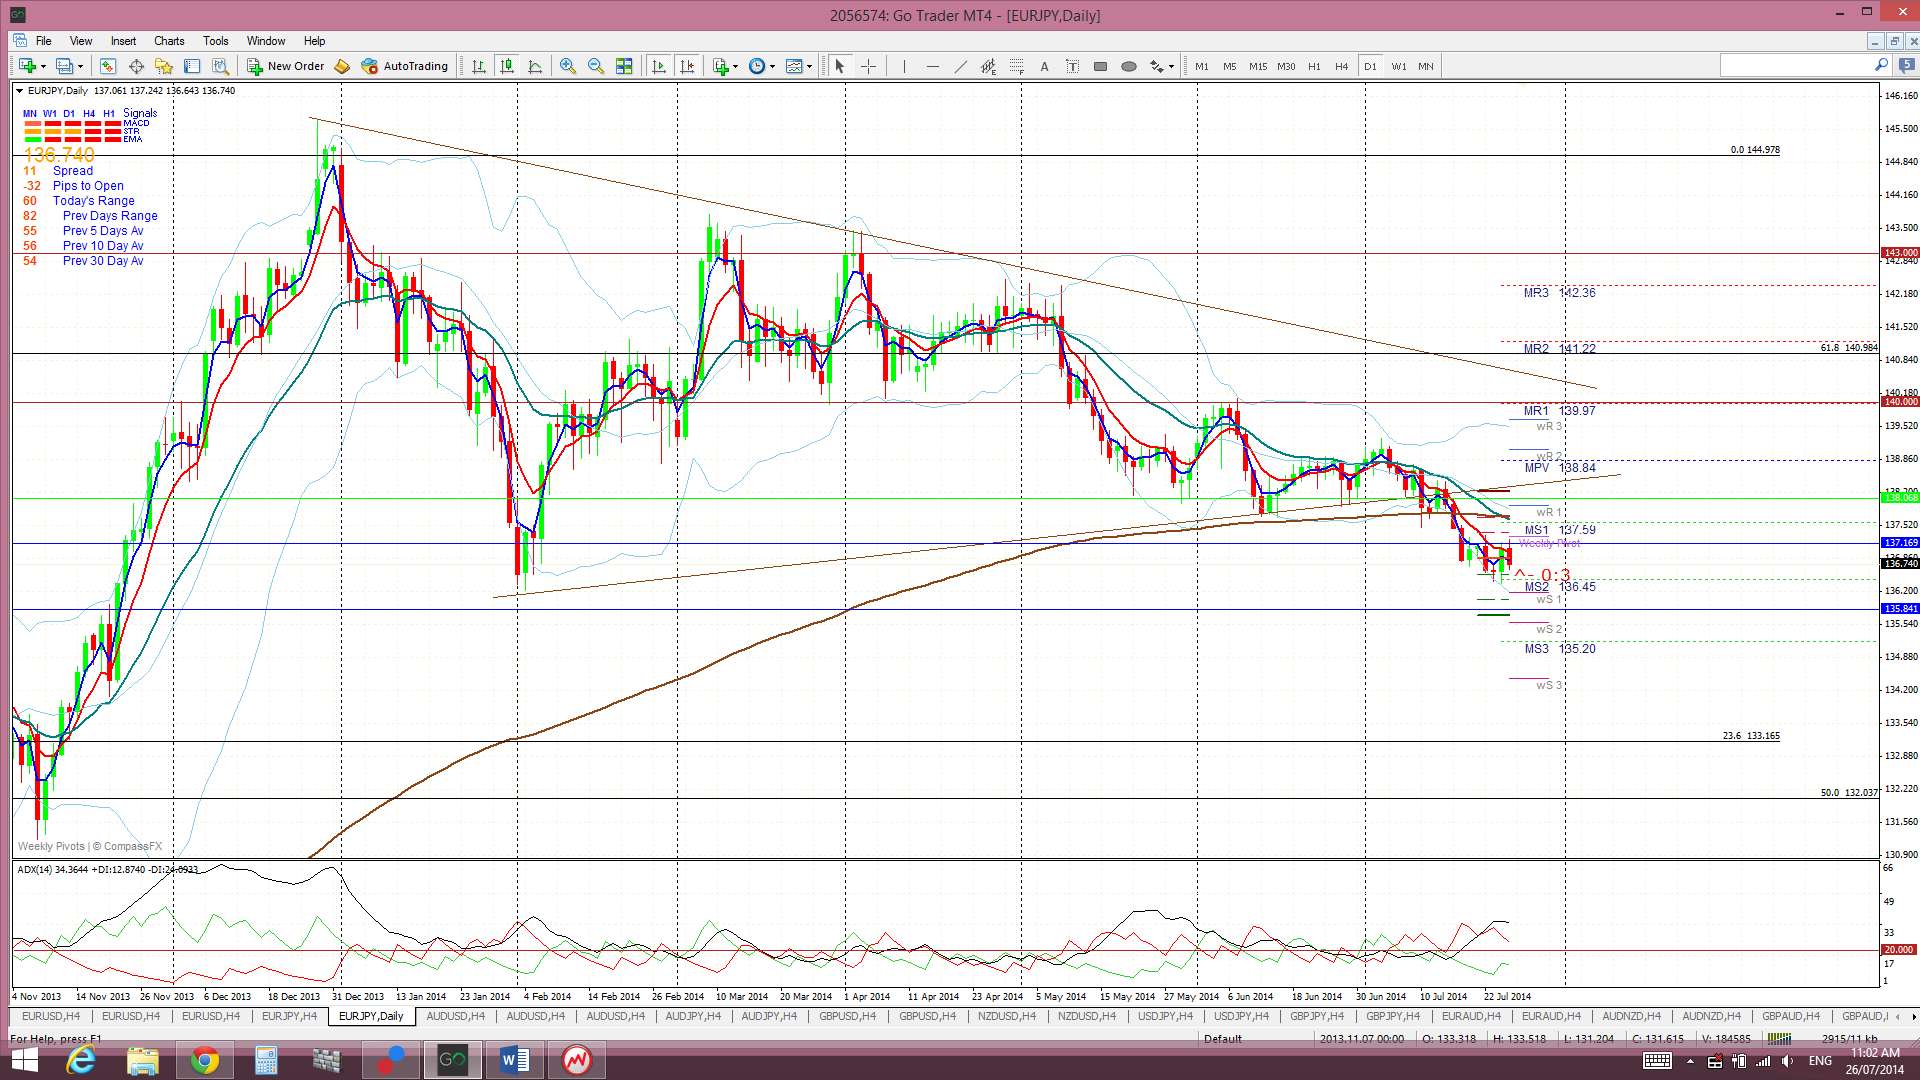
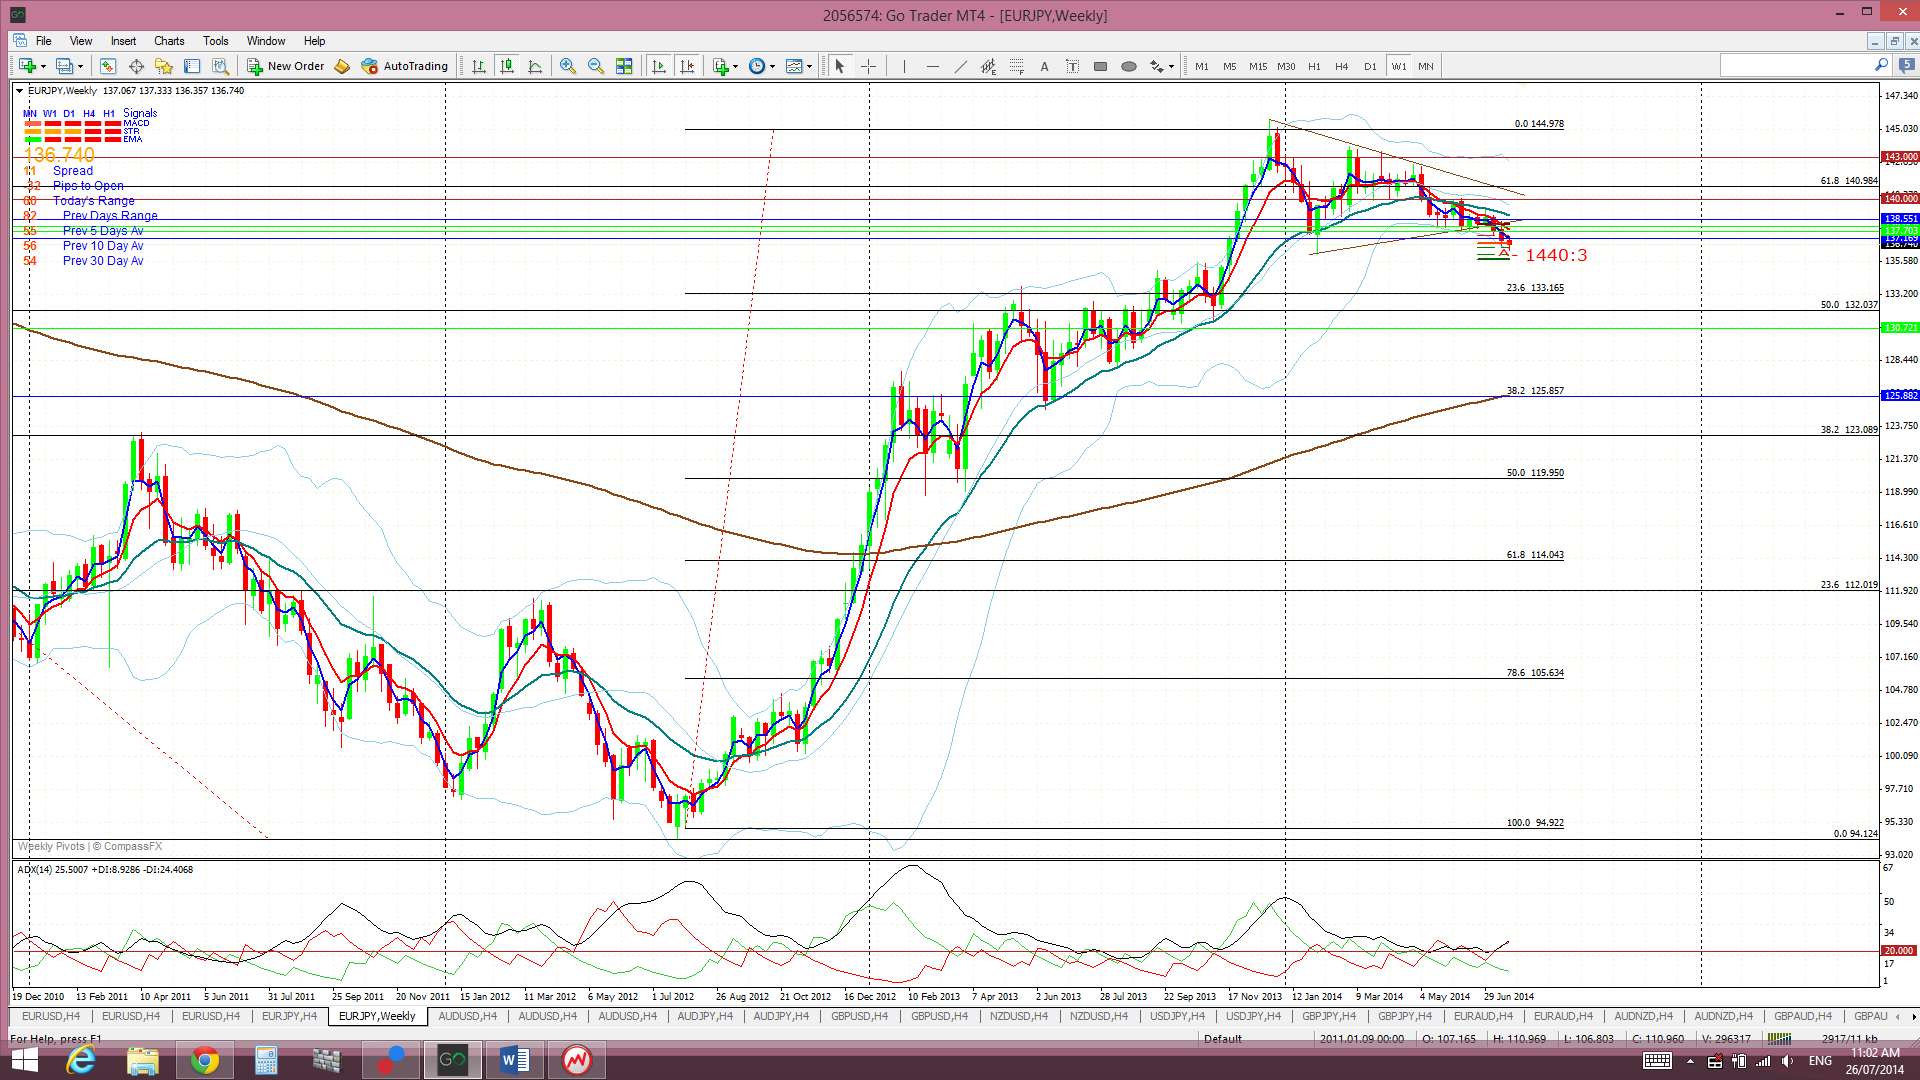
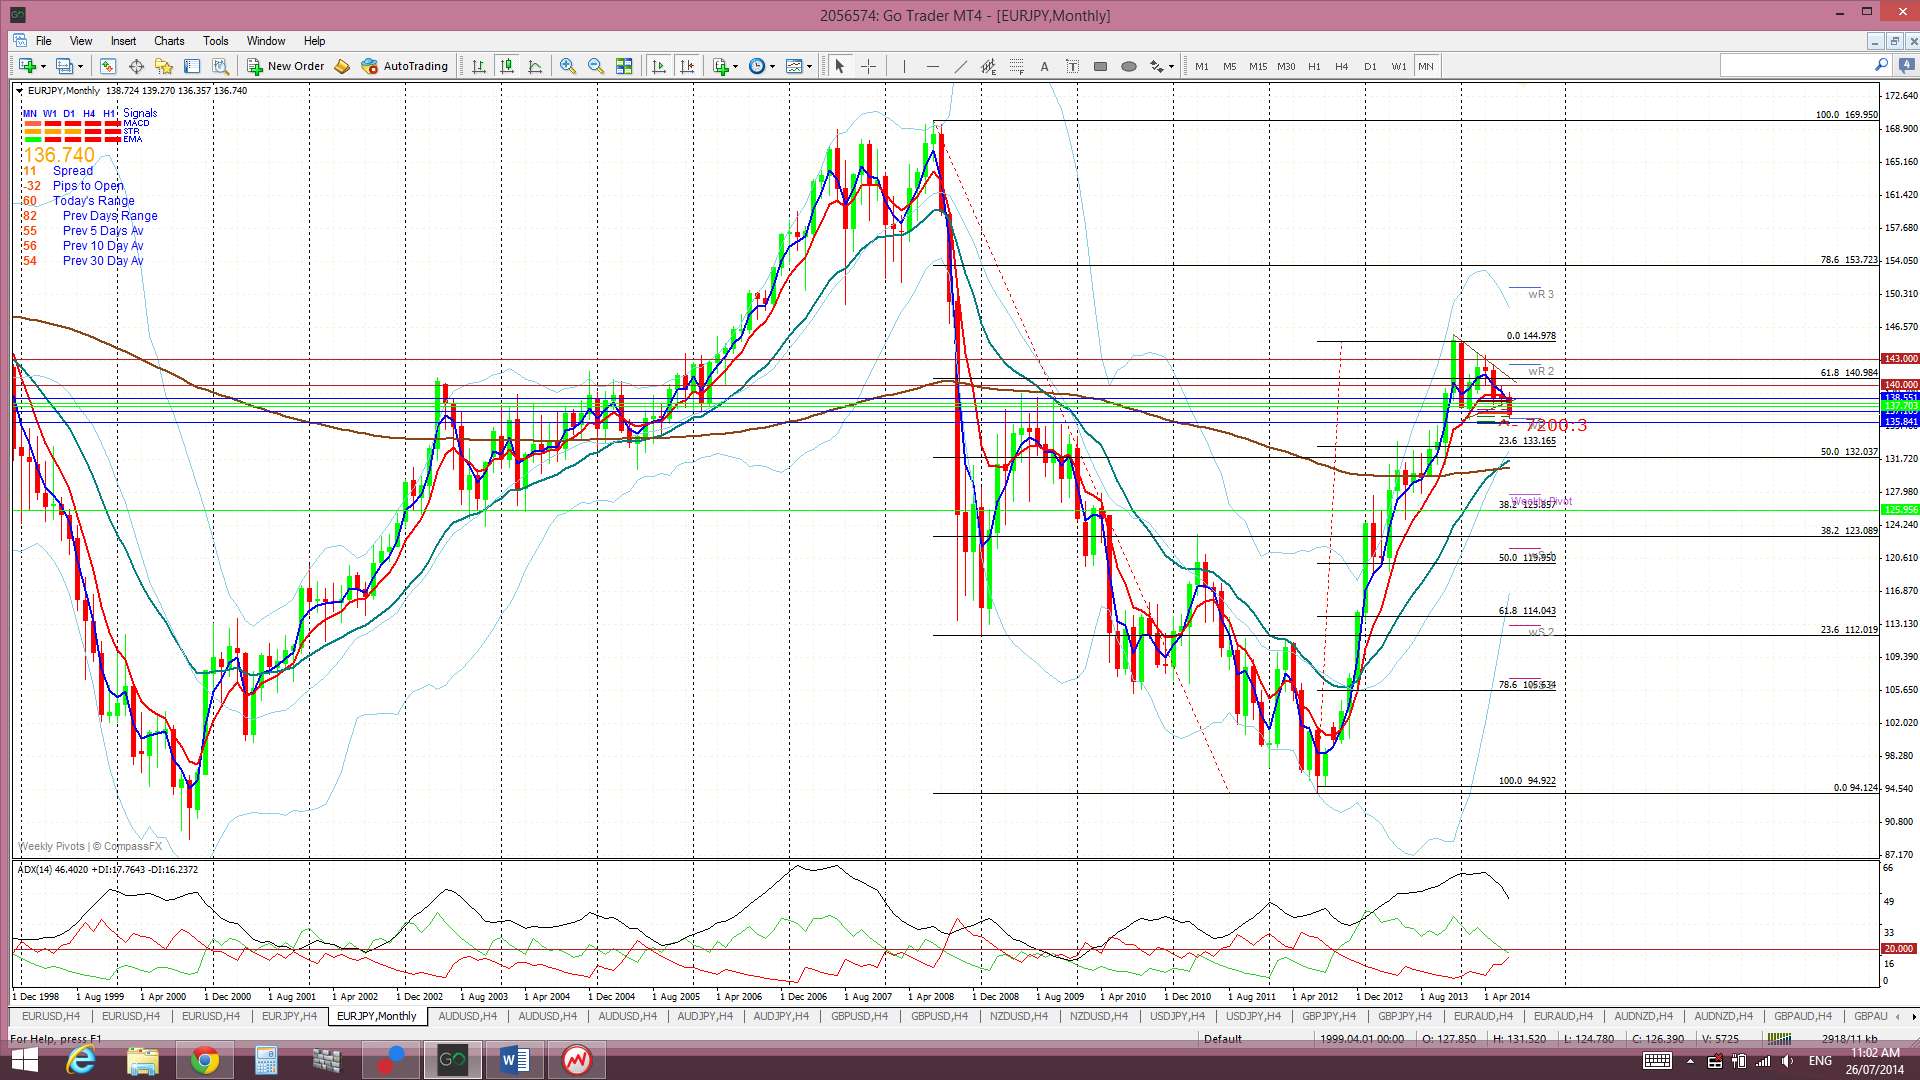
E/J: The E/J snaked up and down last week but still closed below the daily 200 EMA.
Price is still trading below the Cloud on the 4hr and the daily chart, in the Cloud on the weekly but above the Cloud on the monthly chart. The November and December candles were the first to close above the resistance of the monthly Ichimoku Cloud since 2008.
The weekly candle closed as a small bearish candle.
The weekly chart’s ‘Bull Flag’ looks to have broken now. I have fibbed the latest bull move and a 23.6% fib pull back would bring price to the 133 area which is also the region of the top of the monthly Cloud. A 50% pull back brings price to down near the 120 area. A test of either of these regions is not out of order.
- I’m watching for any new TC signal on this pair and the daily 200 EMA.
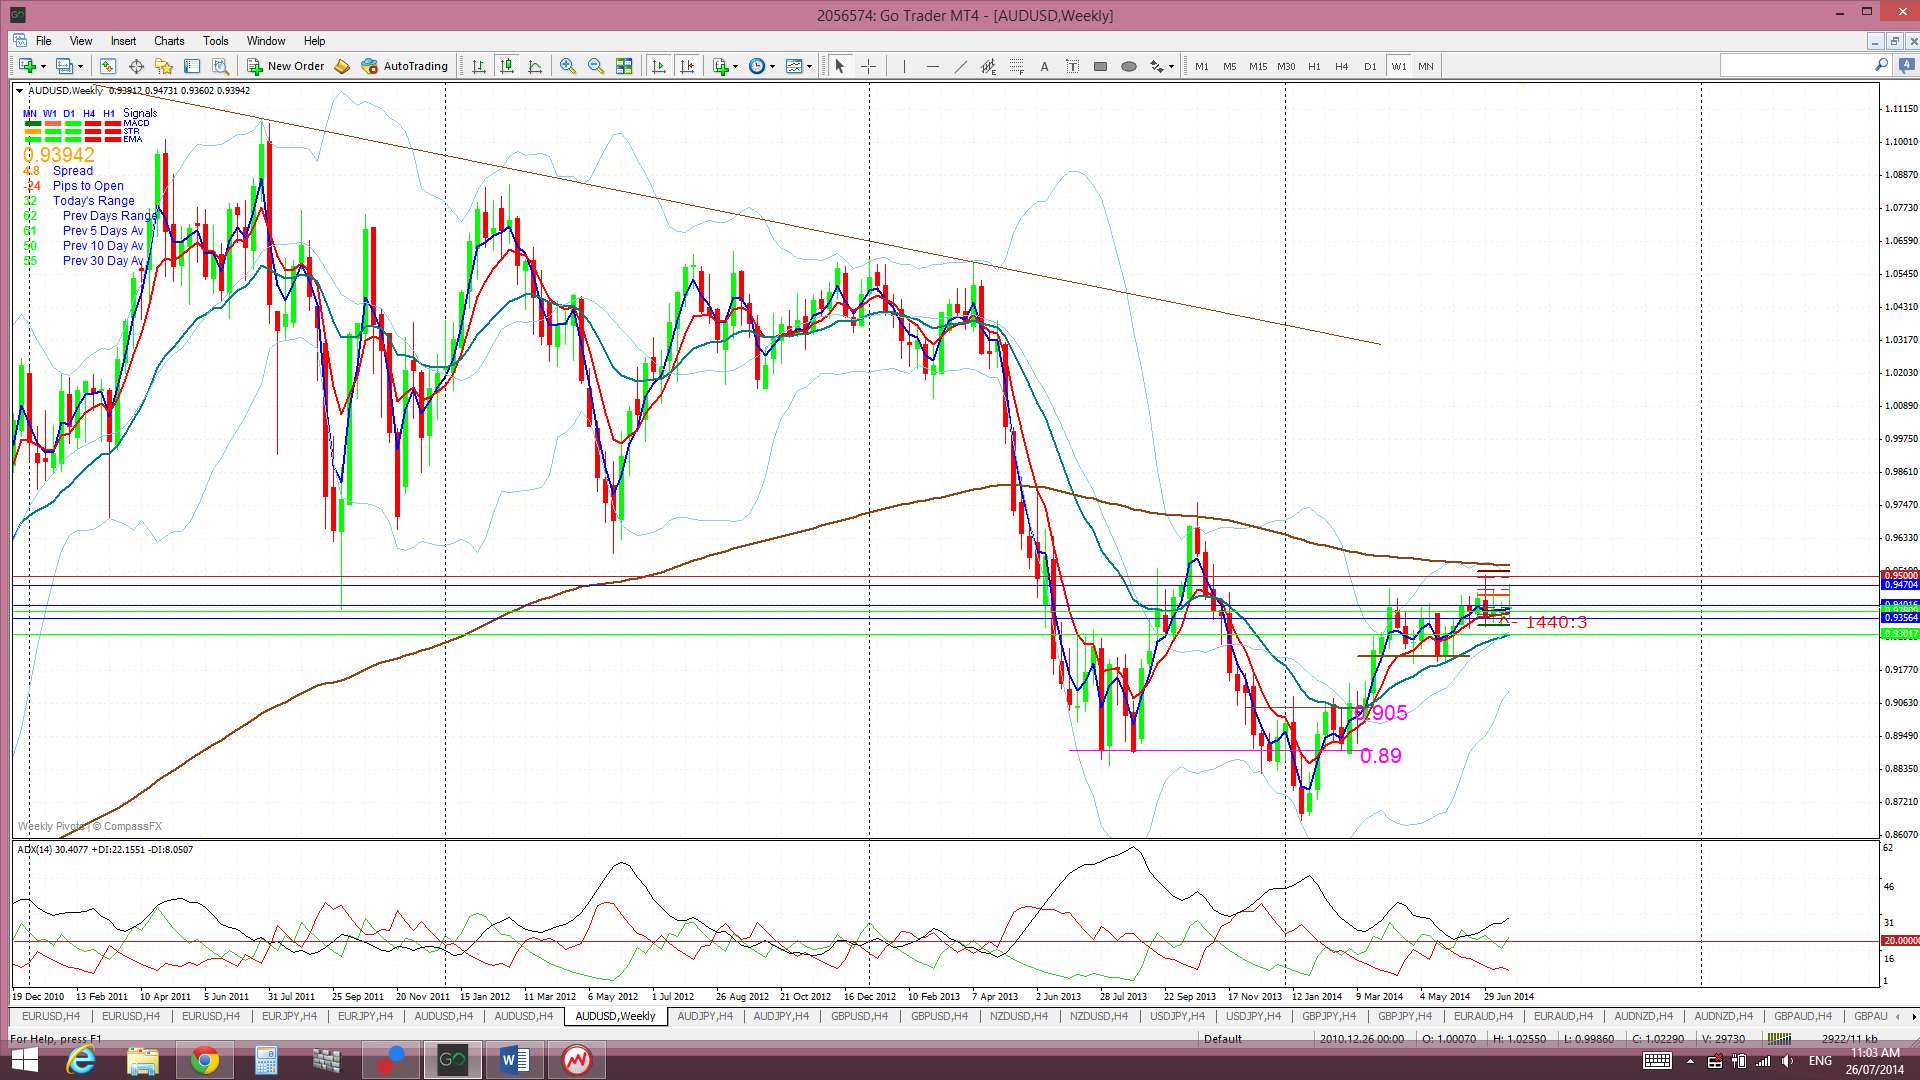
A/U: The AUD chopped higher last week on some positive data but continuing USD strength kept pressure on the A/U and it closed the week back below the 0.94 level.
There has been a recent bearish Tenkan/Kijun cross on the daily Ichimoku chart but this was deemed a ‘weak’ signal as it evolved above the Cloud. The Tenkan/Kijun lines are still rather flat indicating no real trend.
Price is now trading above the Cloud on the 4hr and daily charts, in the bottom of the Cloud on the weekly chart and in the middle of the Cloud on the monthly chart.
The weekly candle closed as a bullish coloured Doji reflecting the indecision here.
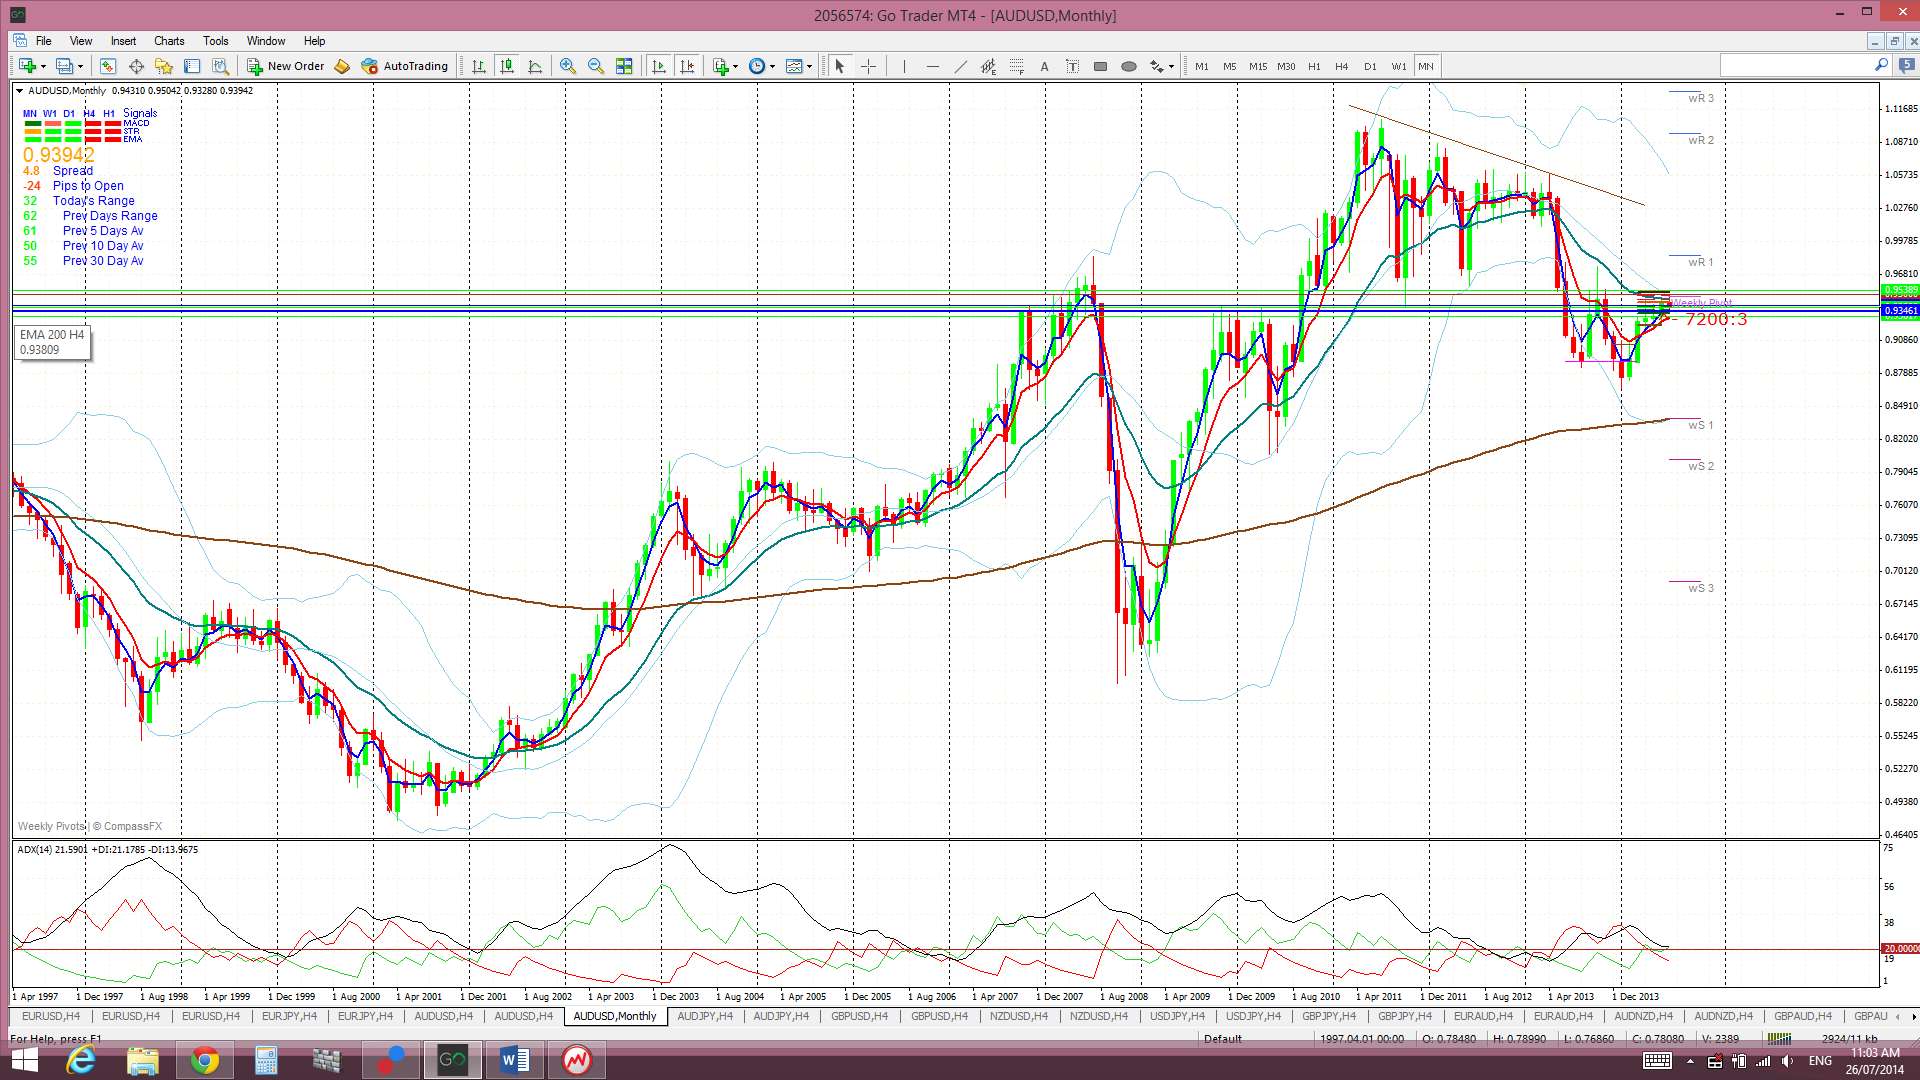
I have posted the monthly Ichimoku chart for the A/U again. The Aussie has been stuck within the congestion of the monthly Cloud for almost 13 months now. It is worth noting how broad this Cloud is as well. Many traders have expressed frustration with this pair and this may continue until the Aussie can clear this region. Note also how price has rallied since the bullish ‘Railway Track’ pattern was noted back at the end of February.
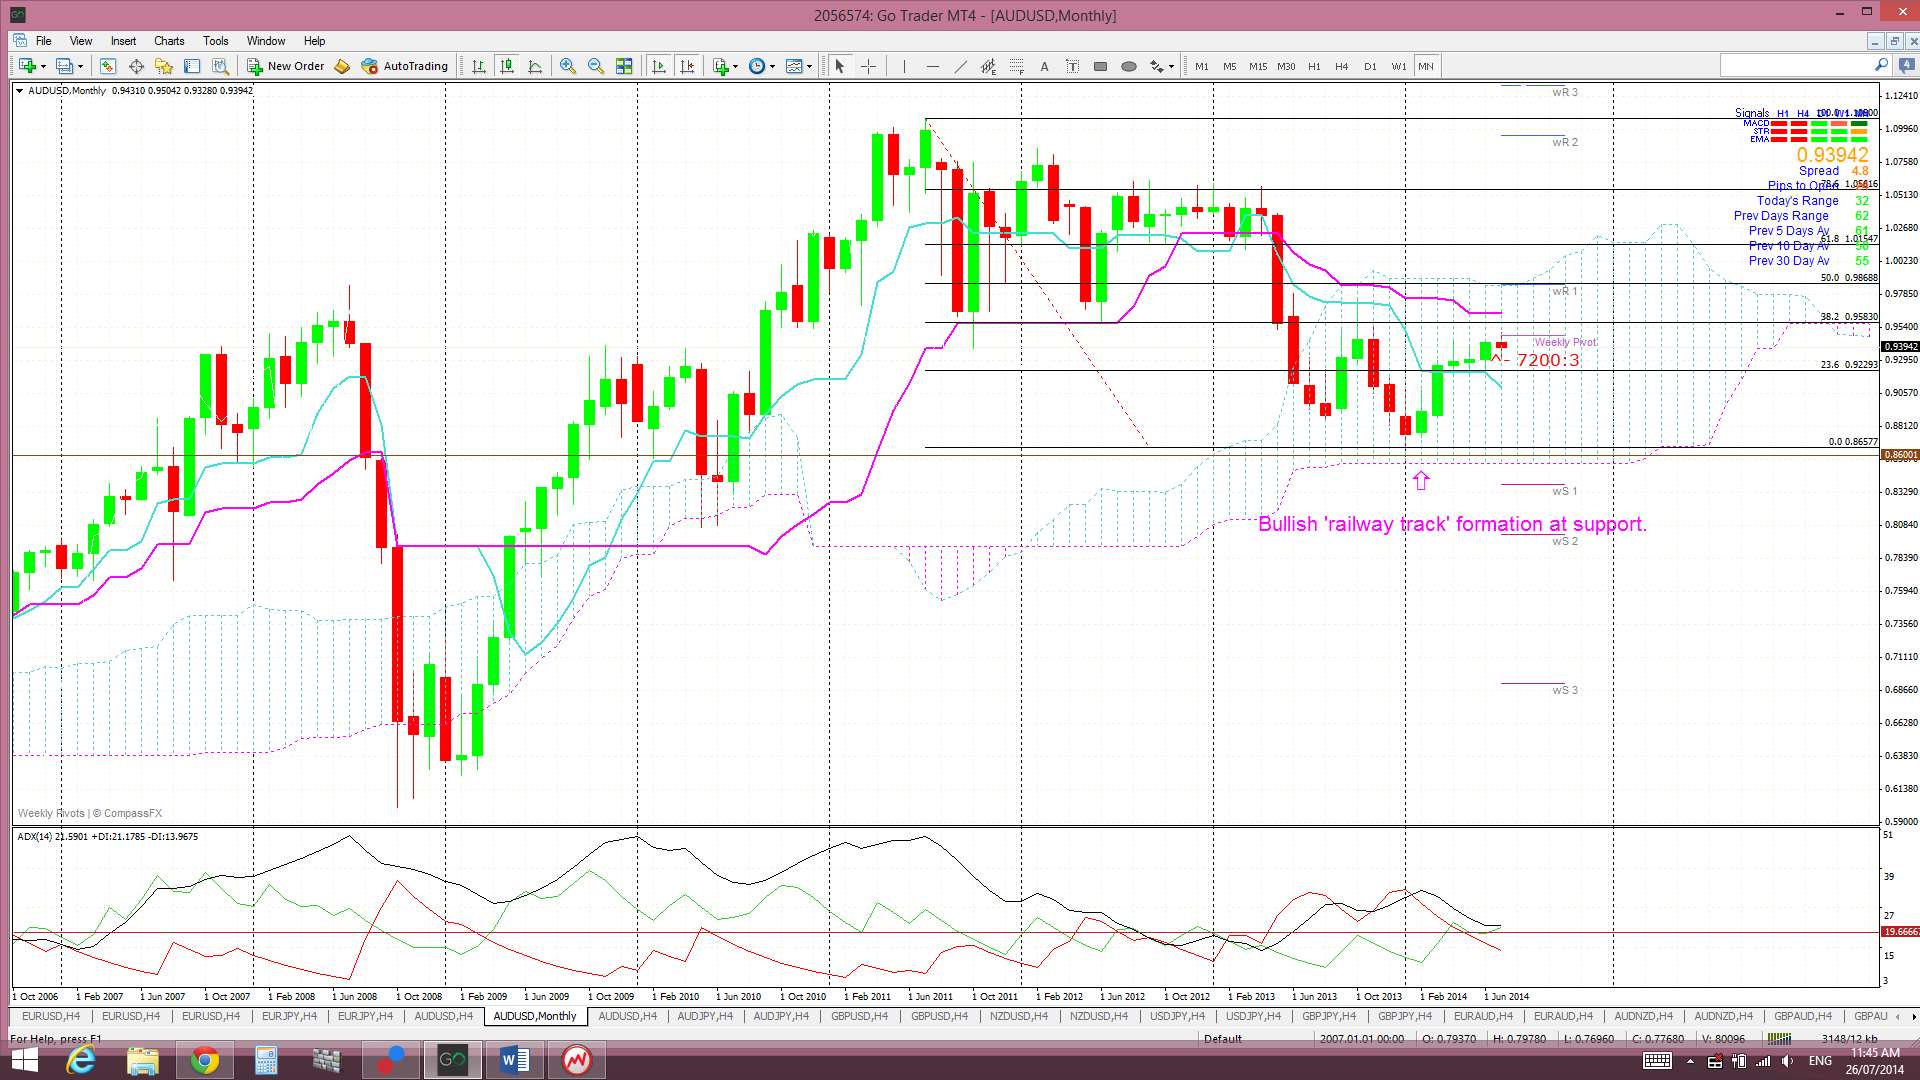
- I’m watching for any new TC signal on this pair and the 0.94 level.
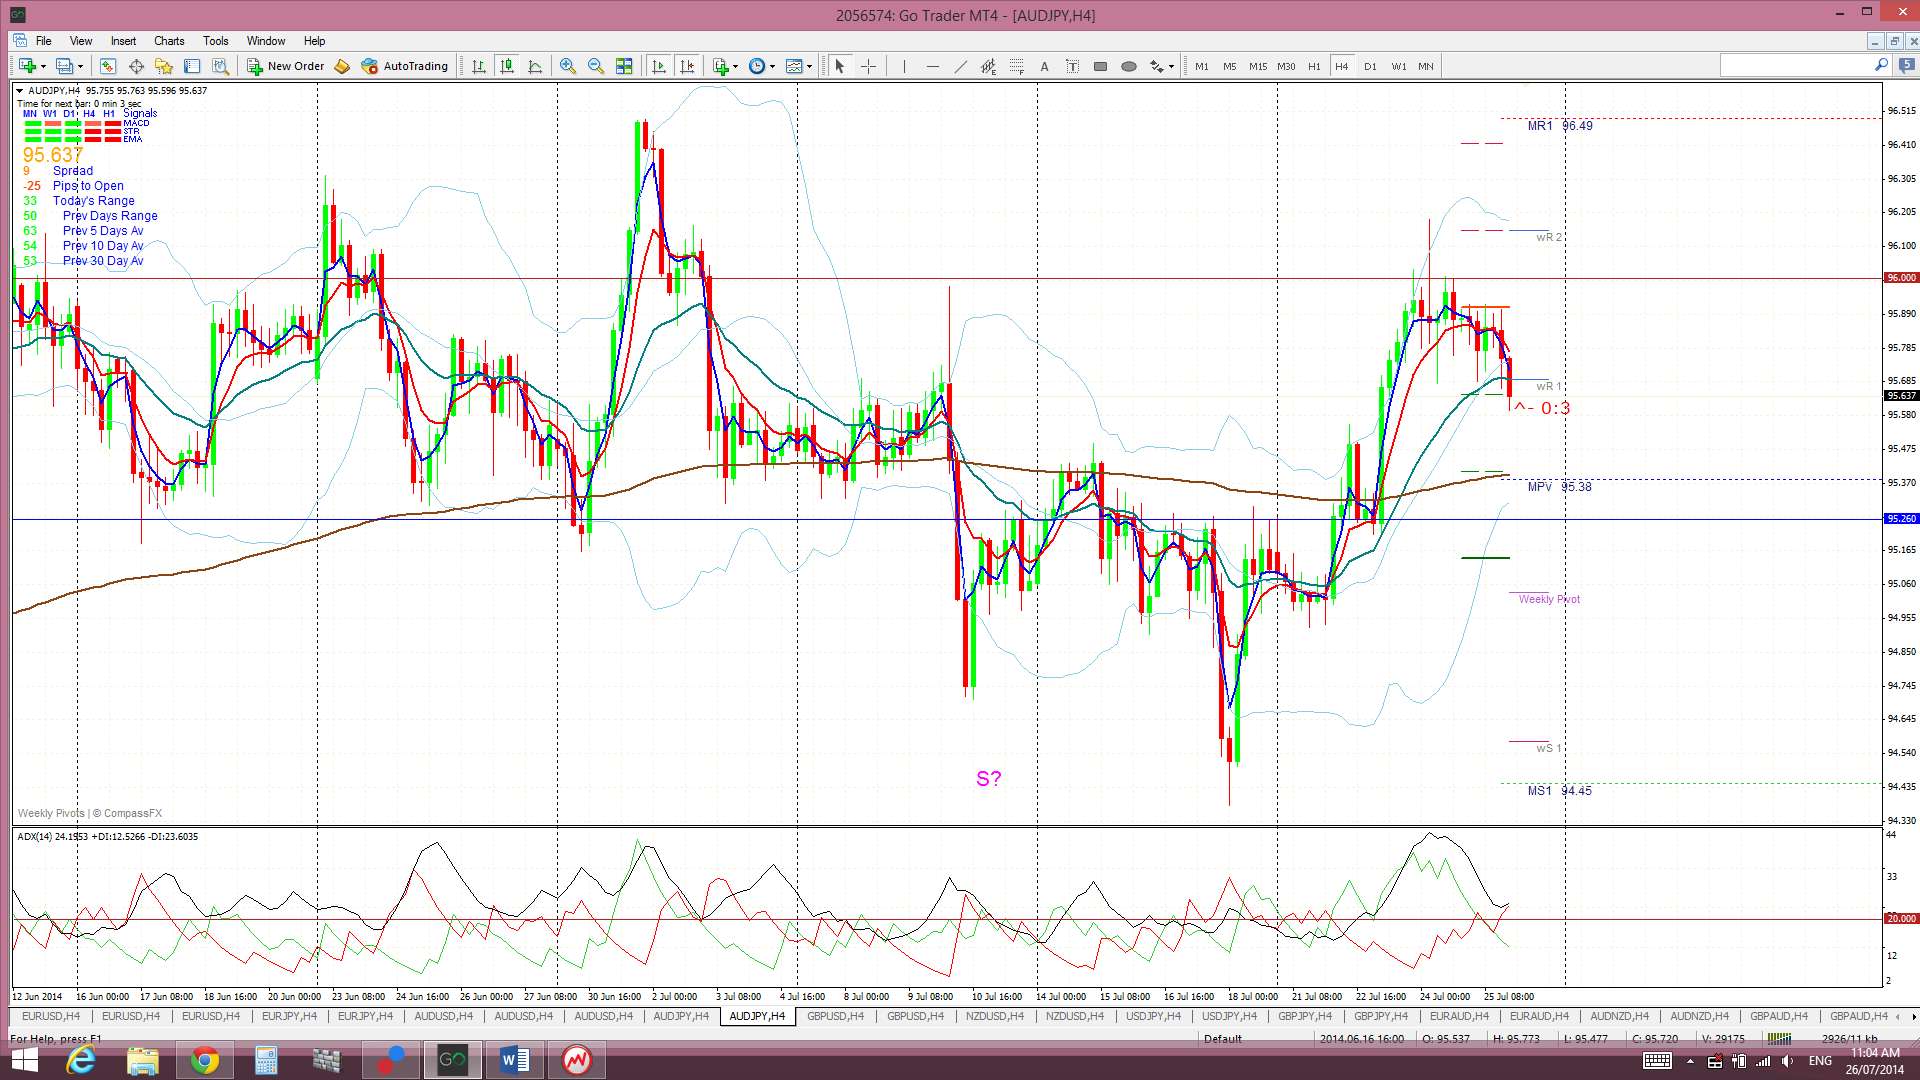
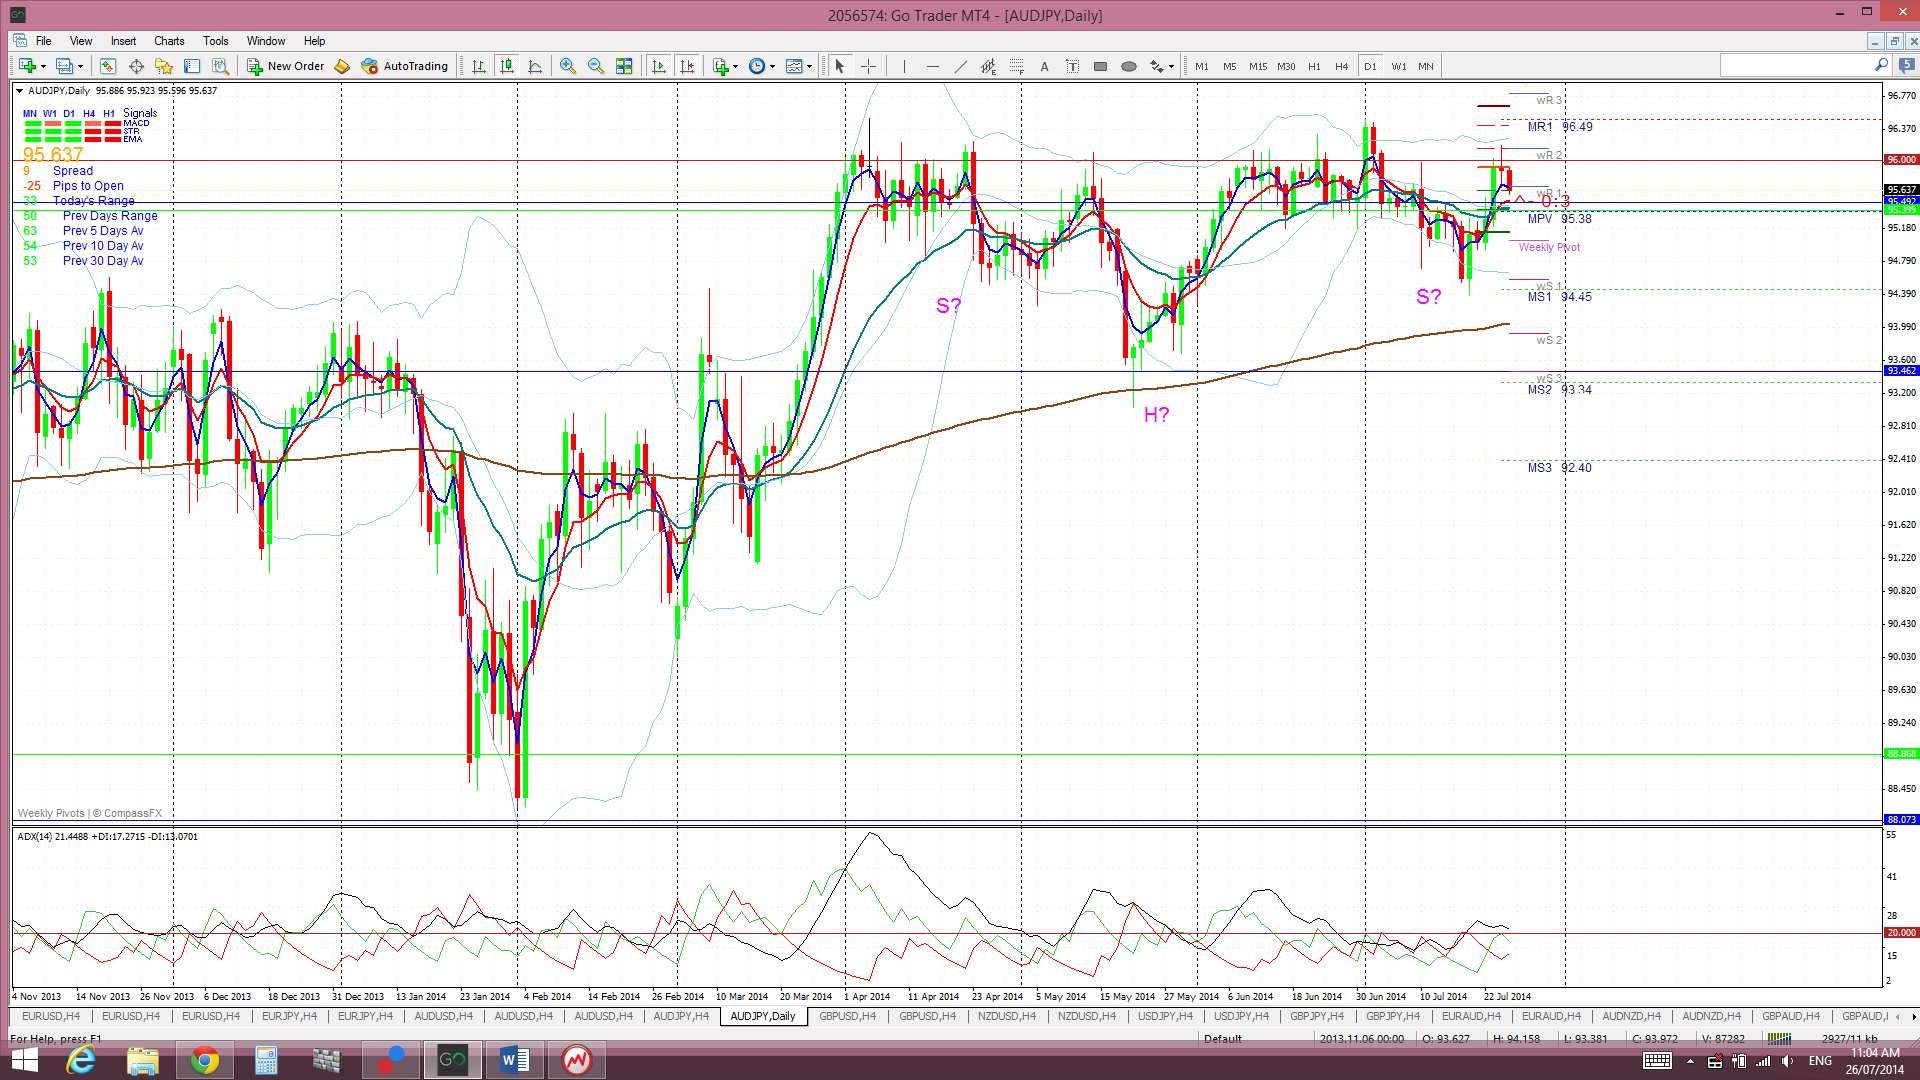
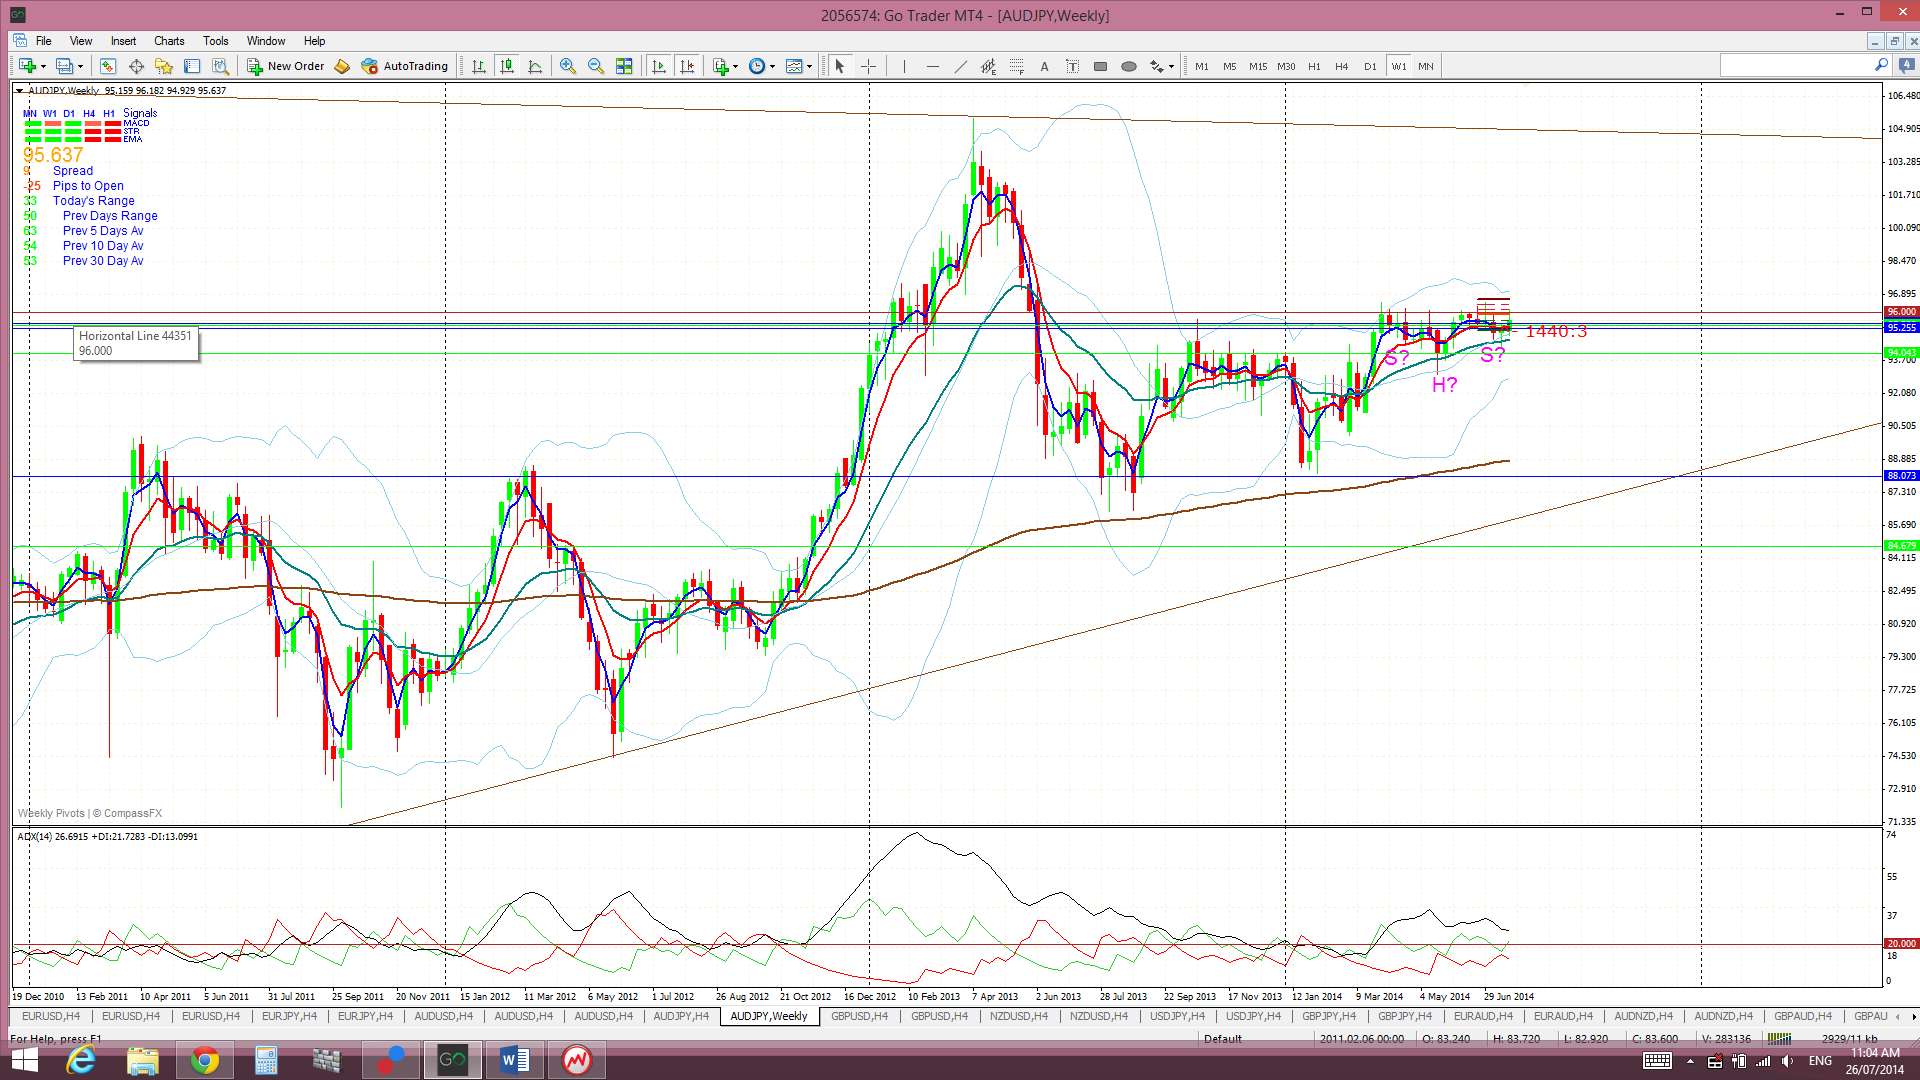
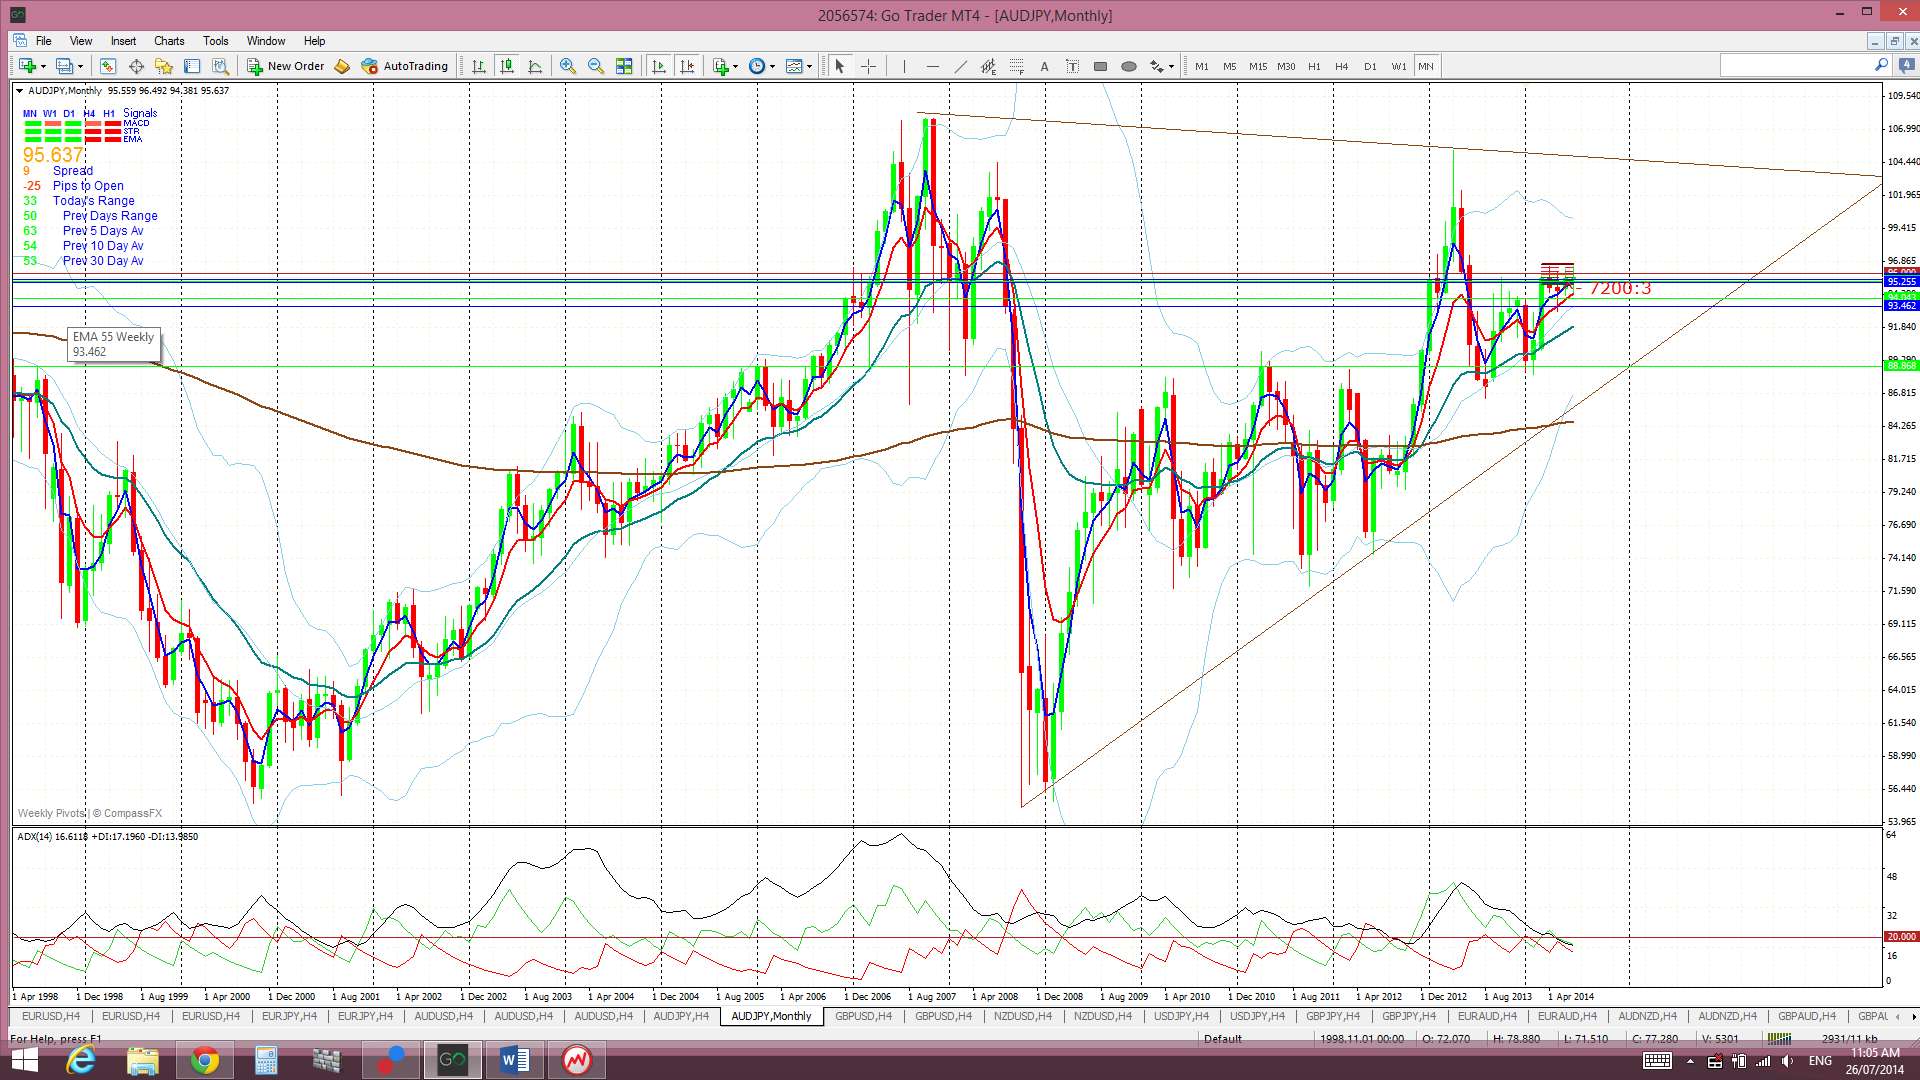
A/J: The A/J chopped higher last week and back up to the region of the key S/R level of 96 but it couldn’t manage to close above this S/R level. The daily chart’s bullish ‘Inverse H&S’ is still in contention here though.
Bullish Inverse H&S? The daily charts shows a rather sloppy but bullish ‘inverse H&S’ possibly still setting up on this pair. The ‘neck line’ is at the crucial 96 level.
Price is now trading above the Cloud on the 4hr, daily and monthly charts and in the top edge of the Cloud on the weekly chart. This represents a bullish shift here.
The weekly candle closed as a small bullish candle.
- I’m watching for any new TC signal on this pair, the daily chart’s ‘inverse H&S’ and the 96 level.
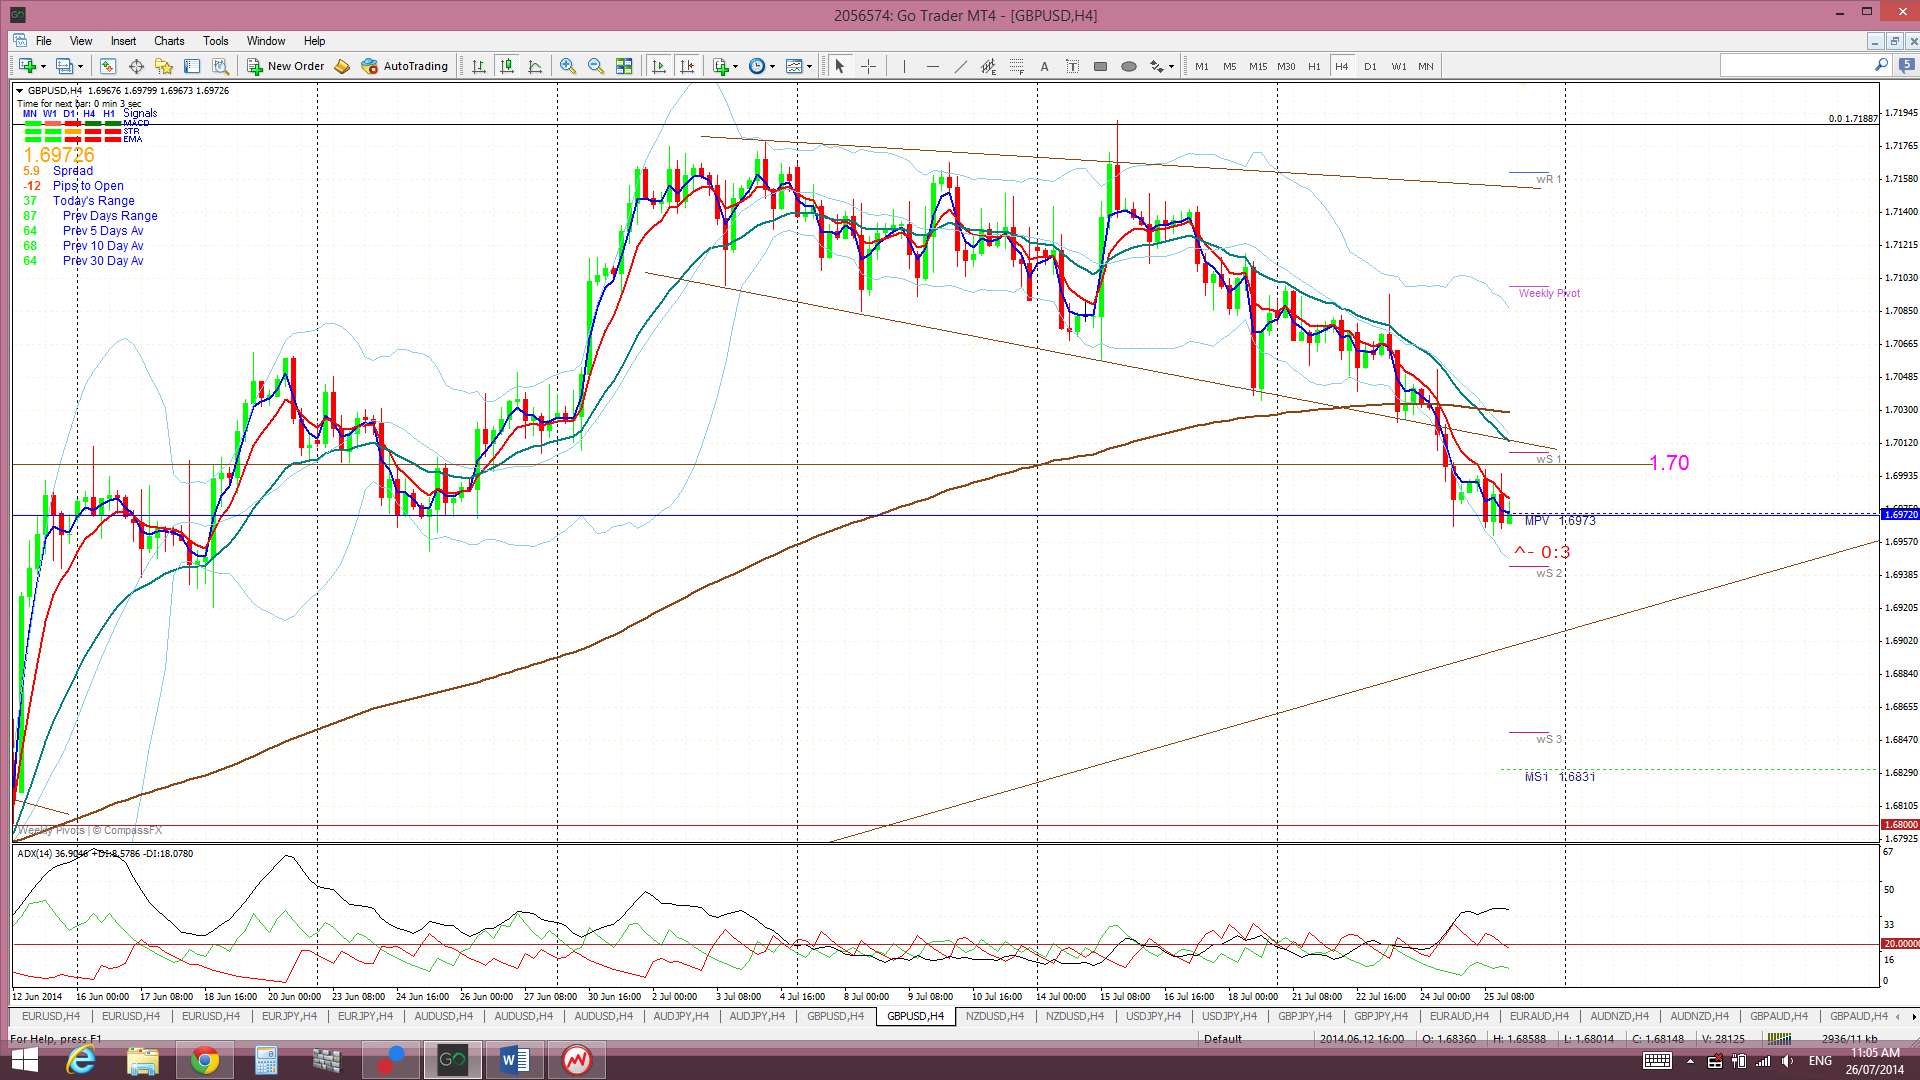
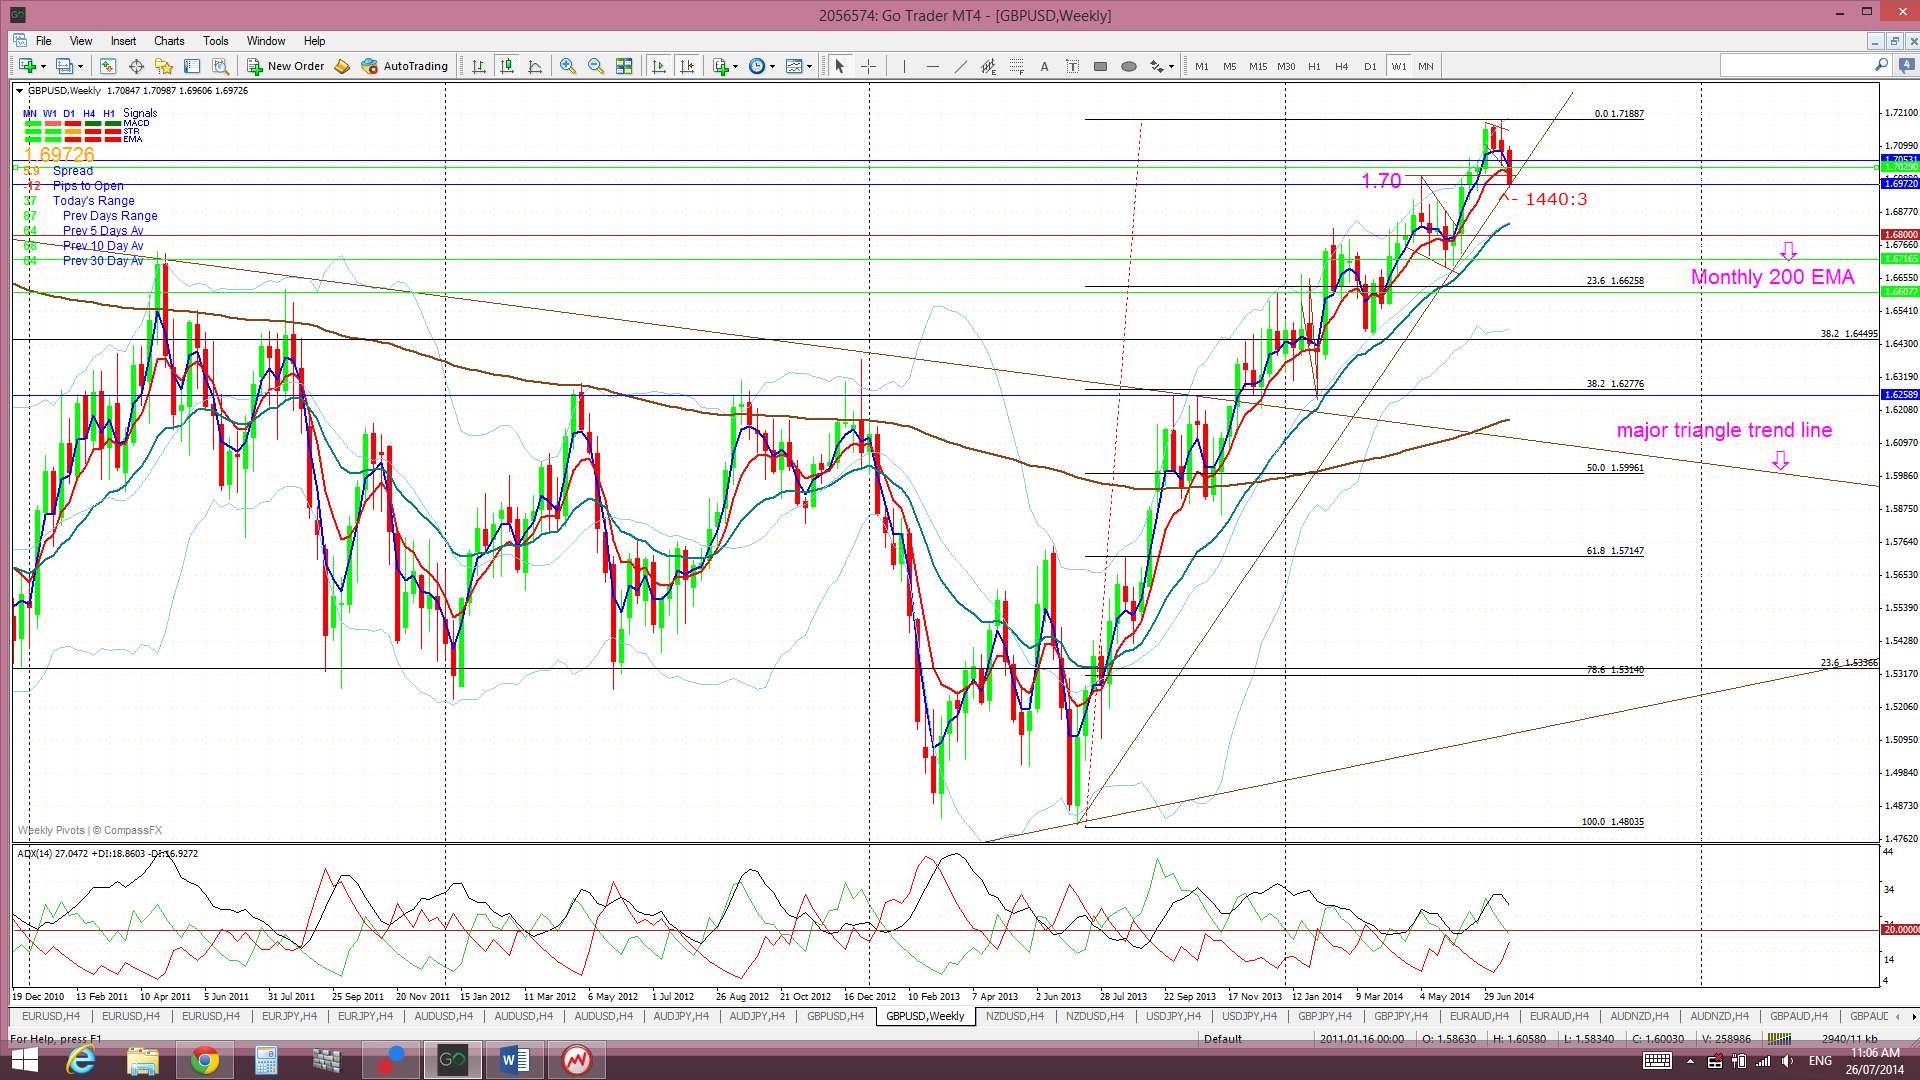
G/U: The Cable continued to chop lower within the trading channel until Thursday of last week. Some weaker than expected GBP Retail Sales data then provided the trigger to spark a move lower on this pair, out and down from the trading channel and below the 1.70 S/R level.
Whilst much is being made of the weekly close below the 1.70 level, the weekly chart shows that the Cable is still holding above a weekly support trend line. A breach of this would be bearish though and would suggest a further pull back. Possible pull back targets include the monthly 200 EMA, near the 23.6% fib of the recent bull move and the 50% bib near the previously broken monthly chart’s triangle trend line. The weekly support trend line will need monitoring here next week.
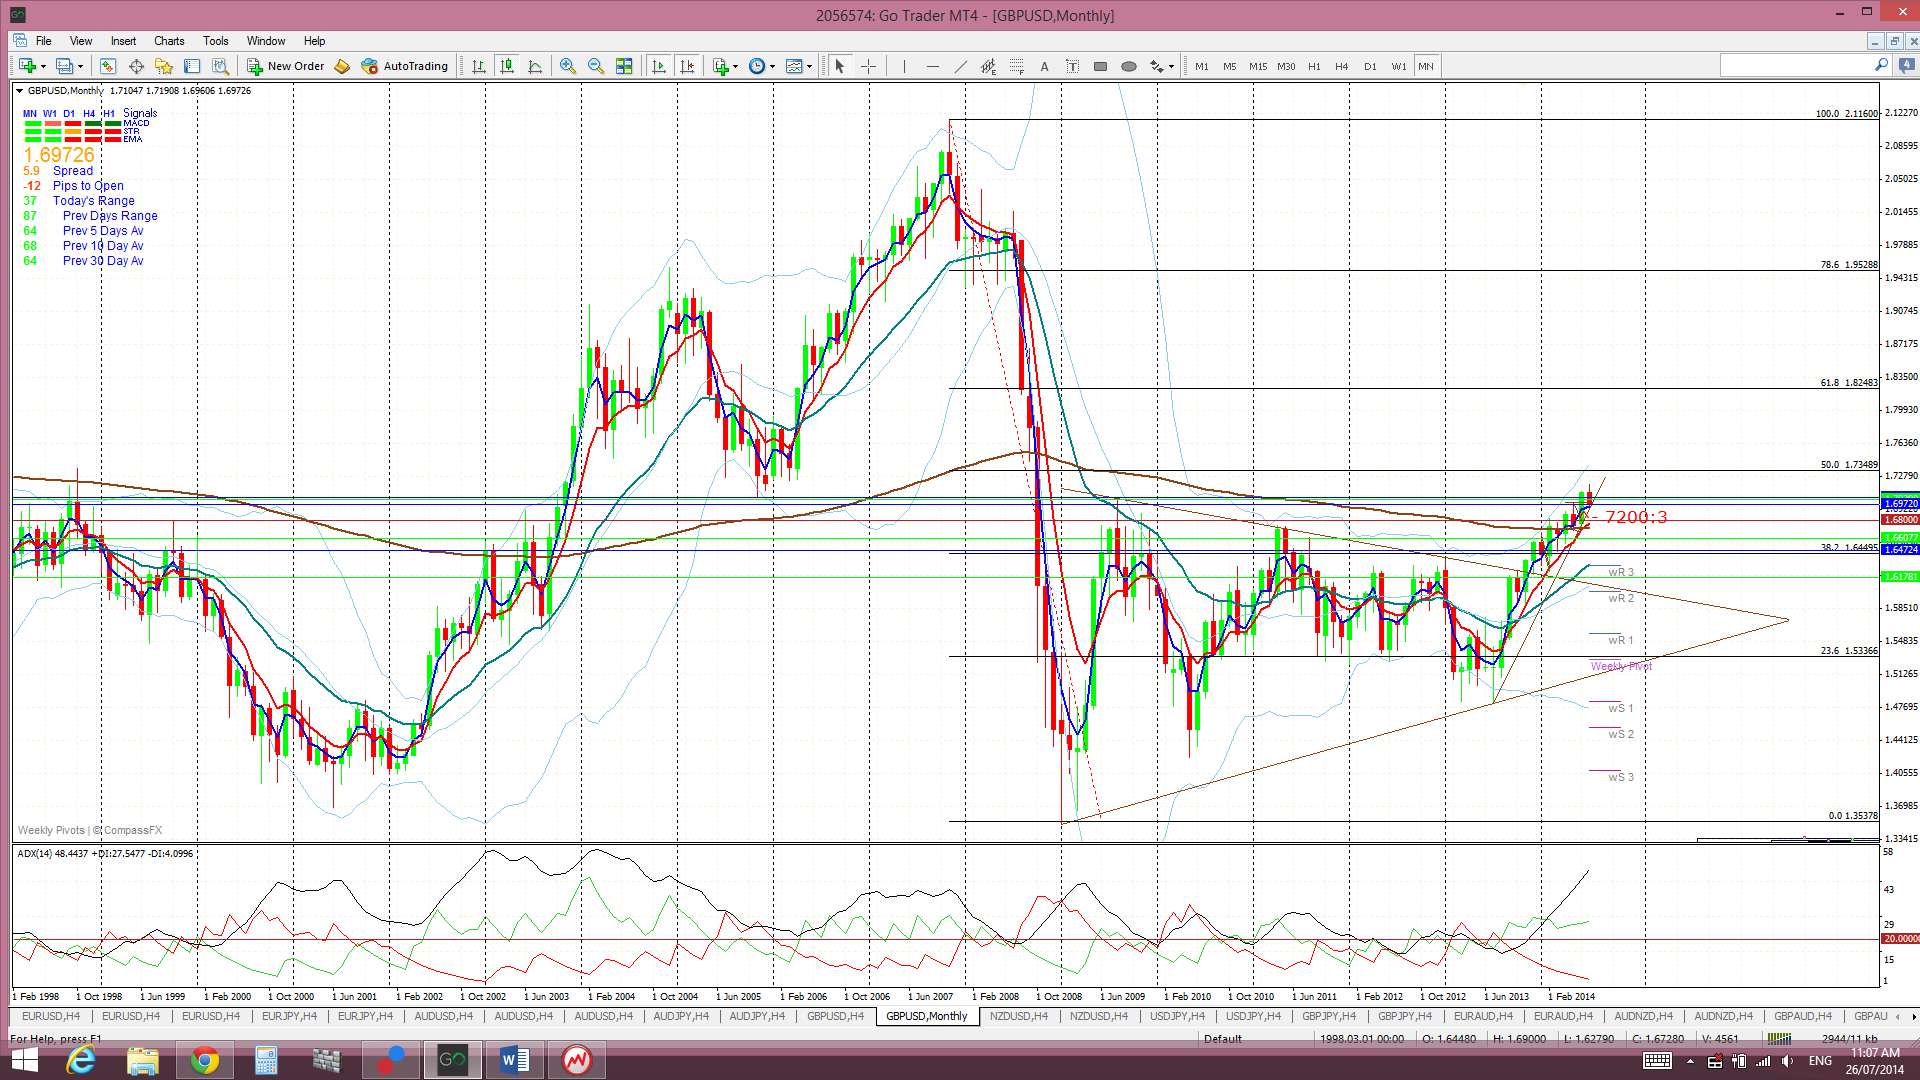
Bullish targets for any continued hold above the monthly 200 EMA: This level remains a key level to watch here. It is important to remember that February was the first monthly close above this S/R level since September 2008 and, also, the highest monthly close since the bear move of 2007-2009. These were major achievements. A possible target for any continued bullish movement is best determined from the monthly chart. The 50 % fib level of the 2007-2009 bear move is up at around the 1.73 region and the 61.8 % fib is at the 1.82 region. Both of these levels might be possible profit targets. Whilst I am bullish on the Cable as long as it holds above the monthly 200 EMa I do realise bull moves don’t run in perfect straight lines. Thus, I am entirely open to the idea of a pull back on the Cable even as part of any bullish continuation.
Price is still trading below the Cloud on the 4hr but above the Cloud on the daily, weekly and monthly (only just) charts.
The weekly candle closed as a bearish candle. That weekly chart ‘Evening Star’ pattern, whilst not 100% technically correct, has been accurate with direction here. I’ll be looking for any further pull back here.
- I’m watching for any new TC signal on this pair and the weekly support trend line.

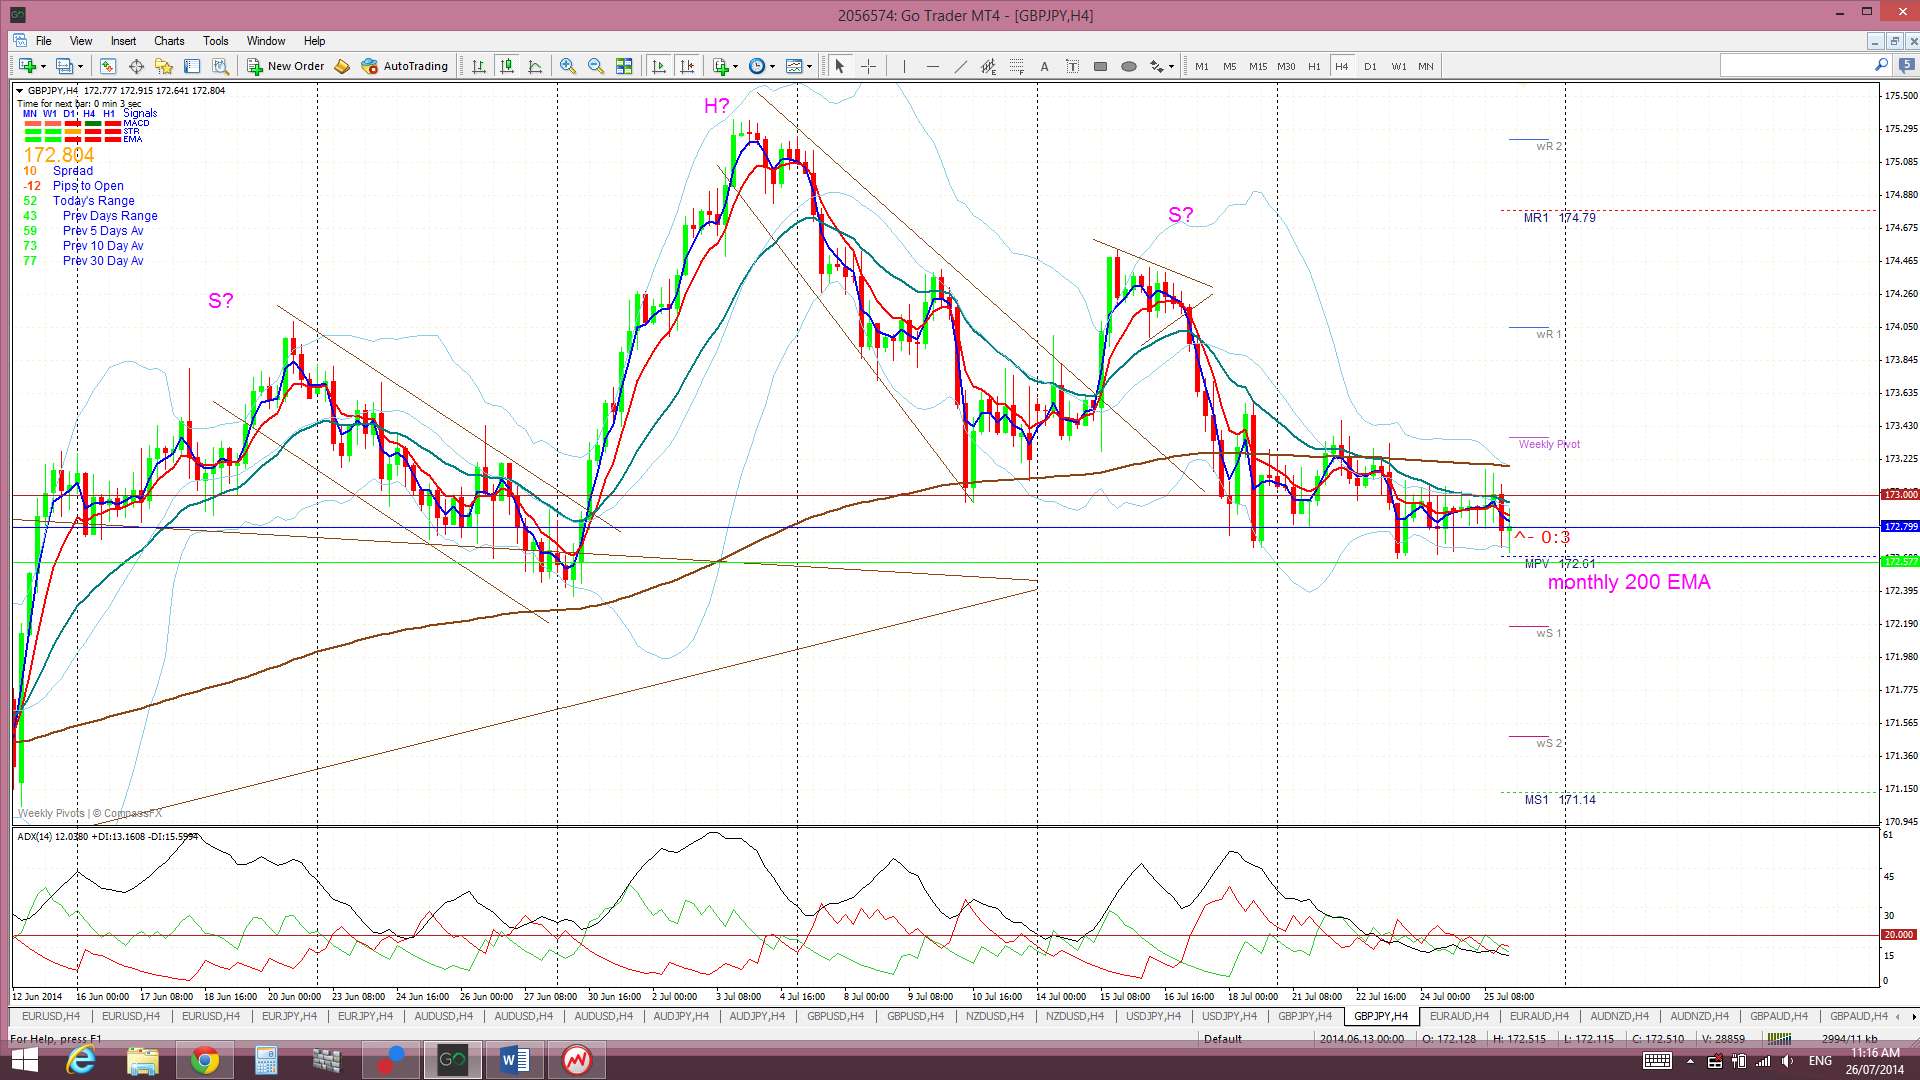
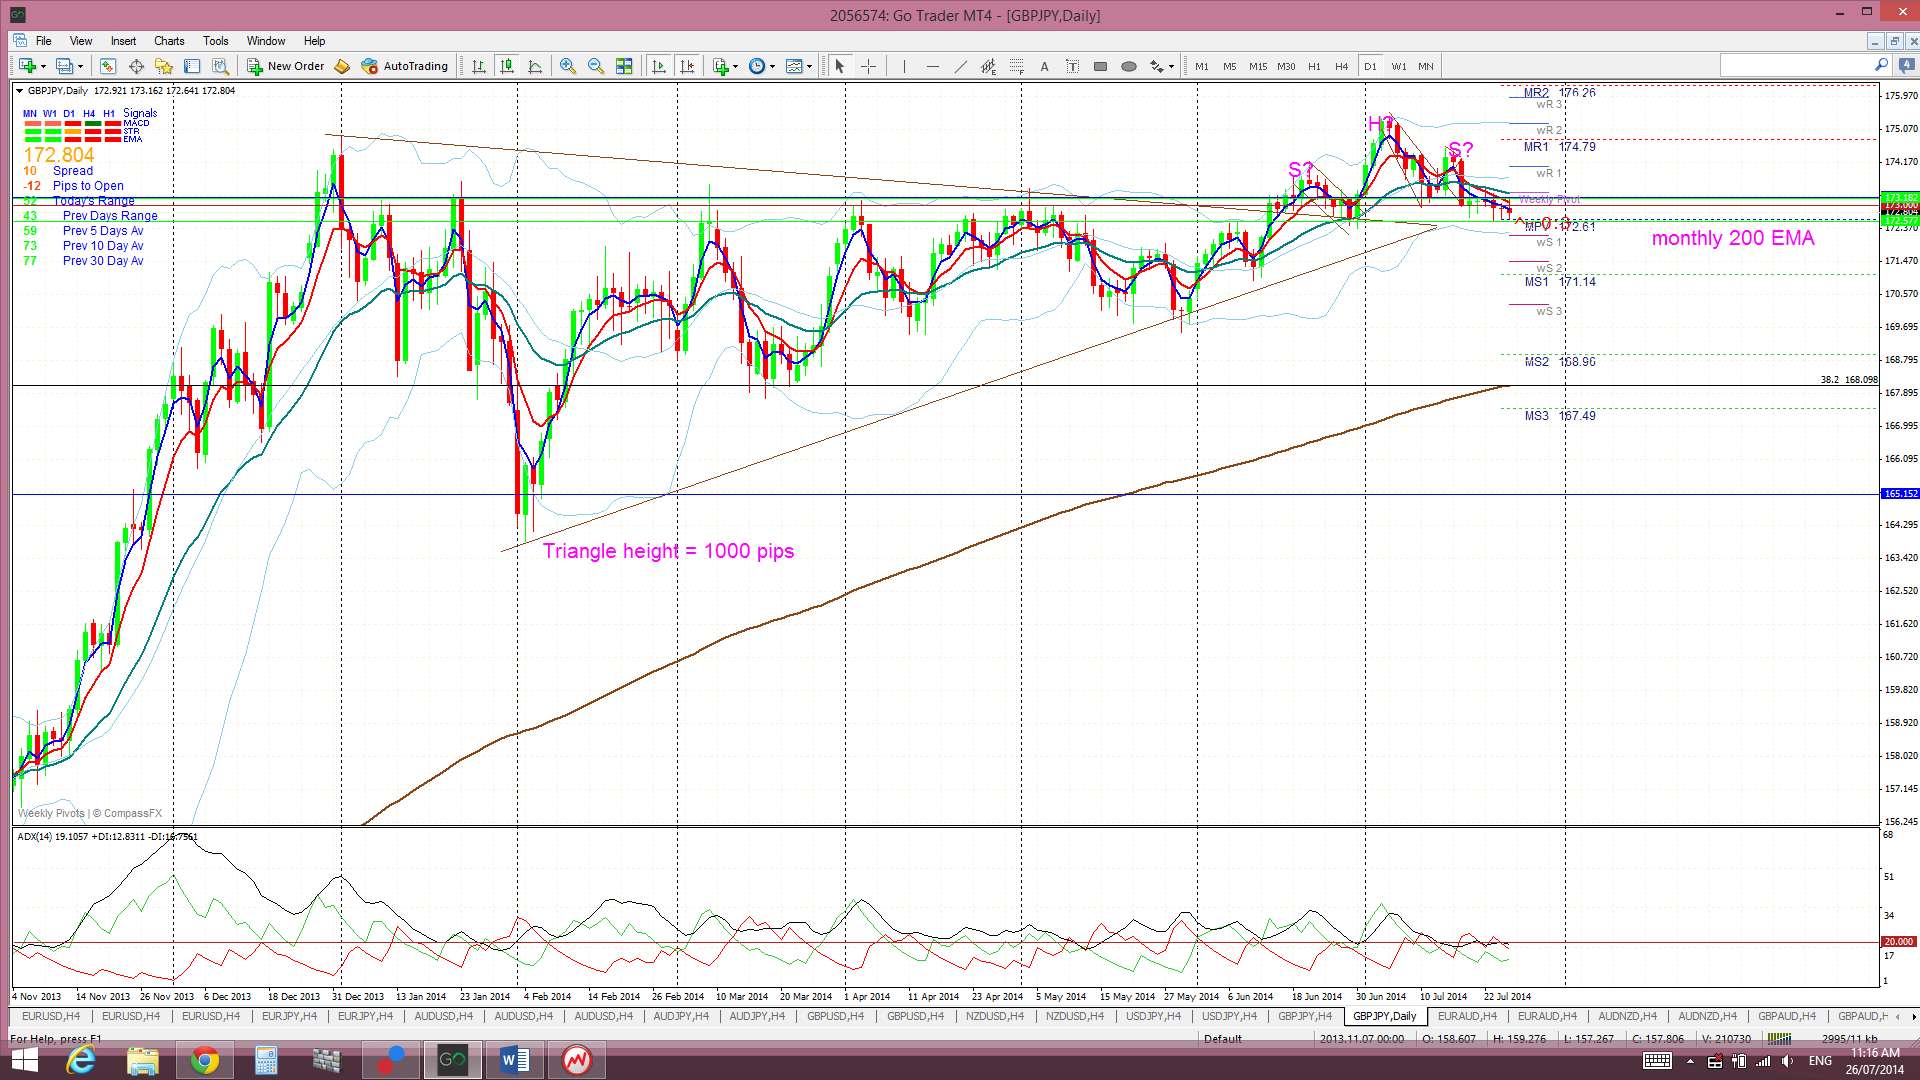
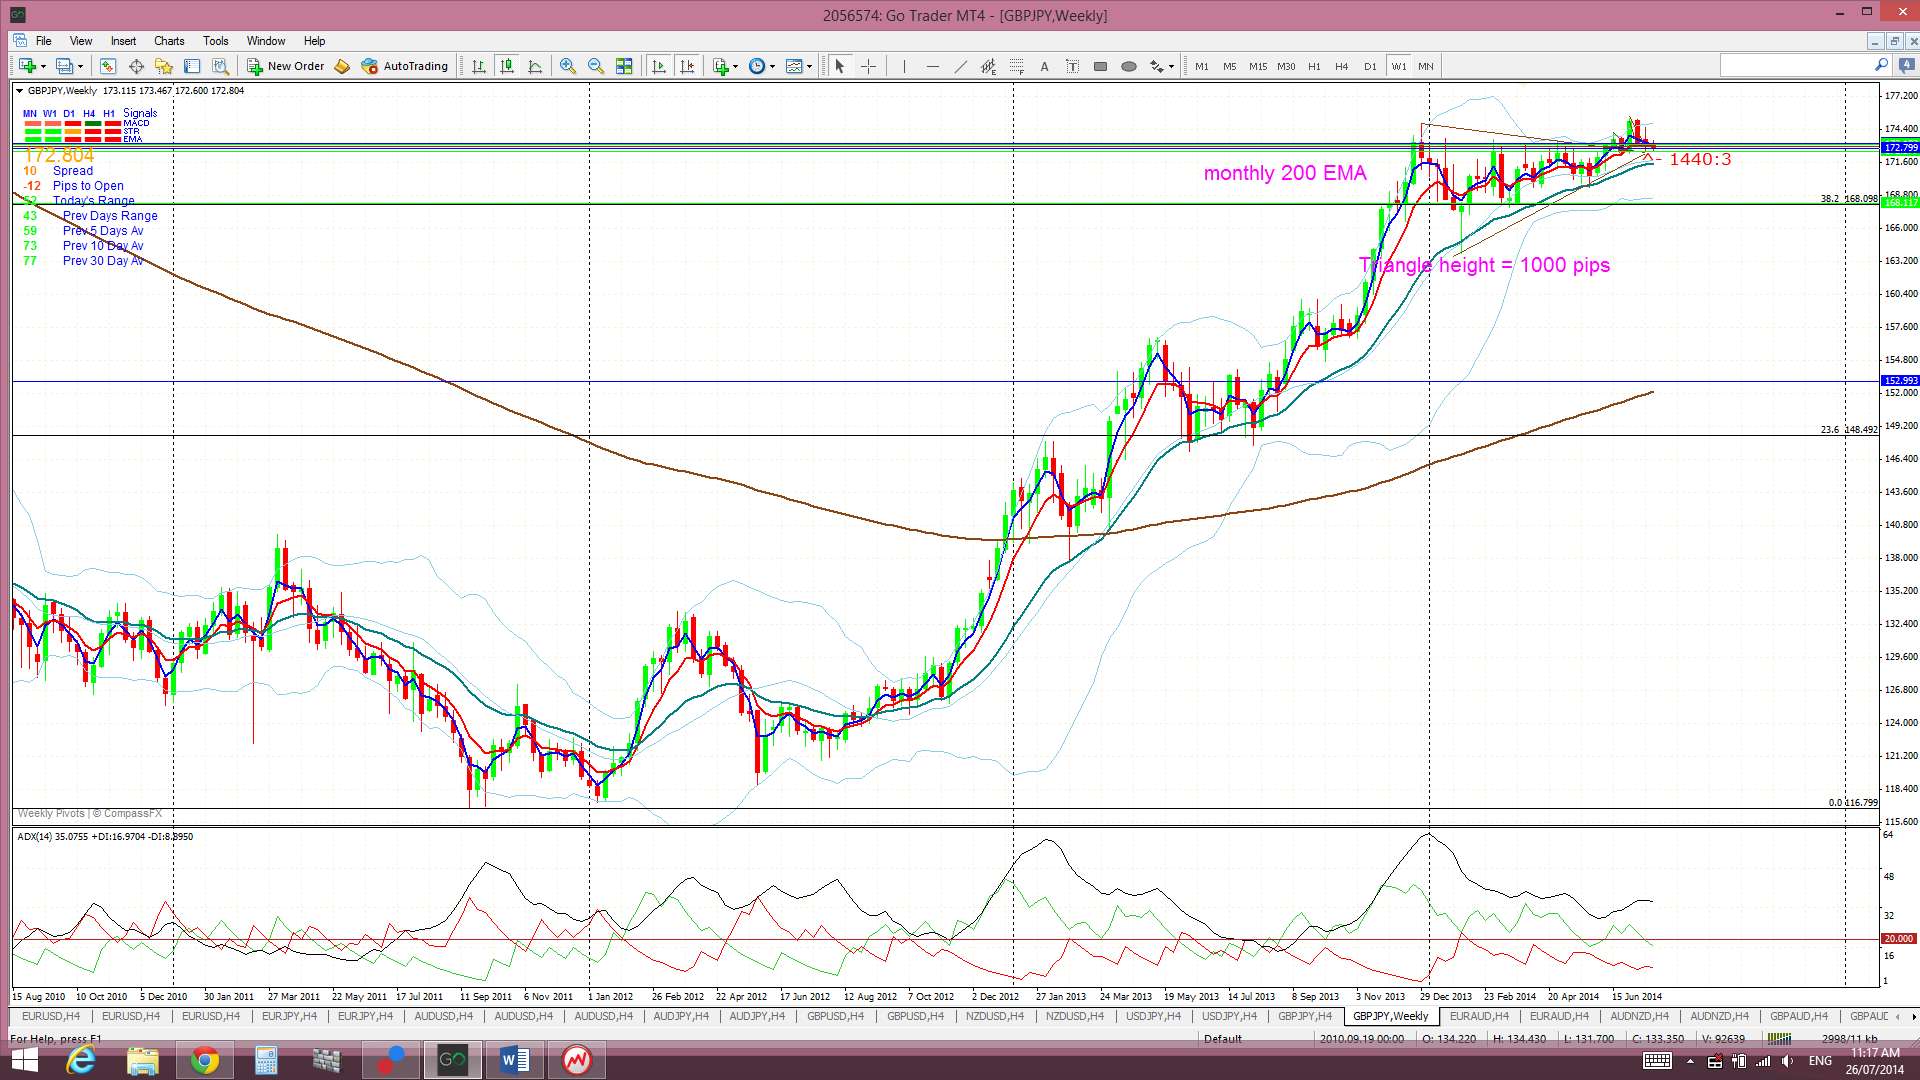
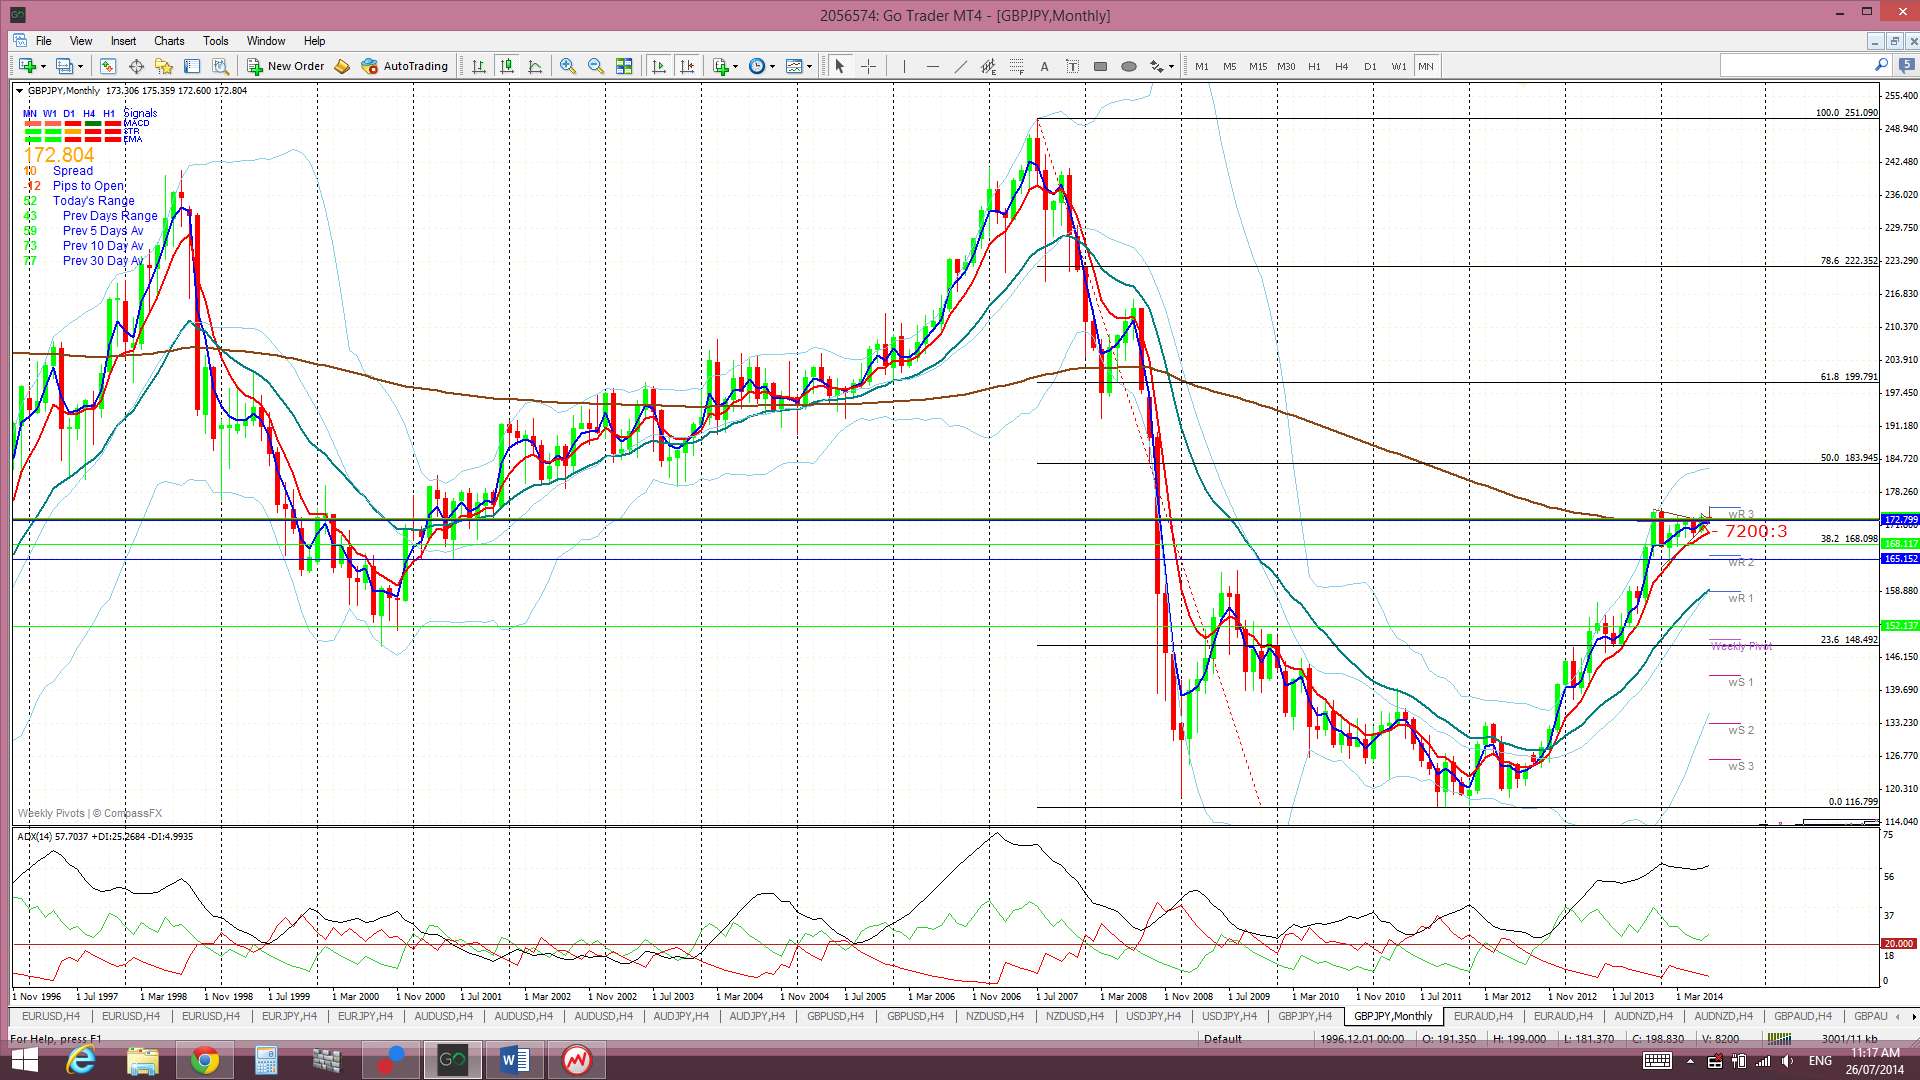
GBP/JPY: The GBP/JPY chopped sideways along the 173 level all week. The 173 is a major level for the pair and the daily chart reveals how significant this S/R level has been.
I’m still seeing a possible bearish H&S setting up on the 4hr and daily charts with a ‘neck line’ at the 173 level. This possible bearish pattern contradicts the previous bullish triangle breakout though but I am open to the idea of a pull back here, as with the Cable.
Triangle breakout targets: The GBP/JPY has now broken out from trading within a triangle pattern on the daily/weekly charts. This pattern had been giving the weekly and monthly charts a ‘Bull Flag’ appearance. The daily/weekly triangle pattern is worth about 1000 pips and technical theory would suggest that the possible bull move from any breakout and continuation would be of a similar order of magnitude. A 1000 pip move would take the GBP/JPY up to about 183 which is near the 50% fib of the 2007-2012 bear move. The 61.8% fib, another popular trading target, is up at the 200 level which is 2,600 pips away. This breakout move has stalled for the time being but is still valid.
Price is still trading below the Ichimoku Cloud on the 4hr chart but above the Cloud on the daily, weekly and monthly charts.
The weekly candle closed as another bearish coloured ‘Spinning Top’ candle.
- I’m watching for any new TC signal on this pair and the 173 level.
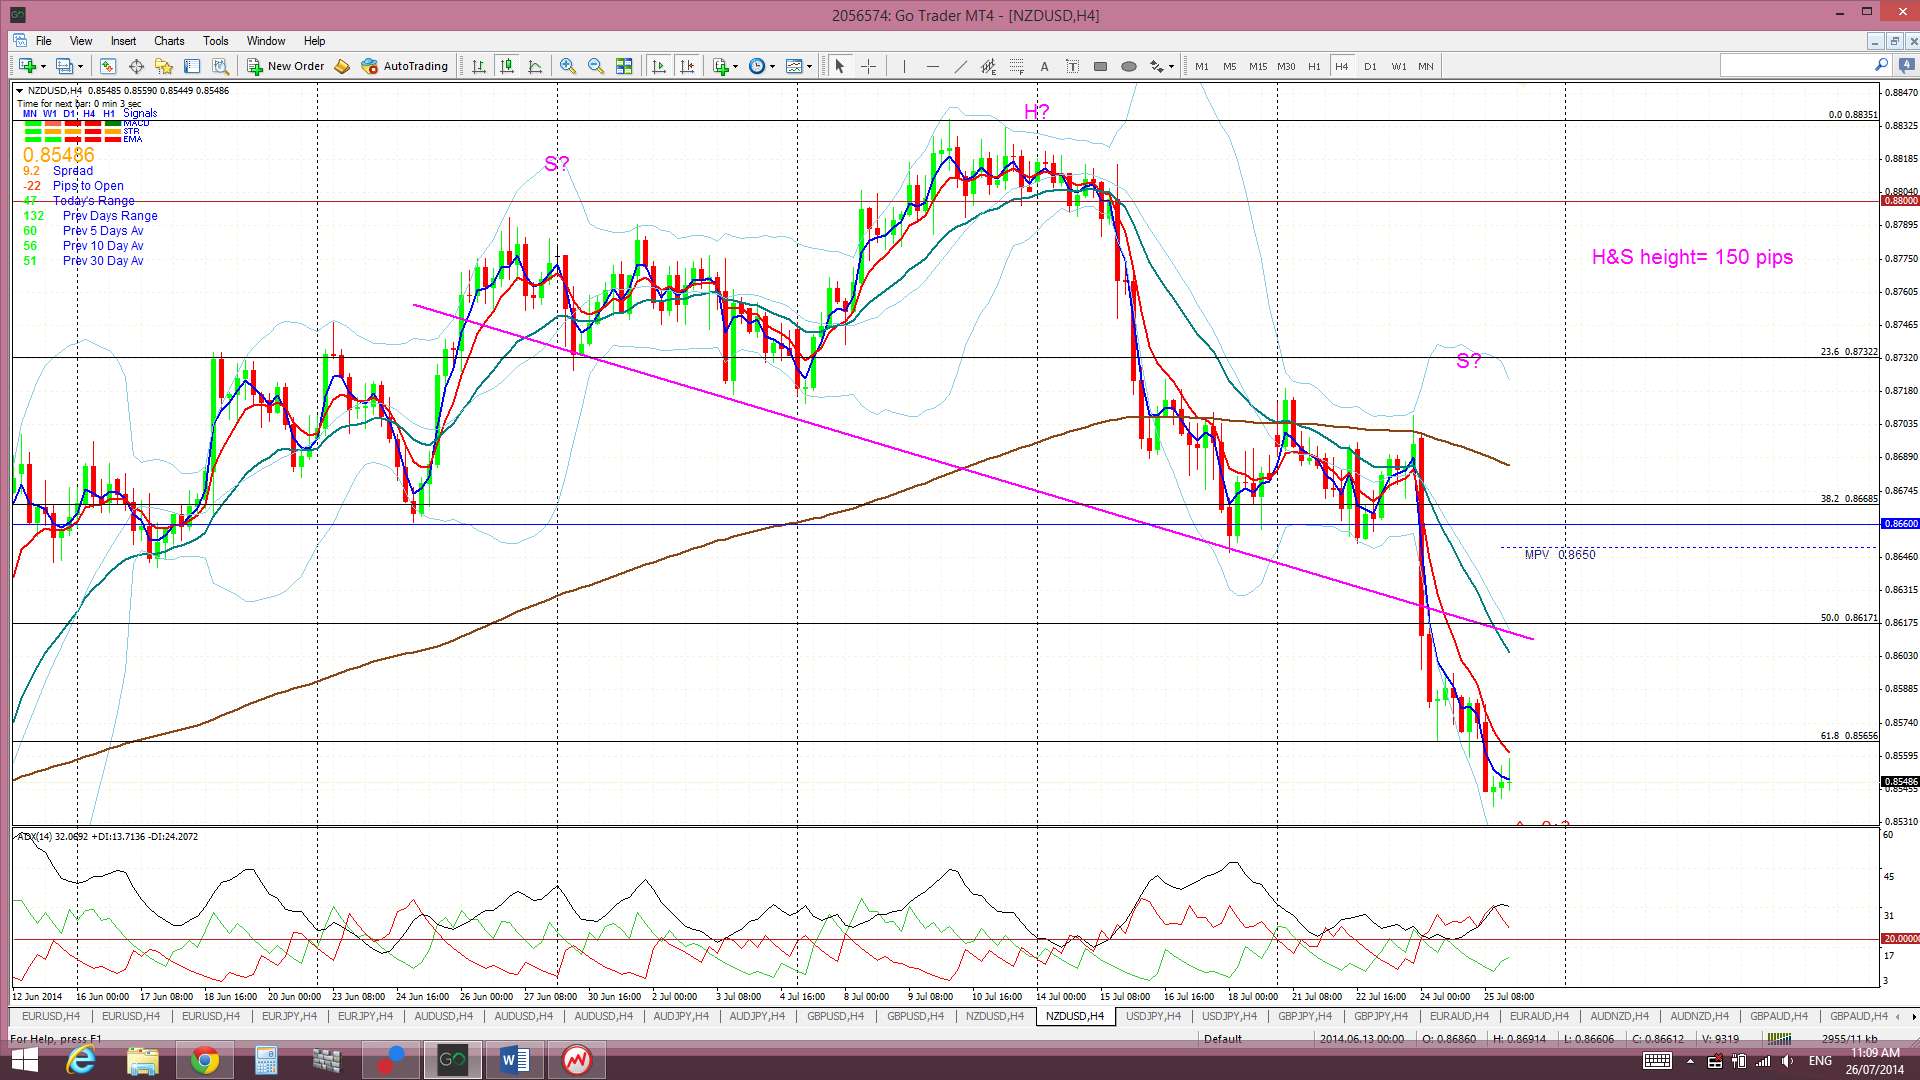
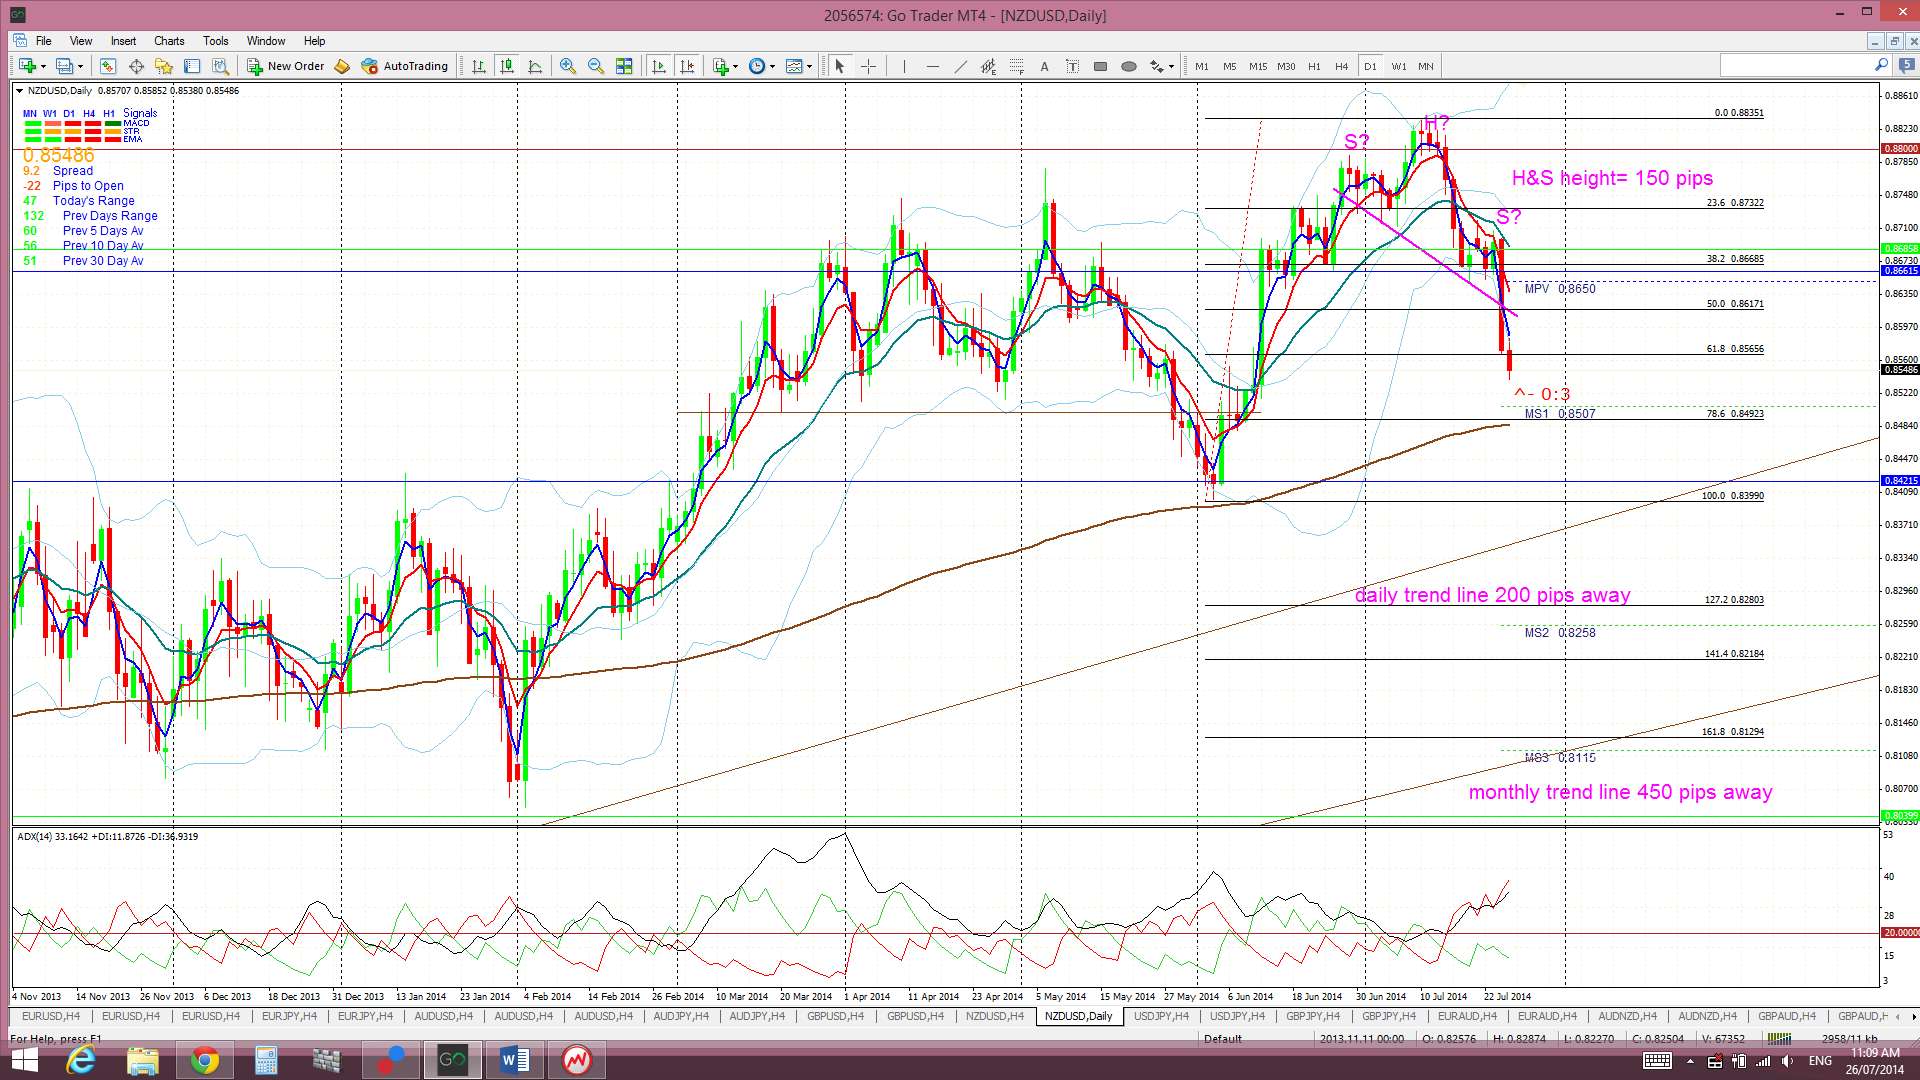
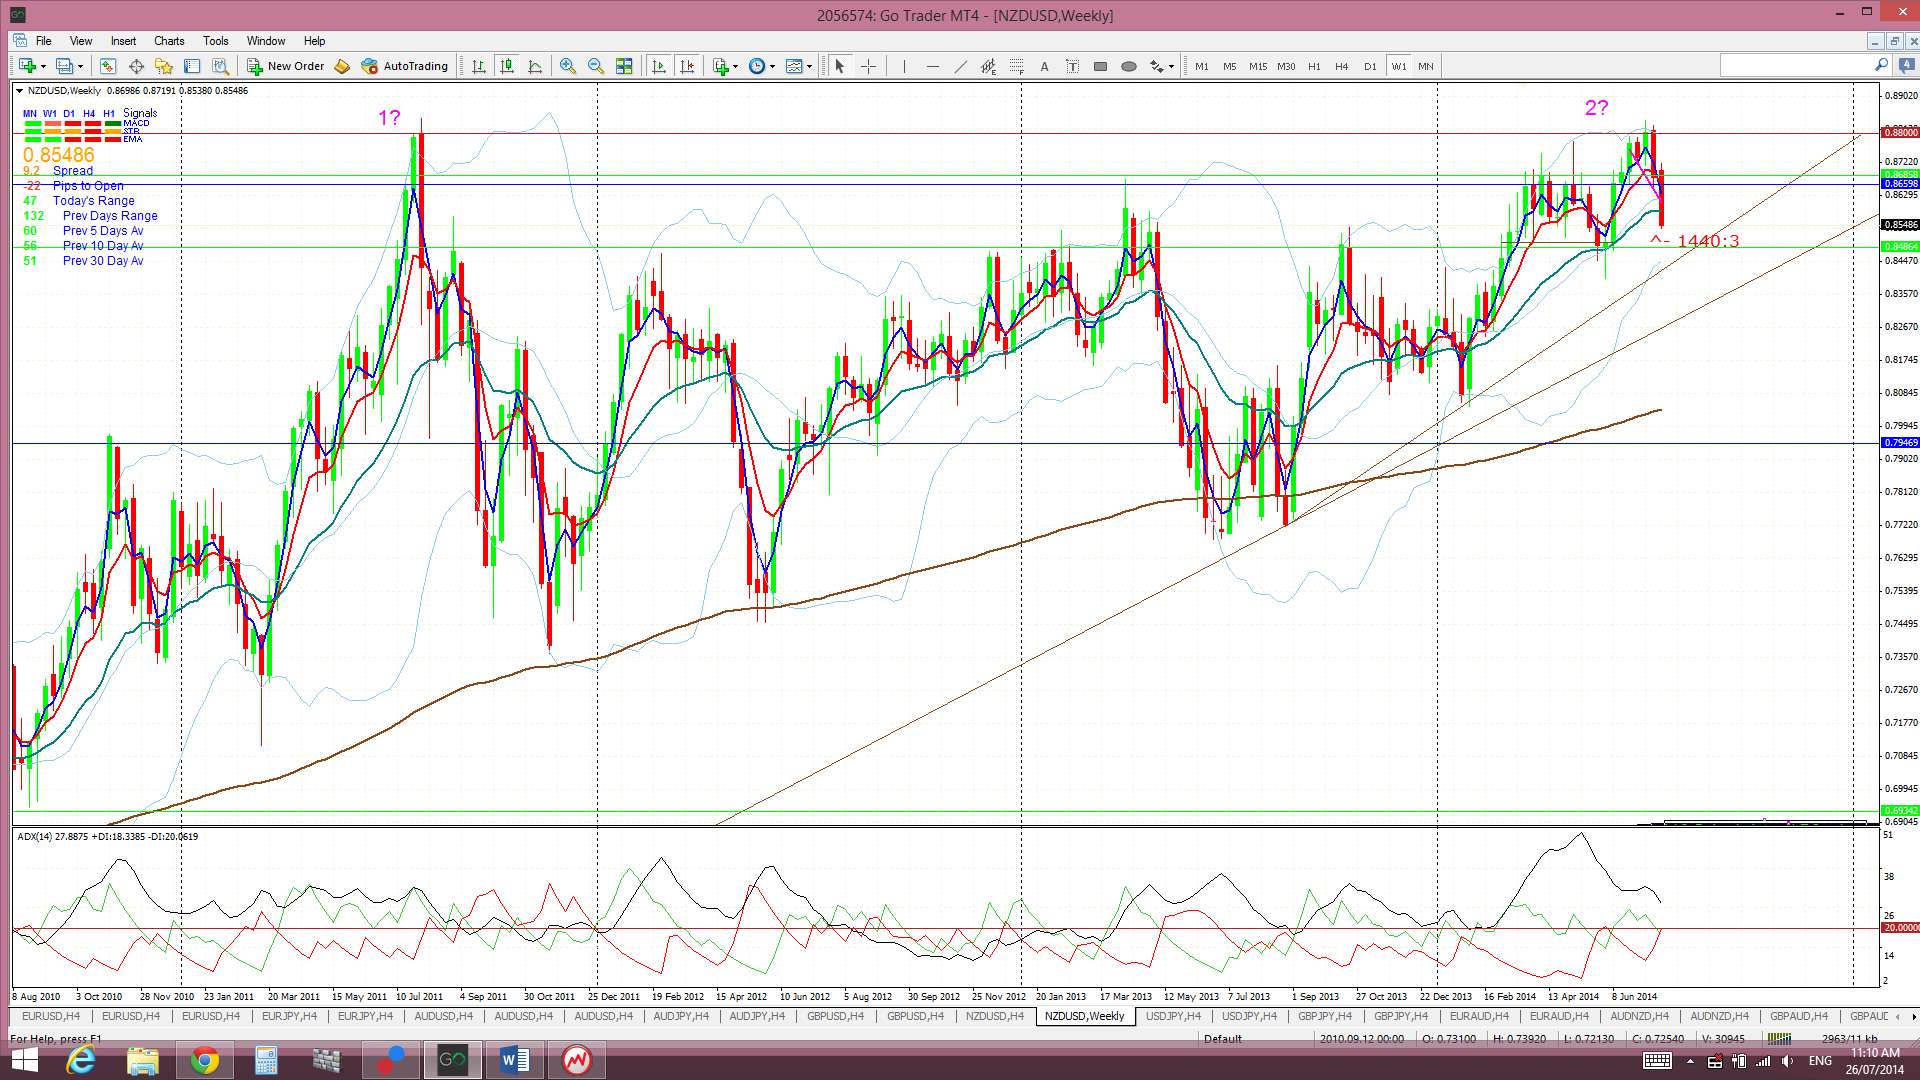
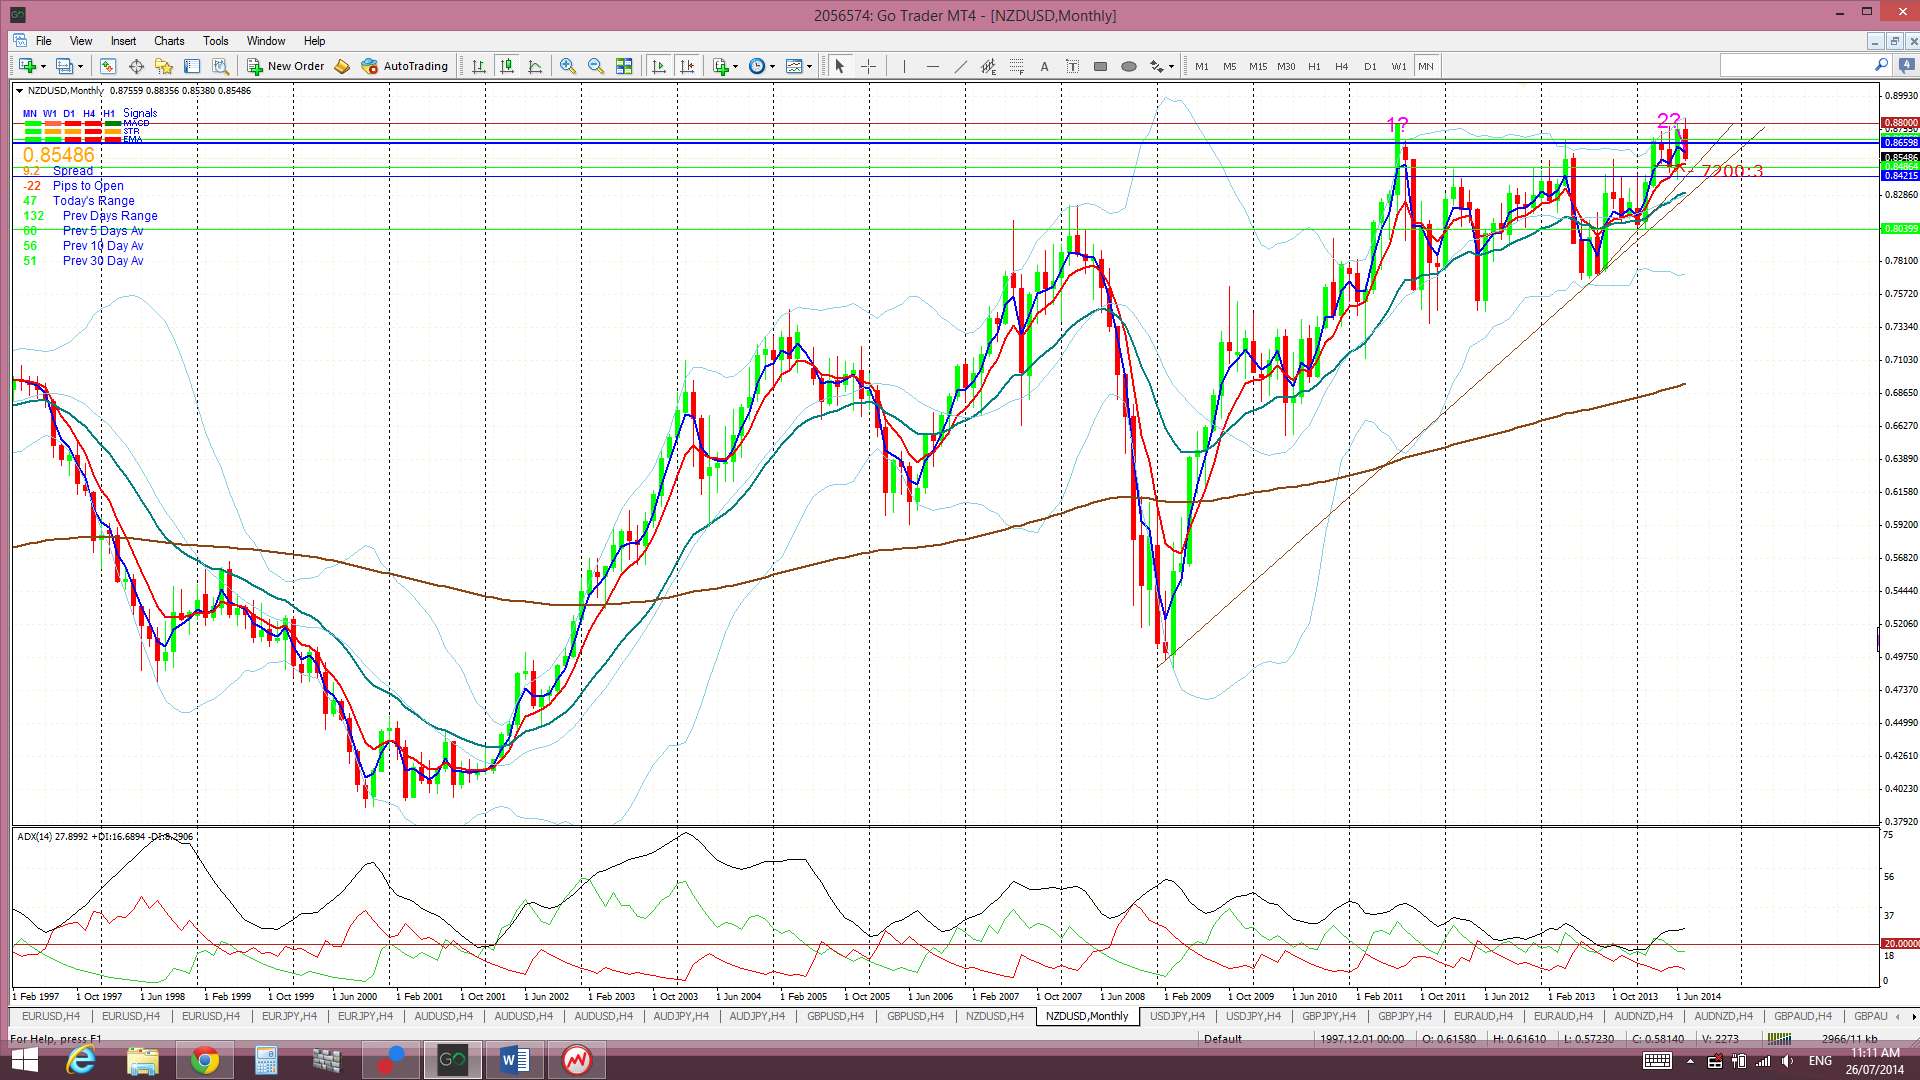
Kiwi: NZD/USD: The Kiwi traded lower last week following comments from the RBNZ and this move triggered a bearish H&S off the 4hr chart. The monthly chart shows that whilst the Kiwi is trading within a bullish ascending triangle, there is still plenty of room for a pullback, fulfilling this recent bearish pattern, to either the weekly or monthly support trend lines.
Bearish H&S? The daily chart shows the ‘H&S’ pattern in relation to these two support trend lines. The height of the H&S pattern is about 150 pips. Thus, the theory with these patterns is that any bearish follow through could be expected to extend by the same order of magnitude, that is, to move lower by about 150 pips. A 150 pip move would bring the Kiwi down to just above the weekly support trend line and, thus, this is a distinct possibility here. Any failure of this weekly support trend line would suggest that the monthly support trend line might be the next reasonable target.
Price is now trading below the Ichimoku Cloud on the 4hr and daily charts but above the Cloud on the weekly and monthly charts.
The weekly candle closed as a large bearish candle following on from last week’s ‘bearish engulfing’ candle.
- I’m watching for any new TC signal on this pair and the H&S.
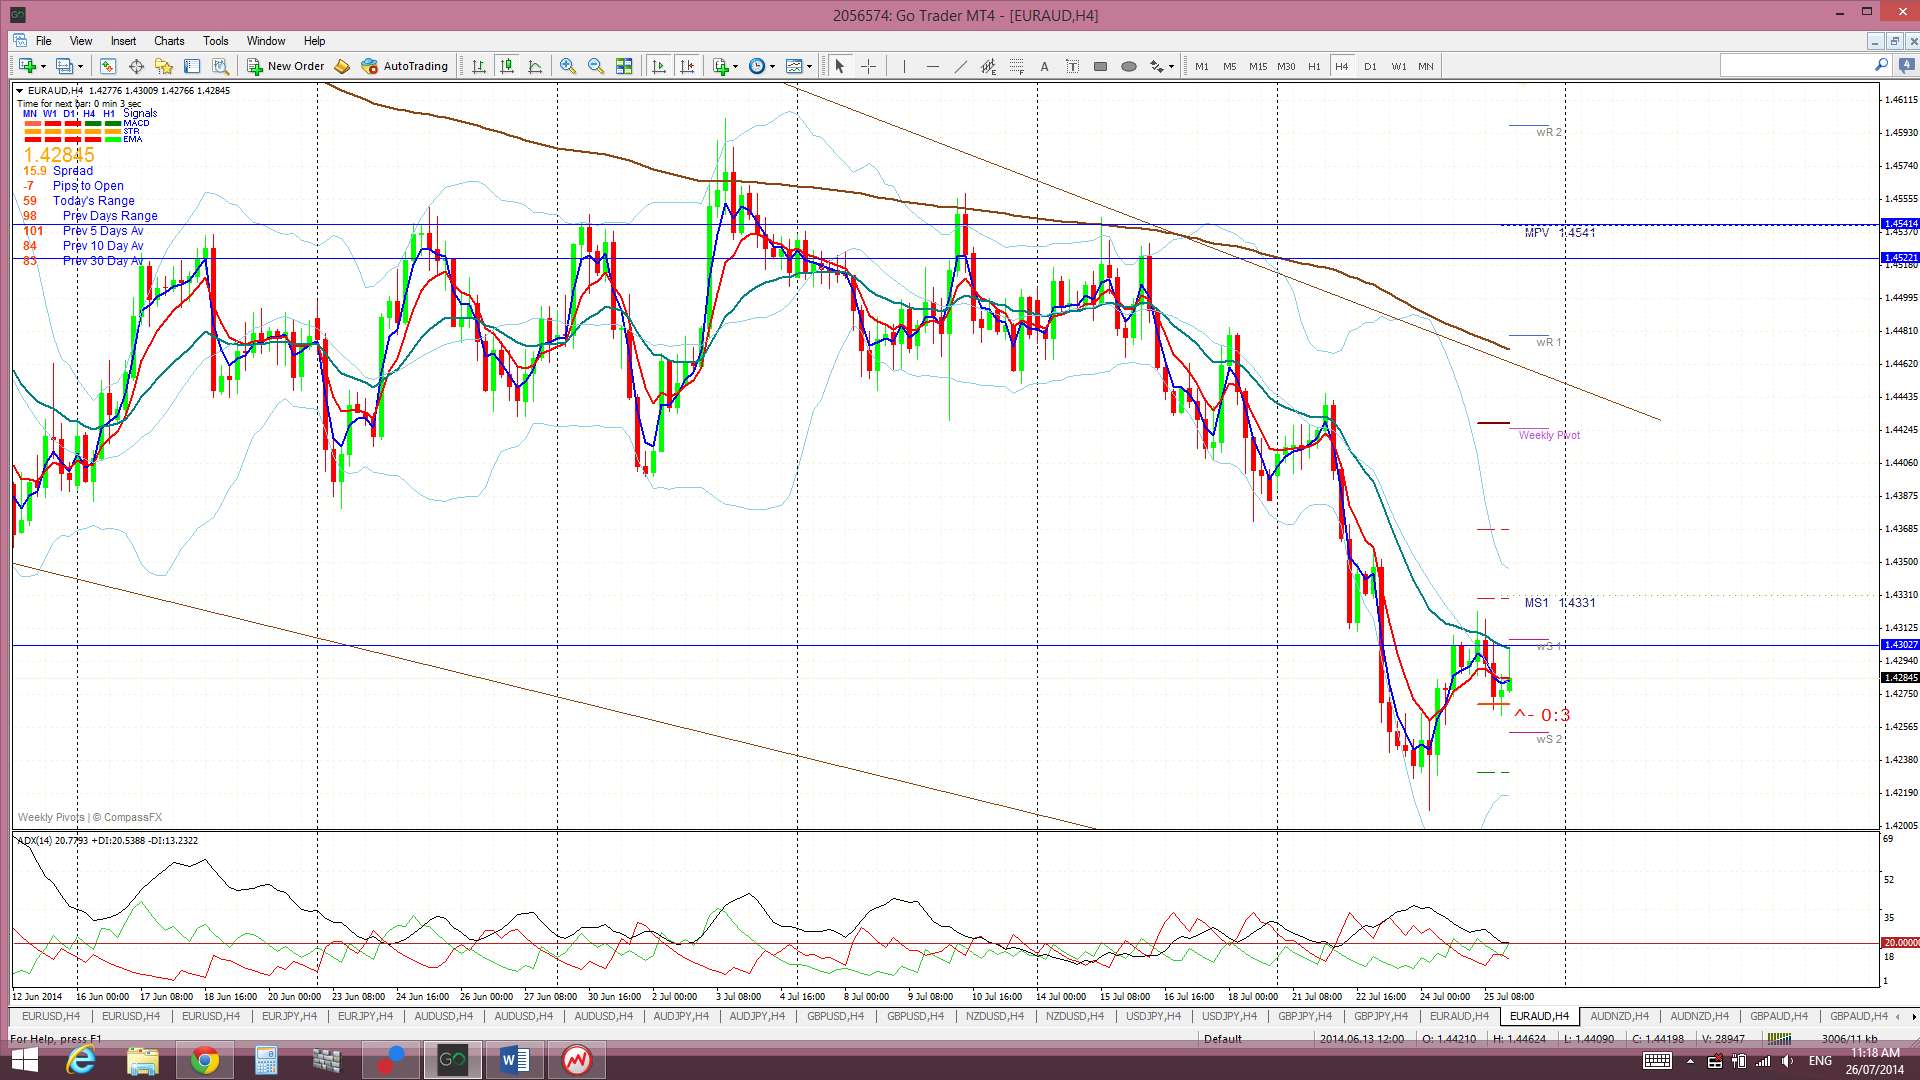
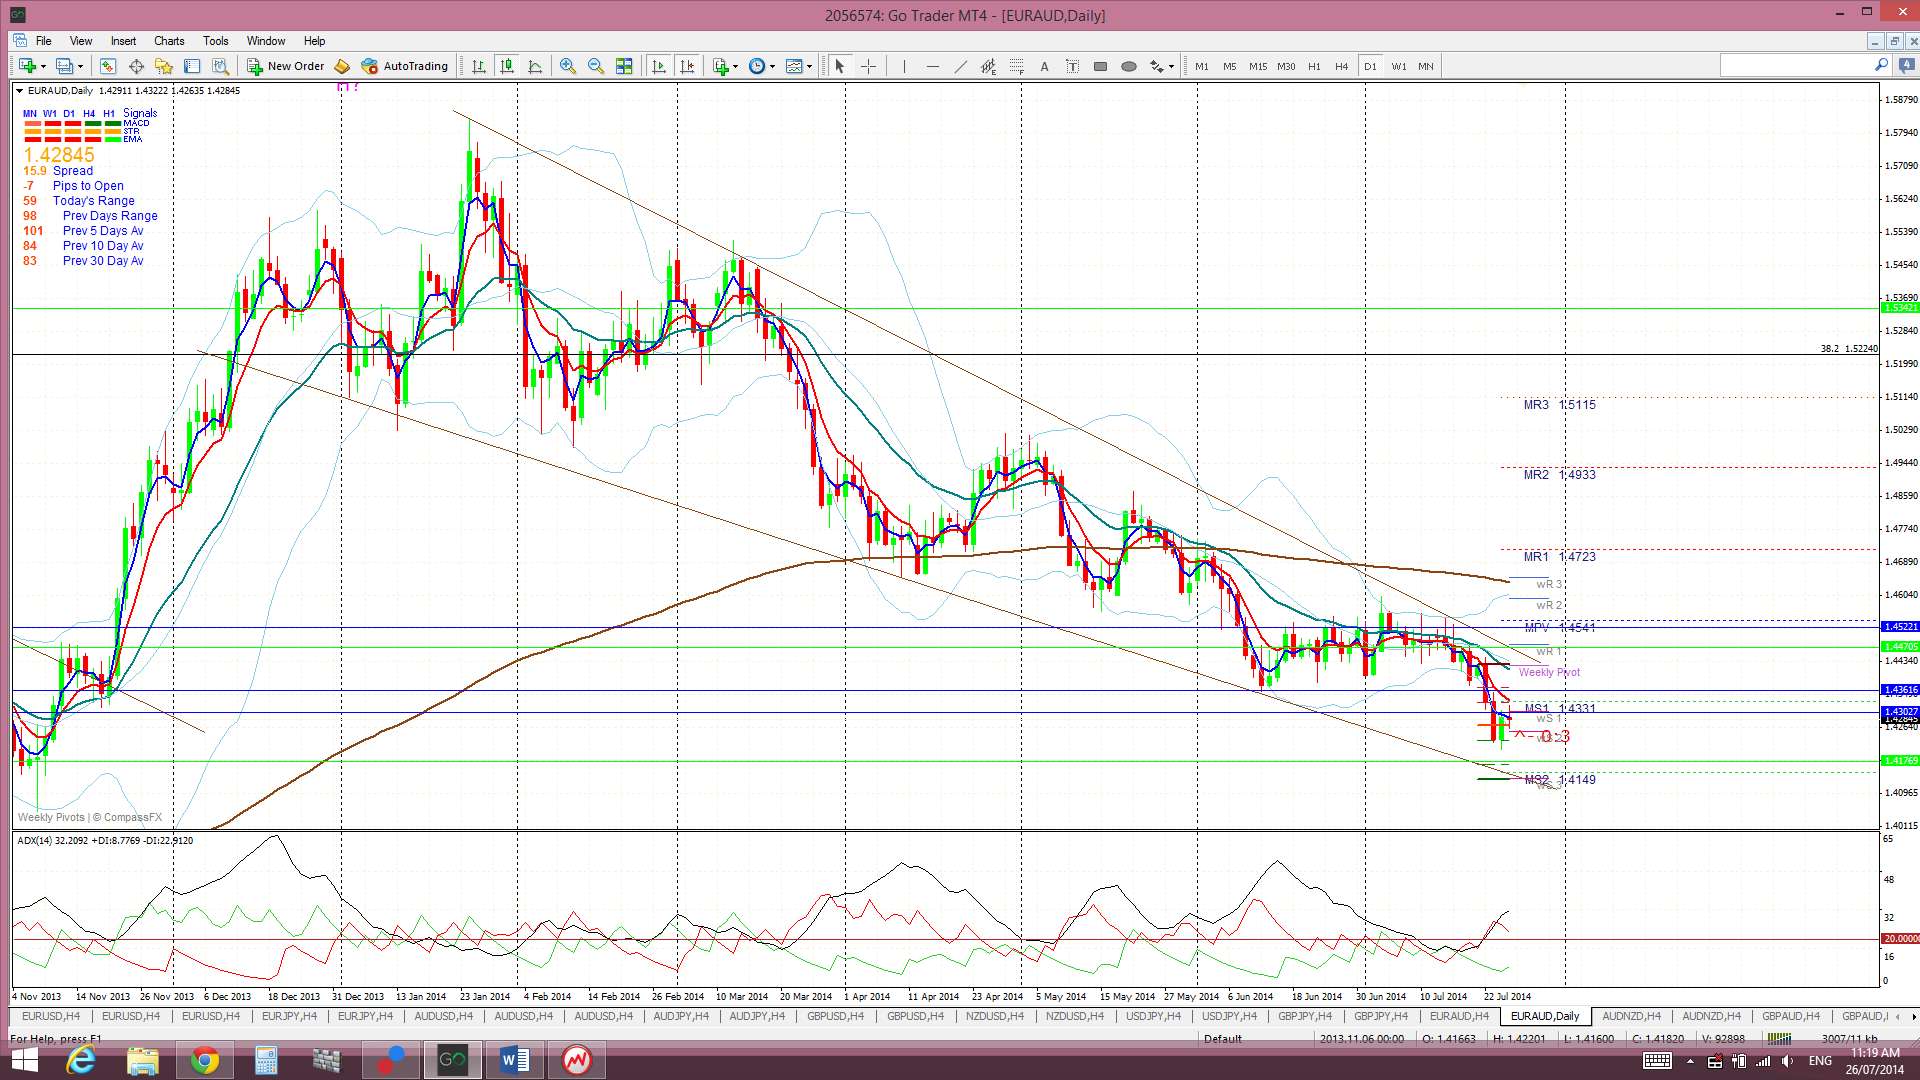
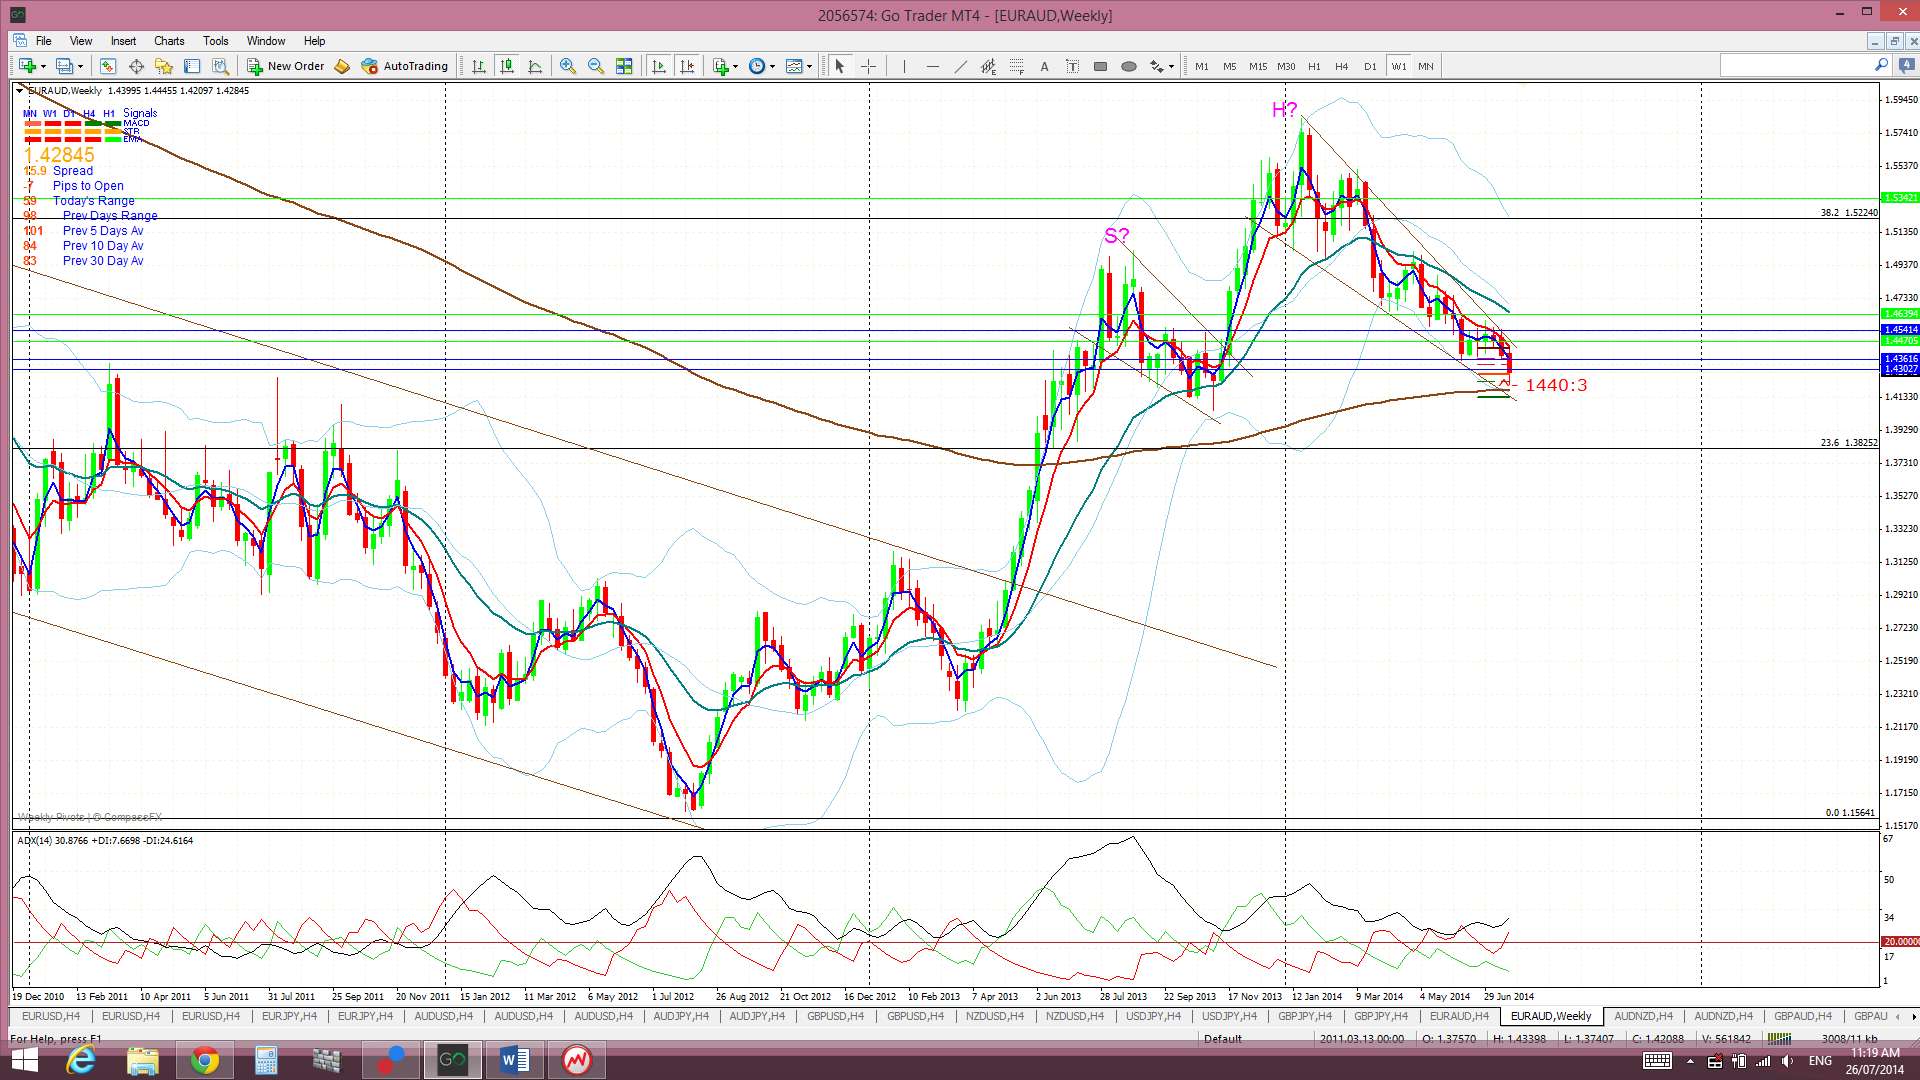
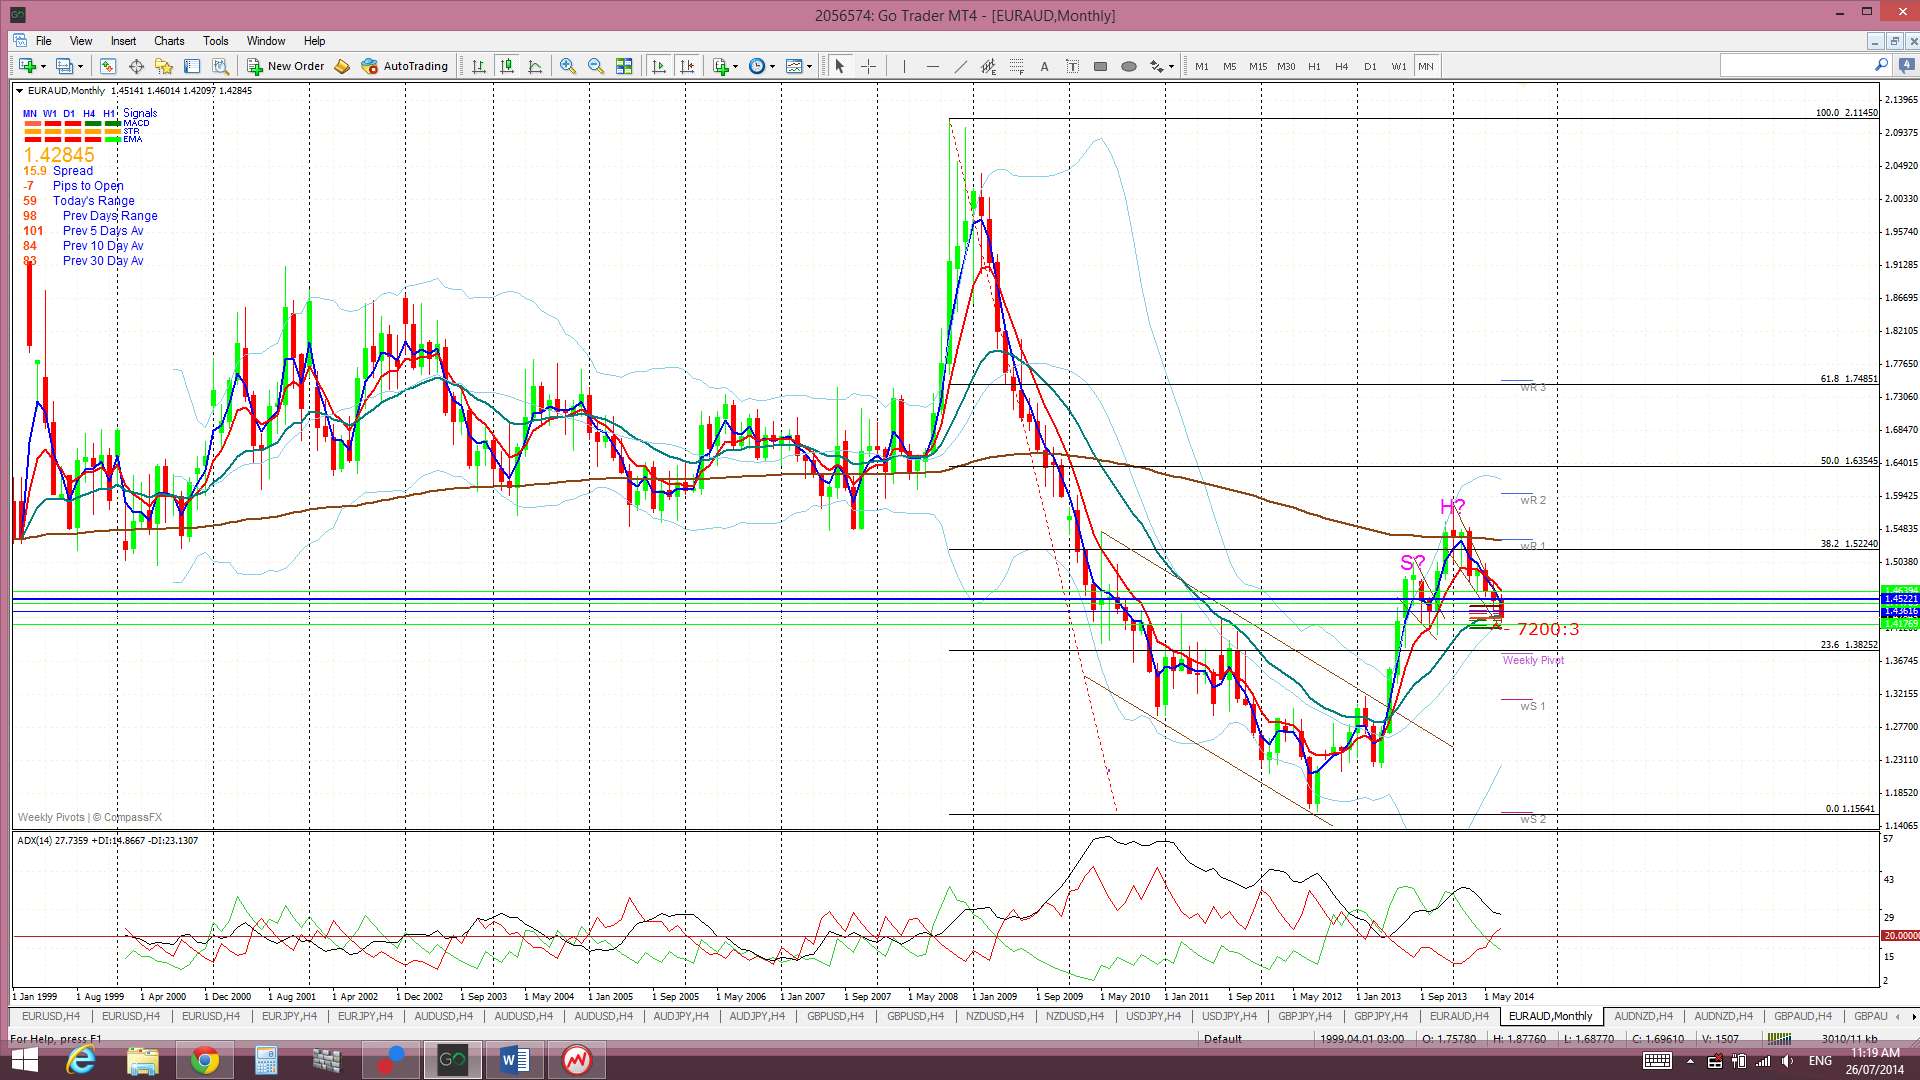
EUR/AUD: This pair continued a bit lower last week and I still think it will be best traded when, and if, it breaks free from this daily chart trading channel.
I’m still seeing the look of a possible bearish H&S building on the weekly chart. This would tie in with any bullish breakout on the E/A from the bullish descending wedge on the daily chart though. Strange as this may see. The only niggling concern I have here, however, is that this would need to see the EUR turn bullish and this isn’t looking to be the case at the moment across on the E/U.
The E/A is still trading below the Cloud on the 4hr and the daily chart which is bearish.
The weekly candle closed as another bearish candle.
- I’m watching for any new TC signal on this pair and the trading channel trend lines.
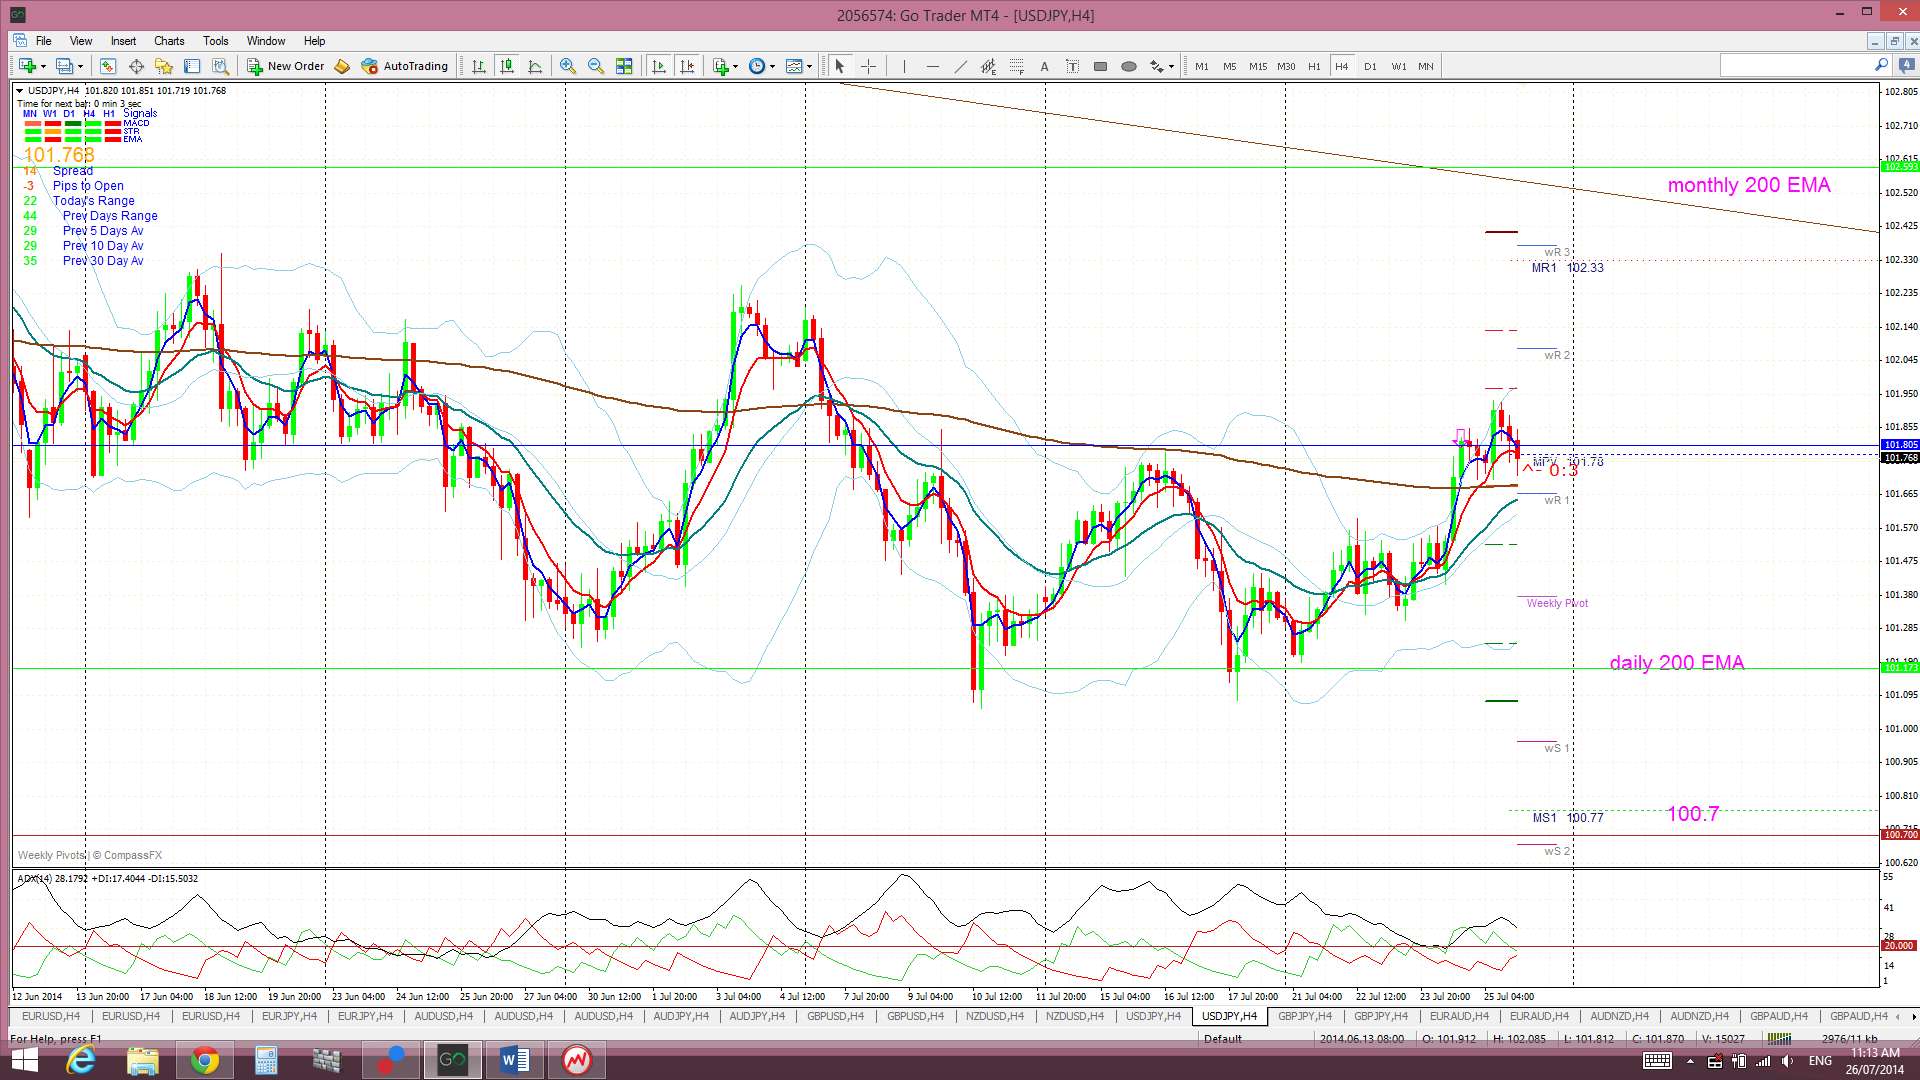
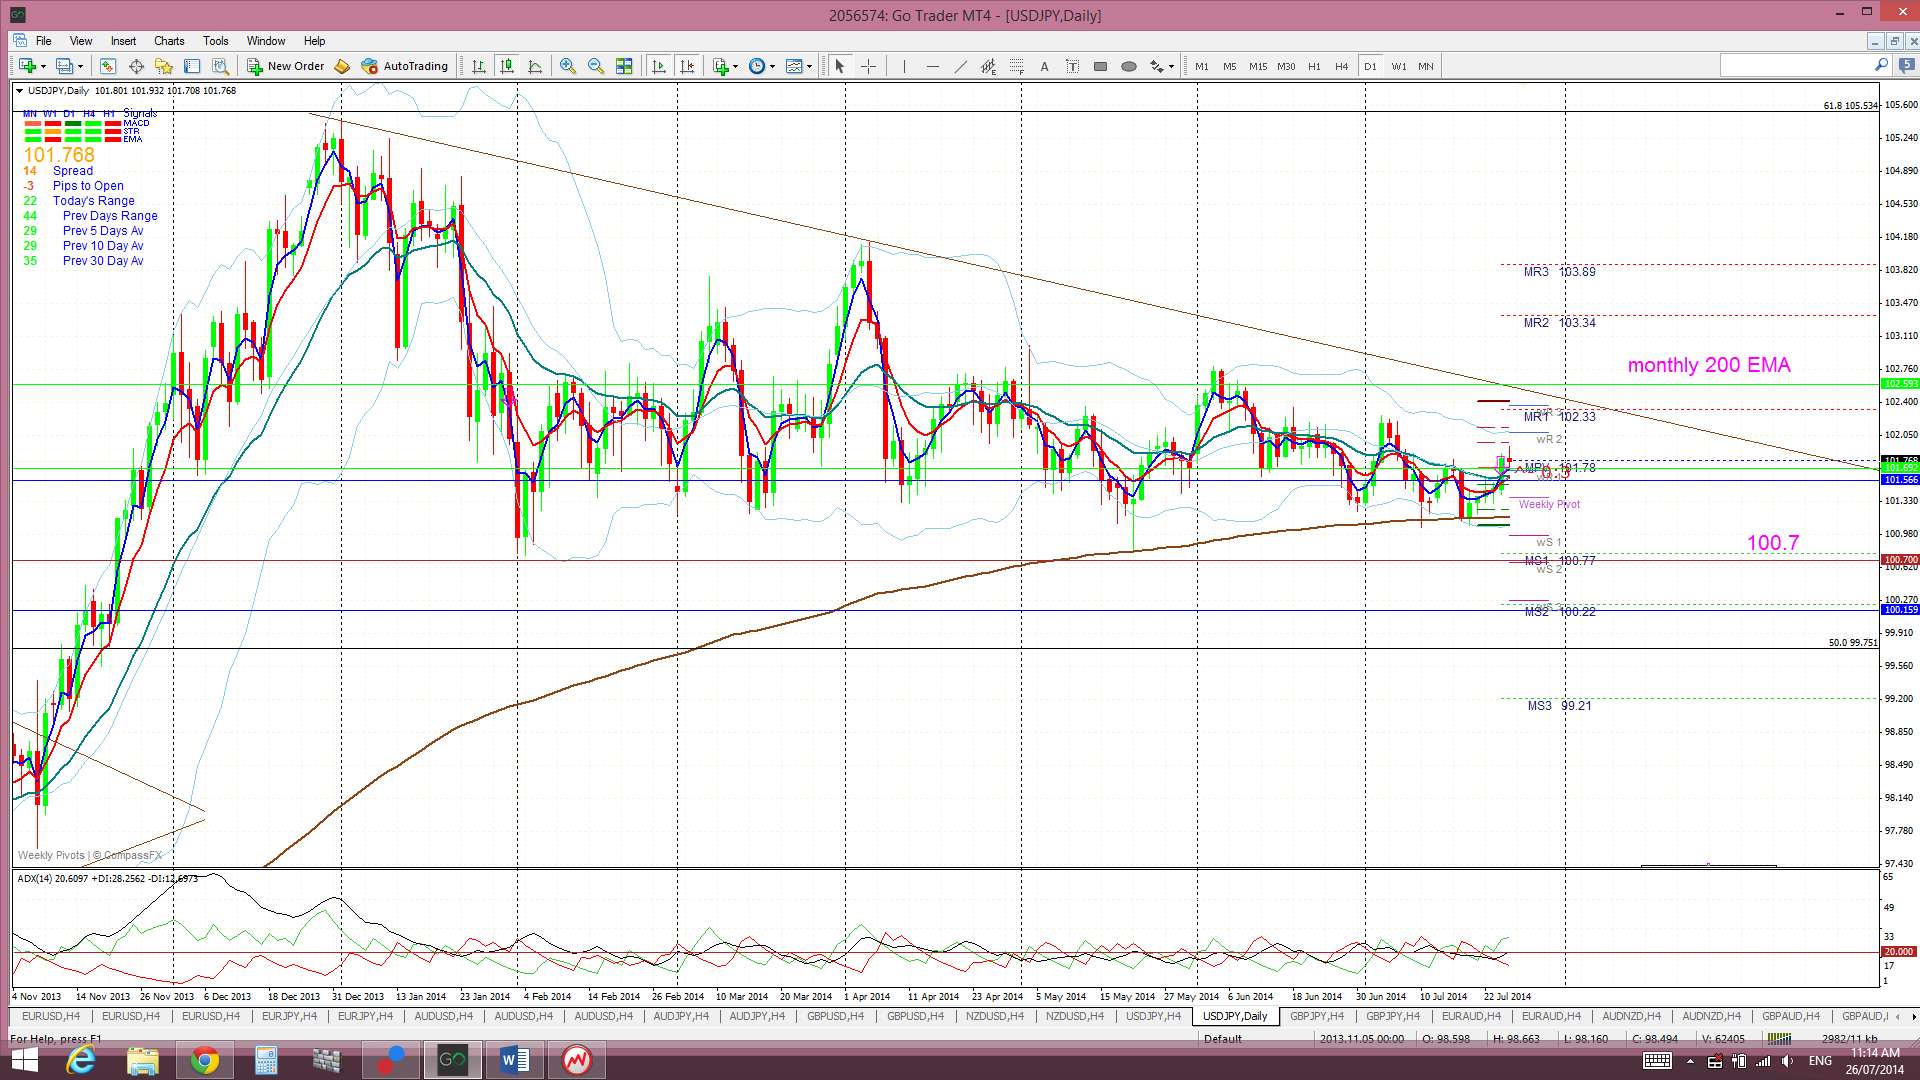
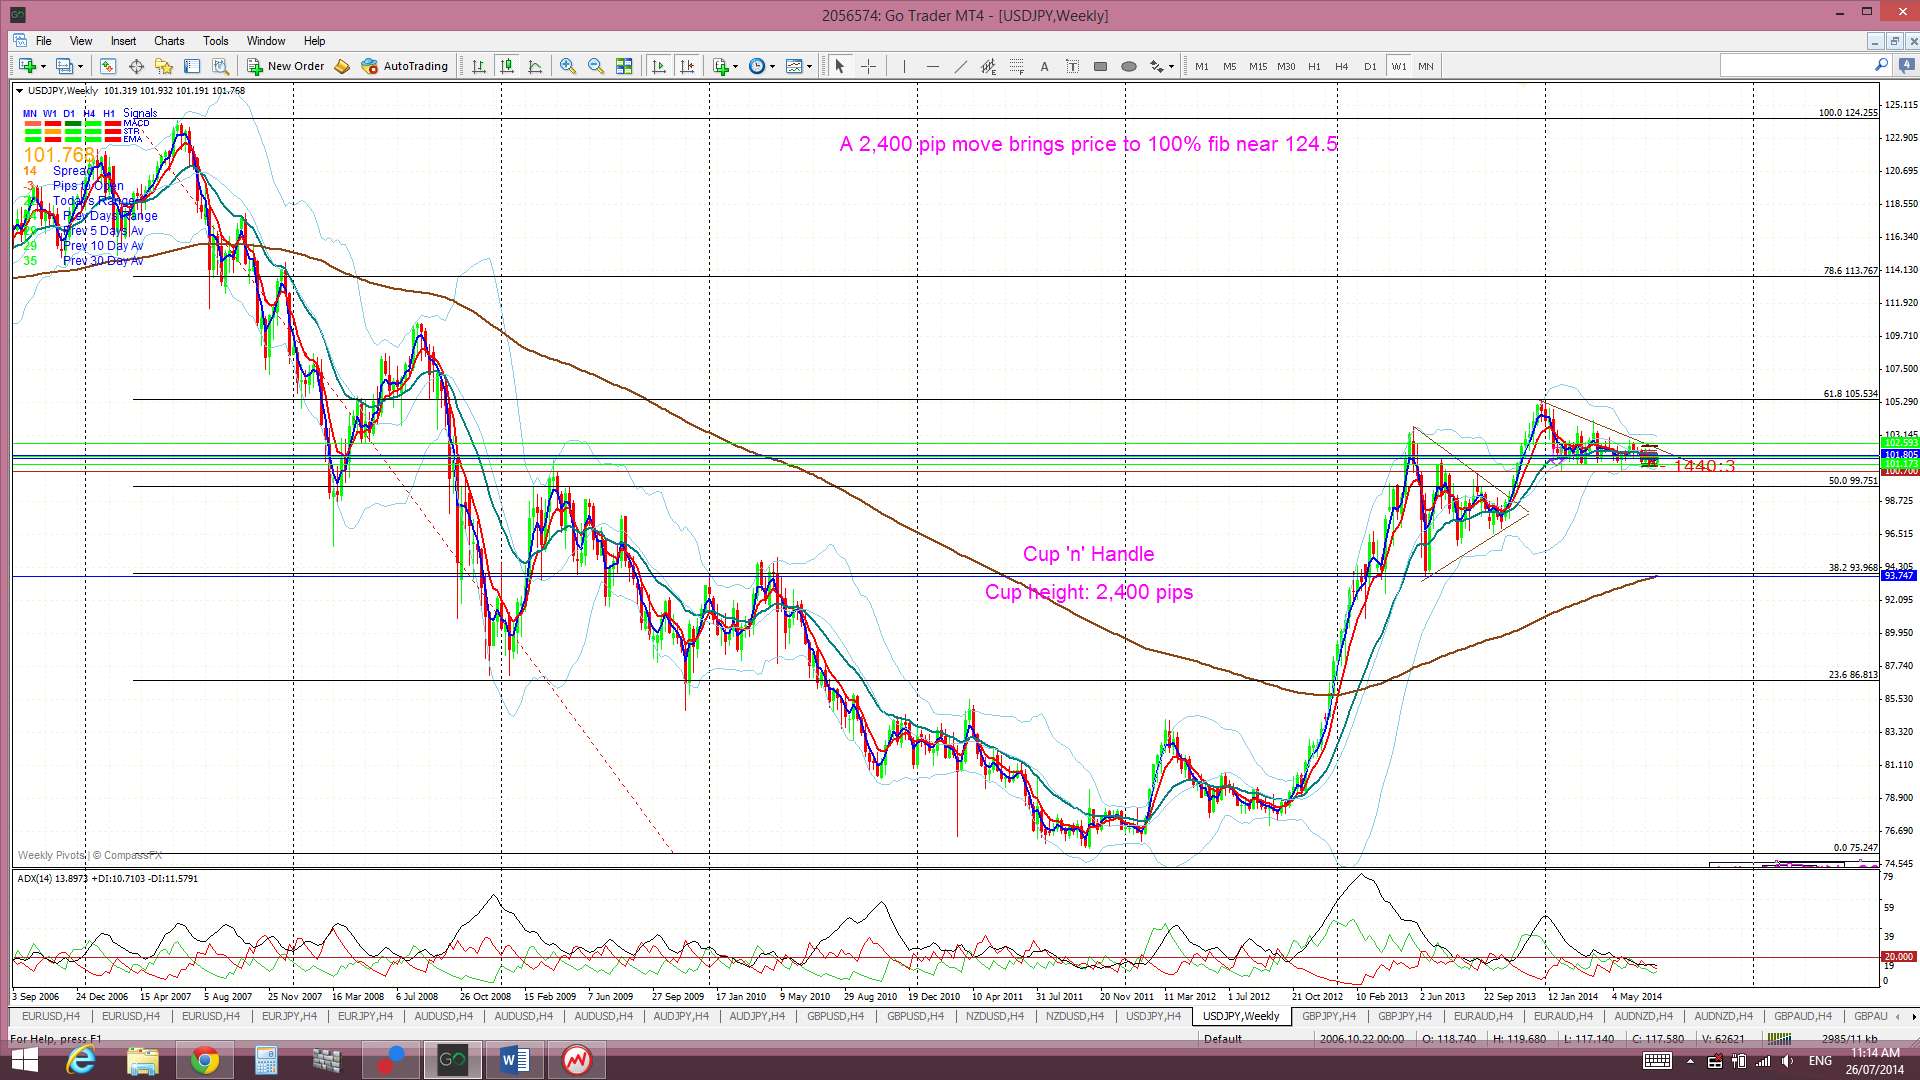
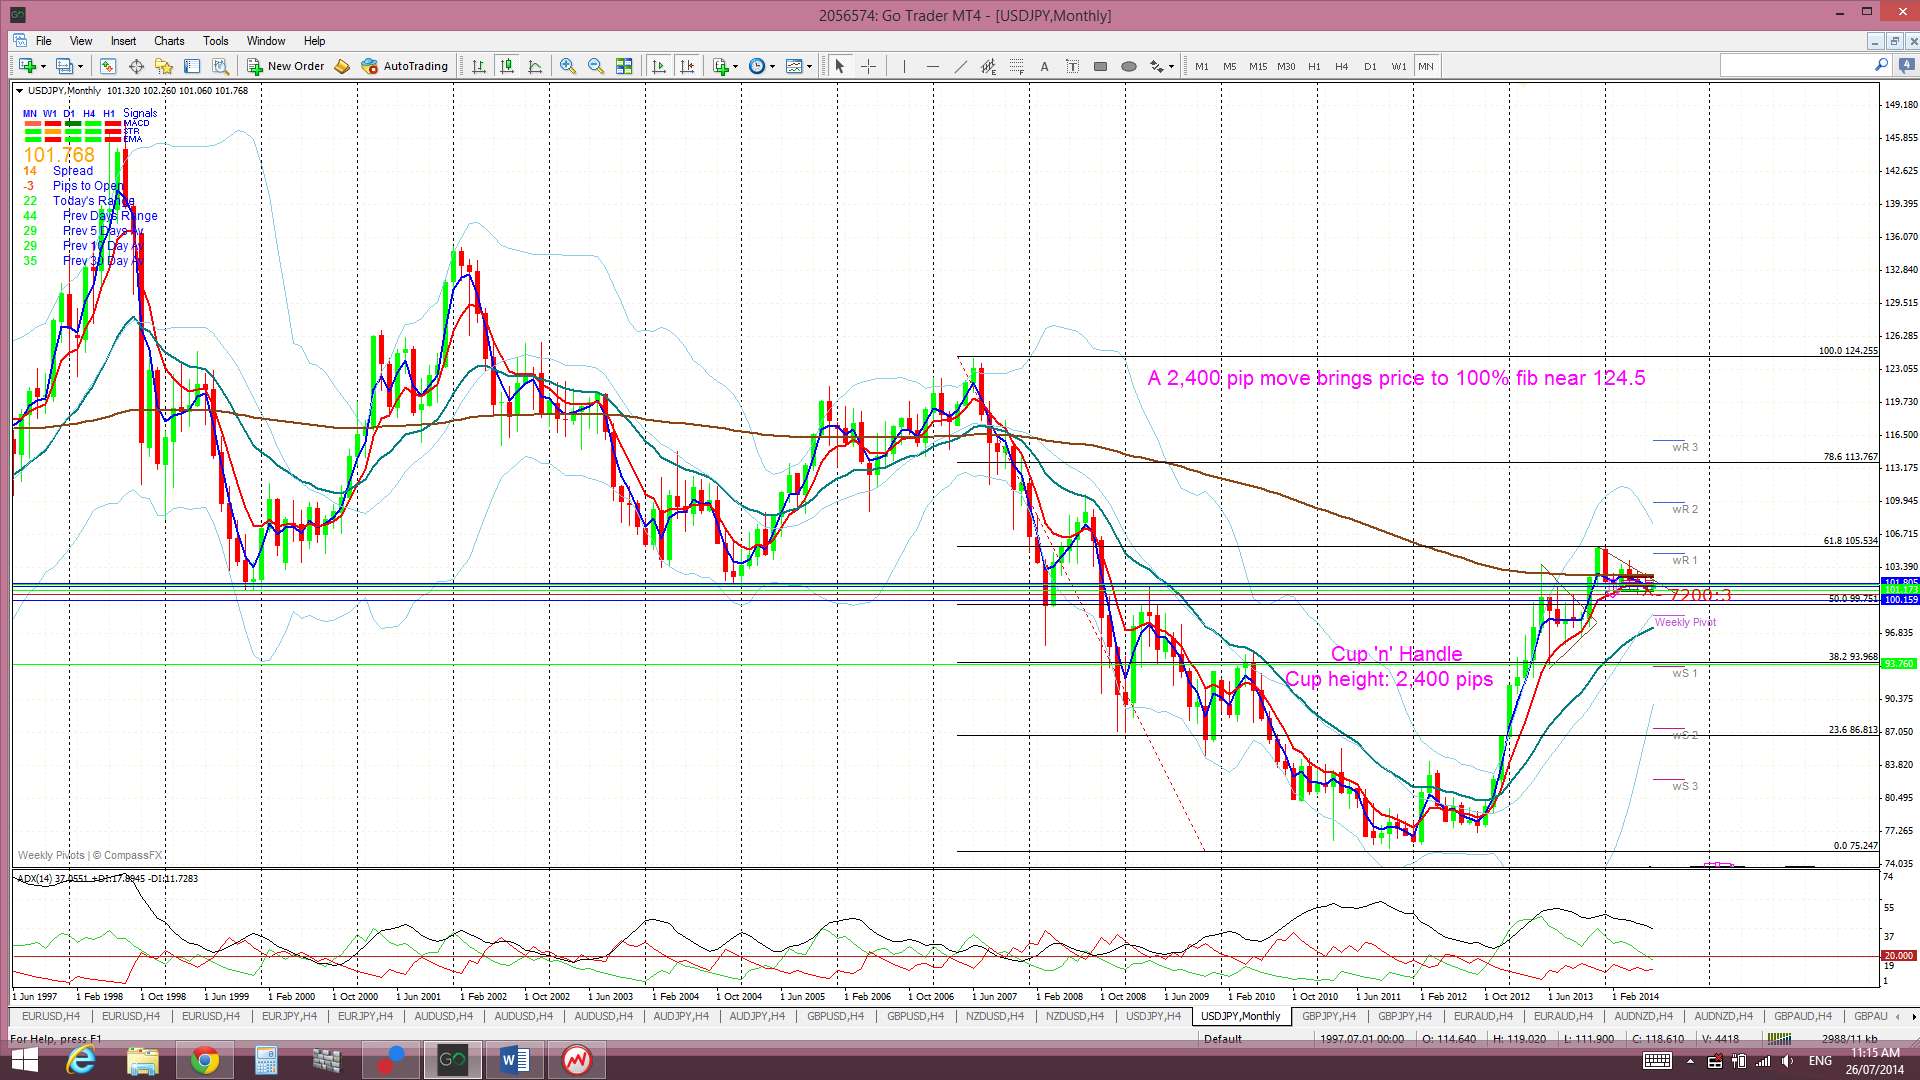
The Yen: U/J:The U/J chopped higher last week after bouncing up off the support of the daily 200 EMA. It is still trading within a triangle pattern on the daily chart and the bottom trend line of this triangle is at 100.7. The U/J has essentially chopped sideways in a narrow range for the last 6 months.
Price is now trading above the Cloud on the 4hr chart, below the Cloud on the daily chart, in the top edge of the Cloud on the weekly chart and above the Cloud on the monthly chart. November was the first monthly candle close above the Ichimoku Cloud since mid-2007 and the bullish hold above the monthly Cloud continues to be noteworthy.
The weekly candle closed as a small bullish coloured candle and almost engulfing the previous Doji candle.
Weekly Chart Bullish Cup’ n’ Handle pattern: I am still seeing this pattern building on the weekly chart. A break and hold below the daily chart triangle of 100.7 would void this pattern though. The theory behind these patterns is that the height of the ‘Cup’ pattern is equivalent to the expected bullish move from the ‘handle’ breakout. The height of the Cup for the U/J weekly chart is around 2,400 pips. The interesting point here is that a 2,400 pip bullish move up from the ‘Handle’ would put price up near the 124 level. This level is the last major swing high for the U/J from back in 2007 and represents the 100% fib pullback for the move down in 2007 to the lows of 2012. Possible targets along the way include the 61.8% fib retrace level at the 105.5 region and the 78.6% fib up near the 112 region.
The weekly chart still has a ‘Bull Flag’ look to it but a sustained breach of the 100.7 level would void this pattern.
- I’m watching for any new TC signal here and the daily chart triangle trend lines.
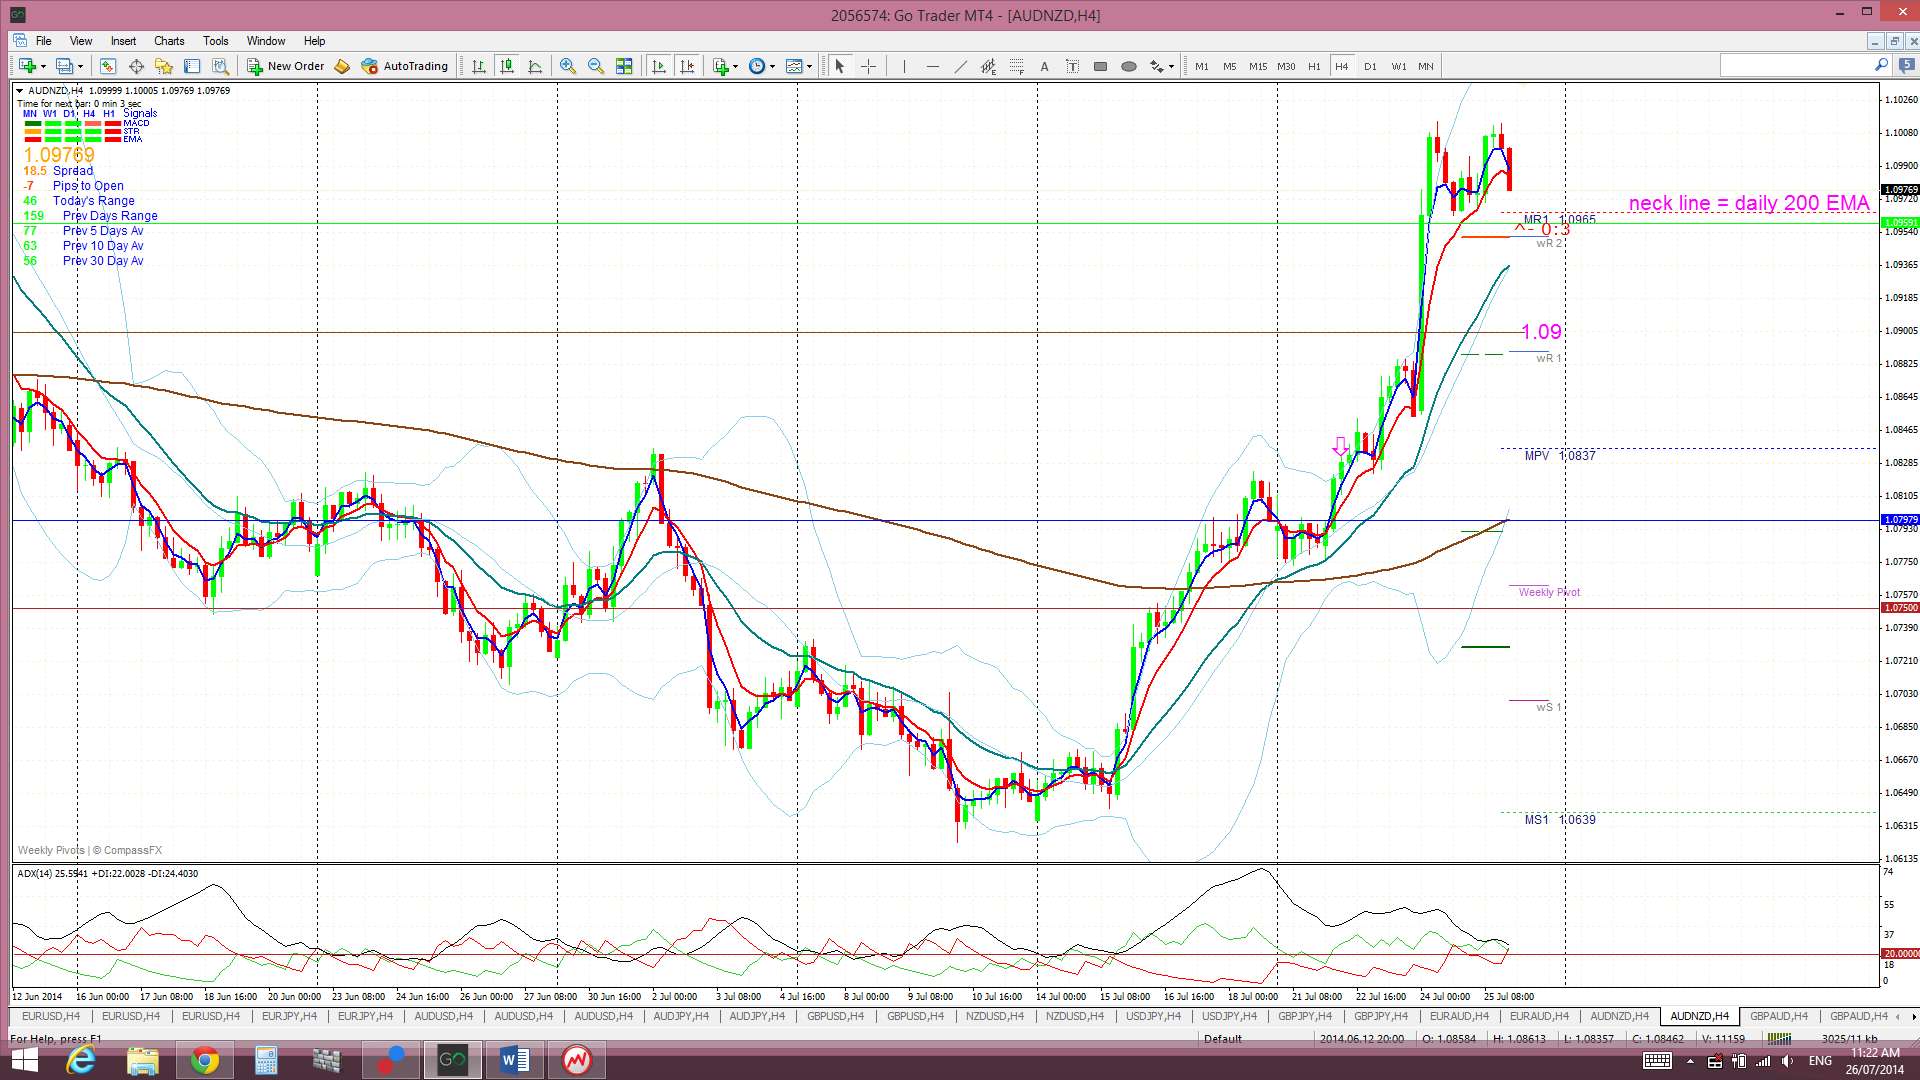
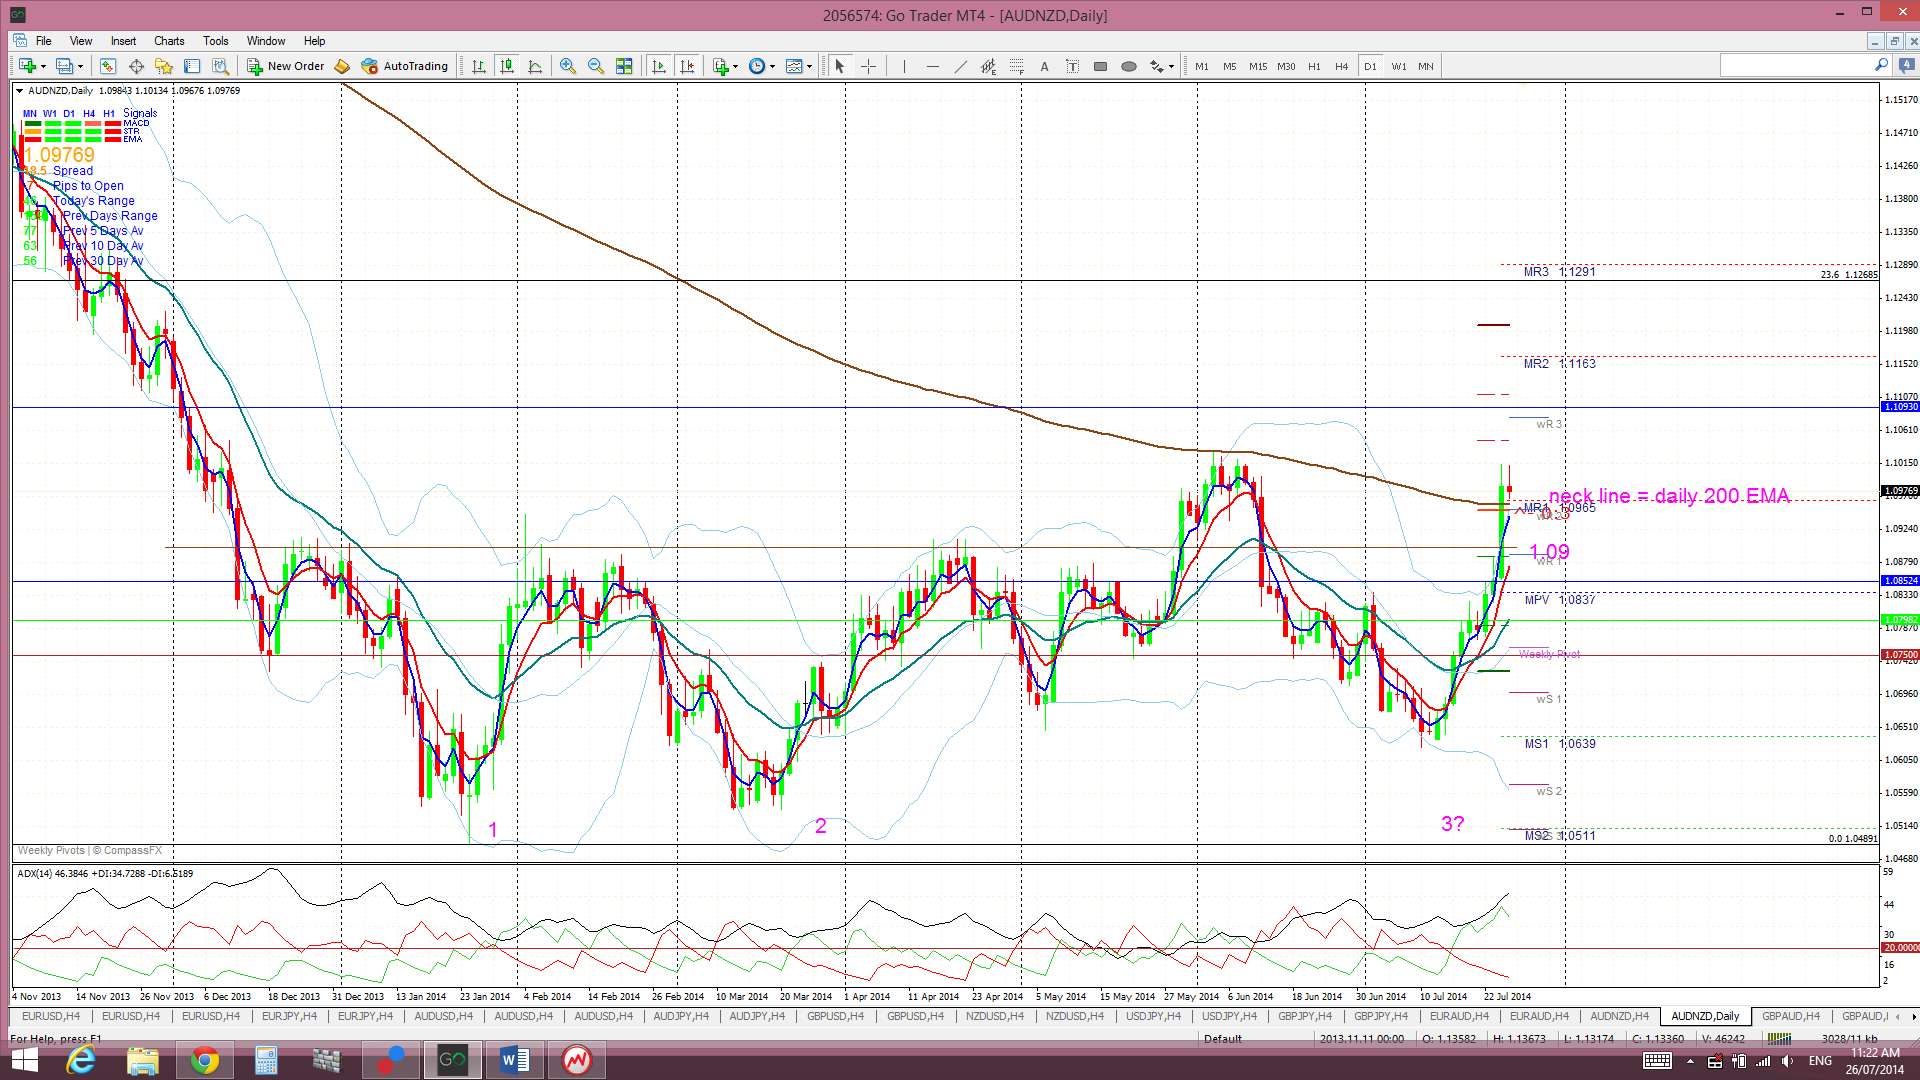
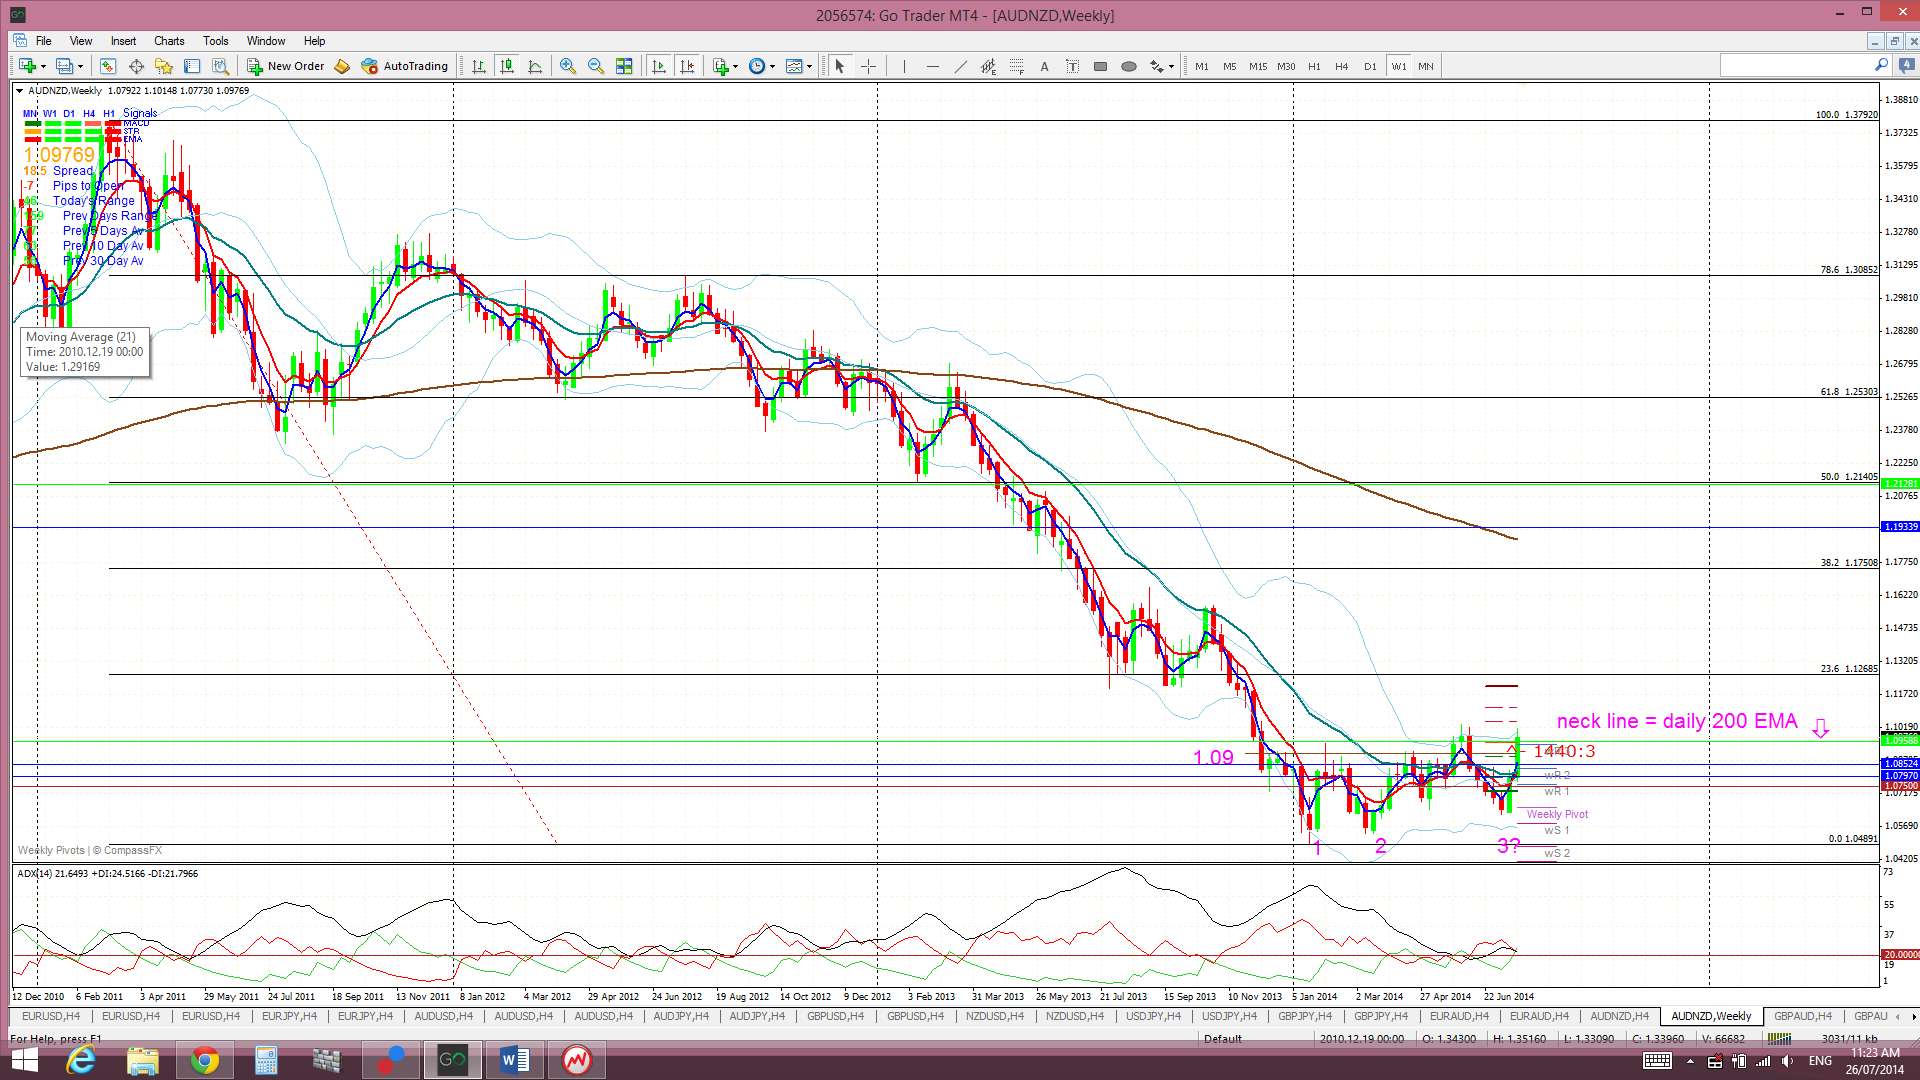
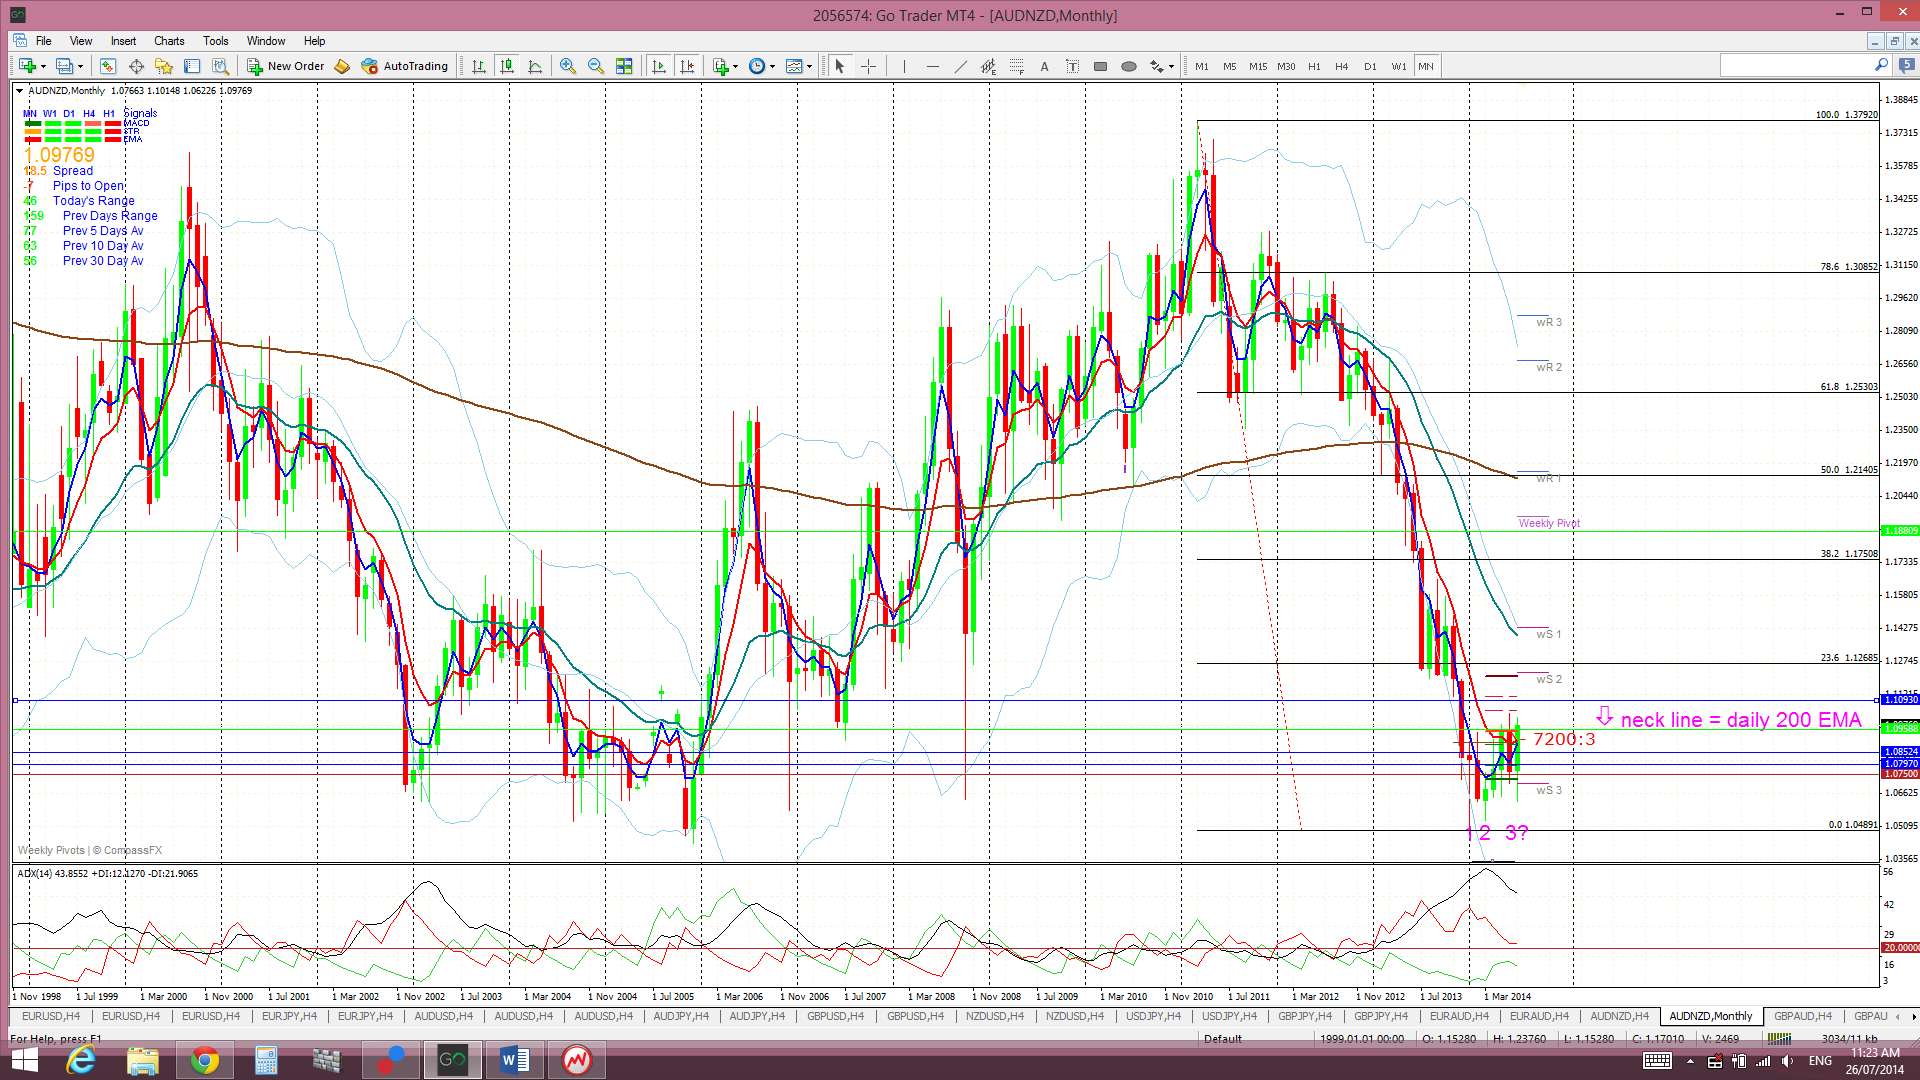
AUD/NZD: The A/N moved much higher last week following the prefect combination of increasing AUD strength and increasing NZD weakness. This move triggered a TC signal that wasn’t valid and this was a pity as the move gave over 180 pips.
I noted during the week that the ‘neck line of the developing messy ‘Triple Bottom’ looked to be at the daily 200 EMA and price has now closed above this level for the week.
The AUD/NZD is now trading above the Cloud on the 4hr and the daily chart which is bullish. Price is now attempting to move up through broad weekly Cloud and so any bullish continuation move could still be a bit choppy.
The weekly candle closed as a bullish candle following on from last week’s bullish engulfing candle.
- I’m watching for any new valid TC signal and the Triple Bottom ‘neck line’.
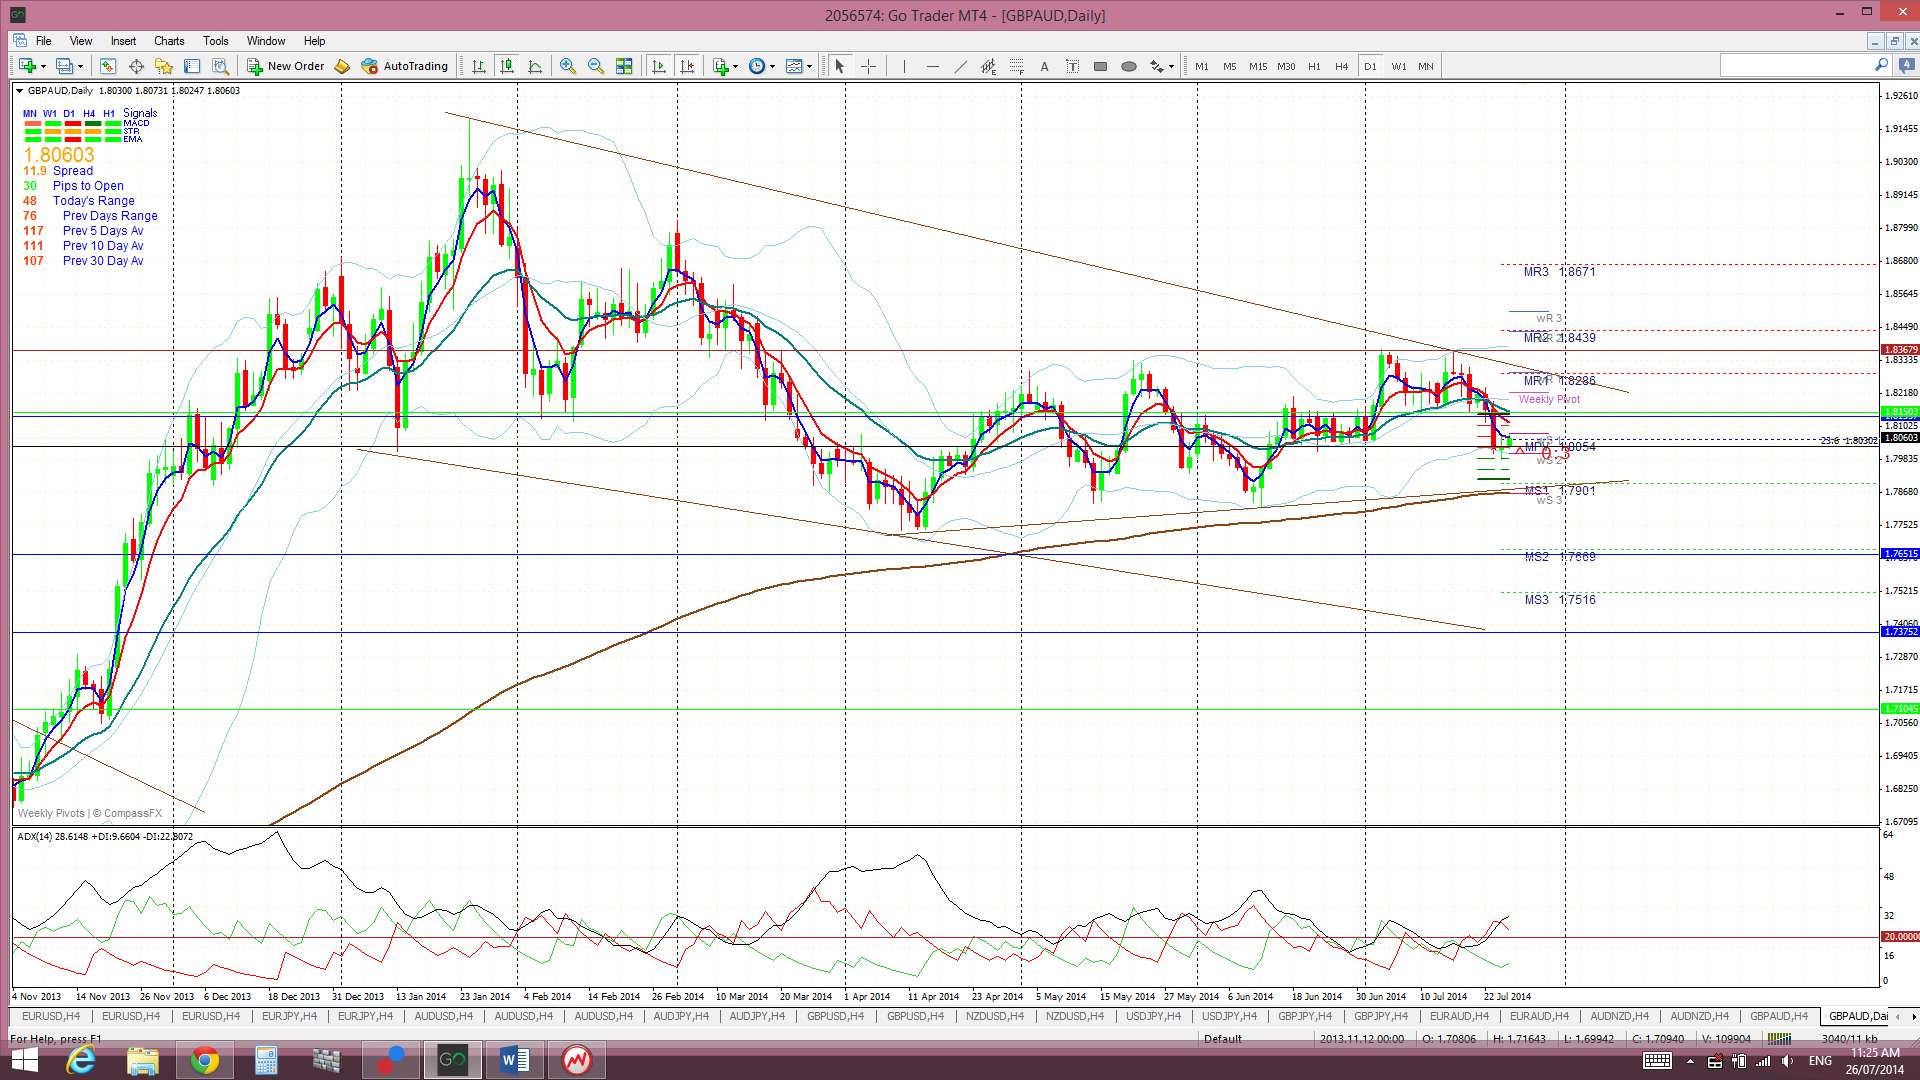
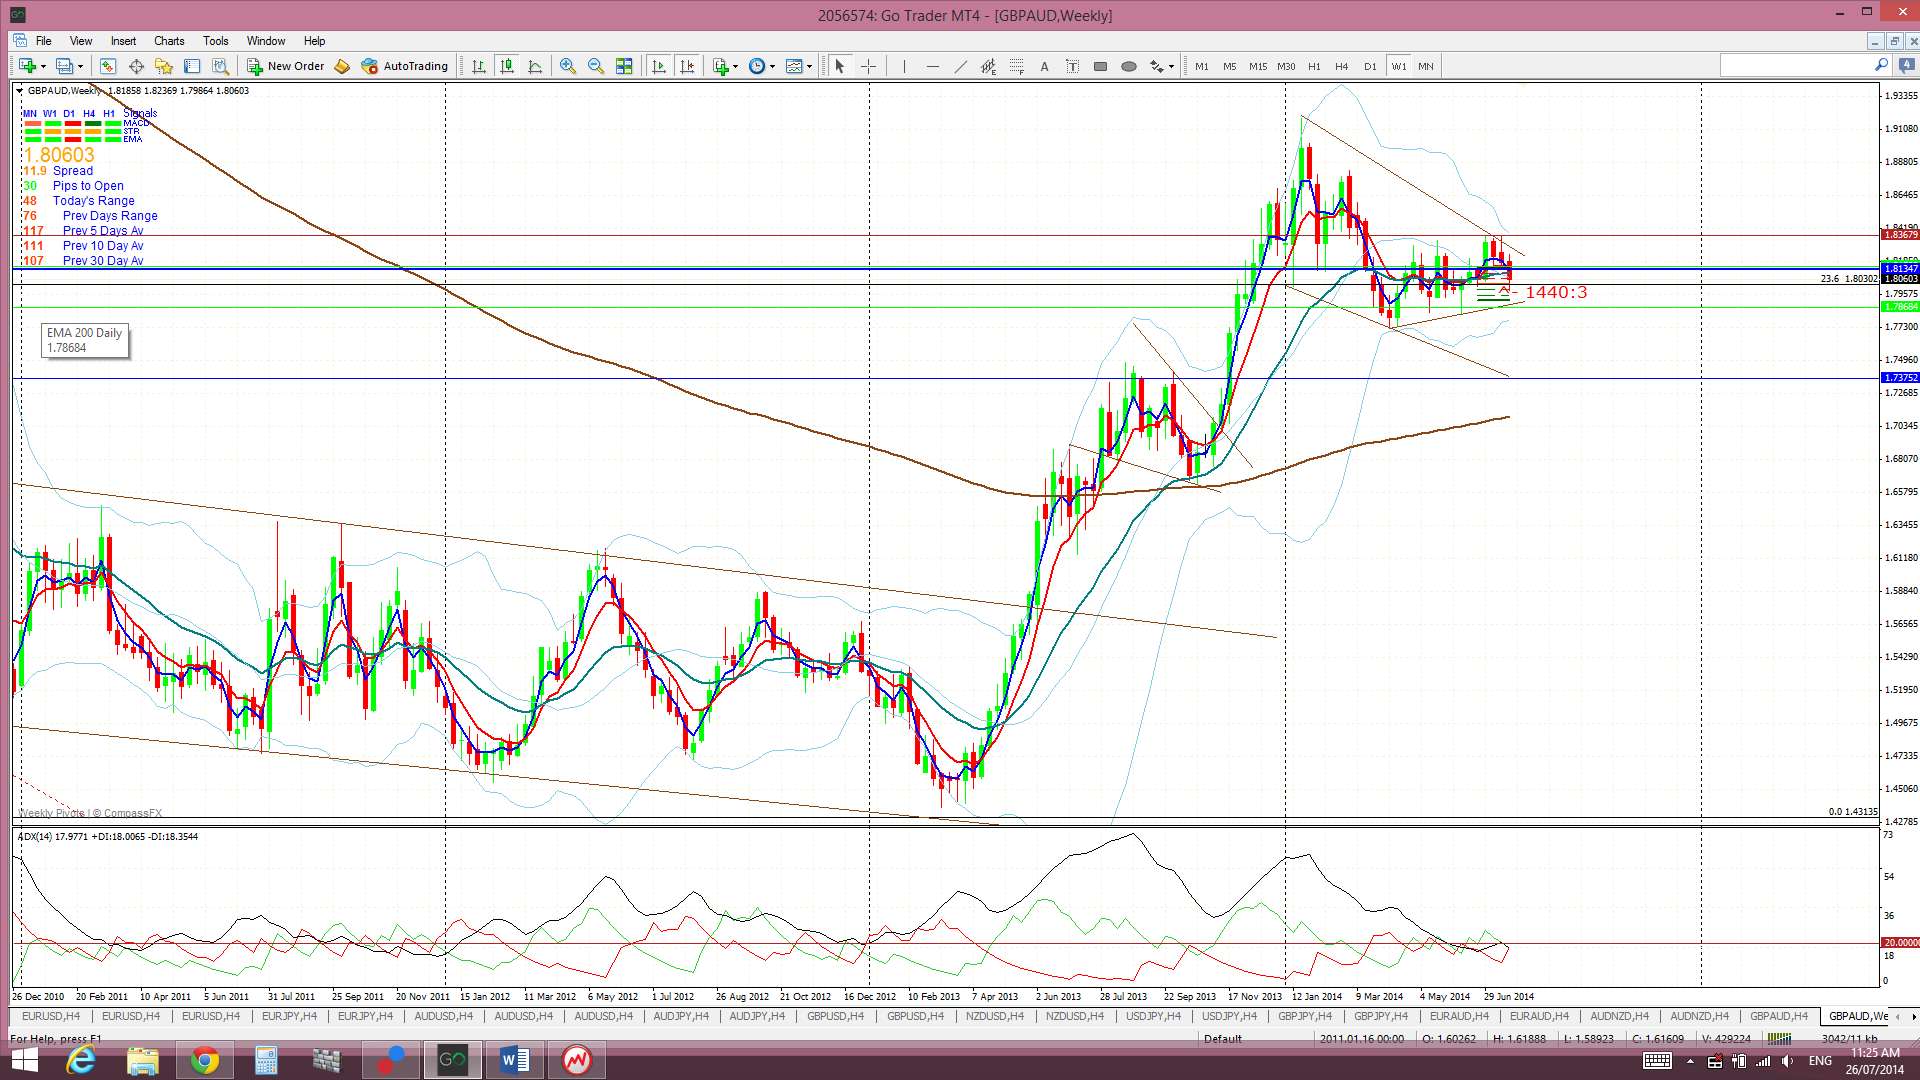
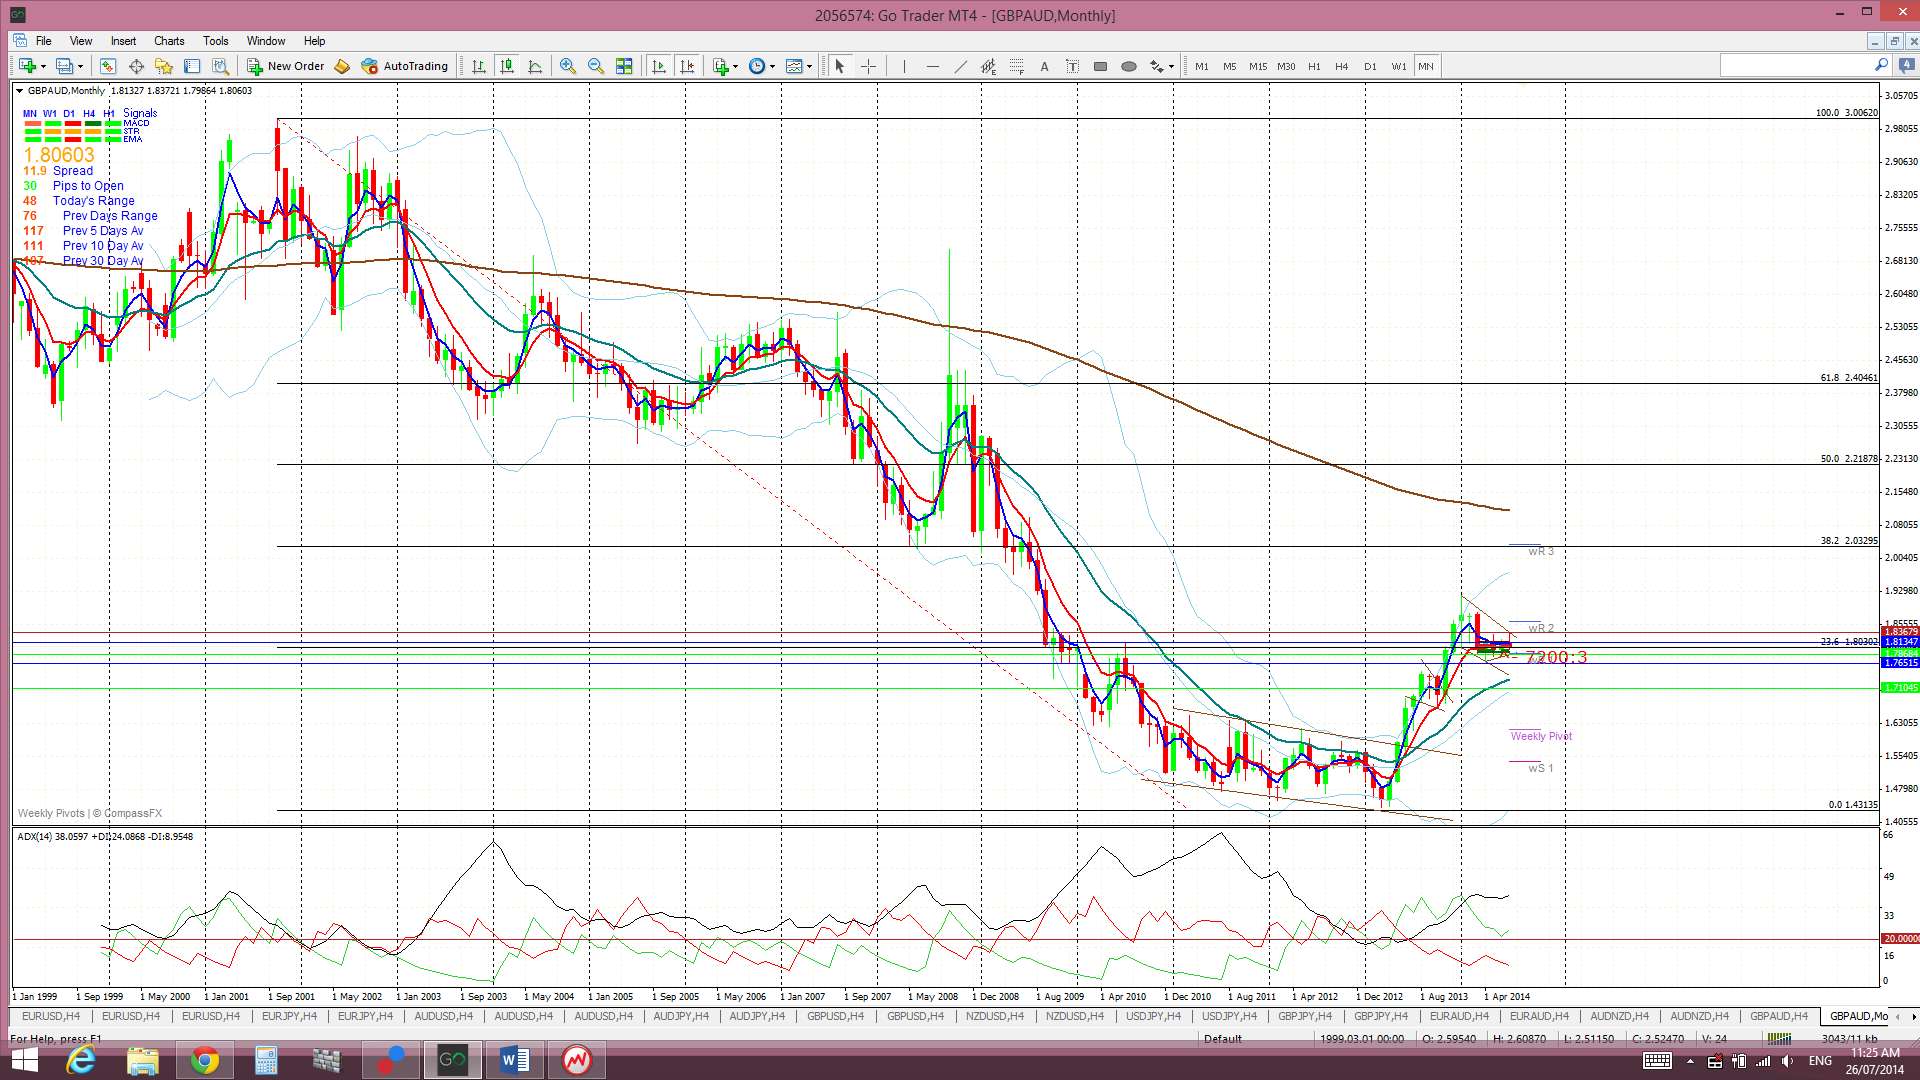
GBP/AUD: This pair chopped lower last week due to the stronger AUD and flat GBP but still looks rather messy within the revised trading channel.
Price is now trading below the Ichimoku Cloud on the 4hr but just above thin Cloud on the daily chart which suggest further choppiness. There is rather broad bullish cloud below the weekly candle, although, this candle is sitting in the top edge of this weekly Cloud.
The weekly candle closed as a bearish candle.
- I’m watching for any new TC signal on this pair.

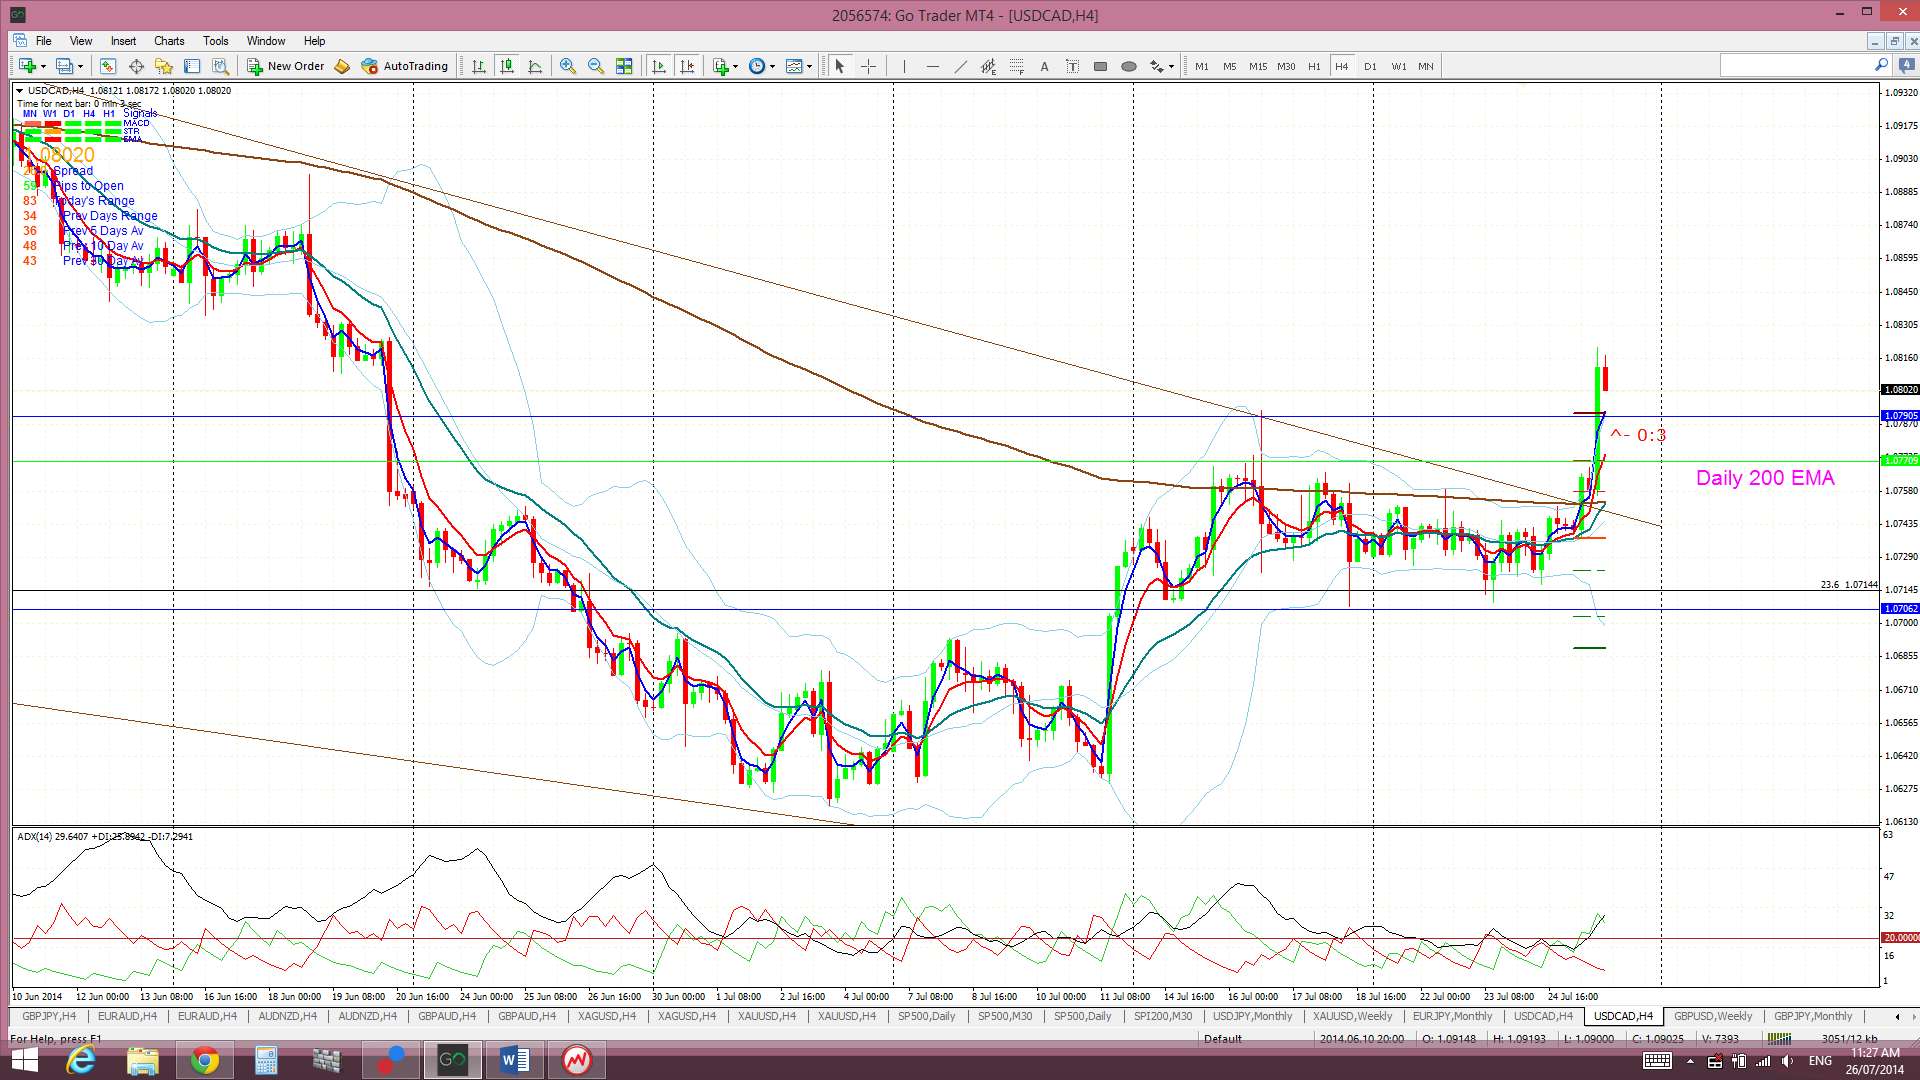
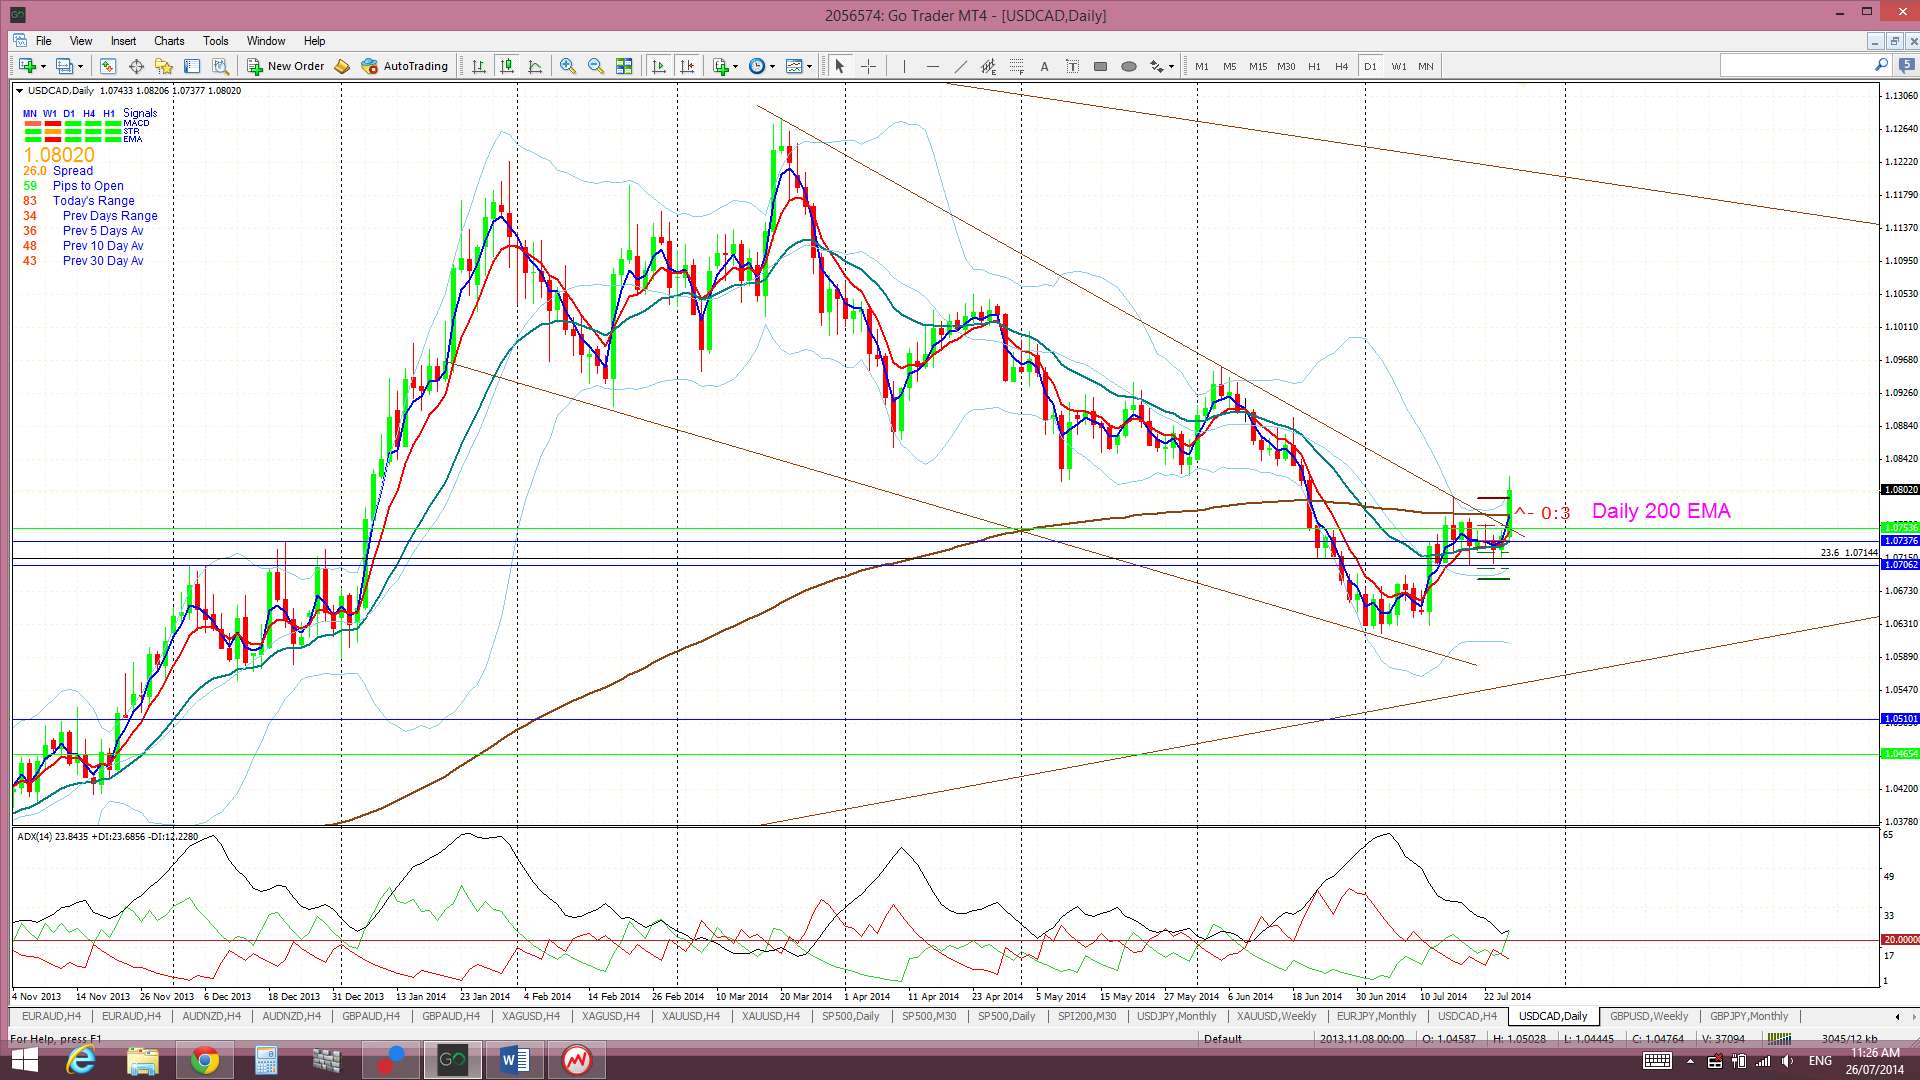
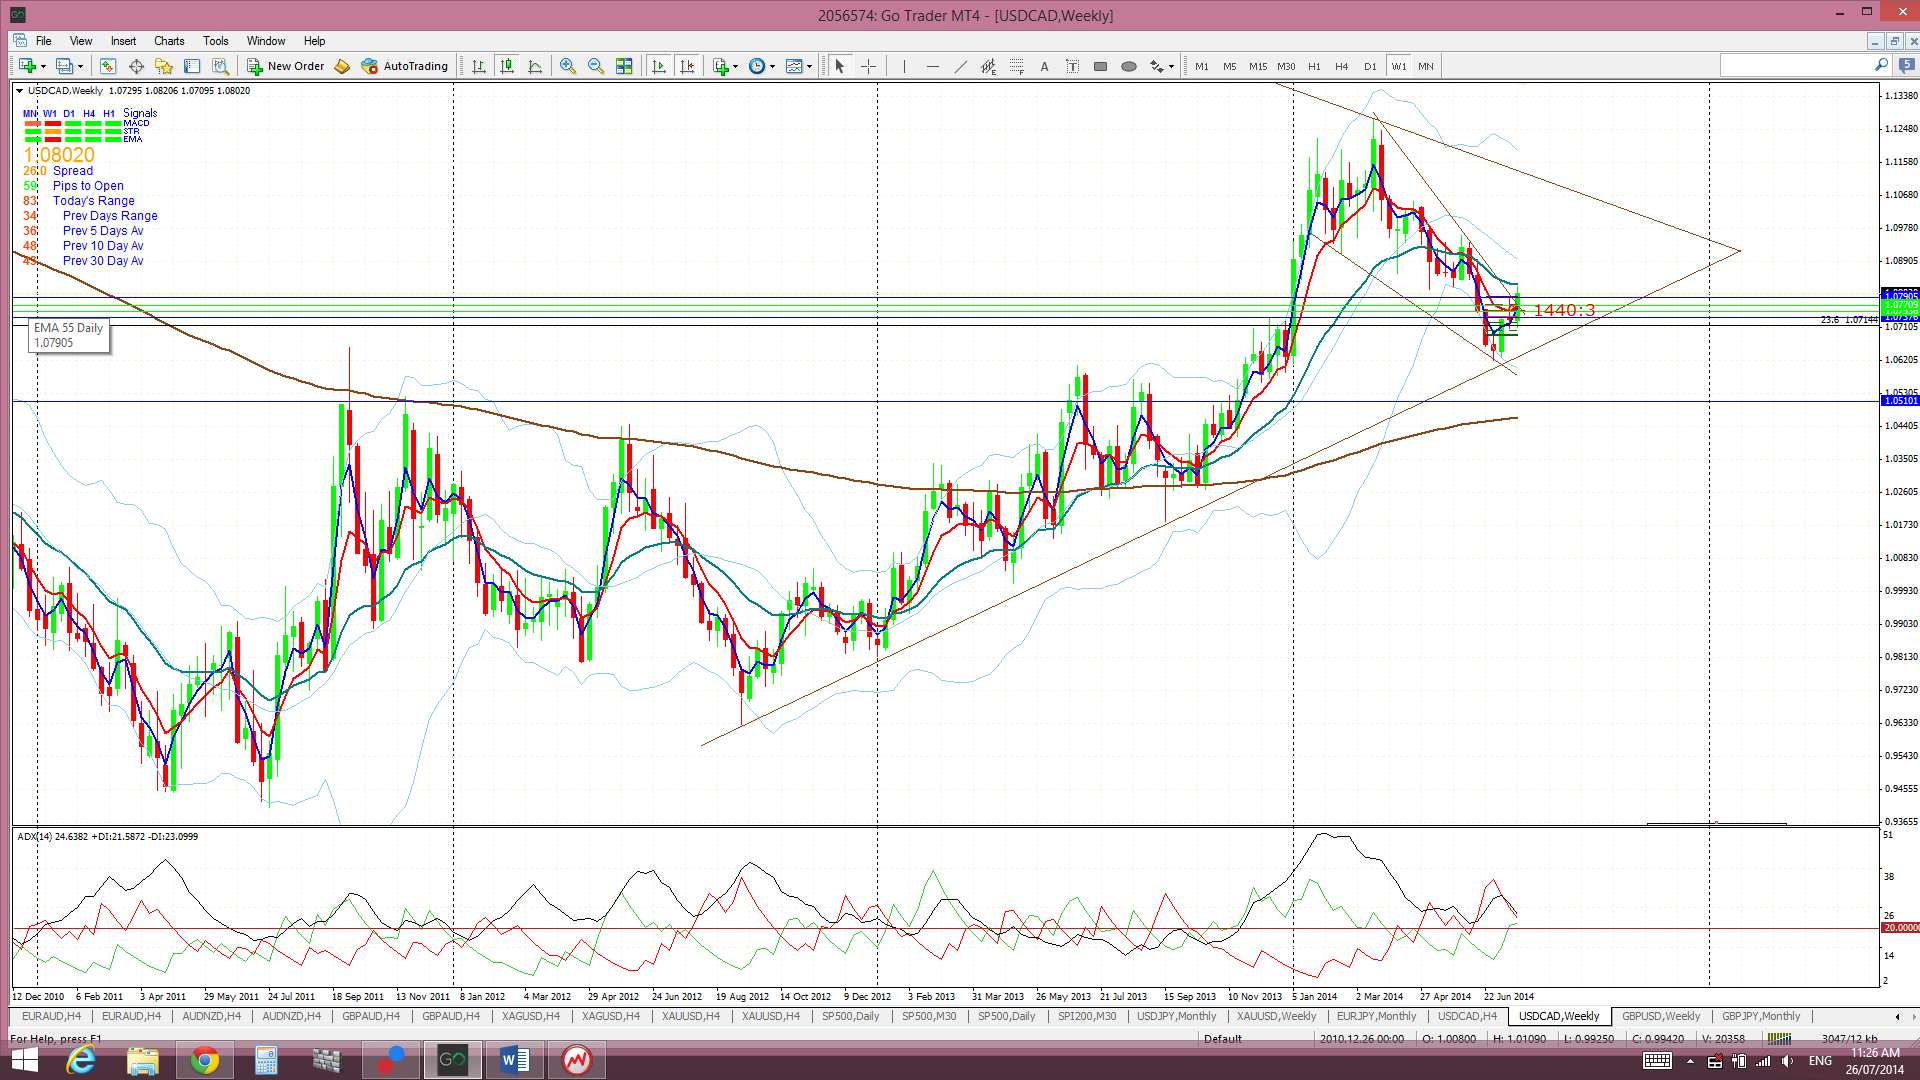
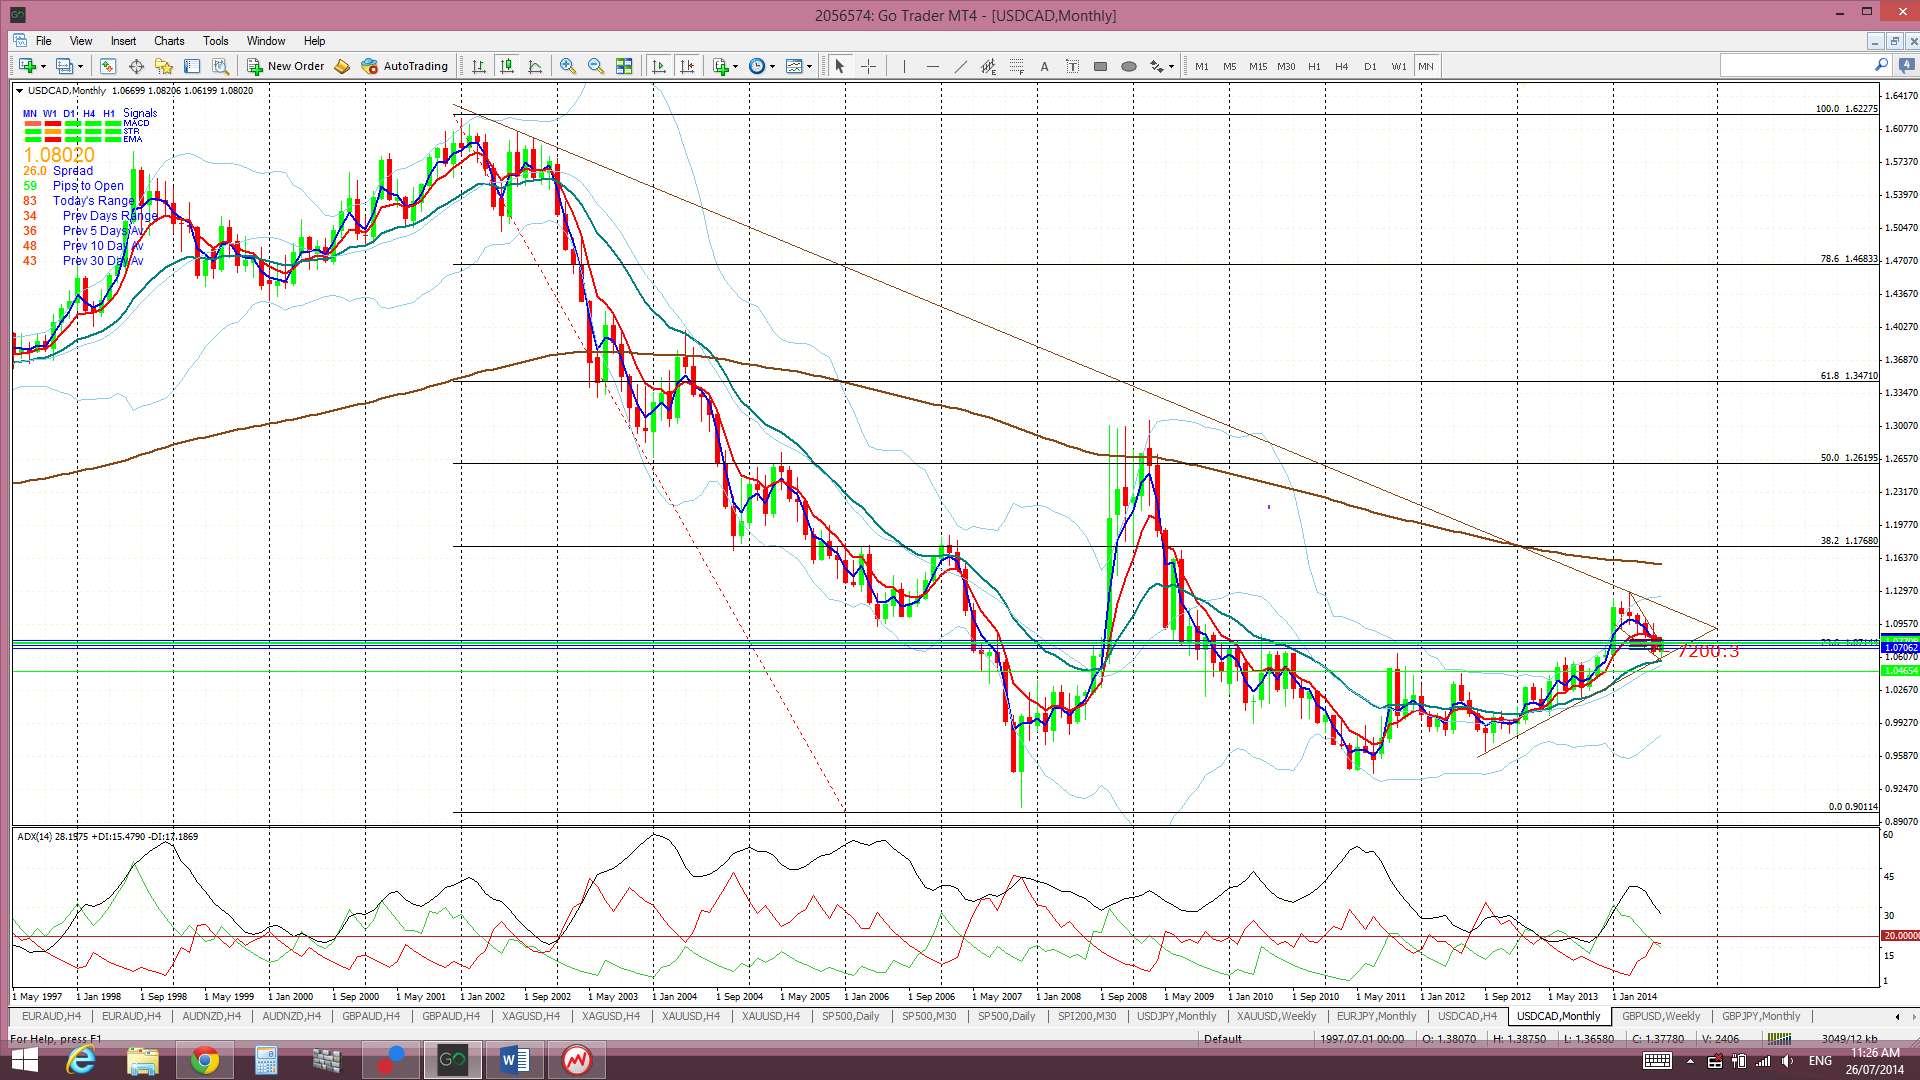
Loonie USD/CAD: The Loonie chopped along sideways and just under the daily chart’s descending wedge pattern and the daily 200 EMA until Friday. Further strong US data on Friday continued to boost the USD though and this triggered a breakout move on the Loonie.
The Loonie has now closed up and out of the bullish descending wedge and above the resistance of the daily 200 EMA. This is a significant bullish development but next week is a high impact data week for the USD and may affect sentiment here. The CAD only has GDP data on Thursday to monitor. Traders may see a ‘long trade’ entry opportunity if price pulls back to test the broken trend line or even just the daily 200 EMA level.
A word of caution: as previously mentioned there is a lot of USD data this week that could impact the direction of the USD and, thus, of this trade too. Traders need to keep an eye on these data items.
Price is trading above the 4hr Cloud but below the daily Cloud which suggests some further choppiness.
The weekly candle closed as a bullish engulfing candle.
- I’m watching for any new TC signal, the trading channel trend lines and the daily 200 EMA.
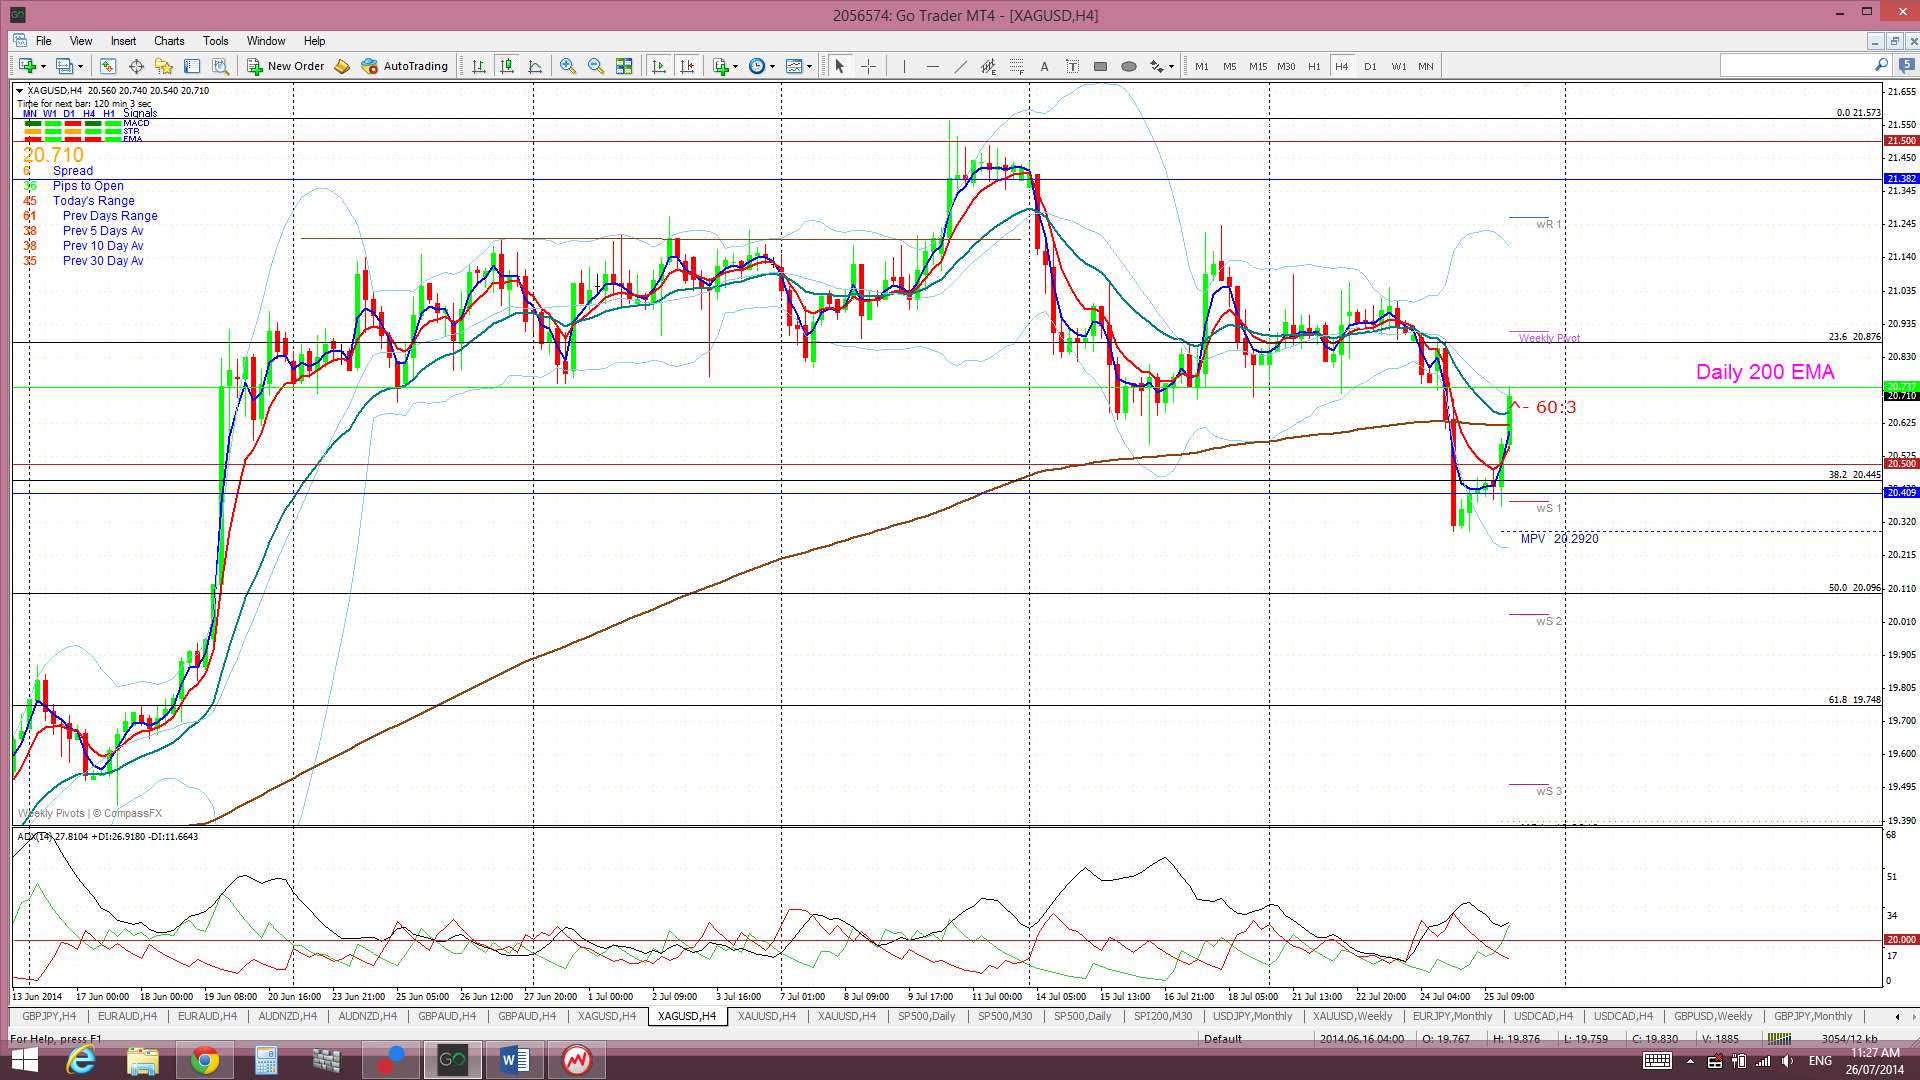
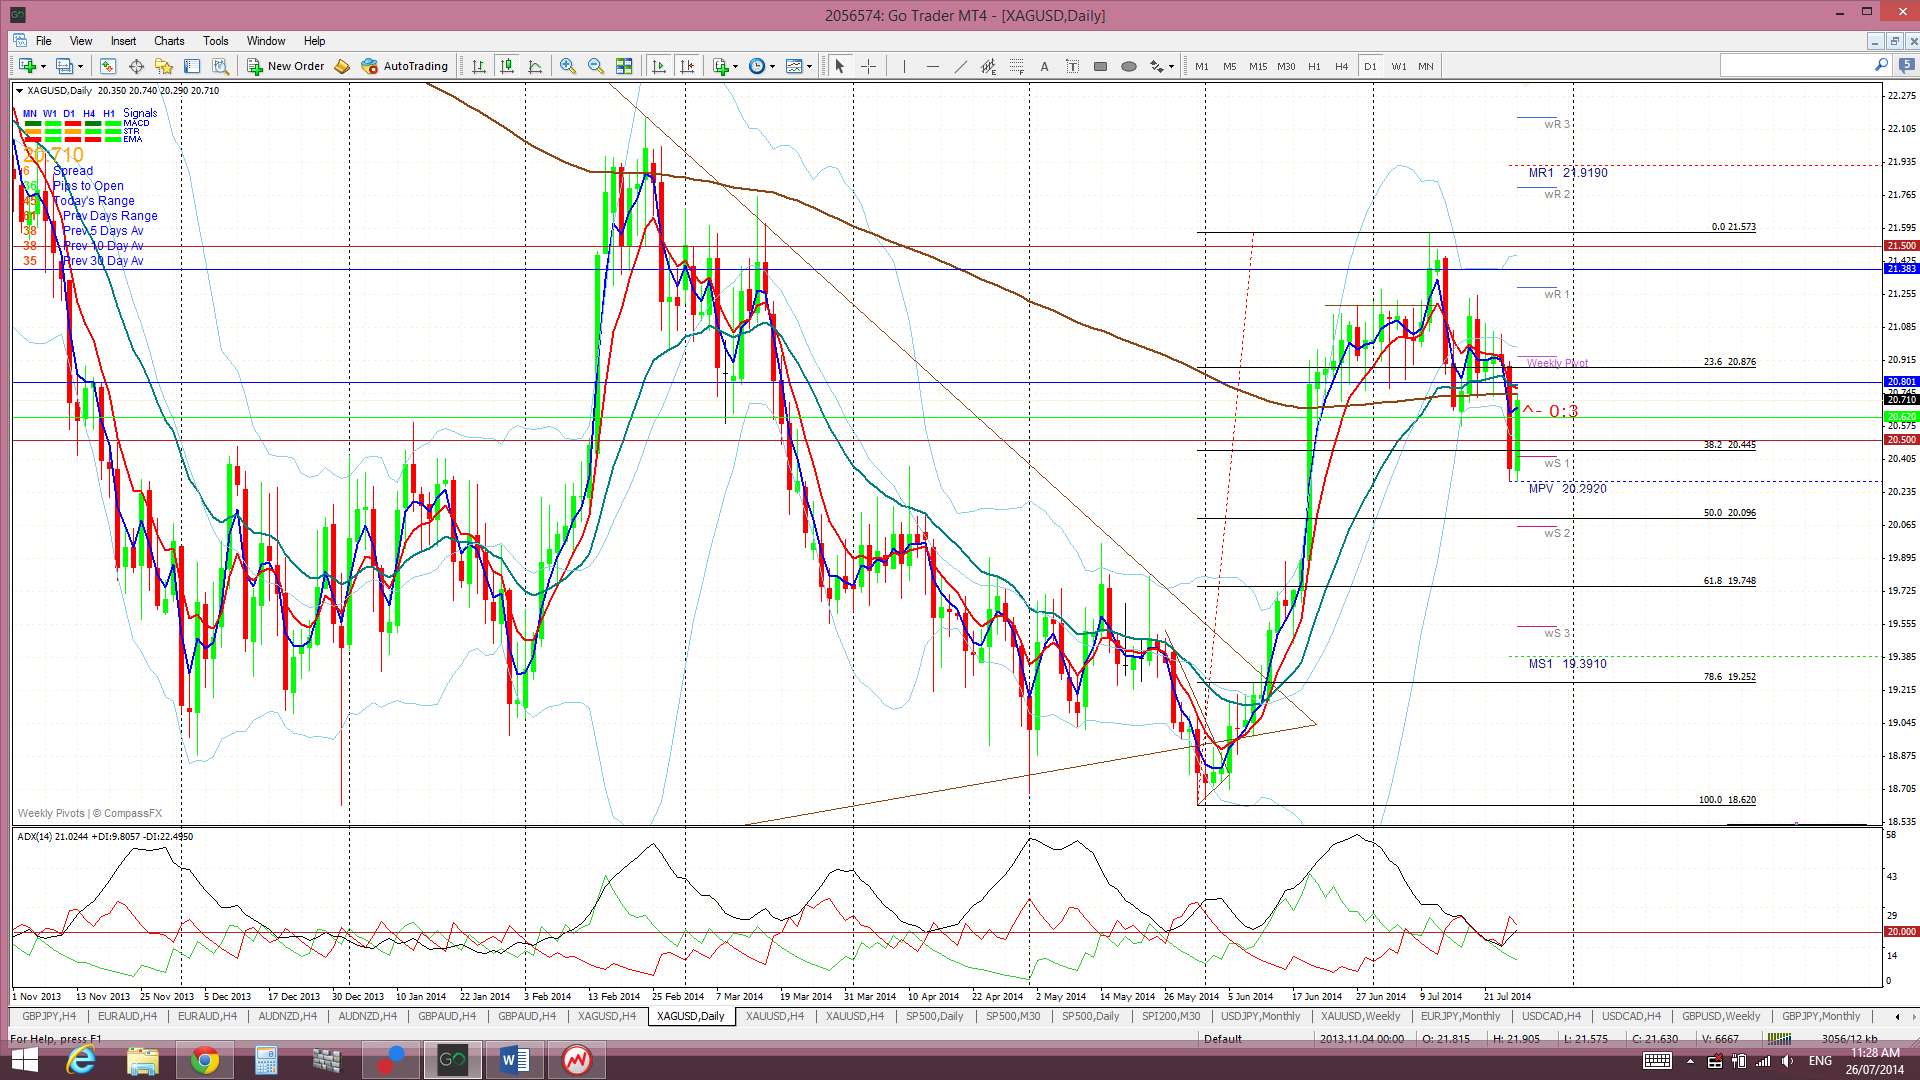
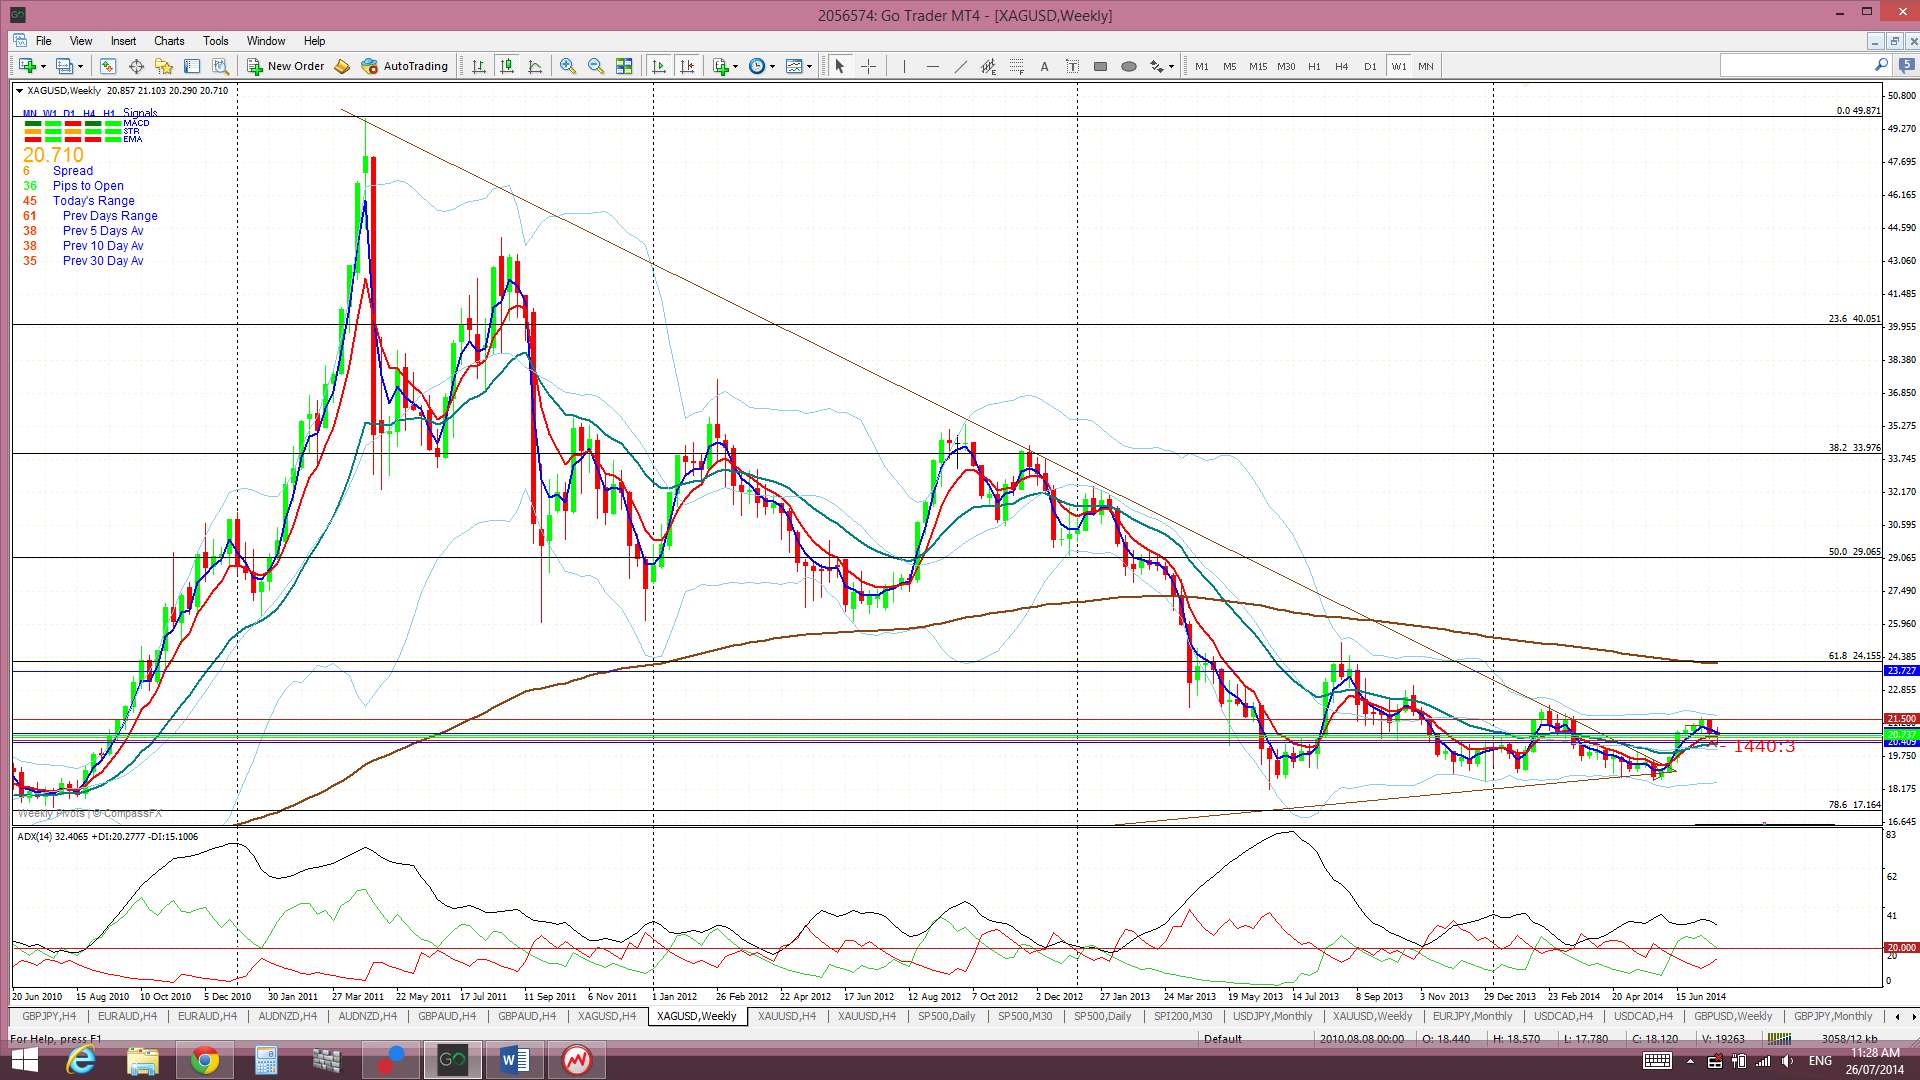
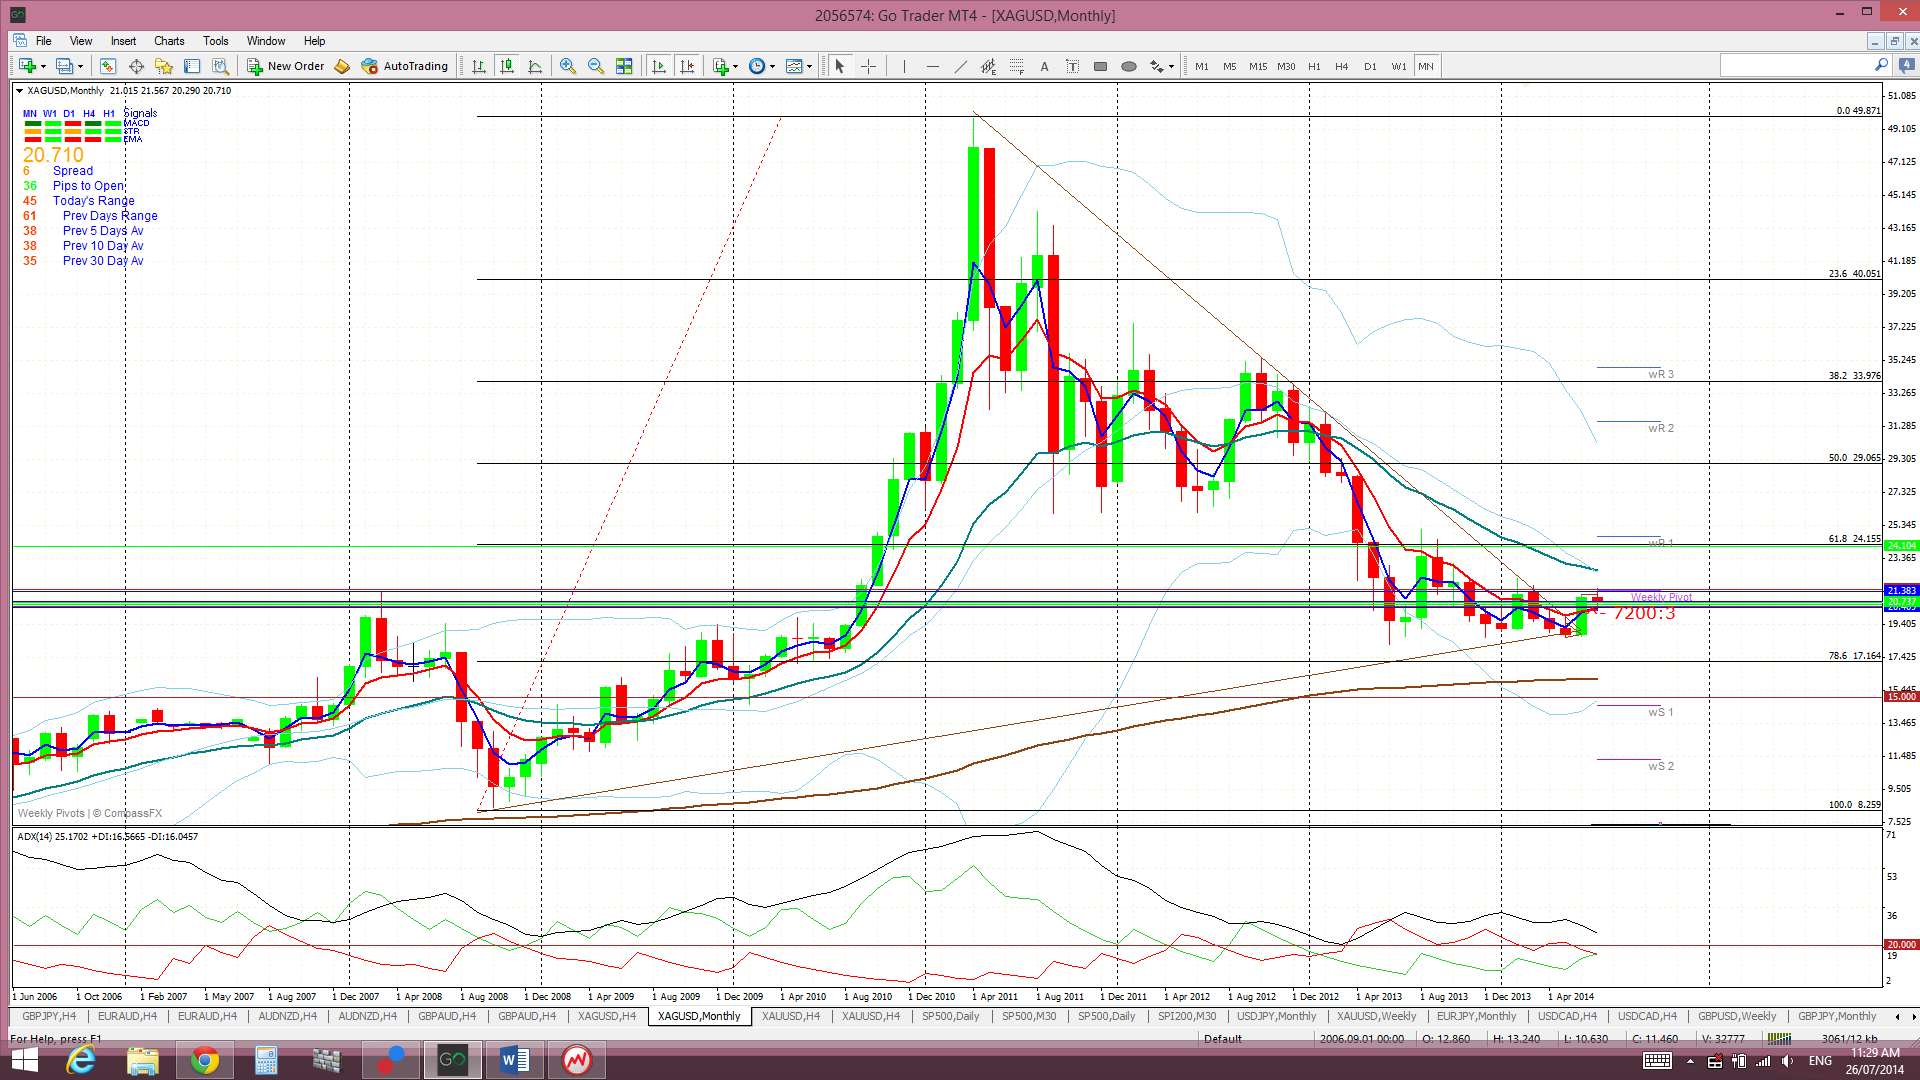
Silver and Gold: both of these struggled a bit last week but scramble back higher on Friday to close back above key support. There is a lot of USD sensitive data next week and this might dictate the future for both Silver and Gold. Any continued bullish momentum with the USD might continue to put pressure on both of the metals. There is also the ‘geopolitical tension’ factor to be aware of here.
Silver: Silver chopped along above the support of the daily 200 EMA until Thursday. Strong US jobs data helped to boost the USD and this USD strength put pressure on both Silver and Gold. Price fell below the support of the $20.50 level following this data but found support from the monthly pivot. Price rallied from there on Friday and managed to close back above the support of the $20.50 level. This recovery seems quite bullish for Silver.
The daily charts shows how Silver found some support at the end of the week from the monthly pivot but any renewed bearish follow through might target the $20 level, which is the 50% fib of the recent bull move, or the $19.70 level, which is the 61.8% fib of this move.
Silver is trading below the Ichimoku Cloud on the 4hr chart, above on the daily chart, in the bottom edge of the Cloud on the weekly chart but below on the weekly and monthly charts.
The weekly candle closed as a small bearish candle with a long lower shadow. This follows on from last week’s bearish engulfing candle.
- I’m watching for any new TC signal.
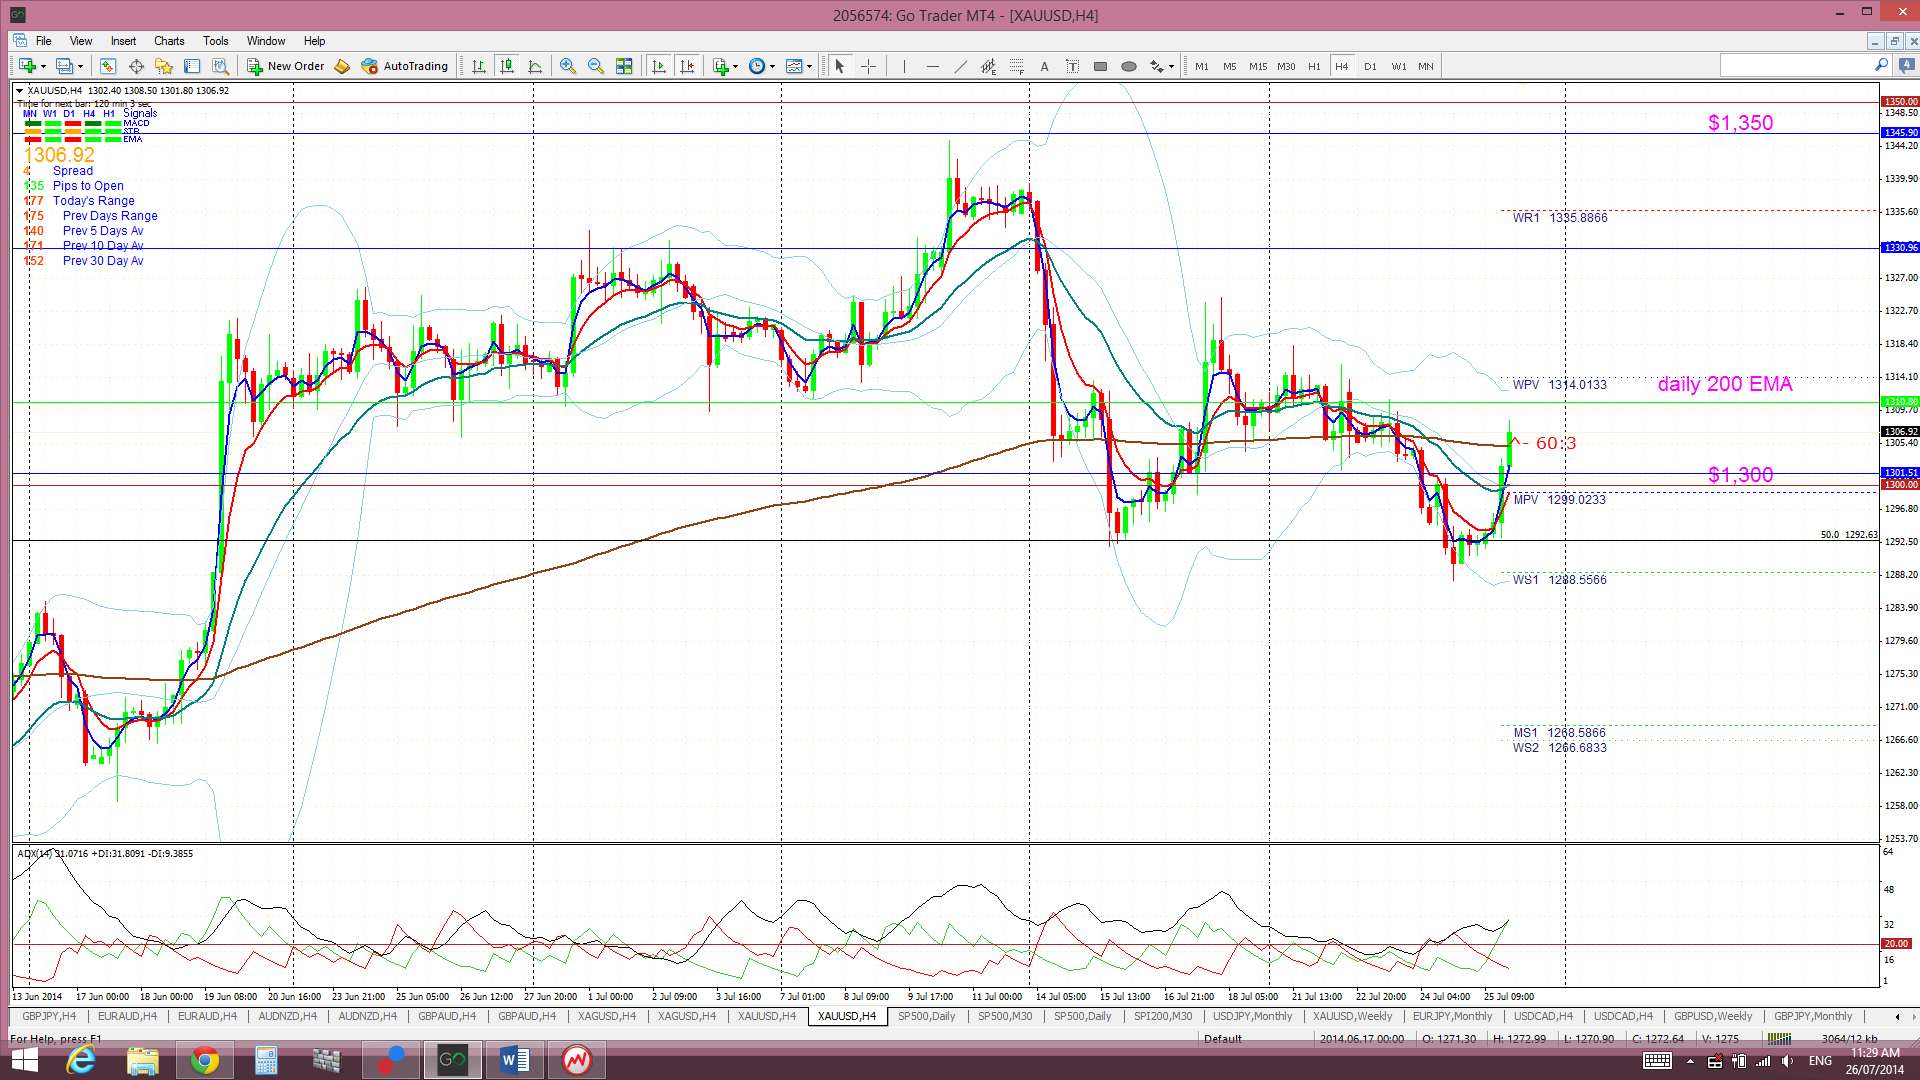
Gold: Gold tracked a similar path as for Silver. It held up reasonably well until Thursday and then fell below the $1,300 support level. Gold found support, once again, from the 50% fib pull back level of the 2008-2011 bull move and rallied from this point on Friday to close back above the $1,300 level. As with Silver, this recovery seems quite bullish for Gold.
The bullish ‘inverse H&S’ pattern is still forming up on the weekly chart though. The ‘neck line’ of this inverse H&S is still up around the $1,400 region, which is also up near the weekly 200 EMA level.
Gold is trading below the Ichimoku Cloud on the 4hr chart, above on the daily chart and in the bottom of the Cloud on the weekly and monthly charts. It is worth remembering that the November candle was the first monthly candle close below the Ichimoku Cloud since January 2002, a period of almost 12 years! Price had pulled back up to test the Cloud but the March, April and May candles closed back below the monthly Cloud. The June monthly candle closed back up in the bottom of the Cloud. This may be a case now of Gold forming a base, as the ‘inverse H&S’ would suggest, and starting to climb its way back. We will need to see where the July candle ends up closing.
It is worth noting that Gold has completed a 61.8% fib pull back of the bull move from the last swing low, back in October 2008, to the highs of 2011. Thus, this is as good a place as any to try to carve out a basing pattern.
The weekly candle closed here much like Silver and as a small bearish candle with a long lower shadow. This also follows on from last week’s bearish engulfing candle.
- I’m watching for any new TC signal on this pair and the ‘Inverse H&S’ pattern on the weekly chart.
<img class=”aligncenter size-large wp-image-8019″ src=”//www.tradechar
The post Trade Week Analysis for 28/07/14 appeared first on www.forextell.com.