Last week: Last week was a good week for TC and trend trading with two TC signals. One winner and one loser: E/J= 270 pips and EUR/GBP = -15 pips.
Friday was a busy trading day following news that the PBOC announced an interest rate cut and the ECB discussed further easing, each with the aim of stimulating growth. This news triggered a rally with stocks across Europe and the USA and gave the A/U and NZD/USD a boost but the E/U suffered a significant fall. The Cable remained fairly flat through this though as the anti-EU party (UKIP) got a bit of press during the week and, with the GBP interest rate situation still remaining unclear, it seems these two factors combined to unnerve any potential ‘long’ trades.
This week:
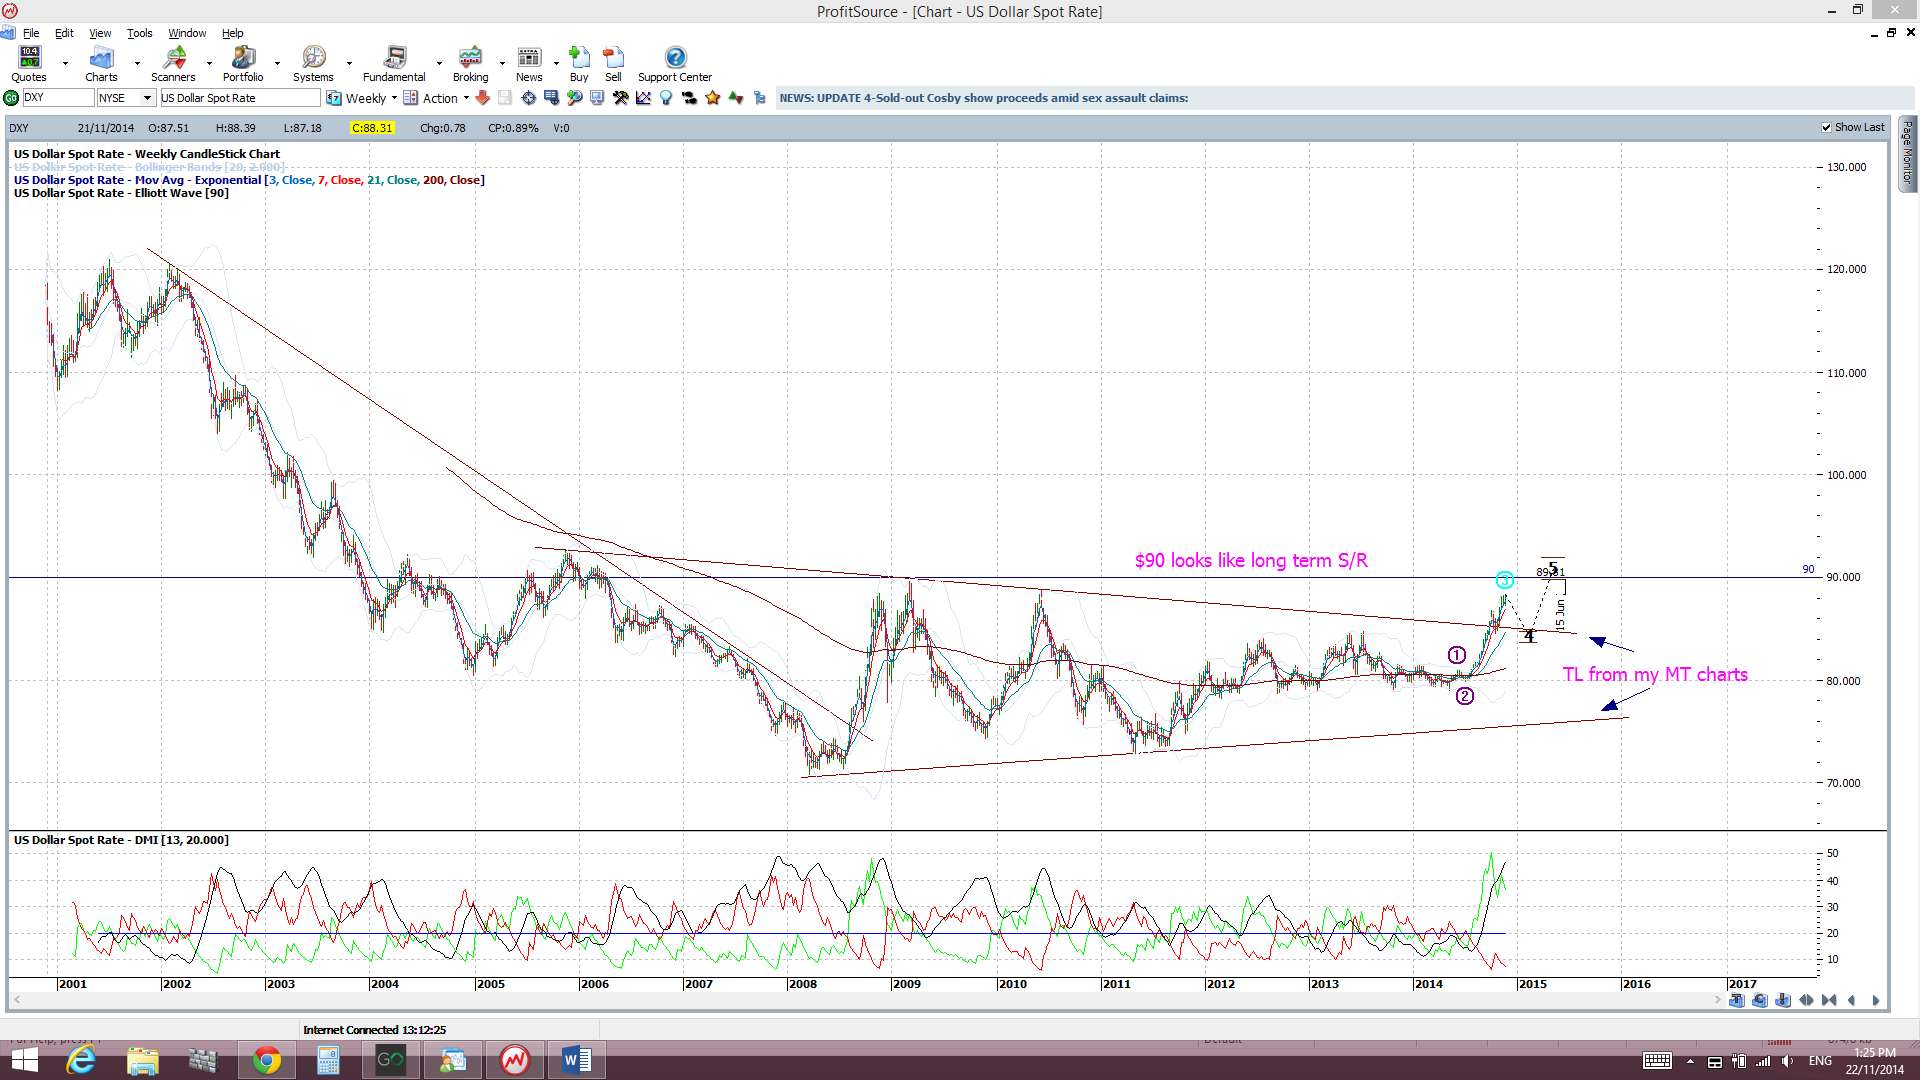
The USDX pushed higher last week but remains below resistance from the 2010 highs. The EURX, although lower following Friday’s ECB QE activity, has held up from last week’s bullish 7 month-trading channel breakout. The long USD trade could pick up momentum again though and, if it breaks up through 90 (chart below), this would have obvious & significant implications for FX pairs. A review of this index can be found through this link.
USD index: note the 90 S/R level:
Thursday is ‘Thanksgiving’ and many US traders take Friday off as well for a long w/e so trading volume might be down towards the end of the week. Friday is also the last day of the trading month so watch for new monthly pivots after that.
I am still expecting Gold and the CHF to be choppy until after the Nov 30 Swiss referendum.
ECB and CNY stimulus measures on Friday gave stock markets quite a boost. Any continued momentum here could see a few global stock indices punch through key resistance and make for a bullish breakout. A review of some of these indices can be found through this link. Traders need to watch to see if this bullish sentiment continues across stocks and, then, whether it flows across into the FX market. These stimulus measures were initiated out of growth concern but the net result is often optimism and this generally triggers bullish sentiment. This is where it becomes important to trade what you see and not what you think! Many doubt a sustained stock rally here but, in a low interest rate environment, the yield on some stocks can look mighty attractive.
Events in the Ukraine and the Middle East, as well as with Ebola, continue to have the potential to undermine any developing ‘risk’ appetite and need to be monitored.
Stocks and broader market sentiment:
Stocks enjoyed another positive week with the S&P500 and DJIA closing at new highs and the NASDAQ flirting on Friday with the key 4,800 resistance breakout level. The S&P500, DJIA and NASDAQ all printed bullish weekly candles but the Russell 2000 printed another Doji candle but this time it was bullish coloured. The Russell 2000 ‘small caps’ index continues to hold up and out from a ‘Bull Flag’ breakout and the NASDAQ continues making decent gains under major resistance. I’m especially focused on the NASDAQ as it looks like it could attempt a bullish triangle breakout in the near future.
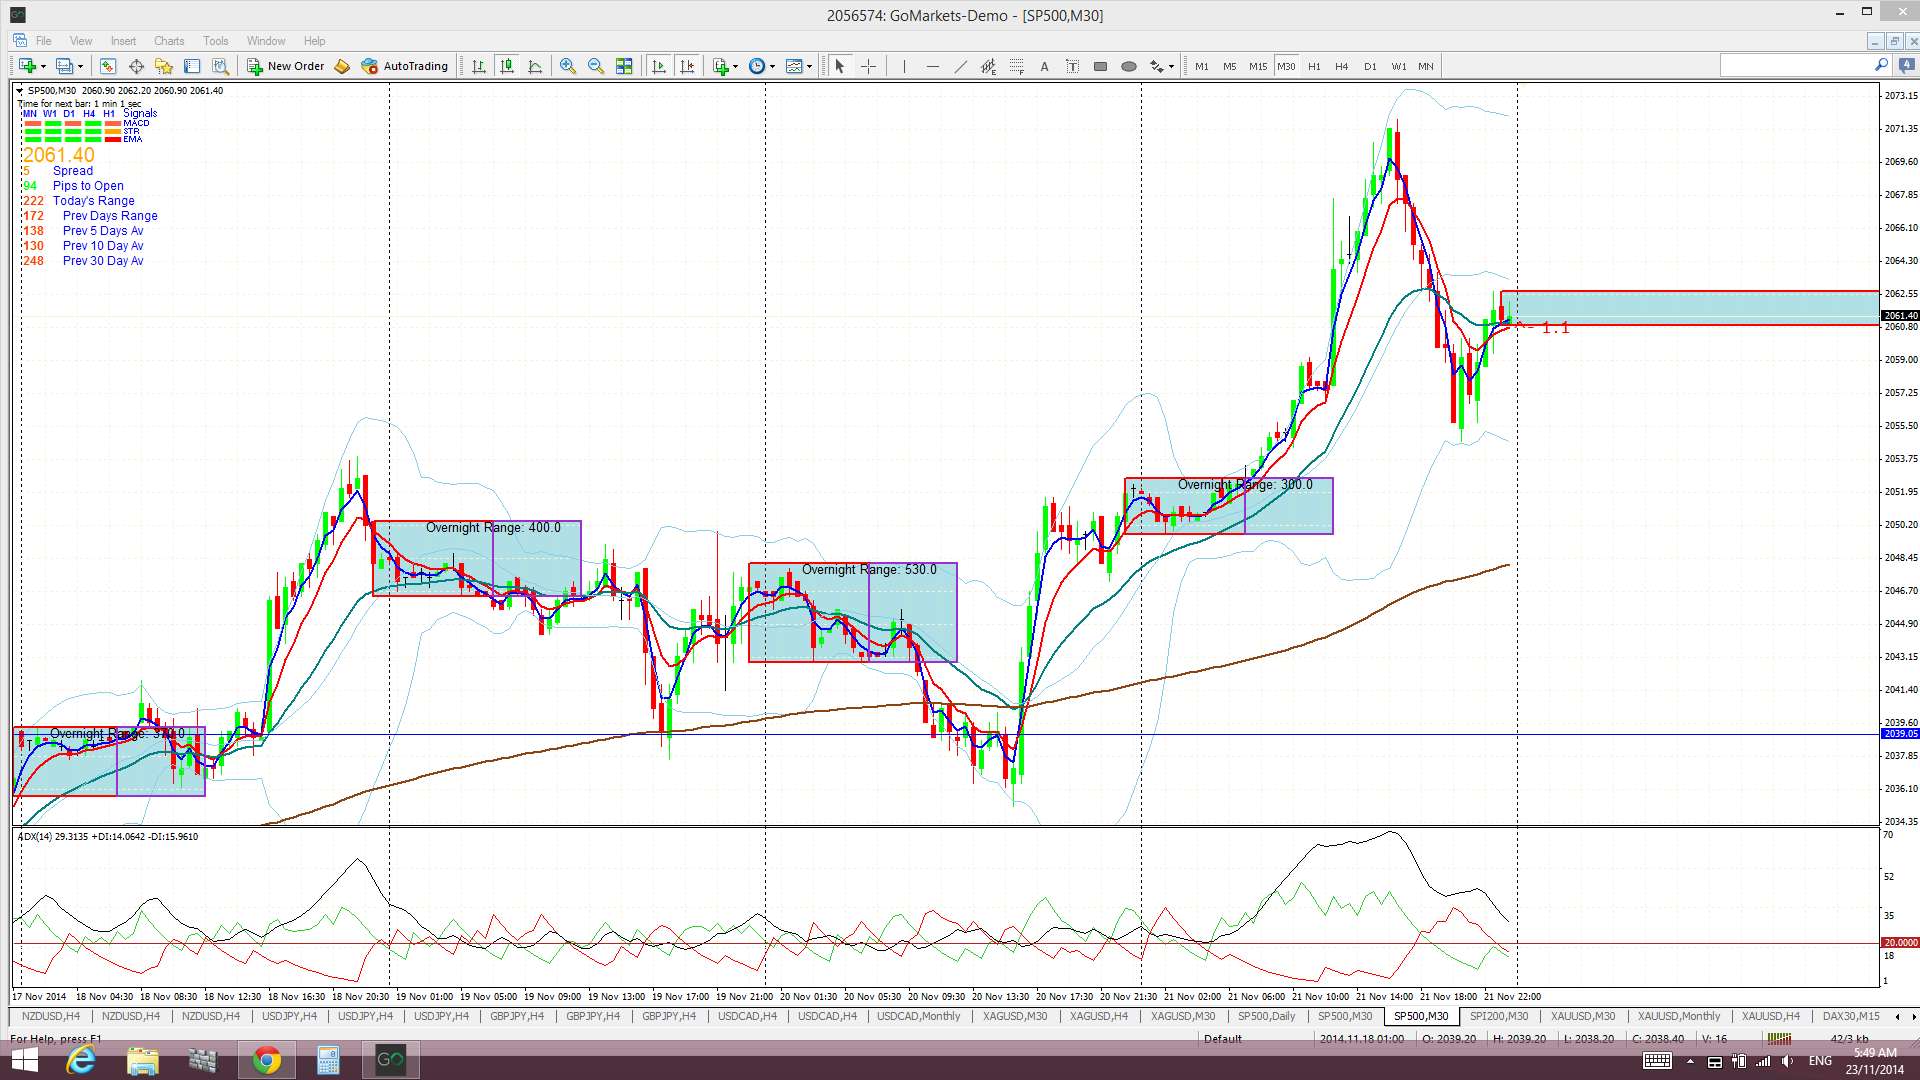
Stimulus activity on Friday by China and the ECB helped to boost stocks on Friday. The S&P500 pulled back from its high of the session but the buying into the close was key here. This does not look like a nervous market with topping action at the moment:
S&P500: note buying into the close:
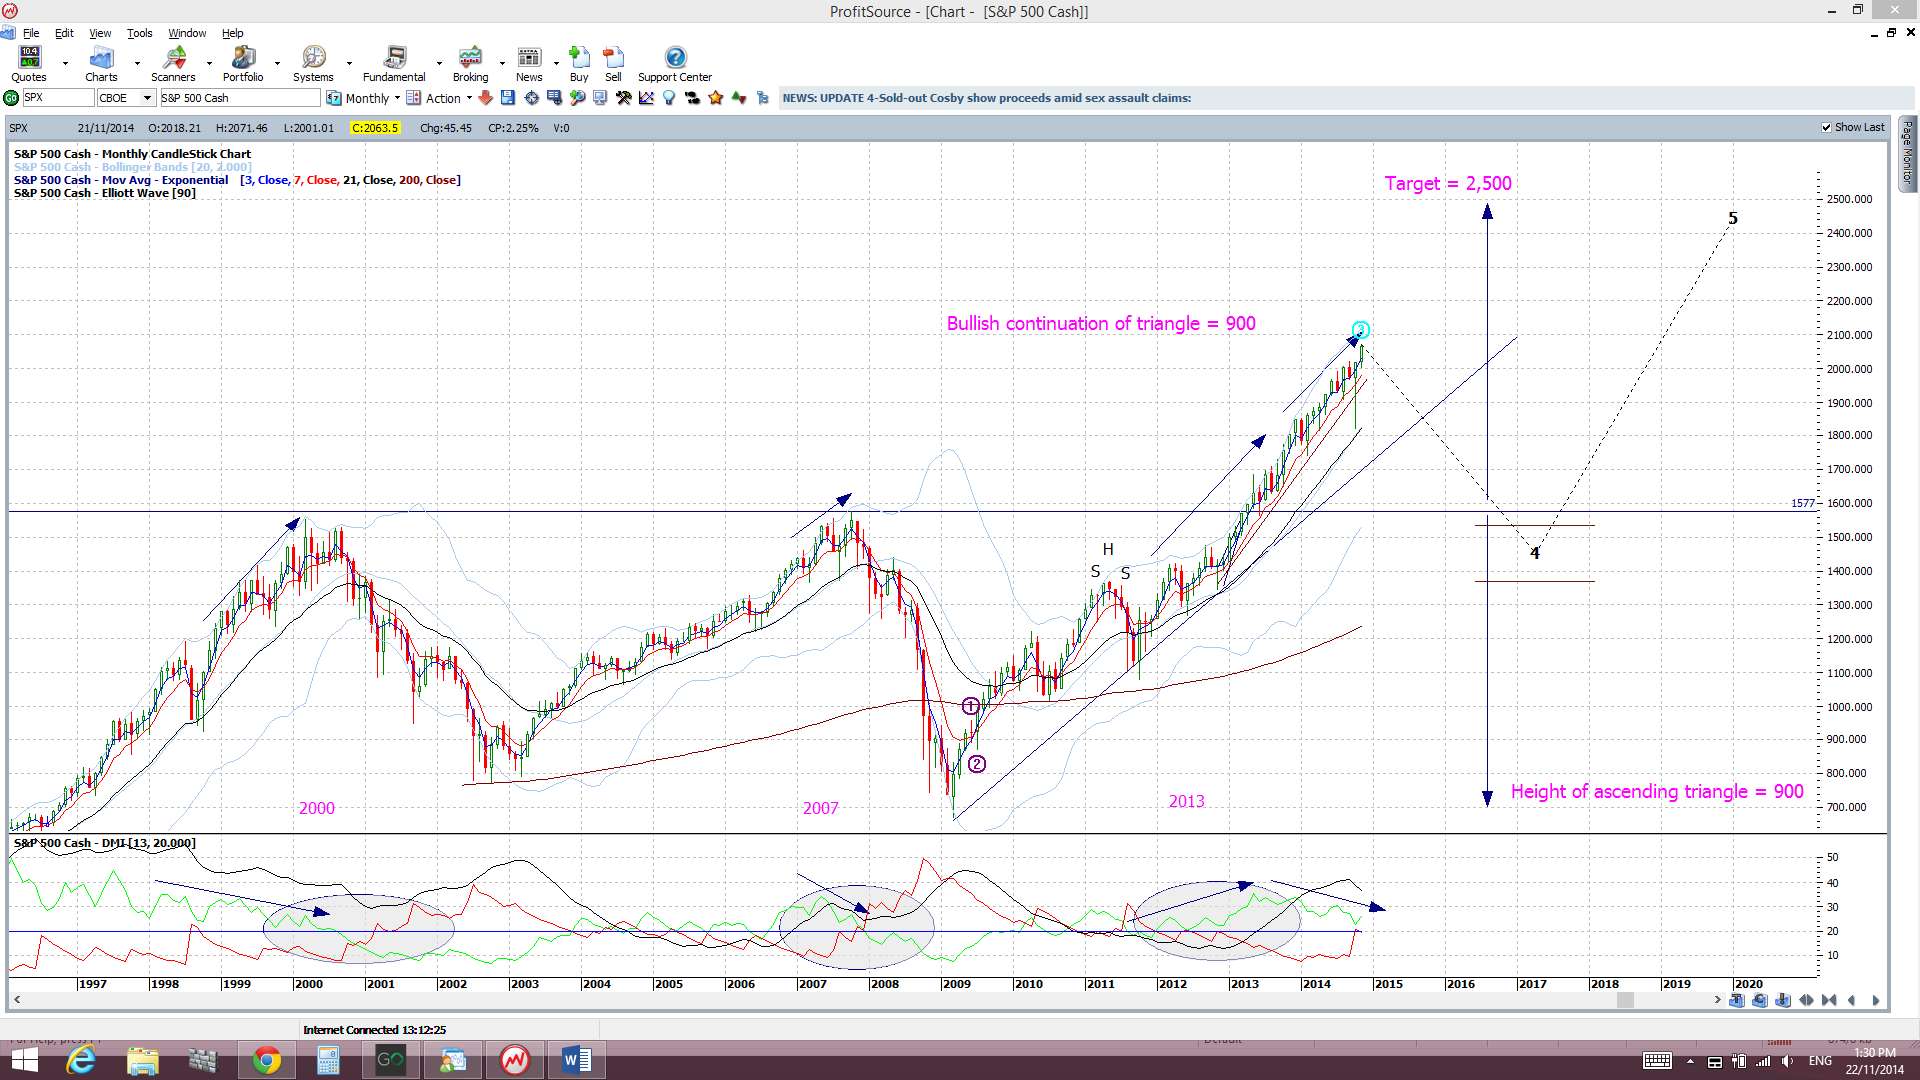
I am still seeing divergence on the monthly S&P500 monthly chart though and whilst this might just be warning of a pause, as the index navigates these new highs up circa 2000, the chance of a pullback cannot be ruled out either. There has not been any real deep pull back since the break up through the 1,577, 1,600, 1,700 and 1,800 levels and the major break of the 1,577 level was only tested once.
Thus, with all of this, I continue to watch out for further clues as to any new momentum move, long or short though! In particular I’m looking out for:
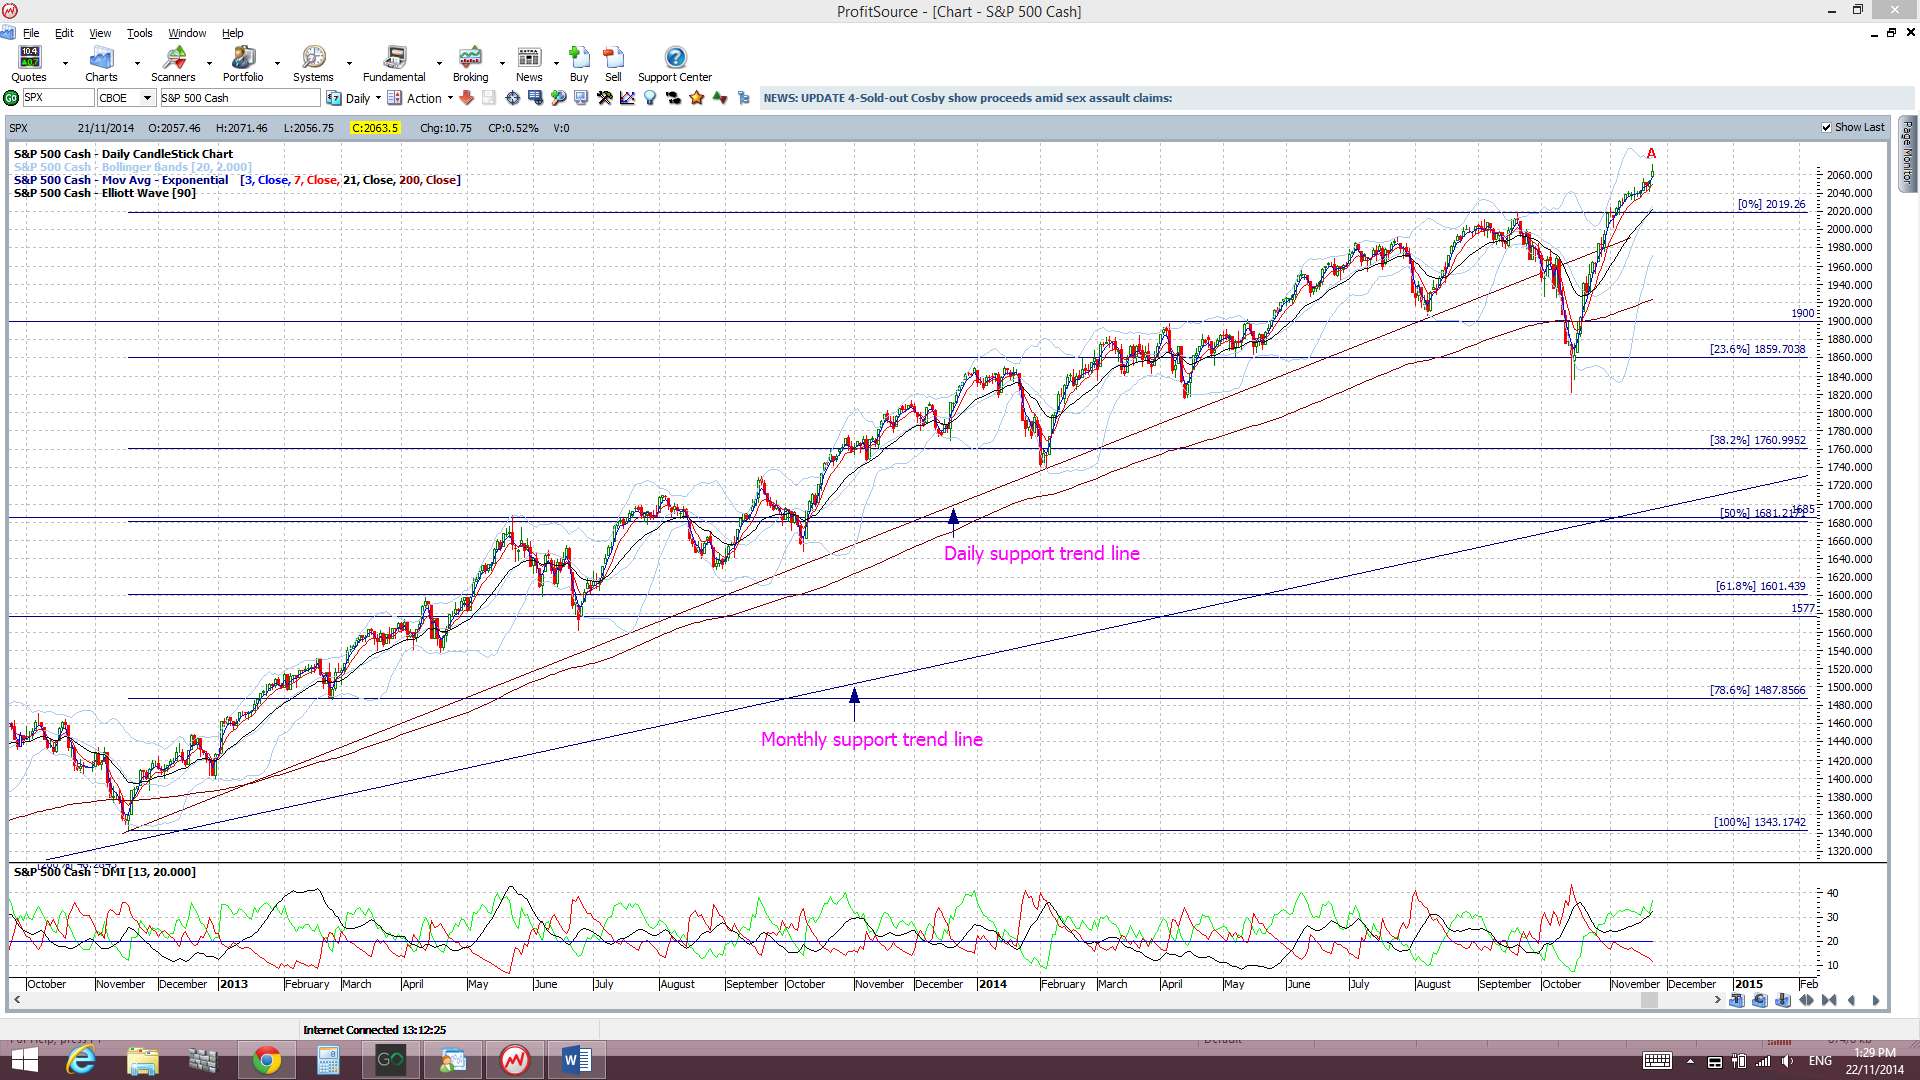
S&P500 daily chart: The index is back above the previous daily trend line and still above the key 2,000 level. I would not be surprised to see the 2,000 level tested at some stage though.
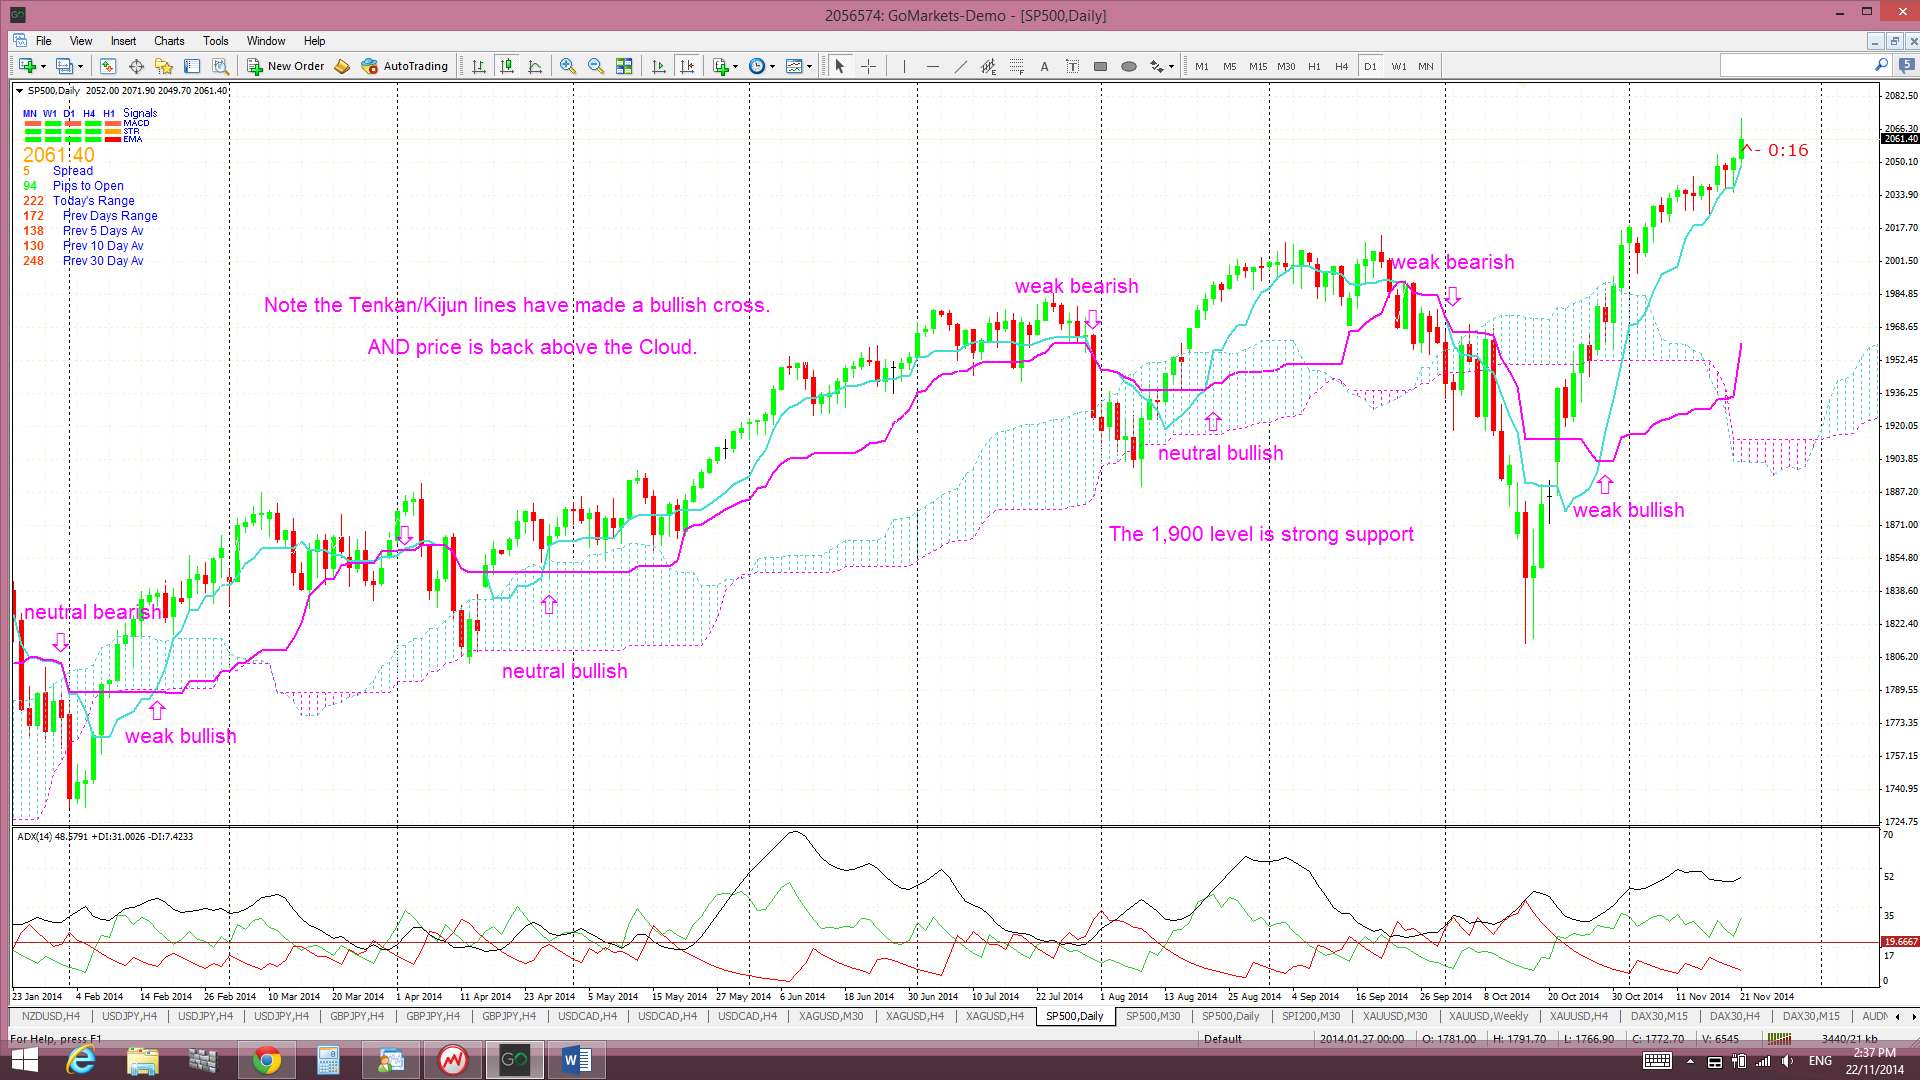
Ichimoku S&P500 chart: a clear cross of the blue Tenkan-sen line below the pink Kijun-sen line. There has been a recent bullish Tenkan/Kijun cross and price is trading above the Cloud.
S&P500 monthly chart: a break of the monthly support trend line (see monthly chart). The monthly trend line remains intact.
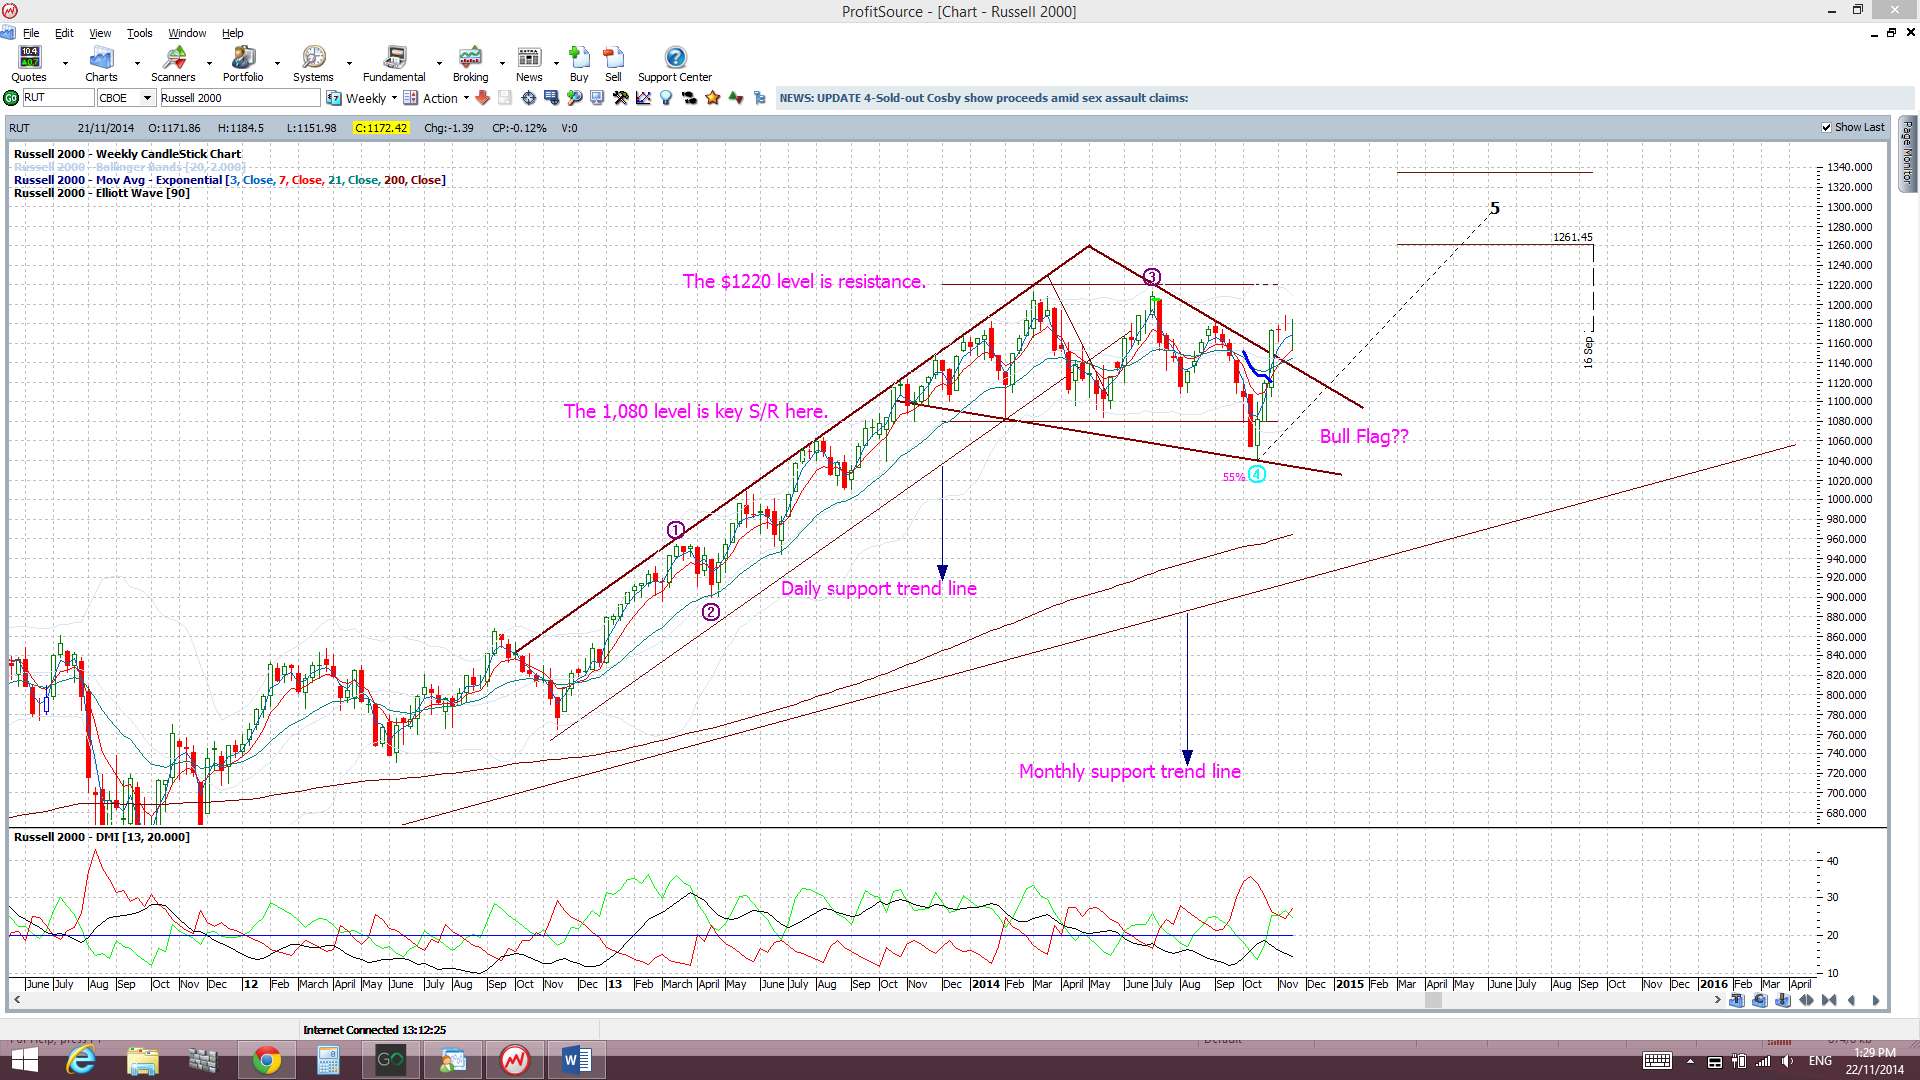
Russell 2000 Index: this small caps index is a bit of a US market ‘bellwether’ and I see the 1,080 level as key support here. The index has held up and out from a ‘Bull Flag’ breakout:
VIX Index: this recently broke up and out of a descending triangle pattern but is back below the broken trend line and the 14 level.

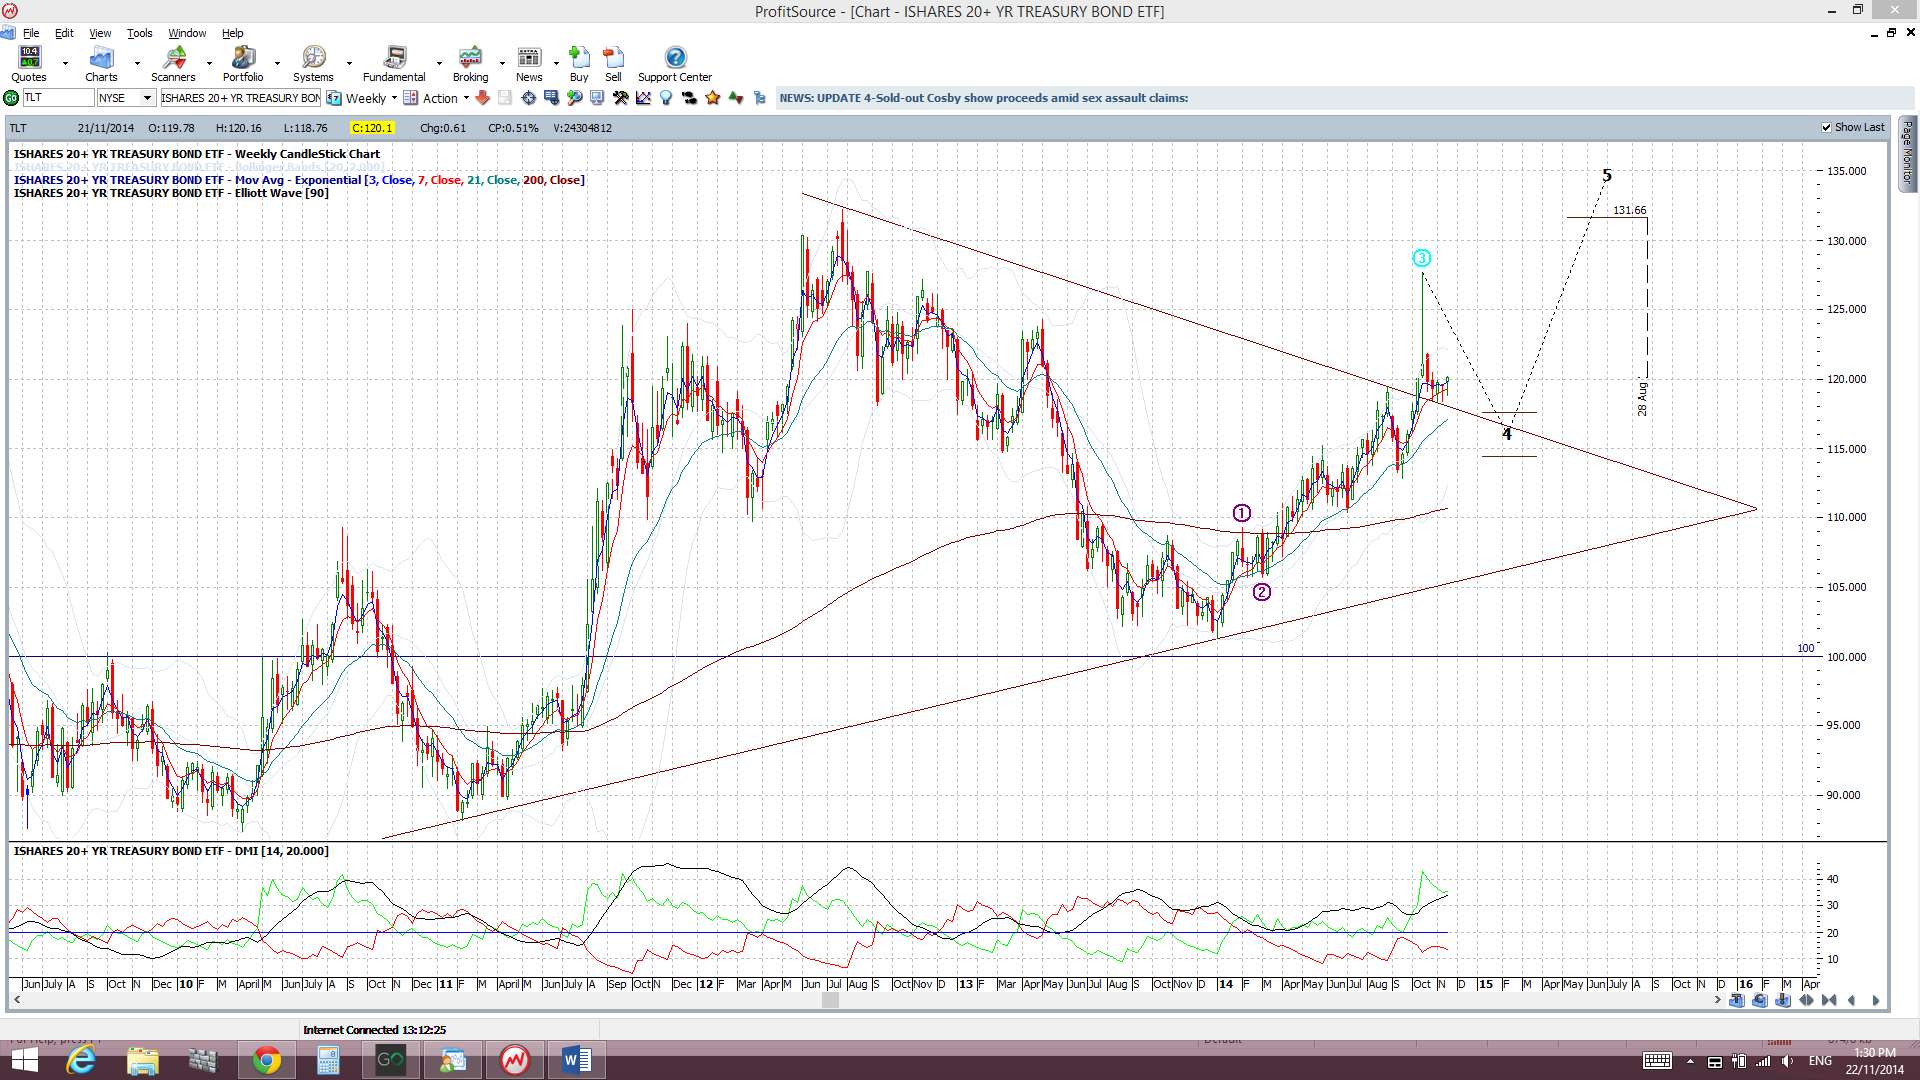
Bonds: The bond ETF remains above the triangle breakout:
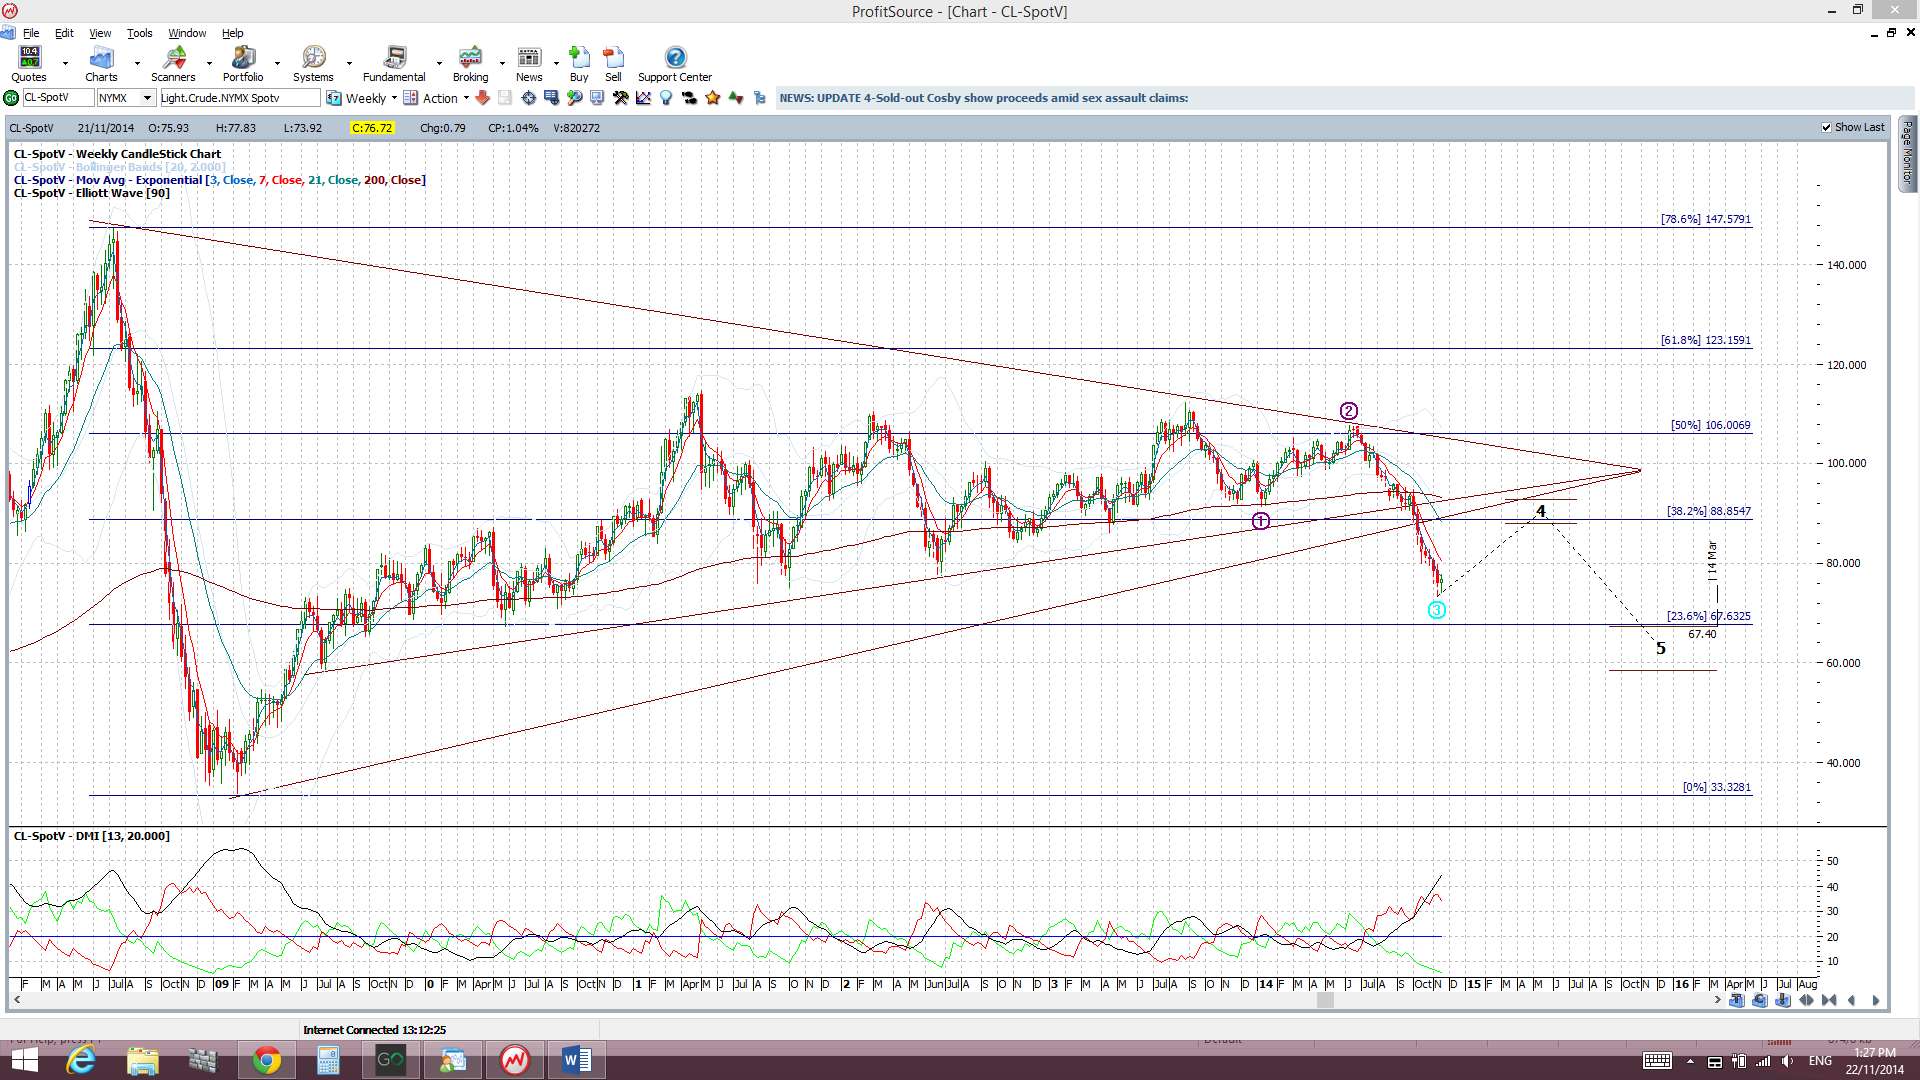
Oil: Oil has closed below key $80 support level again BUT it printed the first bullish candle, albeit a ‘spinning top’, for seven weeks. There have only been three bullish candles out of the last 17! BTW: Thursday was the most bullish of days with Wednesday and Friday being only small bullish days and, thus, Friday’s CNY rate cut news can’t take all the credit here. Any new USD weakness may help to lift commodity prices:
Trading Calendar Items to watch out for:
- Mon 24th: JPY Bank Holiday. EUR German Ifo Business Climate.
- Tue 25th: BoJ Gov Kuroda speaks x 2. CAD Core Retail Sales. USD Prelim GDP & CB Consumer Confidence.
- Wed 26th: GBP Second Estimates GDP. USD Core Durable Goods, Unemployment Claims & New Home Sales.
- Thurs 27th: USD Thanksgiving Holiday. NZD Trade Balance. AUD Private Capital Expenditure. EUR German Prelim CPI.
- Fri 28th: NZD ANZ Business Confidence. EUR CPI Flash Estimates. CAD GDP.
Forex:
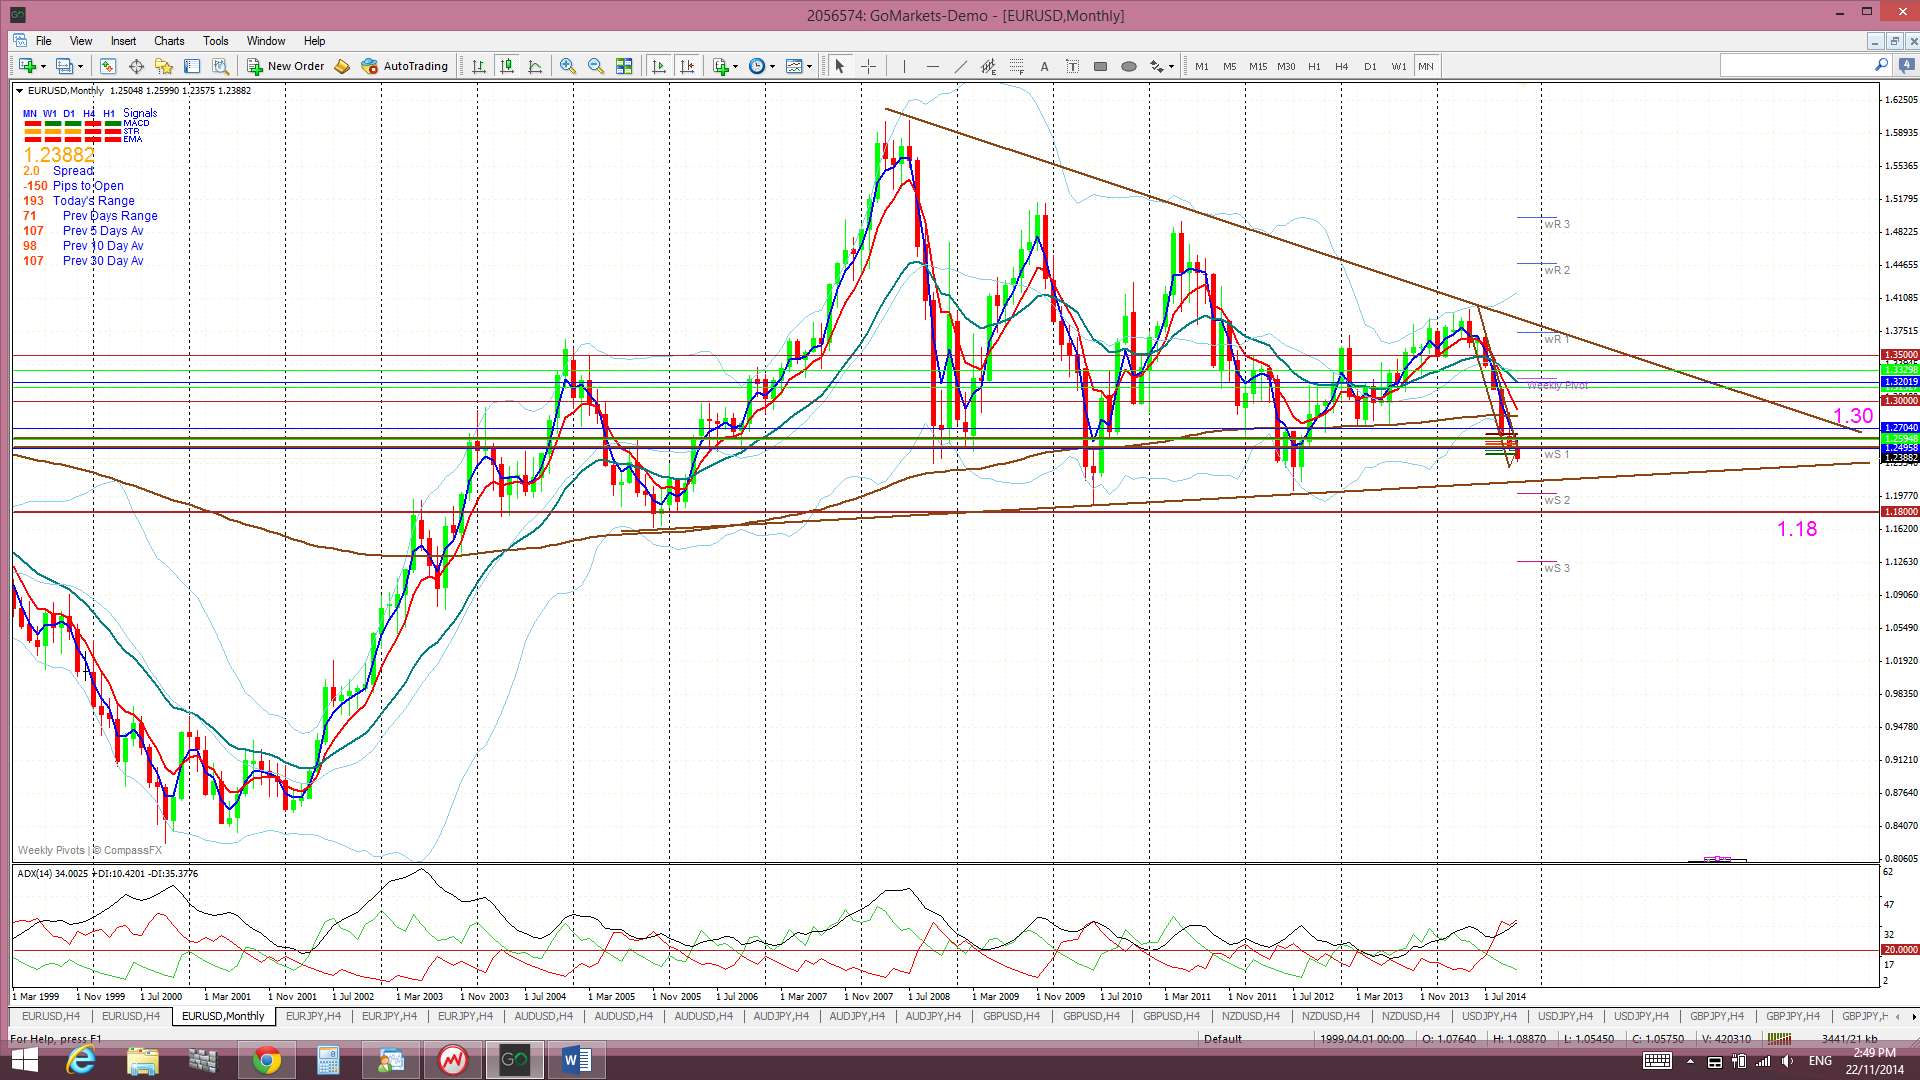
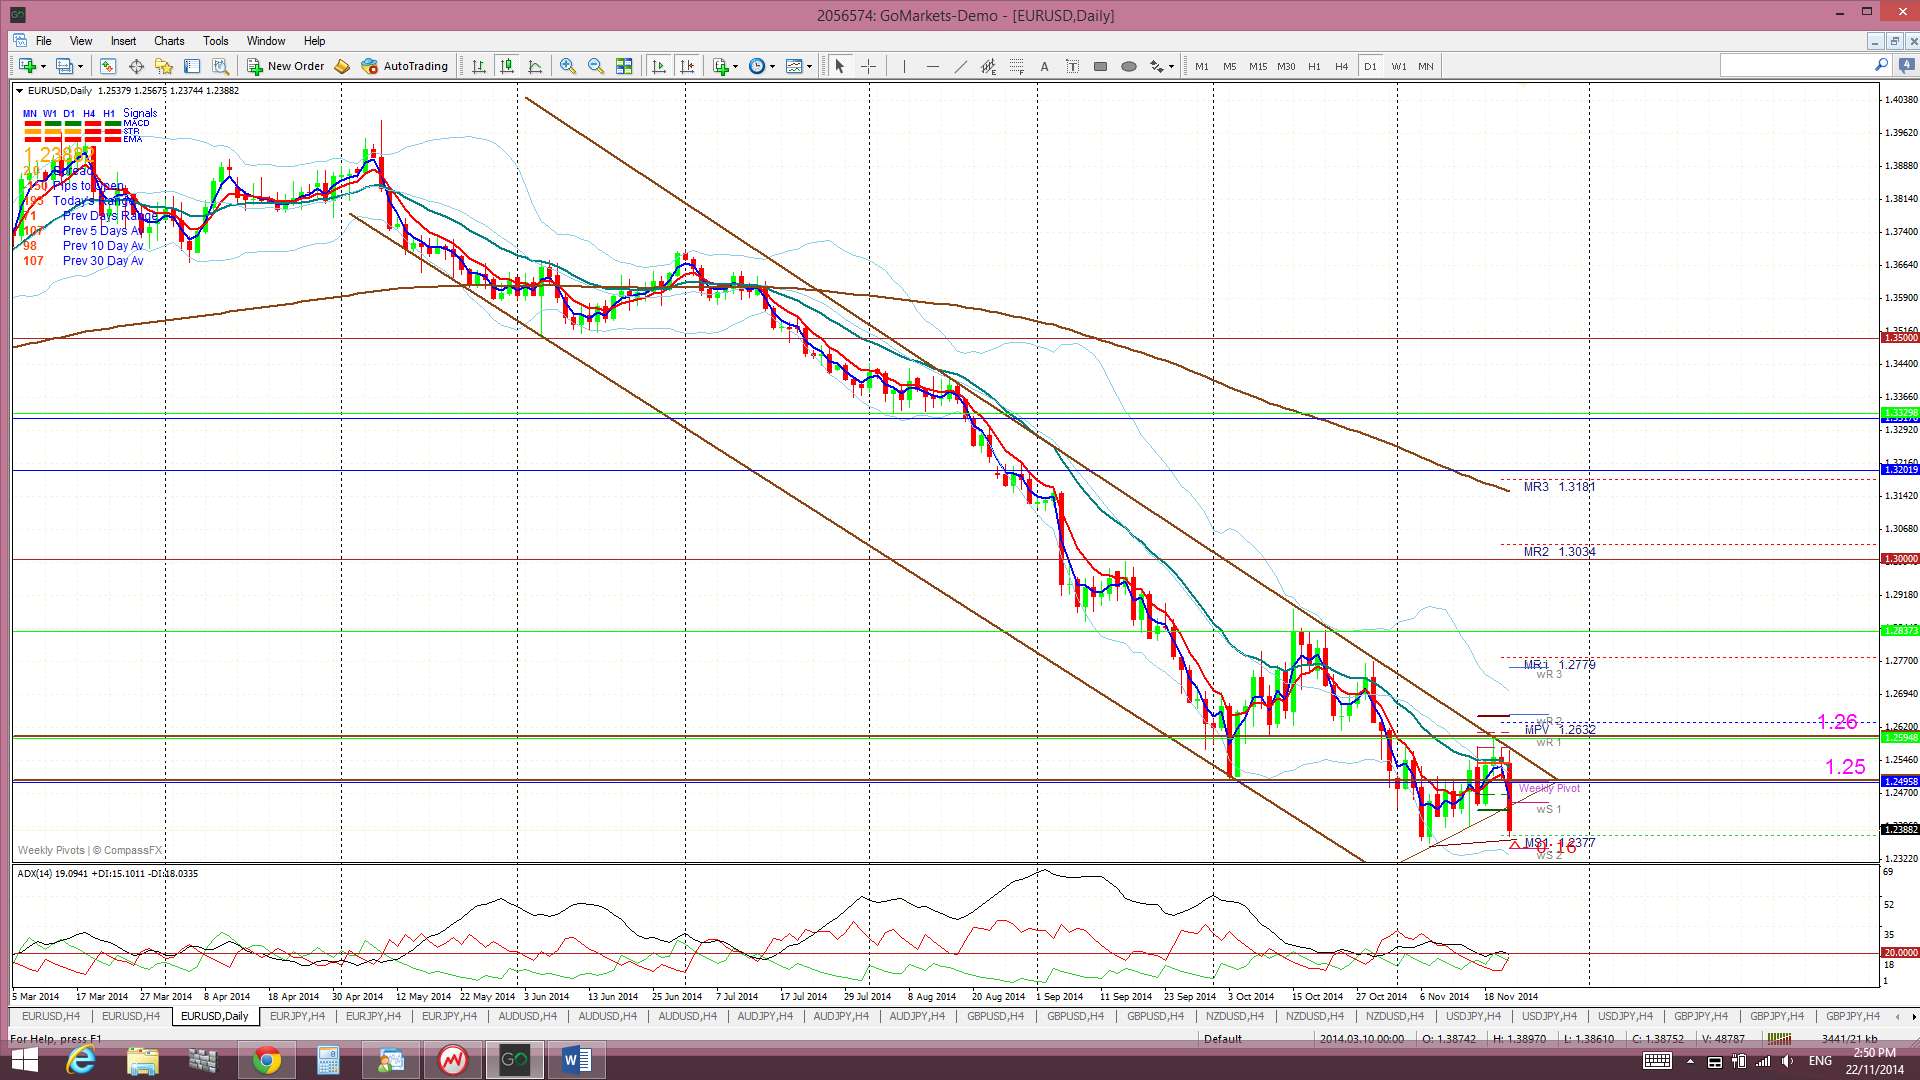
E/U: The E/U became increasingly squeezed into the apex of a triangle formed by a 7 month-duration bear trend line and recent daily support. Friday’s jawboning by ECB President Draghi weakened the E/U and it fell to break down through the triangle trend line and, then, further down to test recent lows in a move that also triggered a new TC signal.
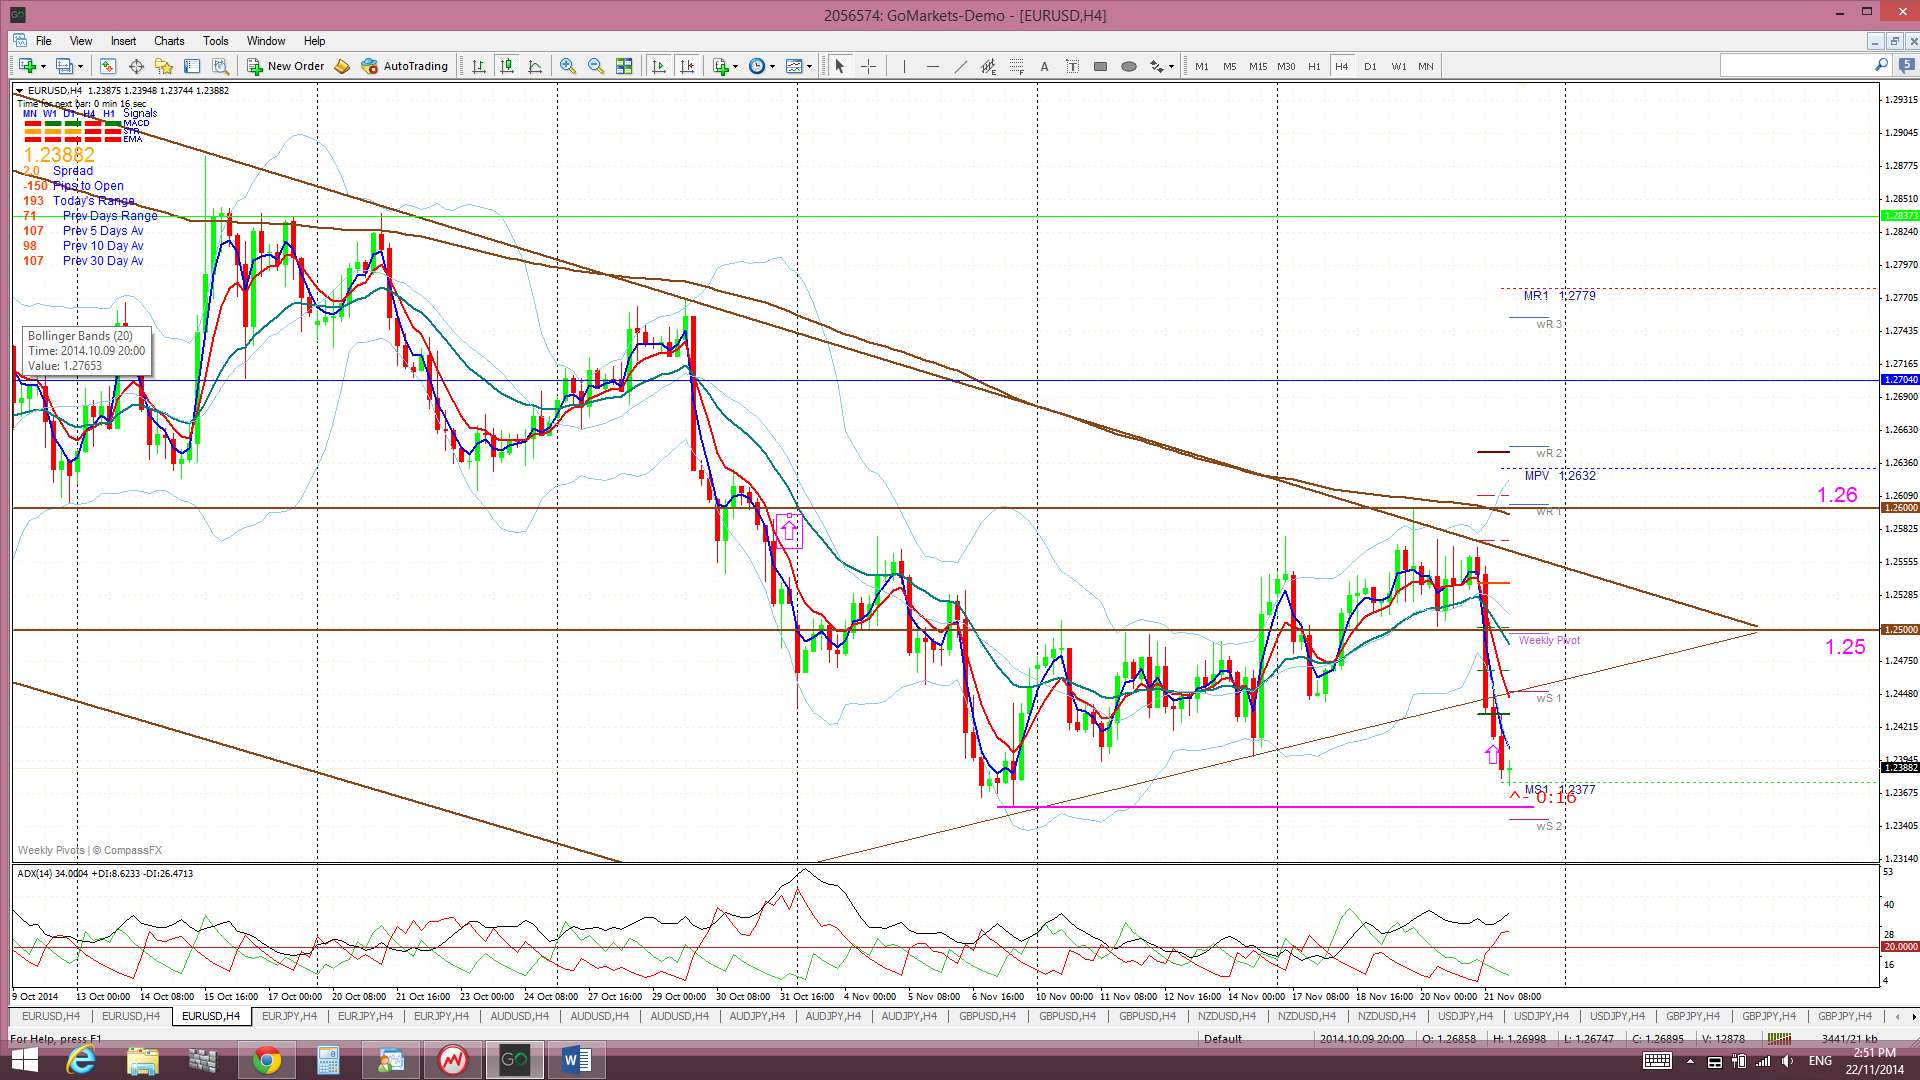
The daily chart had been looking ‘Bear Flag’ like for some weeks but the recent choppiness undermined this pattern and I now see the E/U forming up in more of a descending trading channel. This channel, however, is set within a bearish descending triangle pattern on the larger-scale monthly chart. Any move back below recent lows on the 4hr chart would have me chasing this new 4hr TC signal down to this triangle trend line near 1.18.
Descending triangle on the monthly chart: the descending triangle pattern is a bearish continuation pattern and has a base at around the 1.18 level. The height of this triangle is about 4,000 pips. Technical theory would suggest that any bearish breakdown of this triangle below 1.18 might see a similar move. It is worth noting that this would bring the E/U down near 0.80 and to levels not seen since 2000/2001!
Price is now back trading below the Ichimoku Cloud on the 4hr, daily, weekly and monthly charts which is bearish.
The weekly candle closed as a bearish engulfing candle.
The picture on the E/U sure looks grim BUT I think an element of caution is needed. ECB stimulus measures will undermine the E/U BUT Chinese stimulus measures, especially if there are any more surprise packages announced, could help to boost general market optimism and thus lift this pair. It will come down to which of these two measures provides the dominant market theme.
- There is an new TC signal on this pair BUT I’m waiting for any break of the recent low.

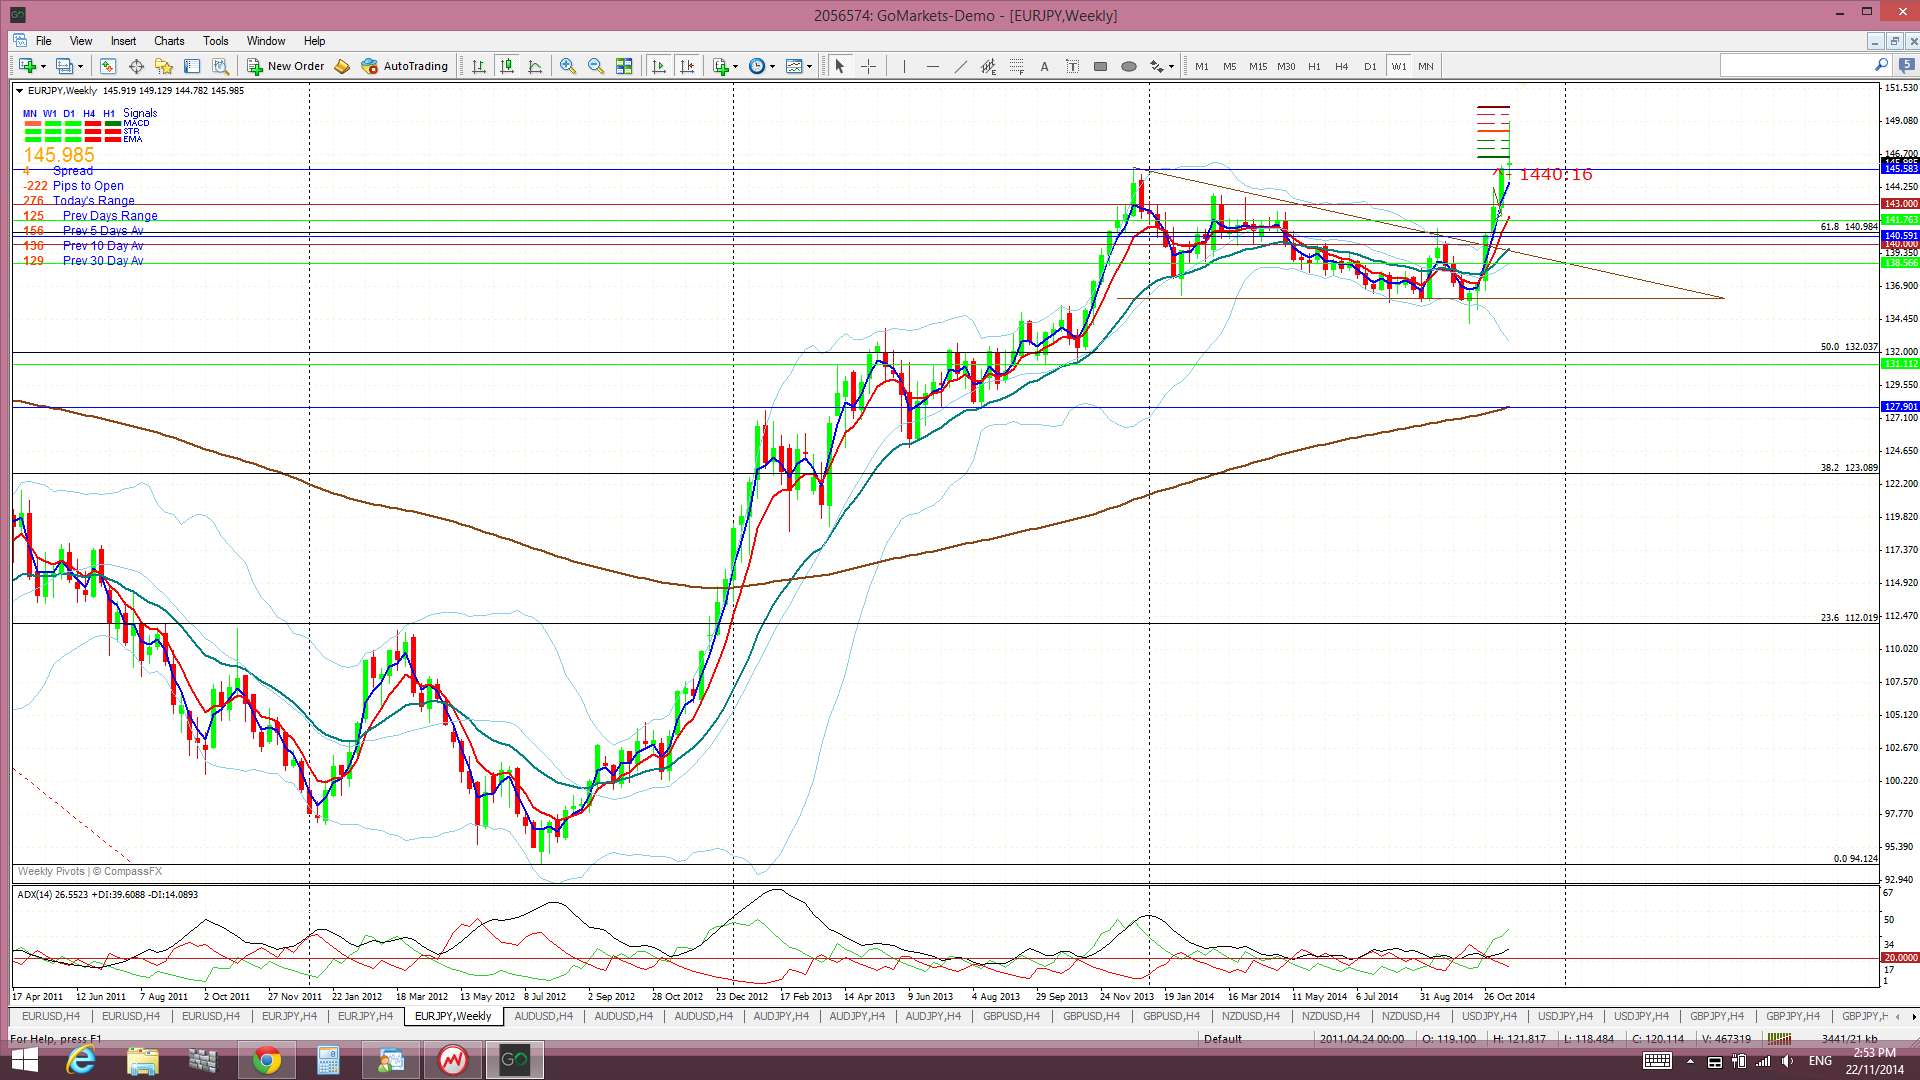
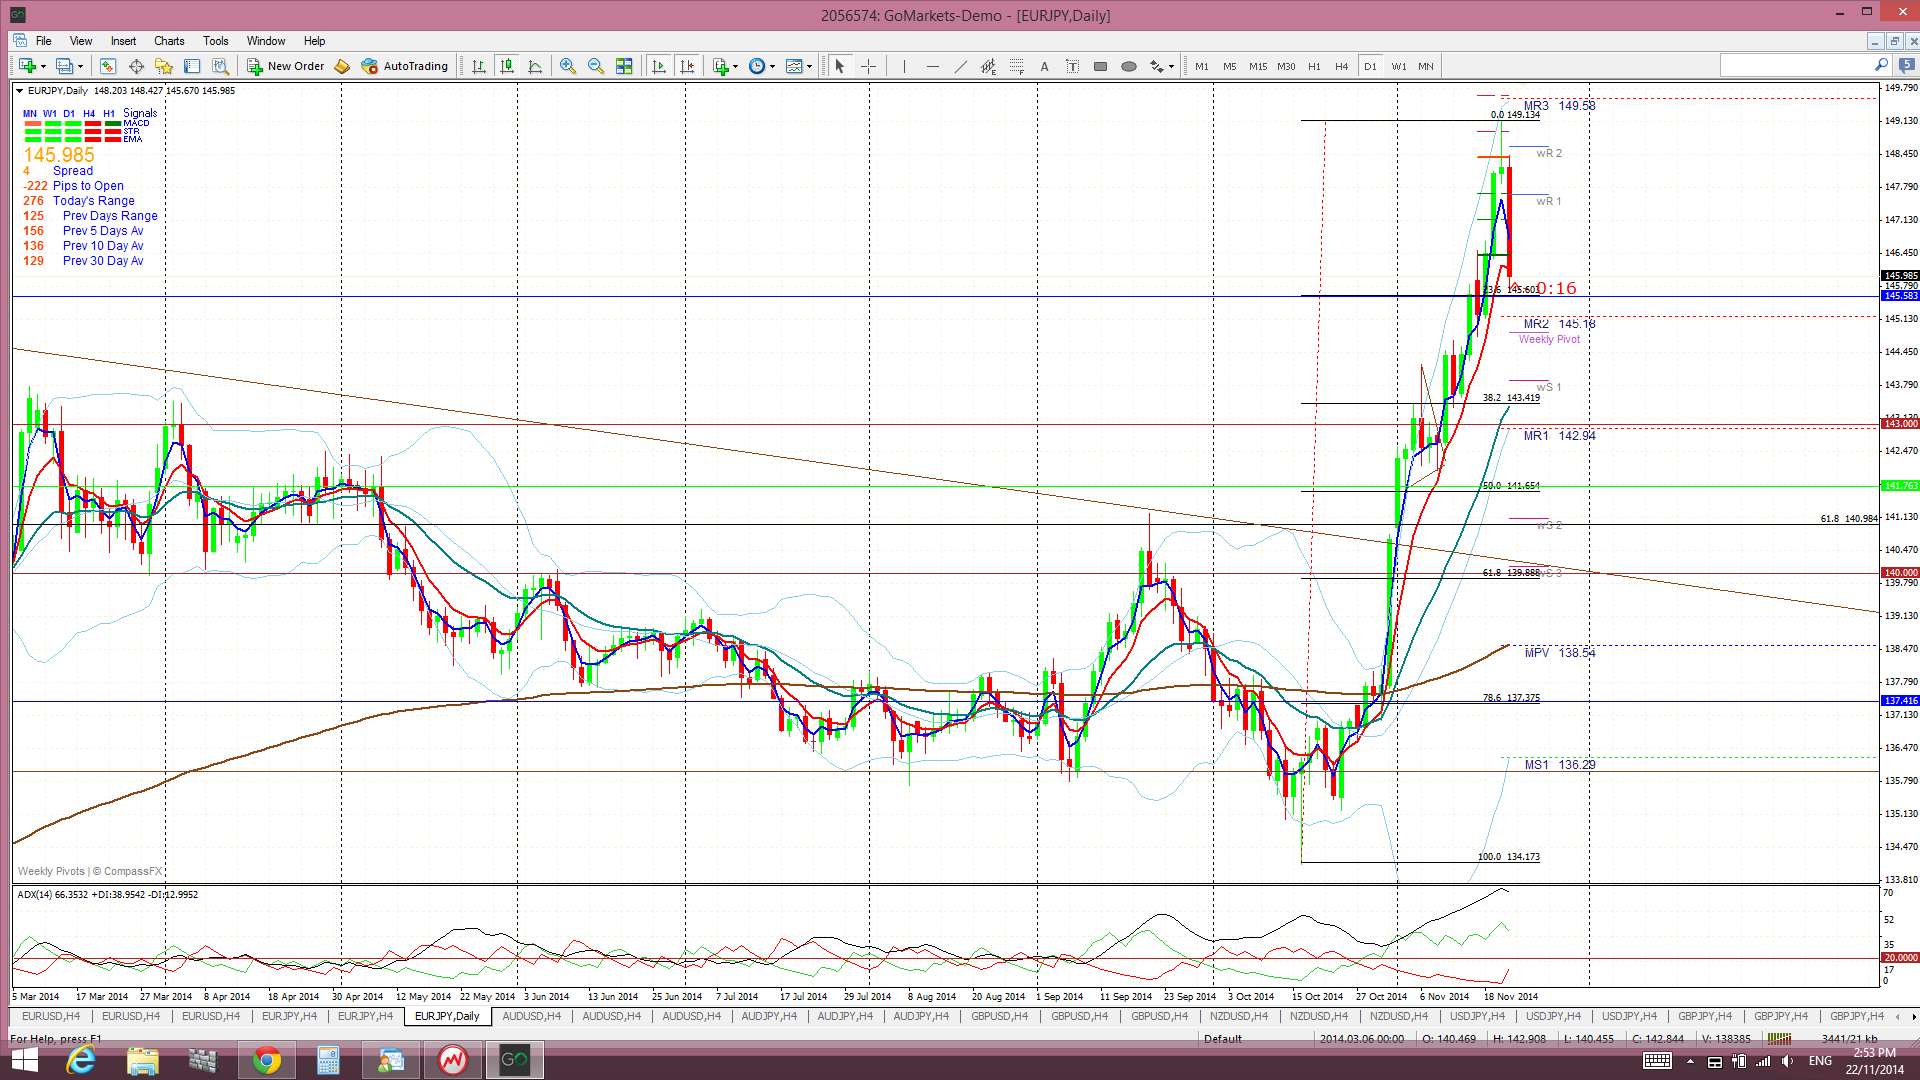
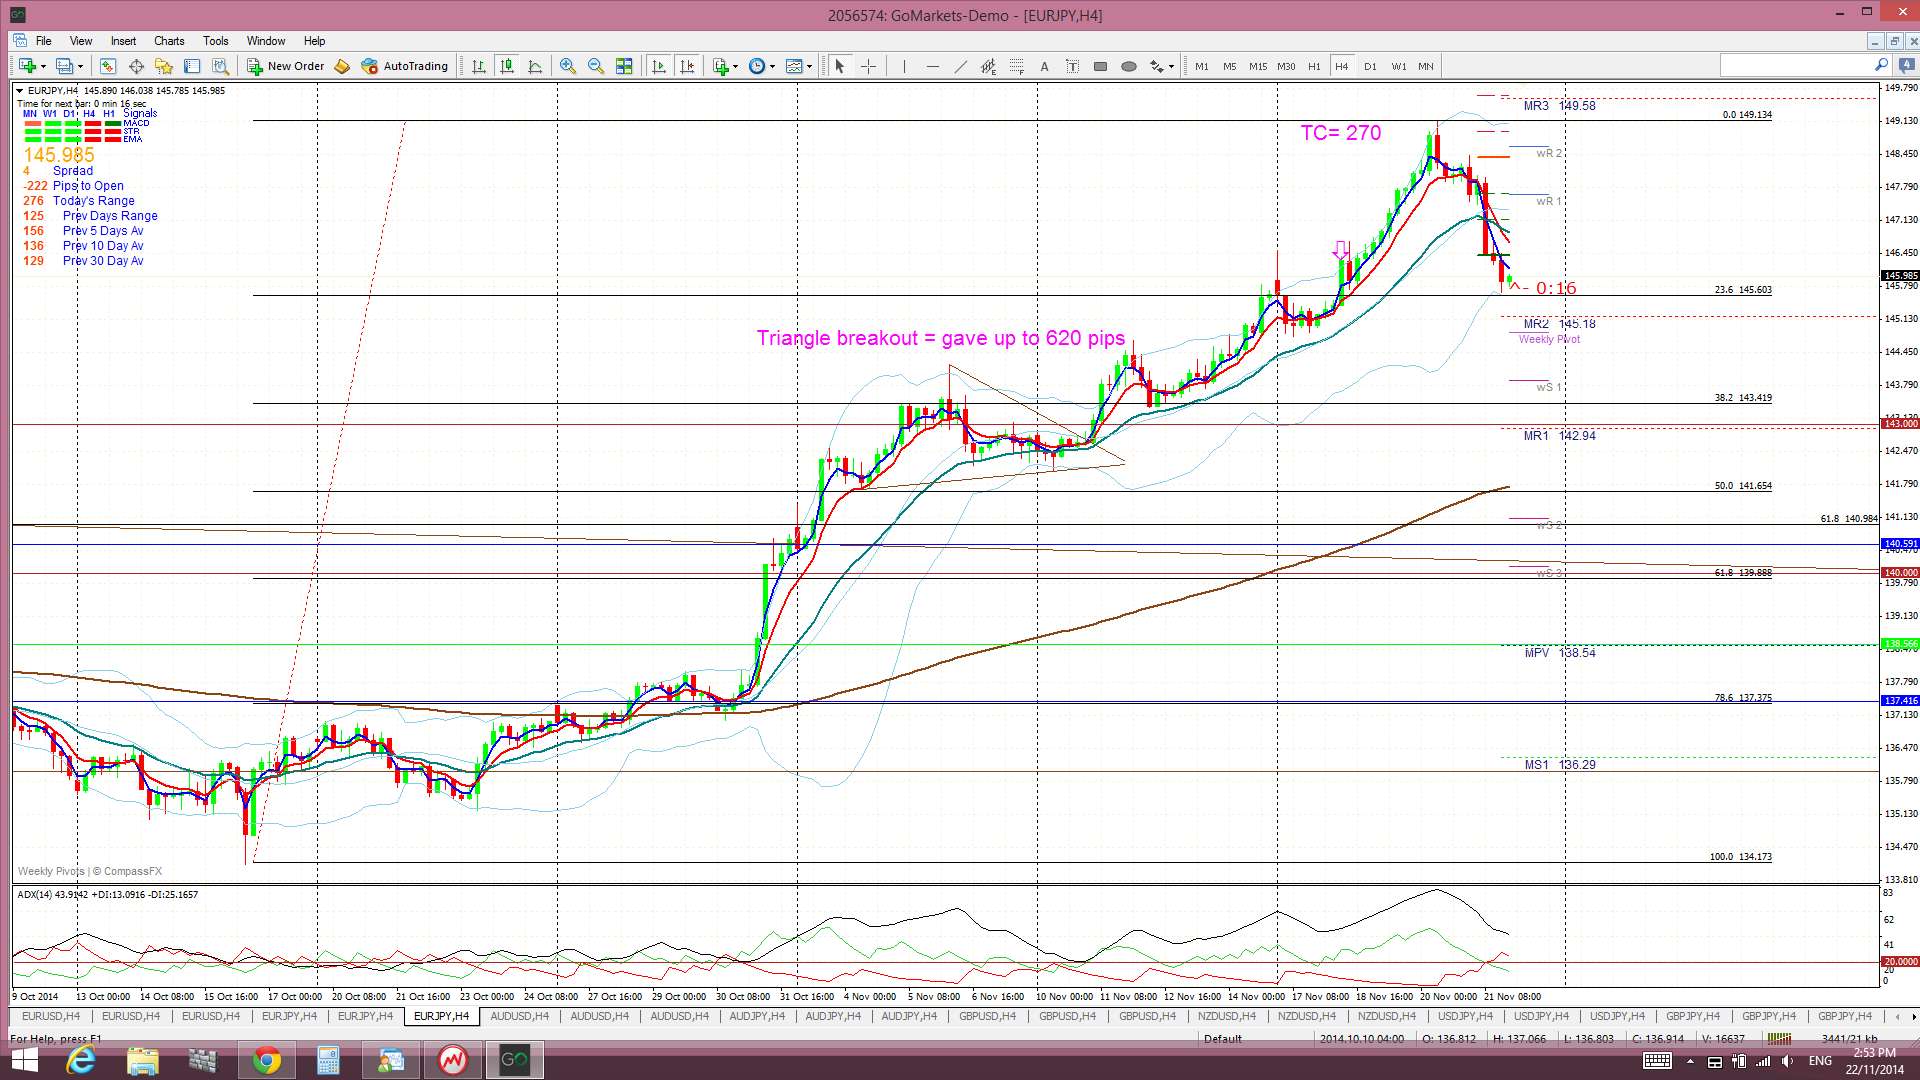
E/J: The previous week’s bullish triangle breakout move ended up giving 620 pips and last week’s new TC signal gave up to 270 pips before closing off. EUR weakness on Friday saw this pair pull back to the 23.8% fib of the recent bull run and, whilst the monthly candle is bullish, the monthly chart has a potential ‘Double Top’ look to it.
I had given up on hope of a pull back here but I may have been a bit premature to do so. The E/J has already pulled back to the 23.8% fib but this bearish move could continue. Further bearish targets could include:
- The 38.2% fib near the key 143 level.
- The 50% fib near the daily 200 EMA circa 141.5.
- The 61.8% fib near the key 140 level. This level is also near the trend line from the previous weekly chart’s triangle breakout and it is near the 61.8% fib of the monthly charts major bear move. Thus, there is a lot of confluence in this region.
Price is still trading above the Cloud on the 4hr, daily, weekly and monthly charts however which is bullish. The November and December candles were the first to close above the resistance of the monthly Ichimoku Cloud since 2008. Check out the monthly Cloud chart below. The E/J made its last break back above the Cloud in 2003 and the consolidation pattern following that breakout is very similar to the consolidation we’re seeing now. Note how, back then, price eventually rallied and I still wonder if history might repeat itself here?

The weekly candle closed as a bullish coloured candle BUT with a bearish-reversal ‘Shooting Star’ look to it.
- I’m watching for any new TC signal on this pair and fib levels as potential pull back targets.

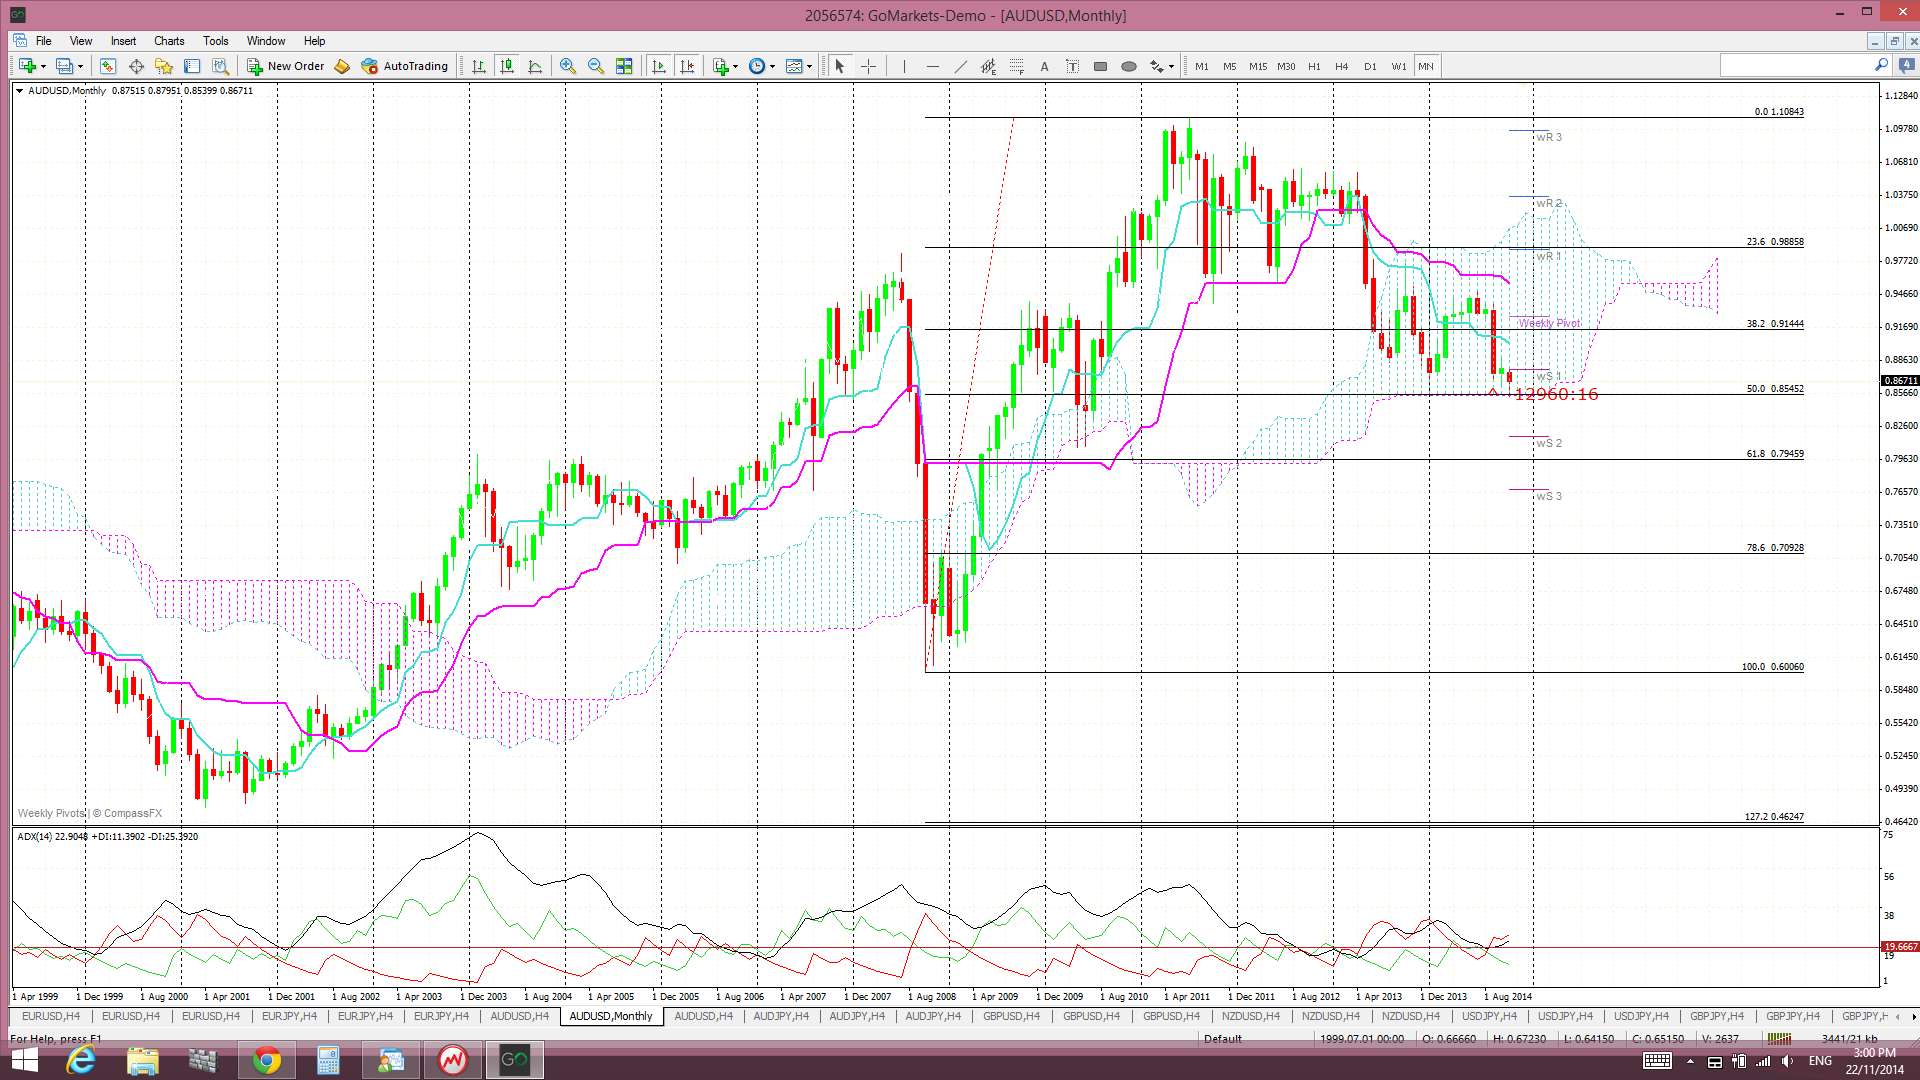
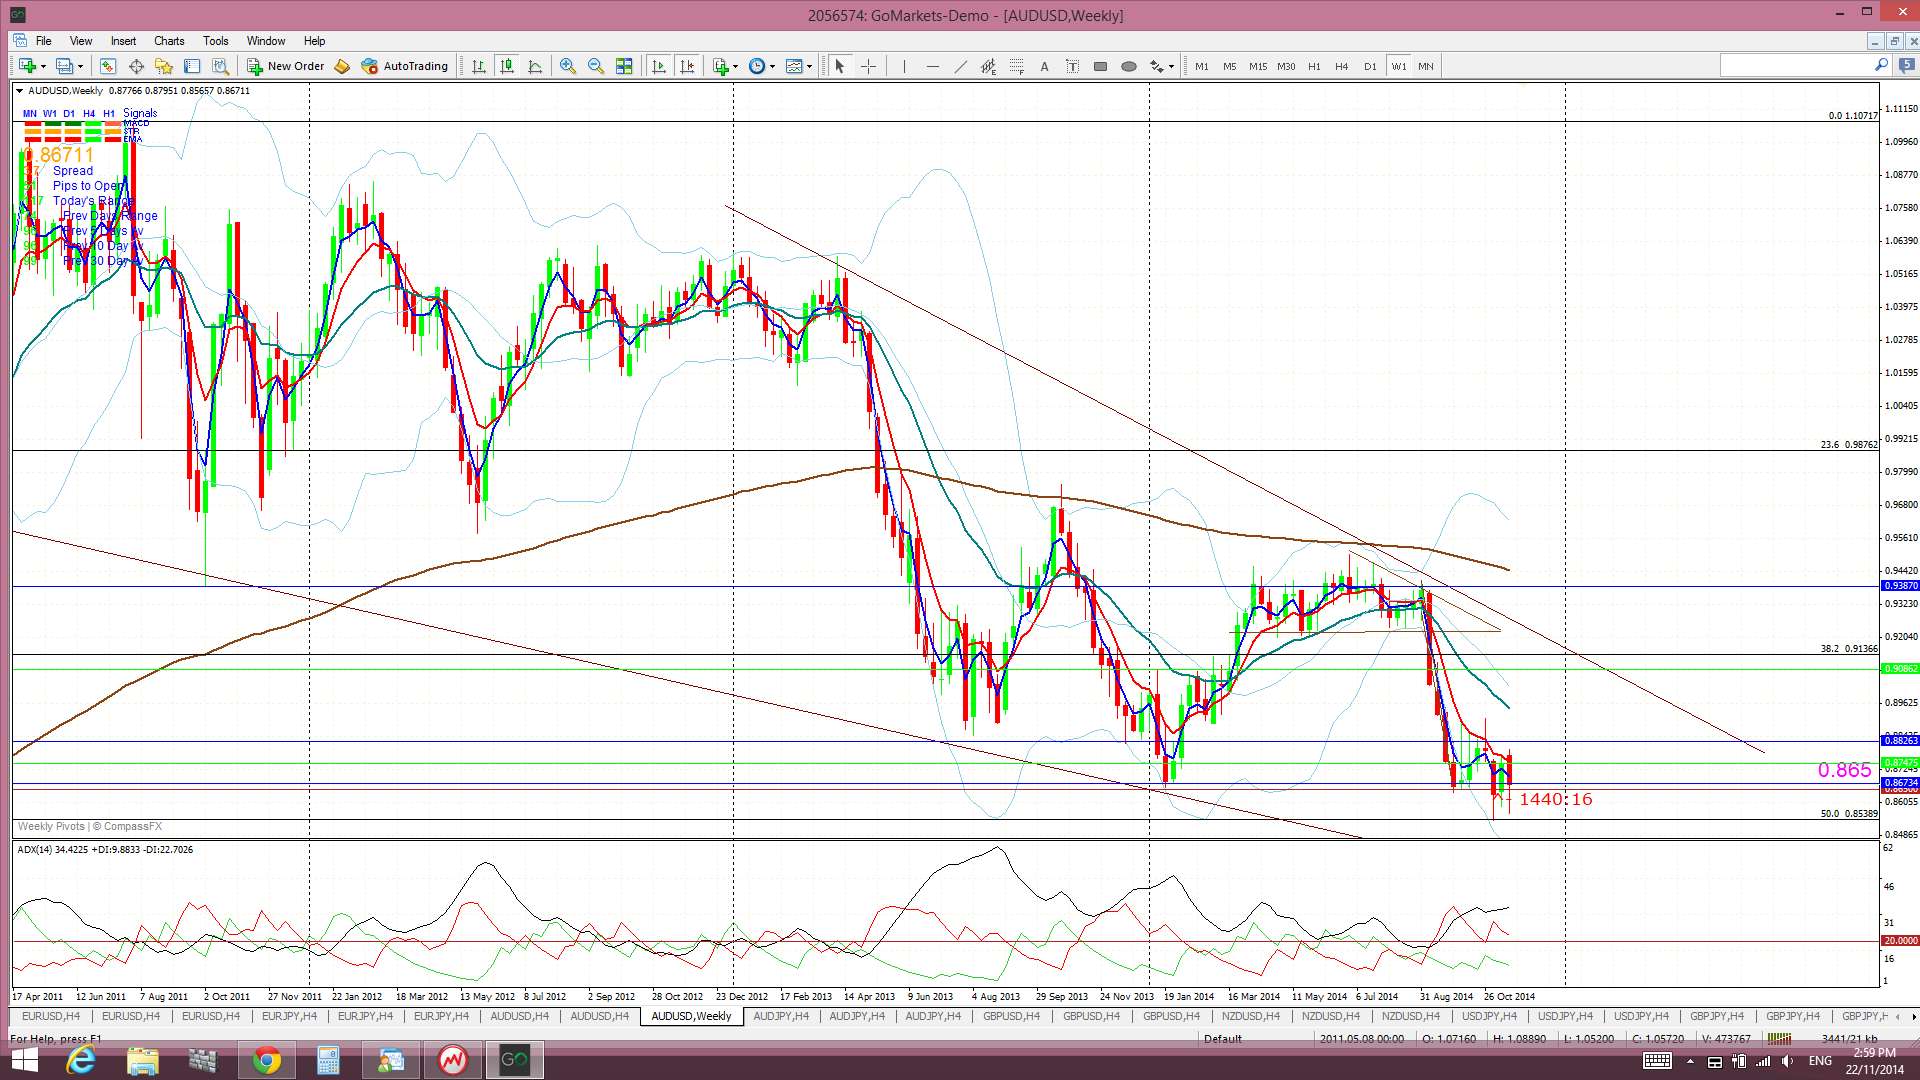
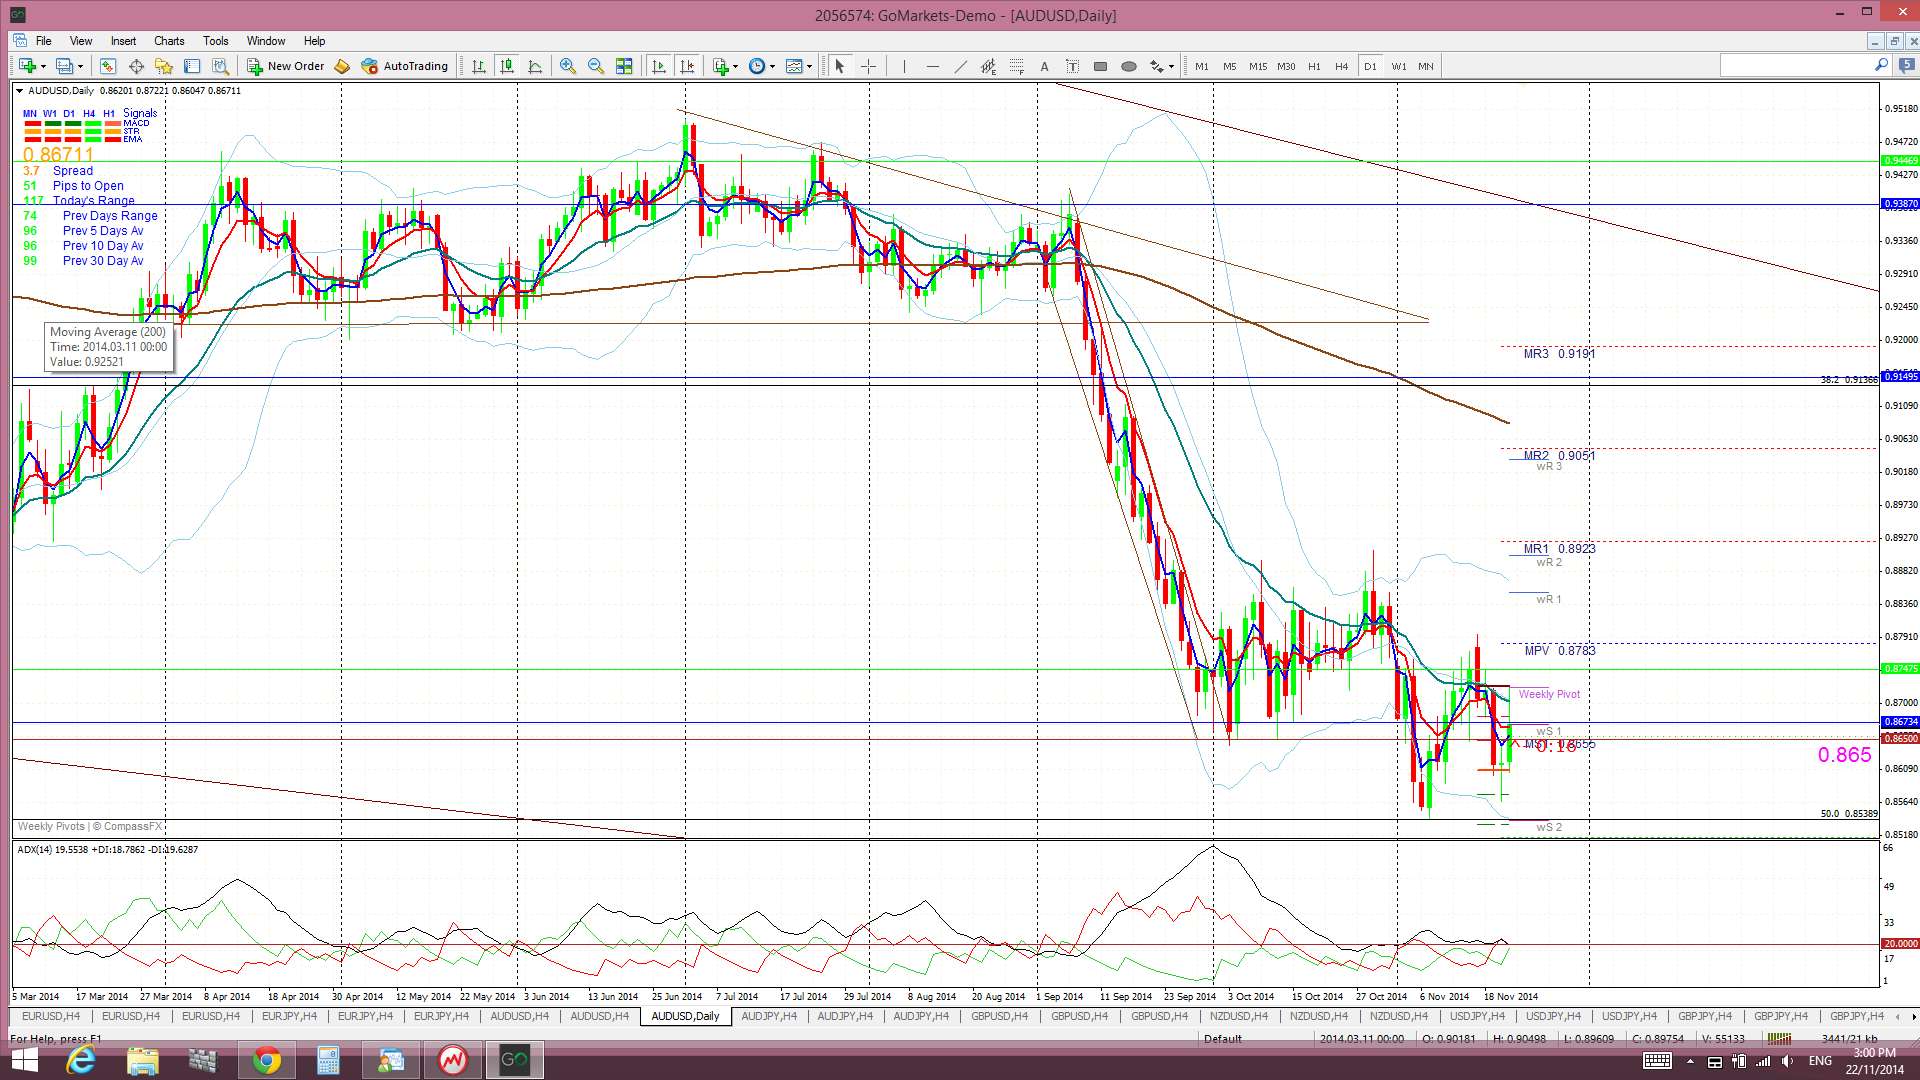
A/U: The A/U chopped lower last week and fell back below key 0.865 support. Some further RBA jawboning and falling Iron Ore prices added to a basket of woes and to bearish AUD sentiment. Friday’s news of a Chinese interest rate cut was viewed positively for the AUD though and this resulted in the pair rallying back above the 0.865. It is worth noting that there are two other levels offering strong support just under this 0.865: the 50% fib of the 2008-2011 bull run and the bottom of the monthly Ichimoku Cloud:
The choppy action around 0.865 has undermined the look of the Bear Flag pattern but this level, helped by the 50 % fib and monthly Cloud base, remains as the ‘line in the sand’ for me with any possible bearish continuation down to the 0.80 region.
Bear Flag? The Bear Flag is looking very messy but the 0.865, monthly 50% fib and bottom of the monthly Cloud remains as key support levels to watch. A break and hold below these three support levels would suggest the Bear Flag move might be back in contention. The ‘Flag Pole’ for any A/U Bear Flag has a height of about 630 pips. Thus, the expected move for any bearish breakdown is expected to be of about 630 pips as well. This projects a bearish target down near the 0.80 level. This is significant as this is also the 61.8% pull back for the 2008-2011 bull run.
Price is now trading below the Cloud on the daily and weekly charts and near the bottom of the Cloud on the 4 hr and monthly charts.
The weekly candle closed as a bearish candle BUT the monthly chart now looks to be setting up with a bullish descending wedge.
A rising USD will be bearish for this pair but Chinese stimulus will most likely be bullish. It could get messy here but the level of the monthly candle close next week with respect to the 0.865 level might help to clarify the situation.
- I’m watching for any new TC signal on this pair, the 0.865 level and the bottom of the monthly Cloud.


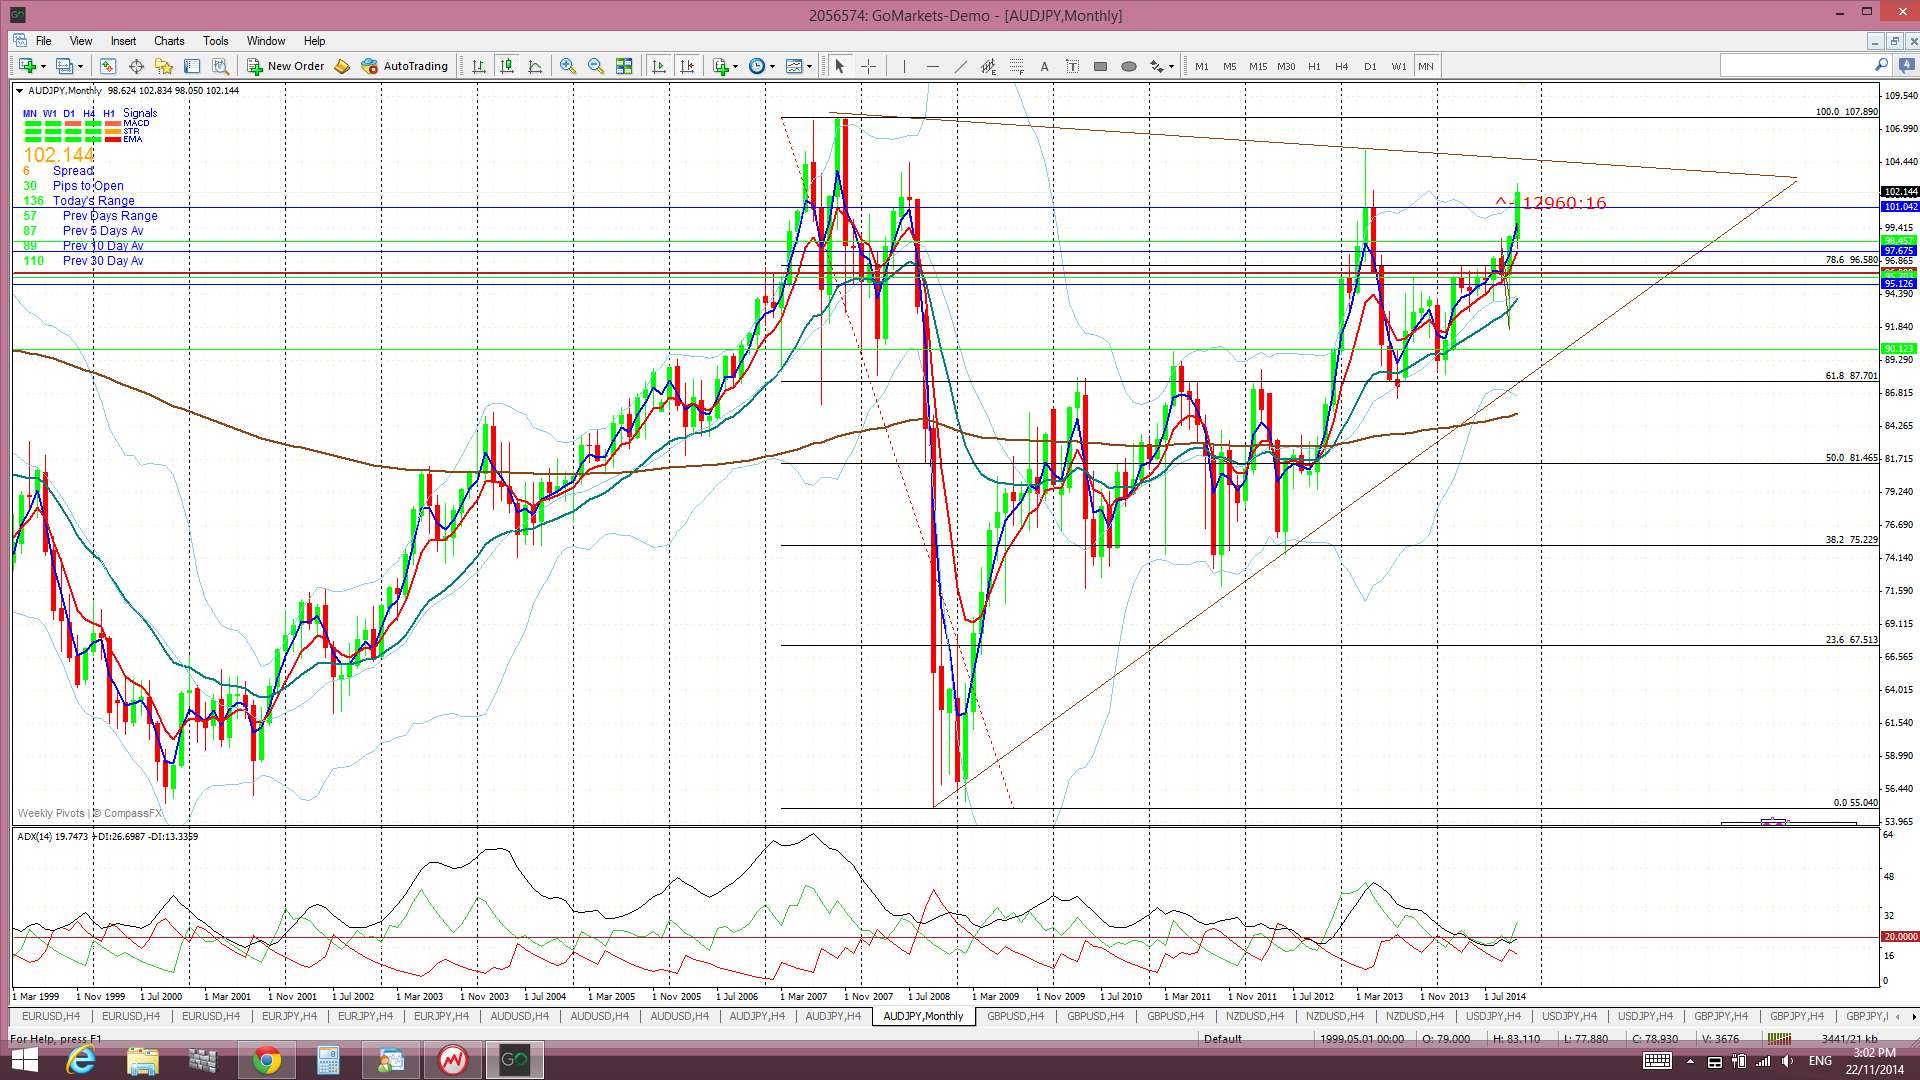
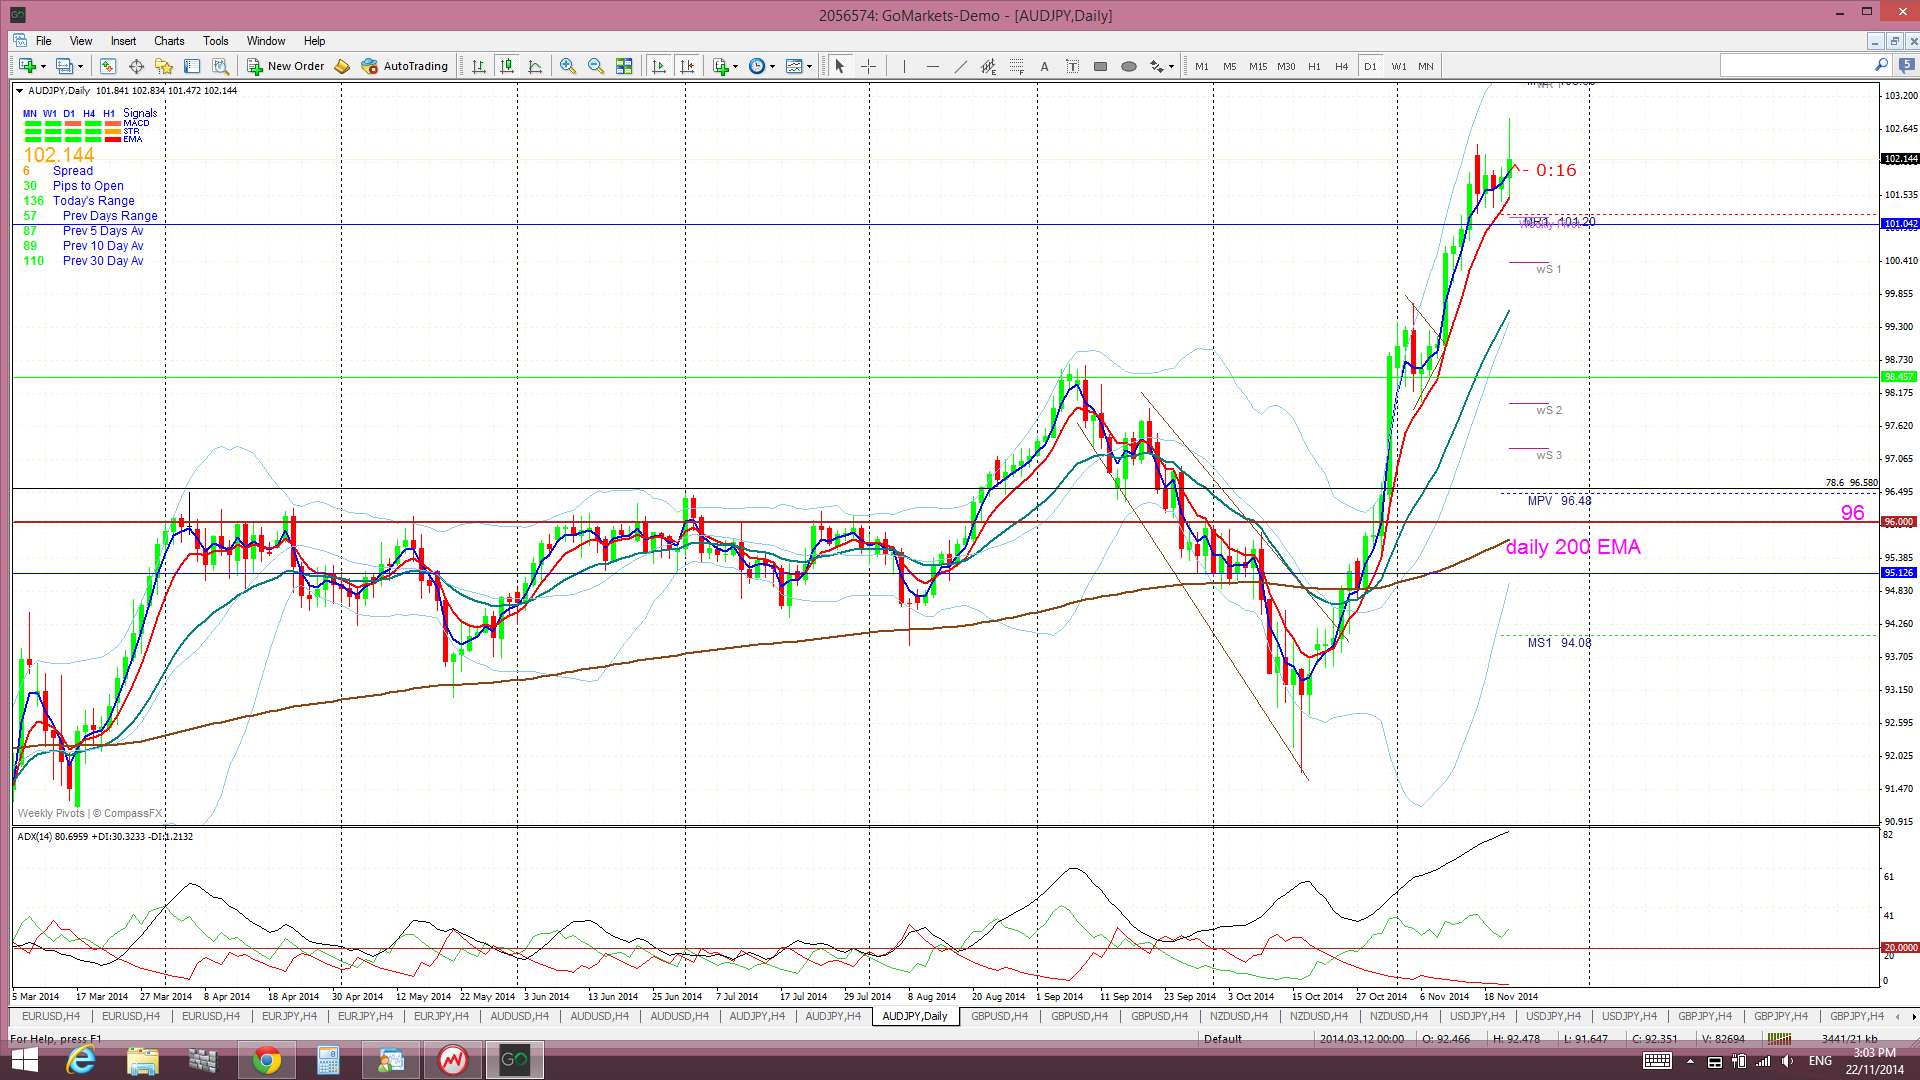
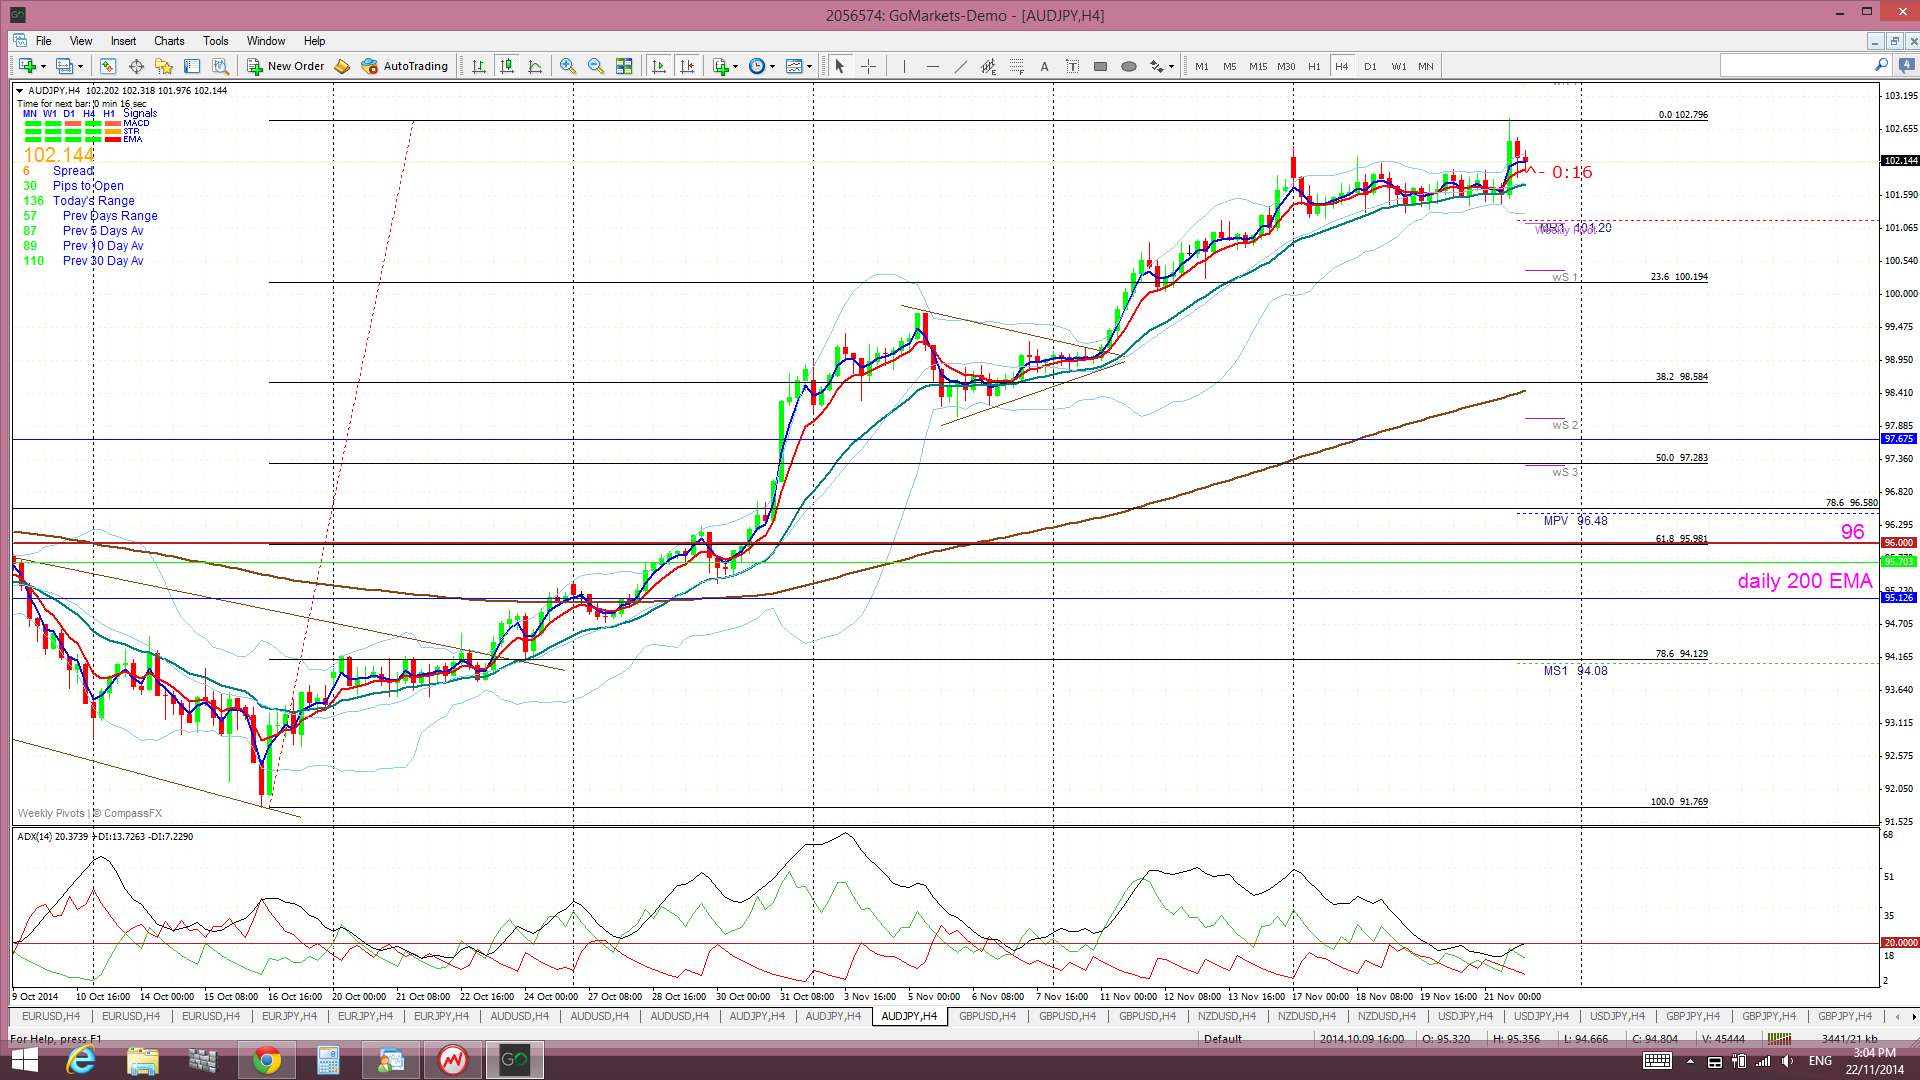
A/J: The A/J chopped sideways for much of last week as both the AUD and JPY weakened in tandem.
This pair is still at a very interesting level. It is only about 300 pips below a major monthly triangle trend line and 600 pips or so below the previous 108 region high set back in 2007. The 2013 high was up at 105.42 and I would suspect that this pair might try and, at least, test the 105 region again.
The Yen pairs have slowed a bit though and some have even pulled pack and the A/J could just as easily follow suit. It is worth noting that a 61.8% fib pullback of the recent bull run would bring price back down to the key 96 S/R level.
Price is trading above the Cloud on the 4hr, daily, weekly and monthly charts.
The weekly candle closed as a bearish coloured ‘Spinning Top’ candle. This candle has come after four bullish candles, three of them large, and thus is giving a bit of a bearish-reversal perspective to the chart.
- I’m watching for any new TC signal on this pair and the 96 level….again!

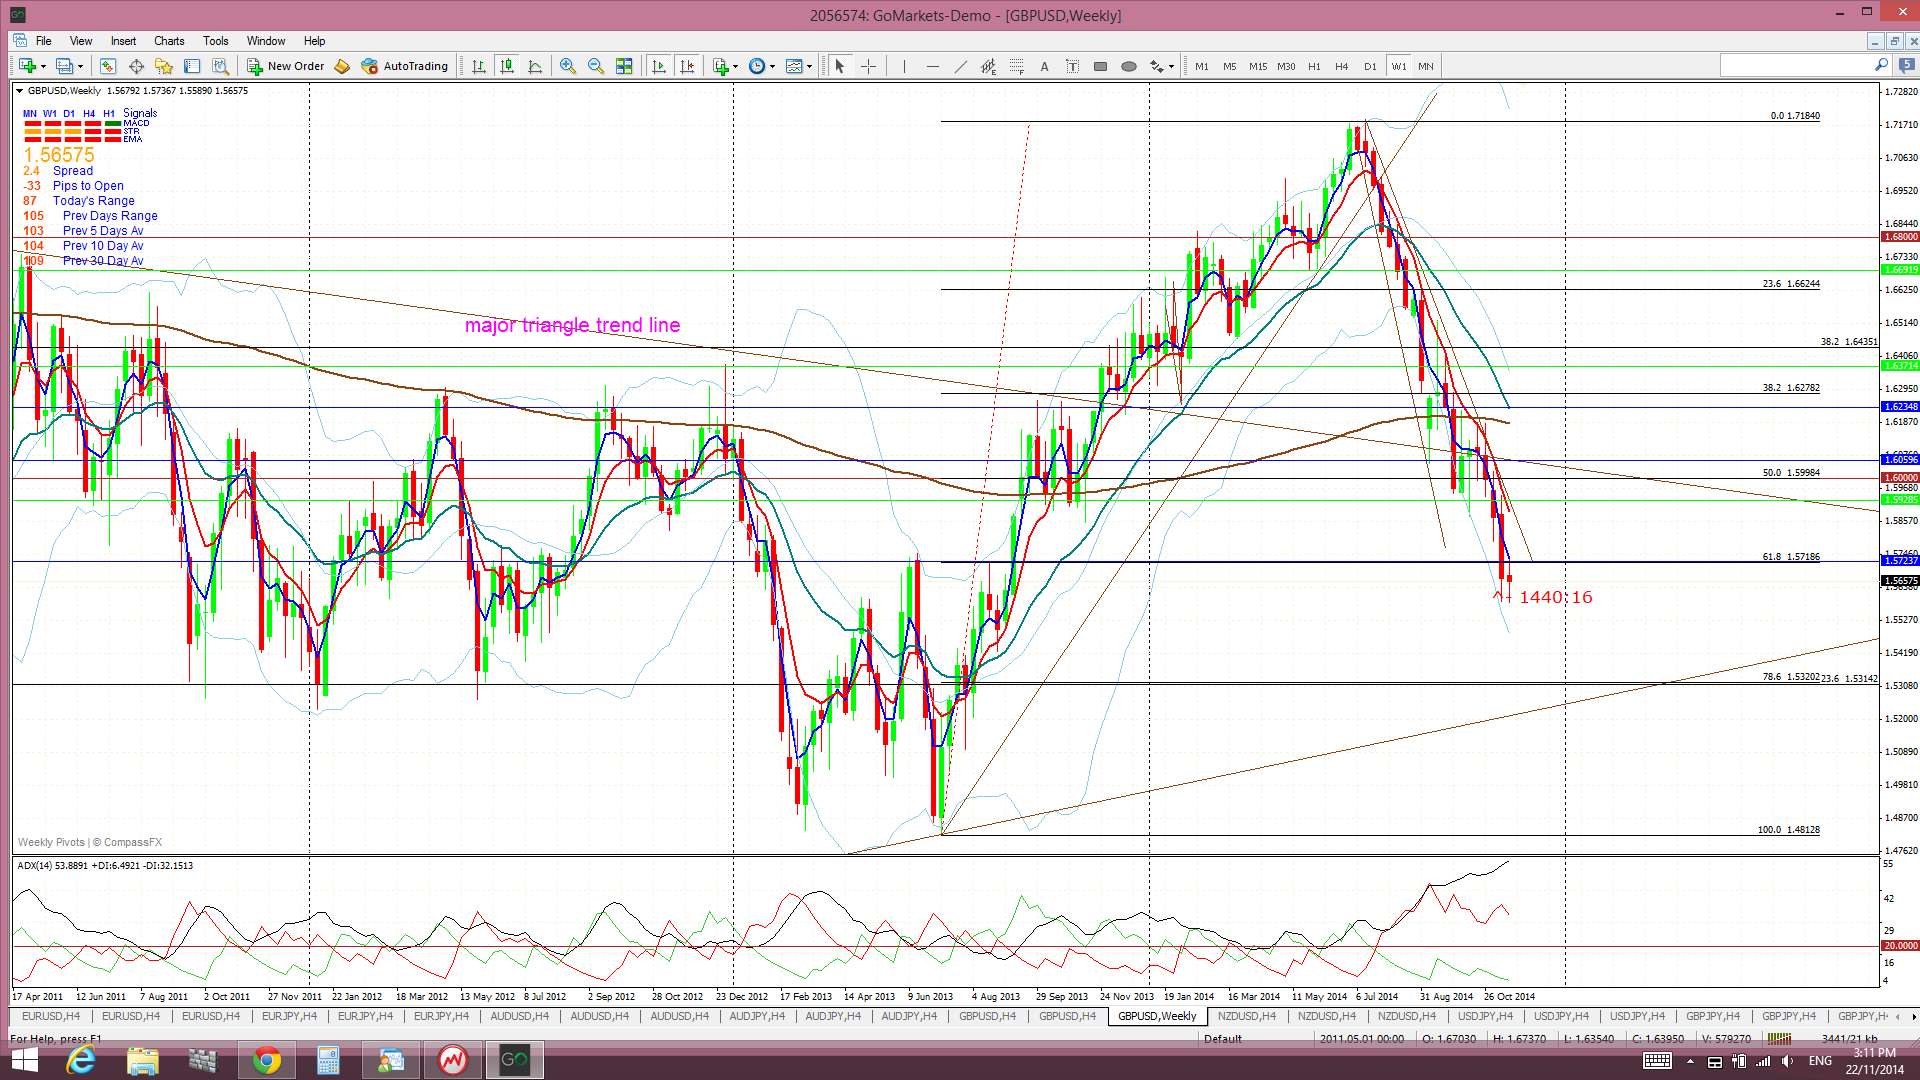
G/U: The Cable was always going to struggle this week as it opened below the 61.8% fib level of the 2013-2014 bull run. It tried to reclaim this level a few times but, despite some upbeat GBP data and Friday’s Chinese rate cut news, it closed the week still below this key demarcation level. This upbeat GBP and CNY news was offset by news of UKIP (anti-EU party) success stories and continuing uncertainty about when UK interest rates are actually likely to increase.
The Cable has closed below this 61.8% fib again which is bearish and would suggest a further fall down to the 78.6% fib at the 1.53 region which is also near the monthly chart’s support triangle trend line.
Price is still trading below the Cloud on the 4hr, daily, weekly and monthly charts which is bearish.
The weekly candle closed as a bearish coloured ‘Spinning Top’ candle.
- I’m watching for any new TC signal on this pair and the 61.8% fib.


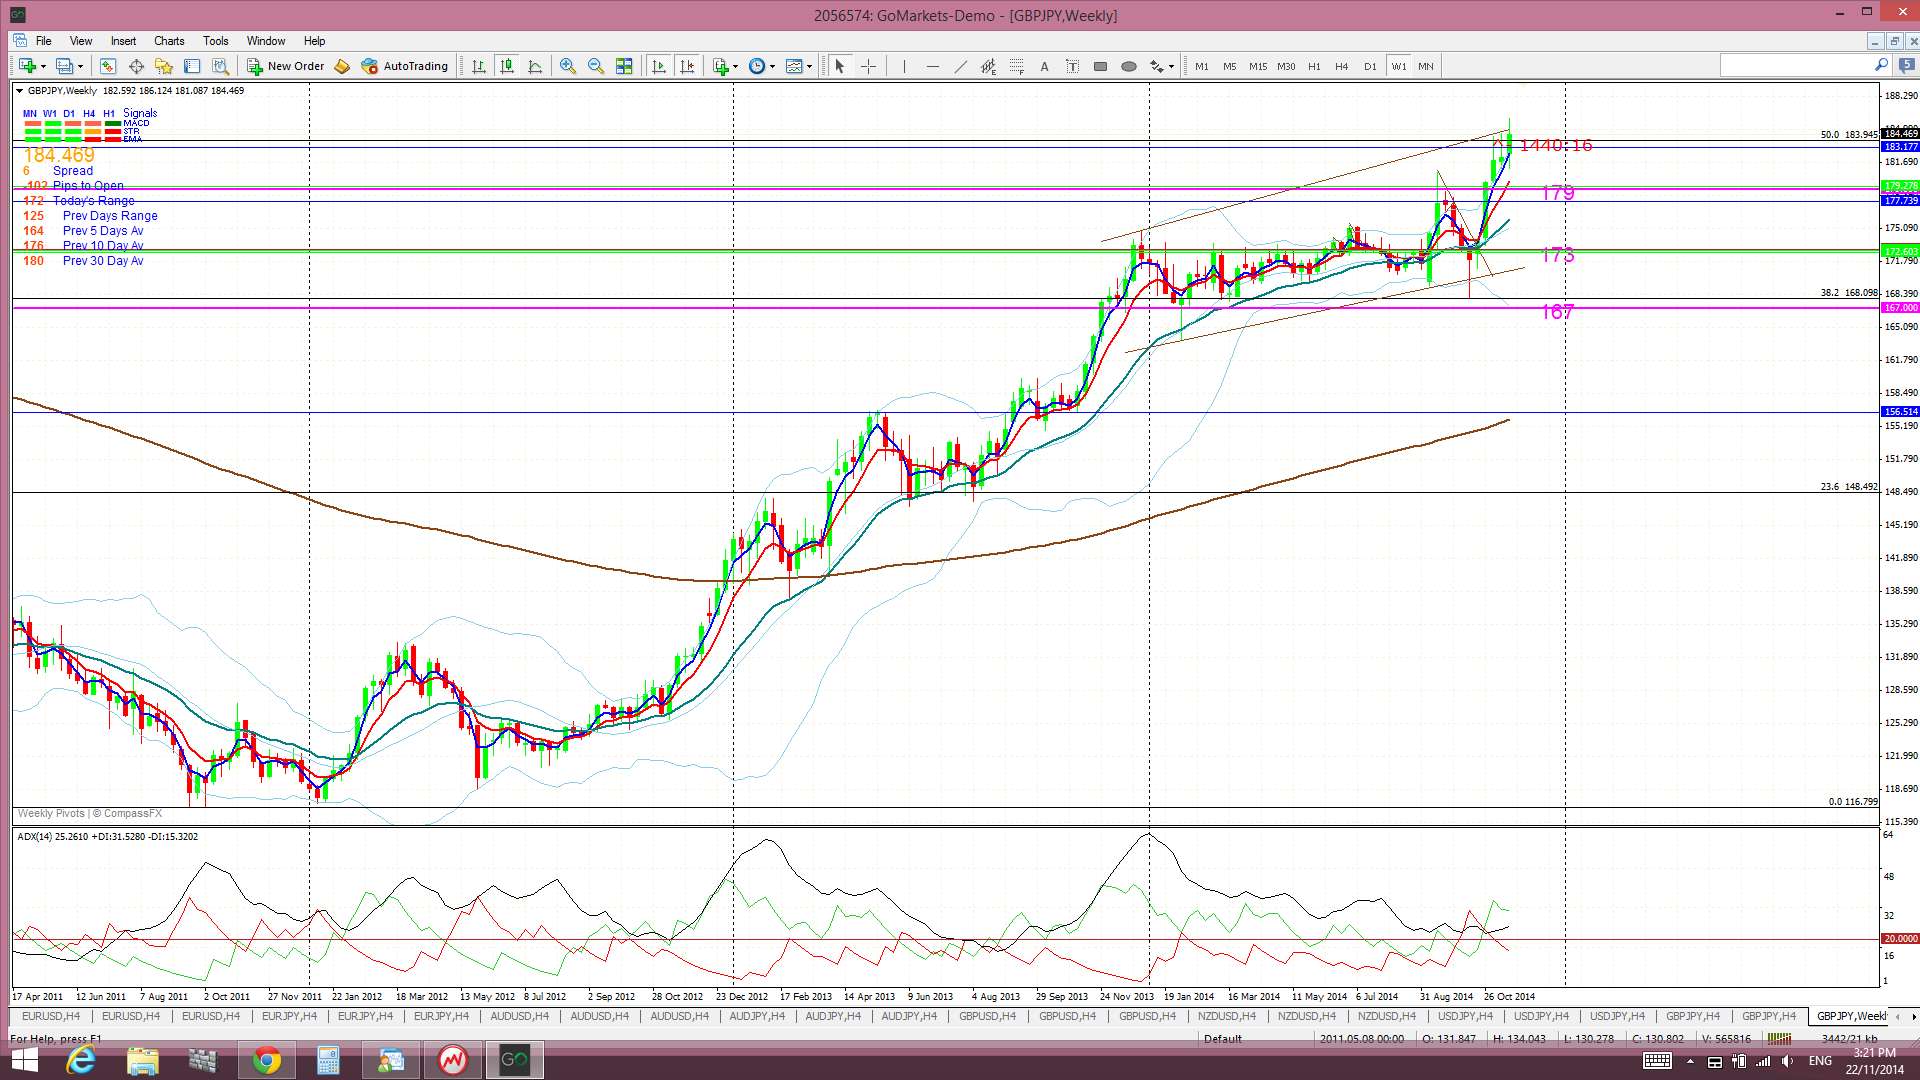
GBP/JPY: The GBP/JPY chopped sideways for much of last week under the key 50% fib of the 2007-2011 bear move. It eventually broke up and over this level and, in doing so, avoided the bearish ‘Double Top’. This move also triggered a bullish breakout from the weekly chart’s broadening ascending wedge but this was short lived. The GBP/JPY eventually pulled back but did manage to close the week out above the 50% fib level.
I had been looking for a pull back here but this has failed to evolve as yet. Possible bearish targets would be the 179 level, which is near the 38.2% fib, and the 173 level which is just below the 61.8% fib.
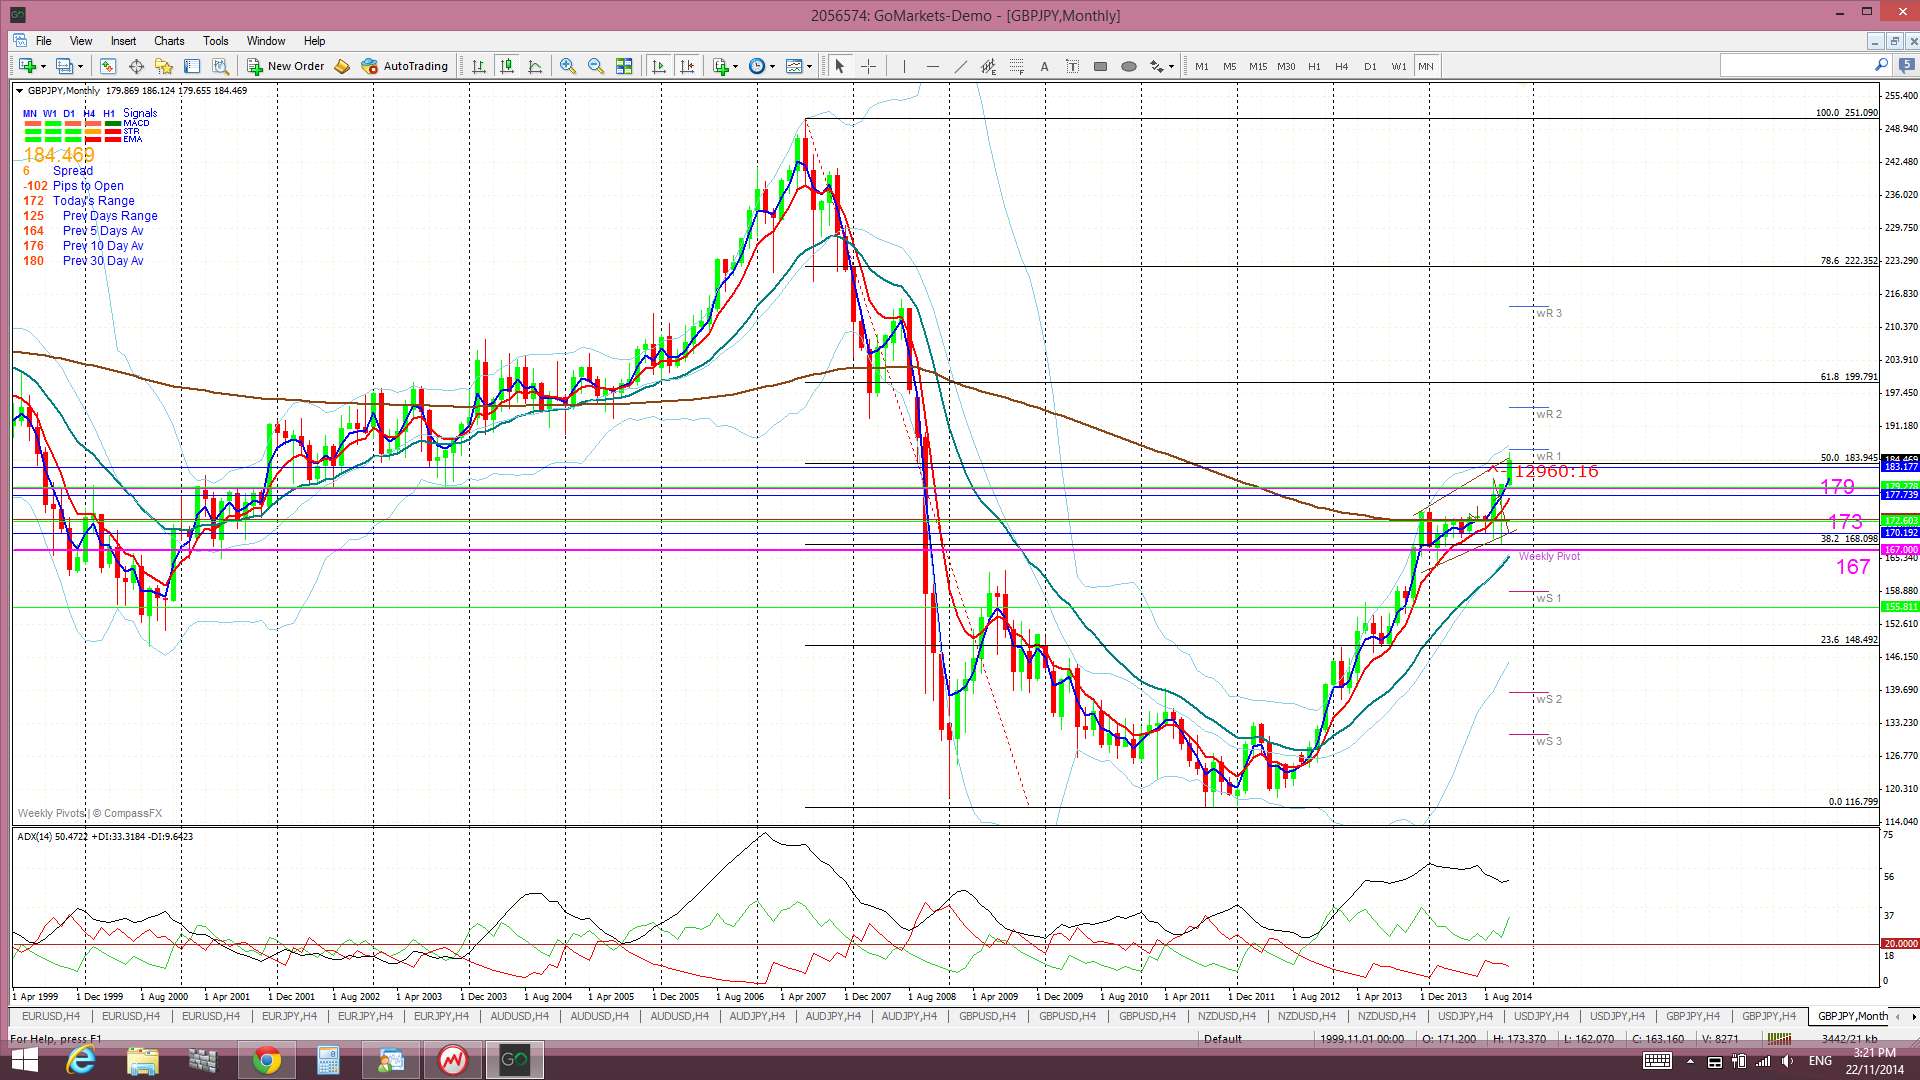
Two key S/R levels on the G/J chart: The monthly chart shows a band of choppy congested activity across the chart. This band is defined by rather strong S/R levels at 179 and 167. The 179 level seems to be a key demarcation level and a close and hold above this would suggest bullish continuation. The key 173 level lies midway between these two S/R levels. Targets for any bullish break and hold above the 179 level, apart from obvious whole number levels, include the 50% fib near 184, the 61.8% fib near 200 and the 78.6% fib near 222.
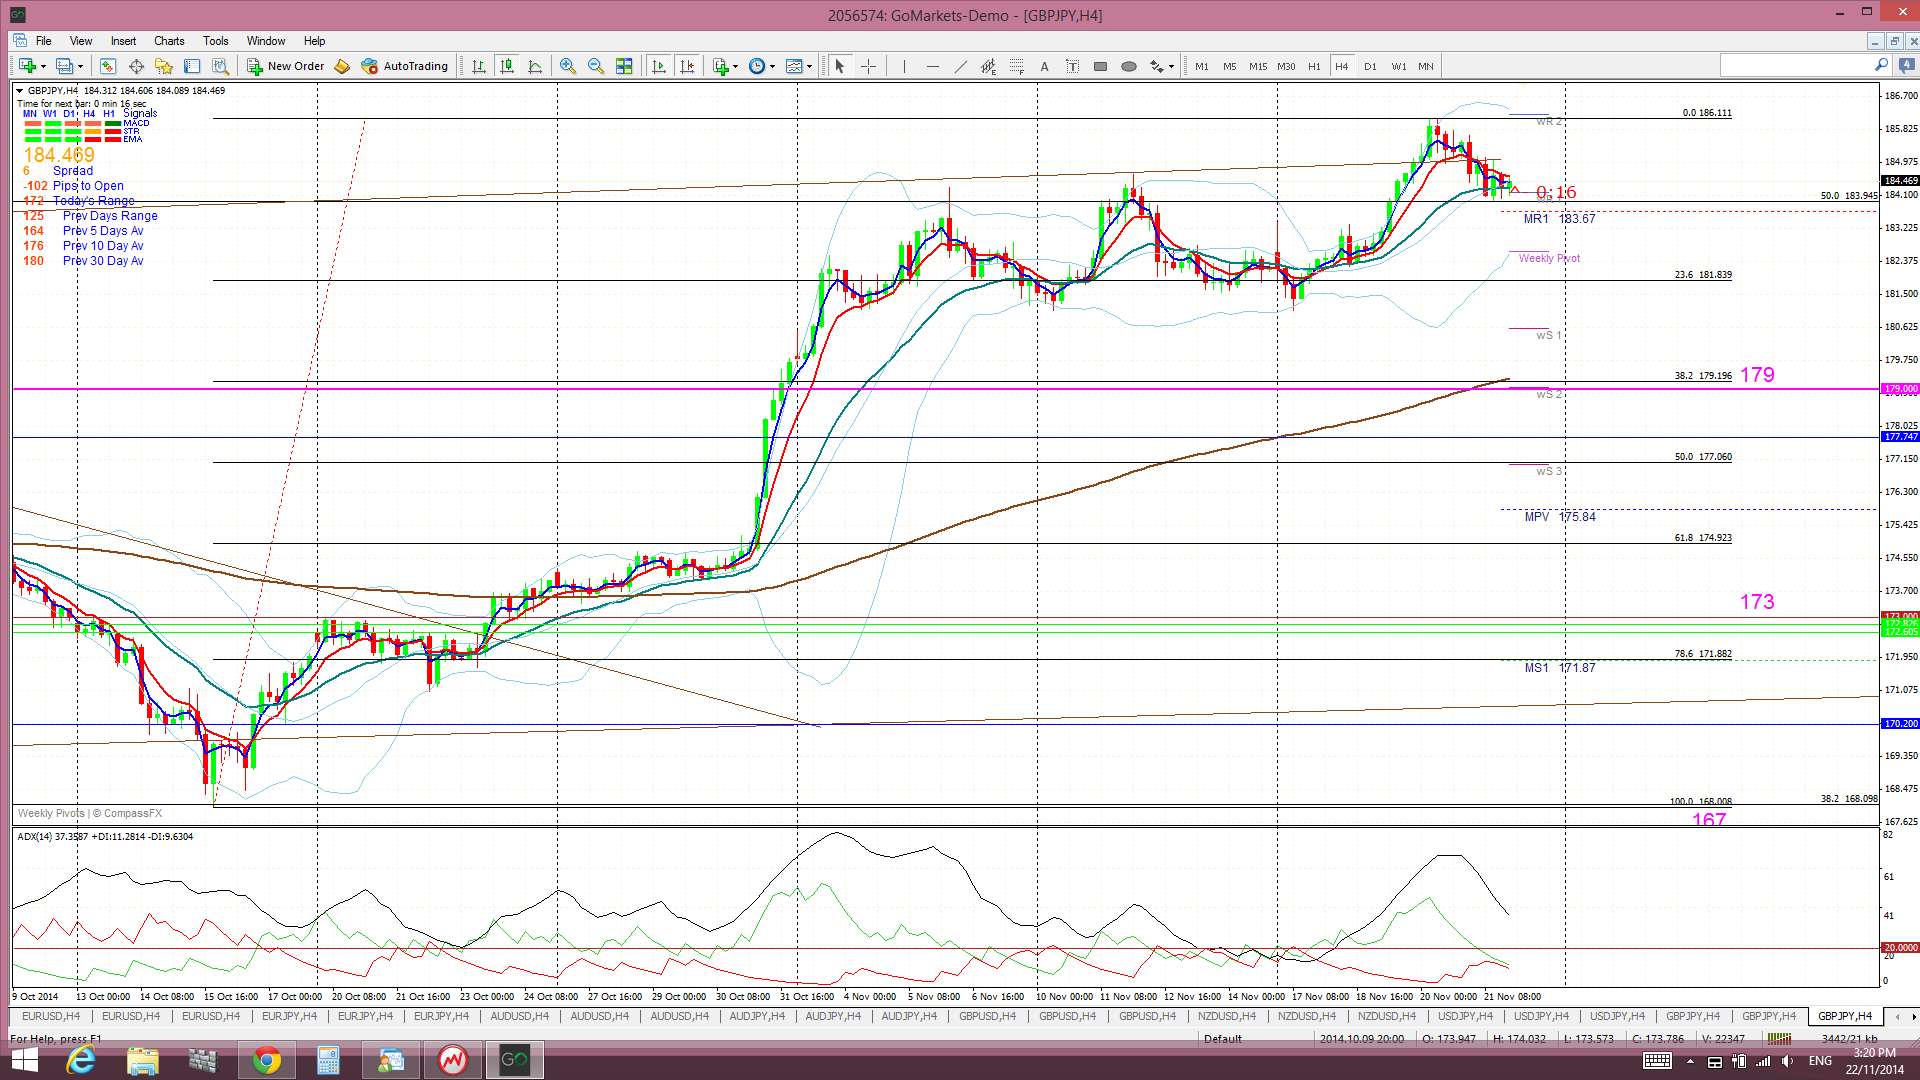
Price is now back trading above the Ichimoku Cloud on the 4hr, daily, weekly and monthly charts which is bullish.
The weekly candle closed as a bullish candle with decent upper and lower shadows.
- I’m watching for any new TC signal on this pair and the 179, 176 & 173 levels.

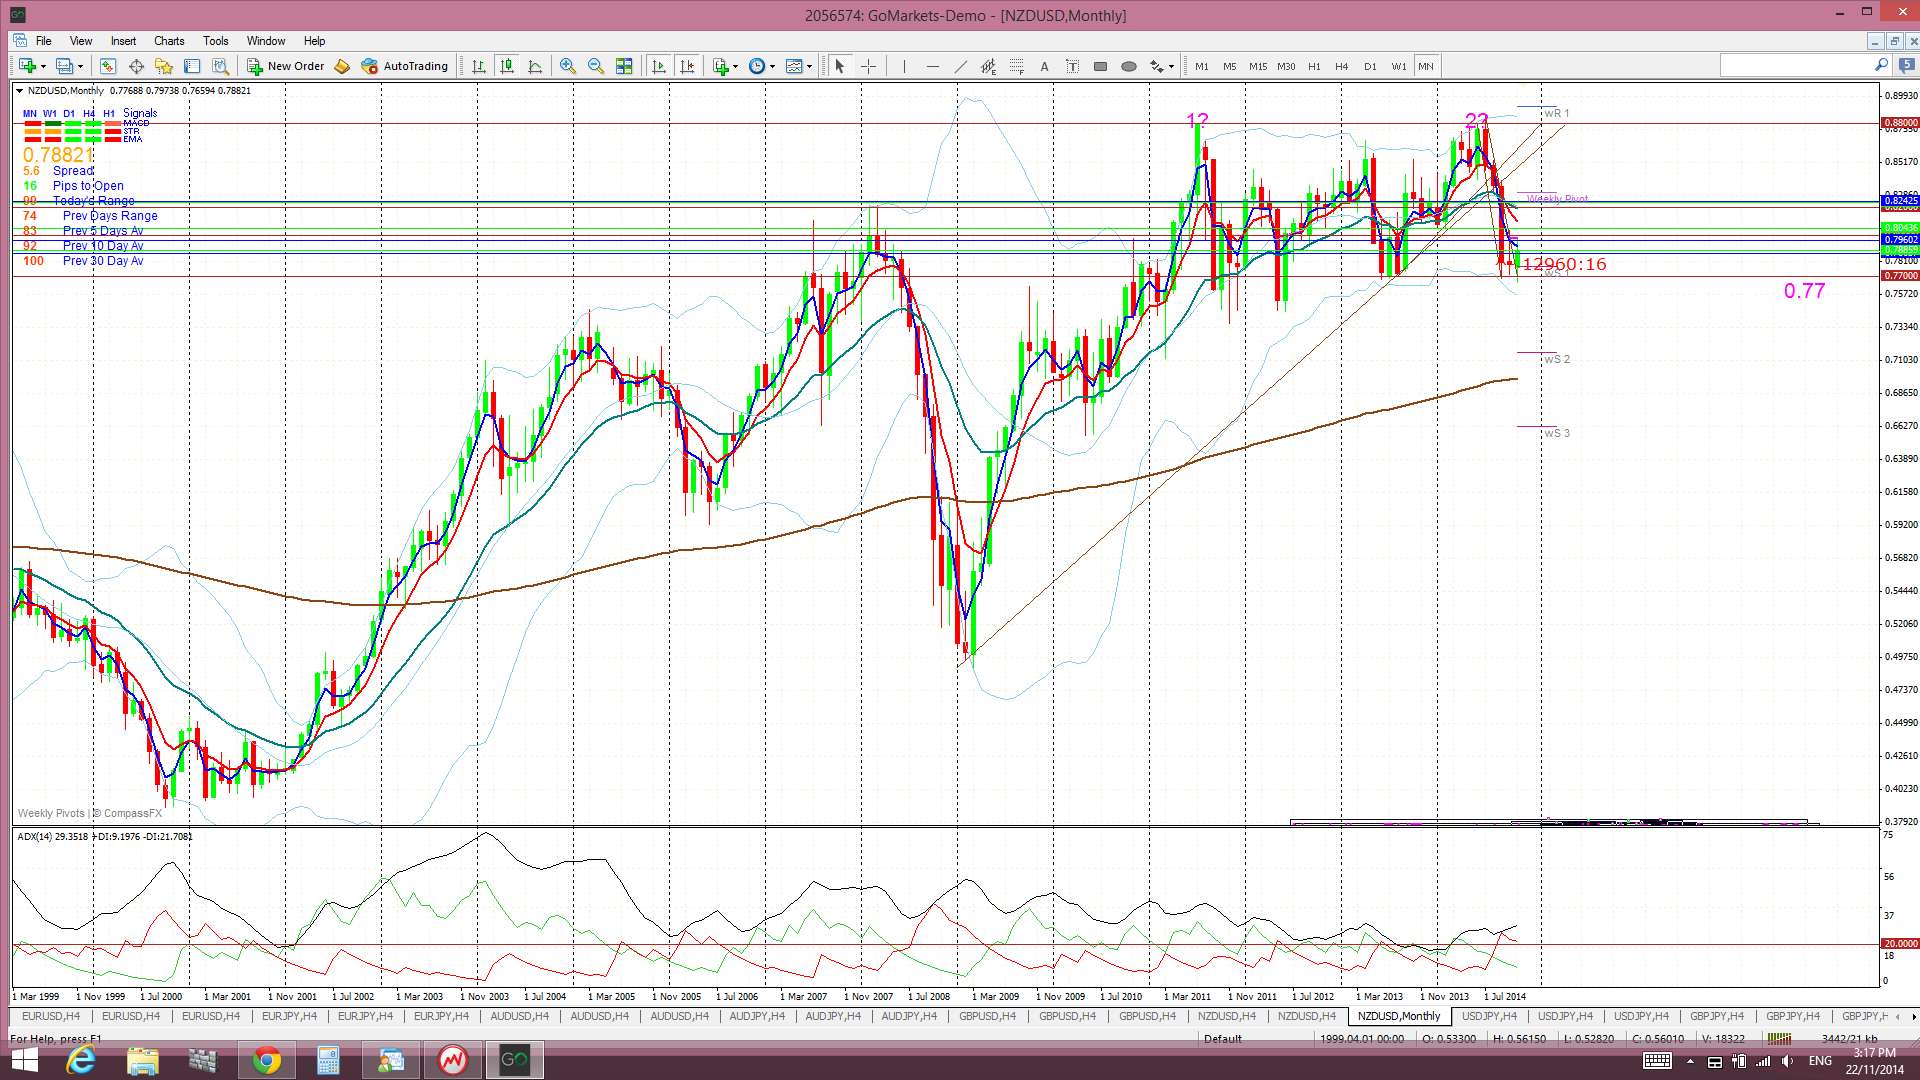
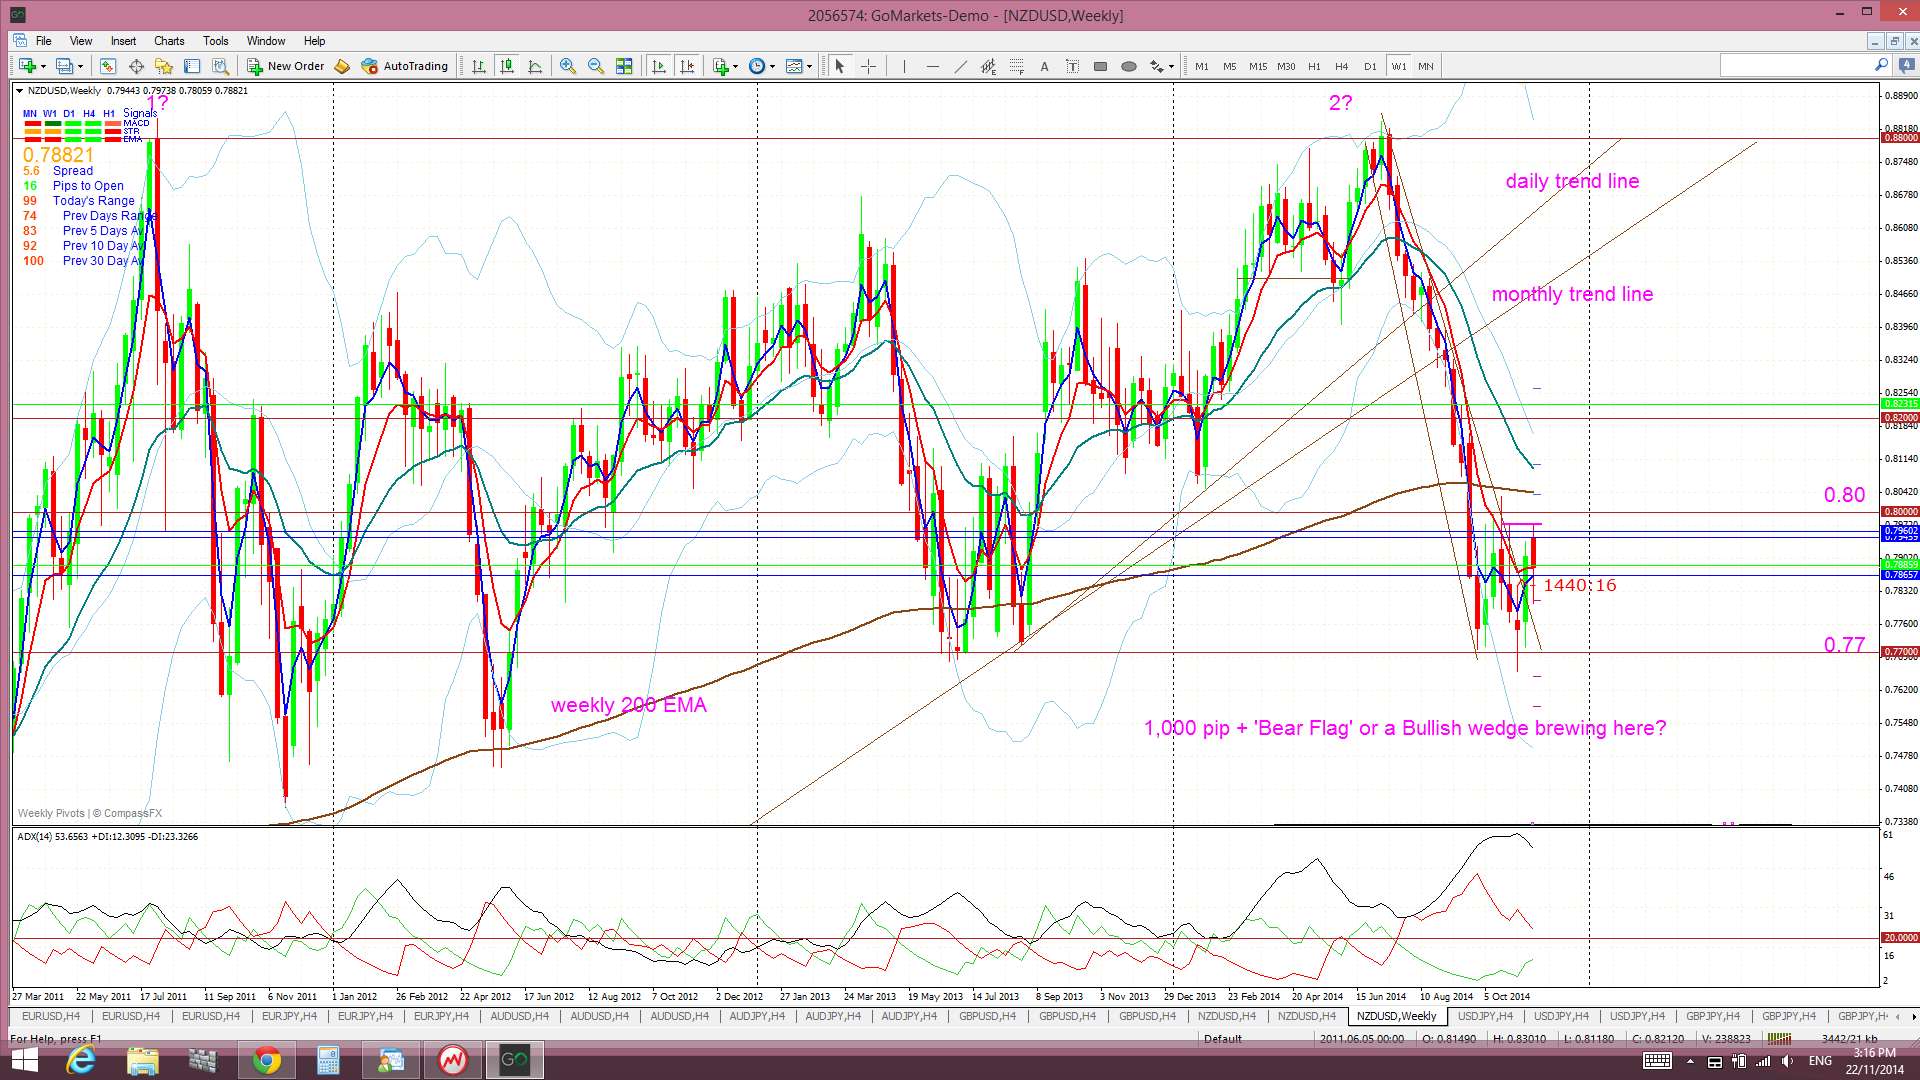
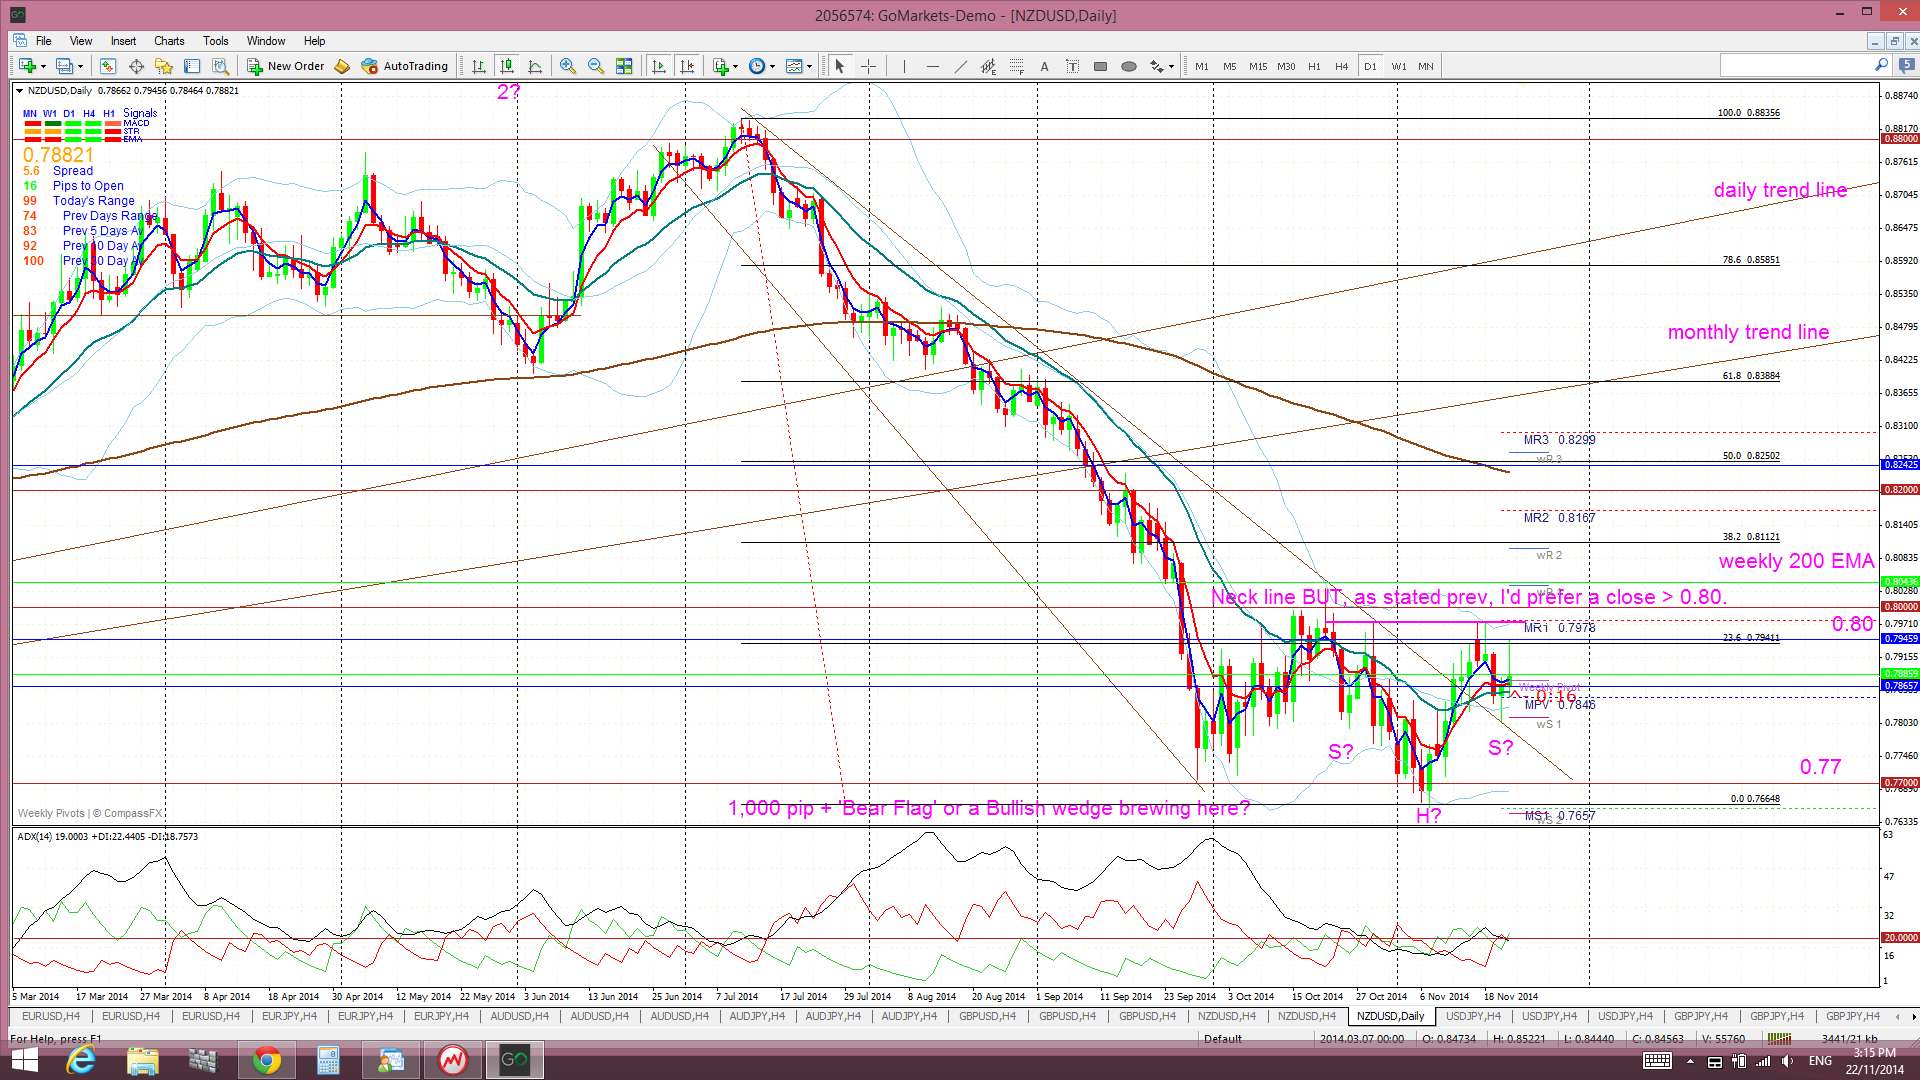
Kiwi: NZD/USD: The Kiwi had a choppy week but managed to hold up and out from the previous week’s bullish descending wedge. It suffered a few setbacks though and didn’t quite make it back up to the key 0.80 level. This price action resulted in the Kiwi forming up into another bullish ‘inverse H&S’ pattern on the 4hr chart. Fridays CNY interest rate news might help to keep this pair supported.
Bear Flag for Kiwi: The 0.77 remains the key level to watch here as any break and hold below this level would trigger the start of a possible ‘Bear Flag’ move. The ‘Flag Pole’ for the Kiwi’s ‘Bear Flag’ is about 1,100 pips. Thus, any bearish breakdown and continuation below the ‘Flag’ trend line may be expected to extend by 1,100 pips as well. This would bring the Kiwi down to near 0.67 cents. This level is between the 61.8 and 78.6% fibs of the 2009-2014 bull run. Given that the 0.77 is strong support I would still prefer to wait to confirm any possible ‘Bear Flag’ move until there is a close and hold below this 0.77 level. The 0.77 remains a significant S/R level for the Kiwi as it represents the previous swing low for the period during mid-2013 and, prior to then, from mid-2012.
Fib levels shows other possible targets for any bearish continuation below 0.77 as being the:
- 38.2% fib near 73.5.
- 50% fib near 70 and the weekly 200 EMA.
- 61.8% fib near 0.65.
Price is still trading above the Ichimoku Cloud on the 4hr chart (just) but below the Cloud on the daily and weekly charts and in the top edge of the Cloud on the monthly chart.
The weekly candle closed as a bearish candle with decent sized shadows reflecting the uncertainty here.
As with the A/U, a rising USD is bearish for the Kiwi but Chinese stimulus is likely to be positive. The position of the monthly candle close at the end of this week with respect to the 0.77 might help to clarify the situation here.
- I’m watching for any new TC signal on this pair, the 4 hr chart’s ‘Inverse H&S’, and the 0.77 and 0.80 levels.

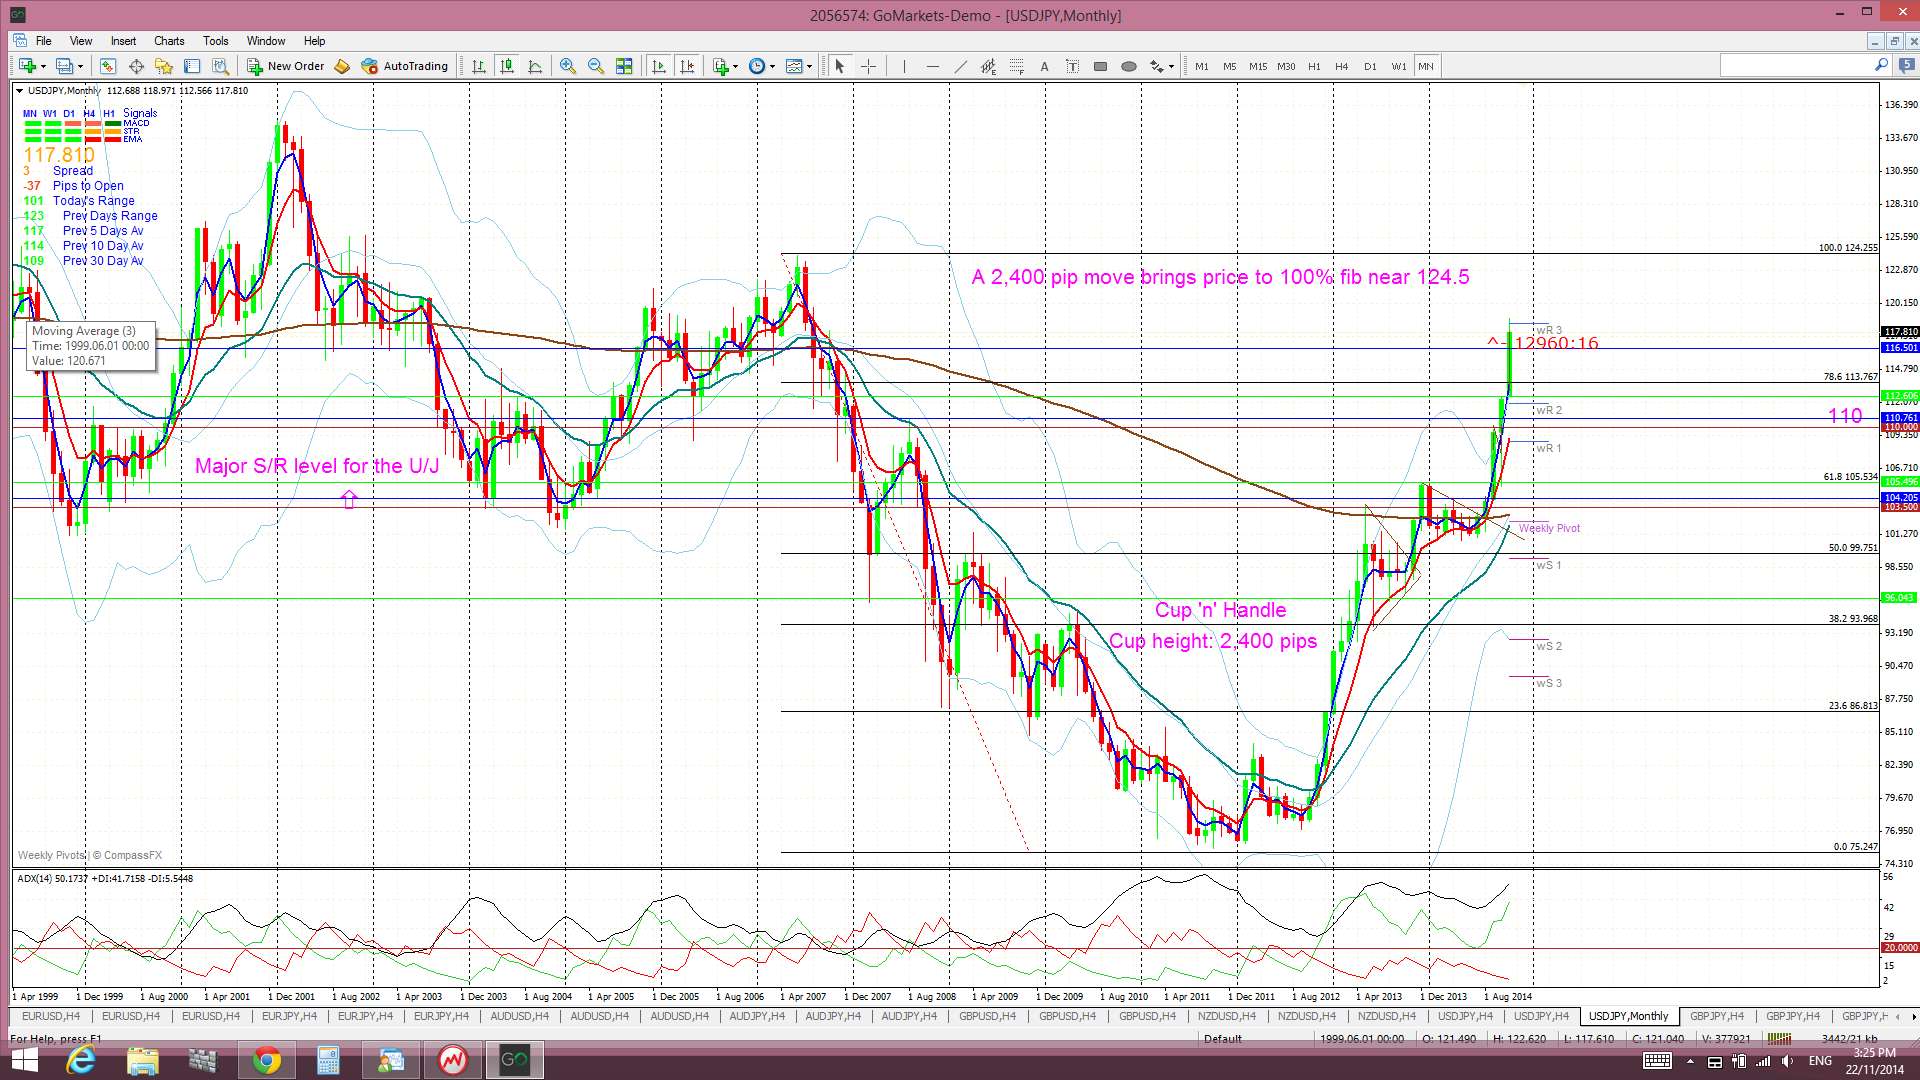
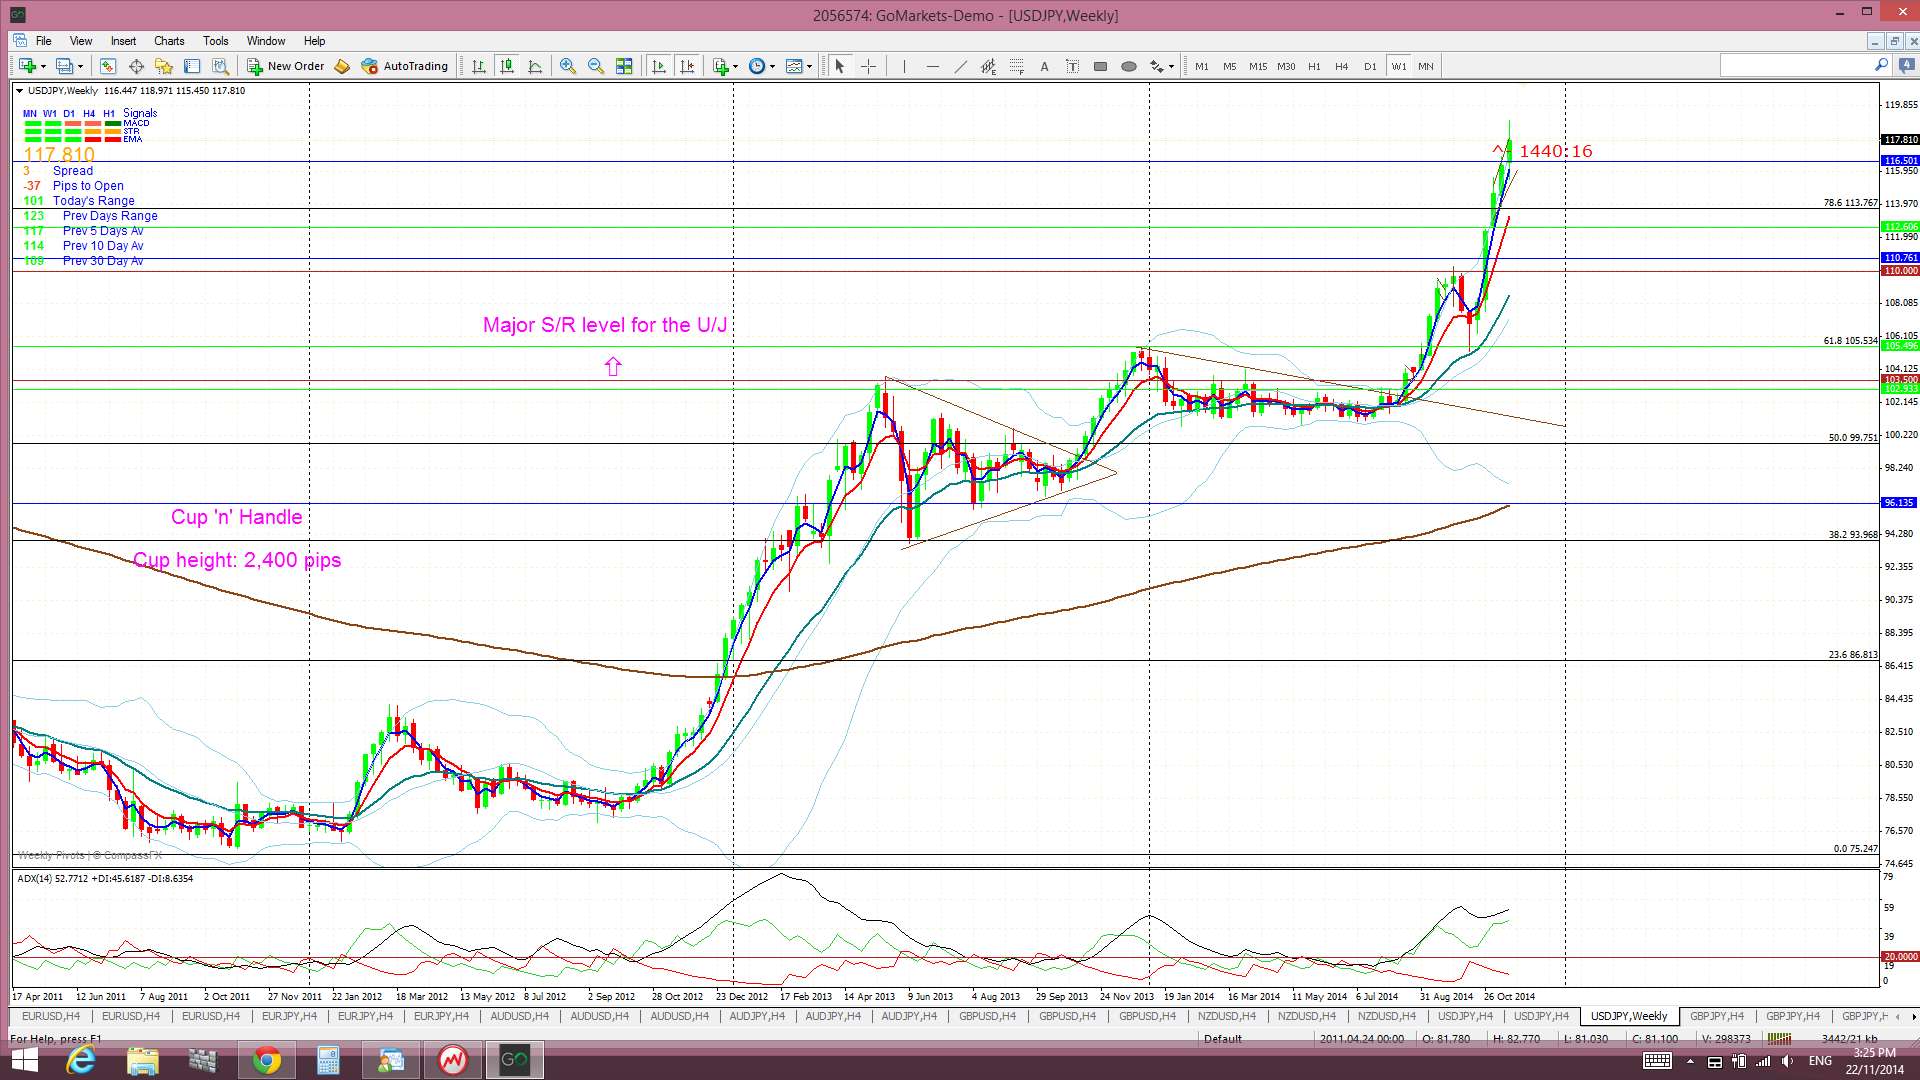
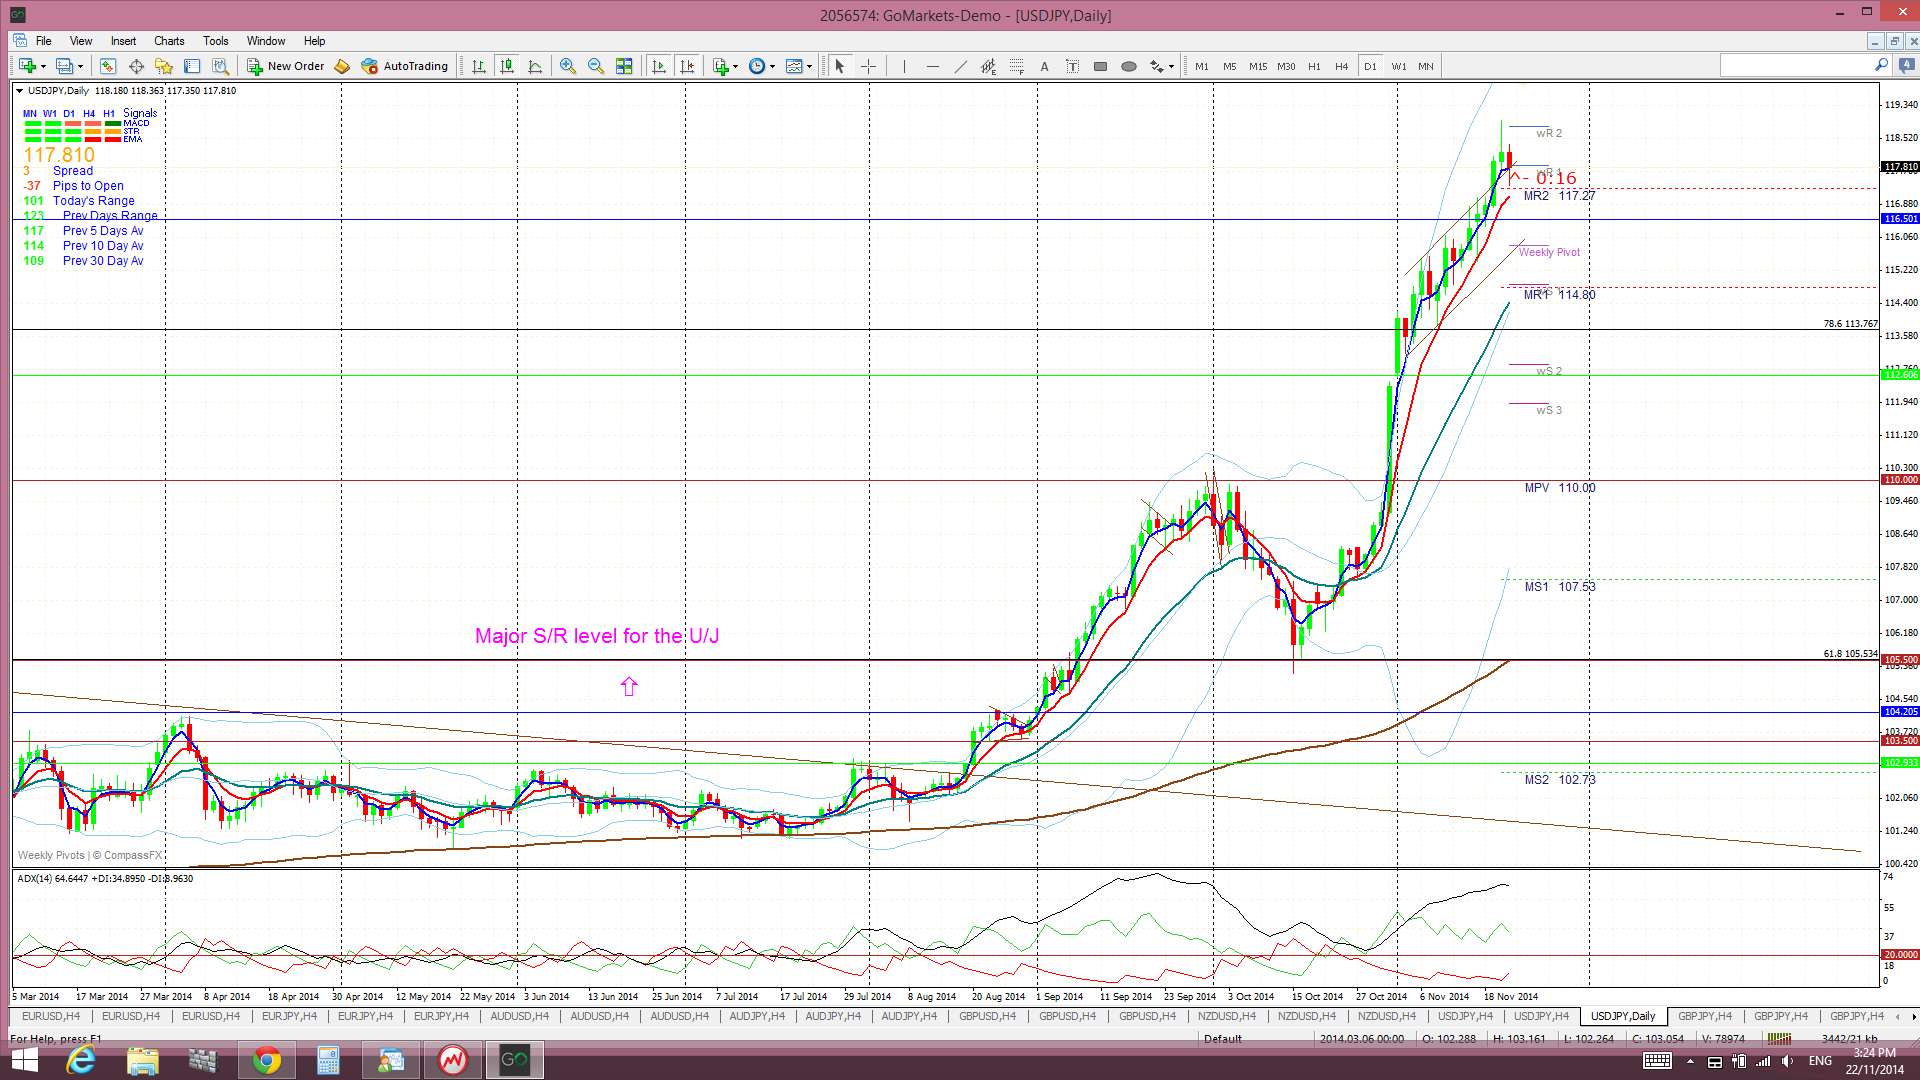
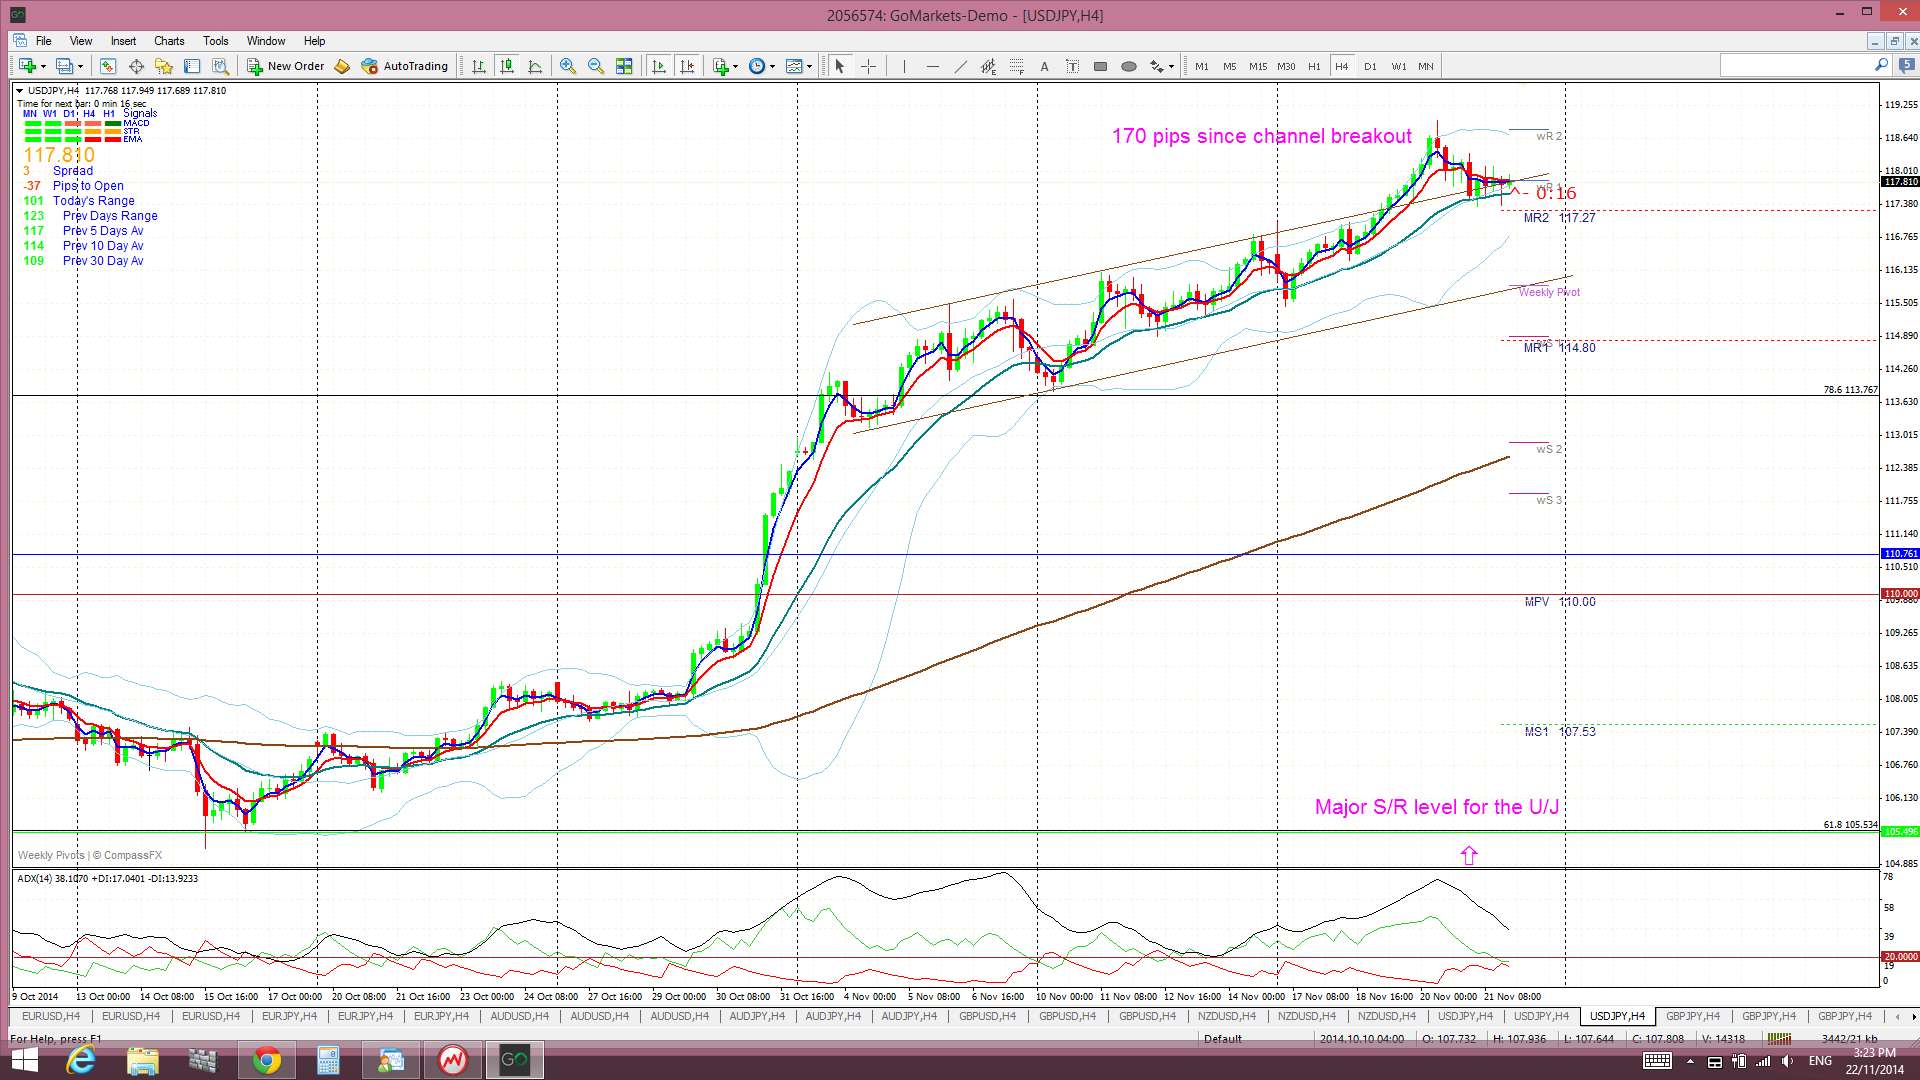
The Yen: U/J: The U/J chopped higher last week and eventually broke up and out from the 4hr chart’s ascending trading channel. Momentum waned on Friday though and, after coming close to 119, the pair pulled back to close below the 118 level.
Price is still trading above the Cloud on the 4hr, daily, weekly and monthly charts which is a bullish. November 2013 was the first monthly candle close above the Ichimoku Cloud since mid-2007 and the bullish hold above the monthly Cloud continues to be noteworthy.
The weekly candle closed as a bullish candle but with some decent sized shadows reflecting the uncertainty here.
Weekly Chart Bullish Cup’ n’ Handle pattern: This pattern is getting close to its climax! The theory behind these patterns is that the height of the ‘Cup’ pattern is equivalent to the expected bullish move from the ‘handle’ breakout. The height of the Cup for the U/J weekly chart is around 2,400 pips. The interesting point here is that a 2,400 pip bullish move up from the ‘Handle’ would put price up near the 124 level. This level is the last major swing high for the U/J from back in 2007 and represents the 100% fib pullback for the move down in 2007 to the lows of 2012. This pattern has already given up to 1,800 pips of the 2,400 pip target!
- I’m watching for any new valid TC signal and the 110 level.
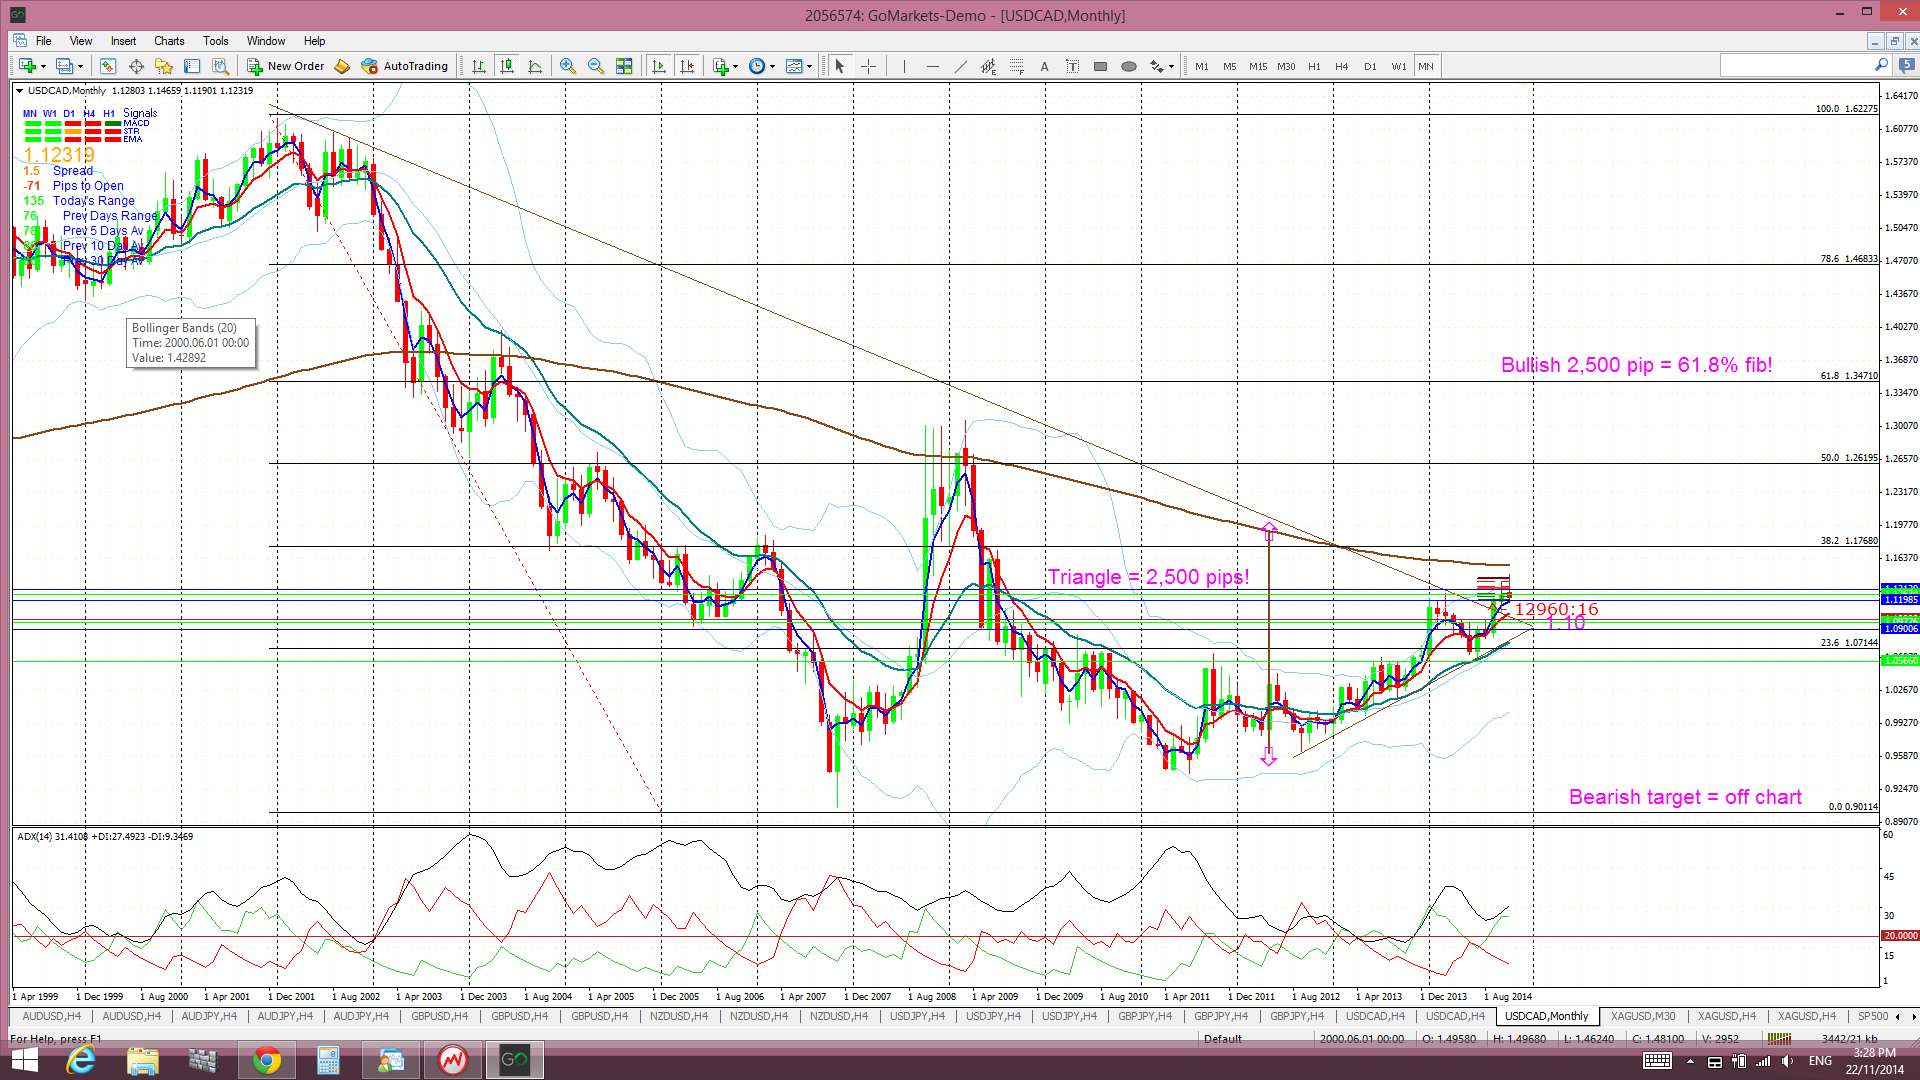
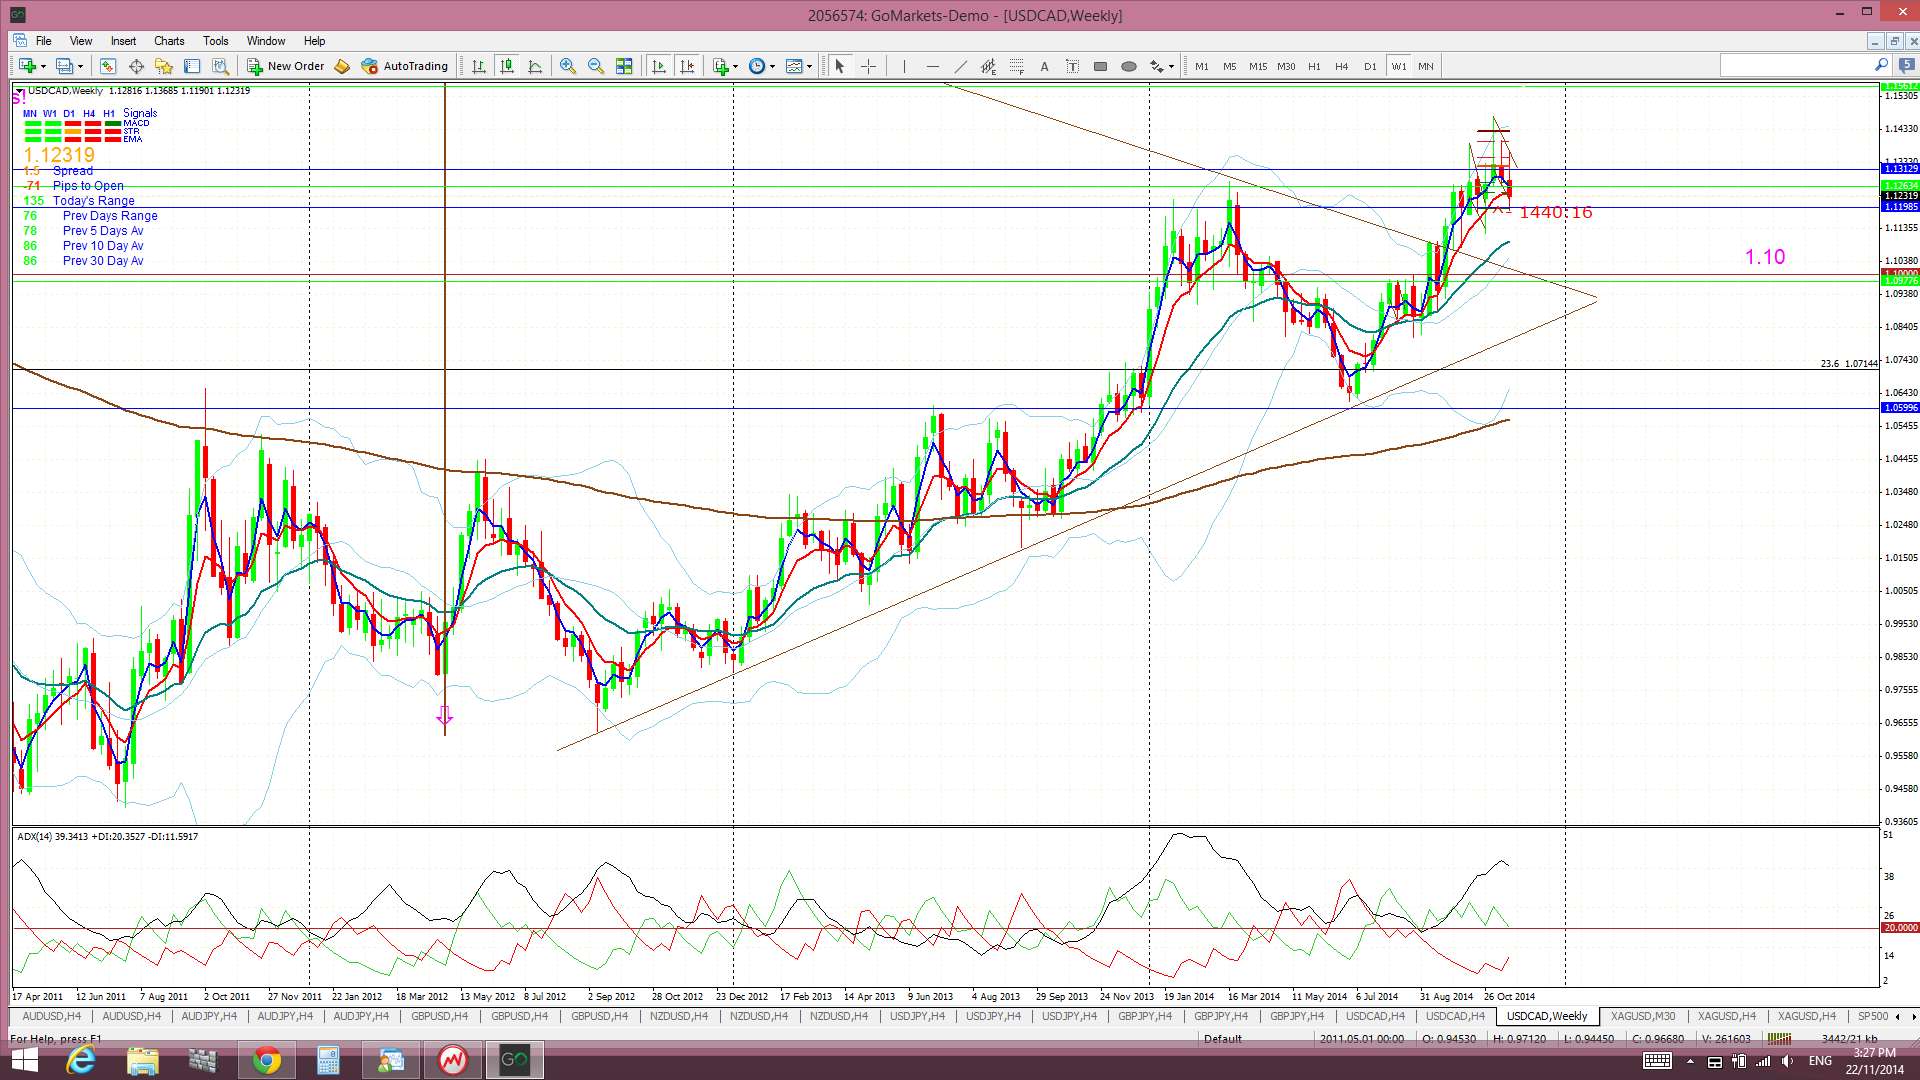
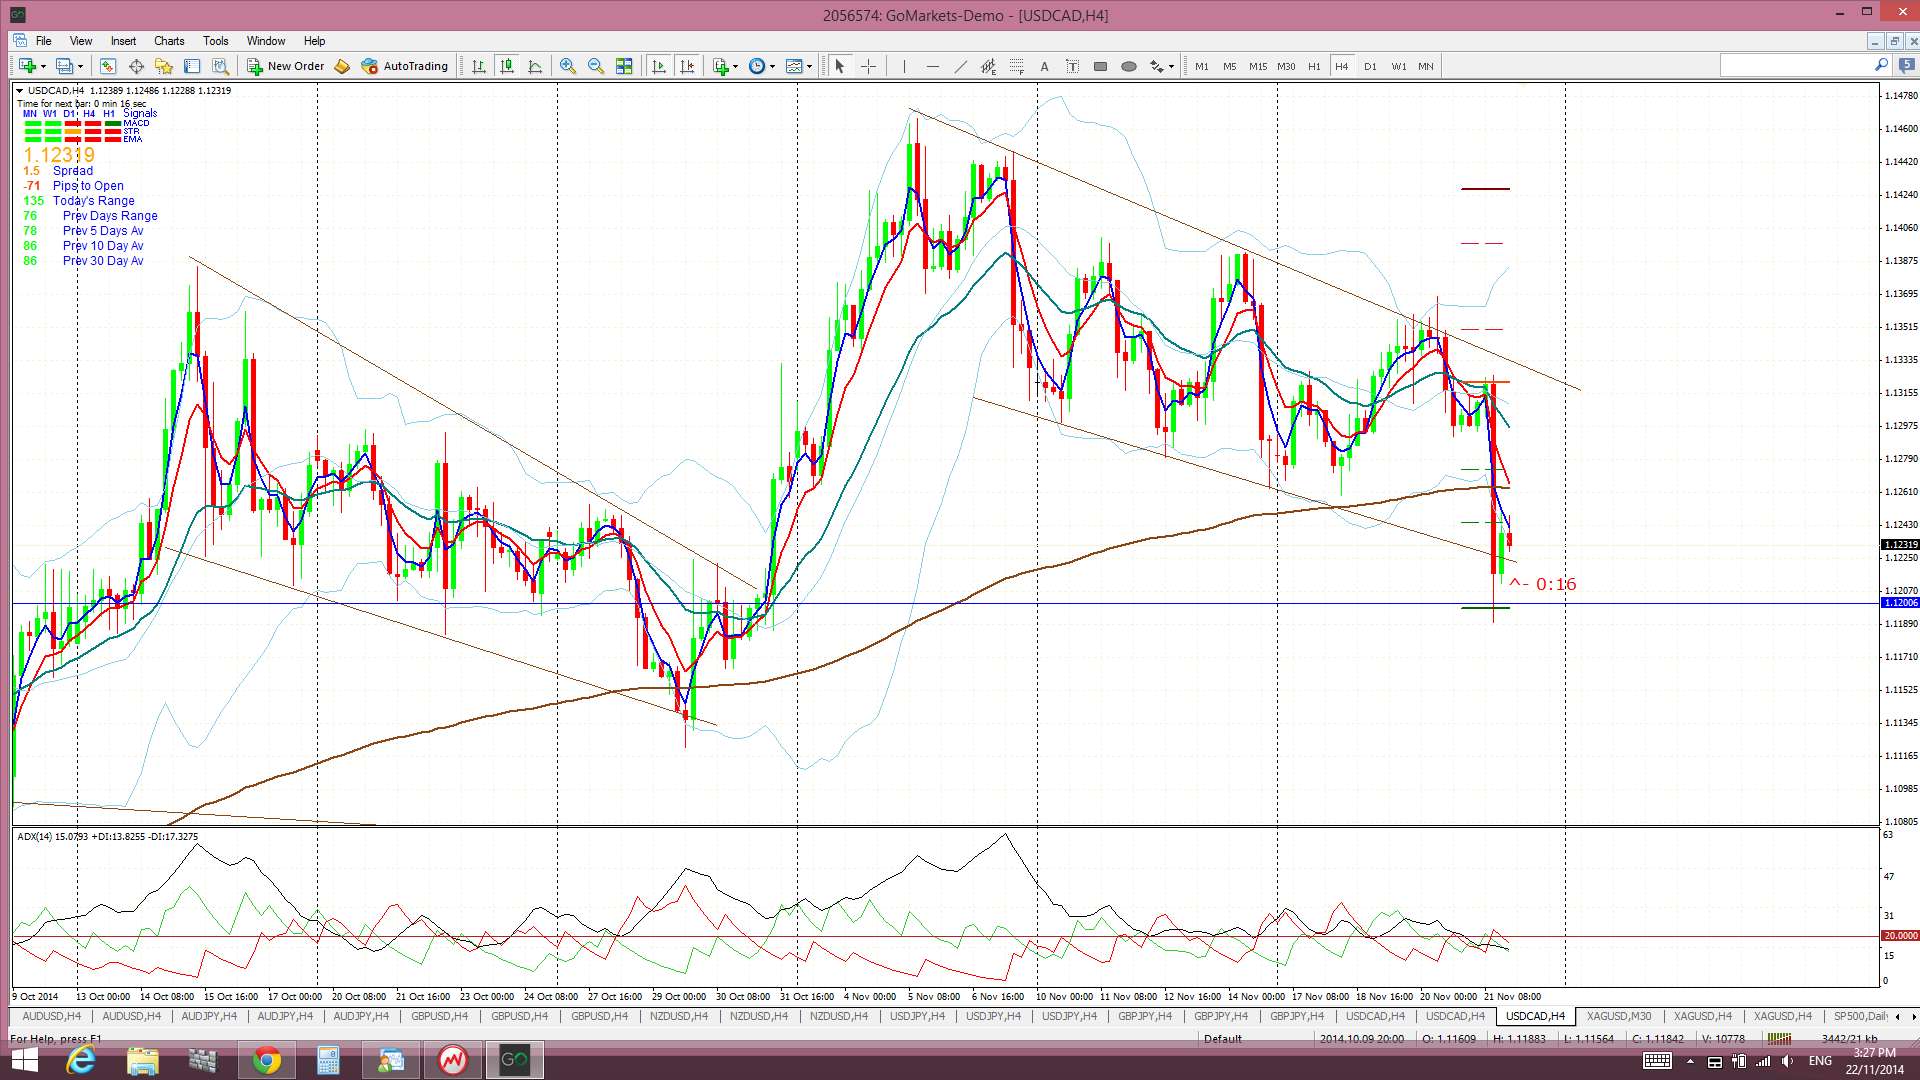
USD/CAD: The USD/CAD chopped around for much of the week and conformed to another descending wedge pattern. It had looked like it might have been on for a bullish breakout on Thursday but it couldn’t manage to print a 4hr candle up and out from the channel. There was better than expected CAD CPI data on Friday and this continues the steady drip of positive CAD data over recent weeks. This resulted in the USD/CAD pushing to the bottom of the wedge pattern and testing this region before closing back within the trend lines. Interestingly, there was little momentum with this bearish move.
Triangle breakout target: The Loonie has broken up and out from a major monthly chart triangle pattern that could deliver up to 2,500 pips. This 2,500 pip figure is evaluated from the height of the triangle. I have used the triangle height from the beginning of the bull trend line, as shown in the monthly chart below. The height of the triangle is around 2,500 pips and, thus, this would be the expected move from any breakout action. This is where it gets interesting! Extrapolating a bullish move from this triangle places price up at the 61.8% fib level. These fibs levels are popular targets in retracement moves and so this adds some confluence to this as a possible target.
Price is still trading below the Cloud on the 4hr chart but above the Cloud on the daily, weekly and monthly (just) charts.
The weekly candle closed as a bearish candle and this follows from last week’s bearish -reversal ‘Shooting Star’ candle and so I’m still hopeful I might get my pullback to 1.10.
- I’m watching for any new TC signal on this pair and the 1.10 level.

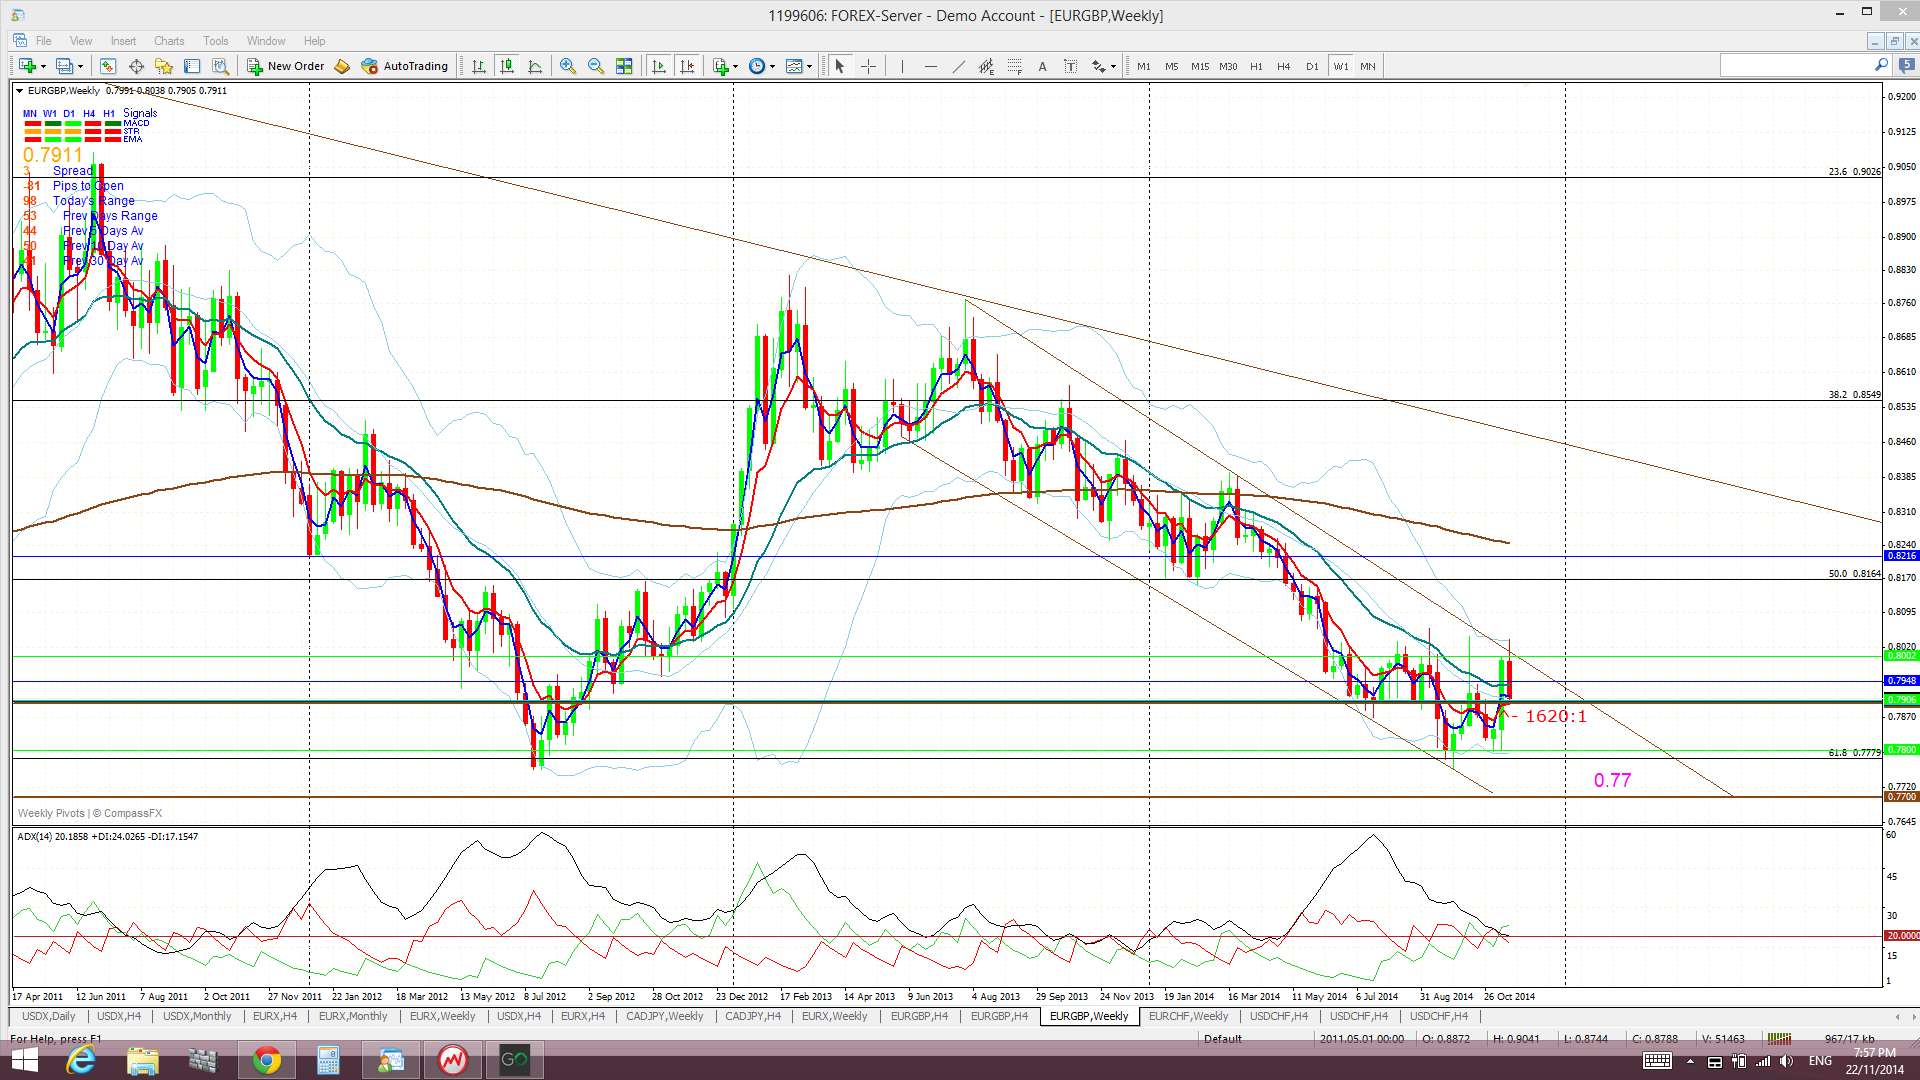
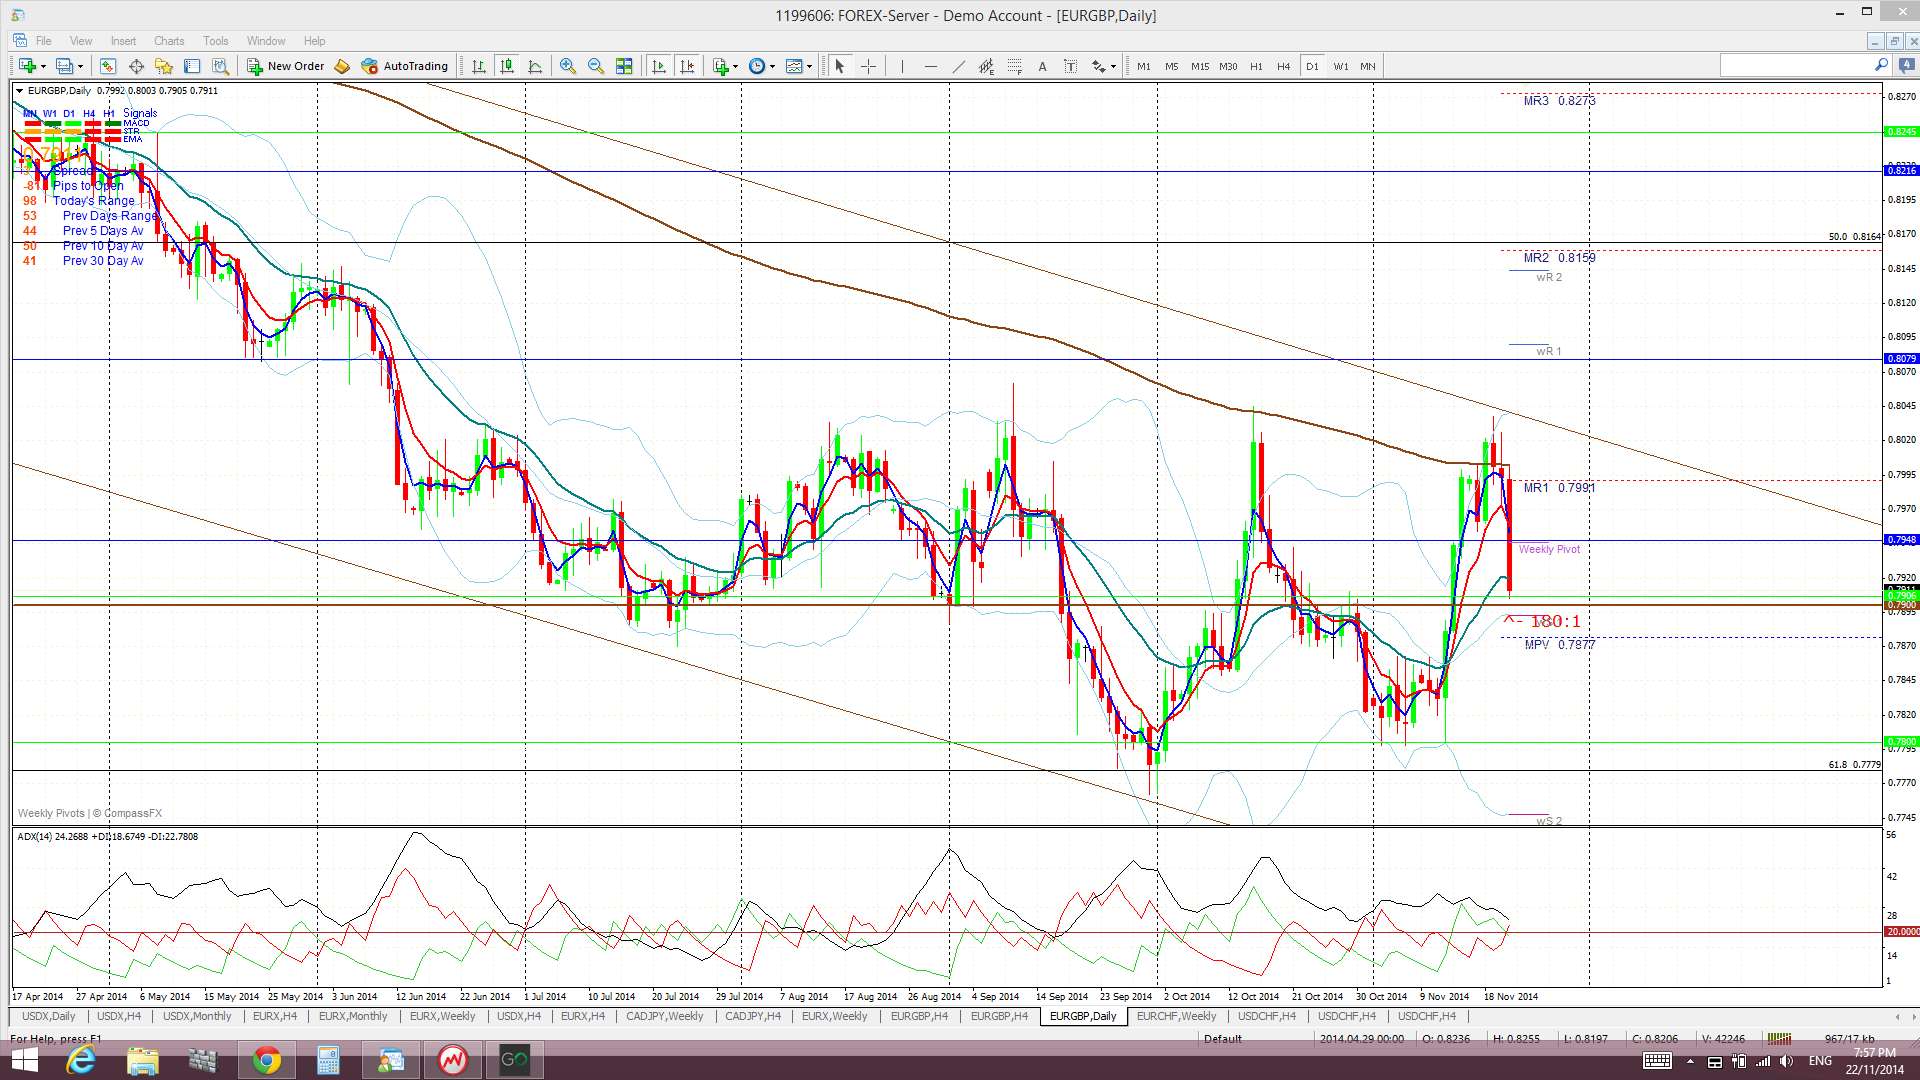
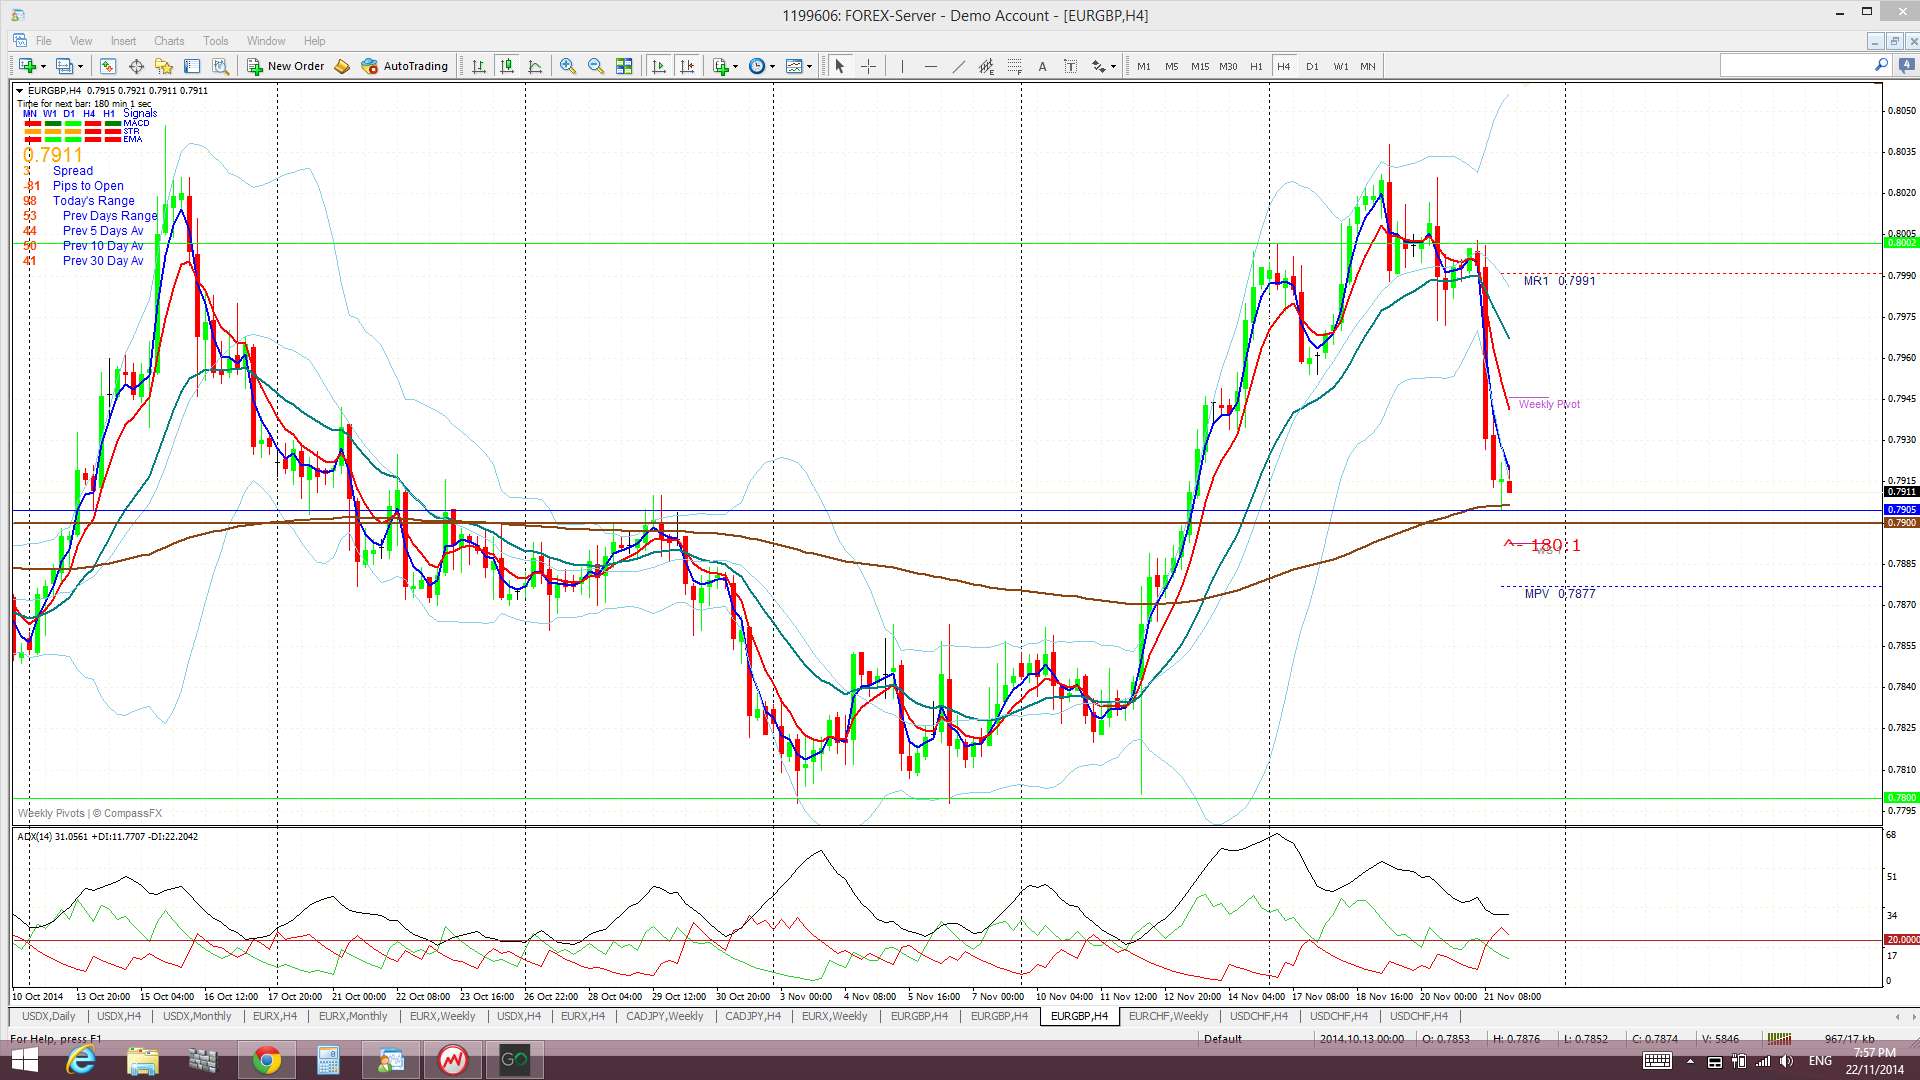
EUR/GBP: This pair hovered up near the 0.80 level and the upper trend line of the daily chart’s trading channel for much of the week until Friday. ECB stimulus news, which was bearish for the EUR, then sent this pair lower.
The GBP isn’t without its own problems though with UKIP and interest rate uncertainty impacting this currency.
The E/G is trading in the 4hr Cloud, just below daily Cloud and well below the weekly and monthly Cloud.
- I’m watching the trading channel trend lines:

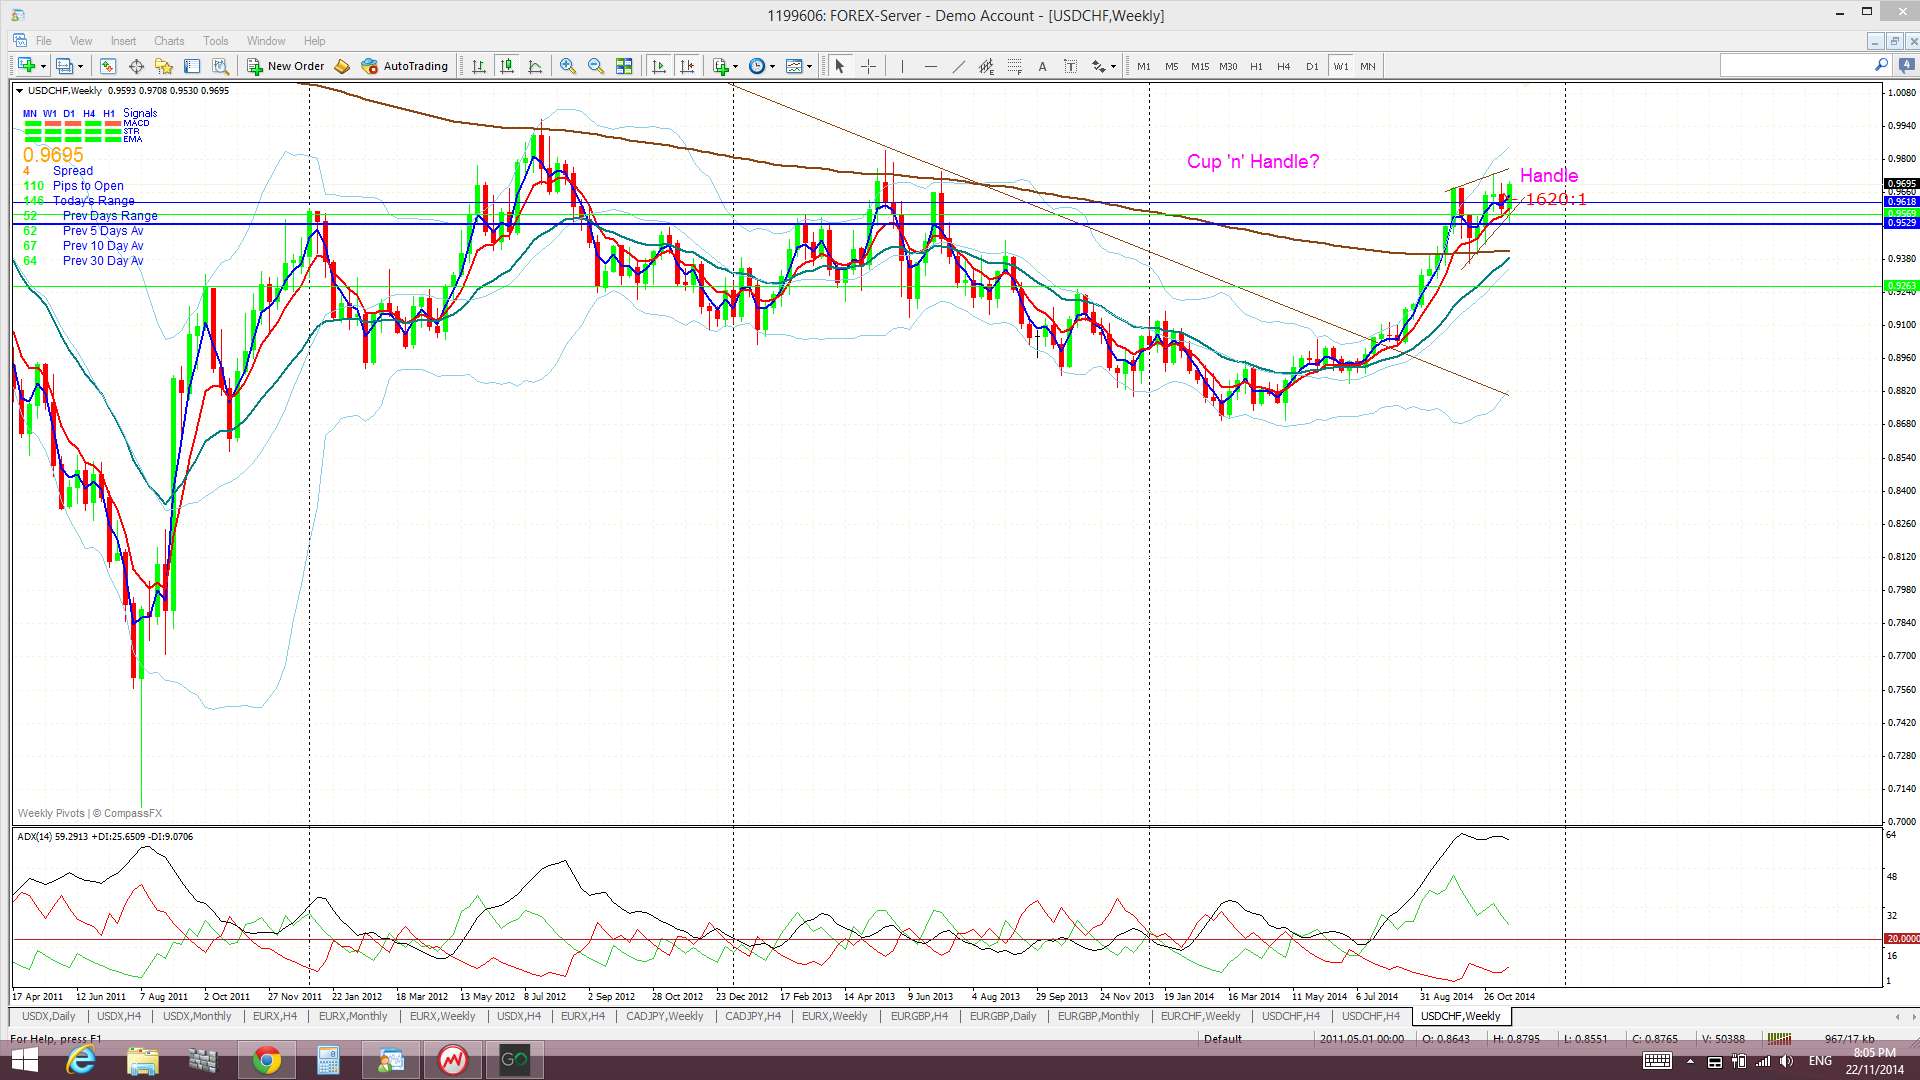
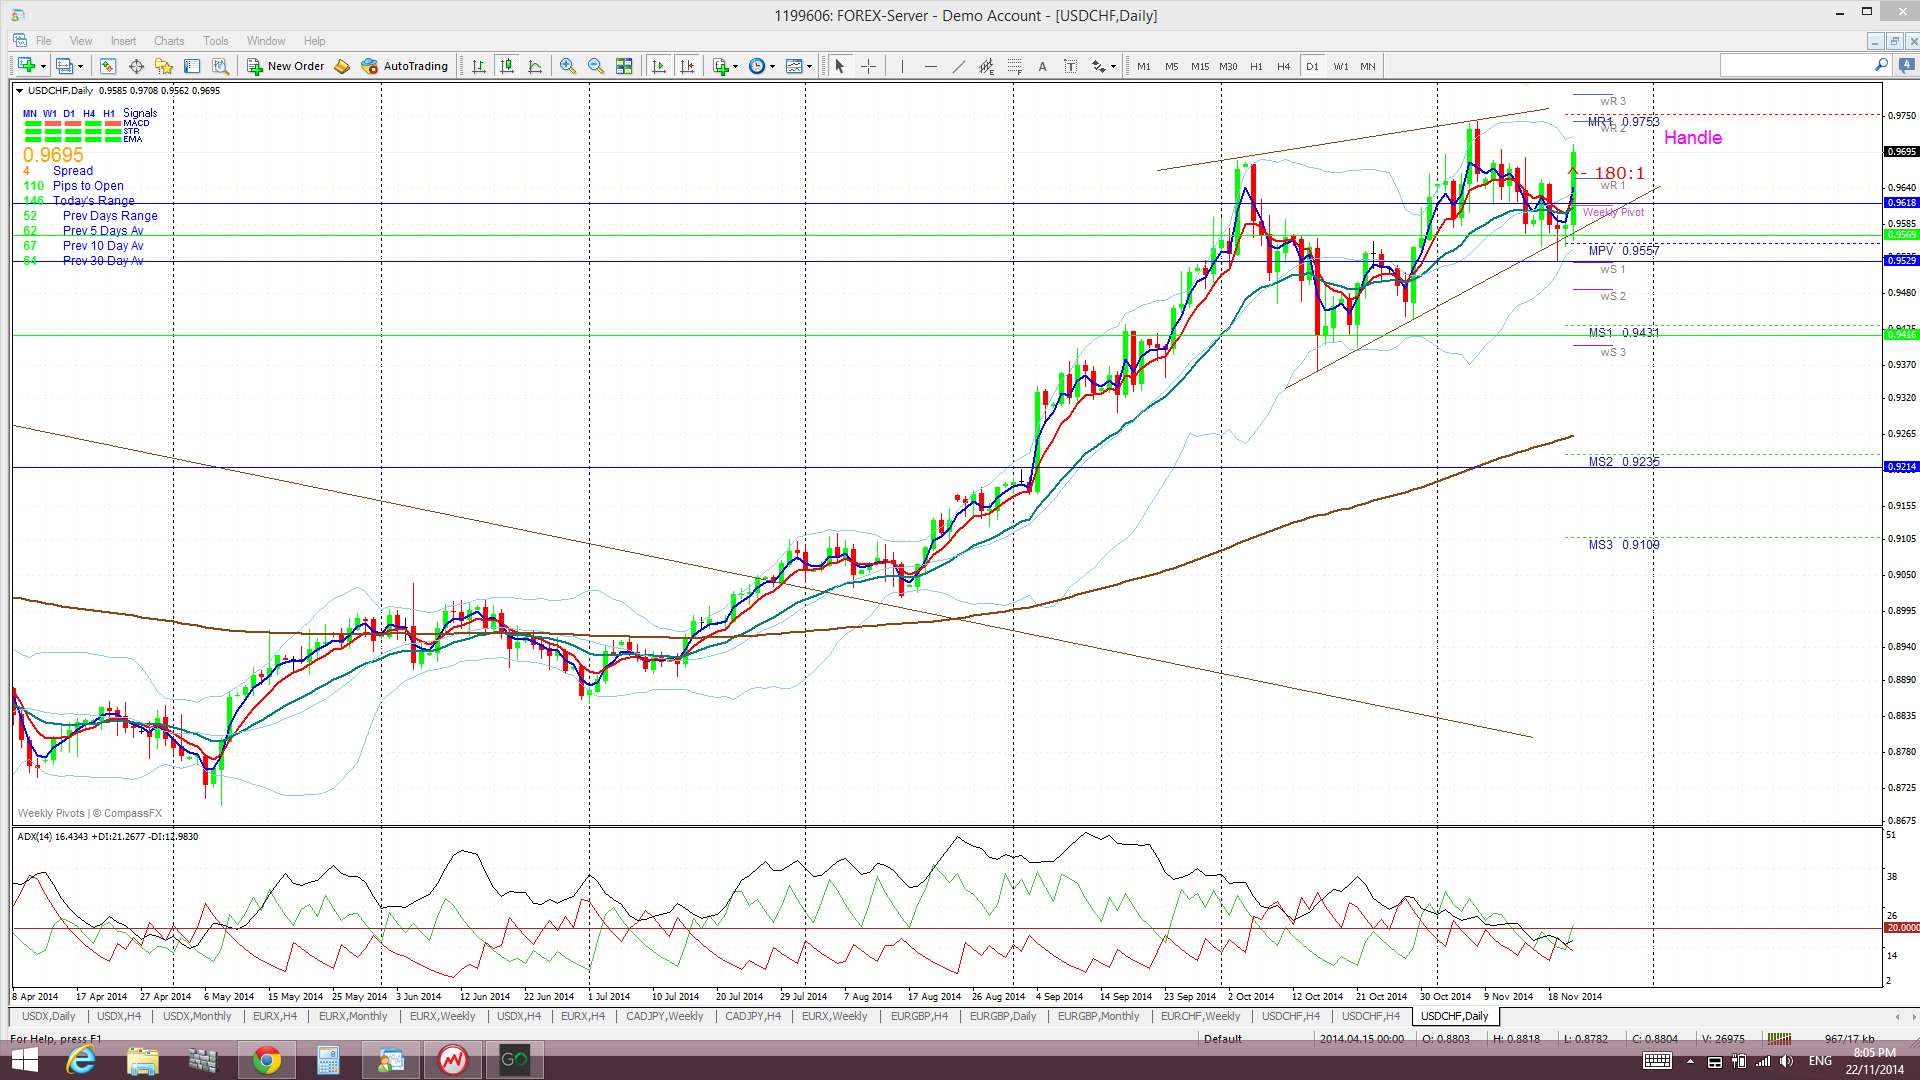
USD/CHF: I included this analysis last week and not much has changed. Price drifted lower to start the week but bounced up off the bottom trend line of the ‘Handle’ pattern from the weekly chart’s bullish Cup ‘n’ Handle pattern.
This bullish Cup ‘n’ Handle pattern is brewing on the weekly chart BUT, given the Swiss Referendum on Nov 30th, I’d be waiting until after then to confirm any such pattern. Fundamental news events will always trump a technically based move.
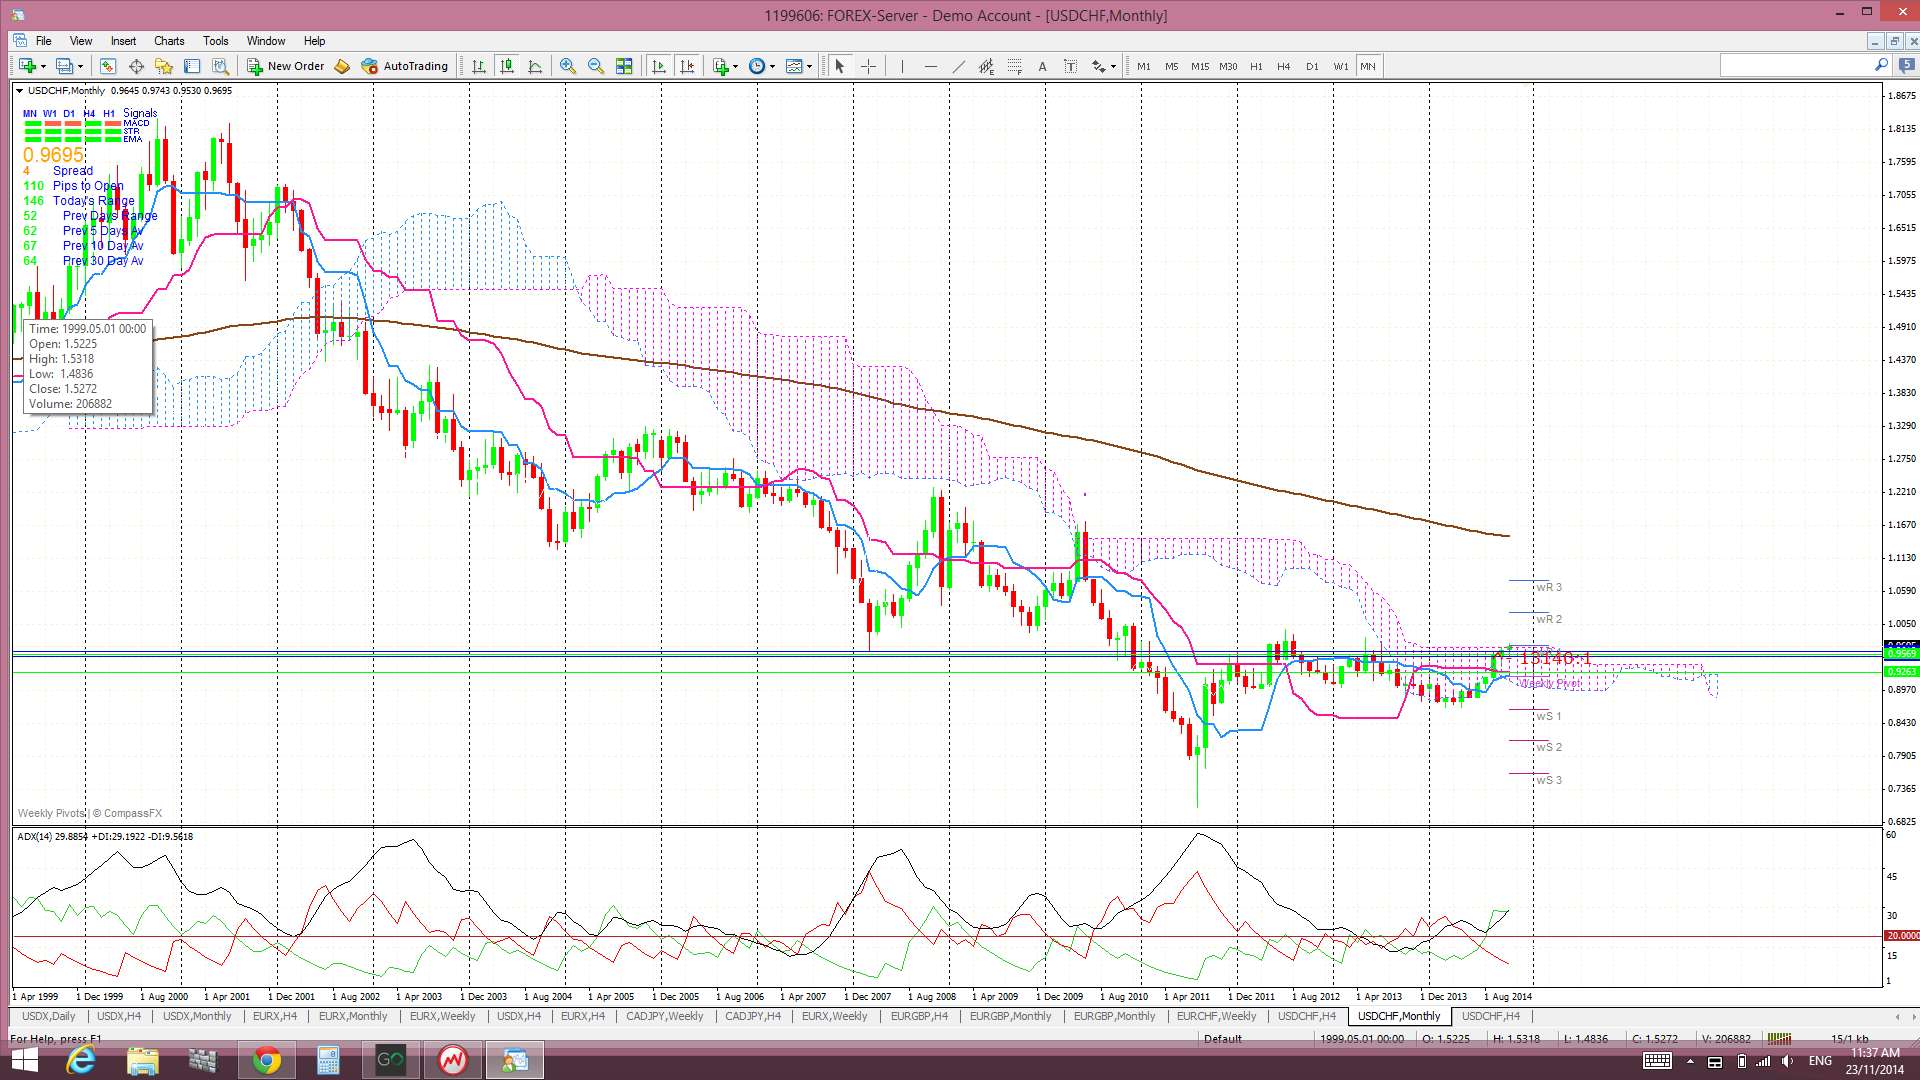
The more significant technical feature of note is the inflection-point shift seen on the monthly chart. A 14 year bear trend line was broken back in July and this major shift was associated with strong momentum, as reflected by the ADX. This polarity shift alone supports a long trade focus but, as mentioned above, I’d be waiting until the Referendum is out of the way as I think price action could chop around until then, thereby helping to form up the ‘Handle’ of any Cup ‘n’ Handle pattern!
The Swissie is now back trading above the Cloud on the 4hr, daily,weekly and monthly charts. The more interesting chart is the monthly Ichimoku chart. The Swissie is trading just above the top edge of the Cloud on the monthly chart and any close above hold above this Cloud for November would support the polarity shift seen with the monthly chart’s trend line break.
- I’m watching for any breakout from the ‘Handle’ pattern AFTER the Nov 30 Referendum.


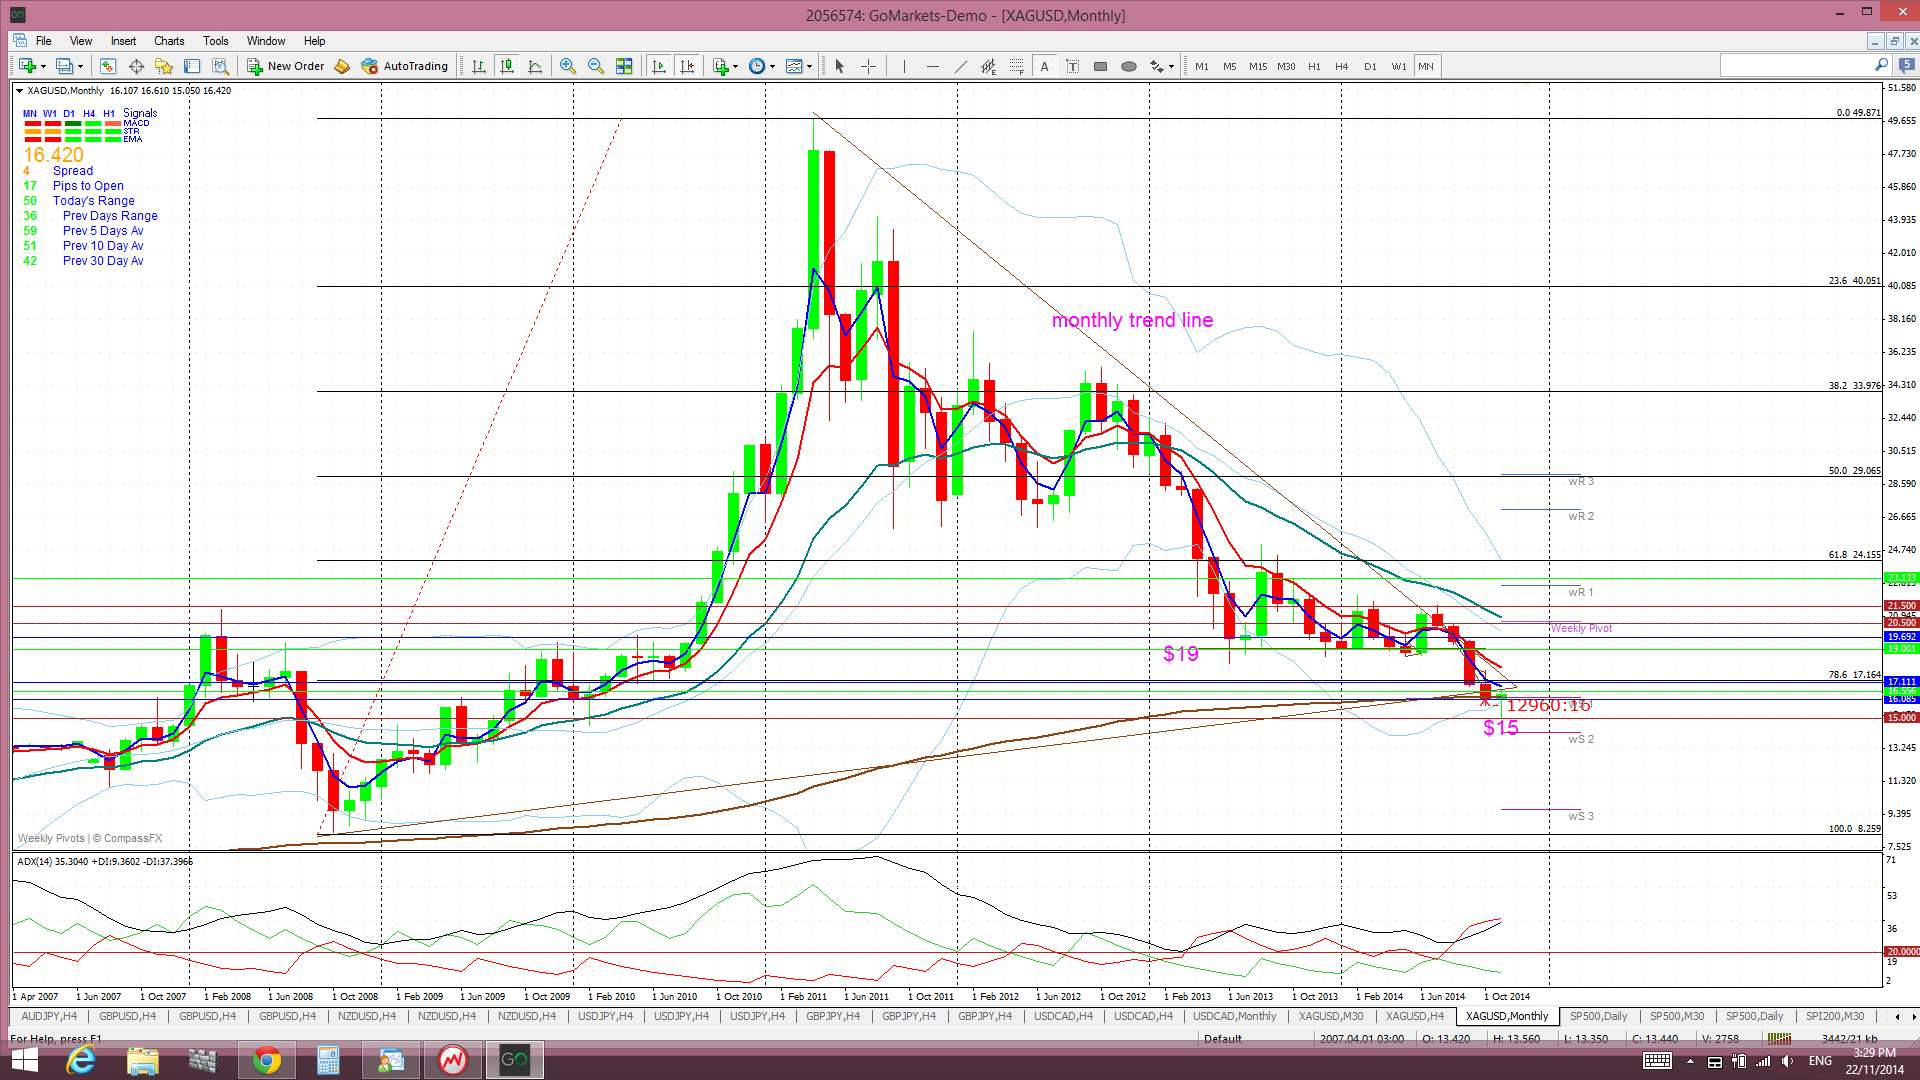
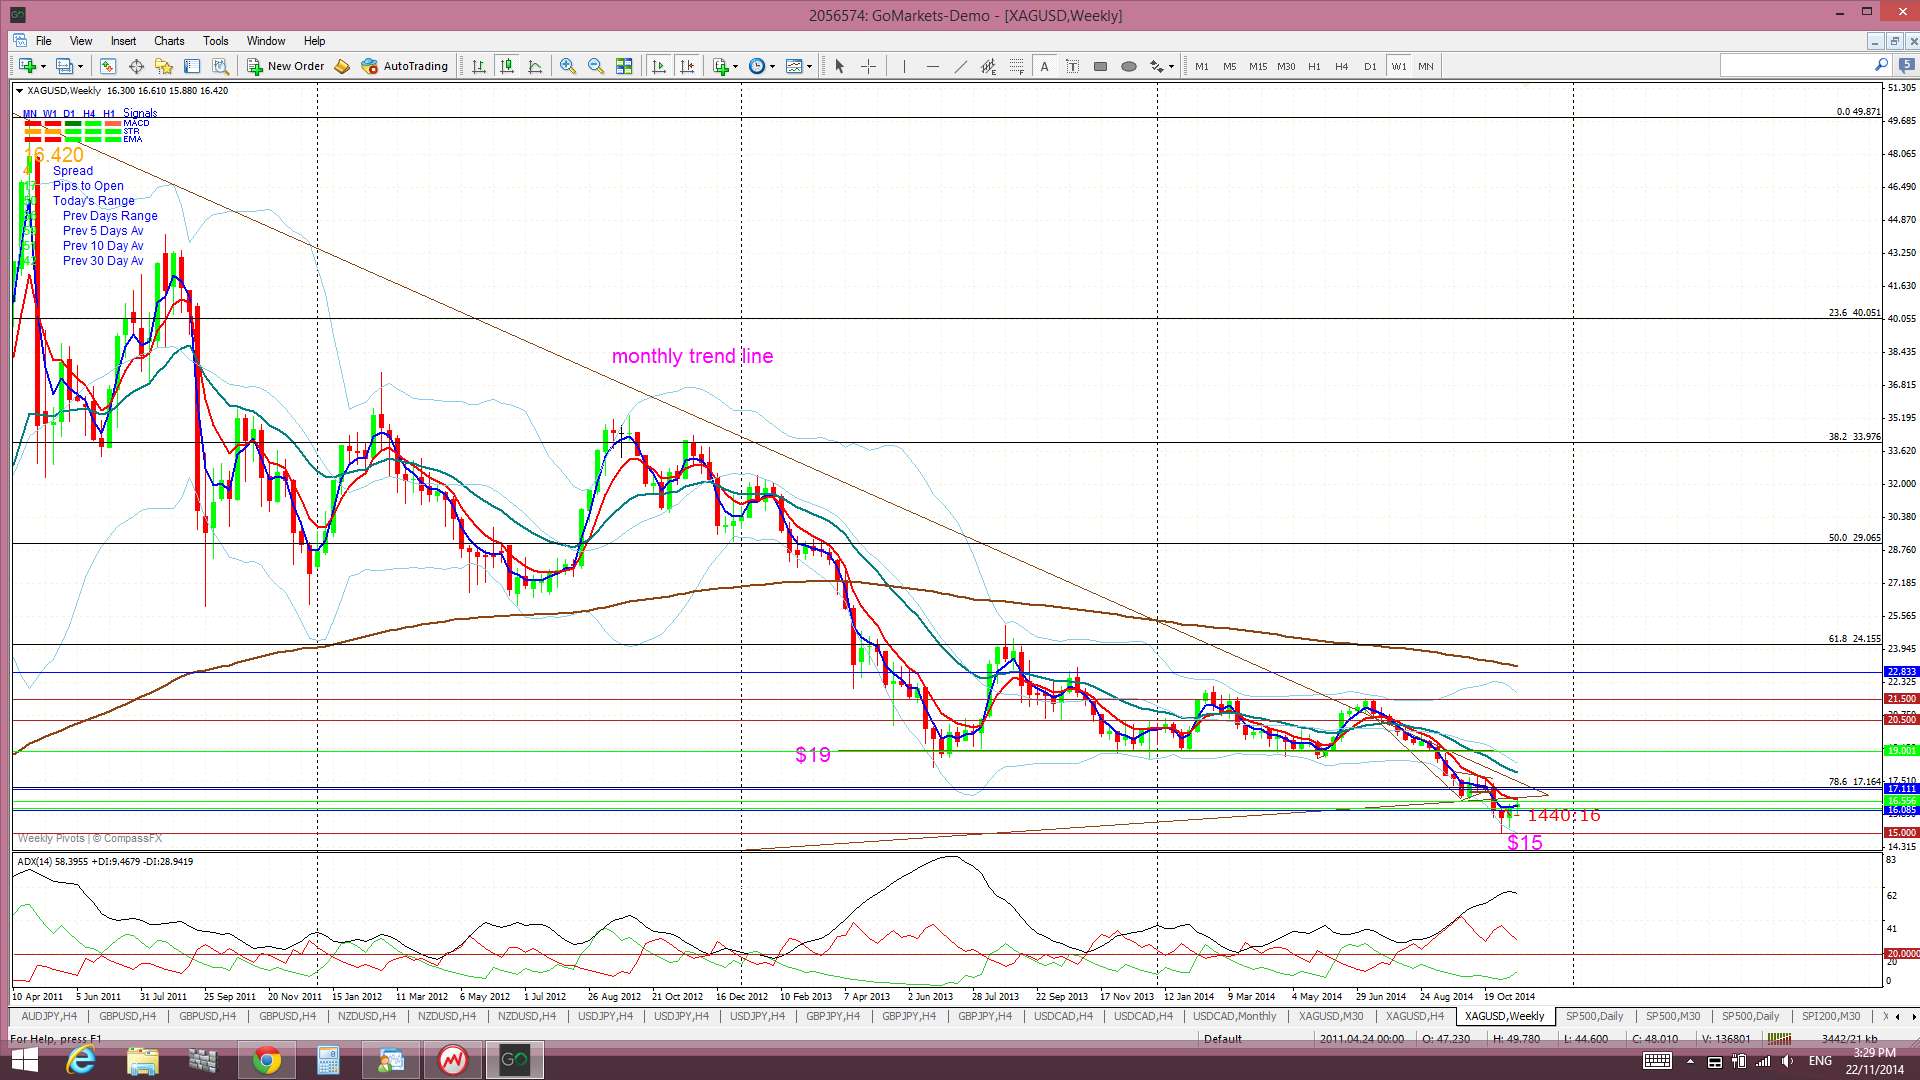
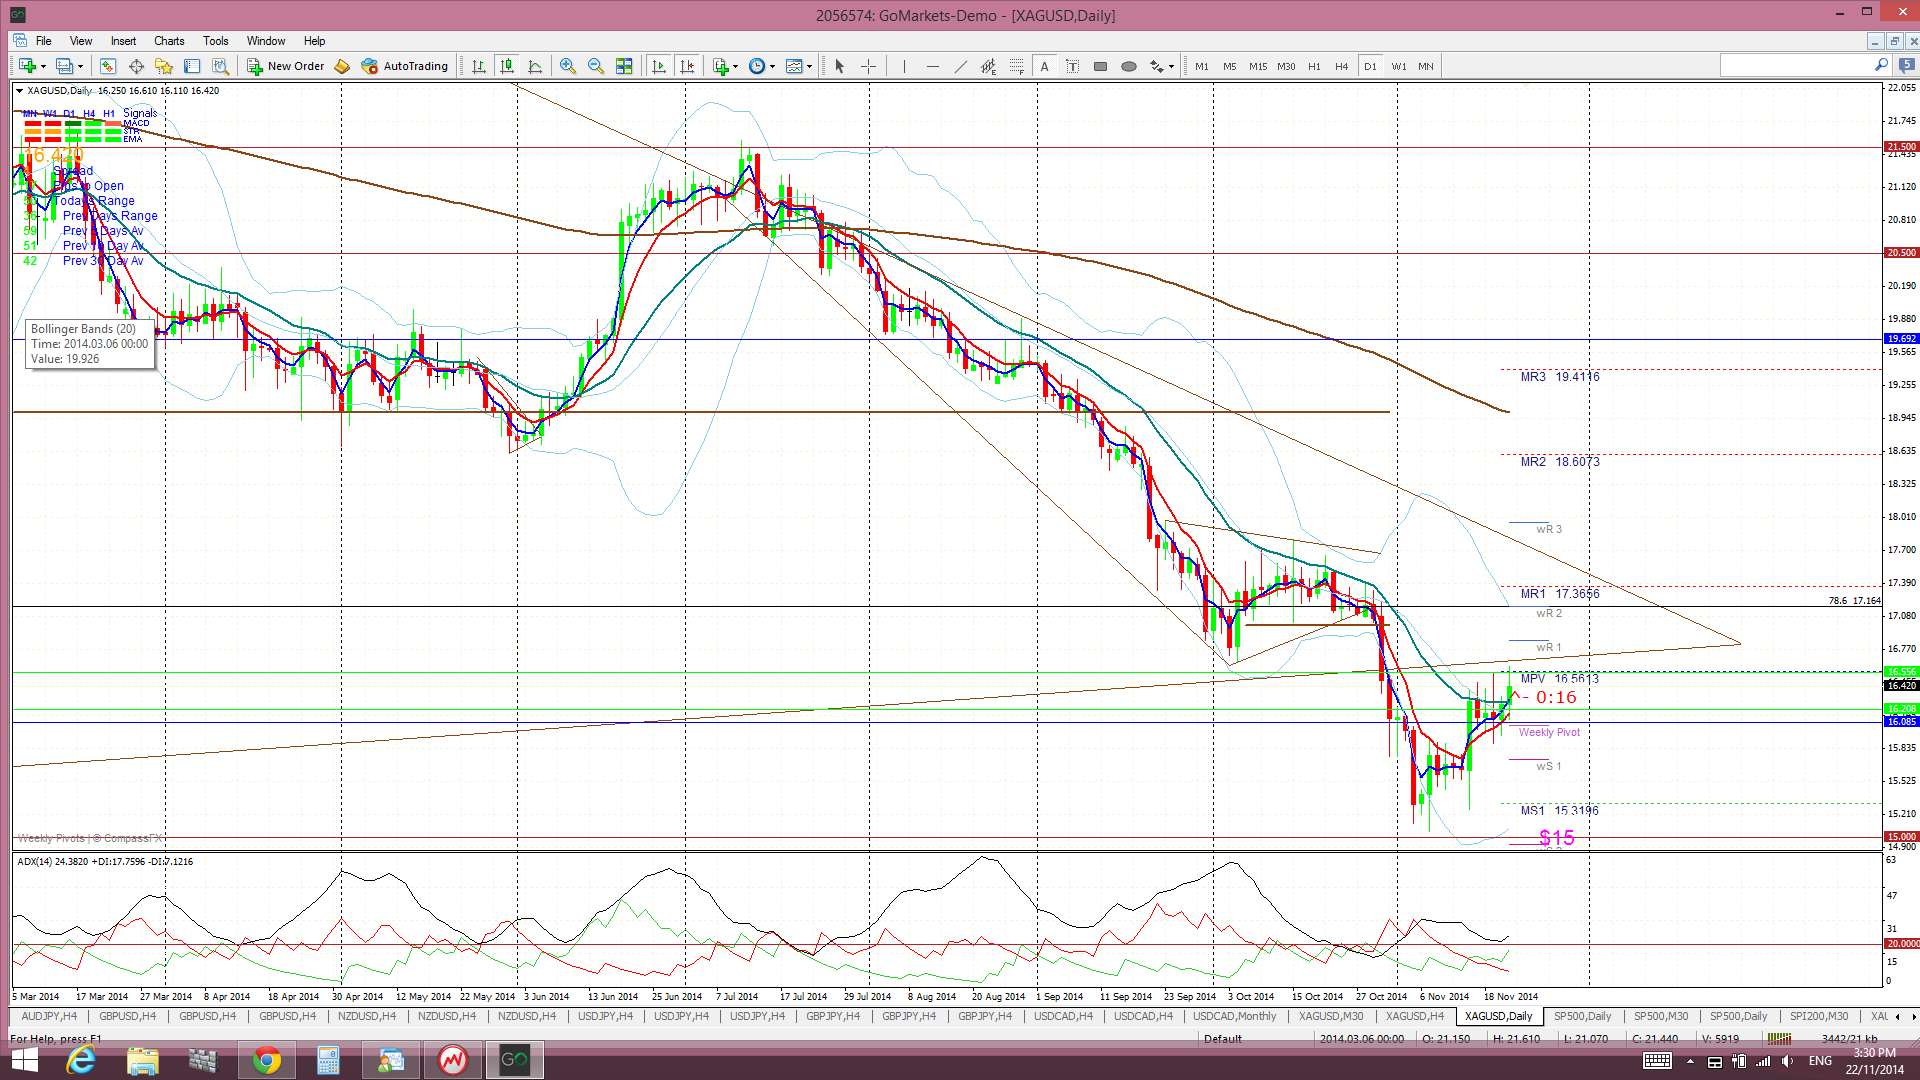
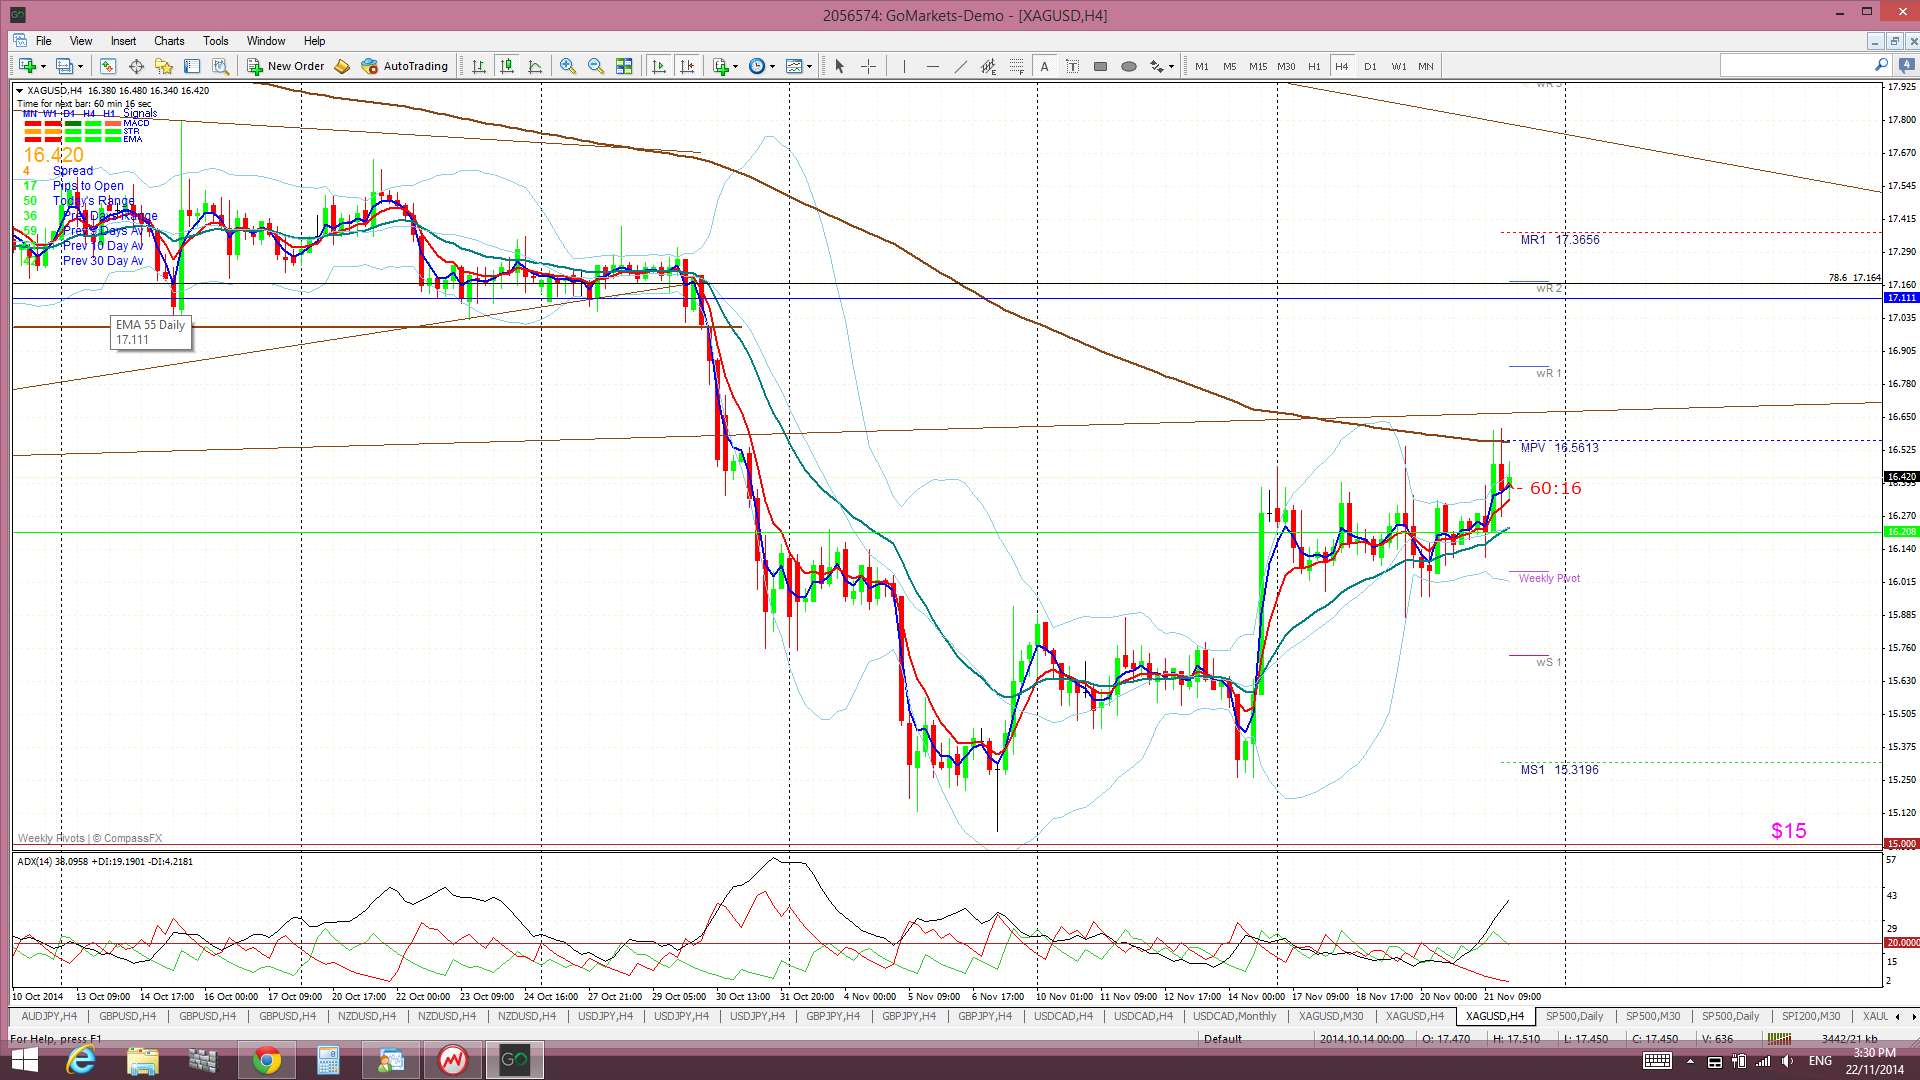
Silver: Silver essentially chopped sideways along the daily 200 EMA and above the $15 level support all week but picked up a bit on Friday following the Chinese rate cut news.
Silver is still trading above the Ichimoku Cloud on the 4hr chart but below the Cloud on the daily, weekly and monthly charts.
The weekly candle closed as a bullish coloured ‘Spinning Top’ and this follows on from last week’s bullish engulfing candle.
The monthly candle still has a week to close but, at the moment, it is printing a bullish-reversal ‘hammer’ candle. If this holds out for next week’s close it would be a rather bullish signal, especially so as it will form up off major $15 support.
- I’m watching for any new TC signal and the $15 level.
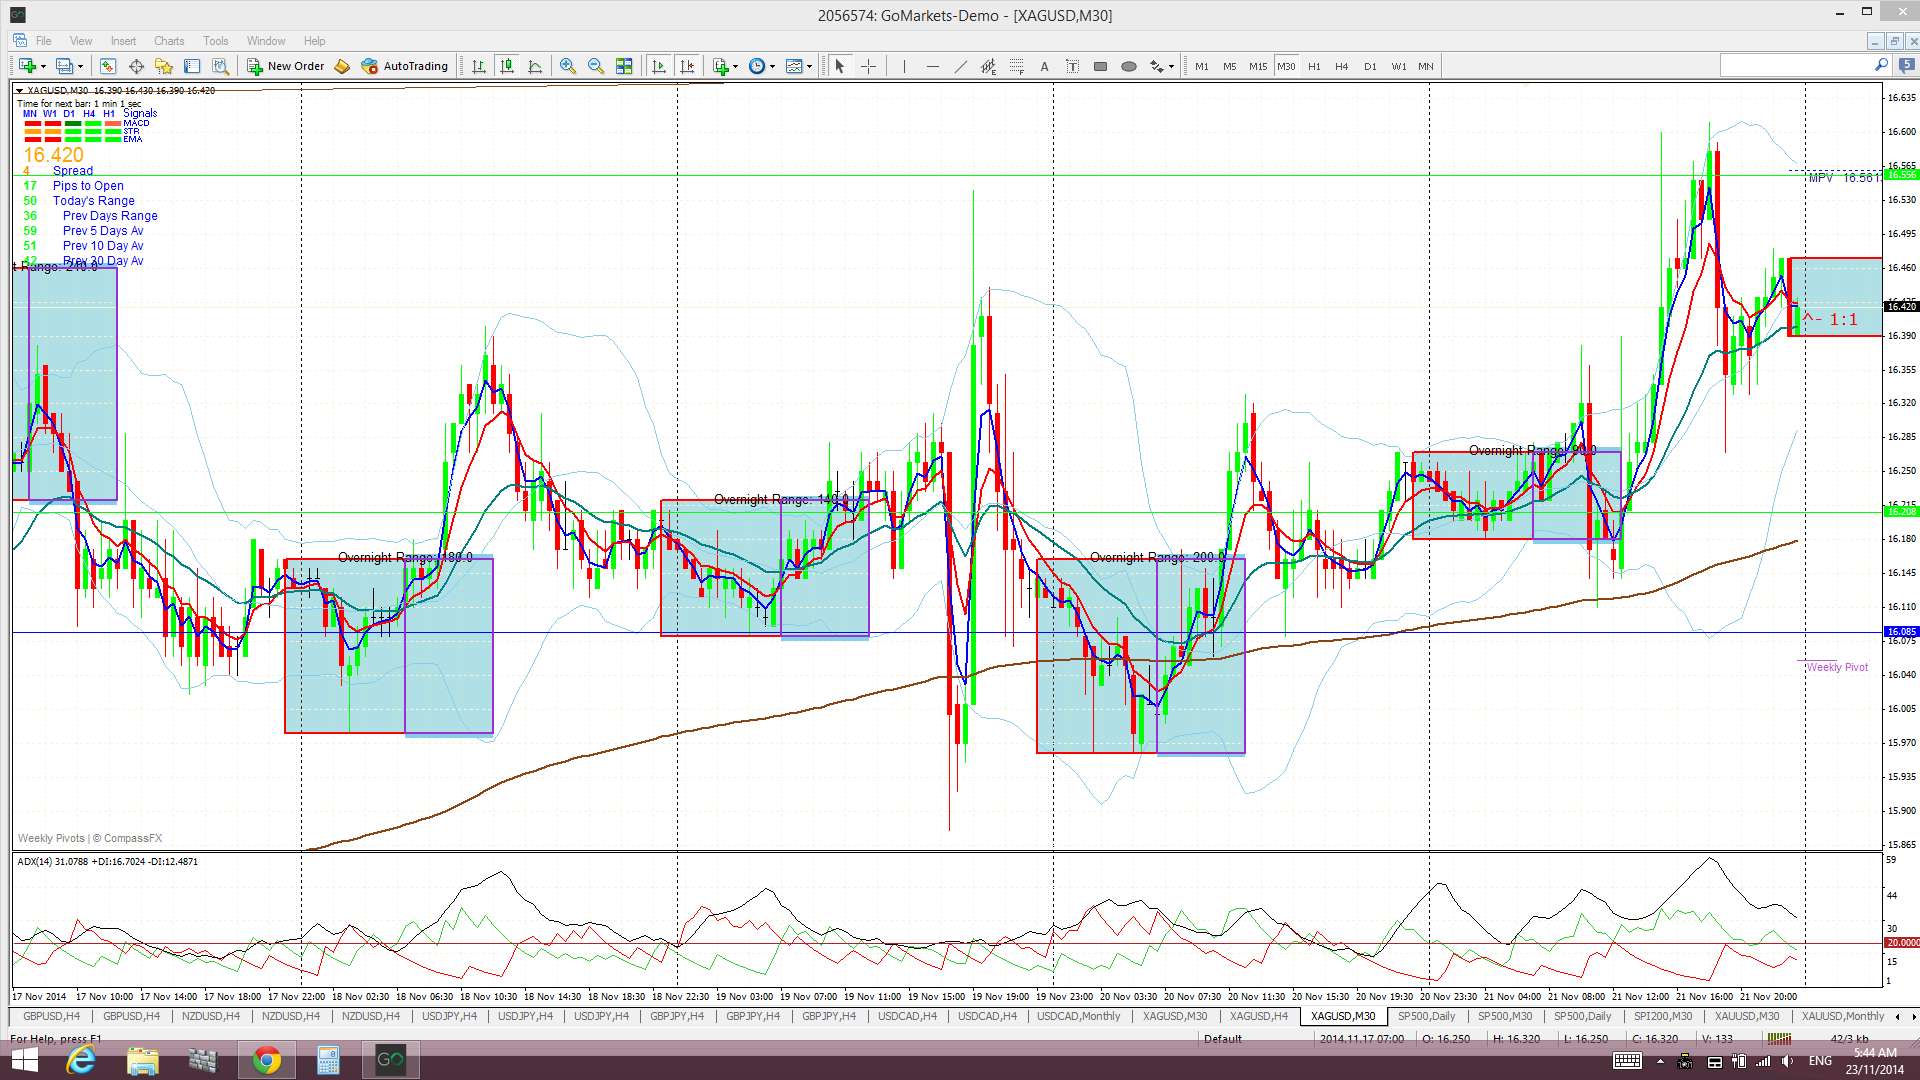
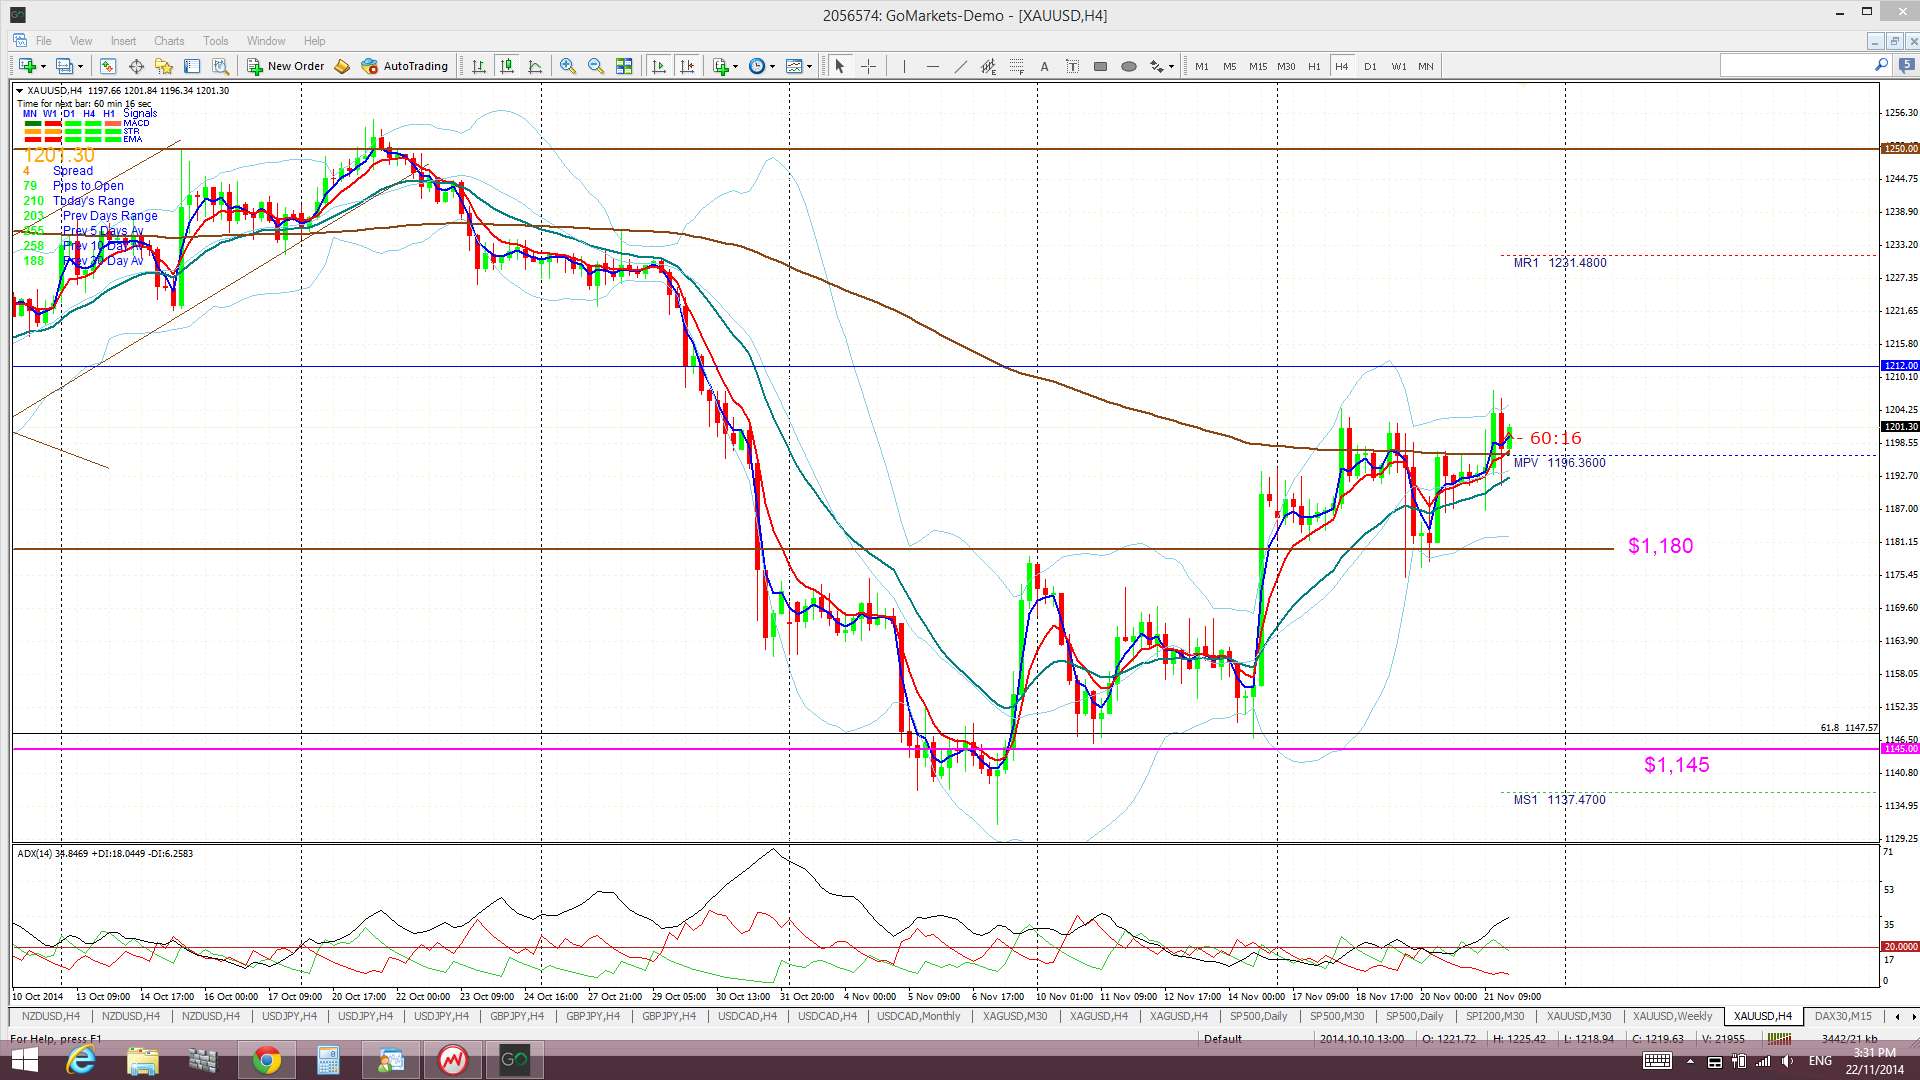
Gold: Gold chopped around above the $1,180 level all week and even managed to close the week back above the psychological $1,200 level.
Gold could continue to chop around between the key S/R levels of $1,180 and the 61.8% fib near $1,145 until the Nov 30 Swiss Referendum. It was very choppy last week as the 30 min chart shows. Note, also, how priced chopped higher on Friday despite the USD also having a bullish day. I’m not sure whether the bullish Gold sentiment was driven by Referendum issues or from Chinese rate cut news but this is further proof to me that Gold might be best left until after Nov 30!
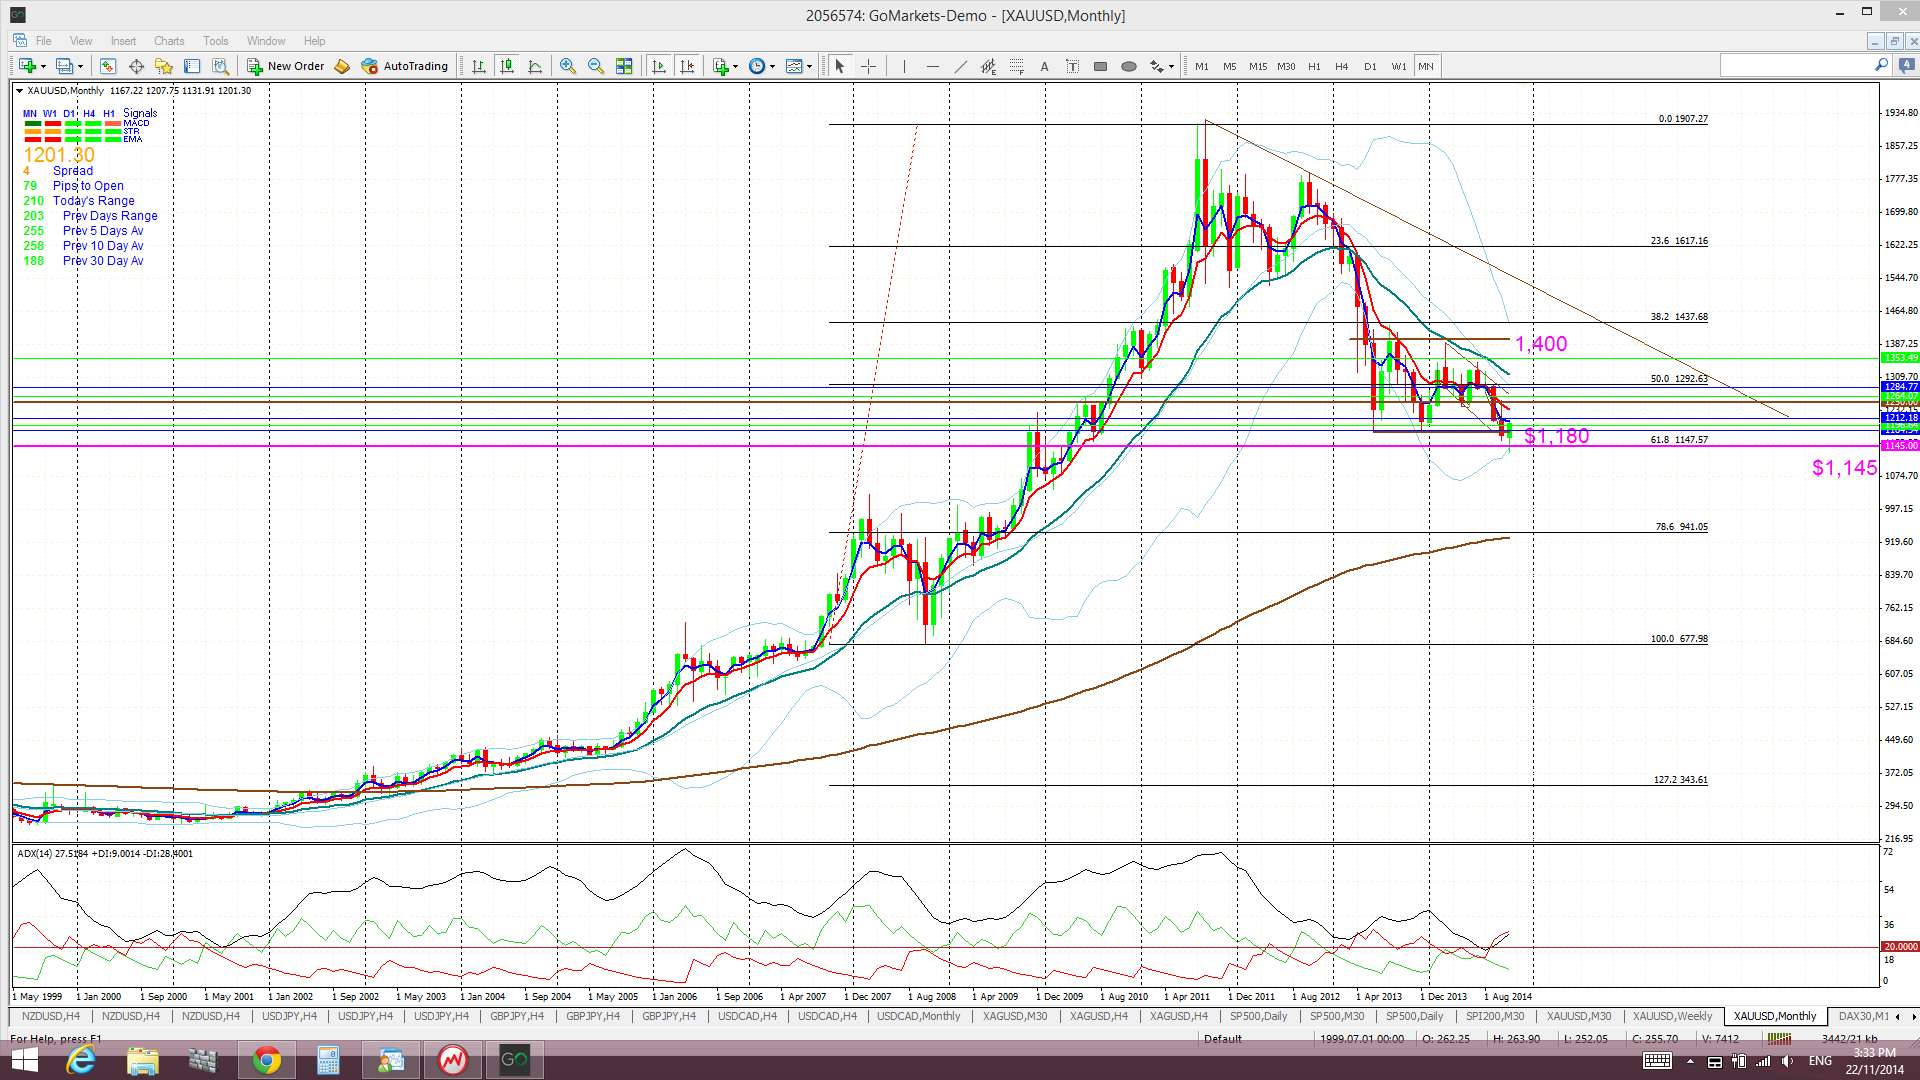
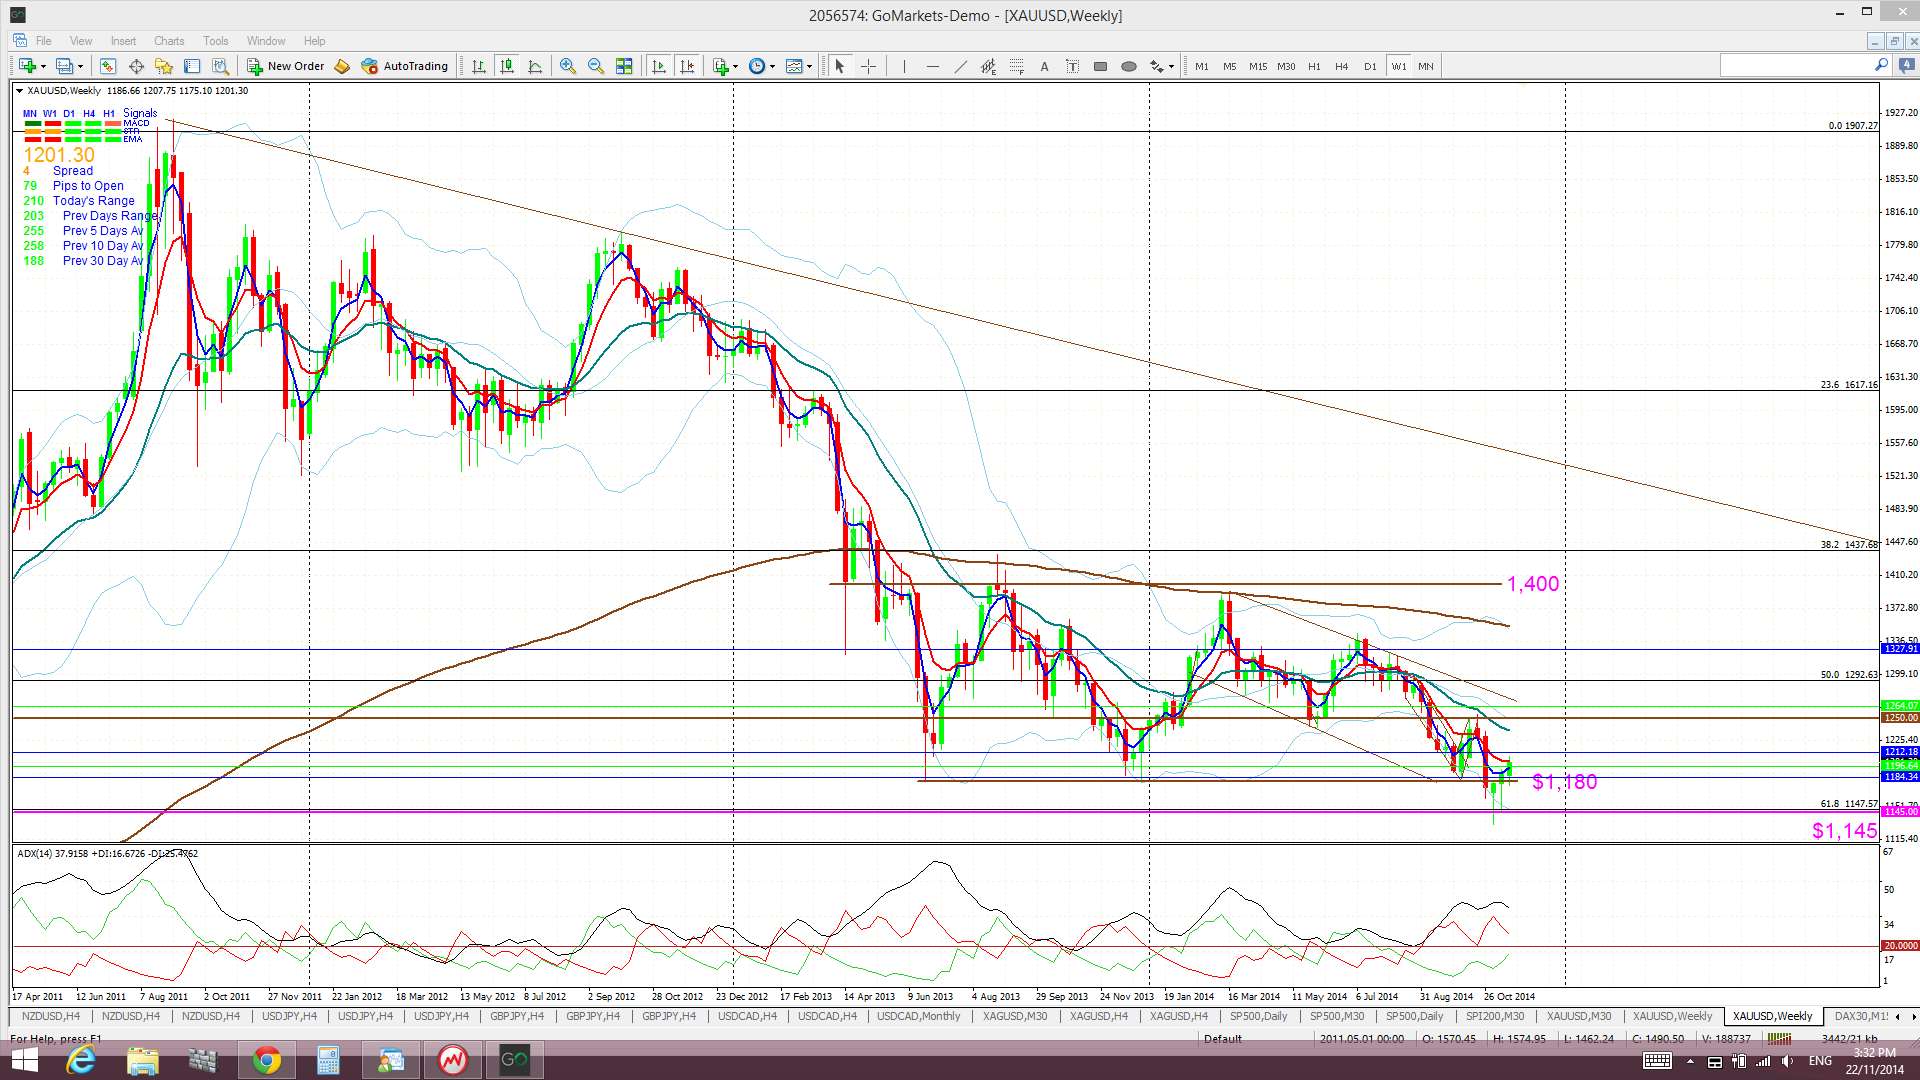
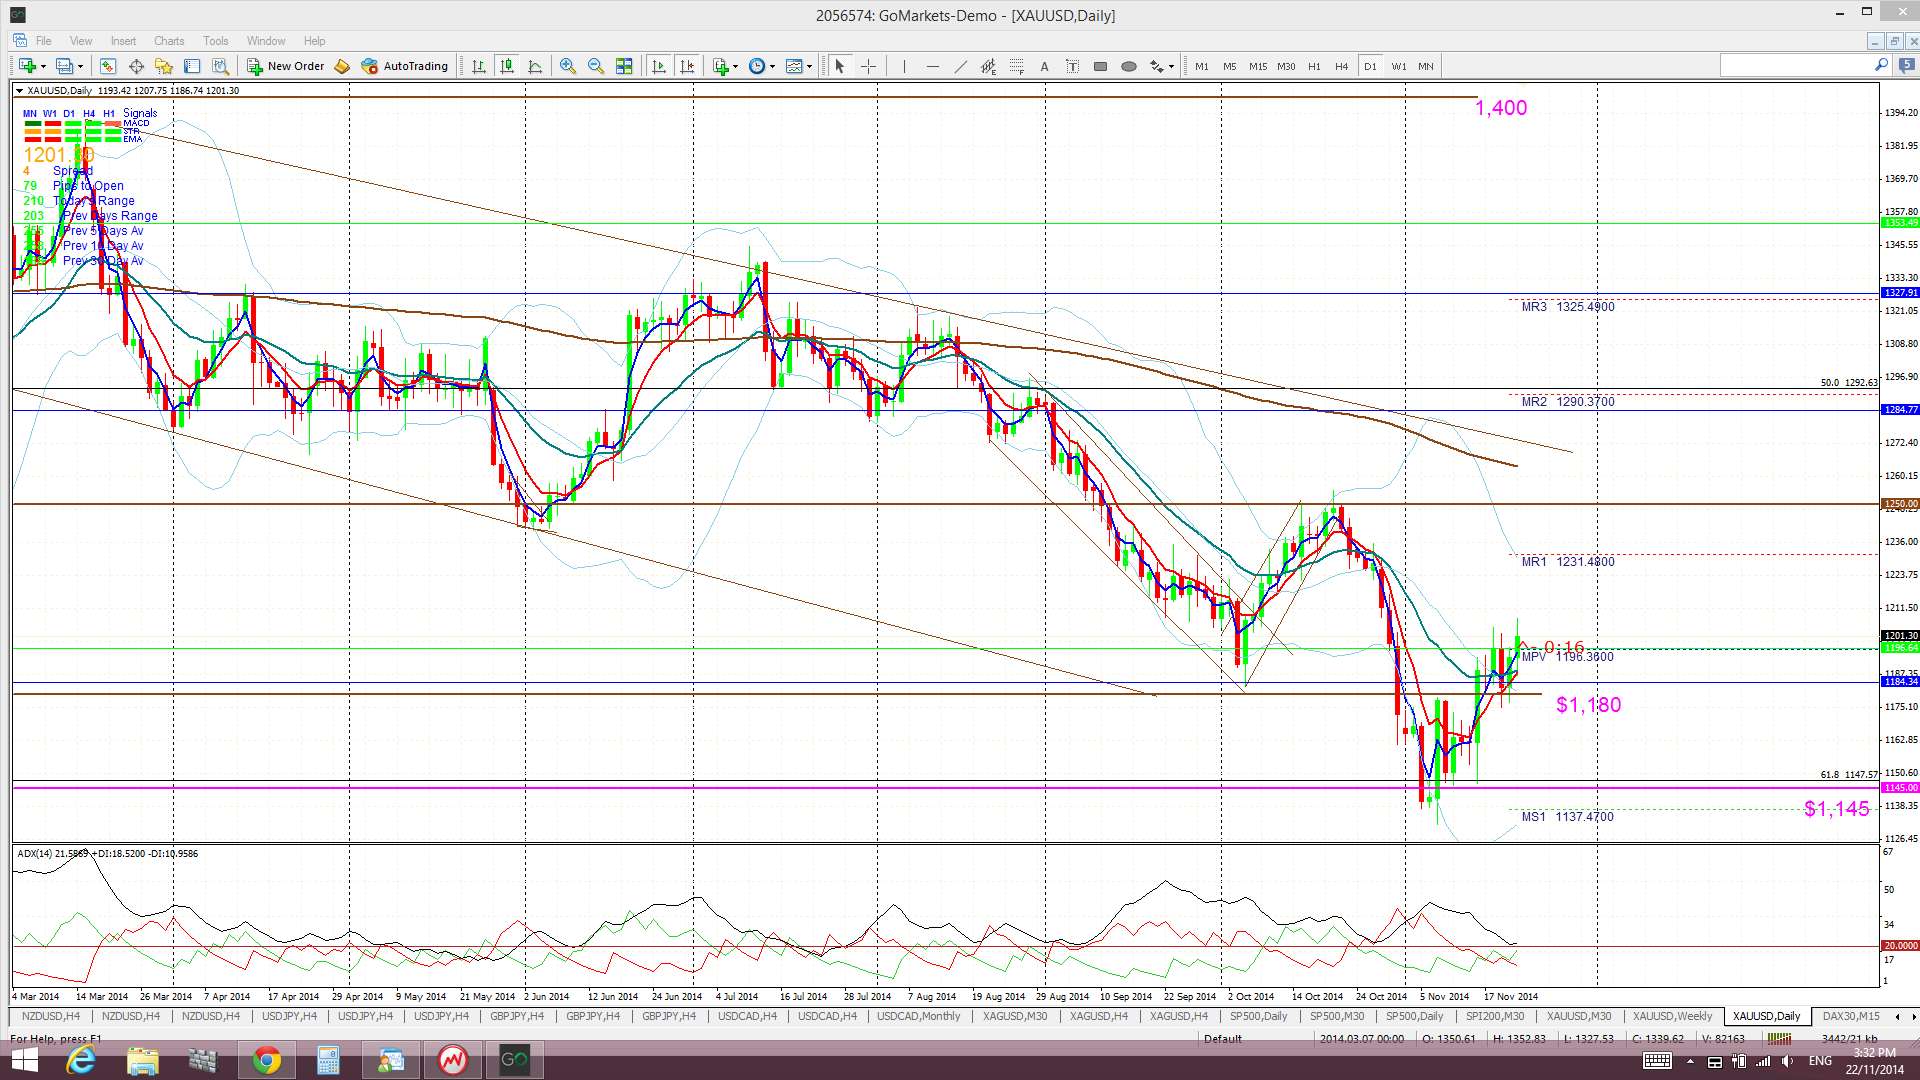
Gold is still trading above the Ichimoku Cloud on the 4hr chart but below the Cloud on the daily, weekly and monthly charts.
The weekly candle closed as a bullish candle and this makes two bullish candles since the earlier bullish-reversal ‘Hammer’ candle. The monthly candle, with a week to close, is looking bullish though here as well.
- I’m watching for any new TC signal on this pair, the 61.8% fib near $1,145 level and the $1,180 level.
The post Trade Week Analysis: Central Banks driving moves. appeared first on www.forextell.com.