Last week: I’ve been away for the week but still managed to keep track of some great trend line breakout trades. These moves, from charts posted here last weekend, have given over 4,000 pips from FX charts and and 900 points from stock index charts. The prevarication with the US$ means there are more consolidation pattern trend lines in focus again this week.
Successful breakout trades: updates on these successful trend line breakout trades from the week can be found here, here and here.
- USD/JPY: 130 pips.
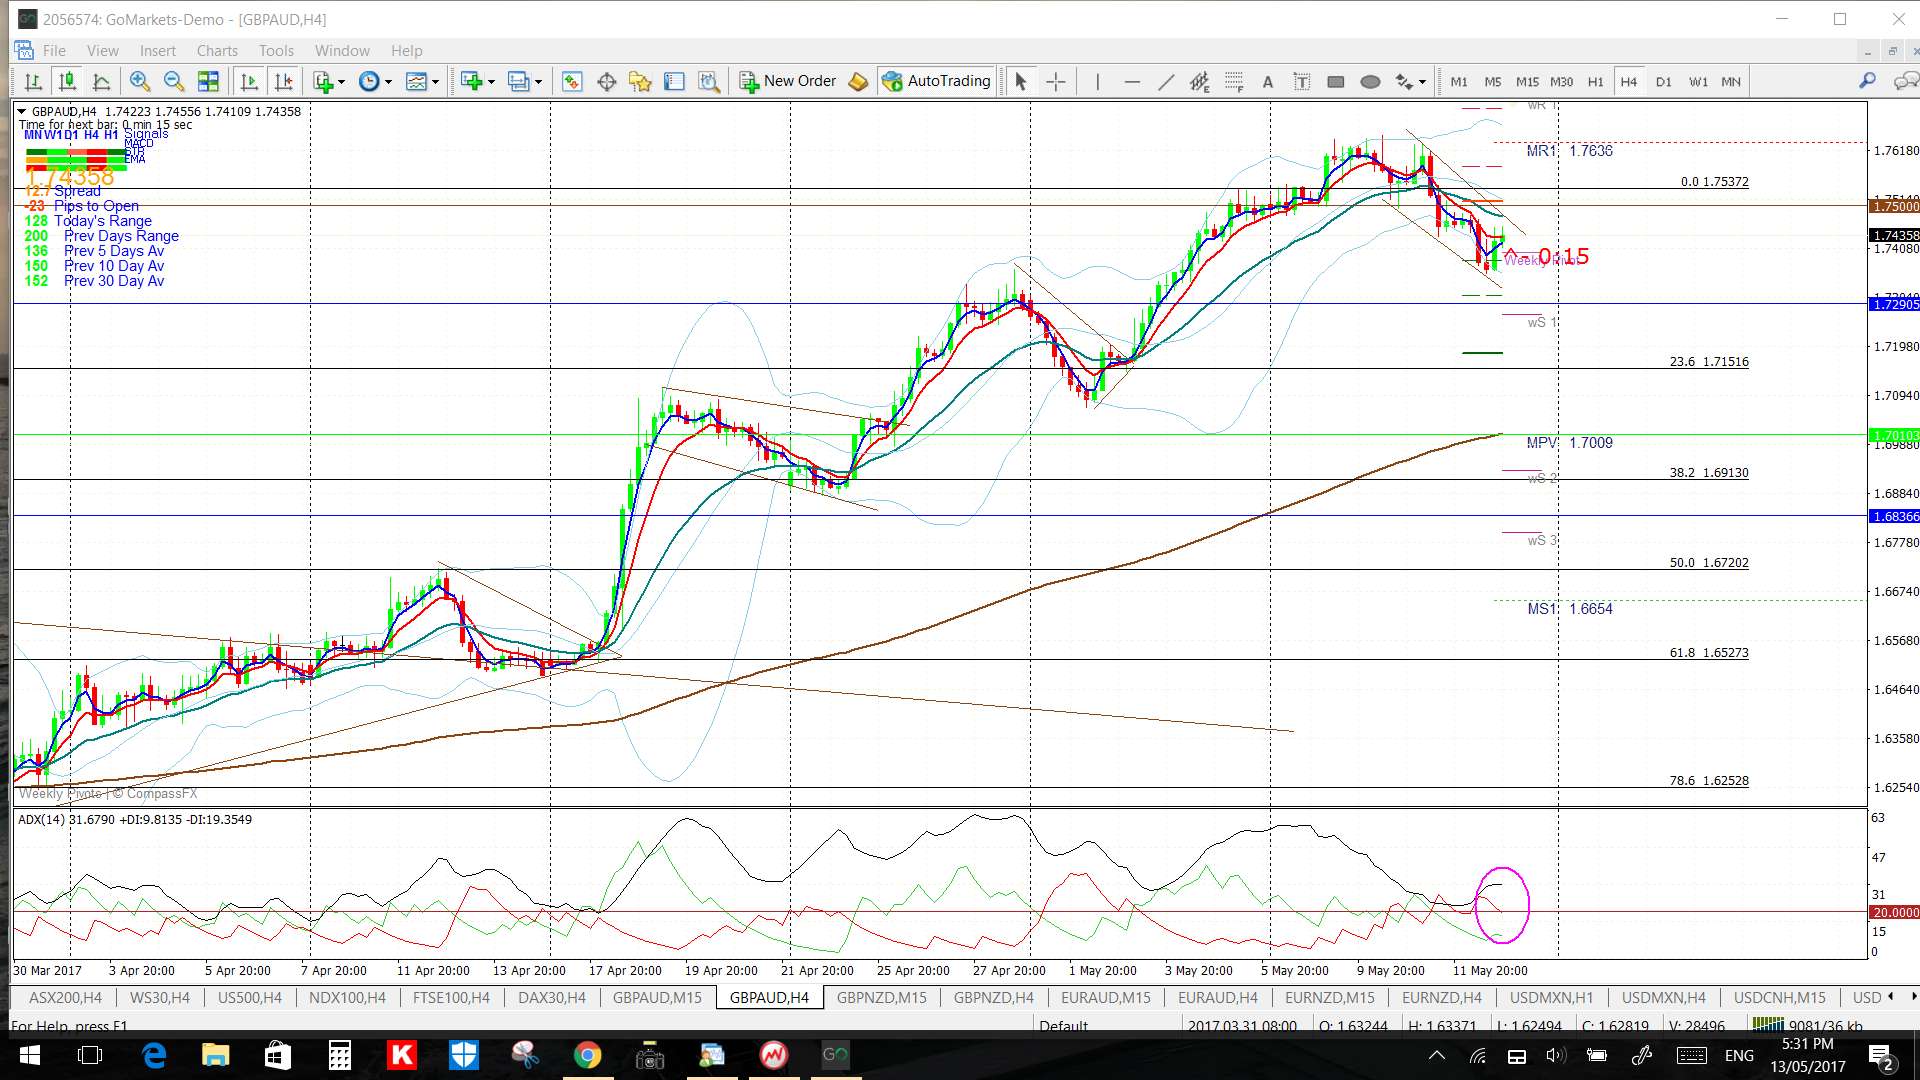
- GBP/AUD: 120 pips and another for 170 pips.
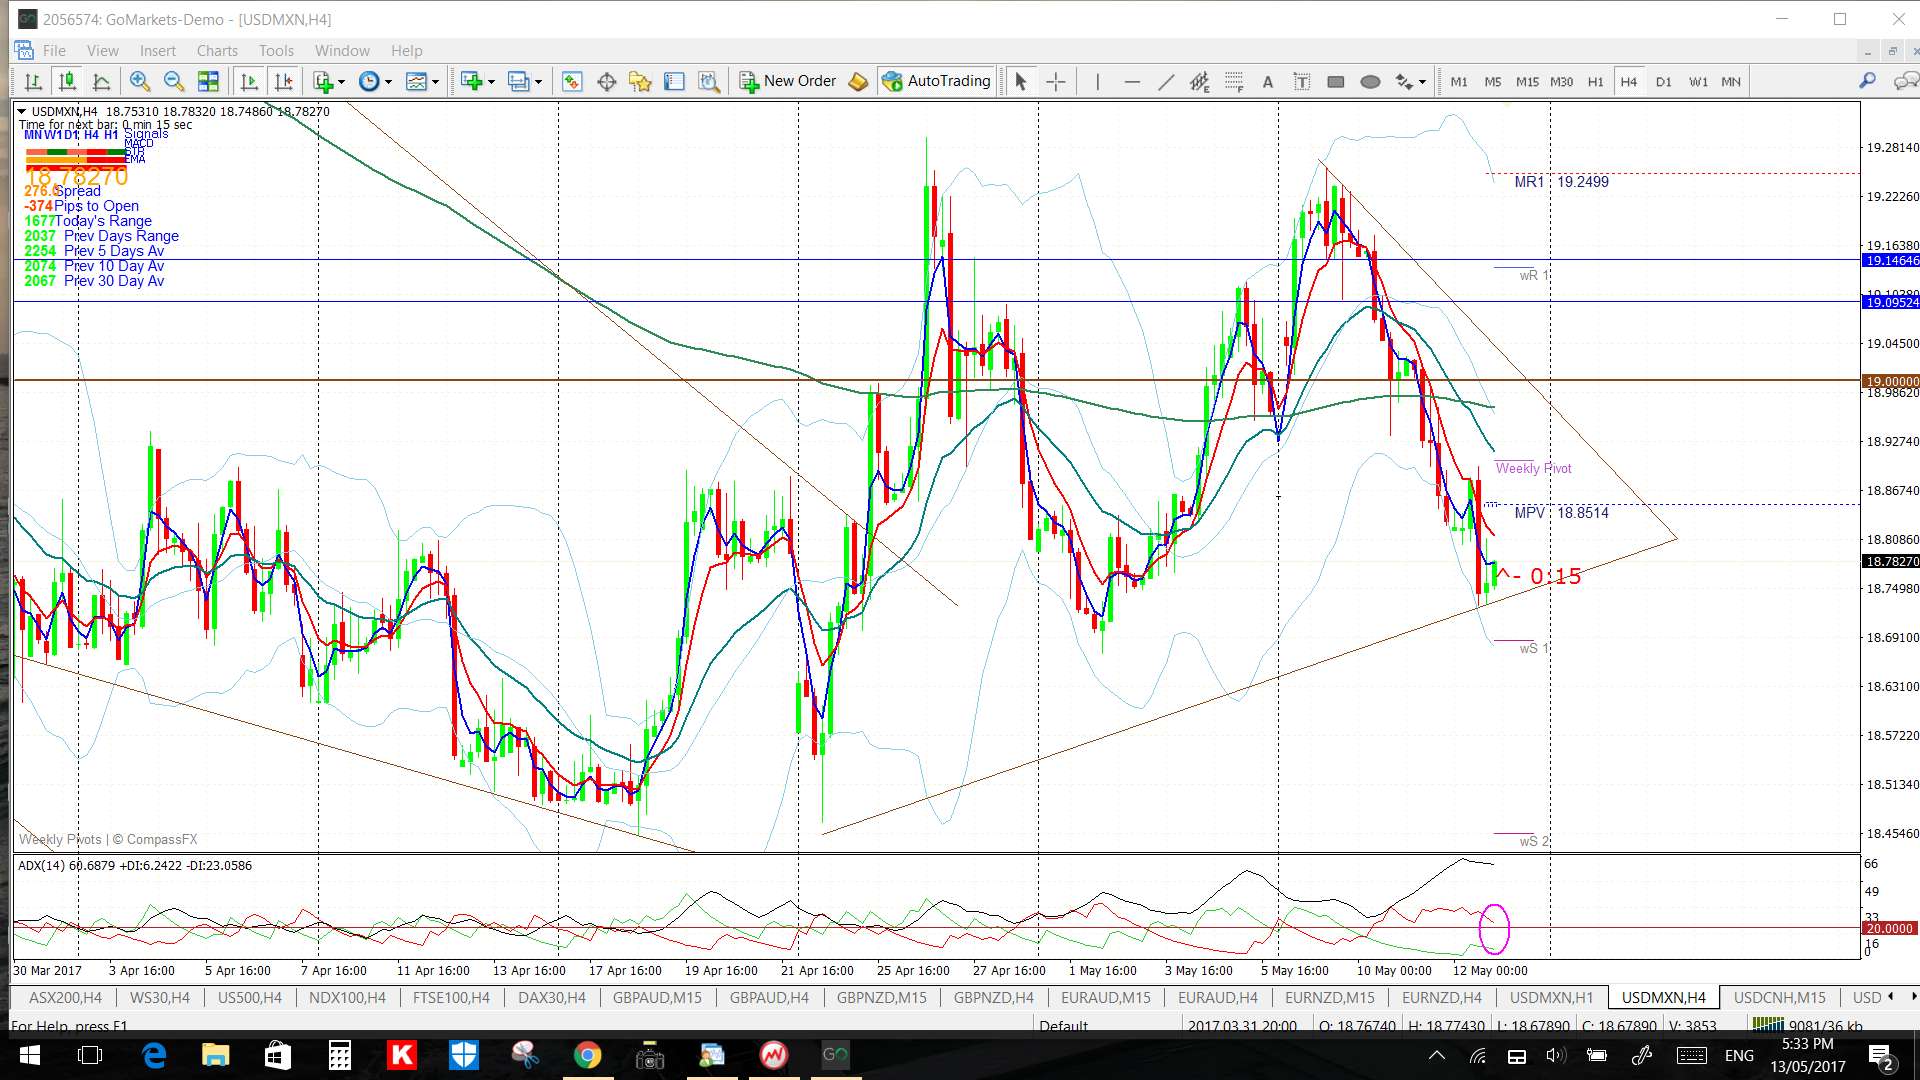
- USD/MXN: 1,500 pips and another for 2,300 pips.
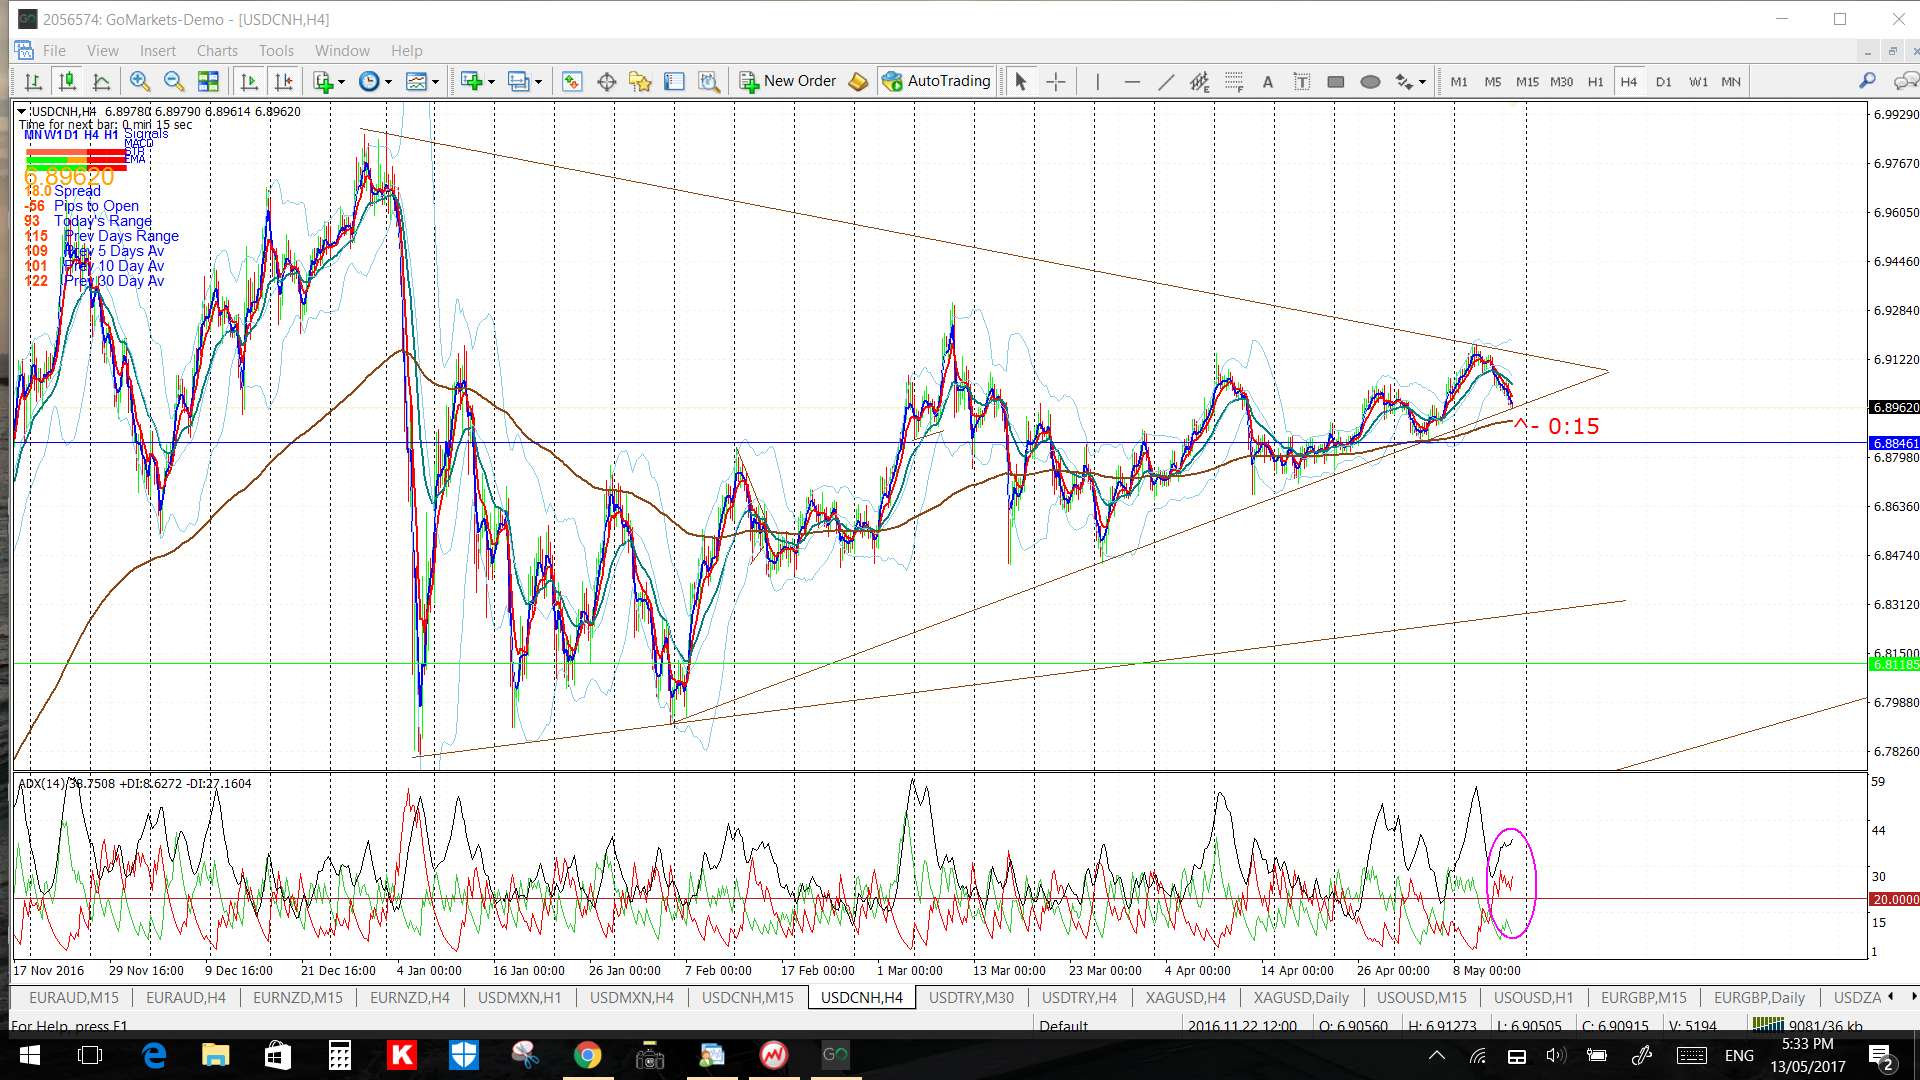
- USD/CNH: 150 pips.
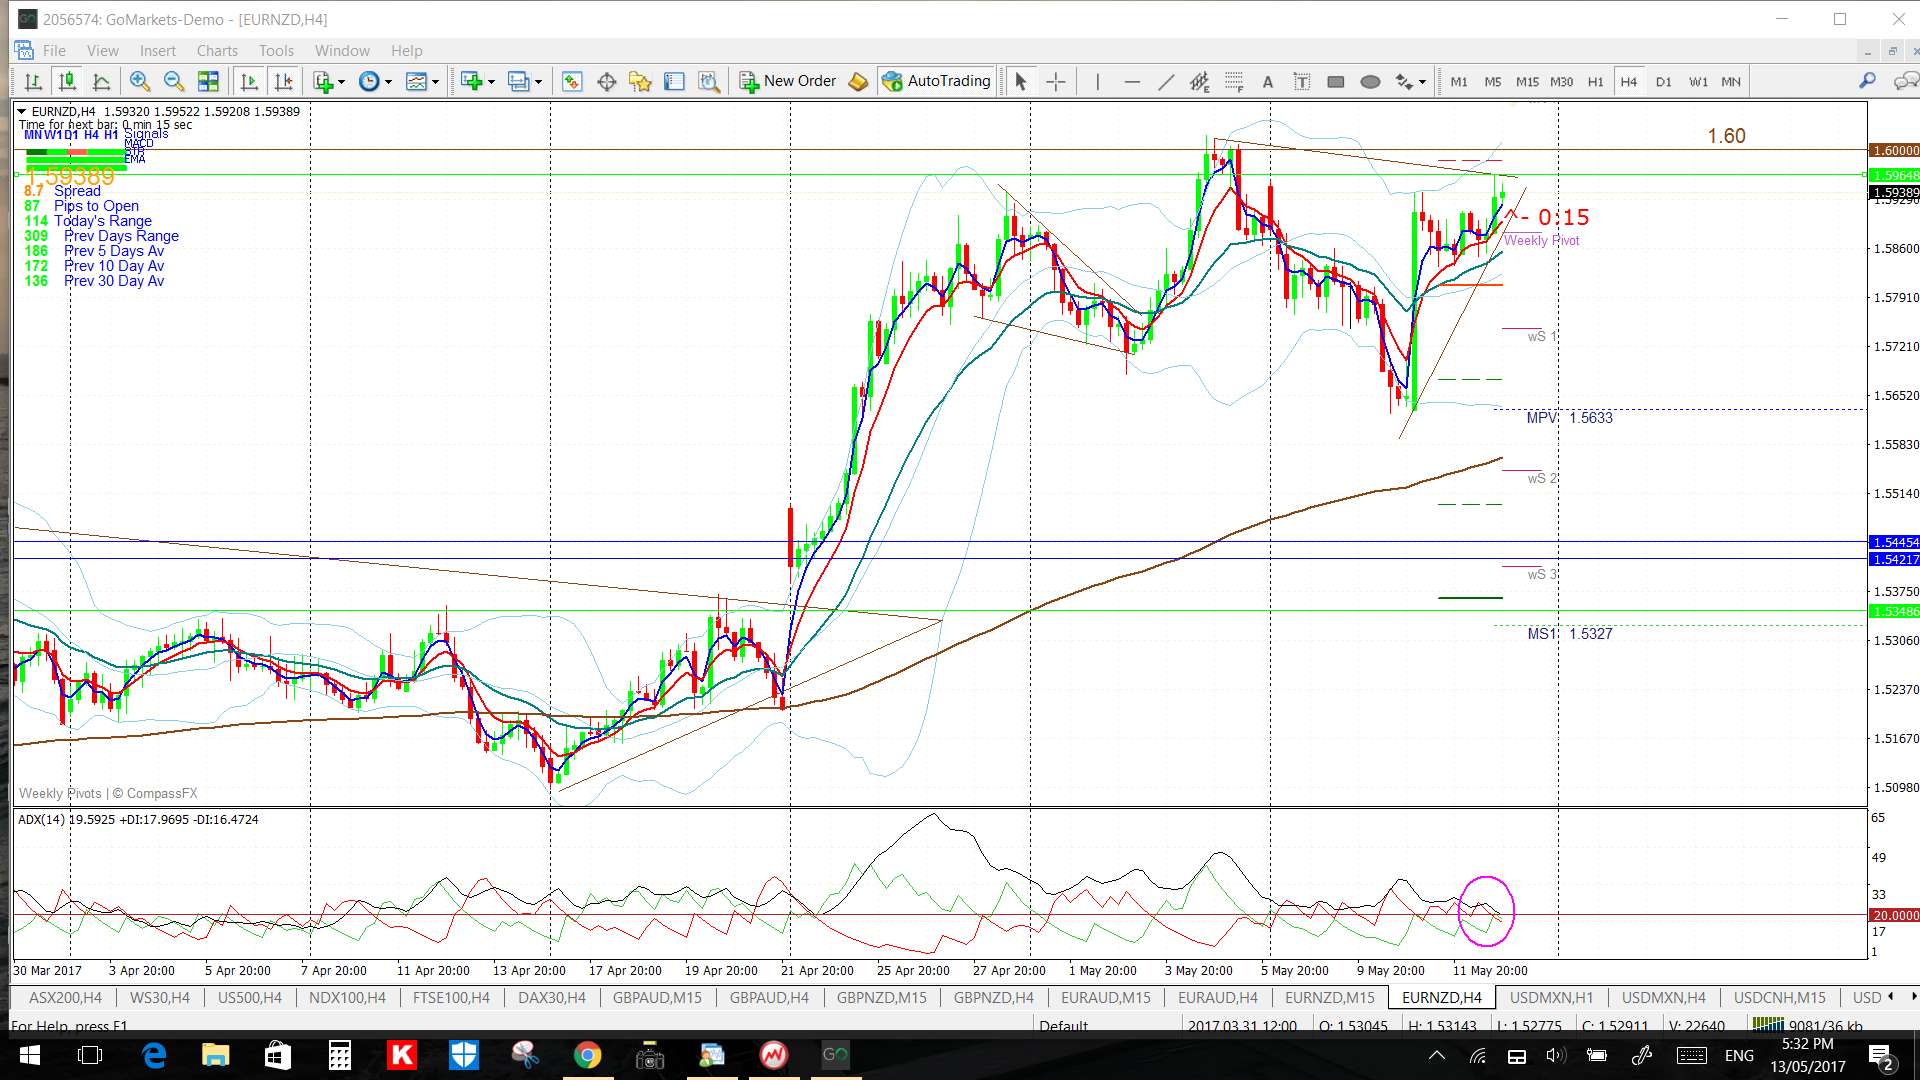
- EUR/NZD: 250 pips.
- GBP/USD: 75 pips.
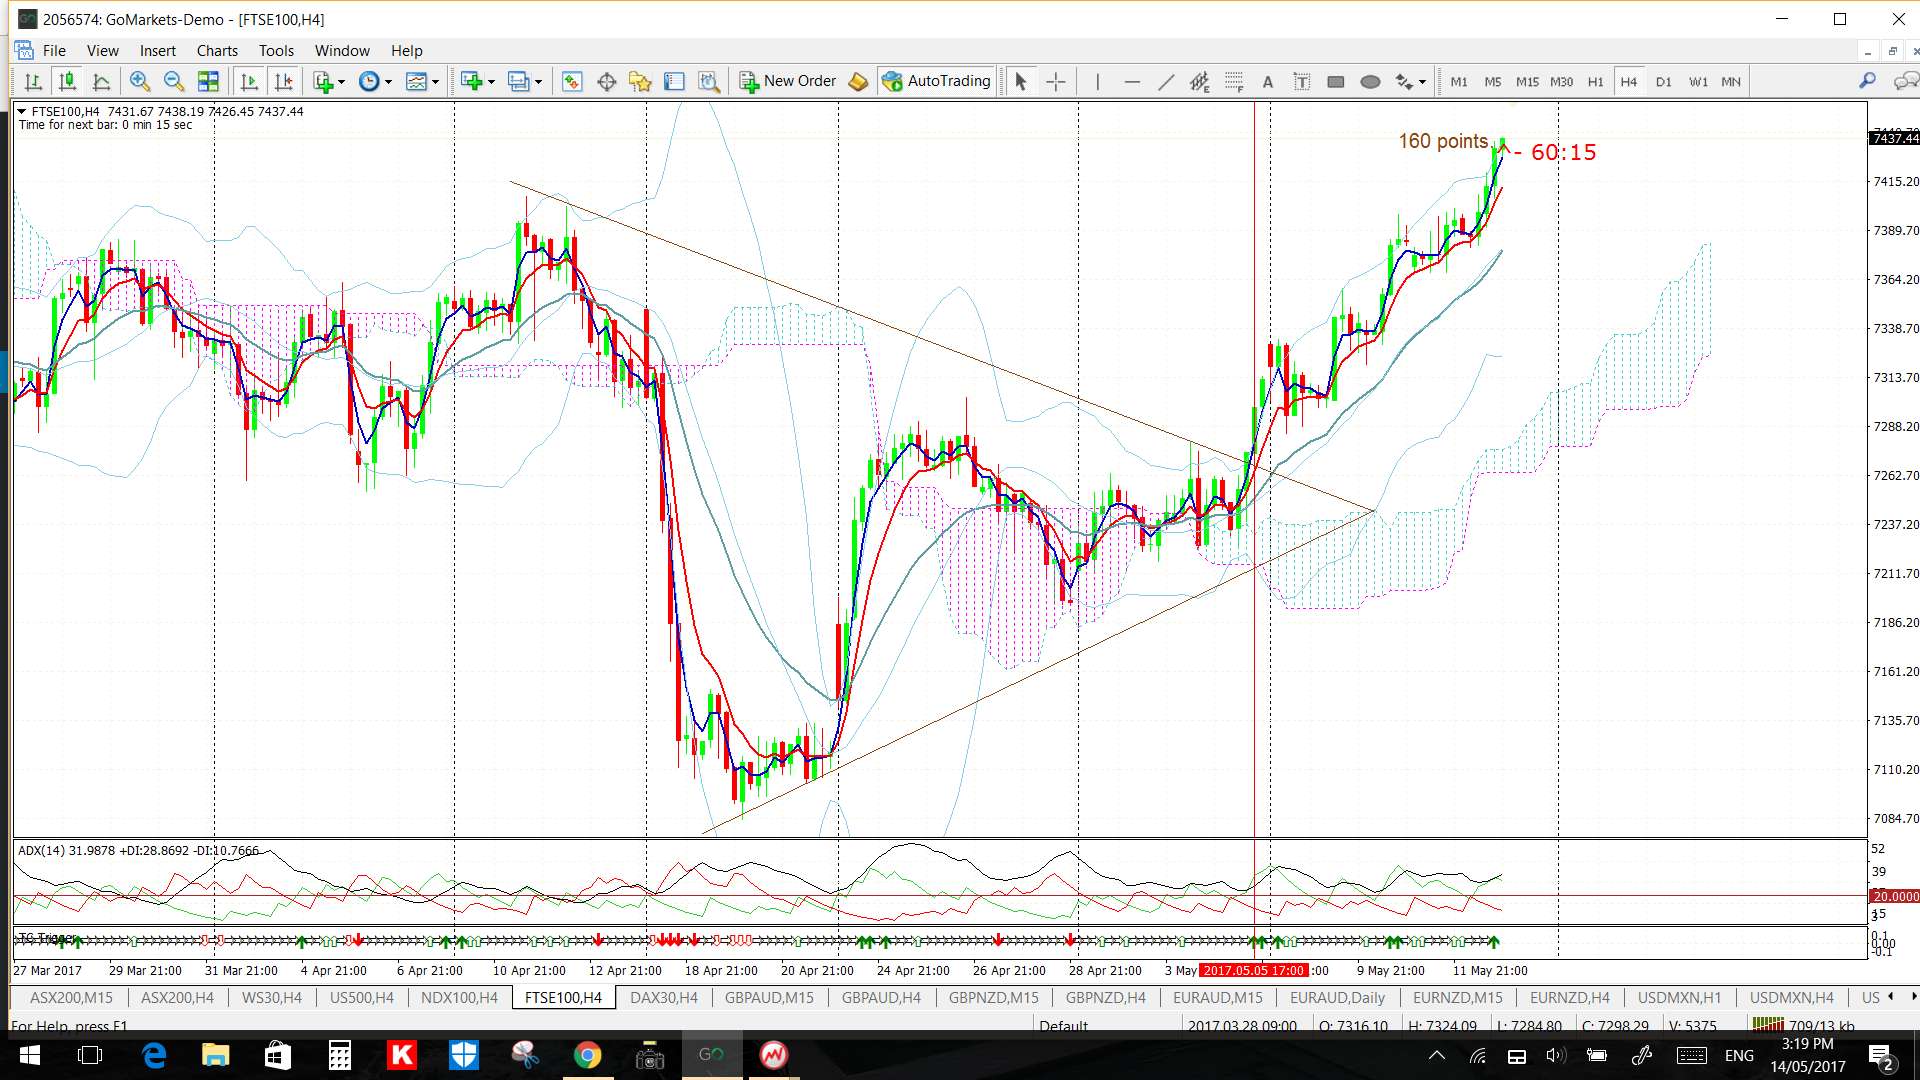
- Oil: 160 pips.
- FTSE-100: 160 points: Note the new TC LONG signal that triggered with the trend line breakout move:
Next week:
- US$: the US$ closed higher for the week but still hasn’t managed to break back above the key 100 level. A review of the FX Indices can be found through this link. I’m still reserving judgement on some of the USD-based pairs pending the next decisive move on the US$ index.
- Risk appetite: watch on Monday during the Asian session to see how Chinese Trade Balance data impact risk appetite.
- GBP/AUD and GBP/JPY: both these pairs are edging up to 20+ month bear trend lines so watch for any make or break activity on these two. These trend lines form part of triangle patterns that technical theory suggests are worth over 4,000 pips so these are well worth monitoring.
- NB: this is a brief update as I am traveling home at the moment.
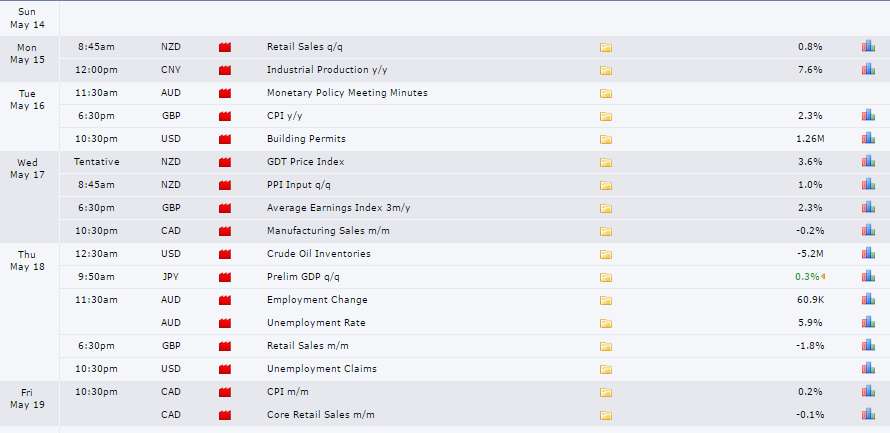
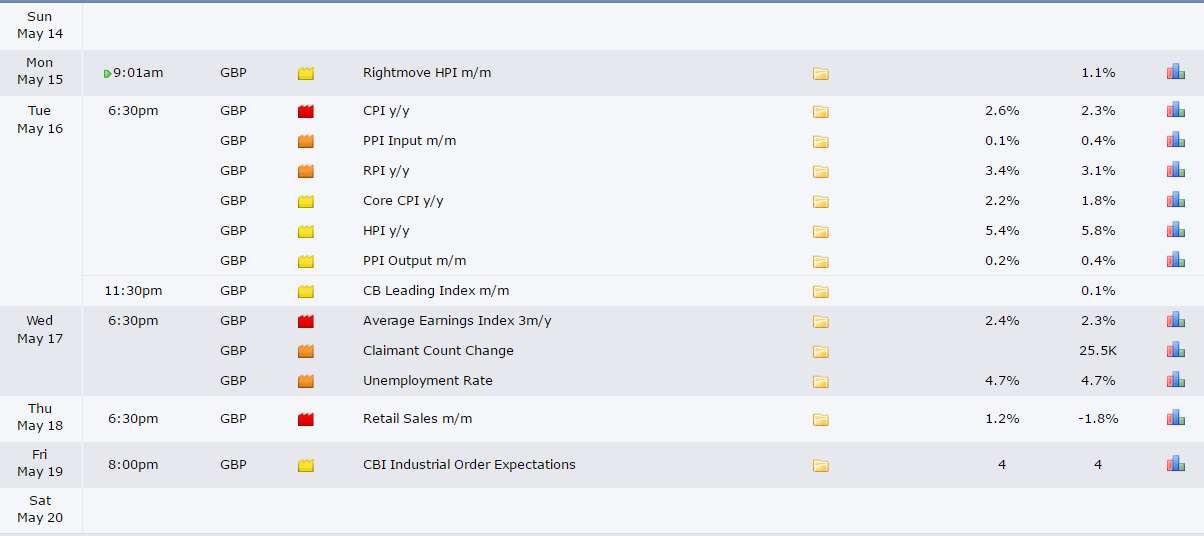
Calendar: Red Flag news items are summarised below:
Forex:
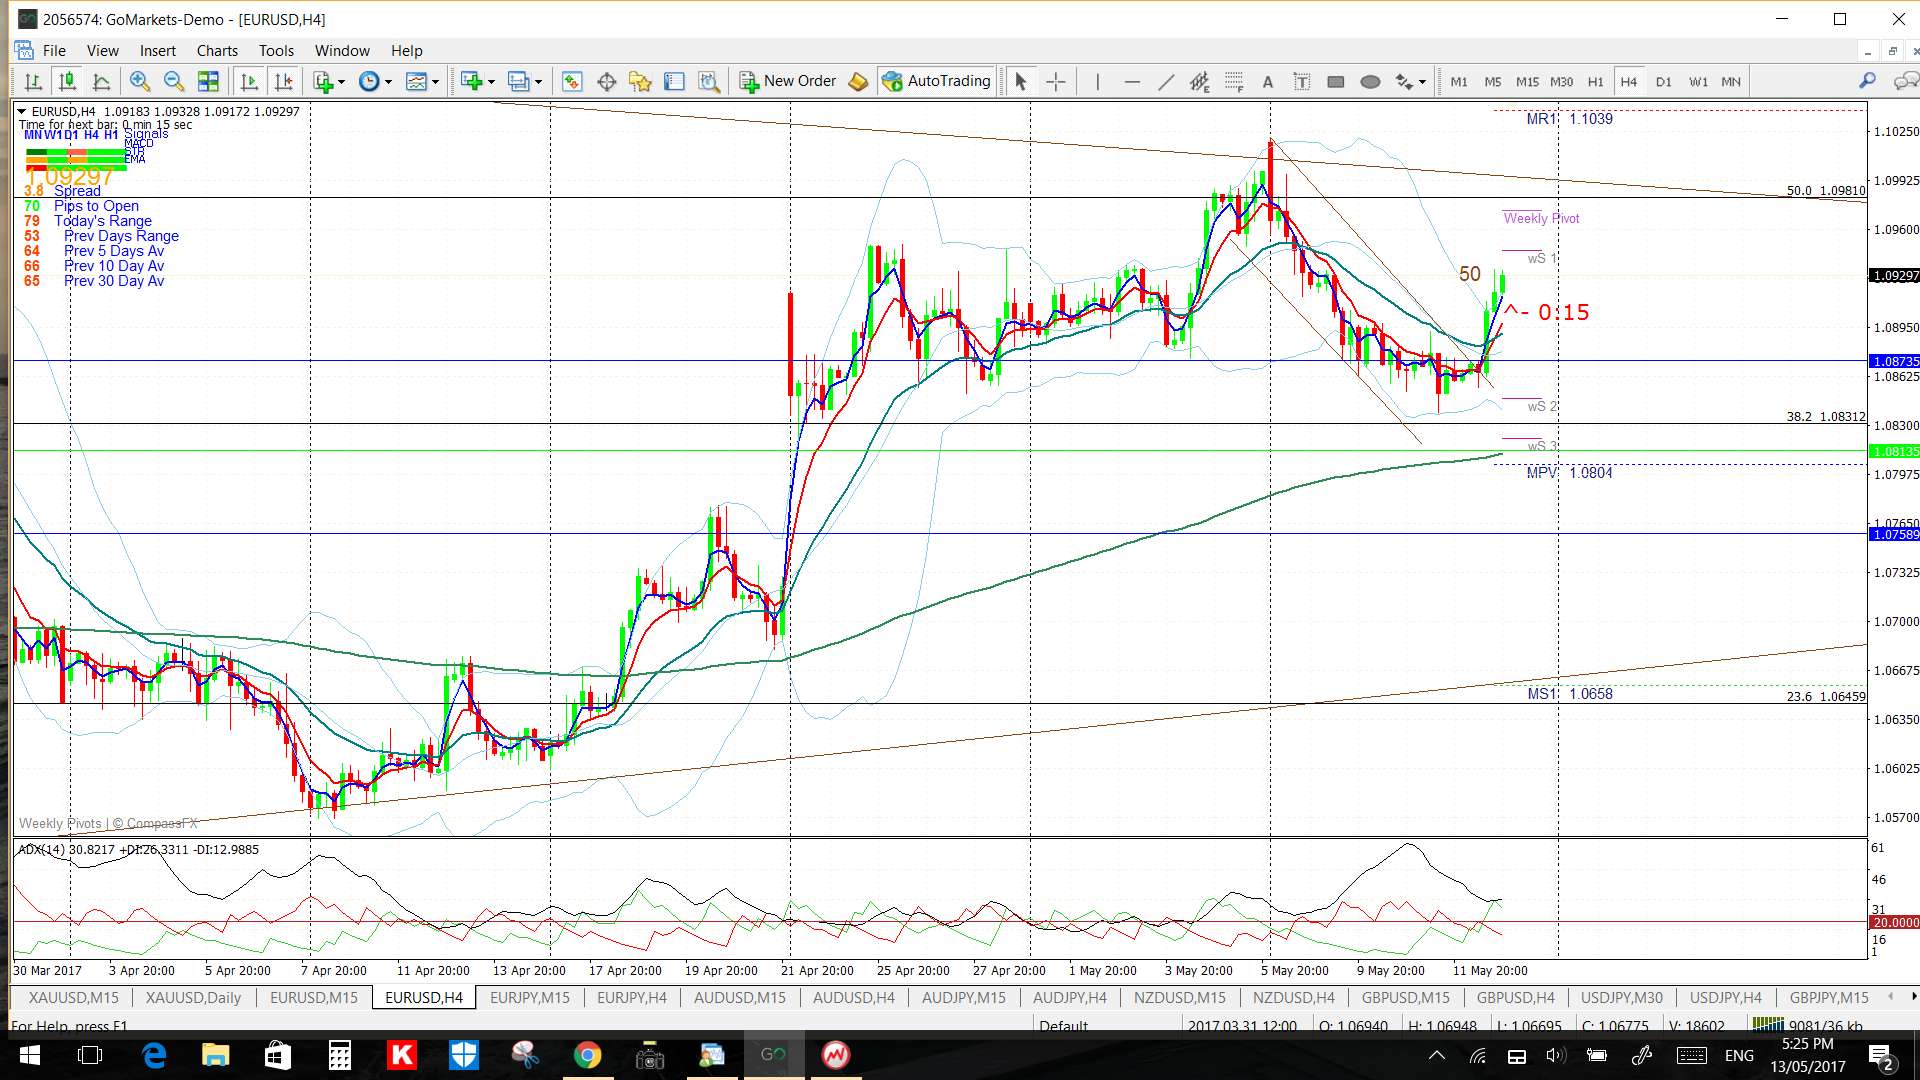
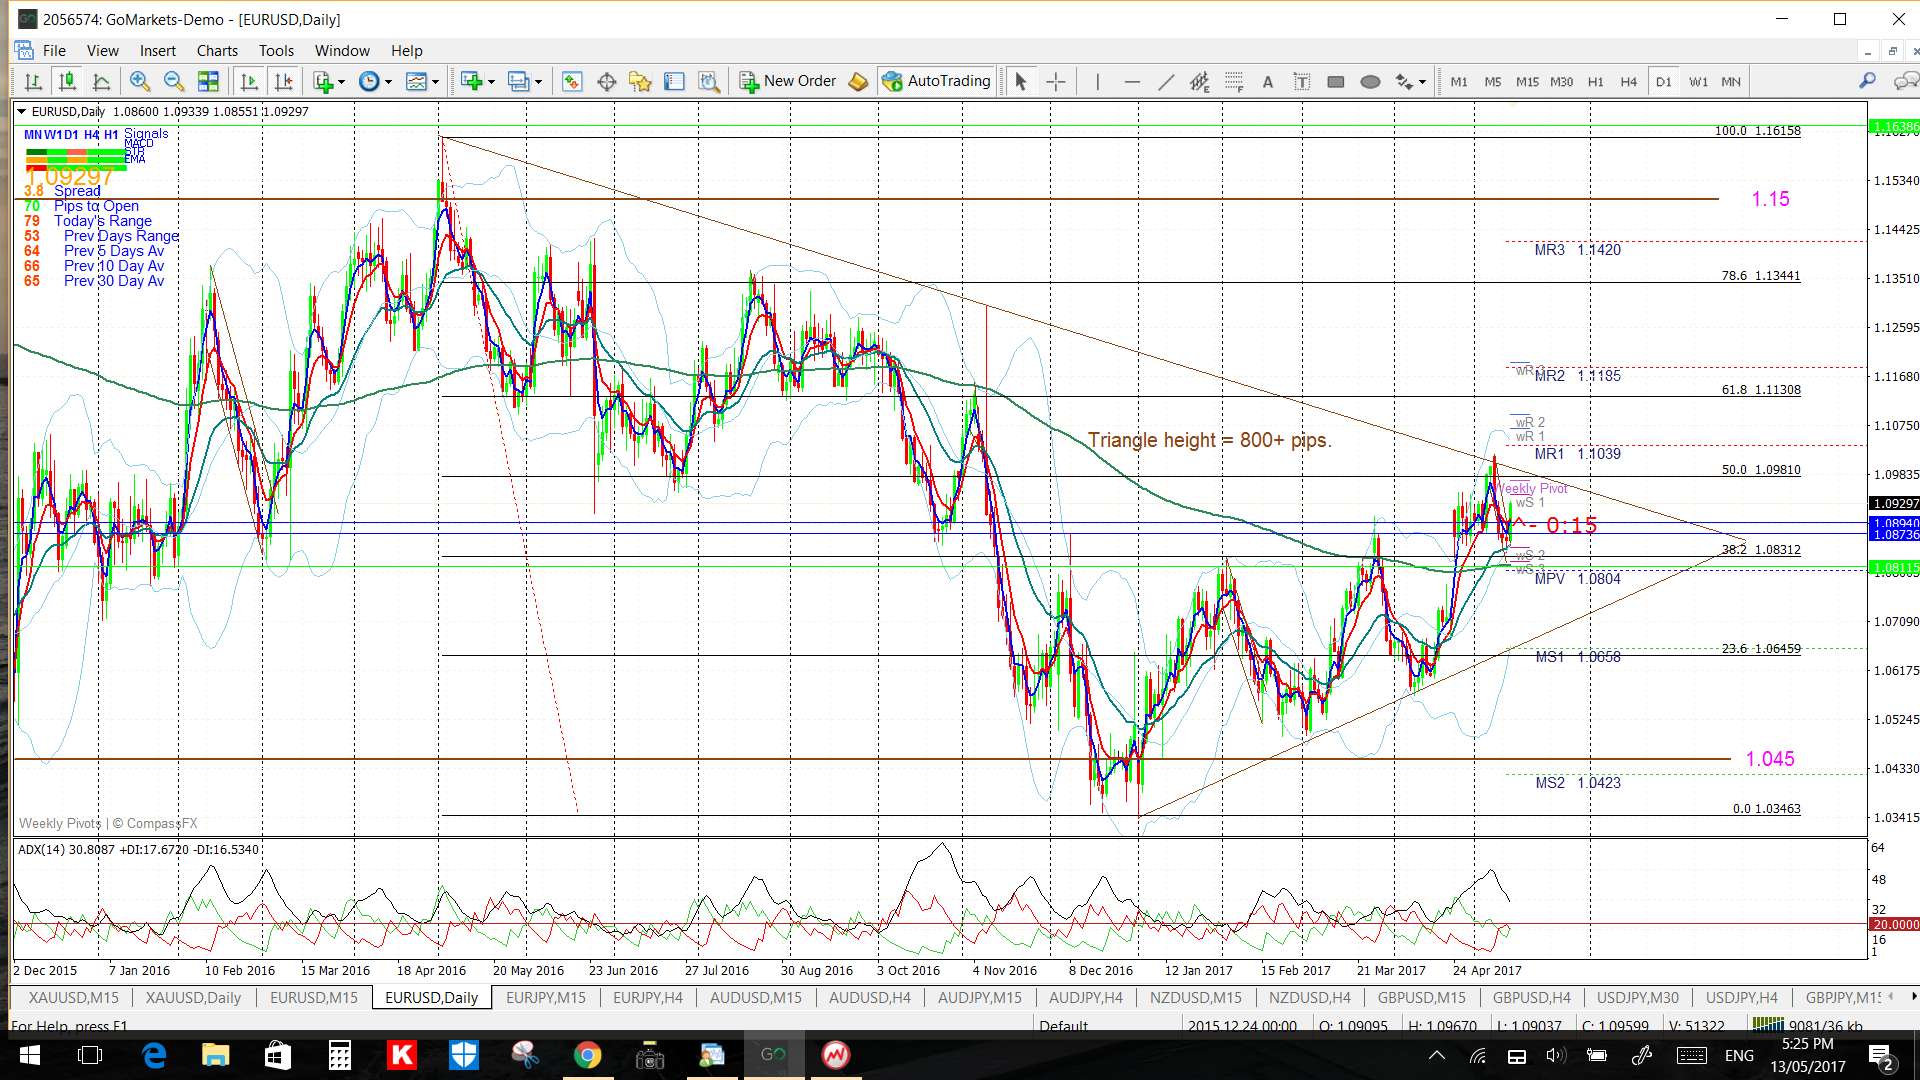
EUR/USD: Watch for any make or break of the daily chart’s upper triangle trend line:
- Any bullish breakout would have me looking for a test of the 1.15 S/R level.
- A bearish retreat from current levels will have me looking to the daily chart’s bottom triangle trend line.
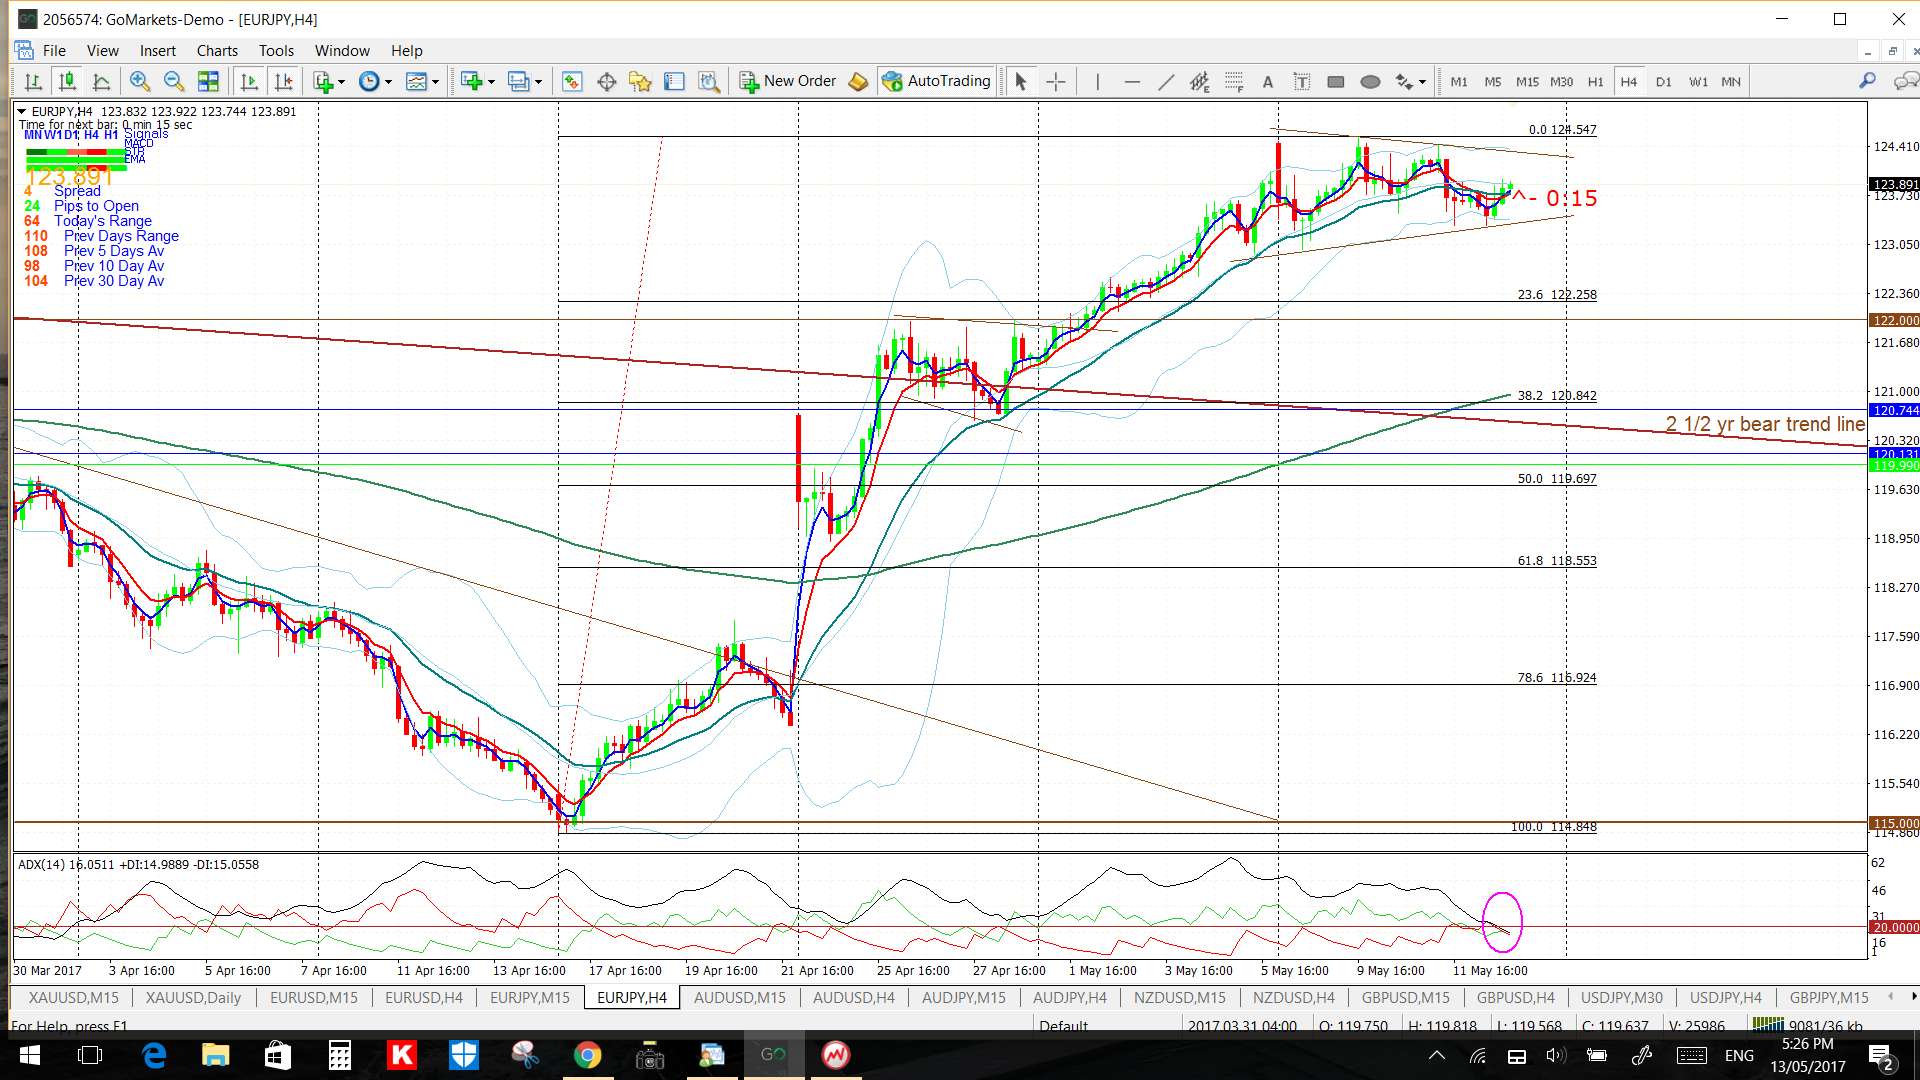
EUR/JPY 4hr: Watch the 4hr chart’s Flag trend lines for any make or break activity.
- a bullish break will have me looking up to 135 S/R.
- a bearish break will have me looking to the 4hr chart Fib levels.
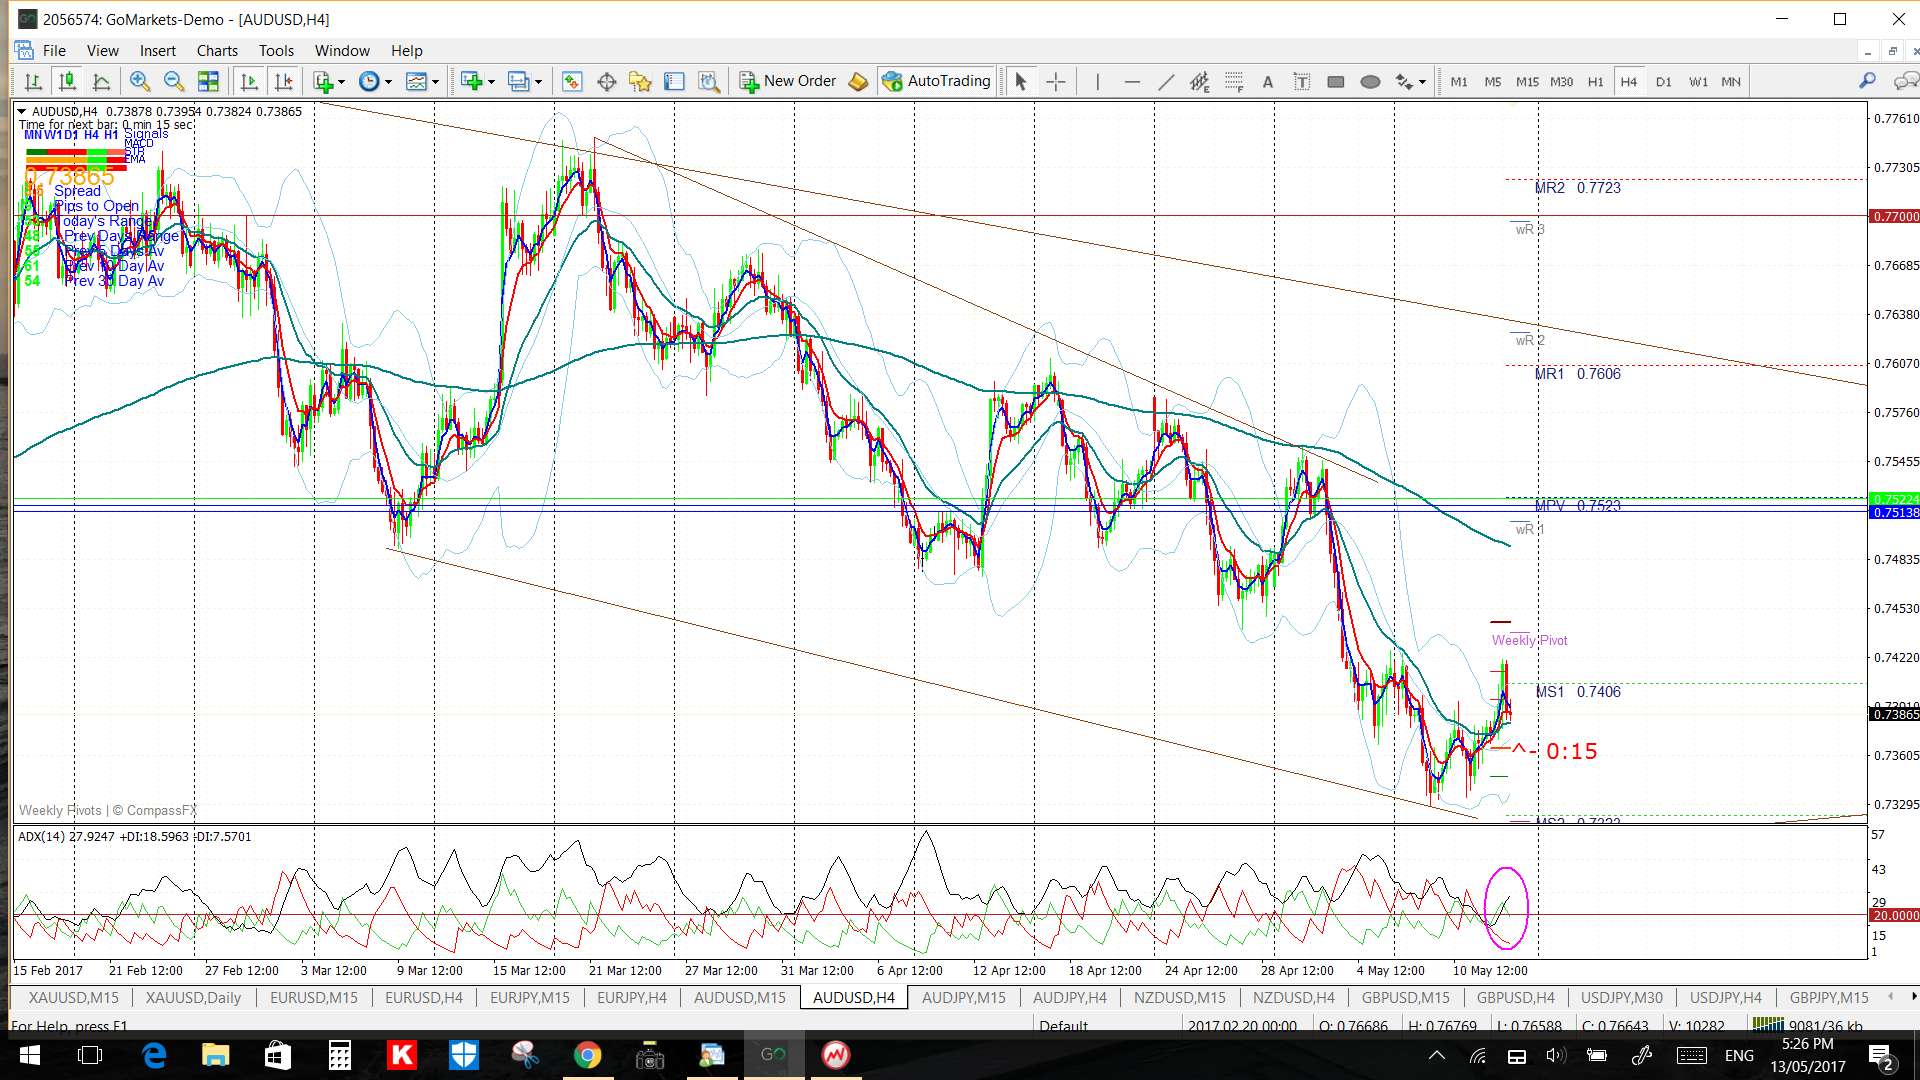
AUD/USD: Watch the 4hr chart’s wedge trend lines for any make or break activity:
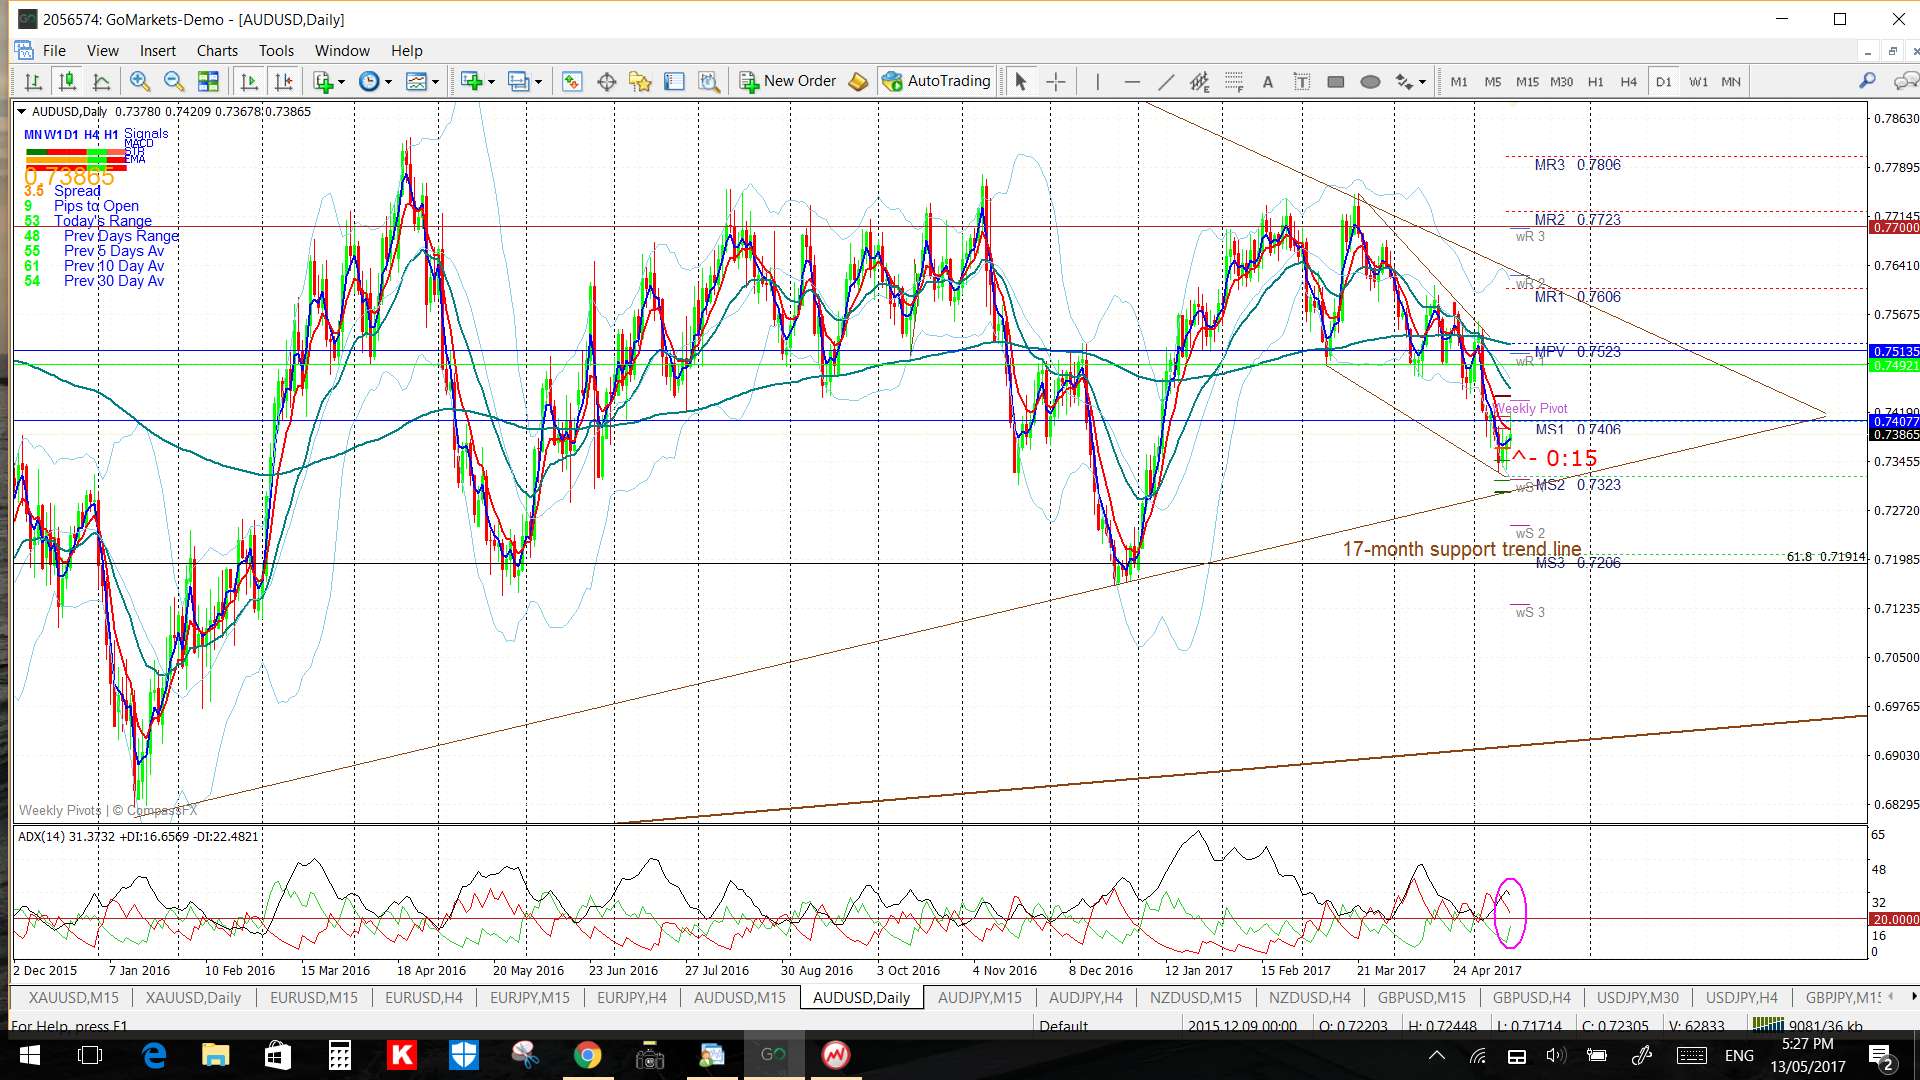
- any bullish 4hr wedge breakout to possibly target the daily chart’s upper triangle TL.
- any bearish 4hr wedge breakout to possibly target the daily chart’s lower triangle TL; which is only about 70 pips below current price.
Watch with AUD Employment data on Thursday and CNY Trade Balance data on Monday.

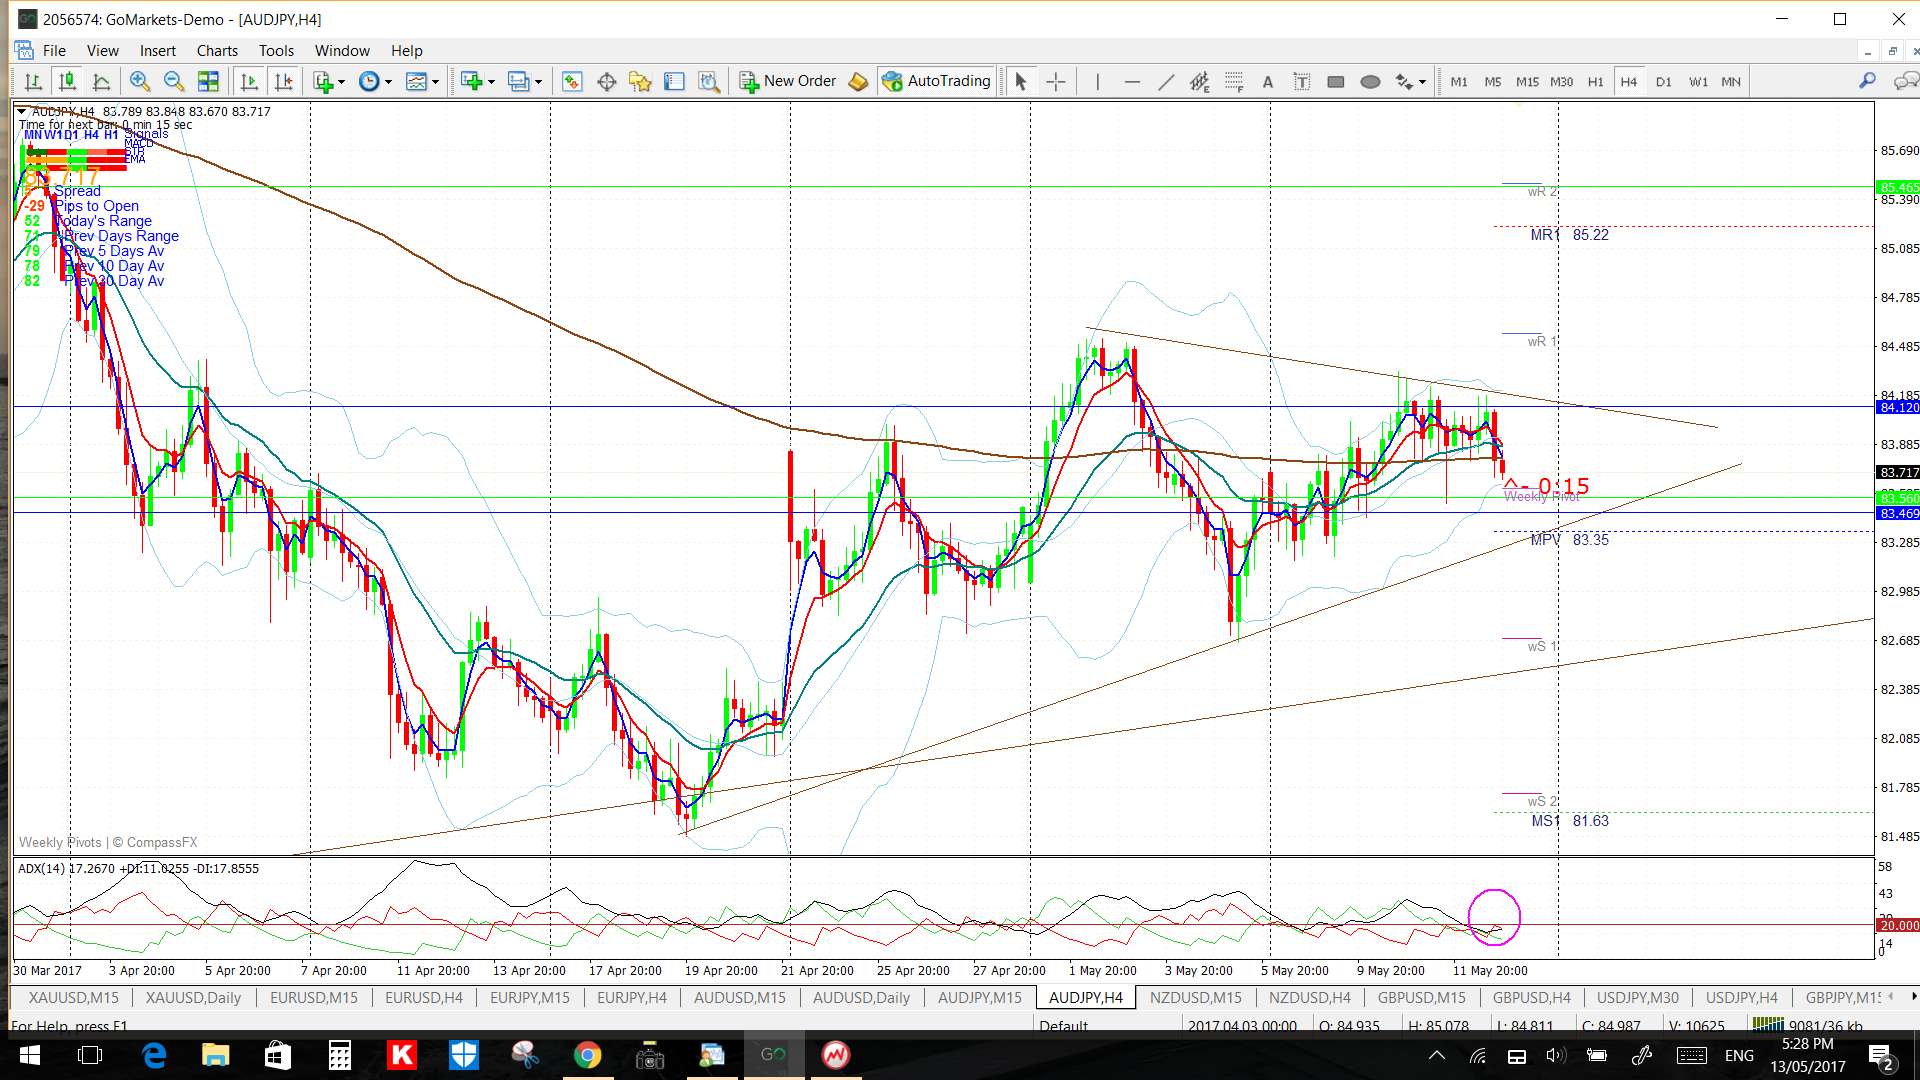
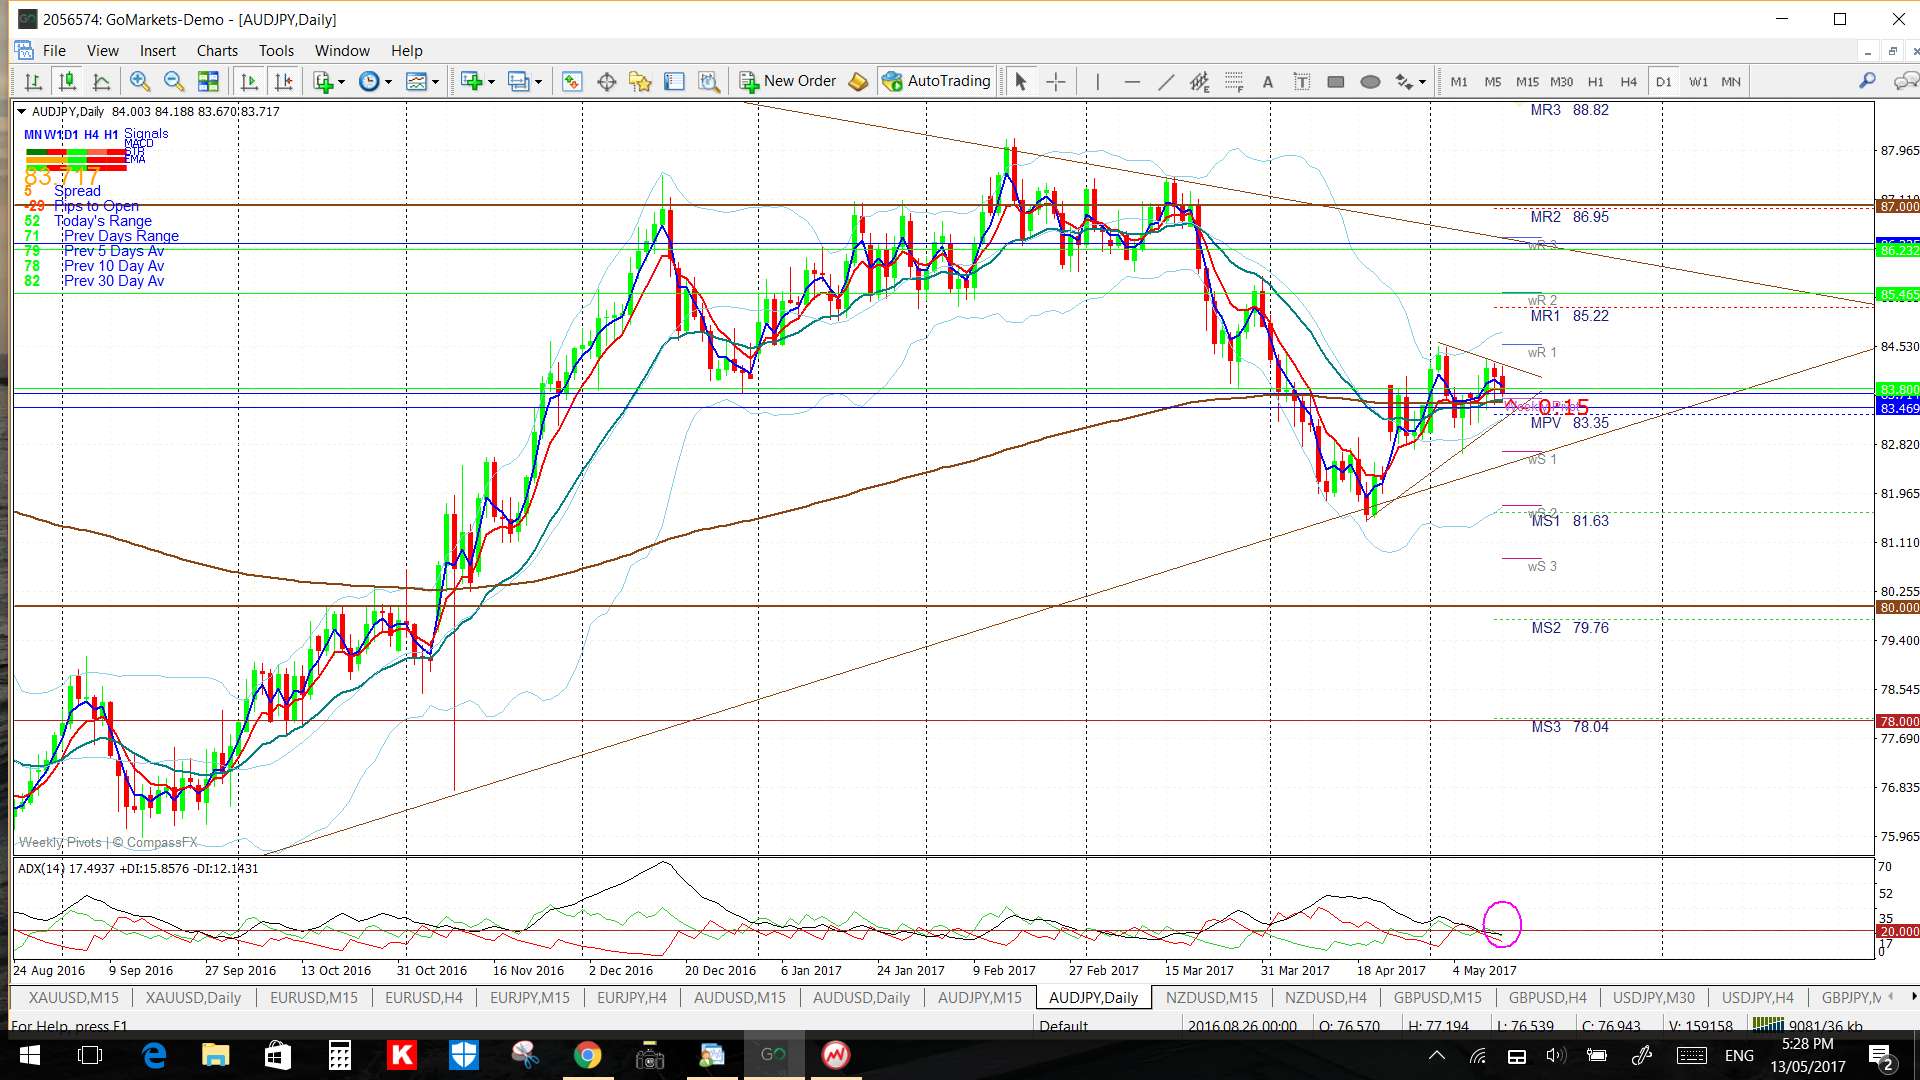
AUD/JPY: Watch the 4hr chart’s triangle trend lines for any make or break activity:
- any bullish 4hr triangle breakout to possibly target the daily chart’s upper triangle TL.
- any bearish 4hr triangle breakout to possibly target the daily chart’s lower triangle TL.
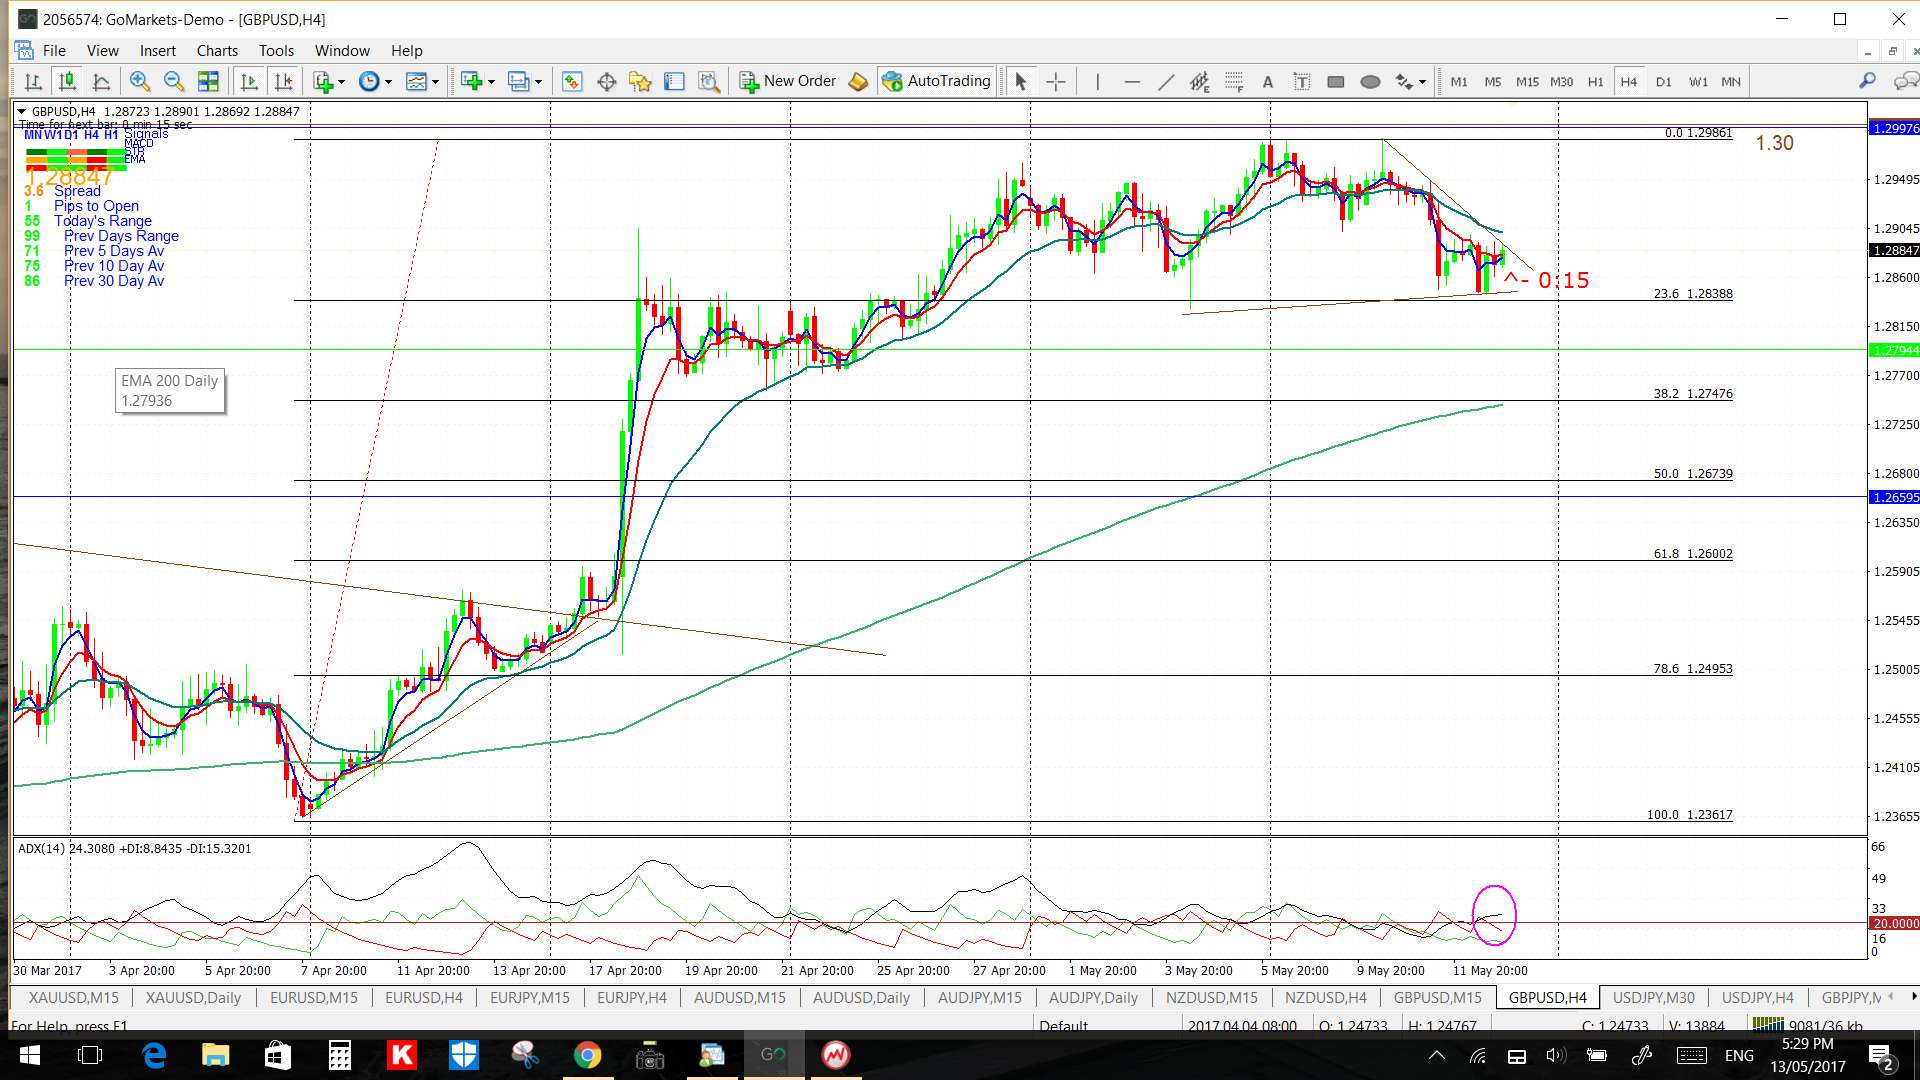
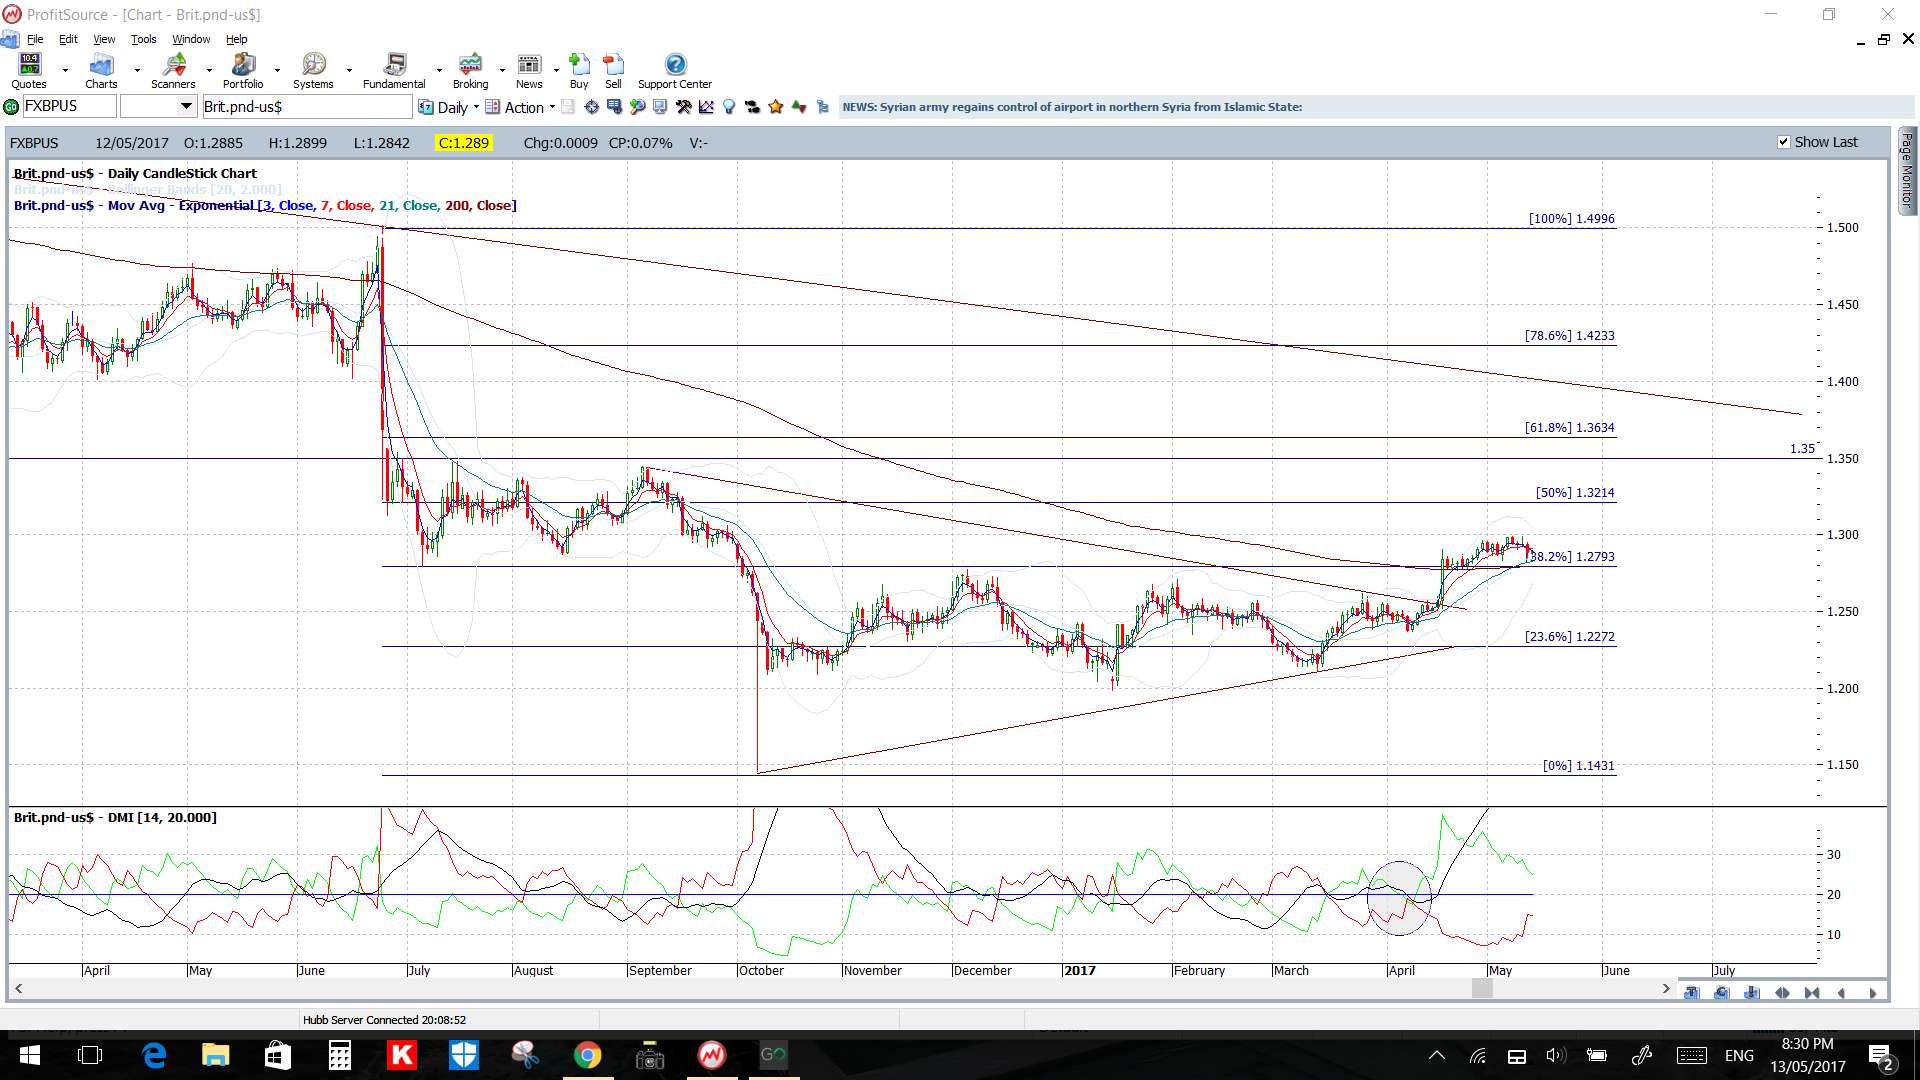
GBP/USD: Watch the 4hr chart’s triangle trend lines for any make or break activity:
- a bullish break: then 1.35 would come into greater focus as it is the daily chart’s 61.8% fib (see last week’s post).
- a bearish break: any rejection of 1.30 would bring the 4hr chart’s 61.8% fib, near 1.26, into focus.
Keep in mind that the weekly chart’s bear trend line has been in play for almost 3 years now and is about 1,000 pips away near the 1.40 level.
Watch with GBP CPI data on Tuesday, Employment data on Wednesday and Retail Sales data on Thursday.
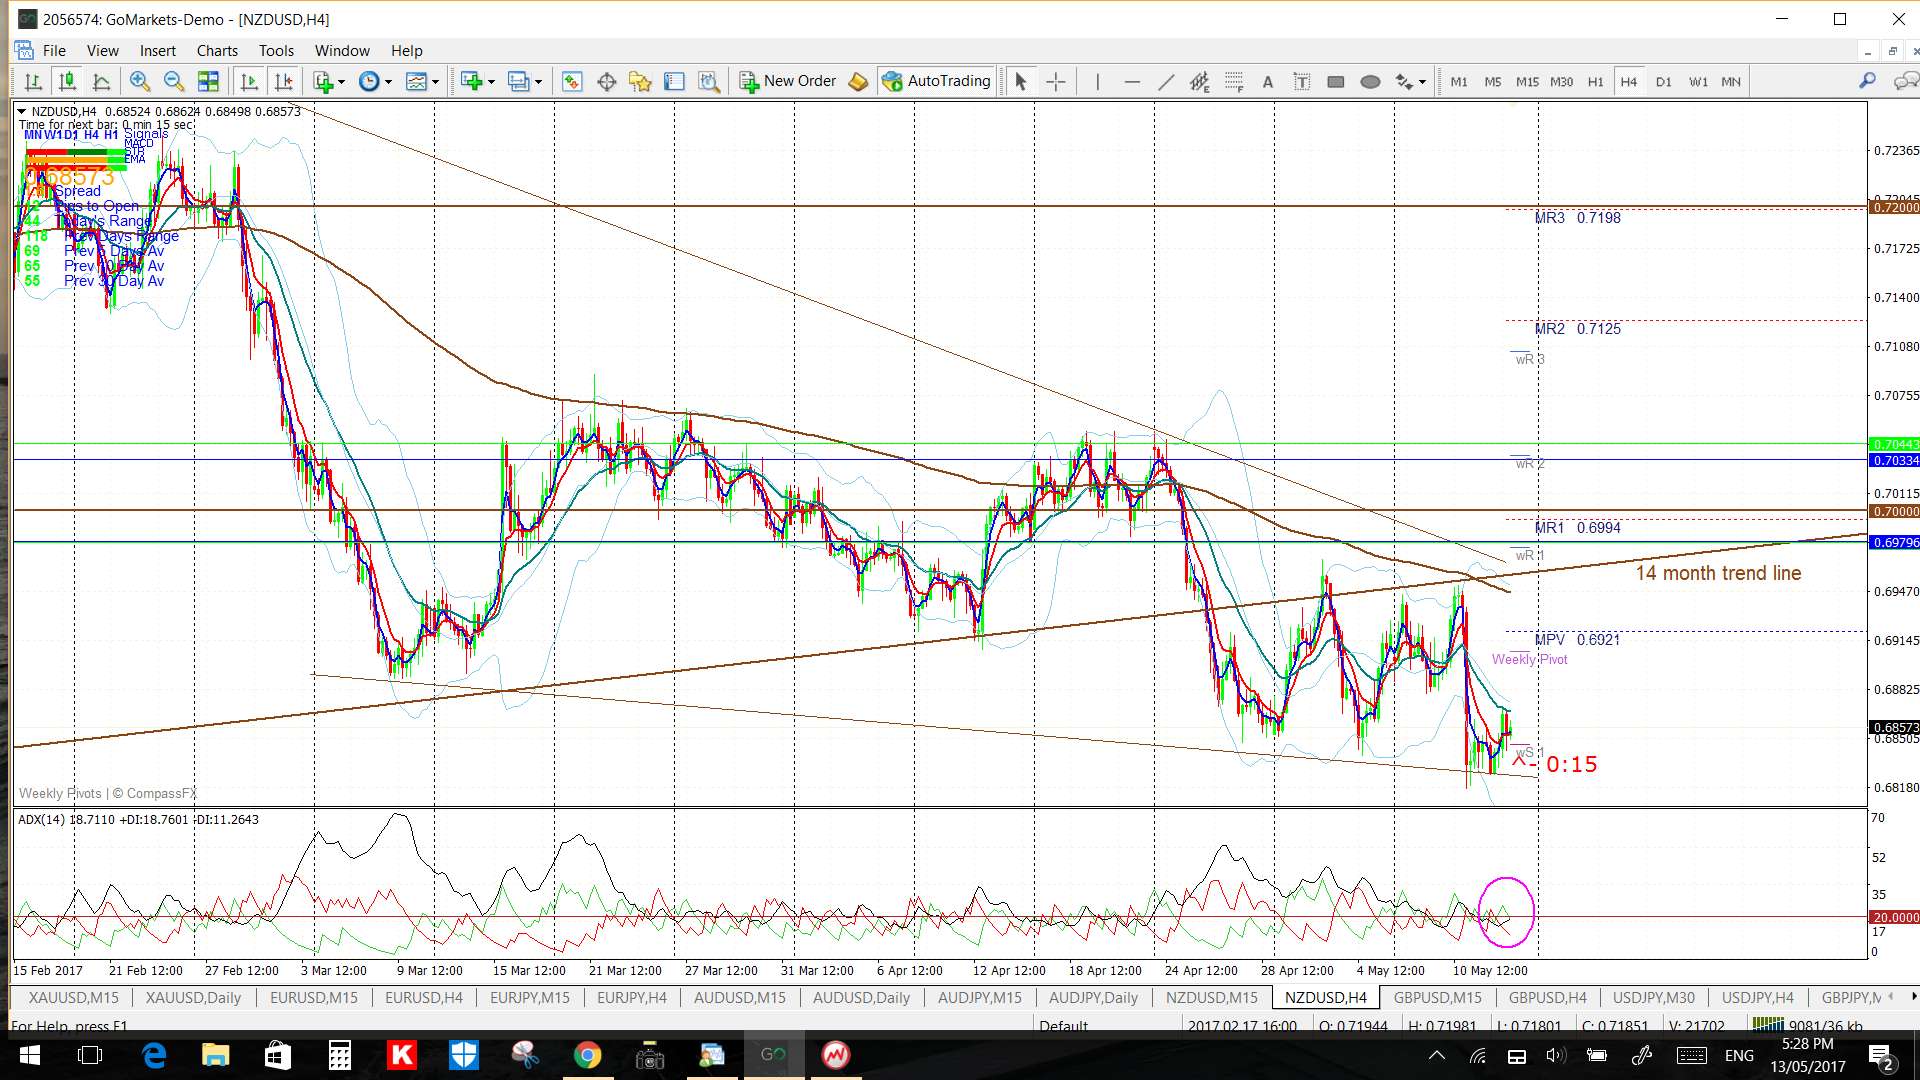
NZD/USD: Watch the 4hr chart’s descending wedge trend lines for any make or break activity.
Watch next week with CNY Trade Balance & NZD Retail Sales data on Monday and then NZD GDT price Index data on Wednesday(early) and PPI data.
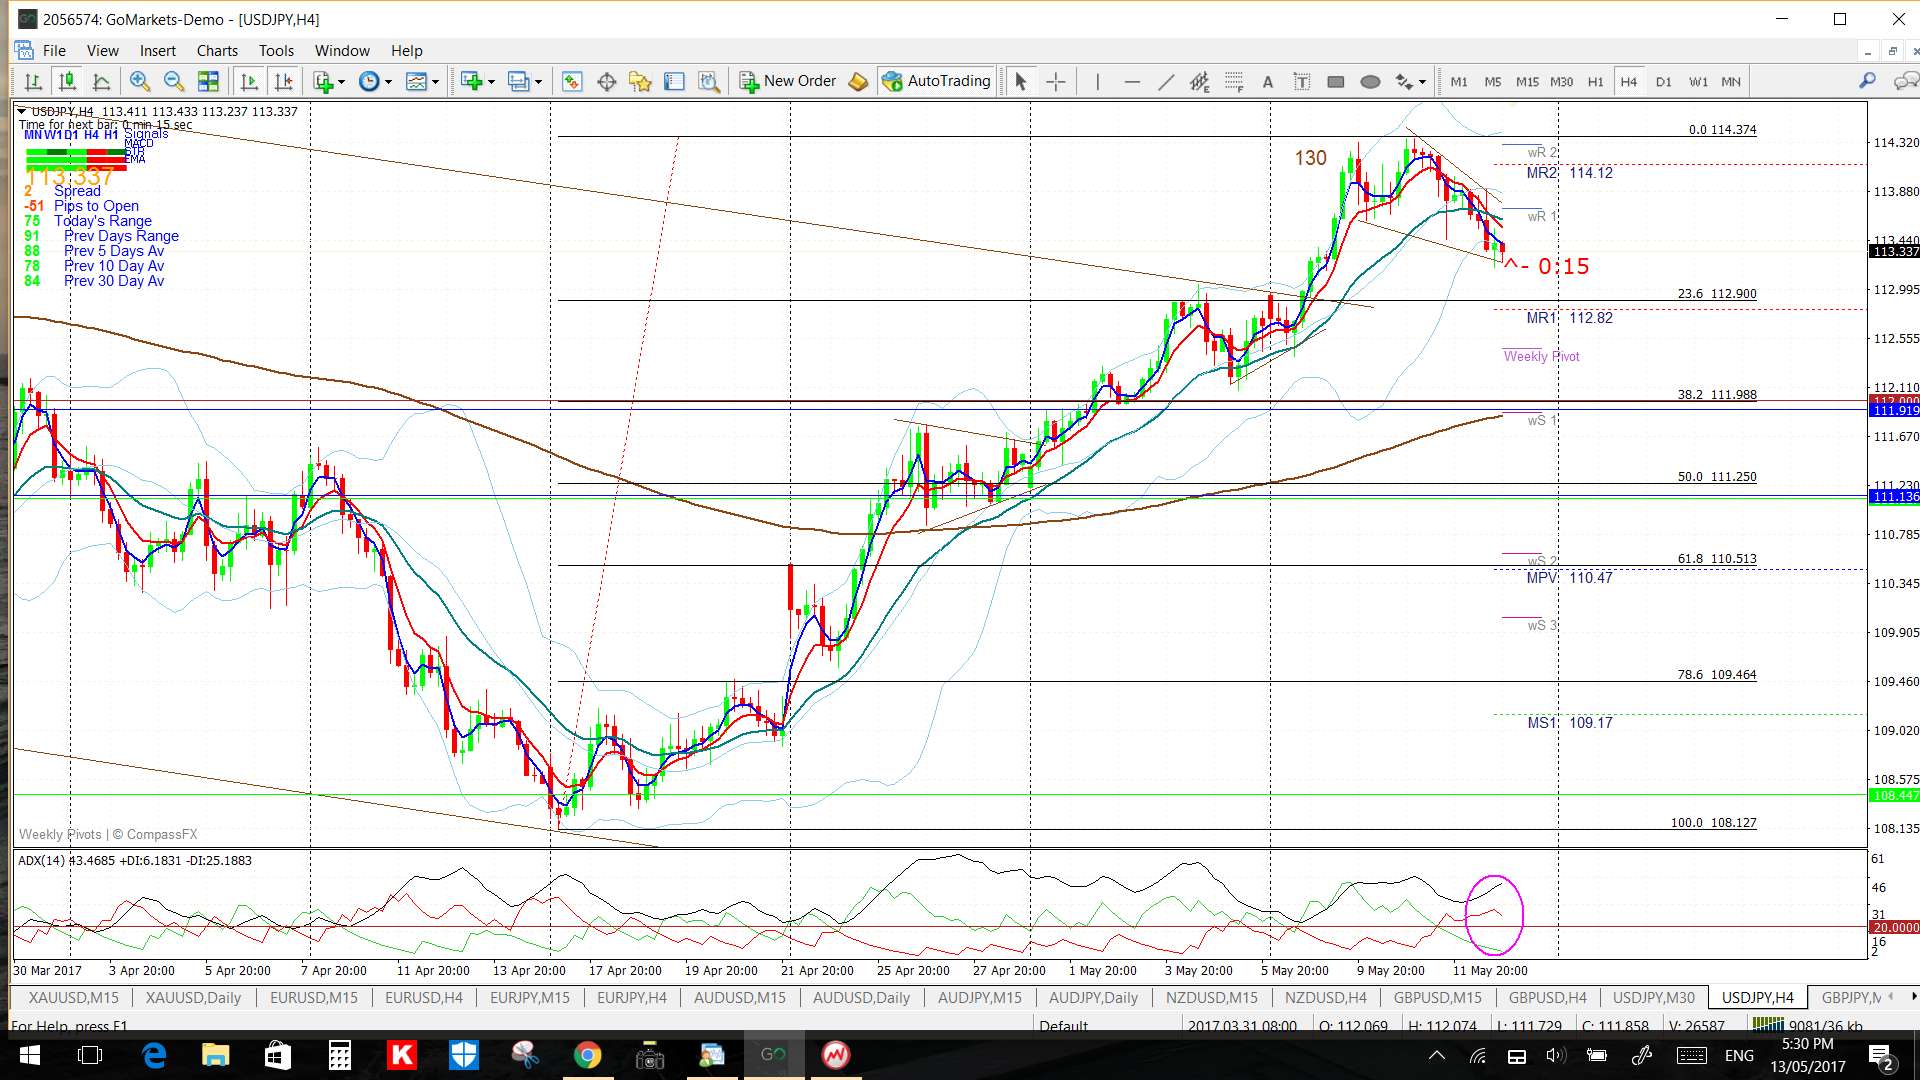
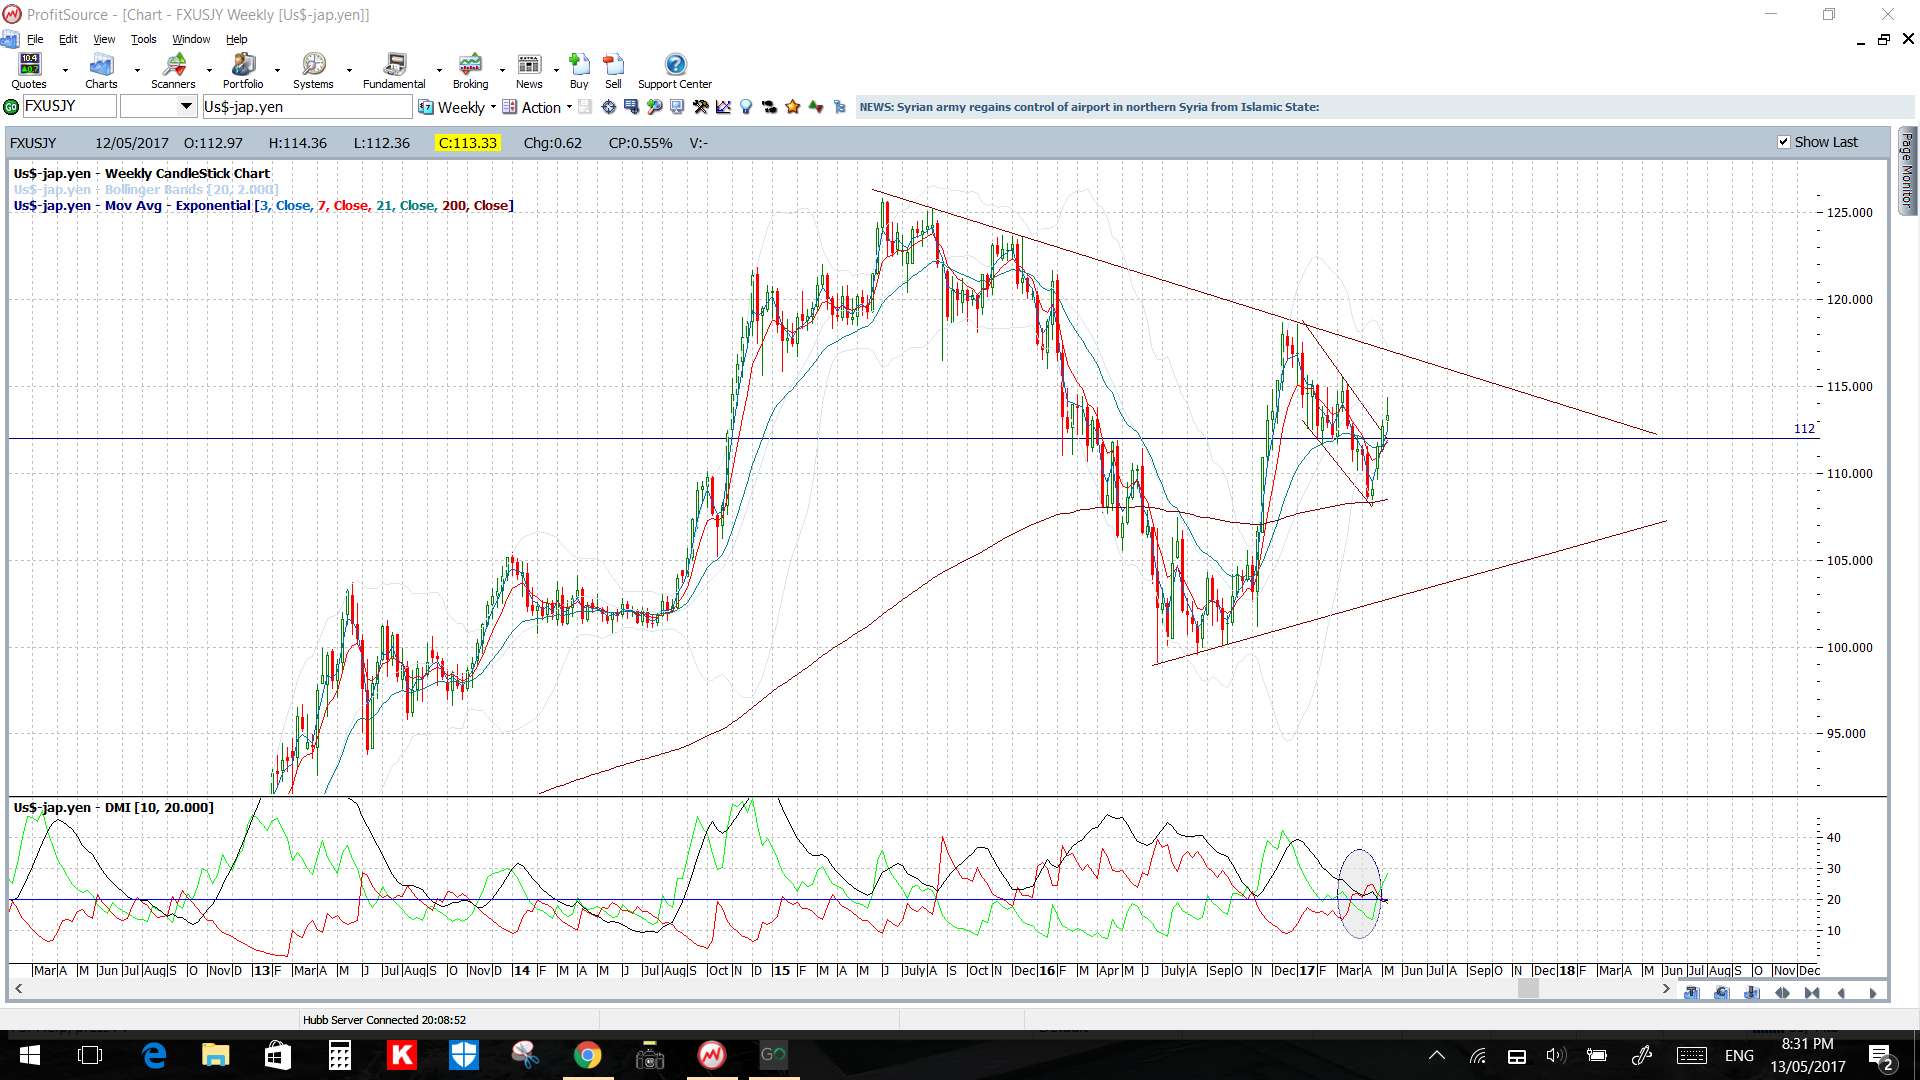
USD/JPY: Watch the 4hr chart’s Flag trend lines for any make or break activity:
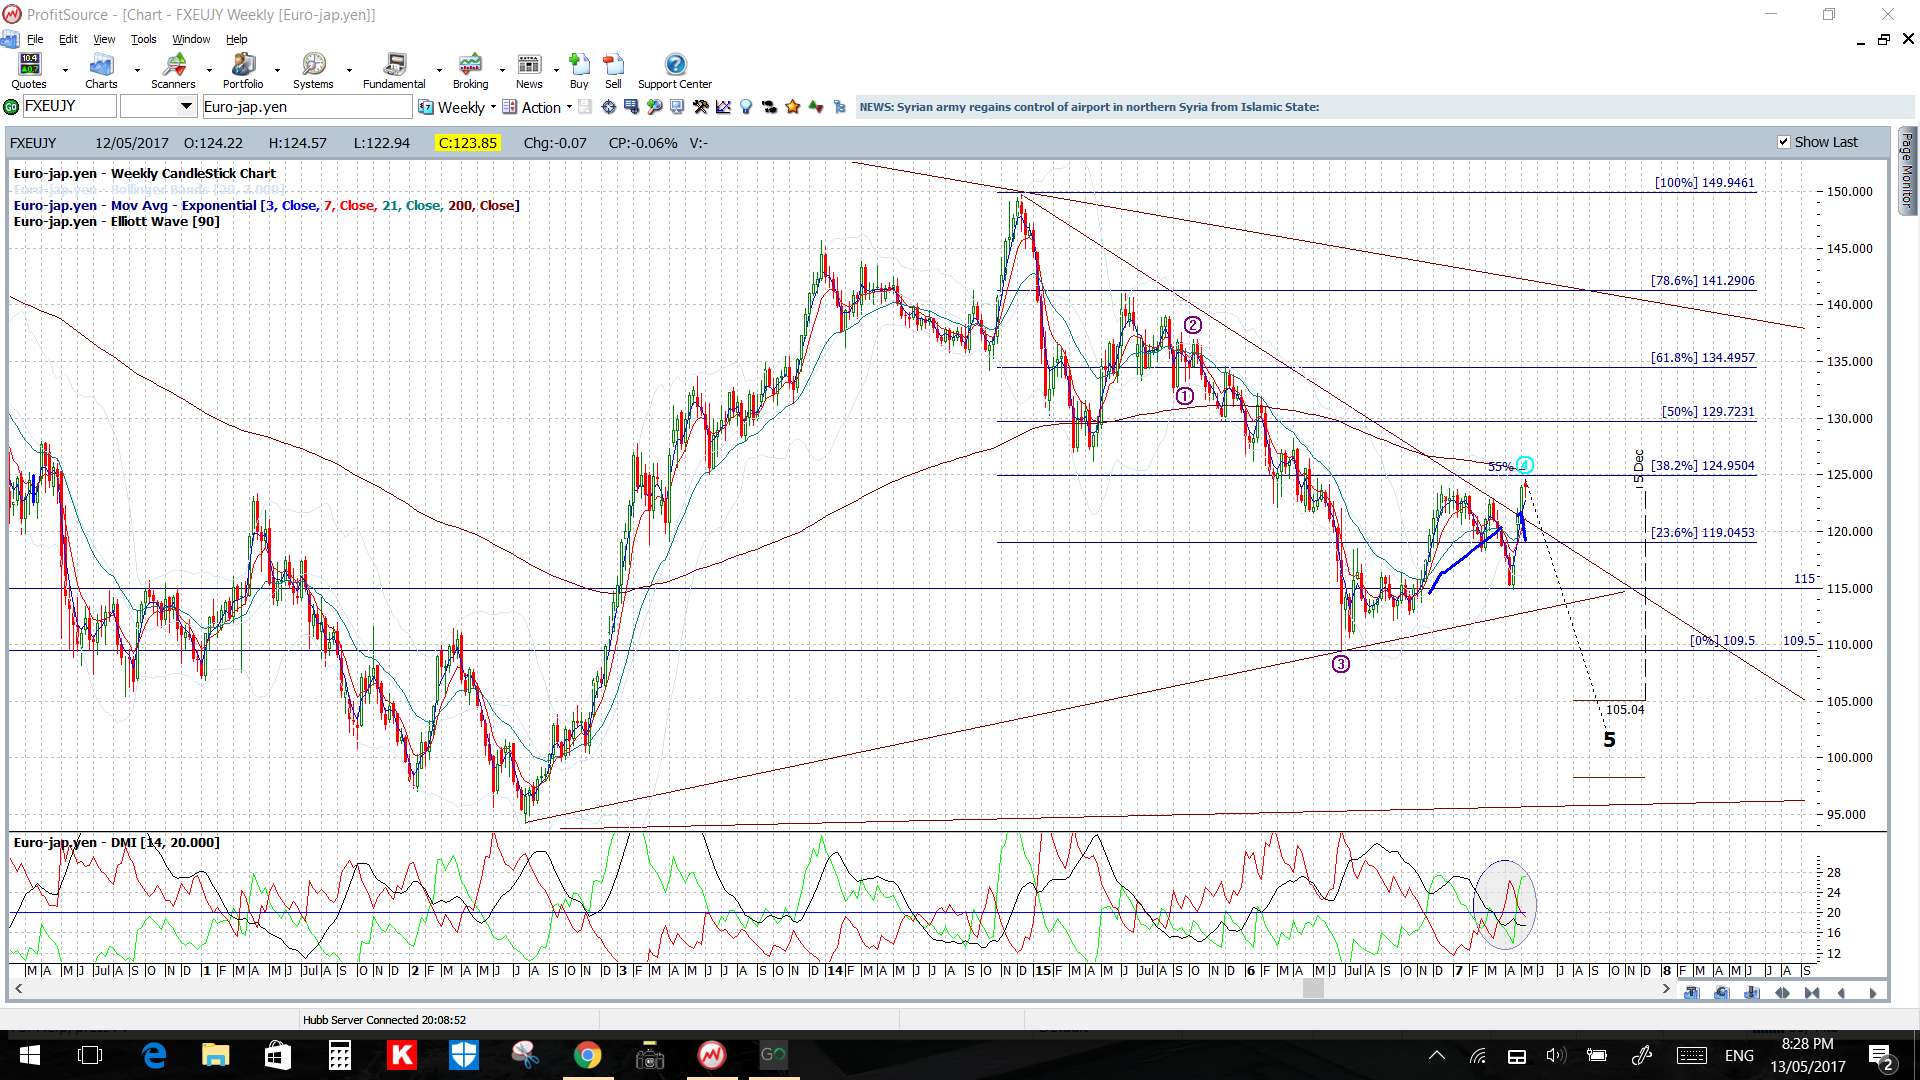
- Bullish breakout: watch the weekly chart’s bear triangle trend line, this is about 400 pips above current price, and then the 124 level.
- Bearish breakdown: watch the 112 and 4hr chart Fib levels.
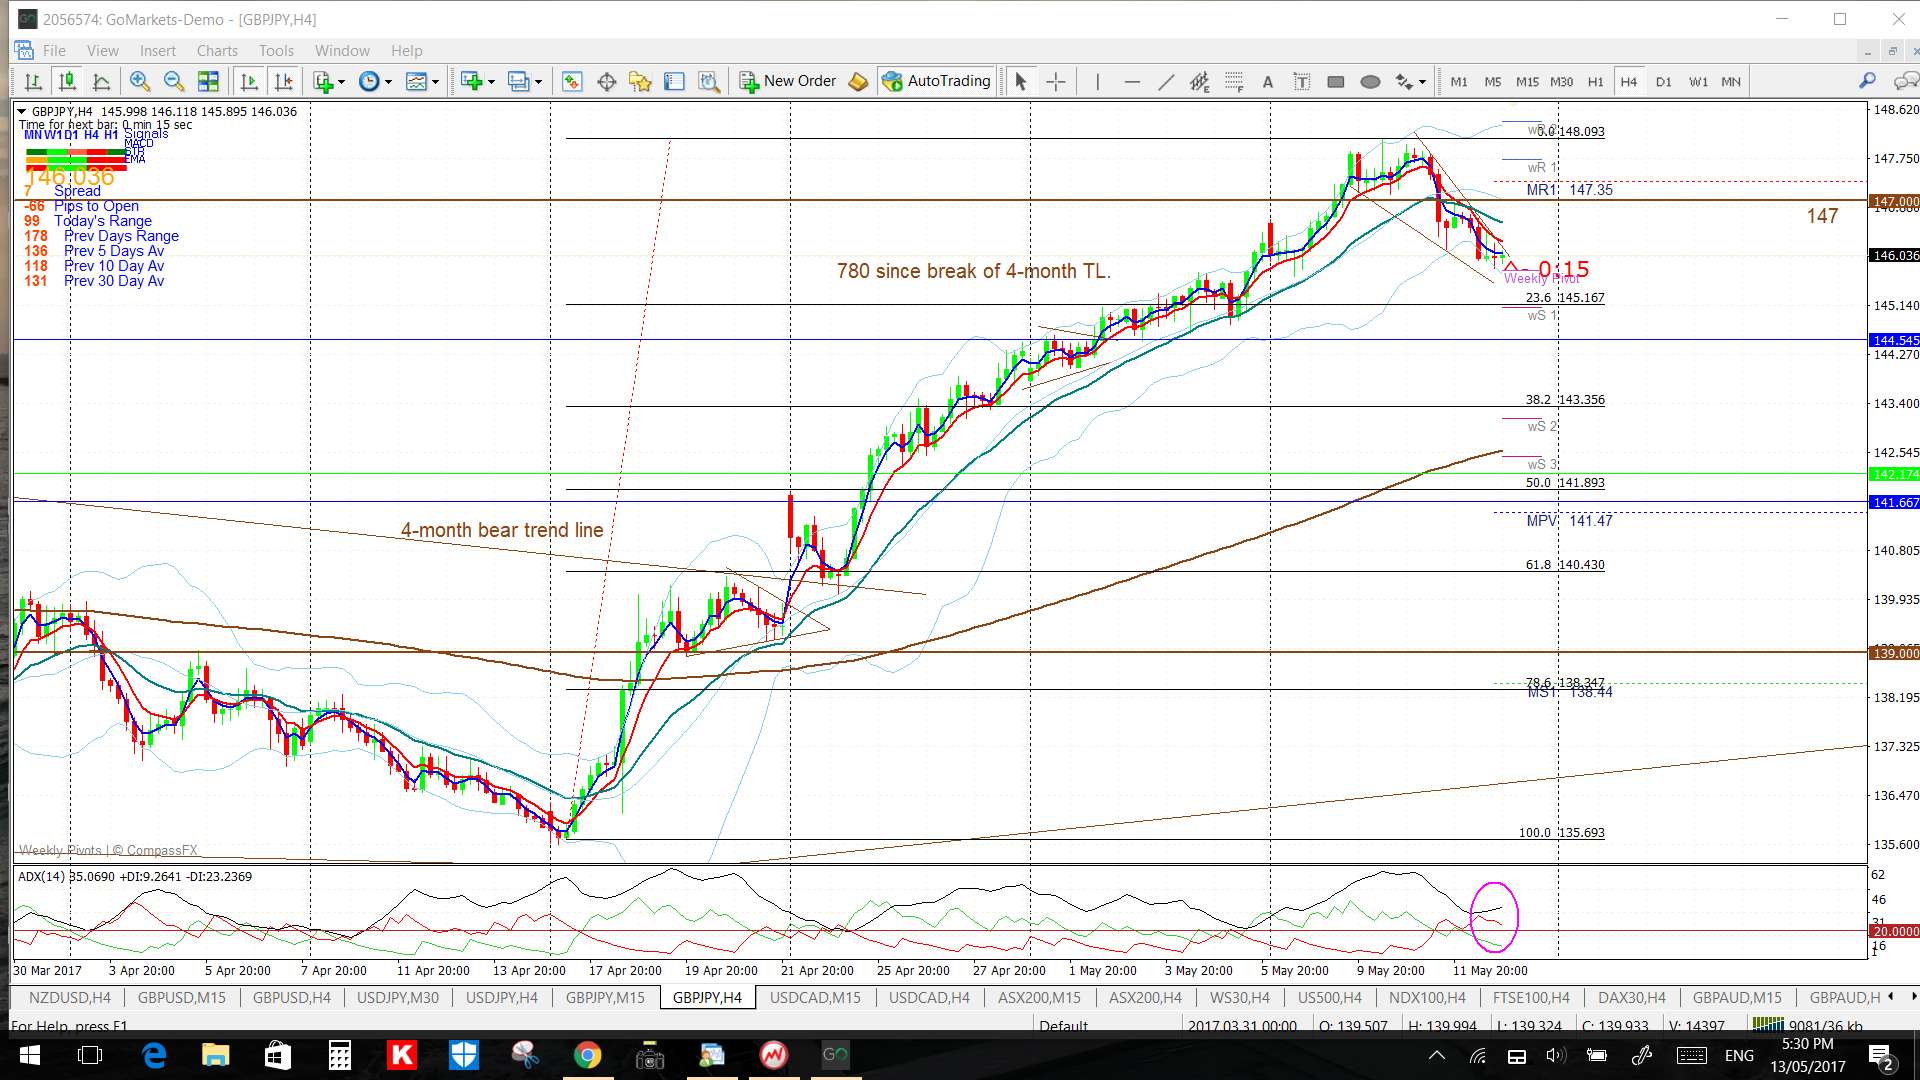
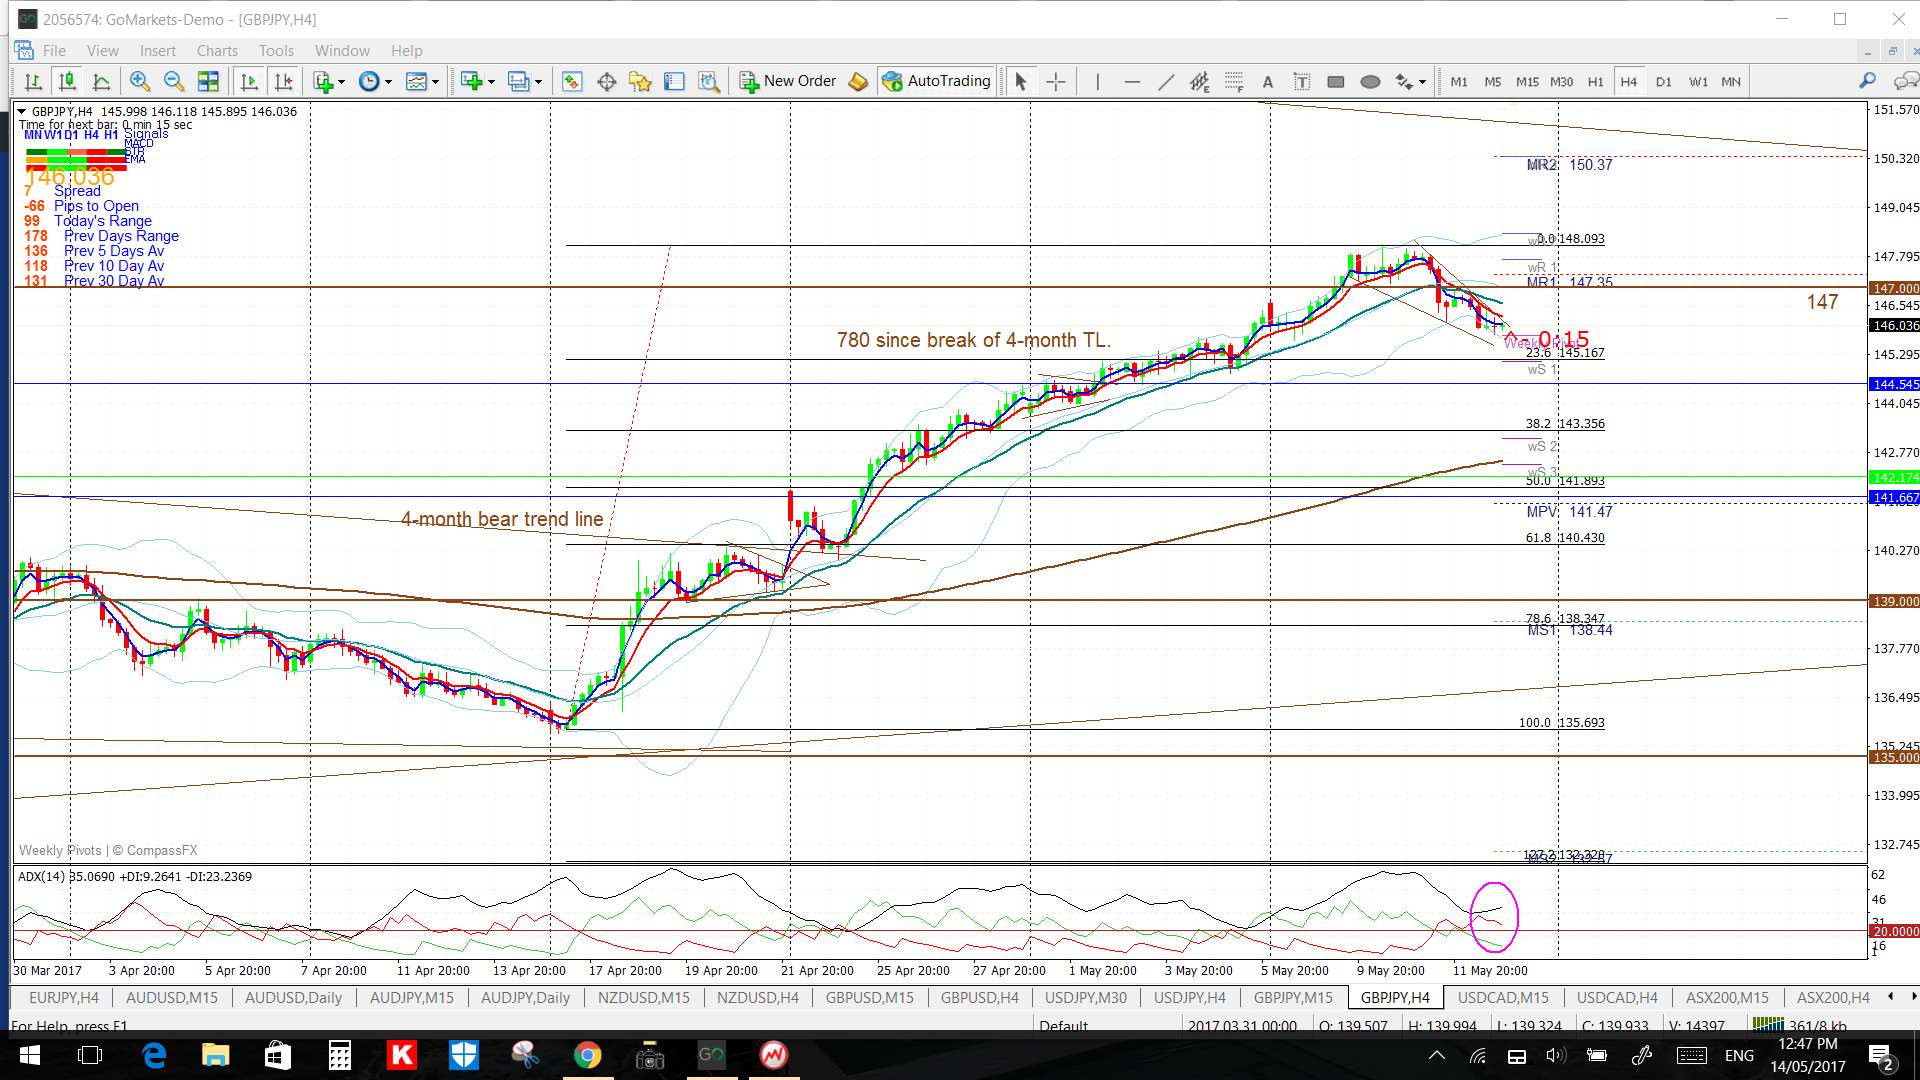
GBP/JPY: Like with the GBP/AUD, this pair is edging up towards a major bear trend line that has been in play for 20+ months and this forms a triangle on the daily/weekly/monthly charts. Technical breakout theory suggests the triangle would be worth over 4,000 pips so this upper trend line, that is still about 500 pips away, is well worth monitoring.
Thus, watch the 4hr chart’s Flag trend lines and the key 147 level for any make or break activity:
- Bullish breakout: First off is the weekly chart’s bear triangle trend line that is about 500 pips above current price. After that, 168is previous S/R and happens to be the weekly chart’s 61.8% Fibonacci so might be a target in any continuation move (see weekly chart).
- Bearish Breakdown: watch 4hr chart Fibs and 139 level.

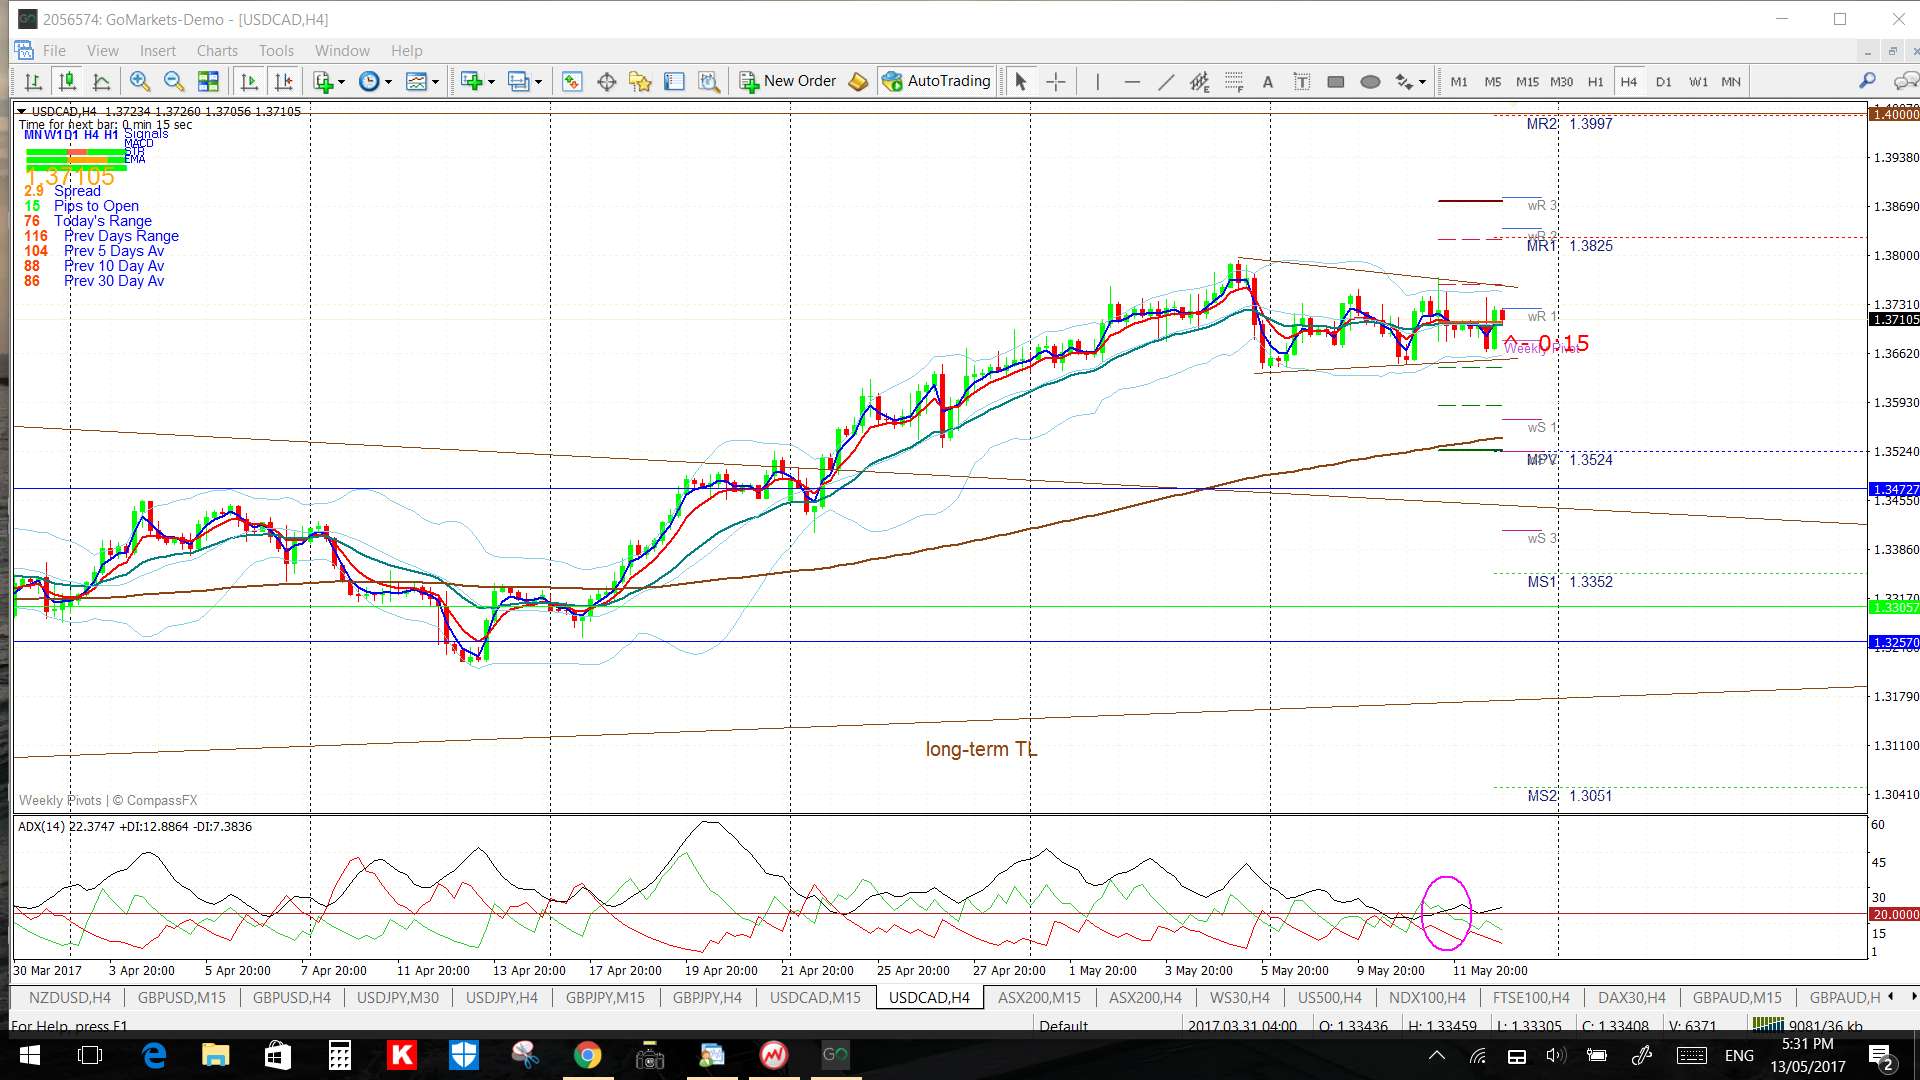
USD/CAD 4hr: Watch the 4hr chart’s wedge trend lines and then the 1.40 level for any make or break activity.
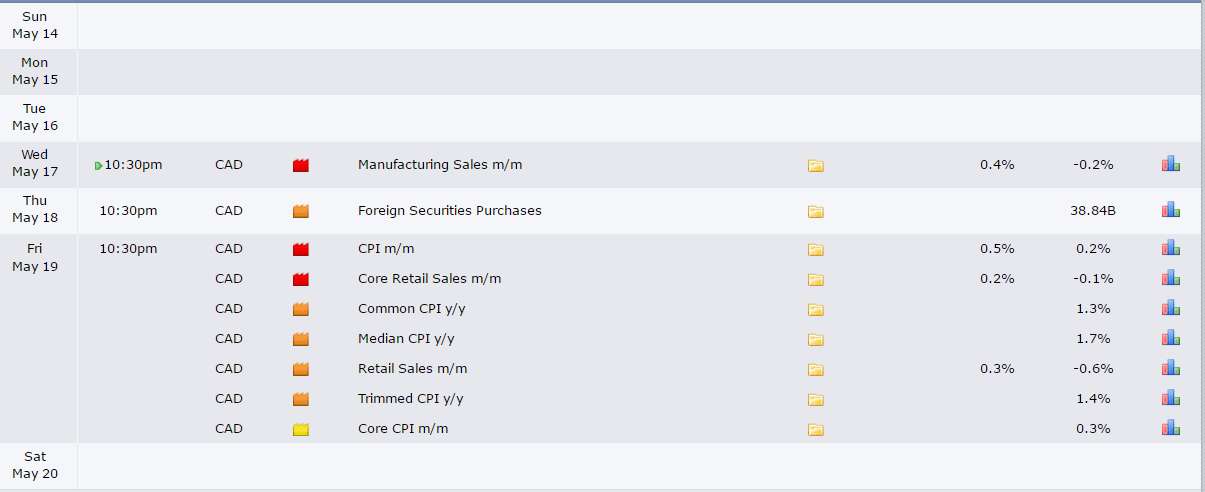
Watch this week with CAD Manufacturing Sales, CPI and Retail Sales data.
GBP/AUD: Watch the 4hr chart’s Flag trend lines for any make or break activity.
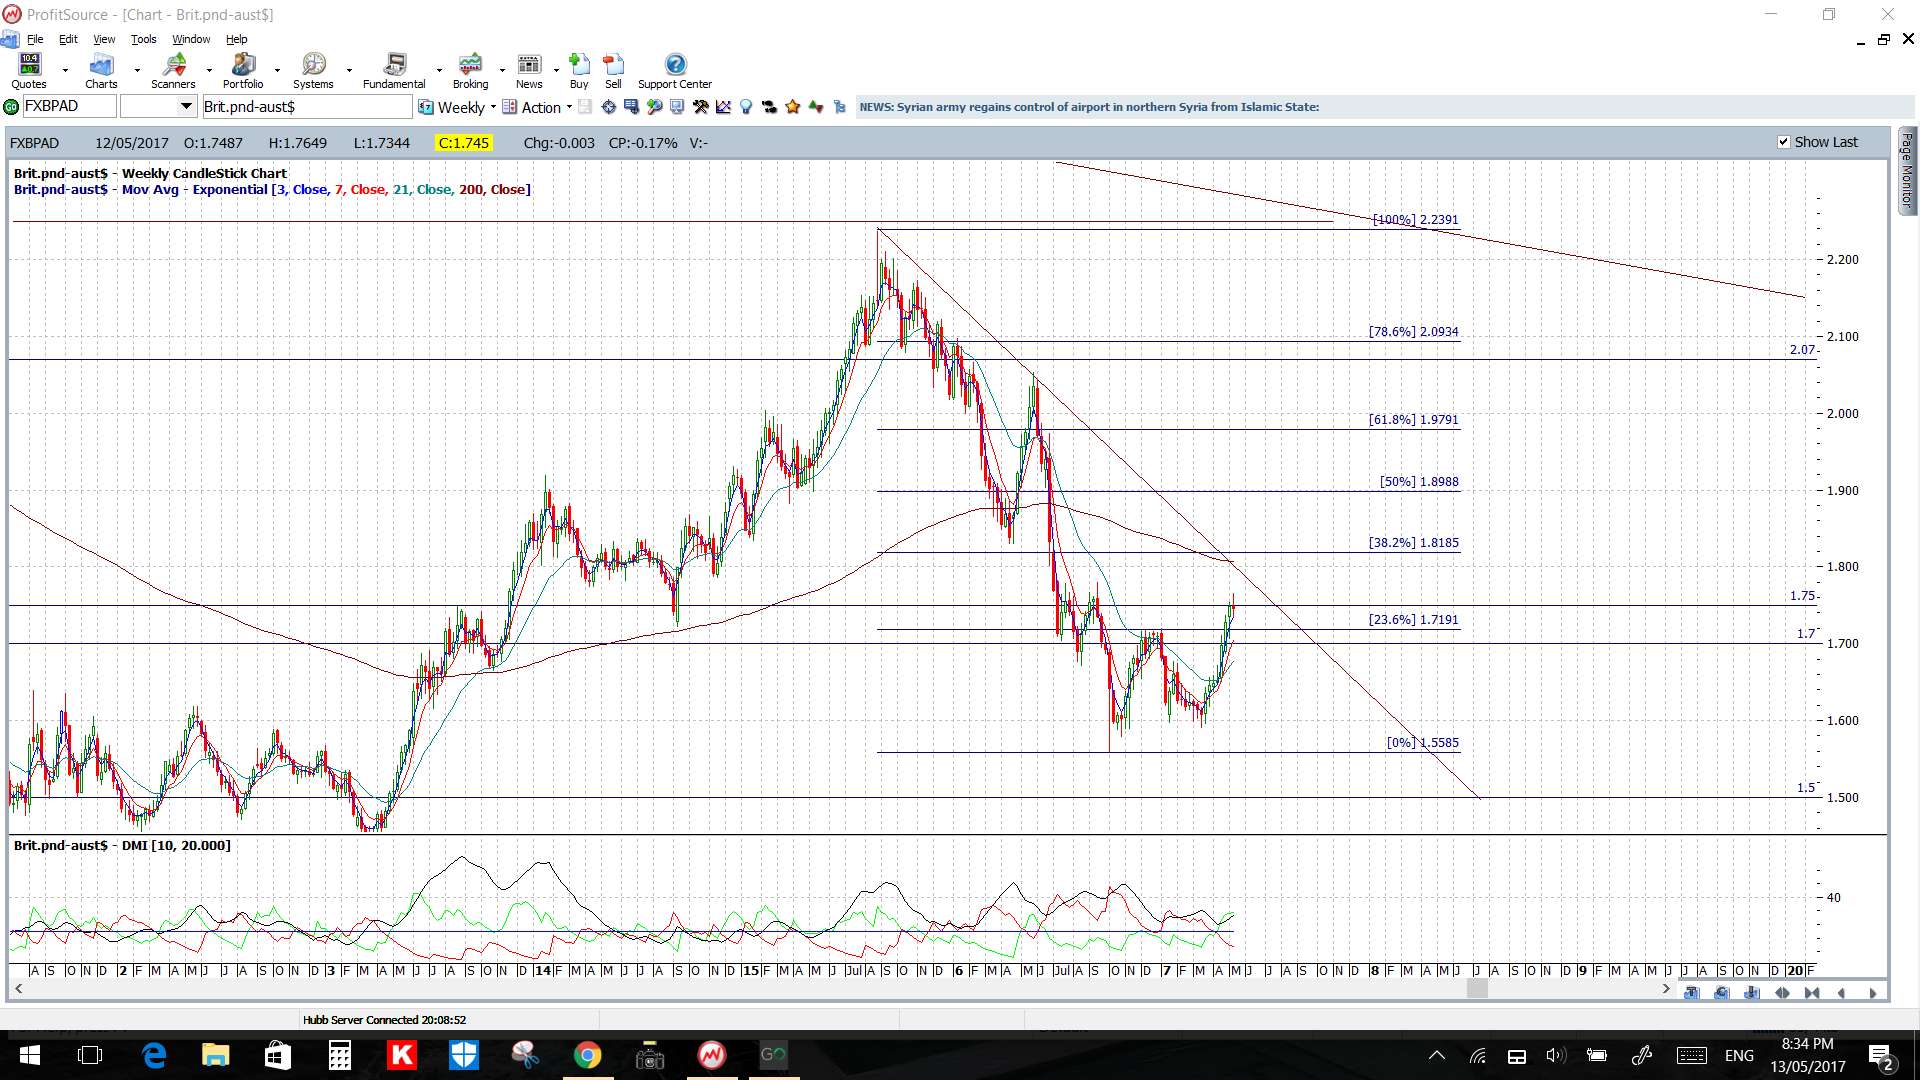
The main point to note here now though is that the GBP/AUD is edging up towards a major bear trend line that has been in play for 20 months and this forms a triangle on the daily/weekly/monthly charts. Technical breakout theory suggests the triangle would be worth 4,250 pips so this upper trend line, that is still about 900+ pips away, is well worth monitoring.
- a bullish breakout above 1.75 would bring the upper triangle trend line into focus.
- a bearish breakdown from 1.75 would bring the 4hr chart Fibs into focus.
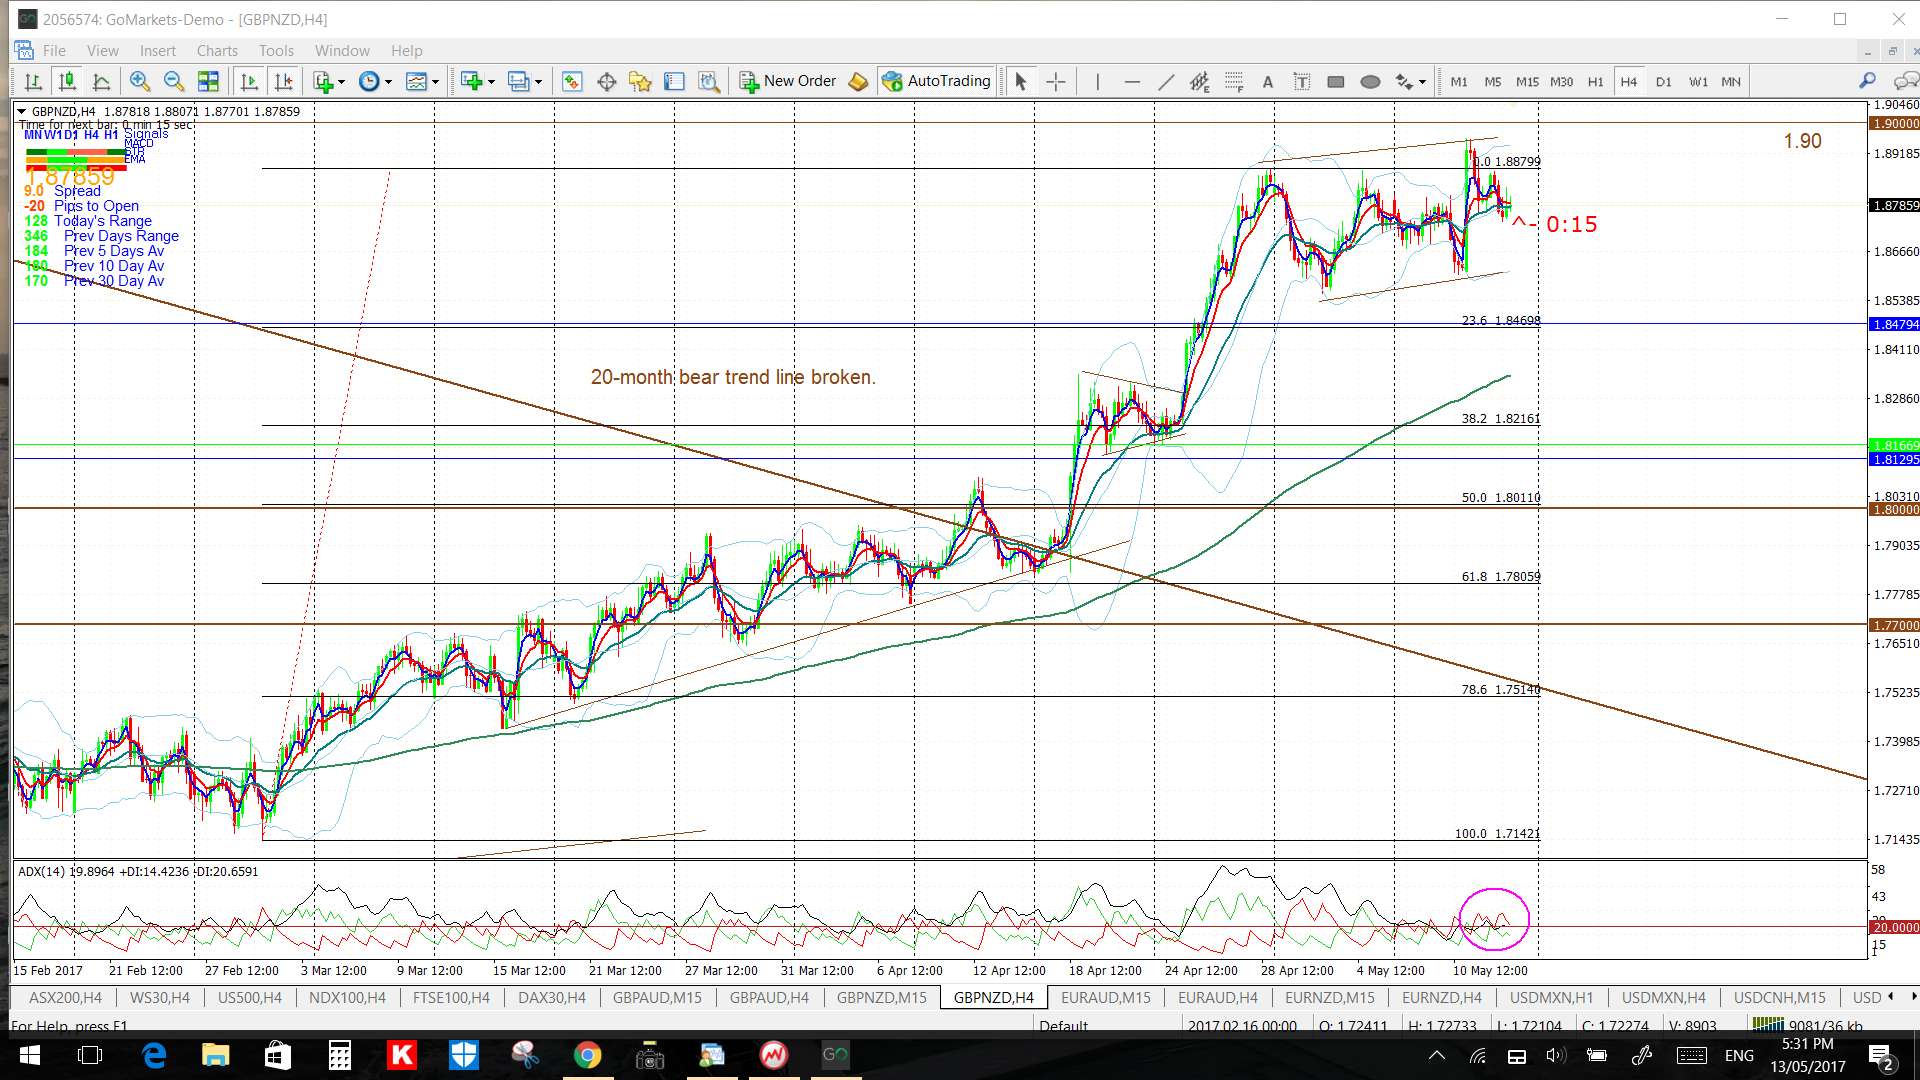
GBP/NZD: Watch the 4hr chart’s Flag trend lines and 1.90 level for any make or break activity:
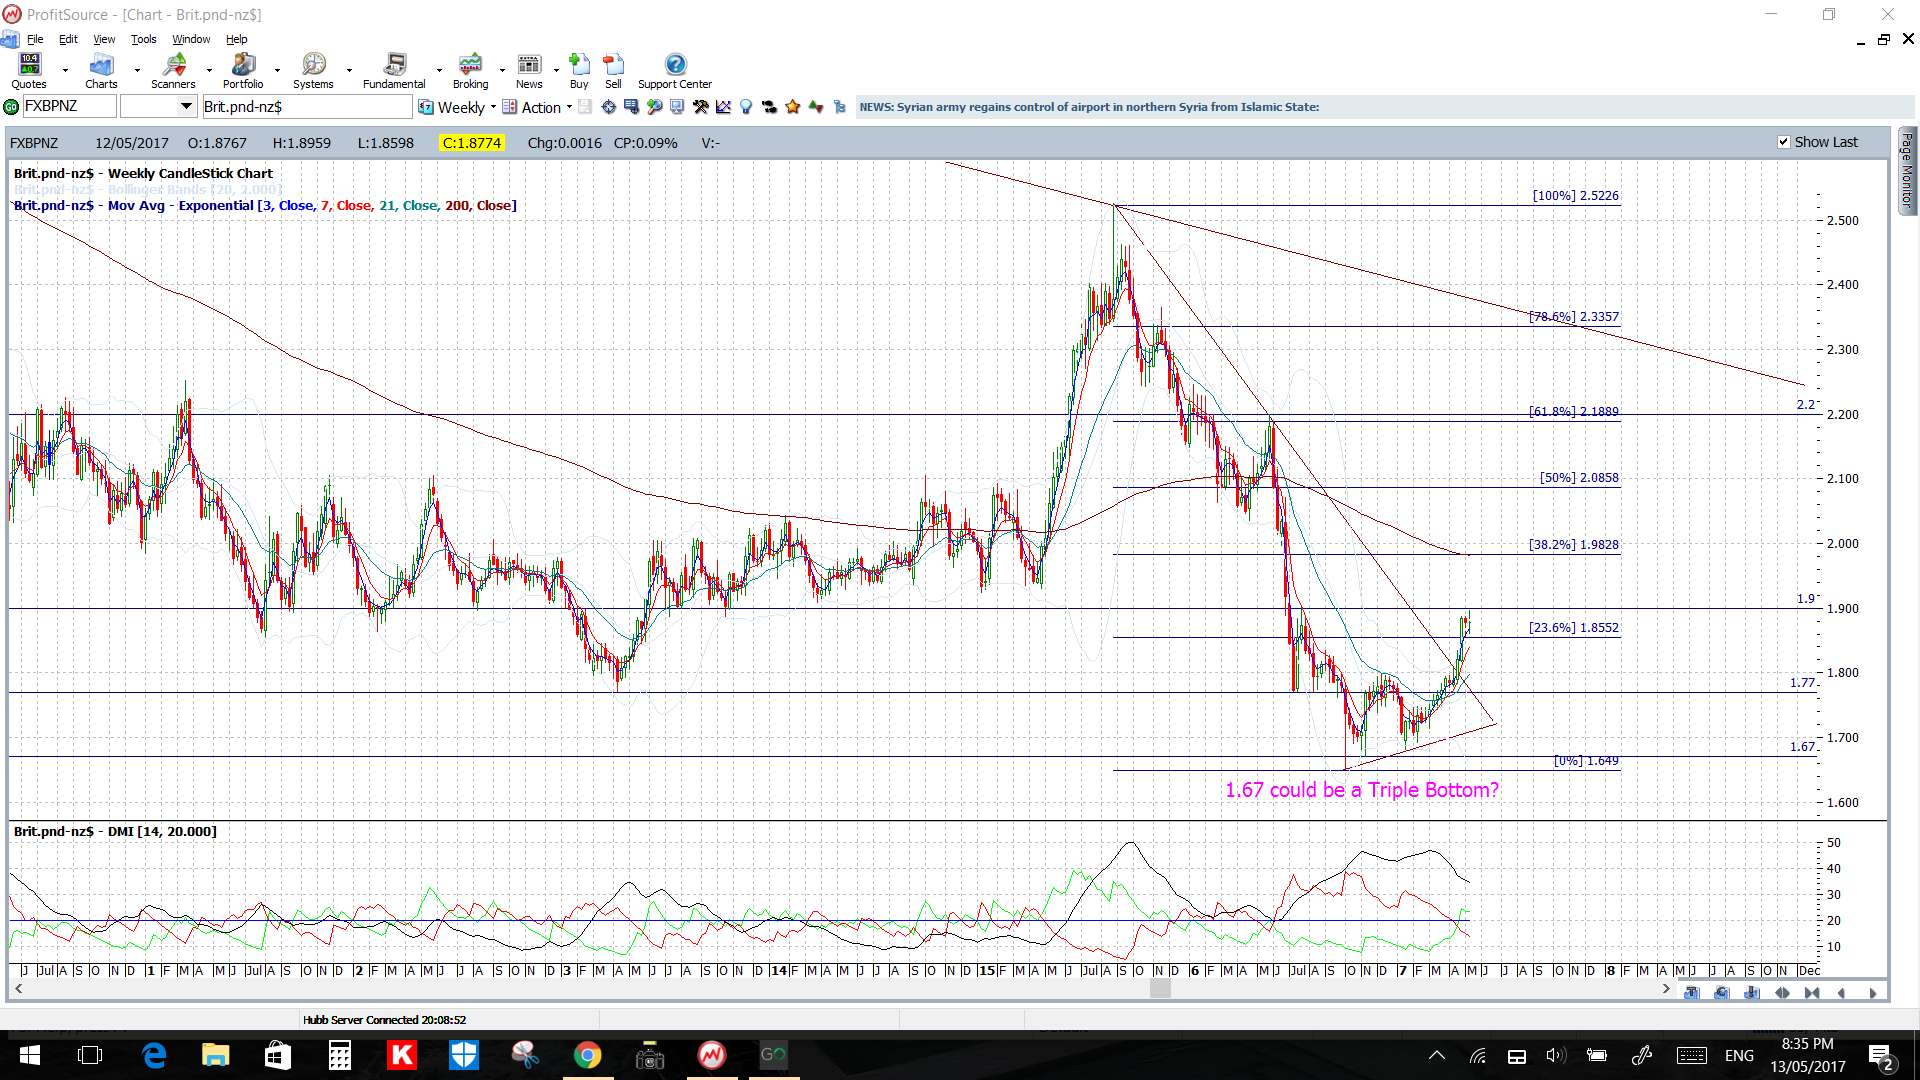
- Any bullish continuation above 1.90 would have me looking to the weekly chart’s 61.8% Fibonacci as this is near previous S/R of 2.20.
- Any bearish retreat would have me watching the 4hr chart Fib levels.
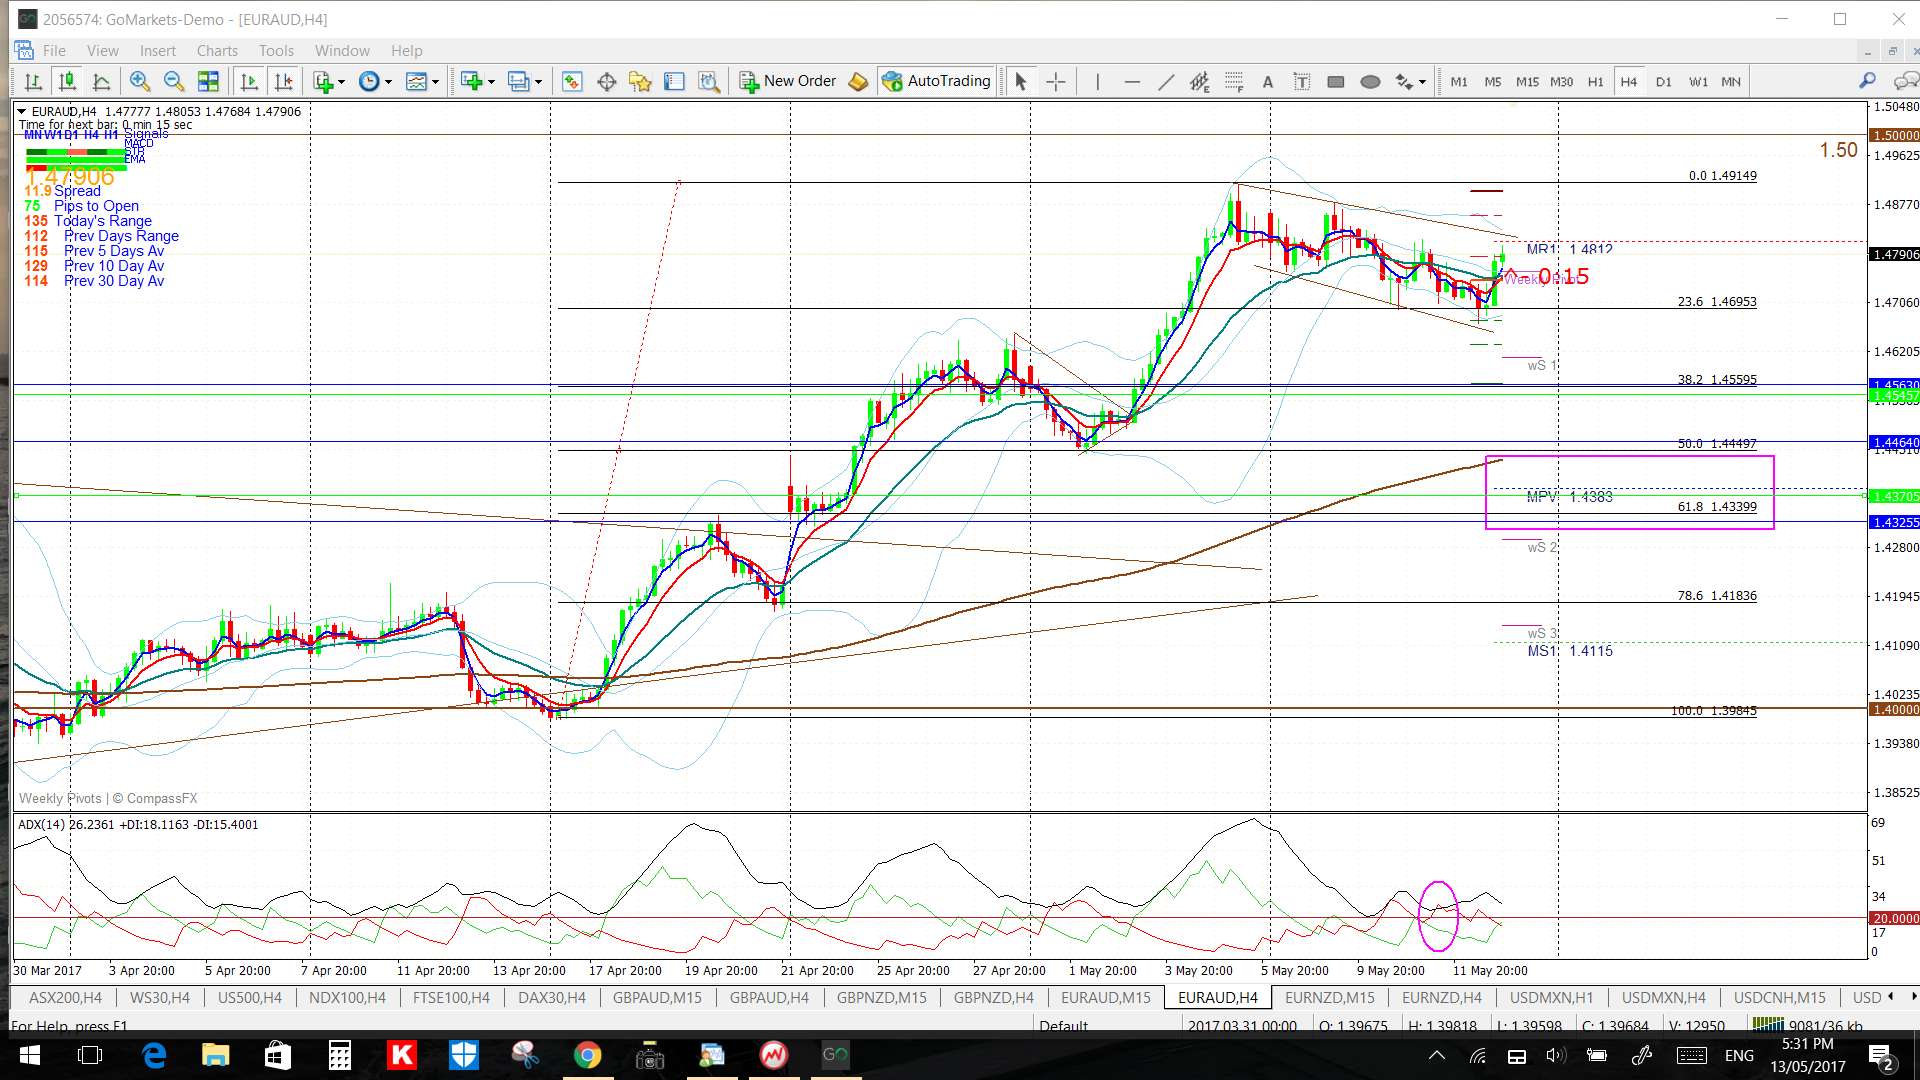
EUR/AUD: Watch the 4hr chart’s Flag trend lines and 1.50 level for any make or break activity:
- Bullish breakout: watch the weekly/monthly chart’s bear trend line and 1.55 S/R region.
- Bearish breakdown: watch the 4hr chart’s Fib levels esp the 61.8% fib as it is near the 4hr 200 EMA and monthly pivot.

EUR/NZD: Watch the 4hr chart’s triangle trend lines and 1.60 level for any make or break.
- Bullish breakout: watch for any move up to test the 1.675 S/R level, which is also near the weekly chart’s 50% Fib..
- Bearish Breakdown: watch the 4hr chart’s Fib levels


USD/CNH: Watch the 4hr chart’s triangle trend lines level for any make or break activity.
USD/TRY: Watch the 4hr chart’s triangle trend lines for any make or break activity.

USD/MXN: Watch the 4hr chart’s triangle trend lines and 19 level for any make or break activity.
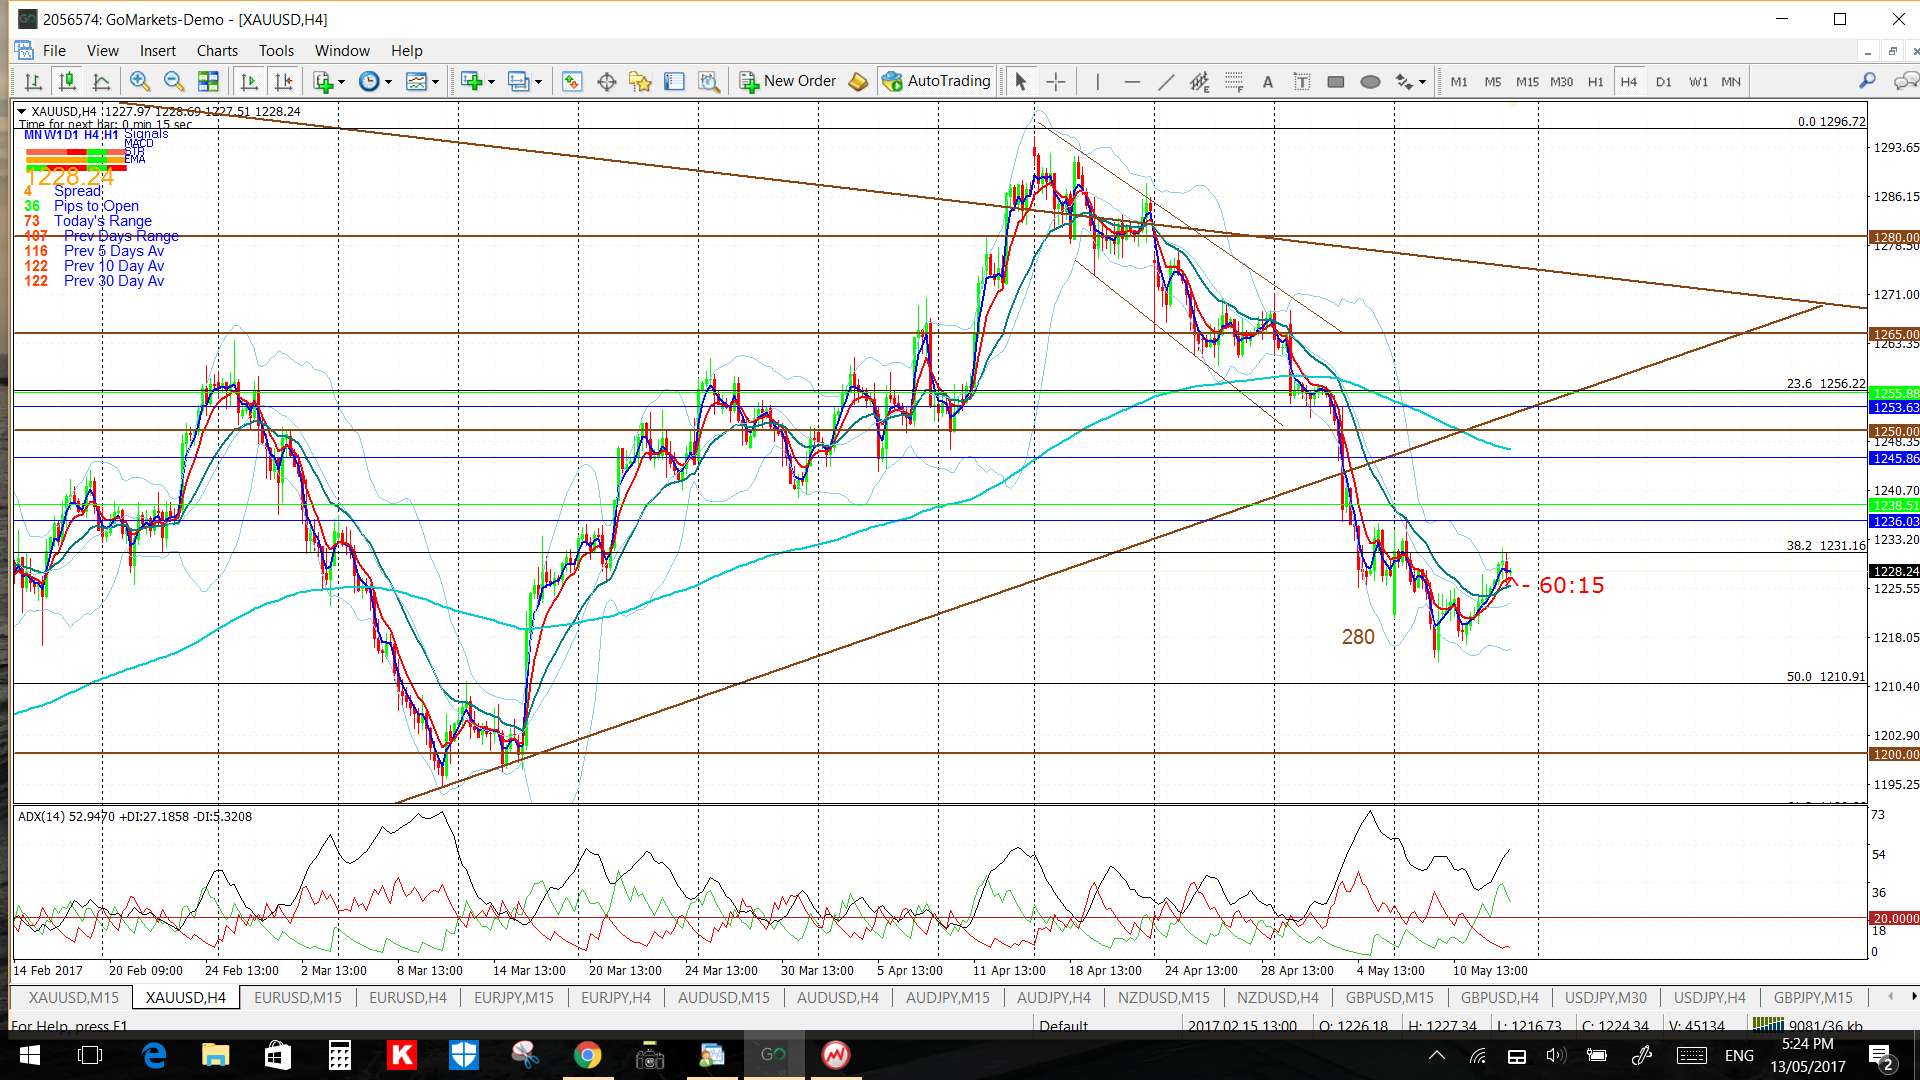
Gold: Watch the daily chart’s 61.8% Fib and $1,200 S/R level for any make or break activity.

Silver: Watch the daily chart’s support triangle trend line for any make or break activity.
