The U/J has been trading within a daily chart triangle for the last two weeks and the S&P500 looks to be ranging within a similar pattern. The main scheduled risk even remaining for this week is Wednesday’s FOMC and traders will be watching these instruments to see how they react to this news. I emphasise ‘scheduled’ as unscheduled Greek news has the potential to impact risk appetite across the broader markets.
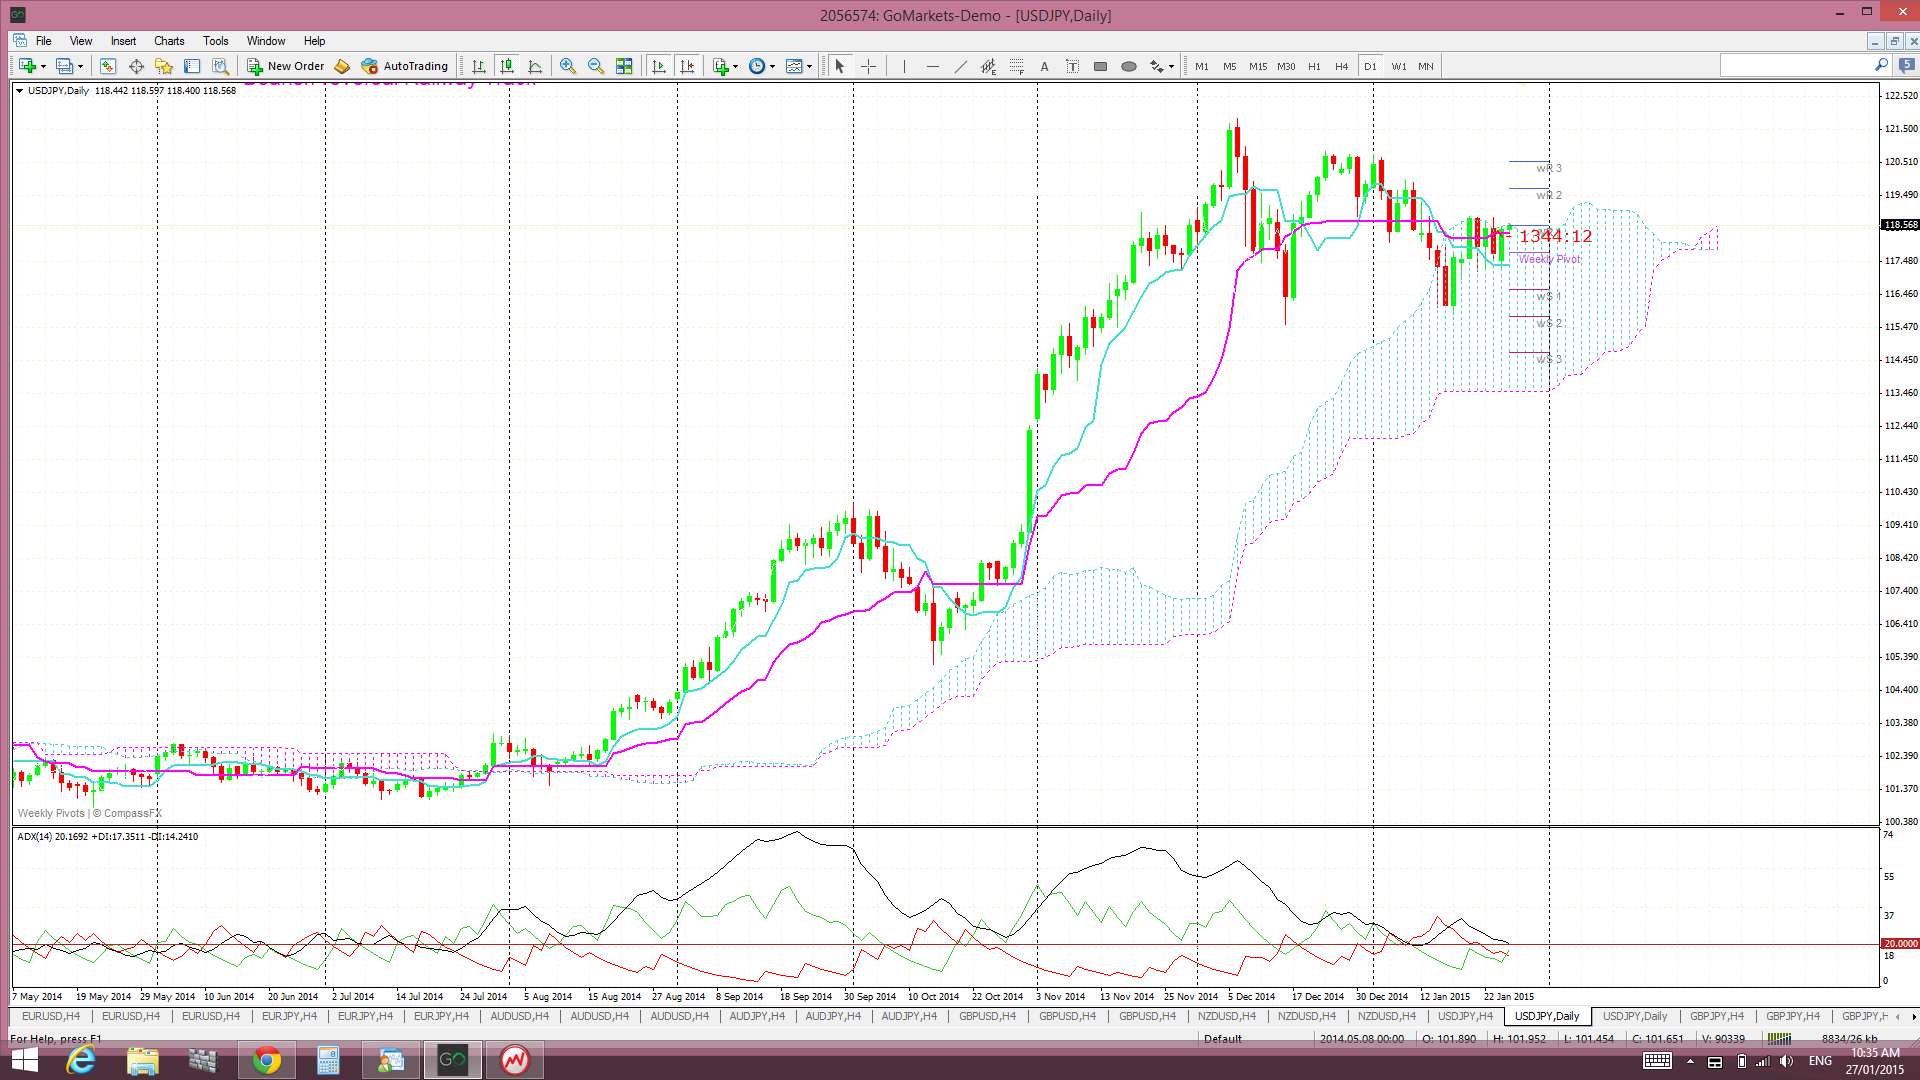
U/J daily: ranging within a daily triangle. Note the current absence of momentum as displayed by the ADX. I’m watching for any triangle breakout, bullish or bearish:

U/J daily Cloud: The U/J is currently stuck within the Cloud and I’m watching for any new breakout from this resistance zone as well. Any bullish breakout above the daily Cloud accompanied by a bullish triangle breakout, whilst not without risk, would be a very strong BUY signal:
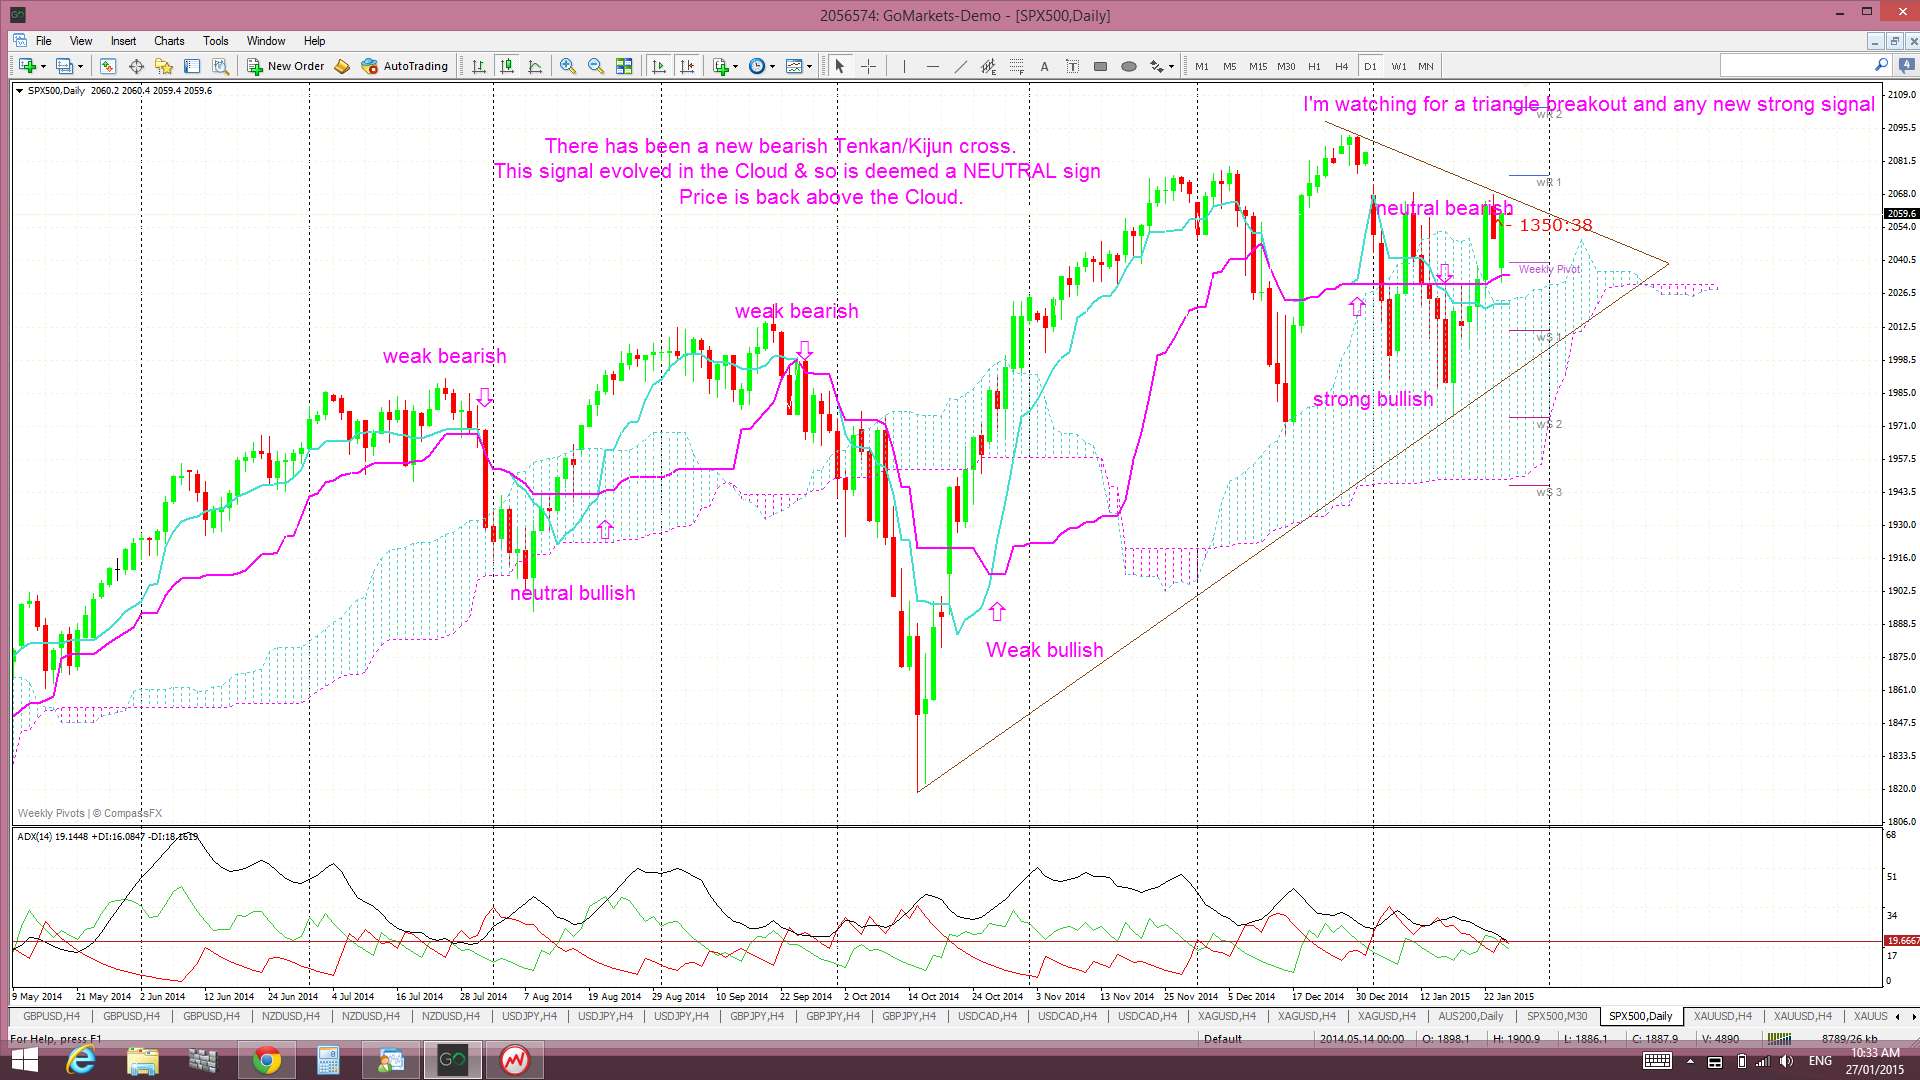
S&P500 daily: this US stock index is forming up within a daily chart triangle as well. Note the absence of momentum here too as seen on the ADX. Price is currently above the Cloud but there is a bearish Tenkan/Kijun cross in play. Watch for any new Tenkan/Kijun cross as a bullish cross above the Cloud would be a ‘strong’ signal. A bullish triangle breakout with any new bullish Tenkan/Kijun cross would also be a strong BUY signal:
Traders will be watching to see if Wednesday’s FOMC news may be a catalyst to trigger an outbreak here on both the U/J and S&P500. Traders need to watch for either a bullish or bearish triangle breakout.
Summary: I’m watching the daily chart time frame of the U/J and S&P500 for any new triangle breakout, bullish or bearish, that evolves with momentum. I’m also watching the S&P500 daily Ichimoku Cloud for any new Tenkan/Kijun cross and the U/J for any daily Cloud breakout.
The post U/J & S&P500: areas to watch with FOMC. appeared first on www.forextell.com.