Last week: The US$ remained choppy until mid-week but there were two new TC signals: U/J = -20 (closed) and Cable= 140 (still open).
This week:
The US$ seemed to get its mojo back last week but I am still waiting for a decisive breakout move either above 100 or below 95.5. An update on the FX Indices can be found through this link.
There are three items of high impact Chinese data this week that may impact FX and, in particular, the AUD and Kiwi pairs.
There are G20 and IMF meetings in the coming week and unscheduled news releases from these have the potential to impact markets and should therefore be monitored (think: Greece).
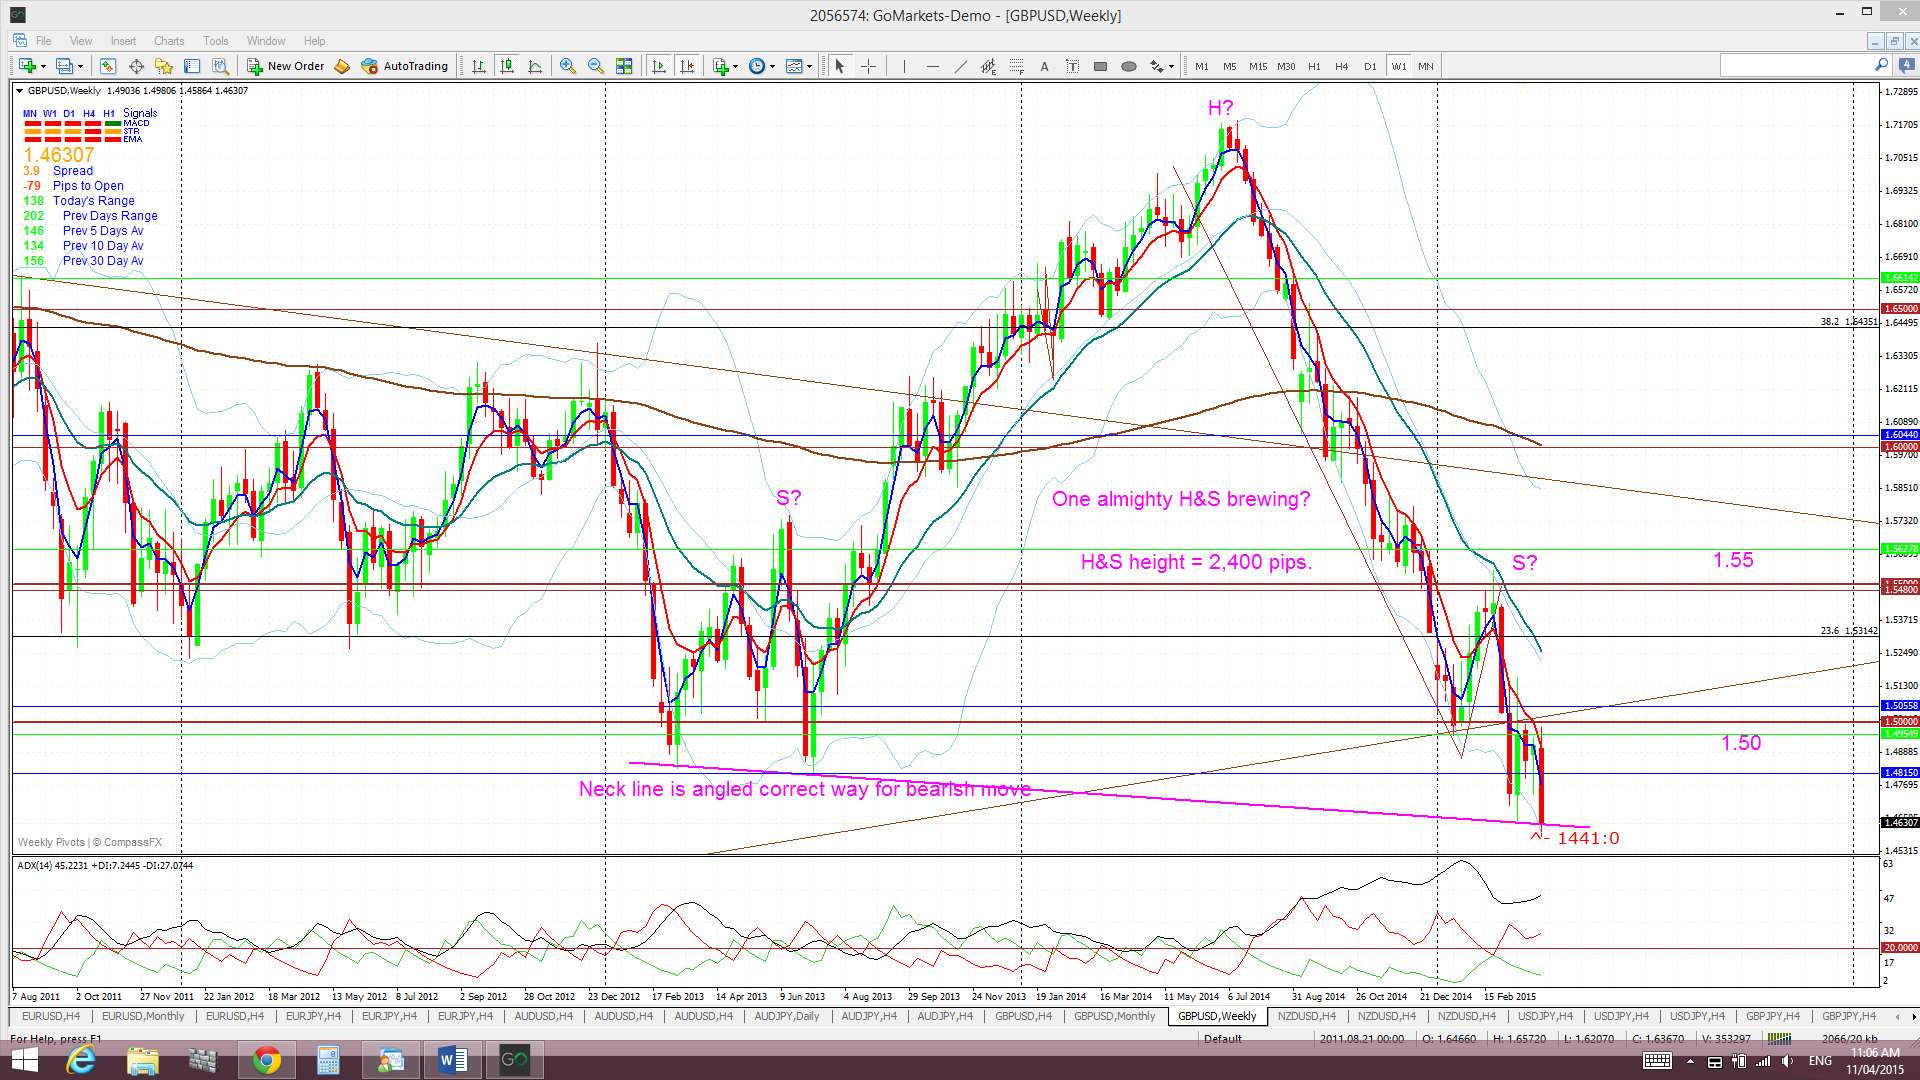
Cable: this looks to be teetering on the edge of the proverbial cliff. A nasty, weekly-chart bearish H&S move is close to being triggered.
U/J and Loonie: both continue ranging within channels and forming up into potentially bullish monthly-chart Cup ‘n’ Handle patterns. The trend lines here are well worth monitoring.
Events in the Ukraine and the Middle East, as well as with Greek Debt talks, continue to have the potential to undermine any developing ‘risk’ appetite and need to be monitored.
Stocks and broader market sentiment:
Global stocks had a bullish week and I am wondering whether we might be starting to see some FOMO action, that is, Fear Of Missing Out! Whilst there is plenty of chatter about signs of a market top here one has to be mindful of the evolving context with trading now, especially with the emergence of China and India and the shifting market landscape.
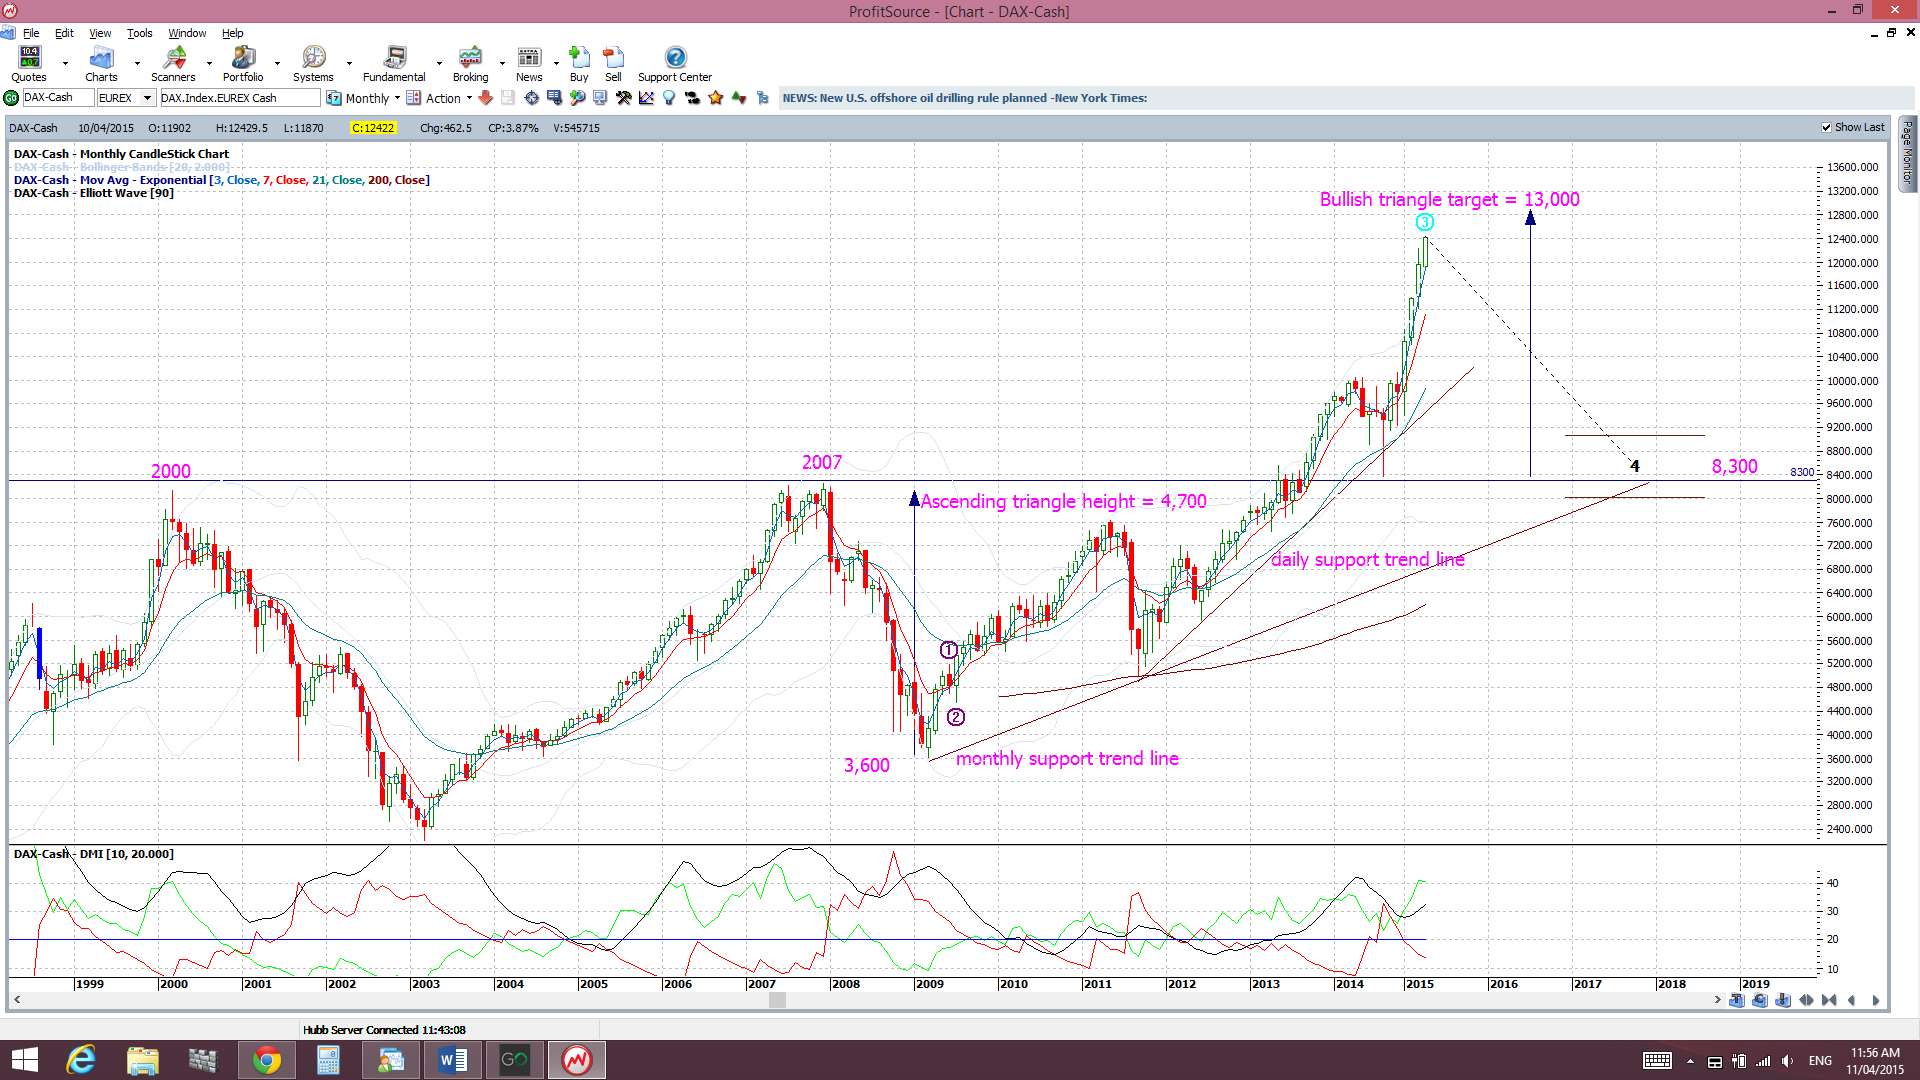
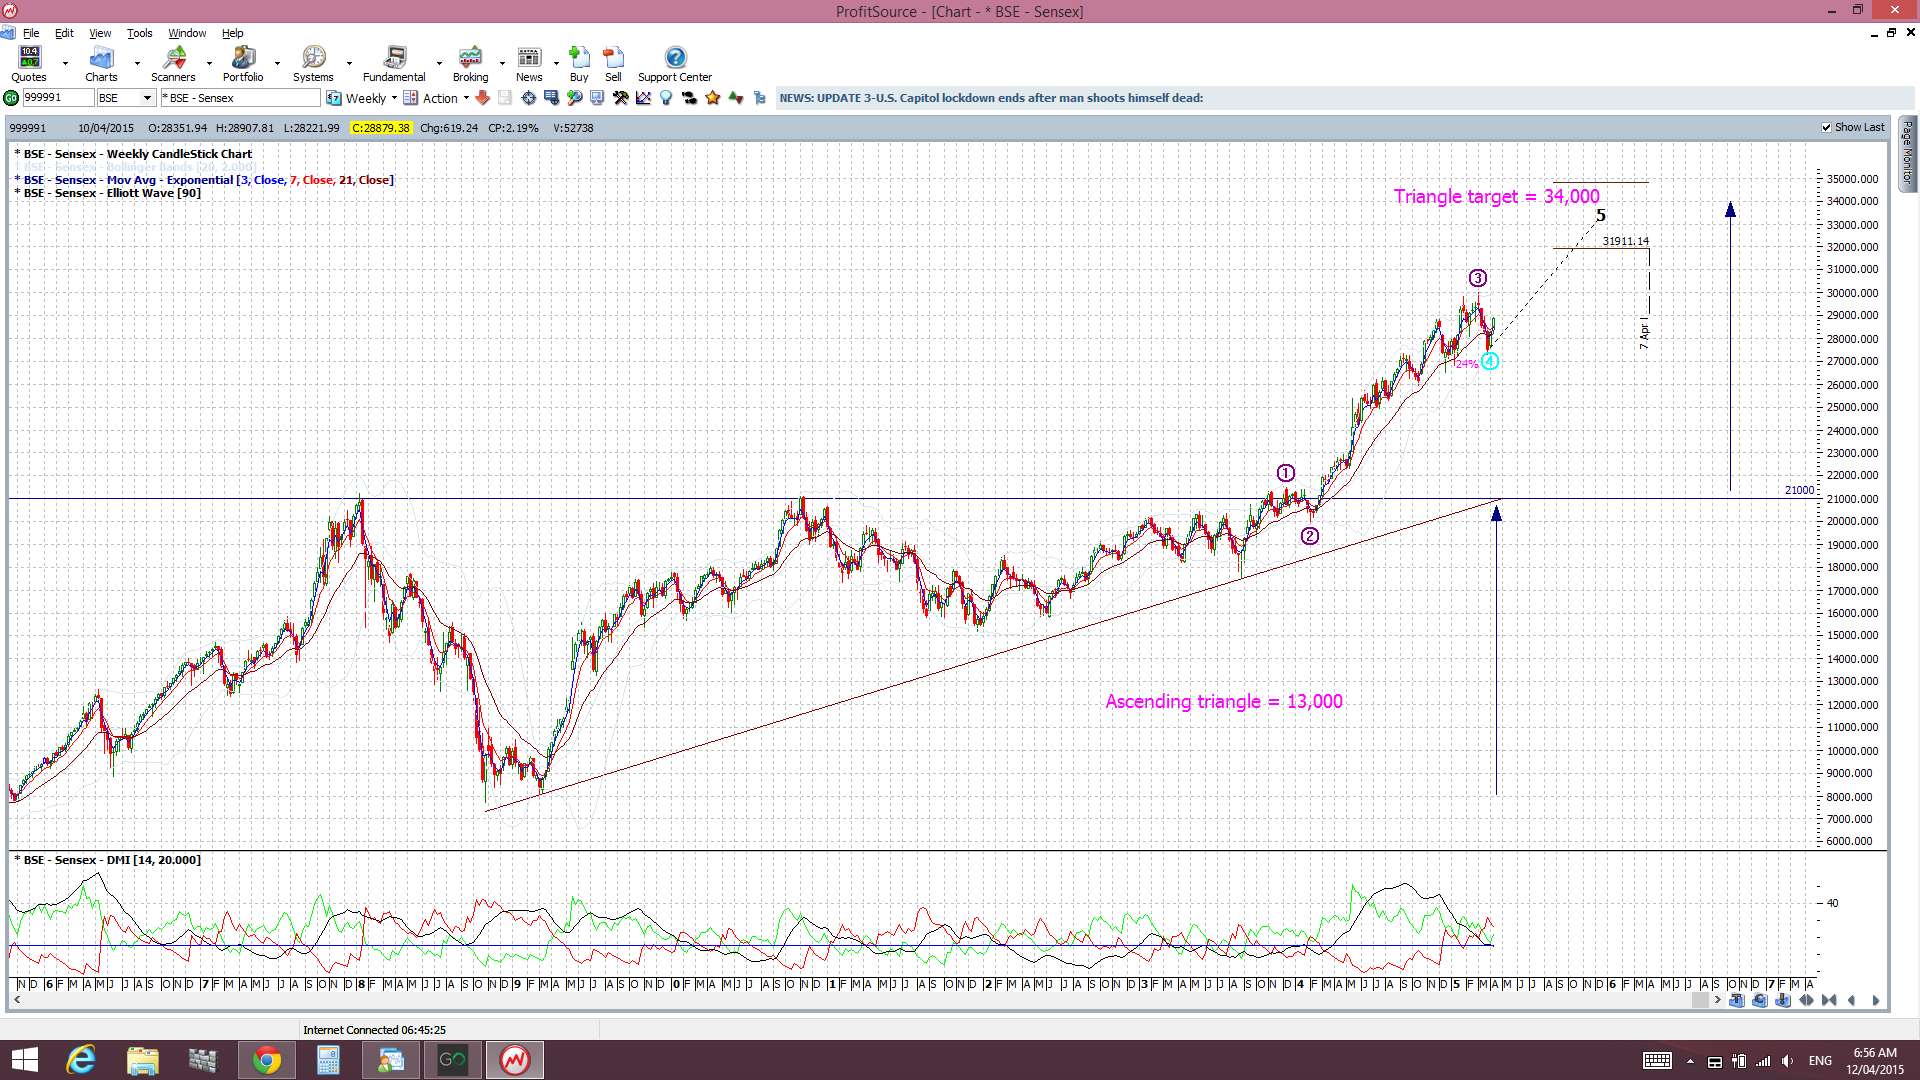
The German DAX is almost up to the bullish target I have had on my charts for some time, so too India’s SENSEX, and I’m watching for other stock indices to continue on their bullish follow-through ascending triangle moves as well:
German DAX monthly: almost there:
India SENSEX: making good progress as well:
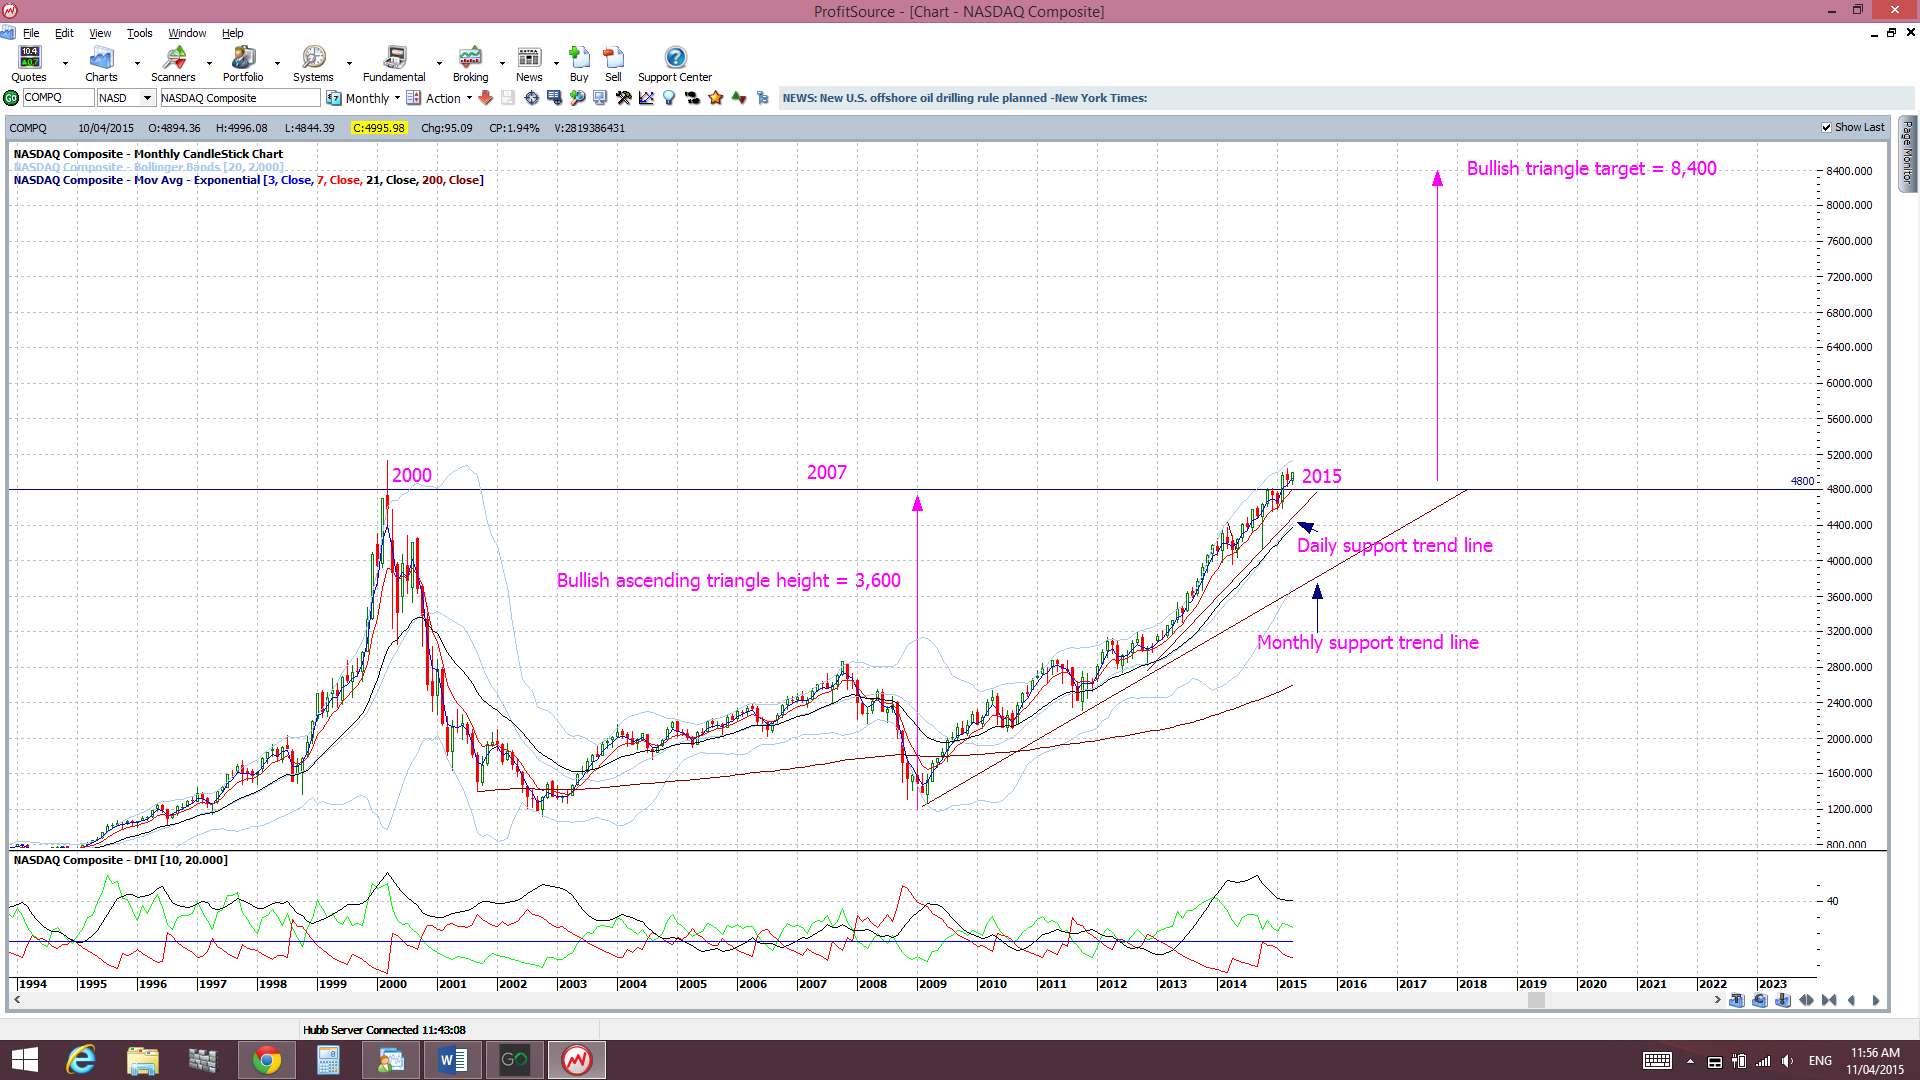
NASDAQ monthly: holding above 4,800:
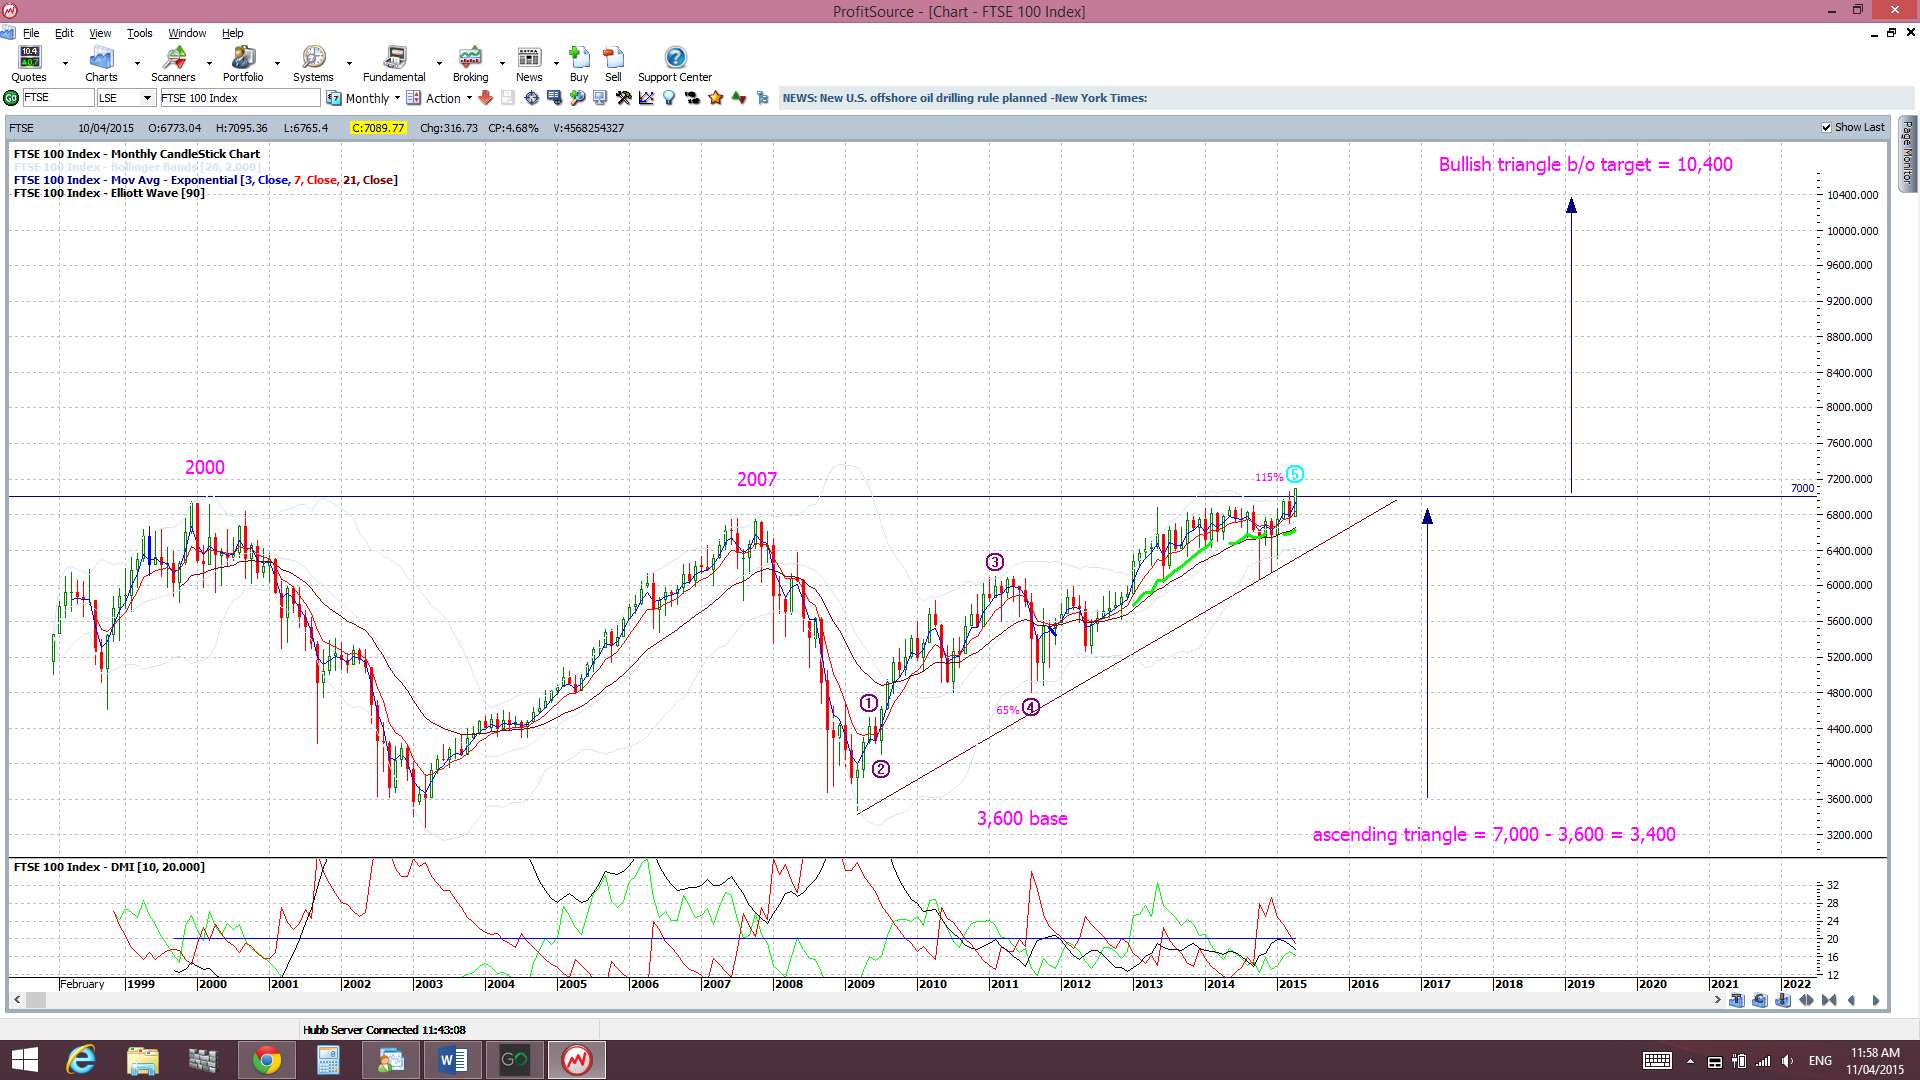
London’s FTSE monthly: month has only started but the FTSE makes its first weekly close above 7,000:
Canada’s TSX monthly: 16,000 seems the new barrier here:

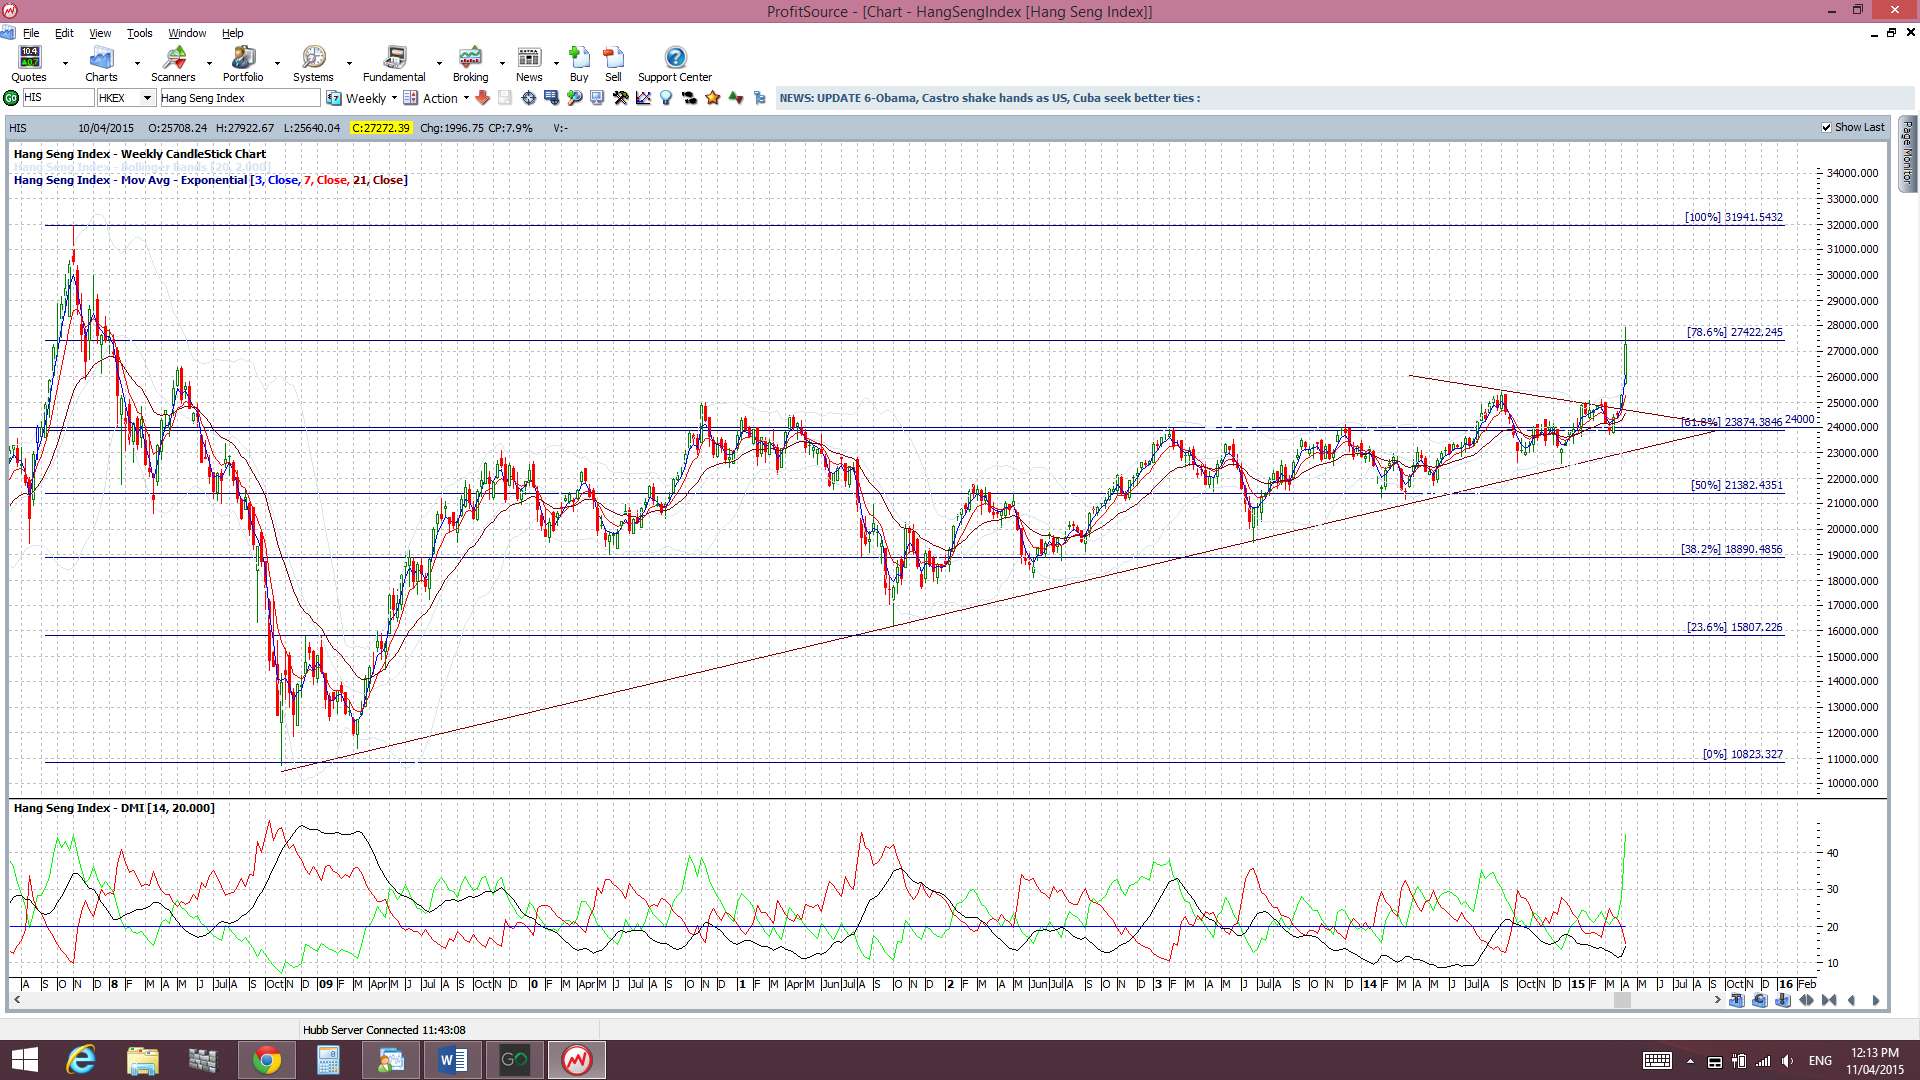
Hong Kong Hang Seng Index weekly: seems to have the 32,000 level in its sights:
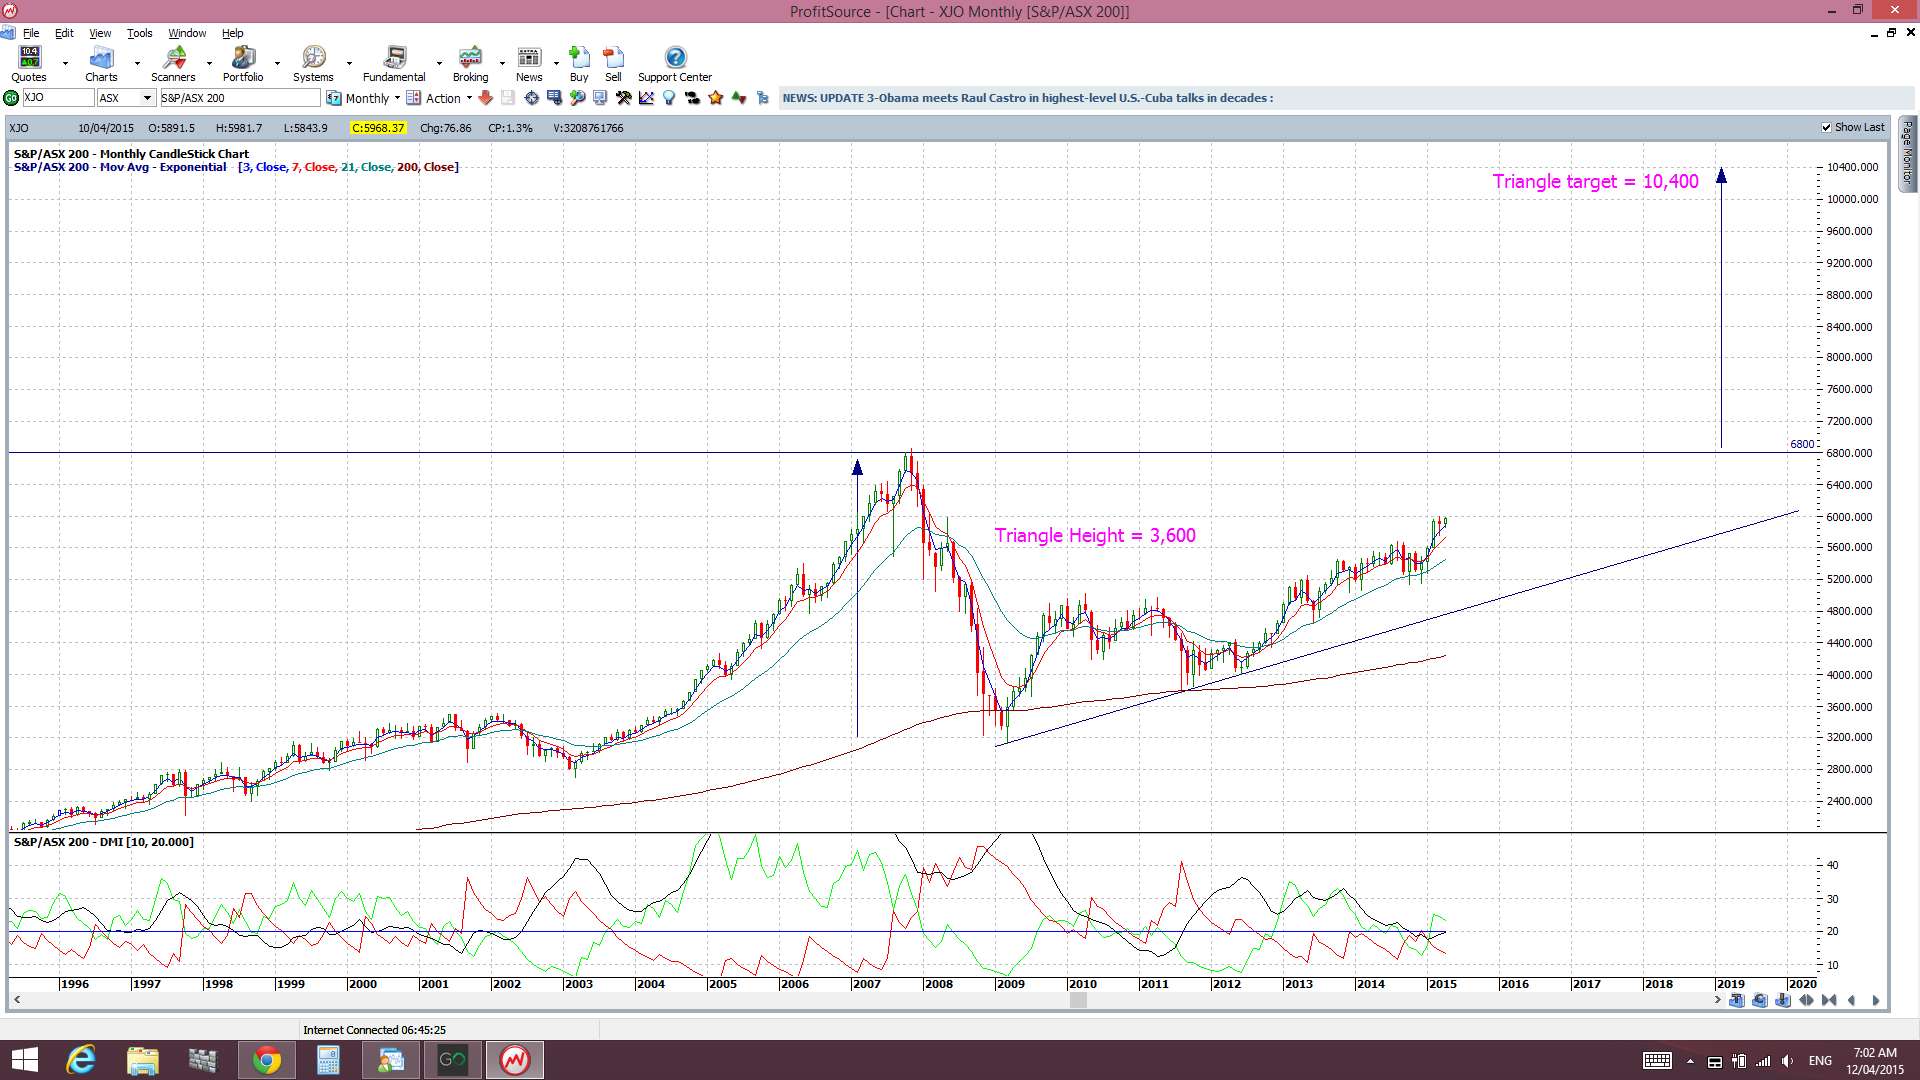
Australia’s XJO: dragging the chain a bit here BUT does this make for better trading opportunities?
Watch for any continued recovery with the price of Oil as this should support energy stocks which would help to lift the S&P500.
Thus, with all of this, I continue to watch out for further clues as to any new momentum move, long or short! In particular I’m looking out for:
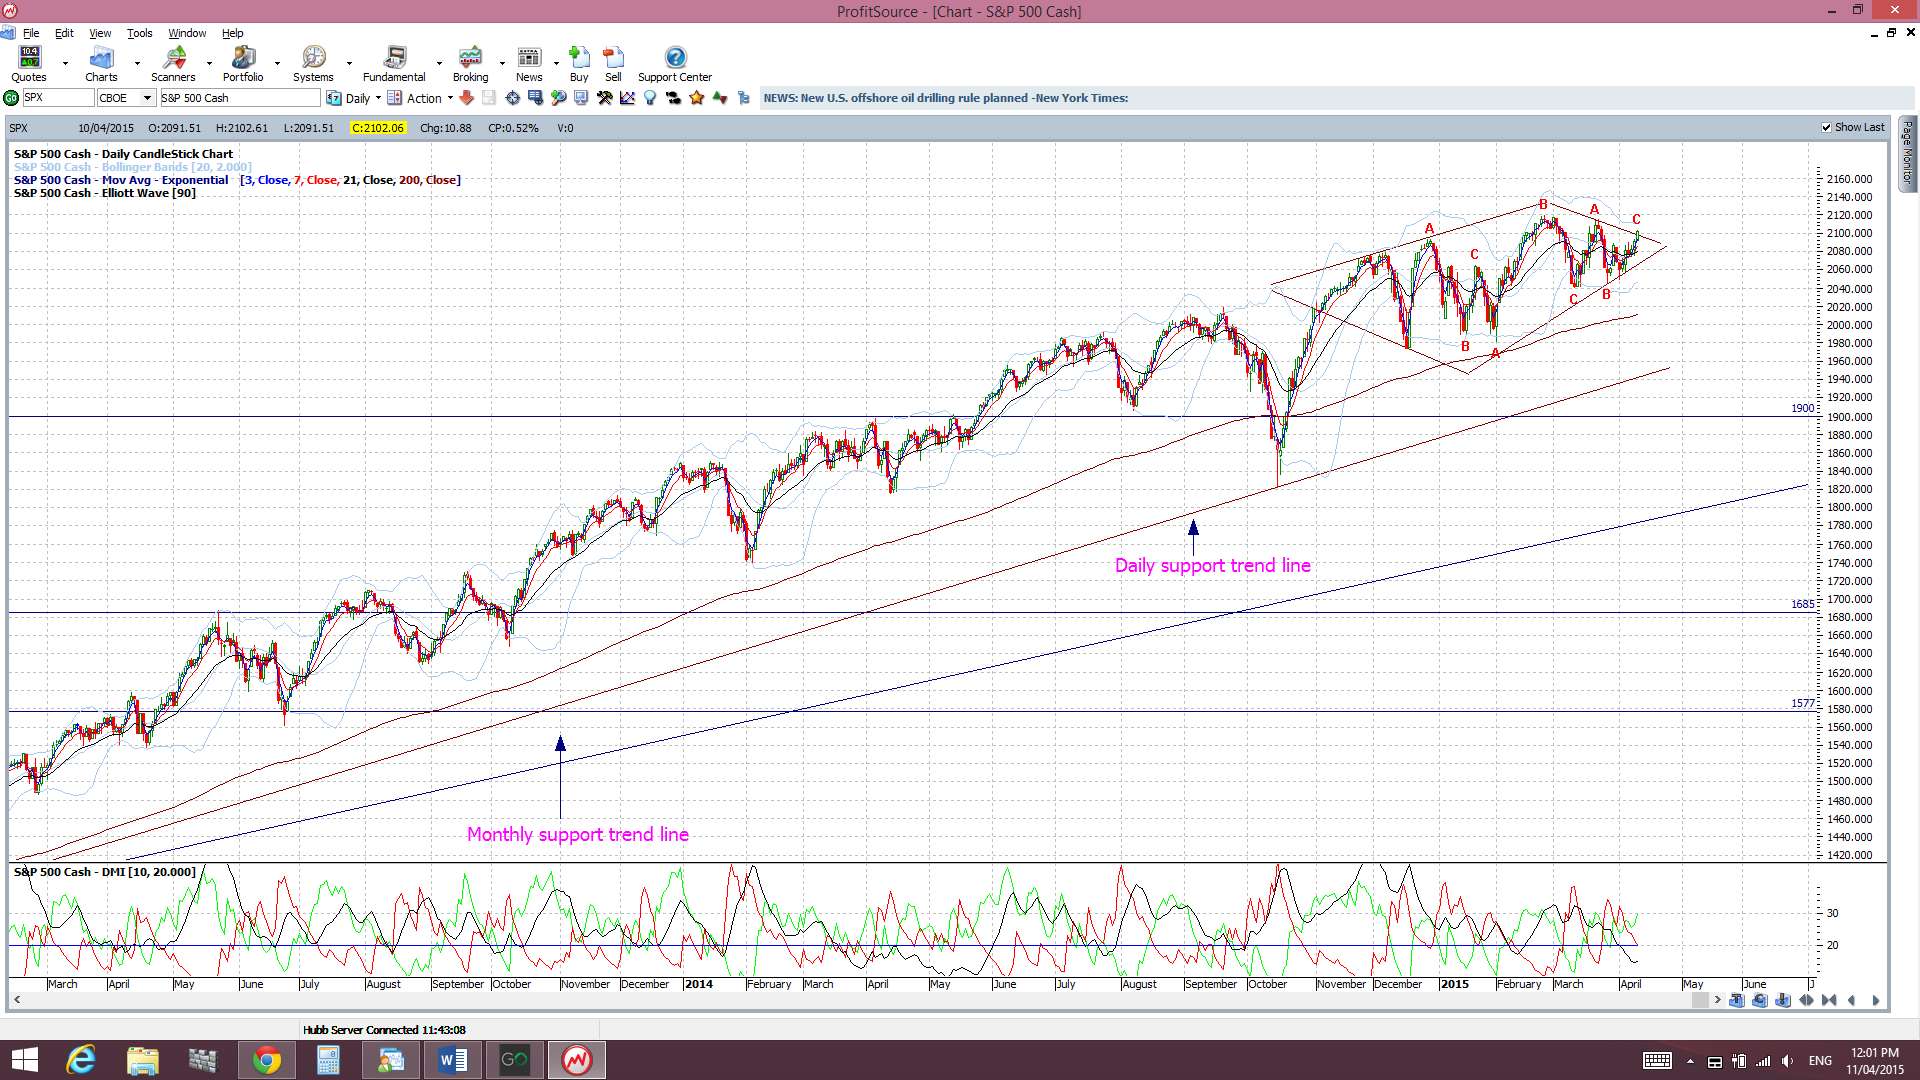
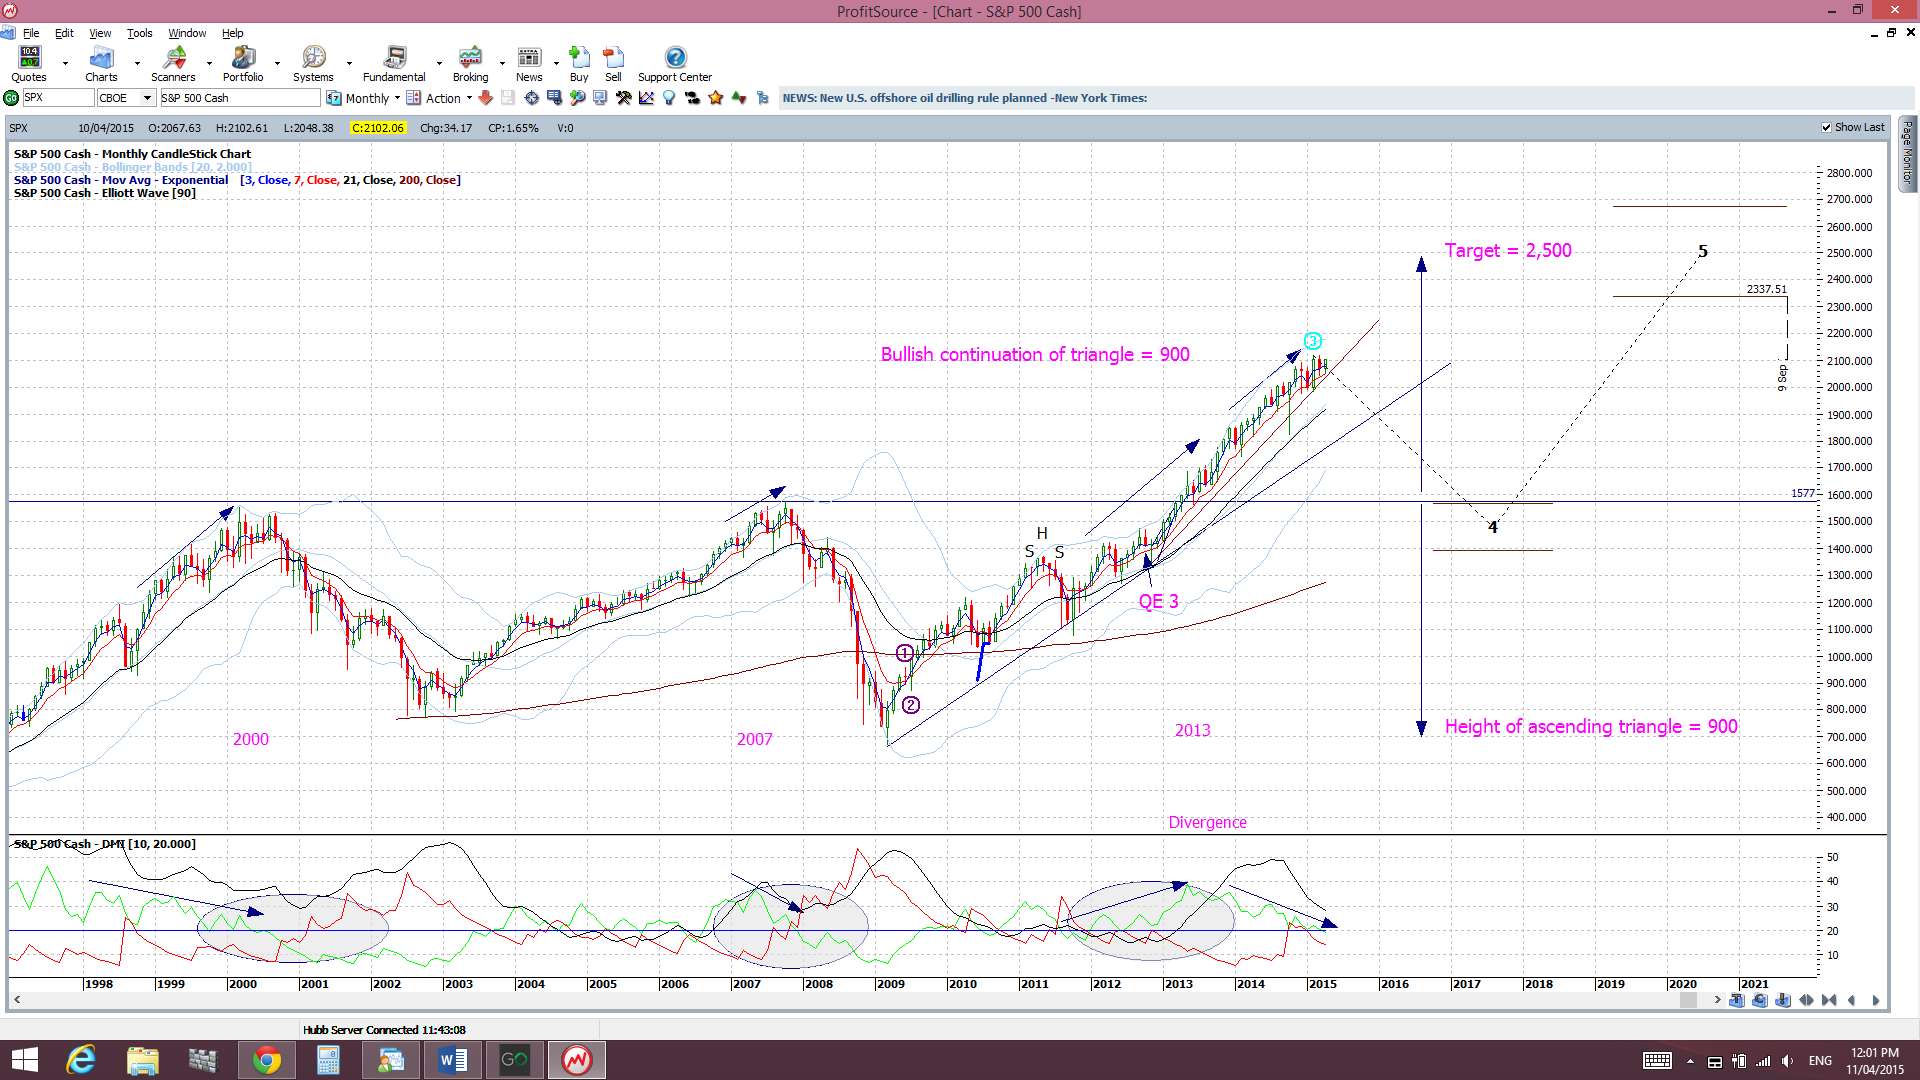
S&P500 daily chart: The index is still trading above the psychological 2,000 level and above daily trend line support. So much for the bearish ‘Diamond’ pattern! It looks more like a bullish triangle breakout to me now!
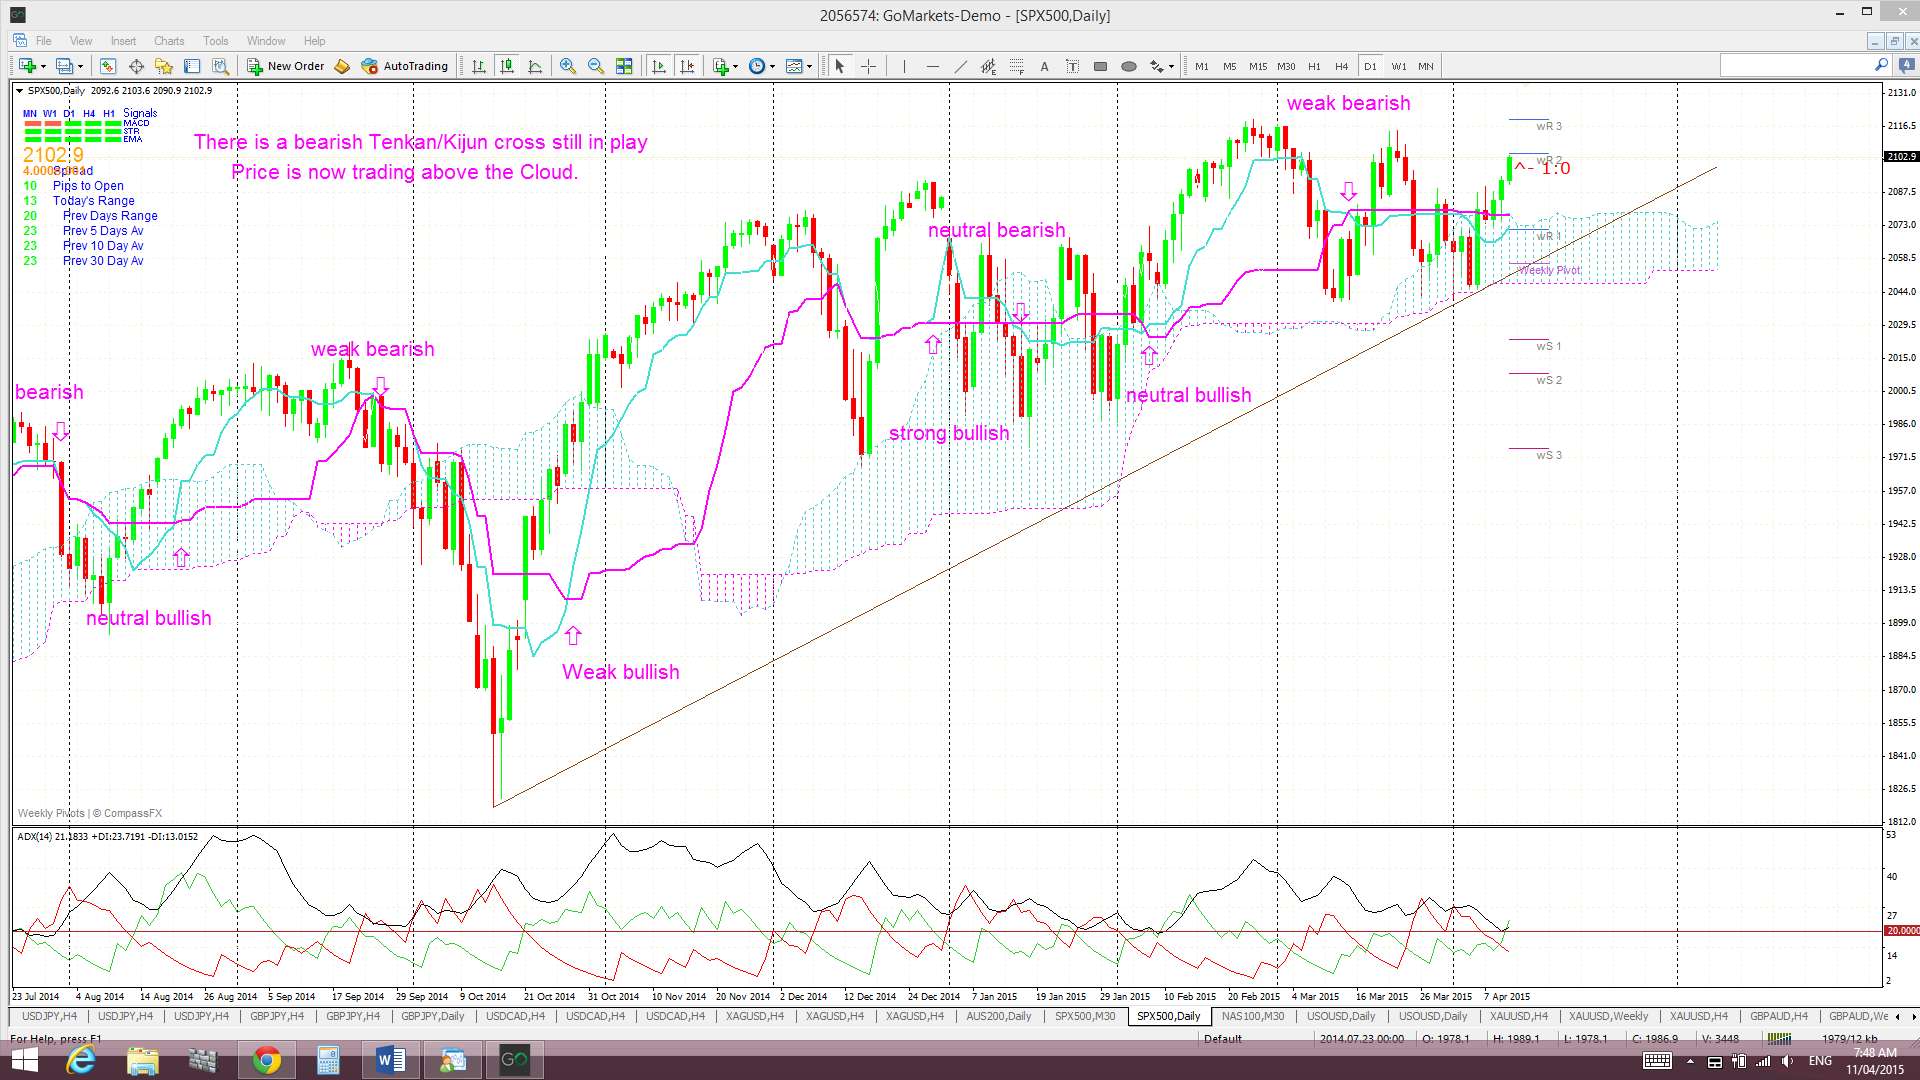
Ichimoku S&P500 chart: a clear cross of the blue Tenkan-sen line below the pink Kijun-sen line. There has been a recent bearish Tenkan/Kijun cross here but price is back above the Cloud. Watch for any new bullish Tenkan/Kijun cross as this would be deemed a ‘STRONG’ signal:
S&P500 monthly chart: a break of the monthly support trend line. The monthly trend line remains intact. A break of this support level would suggest to me of a more severe pull back or correction.
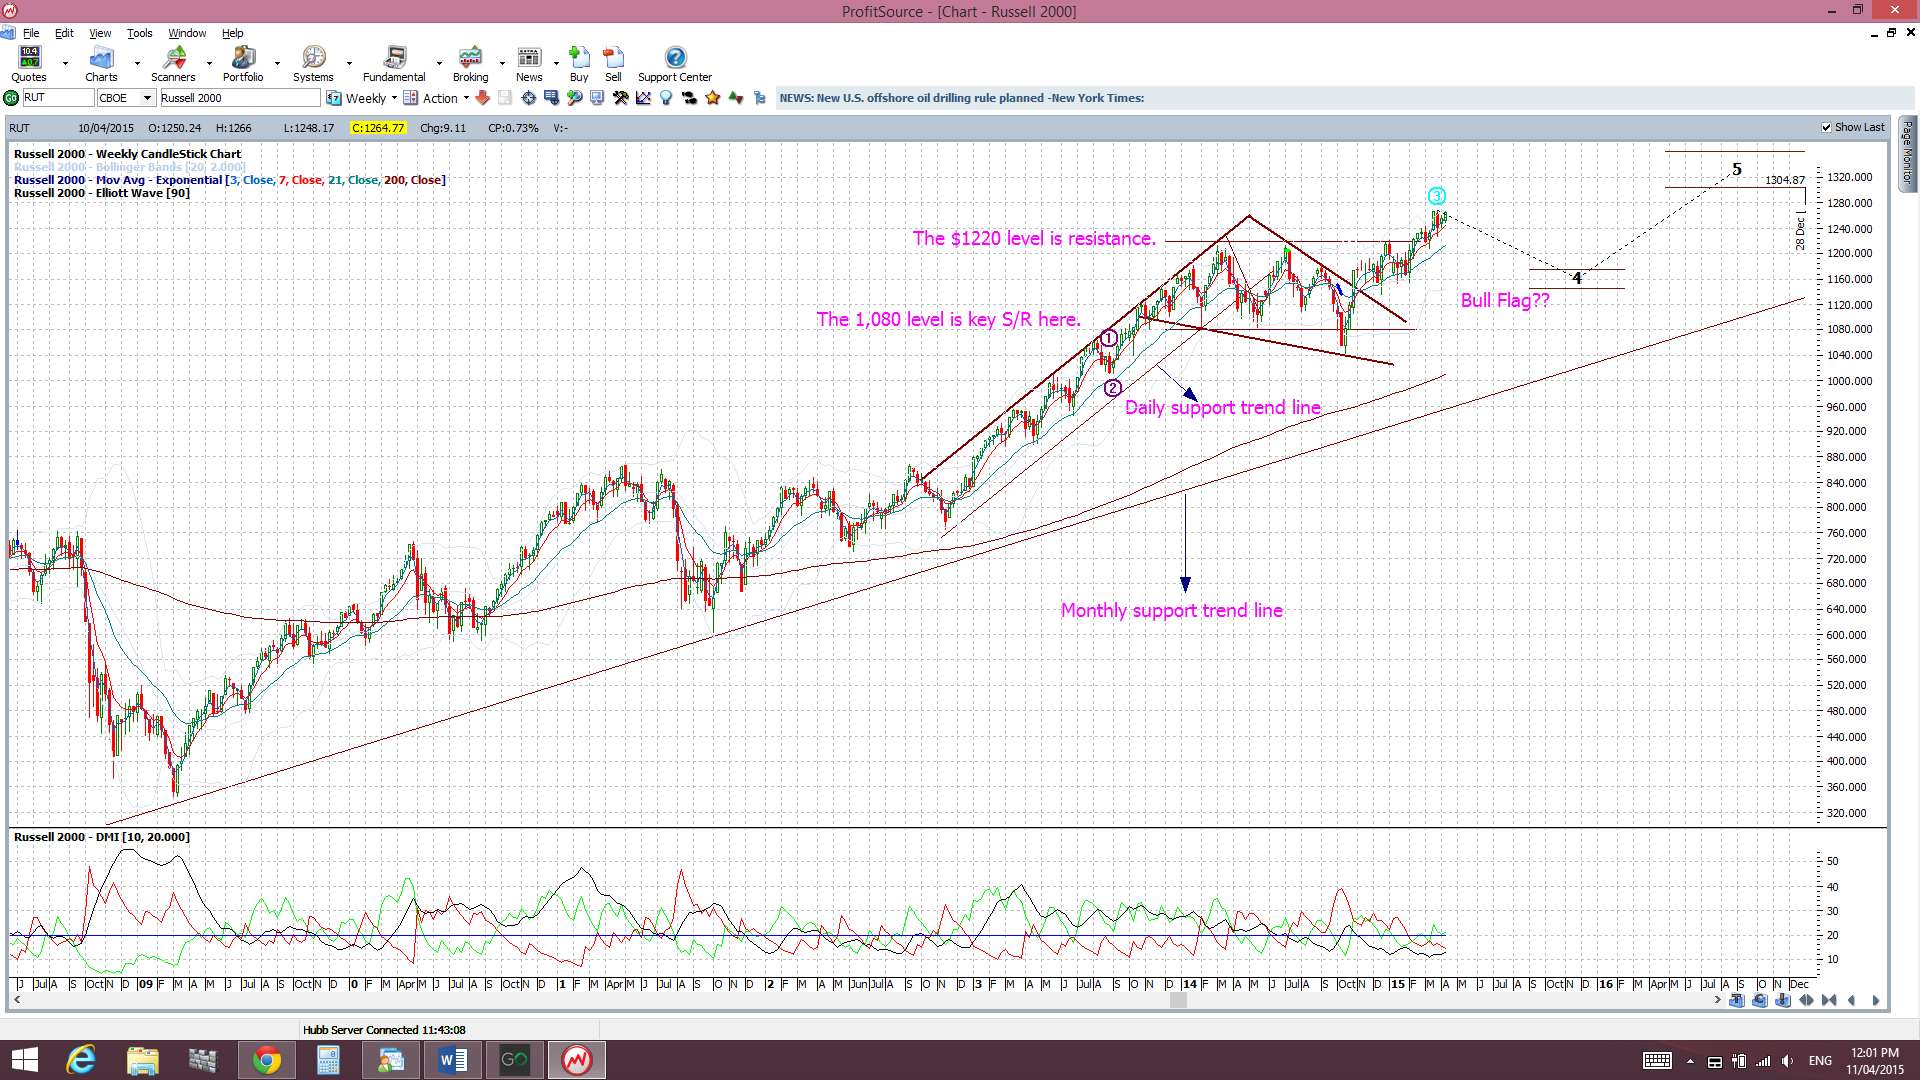
Russell 2000 Index: this small caps index is a bit of a US market ‘bellwether’ and continues on the Bull Flag breakout and to hold above the key 1,220 level.
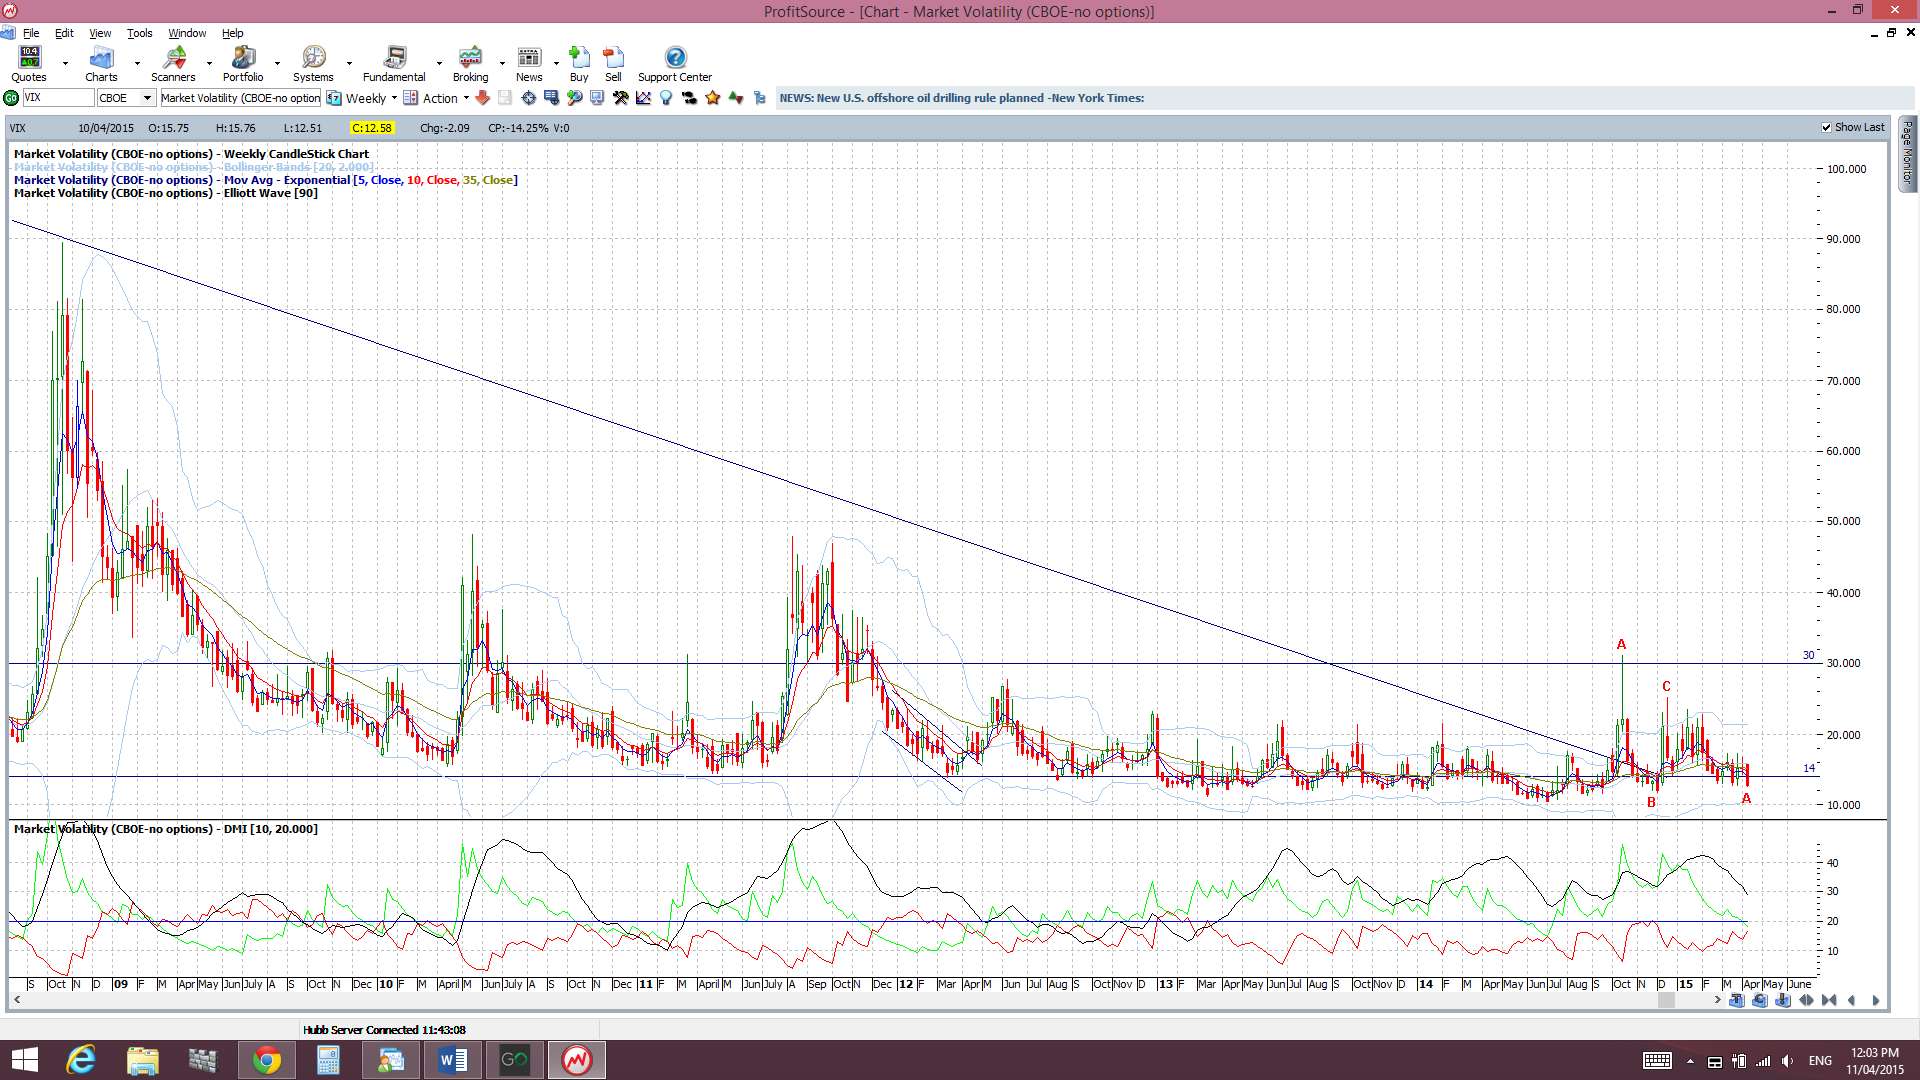
VIX Index: The ‘Fear’ index had a bearish week and is now below the 14 level!
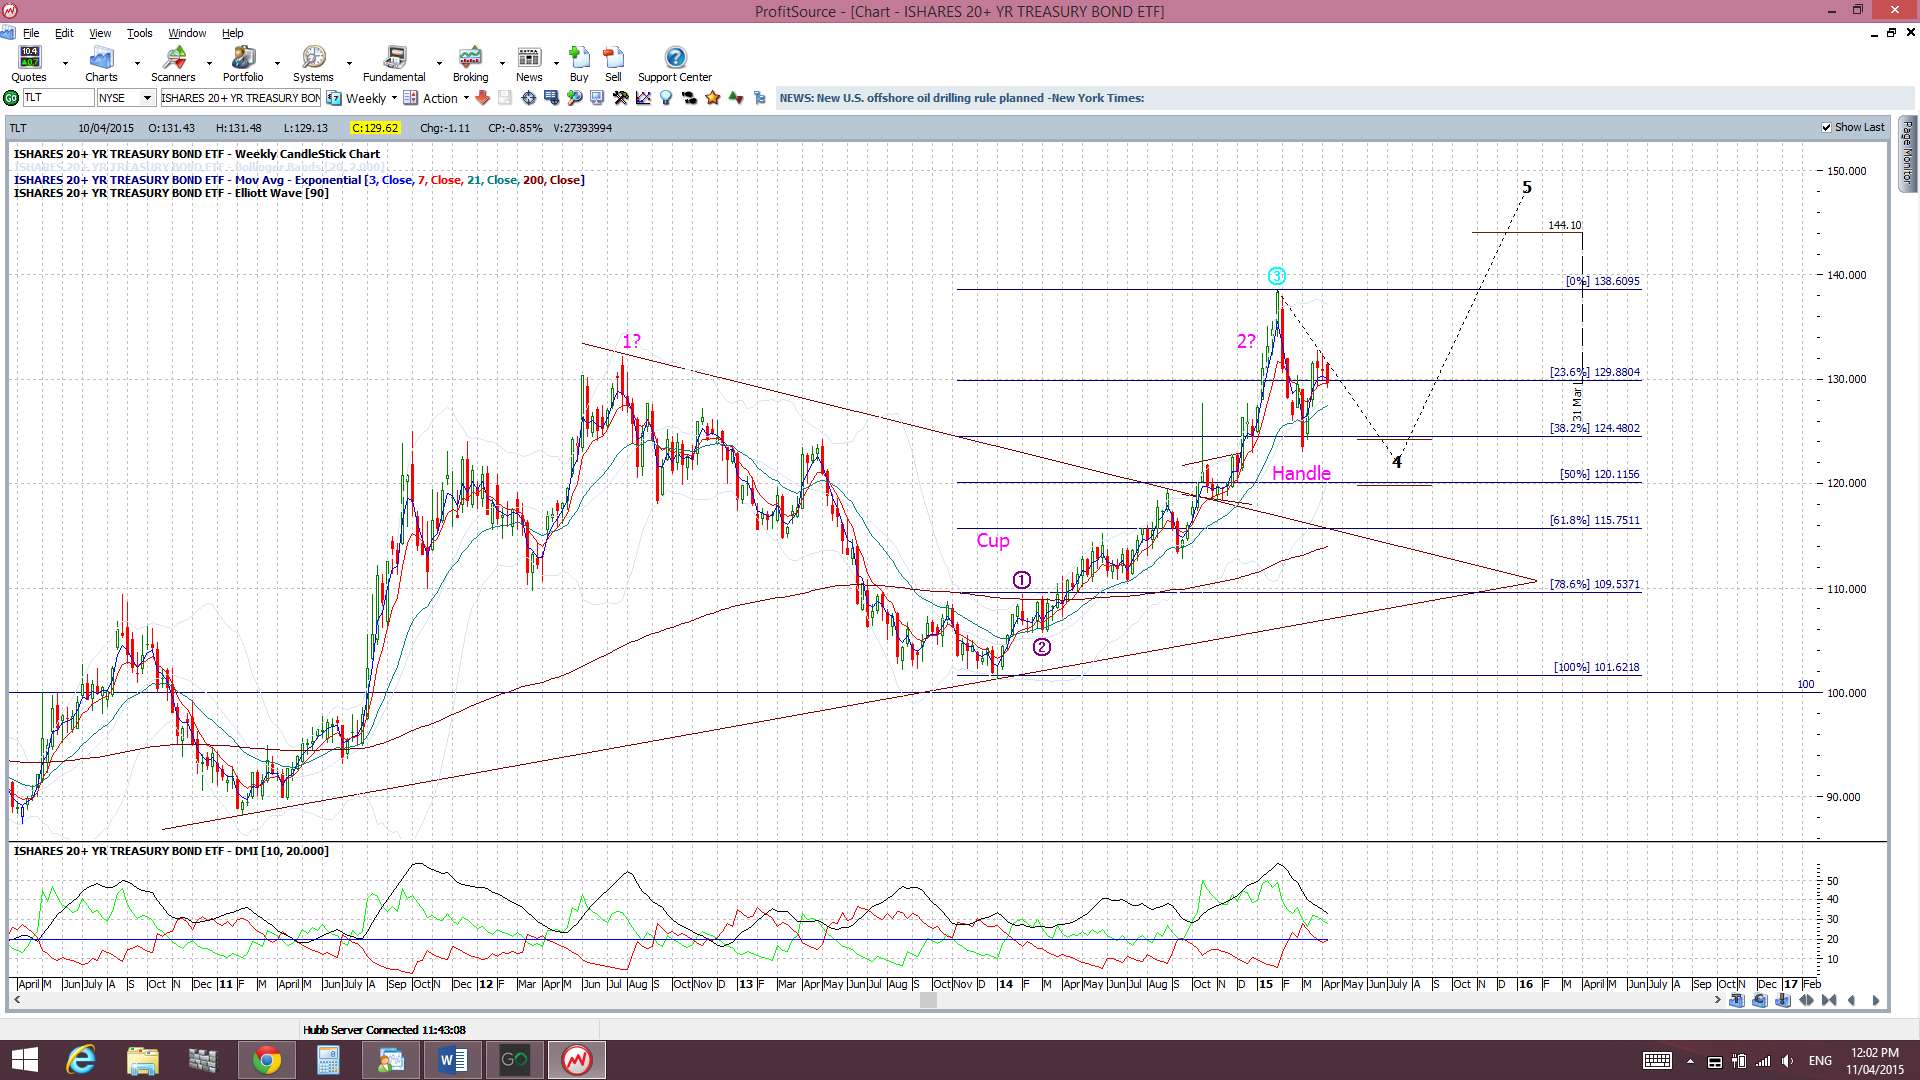
Bonds: The bond ETF has had a bearish week given US$ gains.
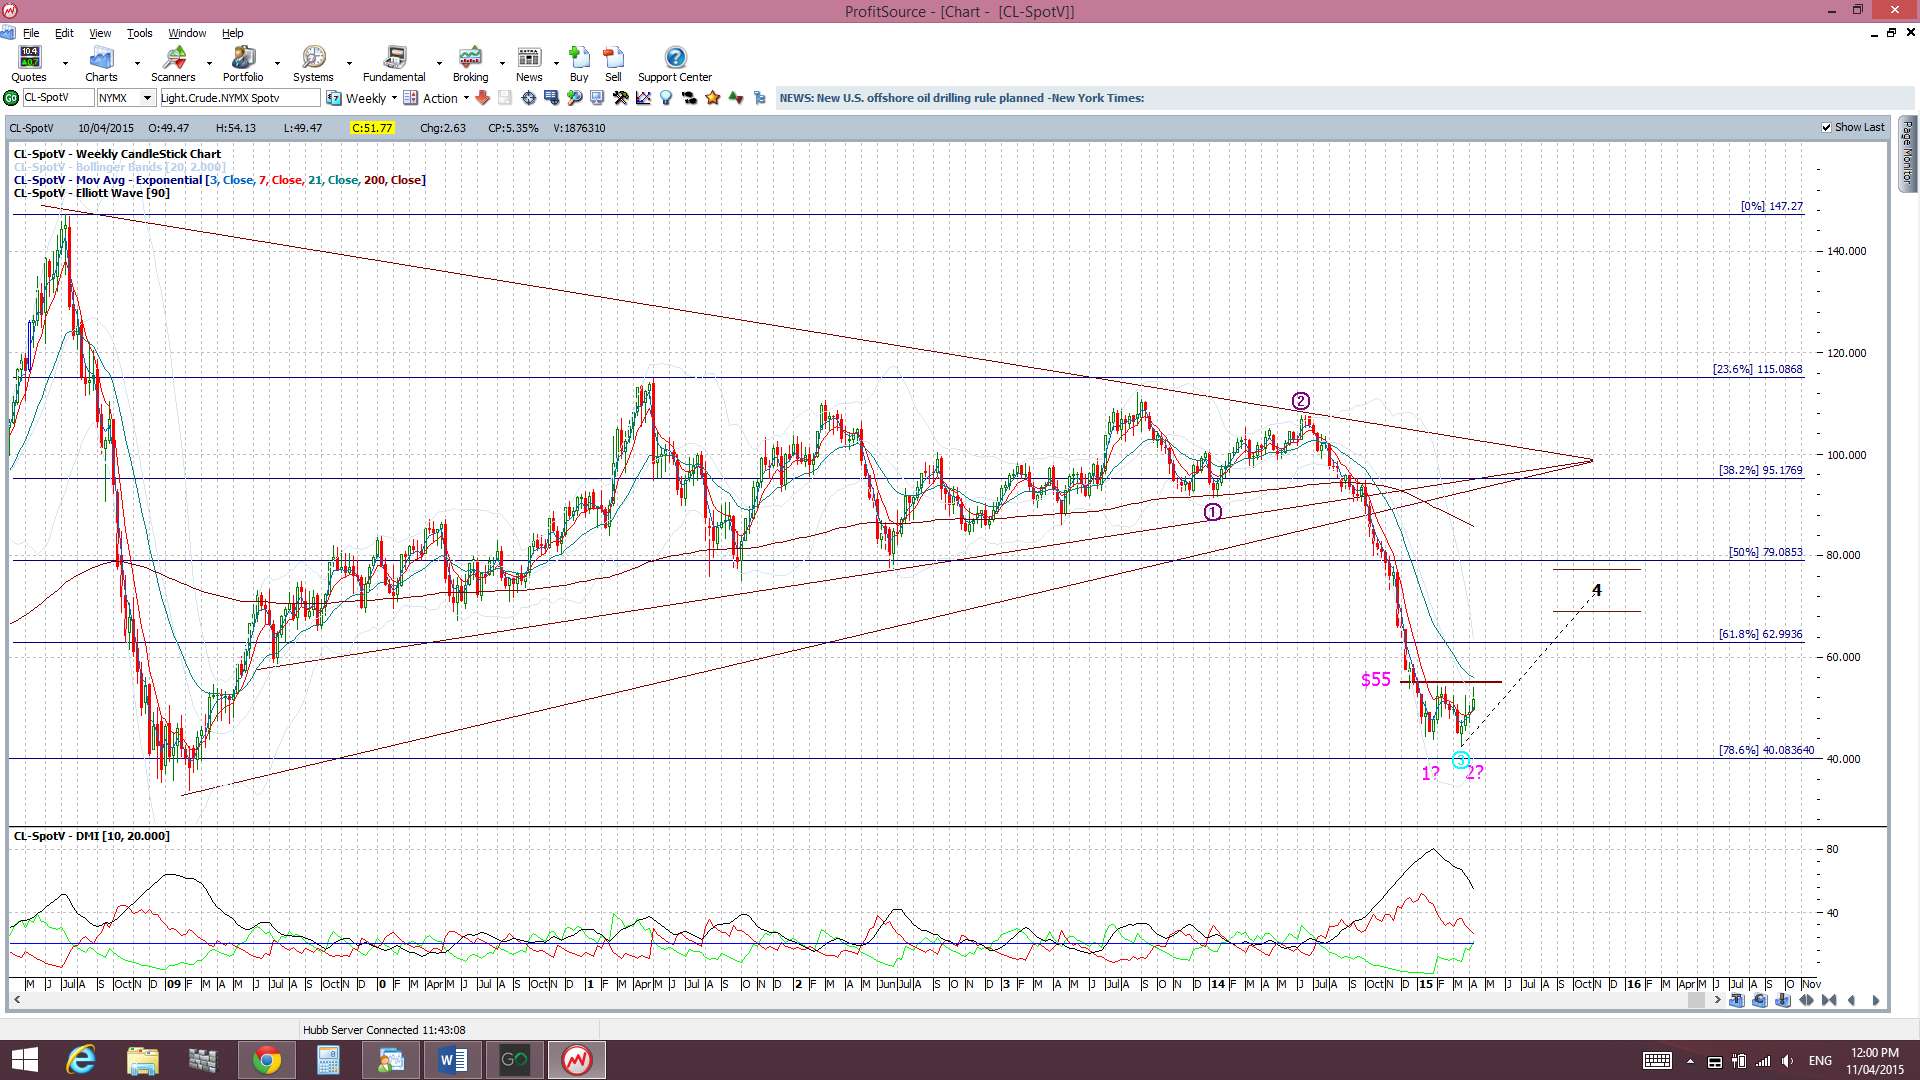
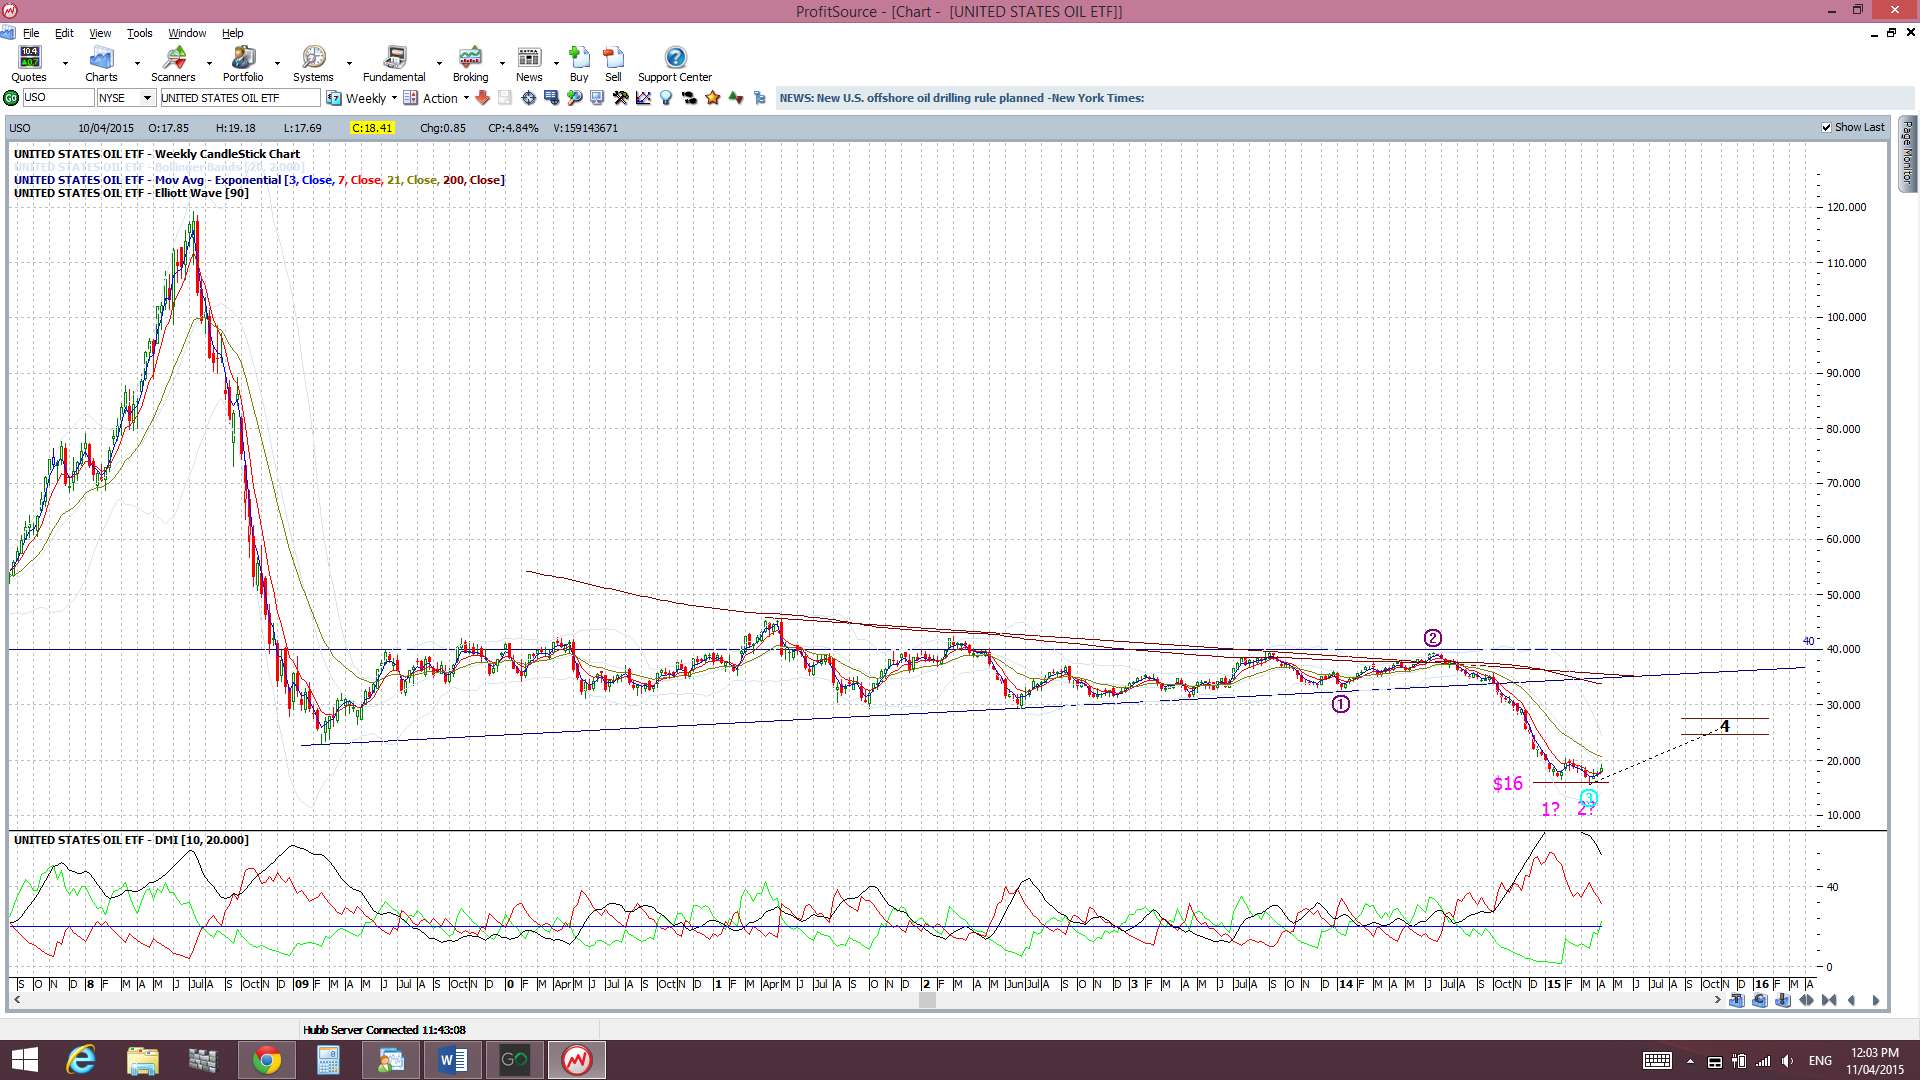
Oil: Oil is still forming up with a bullish ‘Double Bottom’ above $40 support and is trading under the $55 neck line of this pattern. A break and hold above this level would support bullish continuation. USO also looks to be holding above $16 still and forming a bullish ‘Double Bottom’ with $20 as the ‘neck line here. Watch for continued follow through with both:
IYT Transport ETF: I’ve added this other ‘bellwether’ index this week. ‘Transport’ is to the ‘markets’ like a ‘pulse’ is to the ‘human body’; one measure of health! This has been on a tear since the triangle breakout but seems to be consolidating at the moment. Watch for the next triangle breakout move here to monitor sentiment:

Trading Calendar Items to watch out for:
- Mon 13th: CNY Trade Balance.
- Tue 14th: NZD NZIER Business Confidence. GBP CPI. USD Core Retail Sales, PPI & Retail Sales.
- Wed 15th: CNY GDP & Industrial Production. EUR Min Bid Rate & Press Conference. CAD Manufacturing Sales, BoC Monetary Policy Report, Statement & Press Conference. NZD GDT Price Index.
- Thurs 16th: AUD Employment data. USD Building Permits, Unemployment Claims & Philly Fed Manufacturing Index. G20 meetings Day 1.
- Fri 17th: GBP Employment Rate & data. CAD Core CPI & Retail Sales. USD Core CPI & UoM Consumer Sentiment. G20 meetings Day 2.
- Sat 18th: Day 1 IMF meetings.
- Sun 19th: Day 2 IMF meetings.
- Mon 20th: Day 3 IMF meetings.
Forex: The US$ is heading back up to test the 100 level. Any consolidation-style price action under that resistance will have me looking towards cross pairs not currently discussed in this post. I will update though, if an when the need arises.
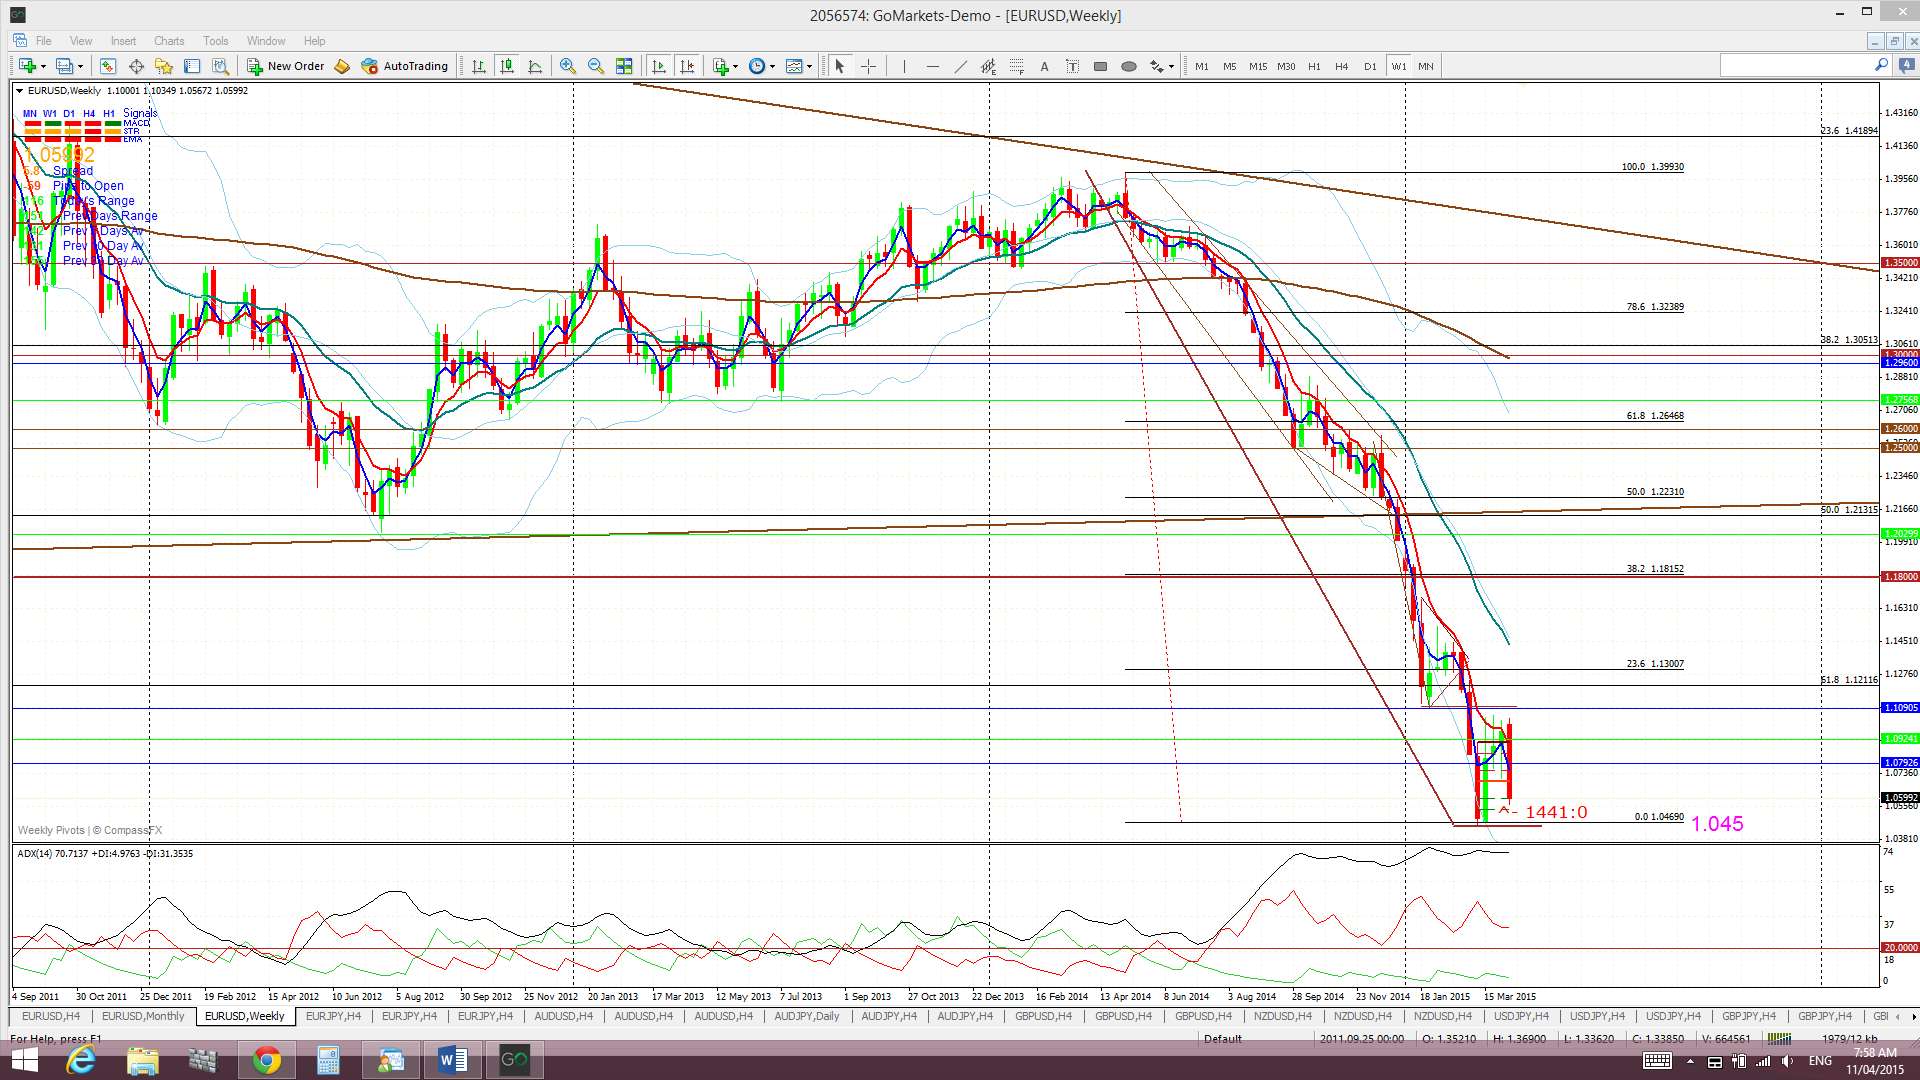
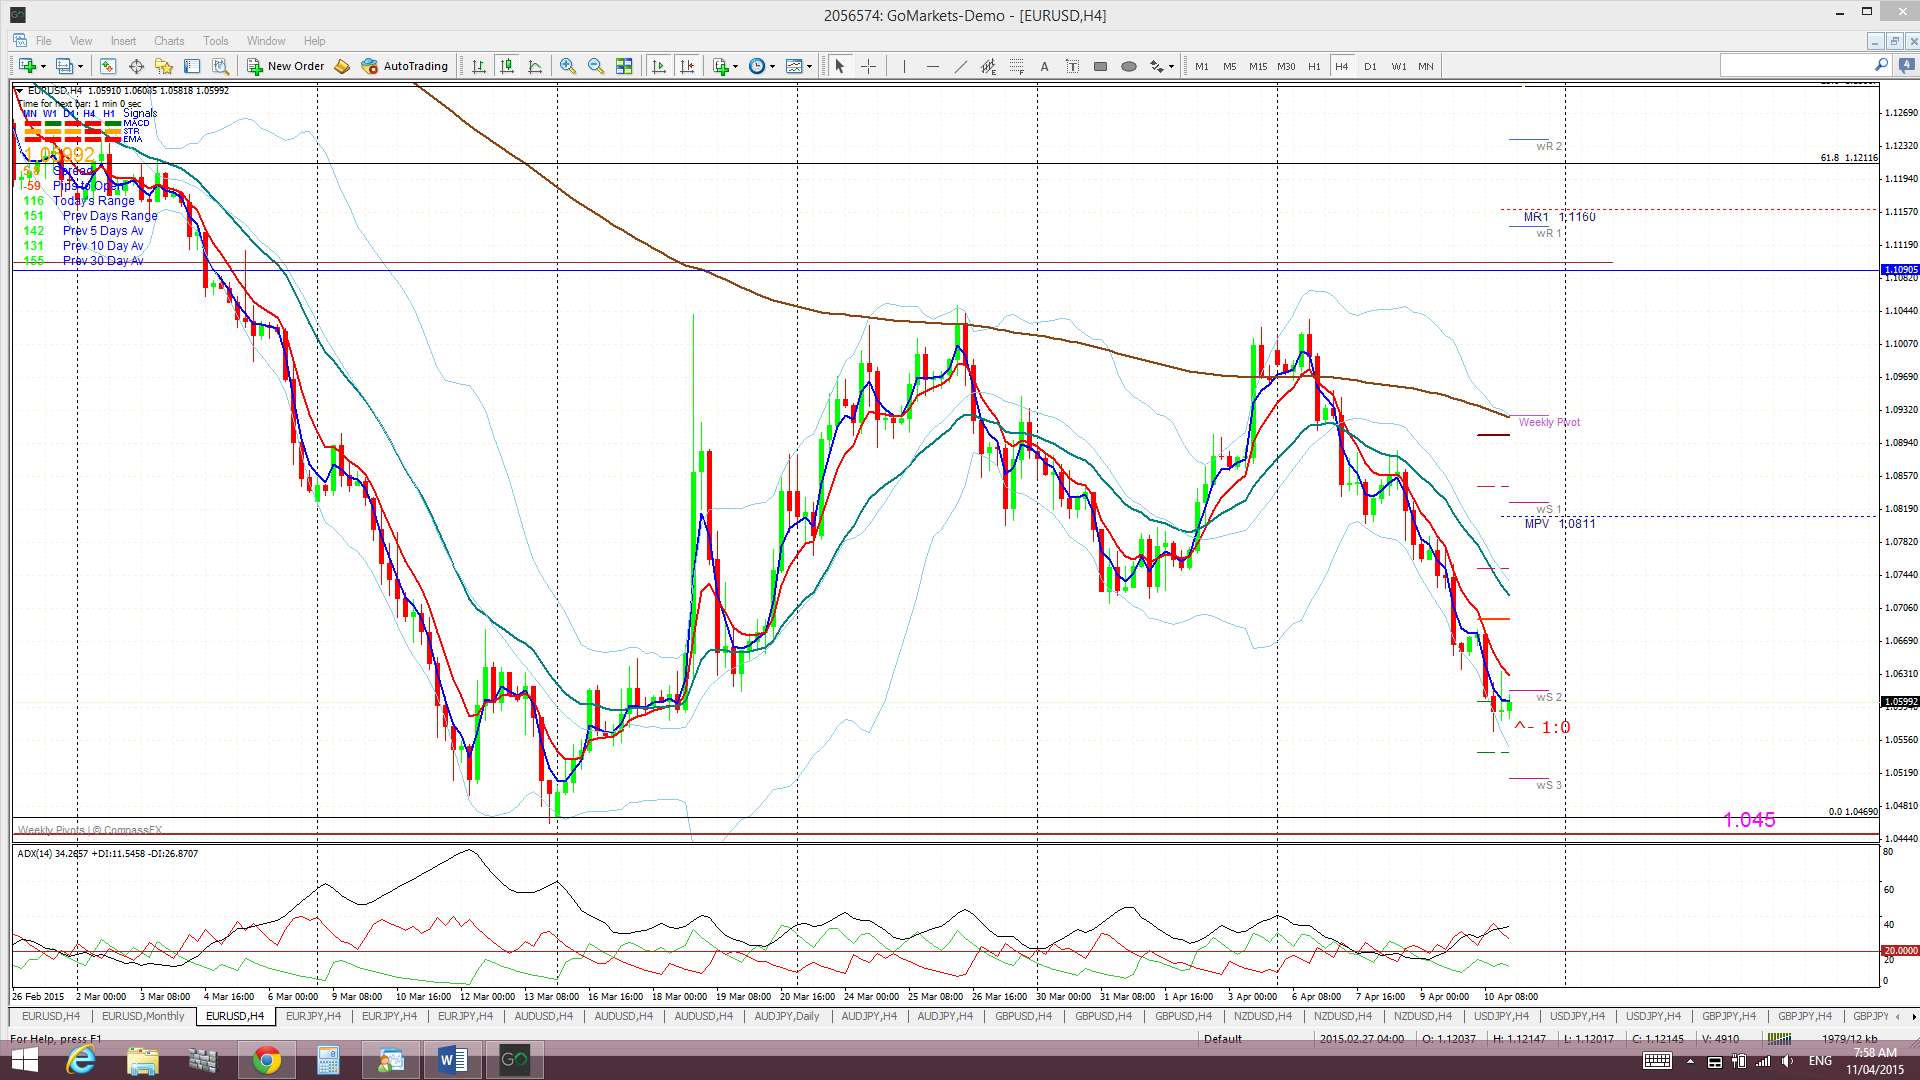
E/U: The E/U traded lower last week despite Greece making good on their IMF debt payment. This pair remains victim of US$ movement and US$ strength was the theme for the week.
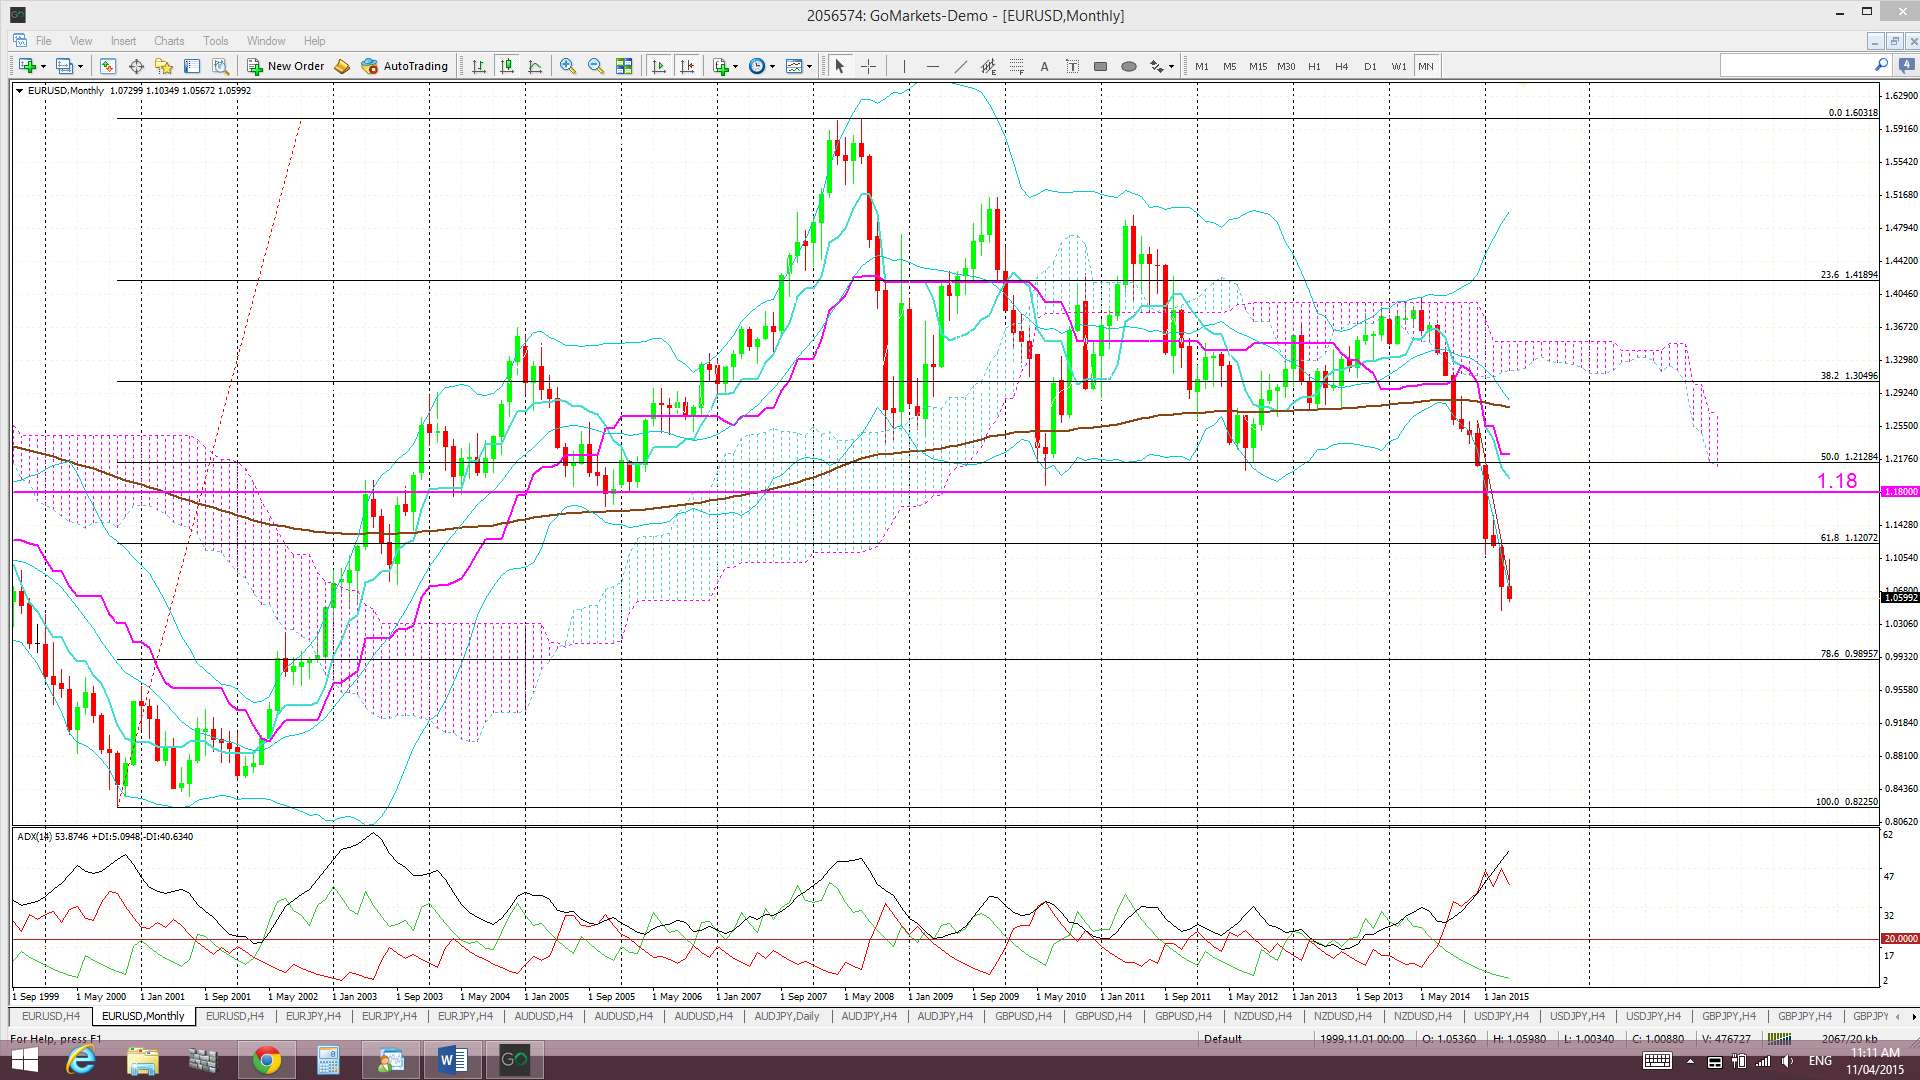
Price is heading down towards a recent low near 1.045. This will be the level to watch in any bearish continuation move. When you look at the monthly chart it seems that reaching parity, down near the 78.6% fib, is just a matter of time:
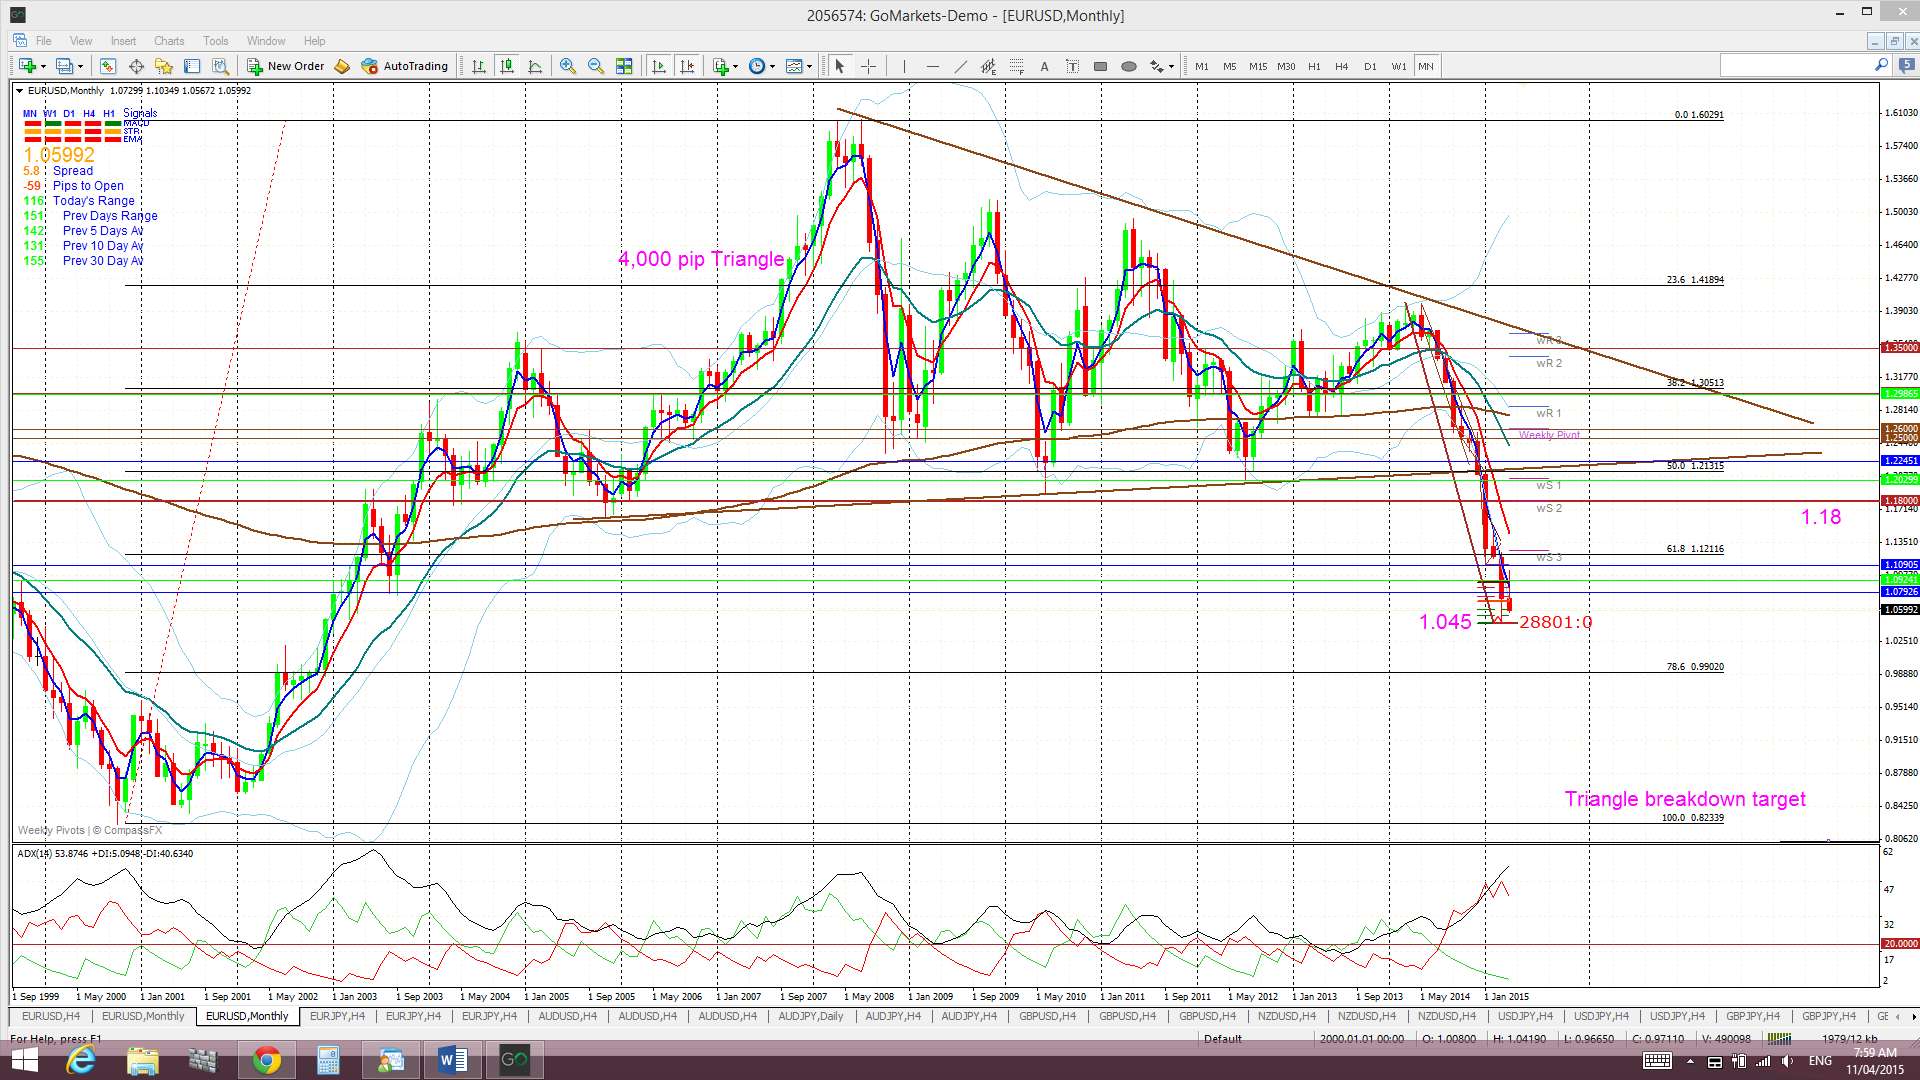
There is now really just one major bearish pattern in play on the E/U: a 4,000 pip bearish descending triangle breakdown on the monthly chart. Continued choppy action above 104.5 could help to from up another Bear Flag on the weekly chart though!
Descending triangle on the monthly chart: the descending triangle pattern is a bearish continuation pattern and has a base at around the 1.18 level. The height of this triangle is about 4,000 pips. Technical theory would suggest that any bearish breakdown of this triangle below 1.18 might see a similar move. It is worth noting that this would bring the E/U down near 0.80 and to levels not seen since 2000/2001! The monthly chart shows how critical this 1.18 level is for the E/U.
Price is back trading below the Ichimoku Cloud on the 4hr, daily, weekly and monthly charts which is bearish.
The weekly candle closed as a bearish engulfing candle.
Risk events for this pair include the ECB Interest rate decision, G20 and IMF meetings (Greece related) and any events/US$ data triggering US$ strength.
- I’m watching for any new TC signal and the 1.045 level.

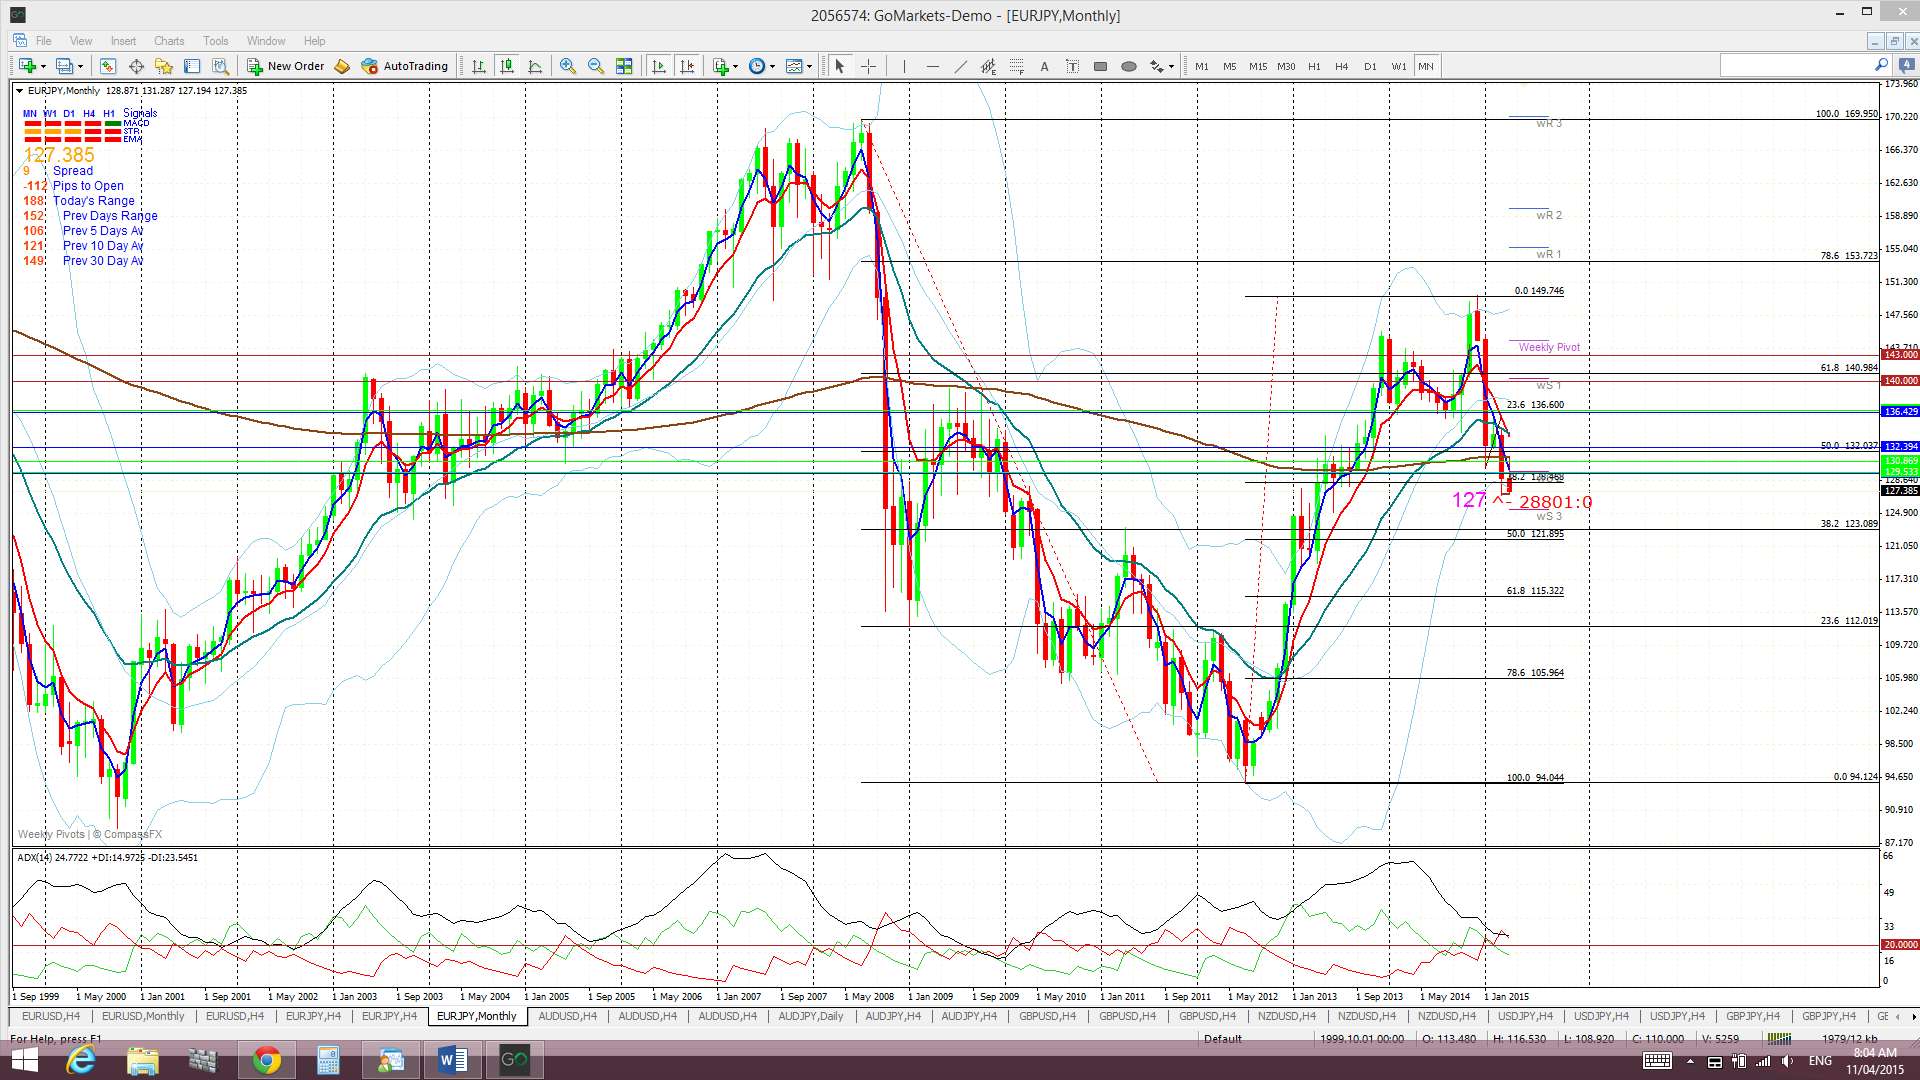
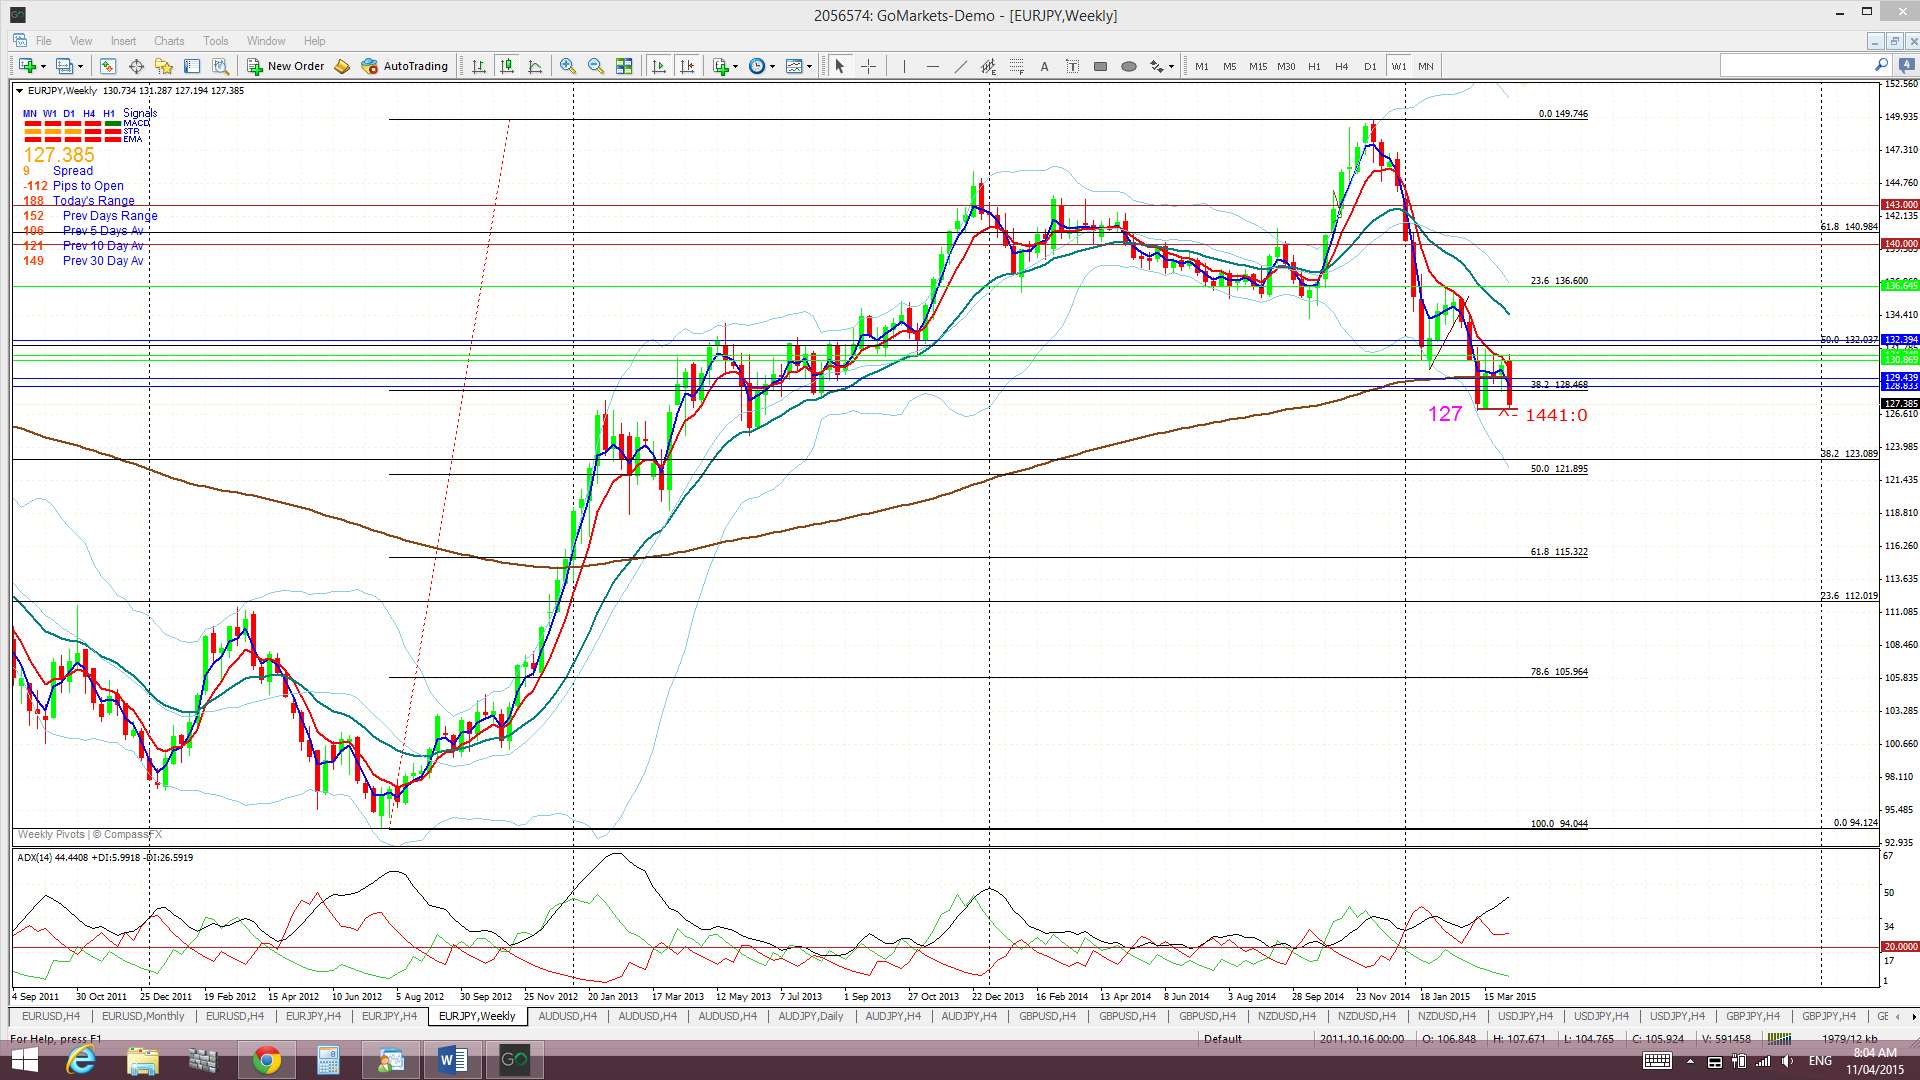
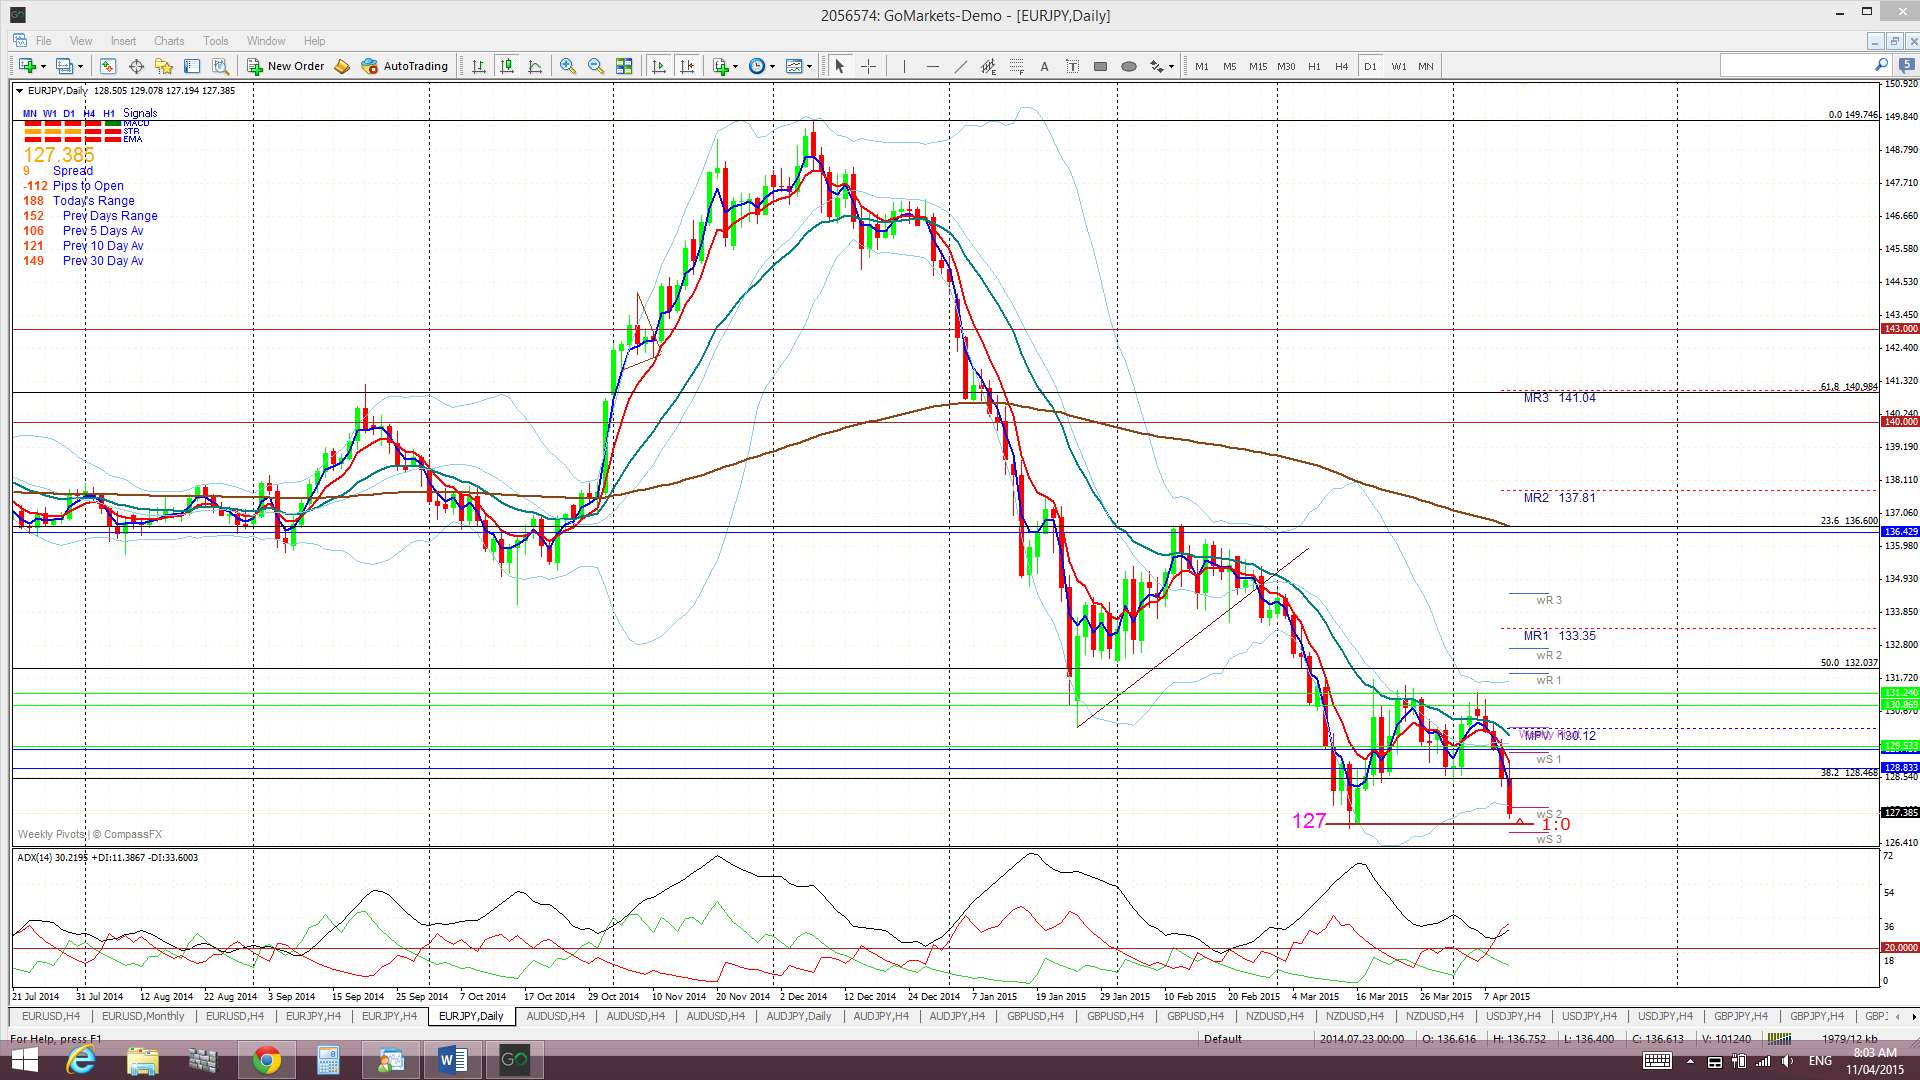
E/J: The E/J traded lower last week as well and, like the E/U, is drifting towards a recent ‘Double Bottom’ region at 127. This will be the level to watch next week.
Price is trading below the Cloud on the 4hr, daily and weekly charts but above on the monthly chart.
The weekly candle closed as a bearish engulfing candle.
Risk events for this pair include the ECB Interest rate decision, G20 and IMF meetings (Greece related) and any data/events impacting US$ strength.
- I’m watching for any new TC signal on this pair and the 127 level.

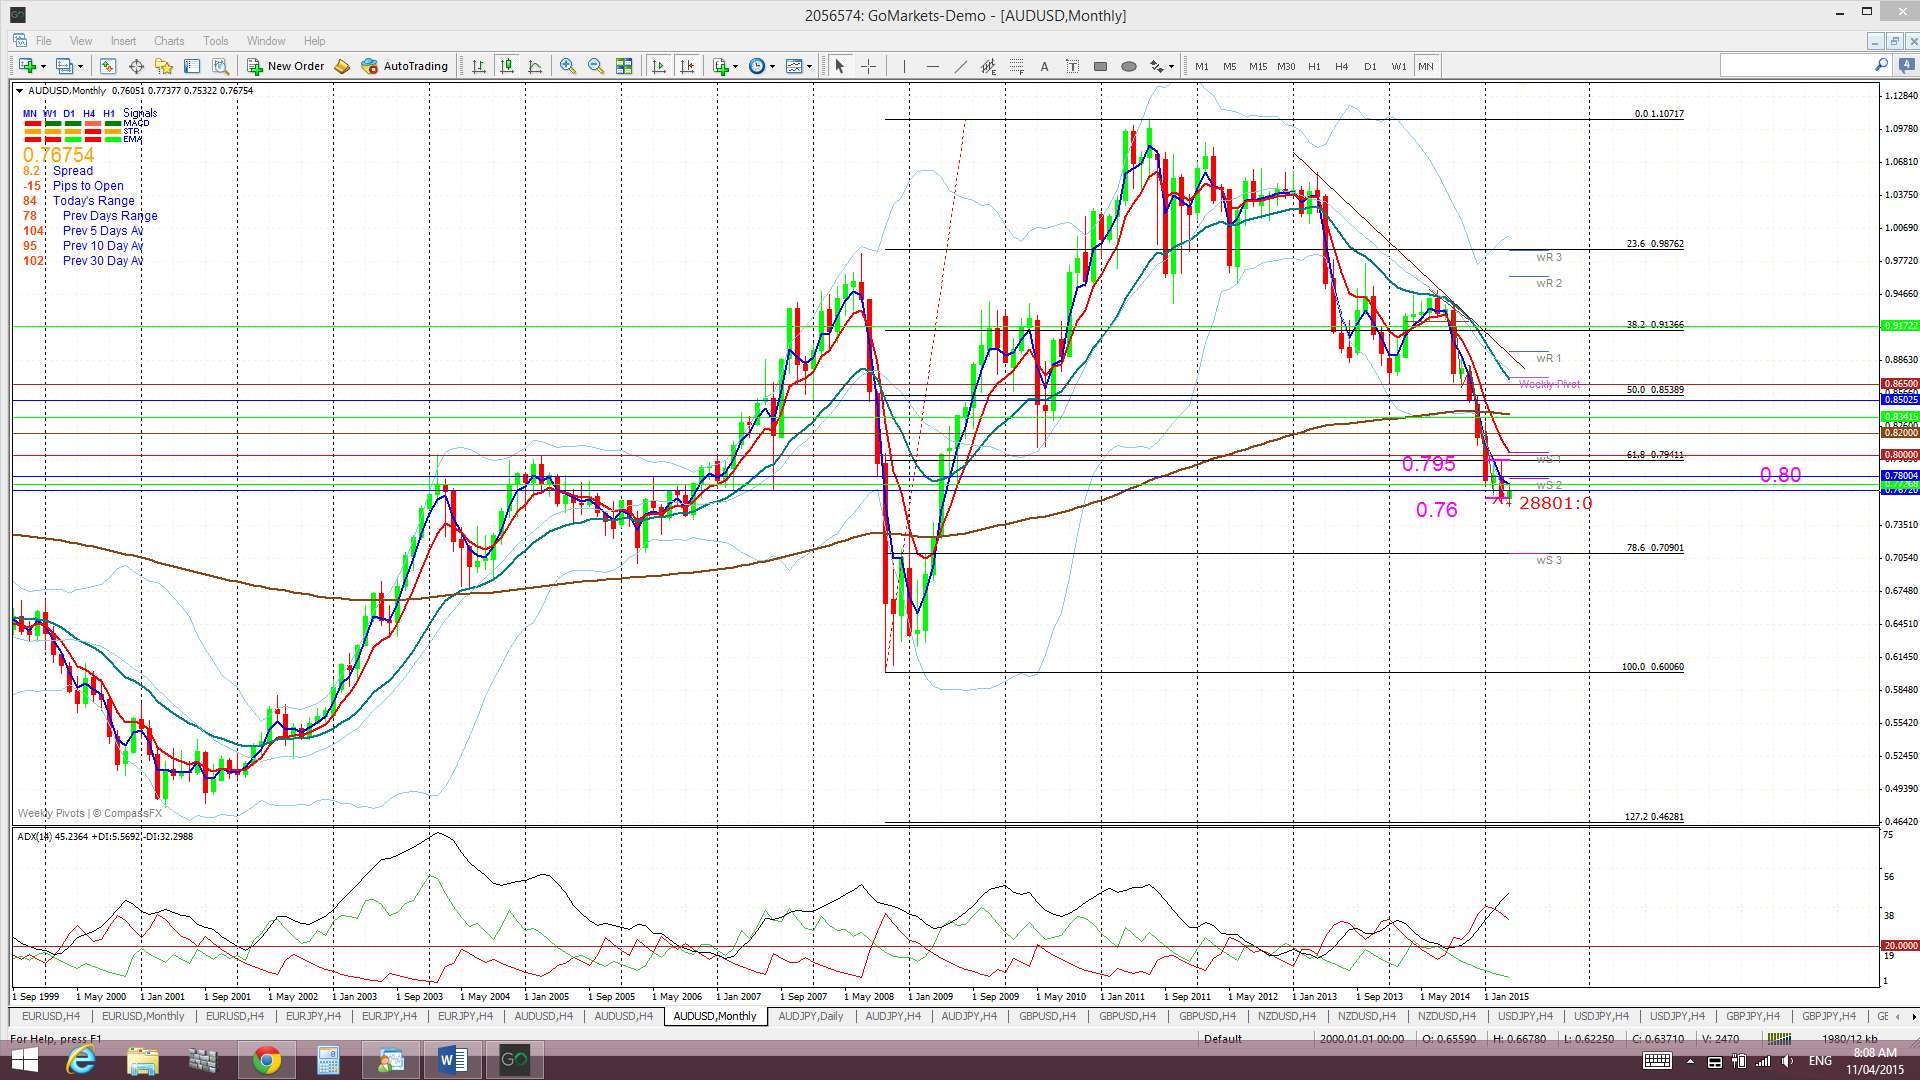
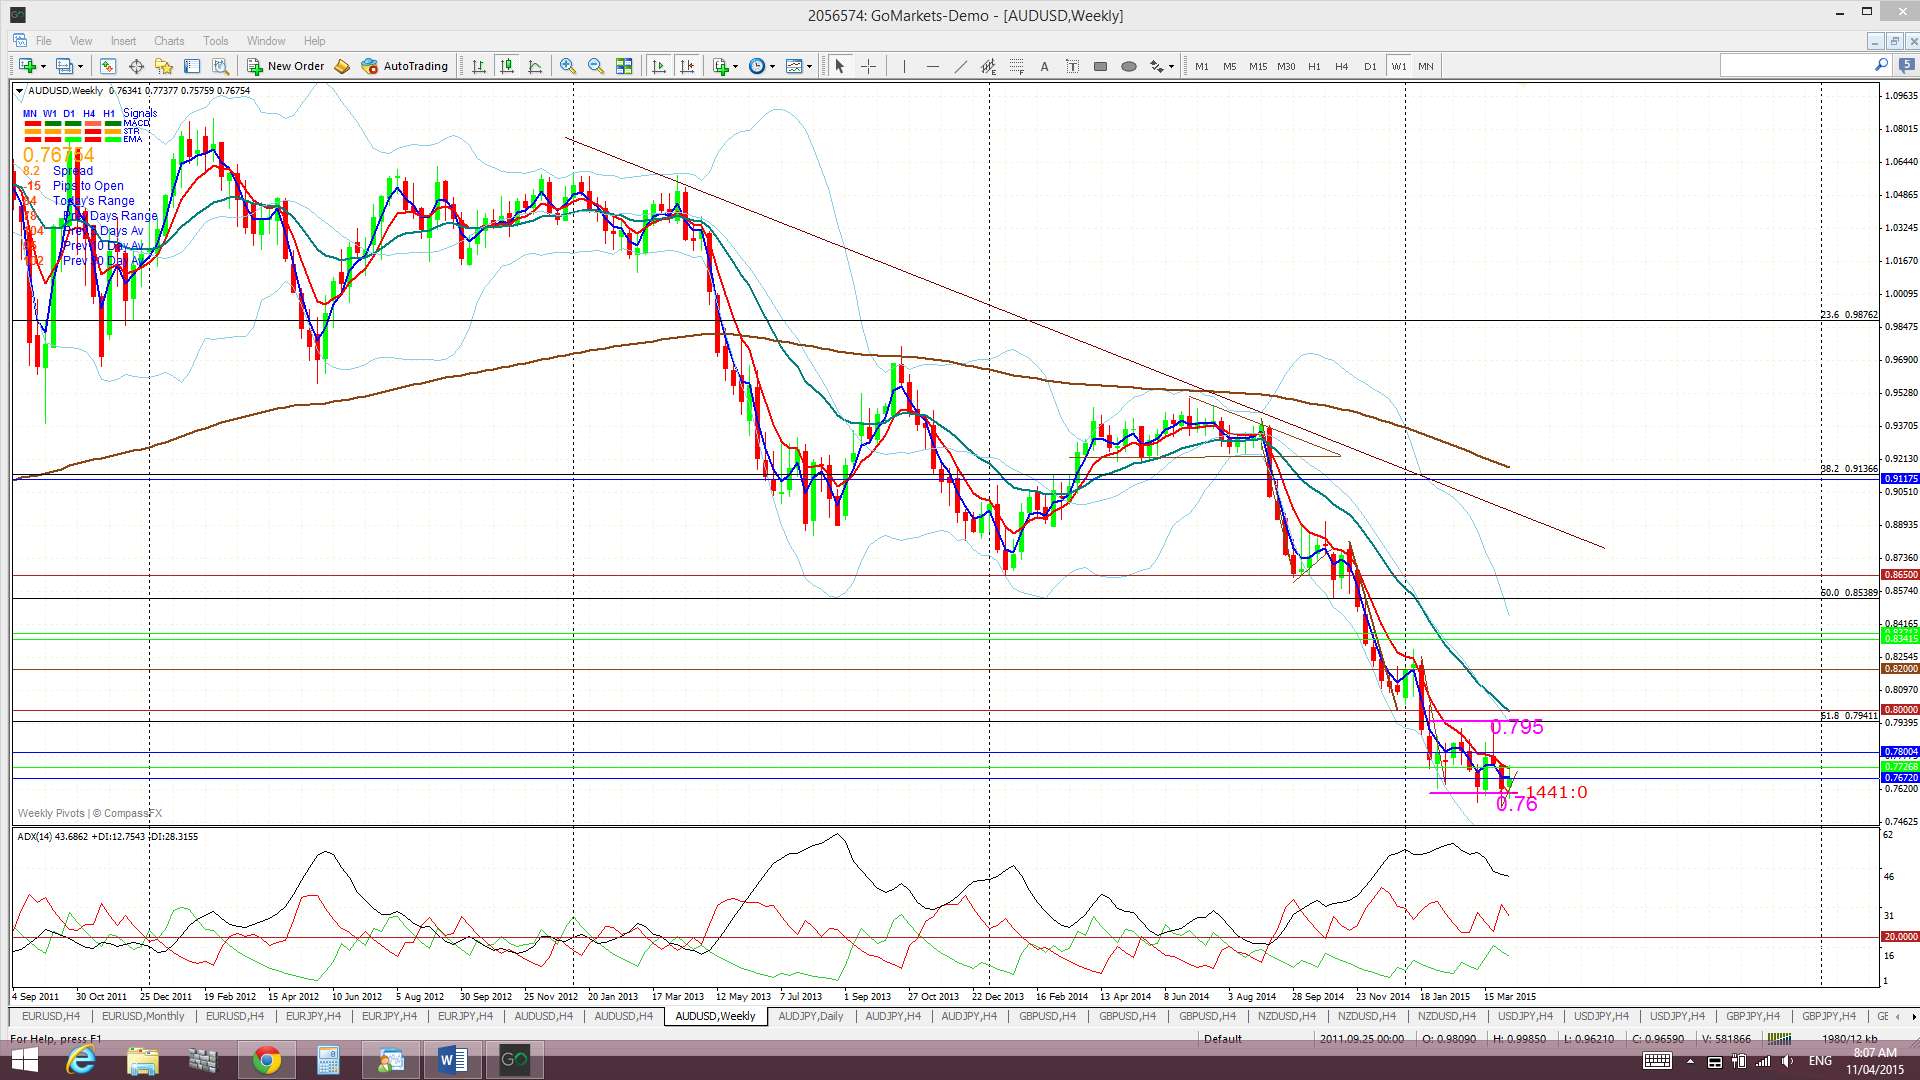
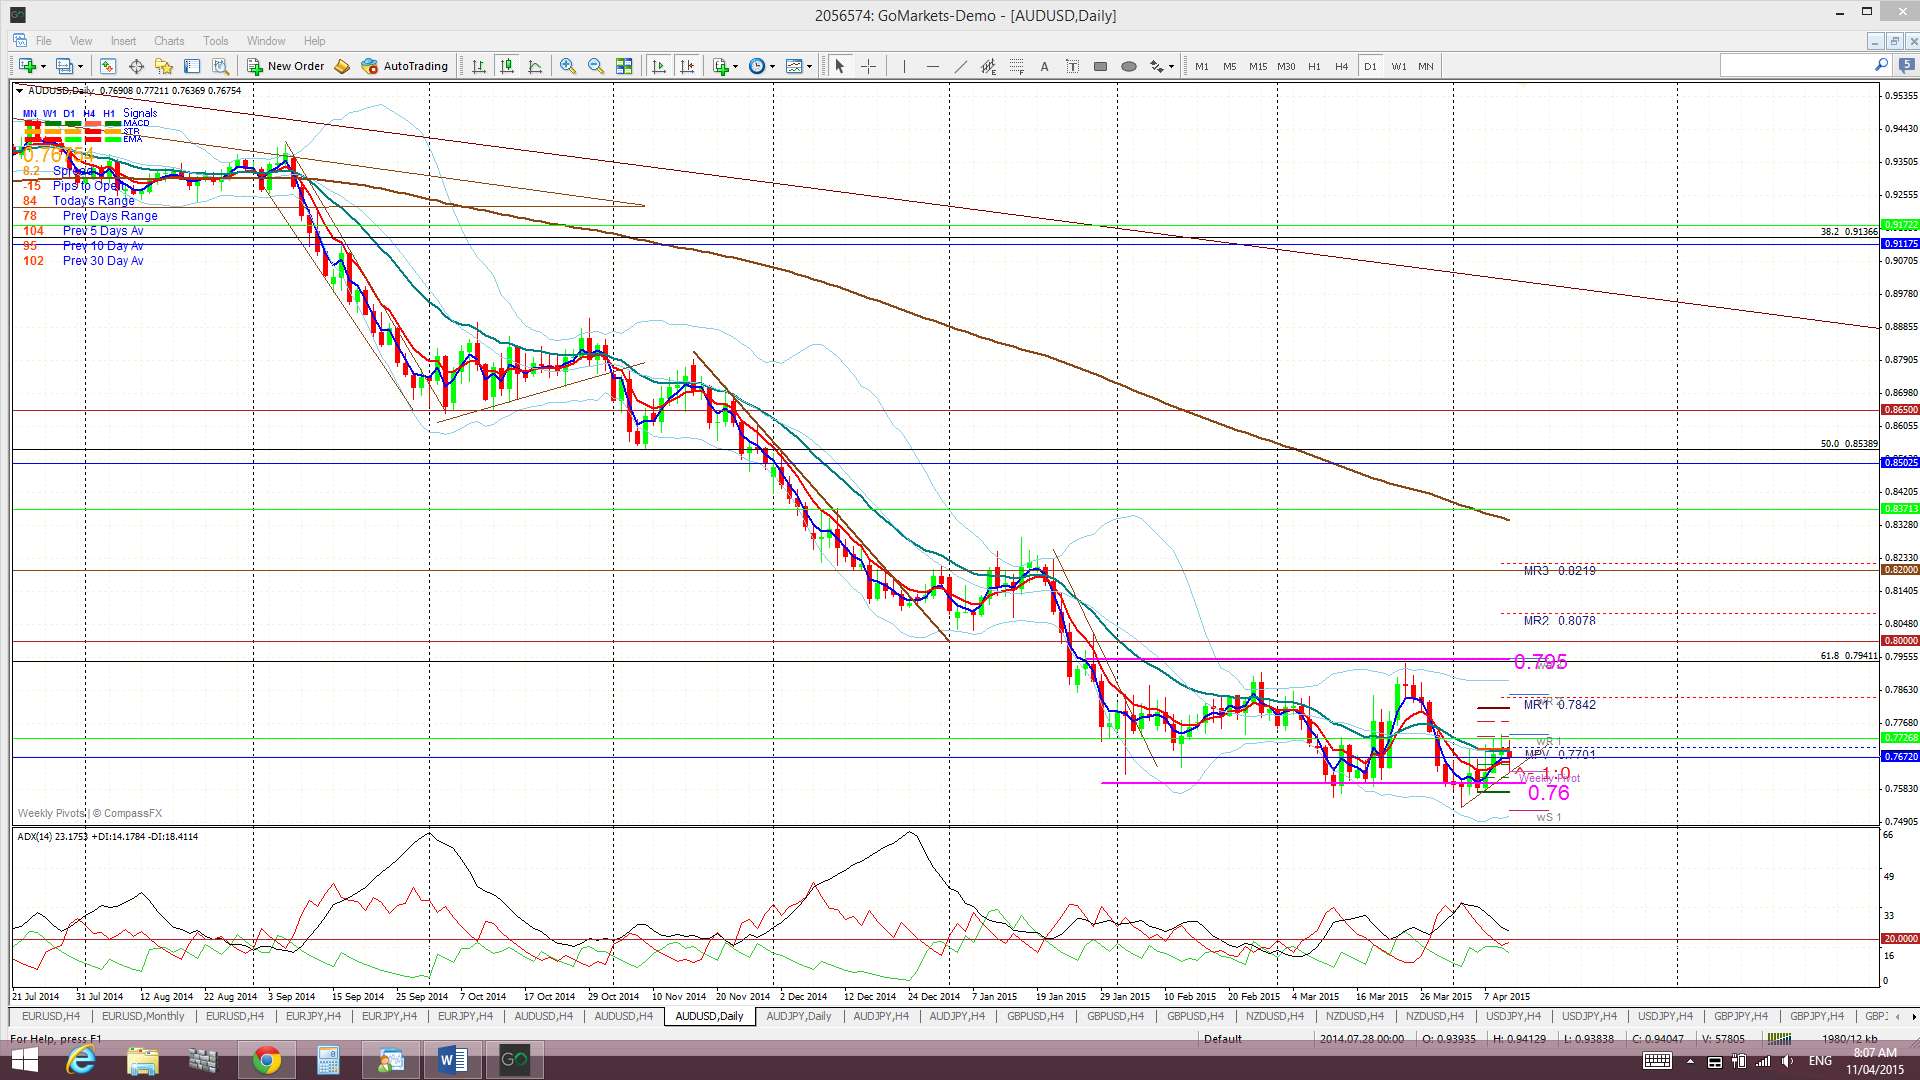
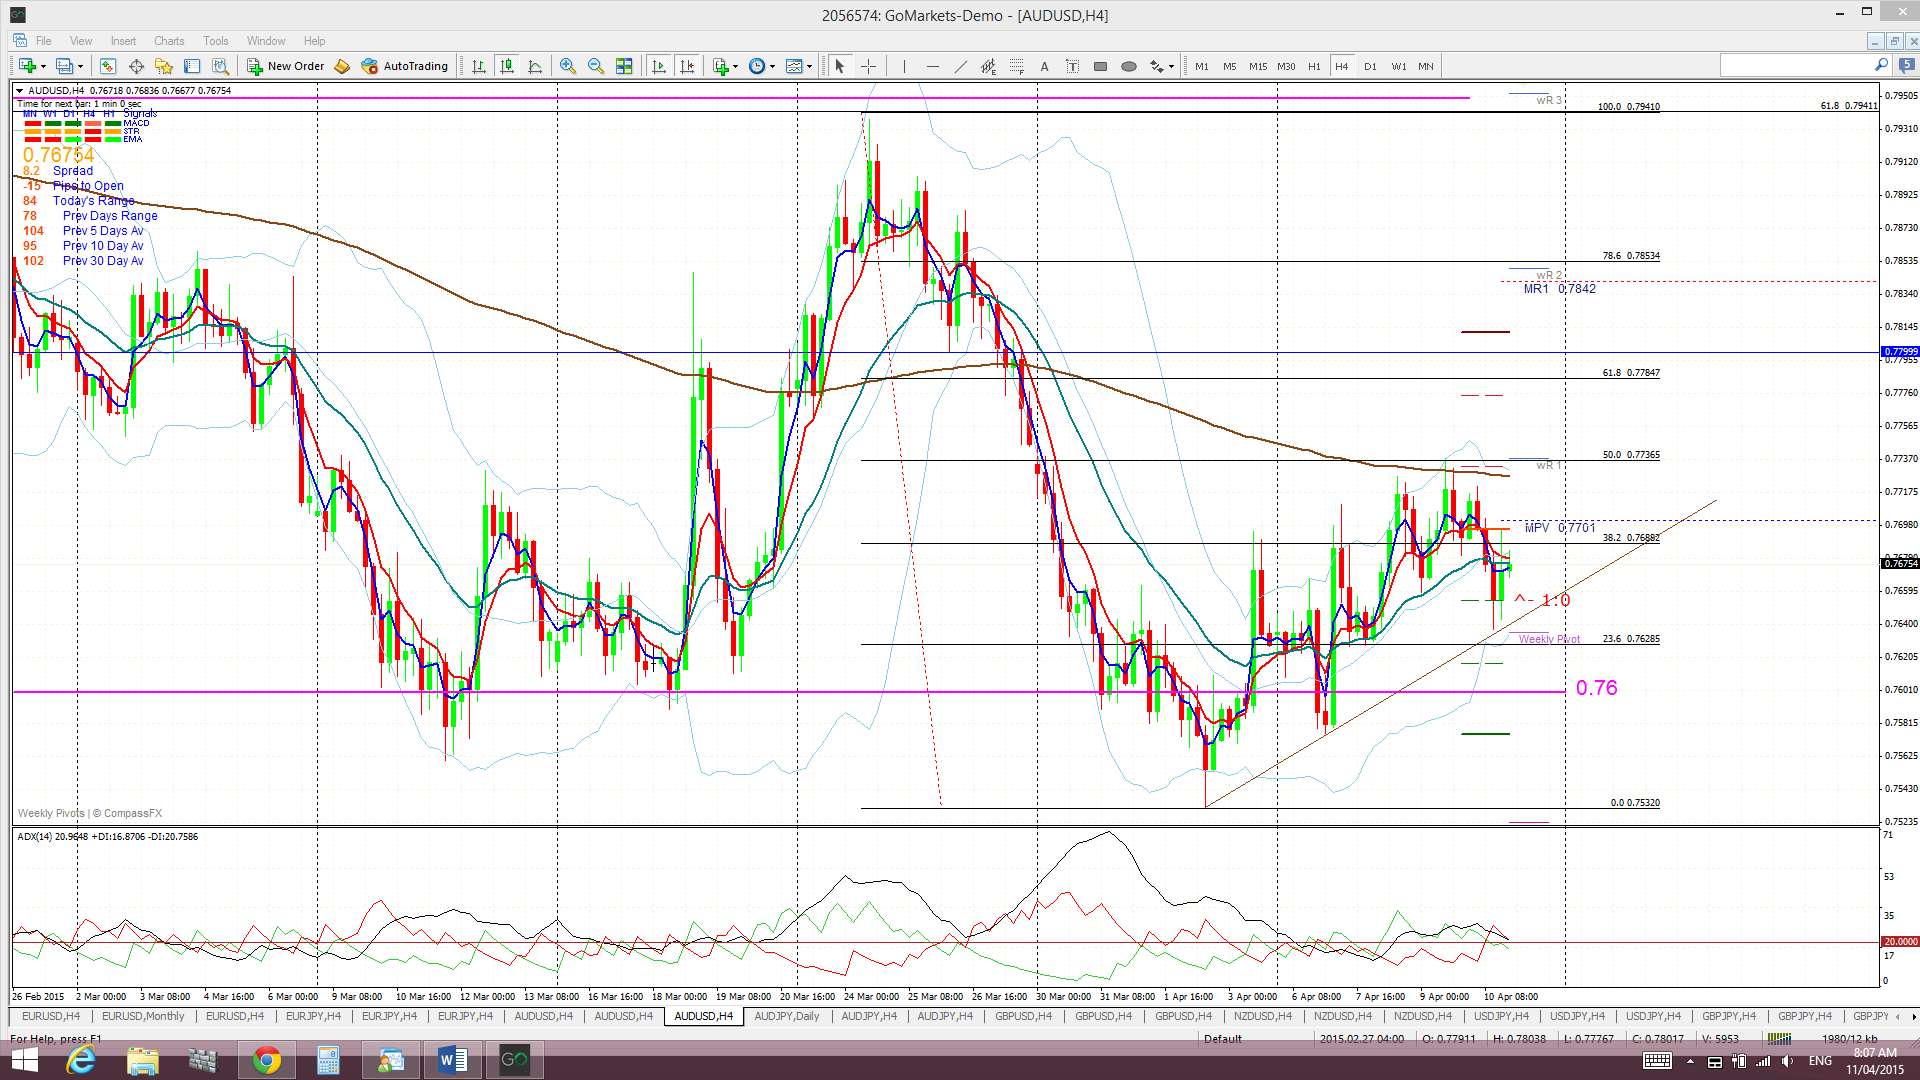
A/U: The A/U chopped higher last week and remains channel bound between 0.76 and 0.795. The RBA’s decision on Tuesday to hold steady with interest rates saw the A/U rally back above 0.76 support.
Price is trading in the Cloud on the 4hr chart but below the Cloud on the daily, weekly and monthly charts.
The weekly candle closed as a small bullish coloured ‘Inside’ candle reflecting the indecision here.
Risk events for this pair next week include the batch of Chinese data, AUD Employment data and any data/events impacting US$ strength.
- I’m watching for any new TC signal on this pair and 0.765 support.
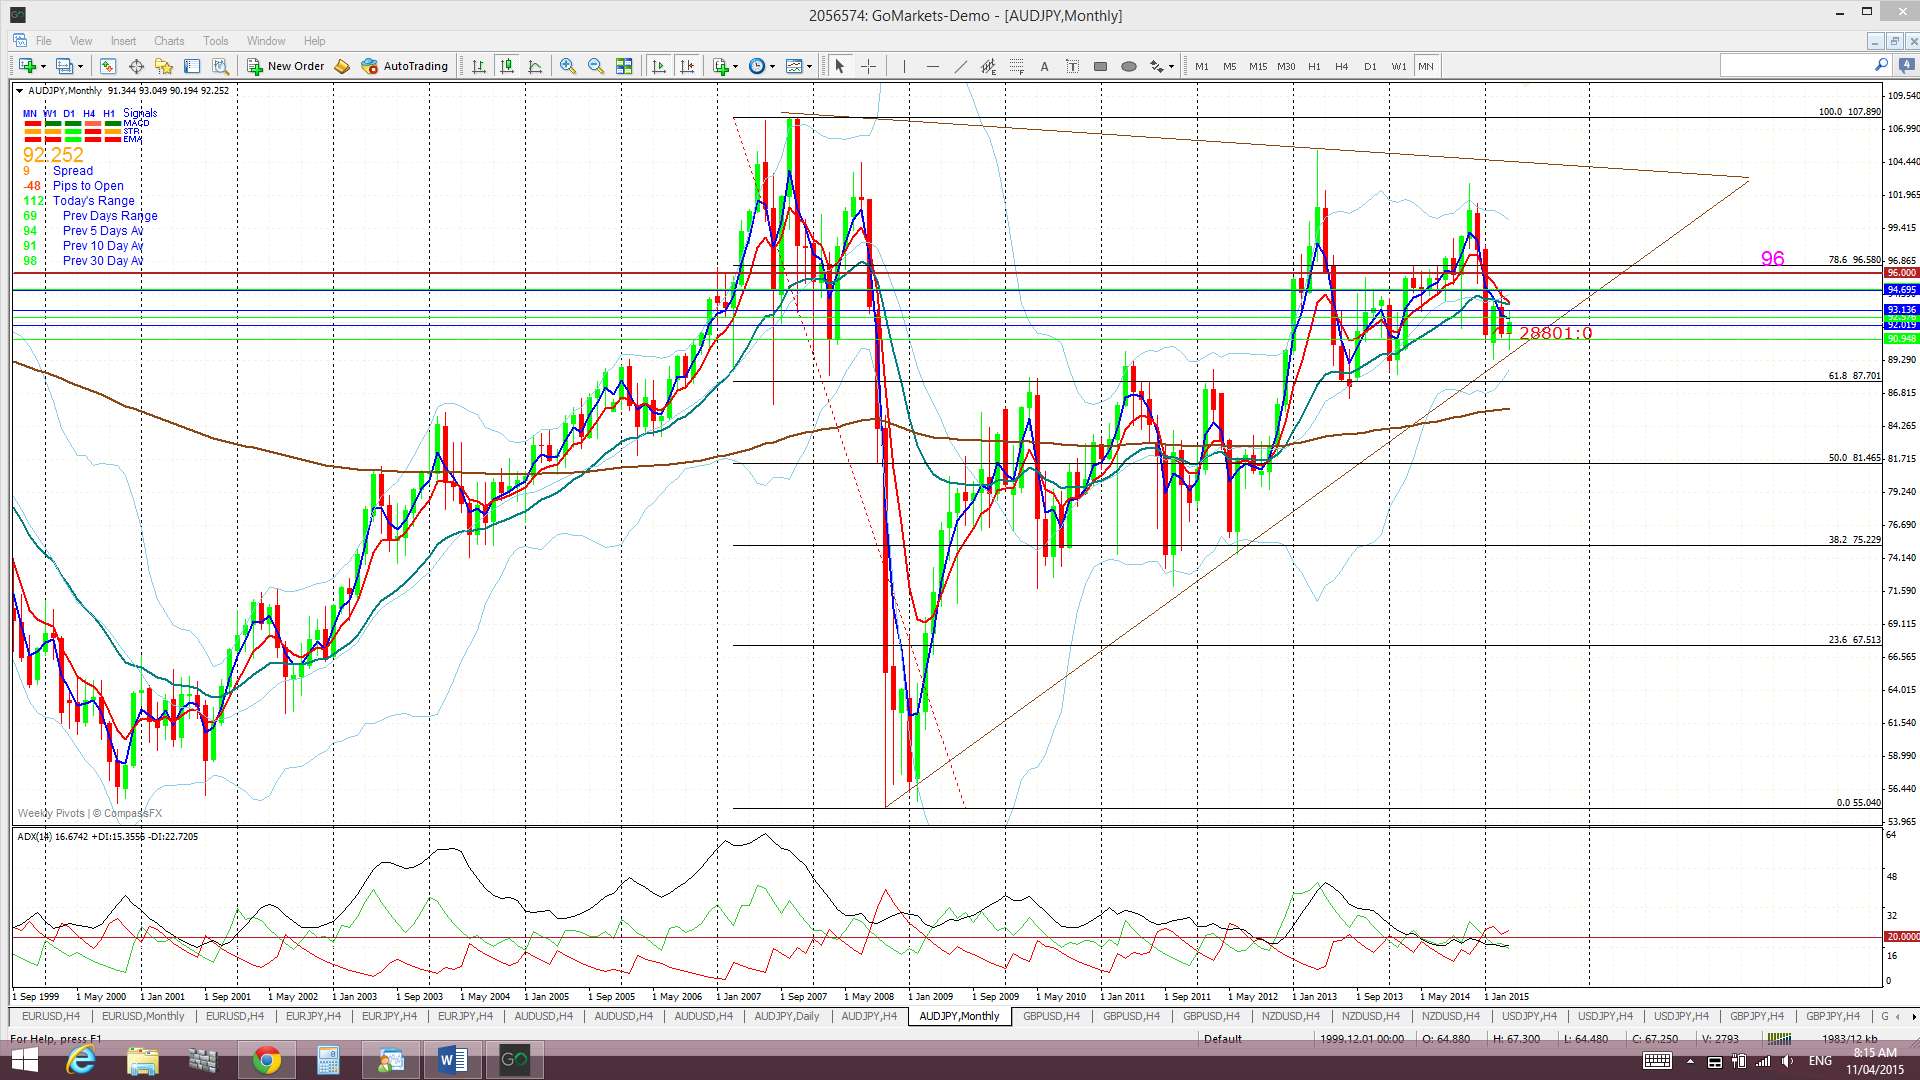
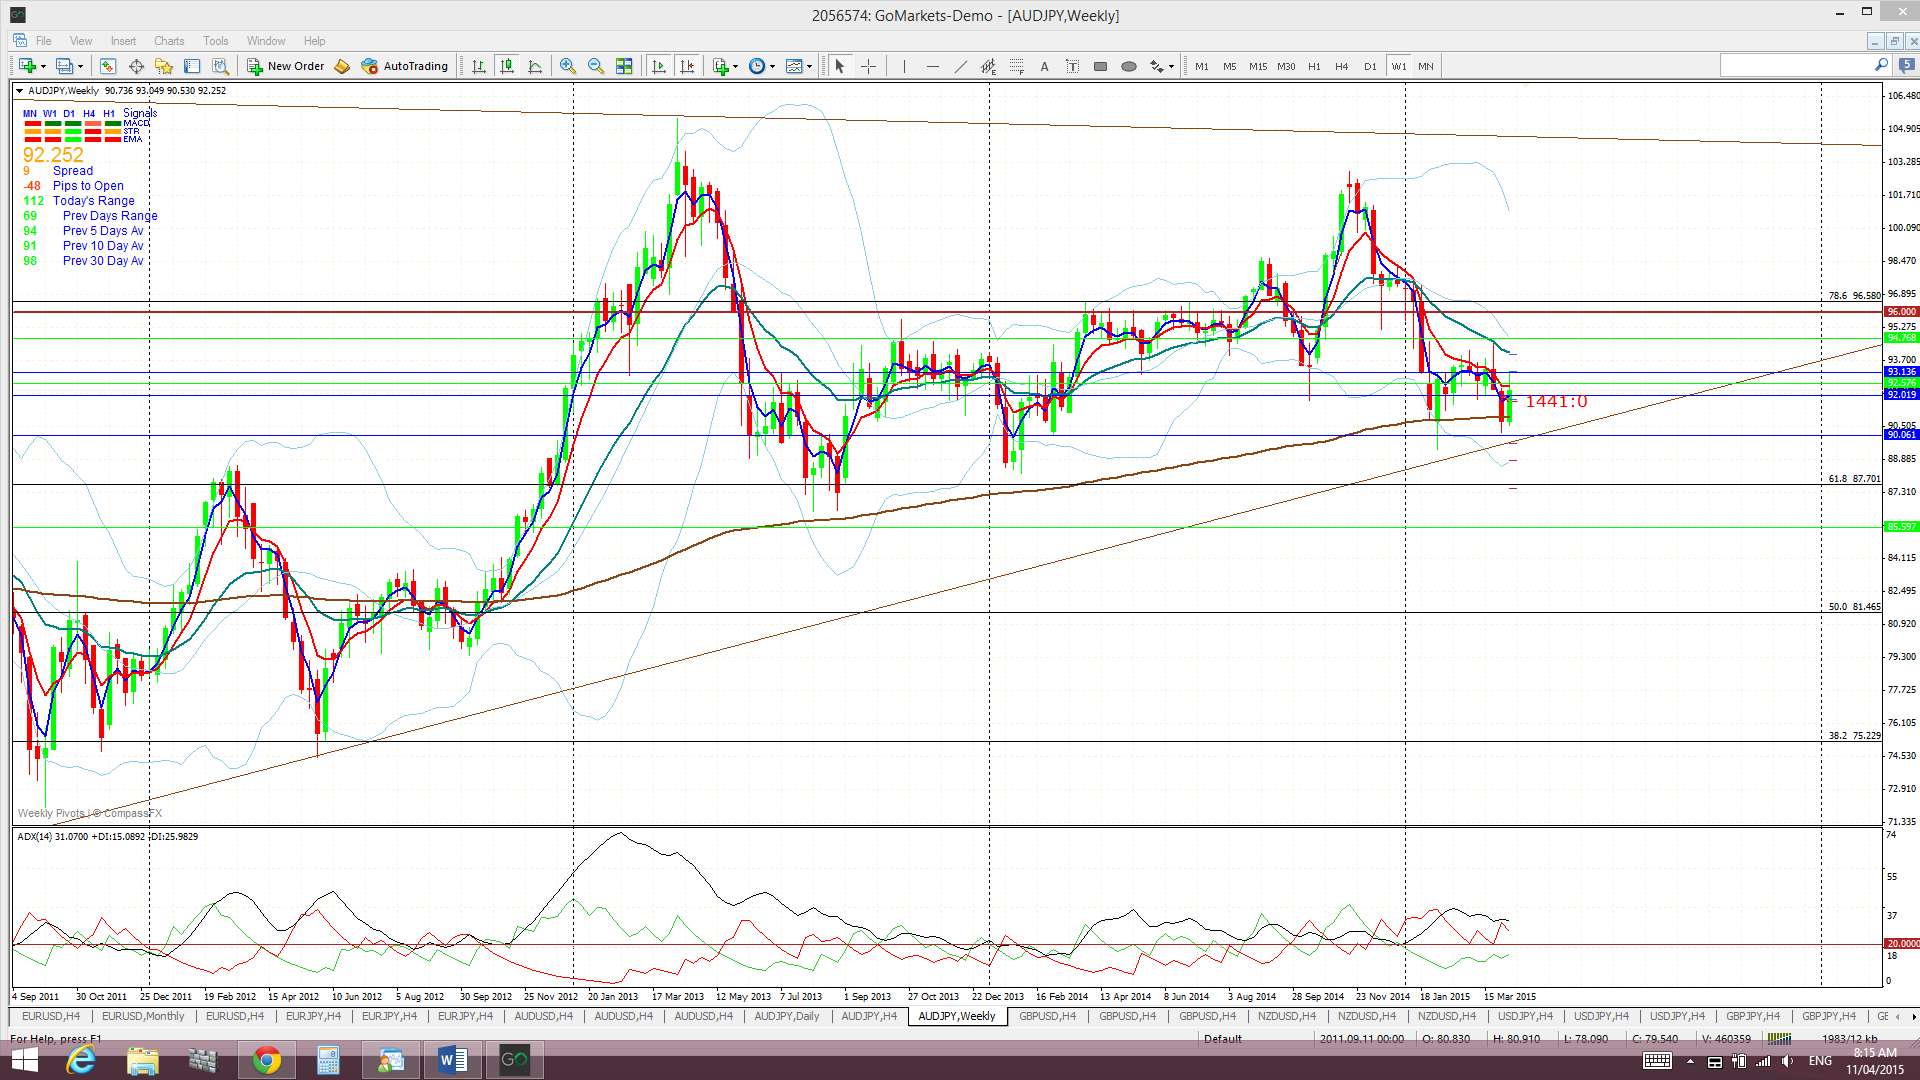
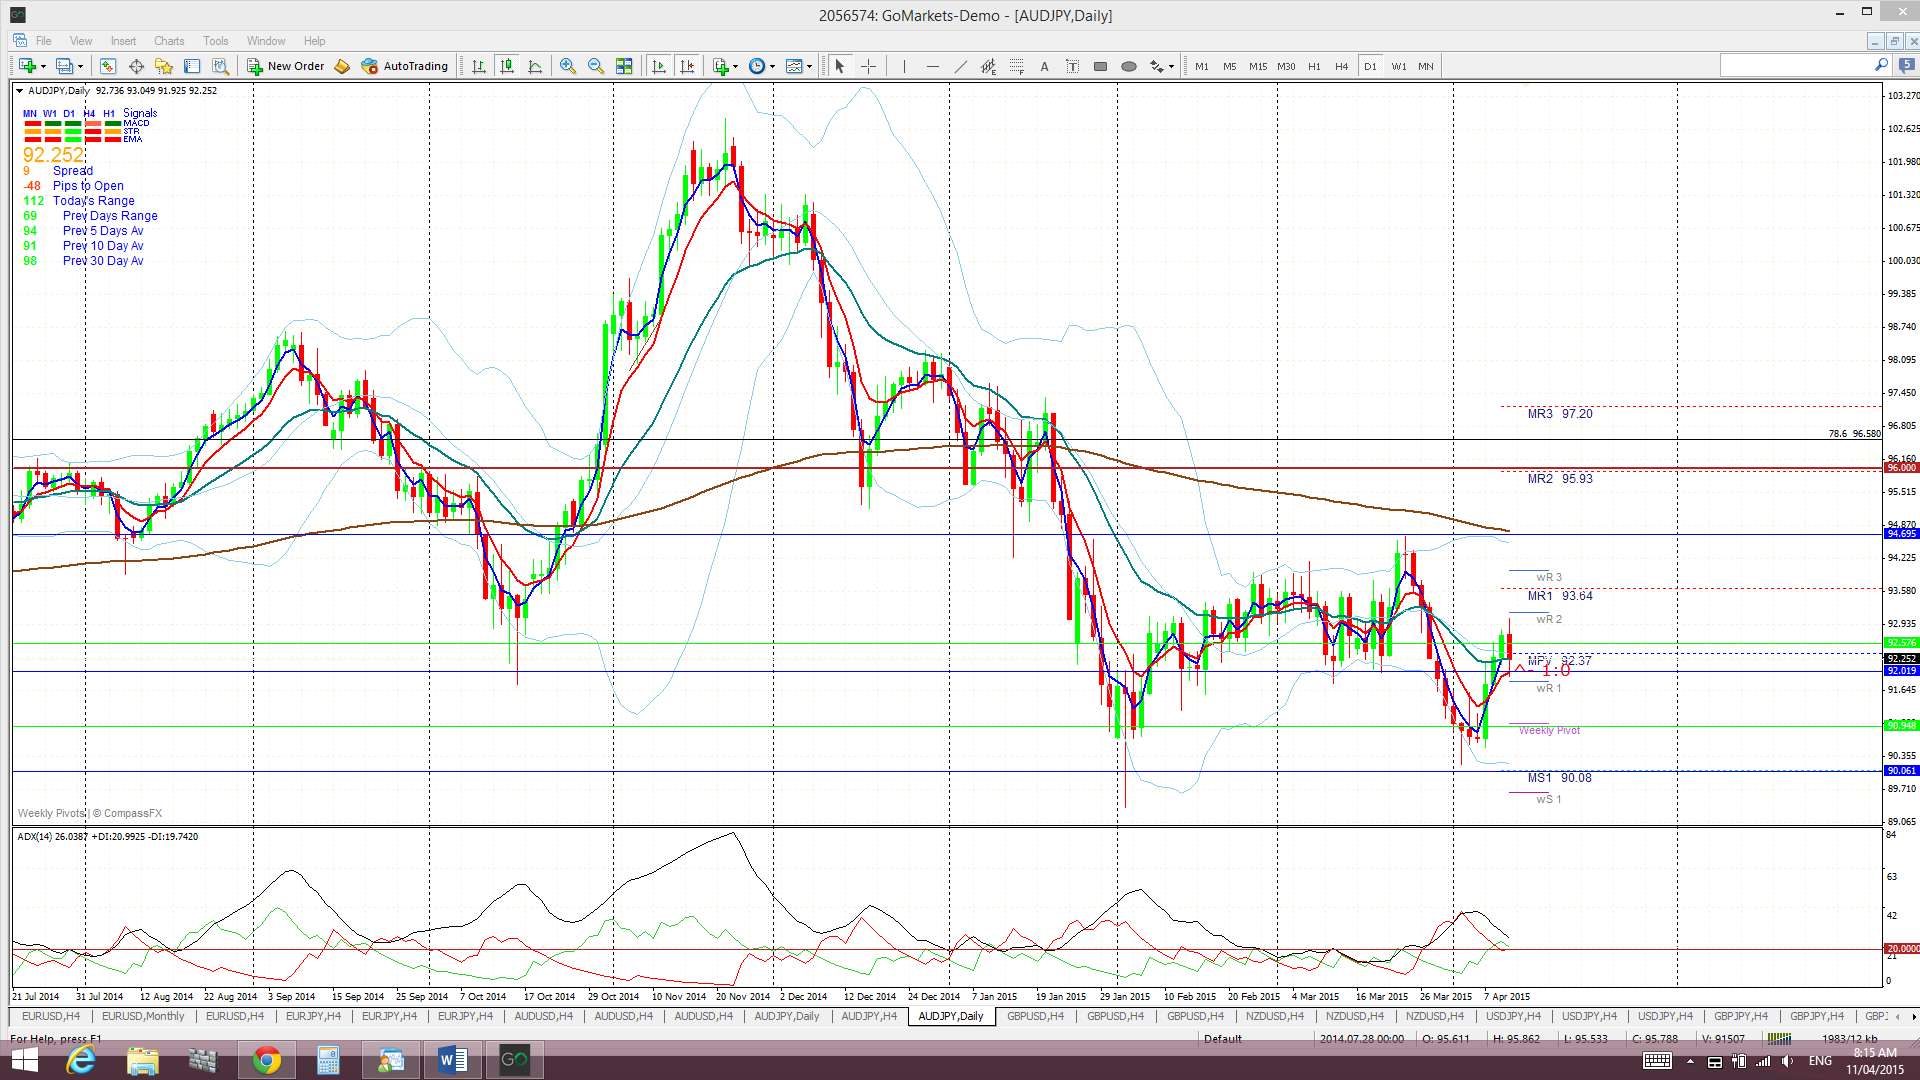
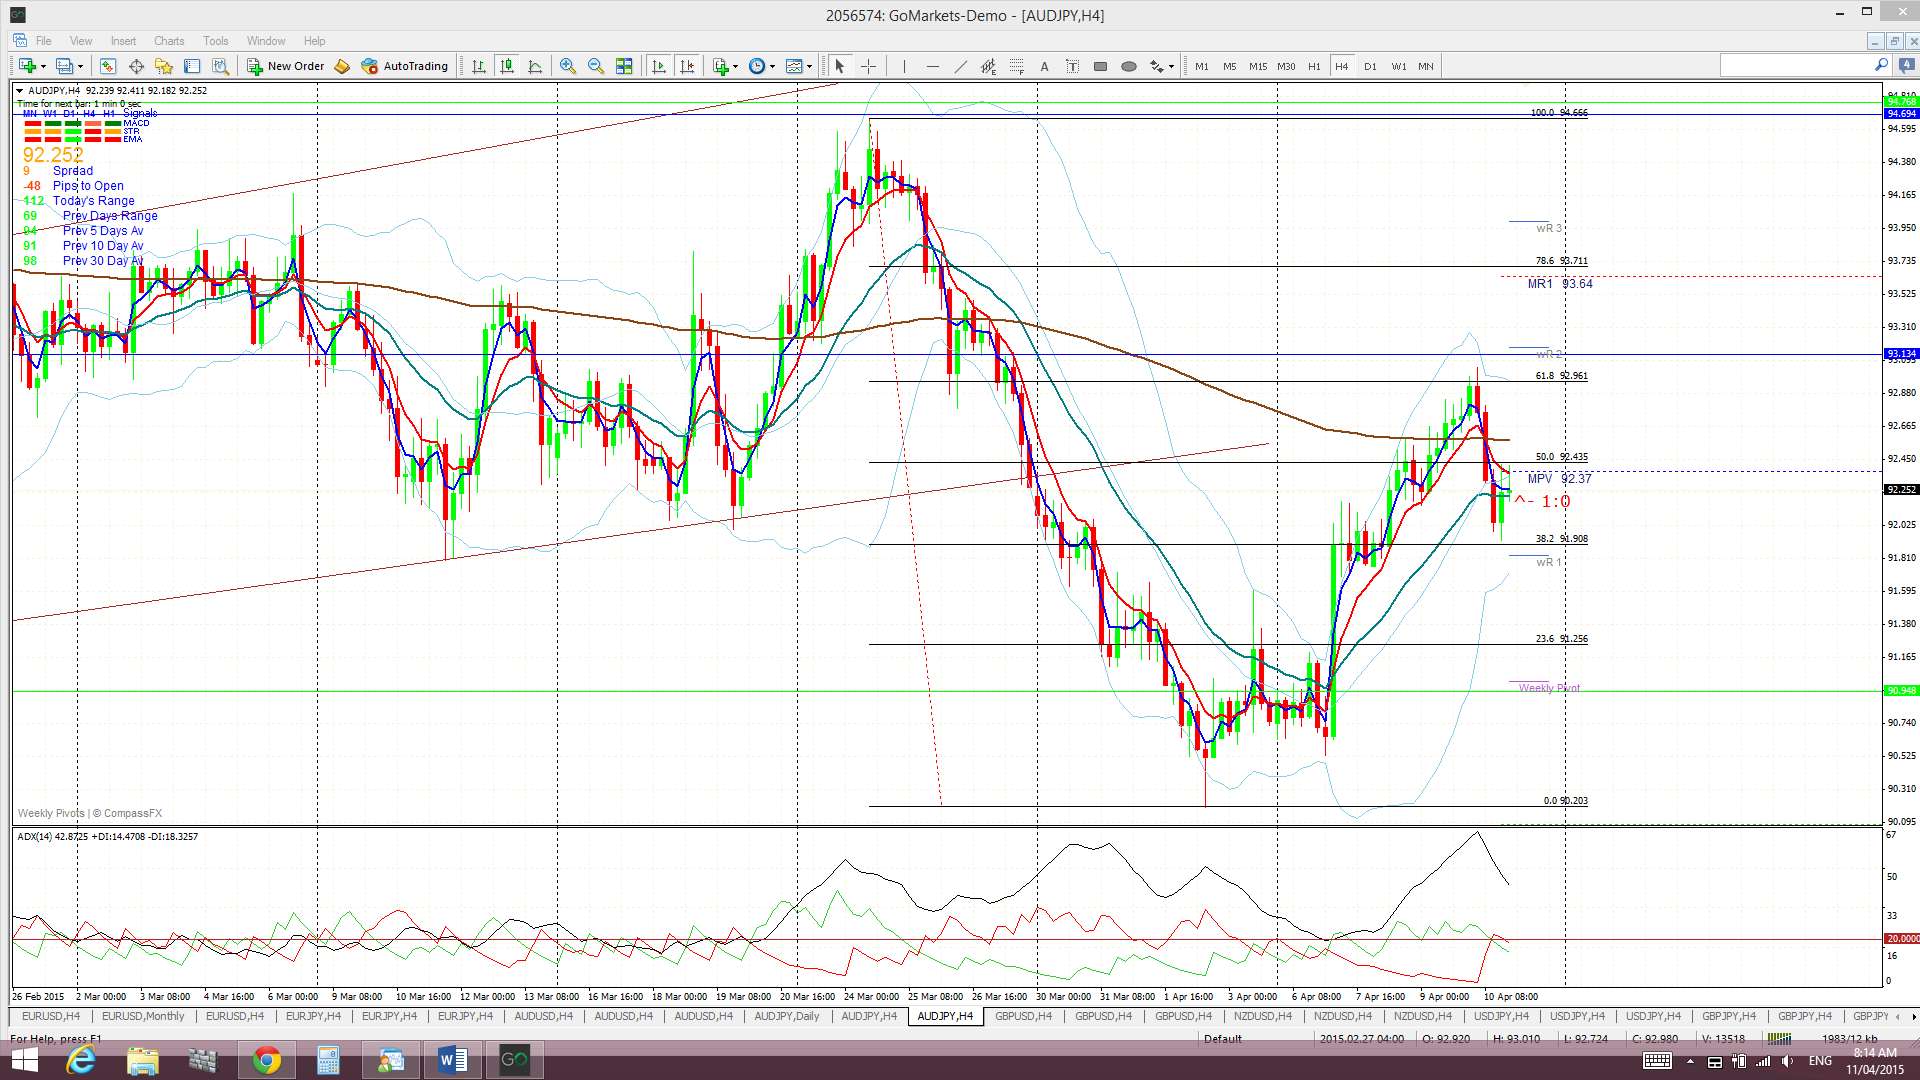
A/J: The A/J continued to chop higher last week and rallied to test the 61.8% retracement fib of the recent bear move. Price pulled back from that fib level test but still closed higher for the week.
I’m struggling to read this pair a bit at the moment but stepping out to the weekly chart shows price action holding above the weekly 200 EMA and the monthly chart shows the A/J conforming to a triangle pattern.
Price is now trading in the top edge of the Cloud on the 4hr chart, below the Cloud on the daily and weekly charts but above the Cloud on the monthly chart. This divergence perhaps goes some of the way to explaining why I am having some trouble here!
The weekly candle closed as an, almost, bullish-reversal ‘Railway Track’ candle.
Risk events for this pair next week include Chinese data and AUD Employment data.
- I’m watching for any new TC signal on this pair.
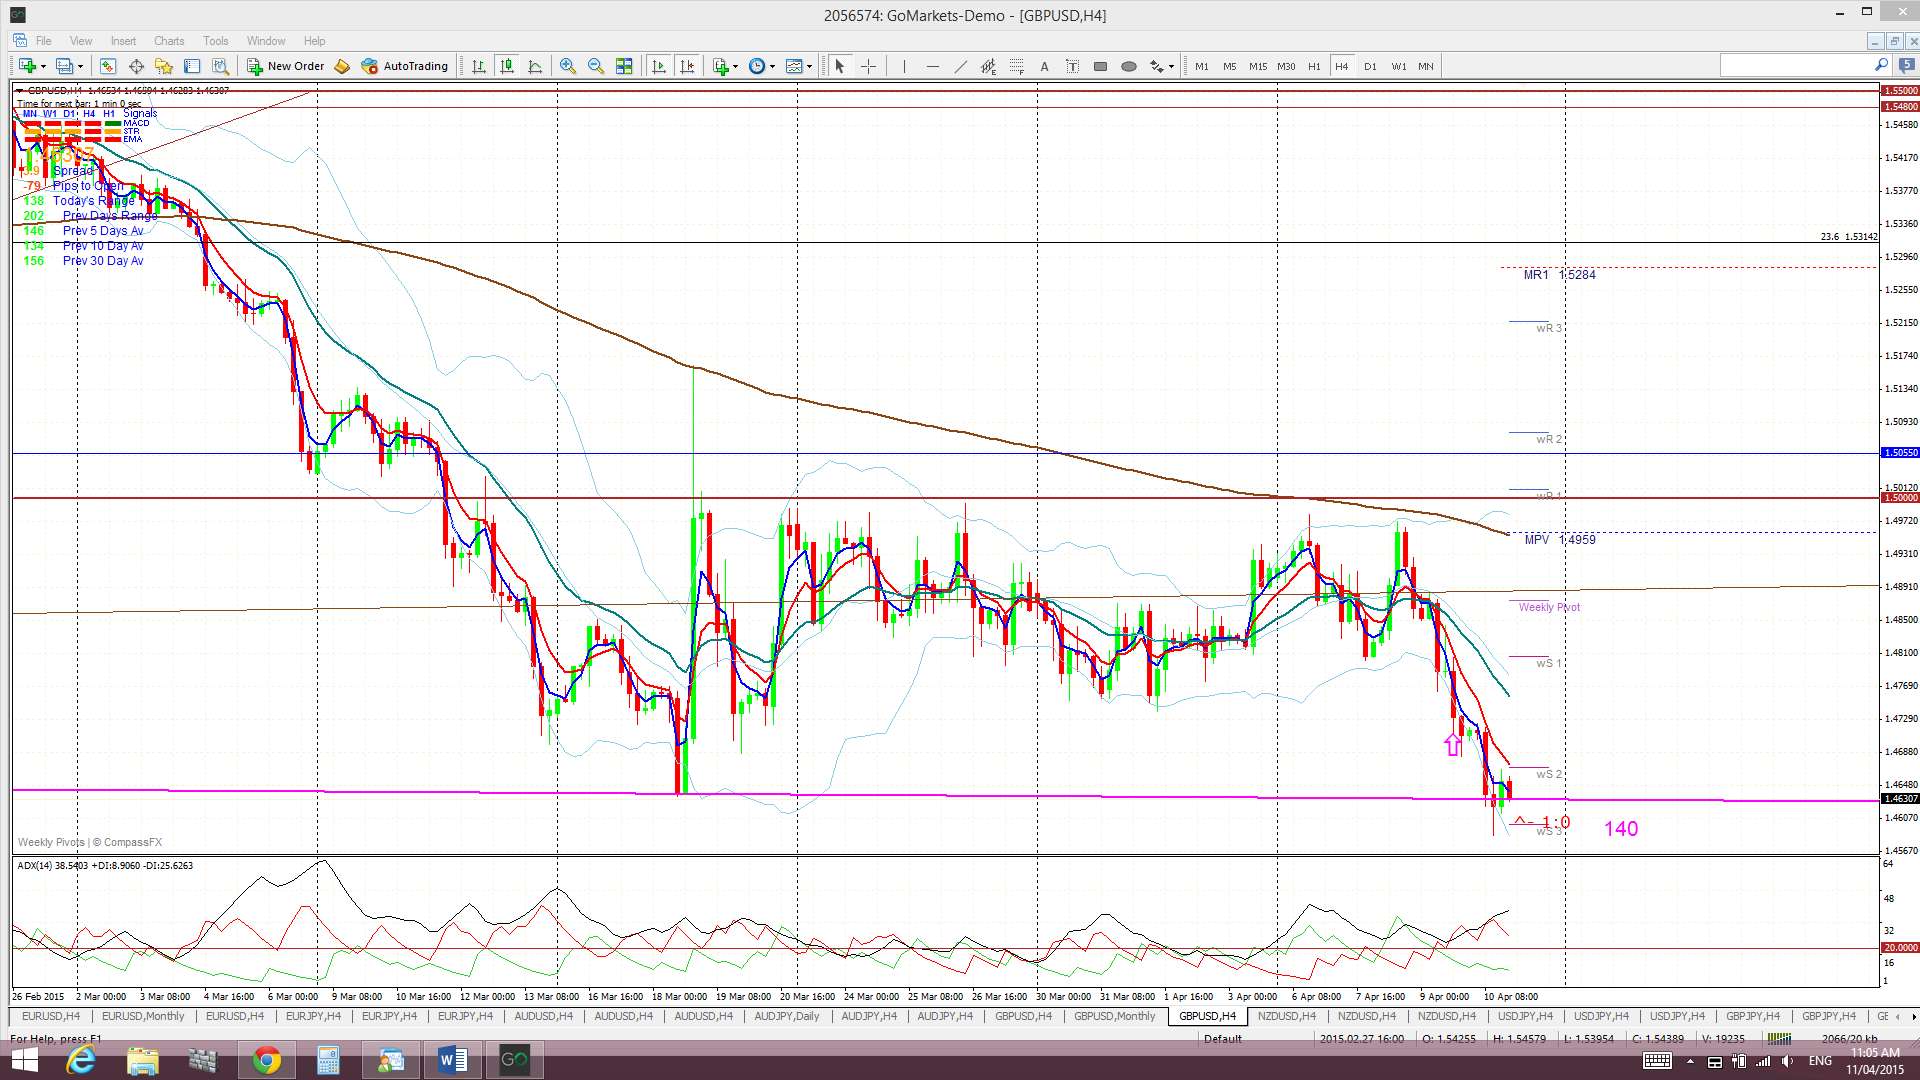
G/U: The Cable continued to chop around under the 1.50 level last week as the UK election landscape remains as a negative for this pair. Price edged lower on Thursday and triggered a new TC signal and, then, weaker than expected UK Construction data on Friday helped to develop this trade signal. Interestingly, price came to rest for the week just above the ‘neck line’ support of my weekly chart H&S pattern but the TC signal is still open and has given up to 140 pips thus far.
Weekly chart H&S: There is a possible bearish H&S pattern forming on the weekly chart. The height of the pattern is about 2,400 pips and suggests a similar move lower with any break and hold below the ‘neck line’. Recall that the GBP/USD printed a monthly close in March below 1.50, the first since June 2010. This bearish development supports the H&S pattern. Price closed for the week just above this neck line and so we will have to wait another week to be able to confirm any such bearish breakdown.
Price is now trading below the Cloud on the 4hr, daily, weekly and monthly charts which is a bearish shift.
The weekly candle closed as a large bearish candle.
Risk events for this pair next week include UK CPI and Employment data as well as issues impacting the US$. Tuesday’s CPI might be a tipping point for the Cable though as it sits on the H&S neck line. A positive result may help lift the pair off this major support level but weak data might get the H&S started.
- There is an OPEN TC SHORT signal on this pair.


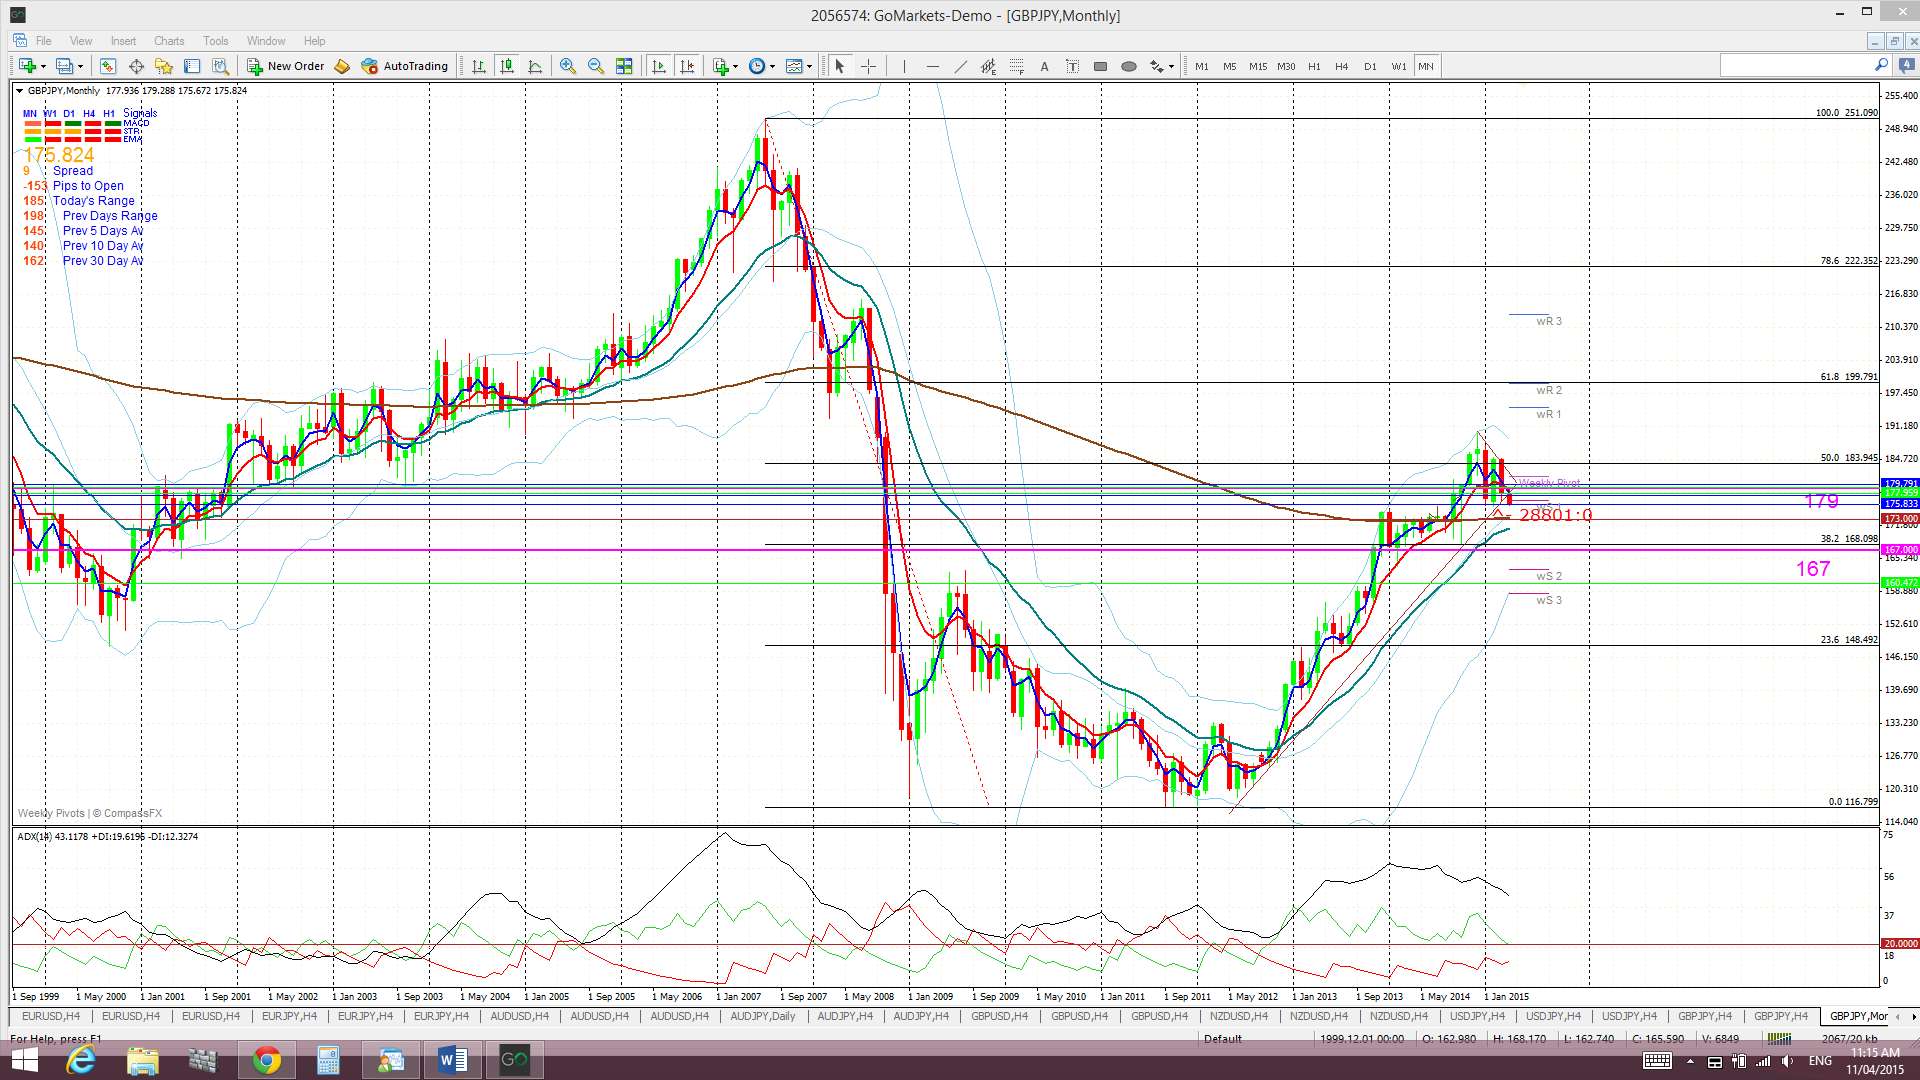
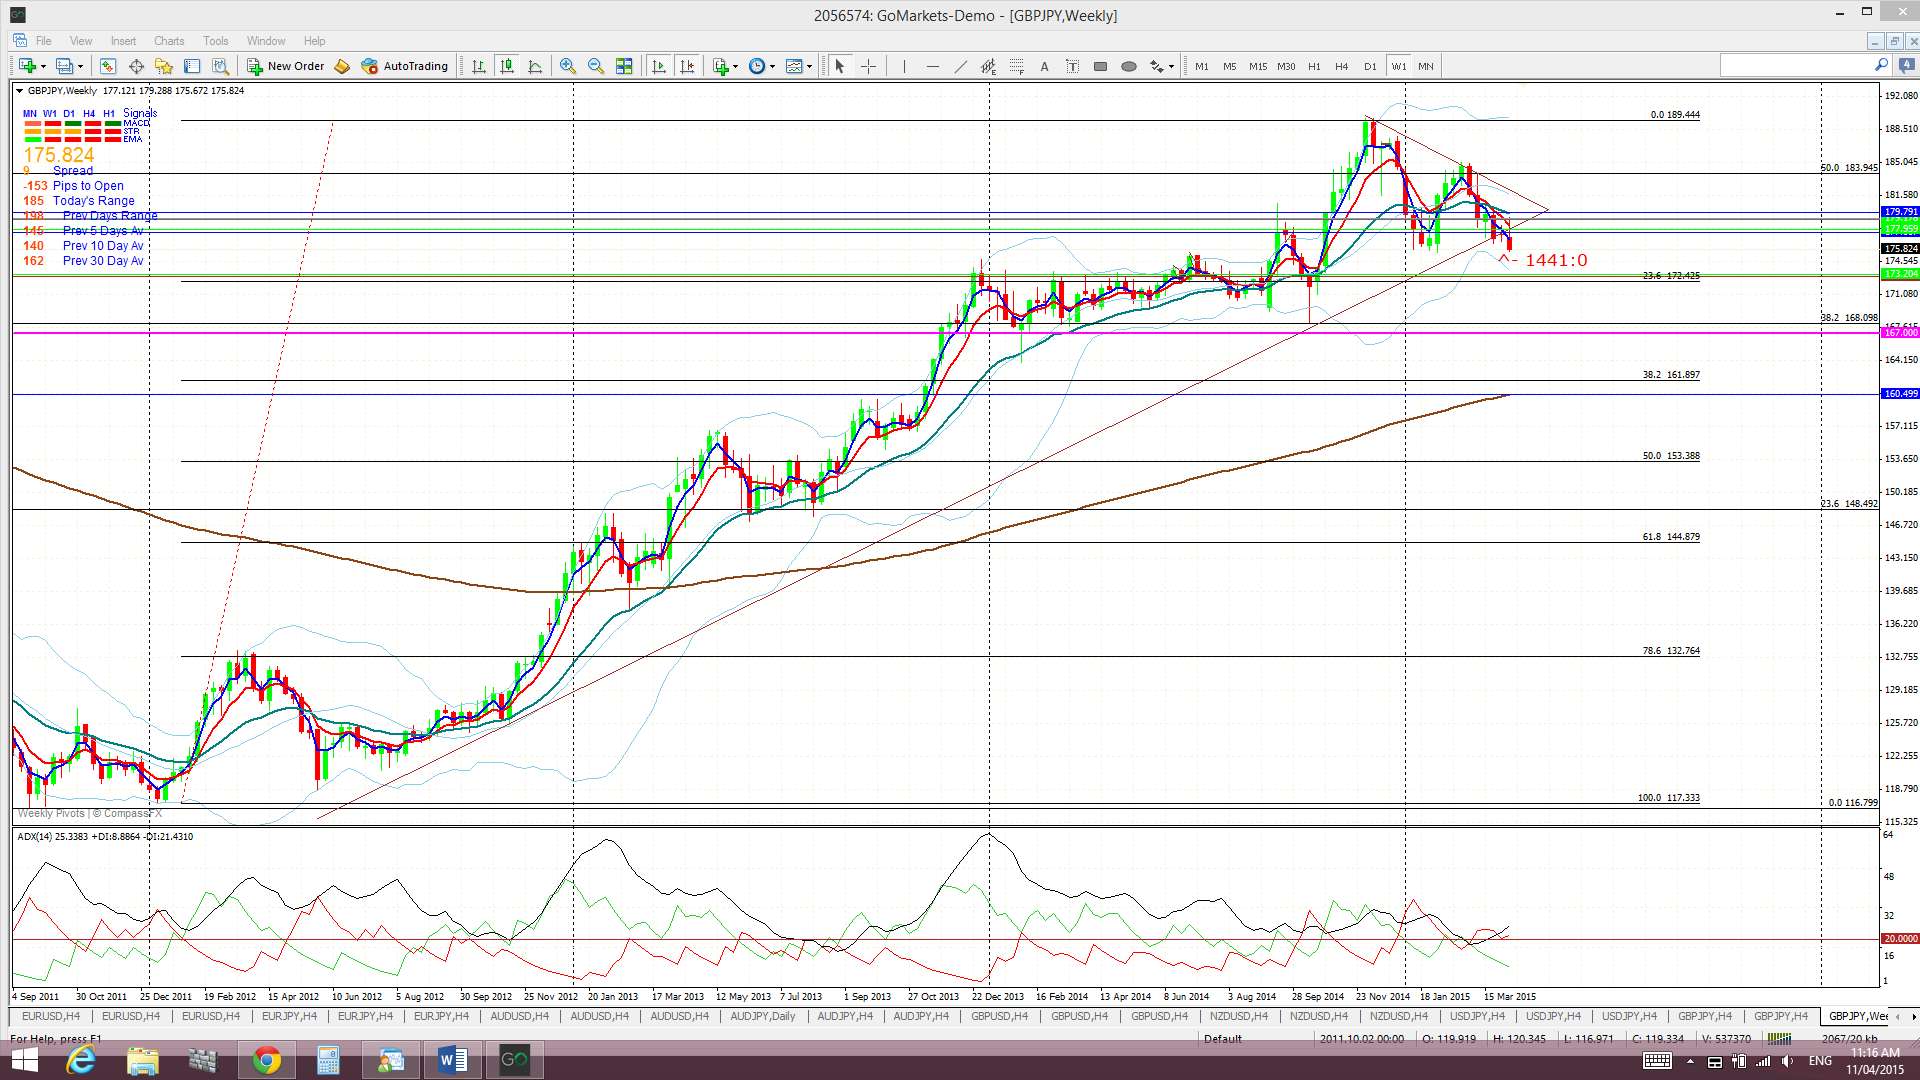
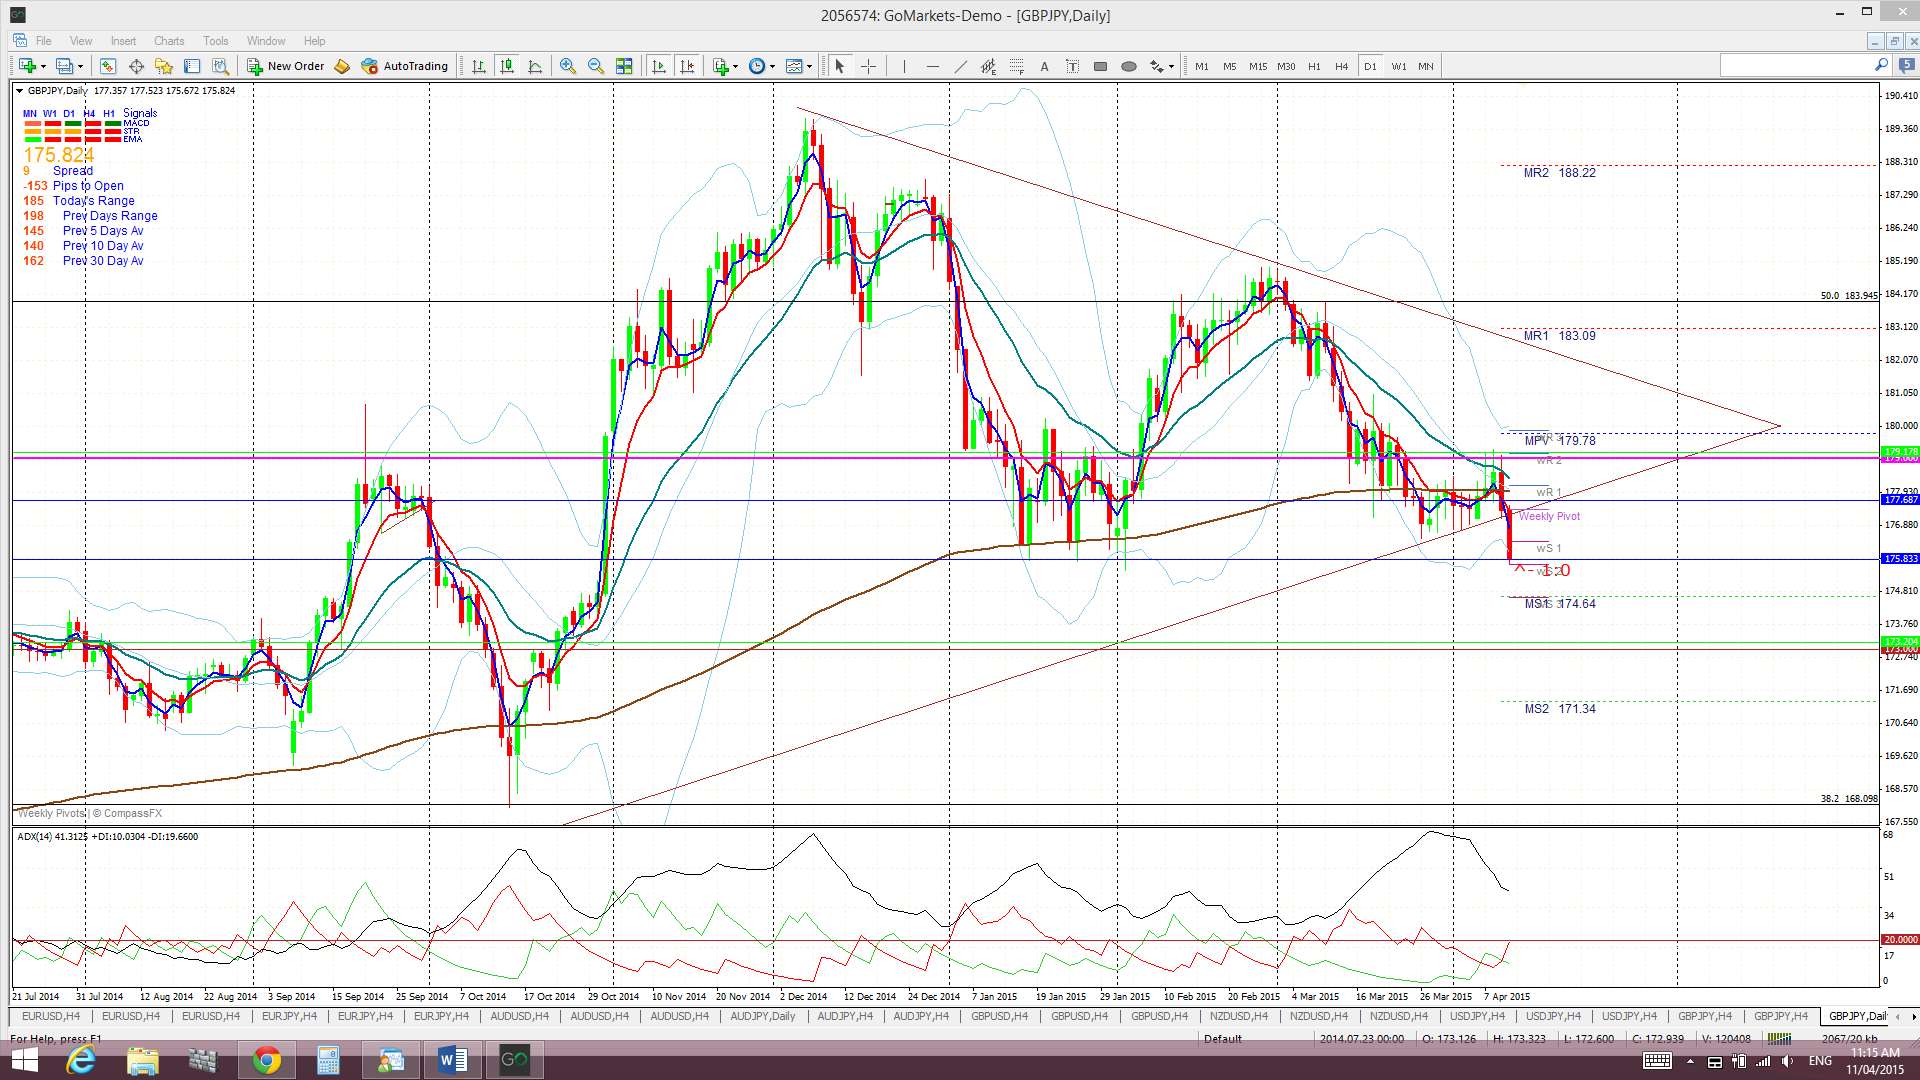
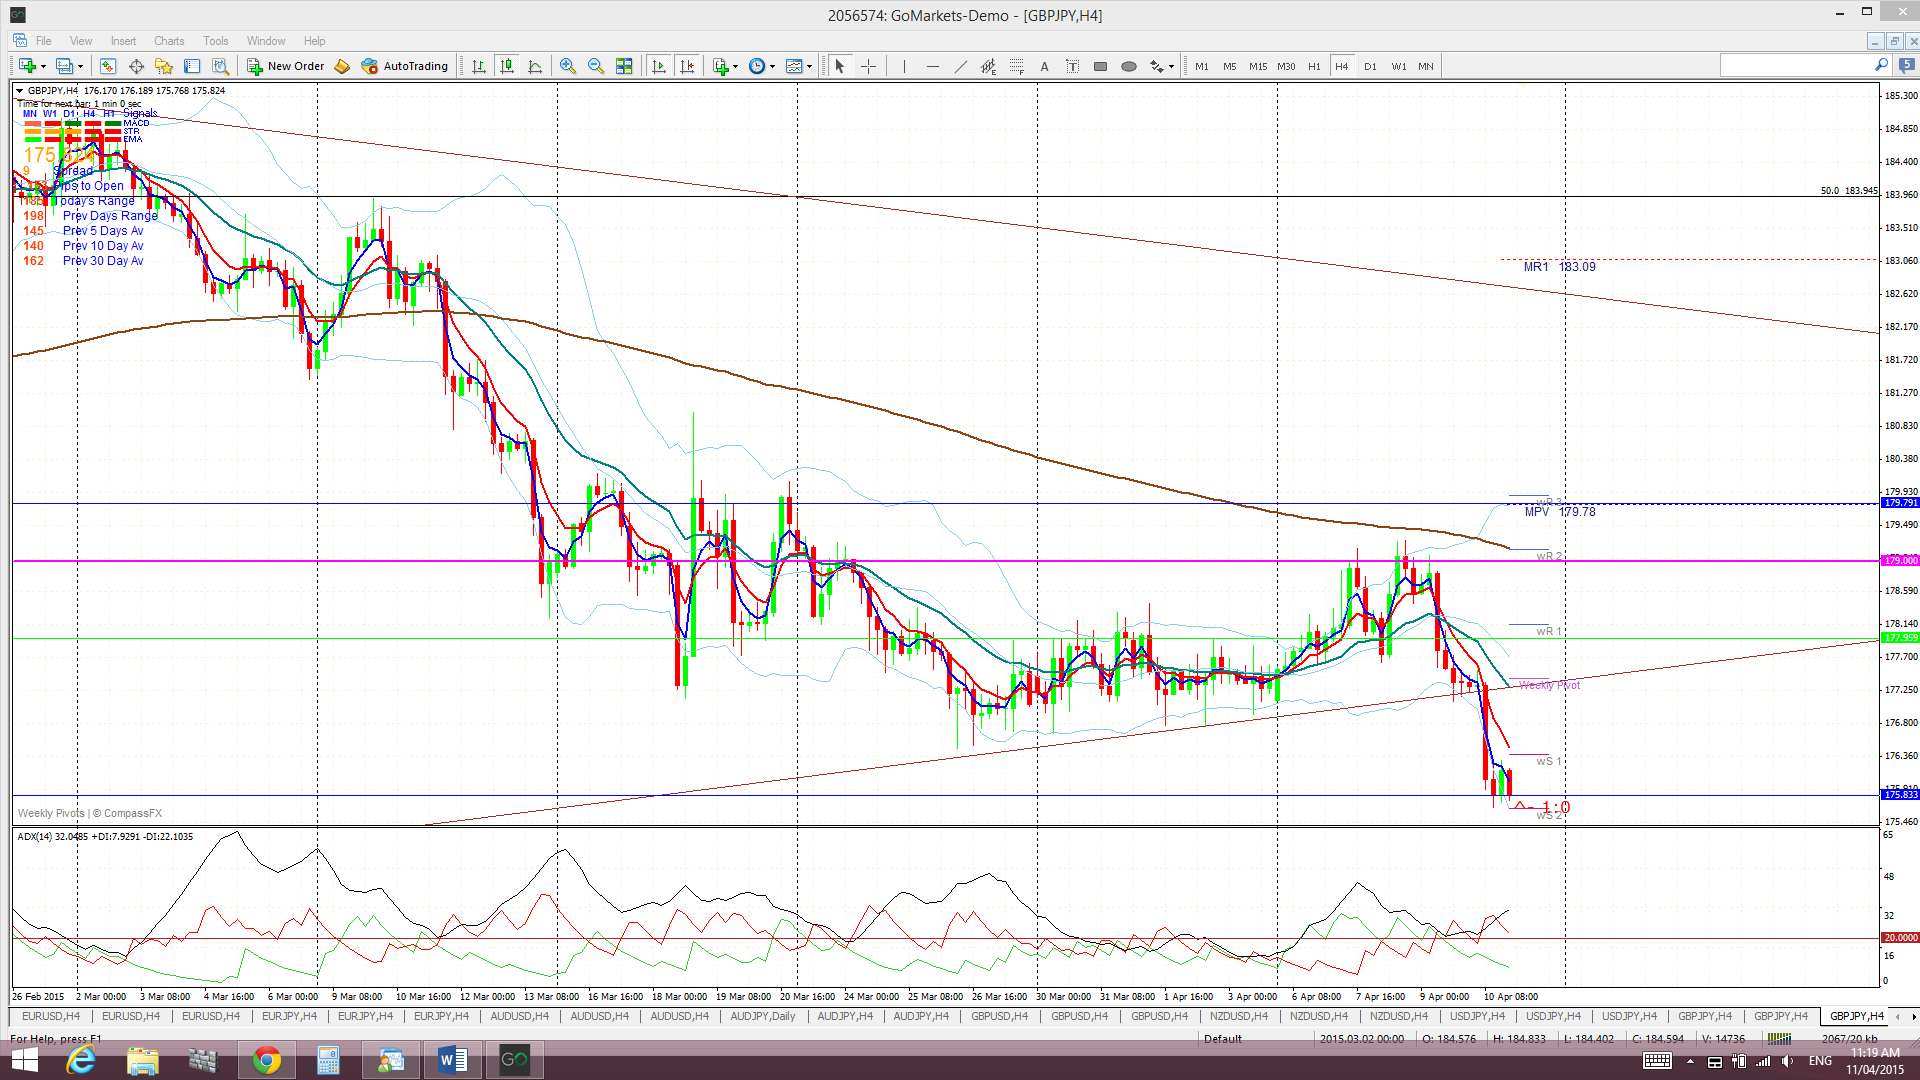
GBP/JPY: The GBP/JPY tried to break above the key 179 level a few times last week but each effort failed. Price then fell away towards the end of the week and broke down through a weekly support trend line.
Two key S/R levels on the G/J chart: The monthly chart shows a band of choppy congested activity across the chart. This band is defined by rather strong S/R levels at 179 and 167. The 179 level seems to be a key demarcation level and a close and hold above this would suggest bullish continuation. The key 173 level lies midway between these two S/R levels. Targets for any bullish continuation include the 61.8% fib near 200 and the 78.6% fib near 222.
Price is still trading below the Ichimoku Cloud on the 4hr and daily charts but above the Cloud on the weekly and monthly charts.
The weekly candle closed as a bearish candle.
Risk events here will be much the same as for the GBP/USD.
- I’m watching for any new TC signal on this pair.
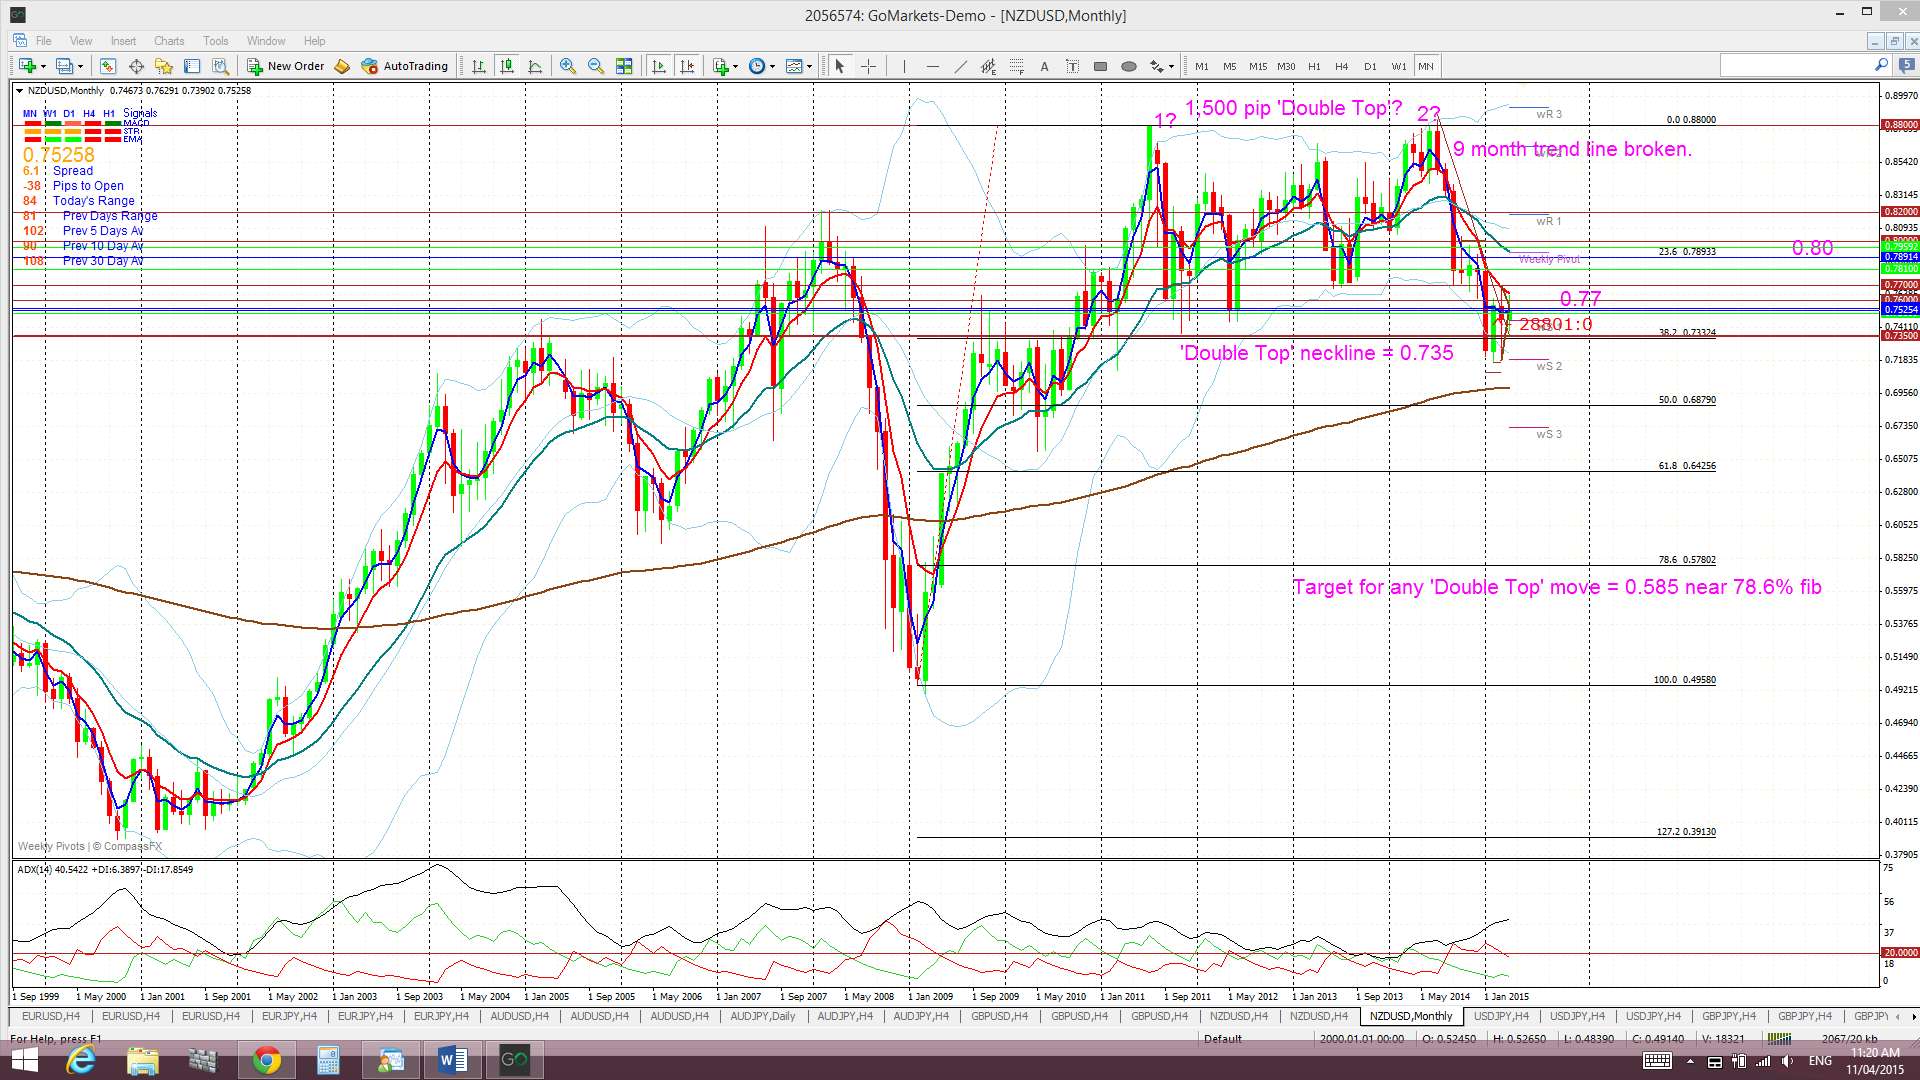
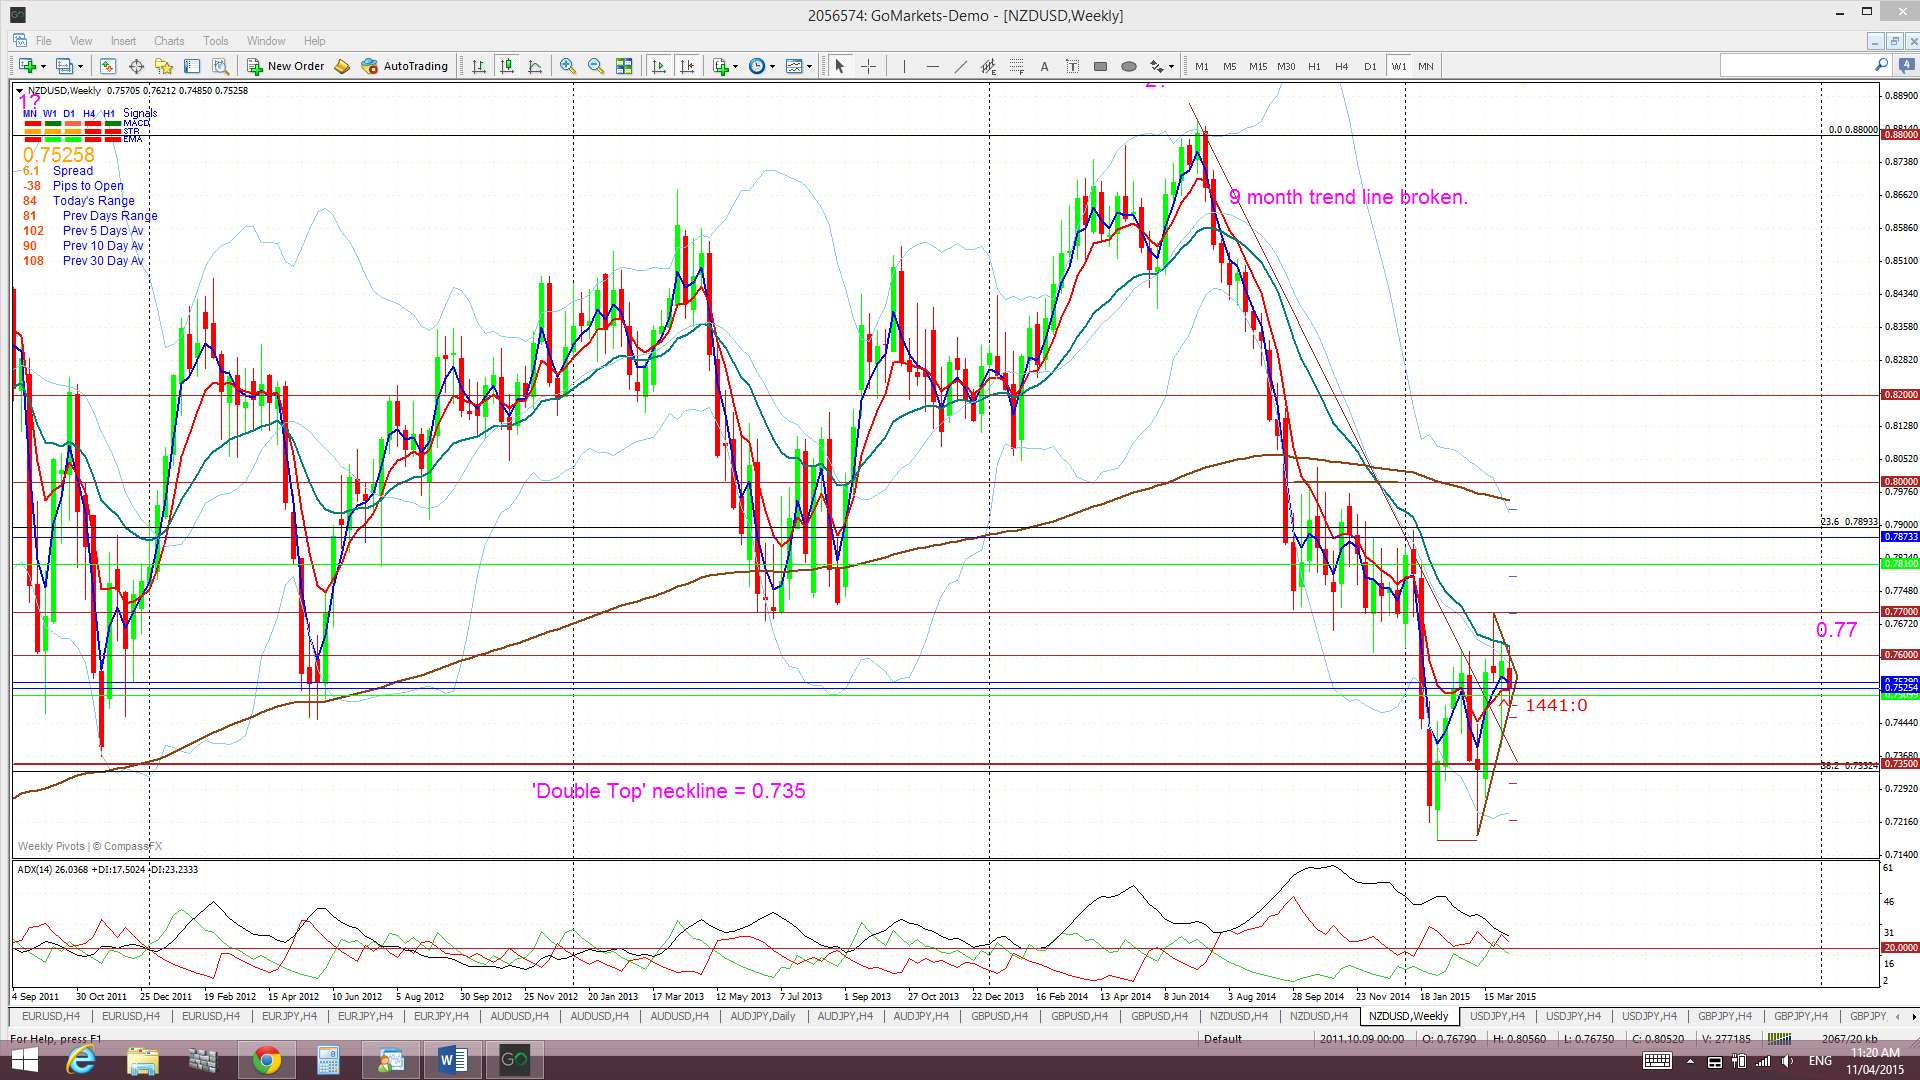
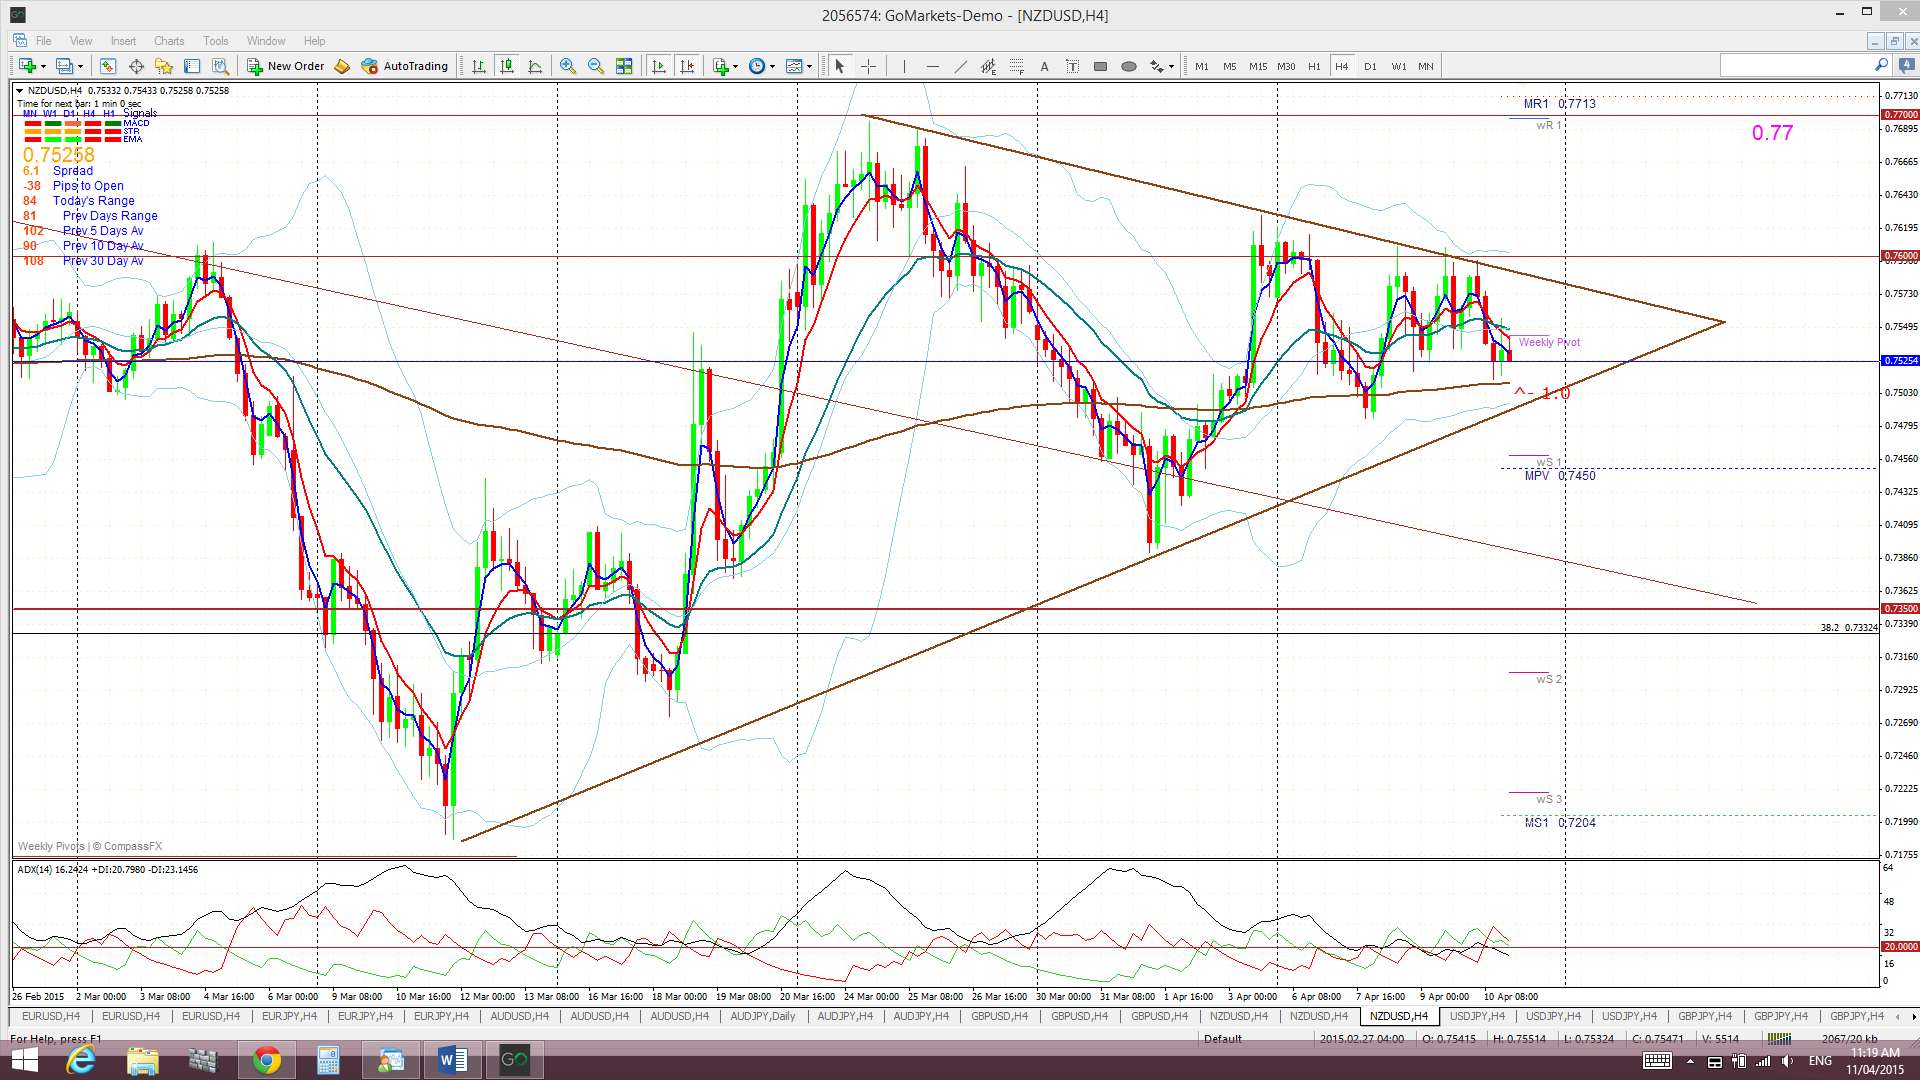
Kiwi: NZD/USD: The Kiwi chopped sideways for most of last week and formed up into a symmetrical triangle on the 4hr chart time frame.
‘Double Top’ breakdown on Monthly chart? The monthly chart still reveals a possible ‘Double Top’ pattern with a neck line at 0.735 in the making. The monthly candle close below this level for January suggested a possible 2,000 pip bearish follow through move as this is the height of the ‘Double Top’ BUT there does not seem to be a hold below this key level JUST YET. This may still well evolve, especially if the USD index continues with its bullish mojo but any reversal on the USD index could see Kiwi continue to bounce up off this major support.
Price is trading below the Ichimoku Cloud on the 4hr chart (only just though), in the top edge of the Cloud on the daily chart, below on the weekly chart but in the middle of the Cloud on the monthly chart.
The weekly candle closed as a small bearish candle with decent upper and lower shadows reflecting some indecision.
Risk events include NZD Business Confidence data on Tuesday, GDT Price Index data on Wednesday, the batch of Chinese data as well as data impacting the US$.
- I’m watching for any new TC signal on this pair and the 4hr chart triangle trend lines.

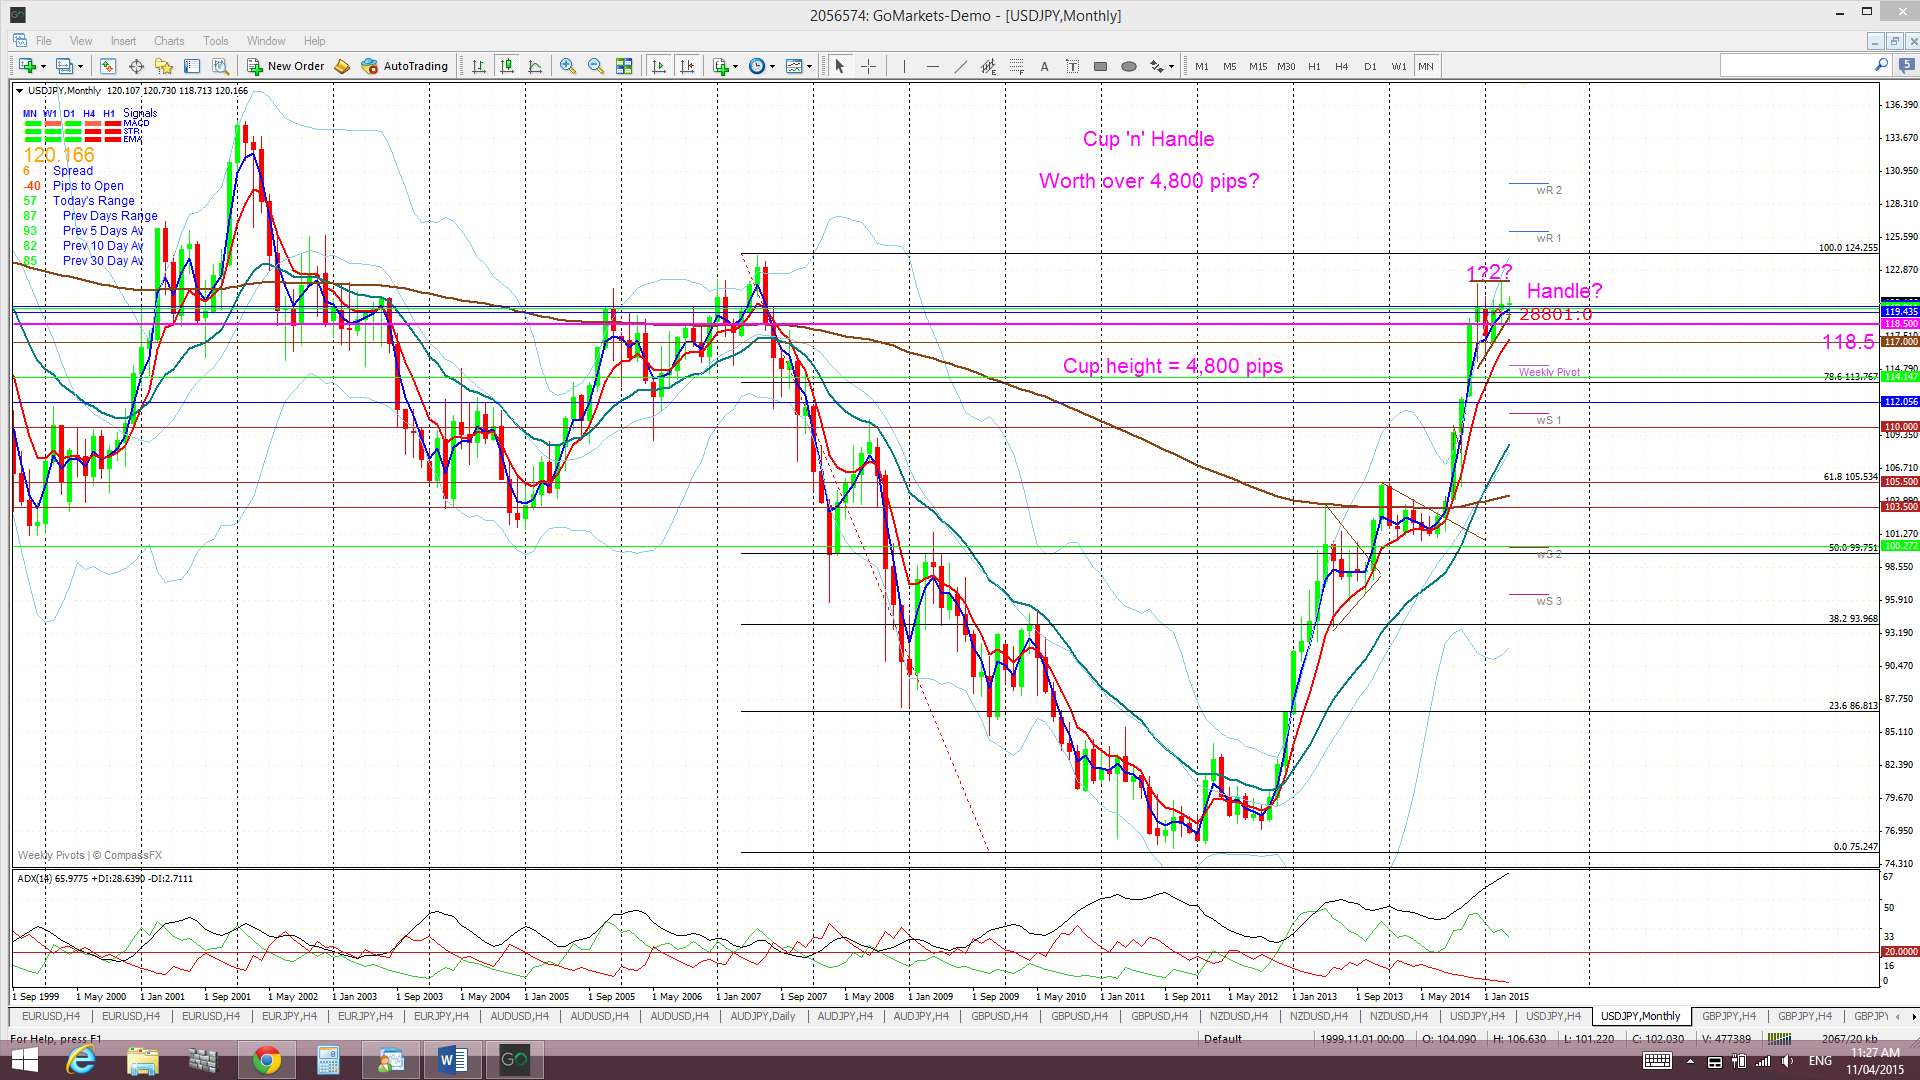
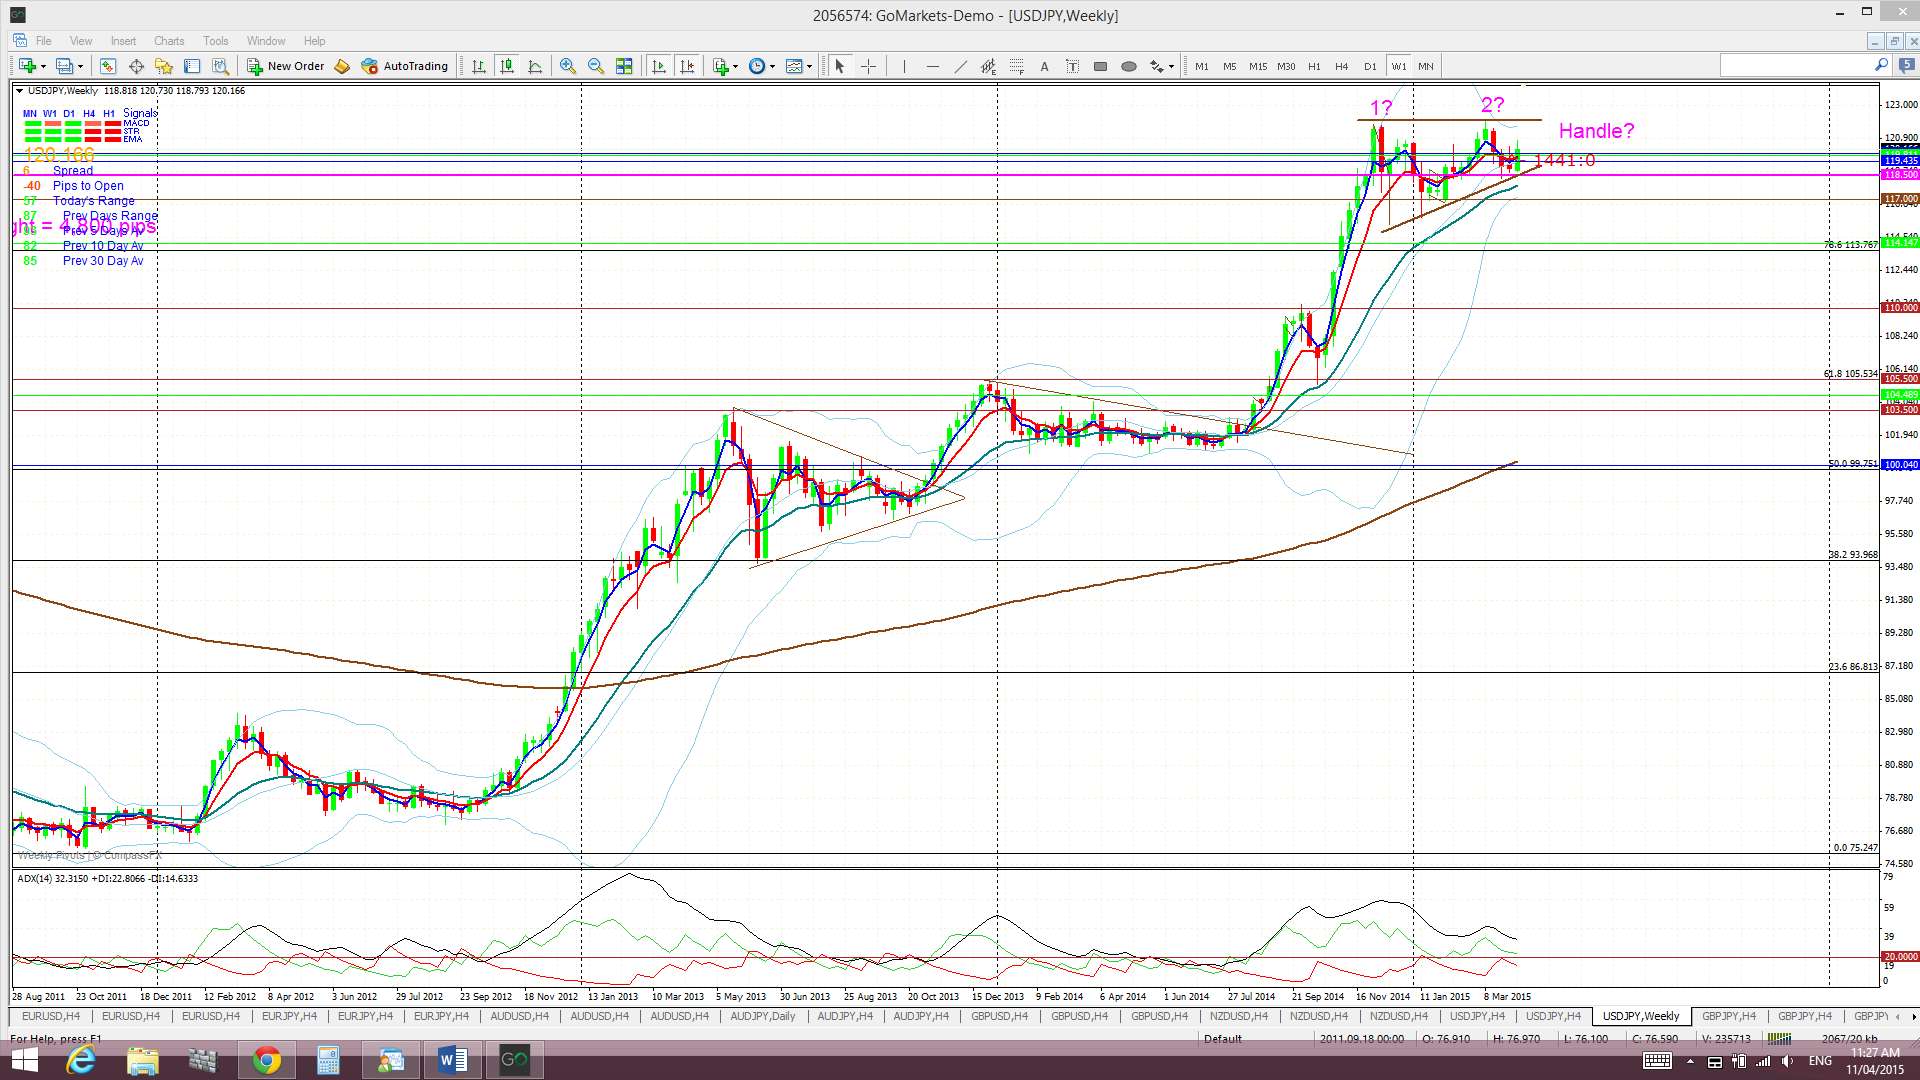
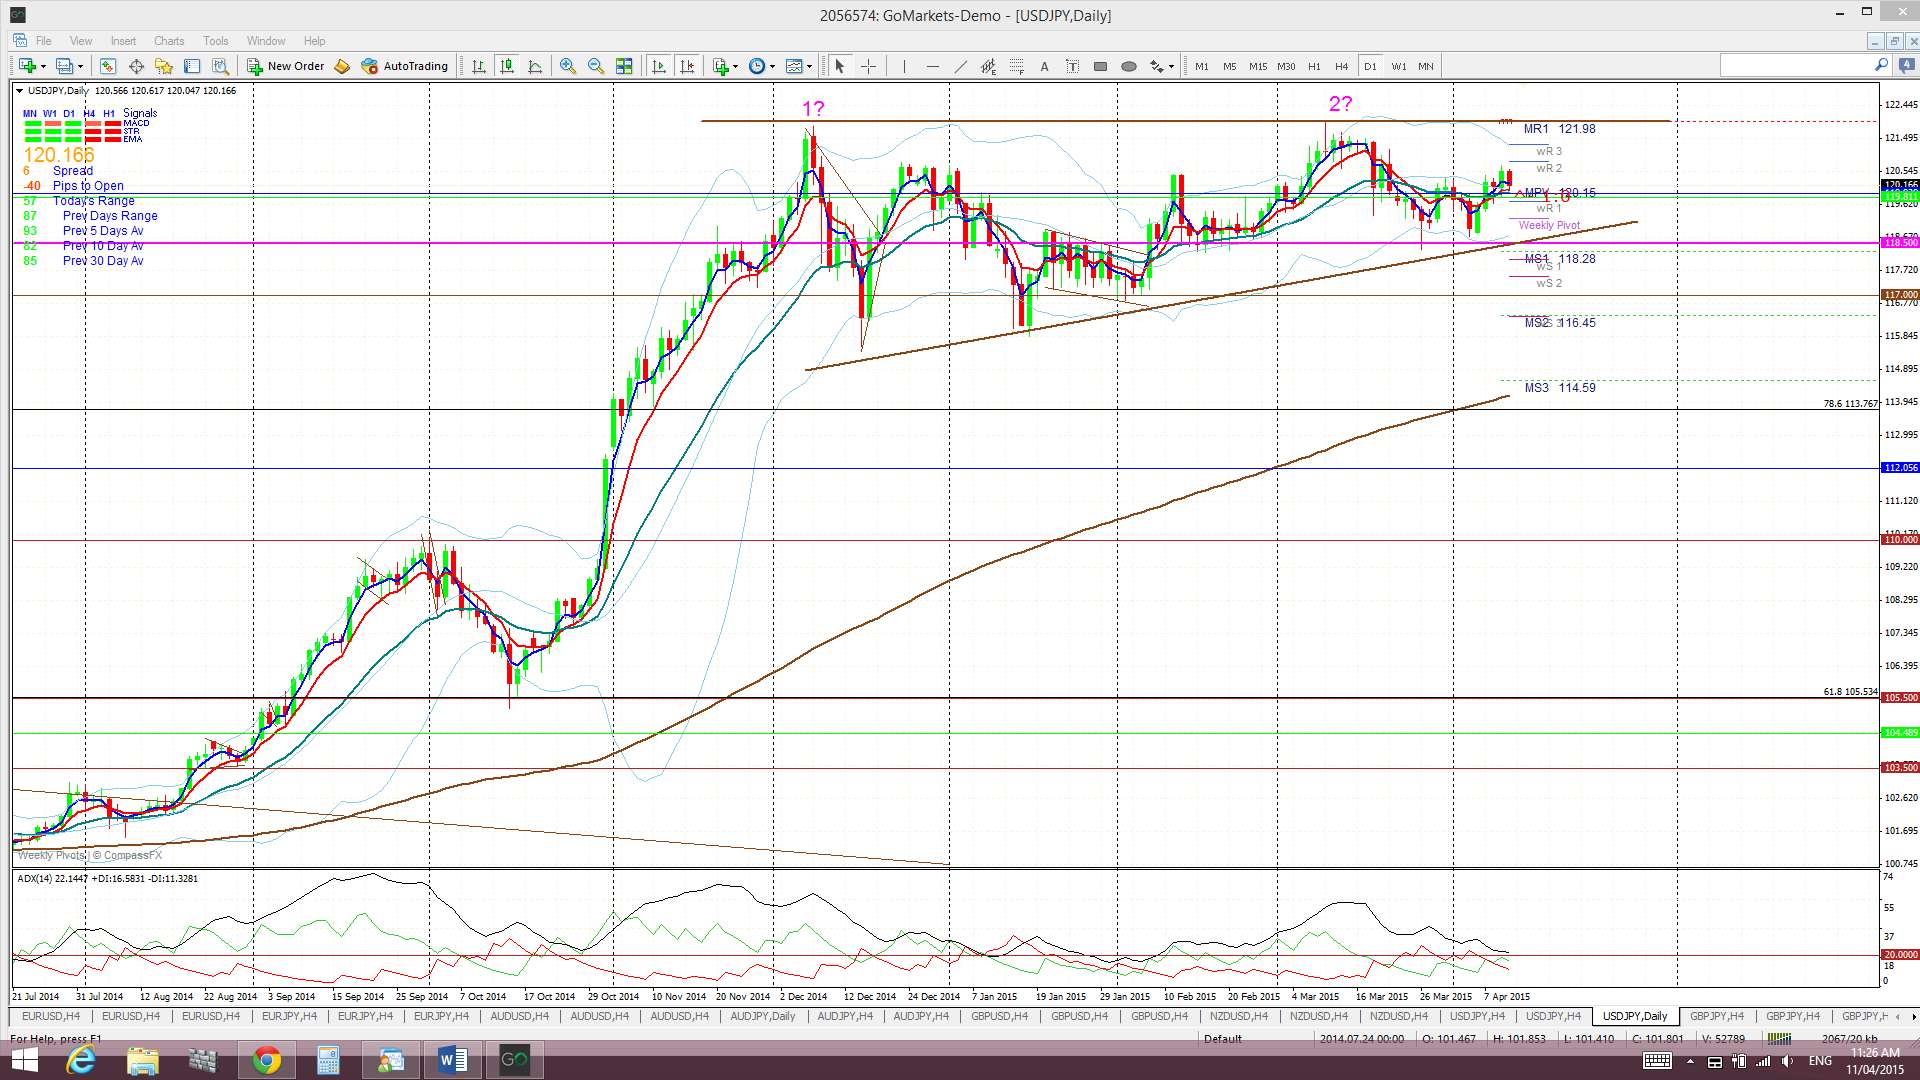
The Yen: U/J: The U/J chopped higher last week and the daily/weekly charts still show a bullish ascending triangle pattern developing. I continue to view this choppy triangle action as helping to form the ‘Handle’ of the new Cup ‘n’ Handle that I am seeing form up on the monthly chart.
Price is now back trading above the Cloud on the 4hr, daily, weekly and monthly charts. November 2013 was the first monthly candle close above the Ichimoku Cloud since mid-2007 and the bullish hold above the monthly Cloud continues to be noteworthy.
The weekly candle closed as a bullish engulfing candle.
Monthly Chart Bullish Cup’ n’ Handle pattern: There looks to be a new bullish Cup ‘n’ Handle forming up on the monthly chart. The theory behind these patterns is that the height of the ‘Cup’ pattern is equivalent to the expected bullish move from any ‘Handle’ breakout. The height of the Cup for the U/J weekly chart is around 4,800 pips.
Risk events include those impacting the US$: US Retail Sales, PPI, Building Permits, Unemployment data, CPI and UoM Consumer Sentiment data.
- I’m watching for any new TC signal on this pair and the ‘Handle’ trend lines.

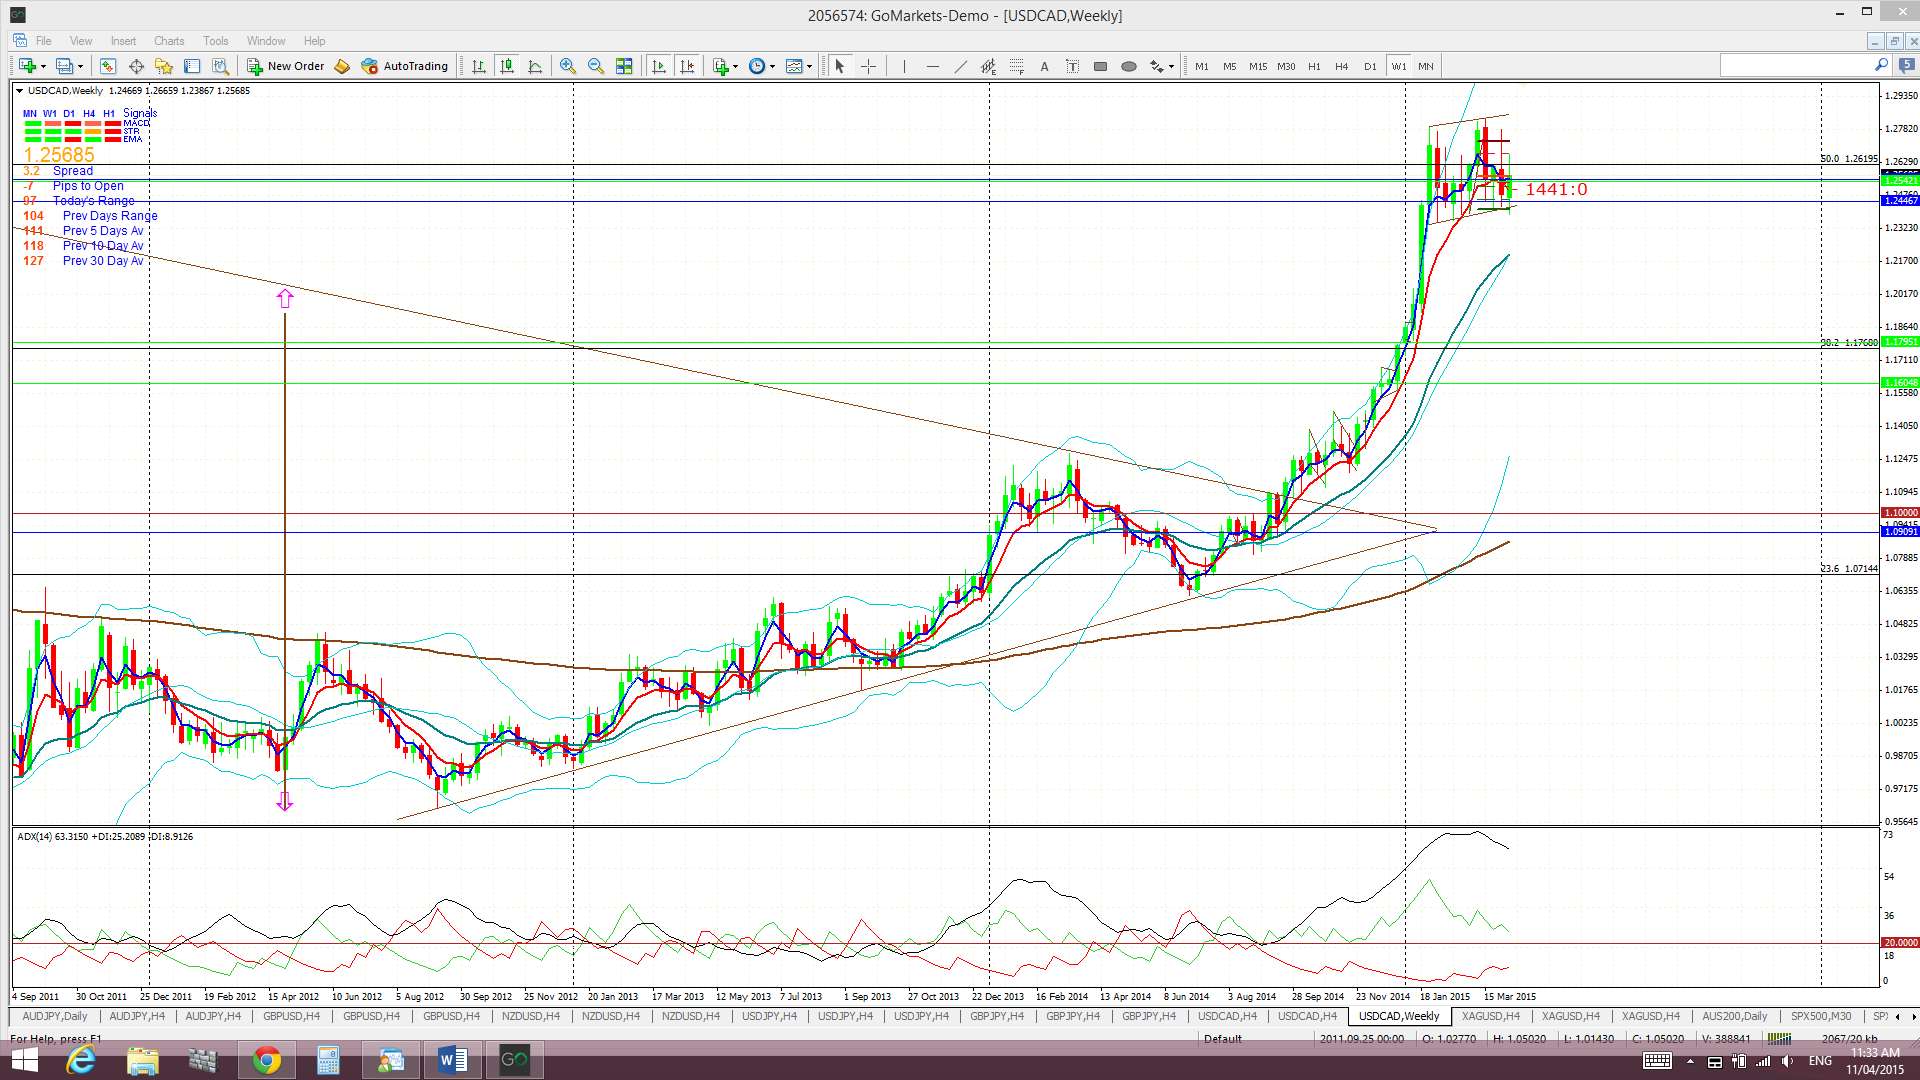
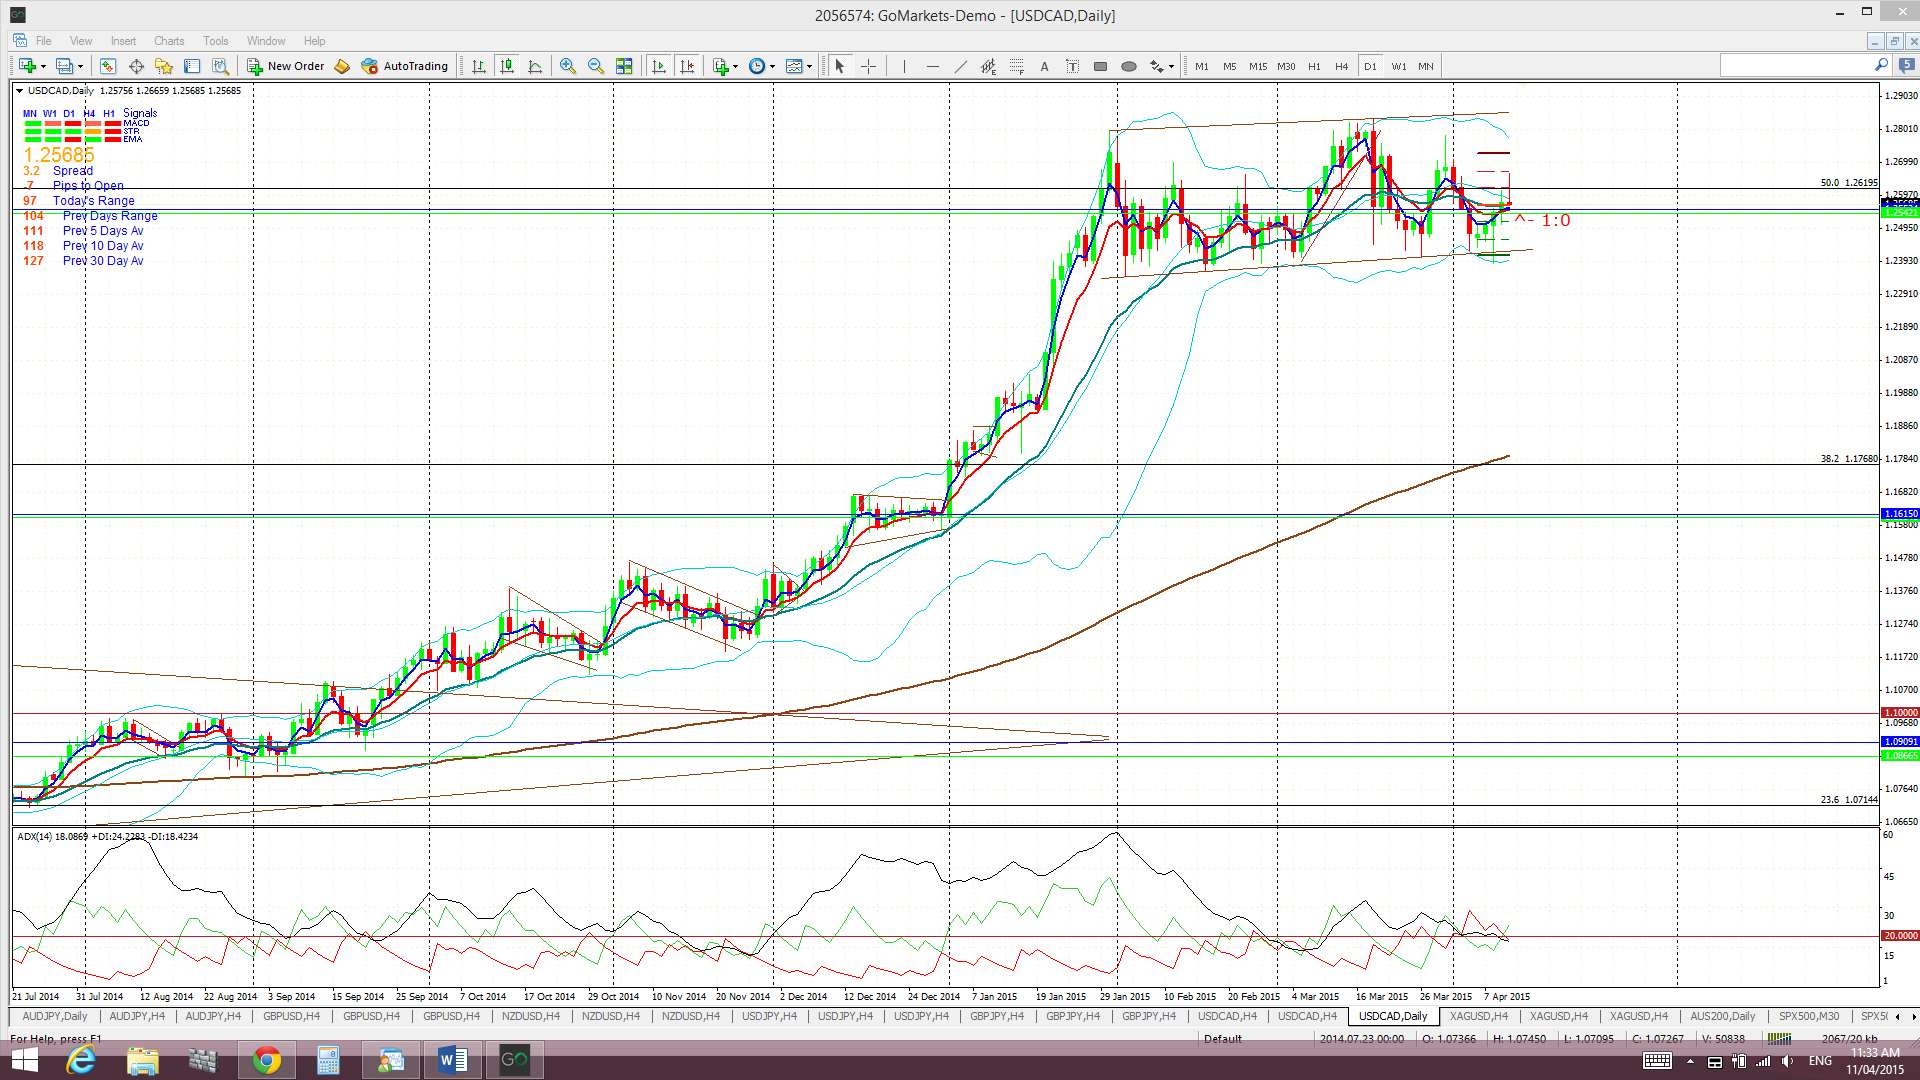
USD/CAD: Not much has changed here this week. The USD/CAD has continued trading within a horizontal trading channel and this price action supports the possible ‘Handle’ of my monthly chart Cup ‘n’ Handle pattern.
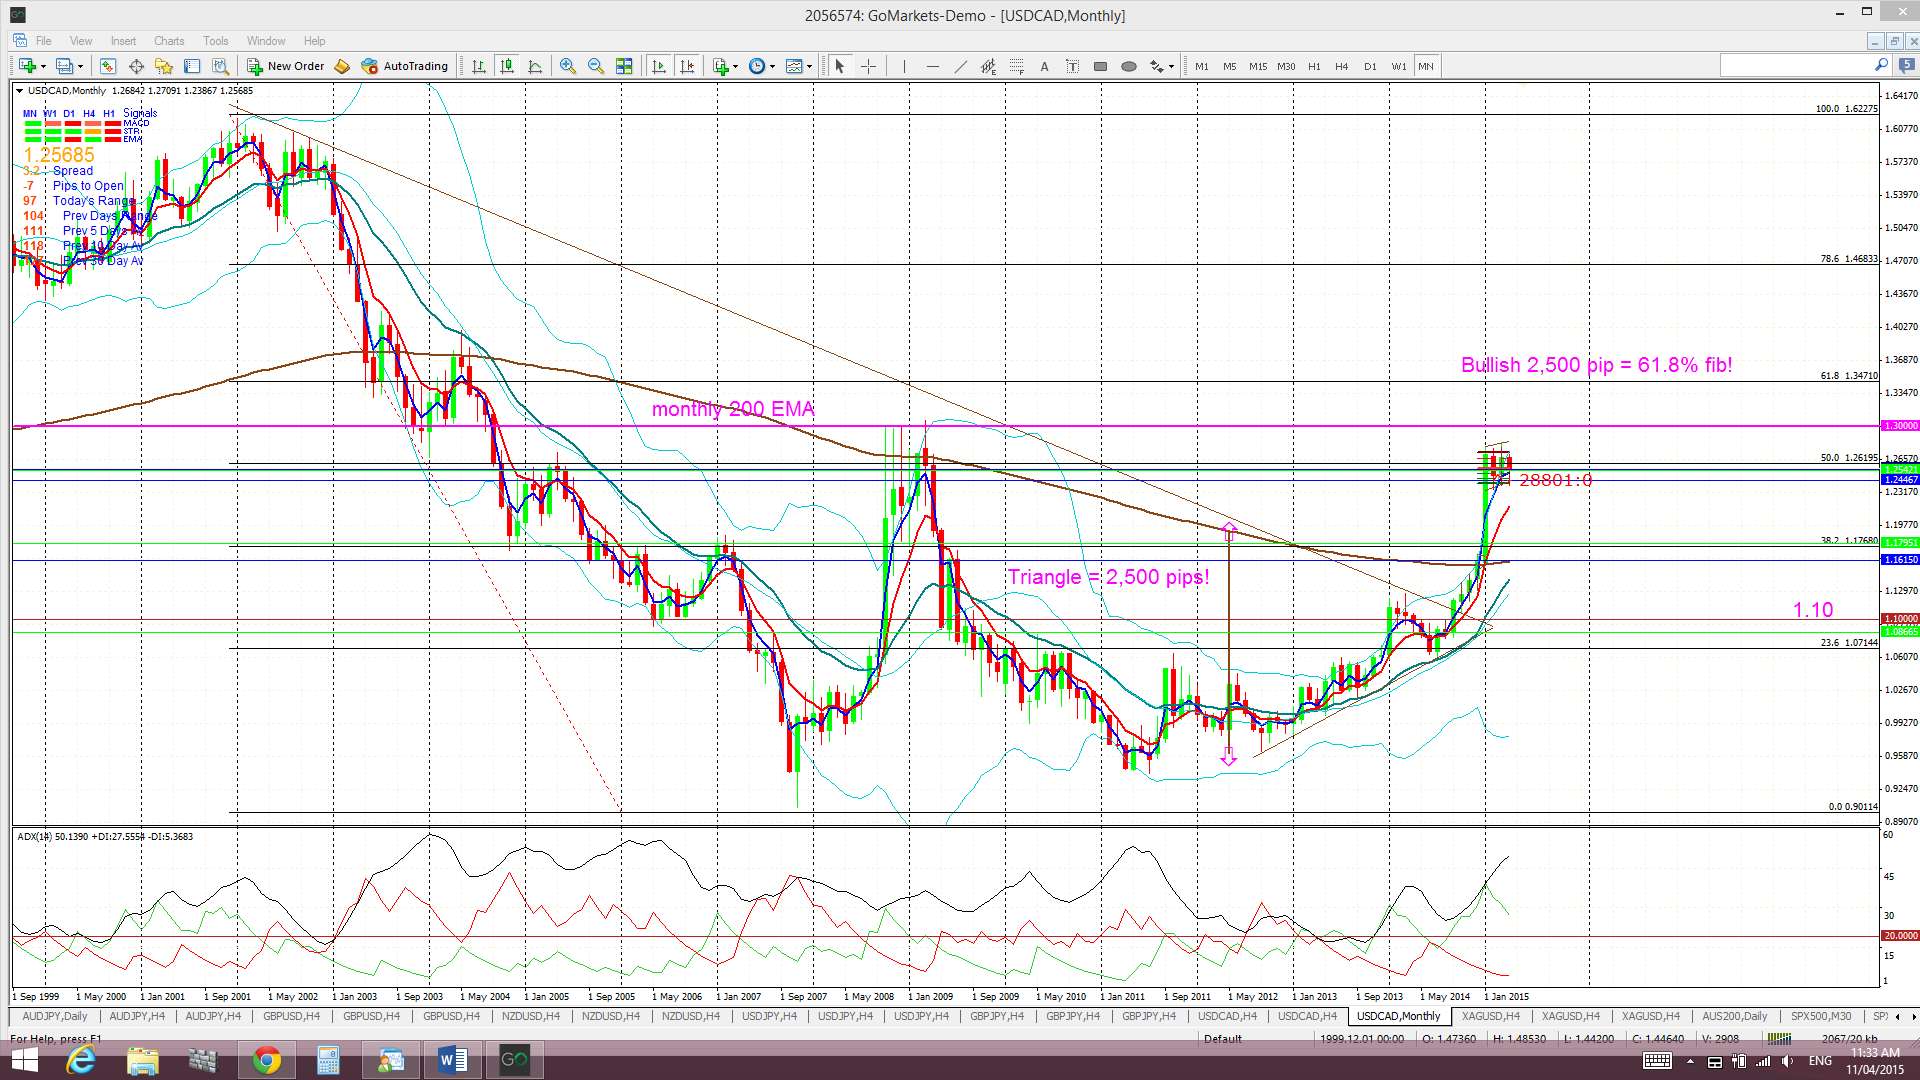
Price continues holding above the monthly 200 EMA however and it is worth remembering that the last bullish monthly candle close above this level was back in February 2009, almost 6 years ago. This period also marks the longest bullish hold by the Loonie above the monthly Cloud since 2002! Note the possible bullish Cup ‘n’ Handle forming up on the monthly chart that is in addition to the bullish triangle breakout already in play.

Triangle breakout target: The Loonie has already broken up and out from a major monthly chart triangle pattern that could deliver up to 2,500 pips. This 2,500 pip figure is evaluated from the height of the triangle. I have used the triangle height from the beginning of the bull trend line, as shown in the monthly chart below. The height of the triangle is around 2,500 pips and, thus, this would be the expected move from any breakout action. Extrapolating a bullish move from this triangle places price up at the 61.8% fib level. These fibs levels are popular targets in retracement moves and so this adds some confluence to this as a possible target. The bullish move has given up to 1,600 pips so far.
Monthly Chart Cup ‘n’ Handle? The monthly chart now also shows a possible bullish Cup ‘n’ Handle pattern forming up. Price may yet rally up to the 1.30 level before any ‘Handle’ formation but recent choppy action might be helping form a ‘Handle’. This is worth keeping an eye on as the pattern would be worth about 3,000 pips if it was to evolve as this is the height of the ‘Cup’. The interesting point is that the target for this pattern would put price up at the highs reached back in 2002 and this is equal to a 100% Fib retracement of the 2002-2007 bear move. Confluence!
Price is now trading in the Cloud on the 4hr chart but above on the daily (only just), weekly and monthly charts.
The weekly candle closed as a bullish candle.
- I’m watching for any new TC signal on this pair and the trading channel trend lines.

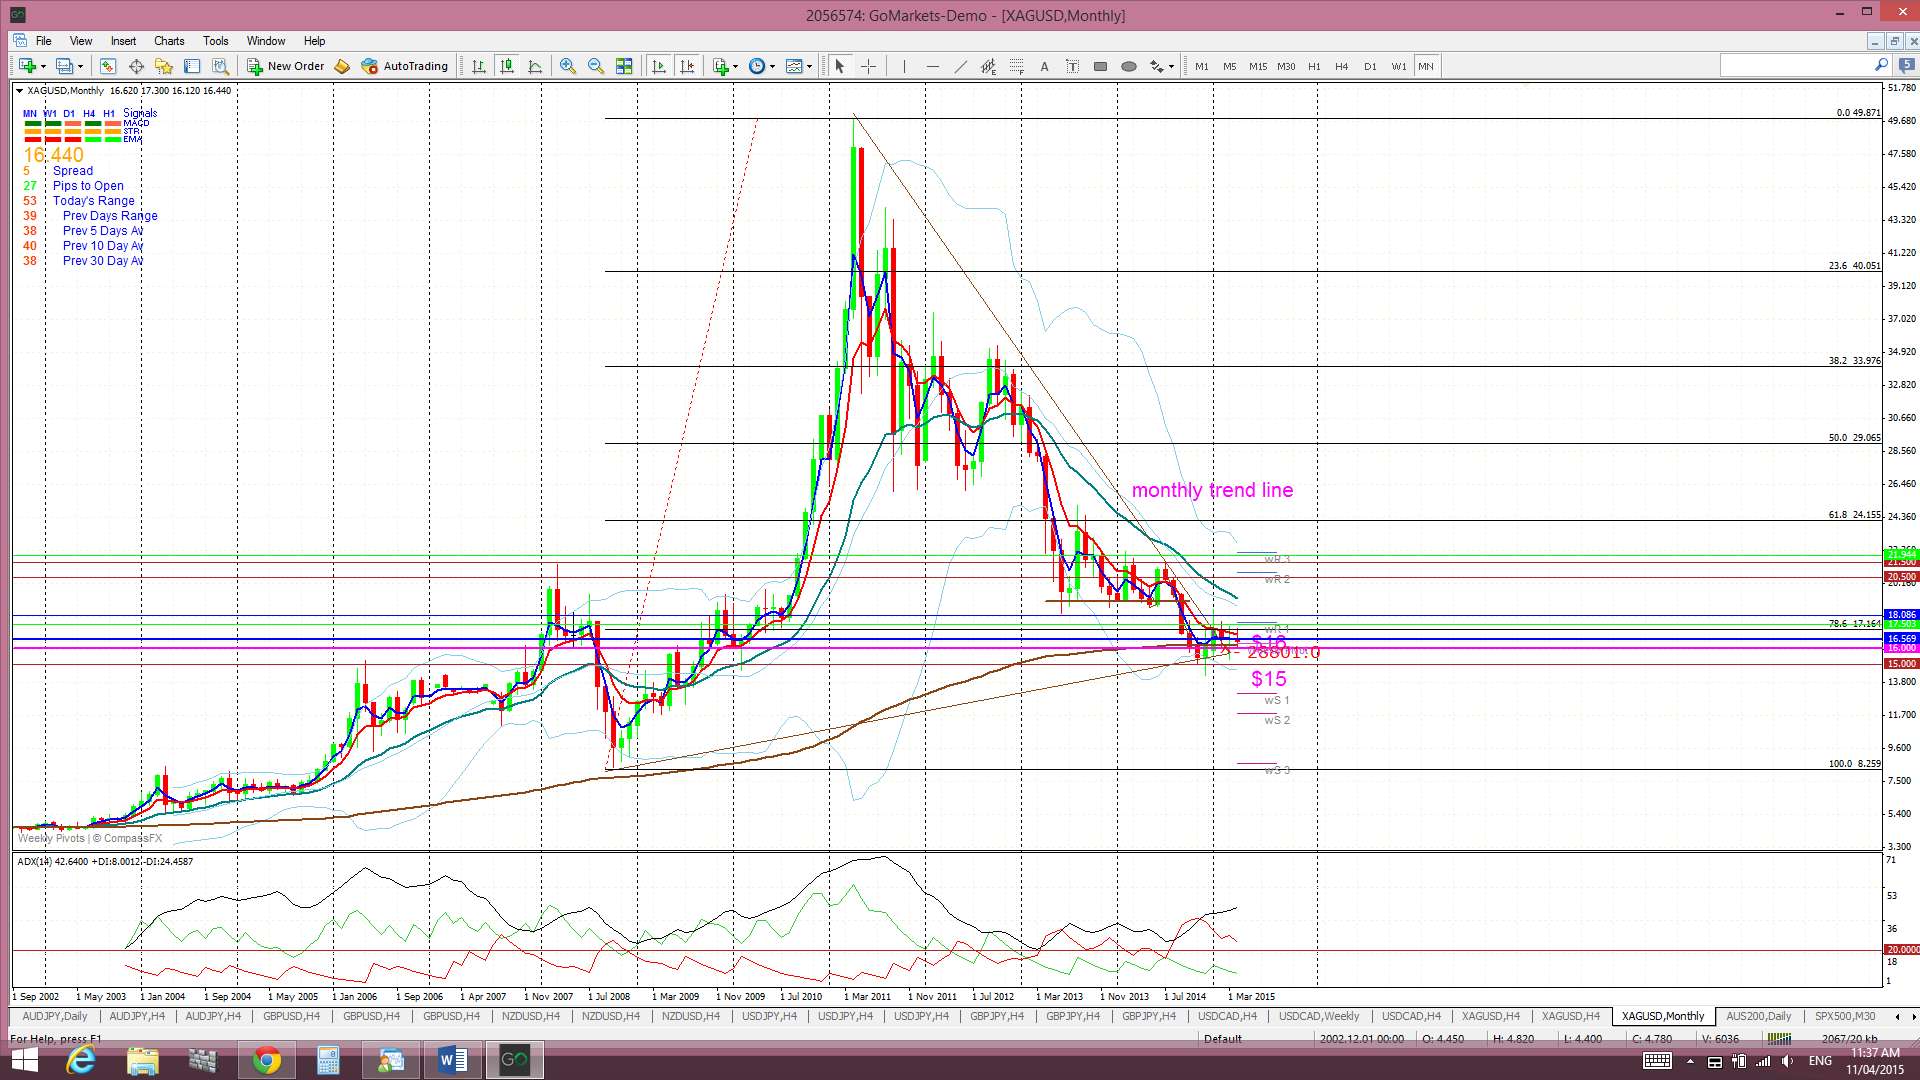
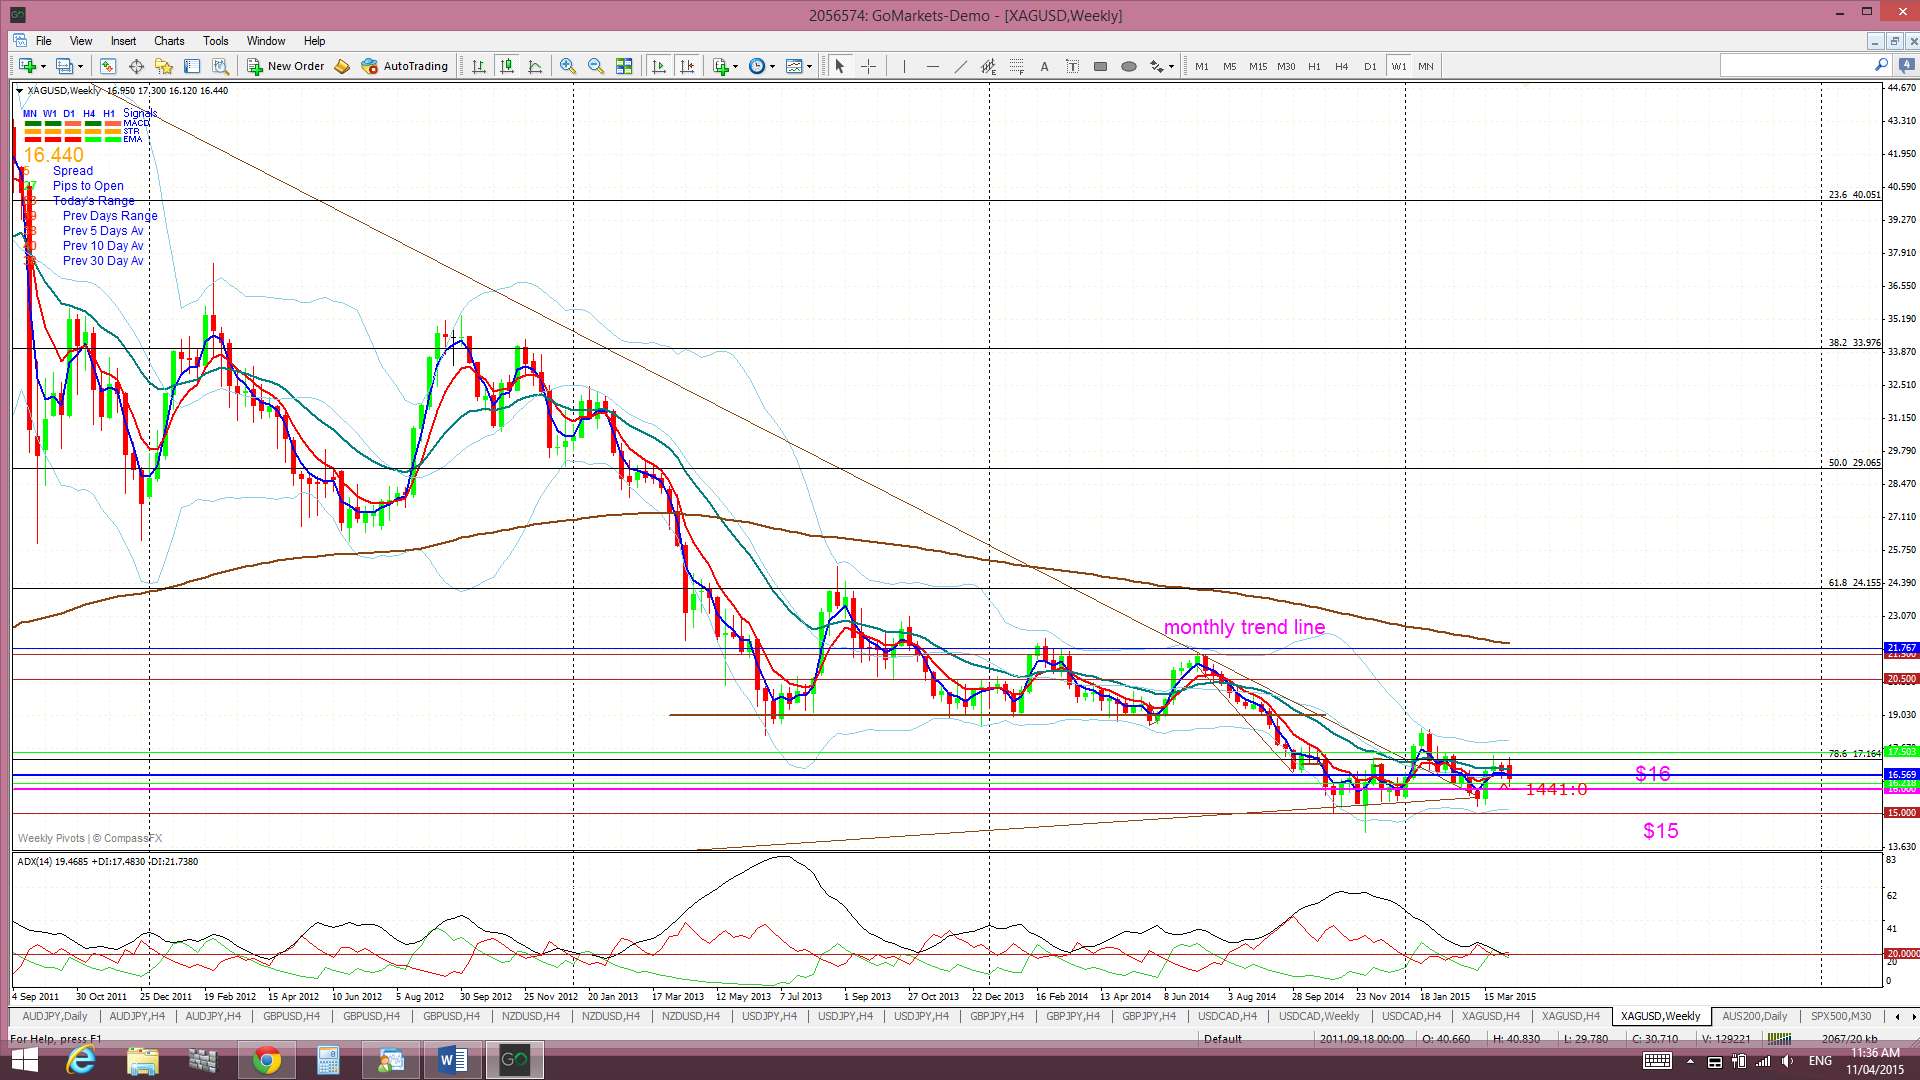
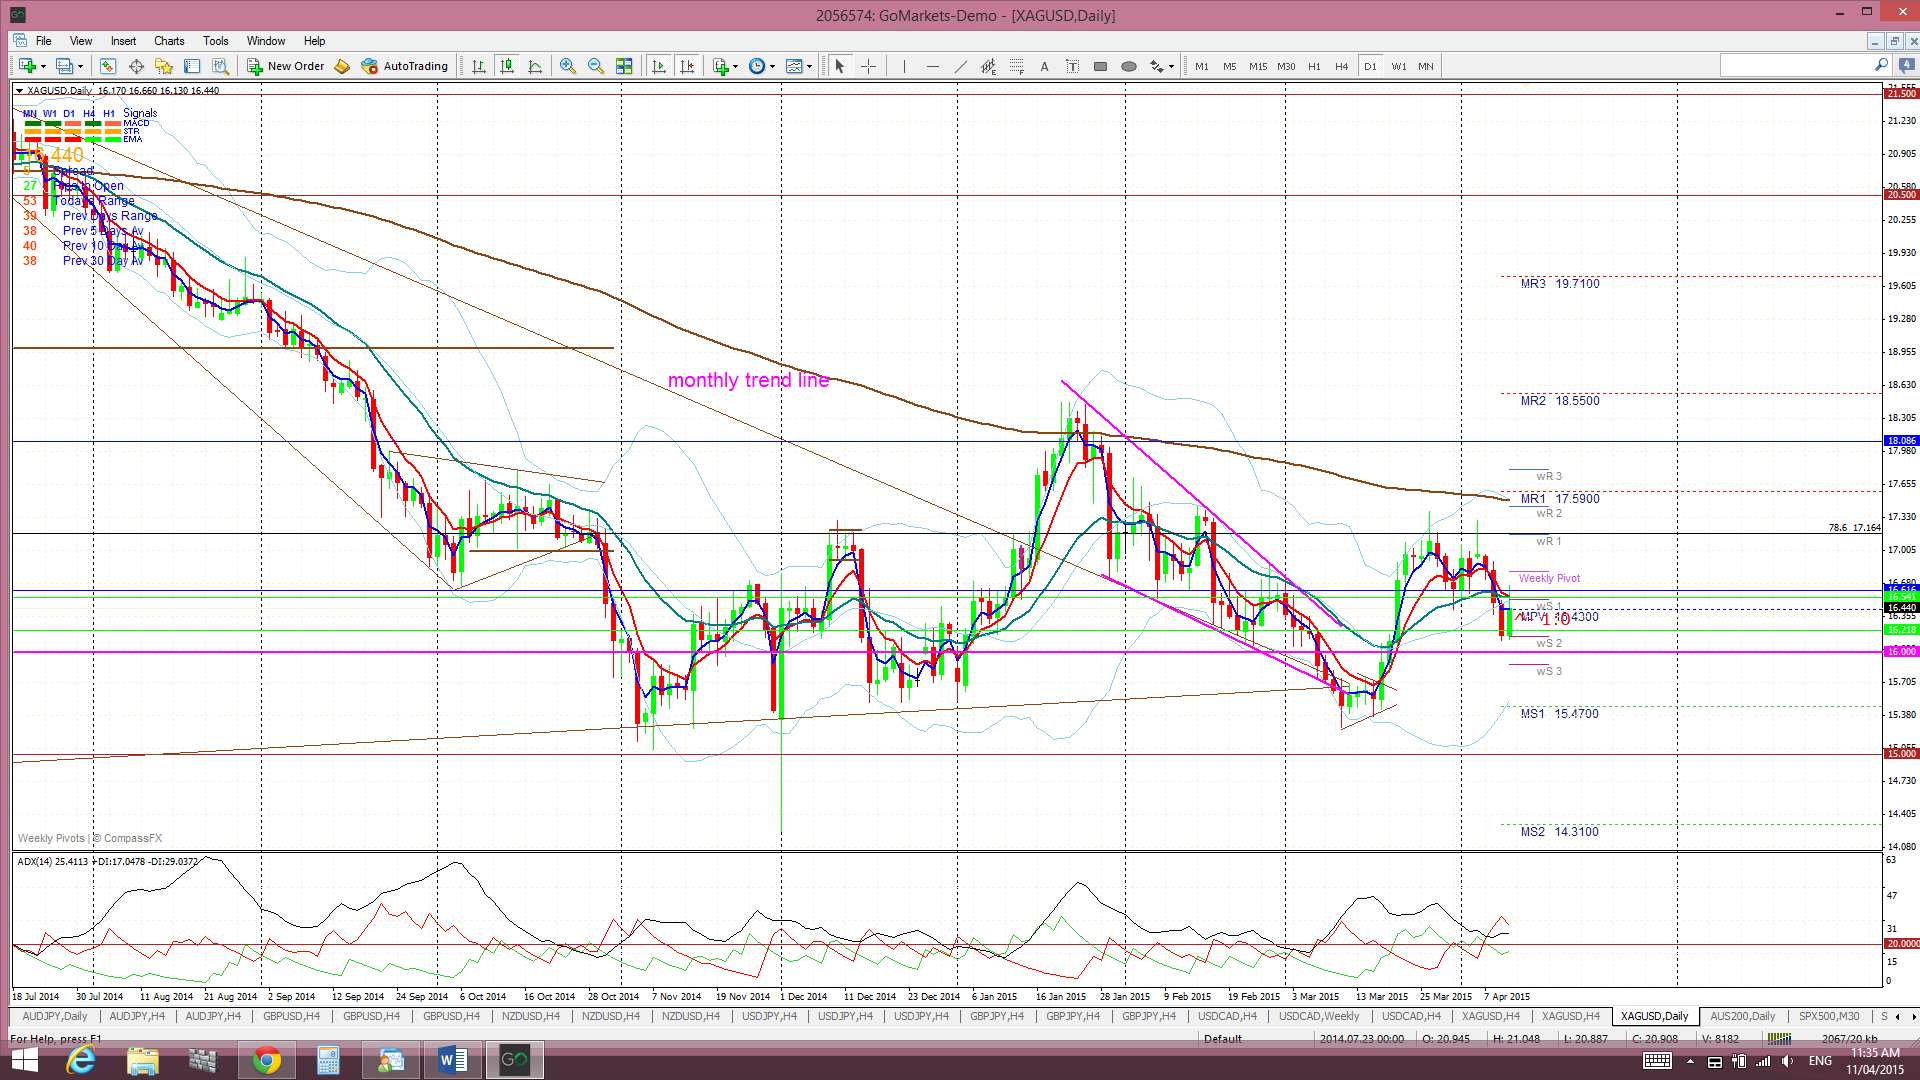
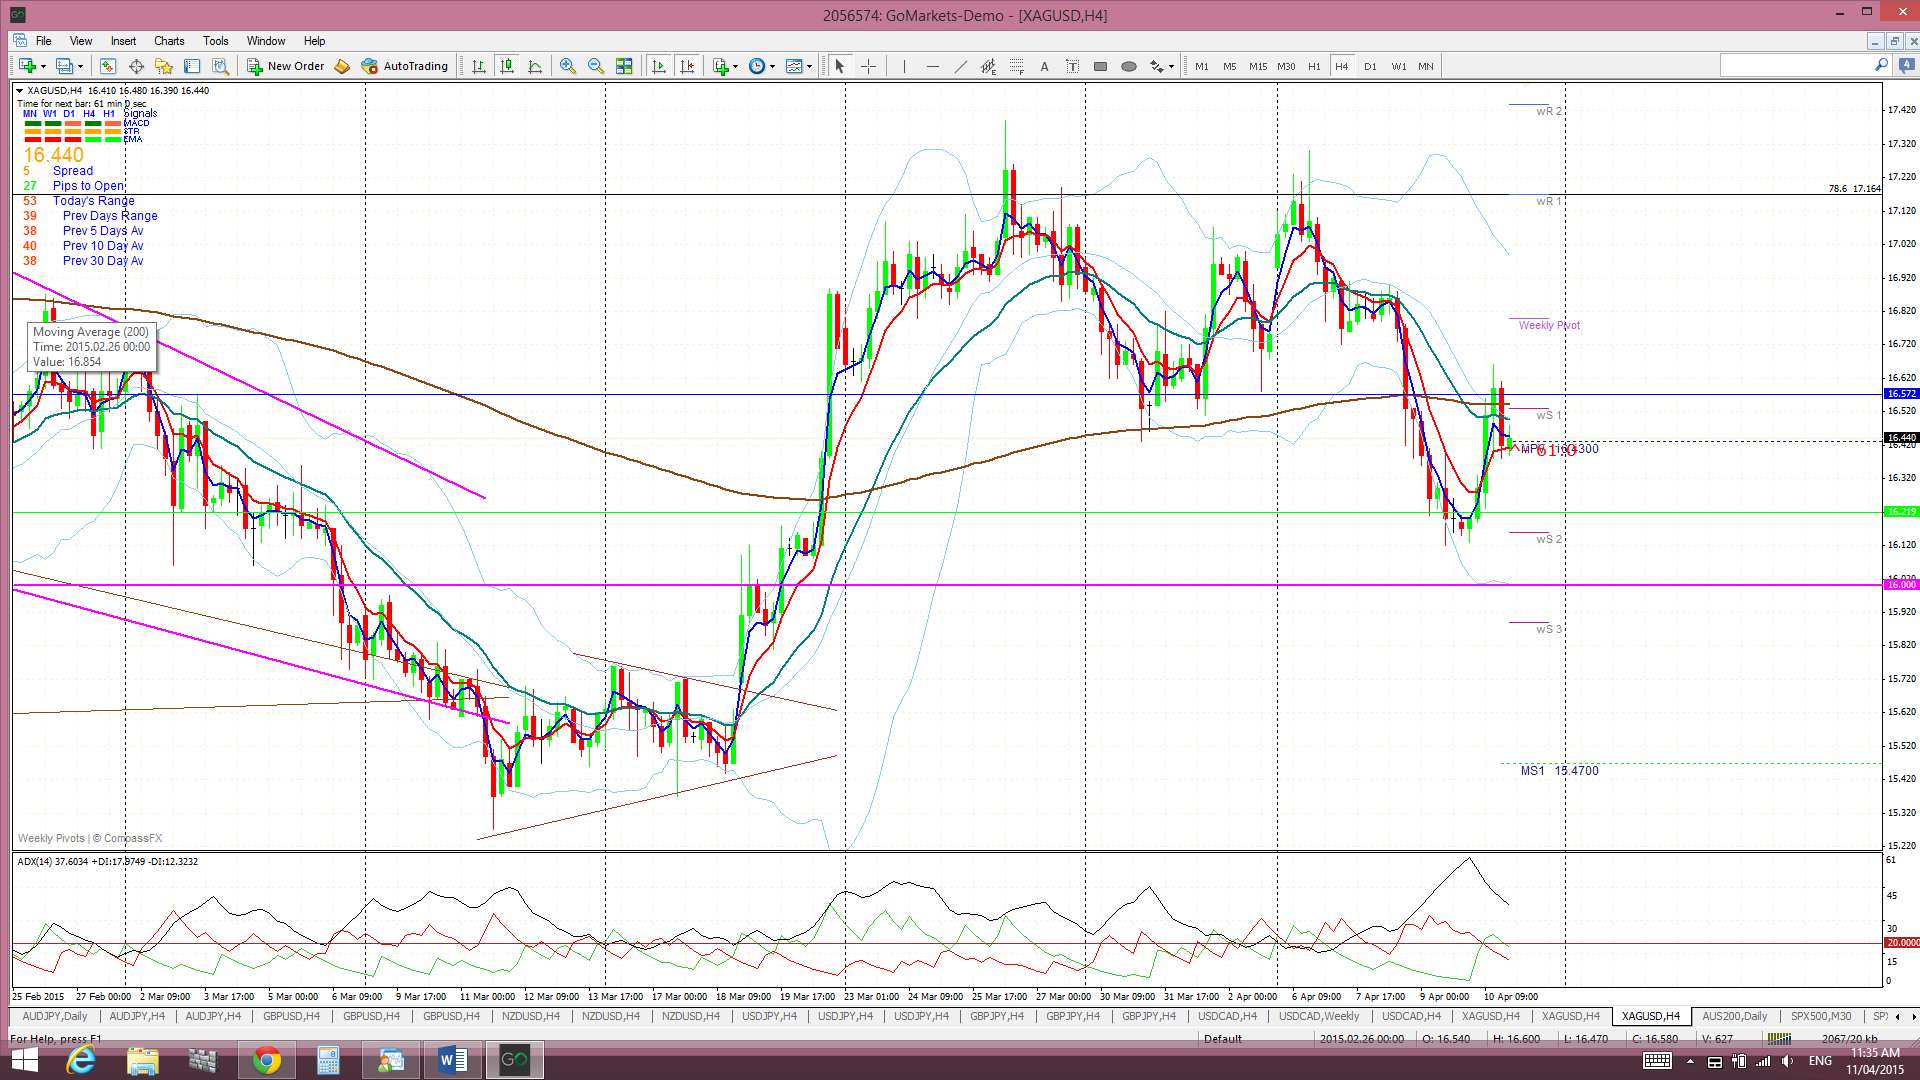
Silver: Silver was a victim of US$ strength last week and fell back towards $16 support.
Silver is back trading below the Ichimoku Cloud on the 4hr daily, weekly and monthly charts which is a bearish shift.
The weekly candle closed as a bearish candle.
- I’m watching for any new TC signal and the $16 level.
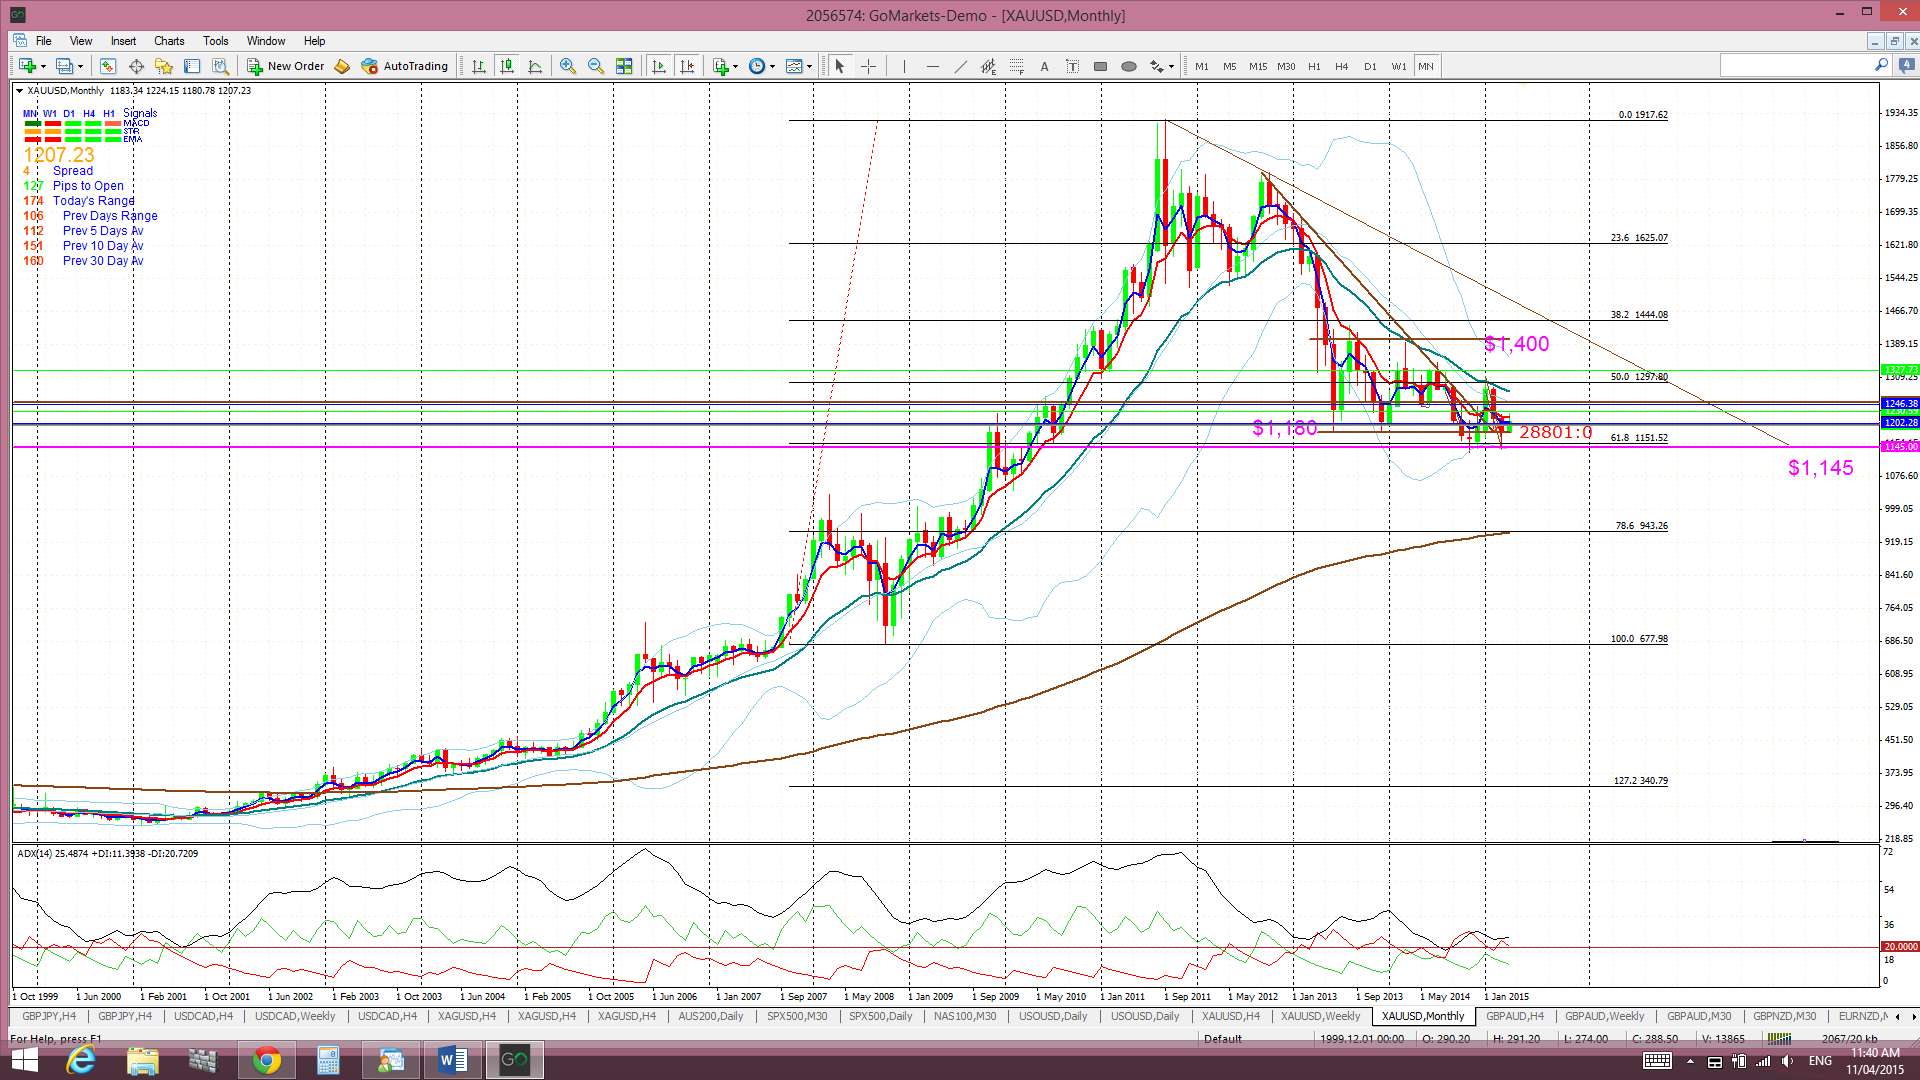
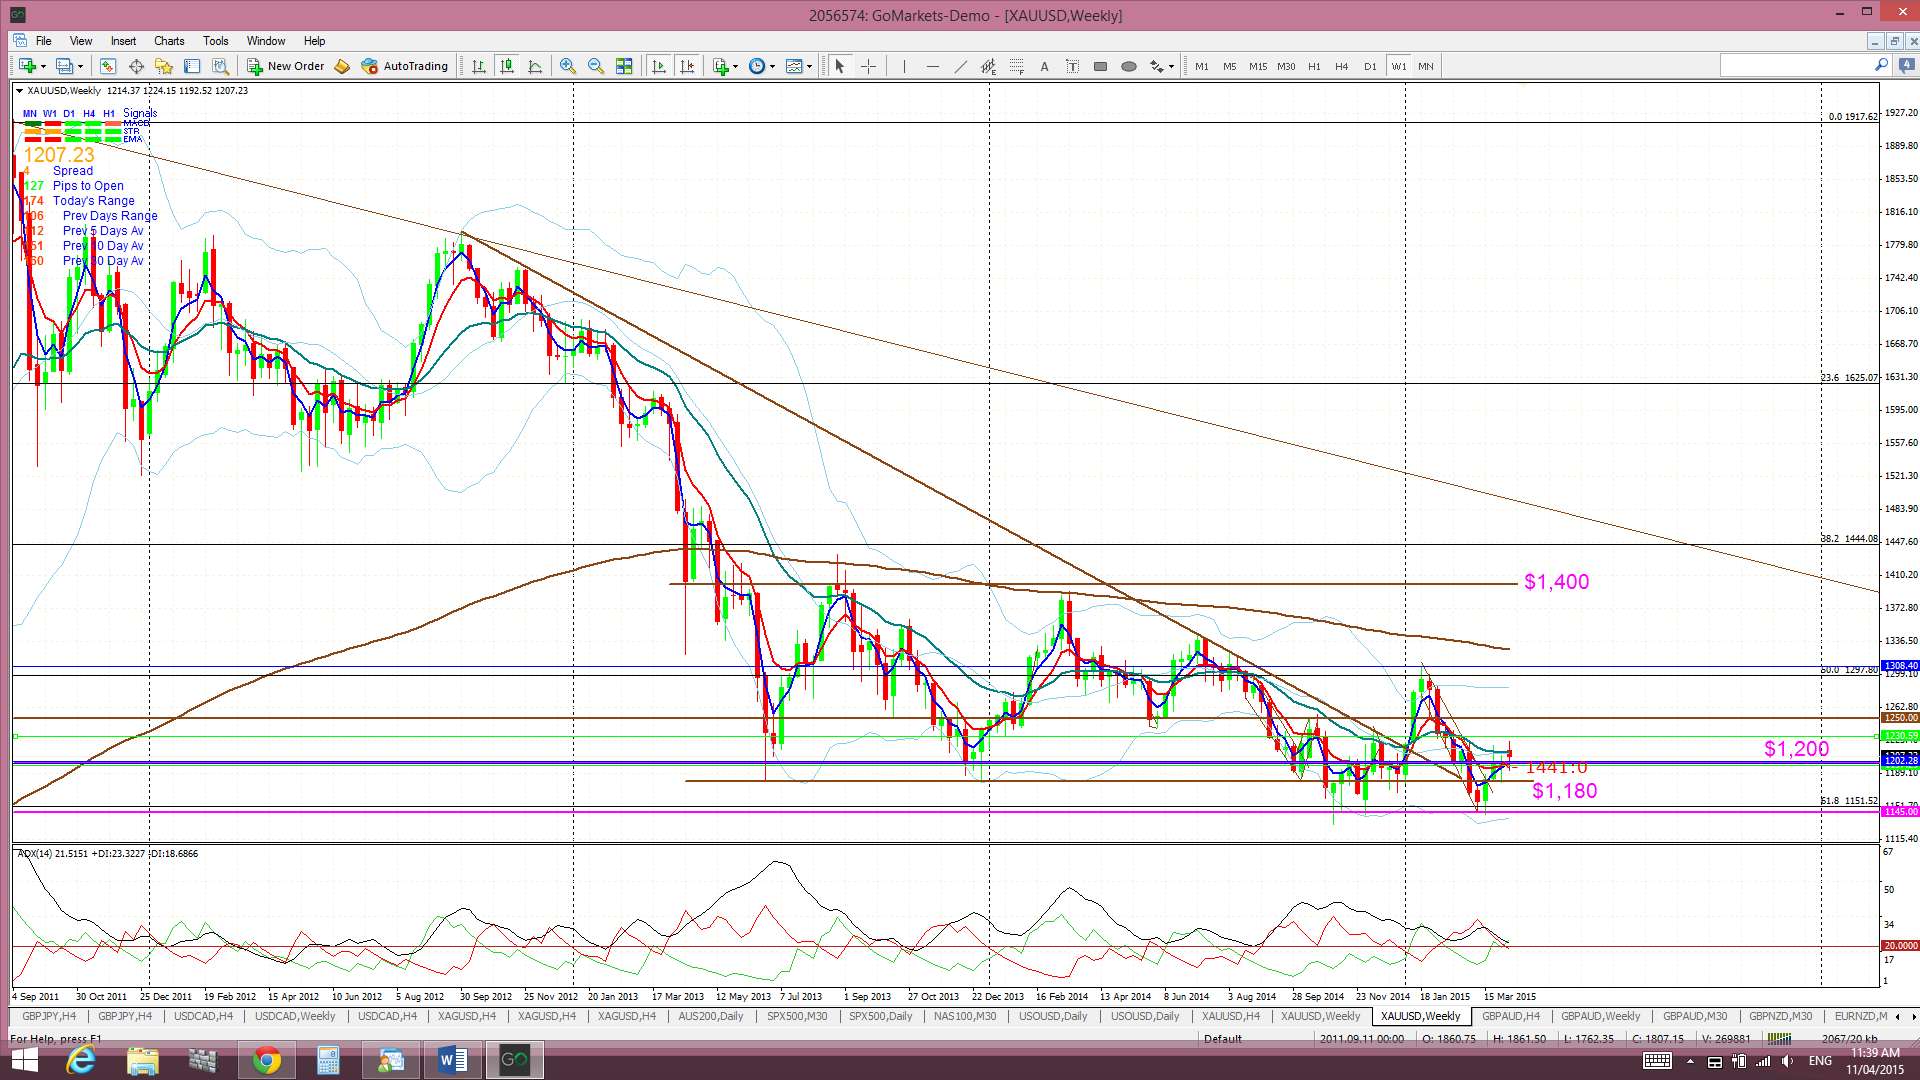
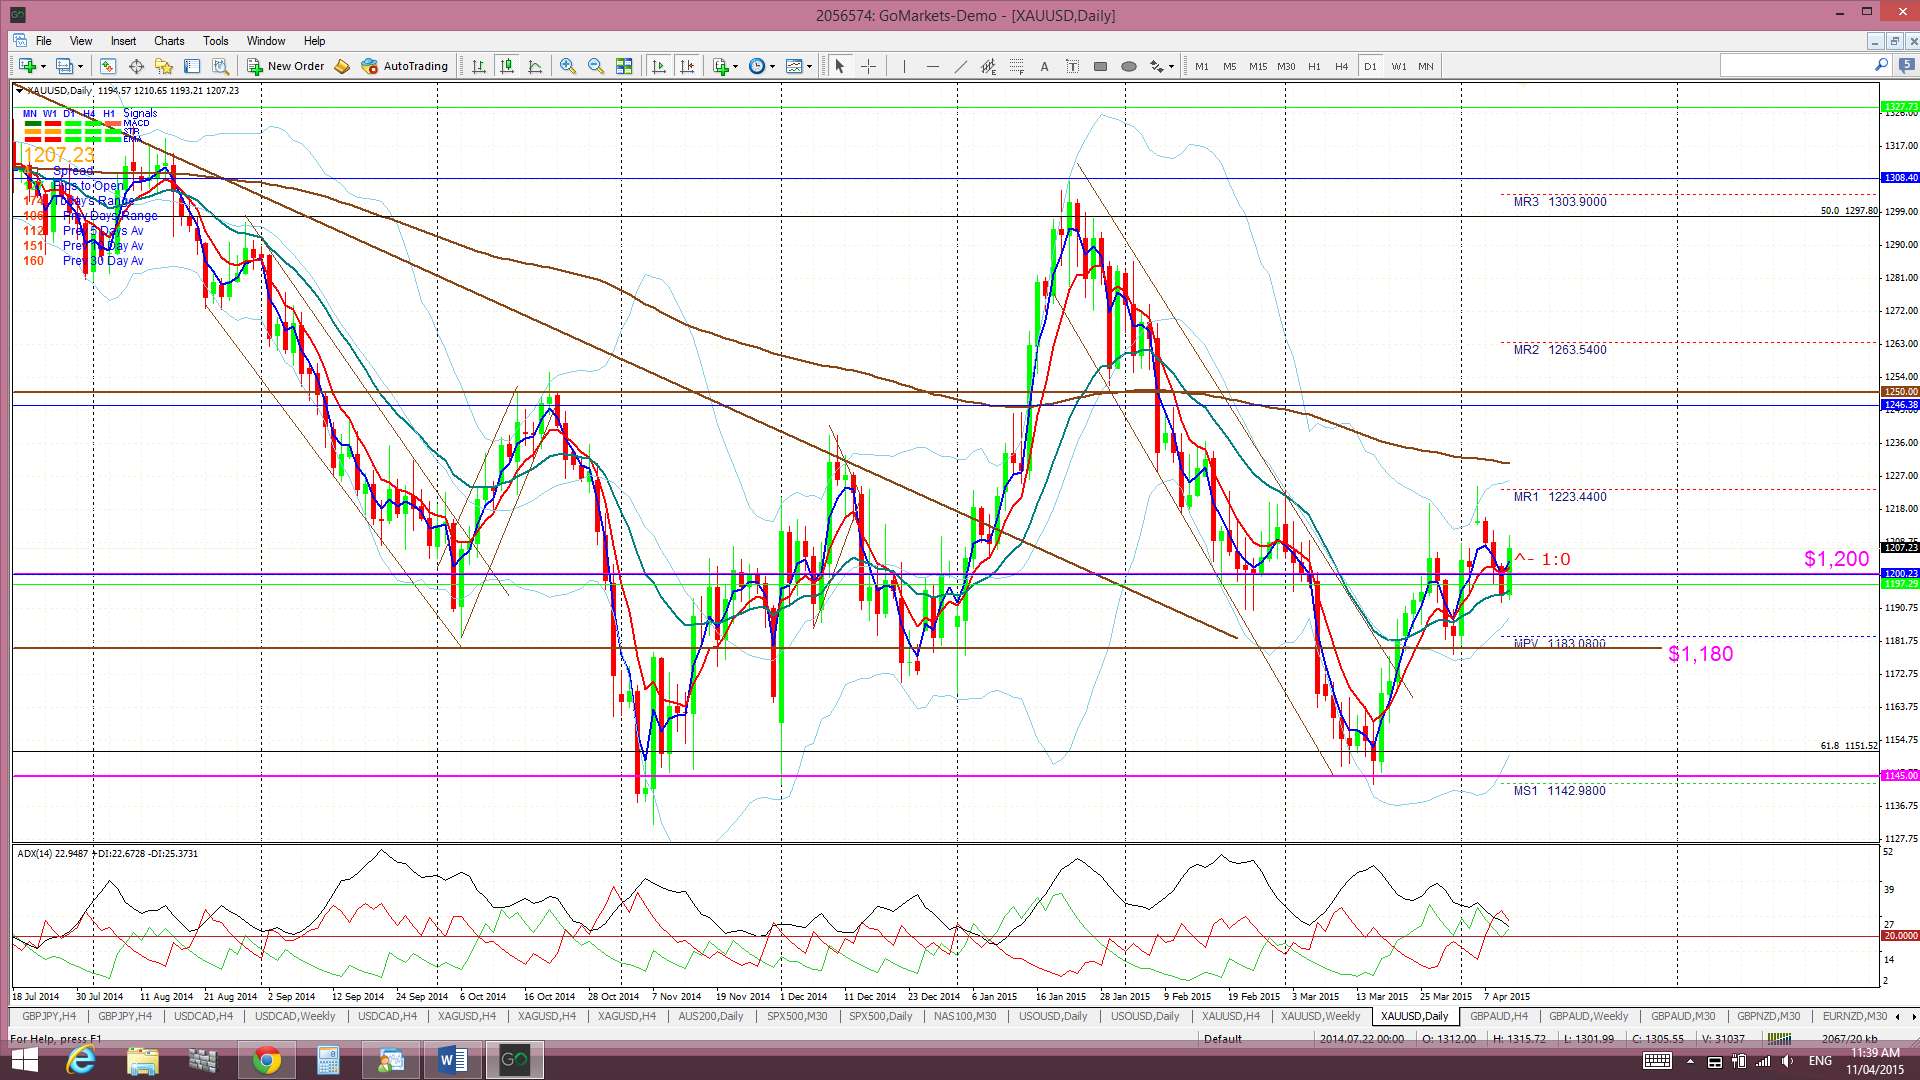
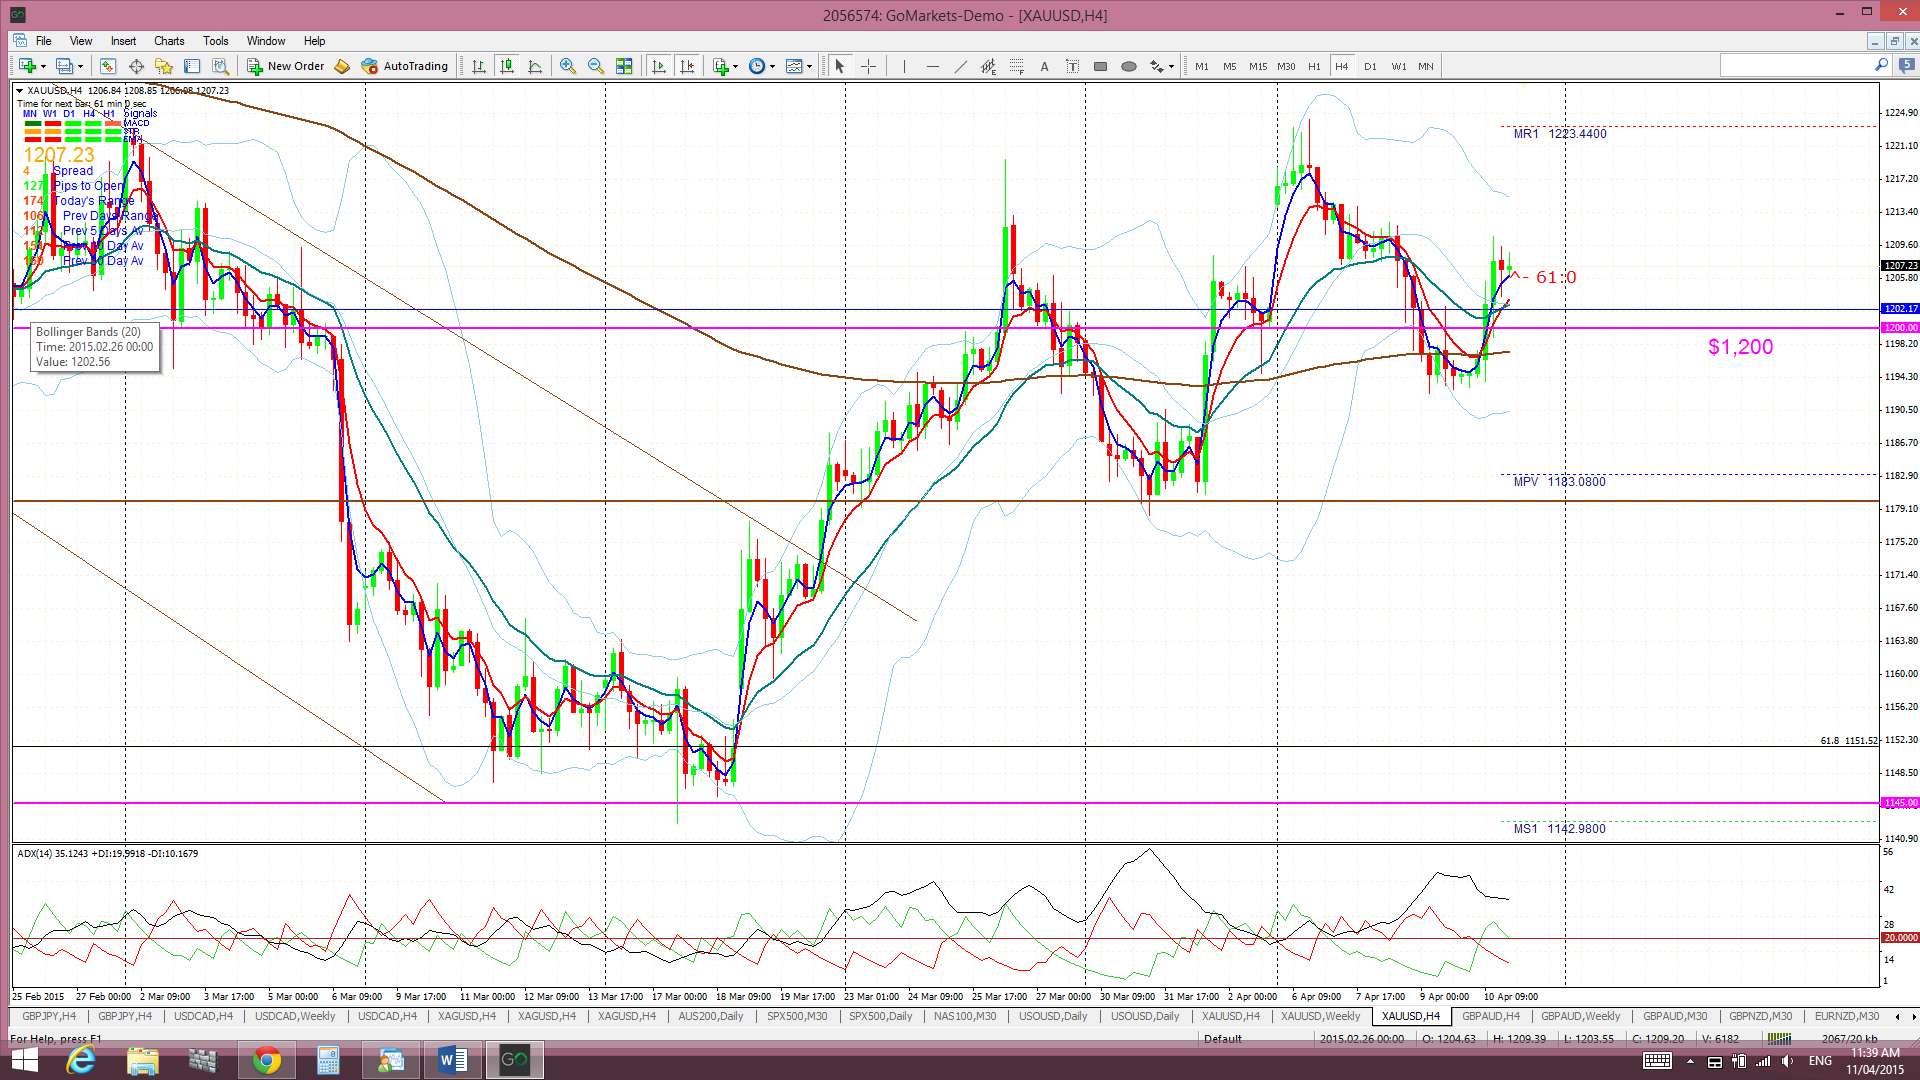
Gold: Gold was also a victim of US$ strength and fell below $1,200 support.
It continues to hold above the 61.8% Fib retracement of the 2008-2011 bull run that is near $1,145 though.
Any new break and hold below $1,145 would suggest a deeper pull back. Bearish targets below $1,145 include the $1,000 psychological level and, then, the 78.6% fib near $950.
Gold is trading above the Ichimoku Cloud on the 4hr chart but below the Cloud on the daily, weekly and monthly charts.
The weekly candle closed as a bearish coloured ‘Spinning Top’ candle.
- I’m watching for any new TC signal and the $1,200 level.
The post US$ and global stock indices higher. appeared first on www.forextell.com.