Last week: Some TC trend signals off 4hr charts emerged last week and I’m wondering if this is a sign that things might be about to turn. There were three signals that all produced some pips: NZD/USD for just 70, EUR/USD for 120 and the GBP/JPY for 300 before reversing.
Next week:
The US$ got a boost last week with the US Federal Reserve Chair, Janet Yellen, giving less dovish than expected commentary when she stated that a US rate hike could be expected this year. Friday’s upbeat US GDP added support to this case but, rather surprisingly, the US$ pulled back to close lower for the day and the EUR index rallied to end up closing positive for the week! This must have US$ bulls at least perplexed, if not worried, ahead of next week’s NFP and they will be looking for a strong result there to continue to support the US$. Regardless of these price gyrations, both the US$ and EURX indices continue consolidating within weekly chart triangle patterns that have persisted for over 6 months and…… somethings gotta give soon. An update on the FX Indices can be found through this link.
There is a lot of high impact data next week with quite a few US Federal Reserve member speeches and with Thursday bringing the larger, and more credible, Chinese Manufacturing PMI before the highlight event of the week with US NFP on Friday. Janet Yellen has flagged jobs growth as an important consideration in any rate-hike decision and so this data might help define the next move for the US$ and, as a consequence, for many related pairs.
Gold & Silver: Gold has managed to close above $1,145 support and Silver above $15 support in fairly bullish moves despite US$ strength. Both metals continue to trade in bullish-reversal descending wedge patterns despite many traders having a bearish outlook for the them. At least we have trend lines to monitor here for any breakout, bullish or bearish, as both metals edge closer towards the apex of their developing wedge patterns.
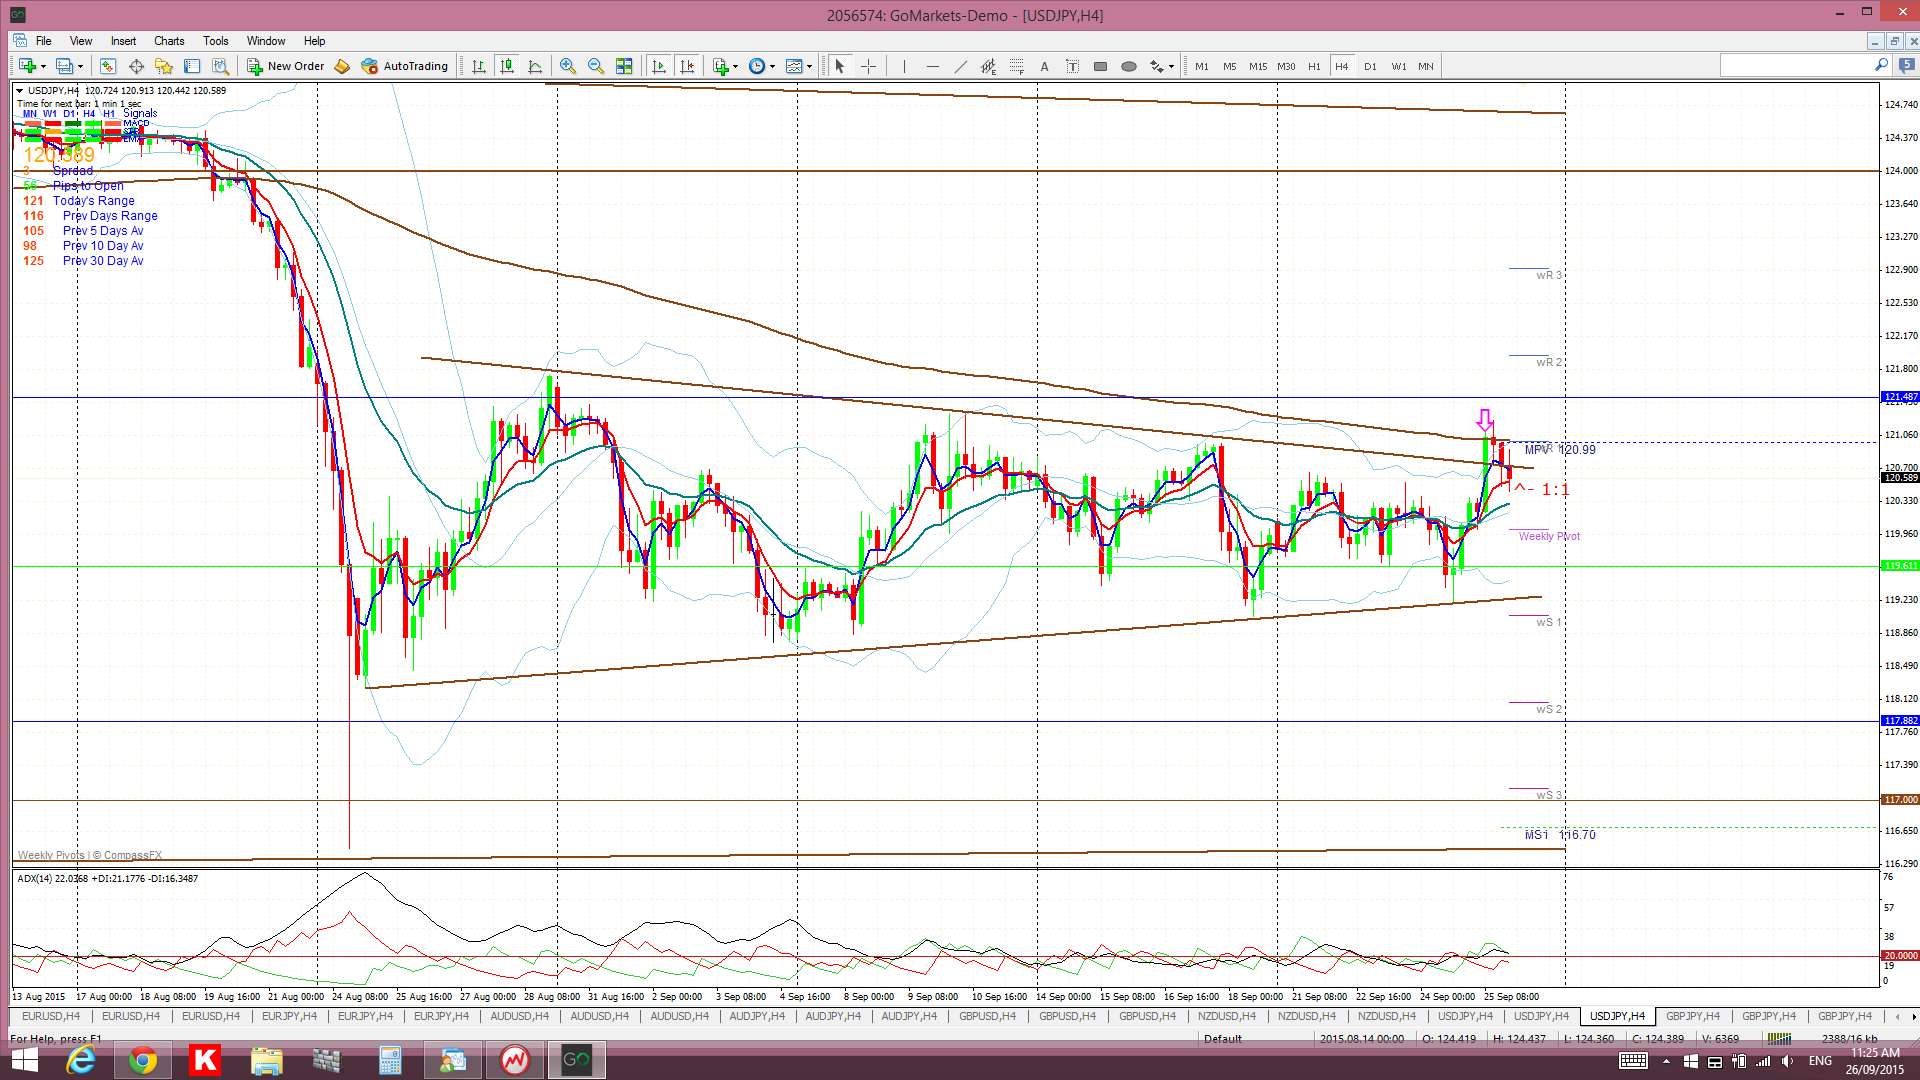
USD/JPY: this looked to make a bullish triangle breakout on Friday but the move had faded by the end of the US session. Was this just fatigue following its decent run during the late Asia/European session or, rather, the Yen strengthening with broader concern and stock market jitters?
GBP/NZD: the GBP weakend more than the NZD last week and this has resulted in a daily support trend line breakdown for the GBP/NZD. Watch to see if this imbalance continues at all and then helps to develop this triangle trade.
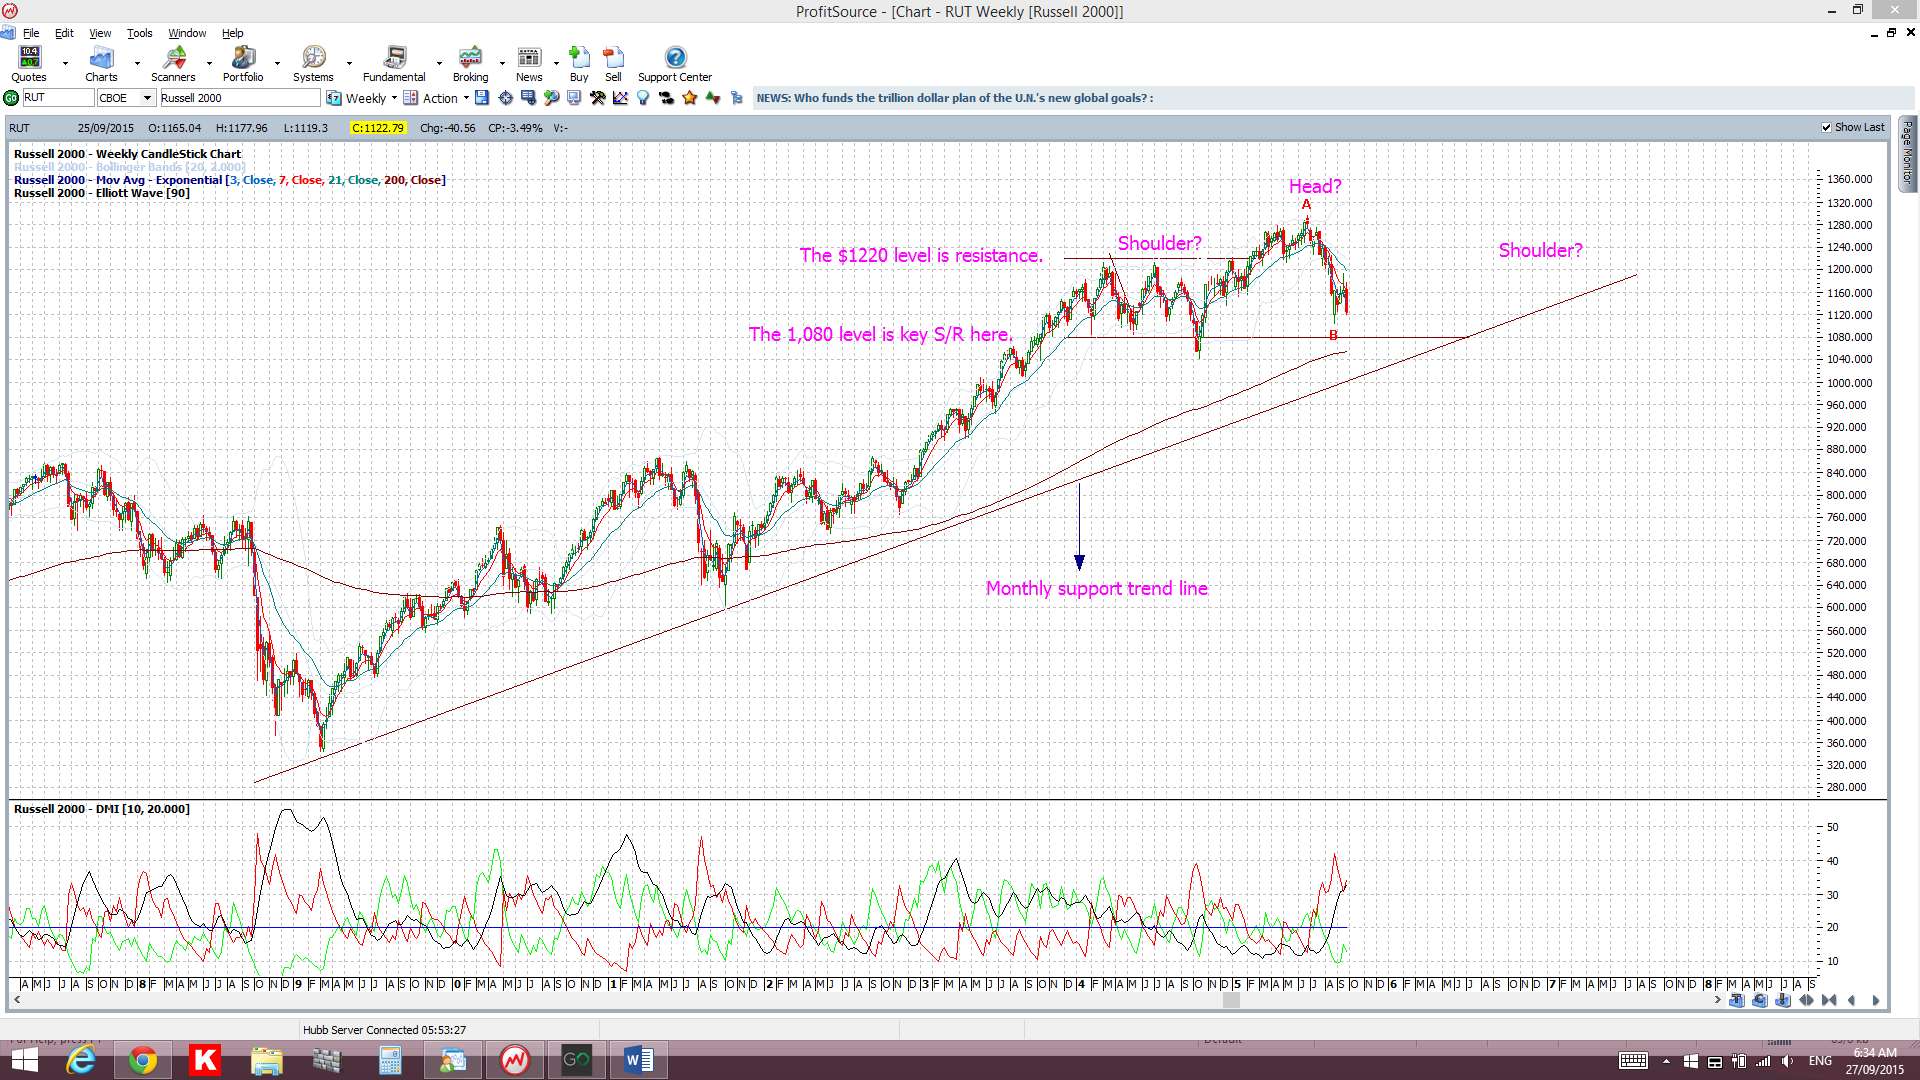
Russell 2000: Is the stock-equivalent of the ‘Canary in the Coal Mine’ starting to struggle?
Stocks and broader market sentiment:
Global stock indices closed lower for the week with ongoing concern surrounding the timing of any US interest rate hike and this is keeping stock traders nervous. The S&P500, DJIA, NASDAQ, FTSE, DAX, TSX (Canada), Russell 2000 and the XJO (Aussie) were all lower last week and, in addition to this, the Russell 2000 is starting to look rather bearish. This is worth keeping an eye on as the RUT is considered the stock-equivalent of the ‘Canary in the Coal Mine’.
Recall: The S&P500 broke up through major 1,600 resistance in May 2013 following 13 years of consolidation and I have been looking for another test of this major breakout region ever since then. I have long stated that I won’t be confident of any potential bullish continuation until there is attest of this major region, as per the test back after the previous period of consolidation (Green shaded region below). My preferred scenario would be for markets to test 1,600 on the S&P500, for this level to hold and, then, for bullish continuation from there. I am wondering if this recent pullback might just offer up an opportunity to execute such a purge and test. A test of S&P500 1,600 would be very painful but, IMHO, it is the necessary medicine to underpin and sustain any viable bullish continuation. If this level is not tested in this current market fluctuation, then, I will be always watching over my shoulder and waiting for it to hit. This would not be at all pleasant and so I want it over and done with now.

Thus, I continue to watch out for further clues as to any new momentum move, long or short though! In particular I’m looking out for:
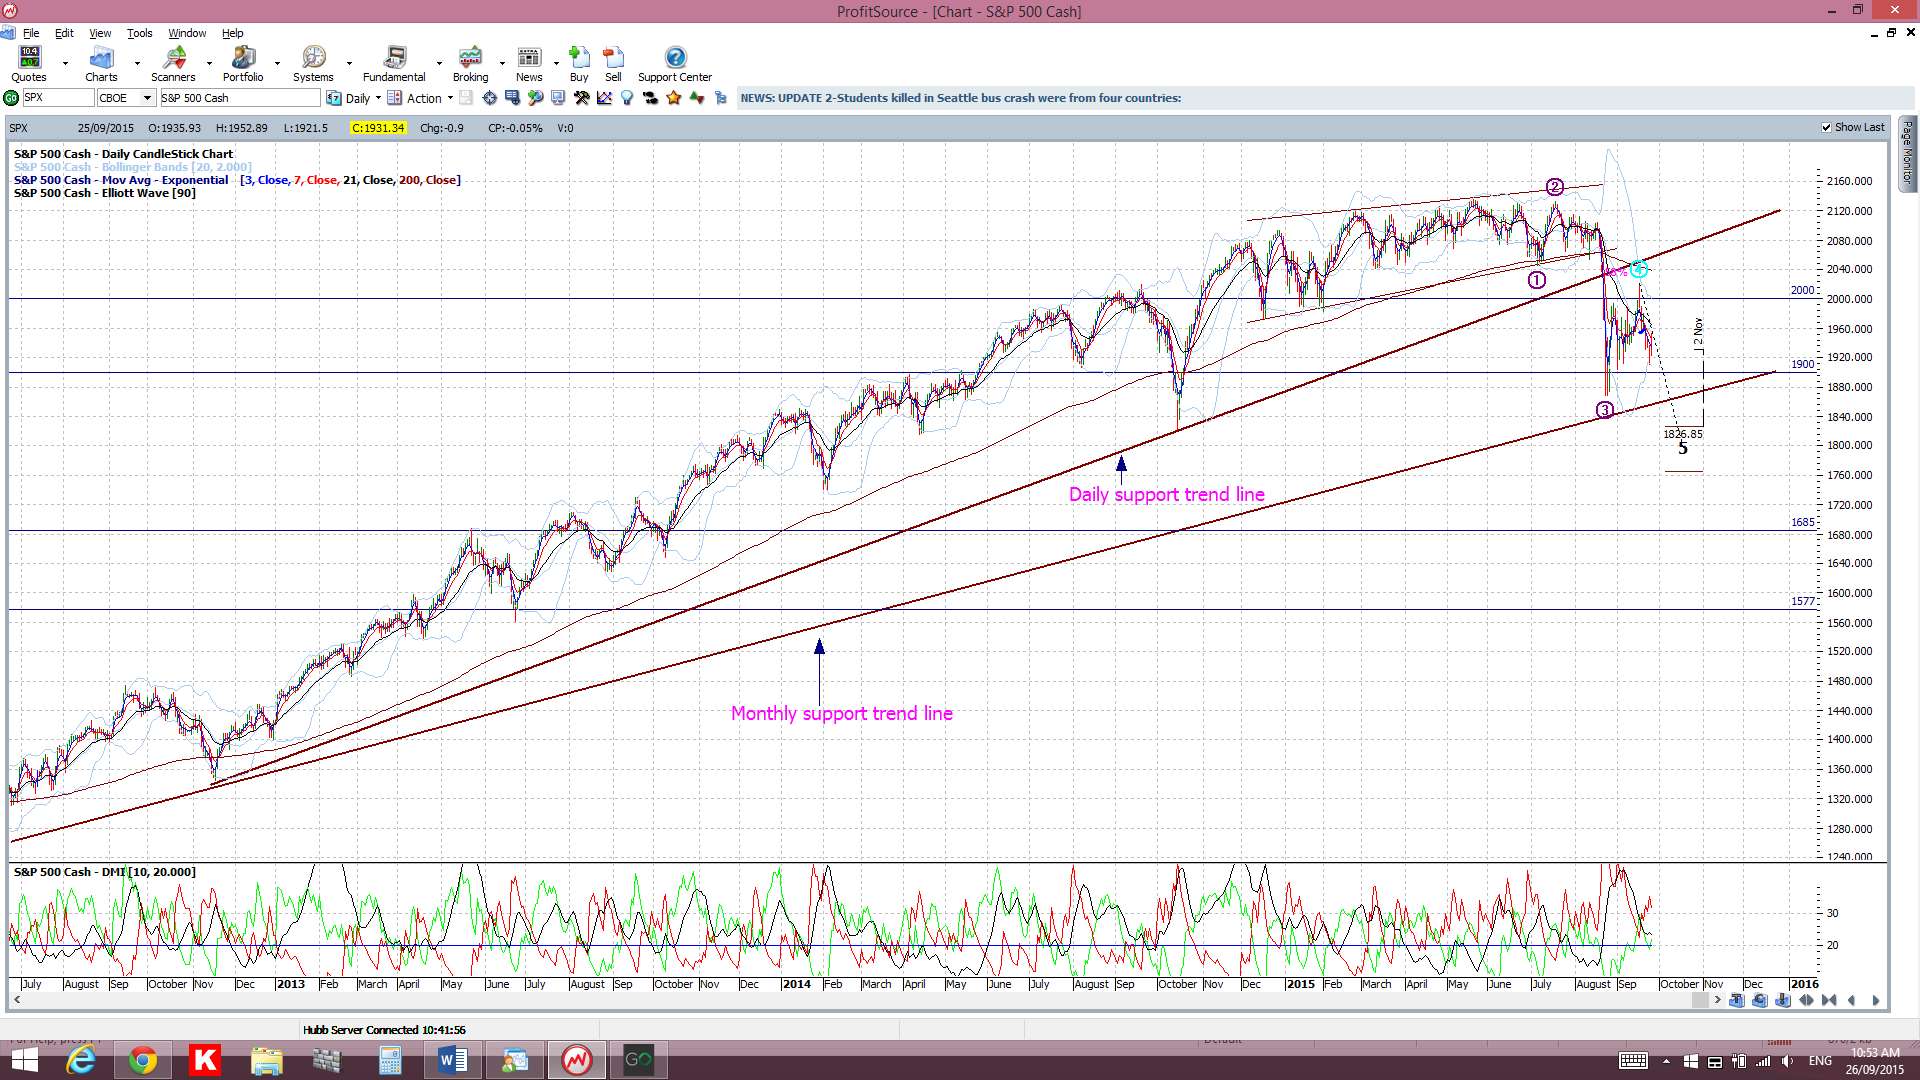
S&P500 daily chart: The index continues trading below the psychological 2,000 level and below daily trend line support but still holding above monthly support. However, I am looking for a deeper pullback to possibly test 1,600.
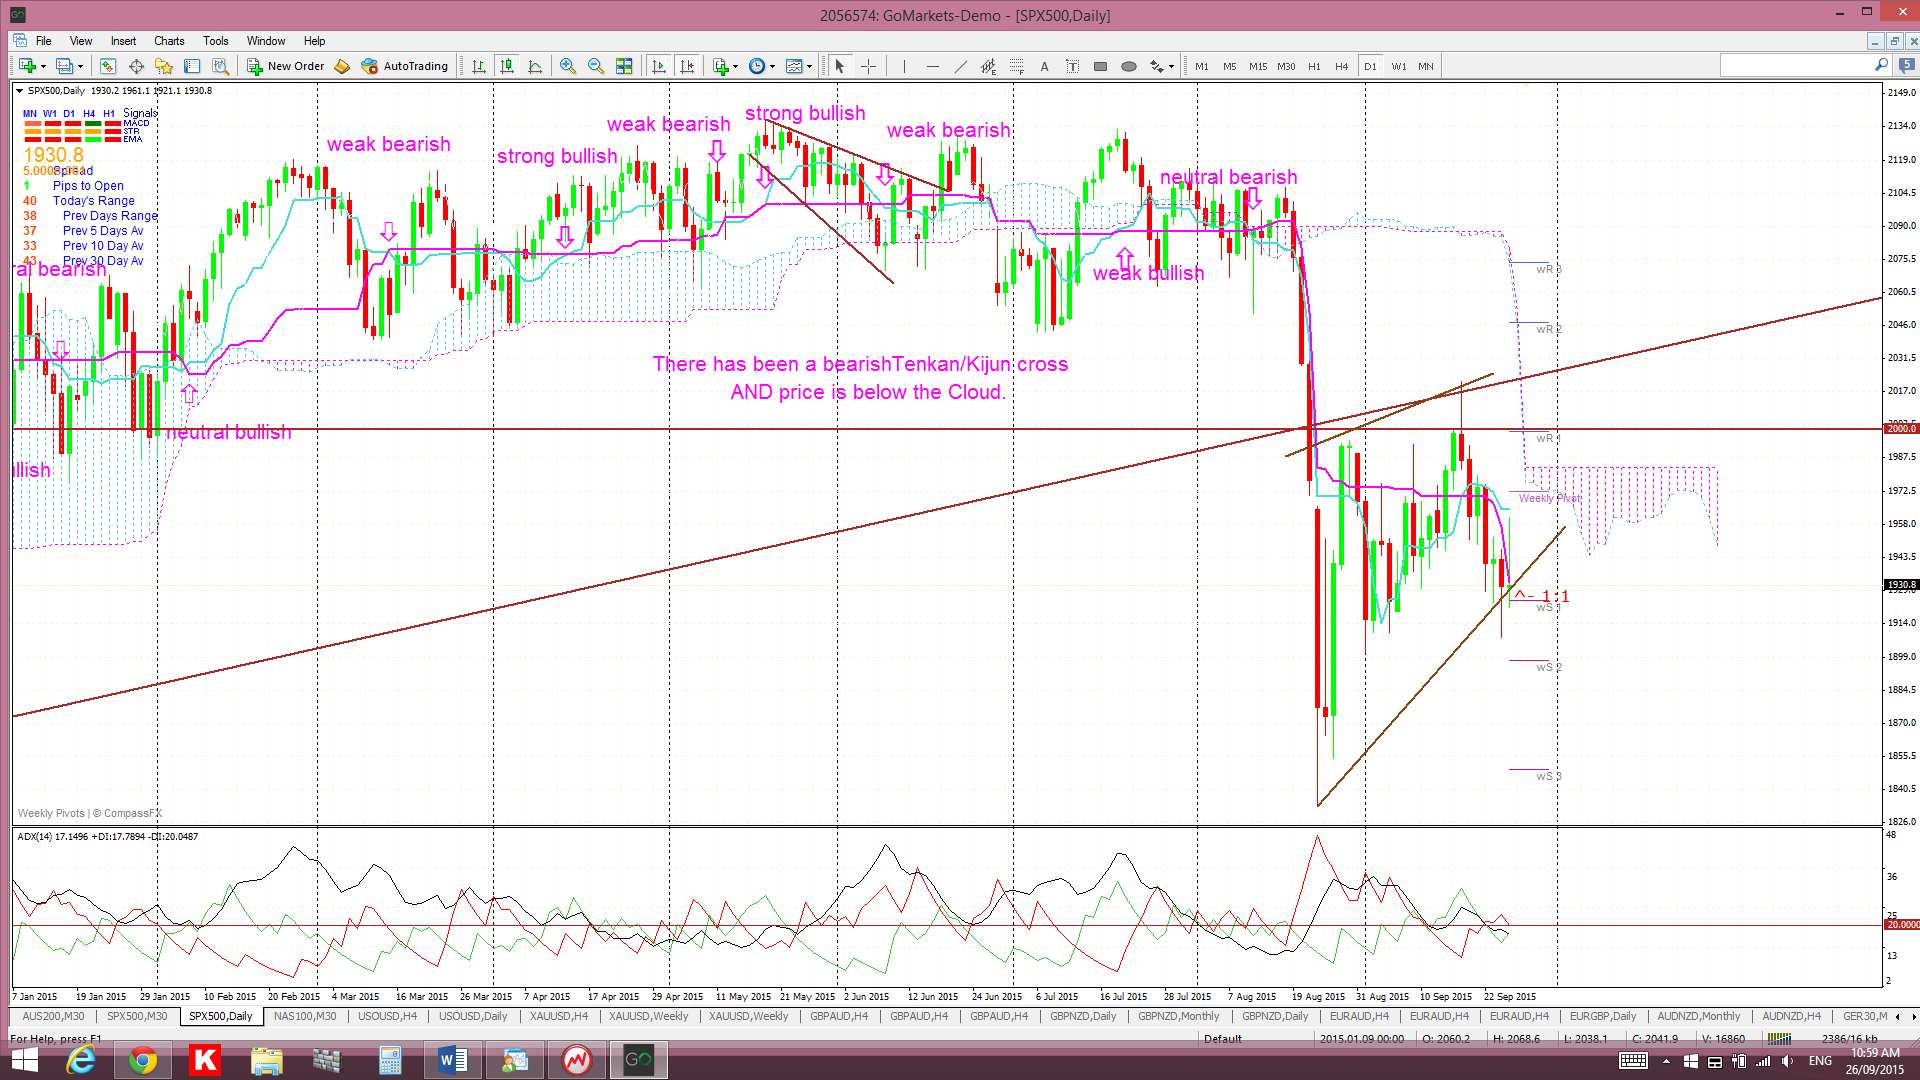
Ichimoku S&P500 daily chart: a clear cross of the blue Tenkan-sen line below the pink Kijun-sen line. The bearish Tenkan/Kijun cross remains open but as this evolved IN the Cloud it is deemed a ‘NEUTRAL’ signal. Price is still below the Cloud and still consolidating within a wedge below the key 2,000 level:
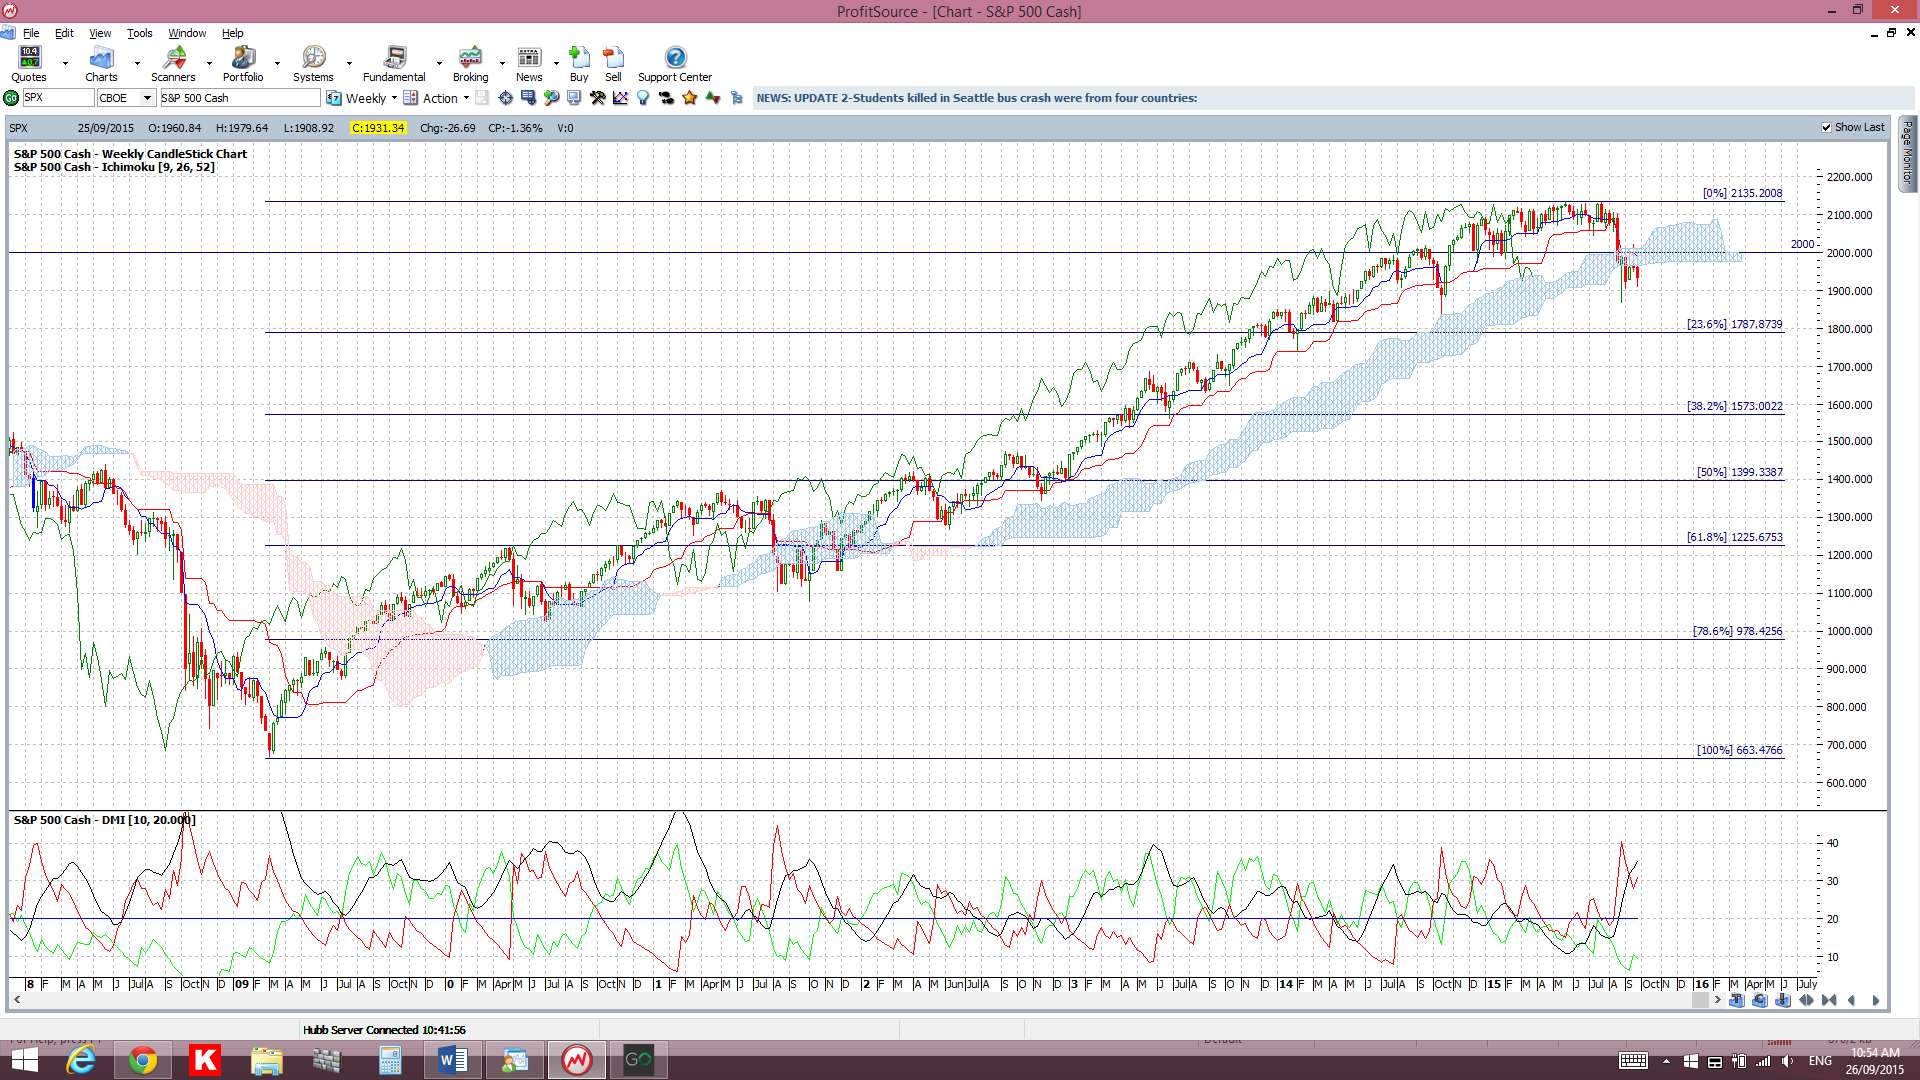
Ichimoku S&P500 weekly chart: the weekly candle closed as a bearish candle and below the weekly Cloud. This is a bearish development for sure BUT I would want to see a sustained bearish move below the Cloud to support bearish sentiment. Note how the weekly Cloud remains aligned along the key 2,000 level:
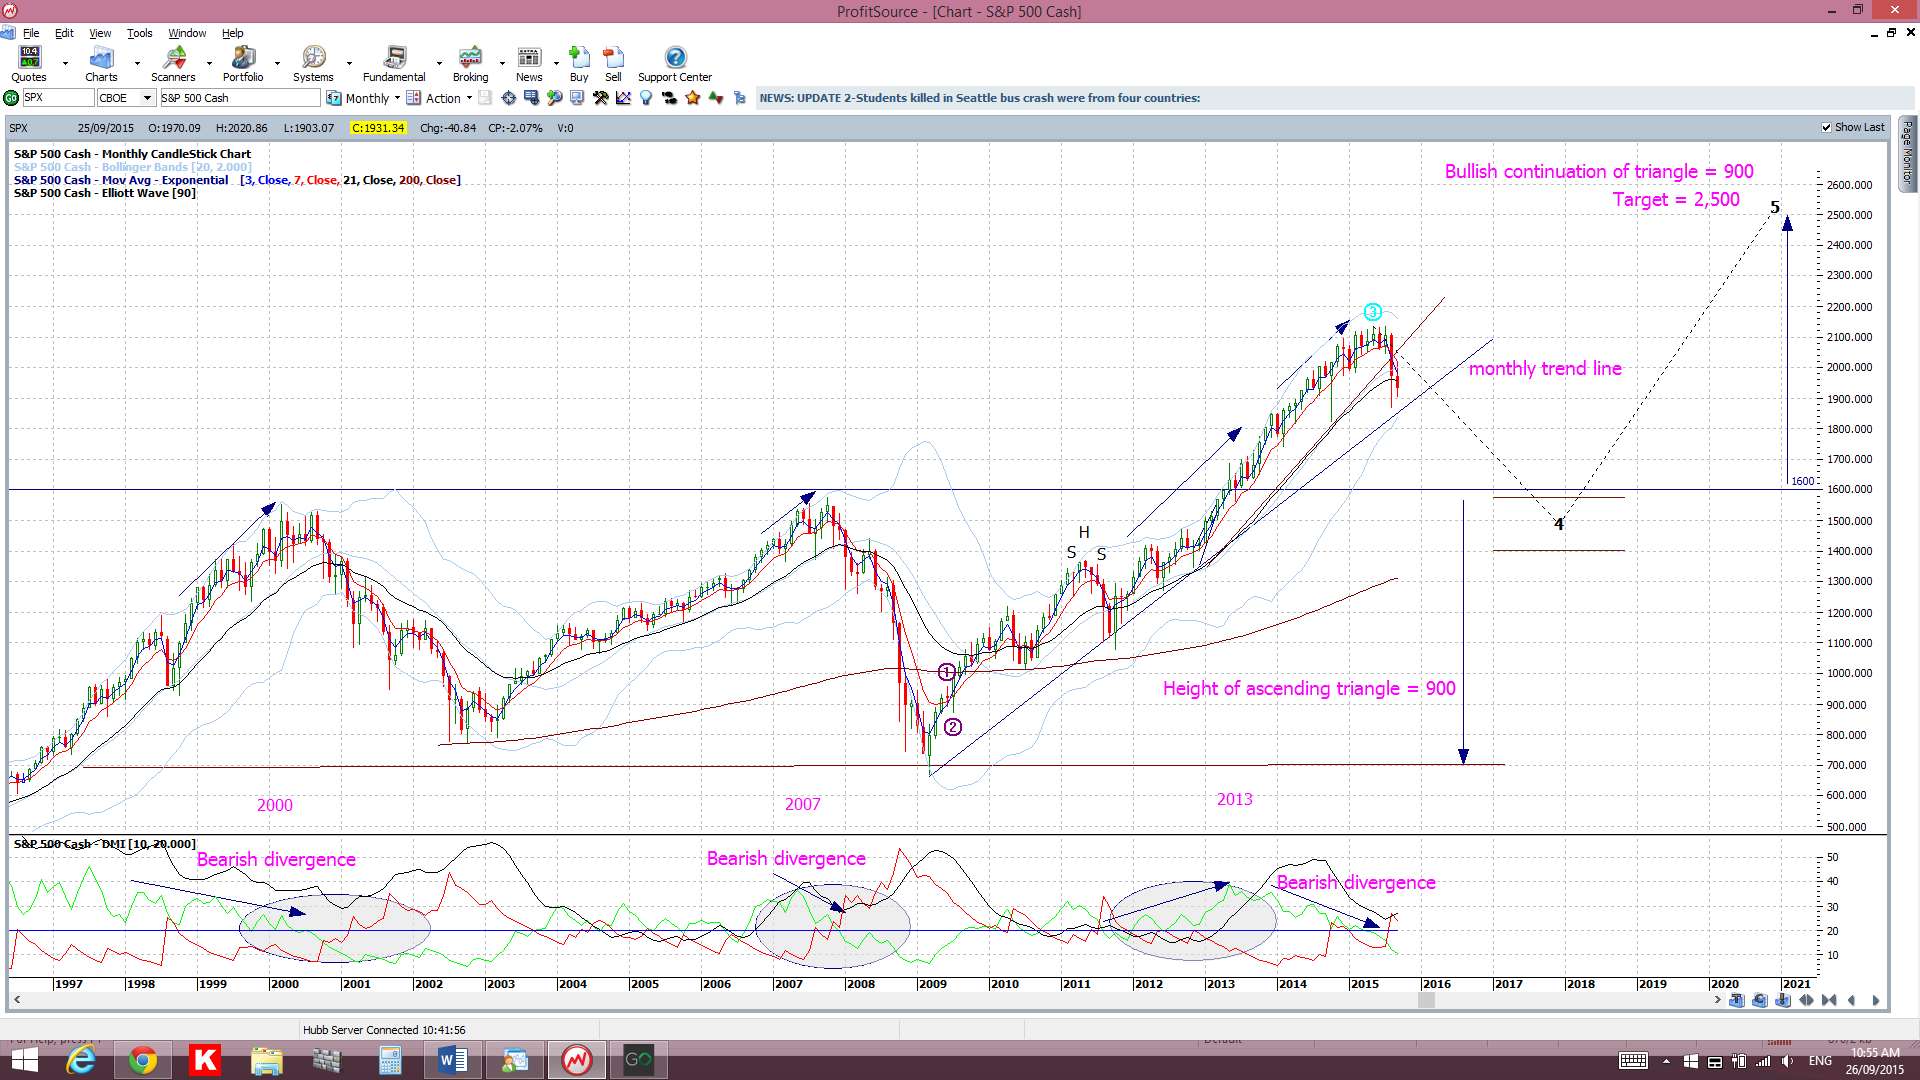
S&P500 monthly chart: a break of the monthly support trend line. The monthly trend line remains intact for now but a break of this support level would suggest to me of a more severe pull back. Bearish divergence on the monthly chart had warned of this recent weakness and I, like the Elliott Wave indicator, am looking for a test of the 1,600 region.
Russell 2000 Index: this small caps index is considered a US market ‘bellwether’ and has again closed the week below the key 1,220 level and with a large bearish ‘engulfing’ candle. I had previously seen this in a ‘Bull Flag’ formation but that has faded and a new pattern might be emerging, that of a bearish ‘H&S’ pattern with a ‘neck line’ near the 1,080 support region. Note how this 1,080 support meets the monthly support trend line and so I will be watching for any break or respect of this region:
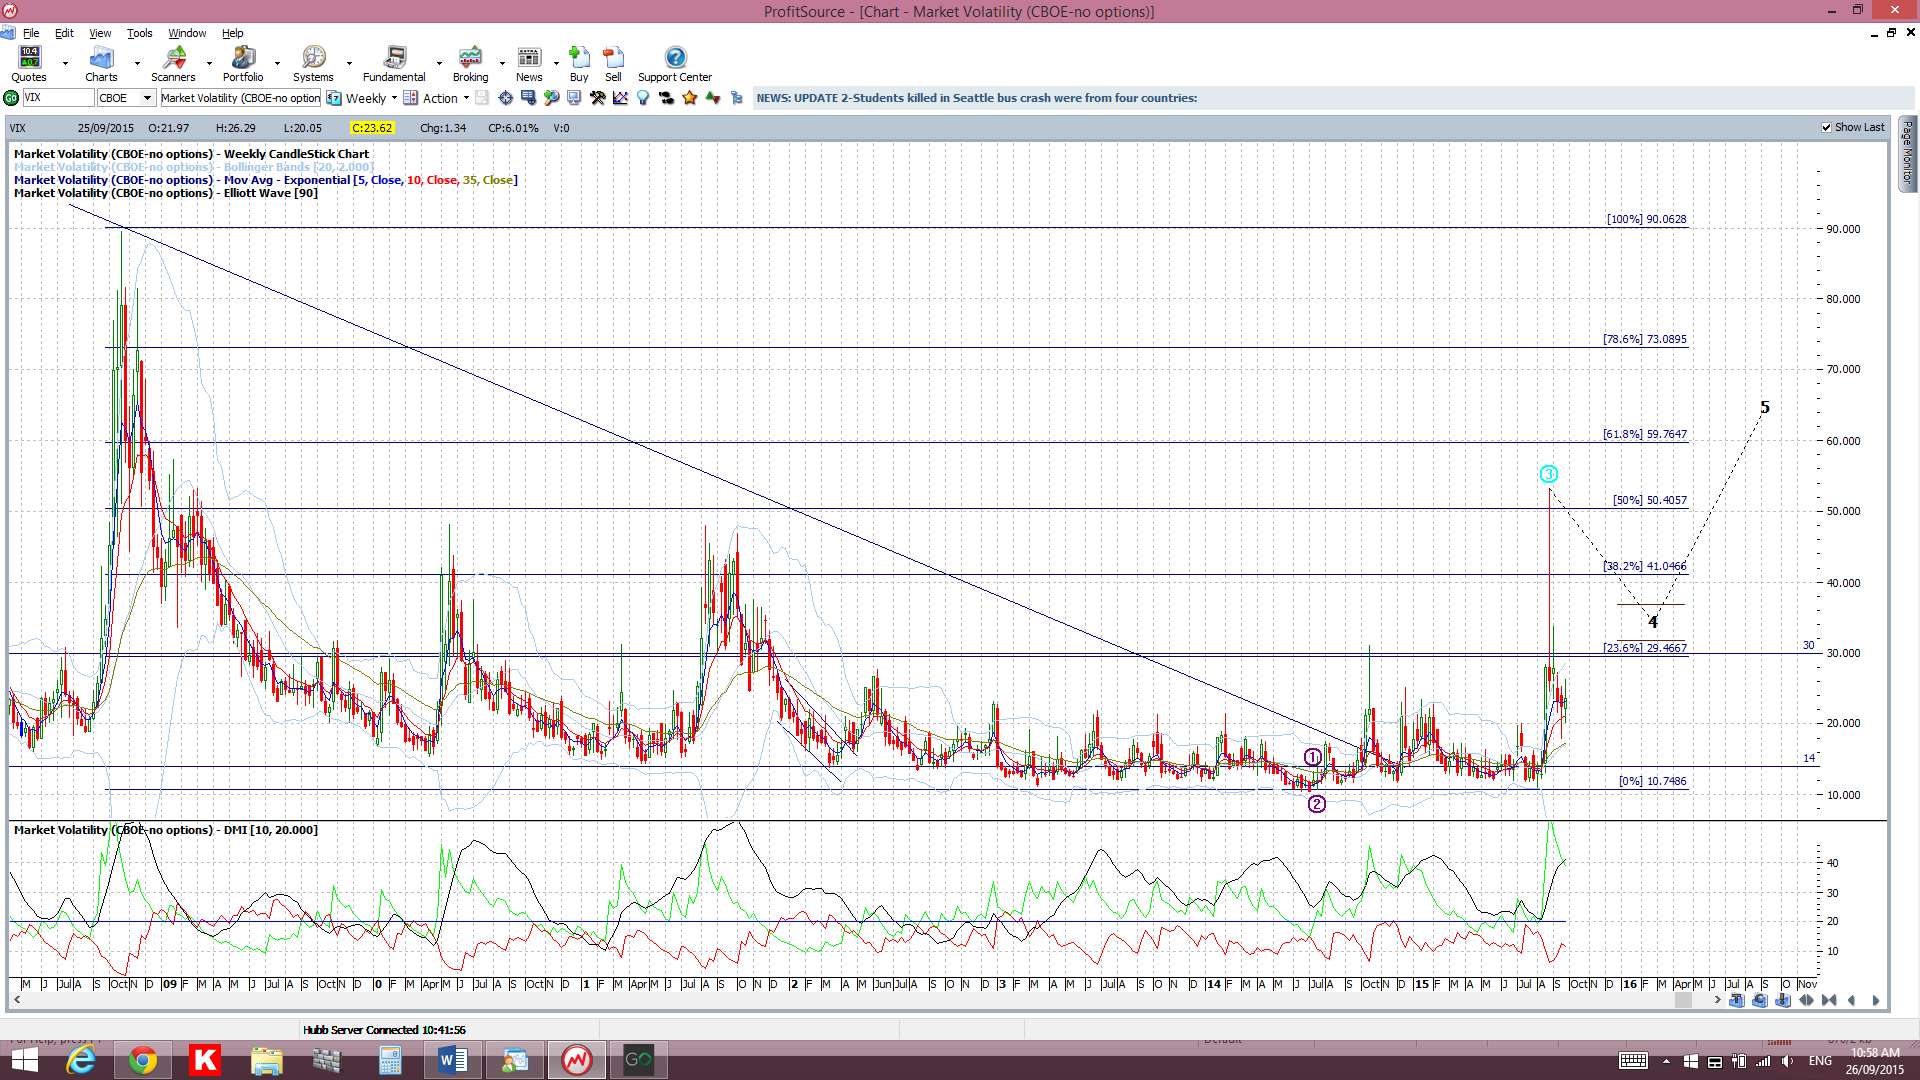
VIX Index: The ‘Fear’ index is below the 30 level but has printed a bullish coloured ‘Spinning Top’ weekly candle suggesting some indecision.
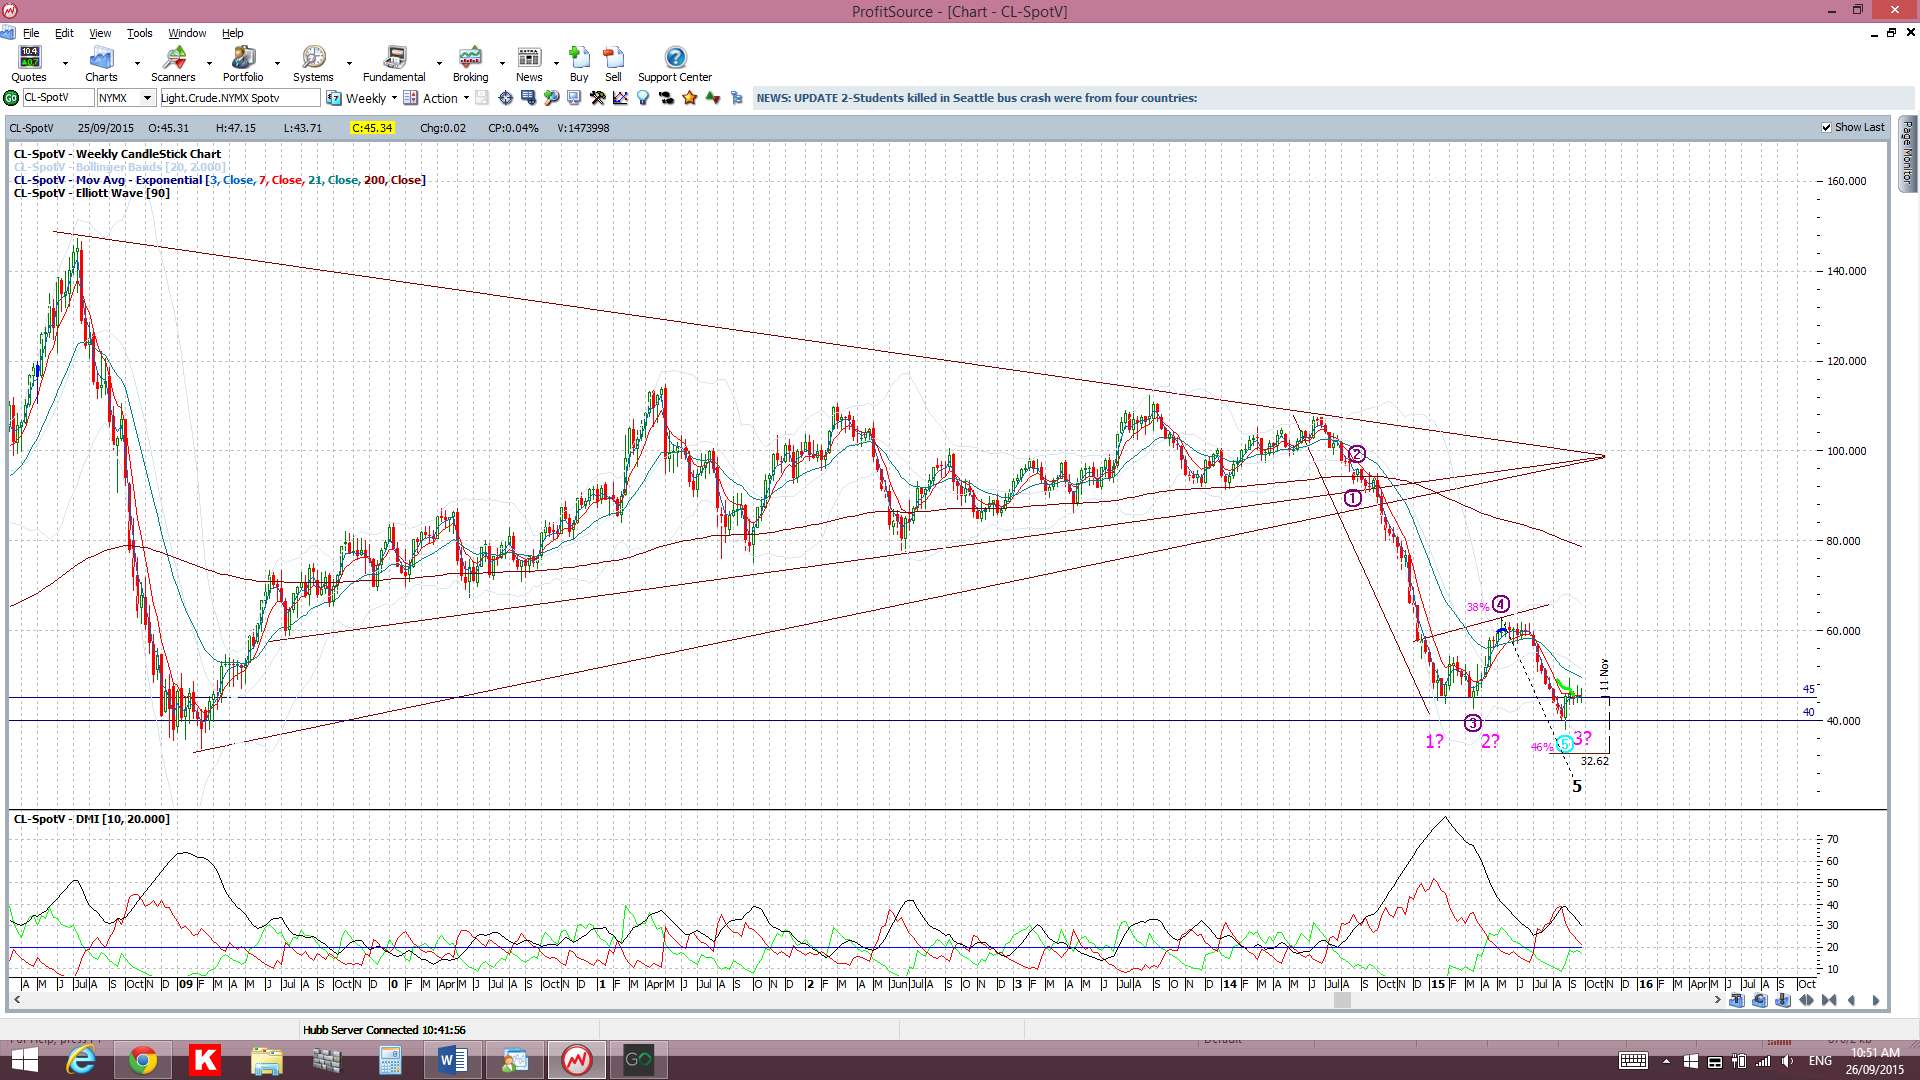
Oil: A potential ‘Triple Bottom’ is still open. The weekly candle was a bullish coloured ‘Doji’.
Trading Calendar Items to watch out for:
- Mon 28th: USD FOMC Dudley speaks.
- Tue 29th: USD CB Consumer Confidence. BoE Gov Carney speaks.
- Wed 30th: NZD ANZ Business Confidence. AUD Building Approvals. GBP Current Account. USD ADP NFP & Fed Chair Yellen speaks. CAD GDP.
- Thurs 1st: CNY Bank Holiday, Manufacturing & Non-Manufacturing PMI and Caixin Final Manufacturing PMI. GBP Manufacturing PMI. USD Unemployment Claims and ISM Manufacturing PMI.
- Fri 2nd: CNY Bank Holiday. AUD Retail Sales. GBP Construction PMI. USD NFP.
Forex:
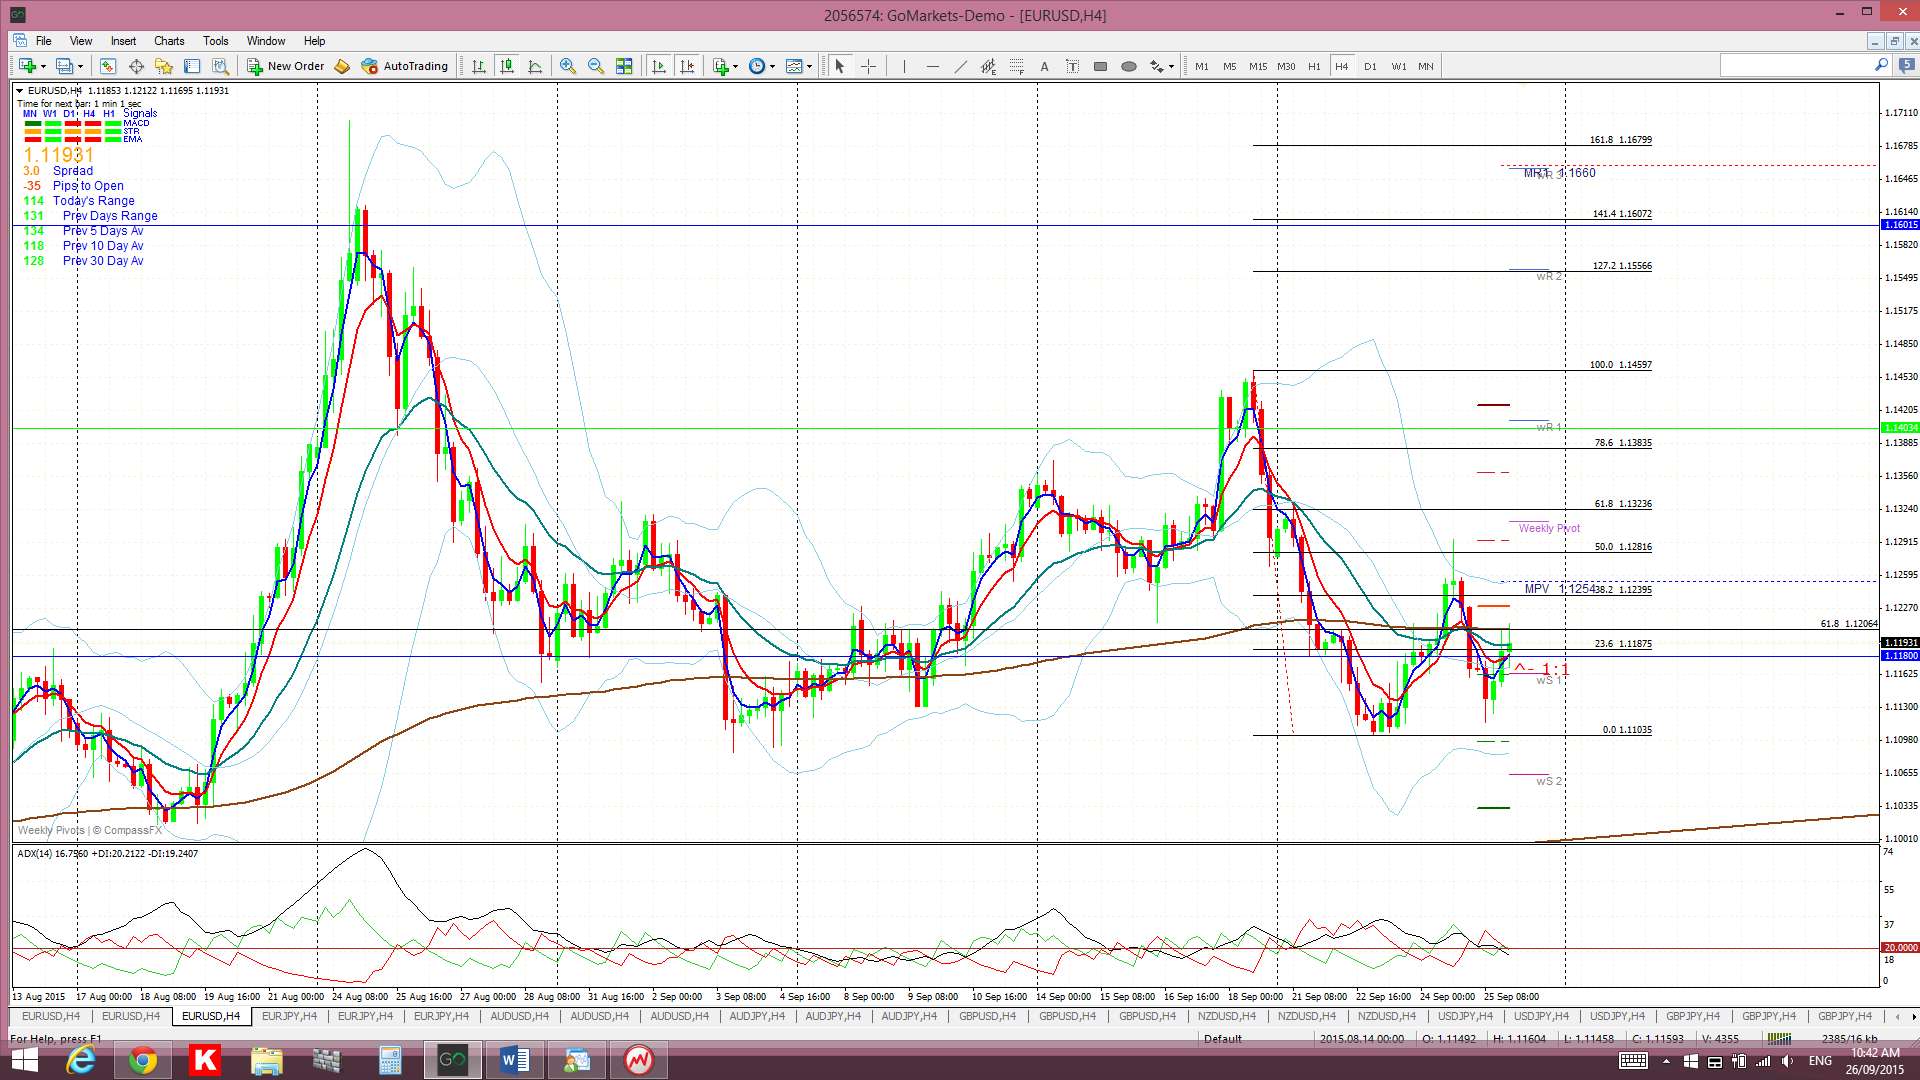
E/U: The E/U chopped lower last week with a fair bit of US Fed commentary talking up the likelihood of a US rate hike for this year. It is worth noting that price action is back sitting near 1.12 which is the major 61.8% fib from the 2000-2008 swing high move. It might just ‘sit on the fence’ in the lead up to next week’s NFP.
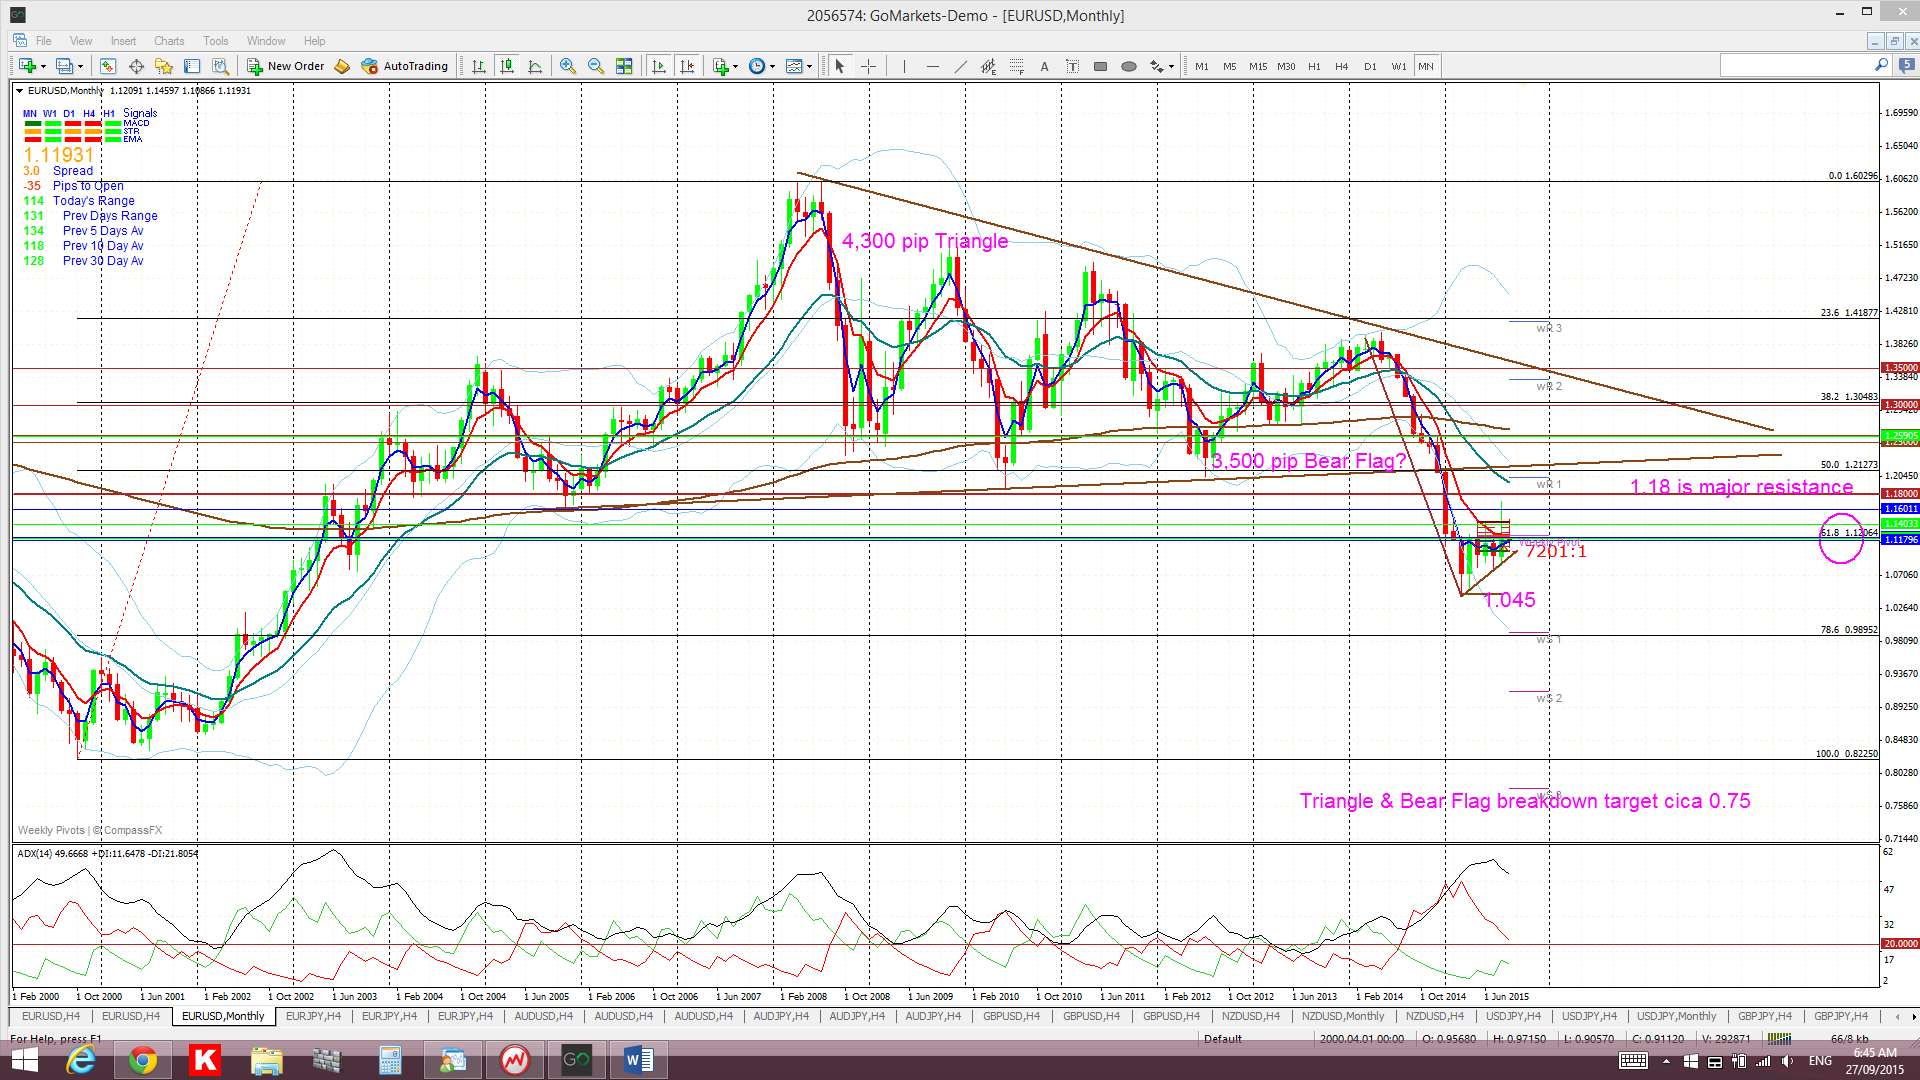
The weekly chart remains the bigger picture story here though and, like with the EUR index, the E/U has been trading in what looks like a Bear Flag for many months now. The top region of this Bear Flag is the 1.18 level and this is also the baseline of the previously broken monthly-chart based triangle pattern and a key S/R region so any move and hold back above this trend line may prove significant and indicate a polarity shift here.
As I have been noting over recent weeks, traders need to keep an eye on the weekly chart’s Flag trend lines for any breakout, bullish or bearish:
- Any new trend line breakdown and continuation could signal the start of a weekly-chart Bear Flag breakdown worth up to 3,500 pips. Keep an eye on the lower flag trend line, and also the recent low down near 1.045, in case they offer up any support.
- Any break and hold back above the 1.18 region could signal reversal here.
Descending triangle on the monthly chart: There is still an overall bearish pattern in play on the E/U monthly chart: a 4,300 pip bearish descending triangle breakdown on the monthly chart. The descending triangle pattern is a bearish continuation pattern and has a base at around the 1.18 level. The height of this triangle is about 4,300 pips. Technical theory would suggest that the bearish breakdown of this triangle below 1.18 might see a similar move. It is worth noting that this would bring the E/U down near 0.80 and to levels not seen since 2000/2001!
Price is trading above the Cloud on the daily chart but below the Cloud on the 4hr, weekly and monthly charts.
The weekly candle closed as a bearish coloured ‘Spinning Top’ candle reflecting some indecision.
- I’m watching for any new TC signal on this pair, the Bear Flag trend lines and the key 1.12 level.


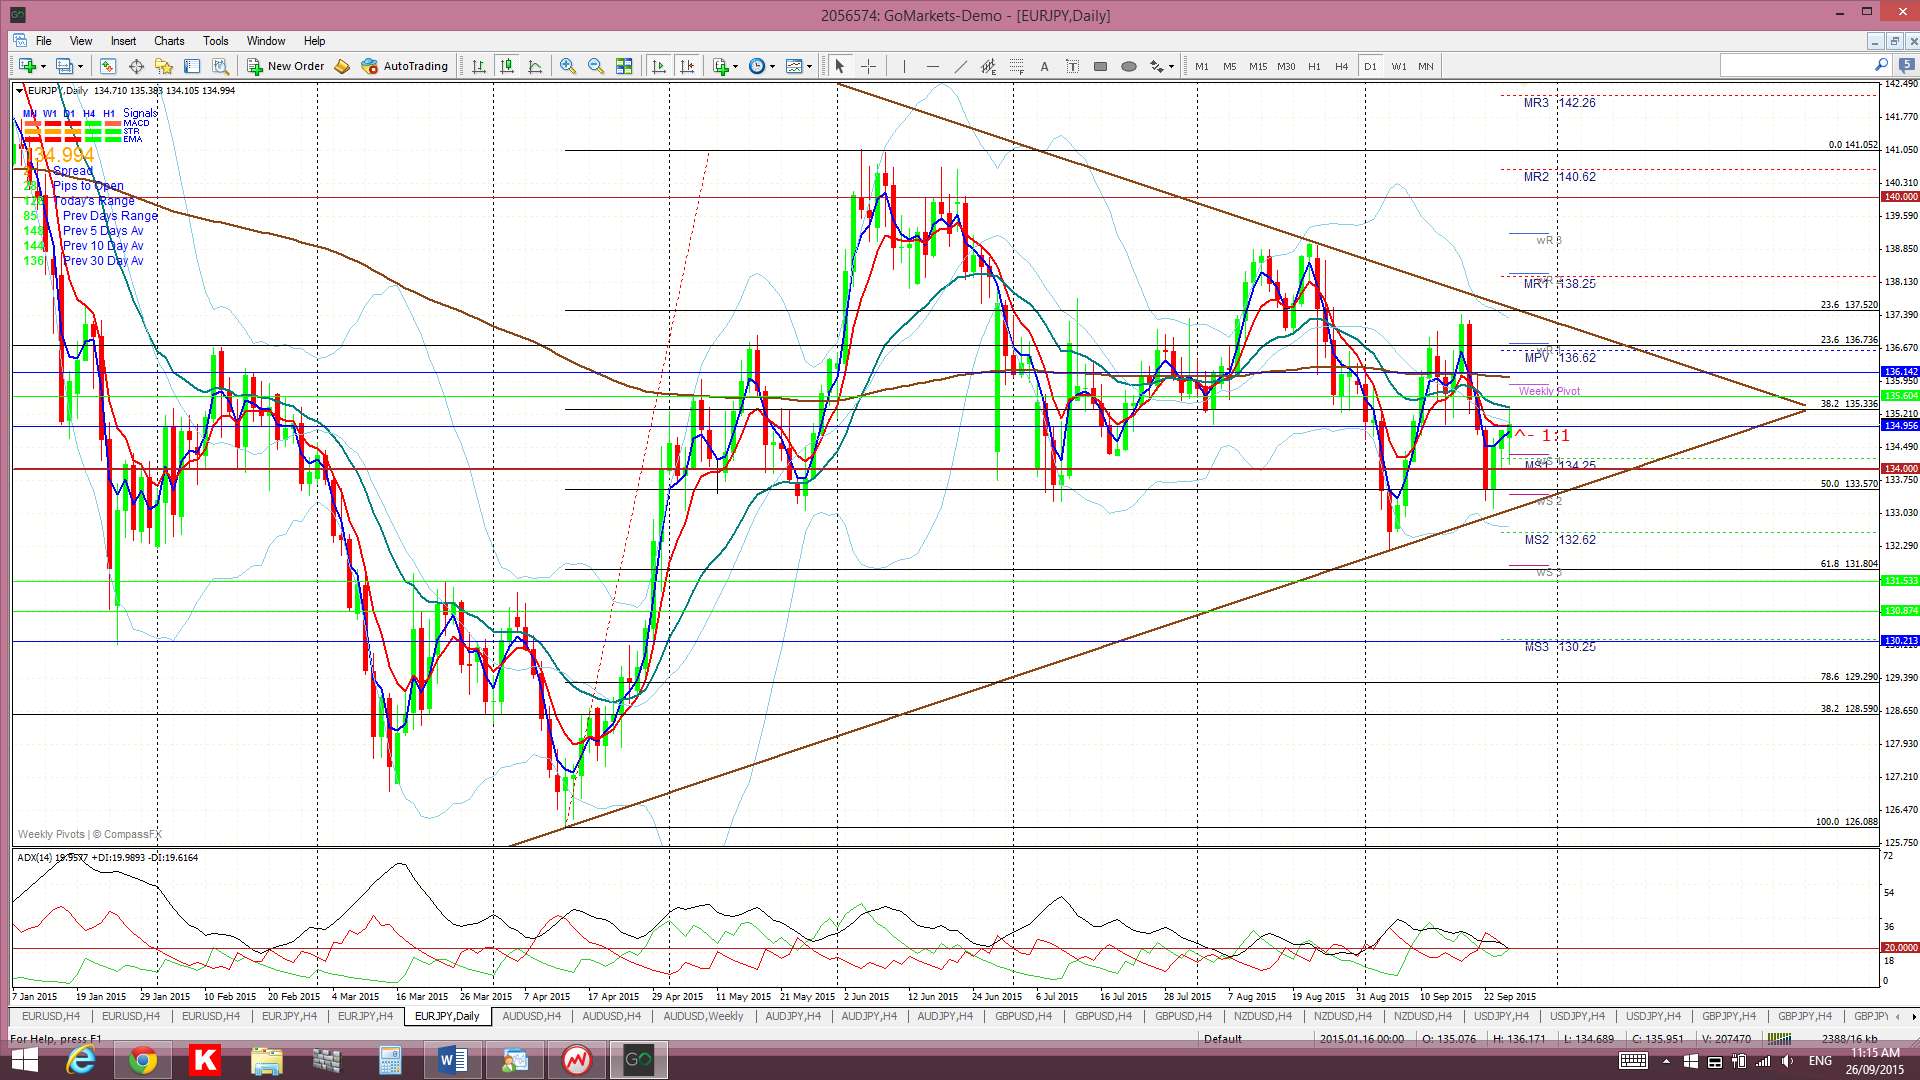
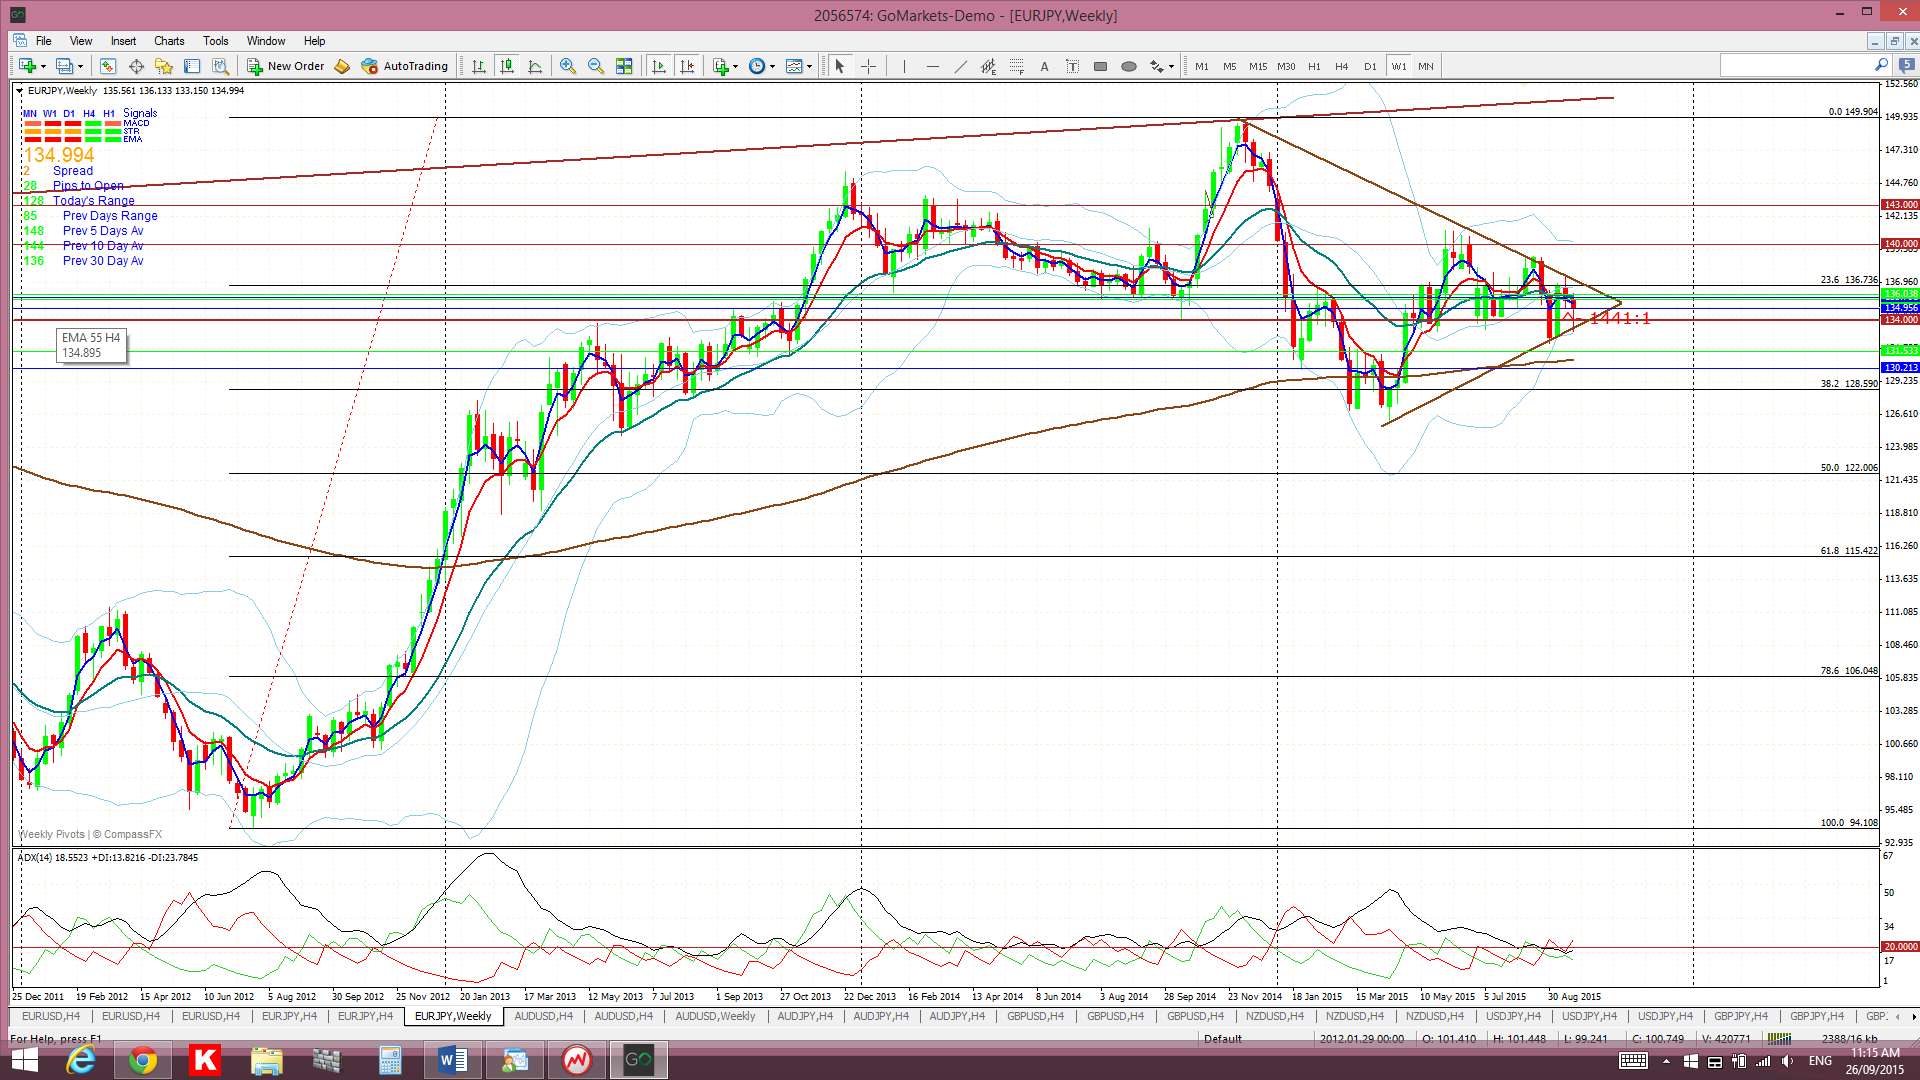
E/J: The E/J traded a bit lower last week but bounced off the support from the bottom trend line of the daily chart’s triangle pattern.
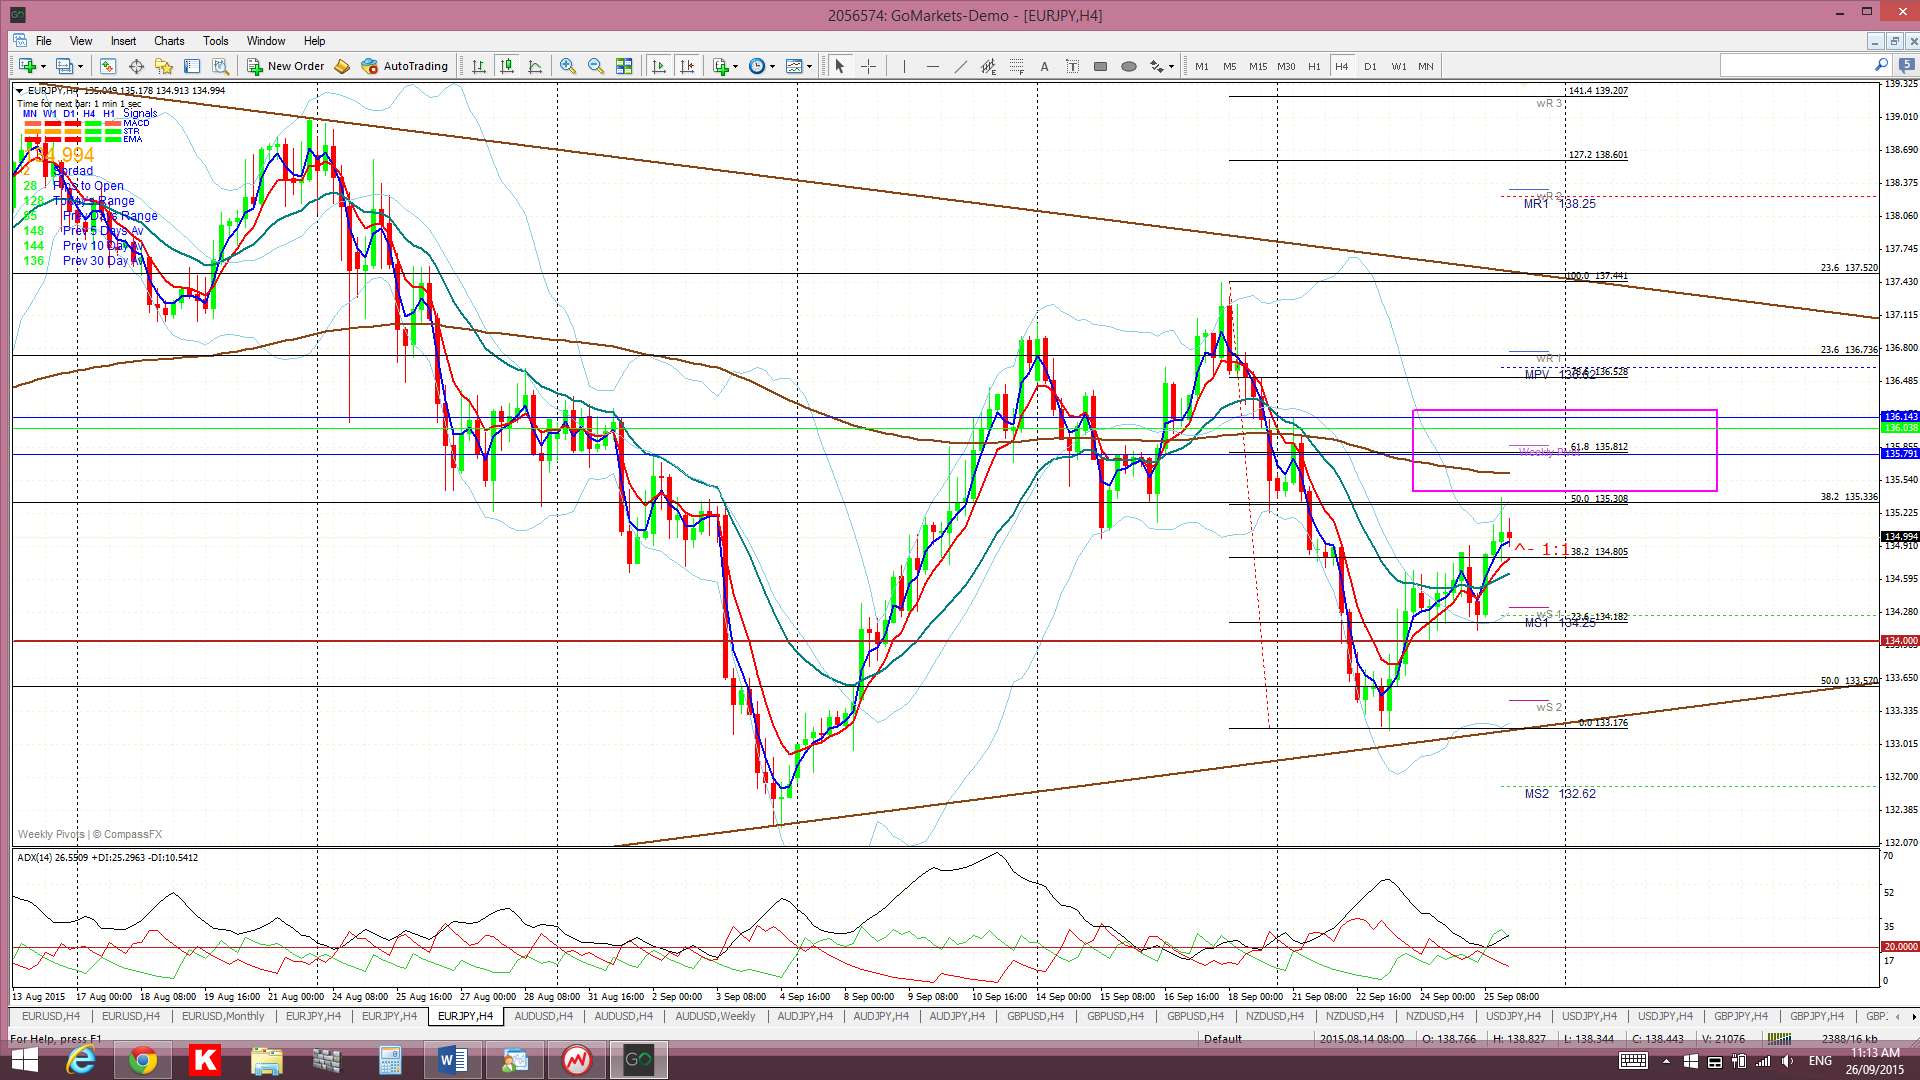
I had noted last week how technically ‘well behaved’ this pair was and this seems to be continuing to be the case. I had suggested earlier in the week that traders should watch for a test of the 61.8% fib in any bounce move and price still seems to be making its way up there. This 61.8% fib is also near the 4hr 200 EMA and weekly pivot so this congested S/R zone may prove to be a target and reaction point for any continued price action:
E/J 4hr: before warning of the 61.8% fib:
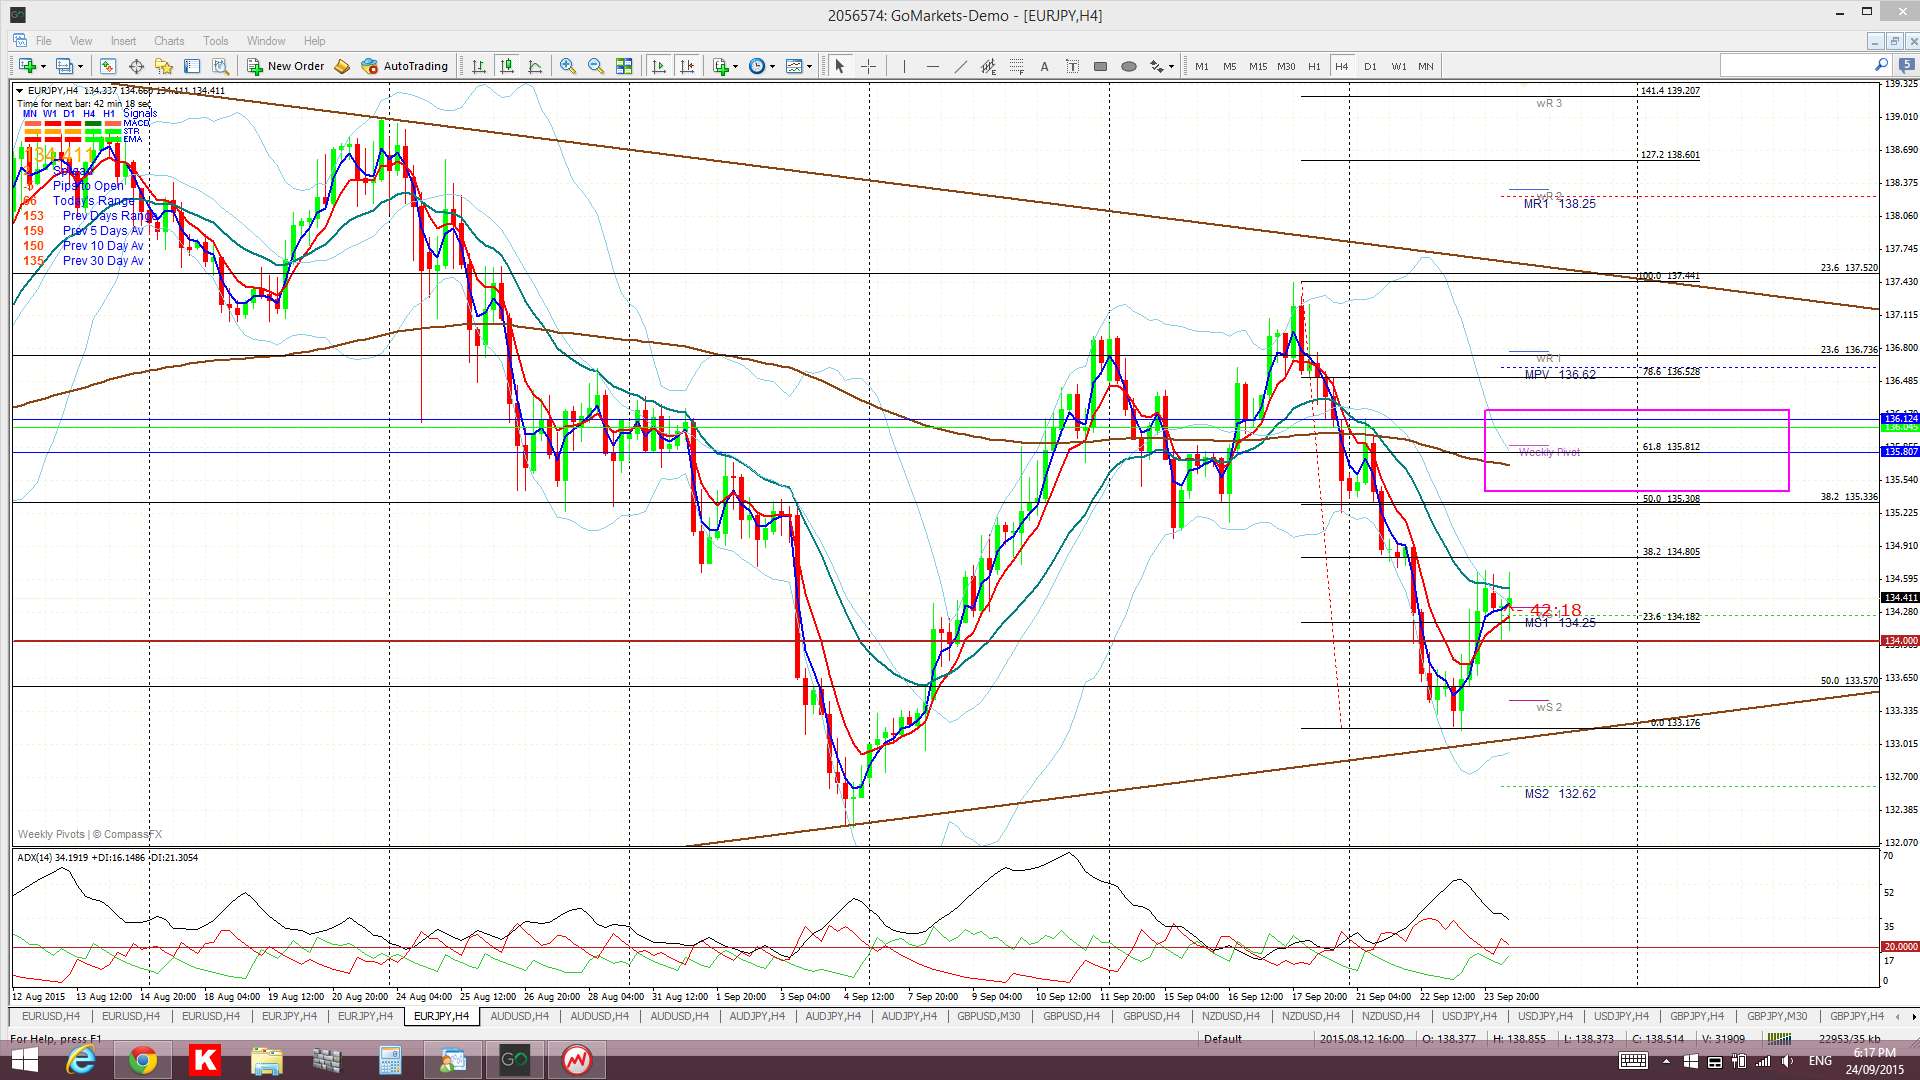
E/J 4hr: at close of the week. Will it make the 61.8% fib?:

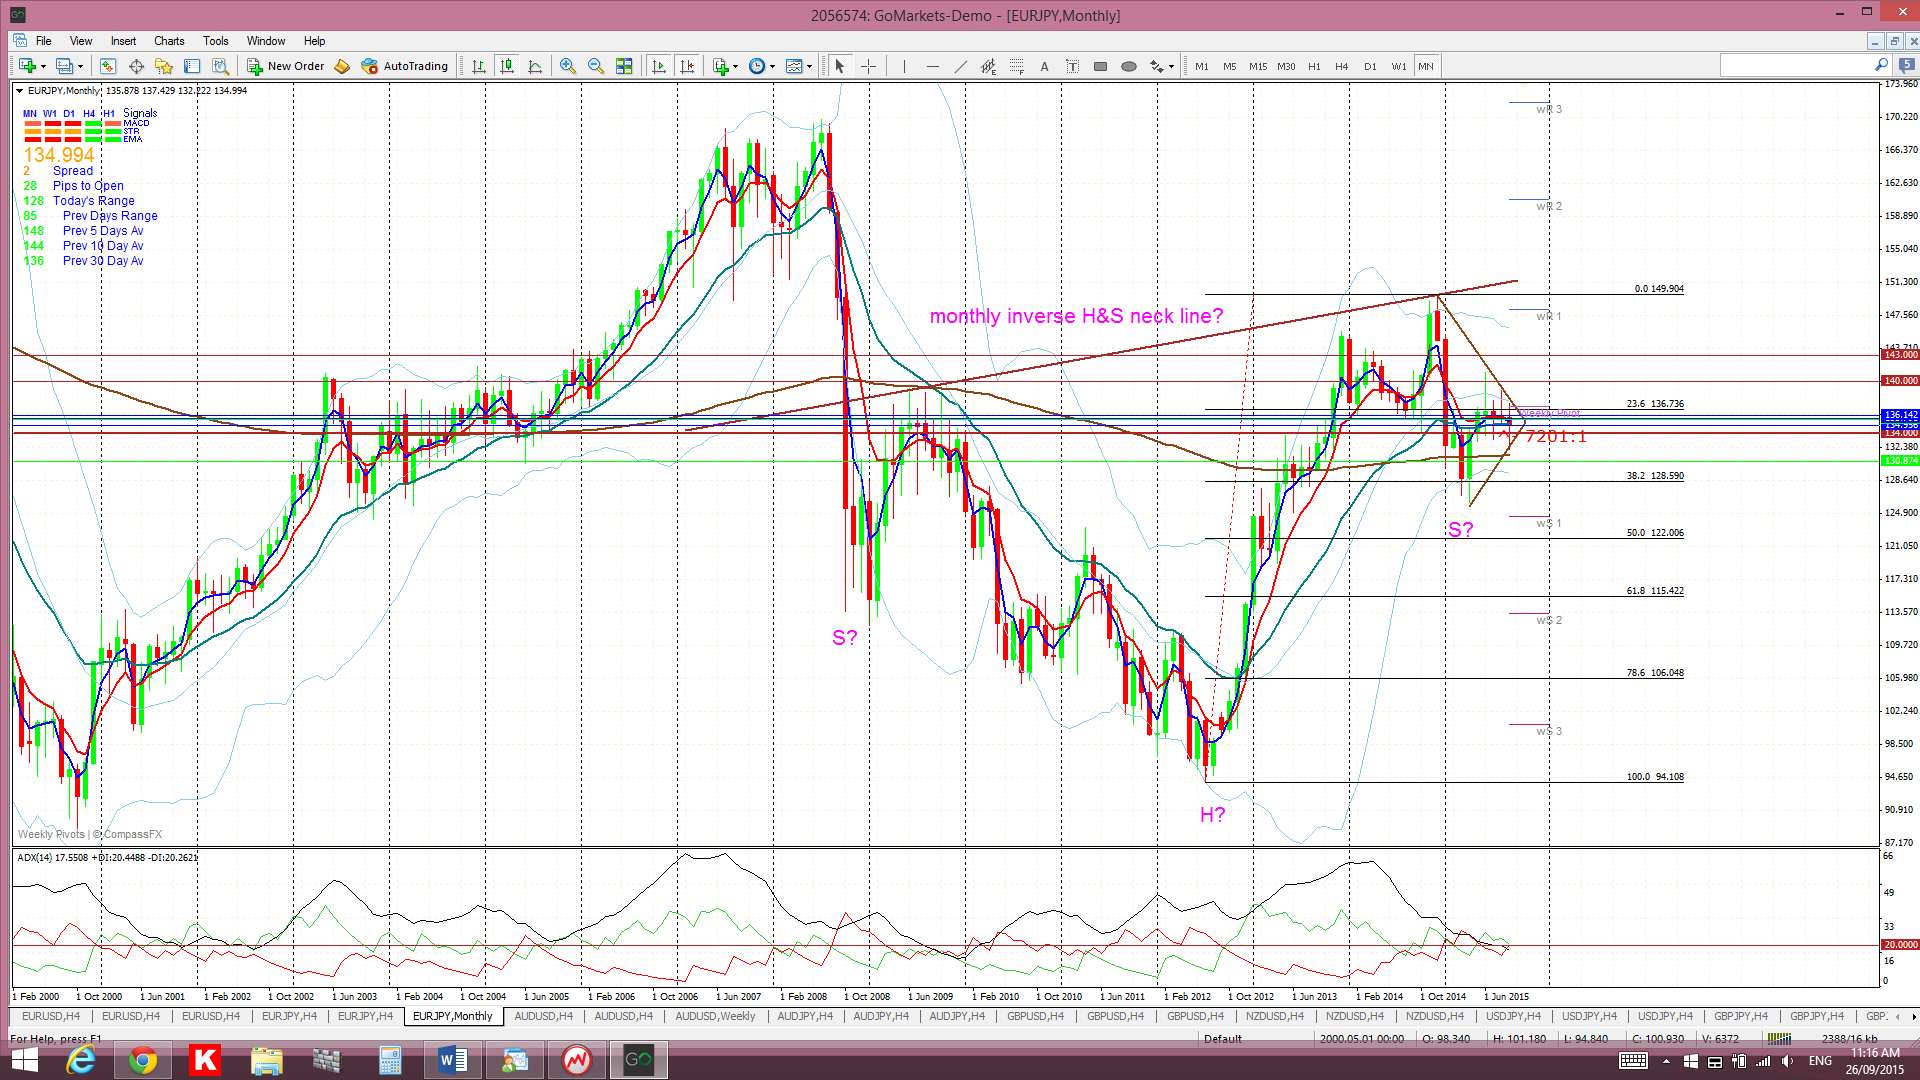
FWIW: I’m still seeing a potential bullish ‘inverse H&S’ pattern building on the monthly chart. Although the monthly Cloud chart has printed a bearish Tenkan/Kijun cross and these crosses are few and far between so worth noting!
Price is trading below the Cloud on the 4hr and daily charts, in the bottom of the Cloud on the weekly chart but above the Cloud on the monthly chart.
The weekly candle closed as a bearish candle.
- I’m watching for any new TC signal on this pair and the daily chart’s triangle trend lines.
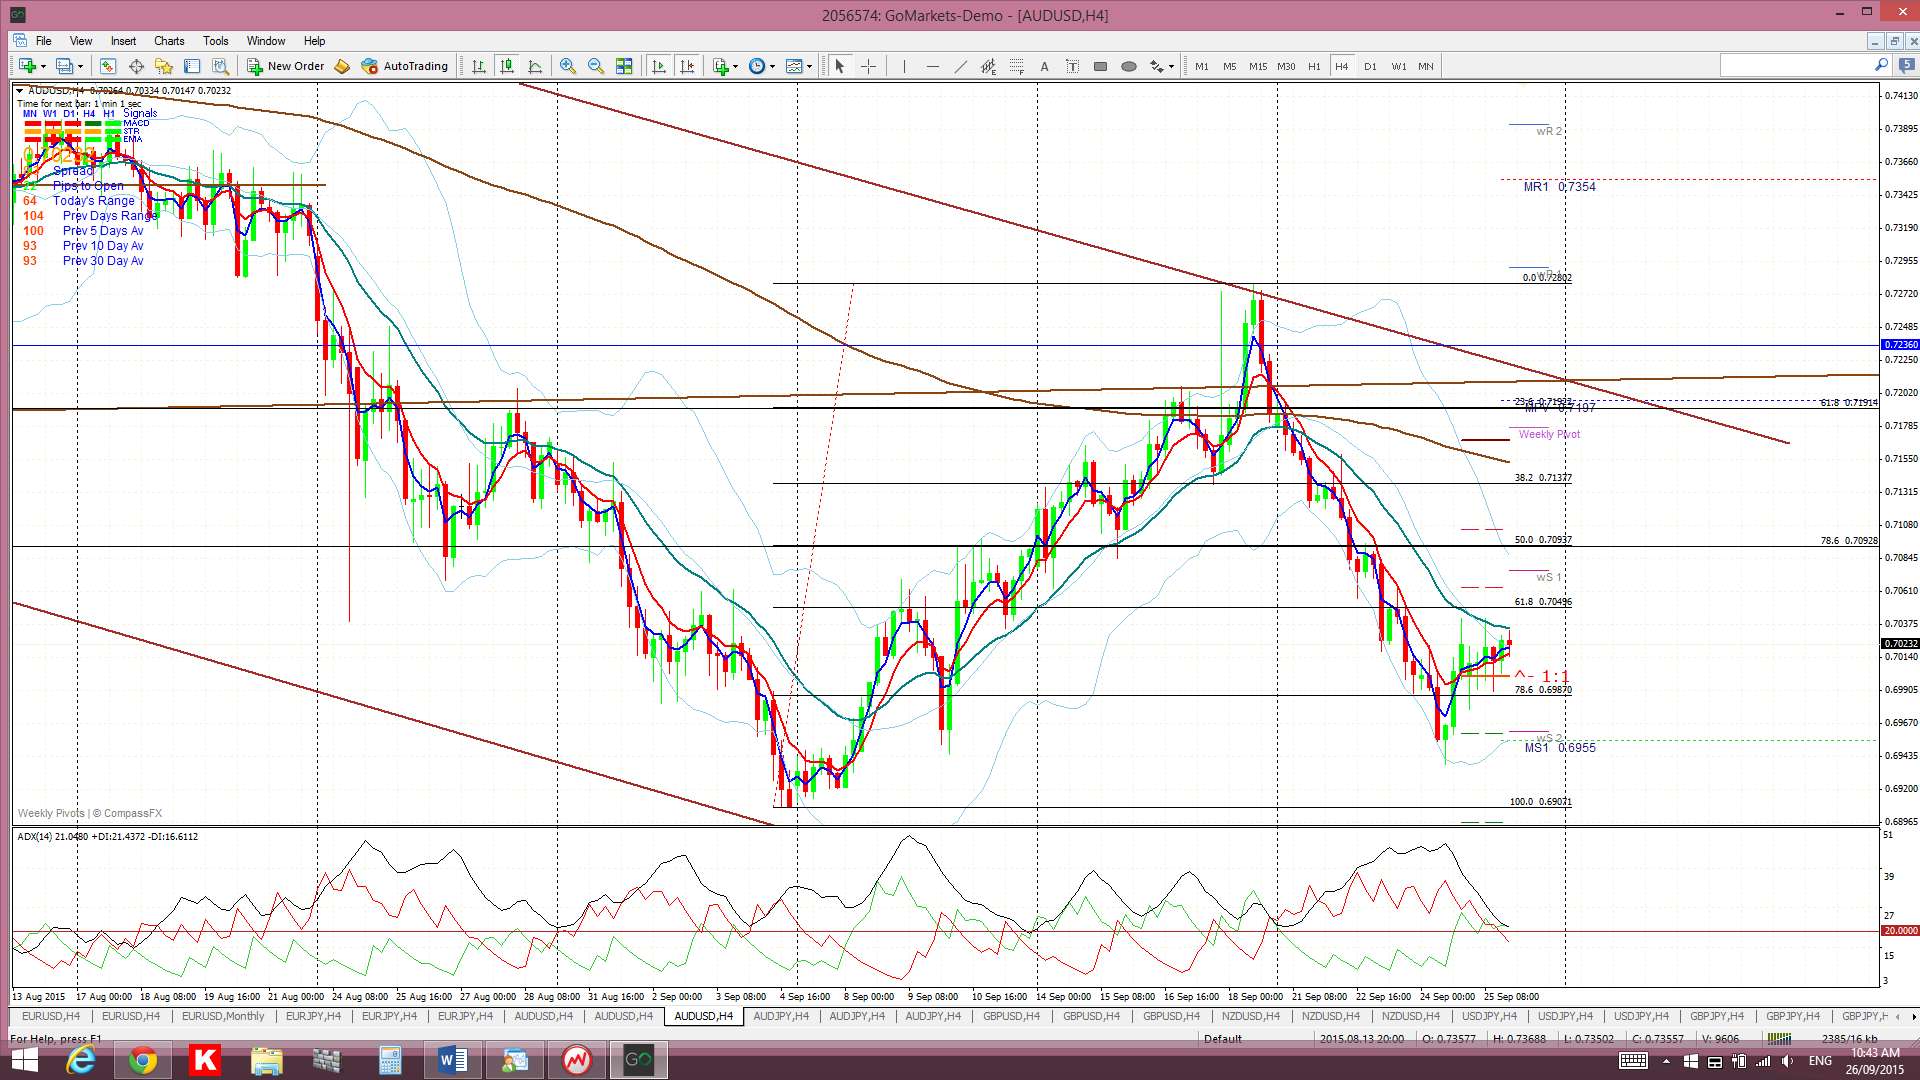
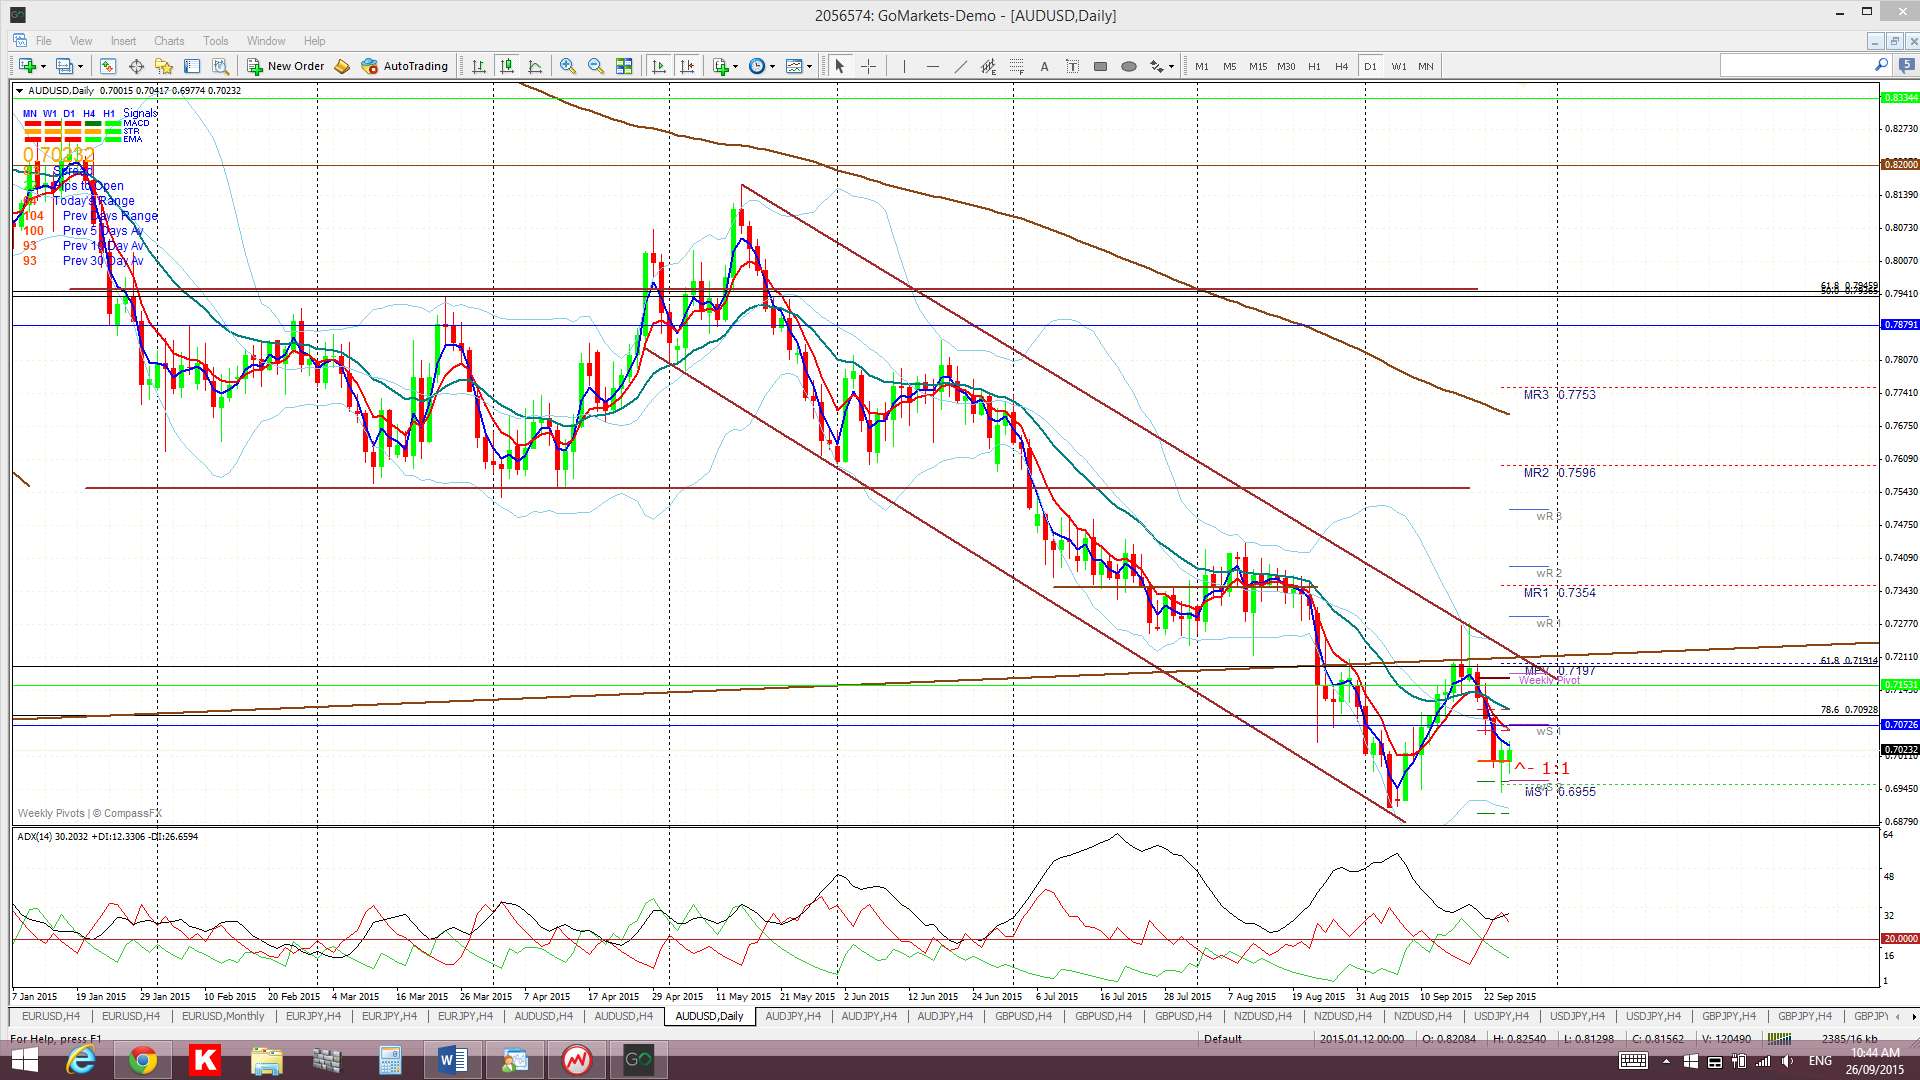
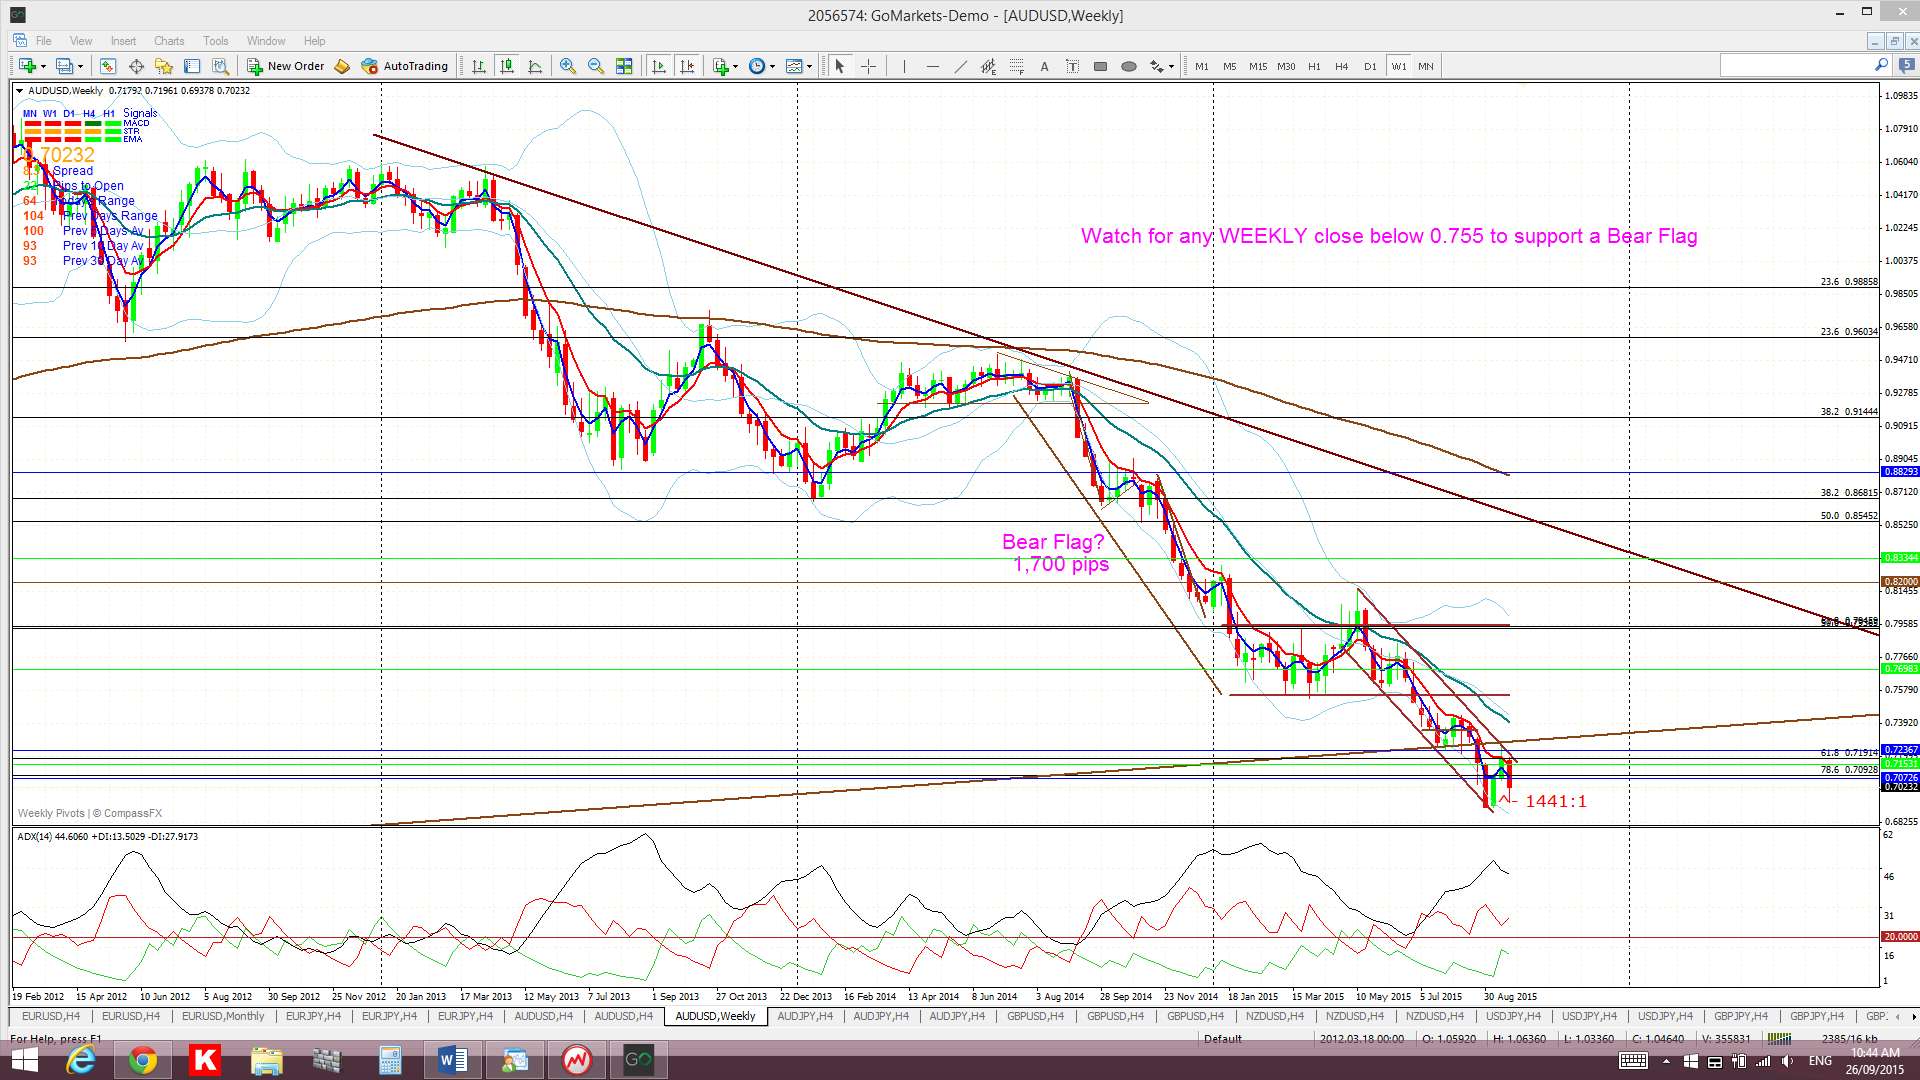
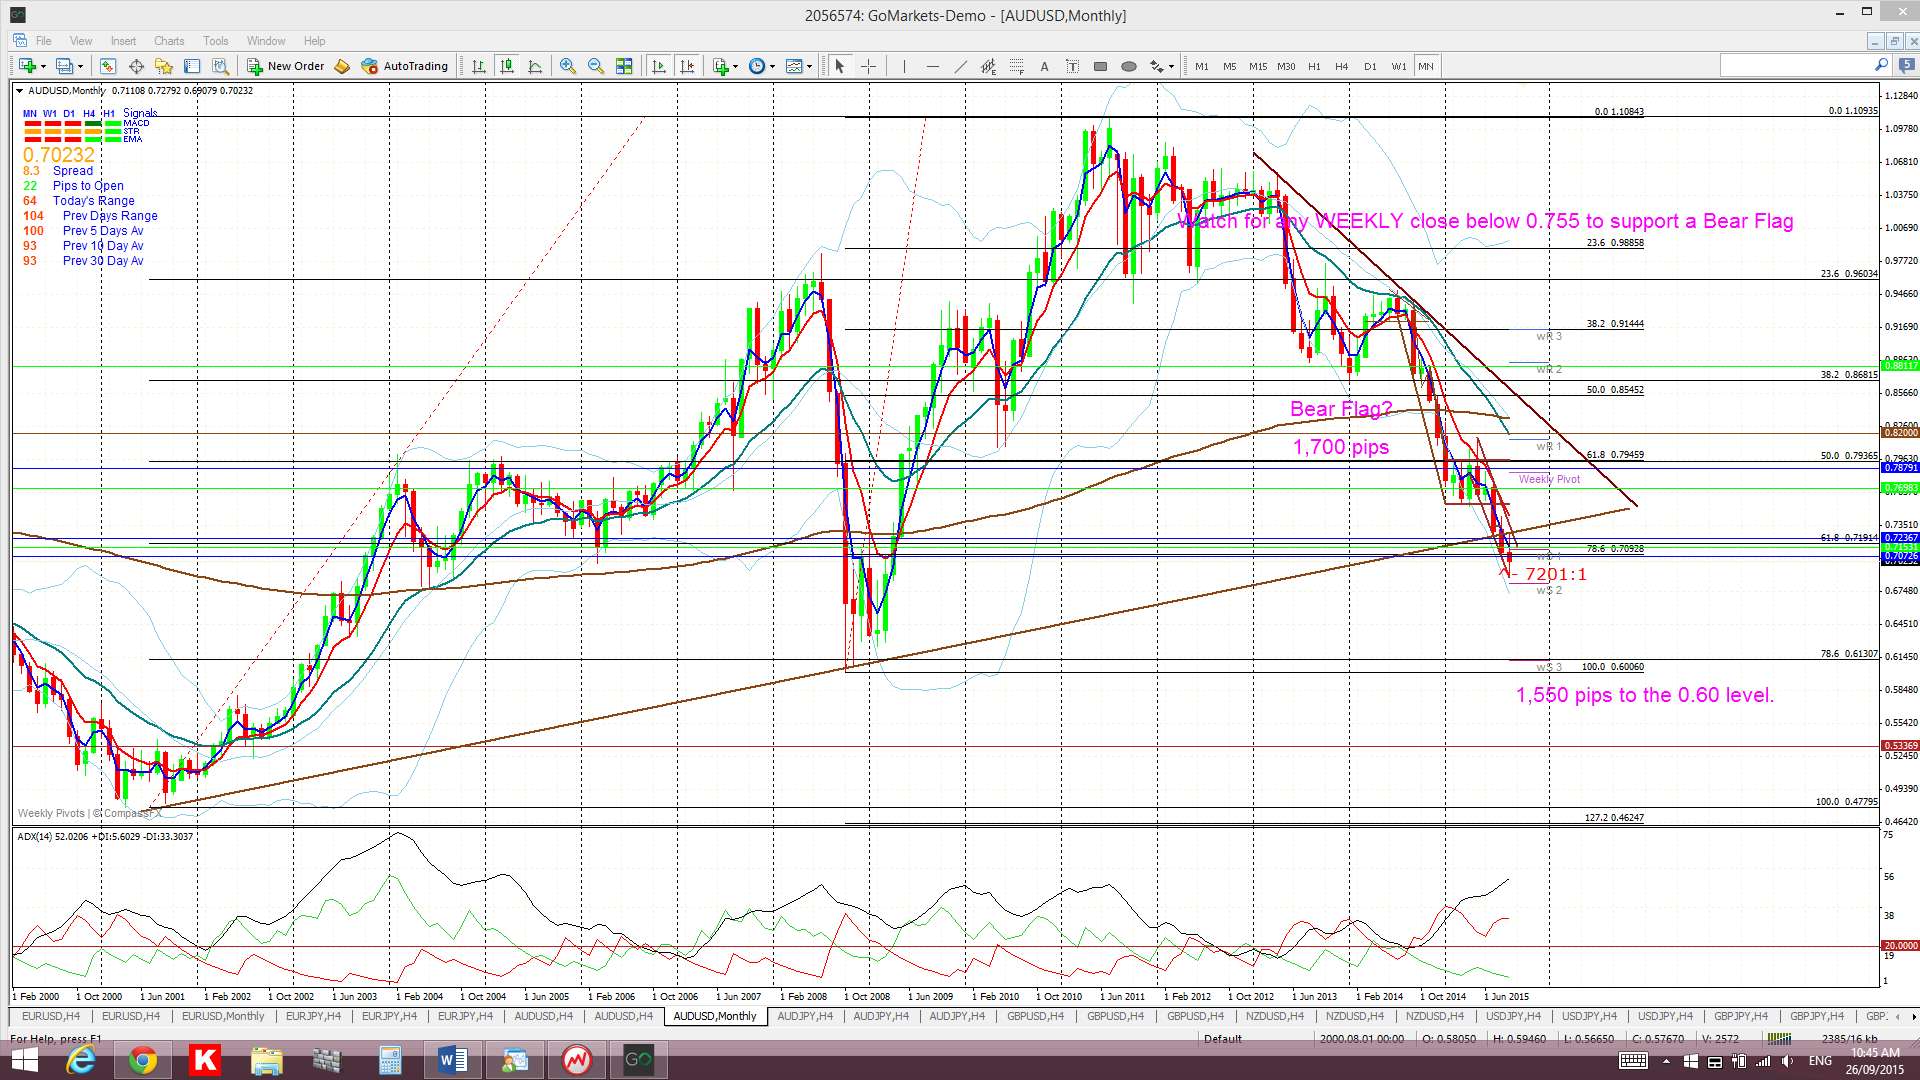
A/U: The A/U has managed to close the week above 0.70 psychological support but, after testing up at the previously broken monthly trend line, price action pulled back over 200 pips lower and is back below this trend line as well as below two key Fib levels:
- The 61.8% fib of the major swing high move from 2001 to 2011 near 0.72.
- The 78.6% fib of the 2008-2011 swing high move near 0.71.
Price seems to be bouncing still within a descending trading channel though.
Traders need to keep an eye on the precious metals as any sustained moved higher with Gold and Silver might help to keep the AUD supported.
Price is trading below the Cloud on the 4hr, daily, weekly and monthly charts.
There is a lot of data to impact the A/U this week: Wednesday’s AUD Building Approvals, Thursday’s batch of Chinese data and Friday’s AUD Retail Sales and US NFP, as well as all the other USD data.
The weekly candle closed as a bearish, almost ‘engulfing’, candle.
- I’m watching for any new TC signal on this pair, the trading channel trend lines and the 0.70 level.
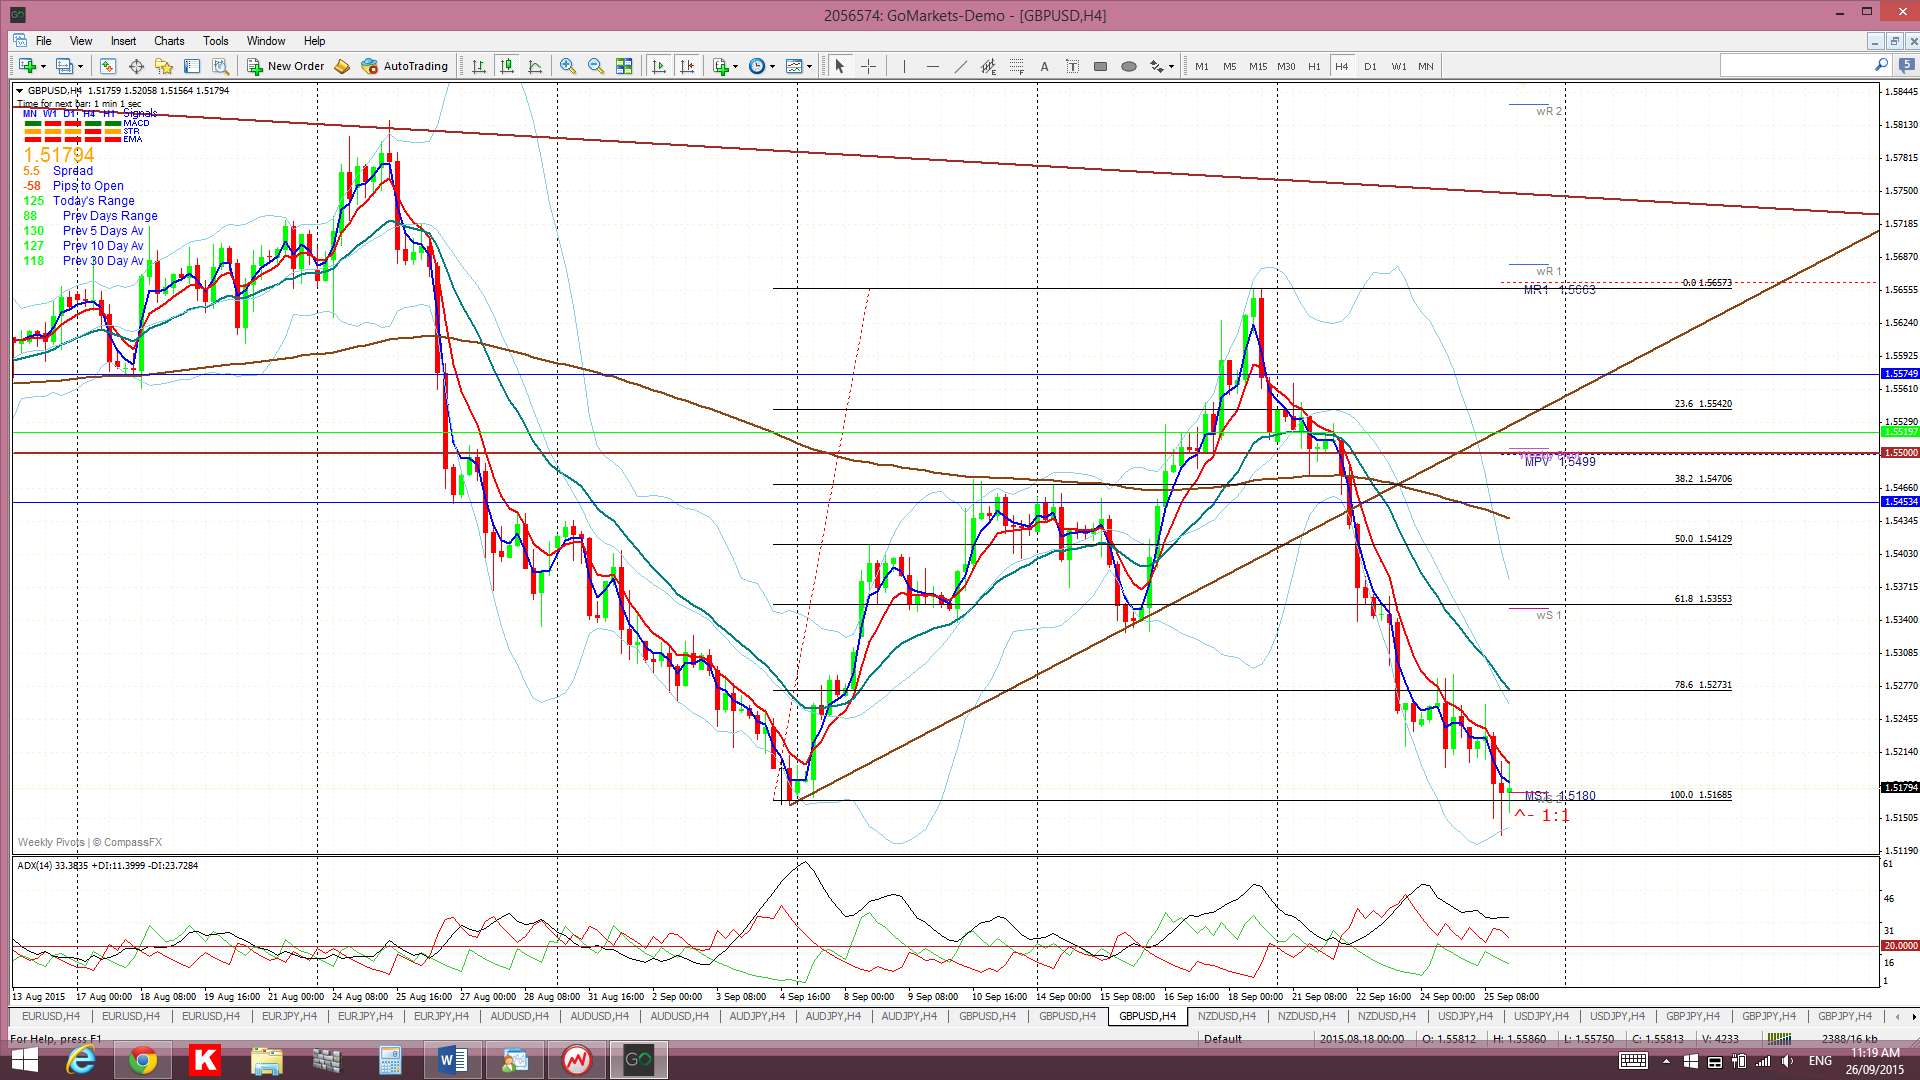
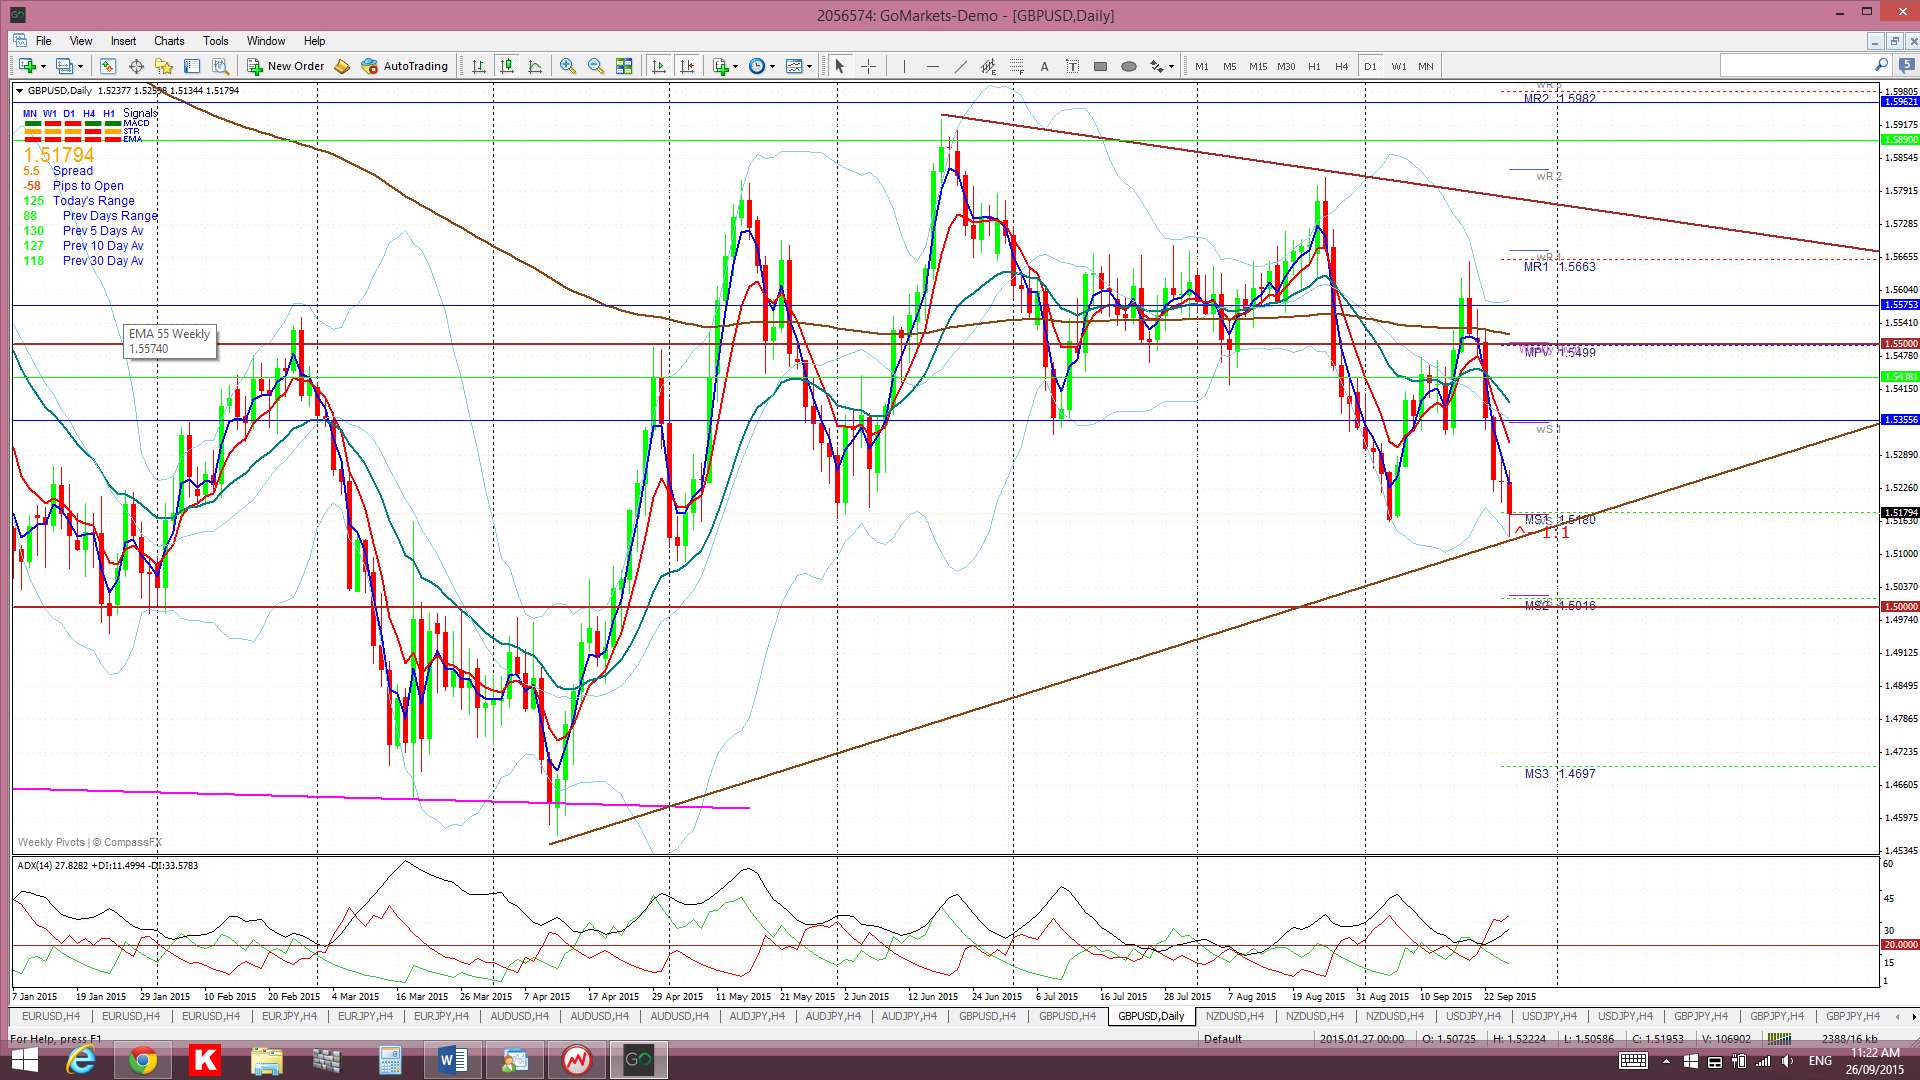
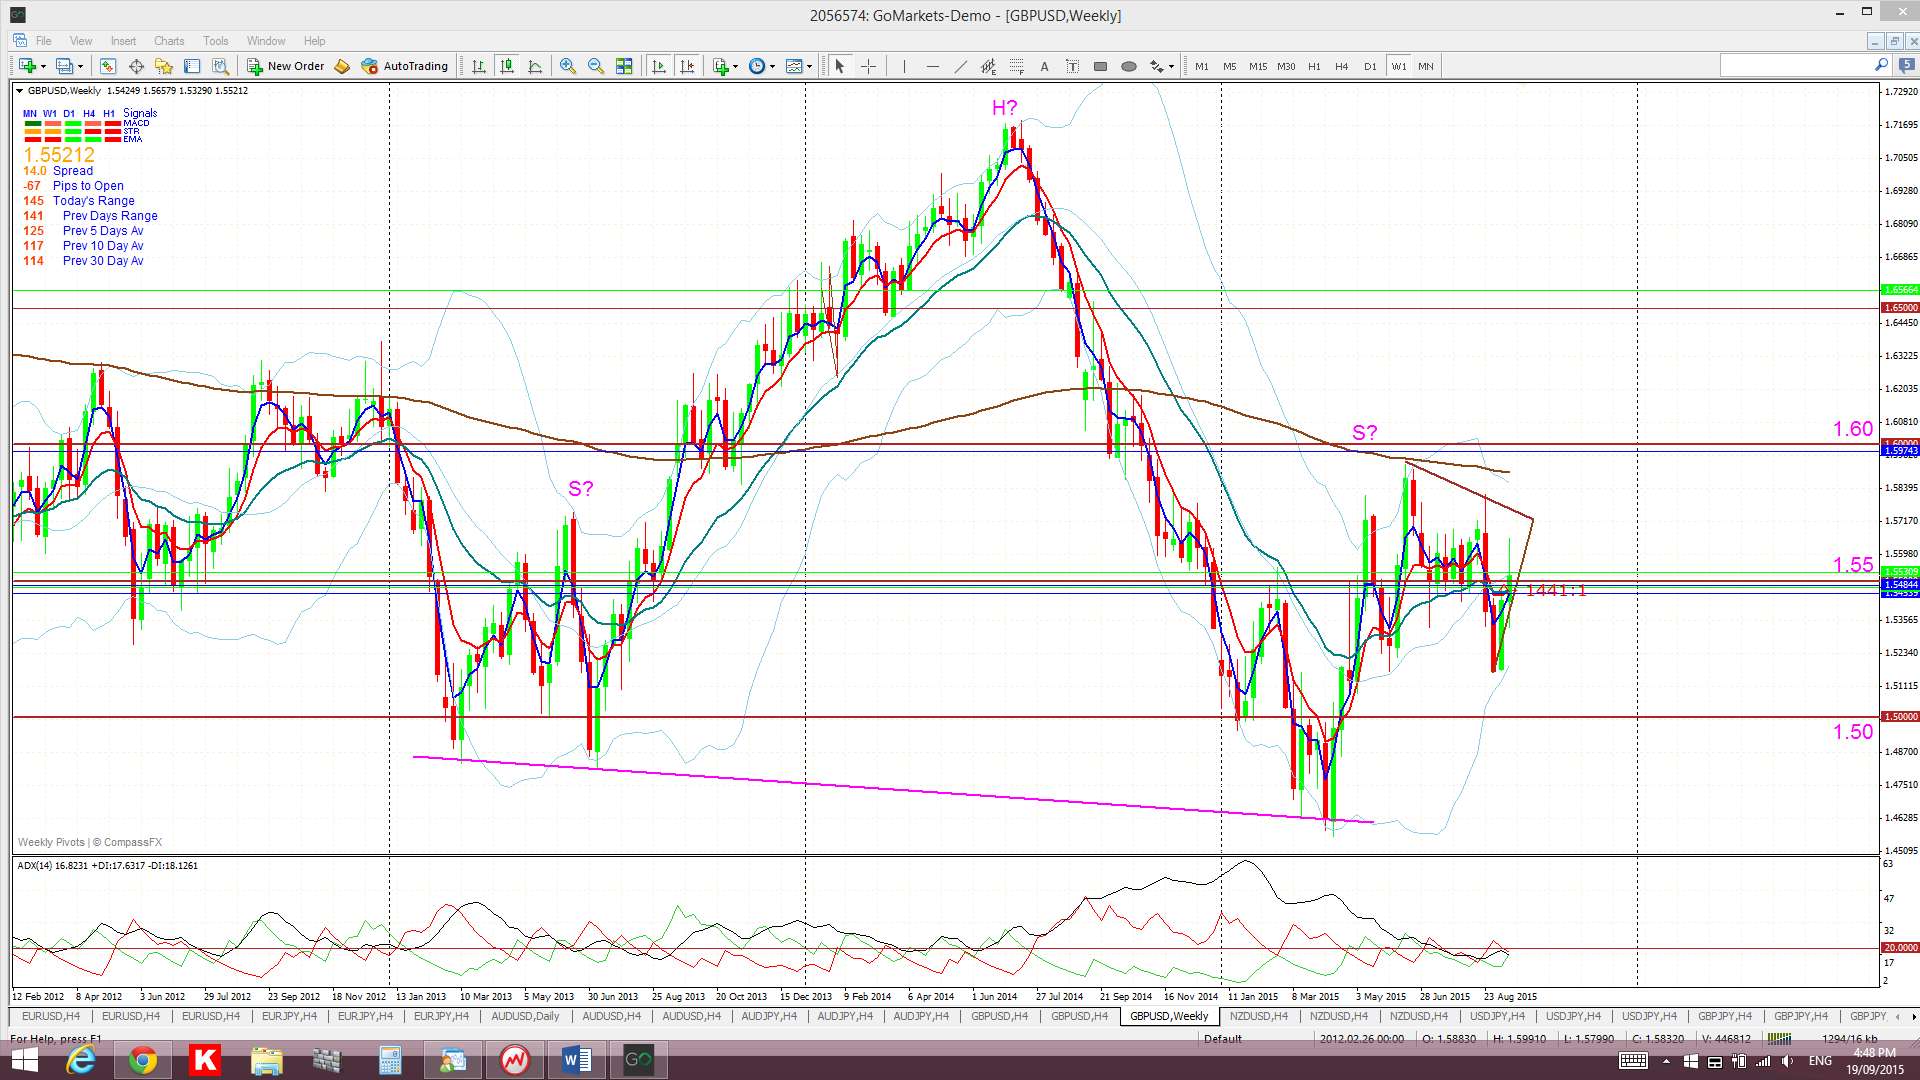
G/U: The Cable gave a great trend-line breakout trade last week that delivered over 200 pips. Price action essentially completed a ’round trip’ as it pulled back to the 100% fib of the recent swing-high move. It is holding there for now BUT any close and hold below this region would surely bring the 1.50 region back into focus.
I have revised the trend lines here now so as to capture recent price action.
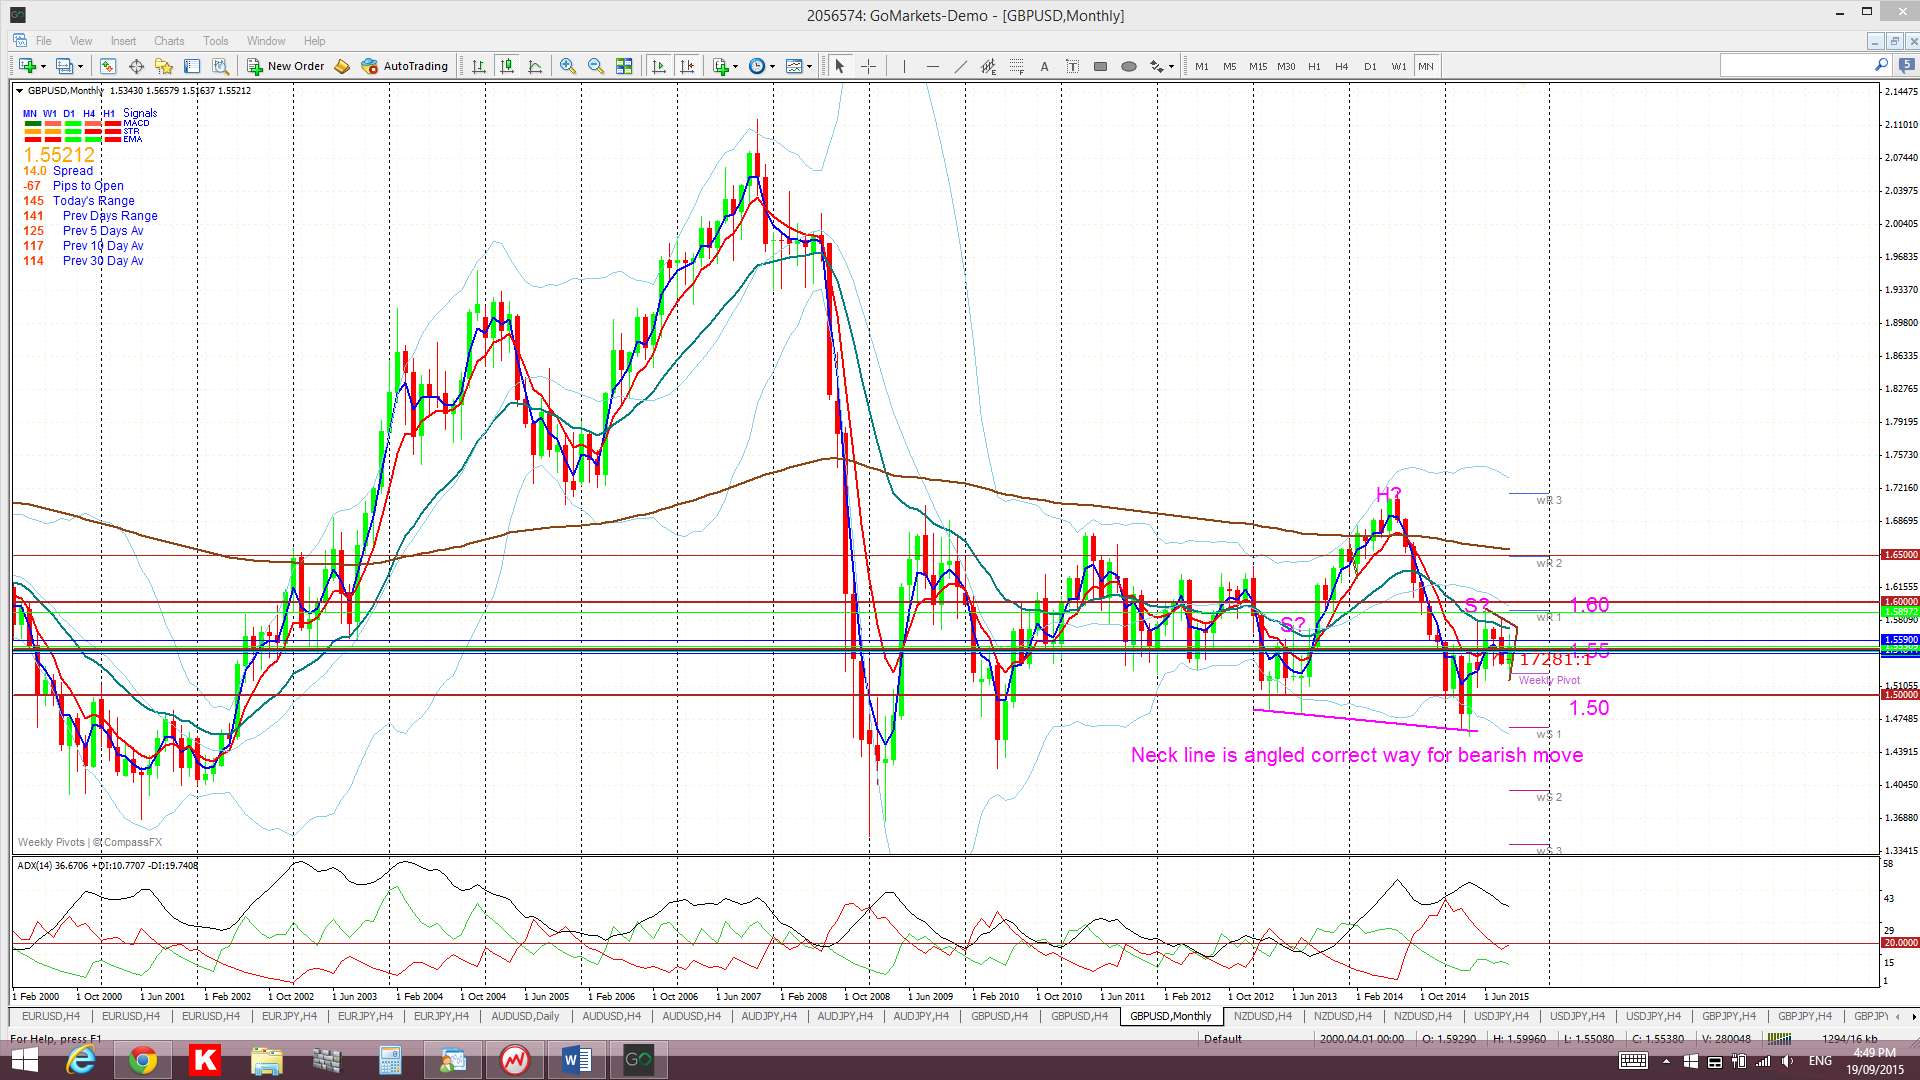
Weekly chart H&S: There is still a possible bearish H&S pattern forming on the weekly chart but the failure to break below the ‘neck line’ is holding this pattern off the time being. The height of the pattern is about 2,400 pips and suggests a similar move lower with any break and hold below the ‘neck line’. I would consider that any close and hold back above 1.60 would void this pattern.
Price is trading back below the Cloud on the 4hr, daily, weekly and monthly charts.
The weekly candle closed as a large bearish candle.
- I’m watching for any new TC signal on this pair, the revised support trend line and the 1.55 /1.50 levels.
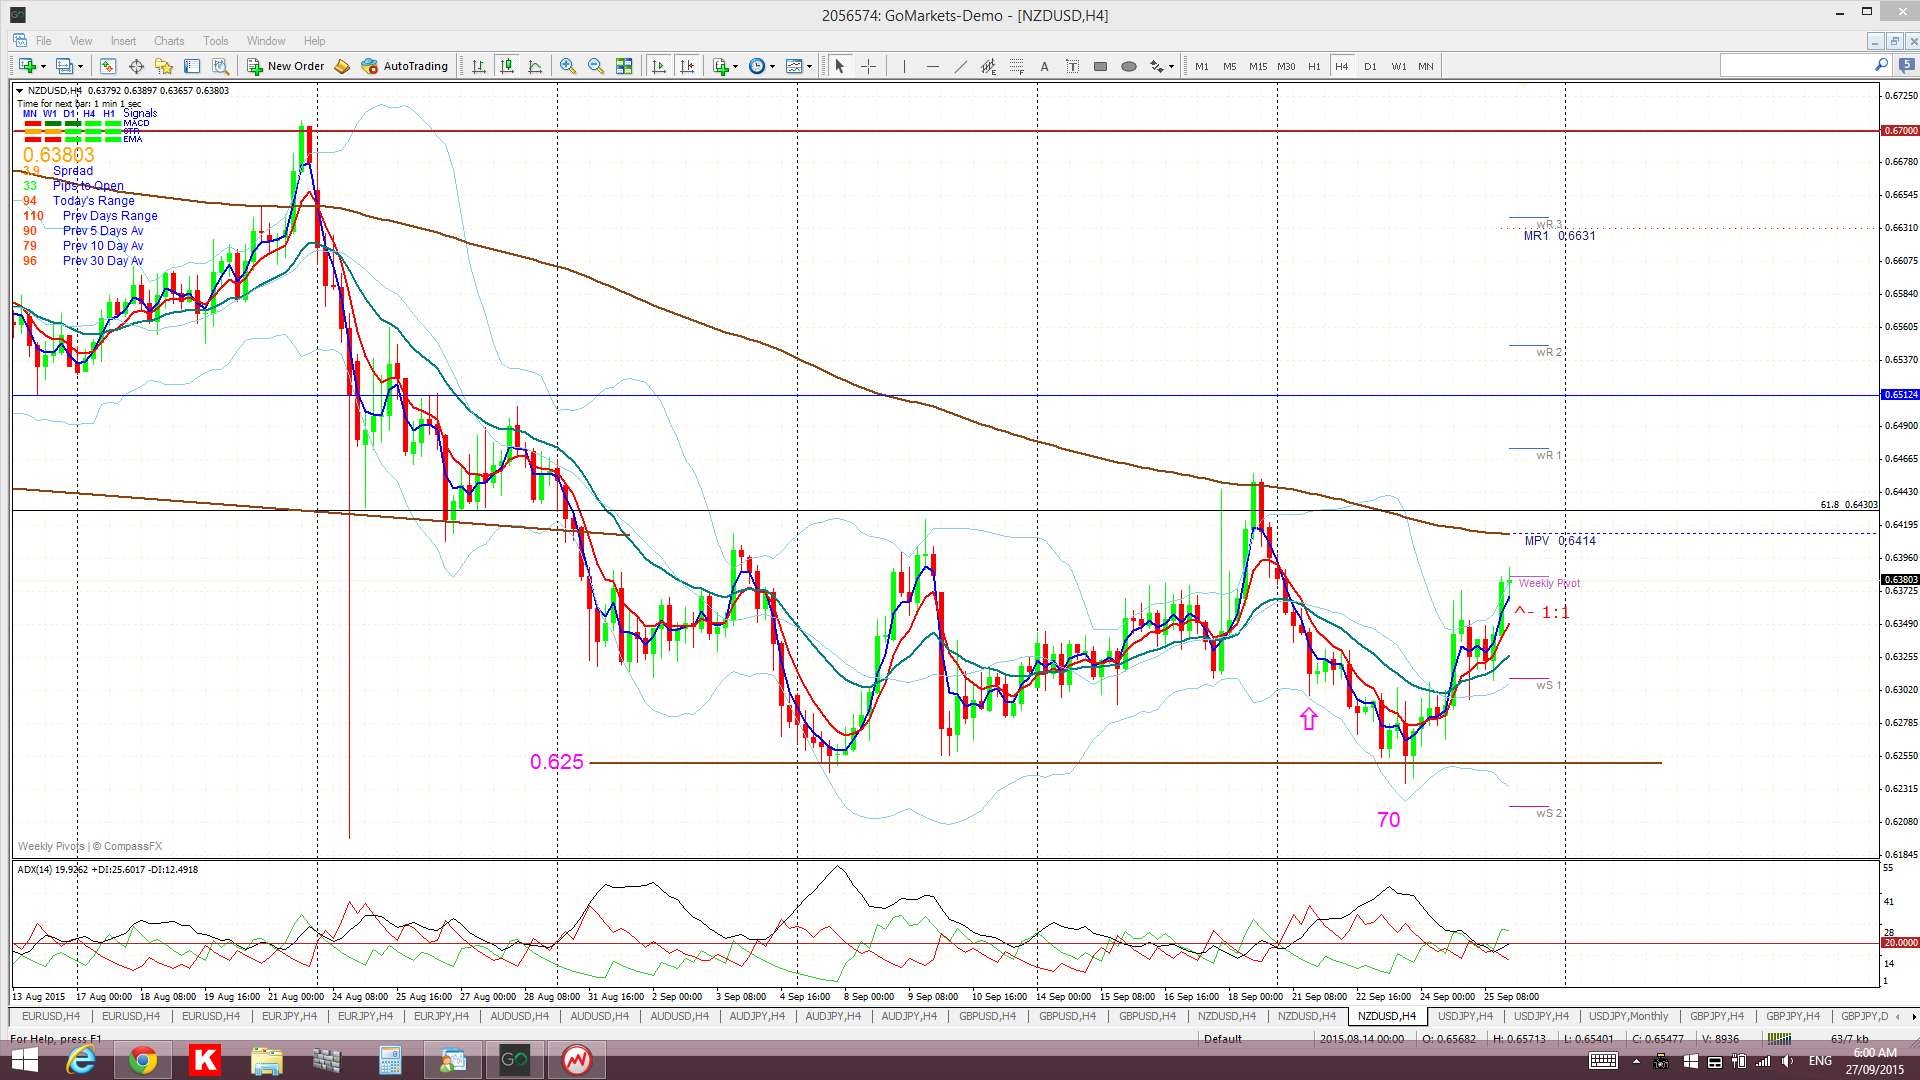
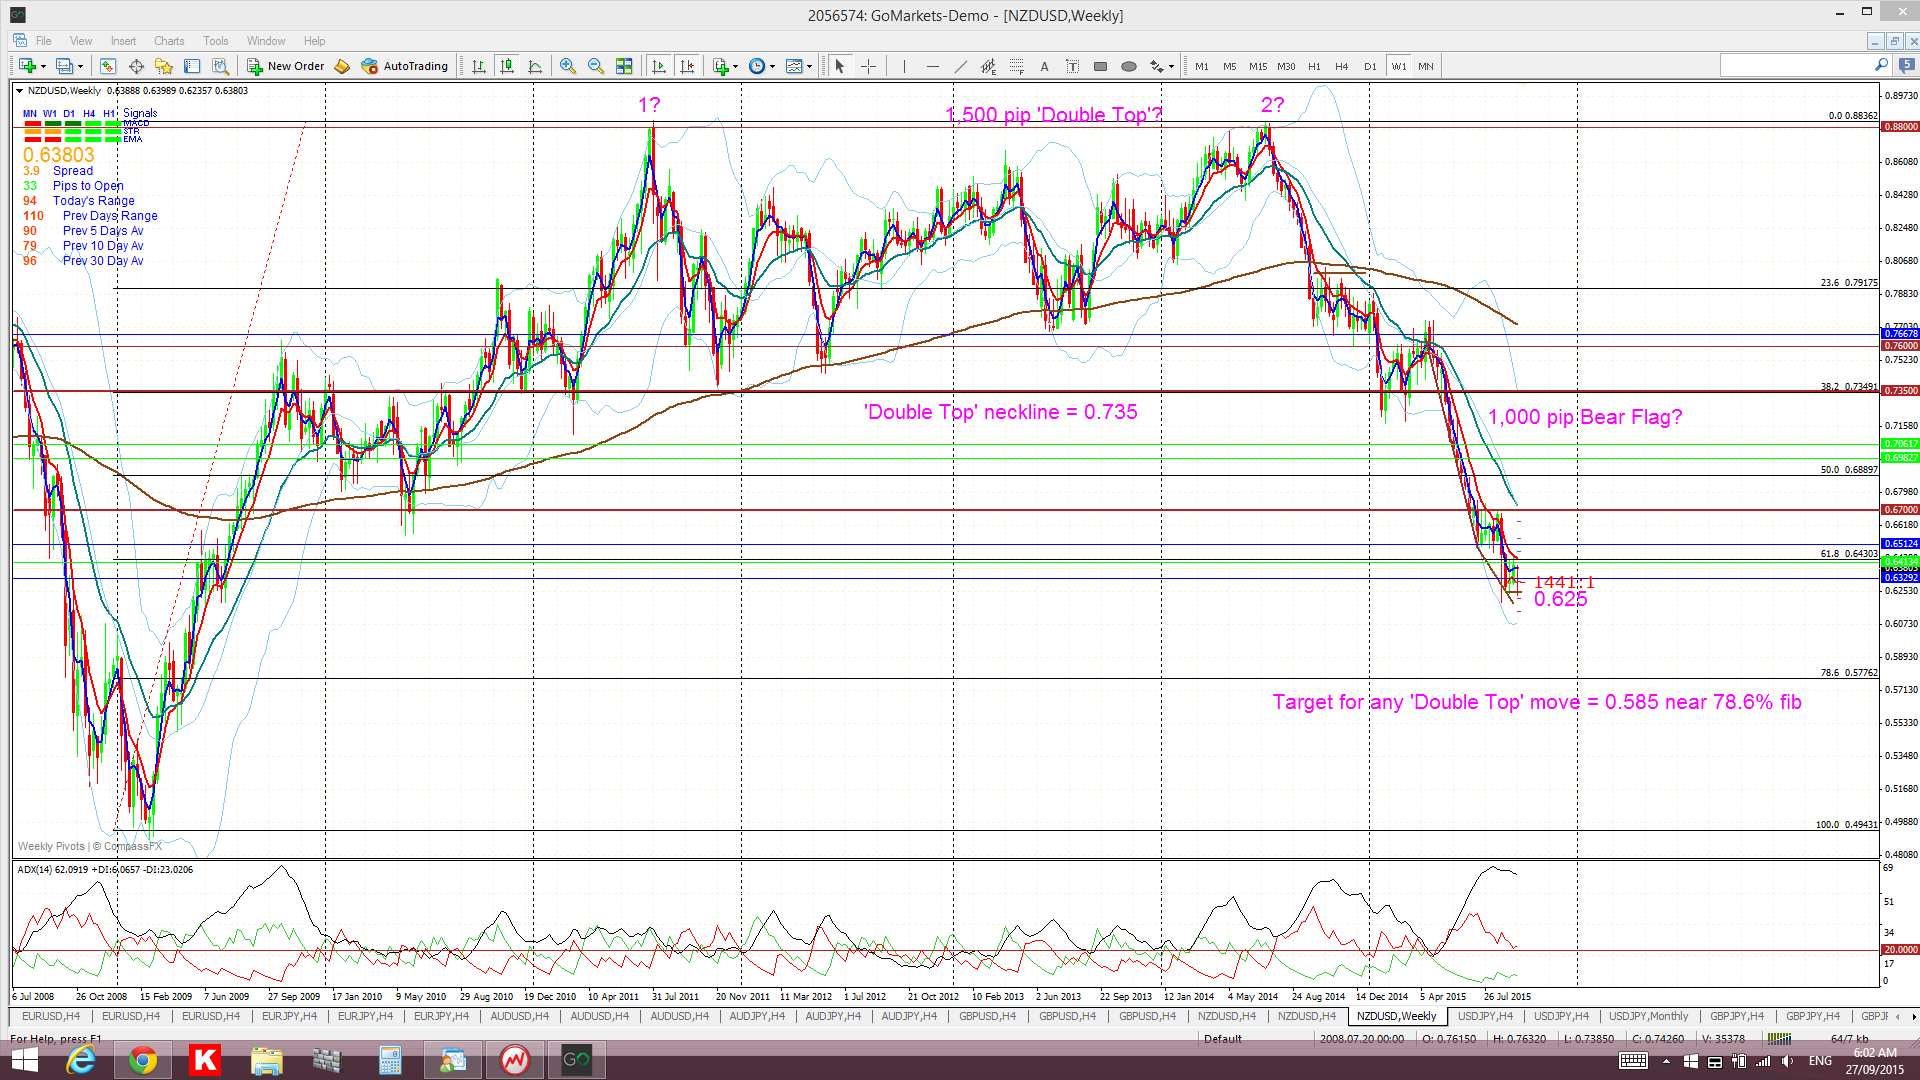
Kiwi: NZD/USD: The NZD/USD continues to hold up fairly well considering the pullback seen on the likes of the GBP/USD and AUD/USD. The 0.625 has offered some support and kept the recent TC signal down to just 70 pips before it closed off.
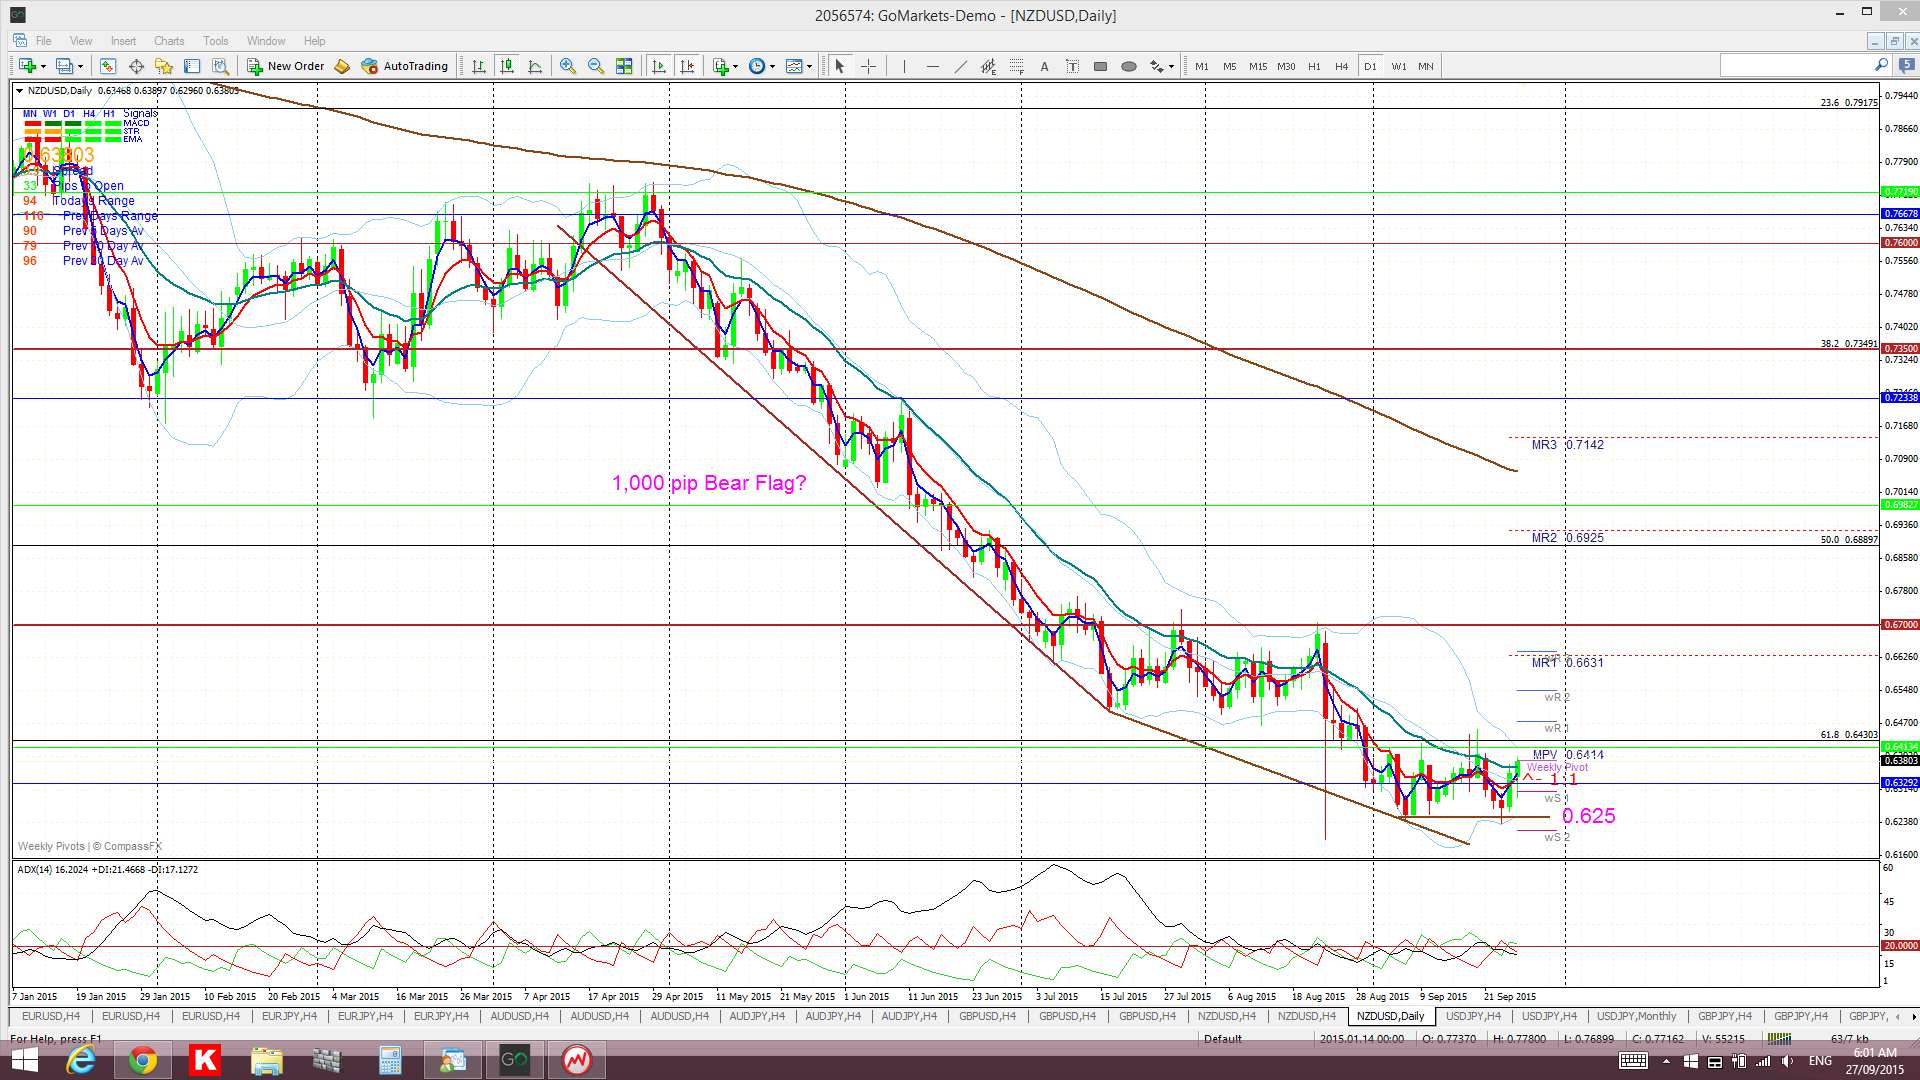
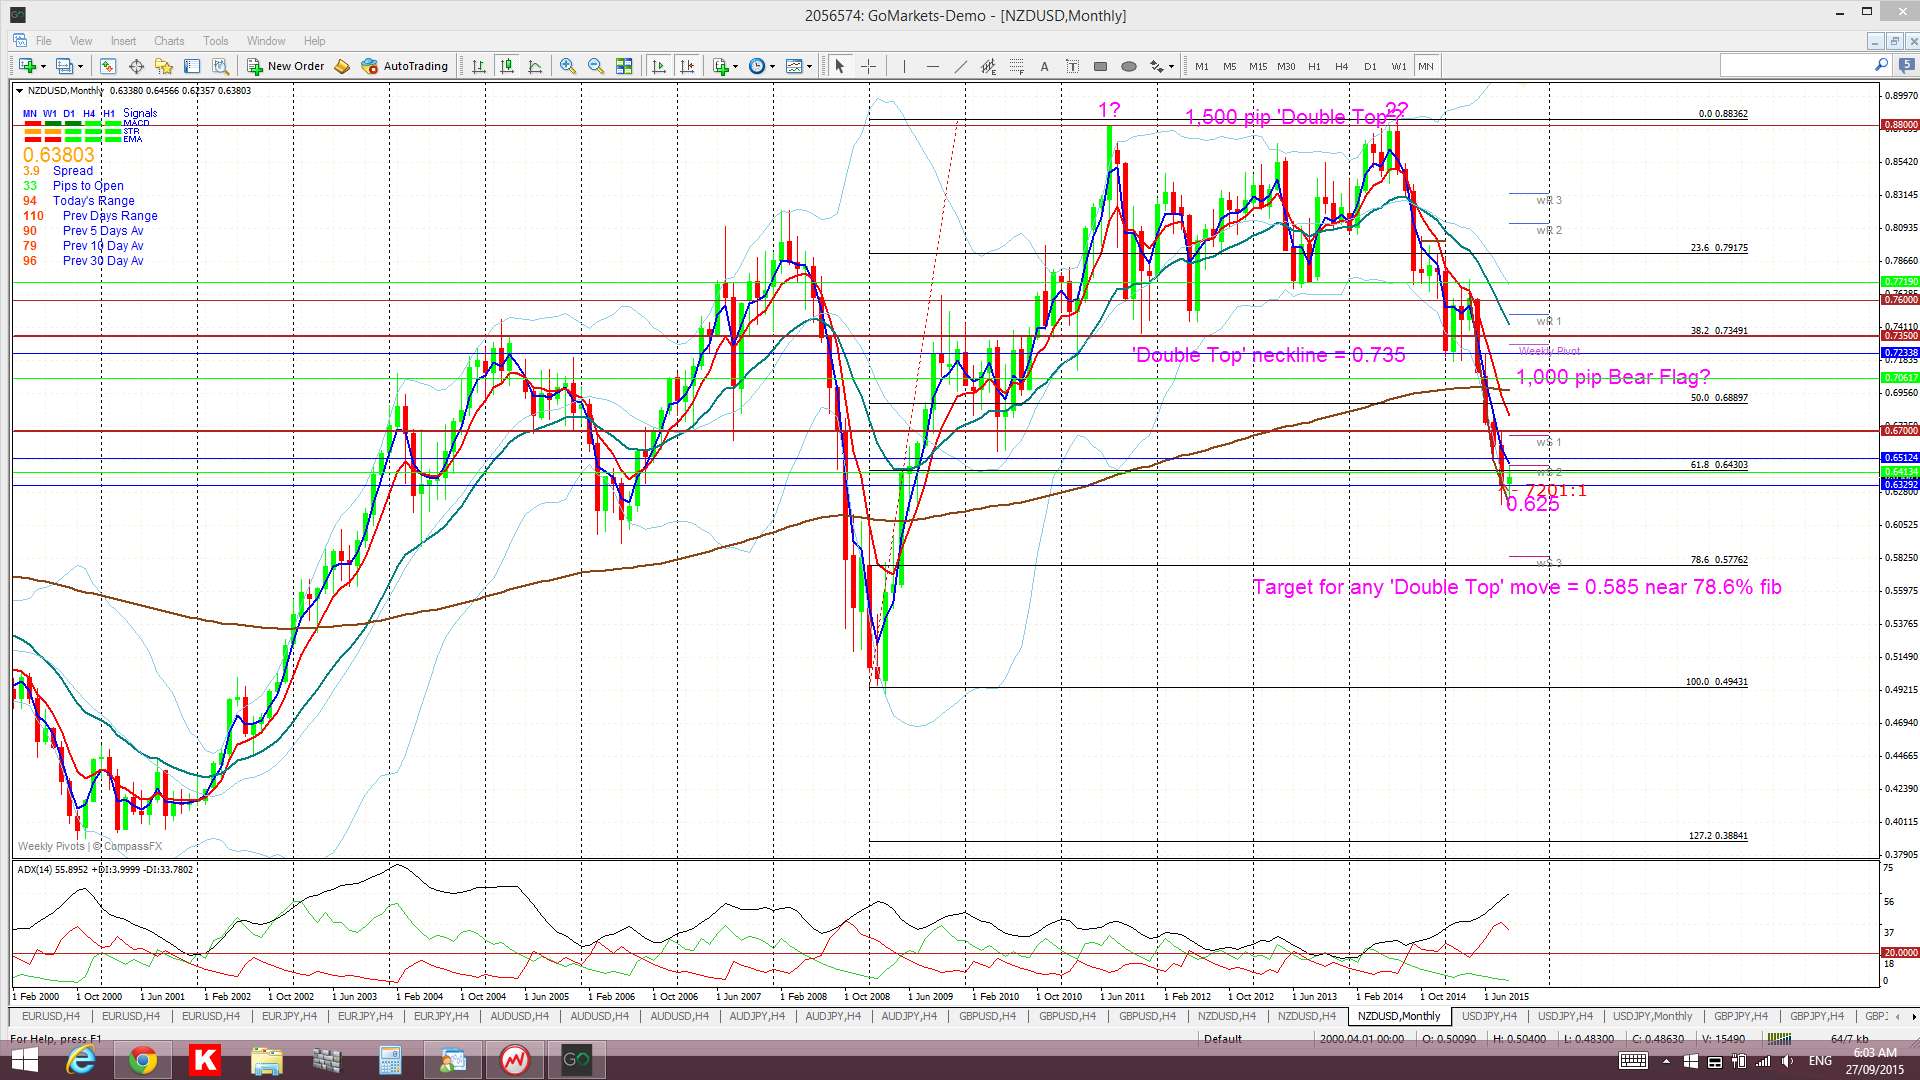
The monthly chart shows price a bit stranded below the 61.8% fib and 0.64 support but above the 78.6% fib. This chart also shows how this pair has given up to 1,000 pips of a potential 1,500 pip ‘Double Top’ breakdown.
For now, though, the 4hr chart shows price recovering and even trying to print a new LONG TC signal! Well go figure but we shall have to wait and see. Friday’s NFP may provide more clarity here as any continued US$ strength would help to keep pressure on this pair.
‘Double Top’ breakdown on Monthly chart? The monthly chart still reveals a ‘Double Top’ pattern with a neck line at 0.735. The monthly candle close below this level for January suggested a possible 2,000 pip bearish follow through move as this is the height of the ‘Double Top’. This bearish move has spiked to over 1,000 pips so far.
Price is trading in the top edge of the 4hr Cloud but below the Cloud on the daily, weekly charts and monthly charts.
The weekly candle closed as bearish coloured Doji candle reflecting some indecision here.
There is only NZD ANZ Business Confidence data for the Kiwi this week but watch for reaction to Thursday’s Chinese Manufacturing PMI and the batch of US$ sensitive news, especially Friday’s NFP.
- I’m watching for any new TC signal on this pair and the 0.625 level.
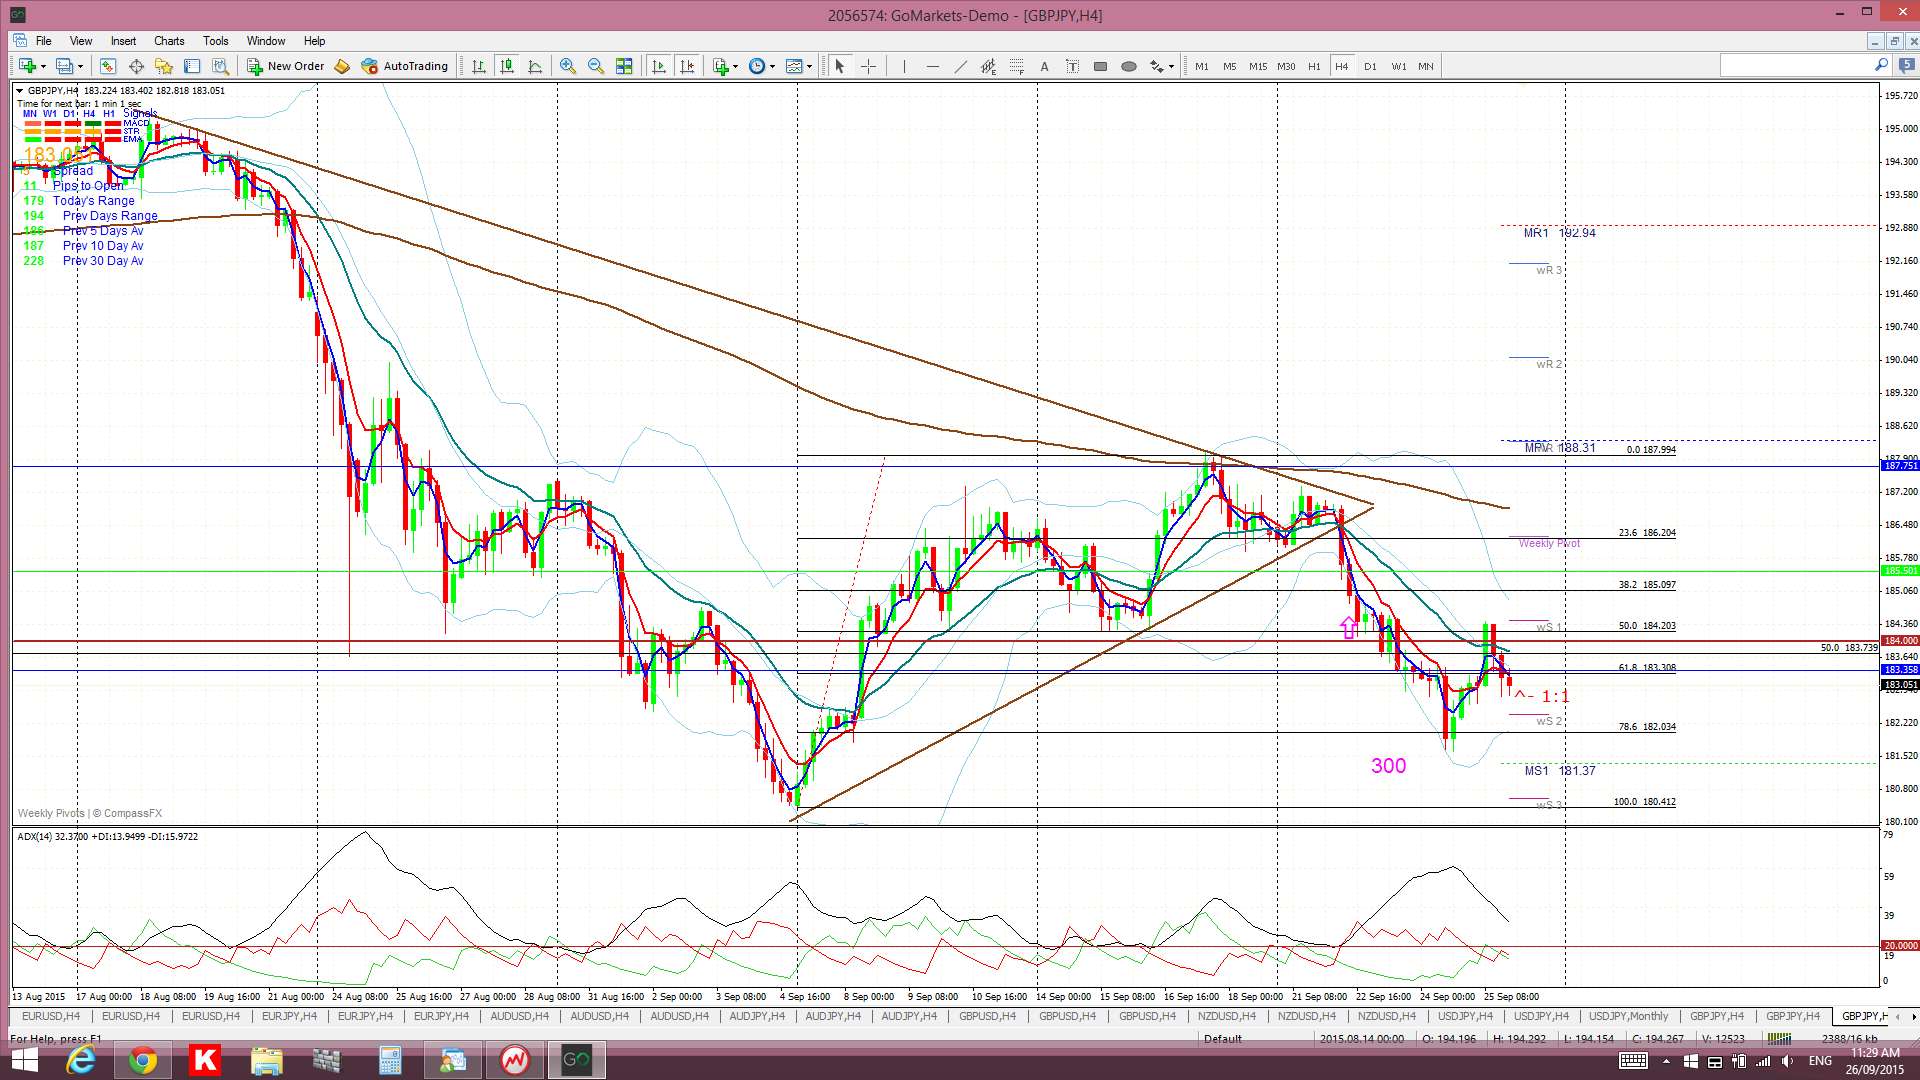
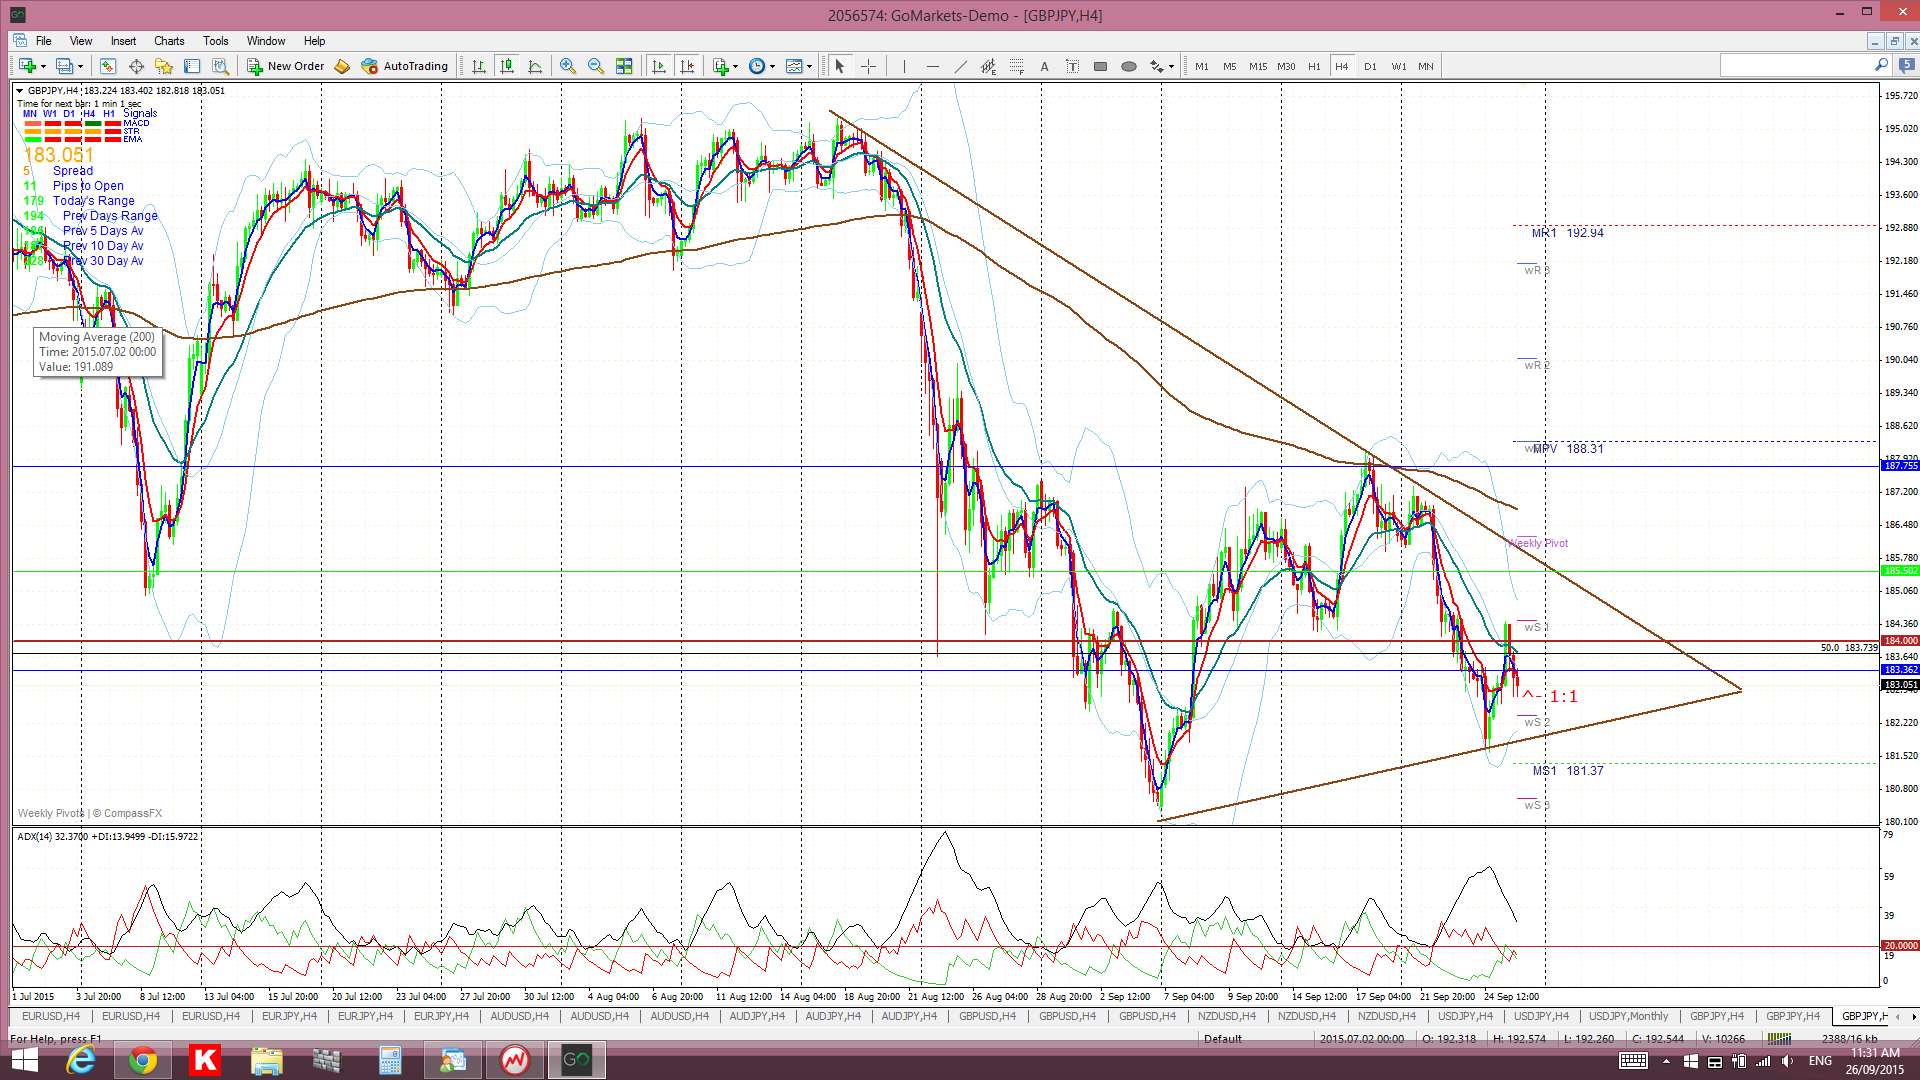
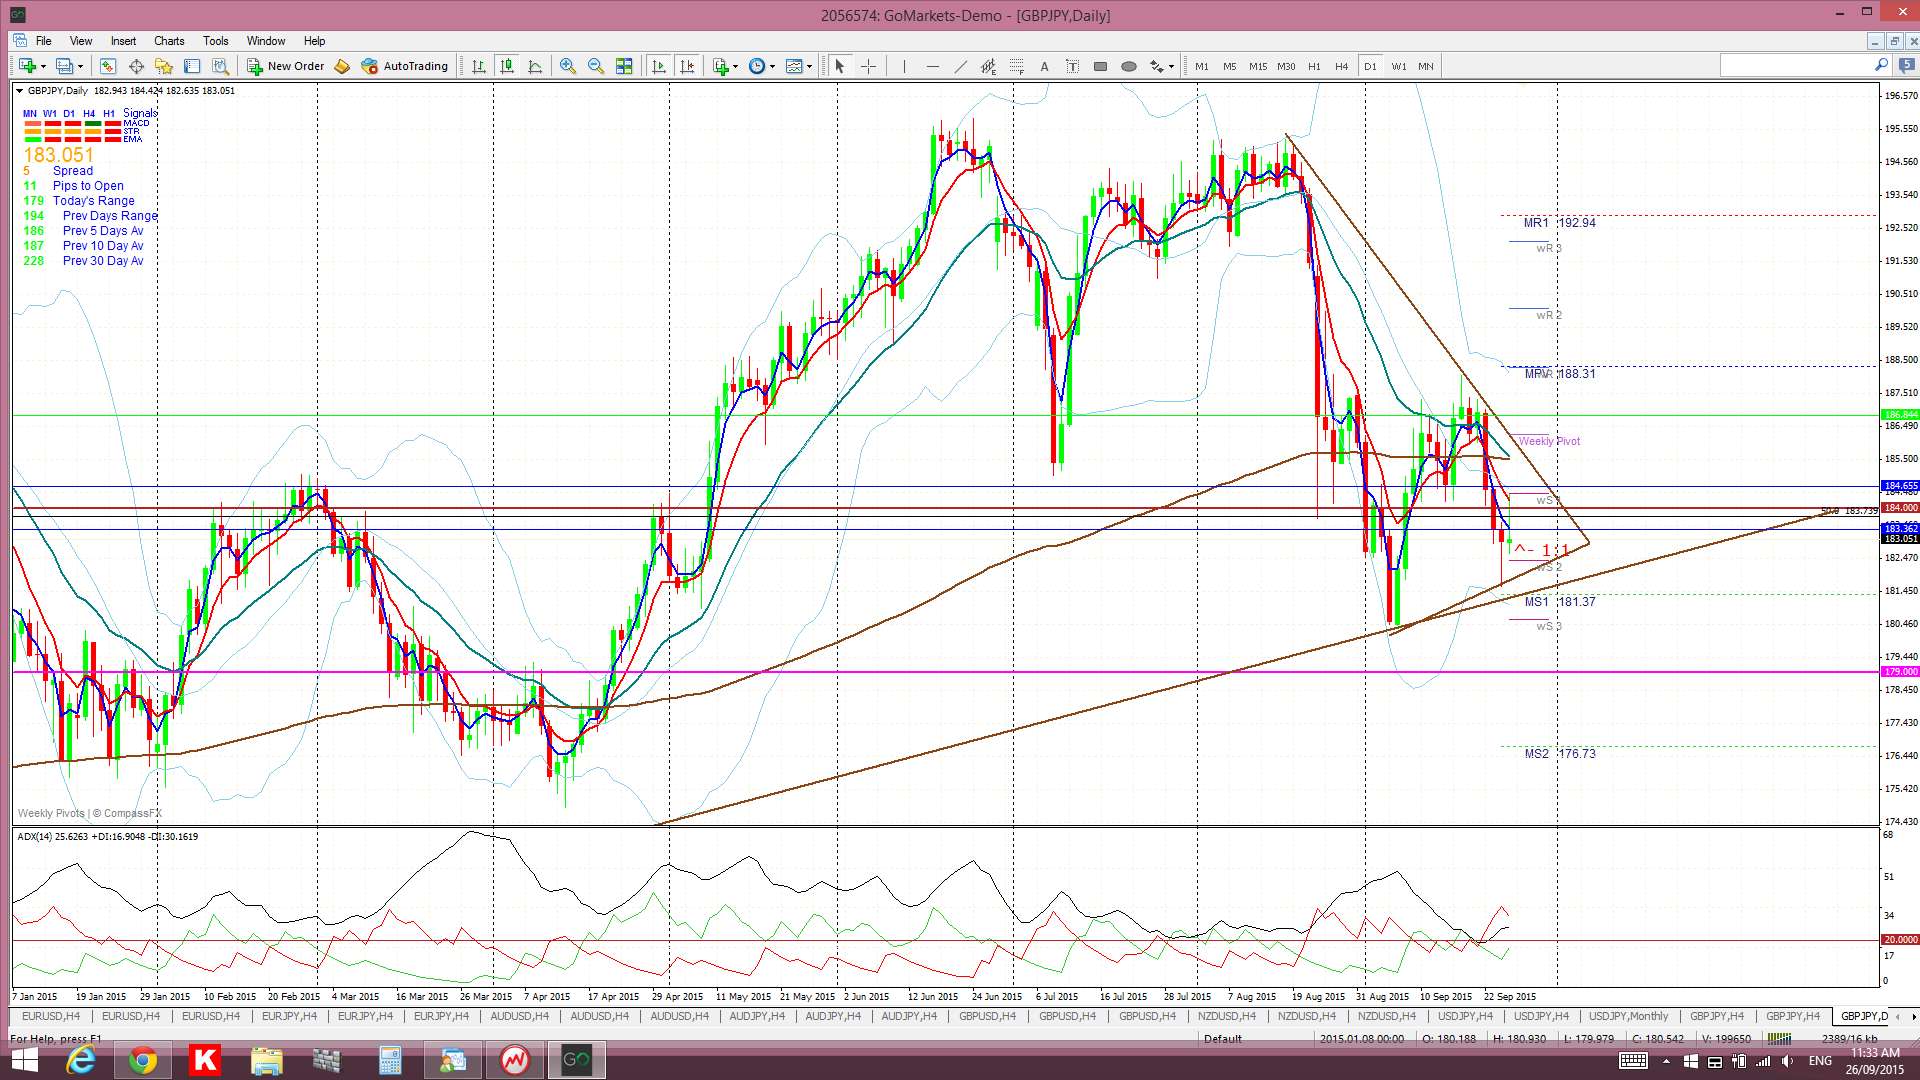
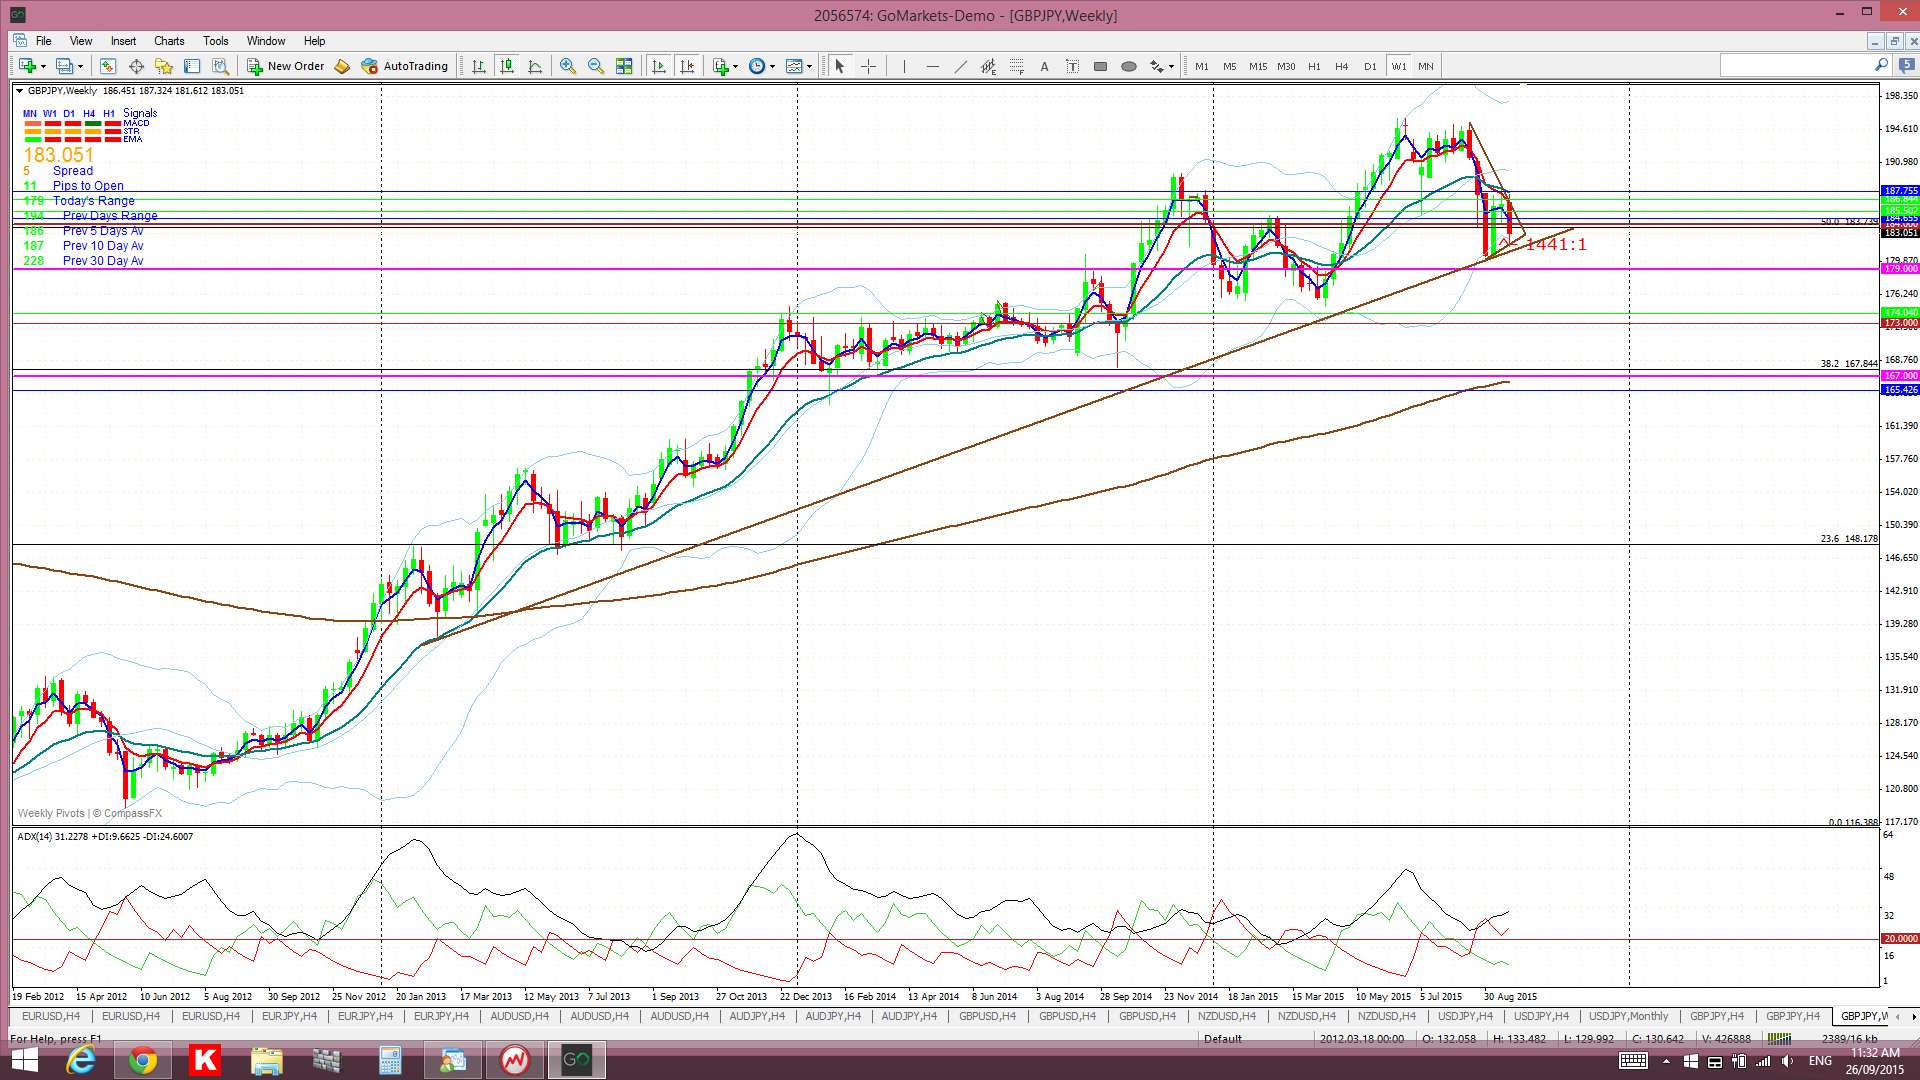
GBP/JPY: The GBP/JPY also gave a great triangle breakdown trade last week but this one came with a TC signal trade that delivered up to 300 pips before closing off. The key 184 still features strong here with another test before closing below this for the week.
Like with the GBP/USD, I have revised the trend lines here too. Hence, the two different 4hr chart shots below.
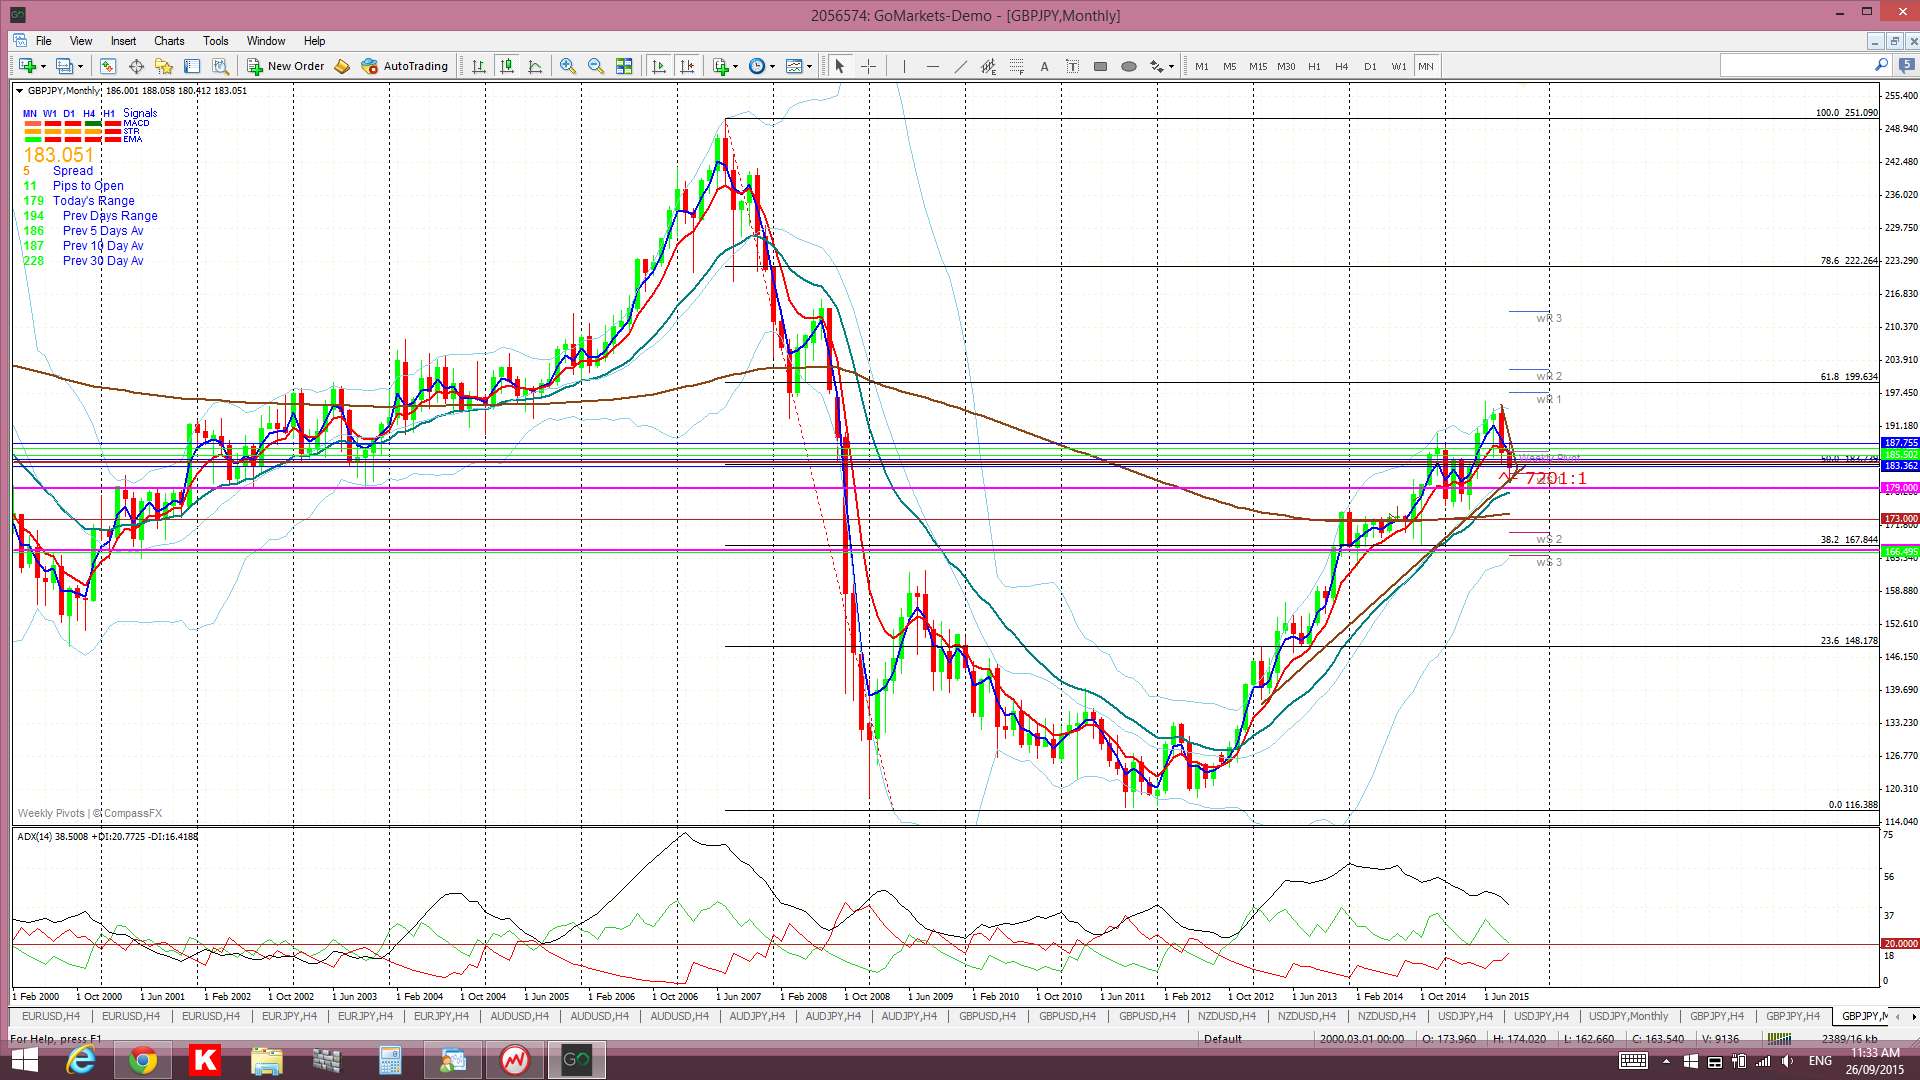
Price is trading below the Ichimoku Cloud on the 4hr and daily charts but above on the weekly and monthly charts.
The weekly candle closed as a bearish engulfing candle.
- I’m watching for any new TC signal on this pair, the 184 level and the revised triangle pattern.
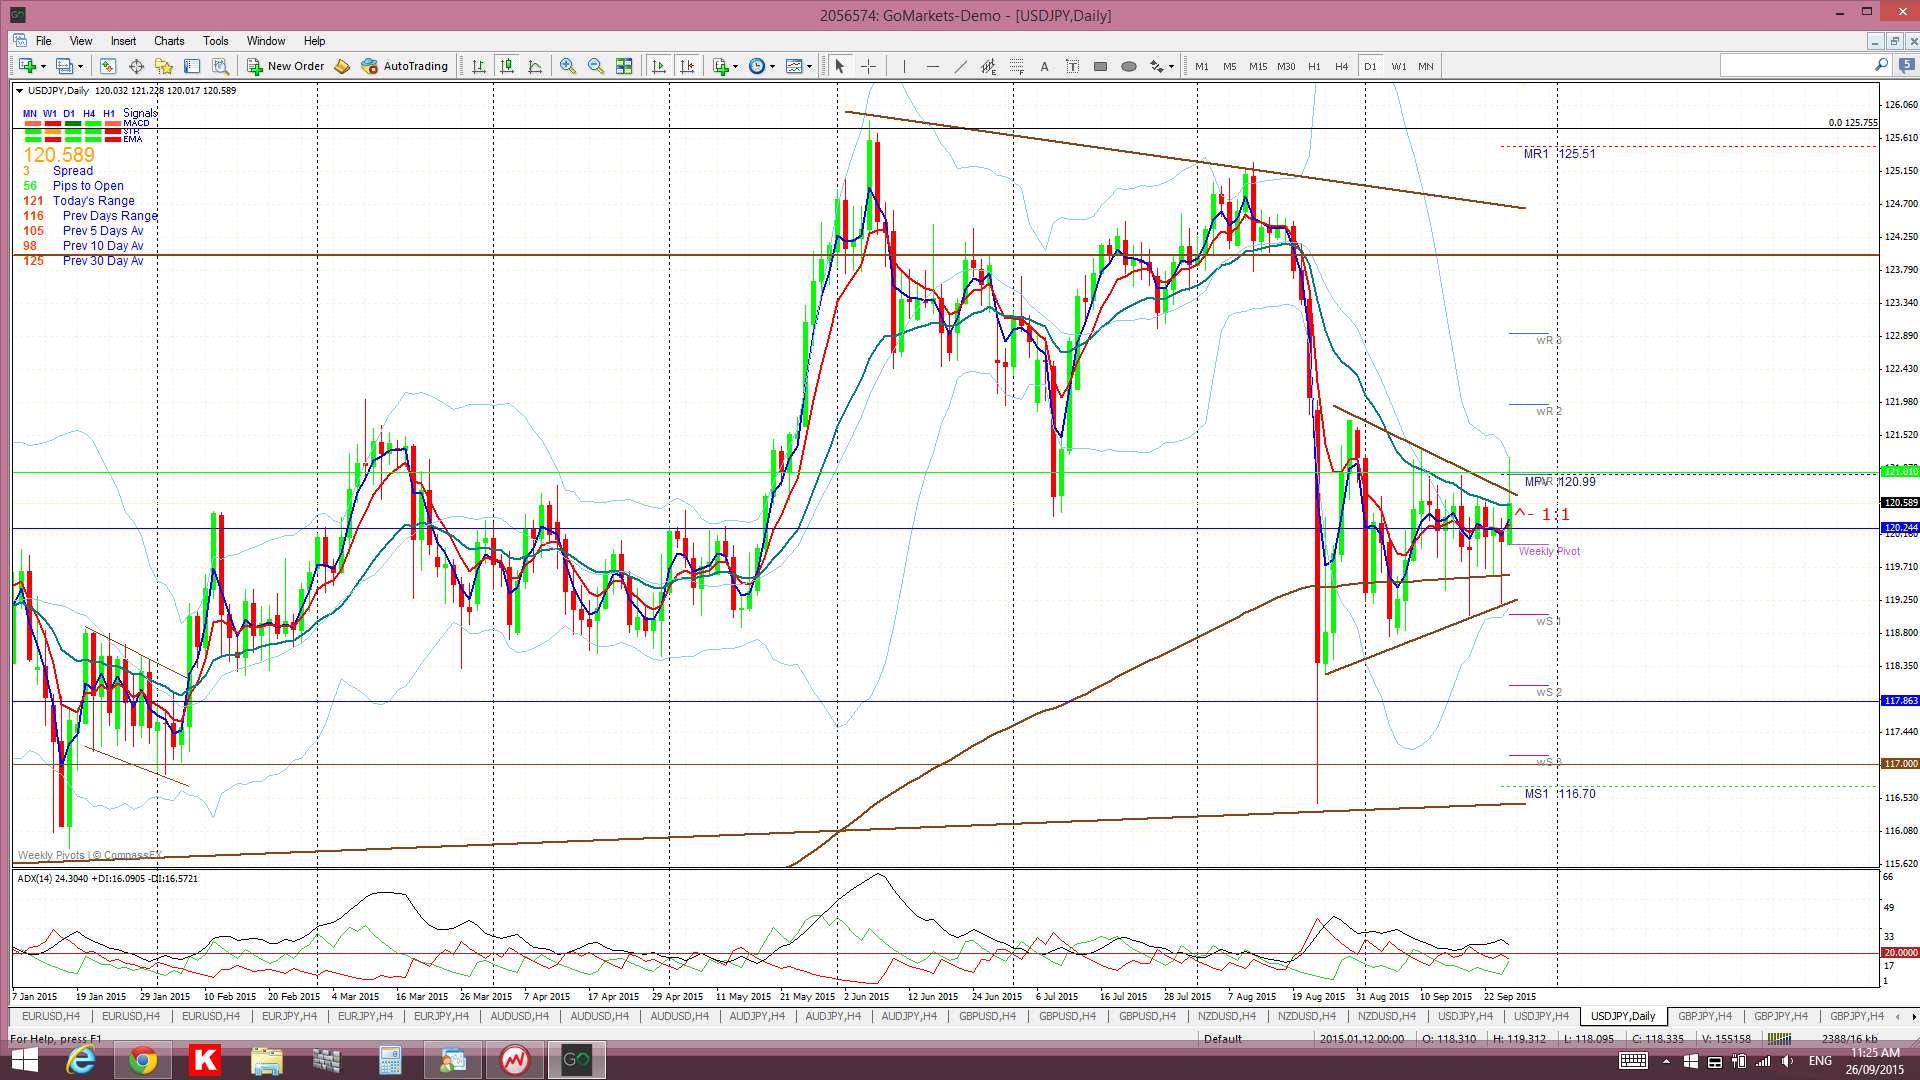
The Yen: U/J: The U/J has chopped sideways for the last five weeks but weak Japanese CPI data on Friday helped to trigger a bullish trend line breakout, or so I thought! This breakout came with a new TC signal but price pulled back, in spite of subsequent upbeat US GDP data. This pull back may have been simply due to the pair having already given an above average ATR move for the day, prior to the US data, or due to the continued jitters across US stock markets helping to develop Yen ‘flight to safety’ strength. Whatever the cause price action could continue on trend next week, however, given that US NFP is not released until next Friday, we may see choppy action continue until the end of the week.
Price is trading below the Cloud on the daily chart but above the Cloud on the 4hr, weekly and monthly charts.
The weekly candle closed as a bullish coloured ‘Spinning Top’ and ‘Inside’ candle; both patterns reflecting indecision here!
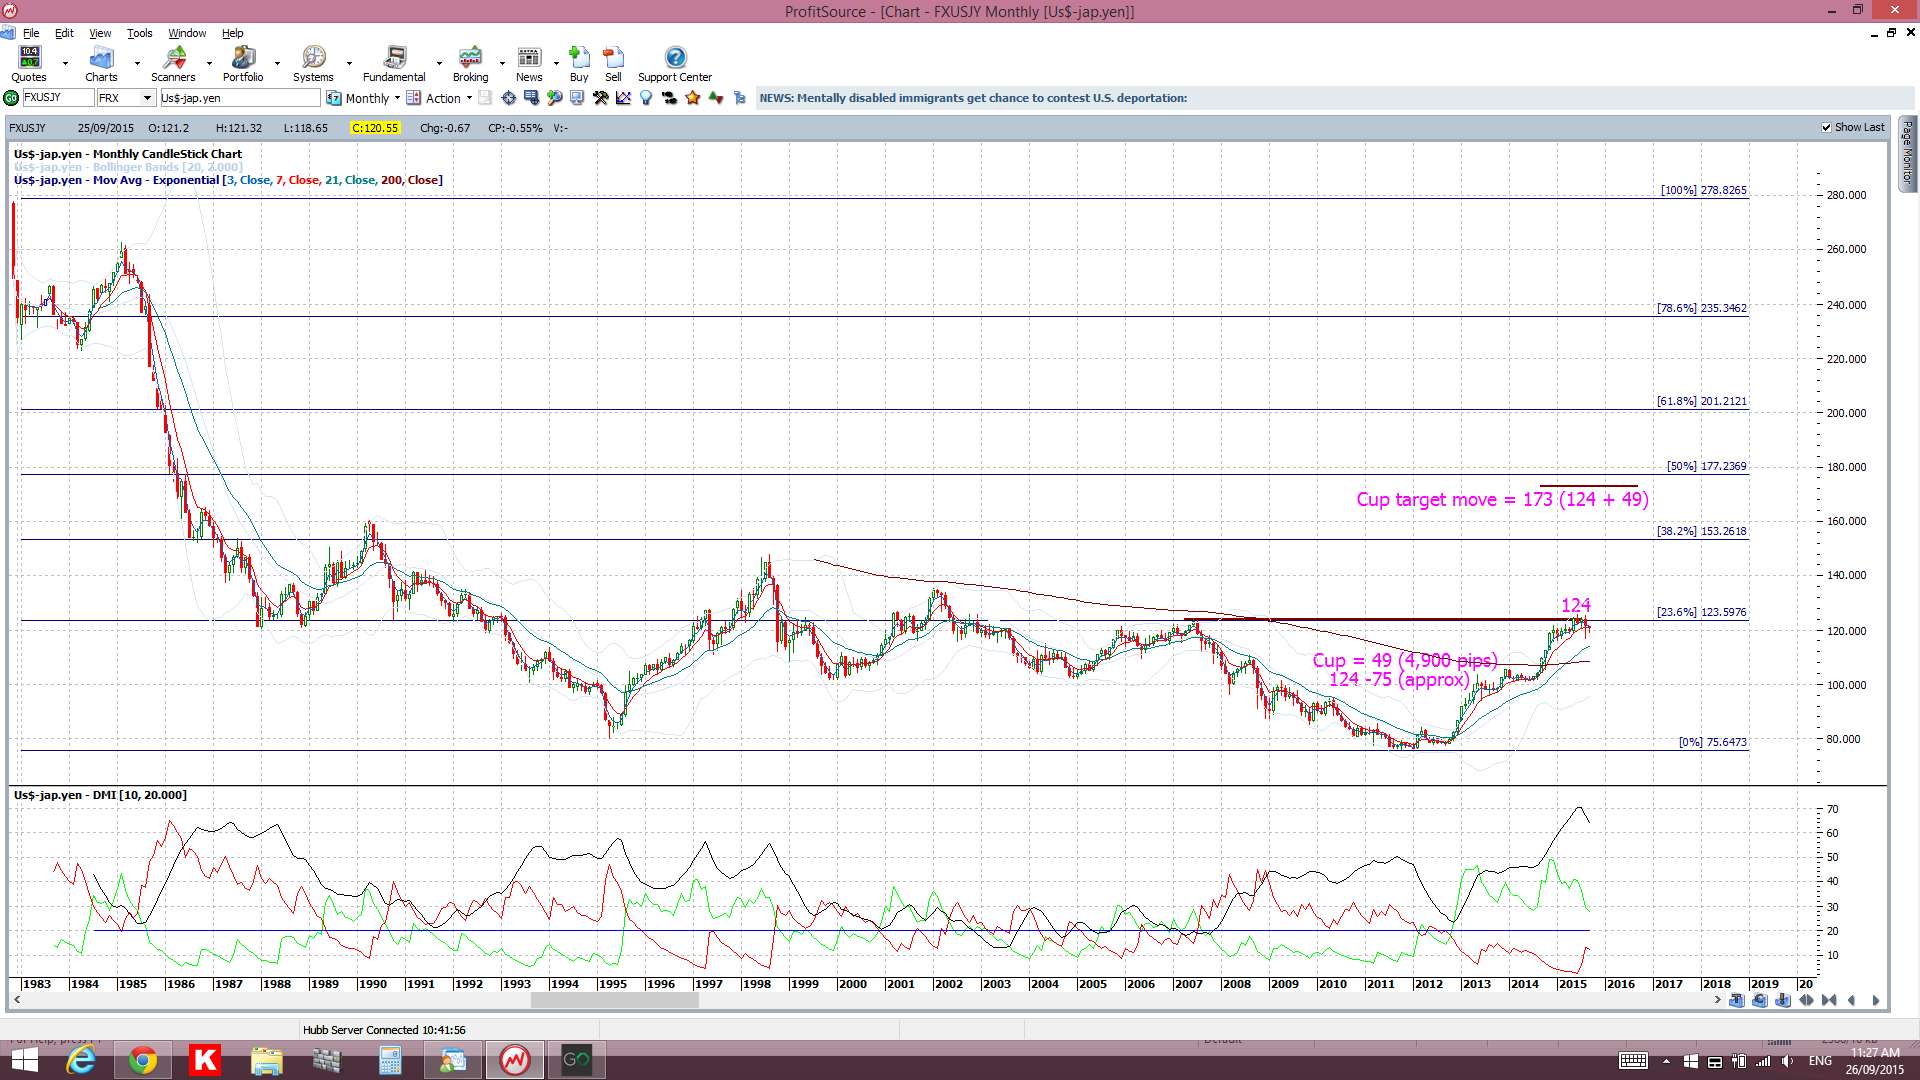
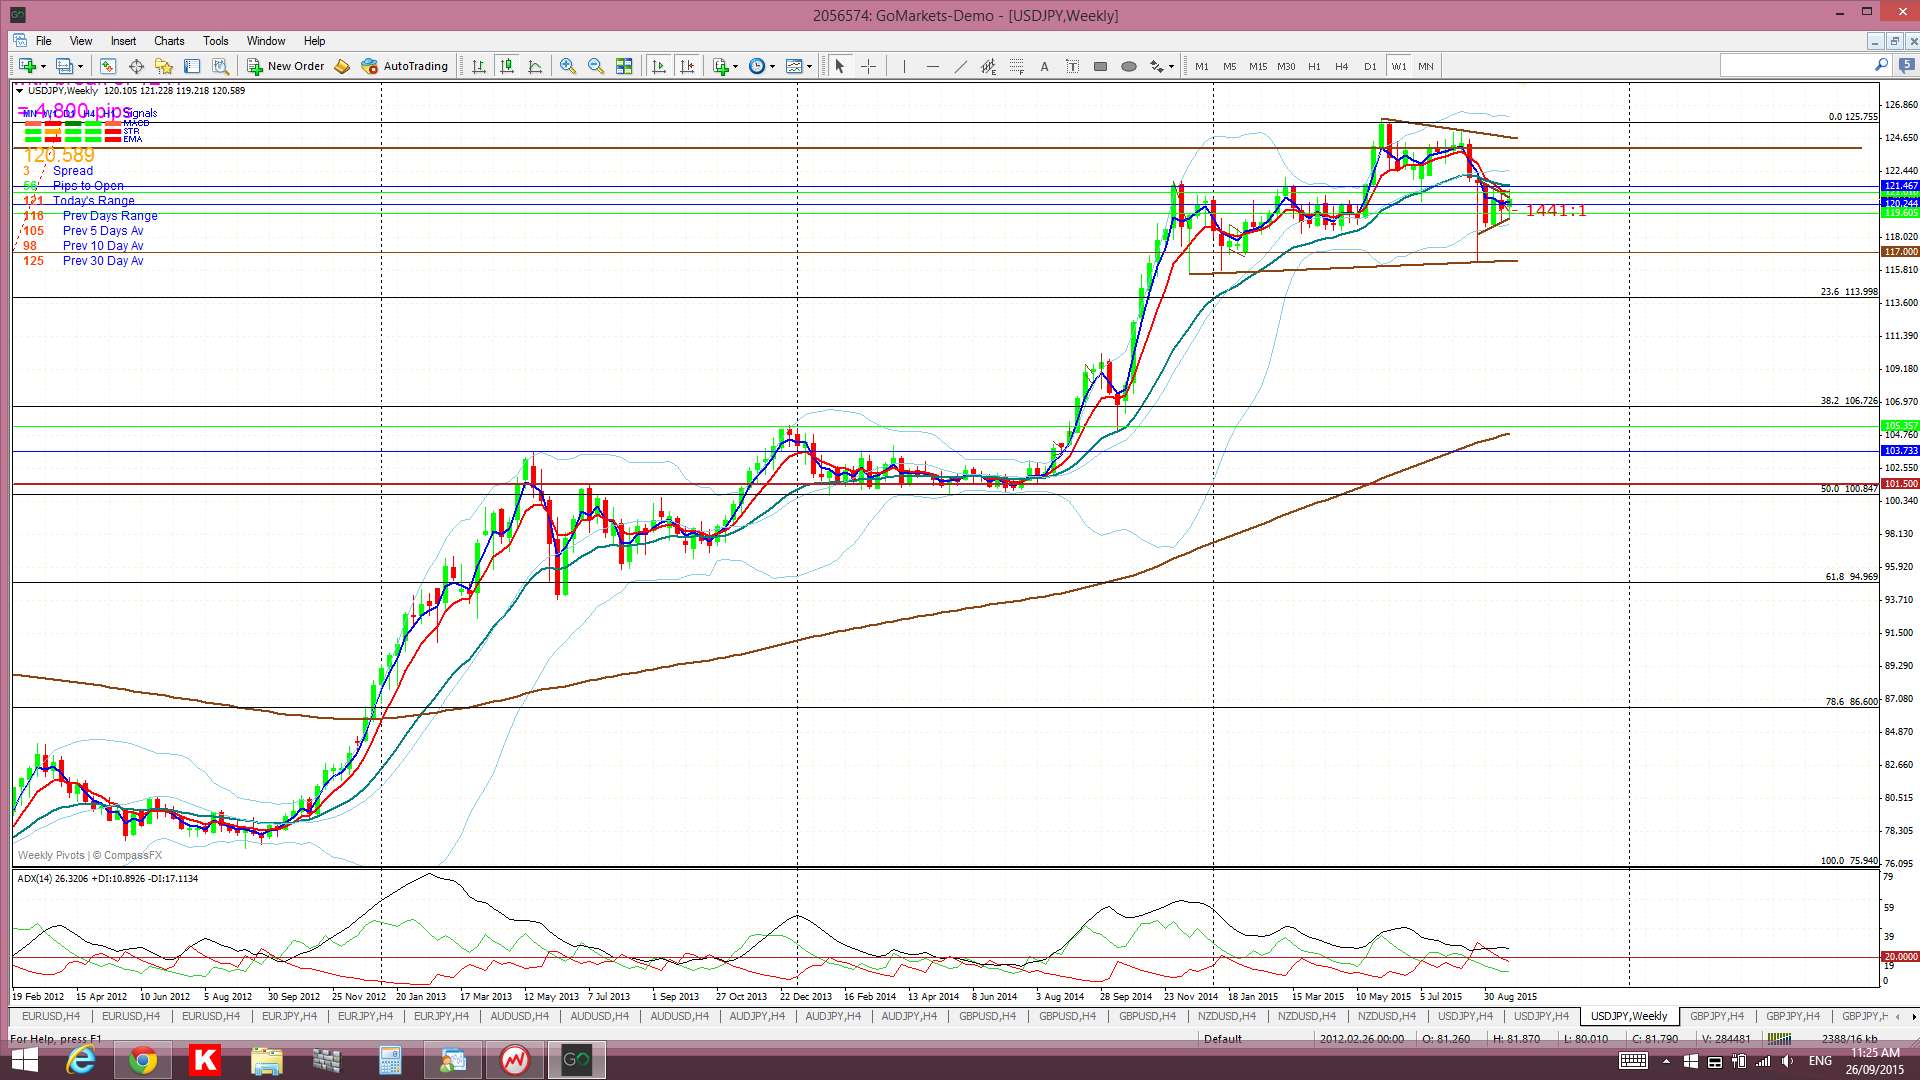
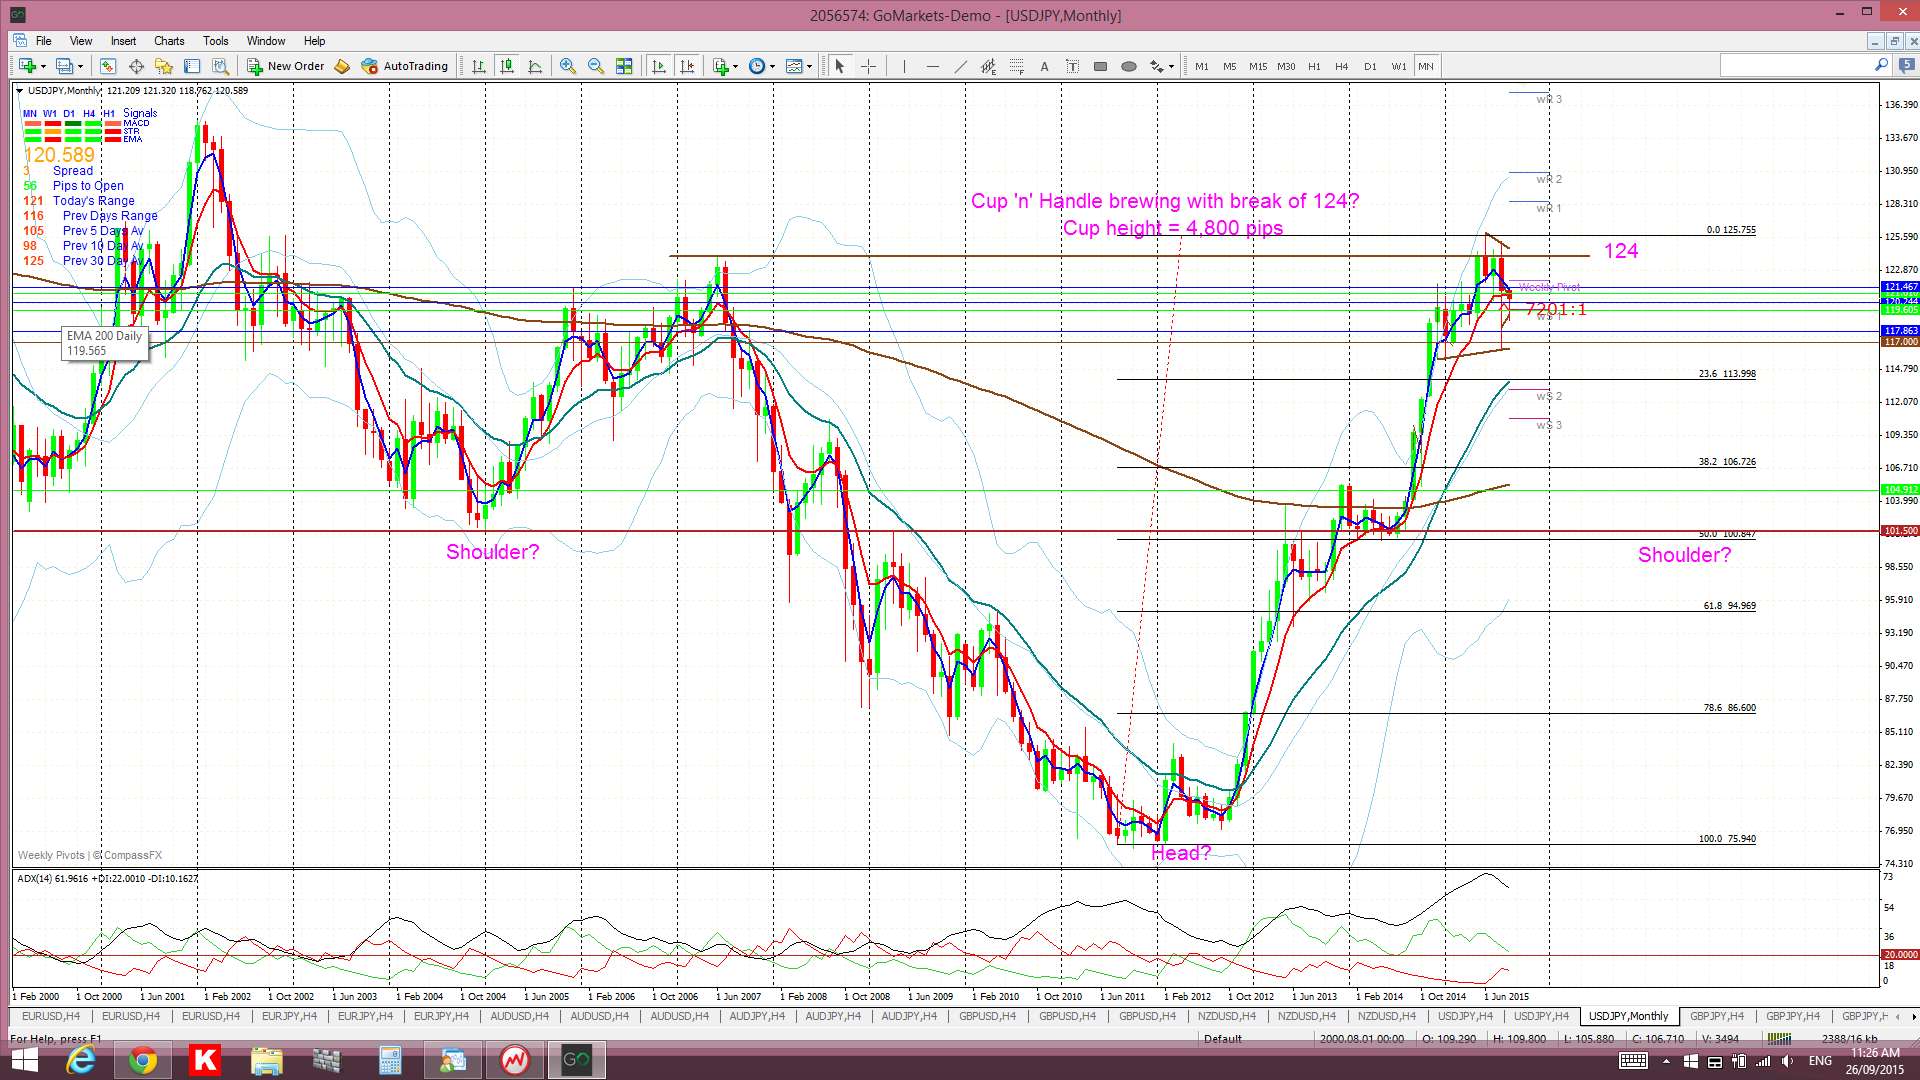
Monthly Chart Bullish Cup’ n’ Handle pattern: There looks to be a new bullish Cup ‘n’ Handle forming up on the monthly chart. The theory behind these patterns is that the height of the ‘Cup’ pattern is equivalent to the expected bullish move from the ‘handle’ breakout. The height of the Cup for the U/J weekly chart is around 4,800 ~ 4,900 pips. This may seem like a massive move but the longer term chart below shows this move to be reasonable as it would take the U/J up near the 50% fib of the 1985-2012 swing low move. Note the 101.5 level on the other MT4 monthly chart though. Any pullback down to this level, apart from helping to form up a huge Handle for the Cup ‘n’ Handle, would also help to develop a bullish ‘inverse H&S’ pattern:
- There is an open TC signal here.
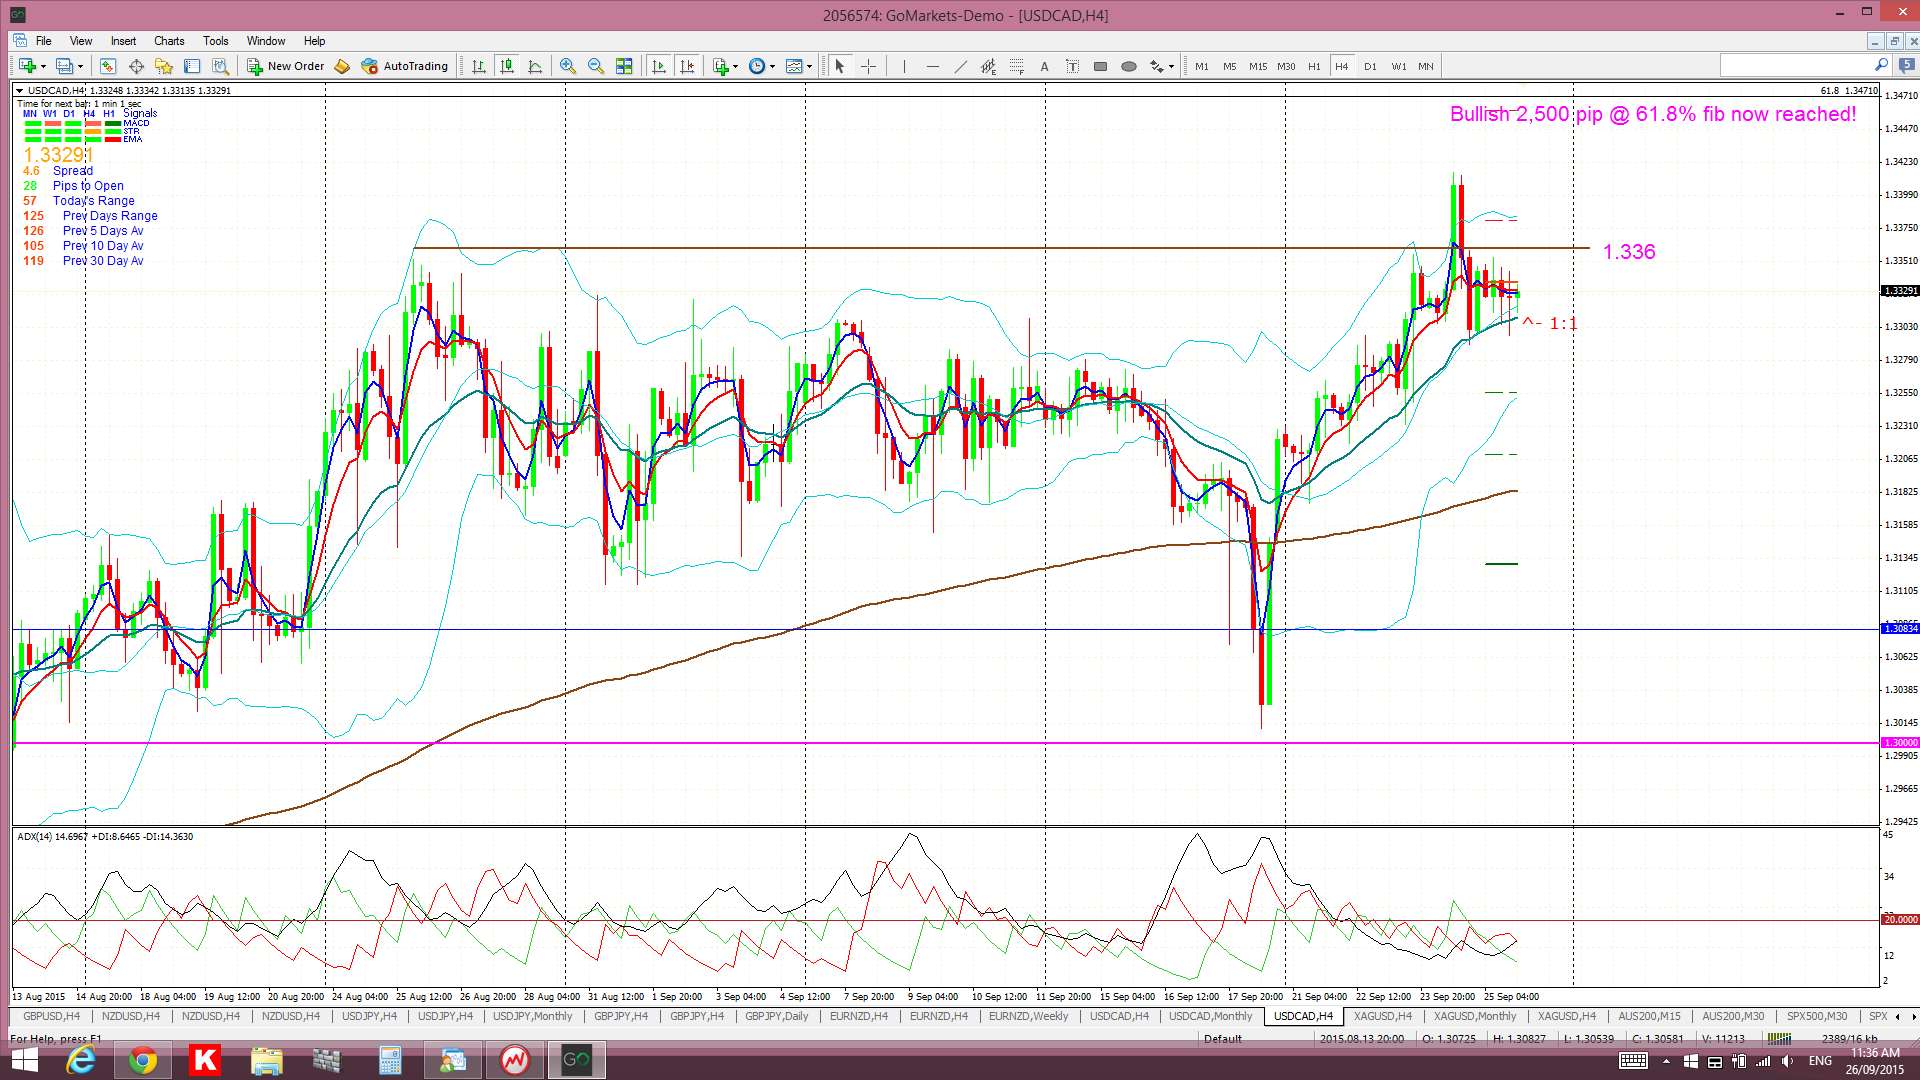
USD/CAD: USD/CAD price action continues to be rather choppy above the key 1.30 level and under the 1.336 level. The 61.8% fib of the monthly chart’s 2001-2007 swing low move is just above current price and keeping a lid on activity for now. This move essentially completes the bullish triangle breakout (described below) that was first charted back in October 2014! I wrote an article on this pair last week and this can be found through this link.
I’m still seeing a new ‘Cup’ pattern forming up on the monthly chart and this brings the potential of extended choppiness around this 1.30 and 61.8% fib region so as to create the ‘Handle’. However, any surprise interest rate cut on Wednesday could see this pair continue to rally up from the broken 1.30 S/R level.
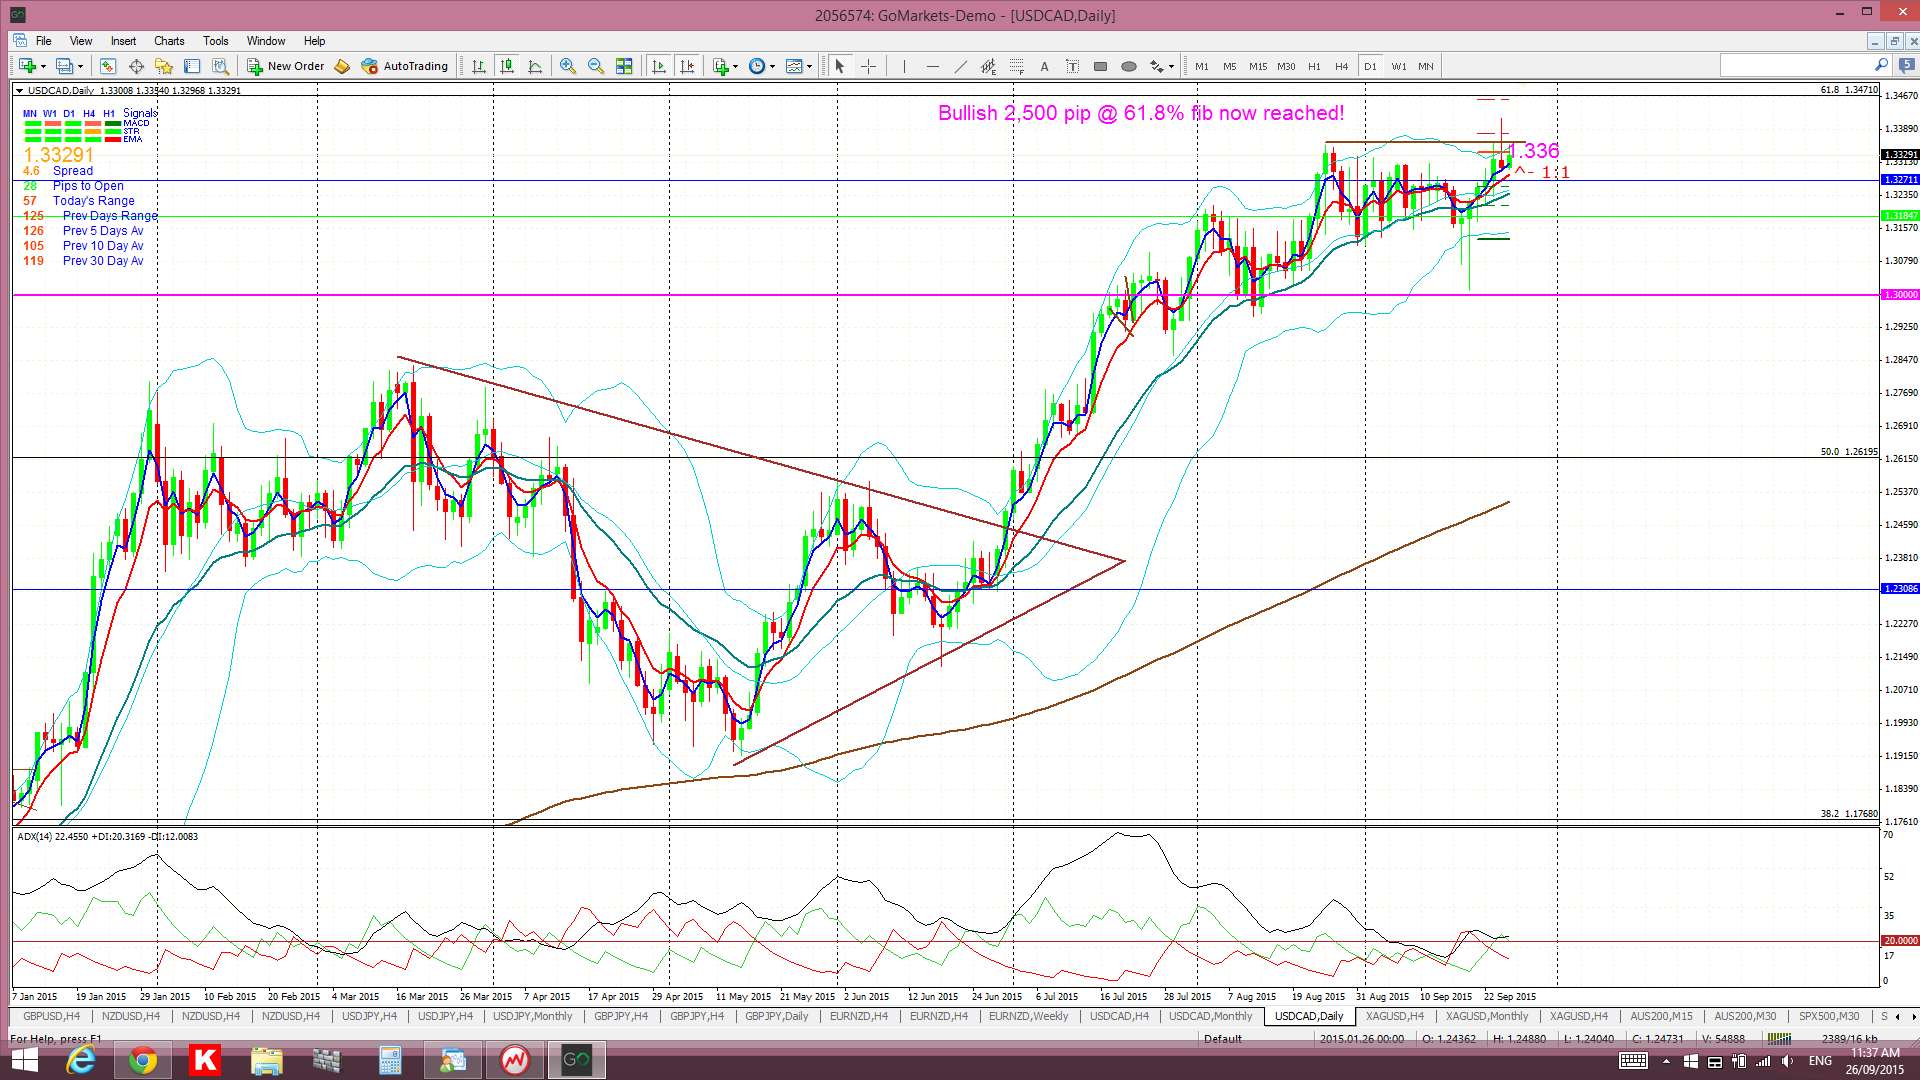
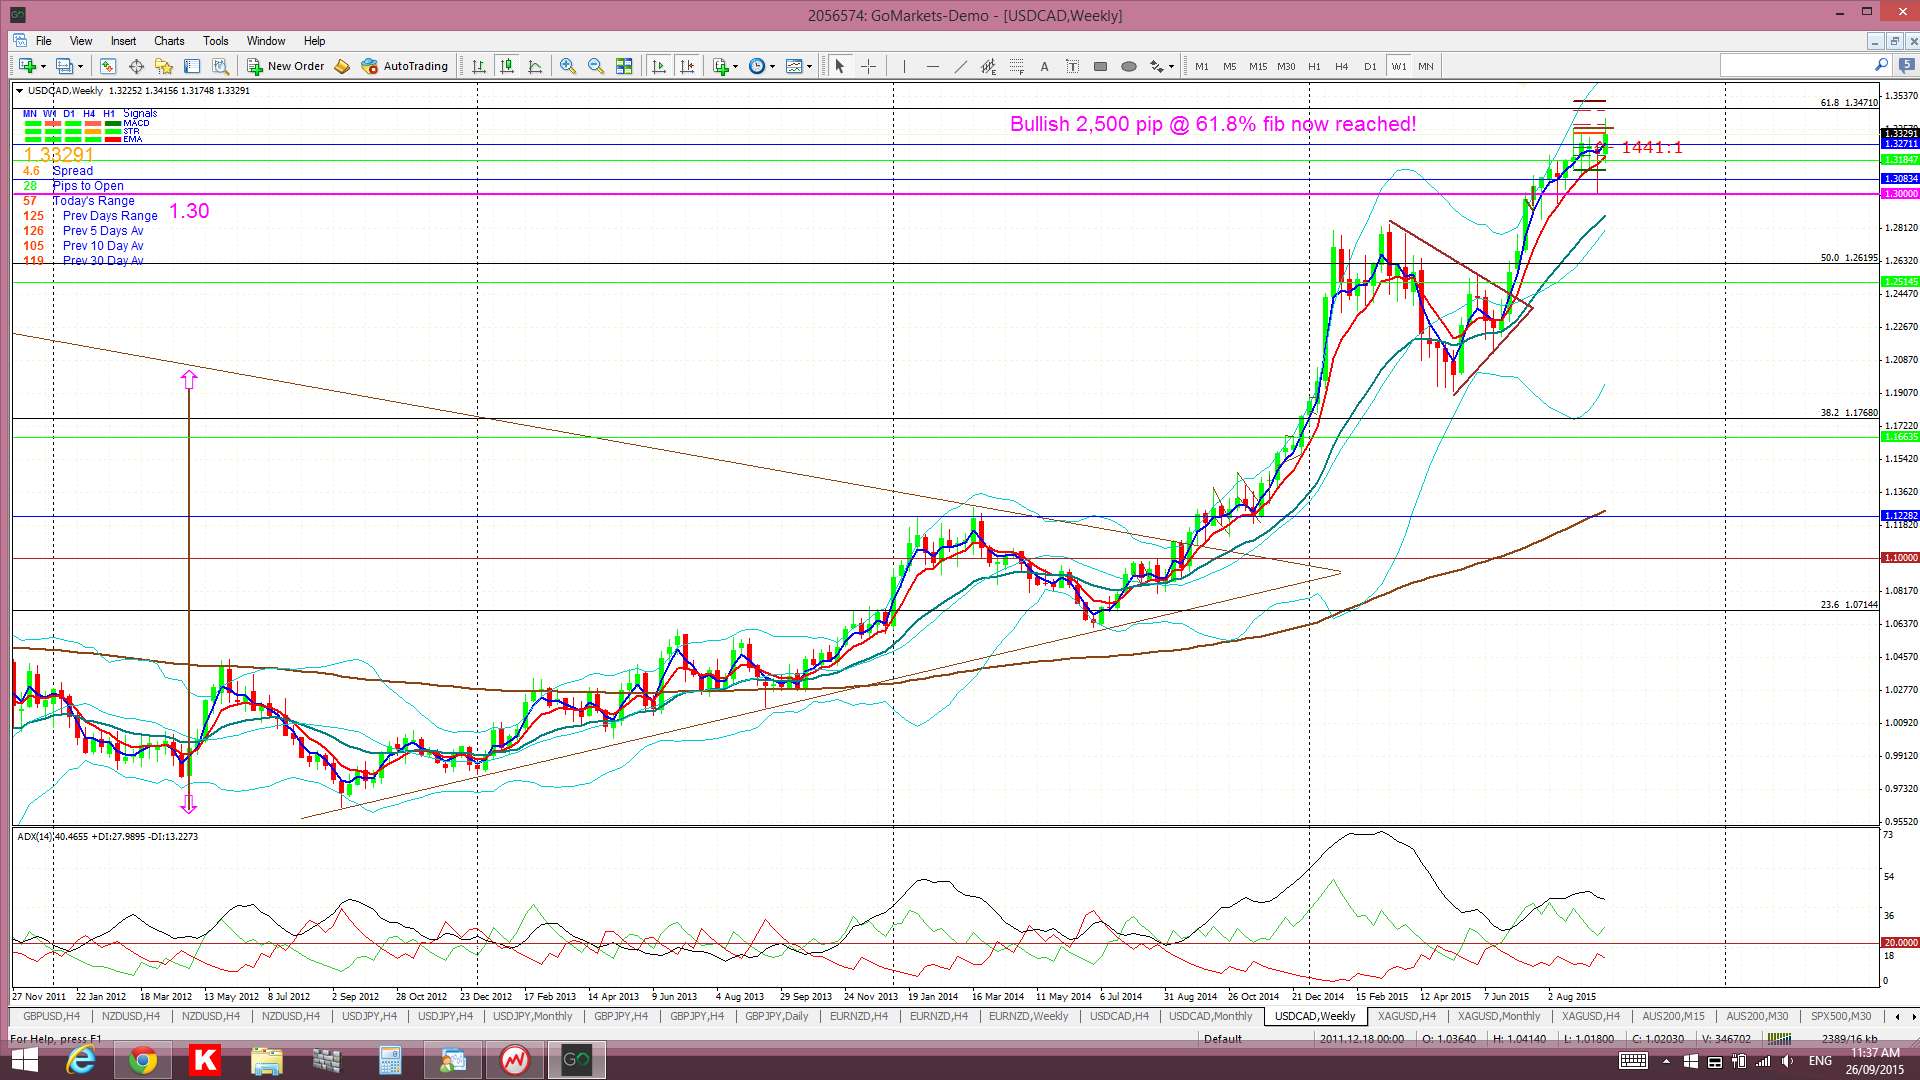
Triangle breakout target: The Loonie had previously broken up and out from a major monthly chart triangle pattern that was identified to deliver up to 2,500 pips and this move has now completed! This 2,500 pip figure was evaluated from the height of the triangle. I used the triangle height from the beginning of the bull trend line, as shown in the monthly chart below. The height of the triangle was around 2,500 pips and, thus, this would be the expected move from any breakout action. Extrapolating a bullish move from this triangle placed price up at the 61.8% fib level. These fibs levels are popular targets in retracement moves and so this added more confluence to this as a possible target. The bullish move has peaked up at the 61.8% fib, has given almost 2,500 pips and has now completed.
Monthly Chart Cup ‘n’ Handle? The monthly chart now also shows a possible bullish Cup ‘n’ Handle pattern forming up under the 1.30 level. This is worth keeping an eye on as the pattern would be worth up to 3,500 pips if it was to evolve as this is the height of the ‘Cup’. The interesting point is that the target for this pattern would put price up at the highs reached back in 2002 and this is equal to a 100% Fib retracement of the 2002-2007 bear move.
Price is trading above the Cloud on the 4hr, daily, weekly and monthly charts.
The weekly candle closed as a bullish, almost ‘engulfing’ candle.
- I’m watching for any new TC signal on this pair.

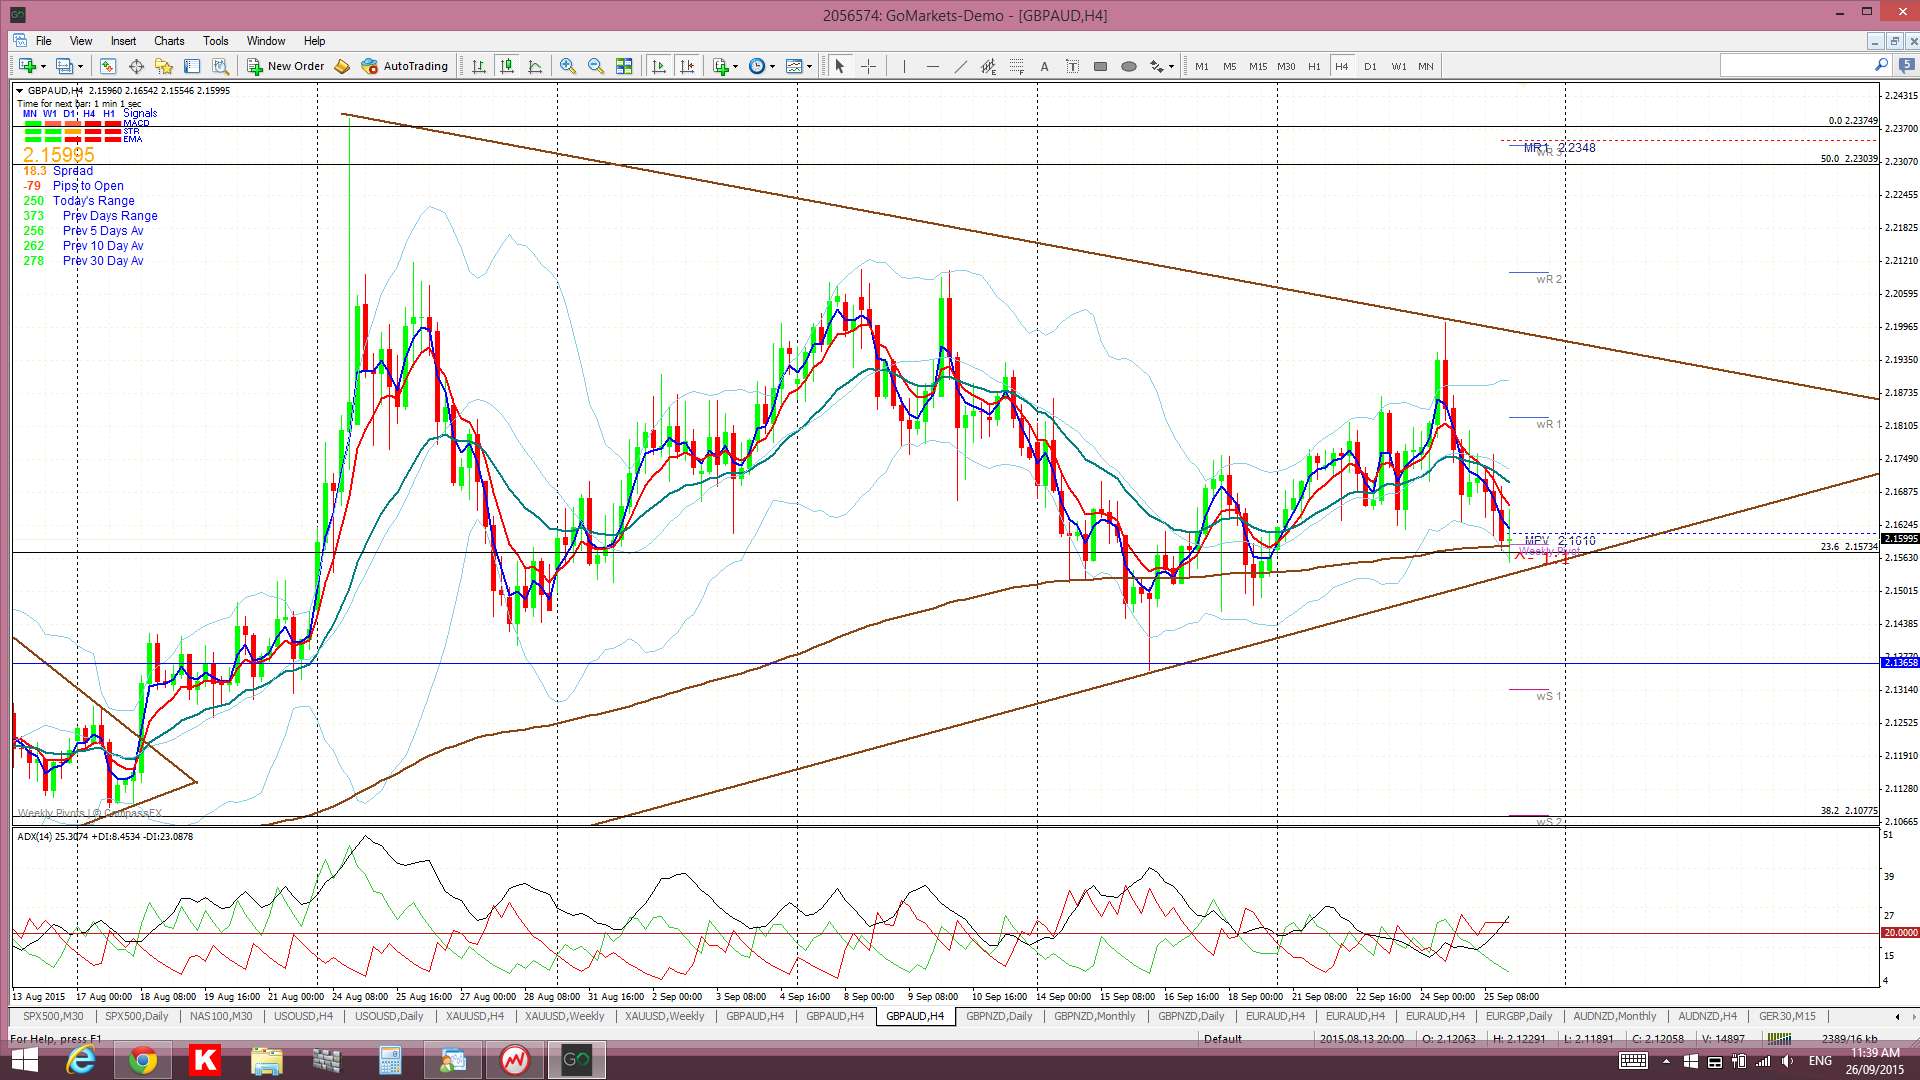
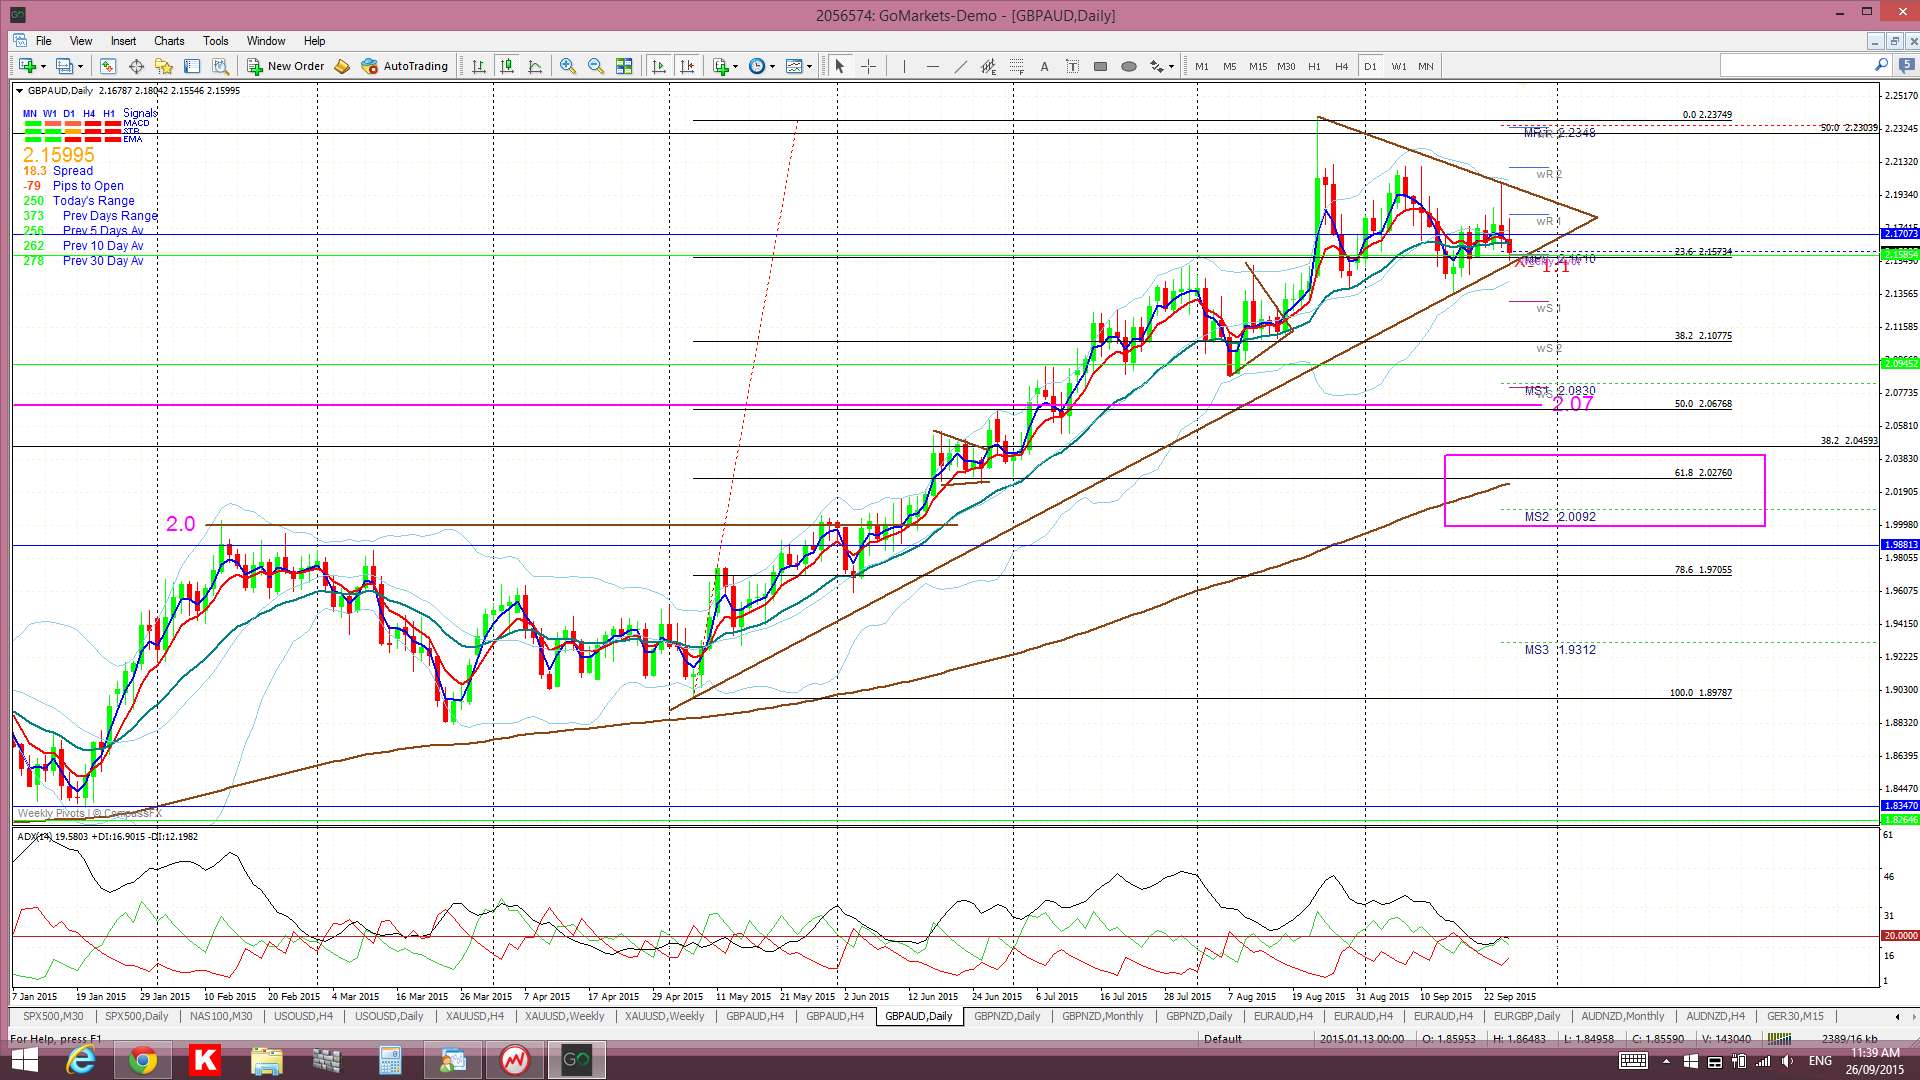
GBP/AUD: Not much has changed here over recent weeks and this pair remains choppy above the 2.07 level and consolidating within a triangle pattern. I’m still watching for any test of this key S/R region however but need to see a break and hold below the recent daily support trend line first.
Any break and hold below the daily support trend line will bring two levels back into focus: Firstly, the 2.07 level which is major S/R and near the 50% fib of the recent swing high move. Secondly, there is the 61.8% fib of this move which is down near the 2.03 level but is also near the daily 200 EMA and so this congested region could attract price as well.
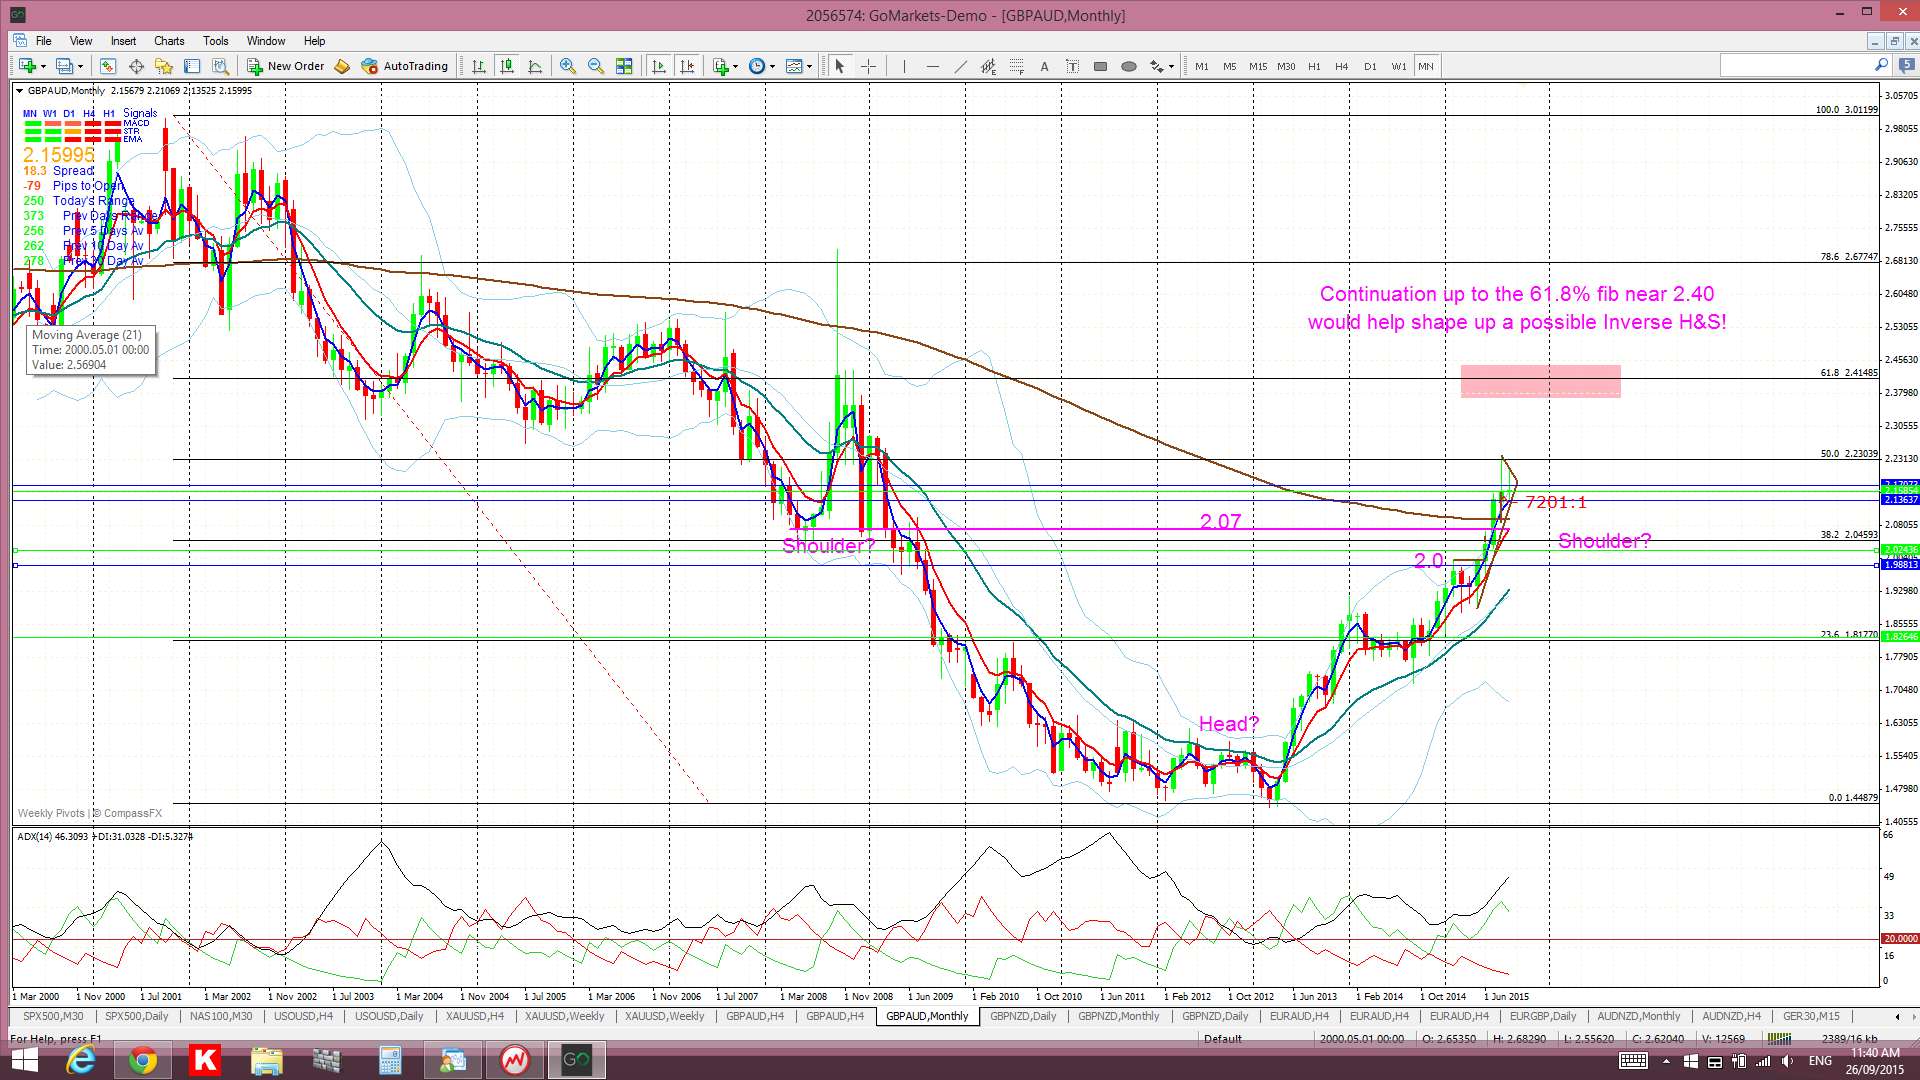
There is the look of a ‘Cup’ pattern on the monthly chart which could support continued choppiness around this 2.07 region as a potential ‘Handle’ forms up however, despite this, there could still be some decent moves though within any swings.
Any continued bullish momentum may bring an alternative monthly chart pattern into focus though. A continued push up to the 2.40 region near the 61.8% fib would help to form up a possible bullish ‘Inverse H&S’ pattern. I would then be looking for any pullback back down to the ‘Shoulder’ region of 2.07.
Price is trading in the bottom of the Cloud on the 4hr chart but above the Ichimoku Cloud on the daily, weekly and monthly charts.
The weekly candle closed as a bullish coloured ‘Doji’ candle.
- I’m watching for any new TC signal on this pair, the daily support trend line & triangle pattern and the 2.07 level.

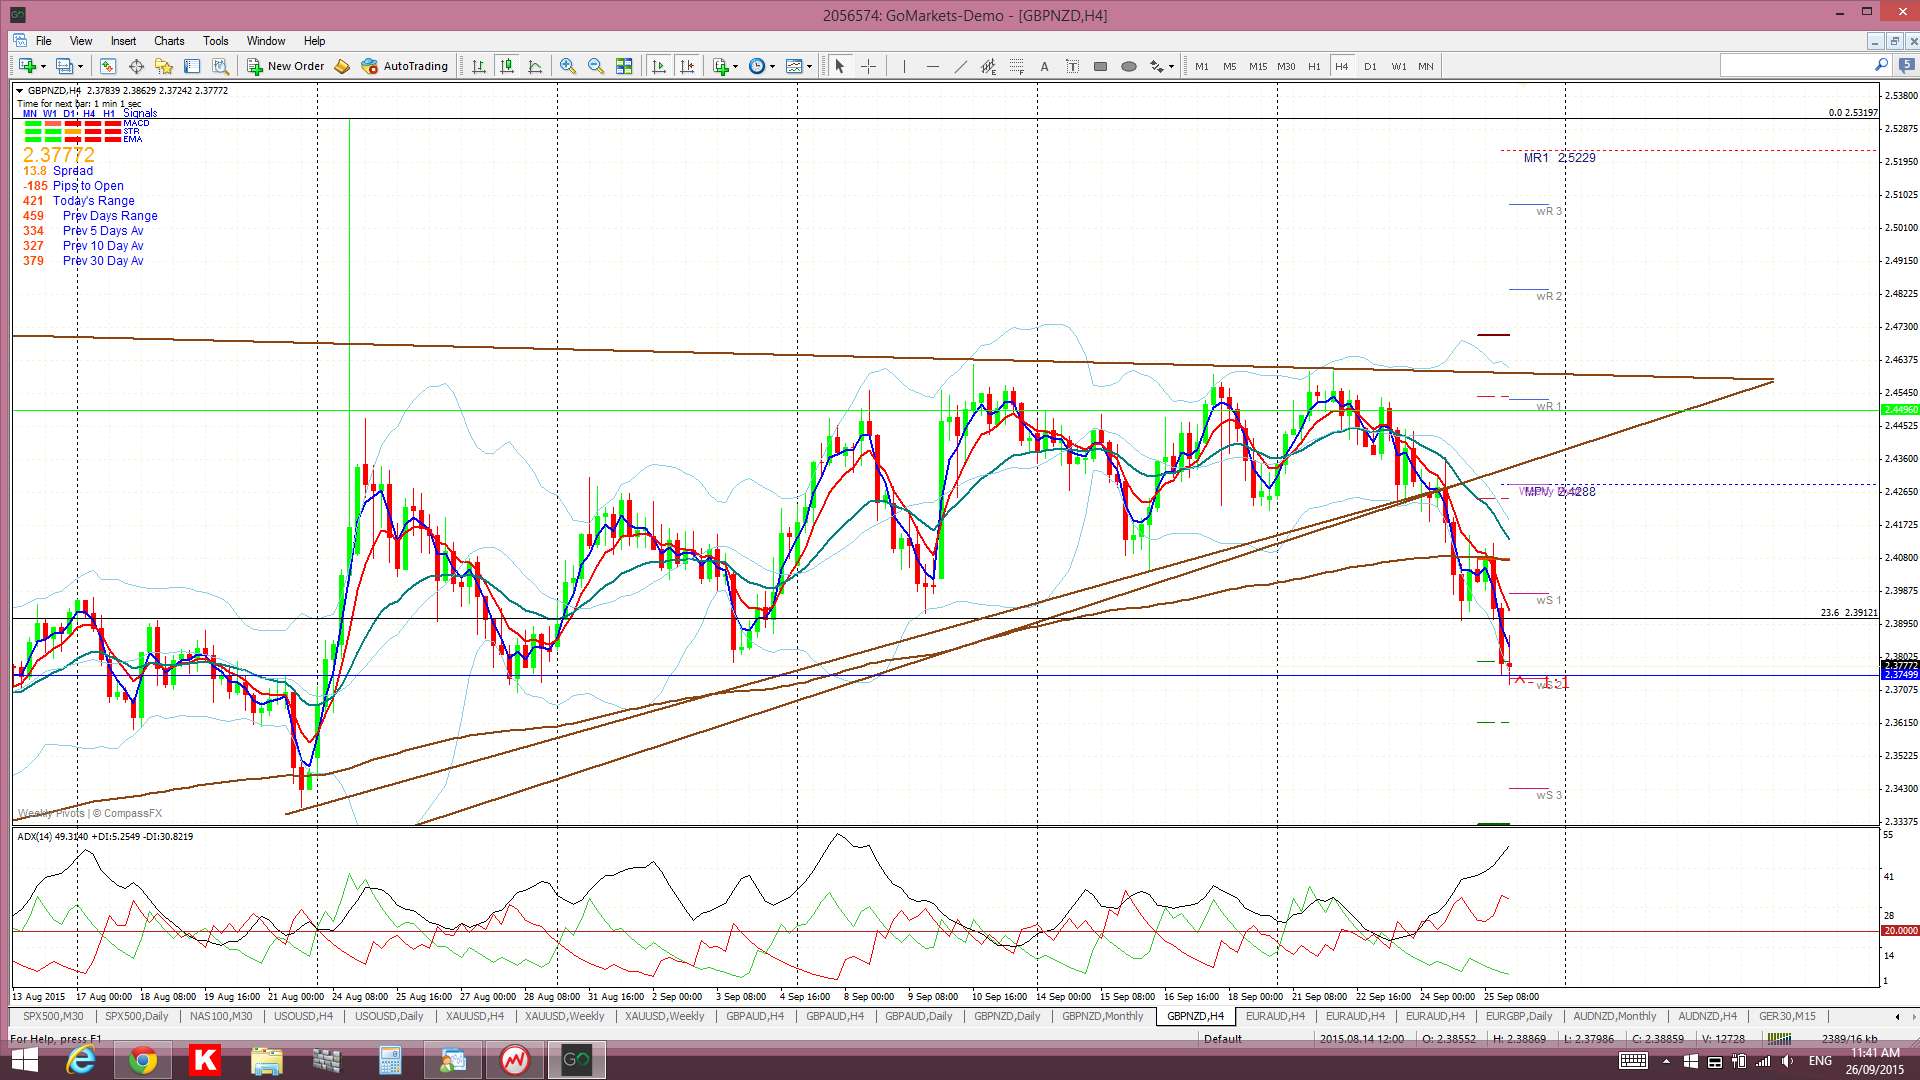
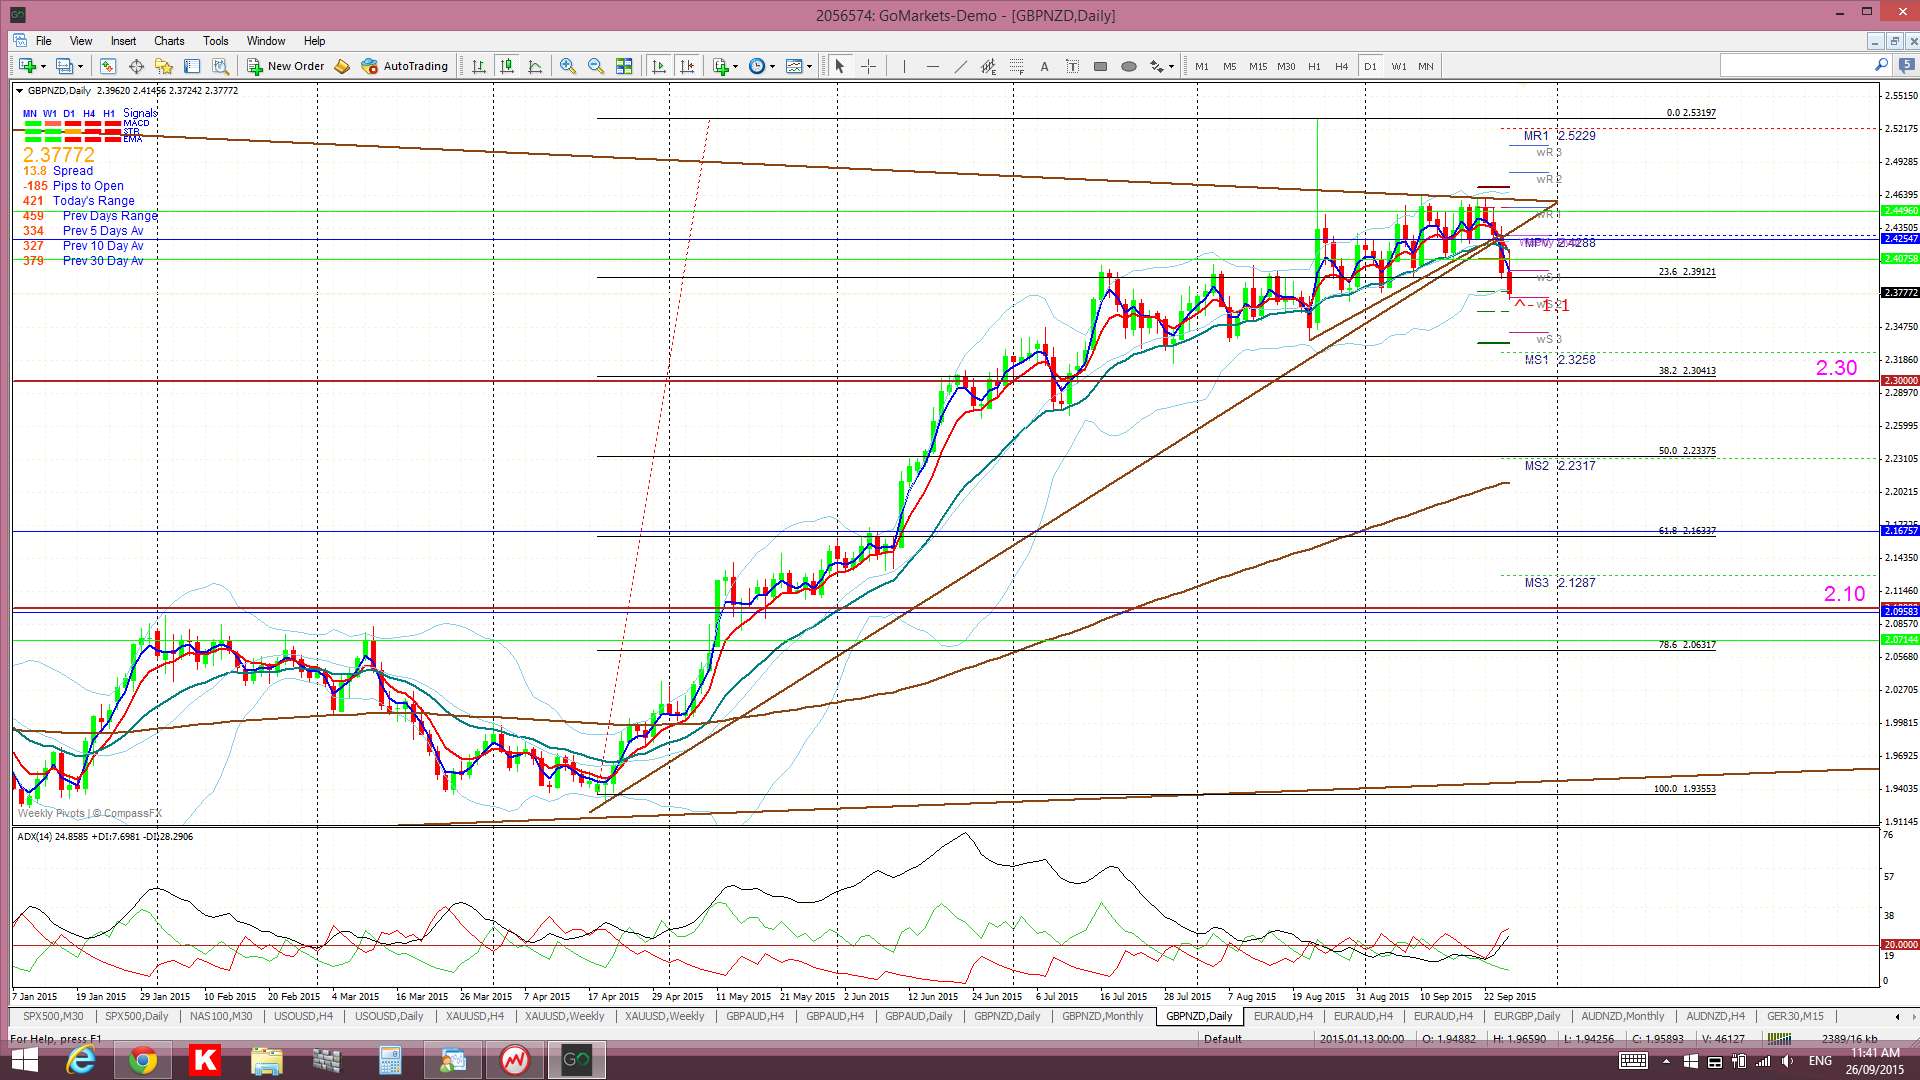
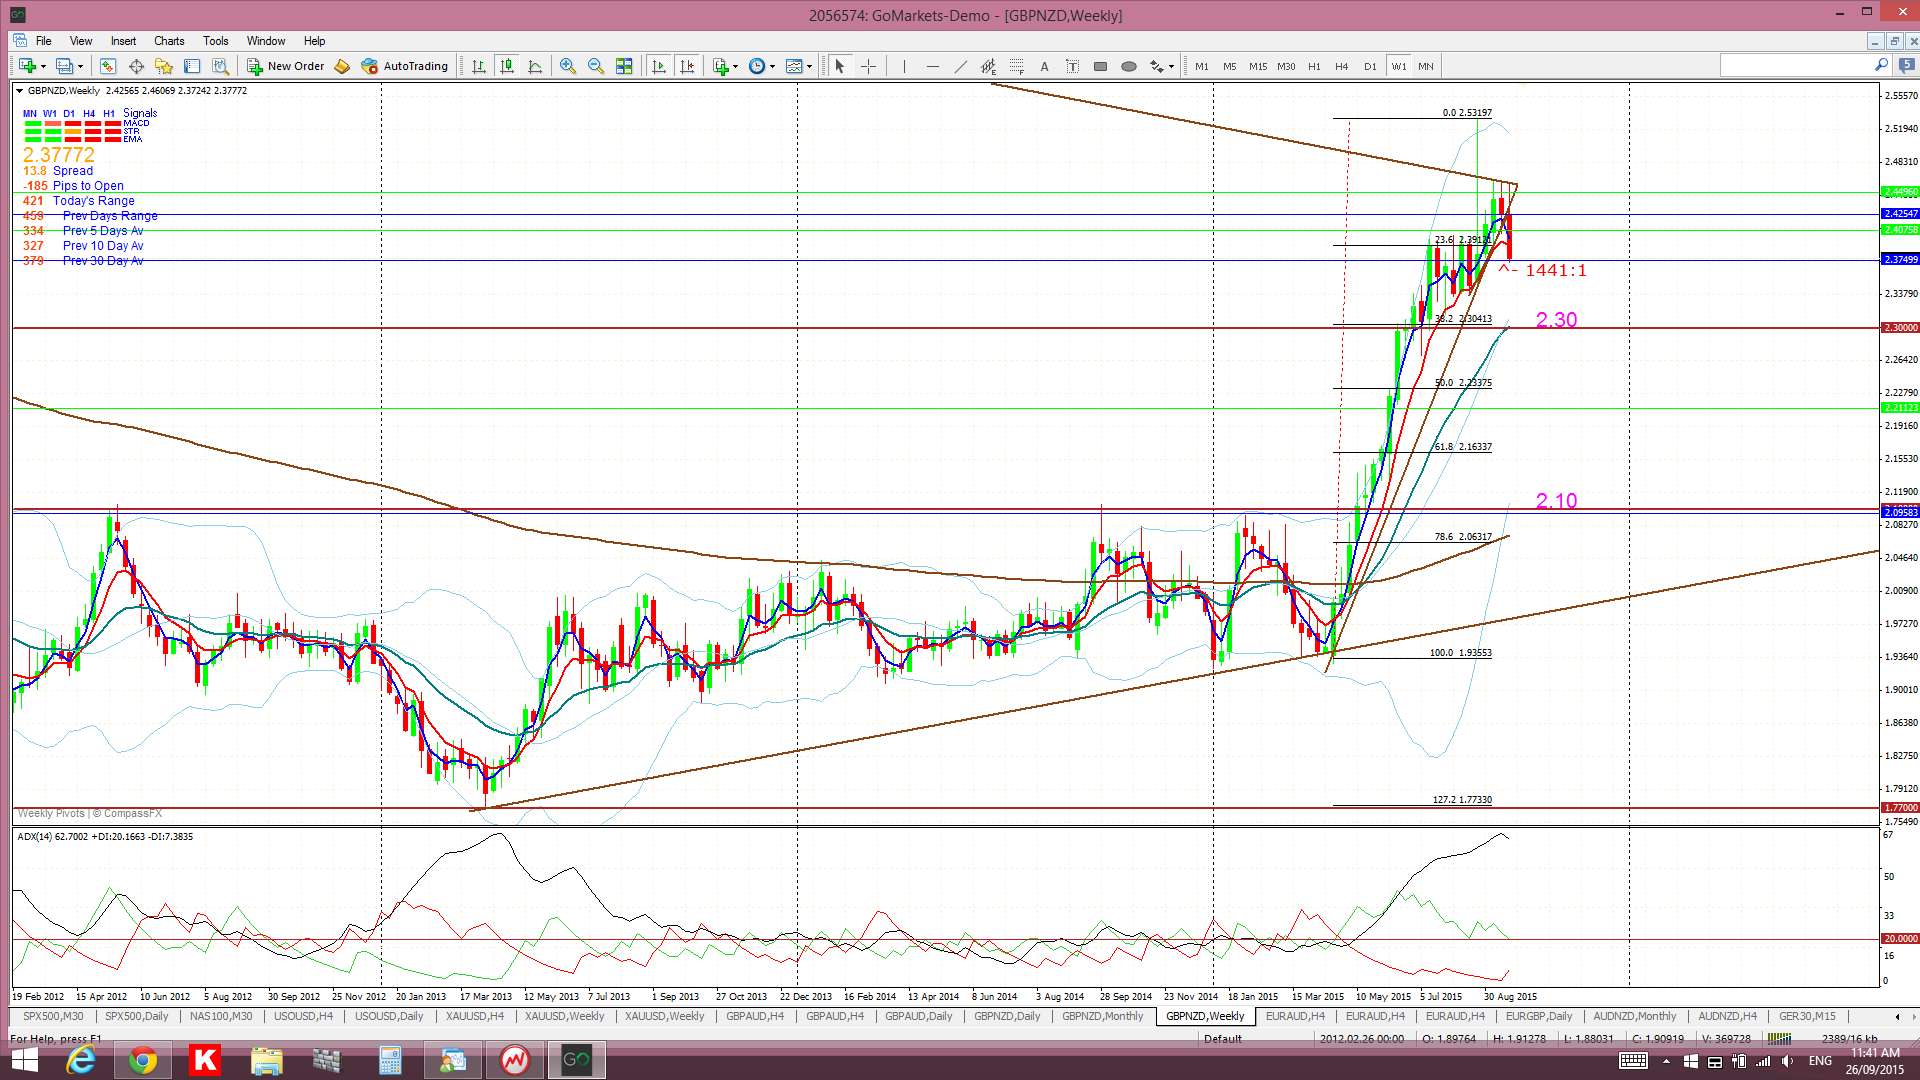
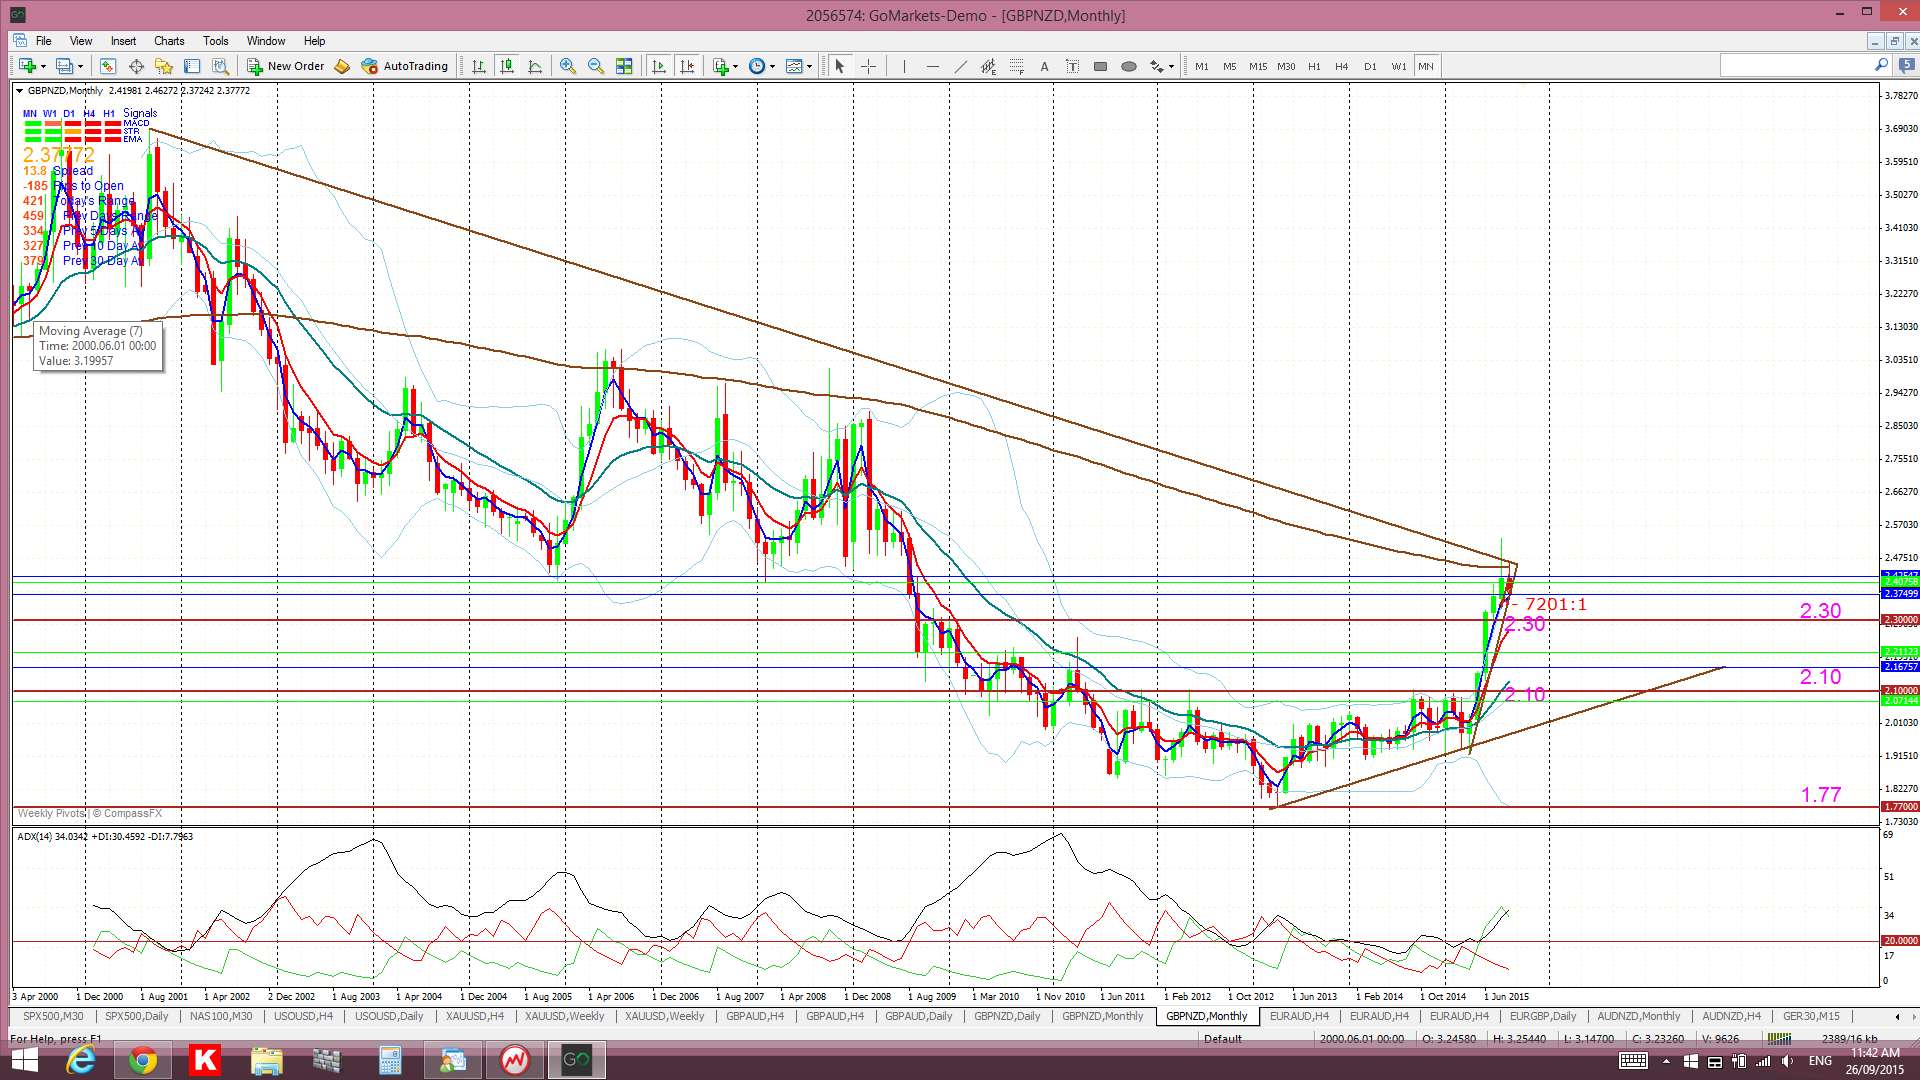
GBP/NZD: The GBP/NZD remains choppy under the monthly chart’s bear trend line but has broken below a daily support trend line. This break did not trigger a clean TC signal on the 4hr chart time frame but, FWIW, I do have a clean TC short signal on the daily chart time frame.
There are a few levels that price action could target in any bearish continuation:
- The previous S/R region of 2.30
- The region between the 50% and 61.8% fib that holds the daily 200 EMA.
- The previous breakout and S/R region of 2.10.
The GBP/NZD is trading below the Cloud on the 4hr chart but above the Cloud on the daily (just), weekly and monthly charts.
The weekly candle closed as a bearish candle.
- I’m watching for any new TC signal on this pair.
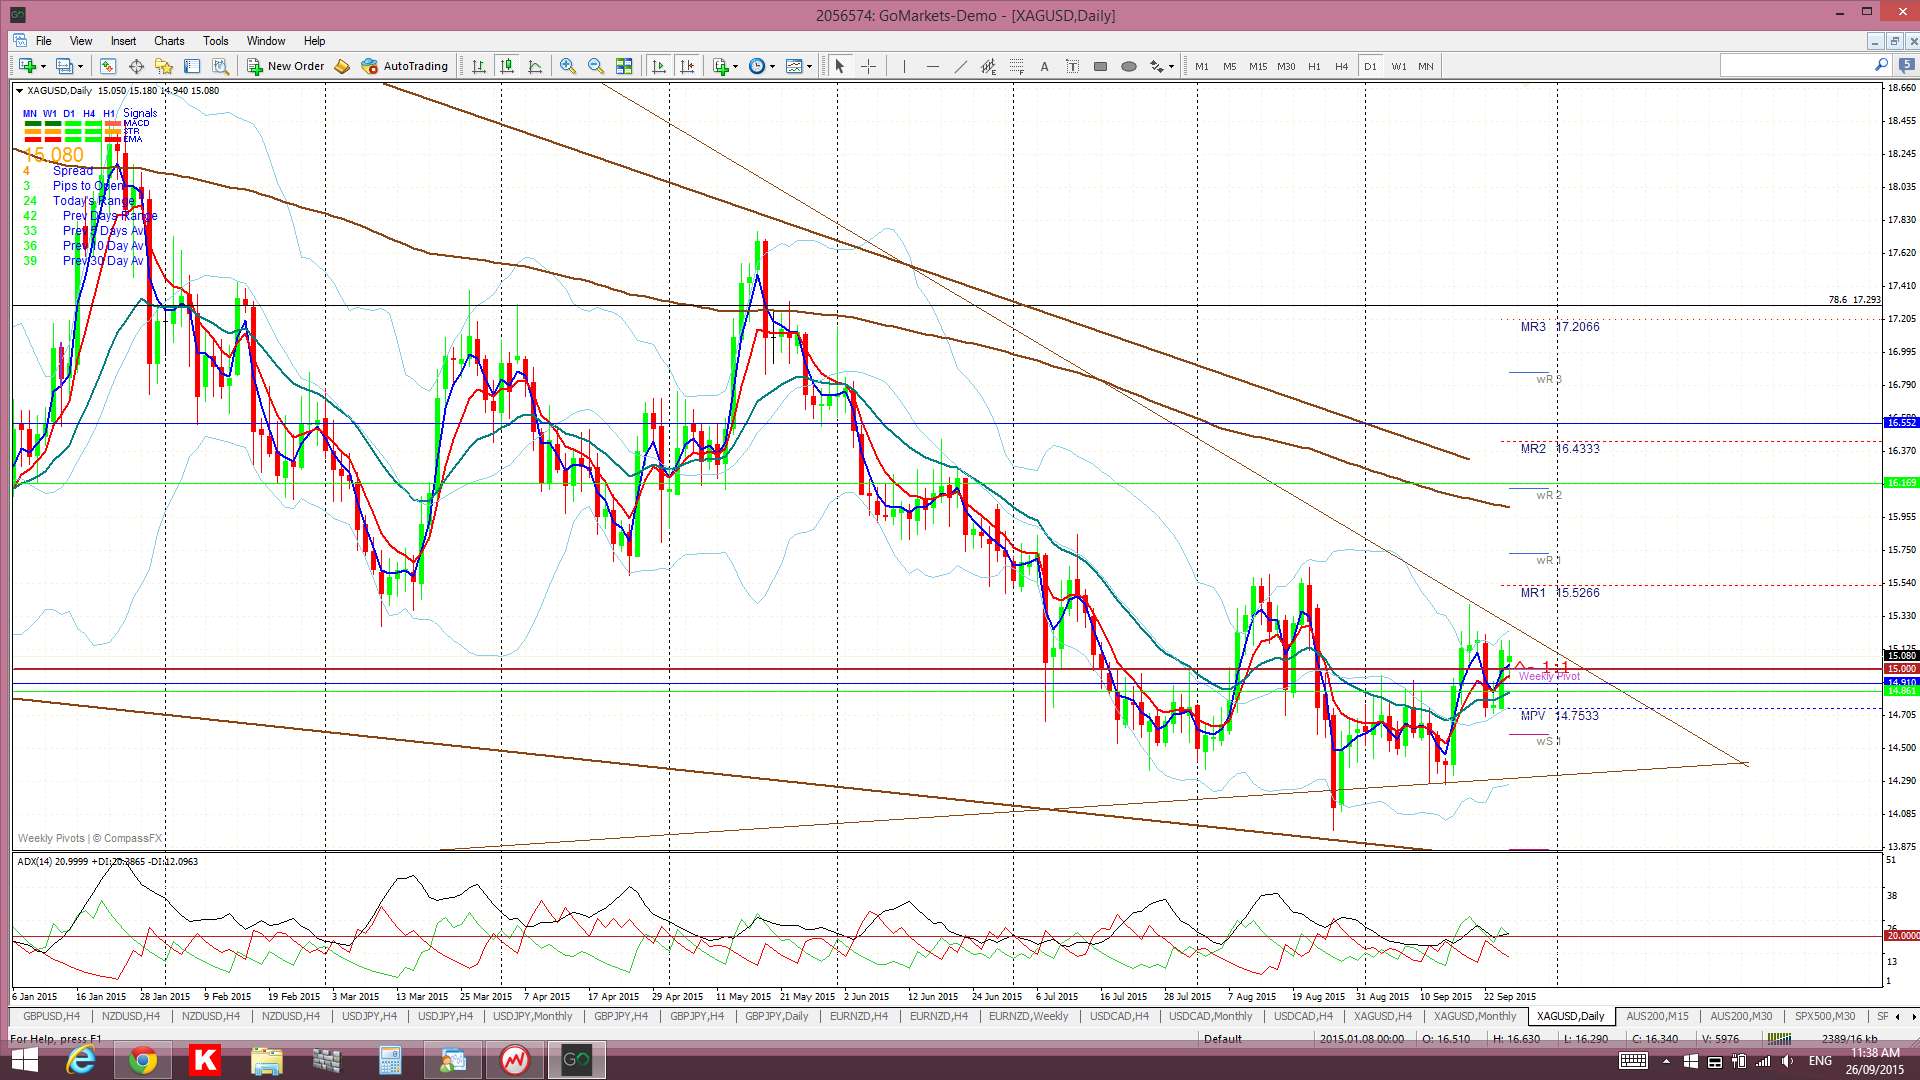
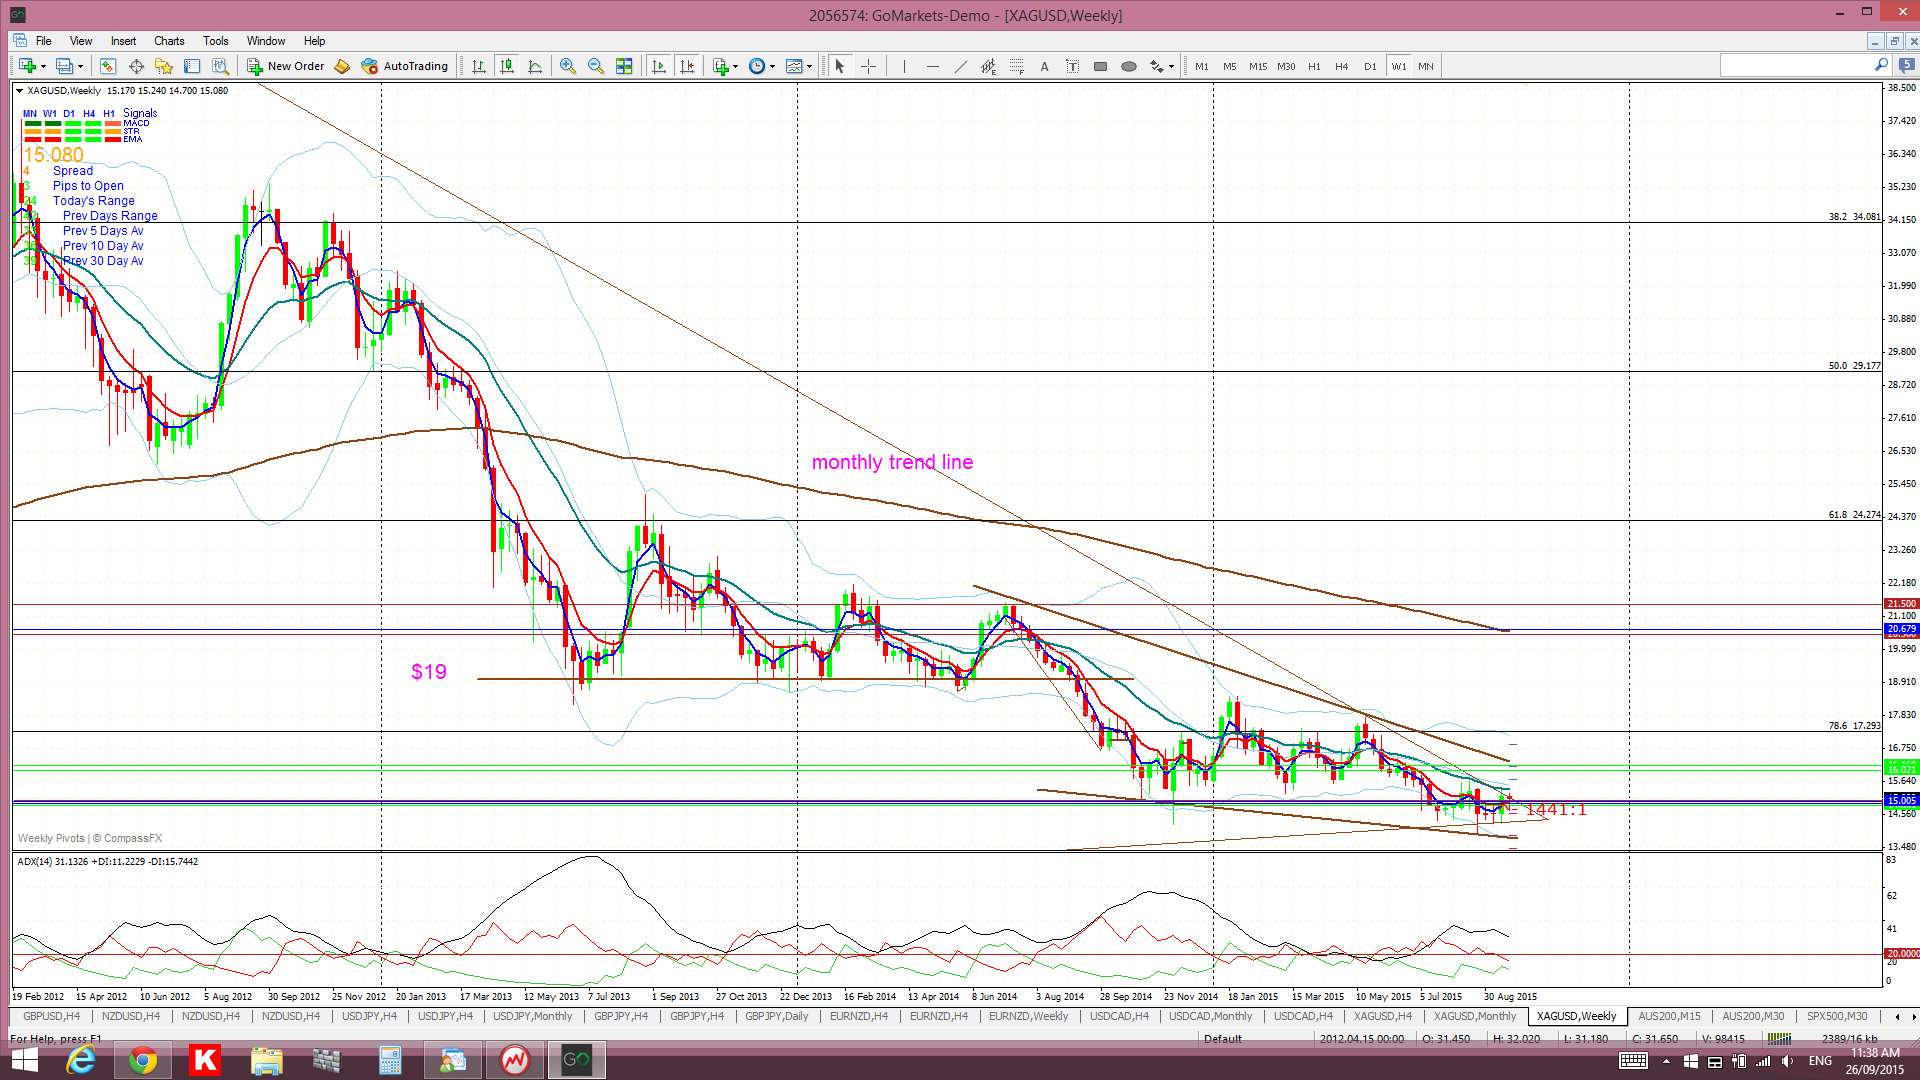
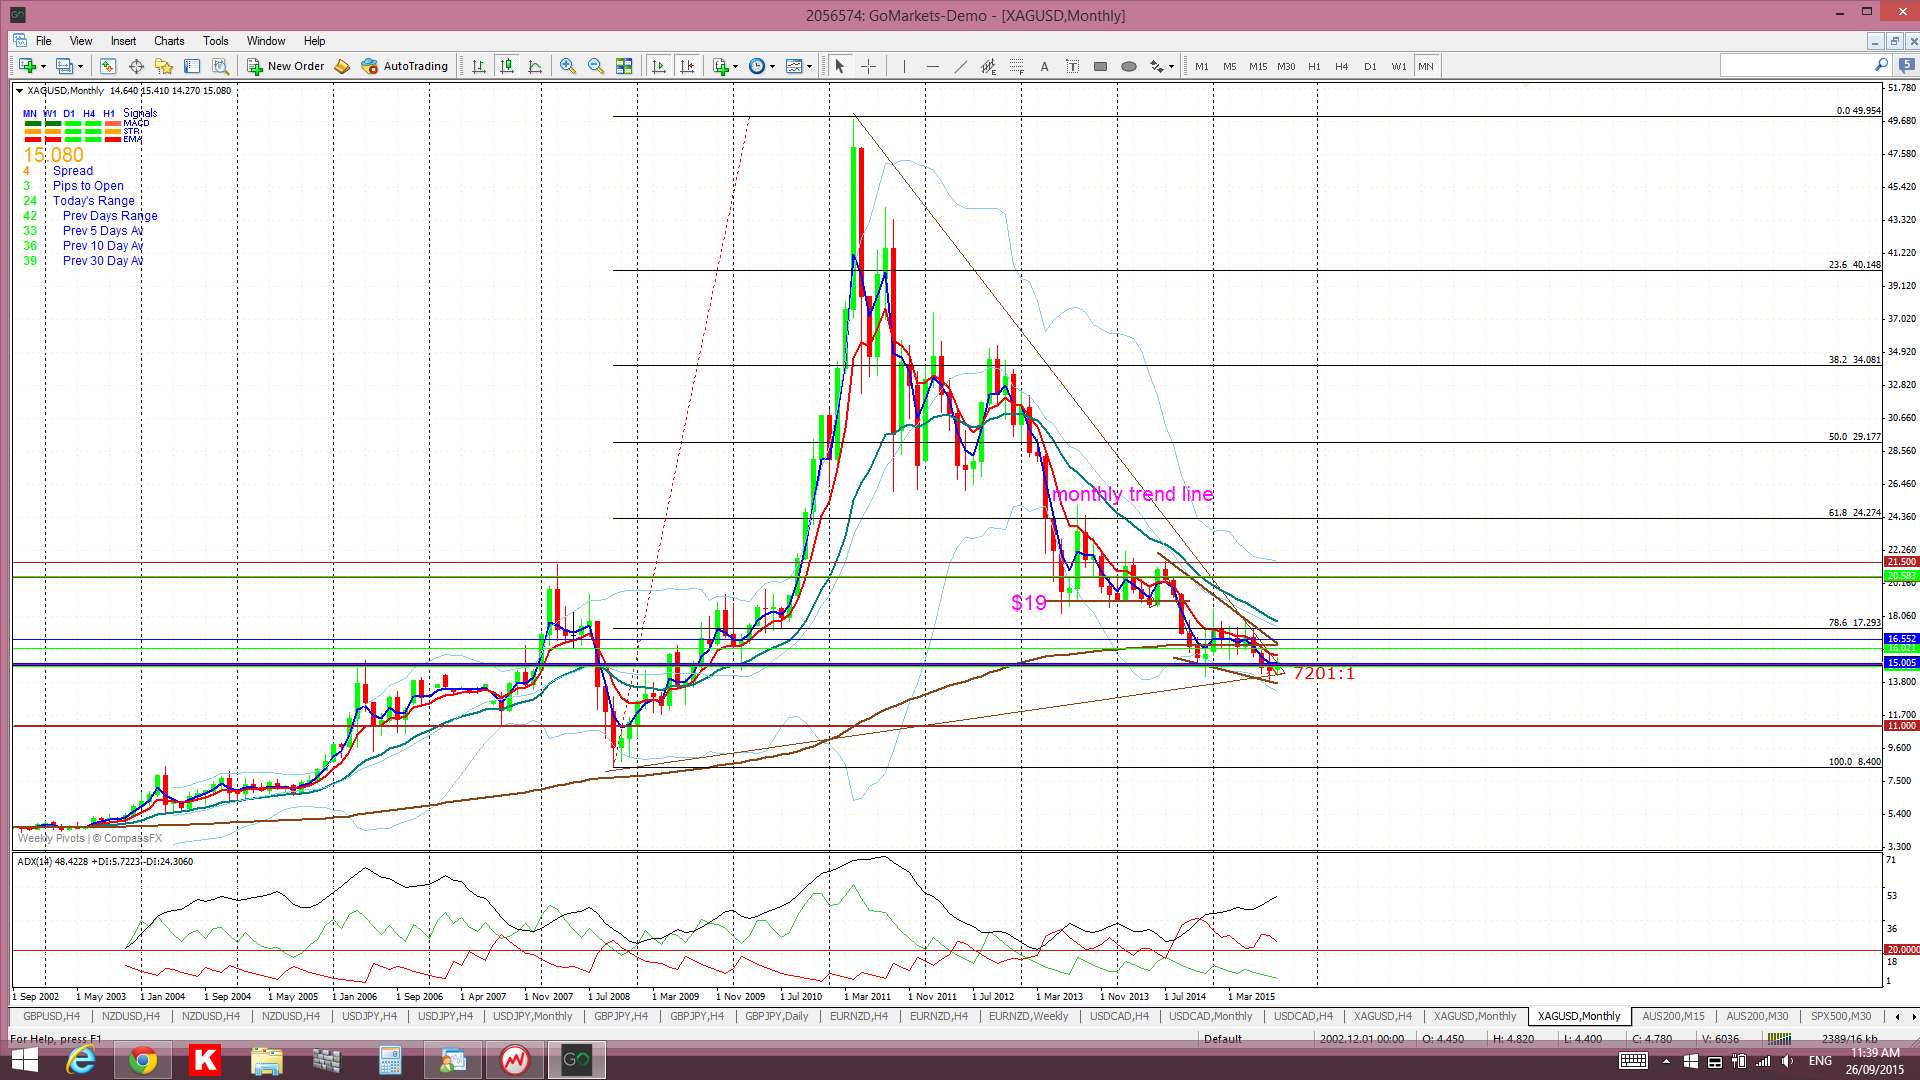
Silver: Silver chopped up and down last week either side of the $15 support level but, despite an upbeat US$ outlook, it managed to close above this psychological support .
I have revised the monthly chart’s bear trend line here again and will wait to see if the monthly candle confirms any breakout at all.
Of more importance to me at the moment though remains the bullish-reversal descending wedge on the weekly chart and I’ll be watching the trend lines here. There is still a bit more room within this wedge though for continued consolidation and the breakout might not evolve until there is a decisive US interest rate decision.
Silver is trading above the Cloud on the 4hr chart but below the daily, weekly and monthly Clouds.
The weekly candle closed as a bearish coloured ‘Spinning Top’ and ‘Inside’ candle suggesting indecision here.
Any new and sustained hold back below $15 would be bearish though and would bring the $11 and $9 levels into focus. $11 is previous S/R and the $9 area is the 100% fib level.
- I’m watching for any new TC signal, the $15 level and the weekly chart’s descending wedge trend lines.

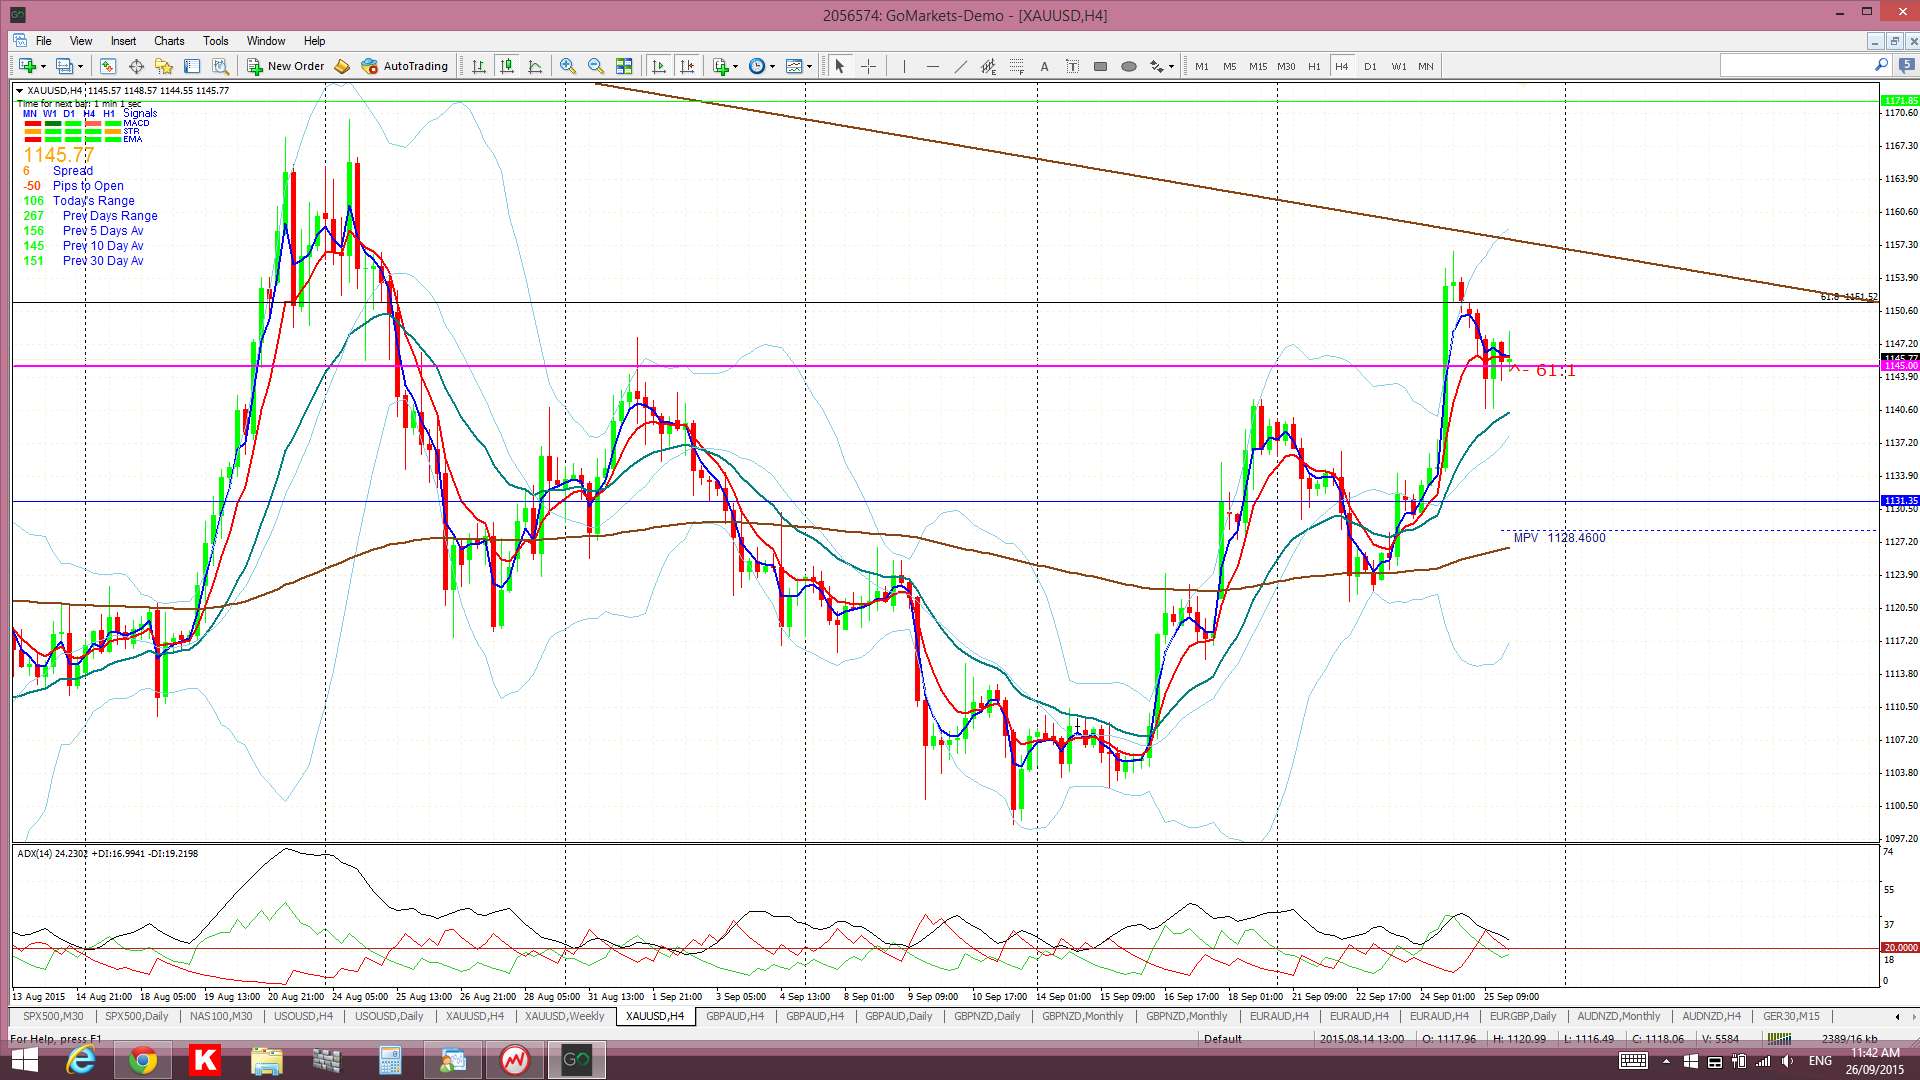
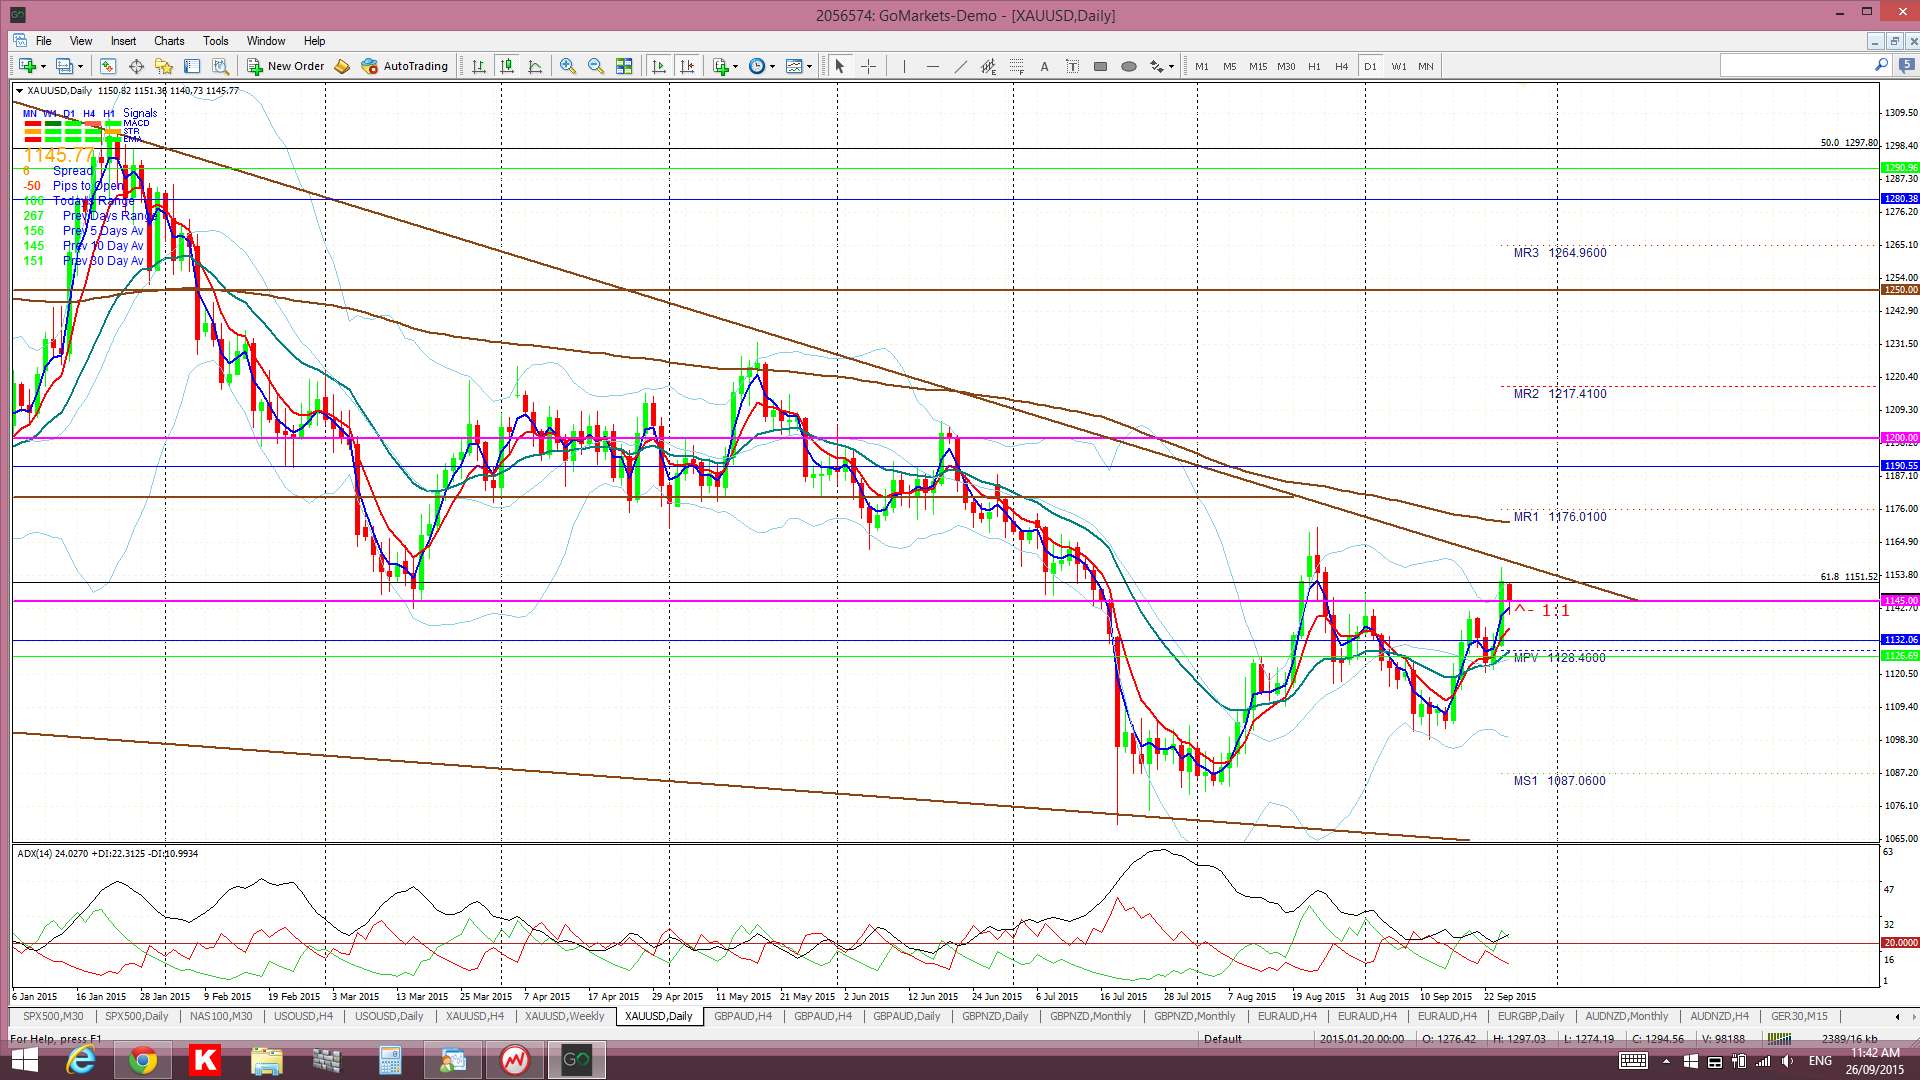
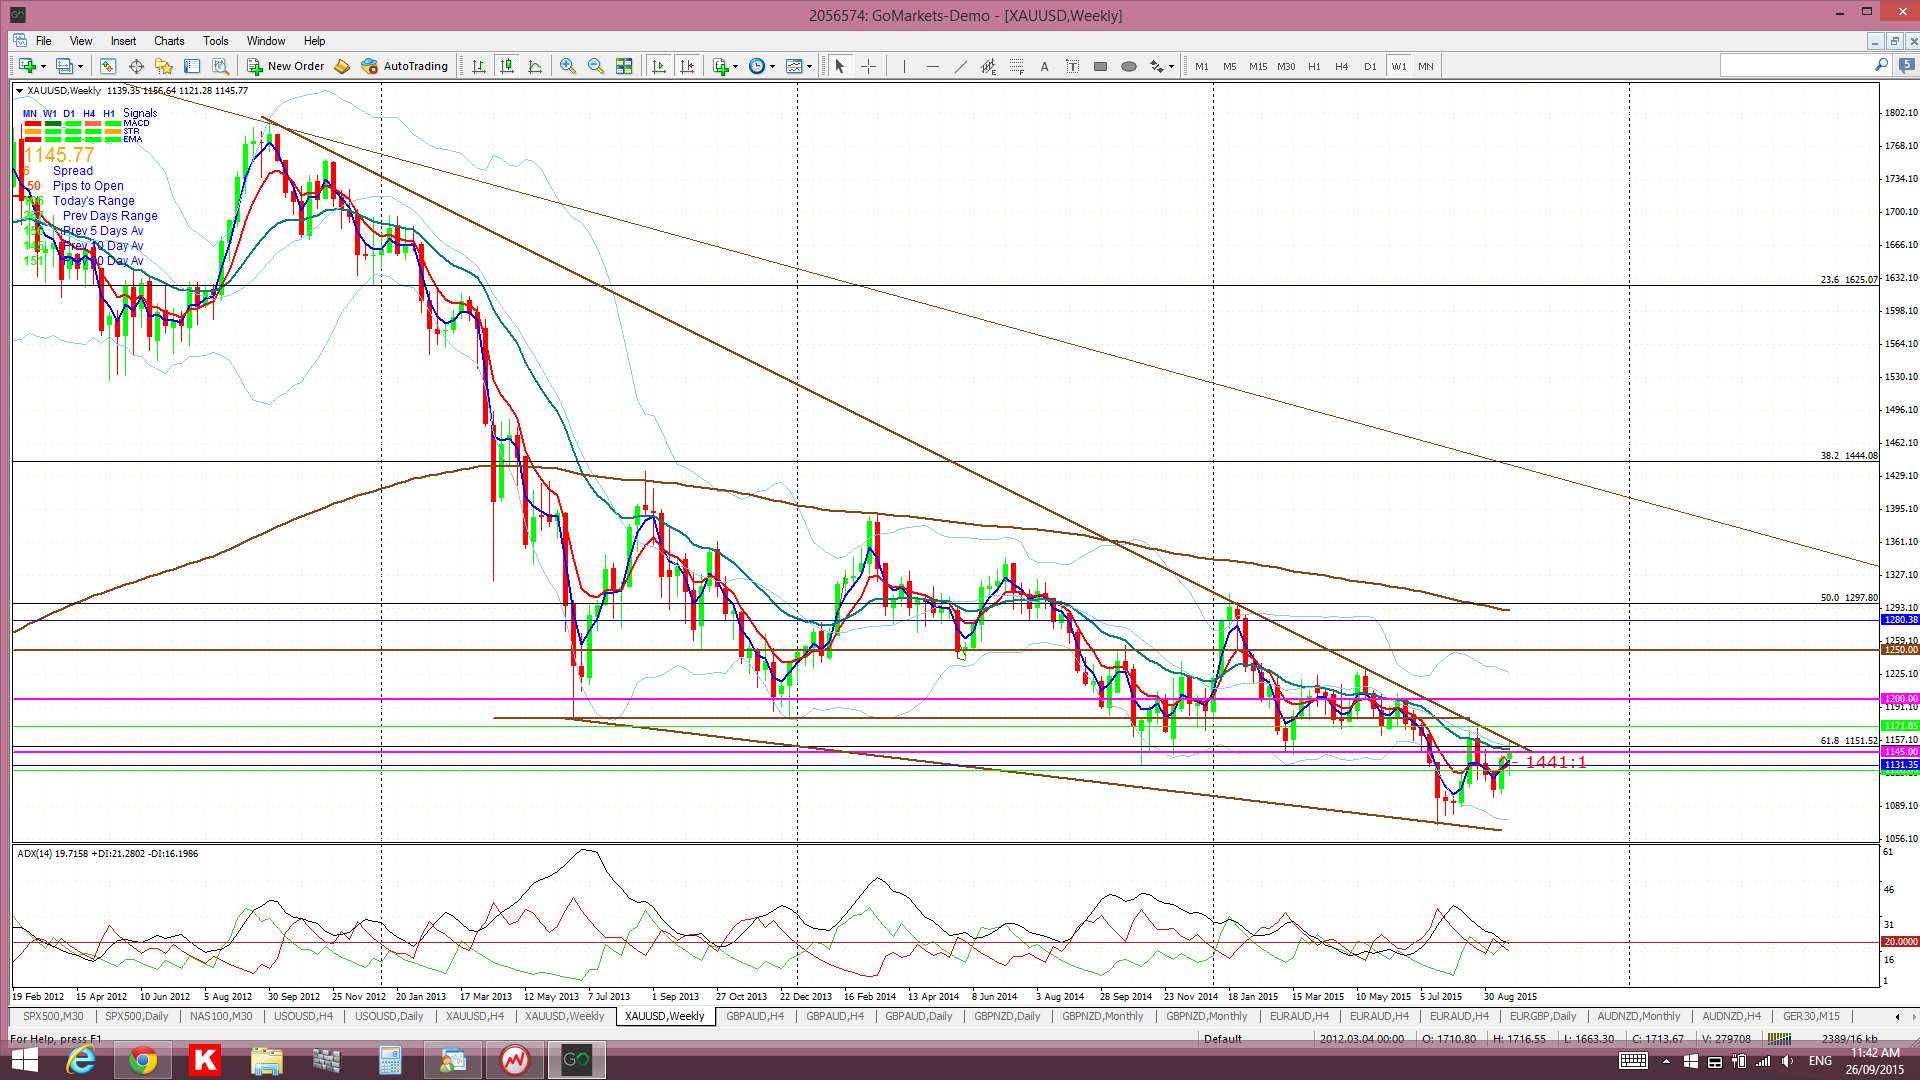
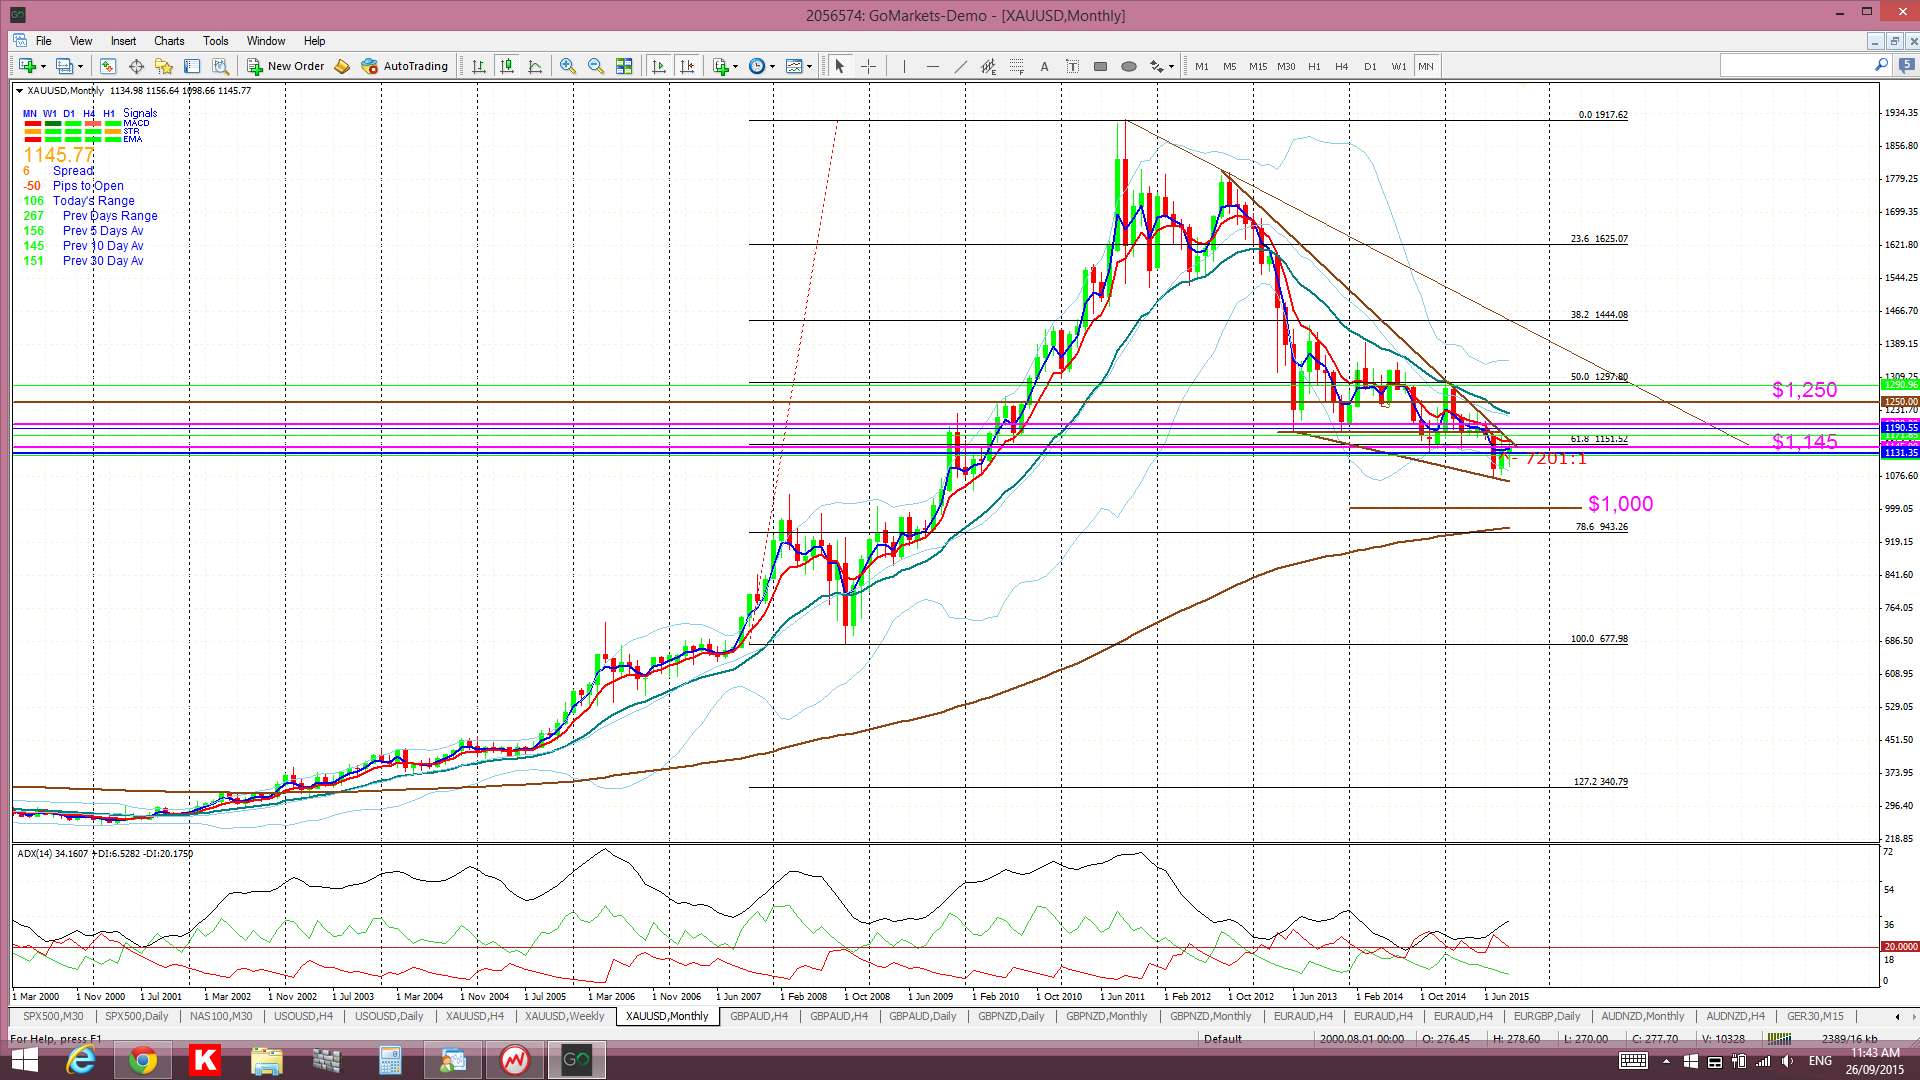
Gold: Gold chopped higher last week and reached back up to the key $1,145 level and monthly chart’s 61.8% fib zone. Price stalled just below the trend line from the bullish-reversal descending wedge pattern and this is now an area of interest to watch here. The weekly close above $1,145 is a psychological boost here in spite of the bullish outlook for the US$. I wrote an article on Gold last week and this can be found through this link.
Any new close and hold above the descending wedge trend line would be bullish but a sustained respect of this region would be bearish, at least in the short term. Bearish targets below $1,145 include the $1,100 and $1,000 psychological levels and, then, the 78.6% fib near $950. As with Silver, there is still a bit more room within this wedge though for continued consolidation and the breakout might not evolve until there is a decisive US interest rate decision.
Gold is trading above the Cloud on the 4hr & daily charts but below the Cloud on the weekly and monthly charts.
The weekly candle closed as a bullish candle following last week’s, essentially ‘bullish engulfing’ candle.
- I’m watching for any new TC signal, the descending wedge trend lines and the $1,145/1,150 levels.
The post US$ bulls looking to NFP for support. appeared first on www.forextell.com.