USDX
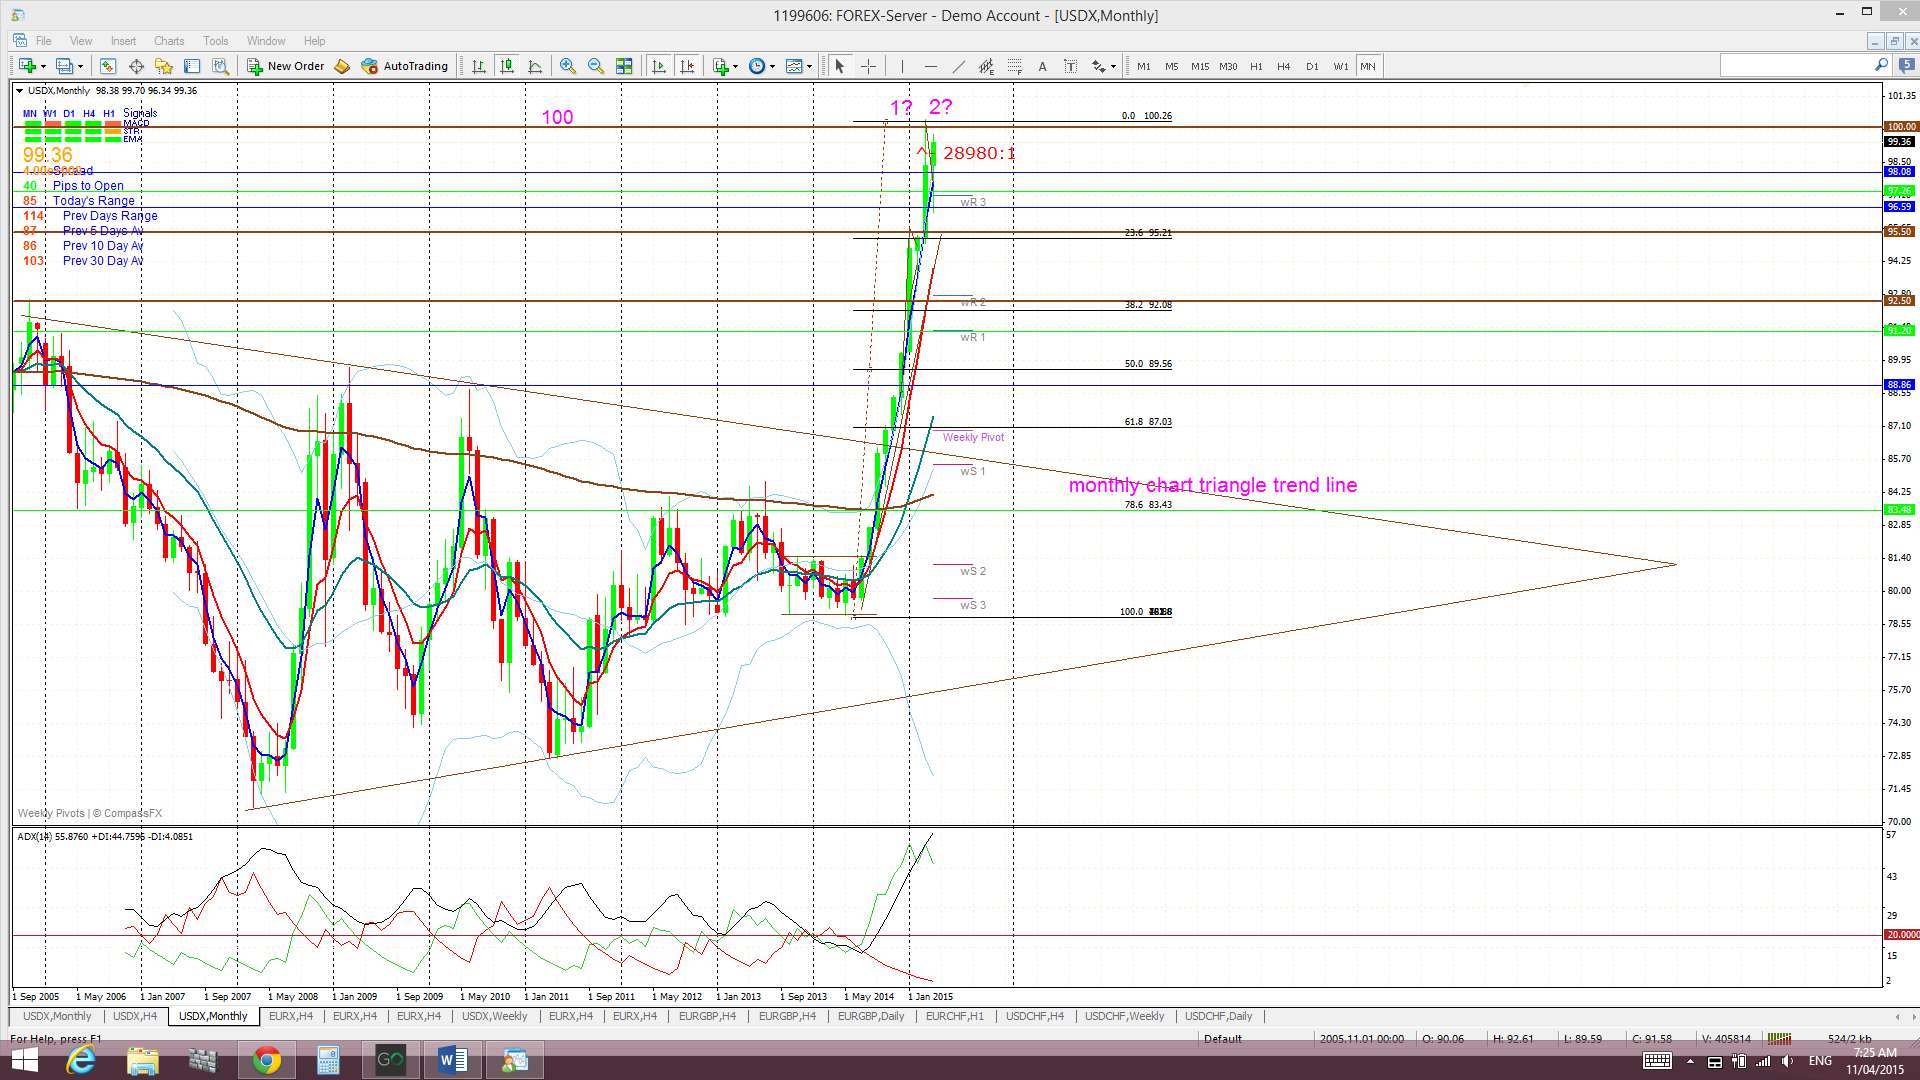
Monthly: The new April candle is currently printing a bullish candle. The 100 level is still proving to be some resistance though.

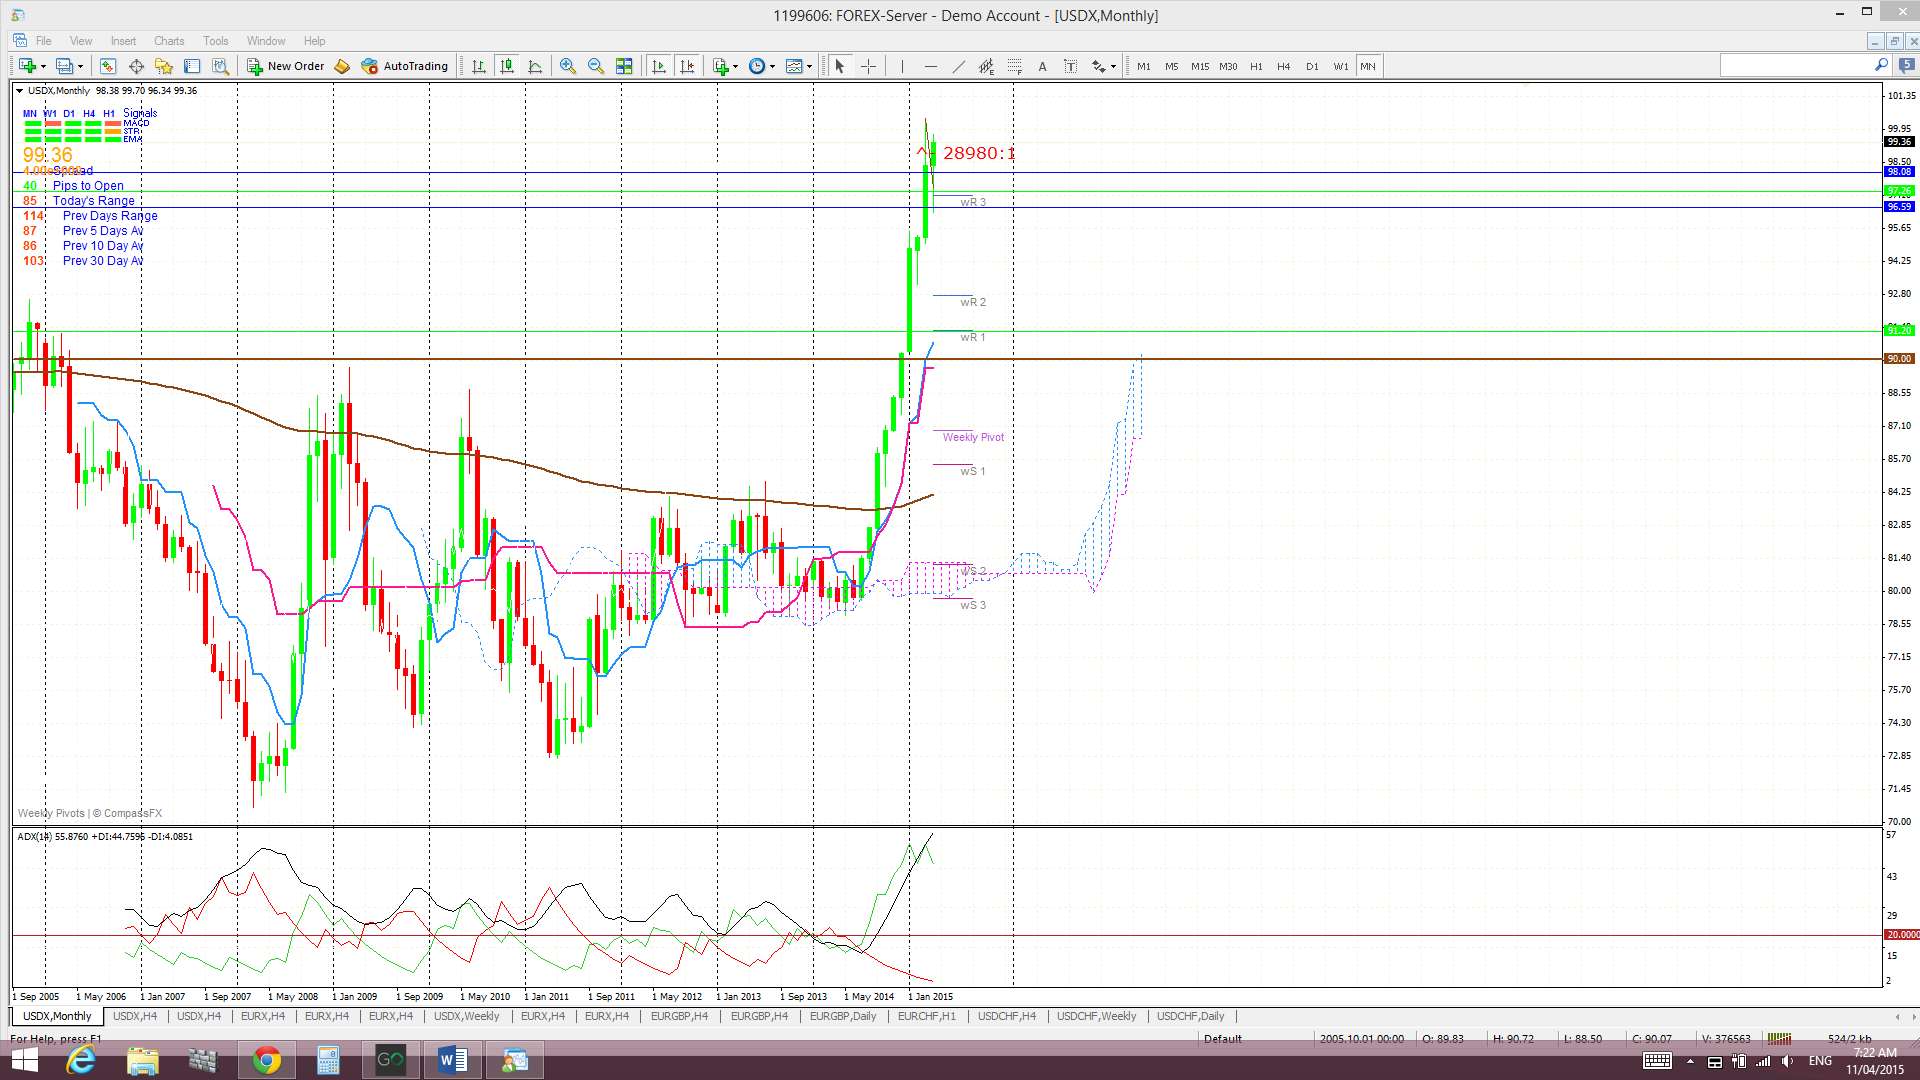
Monthly Ichimoku: The April candle is above the Cloud.
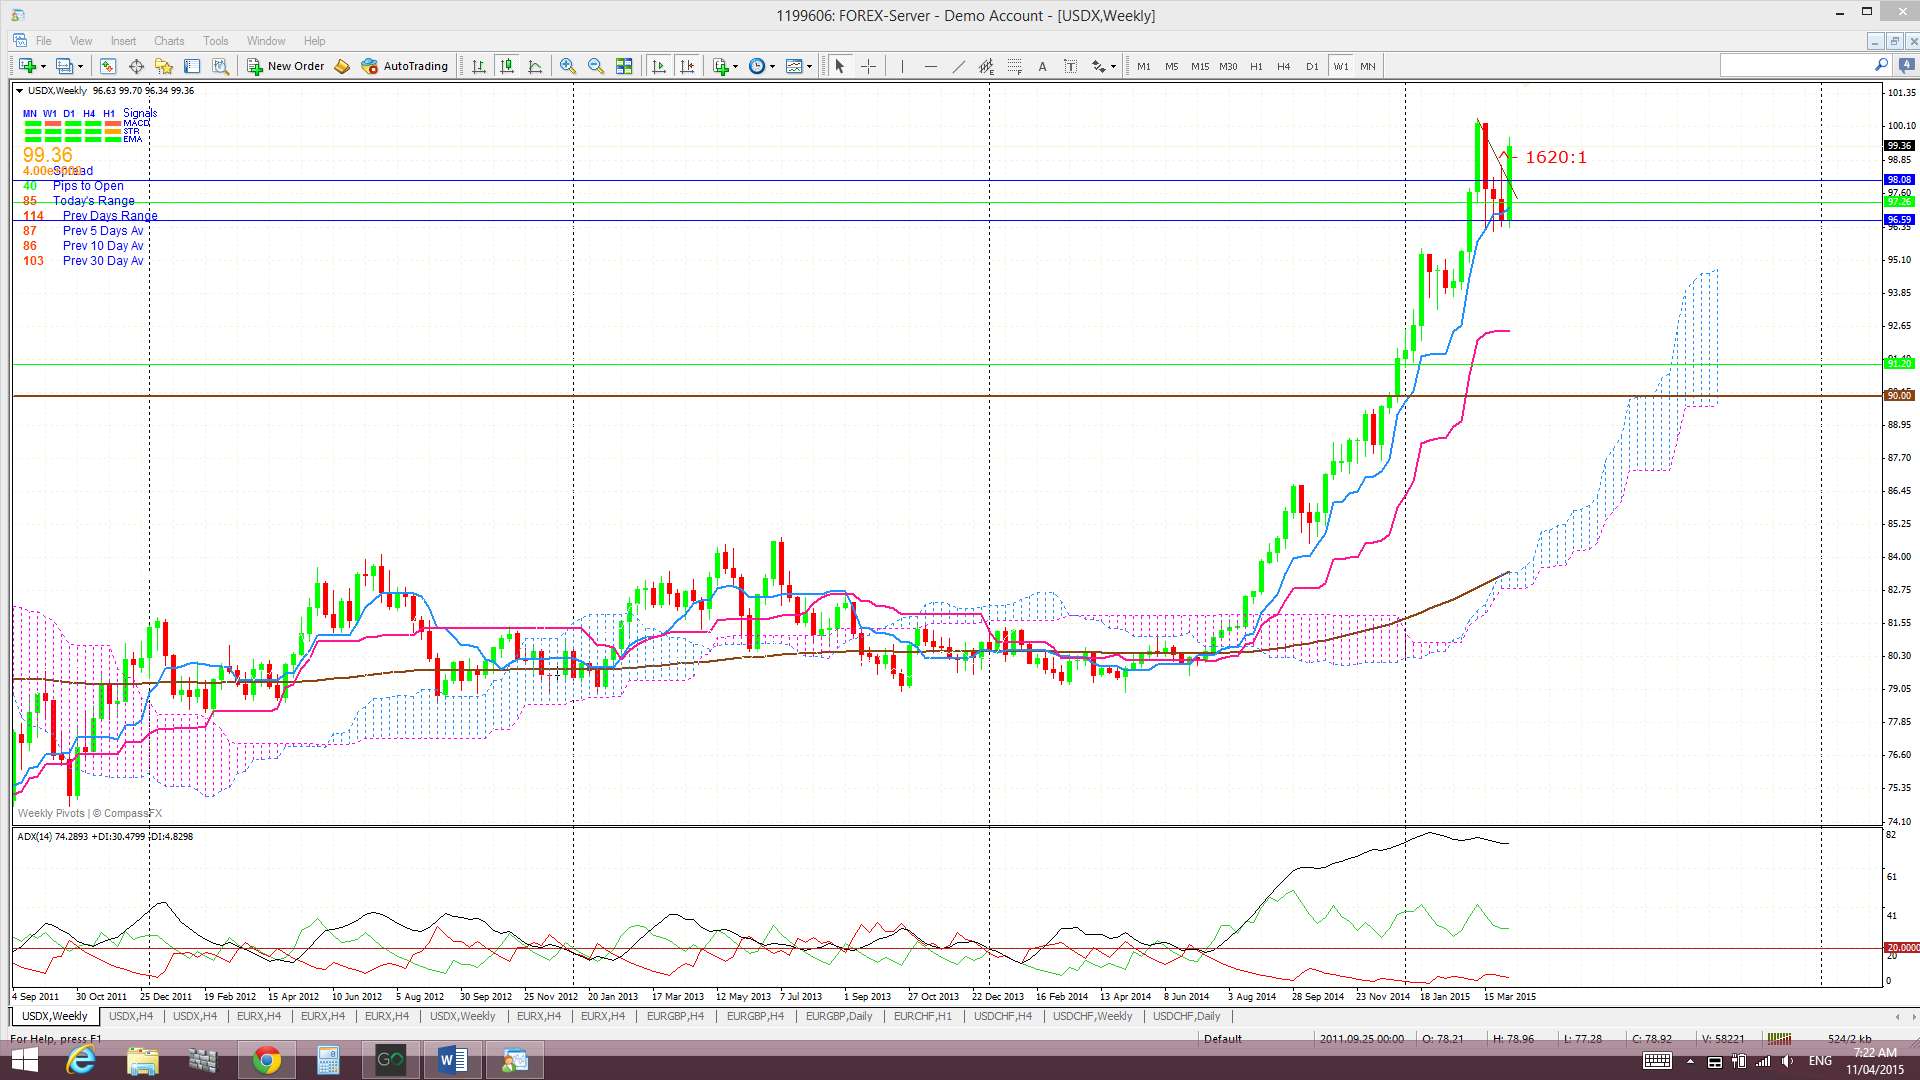
Weekly: Last week’s candle closed as a large bullish engulfing candle but the potential for a bearish ‘Double Top’ is clearly evident. Any return of bearish sentiment may see price action target the 61.8% retracement fib of this lengthy rally. It is worth noting that this fib level is down near the earlier monthly-chart triangle breakout region.

Weekly Ichimoku: The weekly candle closed well ABOVE the weekly Cloud.
Daily: Price traded higher each day last week. The index broke up through a recent bear trend line but the 100 level remains as resistance above current price as it forms a potential ‘Double Top’ region.
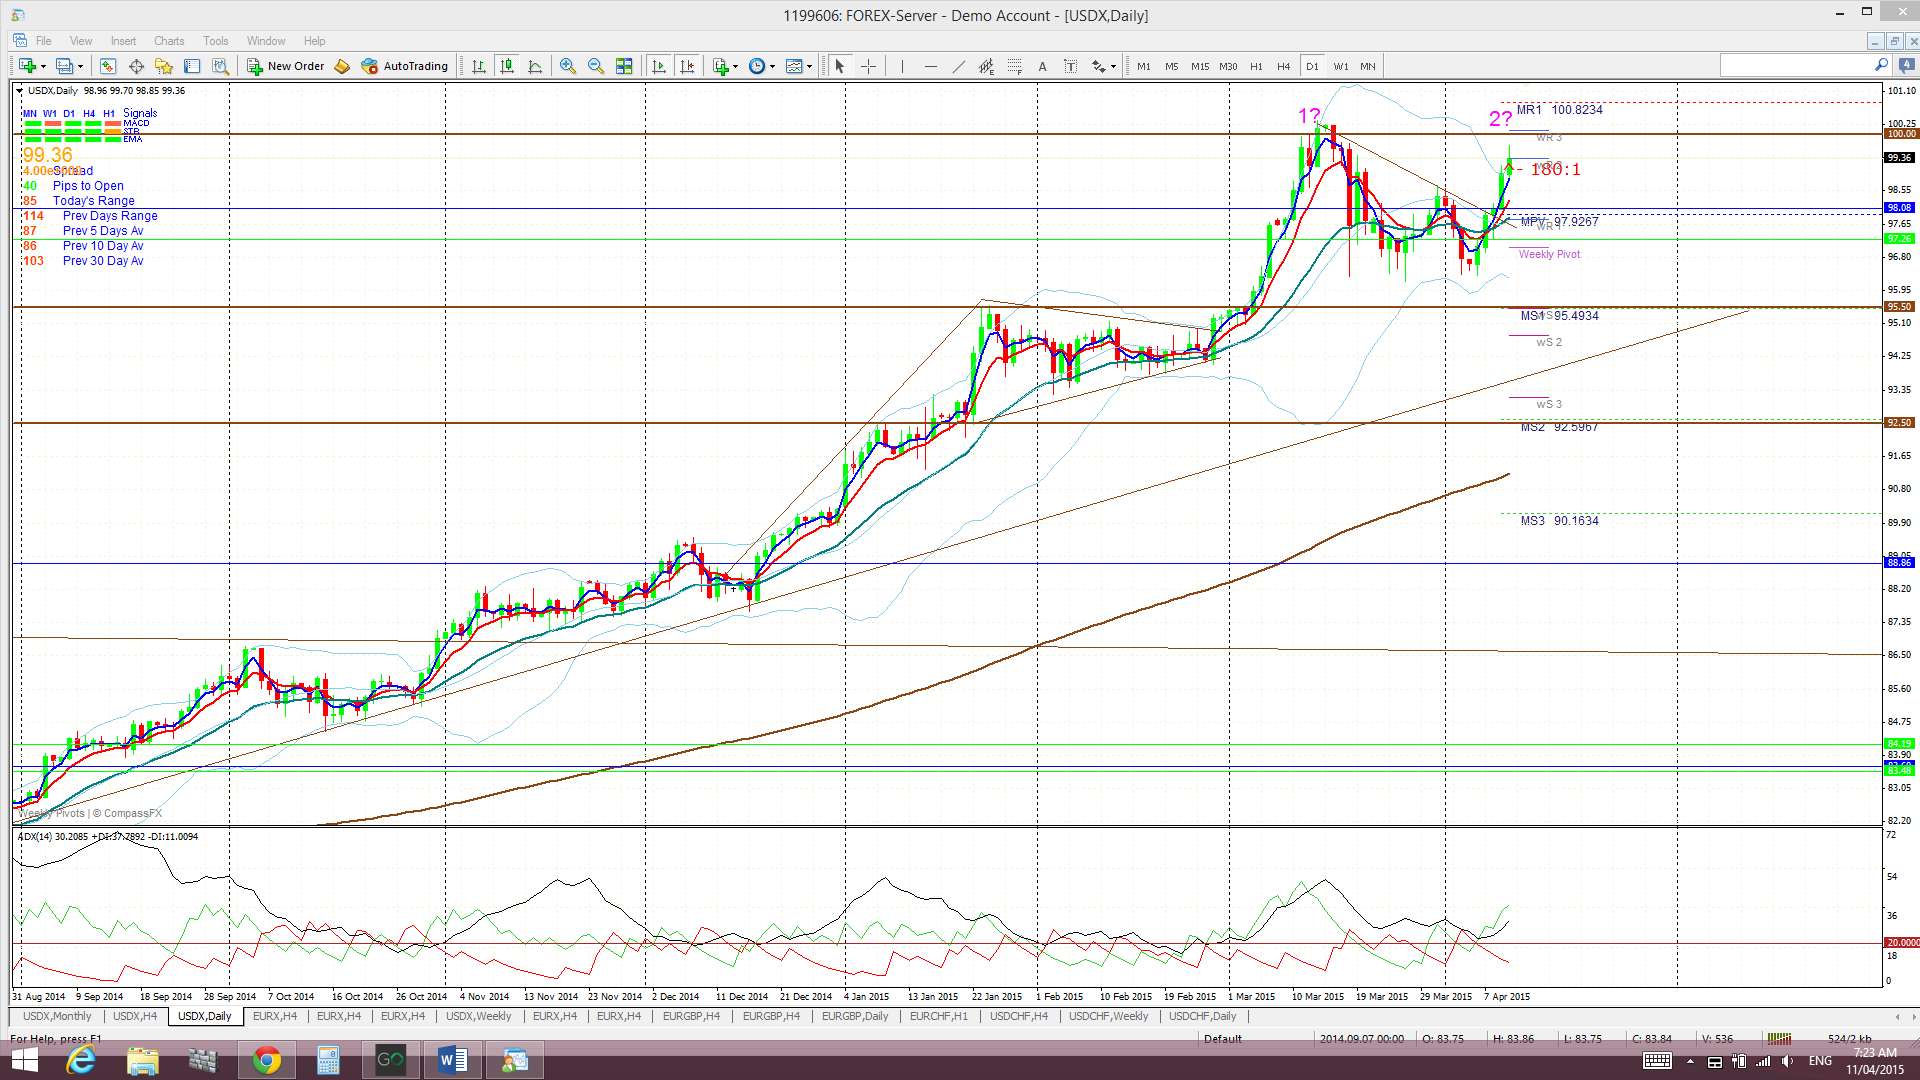
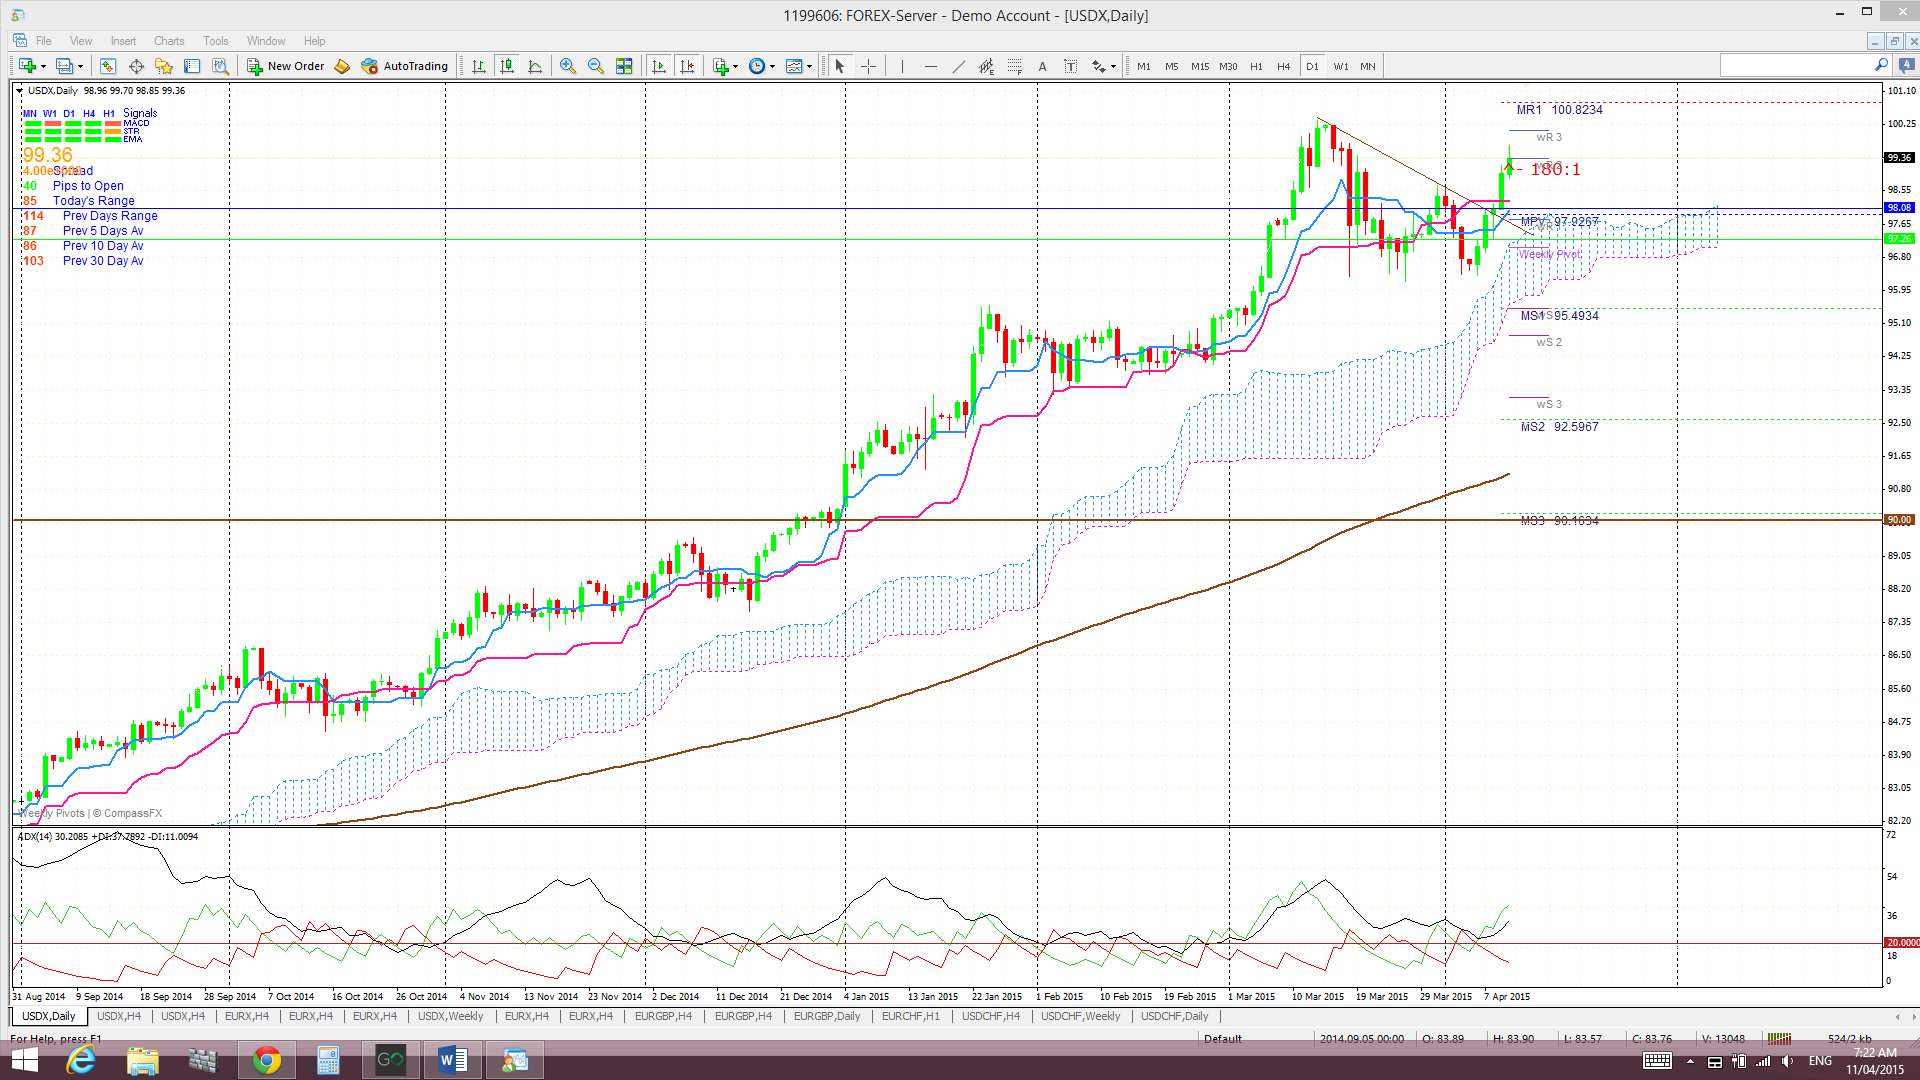
Daily Ichimoku Cloud chart: Price traded above the Cloud all week but the recent bearish Tenkan/Kijun cross remains open.
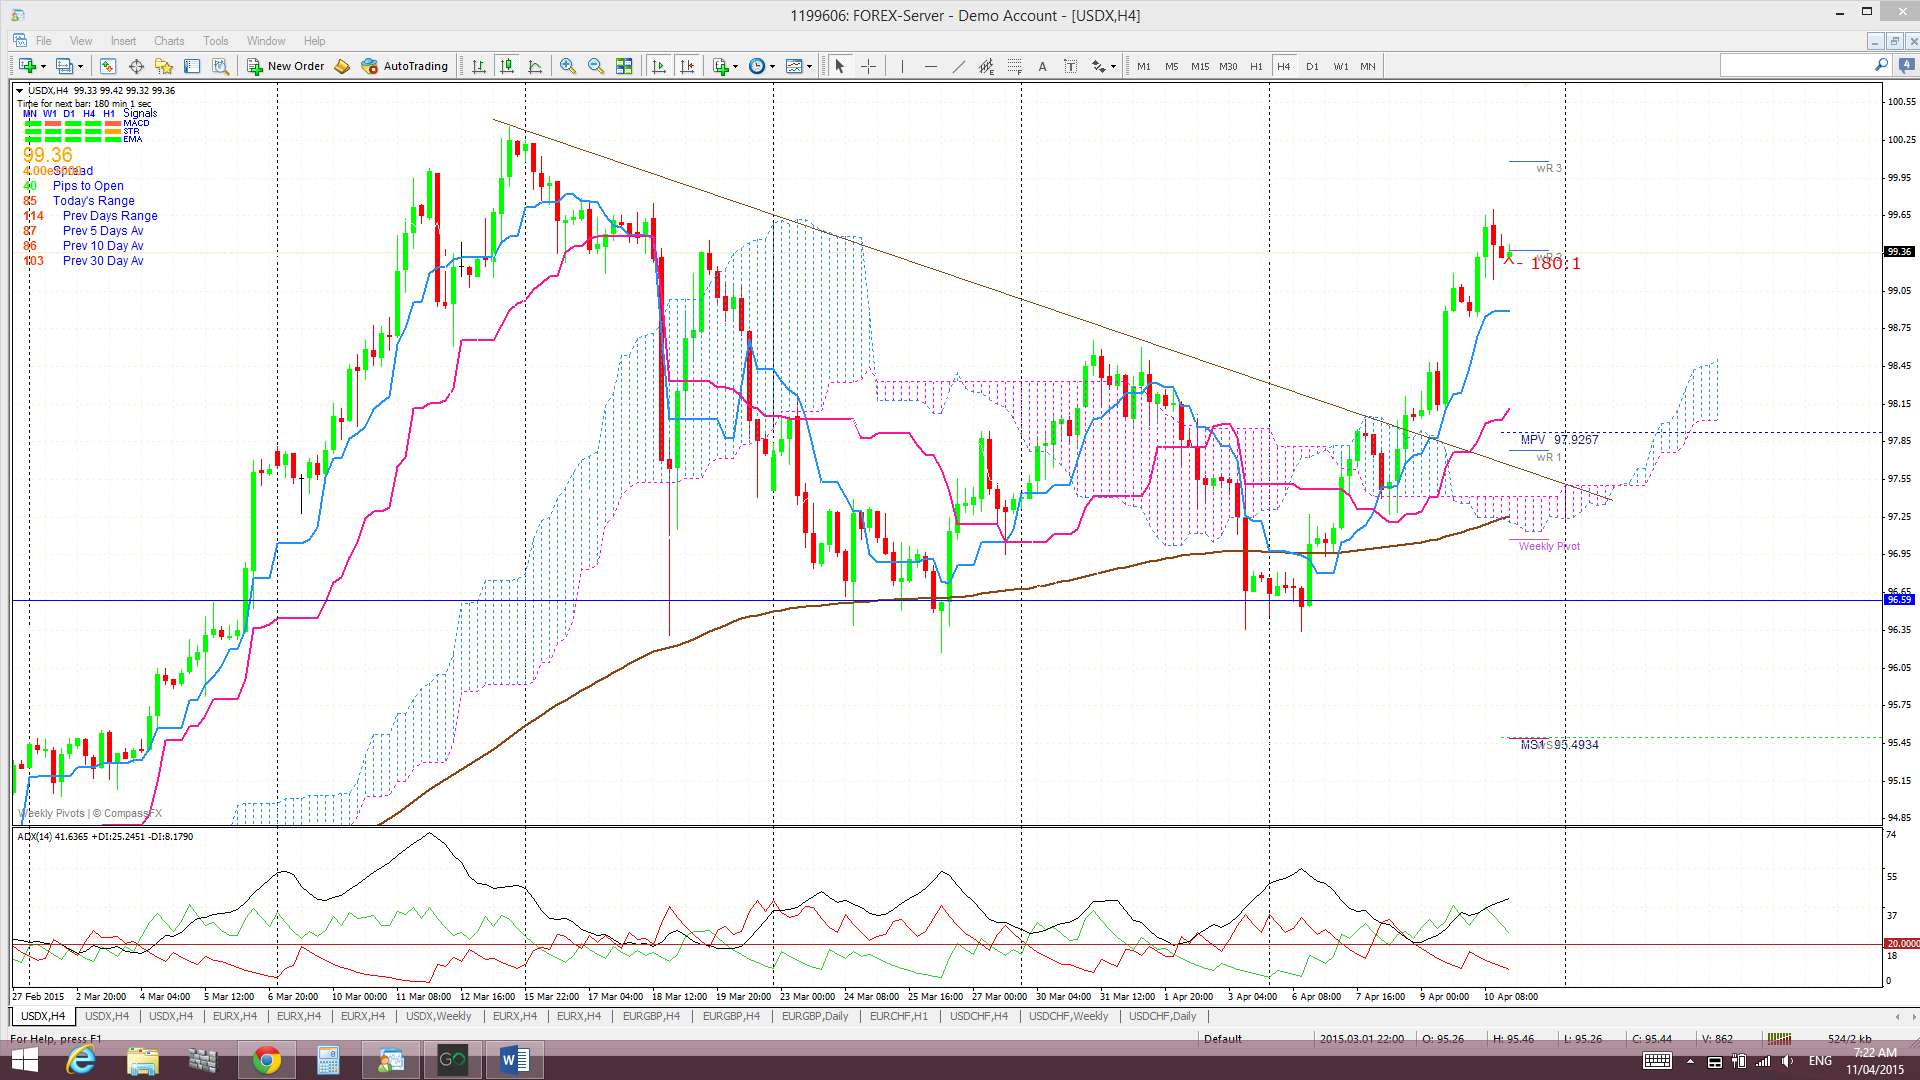
4hr: Price bounced up off a recent low and rallied up through a 4hr chart bear trend line. The index moved up through the 61.8% fib of the recent pullback move but now has to face the 100 resistance level.

4hr Ichimoku Cloud chart: Last week’s rally resulted in the index moving up through the 4 hr Cloud. This chart is back to being aligned with the daily chart and suggests LONG US$.
EURX
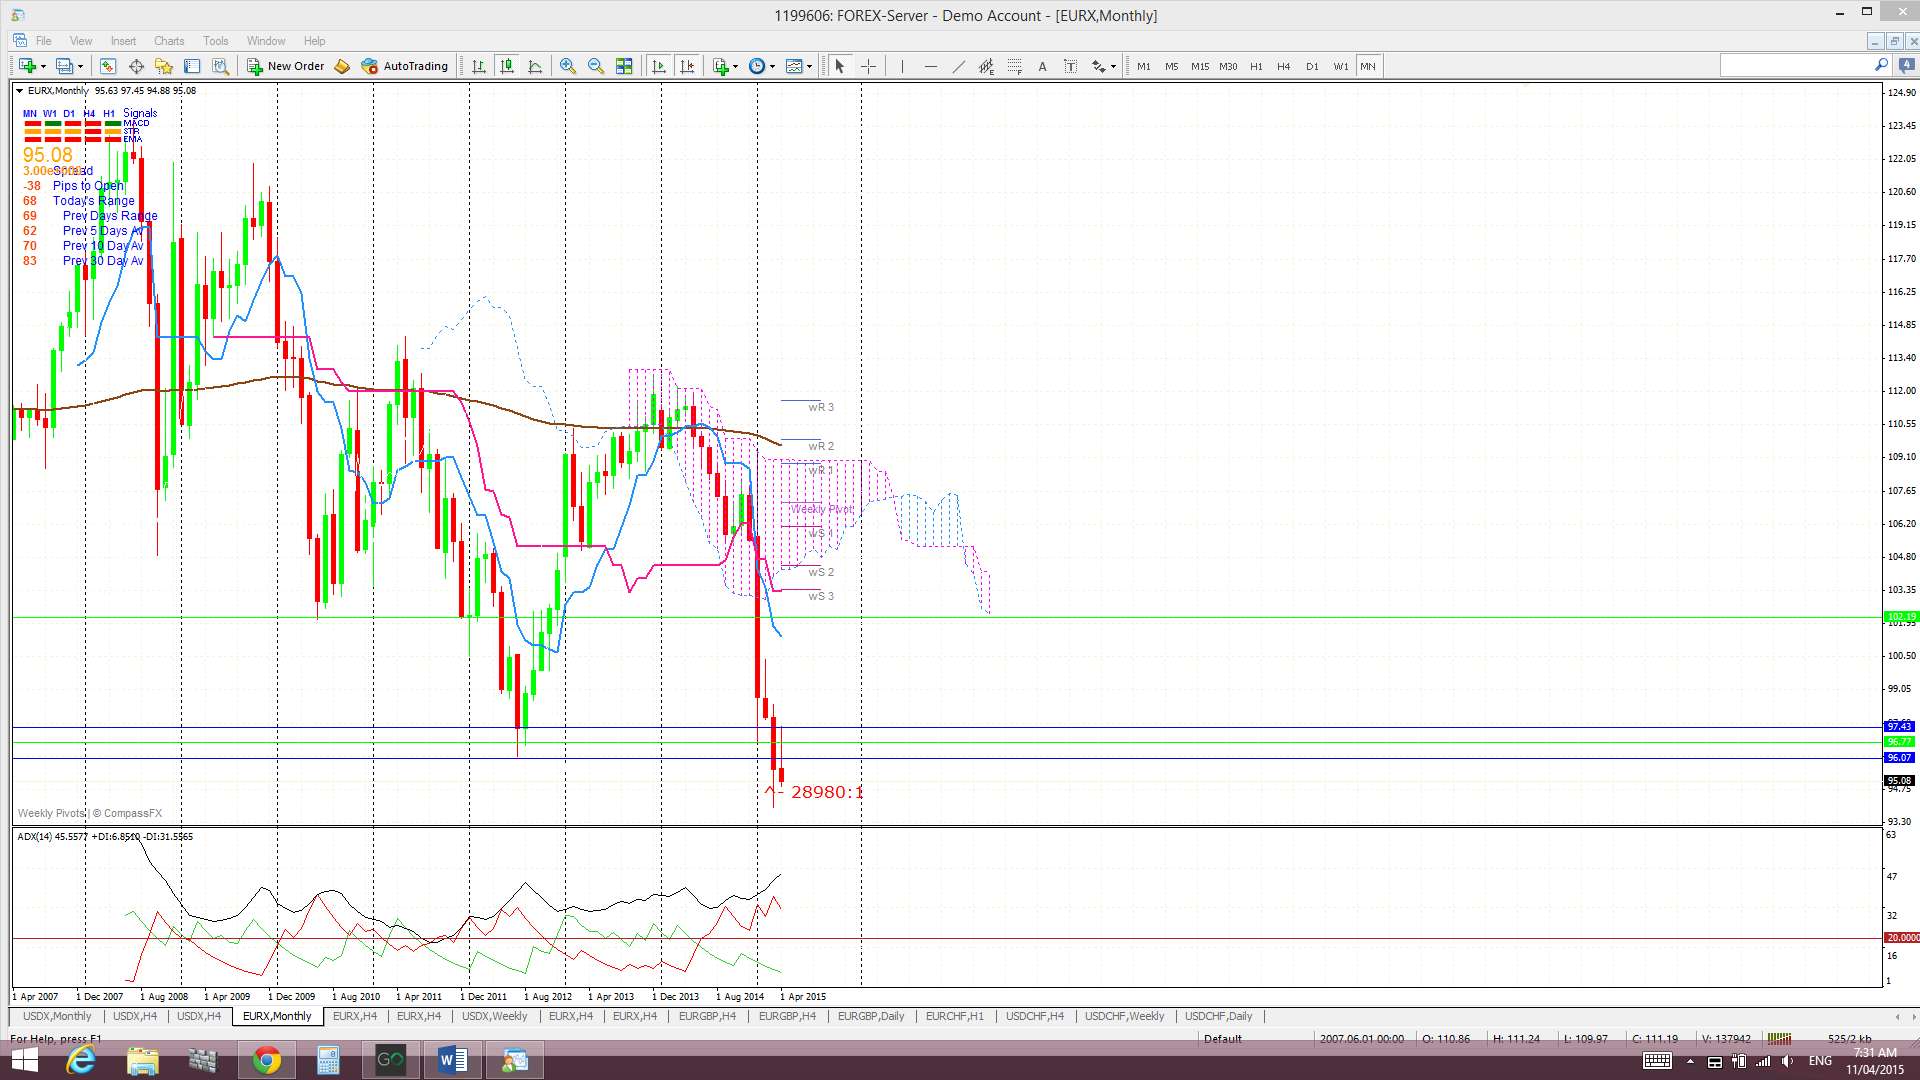
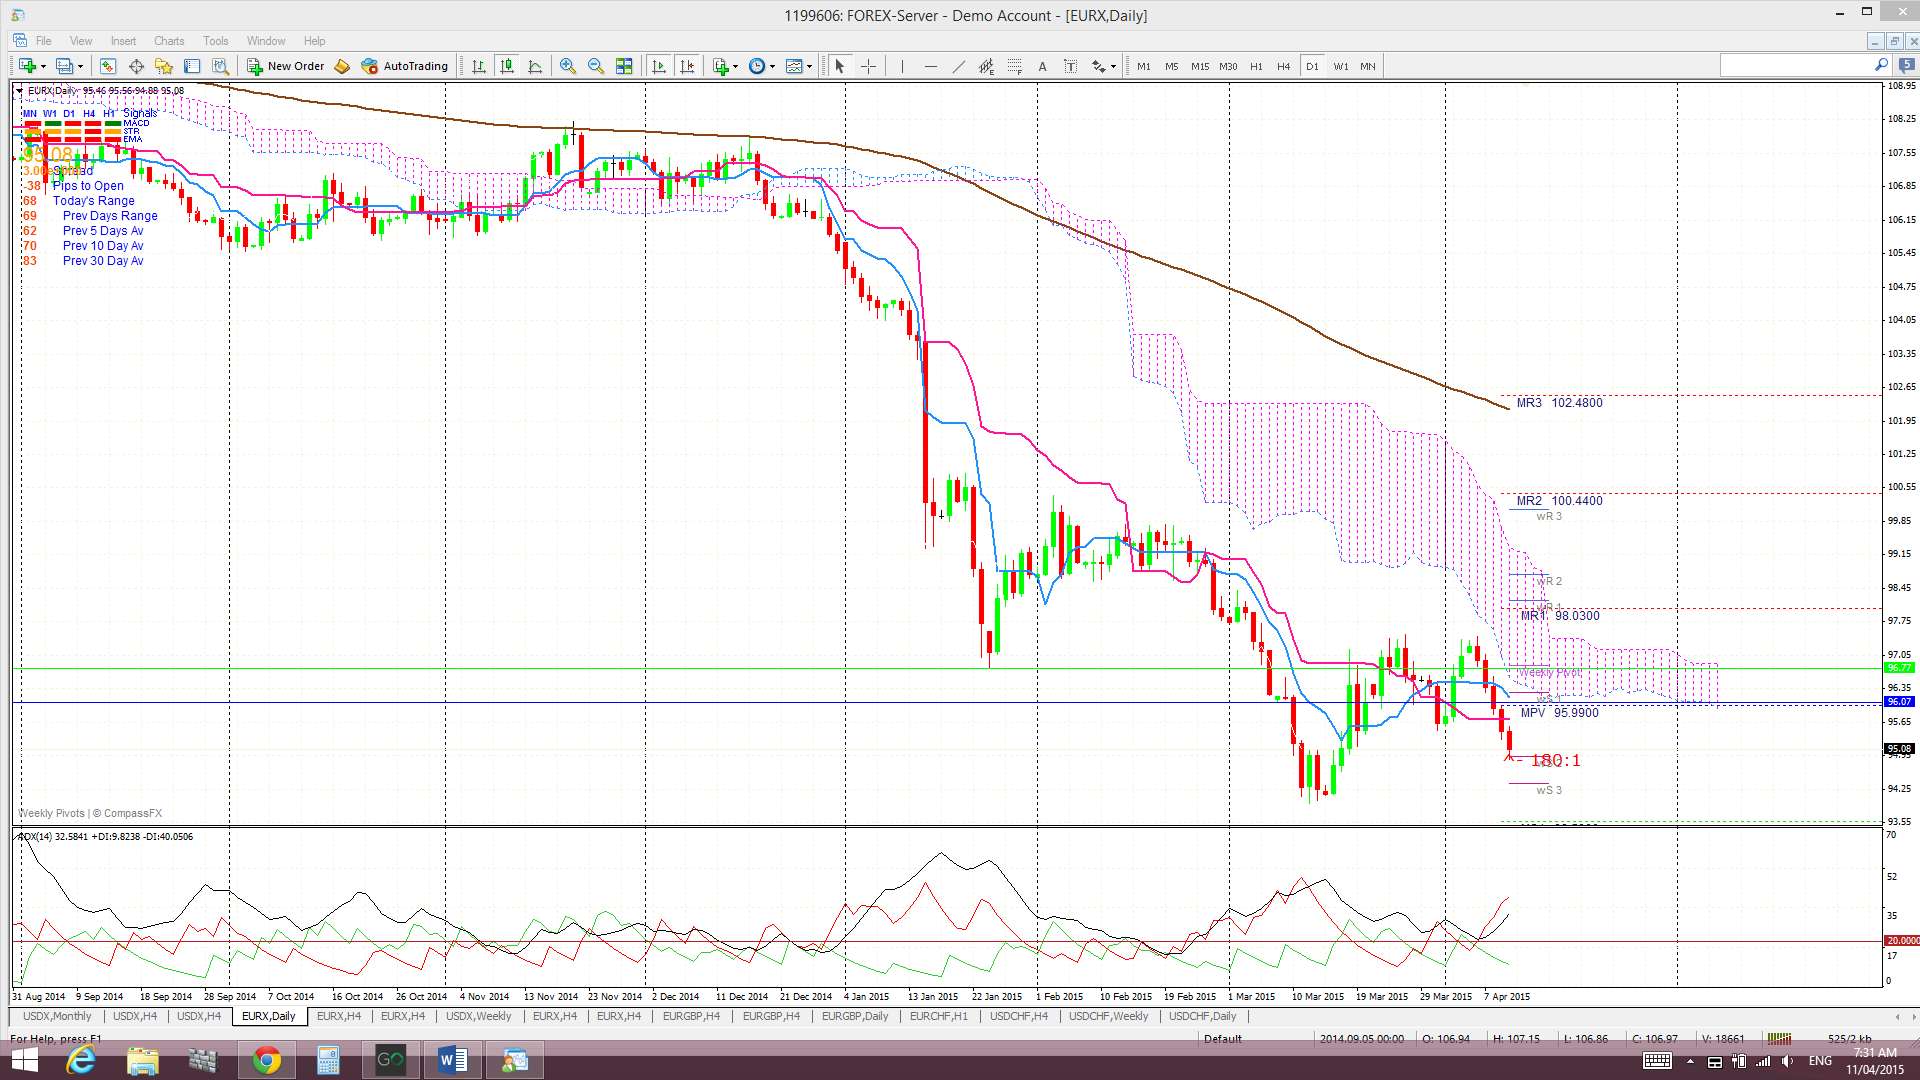
Monthly: The new April candle though is printing a small bearish candle with a long upper shadow but is below 96 support.
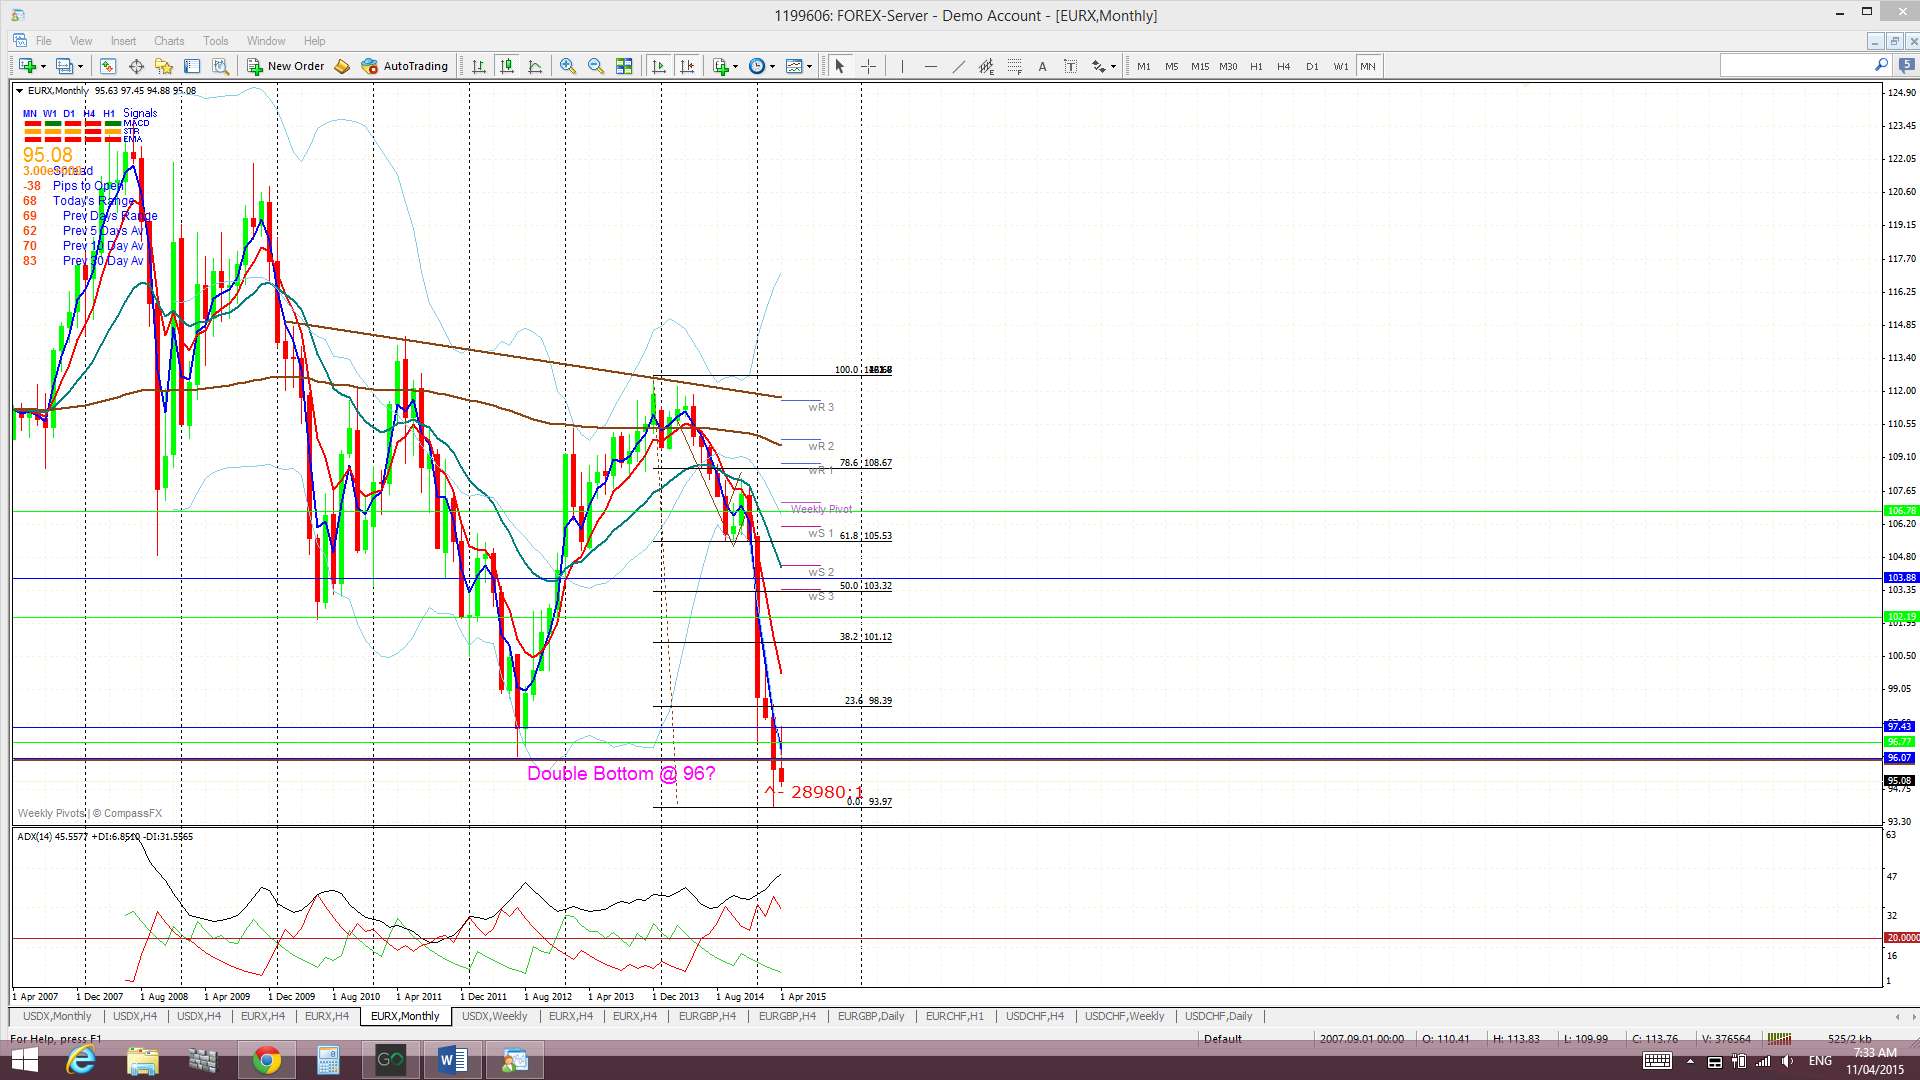
Monthly Ichimoku: The new April candle is still below the Cloud.
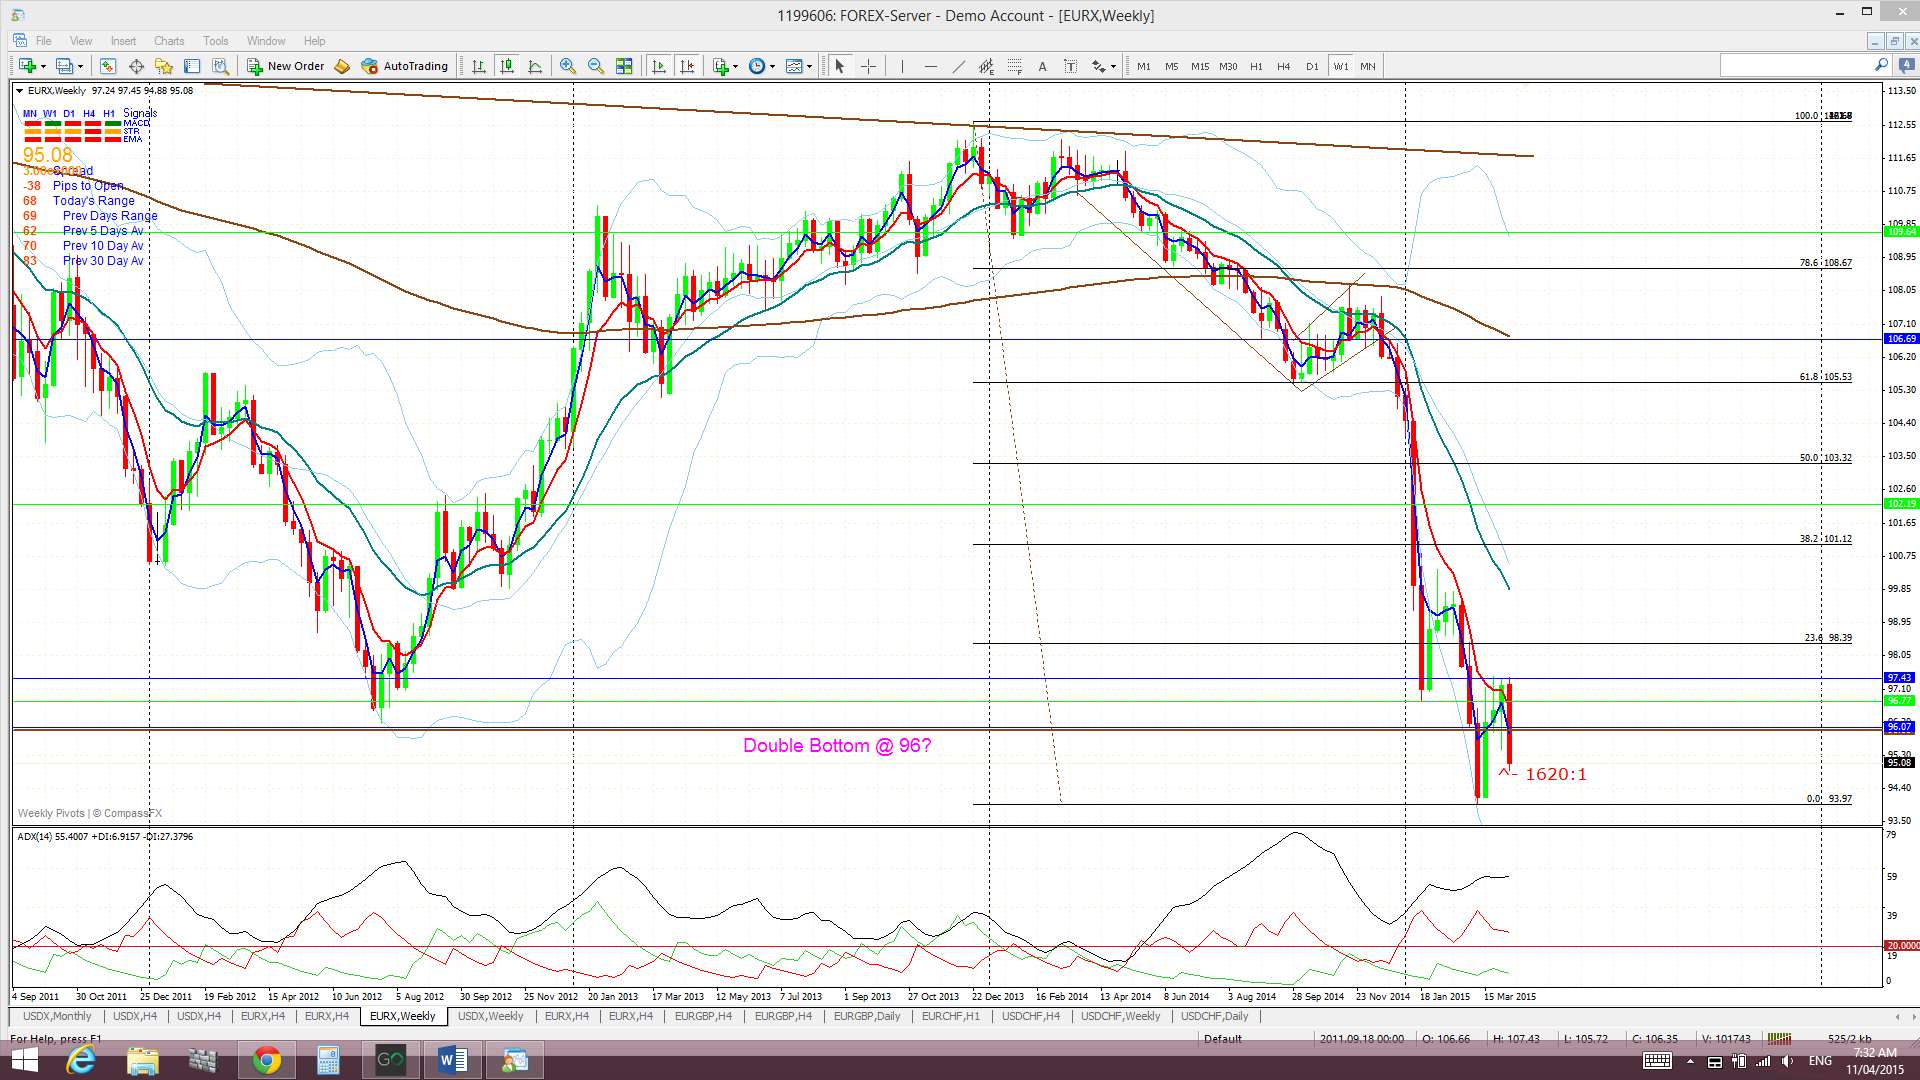
Weekly: The weekly candle closed as a large bearish engulfing candle. Any pullback though might target the 61.8% fib retracement level up near 105.5. This is also near the weekly 200 EMA.
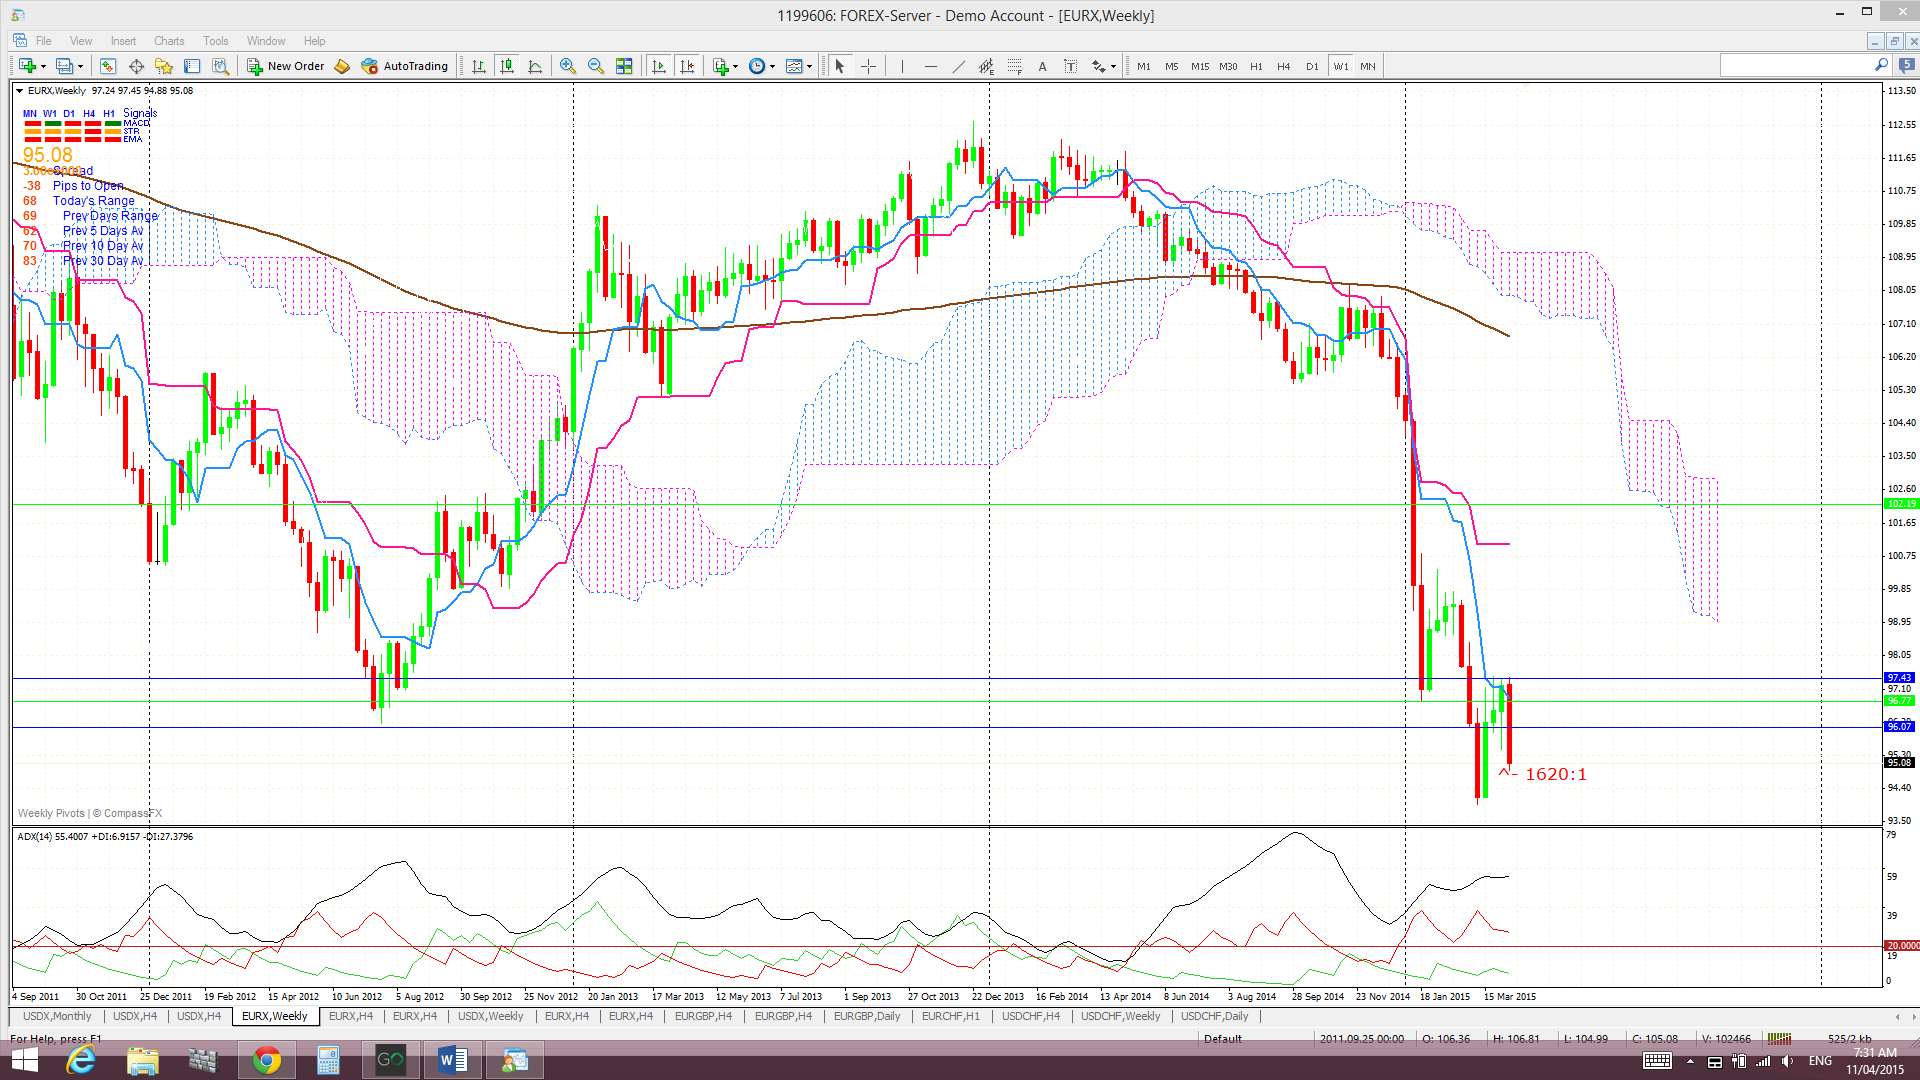
Weekly Ichimoku: Price is still trading well below the weekly Cloud.
Daily: Price traded lower every day of last week.
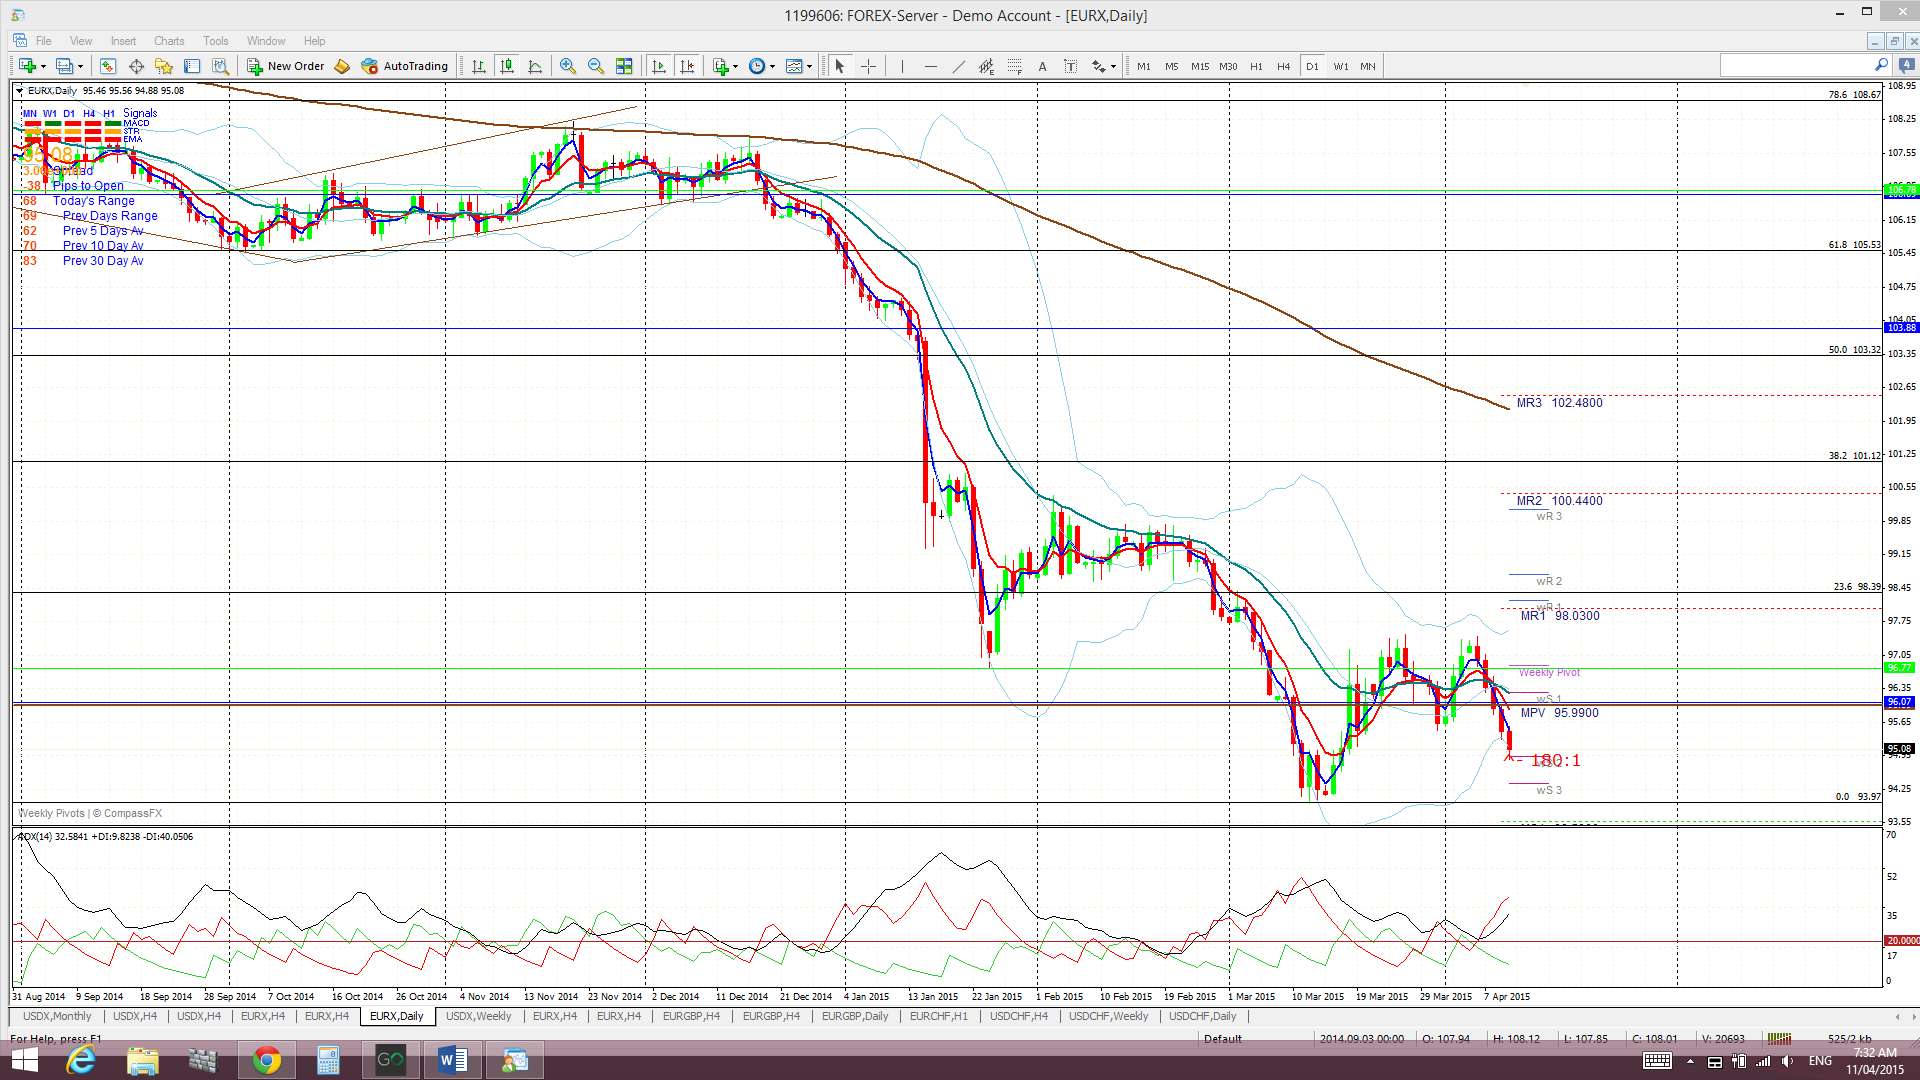
Daily Ichimoku Cloud chart: Price is still trading below the daily Cloud but the recent bullish Tenkan/Kijun cross remains open.
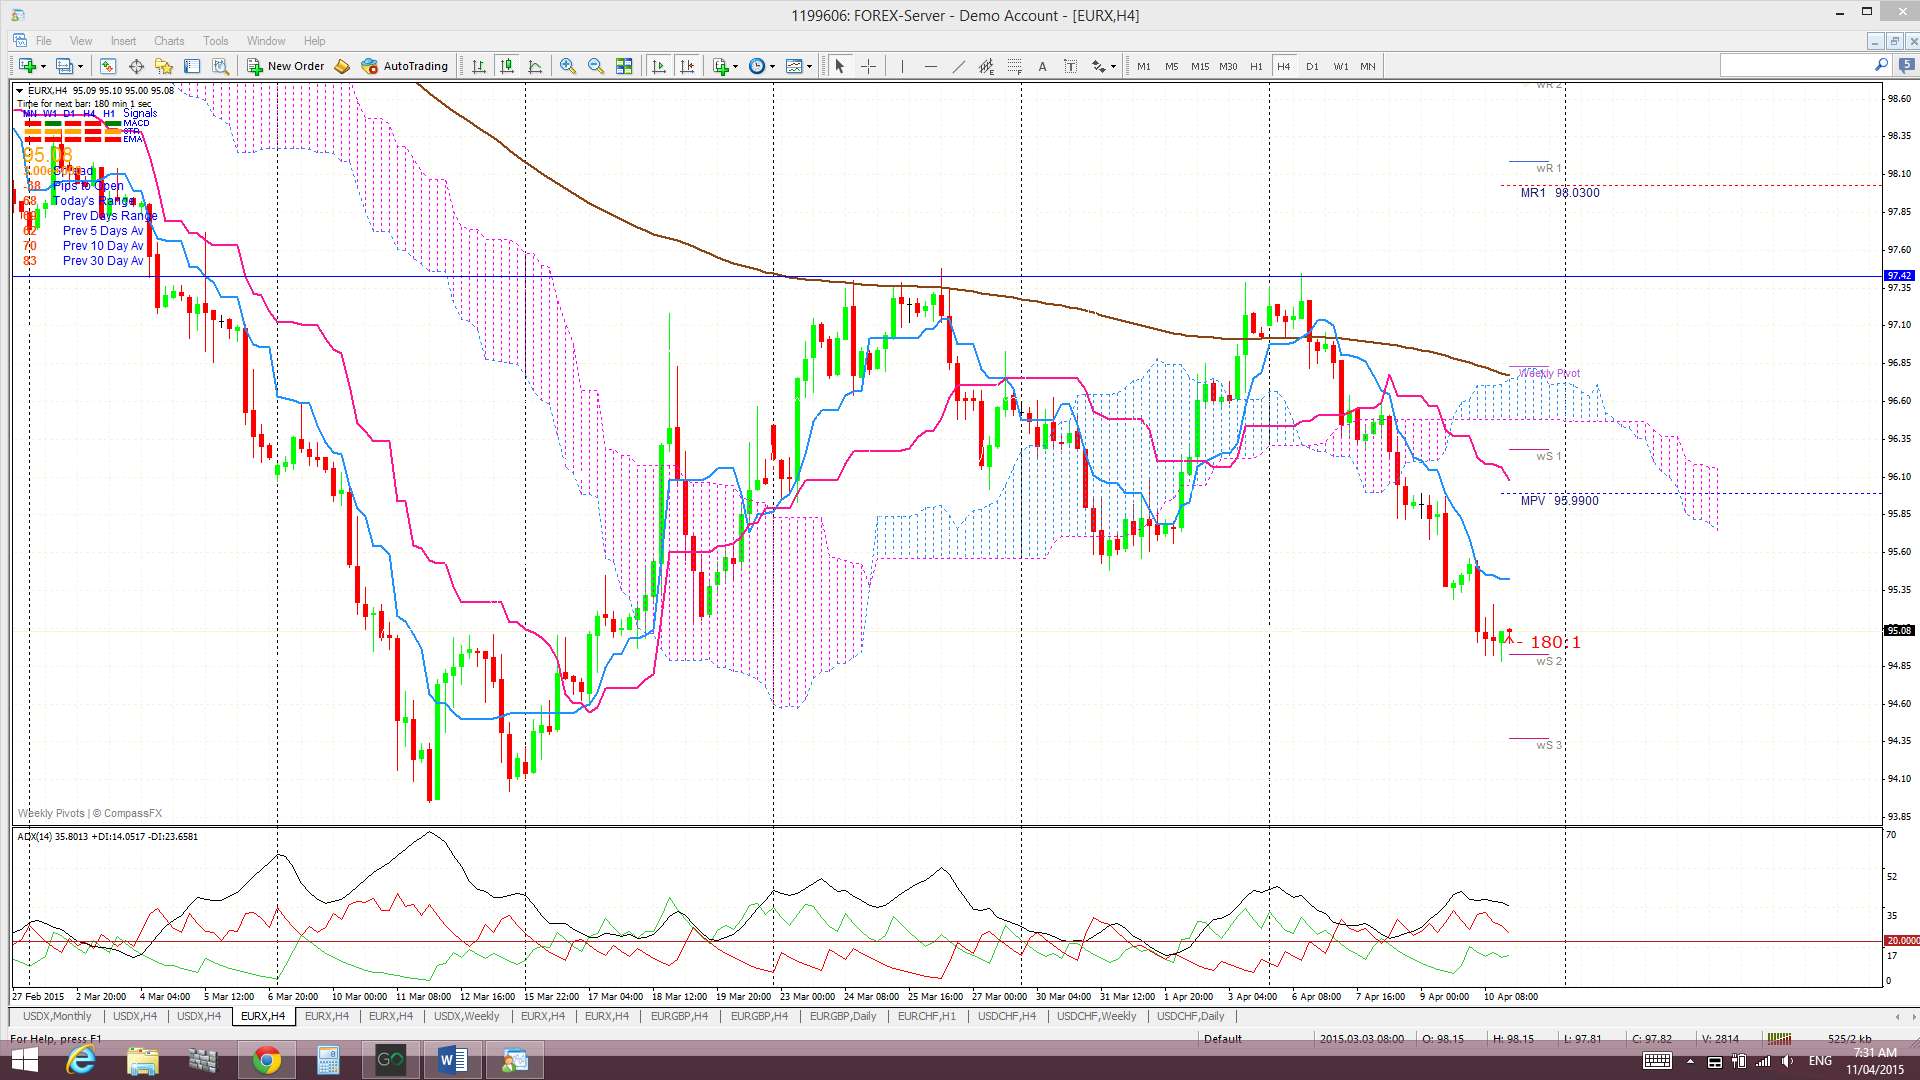
4 hr: Price chopped lower last week. Any continued bearish activity will bring the previous low region near 94 back into focus.
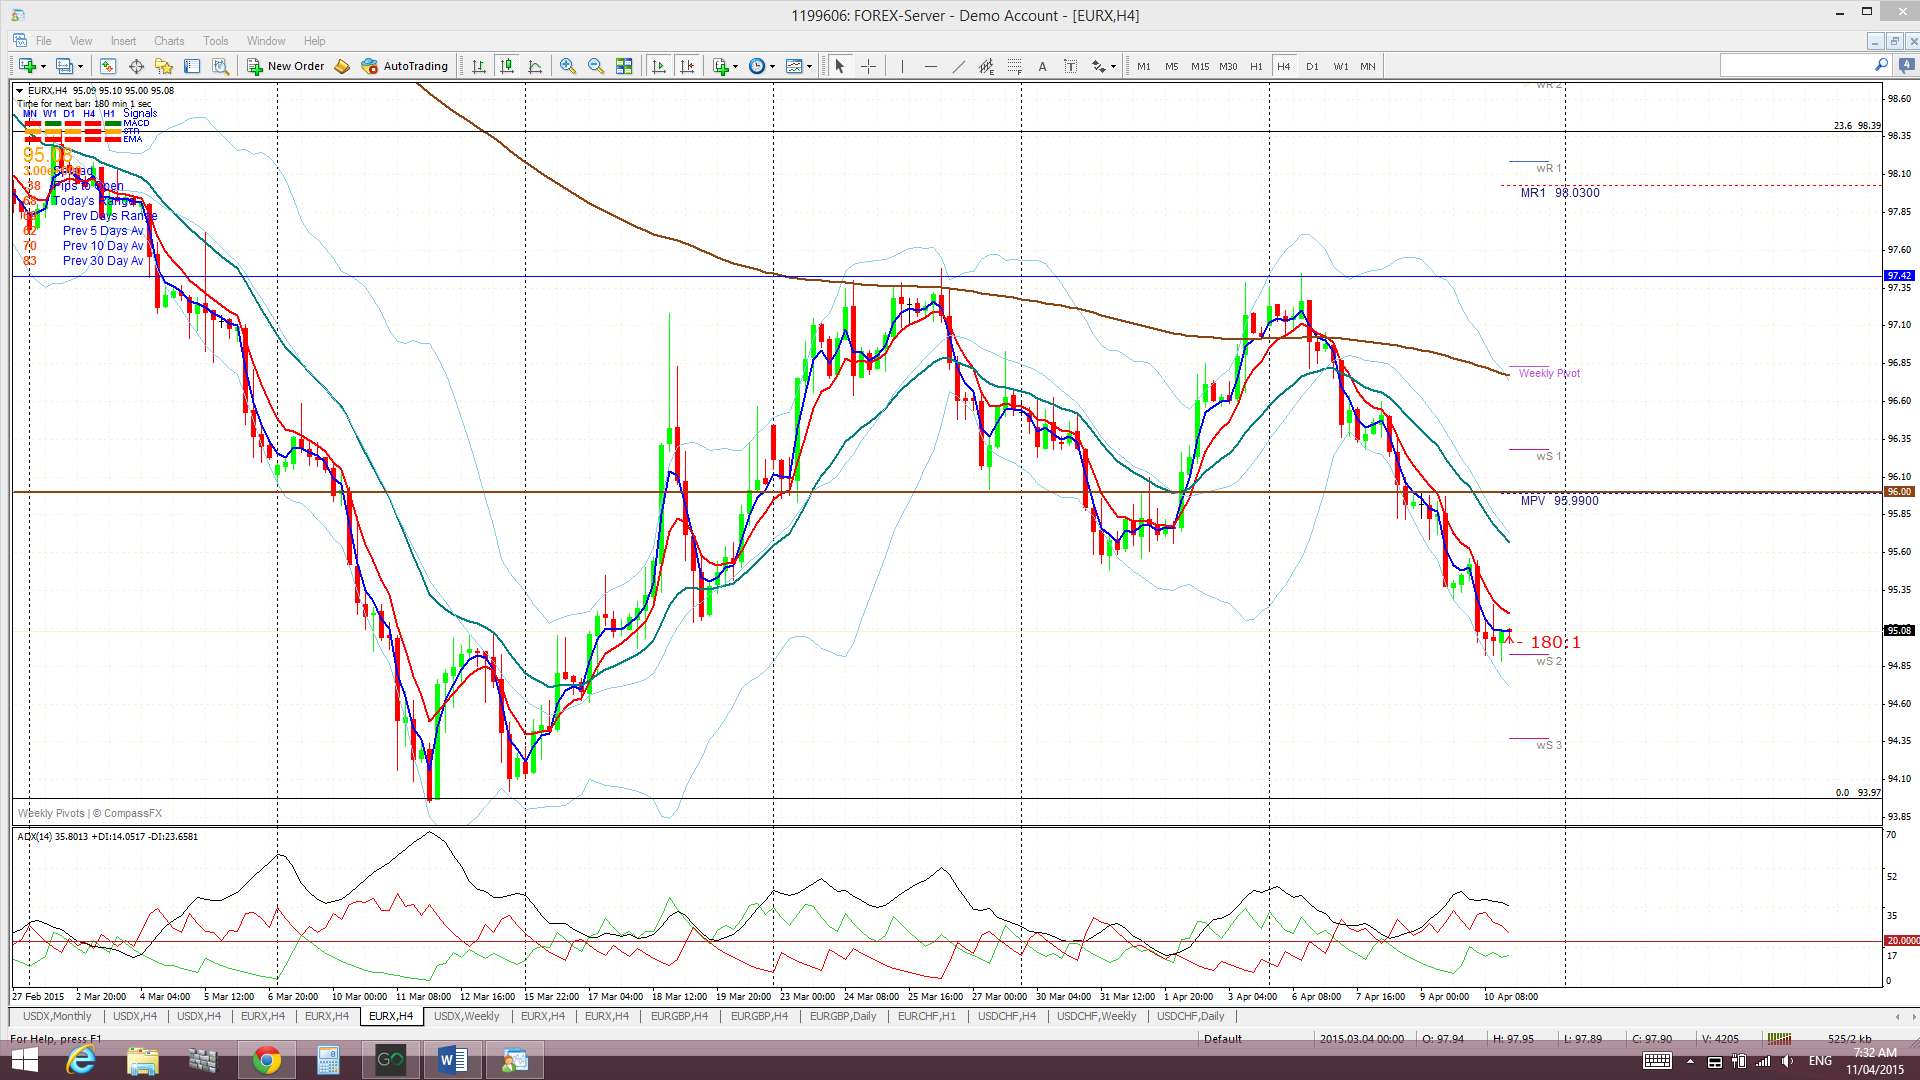
4 hr Ichimoku Cloud chart: The EURX fall has meant that price moved to trade below the Cloud. This chart is back to being aligned with the daily chart and suggests short EUR.
Comments:
Daily and 4hr Cloud alignment: The FX indices are back to being aligned and this means that both the USDX and EURX are trading on the same side of the Ichimoku Cloud on their 4hr and daily time frames. Periods of alignment often result in decent tending markets. In the current situation the alignment is towards LONG US$ and SHORT EUR.
USDX: the USDX closed higher last week despite the disappointing NFP result of the previous week. Last week’s FOMC minutes seemed to leave the door open for a possible US rate hike in June and this has obviously encouraged US$ bulls.
The USDX bounced up off a recent pull back low to start the week and never looked back. It broke up through a 61.8% fib pull back level that now suggests continuation. However, the hard task of breaking up through 100 resistance is still ahead of the index. I still prefer to see a new close and hold above 100 before being confident of any sustainable bullish continuation.
The stronger US$ may be starting to impact stocks with Q1 earnings form a couple of companies reporting last week falling short of expectations. A continued impact on company earnings may give the Fed some pause for concern about the timing of any rate hike and next week’s US Retail Sales will be in focus for them too.
I see that the key US$ levels to watch as being:
- Any new close and hold above 100 would support bullish continuation.
- Any new close and hold below 95.50 would support a deeper pullback.
EURX: The EURX closed lower last week despite Greece making its IMF payment. Divergence between the EZ and US economies continues to be a dominant theme with the Eurozone entering a monetary easing cycle with the US emerging from one. The fate of the EURX continues to be more in the hands of USDX flows than of any Euro-related data for the time being.
The levels to watch on the EURX, apart from the key 96 level, include:
- 105.5: The weekly chart reveals that a 61.8% fib retracement of the recent lengthy bear move is back up near the 105.50 level and weekly 200 EMA. Any move back above 96 and continued recovery effort might see the index target this region.
- 94: Any hold below 96 might suggest bearish continuation as it represents a break of a monthly chart ‘Double Top’. If so, the recent low printed near 94 will come back into focus.
Note: The analysis provided above is based purely on technical analysis of the current chart set ups. As always, Fundamental-style events, by way of any Ukraine, Ebola, Eurozone or Middle East events and/or news announcements, continue to be unpredictable triggers for price movement on the indices. These events always have the potential to undermine any technical analysis.
The post US$ had a strong week but the hard task is still ahead! appeared first on www.forextell.com.