Last week: This is my first update in some weeks due to the protracted Greek-debt situation. US$ strength defined much of last week and, given how the US$ chart is currently presenting, I’m wondering if this may be shaping up to be the new normal.
I have been noting reliable trend line and triangle breakout signals over recent weeks, more so than trend-based TC signals. With much of the Greek-debt deliberations behind us now though I’m hoping that some momentum, dare I suggest normality, might return to the currency markets. Some of these FX triangle breakouts delivered huge pip offerings: a triangle breakout on the Loonie has given up to 500 pips so far, on the GBP/NZD over 700 pips and over 100 pips on the U/J. Thus, triangle breakouts can be valid and reliable trading systems in their own right!
This week:
The US$ index has triggered a Bull Flag breakout and the EURX a Bear Flag breakout. I’ll be watching for any continuation with these patterns as this may offer insight into potential significant moves with a range of currency pairs. An update on the FX Indices can be found through this link.
There isn’t much scheduled US$ sensitive data this week. In fact, the only high impact item that I can see is the regular weekly Unemployment Claims data. Add to this that the only EUR high impact data I can see is some German and French Manufacturing PMI data, and these aren’t until Friday, and then we could be in for a slow start to the week.
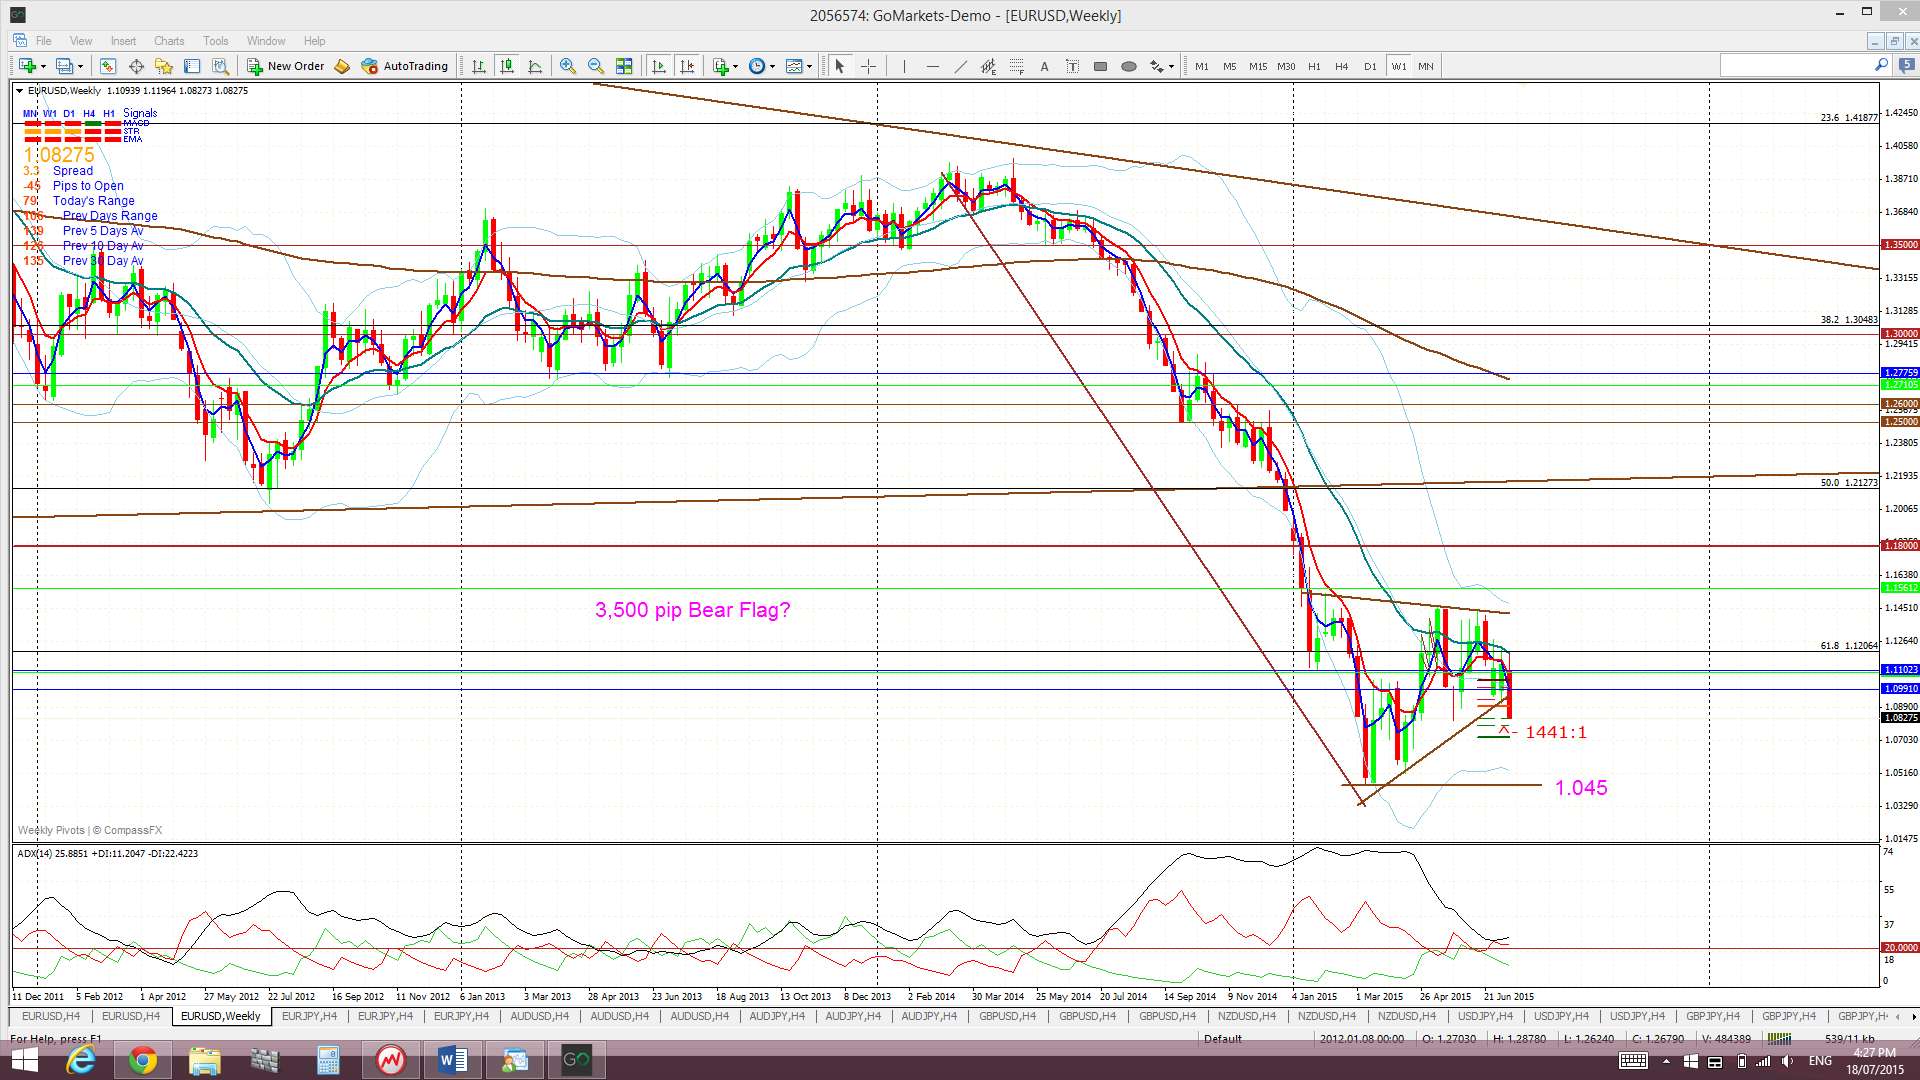
EUR/USD: there has been a trend line break on this pair that could signal the start of a potential 3,500 pip Bear Flag move. Any continued US$ strength will support this and so keeping an eye on how the US$ handles the 100 level will be key with this pair too.
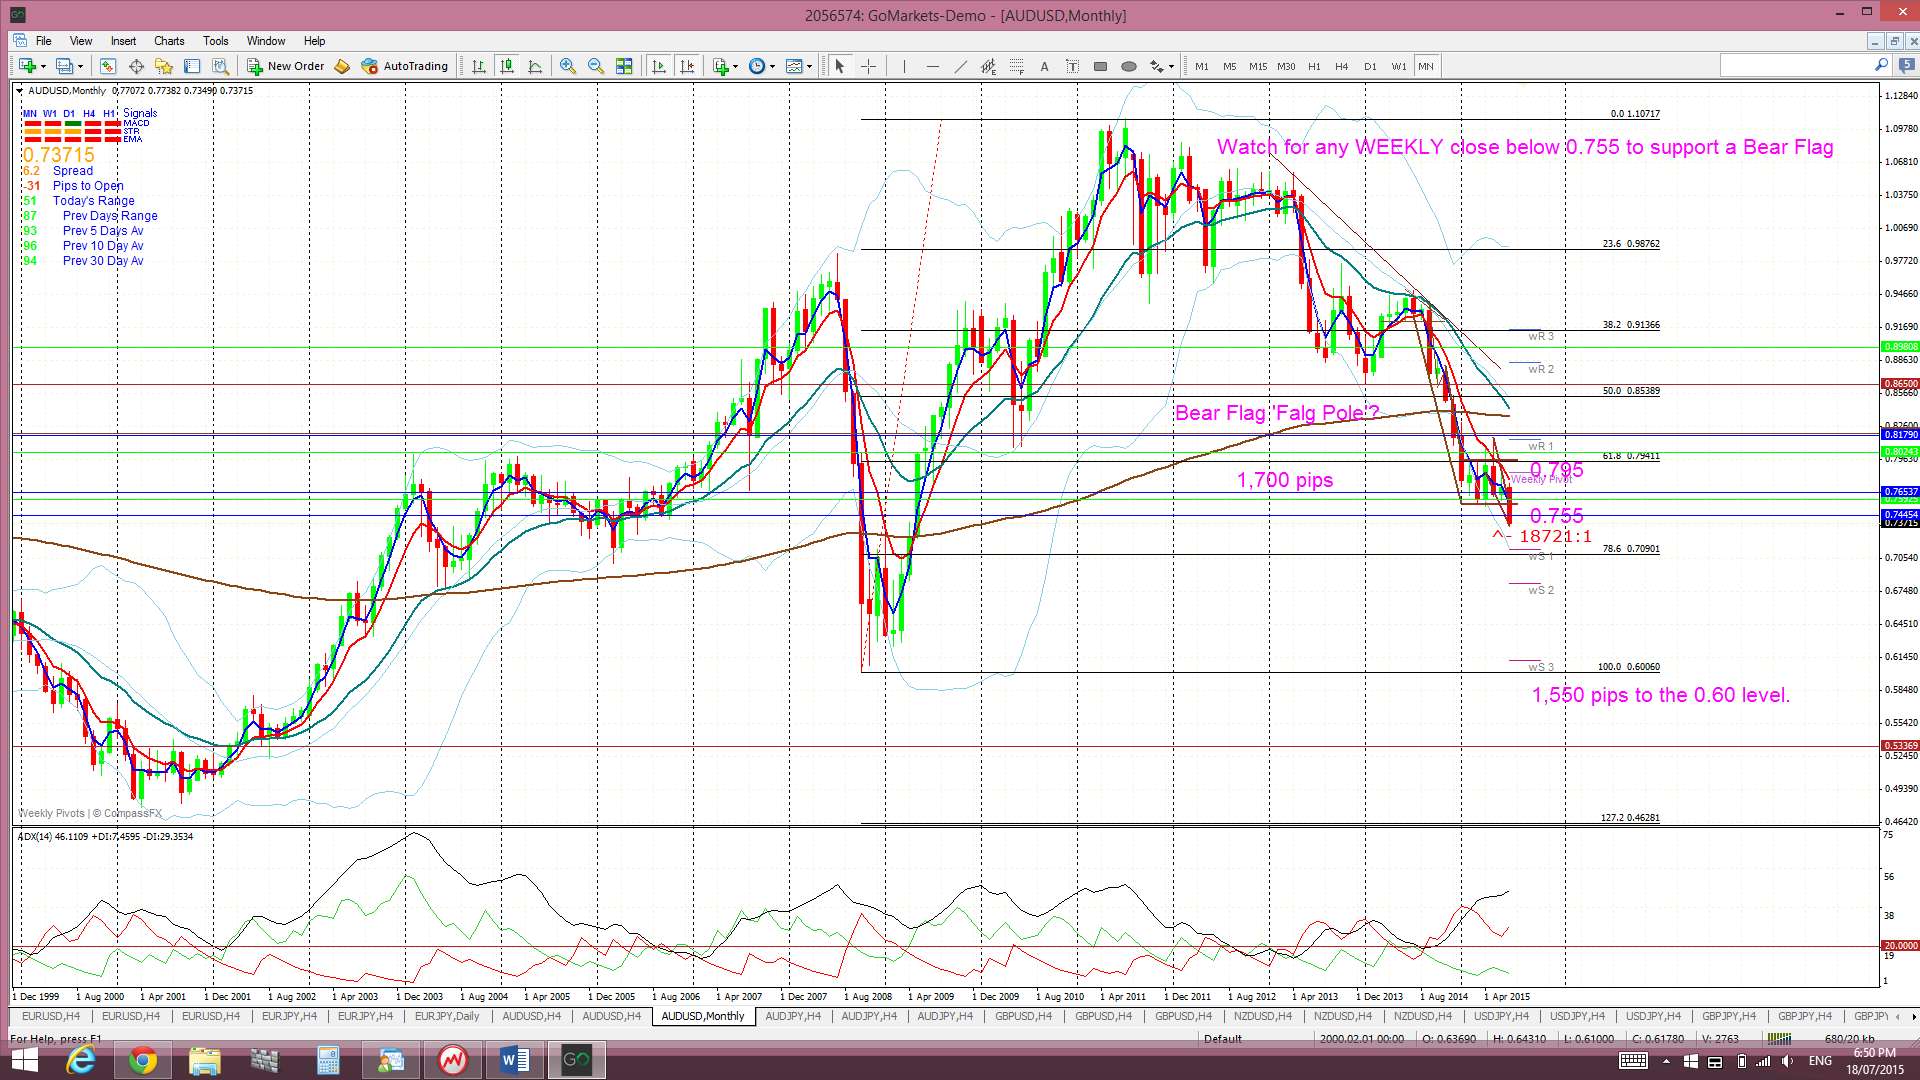
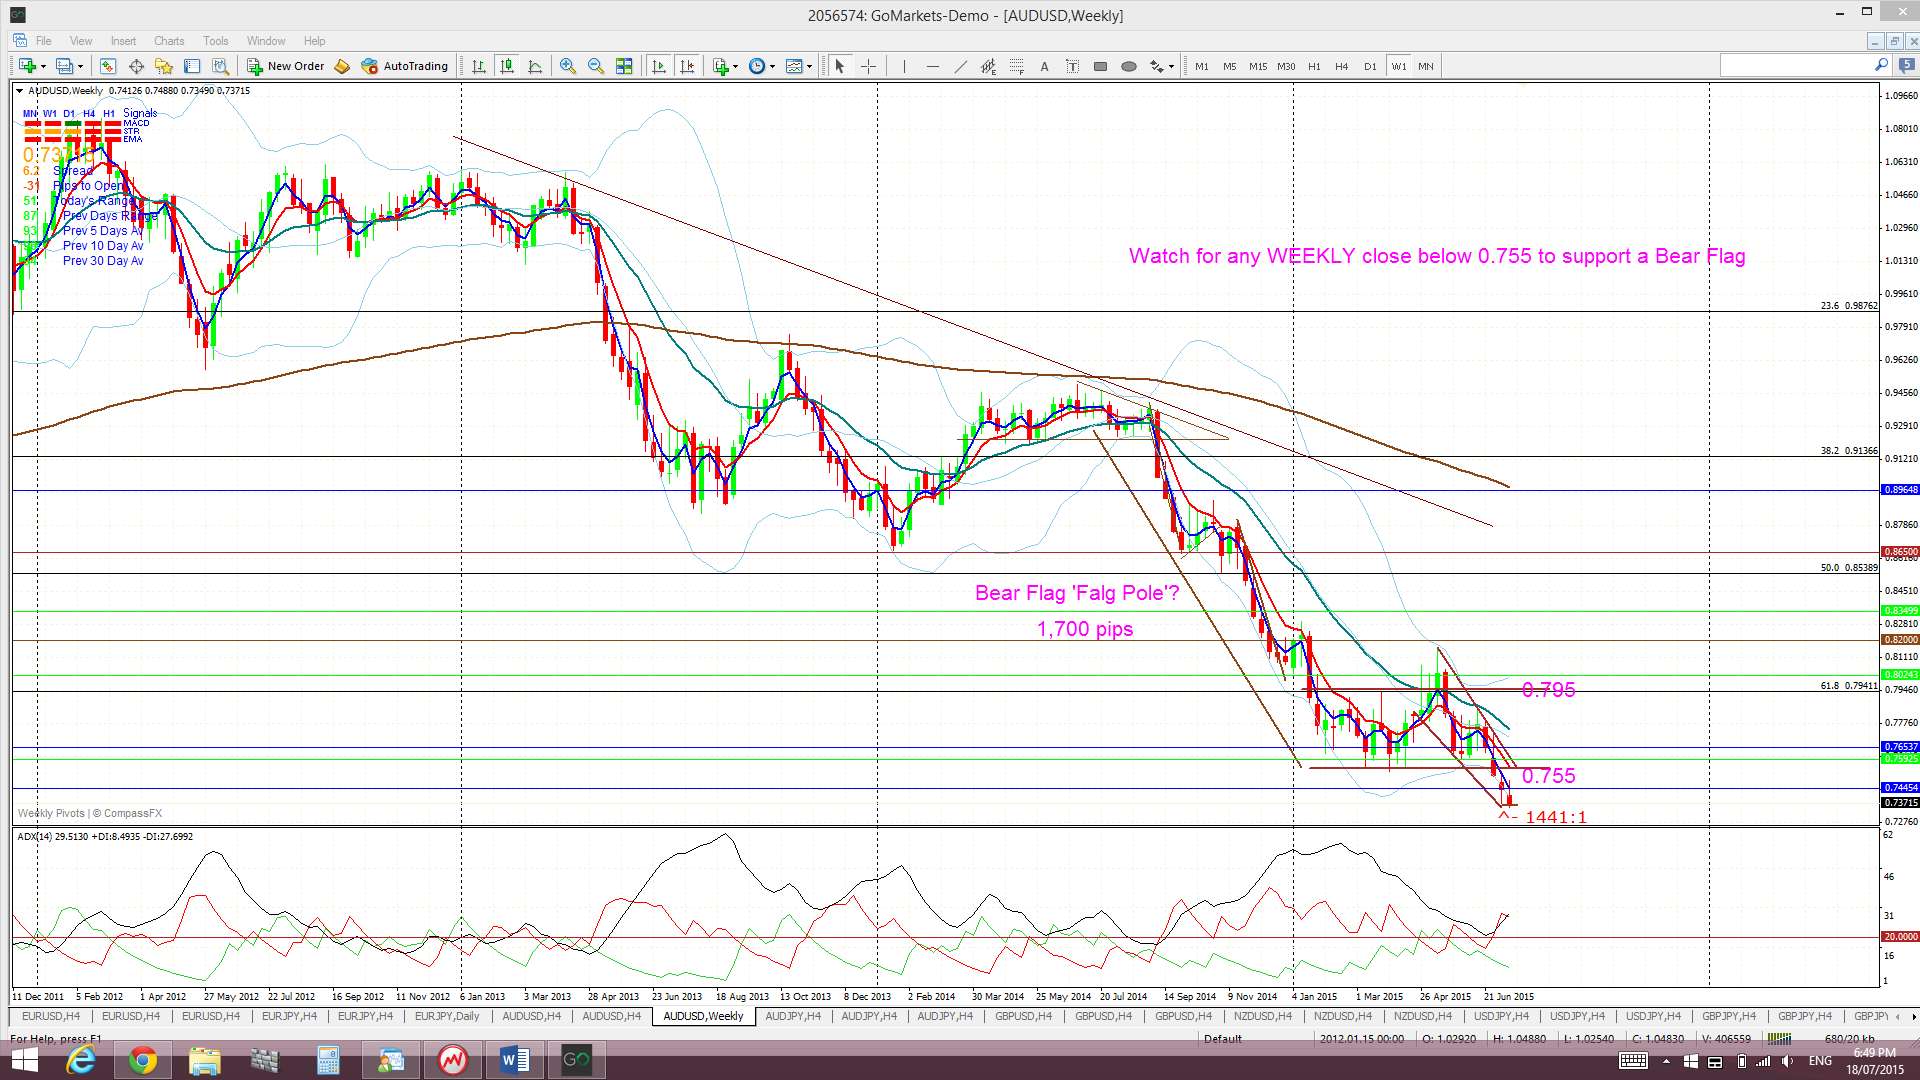
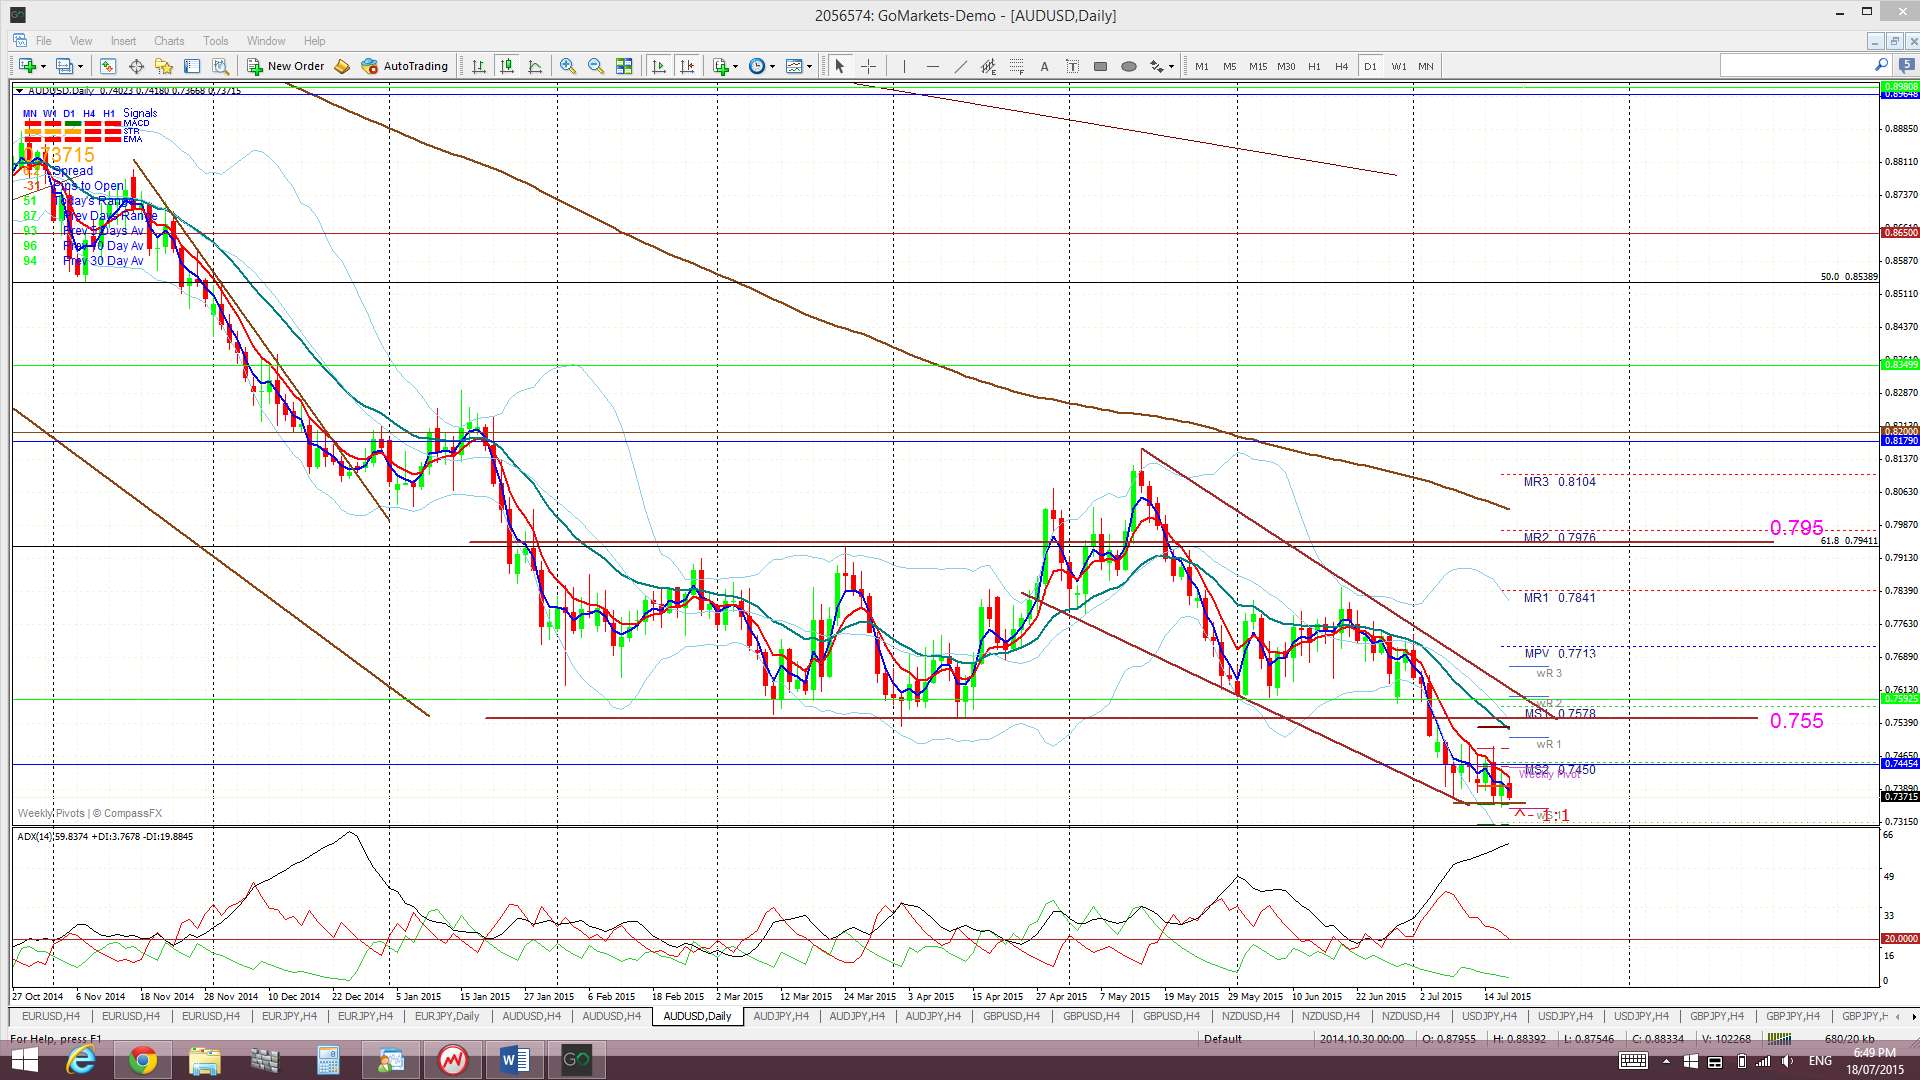
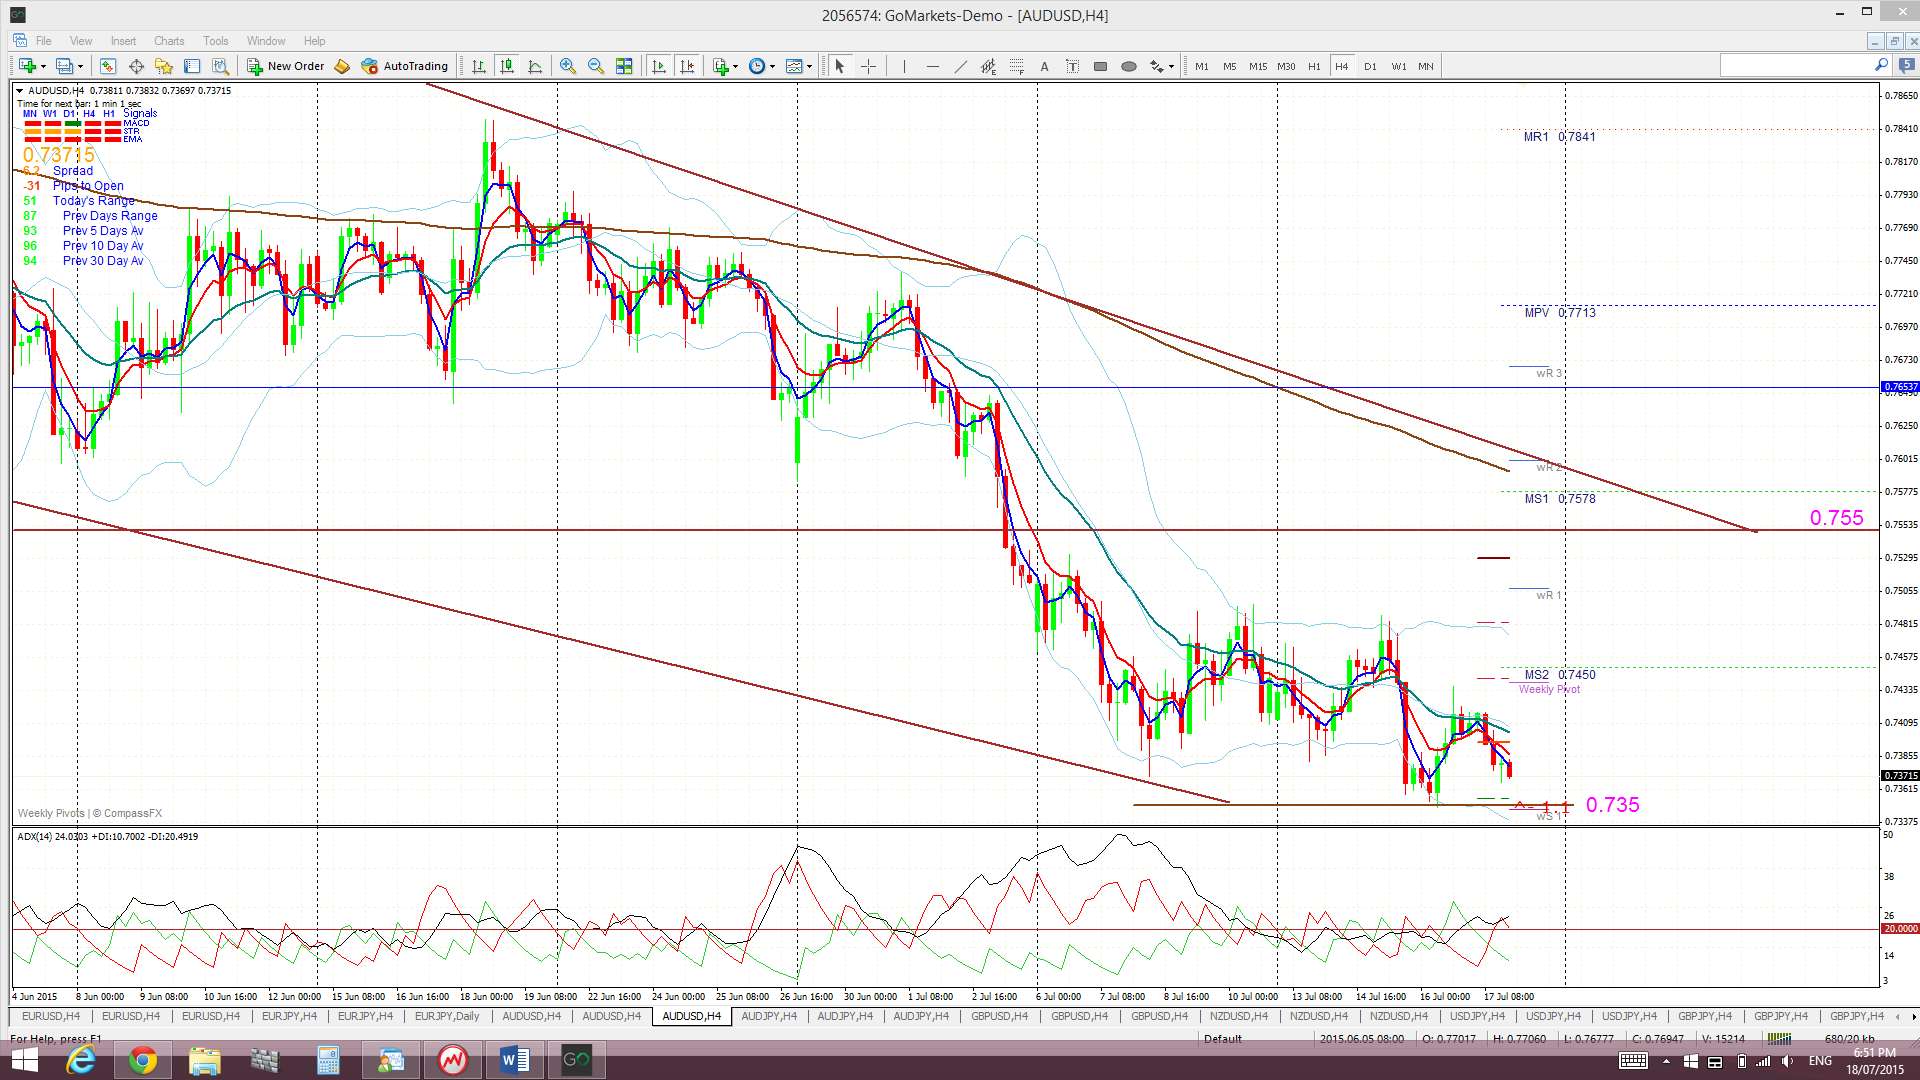
AUD/USD: the continued hold below 0.755 is supporting a potential 1,700 Bear Flag. As with the EUR/USD, US$ strength may be a determining factor here.
GBP: The GBP seems to have its mojo back and I’m wondering if its grinding this out as it tracks on its way. It has been strong against most other currencies over recent weeks and worth watching to see if this bullish momentum continues.
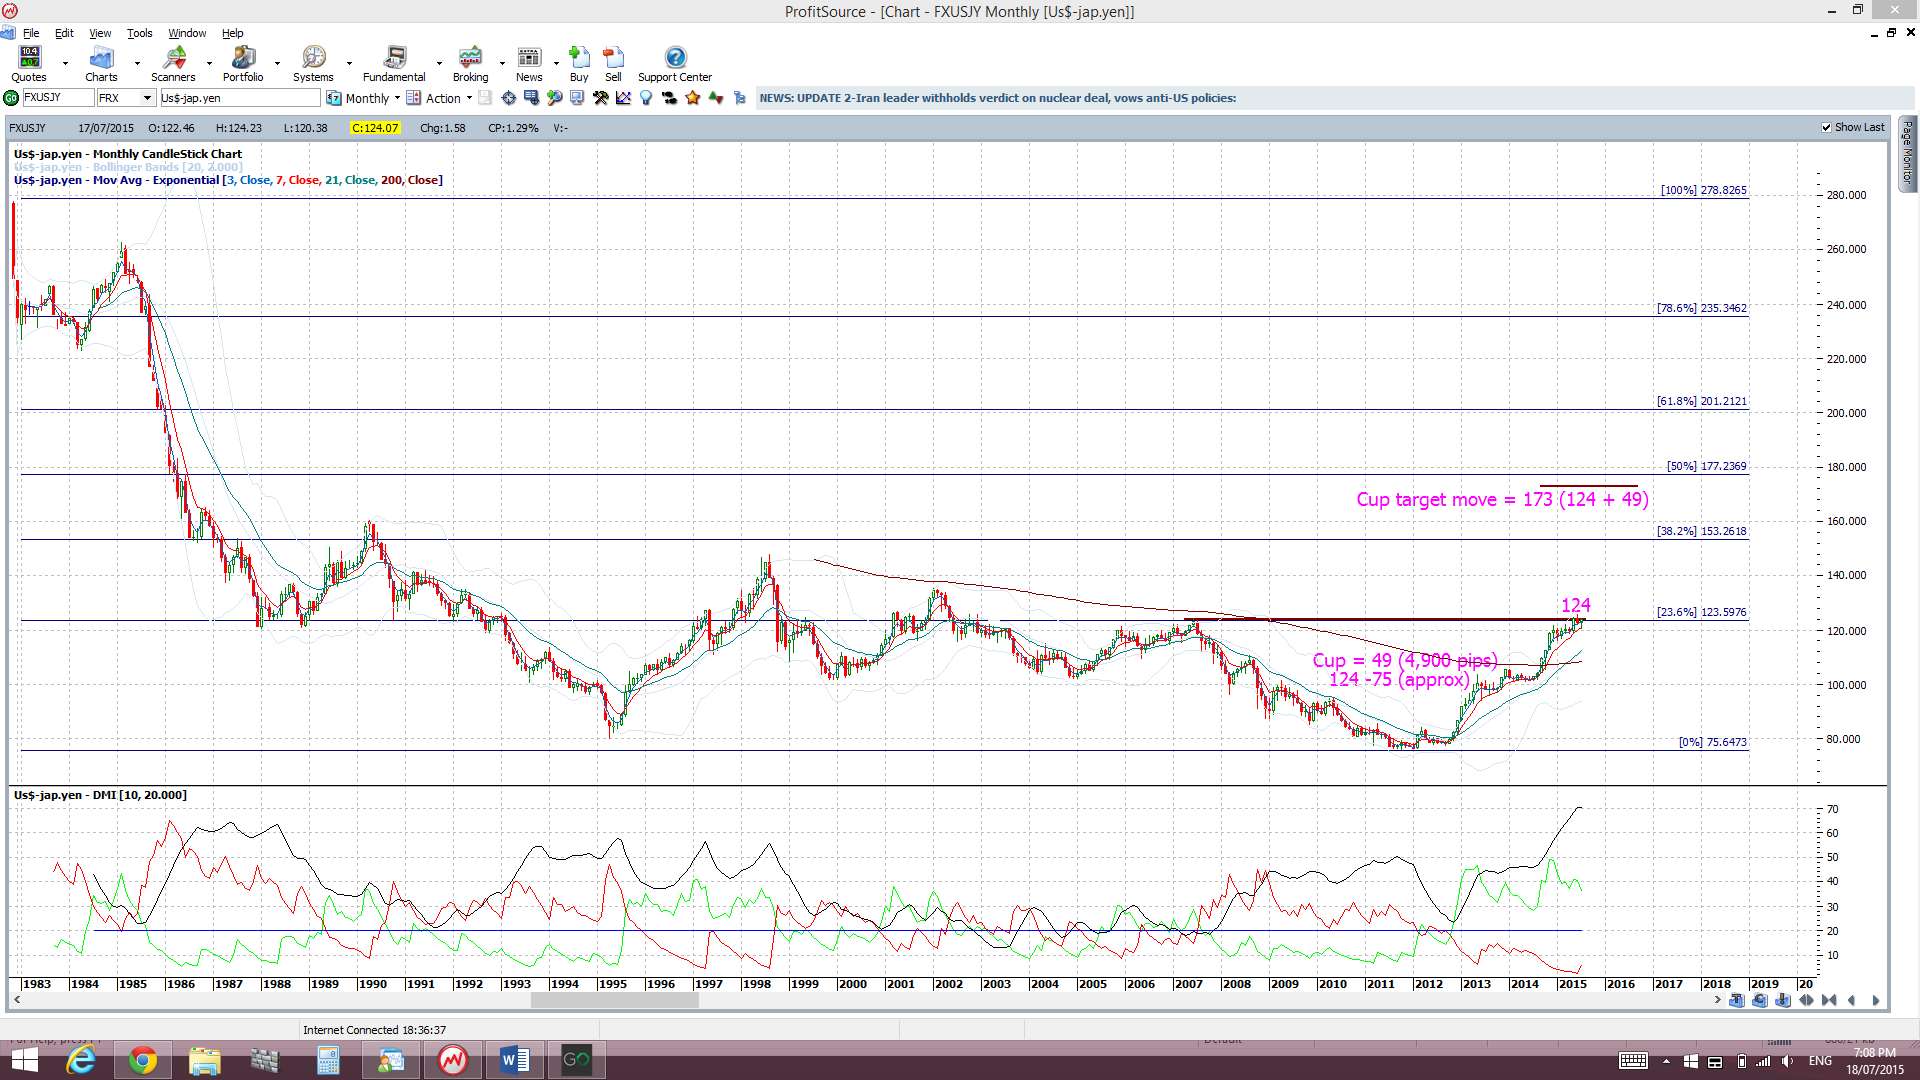
USD/JPY: the U/J is back trading at the key 124 level and this marks the region of a potential Cup ‘n’ Handle pattern worth almost 5,000 pips. Thus, I think it’s a level worth monitoring.
Gold and Silver: both metals have broken through key support levels and any continued US$ strength will only add further pressure to these struggling commodities. The July monthly candles will be important to watch here.
Stocks and broader market sentiment:
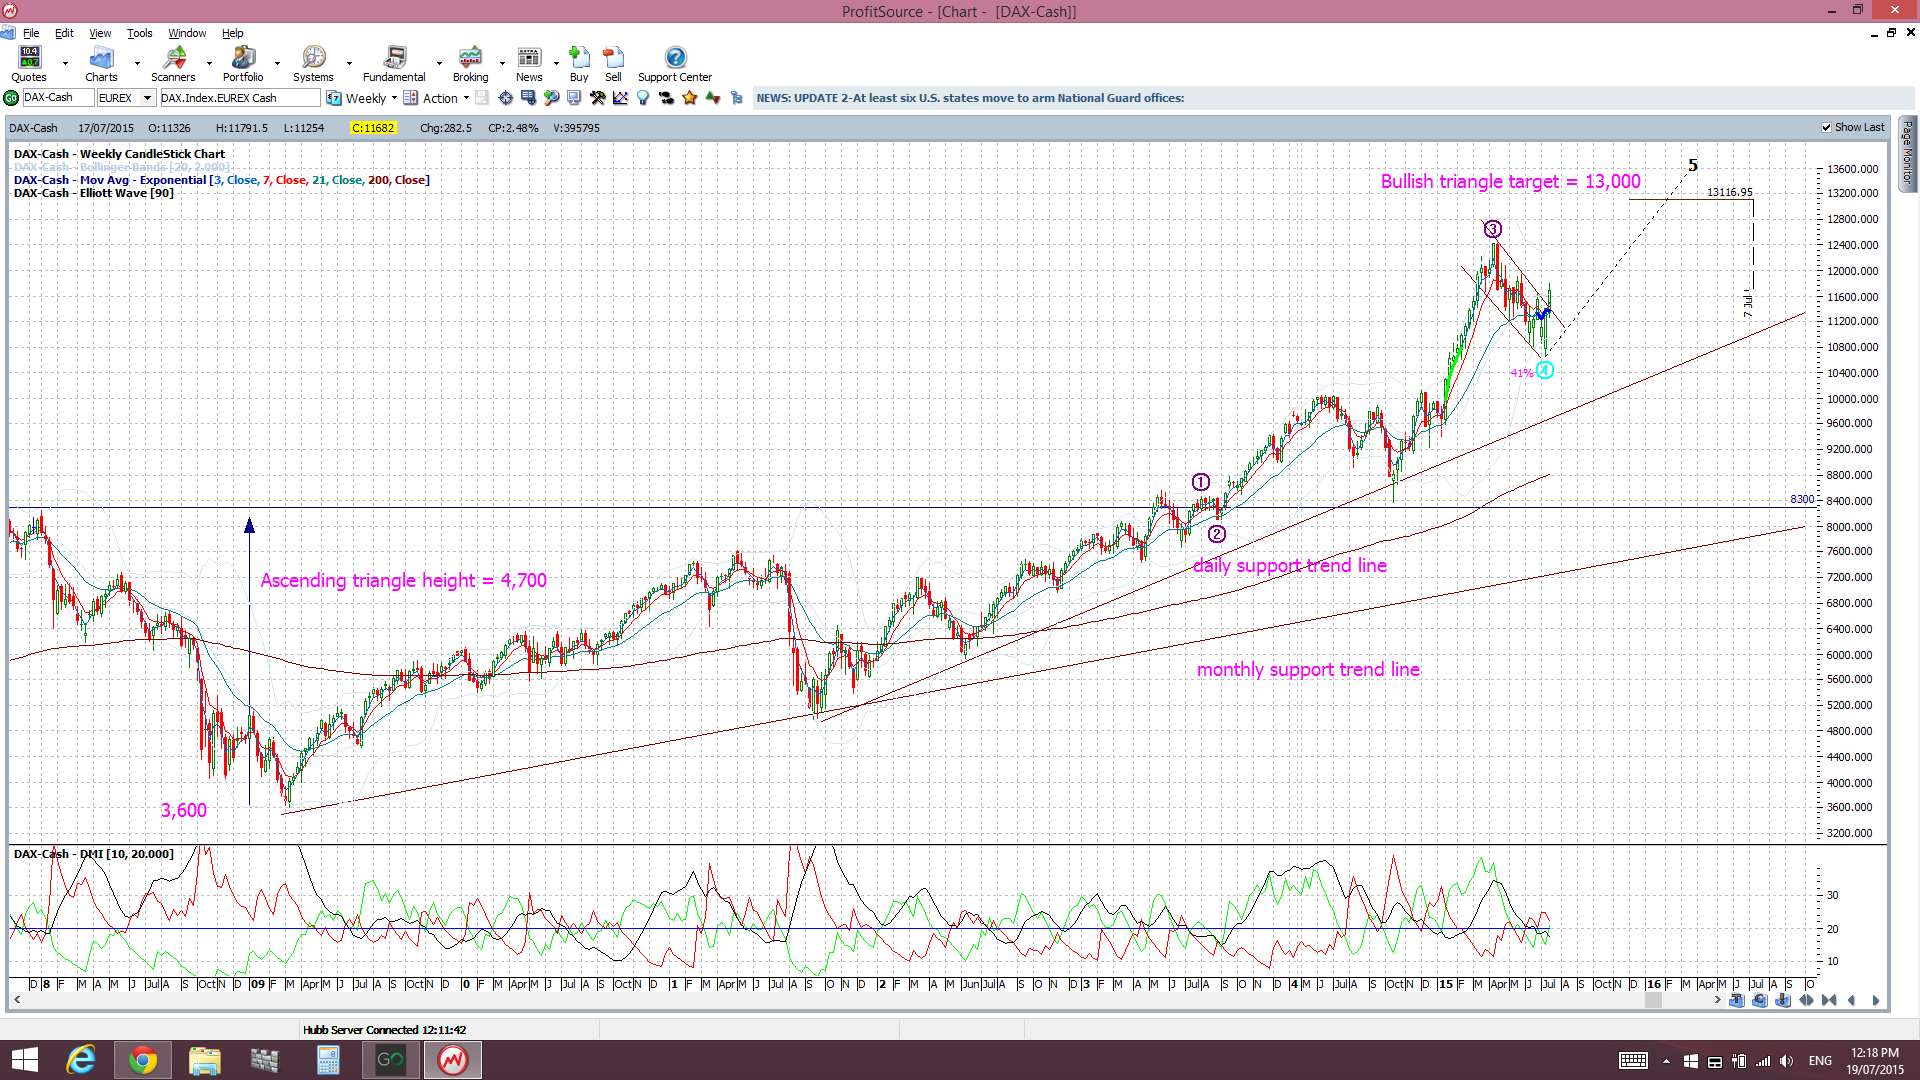
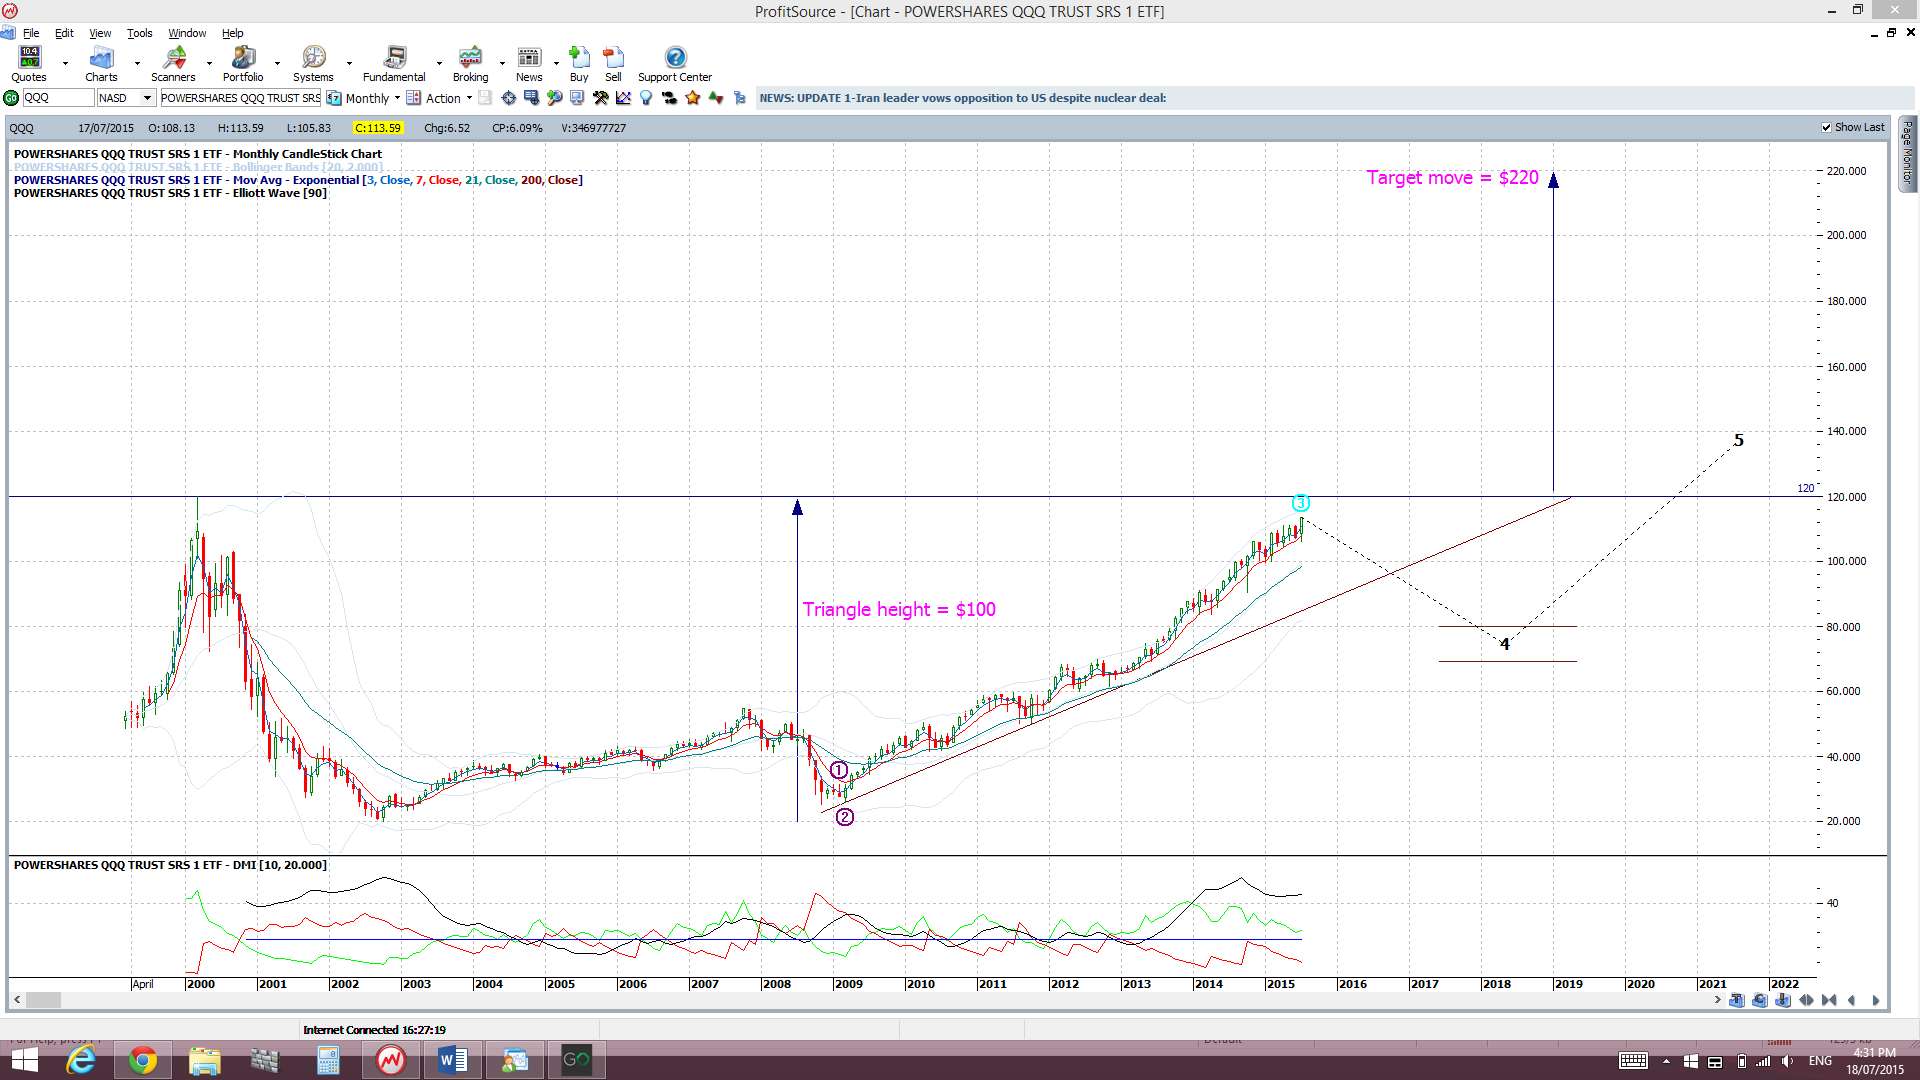
As suspected, global stocks rallied last week with relief following the headline news about a Greek-debt resolution. The S&P500, DJIA, NASDAQ, Russell 2000, FTSE and DAX all posted bullish weekly candles with the NASDAQ reaching an all-time high. Check the Bull Flag breakout on the DAX and how the NASDAQ-100 ETF is setting up with either a bullish Cup or ascending triangle pattern; take your pick:
DAX weekly: Bull Flag breakout?
QQQ weekly: The NASDAQ 100 ETF in a bullish Cup or ascending triangle?:
I continue to watch out for further clues as to any new momentum move, long or short though! In particular I’m looking out for:
S&P500 daily chart: The index is holding above the psychological 2,100 level and is still above daily trend line support. The possible bearish ascending wedge is still in play, although it has lengthened somewhat, but I’ll keep watching these trend lines anyway. However, one more bullish day will probably trigger a LONG TC signal here:

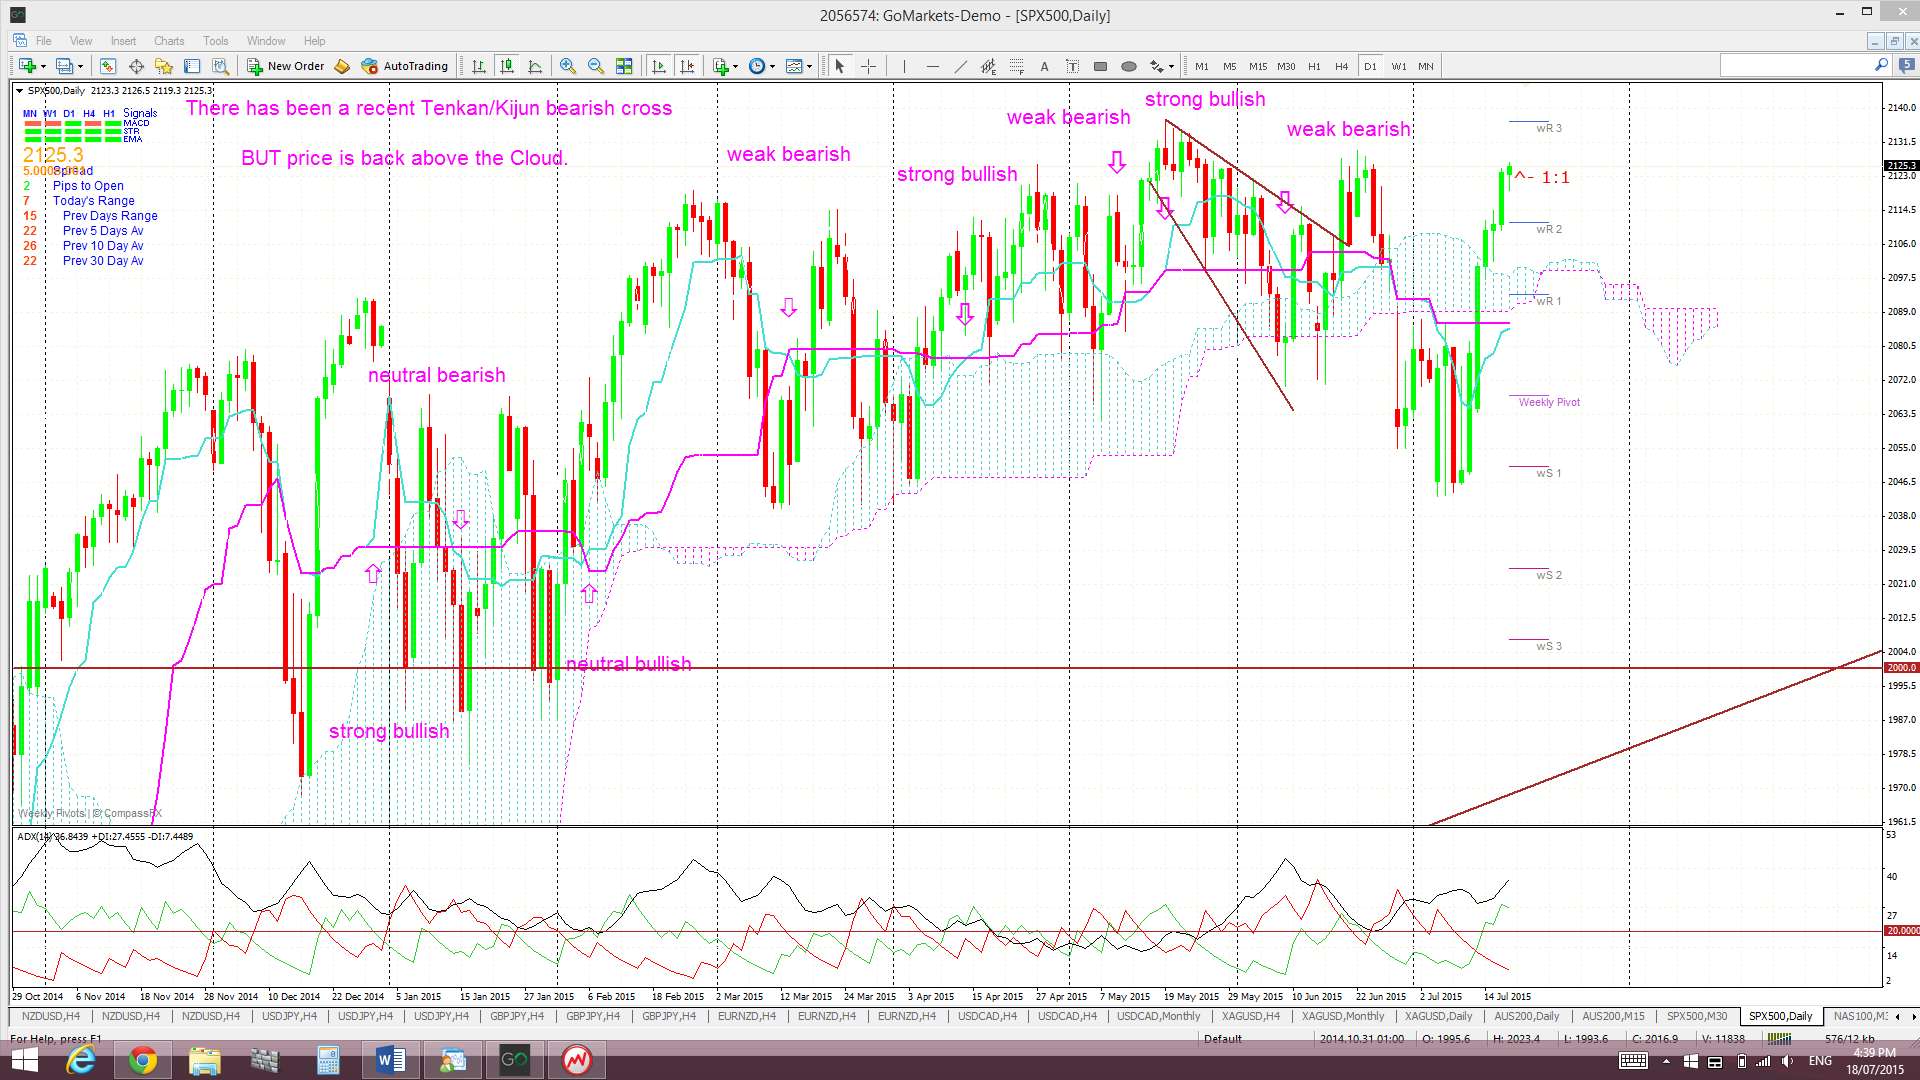
Ichimoku S&P500 chart: a clear cross of the blue Tenkan-sen line below the pink Kijun-sen line. There was a bearish Tenkan/Kijun cross here a while ago but this evolved above the Cloud and so was deemed a ‘WEAK’ signal. Price is back above the Cloud now however and so watch for any hold above this support and, then, for any new bullish cross:
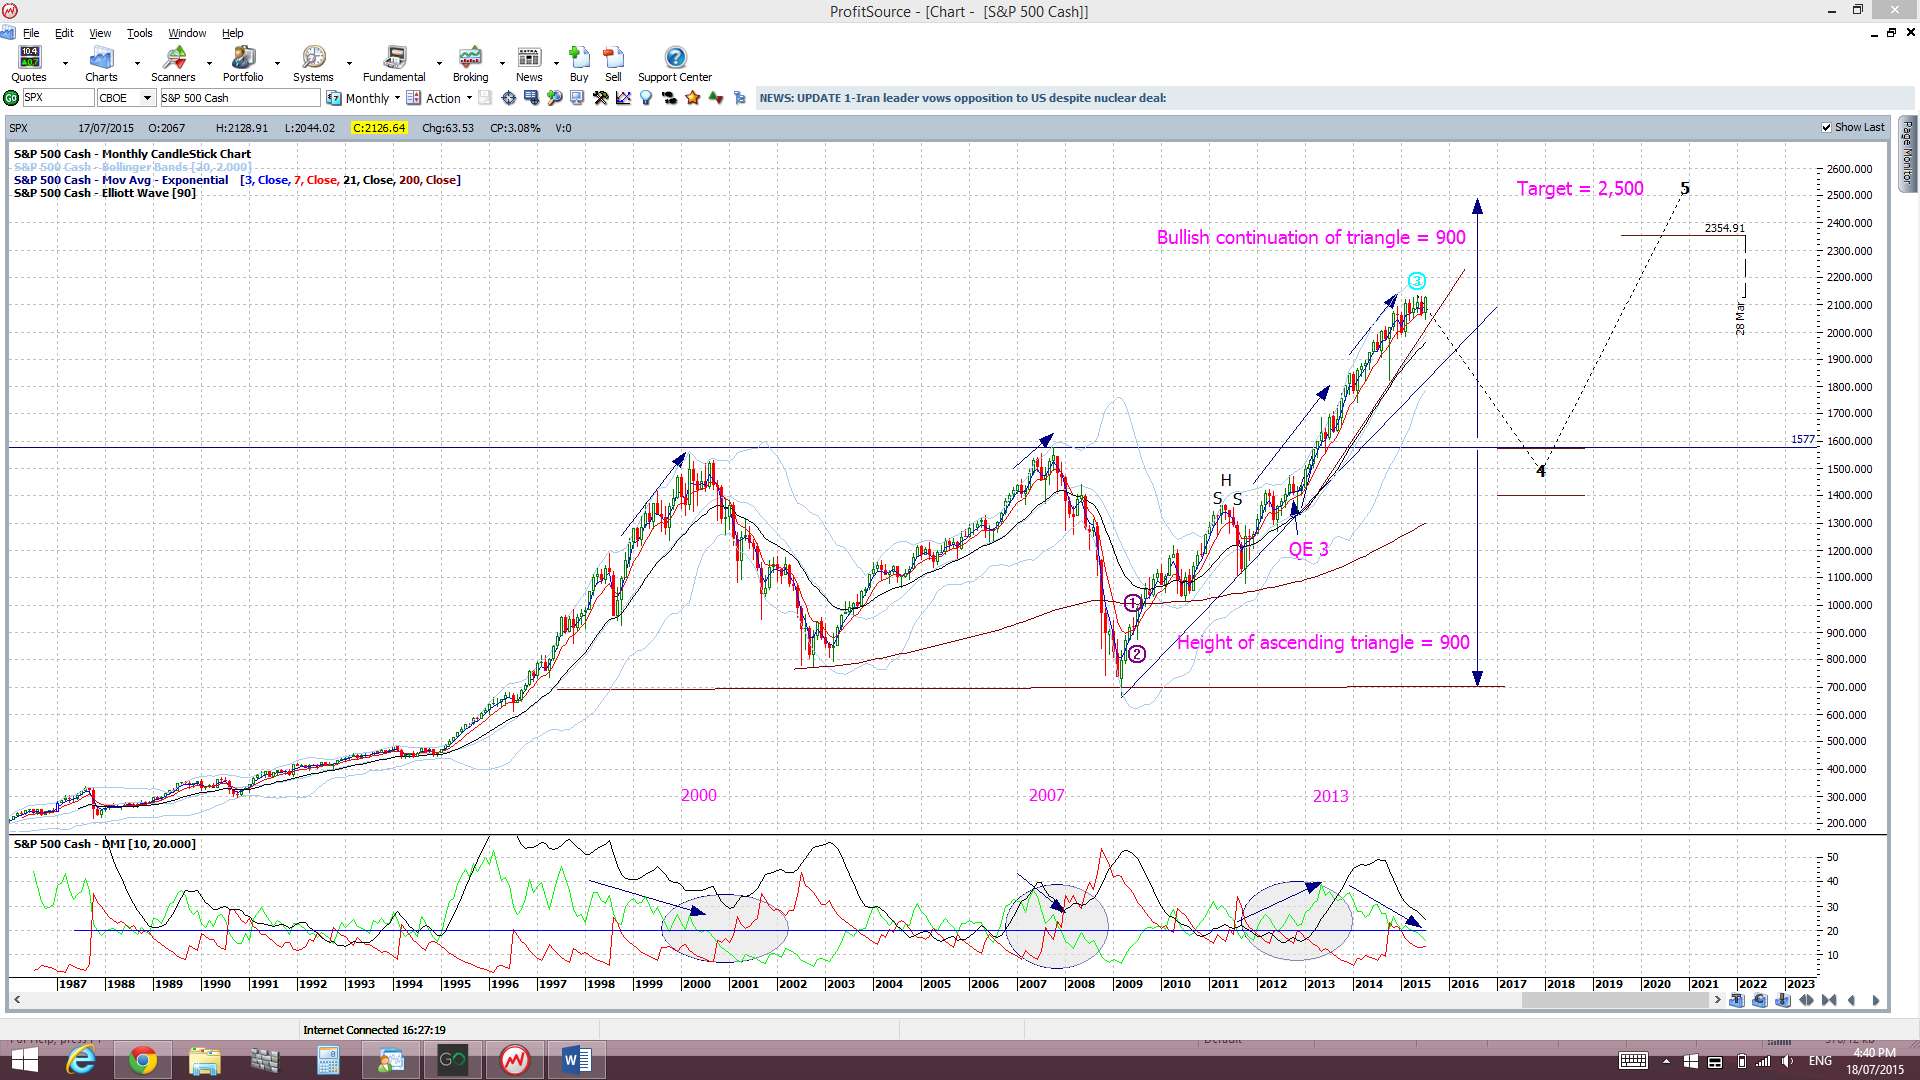
S&P500 monthly chart: a break of the monthly support trend line. The monthly trend line remains intact but a break of this support level would suggest to me of a more severe pull back or correction. I am still seeing divergence on the monthly chart for now though.
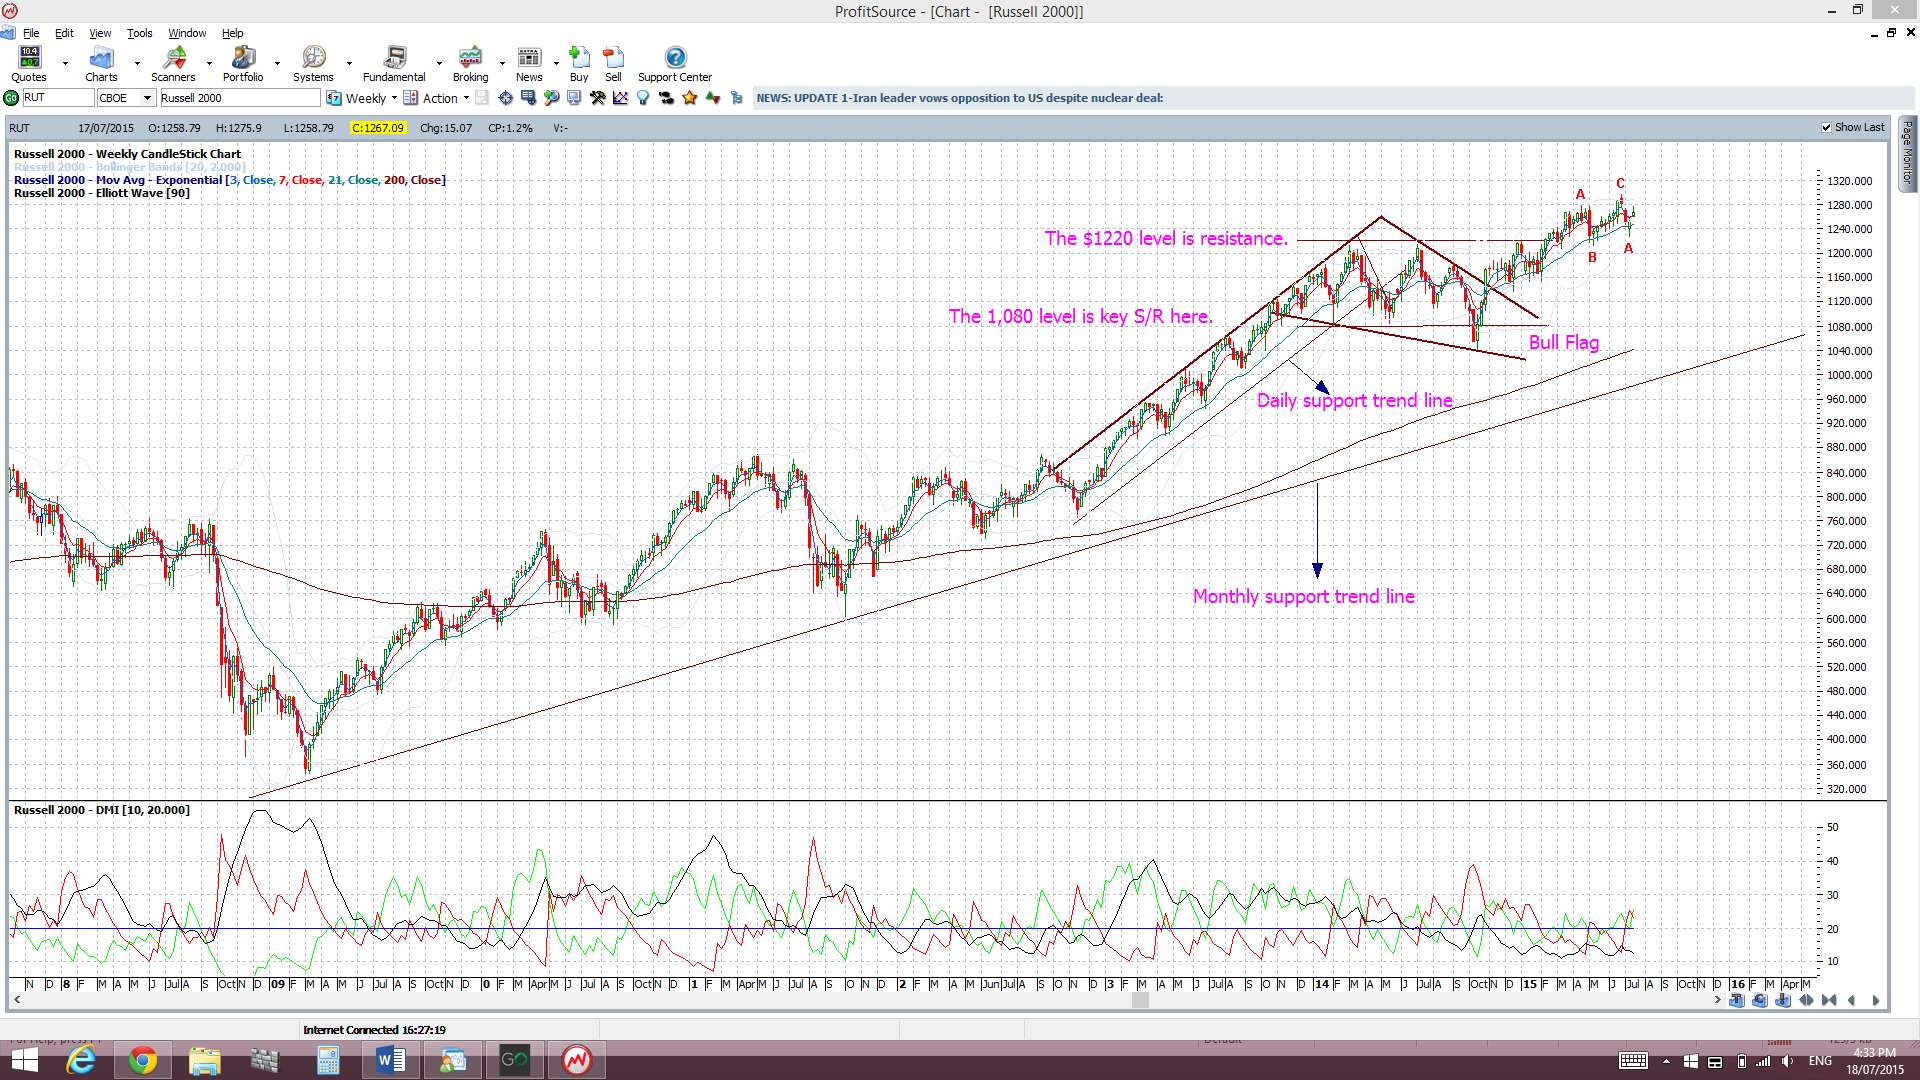
Russell 2000 Index: this small caps index is considered a US market ‘bellwether’ and is still trading above the key 1,220 level and printed another bullish weekly candle.
VIX Index: The ‘Fear’ index is back below the 14 level and printed a bearish weekly.

Trading Calendar Items to watch out for:
- Mon 20th: JPY Bank Holiday. CAD Wholesale Sales.
- Tue 21st: AUD Monetary Policy Minutes.
- Wed 22nd: AUD CPI & RBA Gov Stevens speaks. GBP: Official Bank Rate Votes.
- Thurs 23rd: NZD Interest Rate announcement & Statement. GBP Retail Sales. CAD Core Retail Sales. USD Unemployment Claims.
- Fri 24th: NZD Trade Balance. CNY Markit Flash Manufacturing PMI. EUR French & German Flash Manufacturing PMI.
Forex:
E/U: The E/U chopped lower last week and broke down below a recent triangle trend line. This move has triggered a weekly chart Bear Flag breakdown that could be worth up to 3,500 pips. The recent low down near 1.045 will be worth monitoring in coming sessions in case it offers up any support here.
Some technical theorists would suggest that traders now look for a pullback to the trend line before bearish continuation. However, pullbacks have been few and far between on many pairs with these types of technical moves of late. Another strategy for trading a breakout can be found through this link.
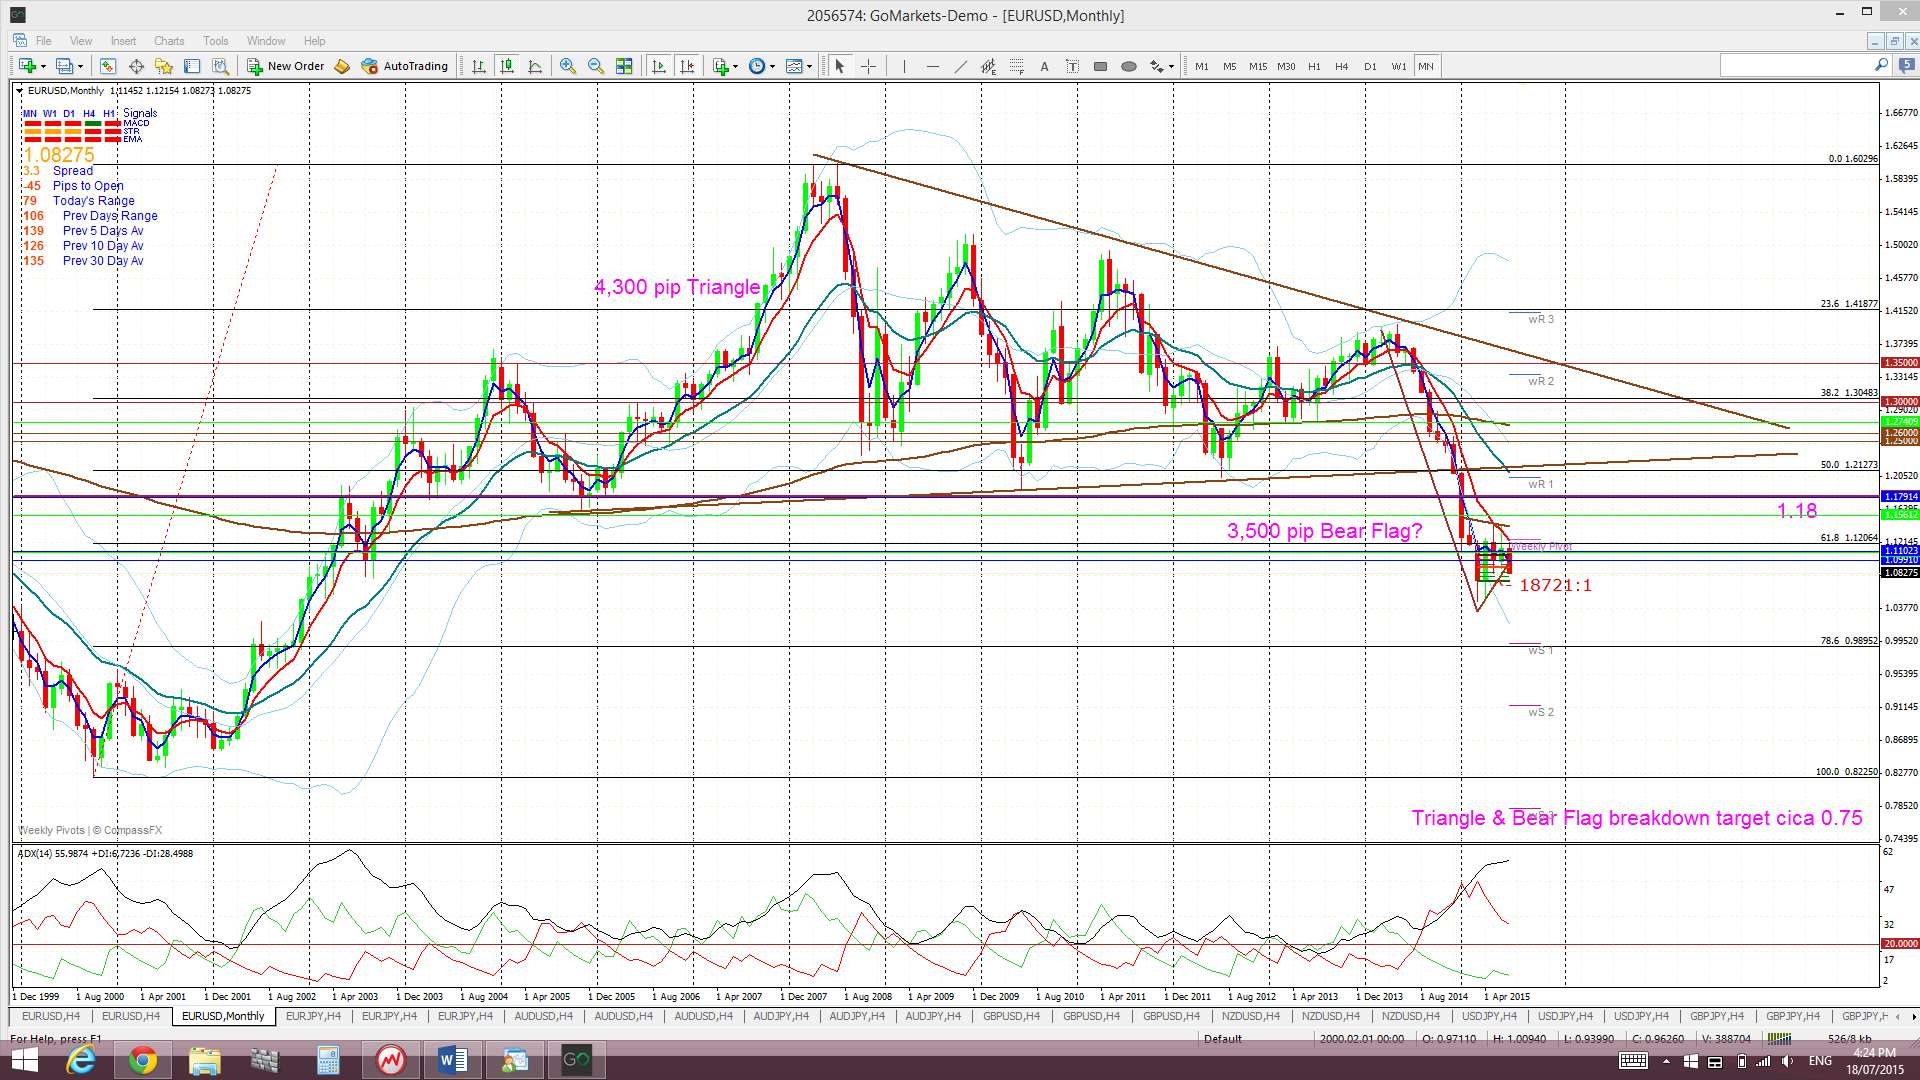
It is interesting to note that the target for this Bear Flag move is similar to the target for the larger, already established monthly descending triangle breakdown….confluence?
Descending triangle on the monthly chart: Despite some recent recovery activity there is still an overall bearish pattern in play on the E/U monthly chart: a 4,000 pip bearish descending triangle breakdown on the monthly chart. The descending triangle pattern is a bearish continuation pattern and has a base at around the 1.18 level. The height of this triangle is about 4,000 pips. Technical theory would suggest that the bearish breakdown of this triangle below 1.18 might see a similar move. It is worth noting that this would bring the E/U down near 0.80 and to levels not seen since 2000/2001!
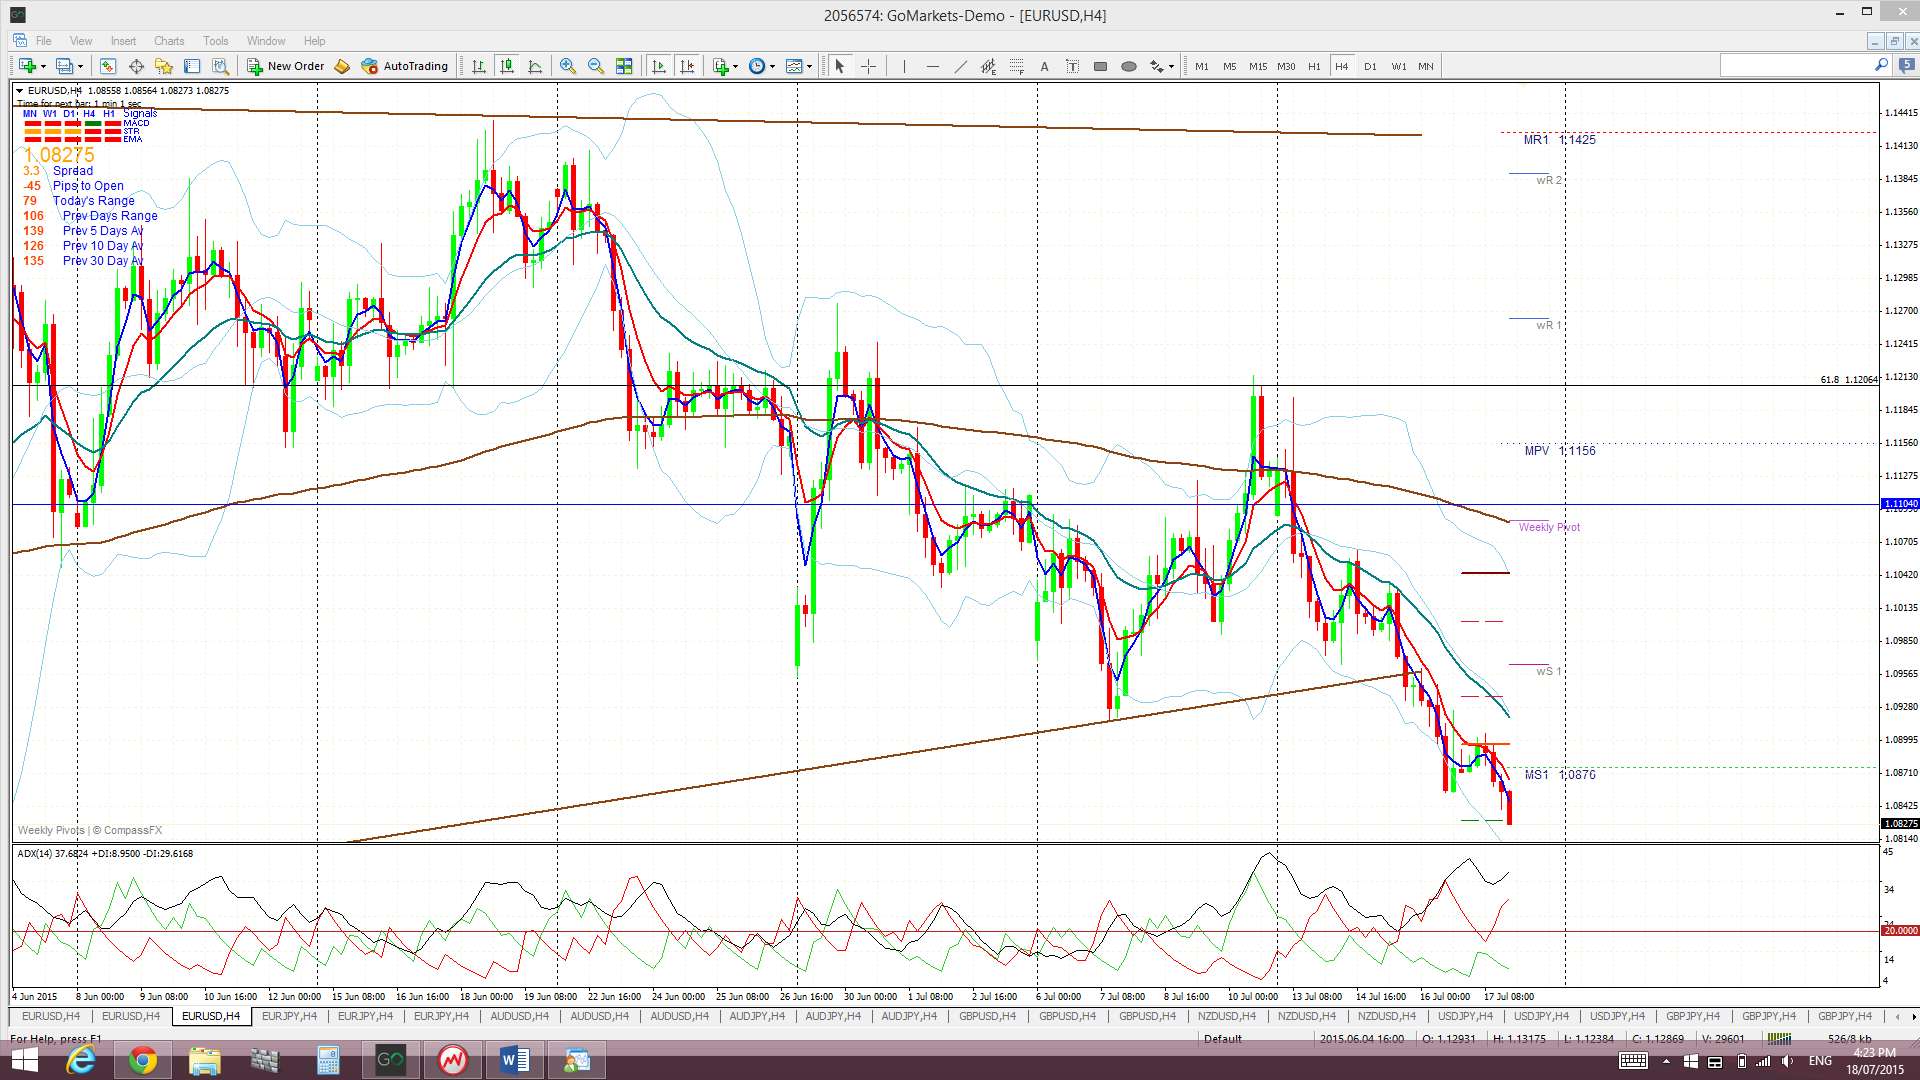
Price is trading below the Ichimoku Cloud on the 4hr, daily, weekly and monthly charts.
The weekly candle closed as a large bearish candle.
- I’m watching for any new TC signal on this pair, the weekly chart’s Bear Flag trend lines and the 1.045 level.

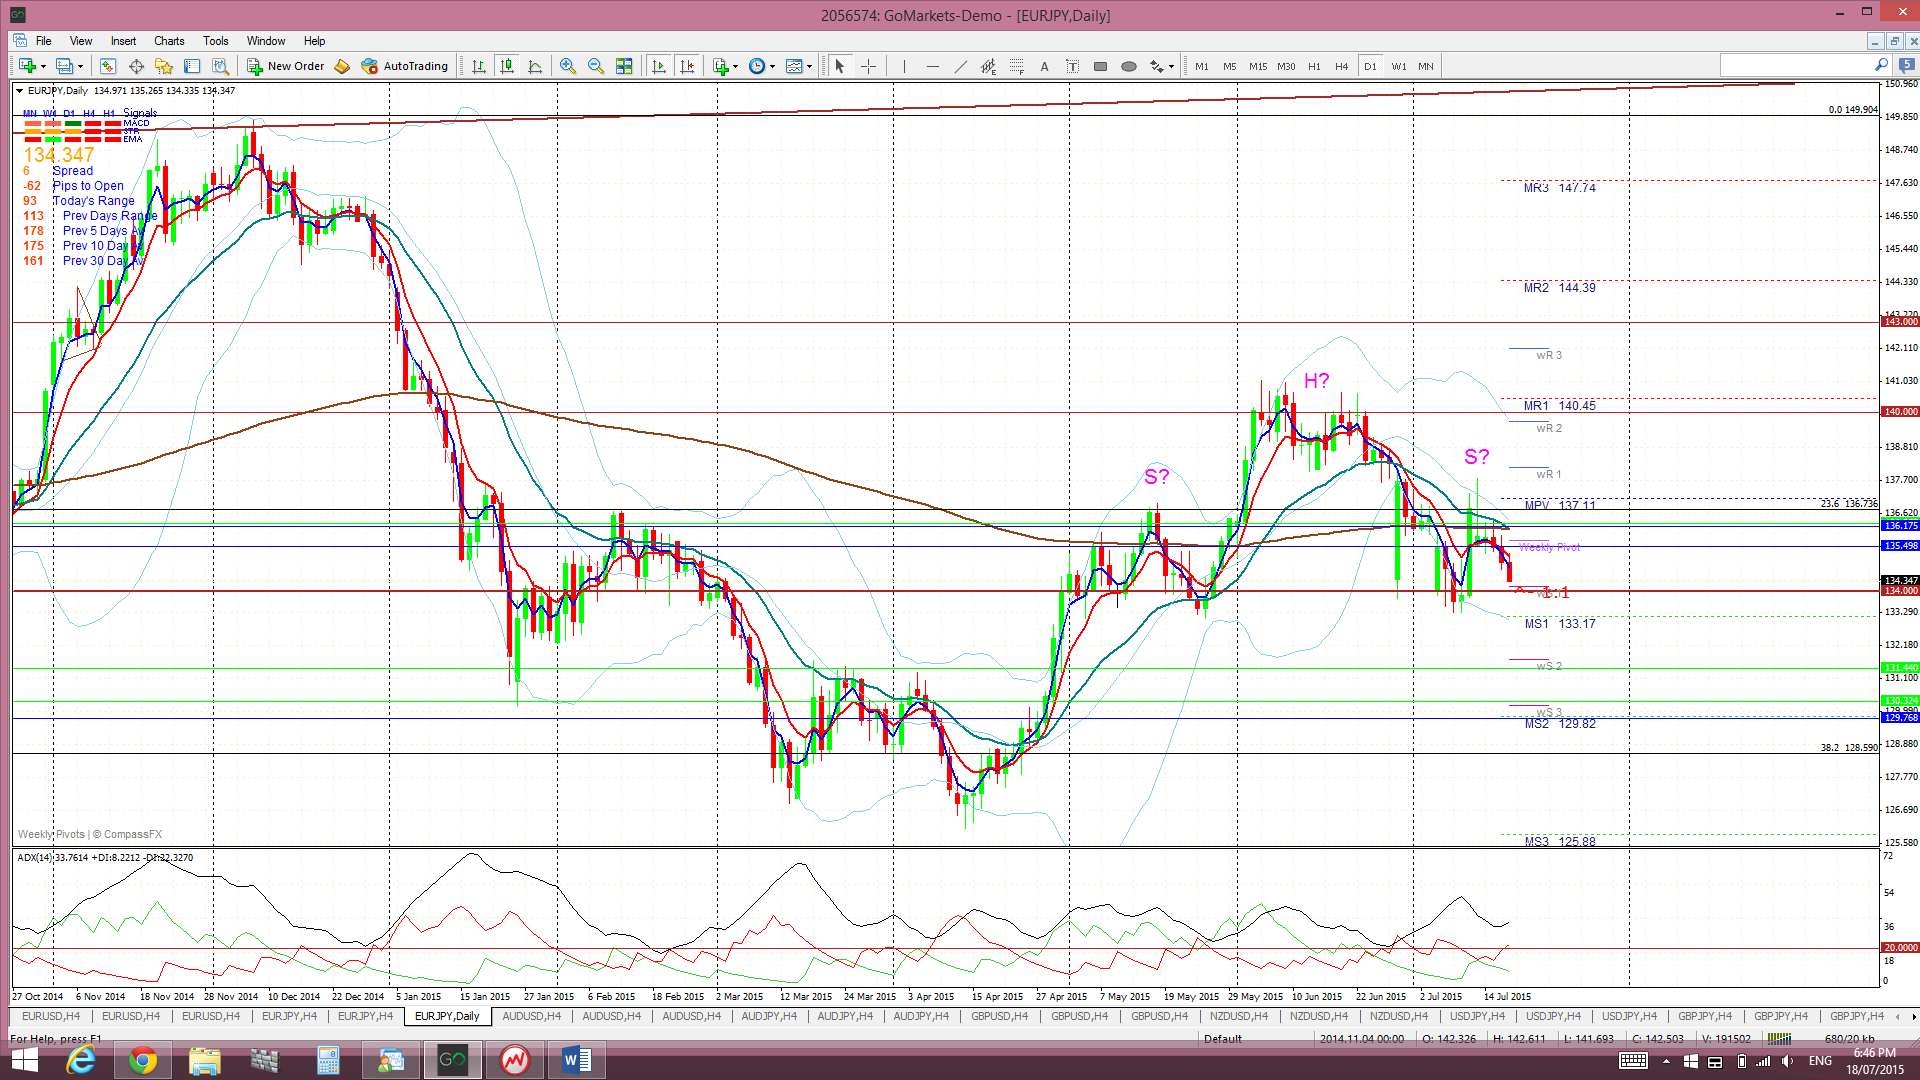
E/J: The E/J is shaping up with a potential H&S pattern on the daily chart and this is bringing the 143 level back into focus.
Price is trading under the Cloud on the 4hr chart, in the Cloud on the daily chart, below the Cloud on the weekly chart and above on the monthly chart.
The weekly candle closed as a bearish coloured ‘inside’ candle with a long upper shadow
- I’m watching for any new TC signal on this pair and the 143 level.
A/U: The A/U remains below the 0.755 level and this is bringing the prospect of a major Bear Flag move into greater focus. The hold below 0.755 is supporting a potential 1,700 pip Bear Flag and any move below the recent low at 0.735 would lend further support to this bearish sentiment.
Price is trading below the Ichimoku Cloud on the 4hr, daily, weekly and monthly charts.
The weekly candle closed as a bearish coloured ‘Spinning Top’.
There is AUD Monetary Policy Minutes, CPI, an RBA Gov Stevens speech and Chinese Manufacturing data to monitor next week. The potential for further RBA jawboning remains high here.
- I’m watching for any new TC signal on this pair and the 0.755 / 0.735 levels.
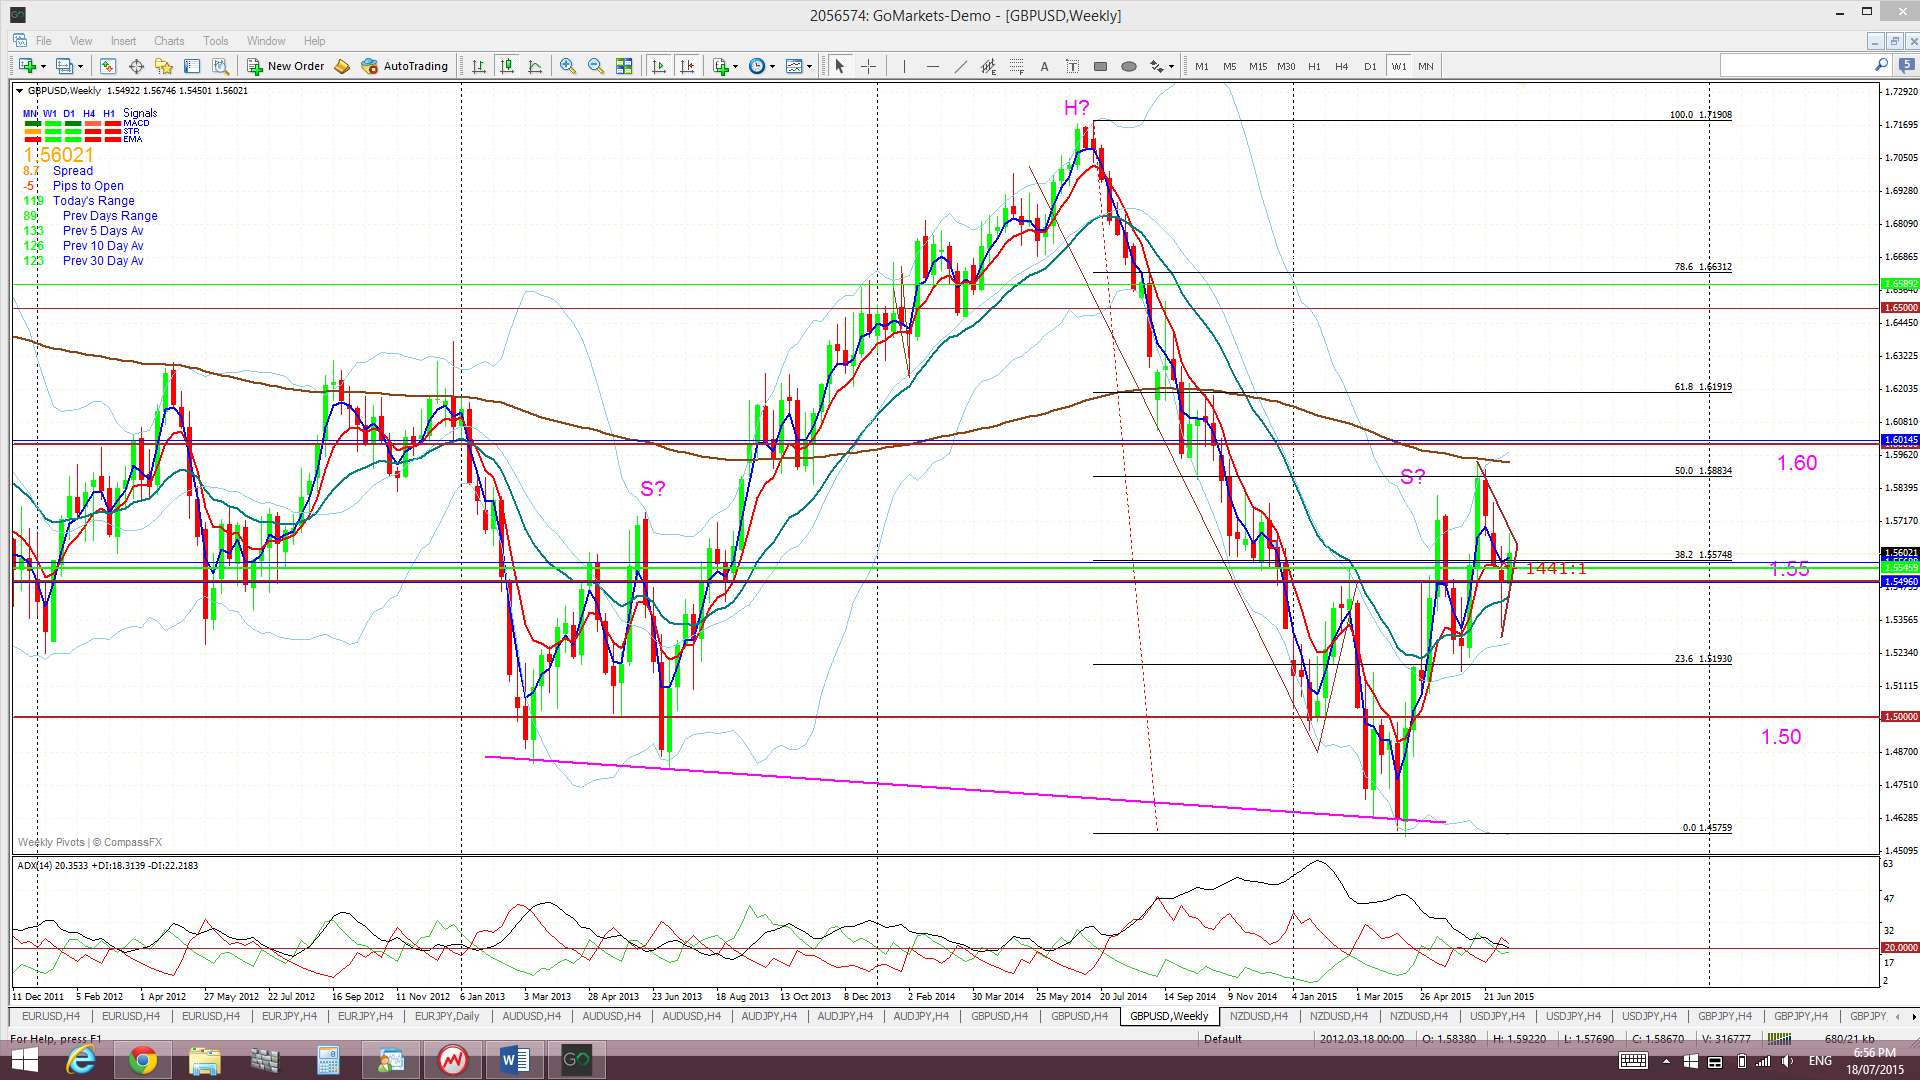
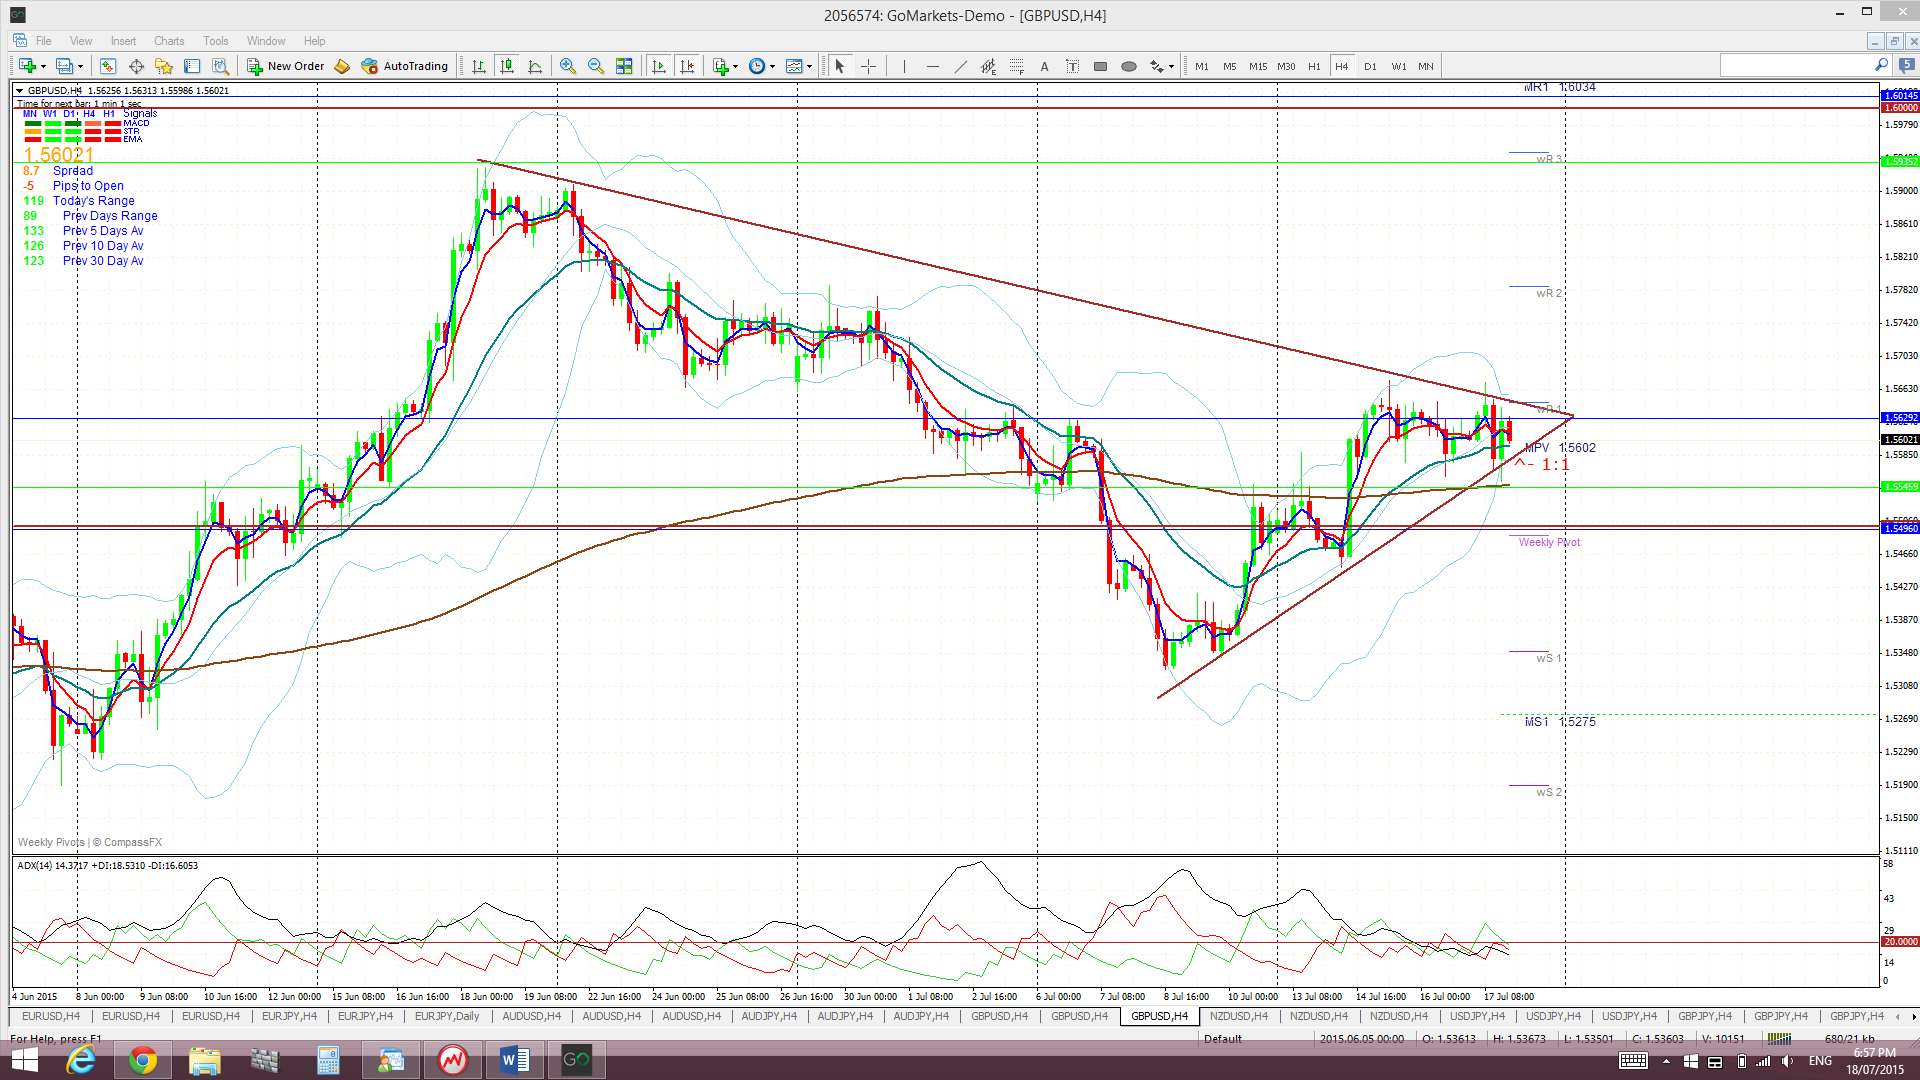
G/U: The Cable remains range bound between 1.55 and 1.60 but has been the ‘quiet achiever’ currency for sure of late. The GBP printed decent bullish weekly candles against all of the USD, JPY, AUD and NZD. It is now trading within a symmetrical triangle pattern on the 4hr time frame and may be gearing up for quite a bullish hit out. Looking at the charts of the GBP/AUD and GBP/NZD you certainly get the feeling that the GBP is up to something!
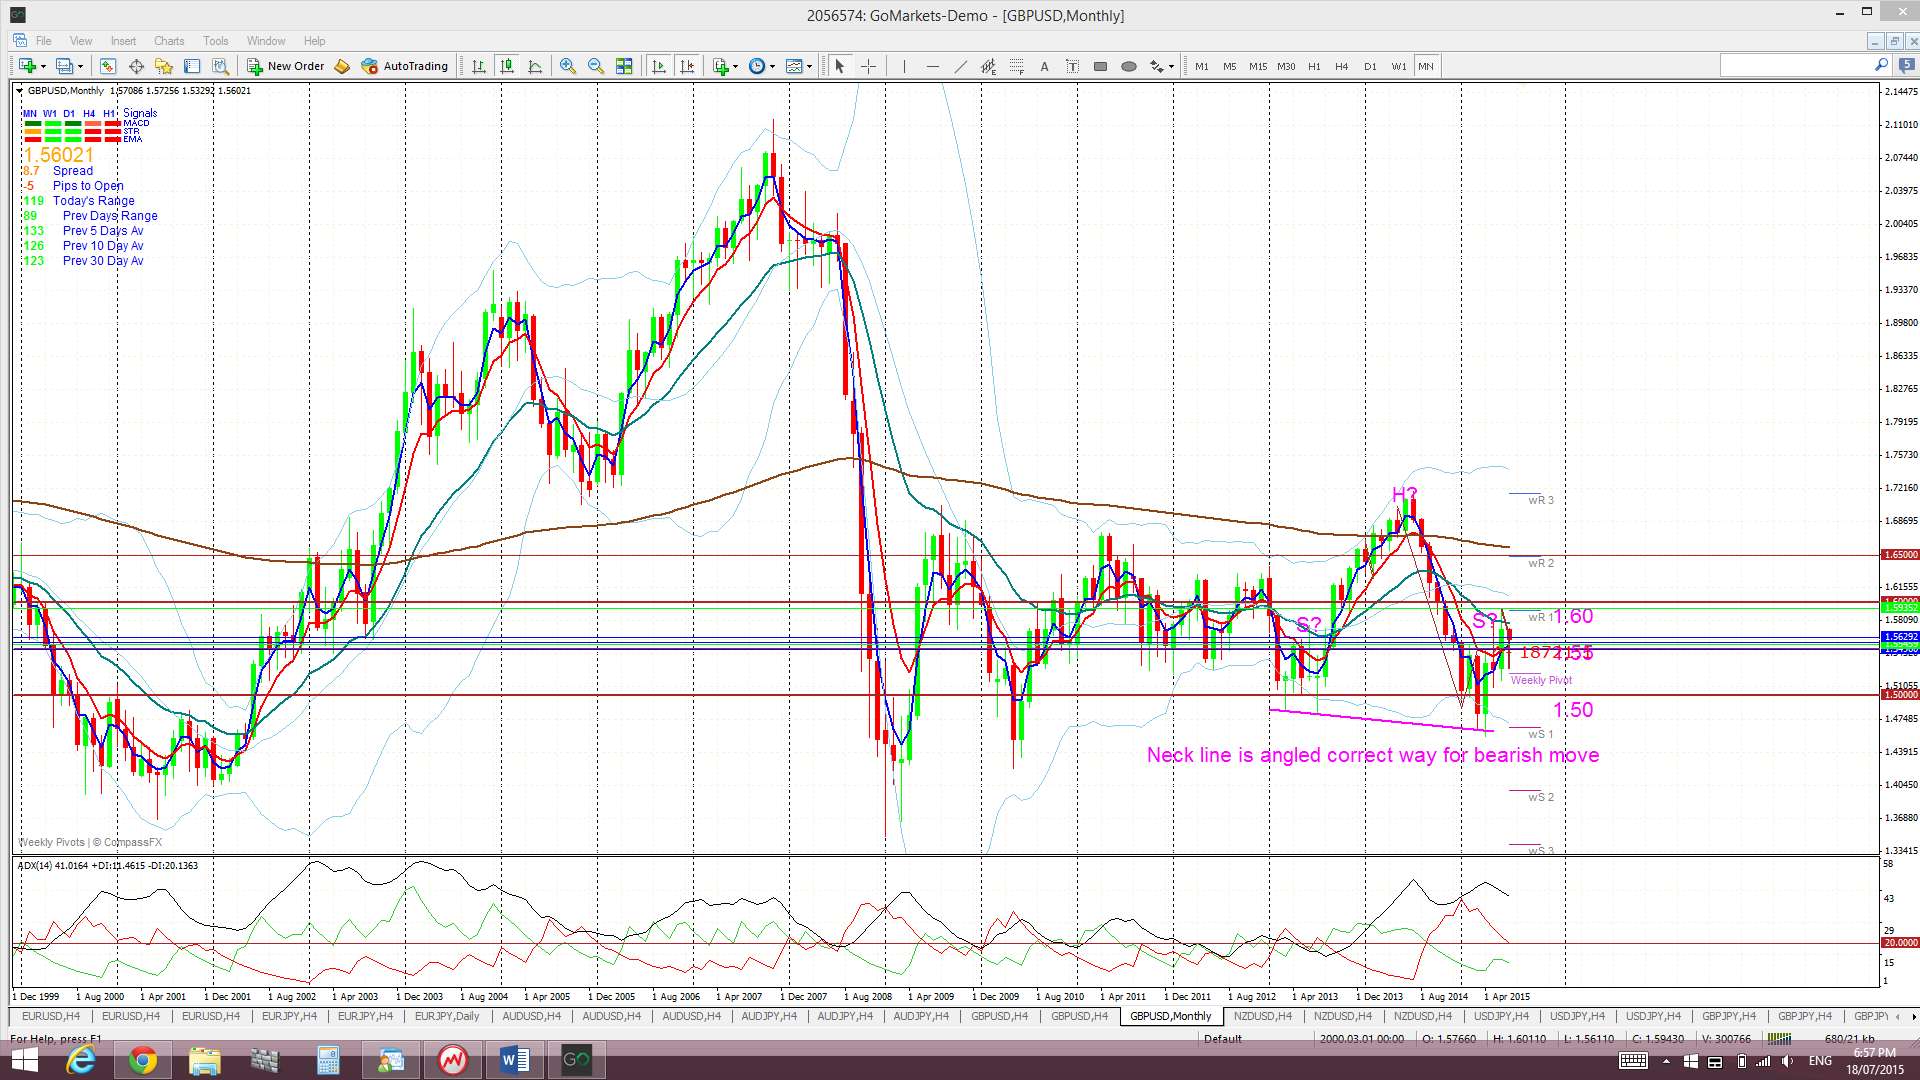
Weekly chart H&S: Having noted this bullish sentiment though there is still a possible bearish H&S pattern forming on the weekly chart. However, the failure to break below the ‘neck line’ is holding this pattern off the time being. The height of the pattern is about 2,400 pips and suggests a similar move lower with any break and hold below the ‘neck line’. Recall that the GBP/USD printed a monthly close in March below 1.50, the first since June 2010. This bearish development supports the H&S pattern BUT we will need to see a close and hold below the ‘neck line’ to confirm any such bearish breakdown. I would consider that any close and hold back above 1.60 would void this pattern.
Price is trading above the Cloud on the 4hr and daily charts, below the Cloud on the weekly chart but in the top of thin Cloud on the monthly chart.
The weekly candle closed as a bullish, essentially ‘engulfing’ candle.
- I’m watching for any new TC signal on this pair and the triangle trend lines.

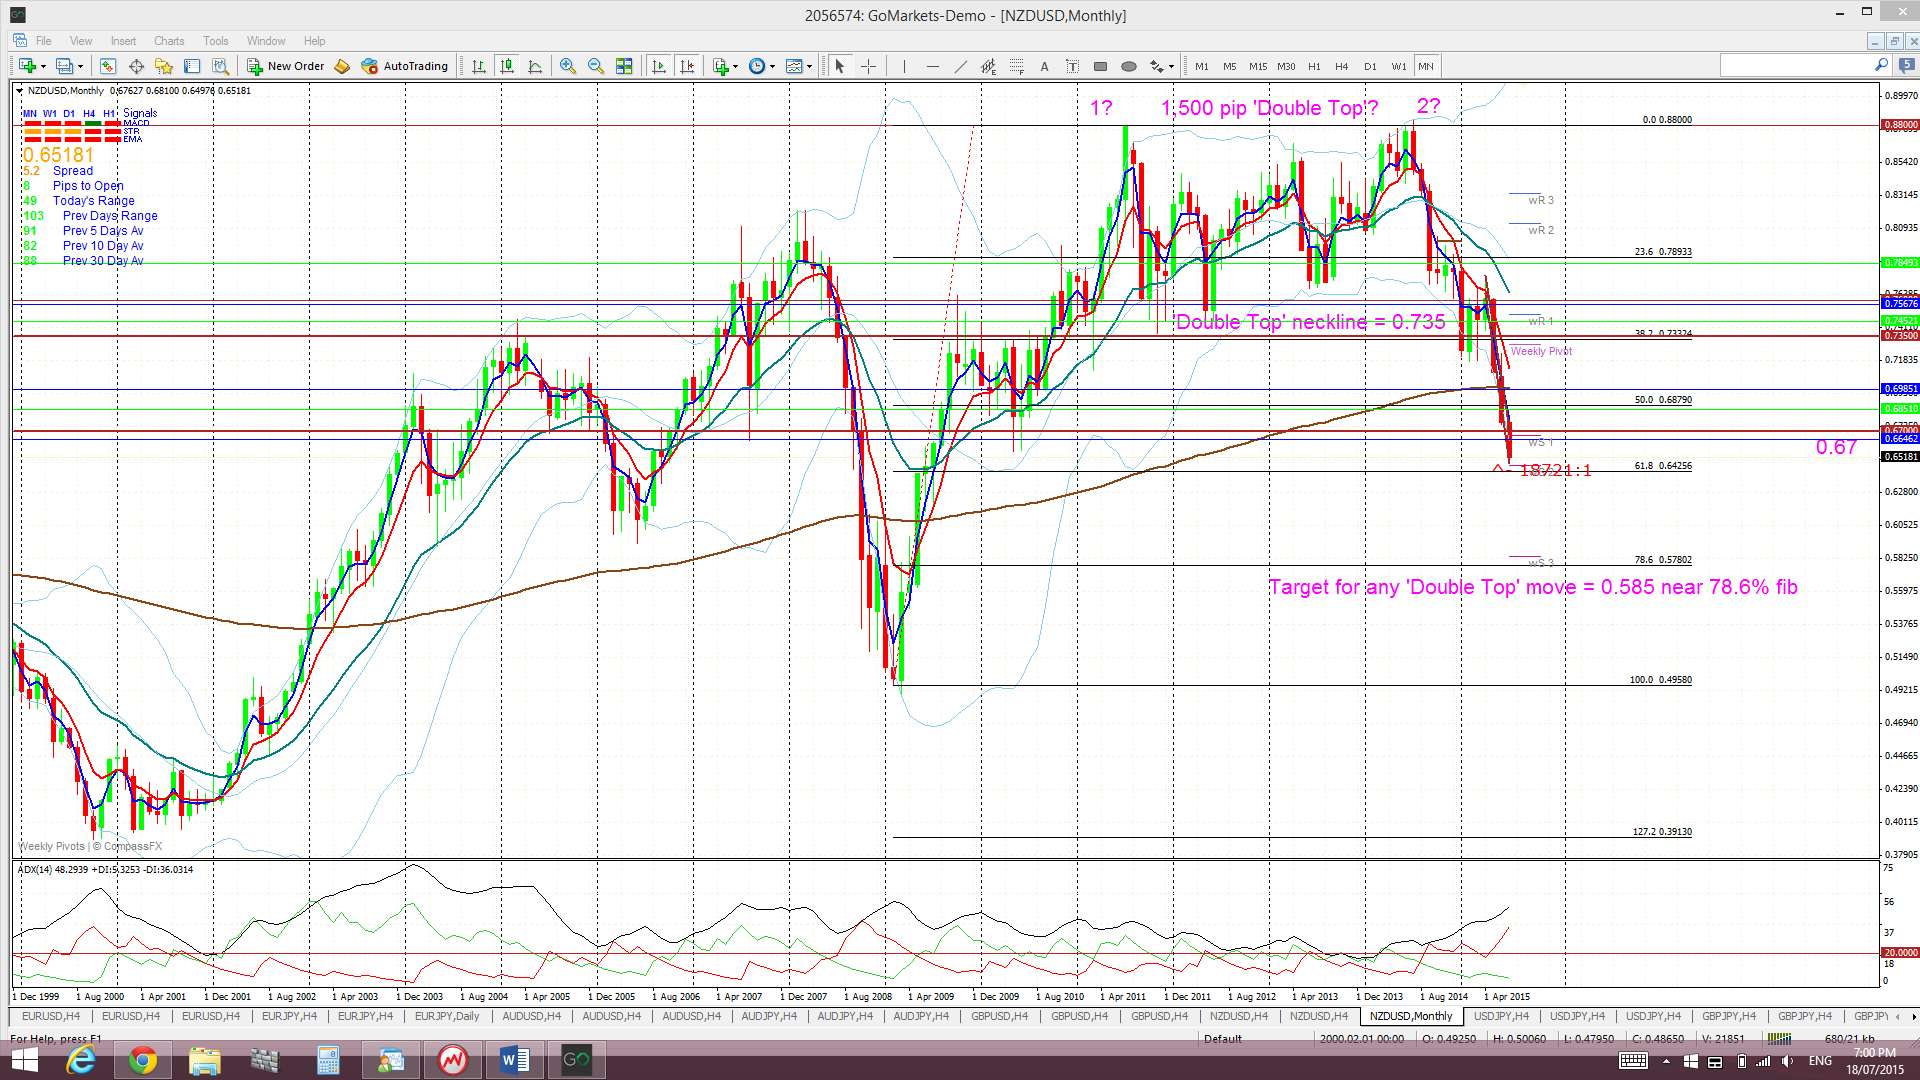
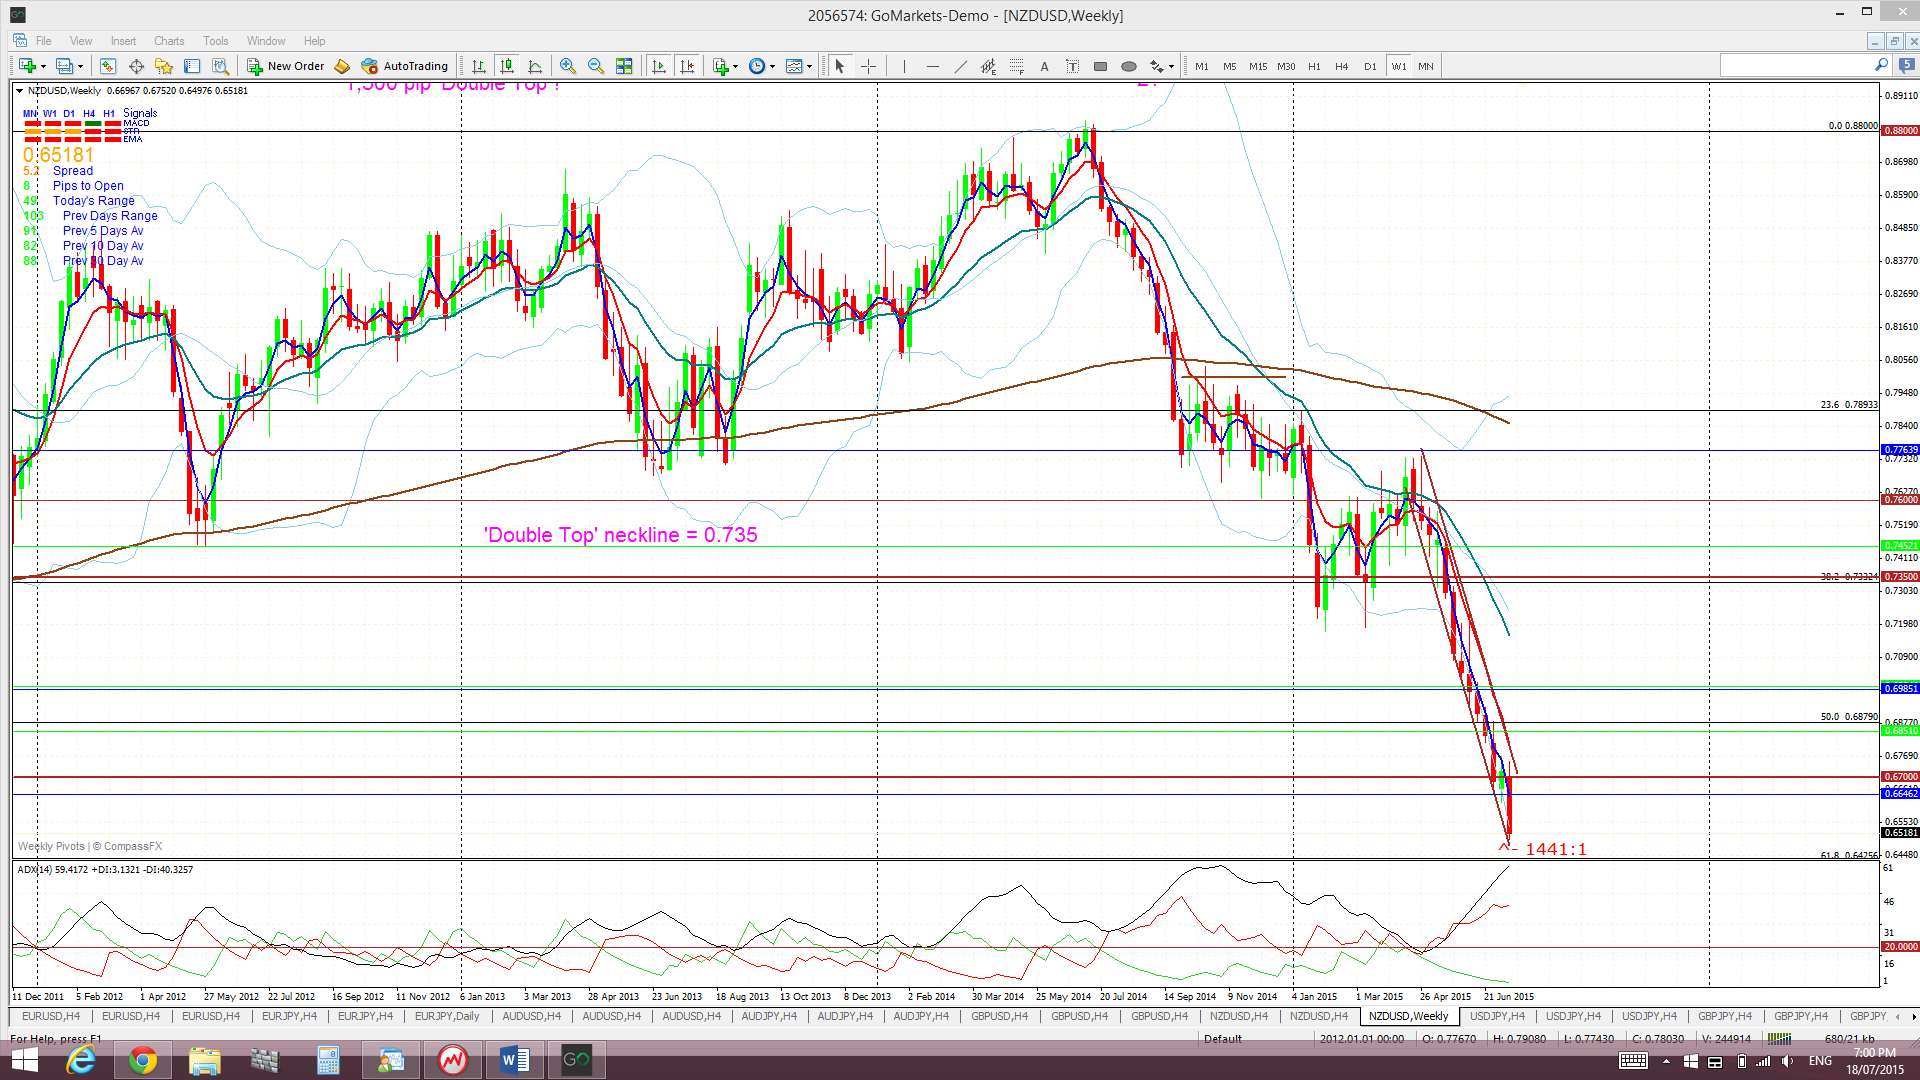
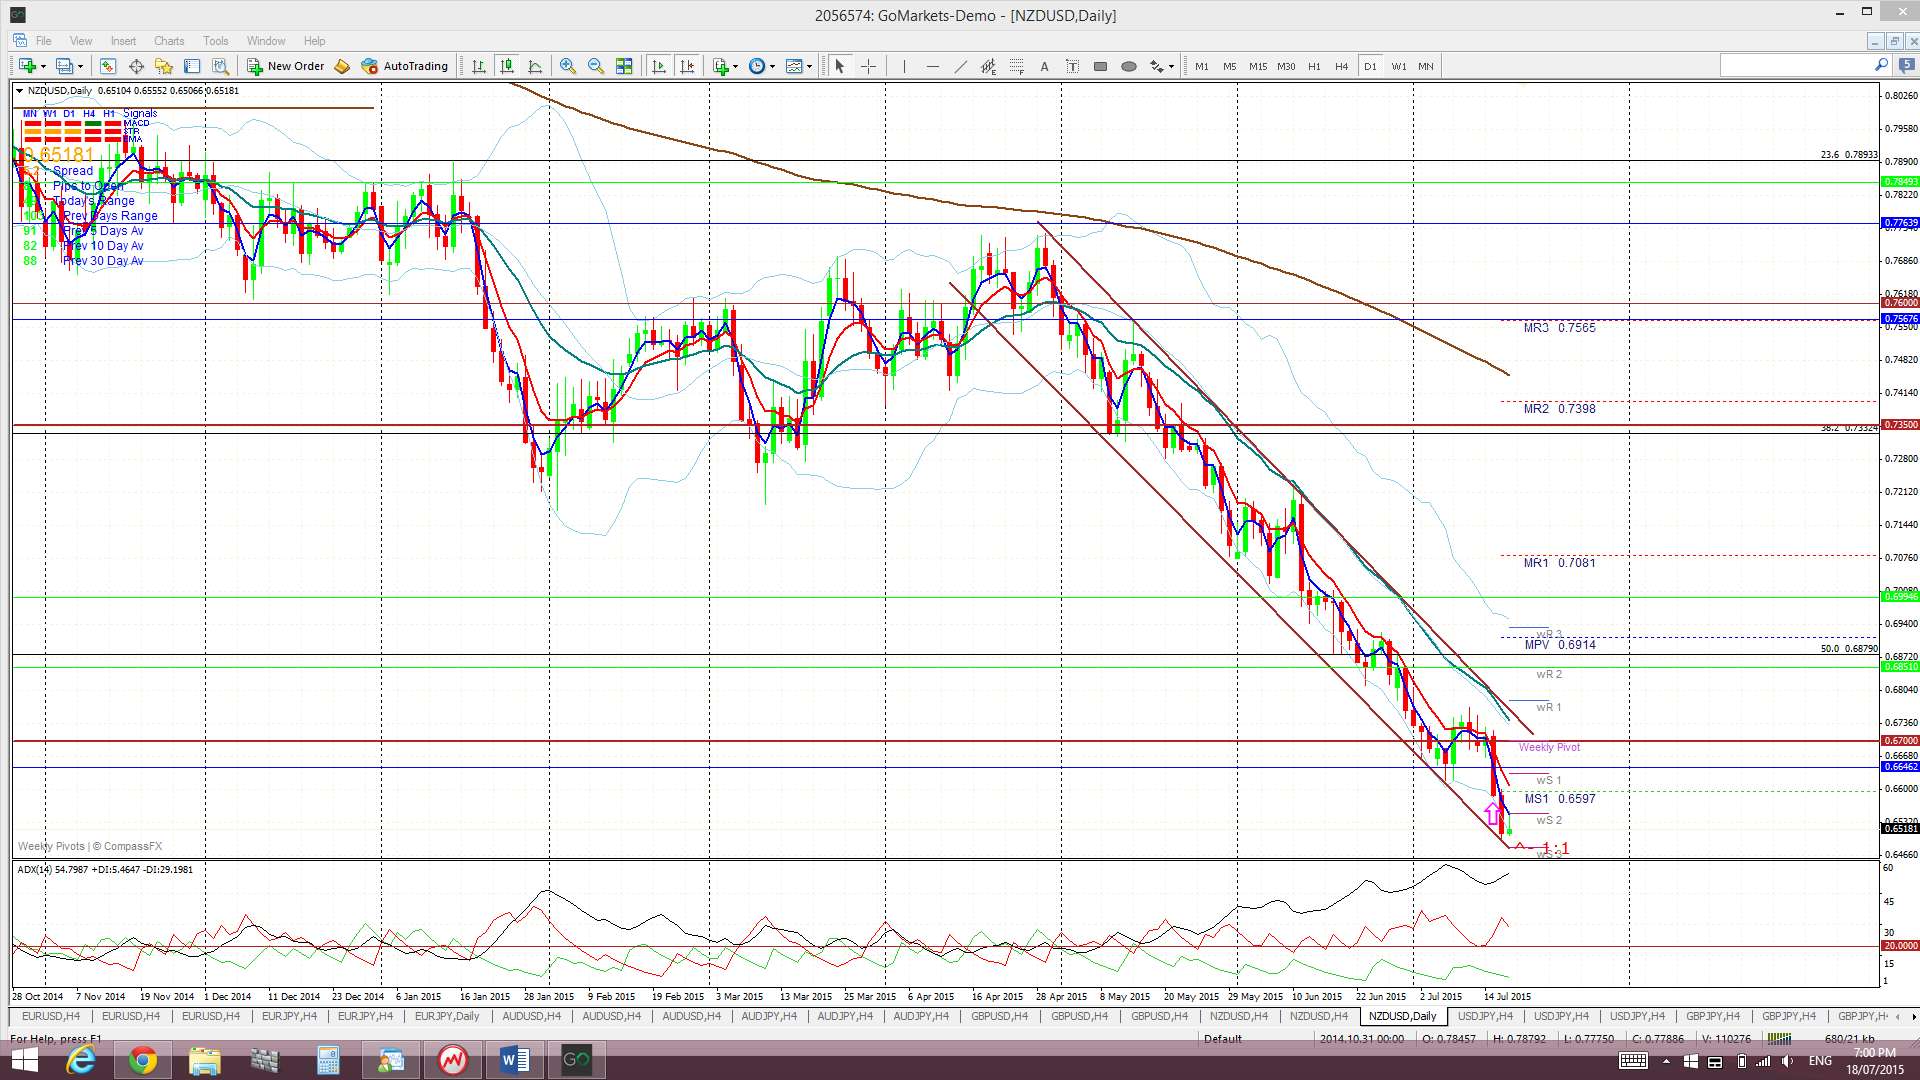
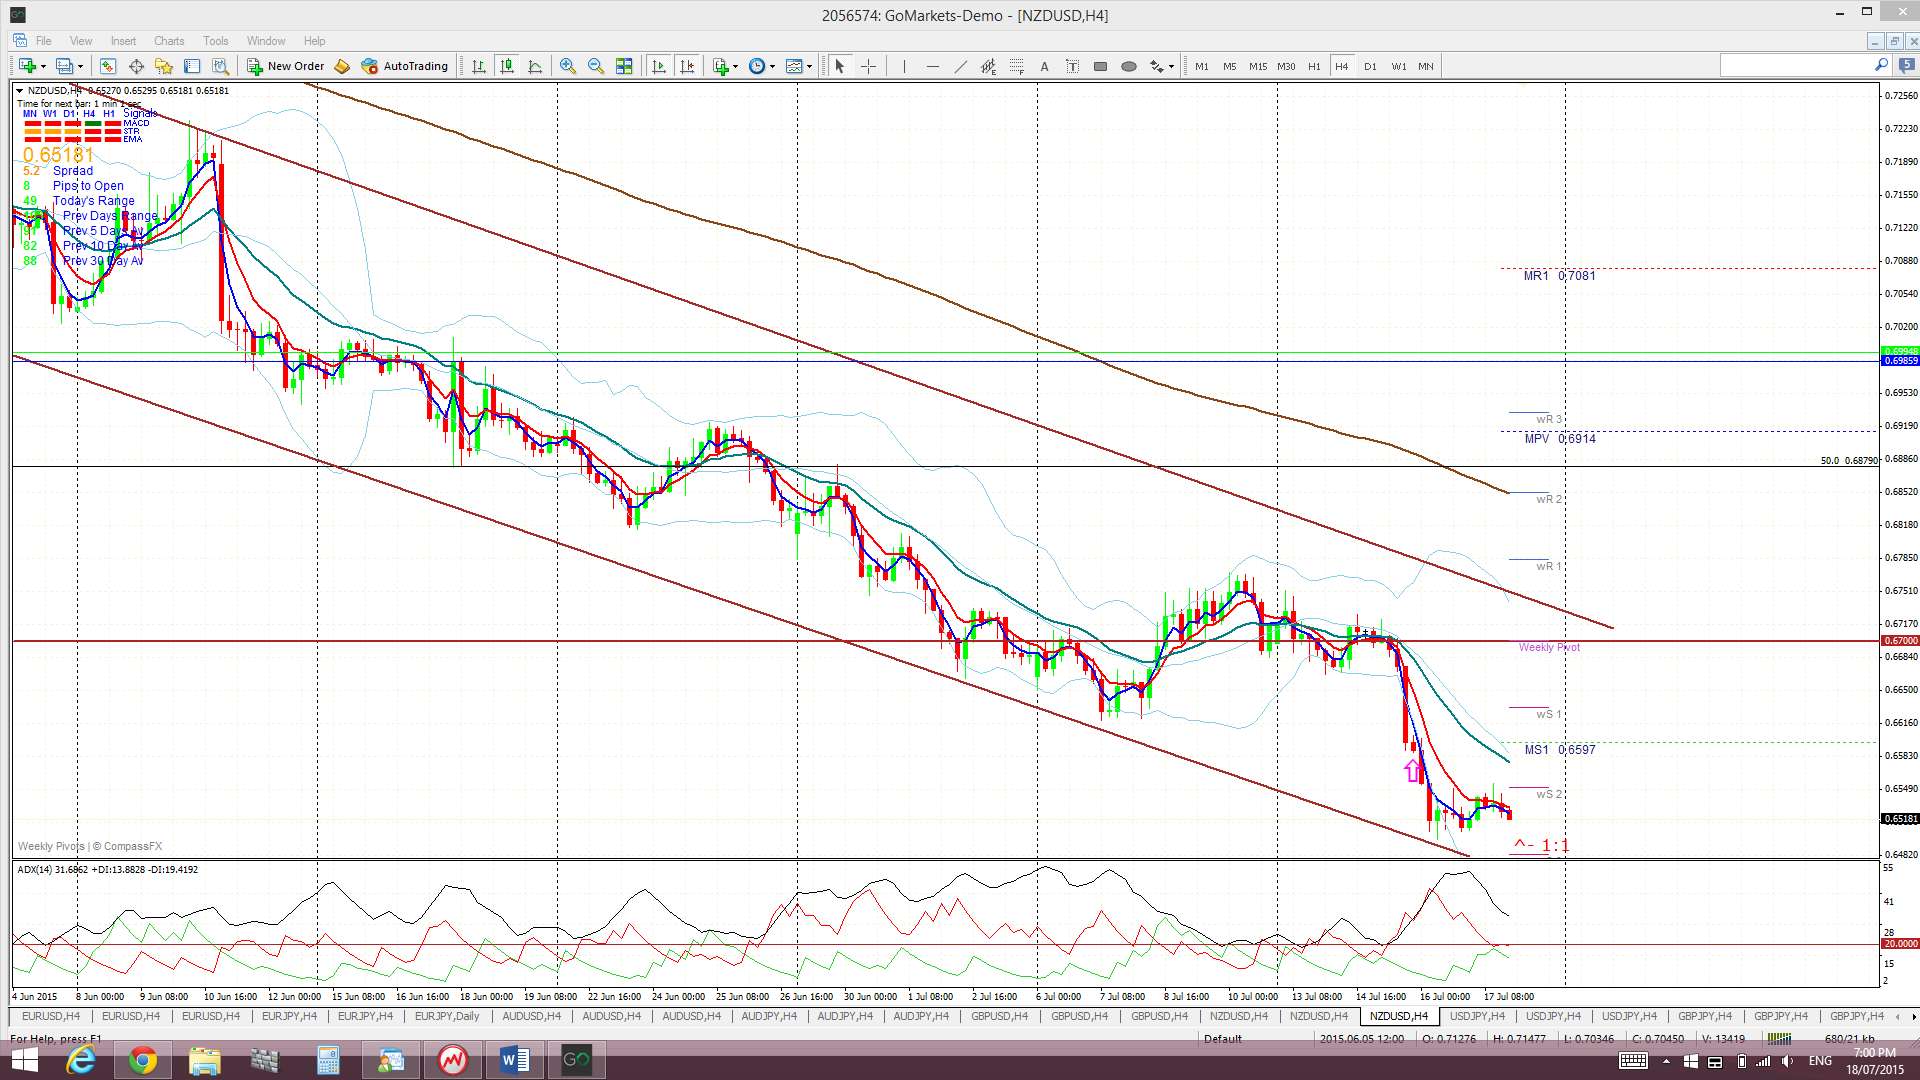
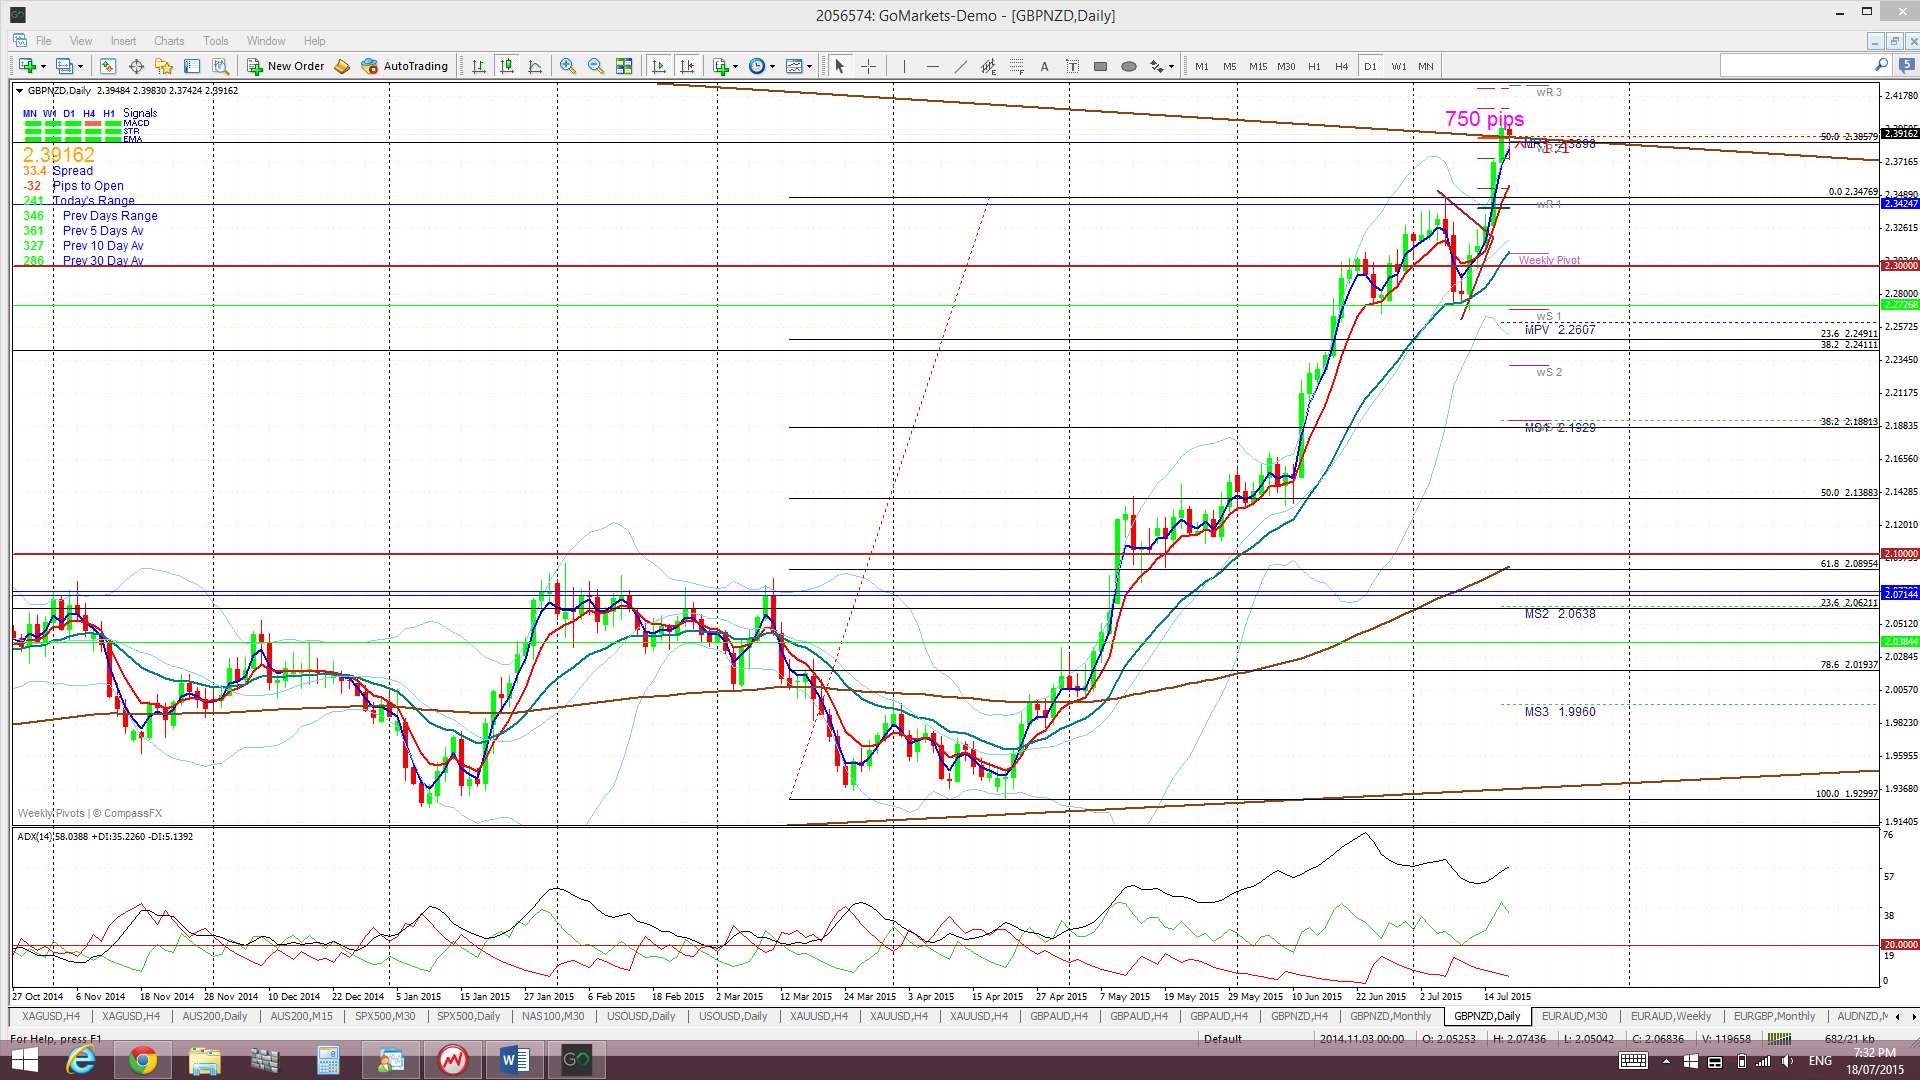
Kiwi: NZD/USD: The Kiwi is still trading within a descending trading channel and below the monthly chart’s ‘Double Top’ neck line level of 0.735. Support from 0.67 gave way this week but there might be some support from the 61.8% fib of the 2008-2011 swing high move that sits near 0.64.
‘Double Top’ breakdown on Monthly chart? The monthly chart still reveals a possible ‘Double Top’ pattern with a neck line at 0.735. The monthly candle close below this level for January suggested a possible 2,000 pip bearish follow through move as this is the height of the ‘Double Top’. This bearish move has yielded over 750 pips so far.
Price is trading below the Ichimoku Cloud on the 4hr, daily and weekly charts and monthly charts.
The weekly candle closed as a large bearish candle.
There is NZD Interest Rate news out on Thursday and Trade Balance data on Friday to monitor.
- I’m watching for any new TC signal on this pair and the 61.8% fib level.
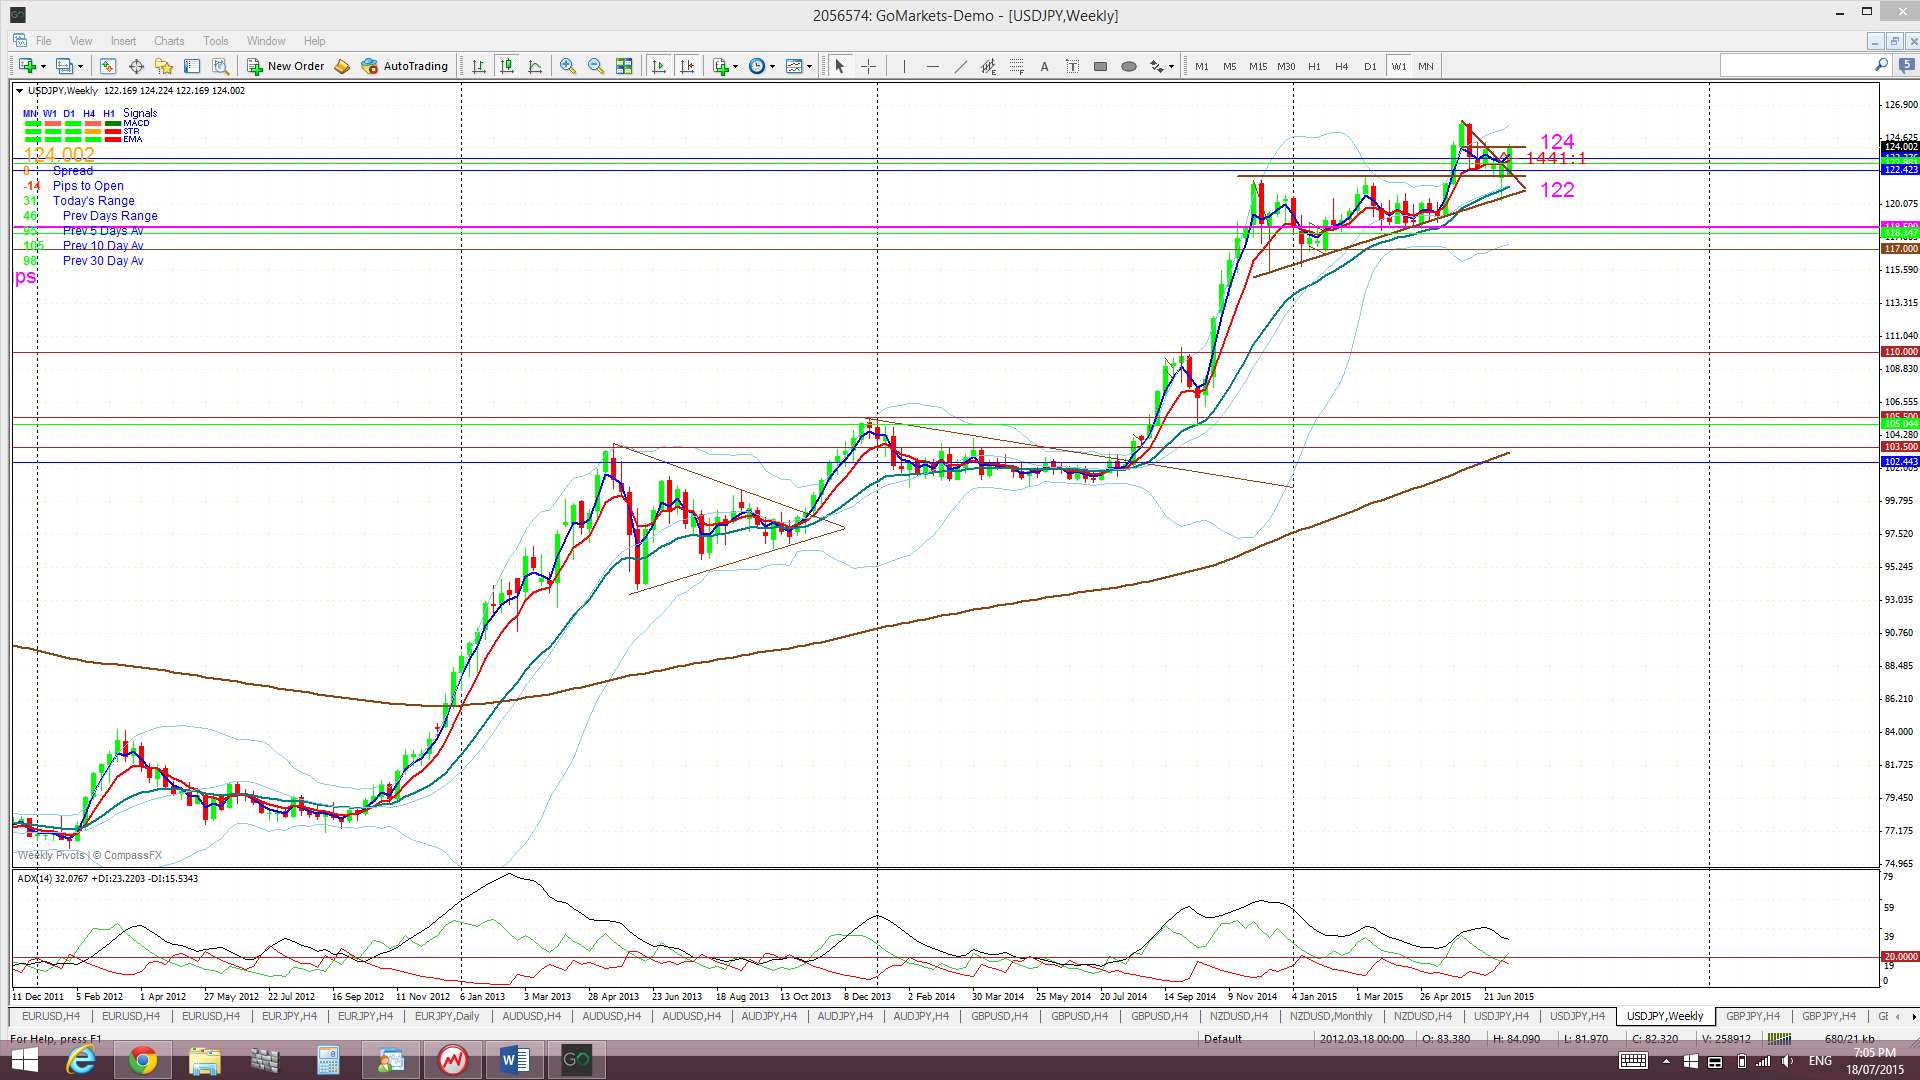
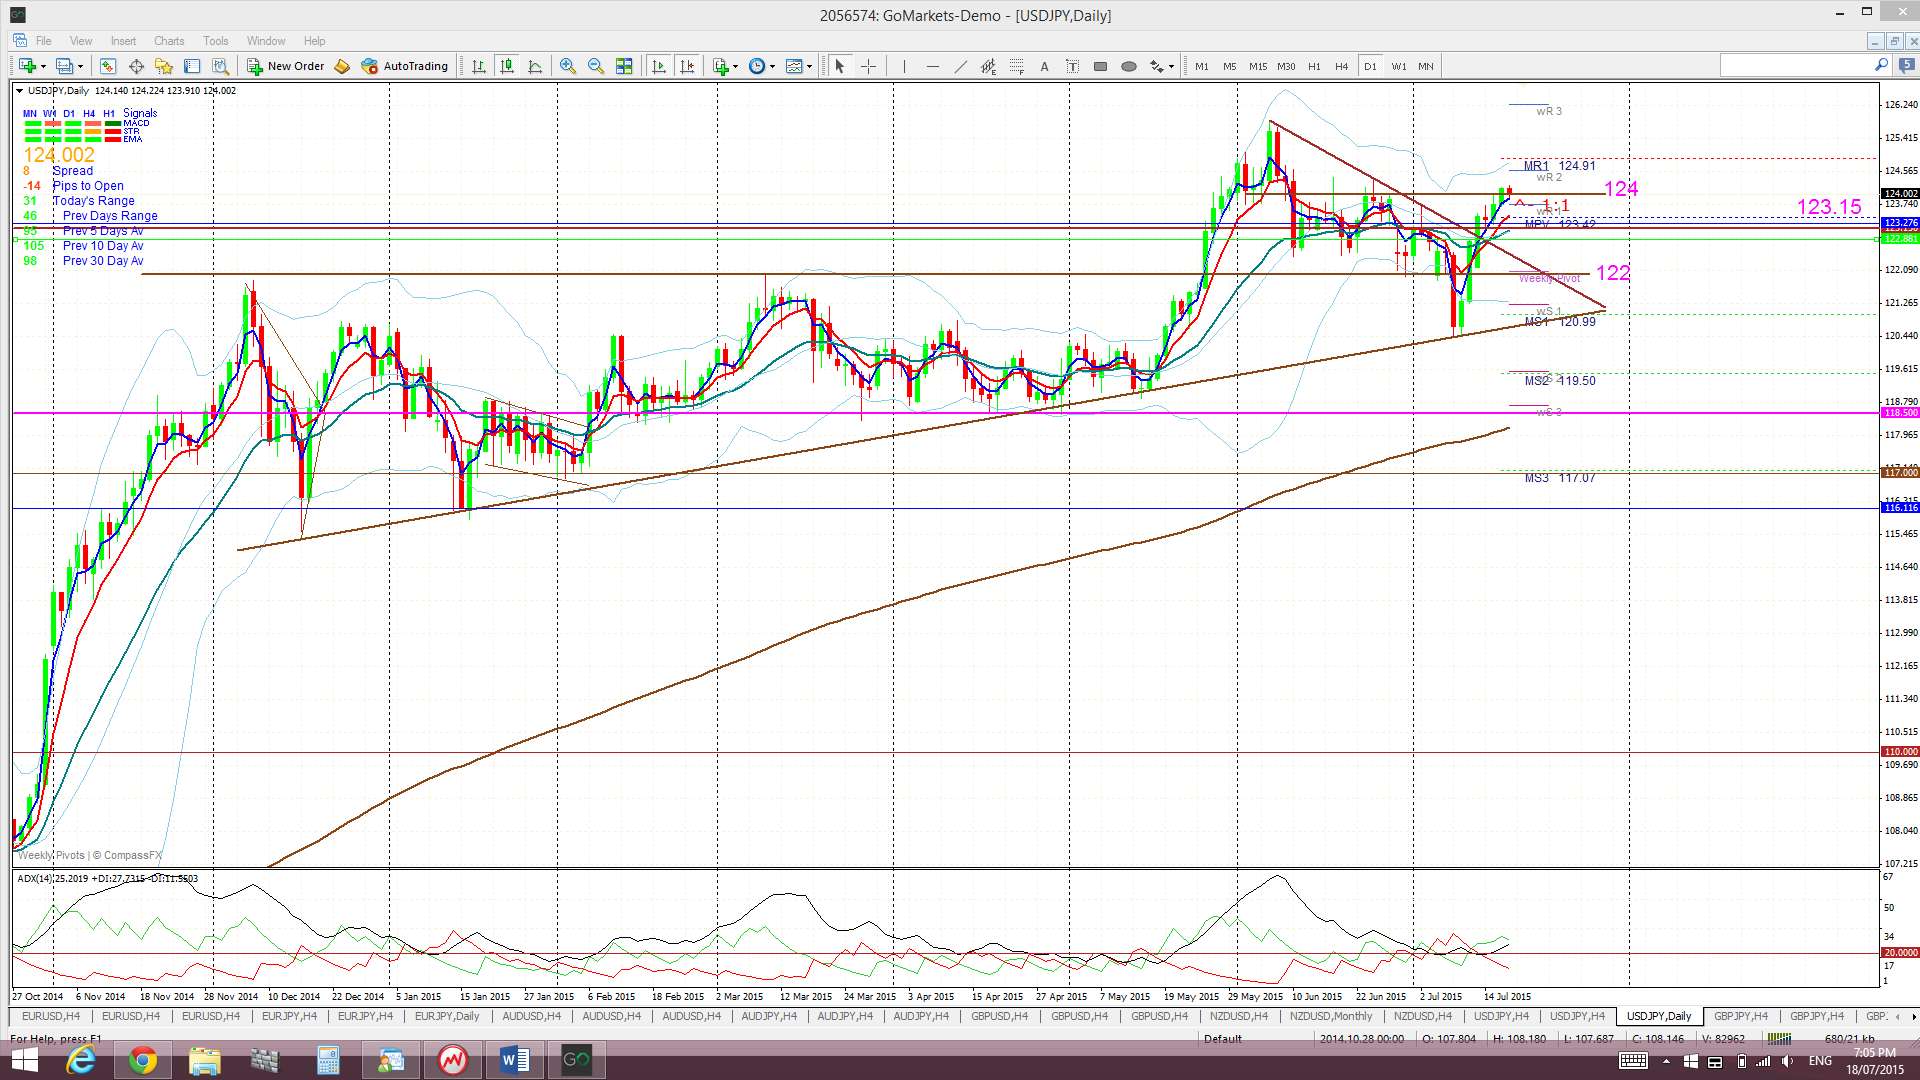
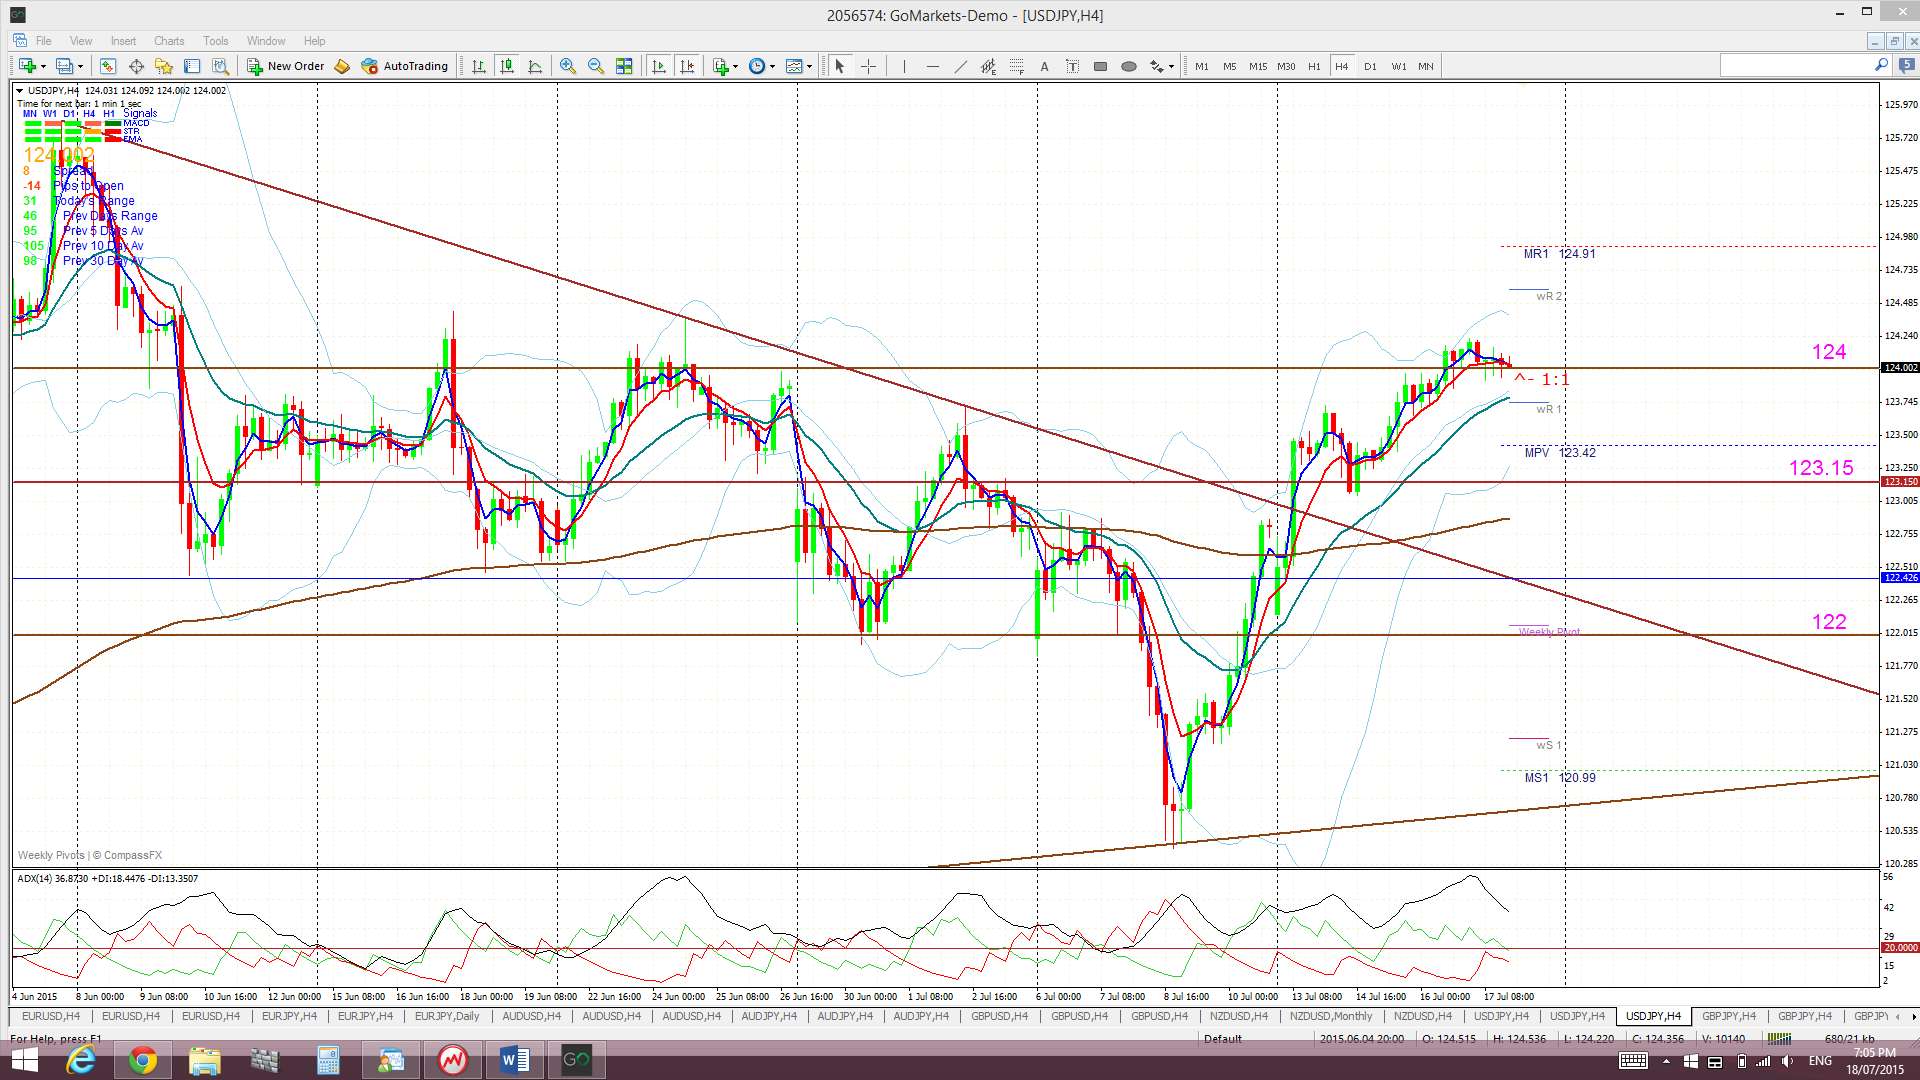
The Yen: U/J: US$ strength has helped to lift this pair over the last two weeks. Price action made a bullish daily-chart 100 pip+ triangle breakout and a move back above 124 during the last week. Remember that 124 represents highs not seen since April 2002 and is a key demarcation level for, yet another, potentially huge Cup ‘n’ Handle breakout pattern .
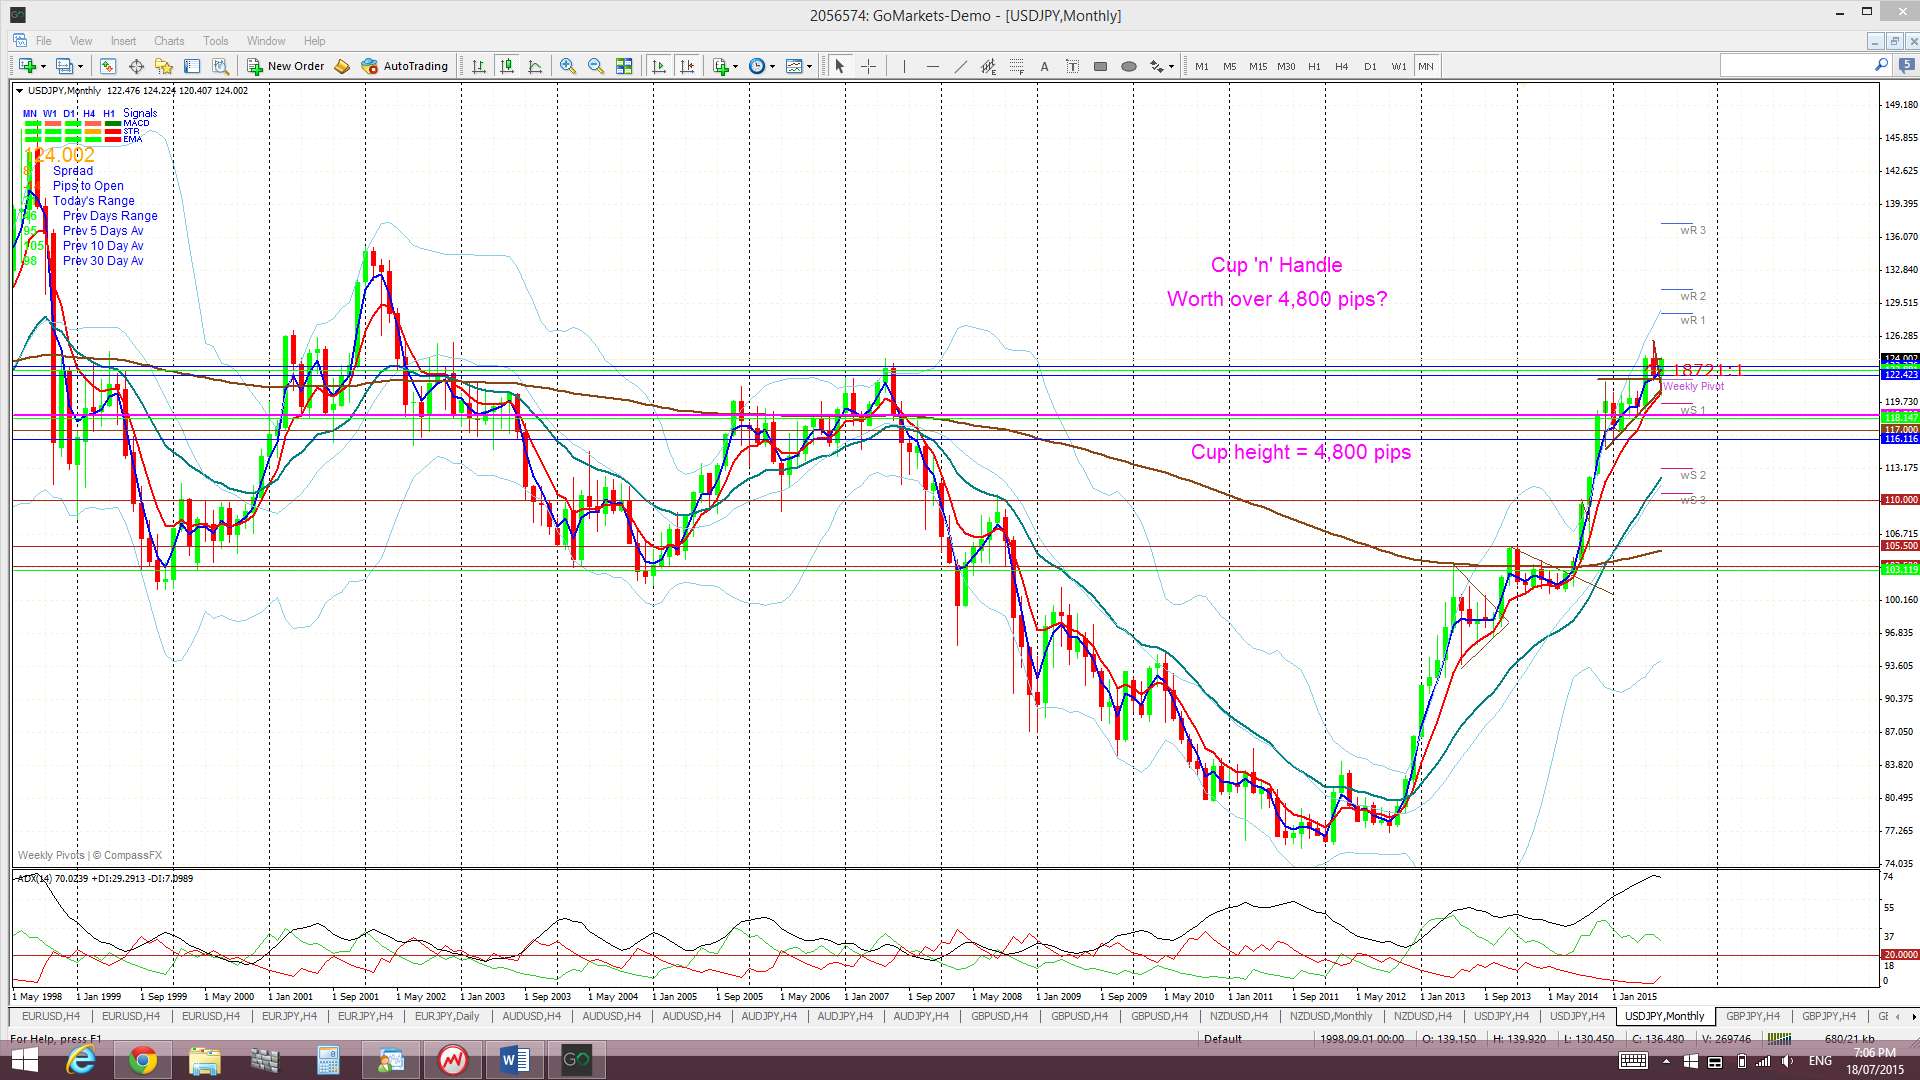
Monthly Chart Bullish Cup’ n’ Handle pattern: There looks to be a new bullish Cup ‘n’ Handle forming up on the monthly chart. The theory behind these patterns is that the height of the ‘Cup’ pattern is equivalent to the expected bullish move from the ‘handle’ breakout. The height of the Cup for the U/J weekly chart is around 4,800~ 4,900 pips. This may seem like a massive move but the longer term chart below shows this move to be reasonable as it would take the U/J up near the 50% fib of the 1985-2012 swing low move.
Price is back trading above the Cloud on the 4hr, daily, weekly and monthly charts.
The weekly candle closed as a bullish candle.
Price action has already been a bit choppy around the 124 level but this could well continue in the formation of a more decent sized ‘Handle’ to add on to this ‘Cup’.
- I’m watching for any new TC signal on this pair and the 124 level.
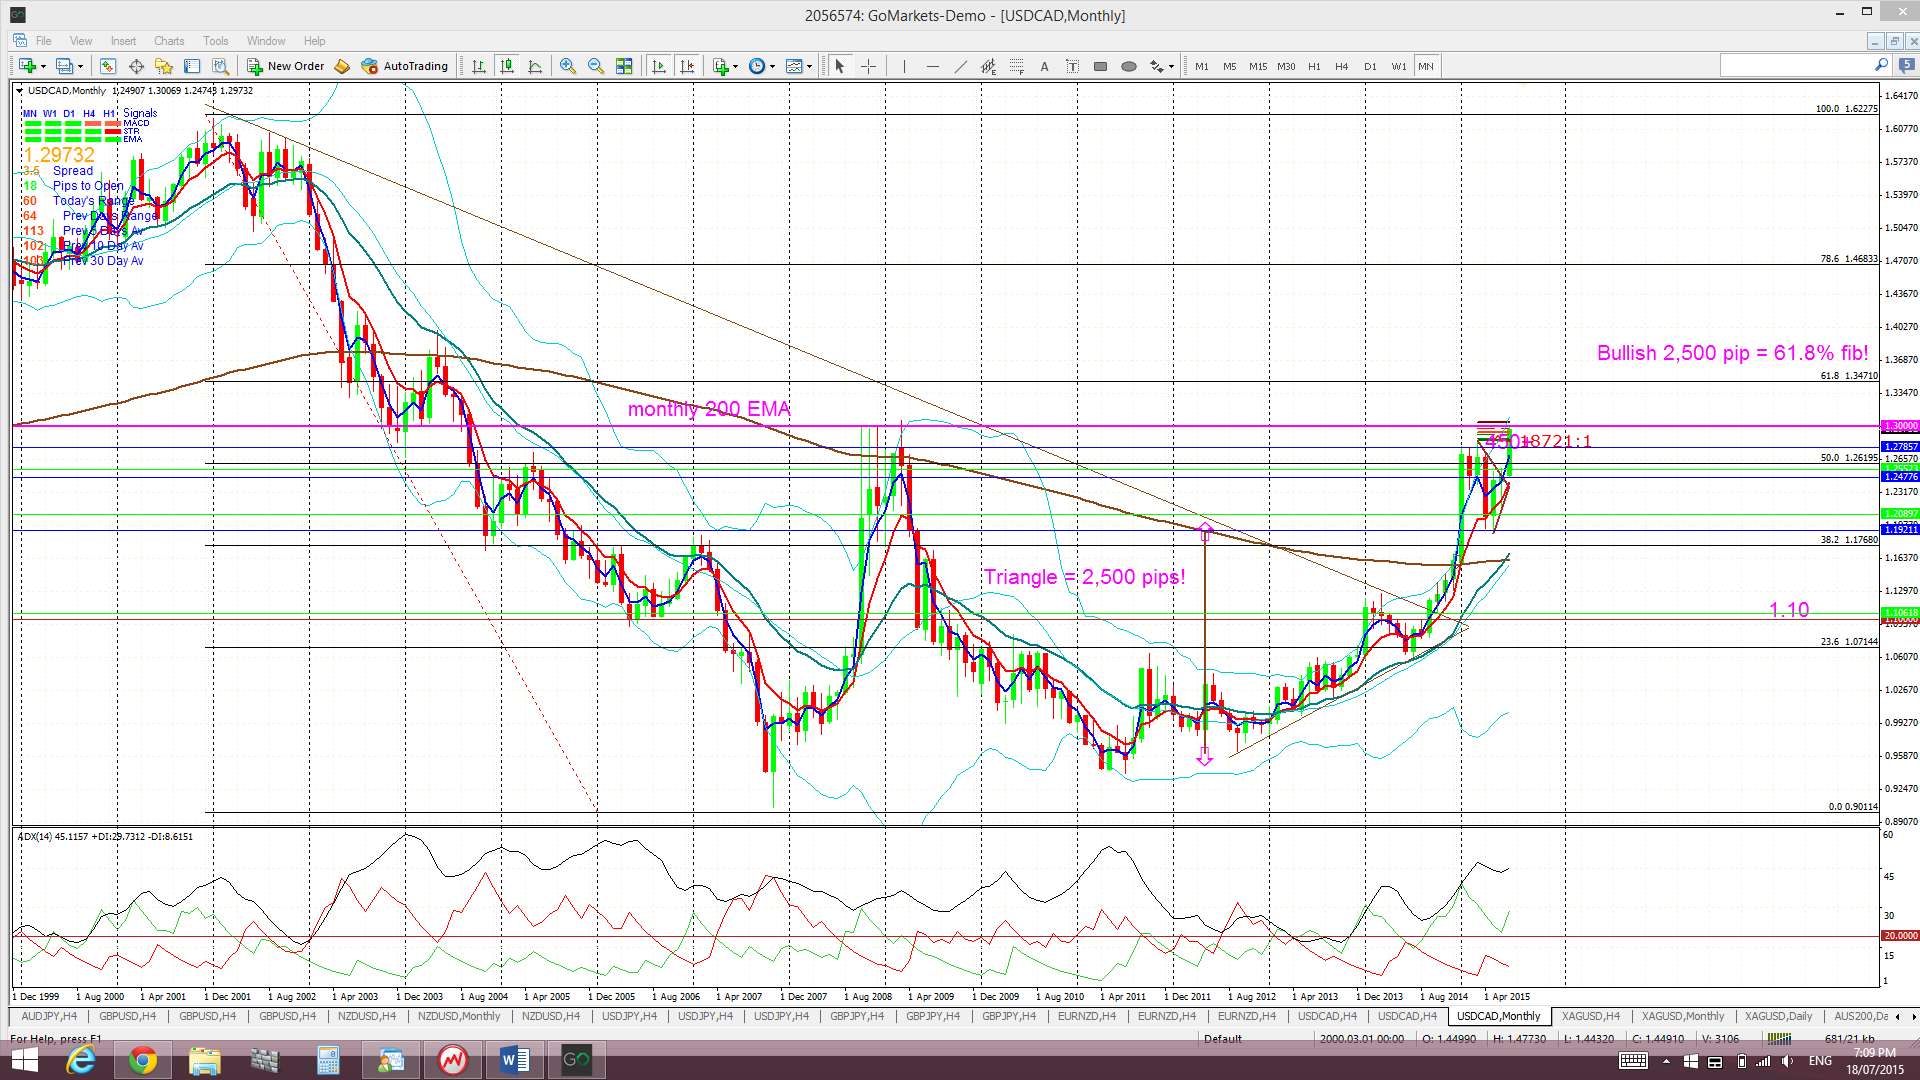
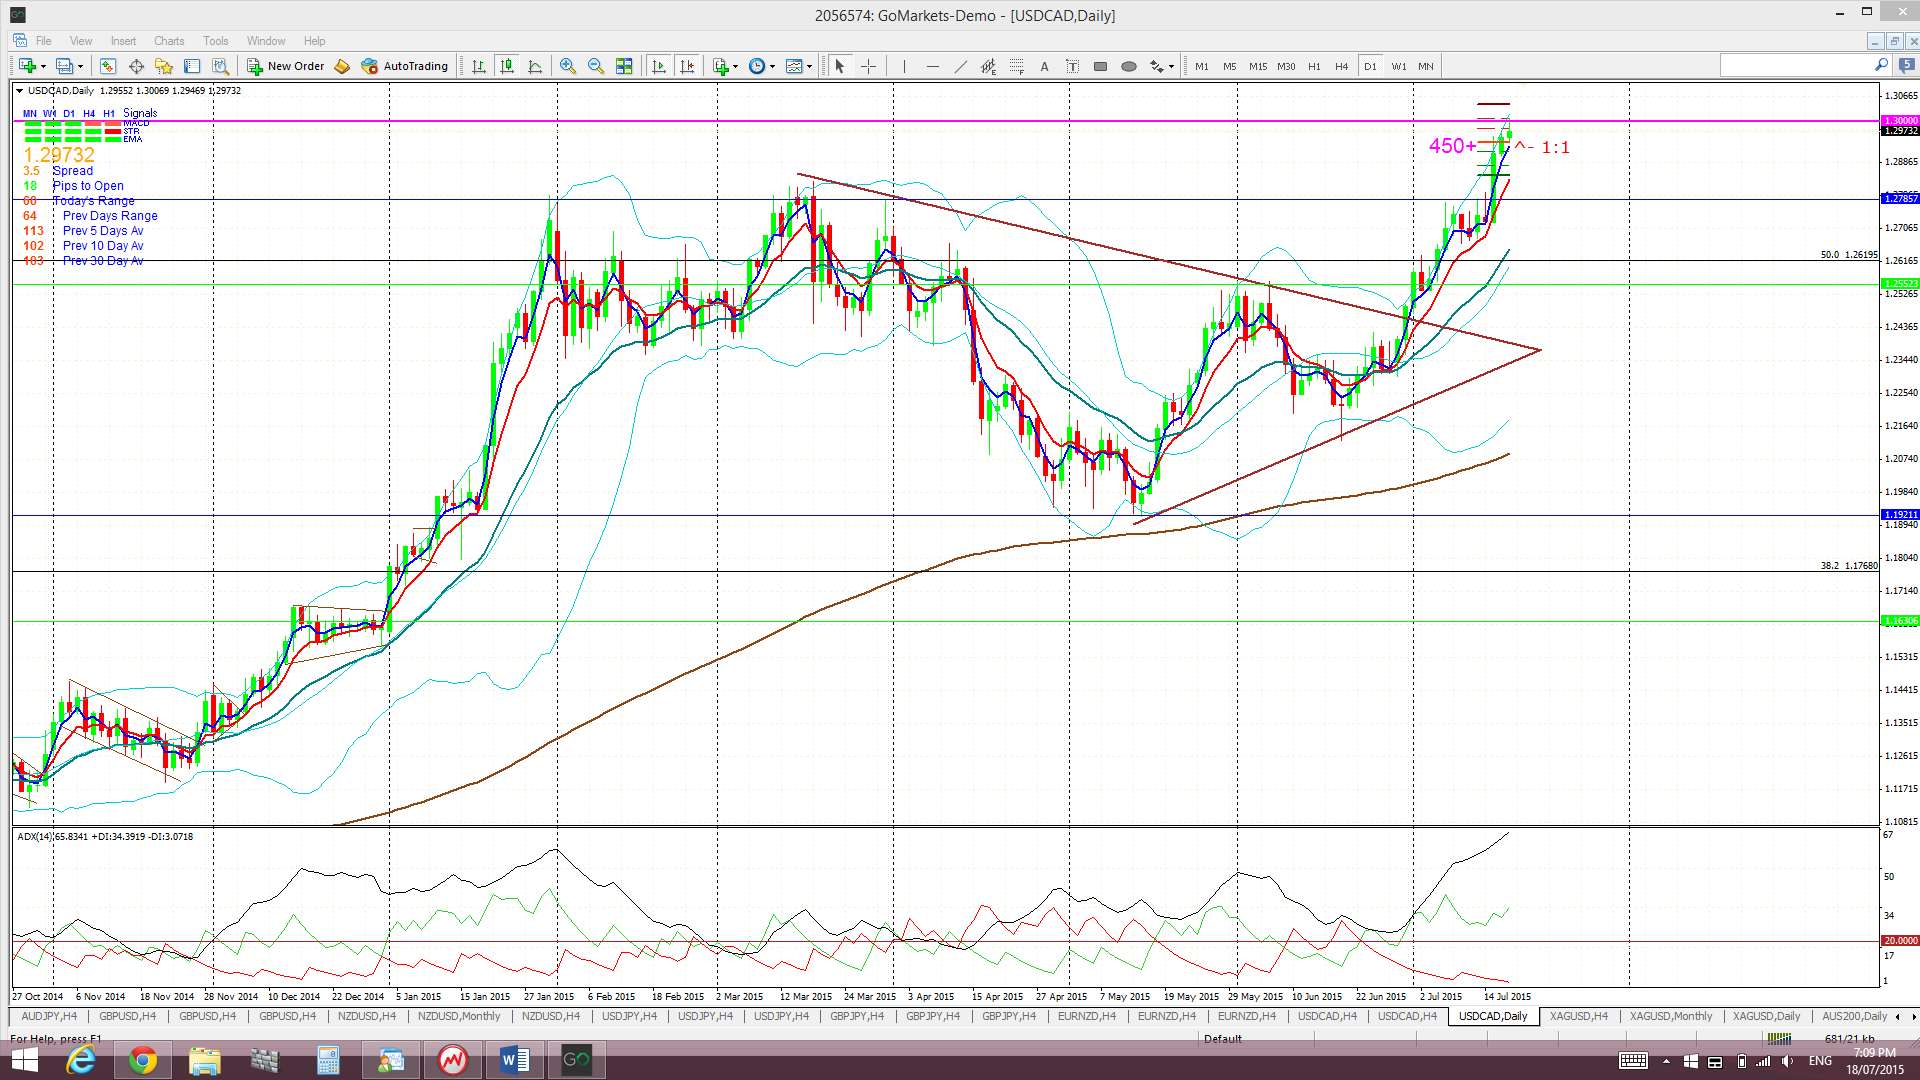
USD/CAD: The daily-chart triangle breakout has delivered over 450 pips but price action has stalled at the key 1.30 level. The significance of this region can be best seen on the monthly chart.
Triangle breakout target: The Loonie had previously broken up and out from a major monthly chart triangle pattern that could deliver up to 2,500 pips. This 2,500 pip figure is evaluated from the height of the triangle. I have used the triangle height from the beginning of the bull trend line, as shown in the monthly chart below. The height of the triangle is around 2,500 pips and, thus, this would be the expected move from any breakout action. Extrapolating a bullish move from this triangle places price up at the 61.8% fib level. These fibs levels are popular targets in retracement moves and so this adds some confluence to this as a possible target. The bullish move has given up to 1,900 pips so far.
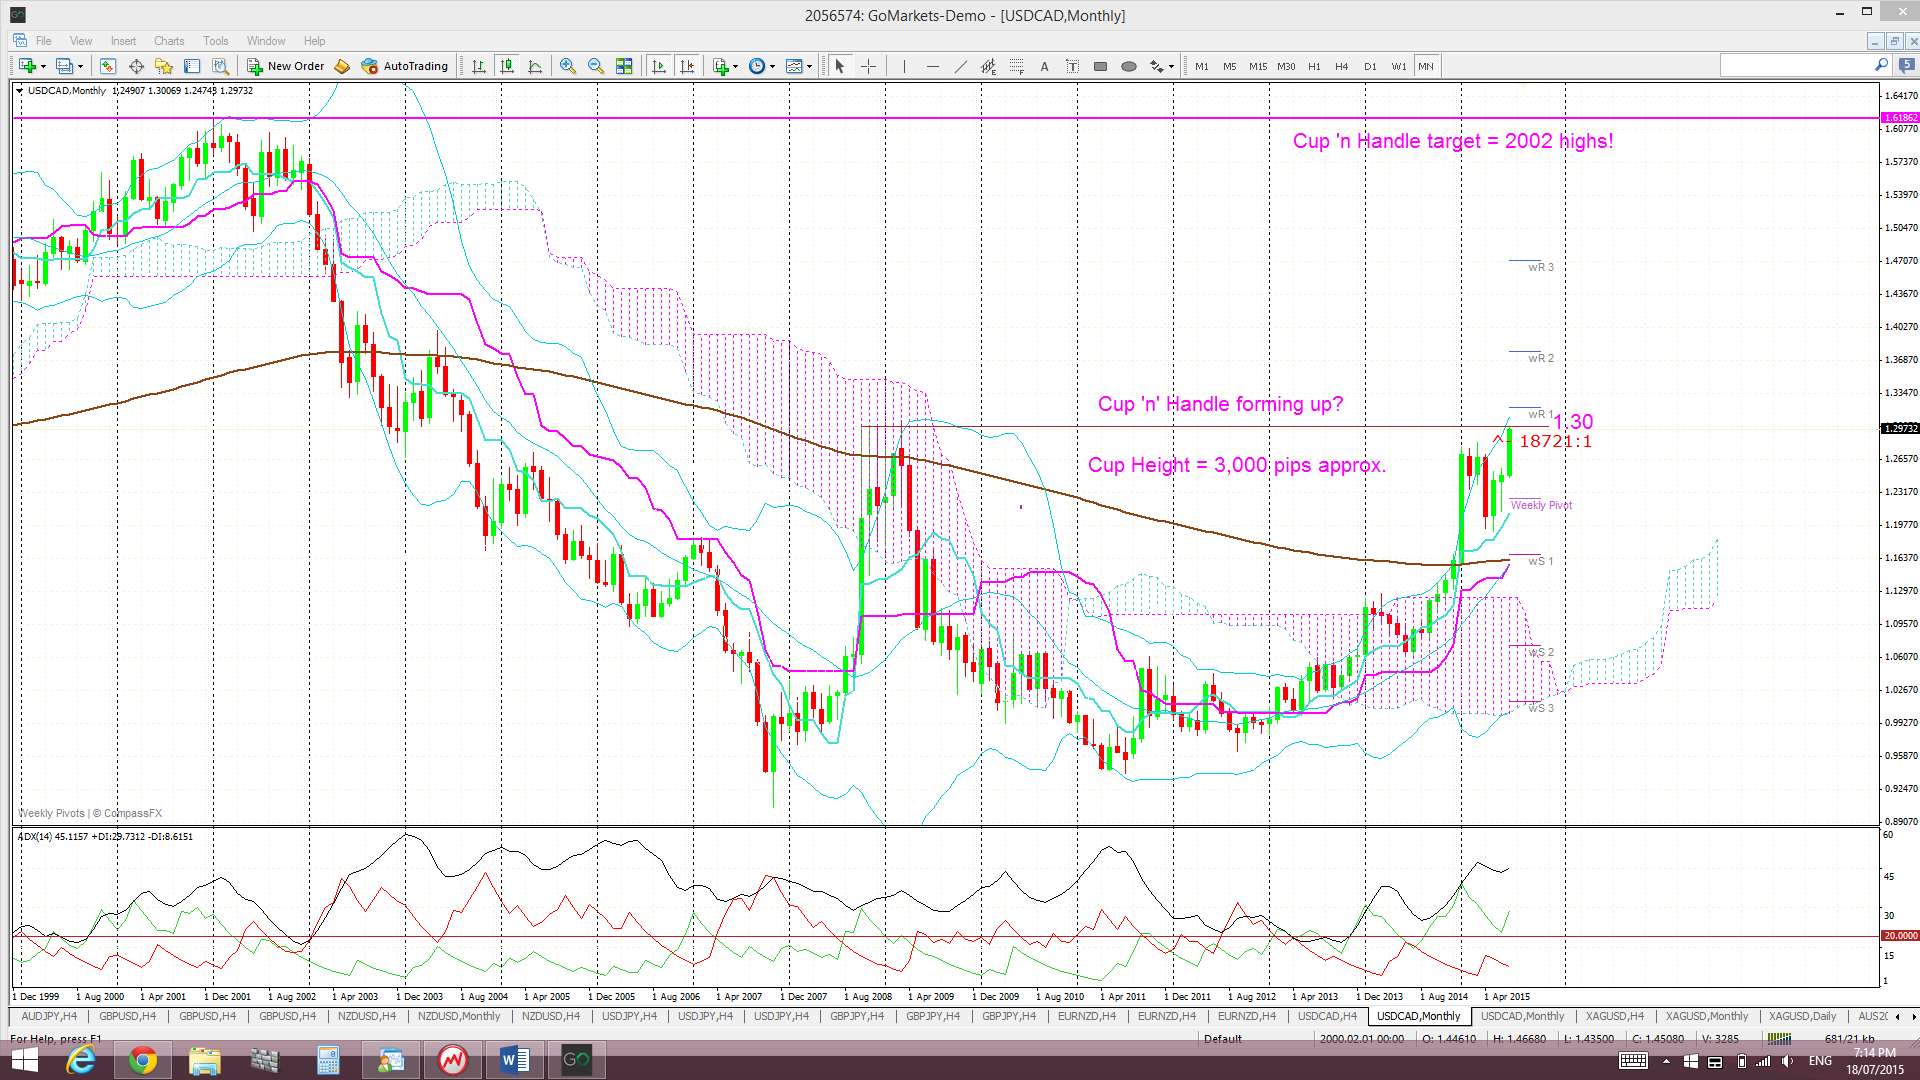
Monthly Chart Cup ‘n’ Handle? The monthly chart now also shows a possible bullish Cup ‘n’ Handle pattern forming up. This is worth keeping an eye on as the pattern would be worth over 3,000 pips if it was to evolve as this is the height of the ‘Cup’. The interesting point is that the target for this pattern would put price up at the highs reached back in 2002 and this is equal to a 100% Fib retracement of the 2002-2007 bear move.
Price is now trading above the Cloud on the 4hr, daily, weekly and monthly charts.
The weekly candle closed as a large bullish candle.
- I’m watching for any new TC signal on this pair and the 1.30 level.
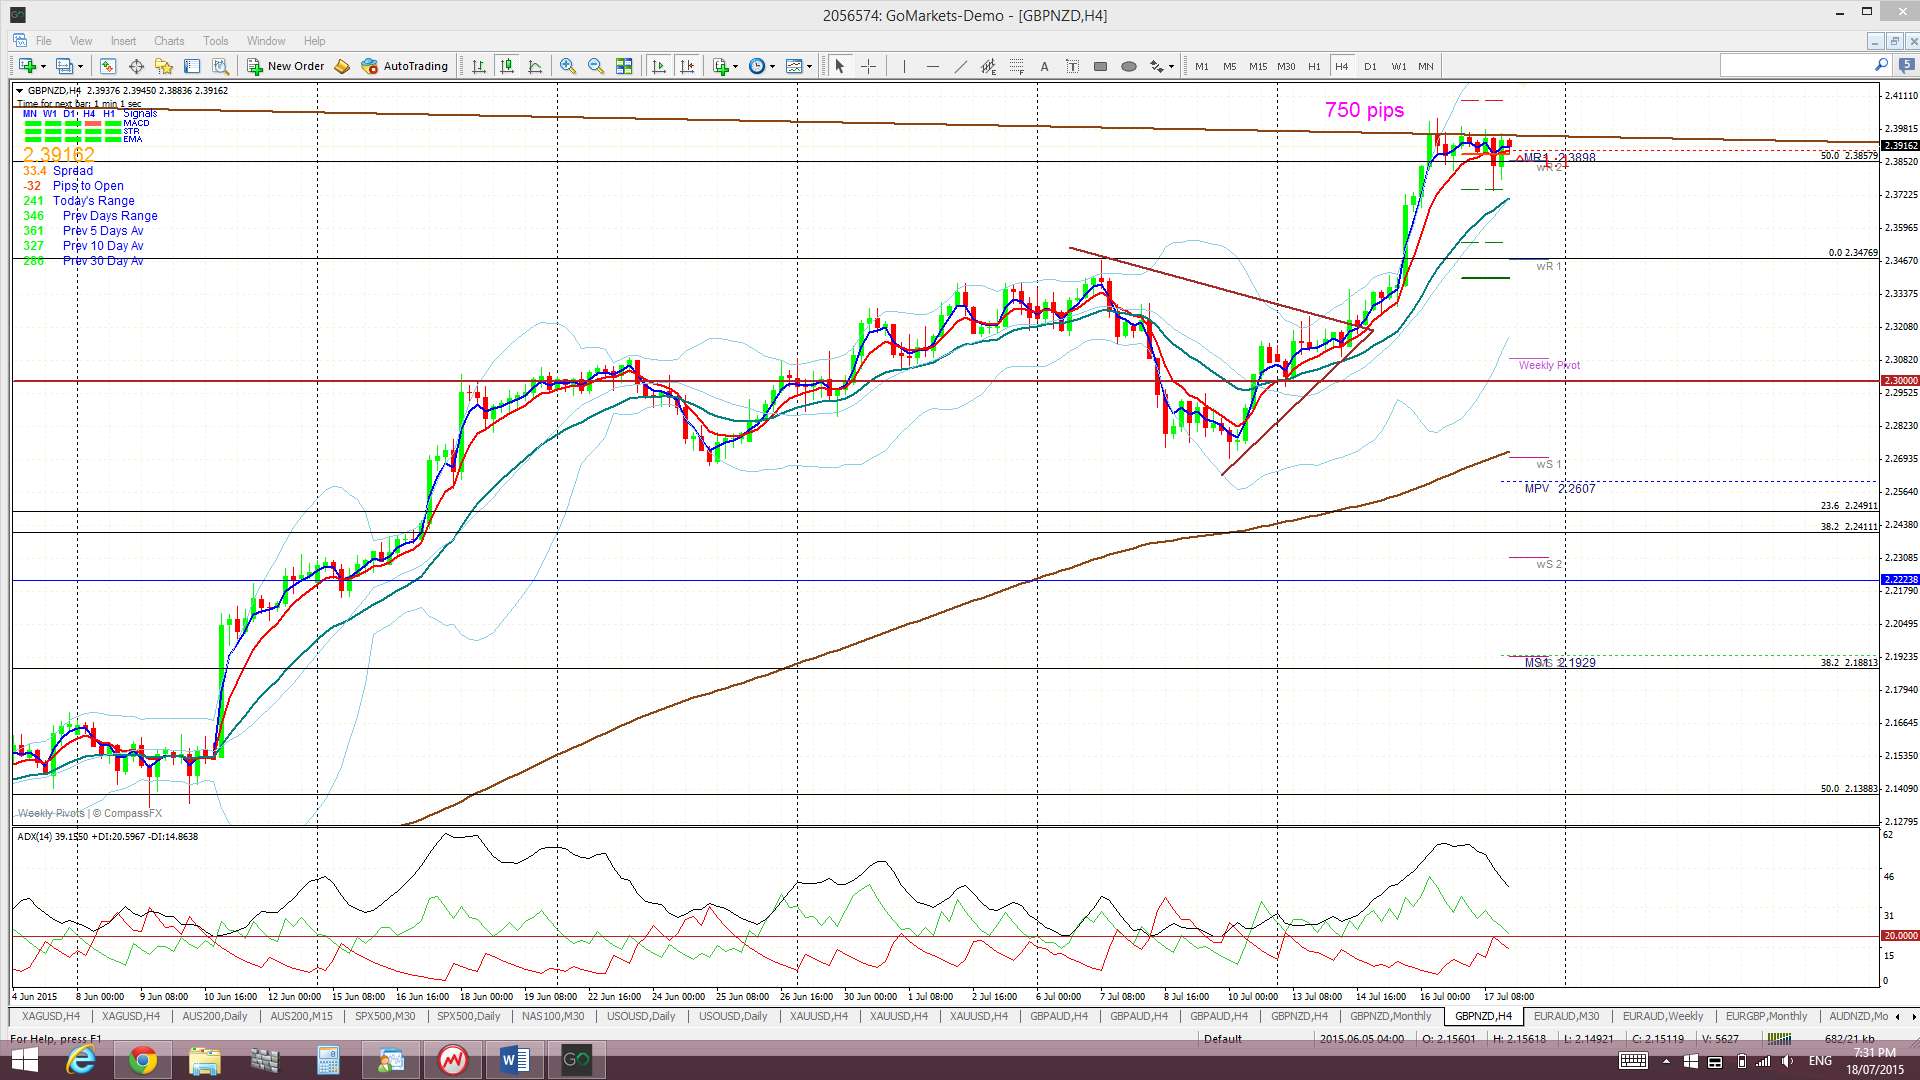
GBP/NZD: The pair continues to pile on the pips. It wasn’t that long ago I was urging traders to monitor the 2.10 level but it has rallied almost 3, 000 pips since then!
The GBP/NZD broke up and out from a 4hr triangle during last week and that move added 750 pips. Price has stalled now though at a major bear trend line from the monthly chart. Any break and hold above this trend line would be very bullish though.
The GBP/NZD is still trading above the Cloud on the 4hr, daily, weekly and monthly charts.
The weekly candle closed as a large bullish candle.
- I’m watching for any new TC signal and the monthly chart’s bear trend line.

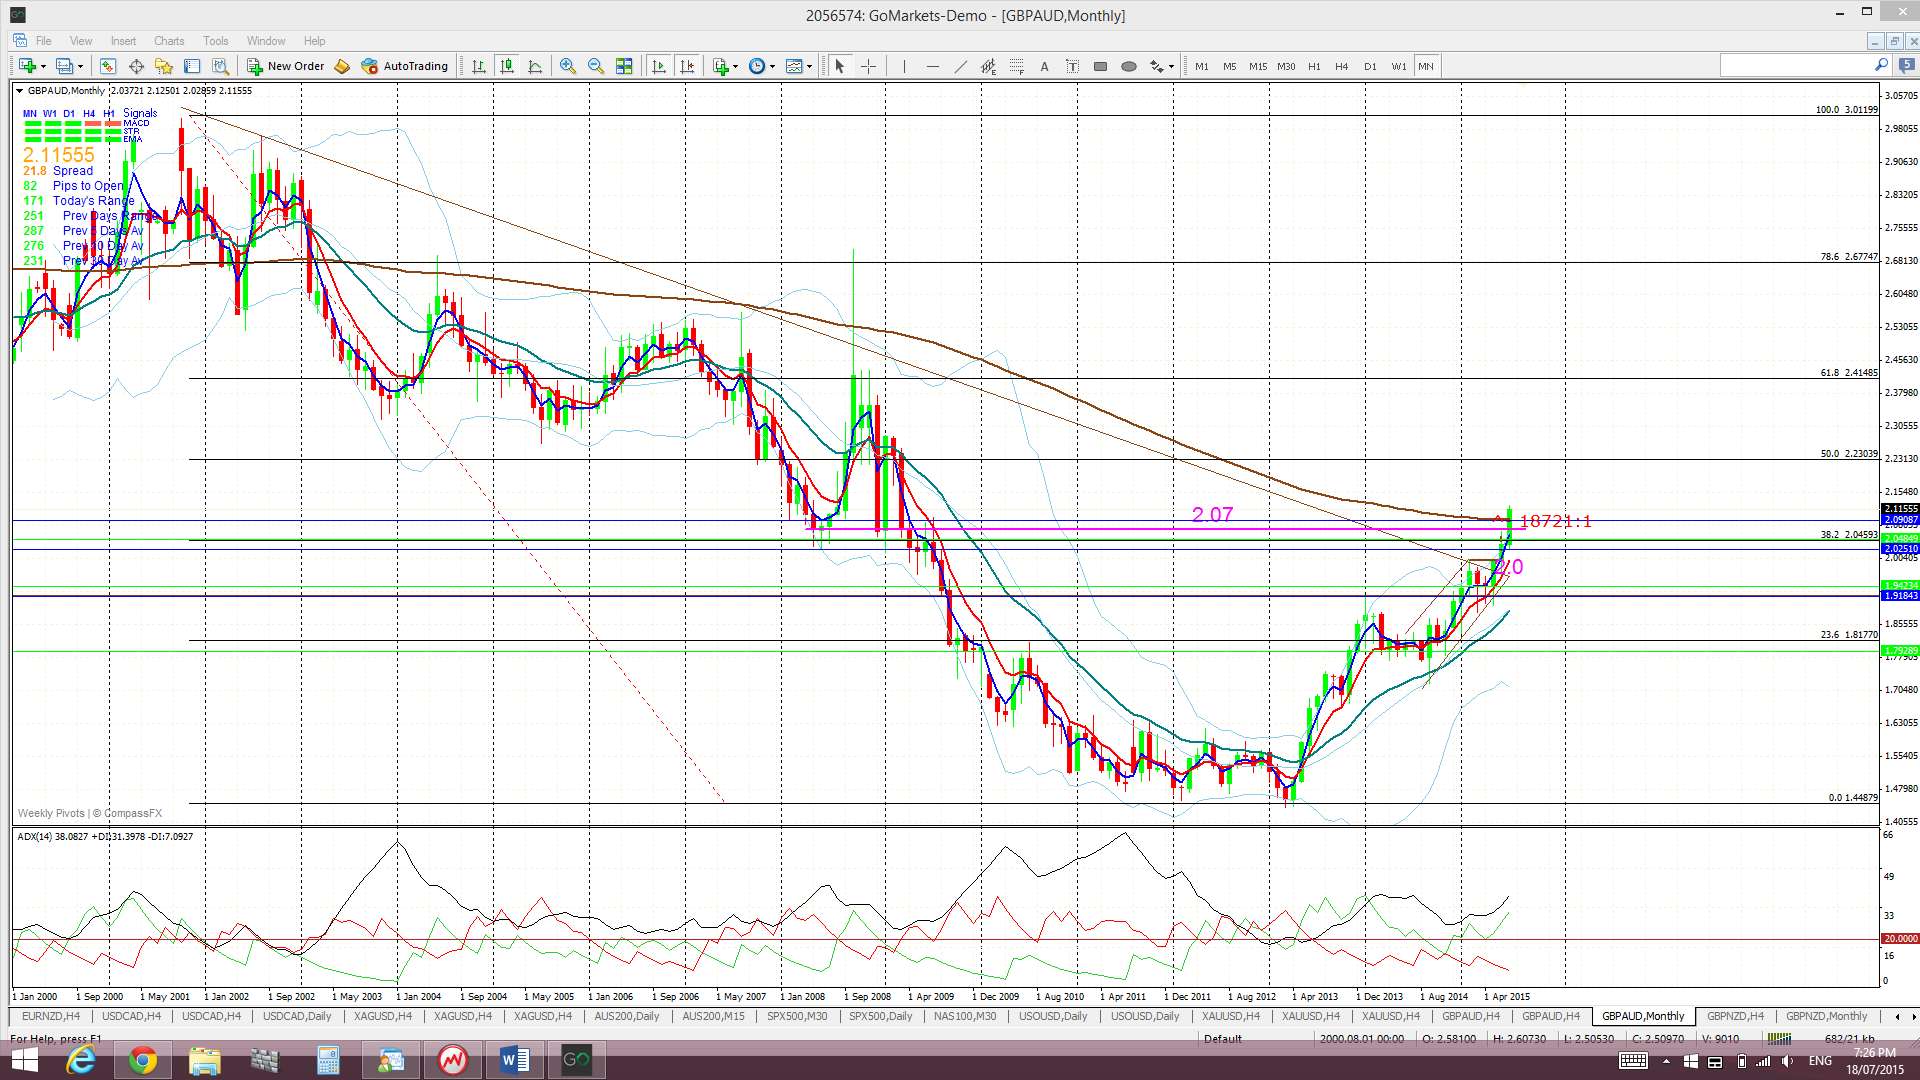
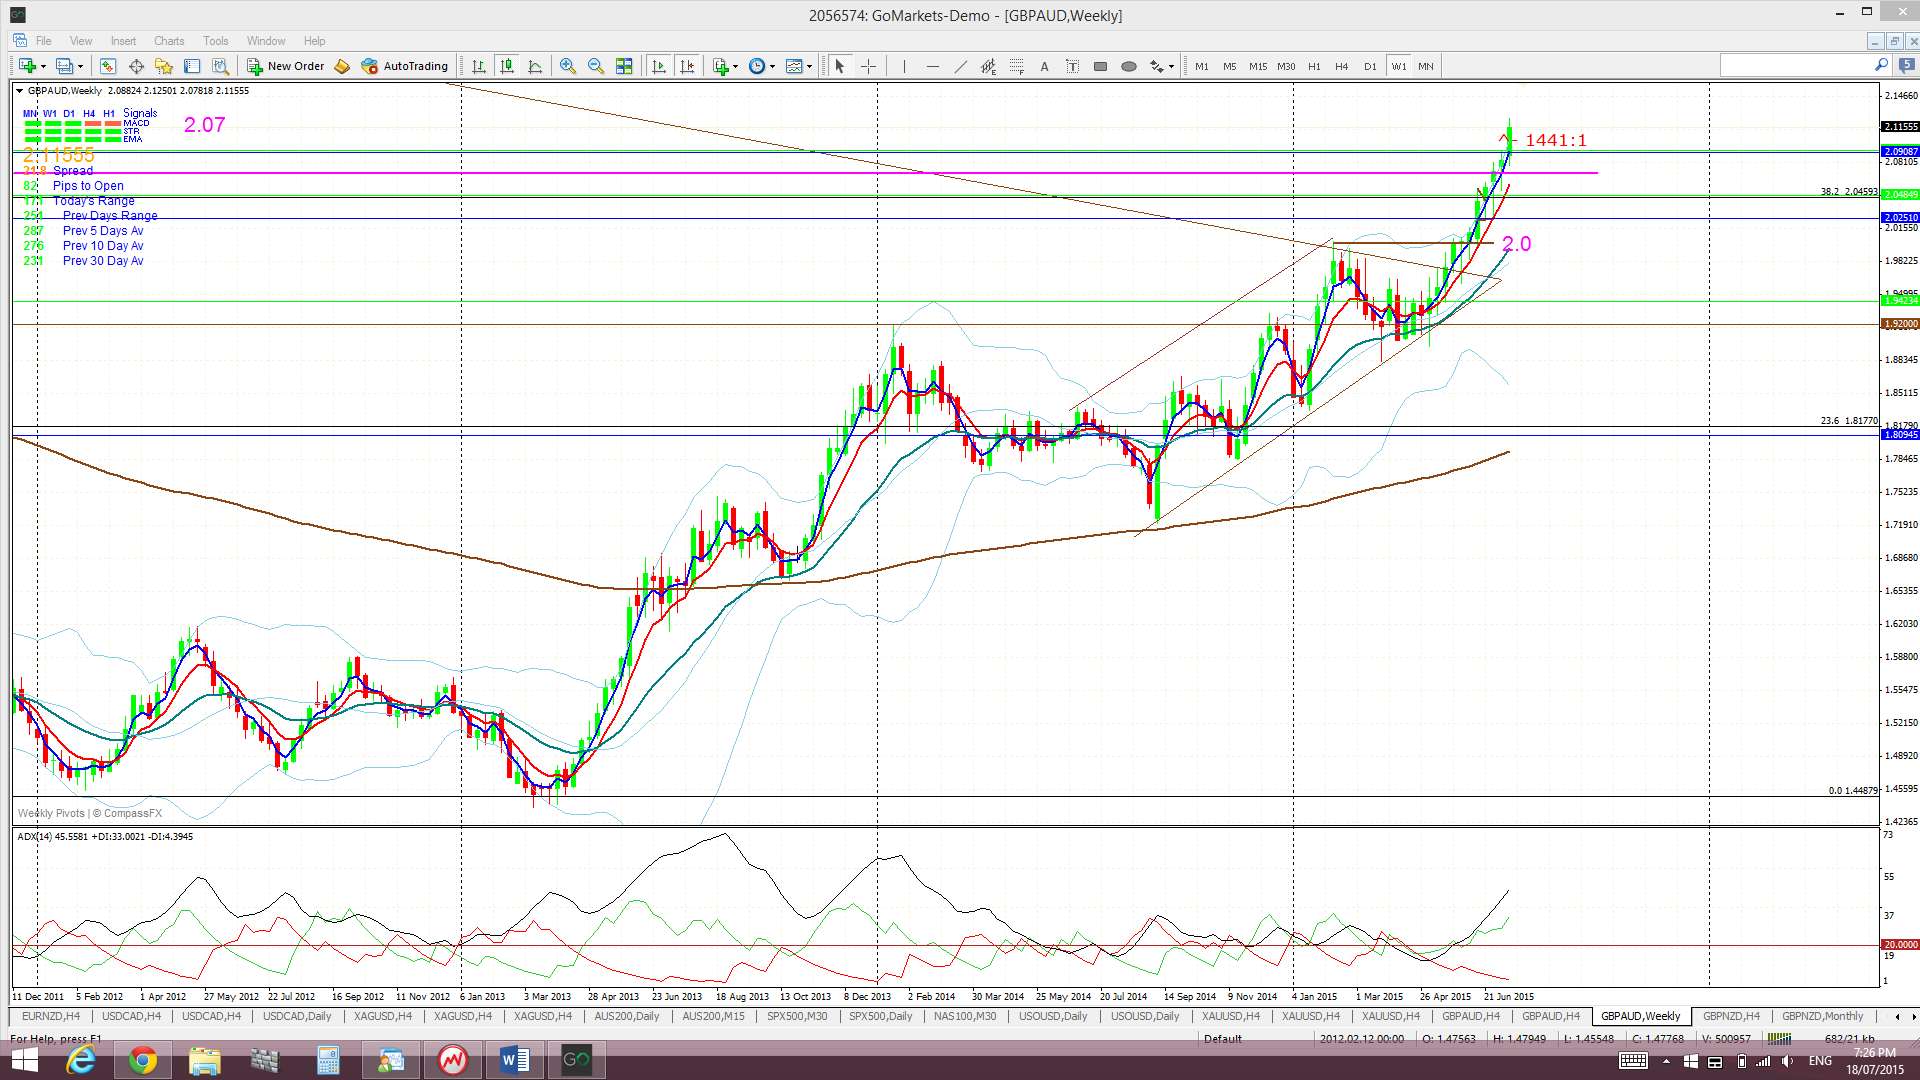
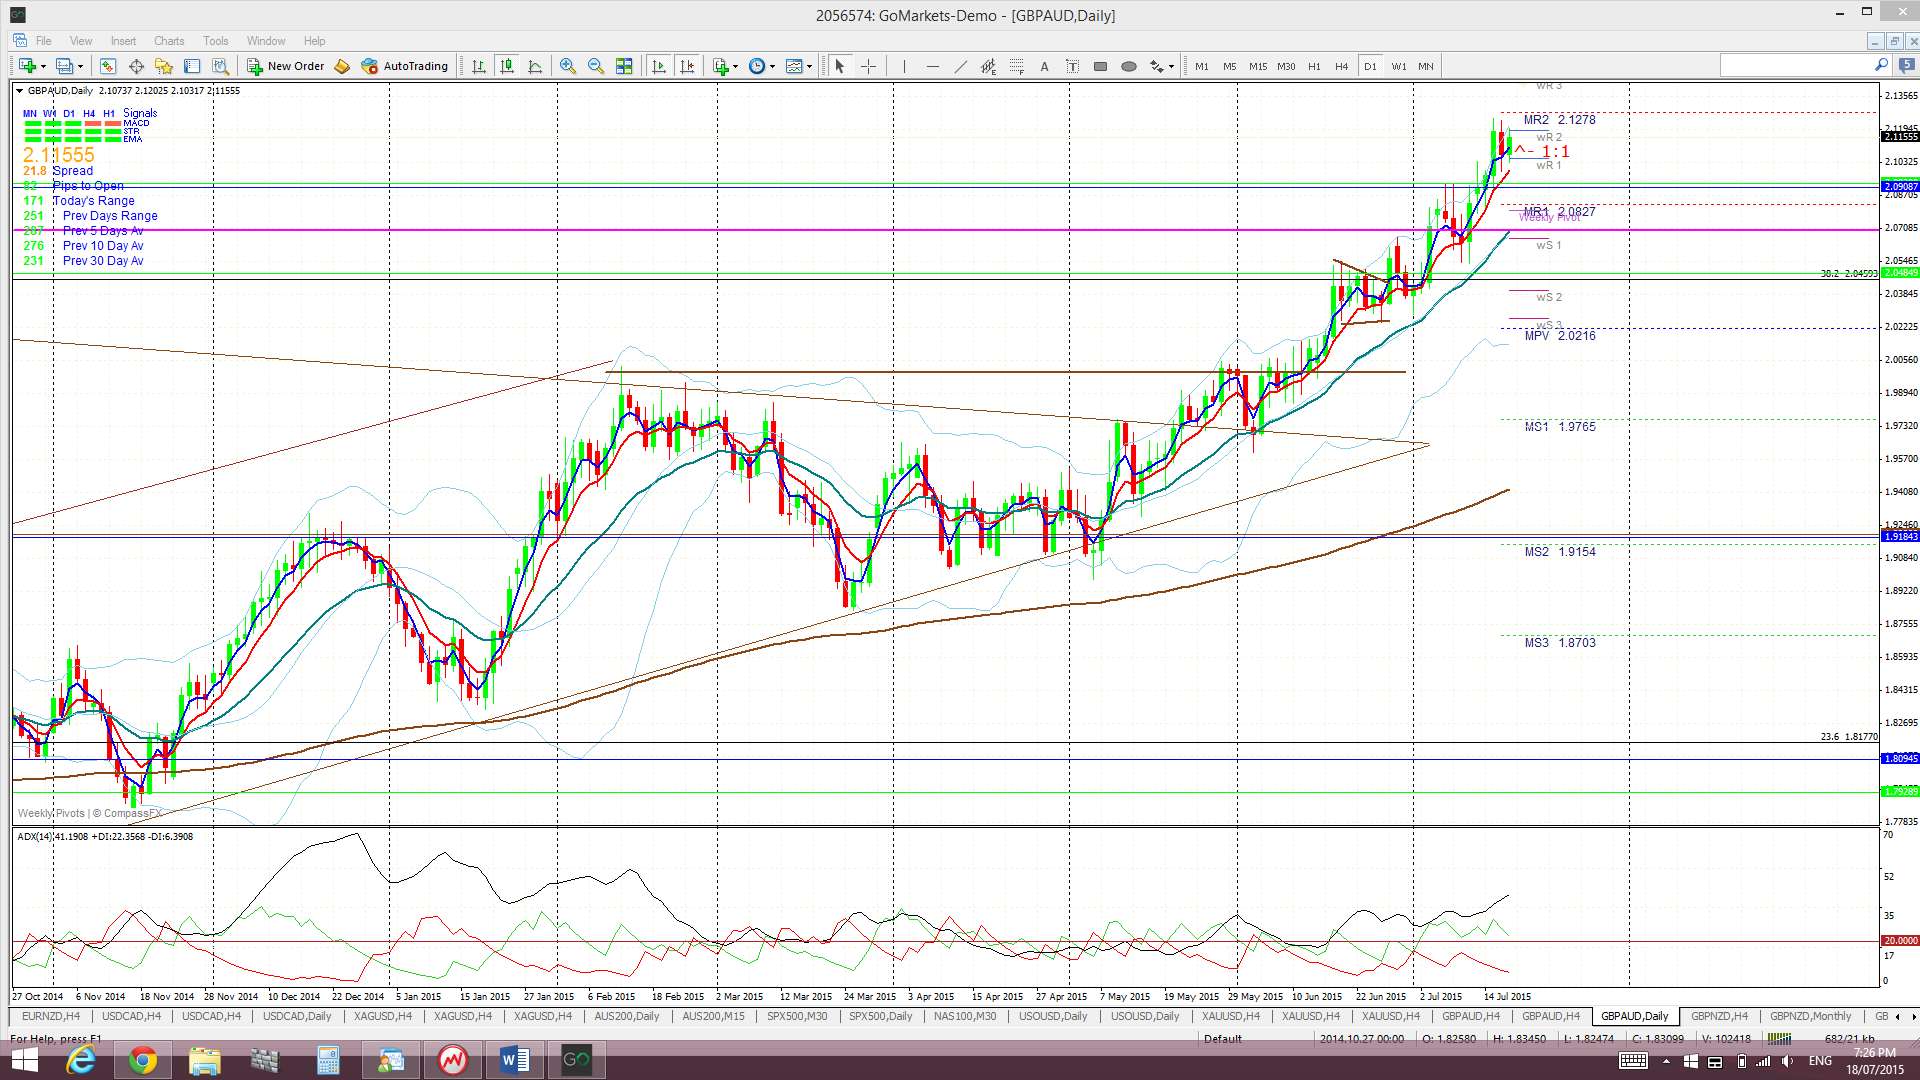
GBP/AUD: This pair is well past the resistance of the 2.07 level and is now negotiating the monthly 200 EMA.
It is some time before the monthly candle closes but I would not be surprised to see price pullback to test either the monthly 200 EMA or even 2.07 major S/R level after the July candle closes if, indeed, it close above these two key levels.
Price is still trading above the Ichimoku Cloud on the 4hr, daily, weekly and monthly charts.
The weekly candle closed as a bullish candle.
- I’m watching for any new TC signal on this pair and the 2.07 and monthly 200 EMA.

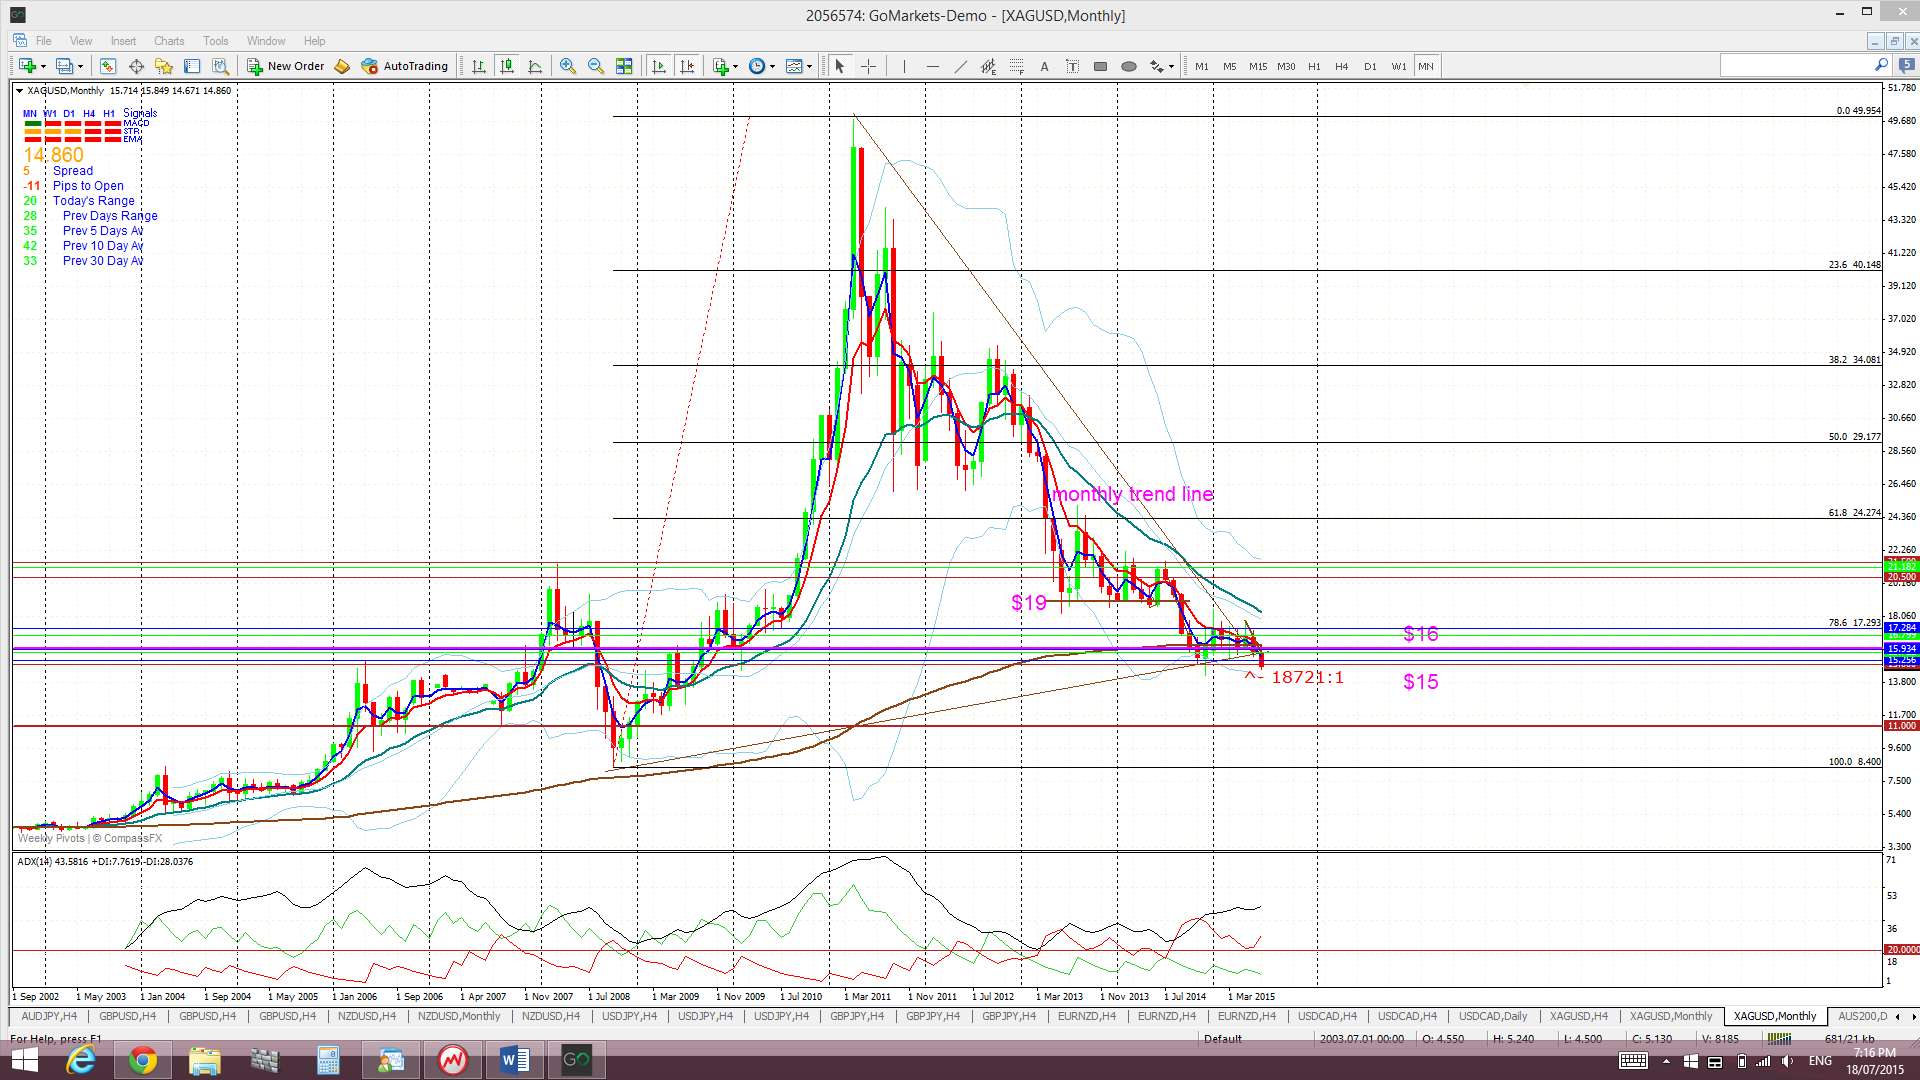
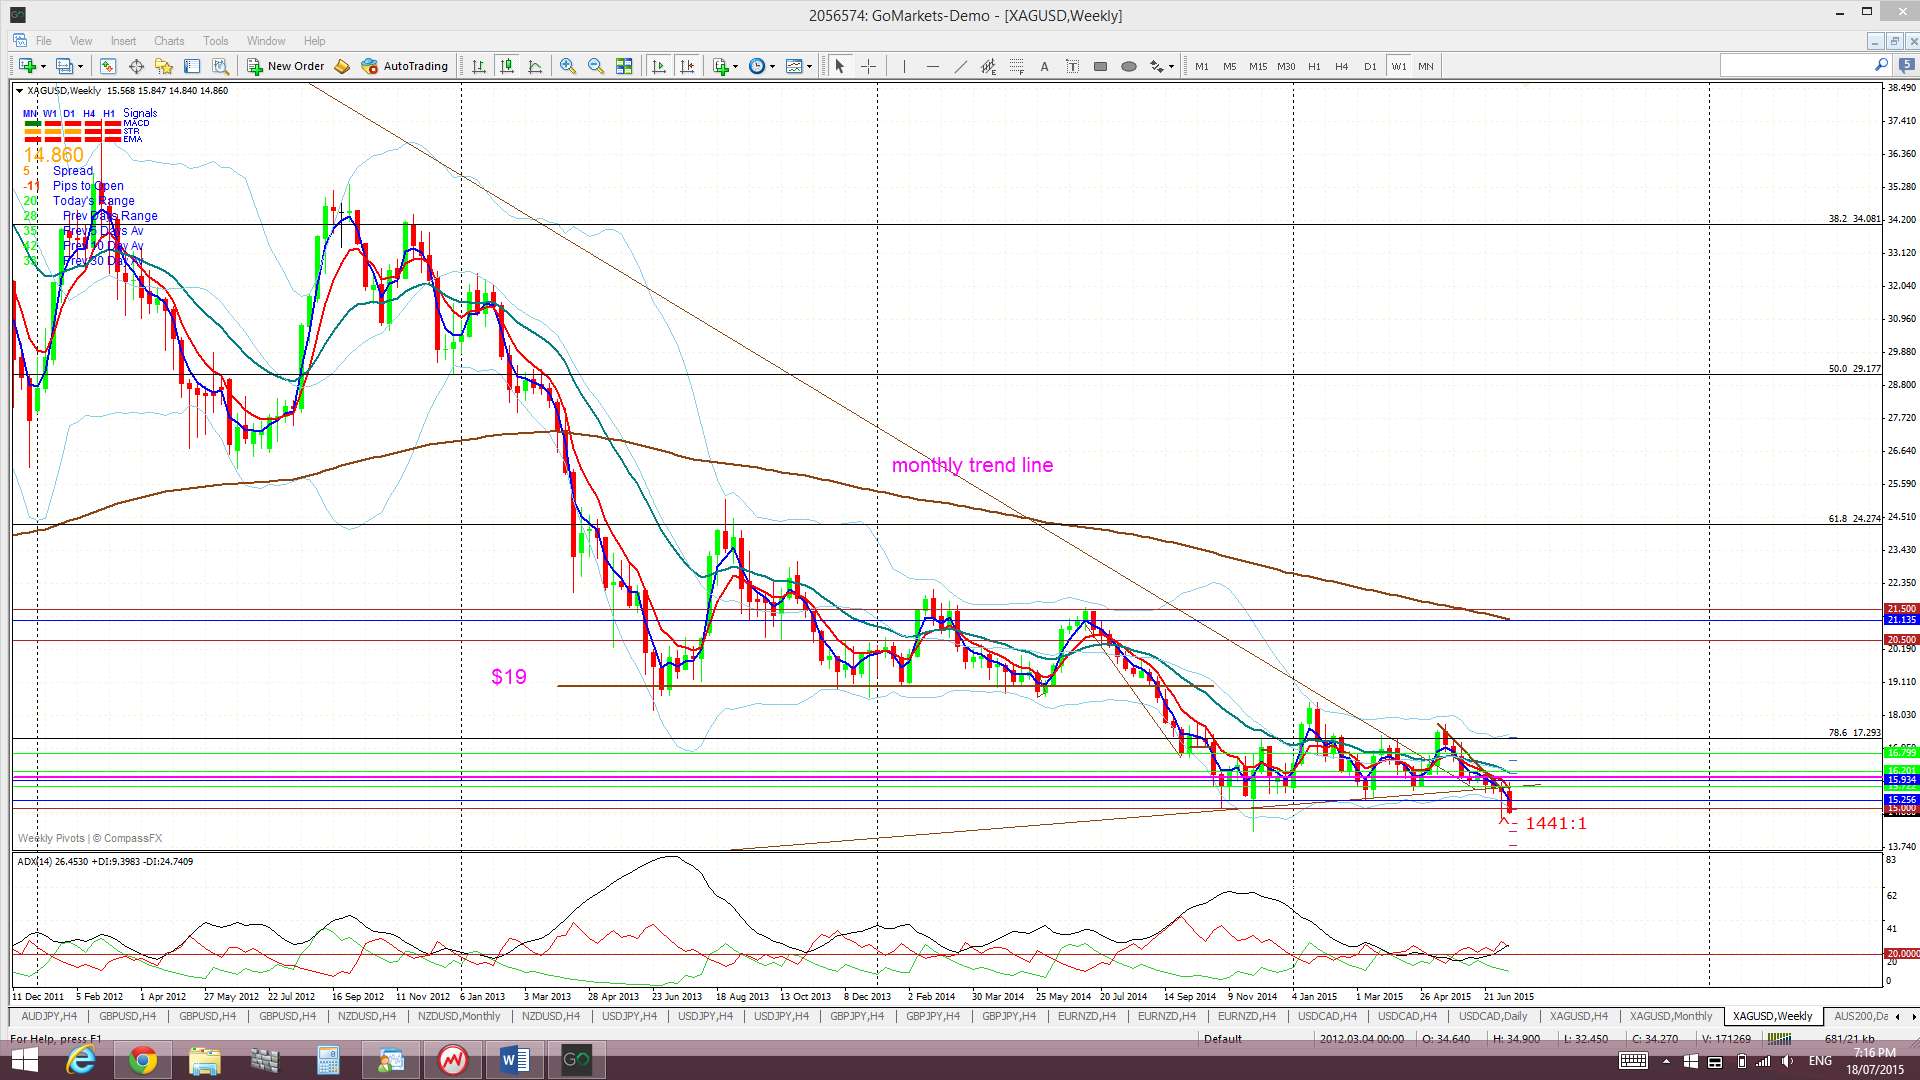
Silver: Recent US$ strength and resolution of the Greek debt crisis have combined to put pressure on both Silver and Gold. Silver spent the end of last week negotiating the $15 level but closed the week below this key support.
Silver is trading below the Cloud on the 4hr, daily, weekly and monthly charts.
The weekly candle closed as a bearish candle.
The weekly close below $15 is bearish and has brought the $11 and $9 levels into focus. The $11 is previous S/R and the $9 is near the 100% fib retracement.
The monthly candle doesn’t close for a couple of weeks yet but any monthly close below $15 would be very bearish. Conversely, support to see out the end of the month could be viewed as bullish. Thus, keep an eye on where this closes for July.
- I’m watching for any new TC signal and the $15, $11 and $9 levels.

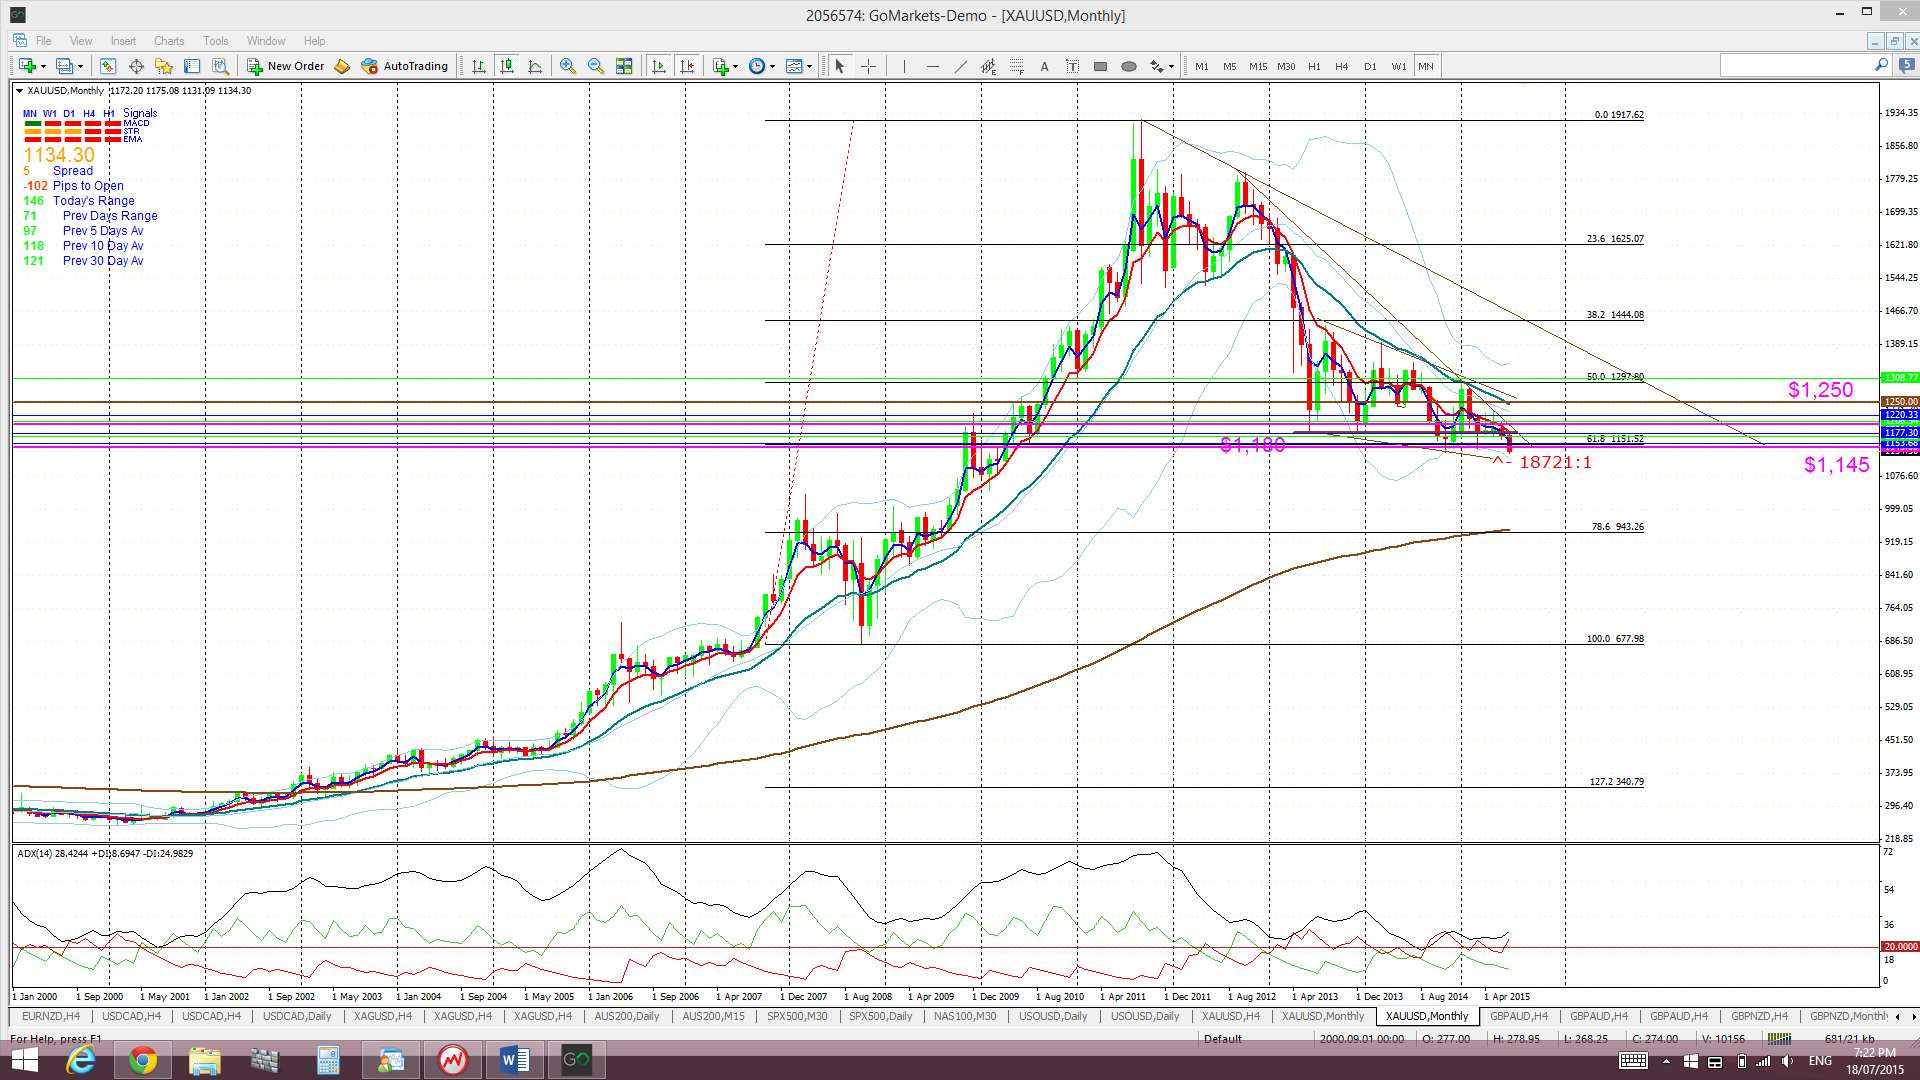
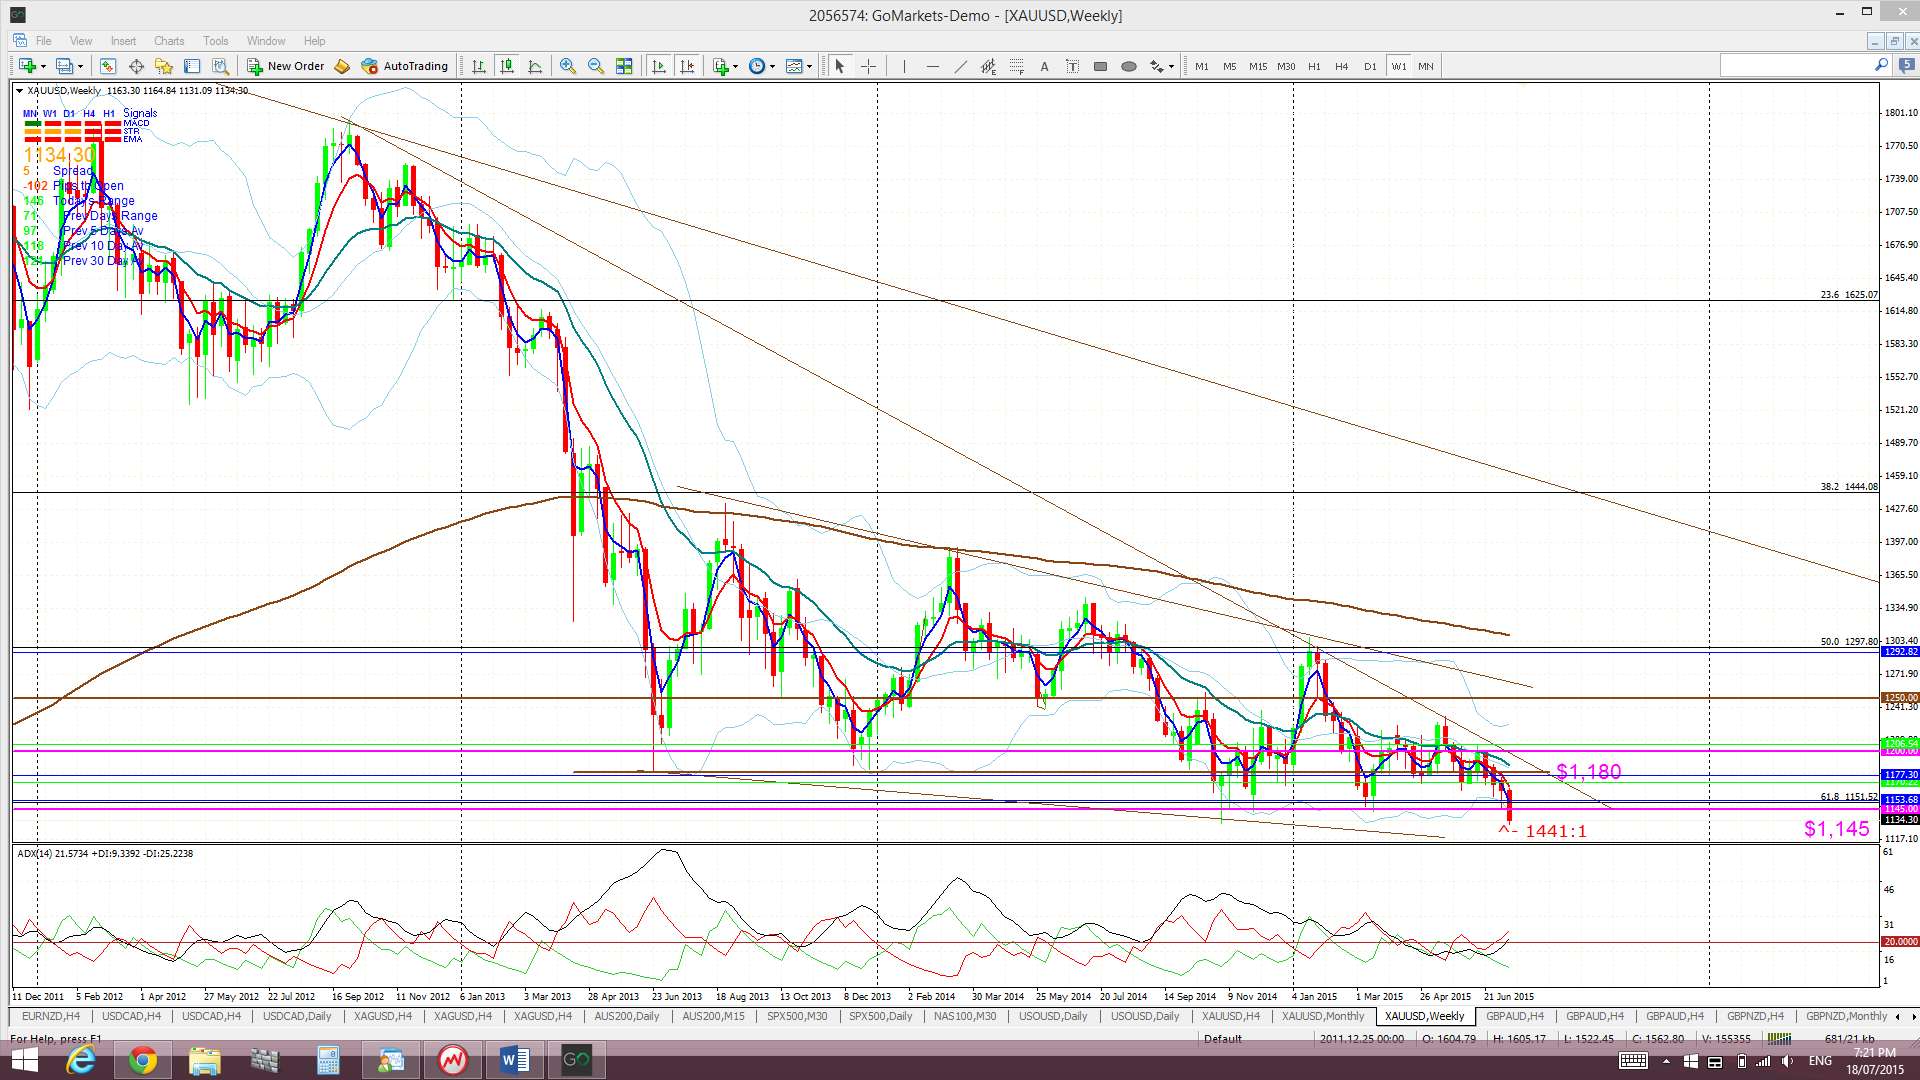
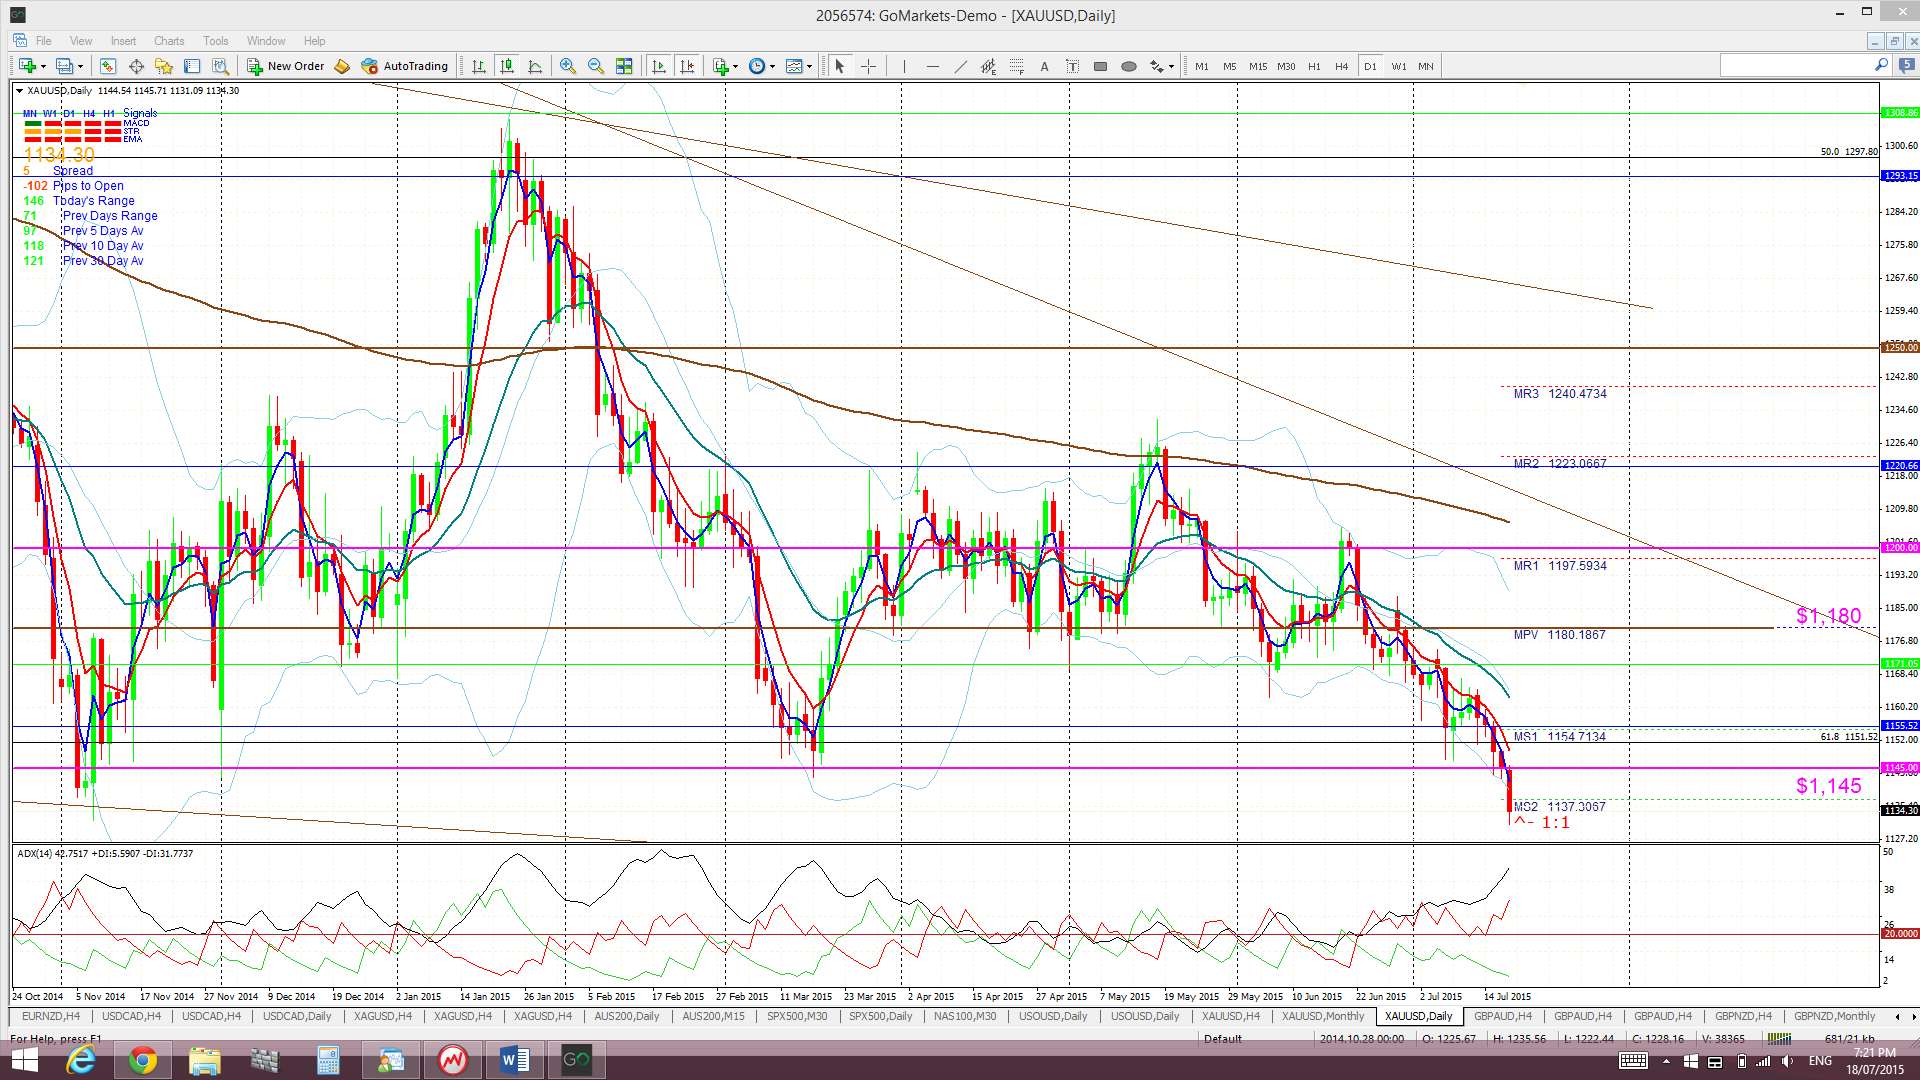
Gold: Like Silver, Gold has been hurt by US$ strength and spent the end of last week negotiating major $1,145 support. It wasn’t able to hold this support though and closed the week below $1,145.
The daily, weekly and monthly charts show how Gold has really just chopped sideways above this 61.8% fib support for the last 2 ½ years but this recent move with the US$ has punished Gold.
Any hold below $1,145 would suggest that a deeper pull back could be in store. Bearish targets below $1,145 include the $1,000 psychological level and, then, the 78.6% fib near $950.
Gold is trading below the Cloud on the 4hr, daily, weekly and monthly charts.
Similar for Silver, the monthly candle doesn’t close for a couple of weeks but any monthly close below $1,145 would be very bearish. Conversely, support here to see out the end of the month could be viewed as bullish. Thus, keep an eye on where this closes for July.
The weekly candle closed as a bearish candle.
- I’m watching for any new TC signal, the $1,145 level, $1,000 and $950 levels.
The post US$ strength: the new normal? appeared first on www.forextell.com.