USDX
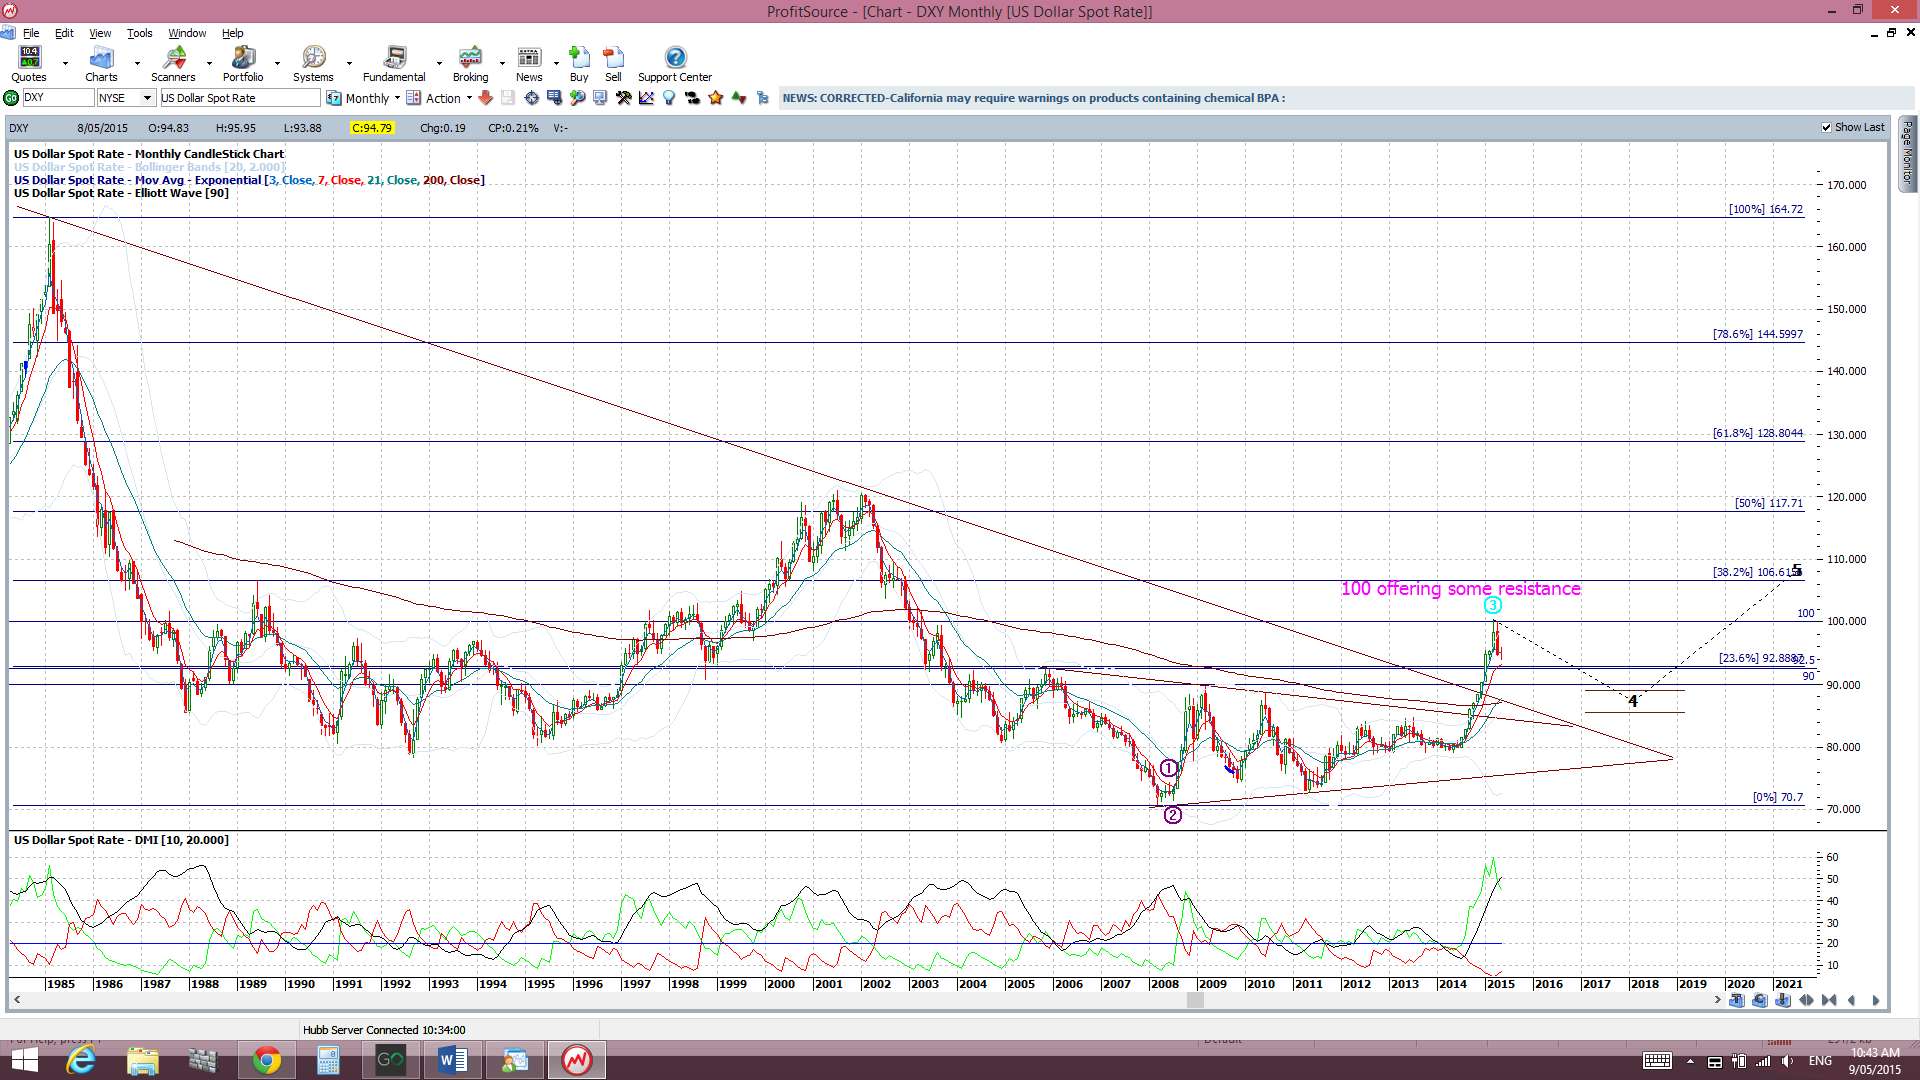
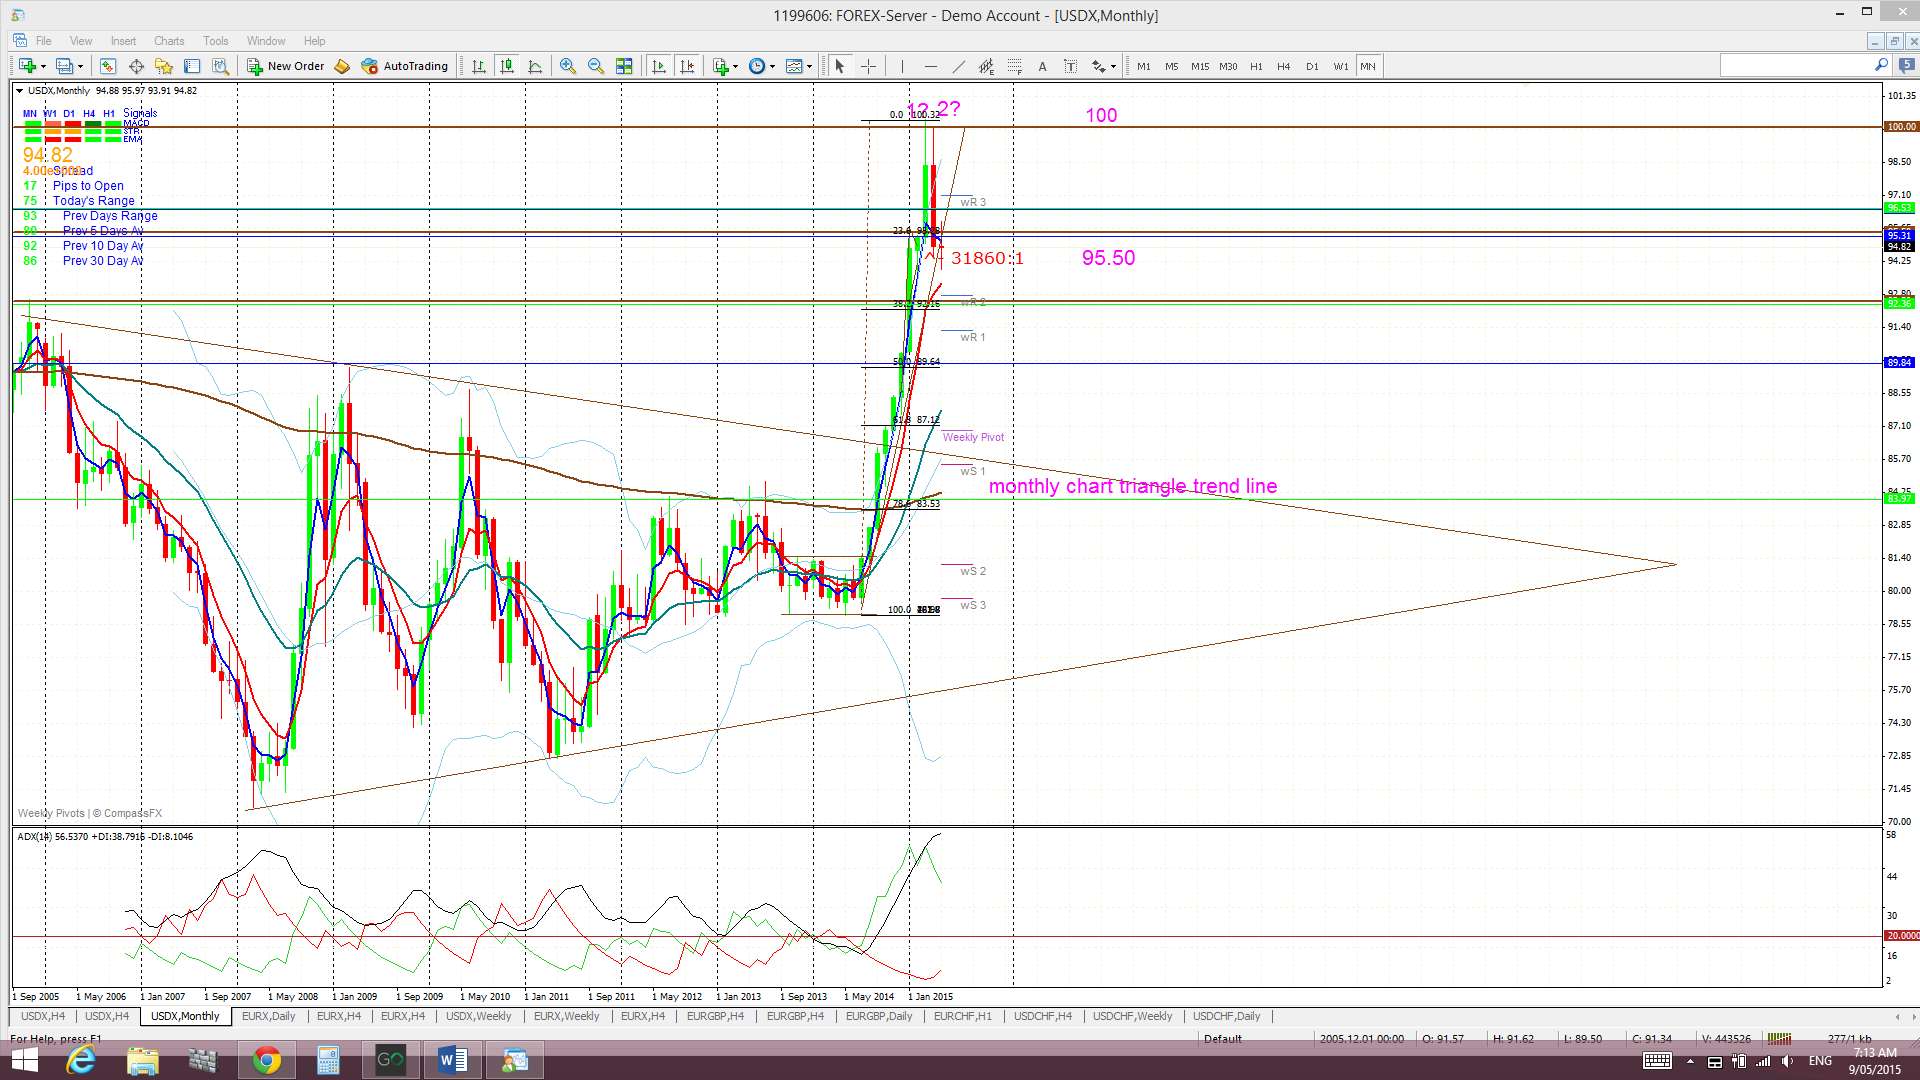
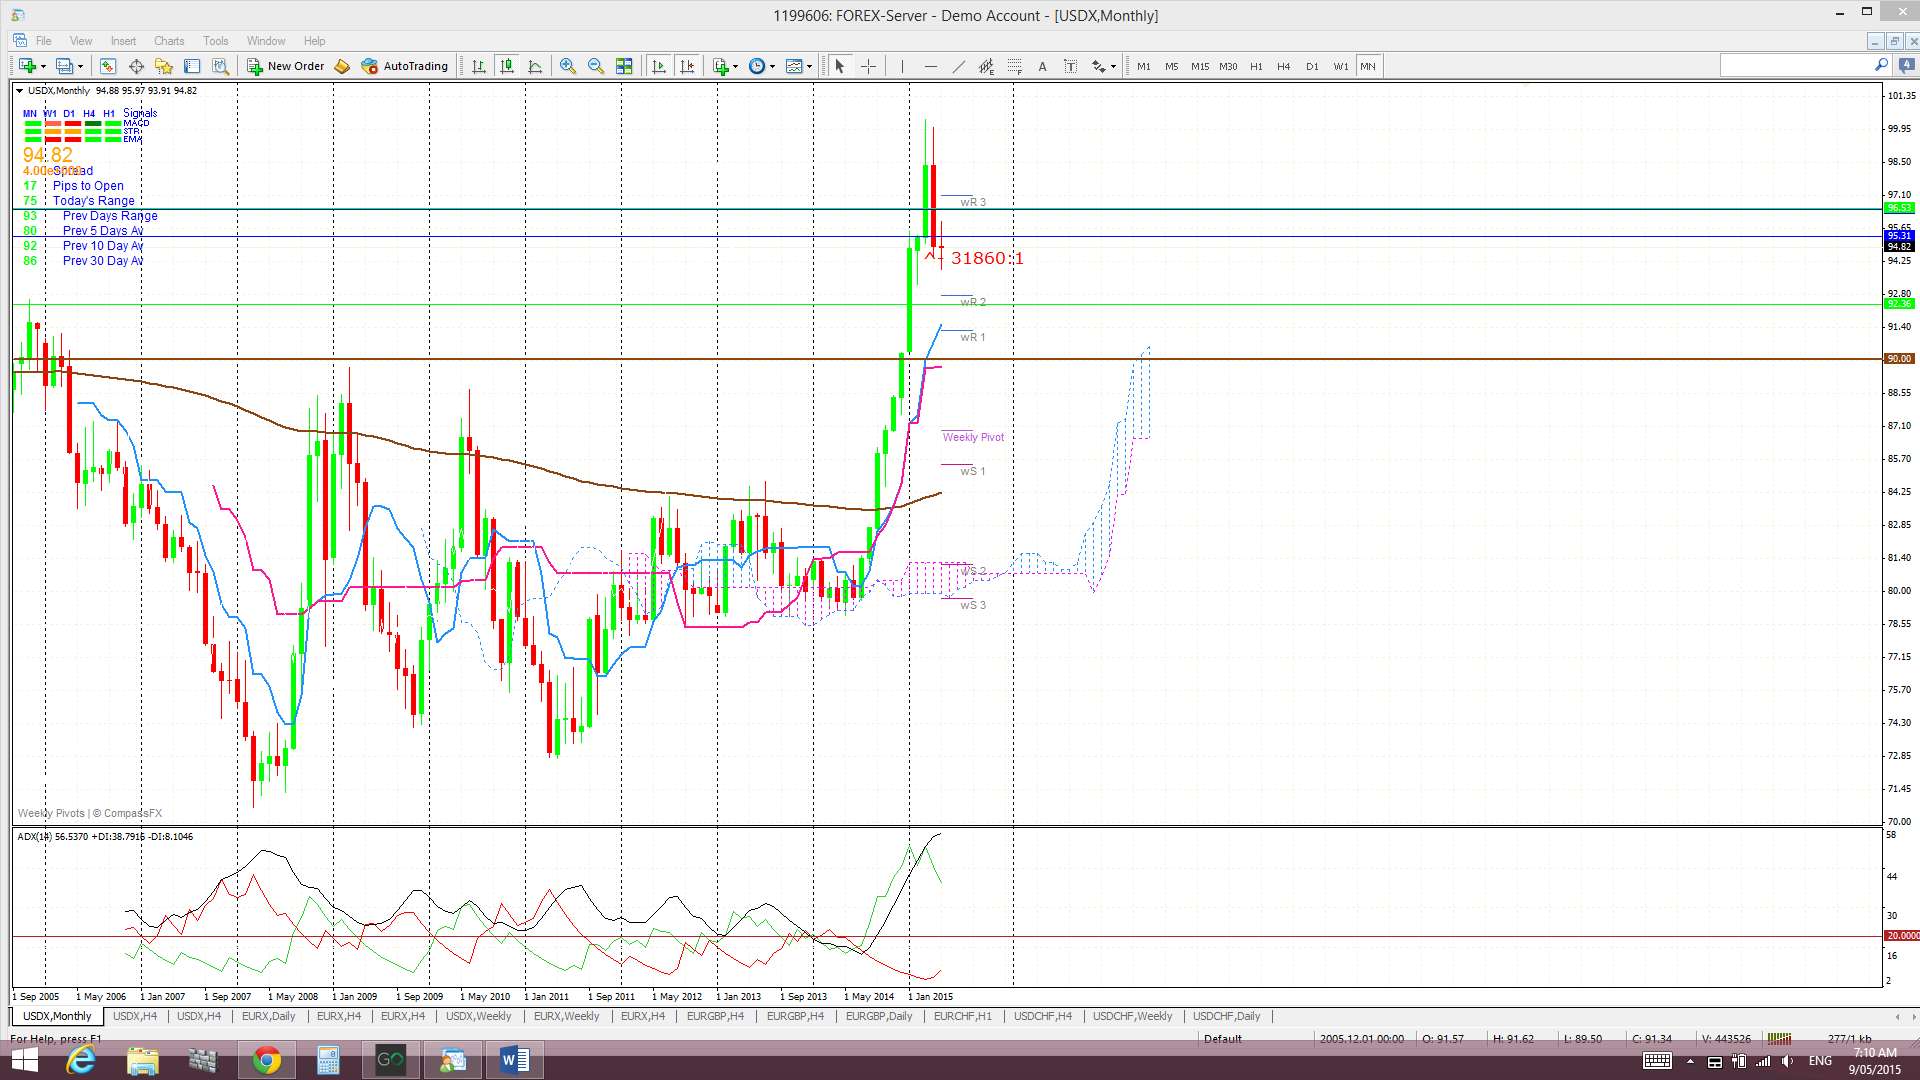
Monthly: The new May candle is currently printing a bearish coloured Doji candle. This follows on from the first bearish candle in April for 9 months. The 100 level is still proving to be some resistance.
Monthly Ichimoku: The May candle is trading above the Cloud.
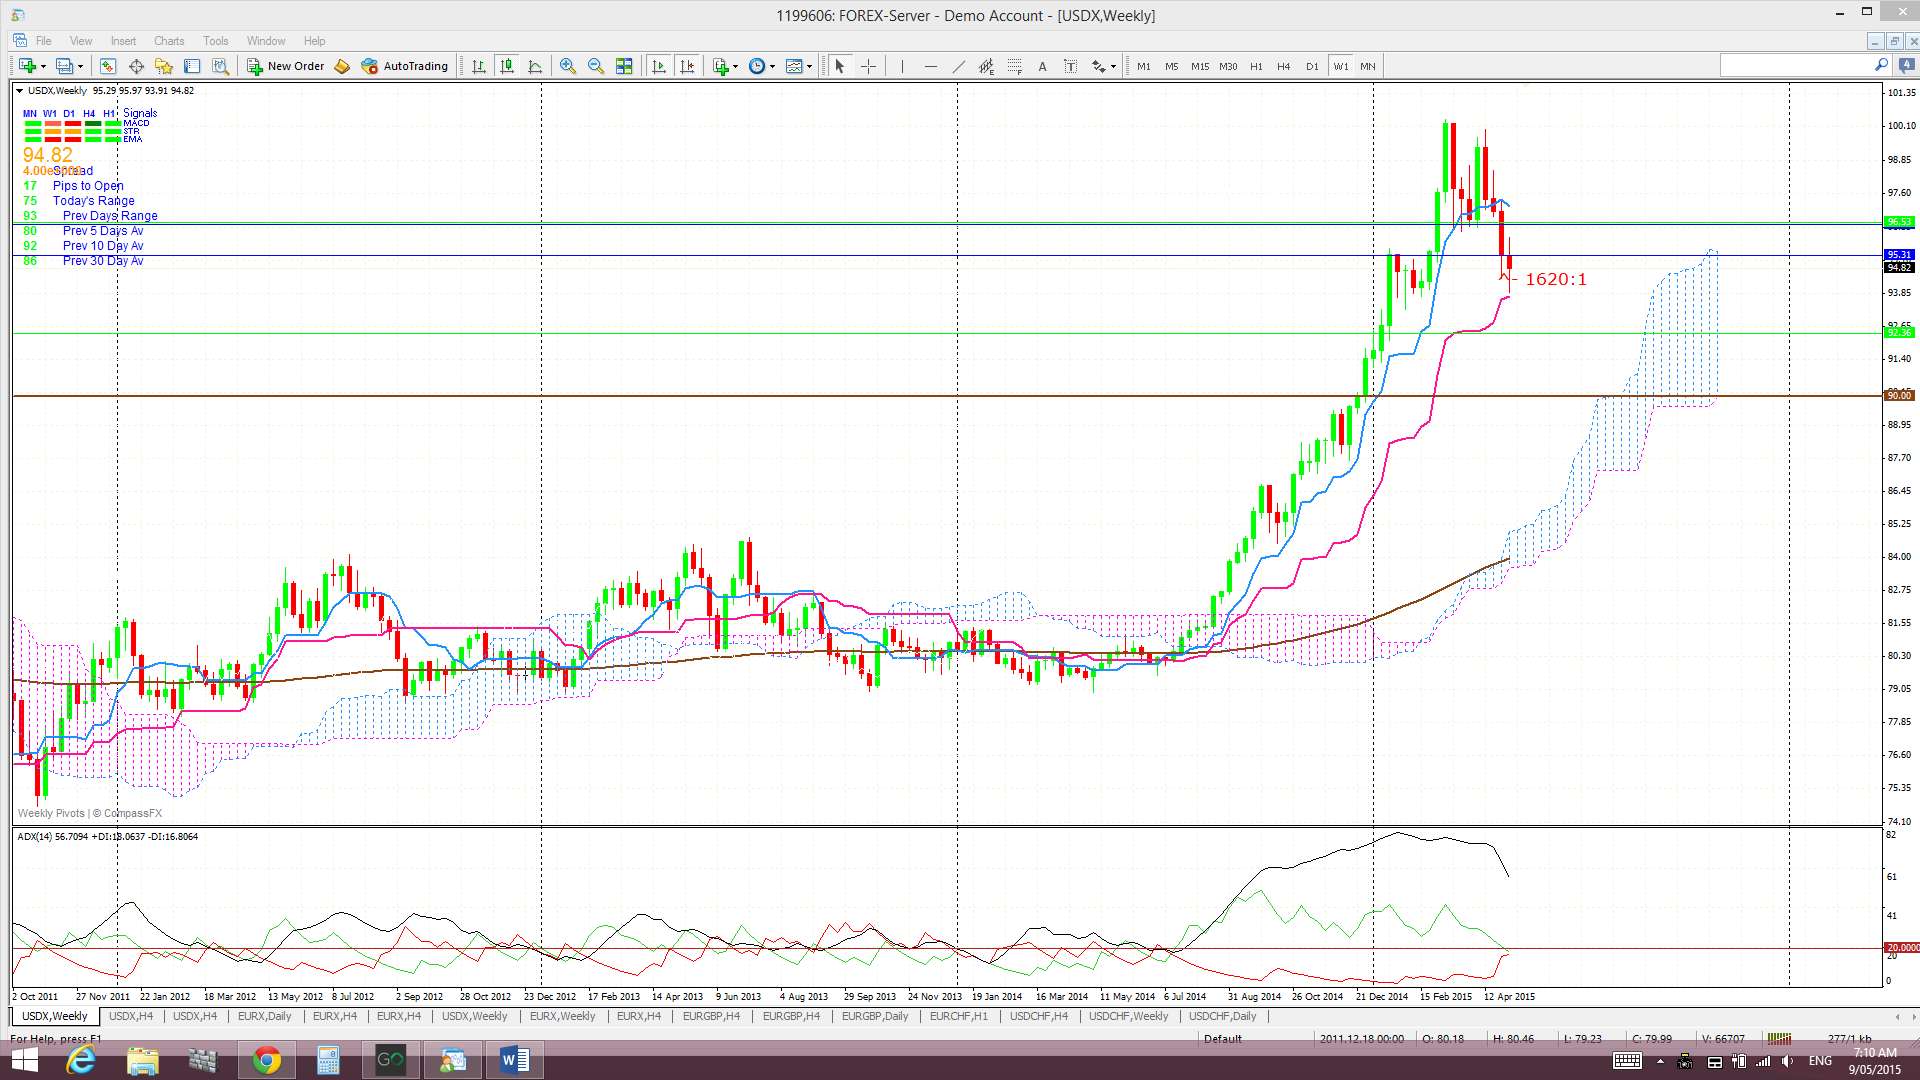
Weekly: Last week’s candle closed as a bearish coloured ‘Spinning Top’ candle and still below the Double Top ‘neck line’. Technically, the ‘neck line’ of this ‘Double Top’ was closer to 96.50 but I was more focused on the S/R region of 95.50. Either way, both levels remain broken. The recent support trend line has held price up for now and remains the level to watch in coming sessions but is helping to keep the index in no-man’s land here, neither up nor down! It is worth remembering that a 61.8% fib pull back of this lengthy US$ rally would bring price down to near the previous monthly-chart triangle breakout region.
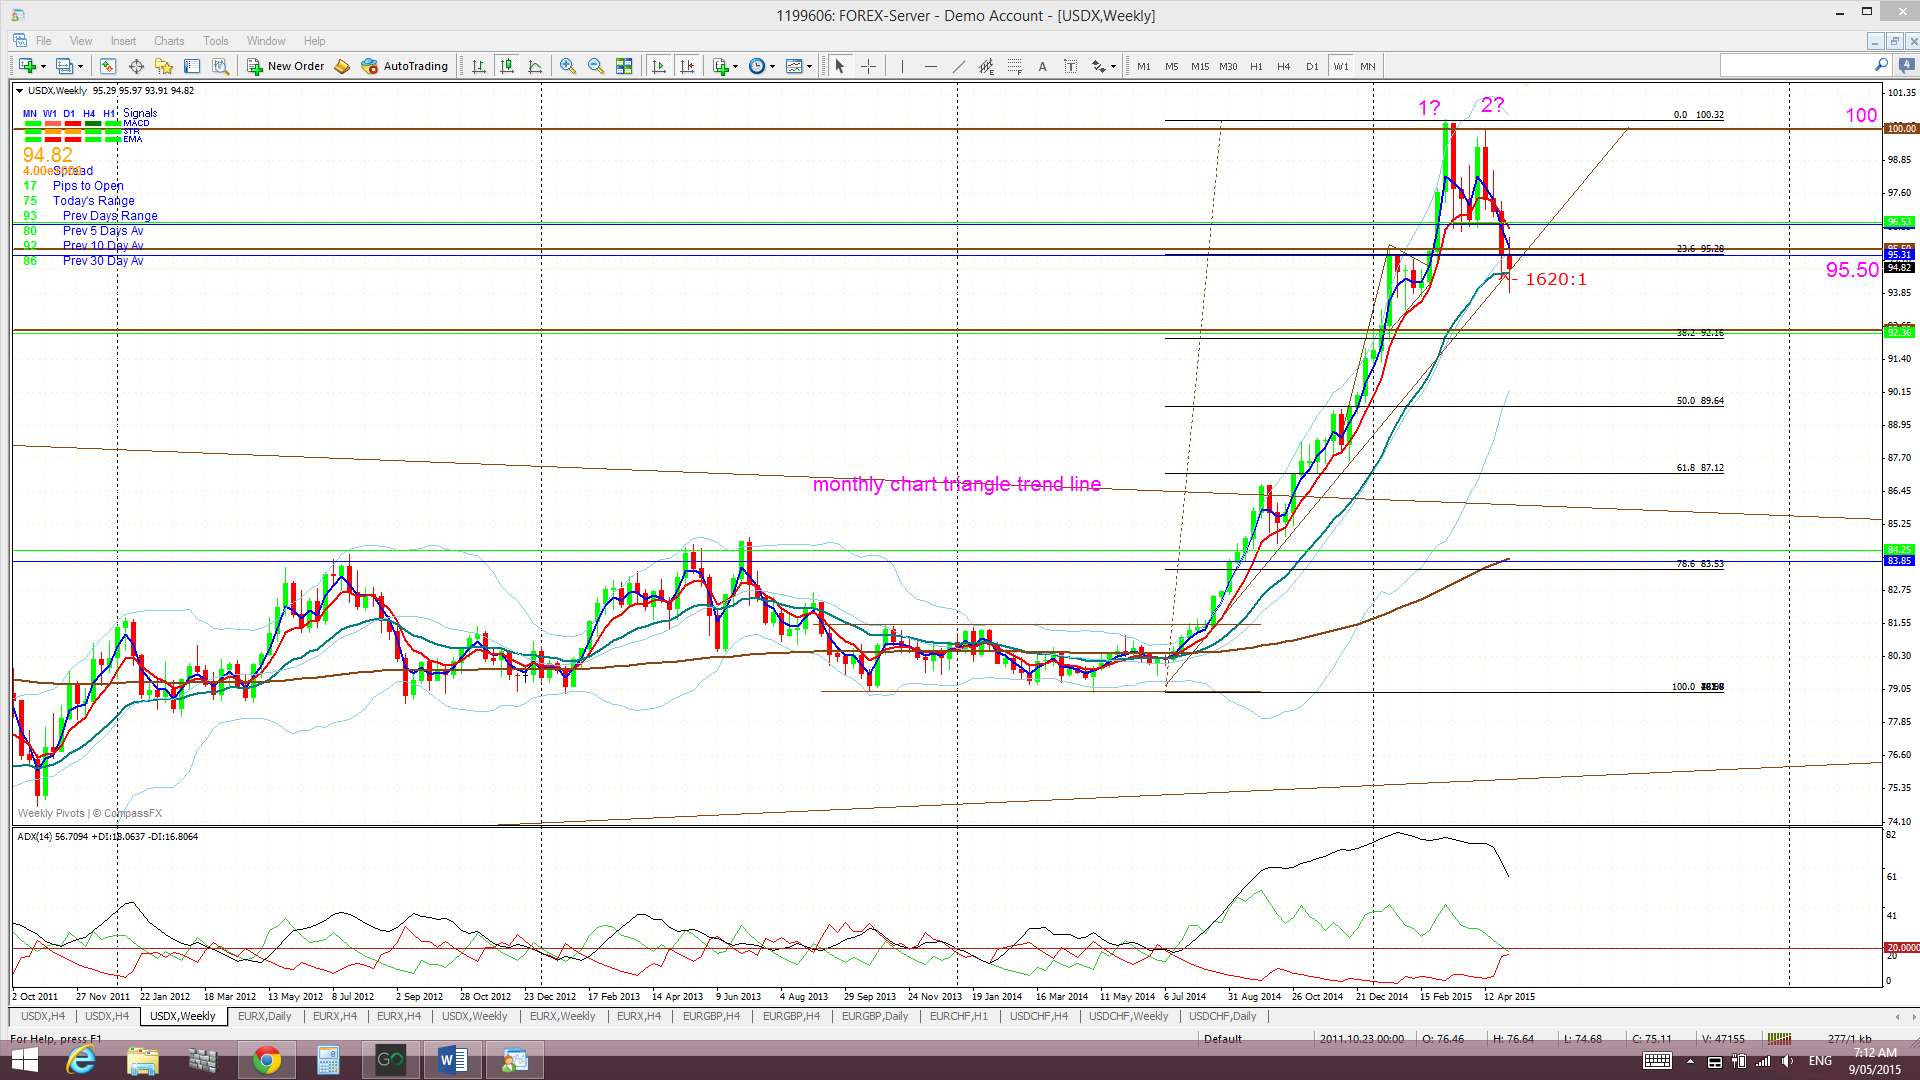
Weekly Ichimoku: The weekly candle closed ABOVE the weekly Cloud.
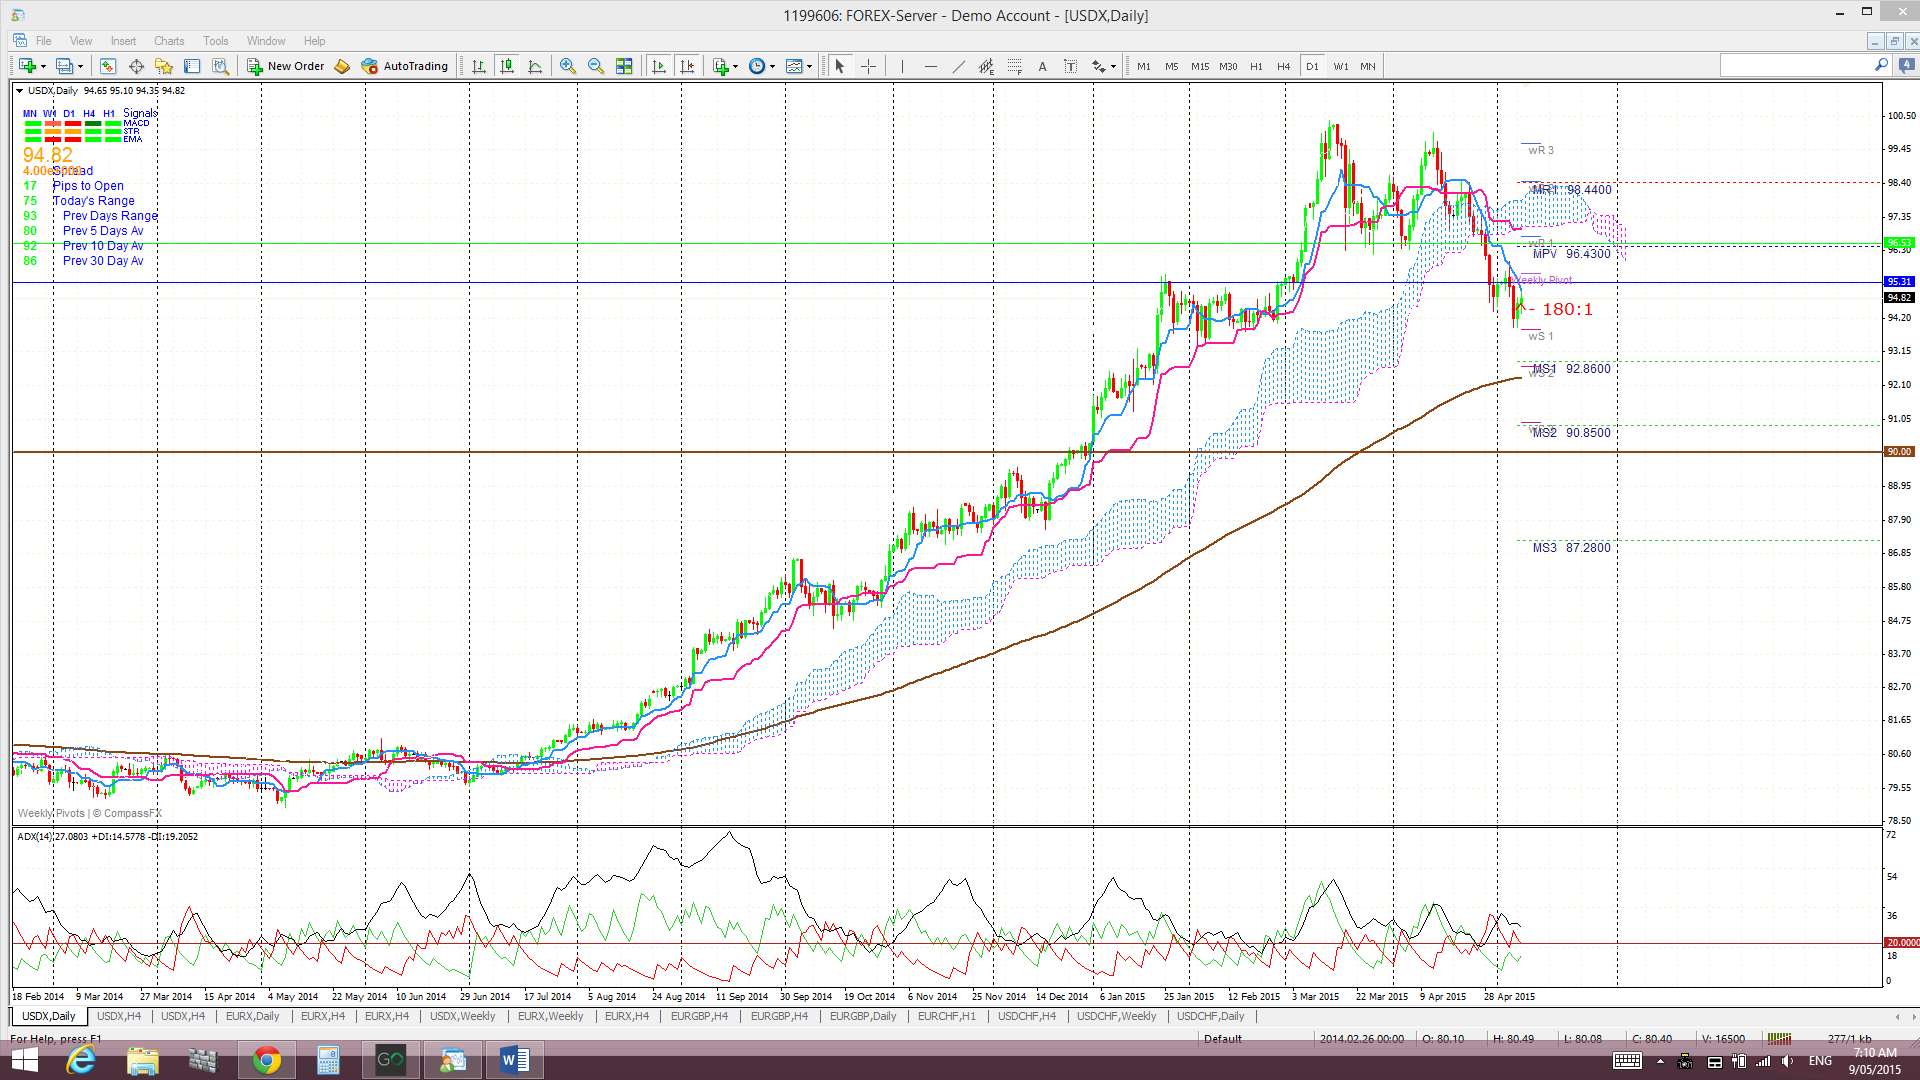
Daily: Price chopped lower last week. The 100 level remains as resistance above current price and has formed a ‘Double Top’ region. The daily support trend line remains intact for now though. A break of this support trend line would help form the Double Top and also conform to a Bull Market Truncation outcome:


Daily Ichimoku Cloud chart: Price remains below the Cloud and the bearish Tenkan/Kijun cross remains open.
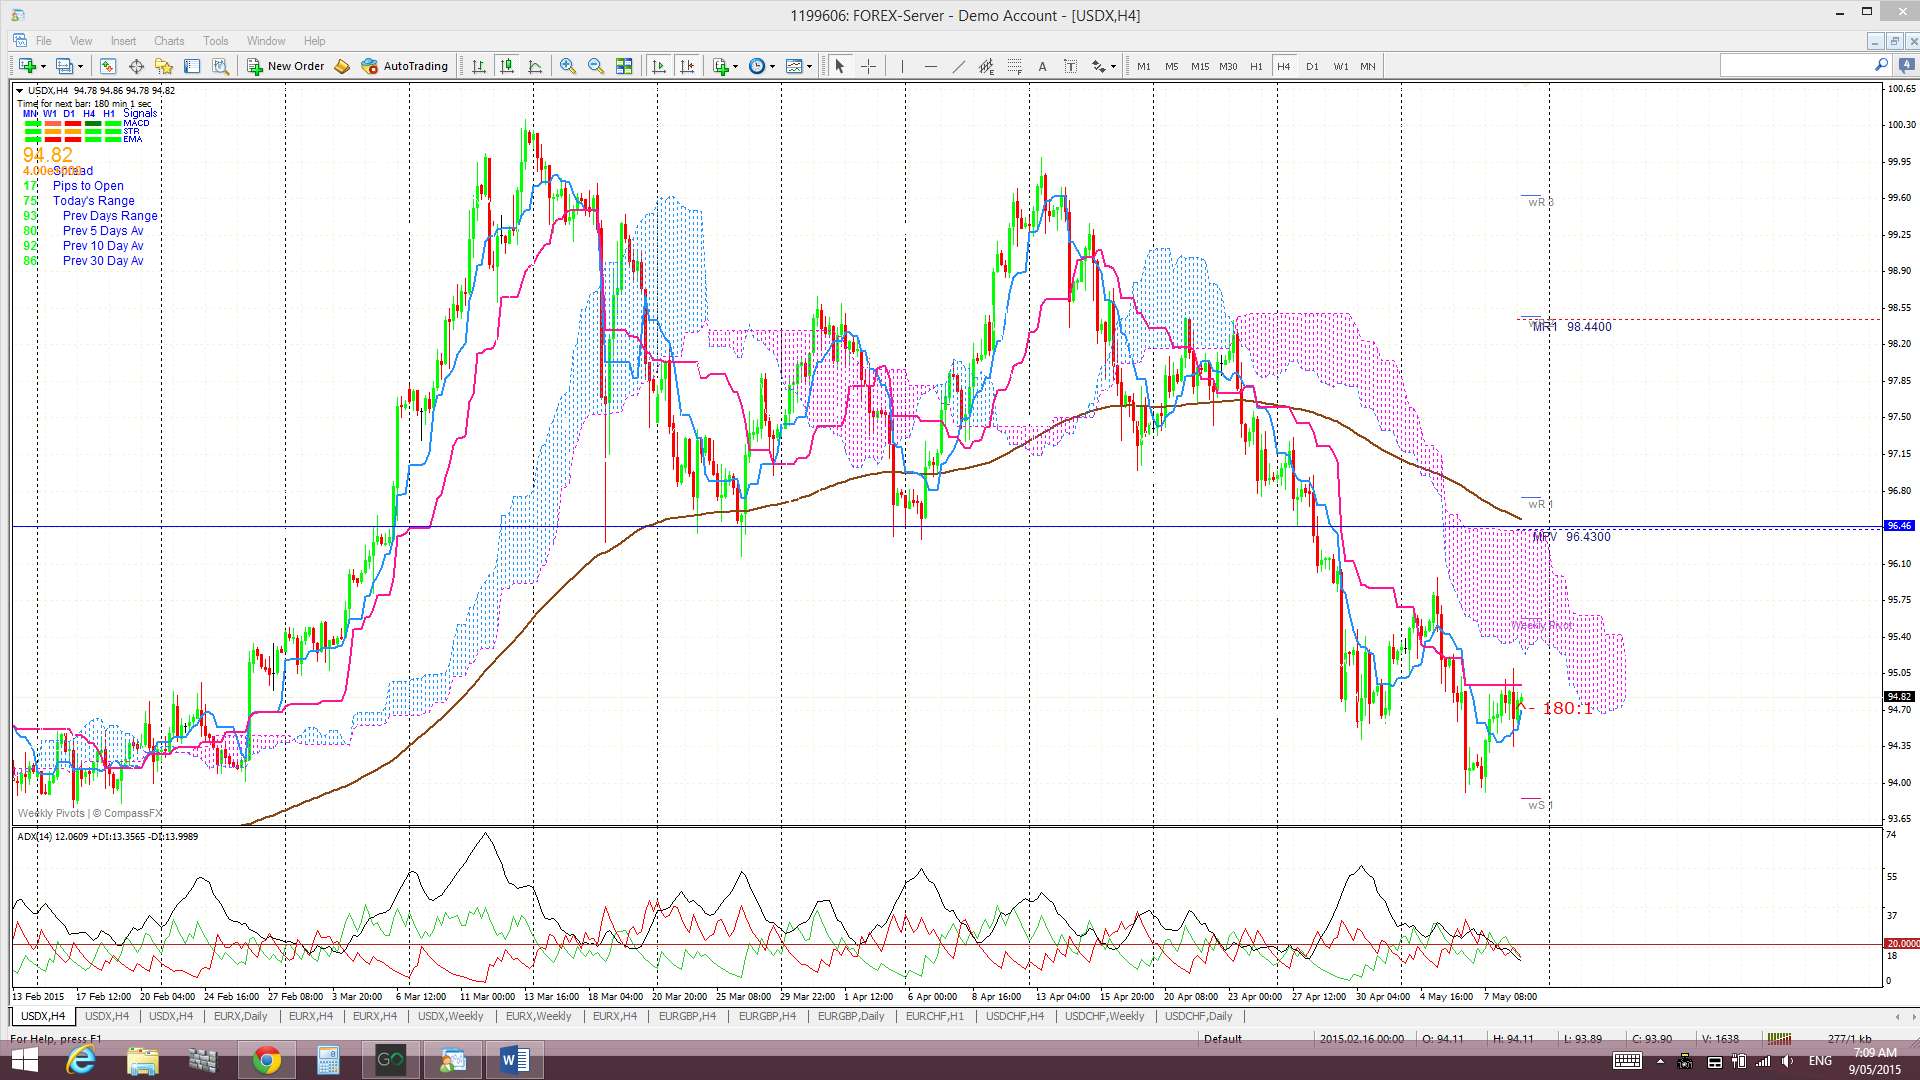
4hr: Price chopped lower last week and, although bouncing off trend line support, it has held below 96.50 and 95.50 support. These previous support levels will now form new resistance though. A continued hold below 95.50 would suggest we could be in for more of a pullback but we would need to see the trend line broken first.
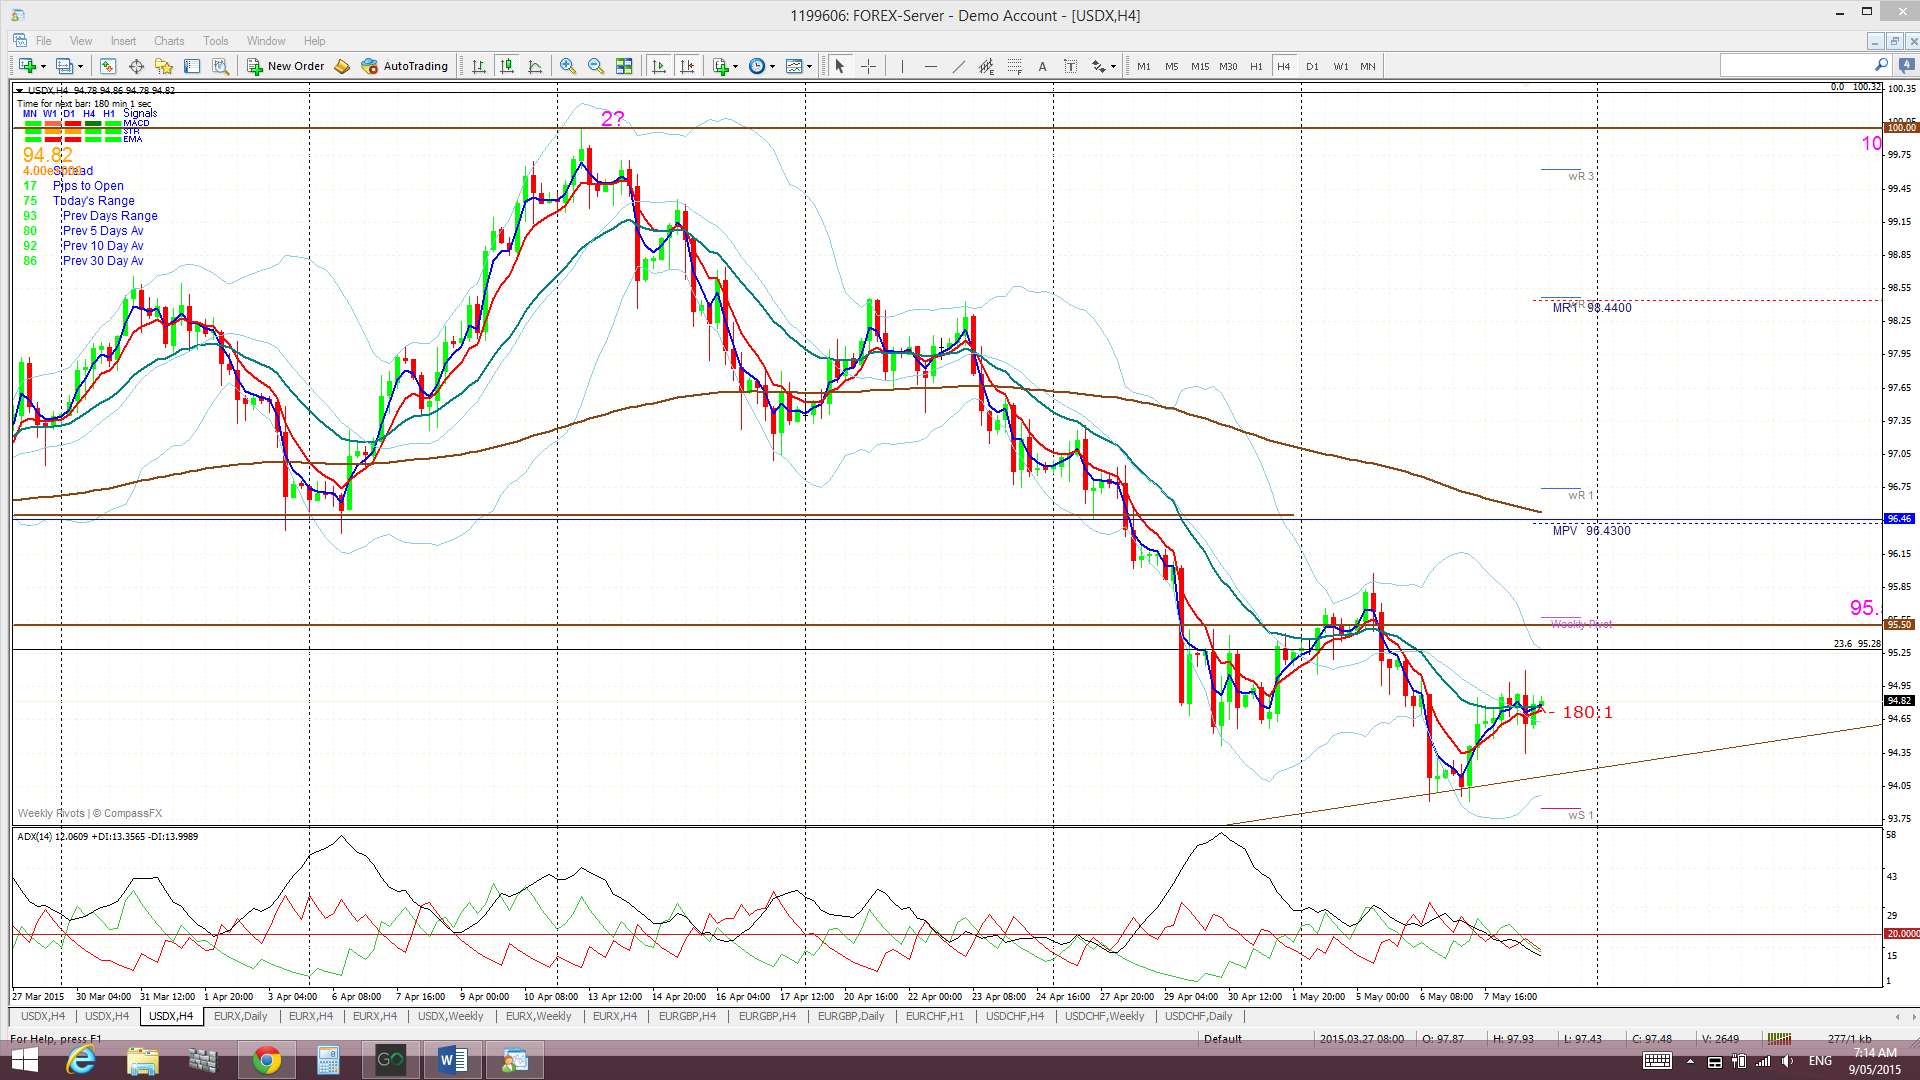
4hr Ichimoku Cloud chart: Price traded below the 4 hr Cloud for all of last week. This chart is aligned with the daily chart and suggests SHORT USD.
EURX
Monthly: The new May candle is currently printing a small bearish candle with a long upper shadow.
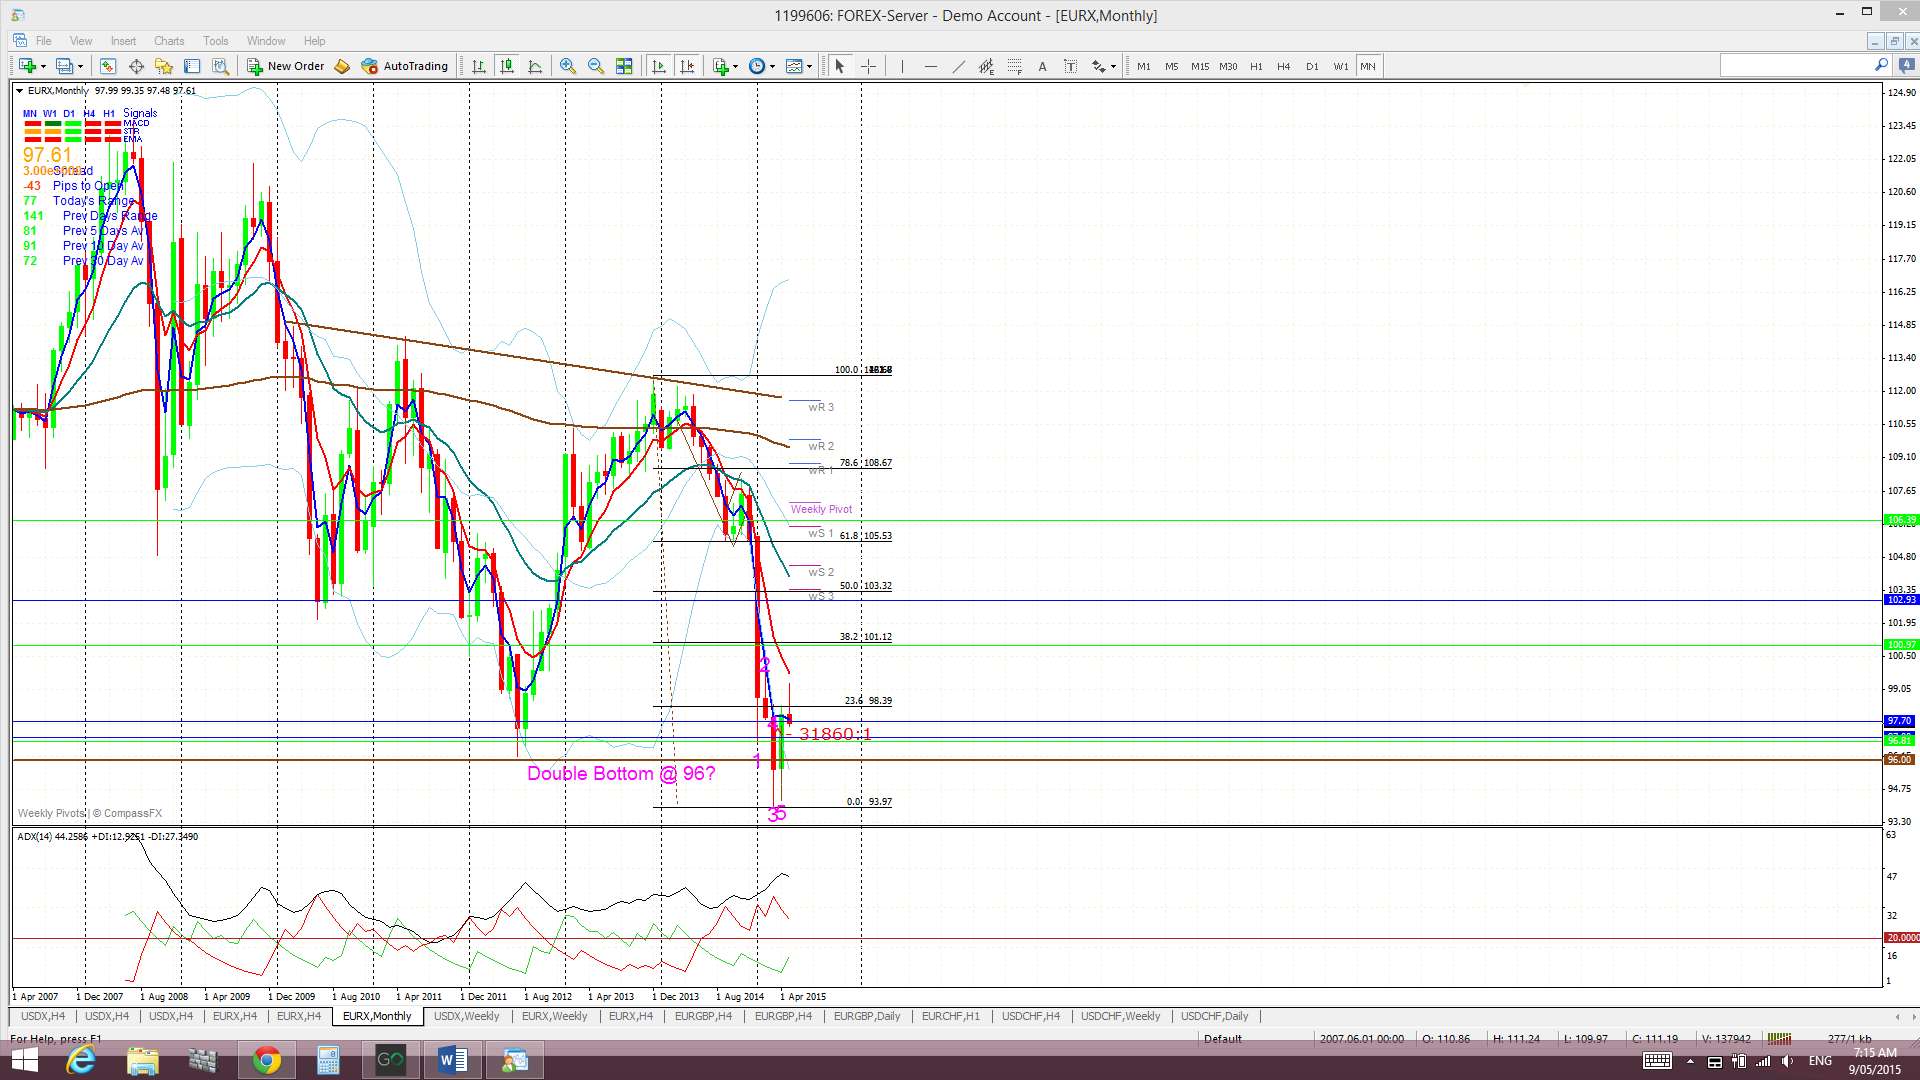
Monthly Ichimoku: The May candle is trading below the Cloud.

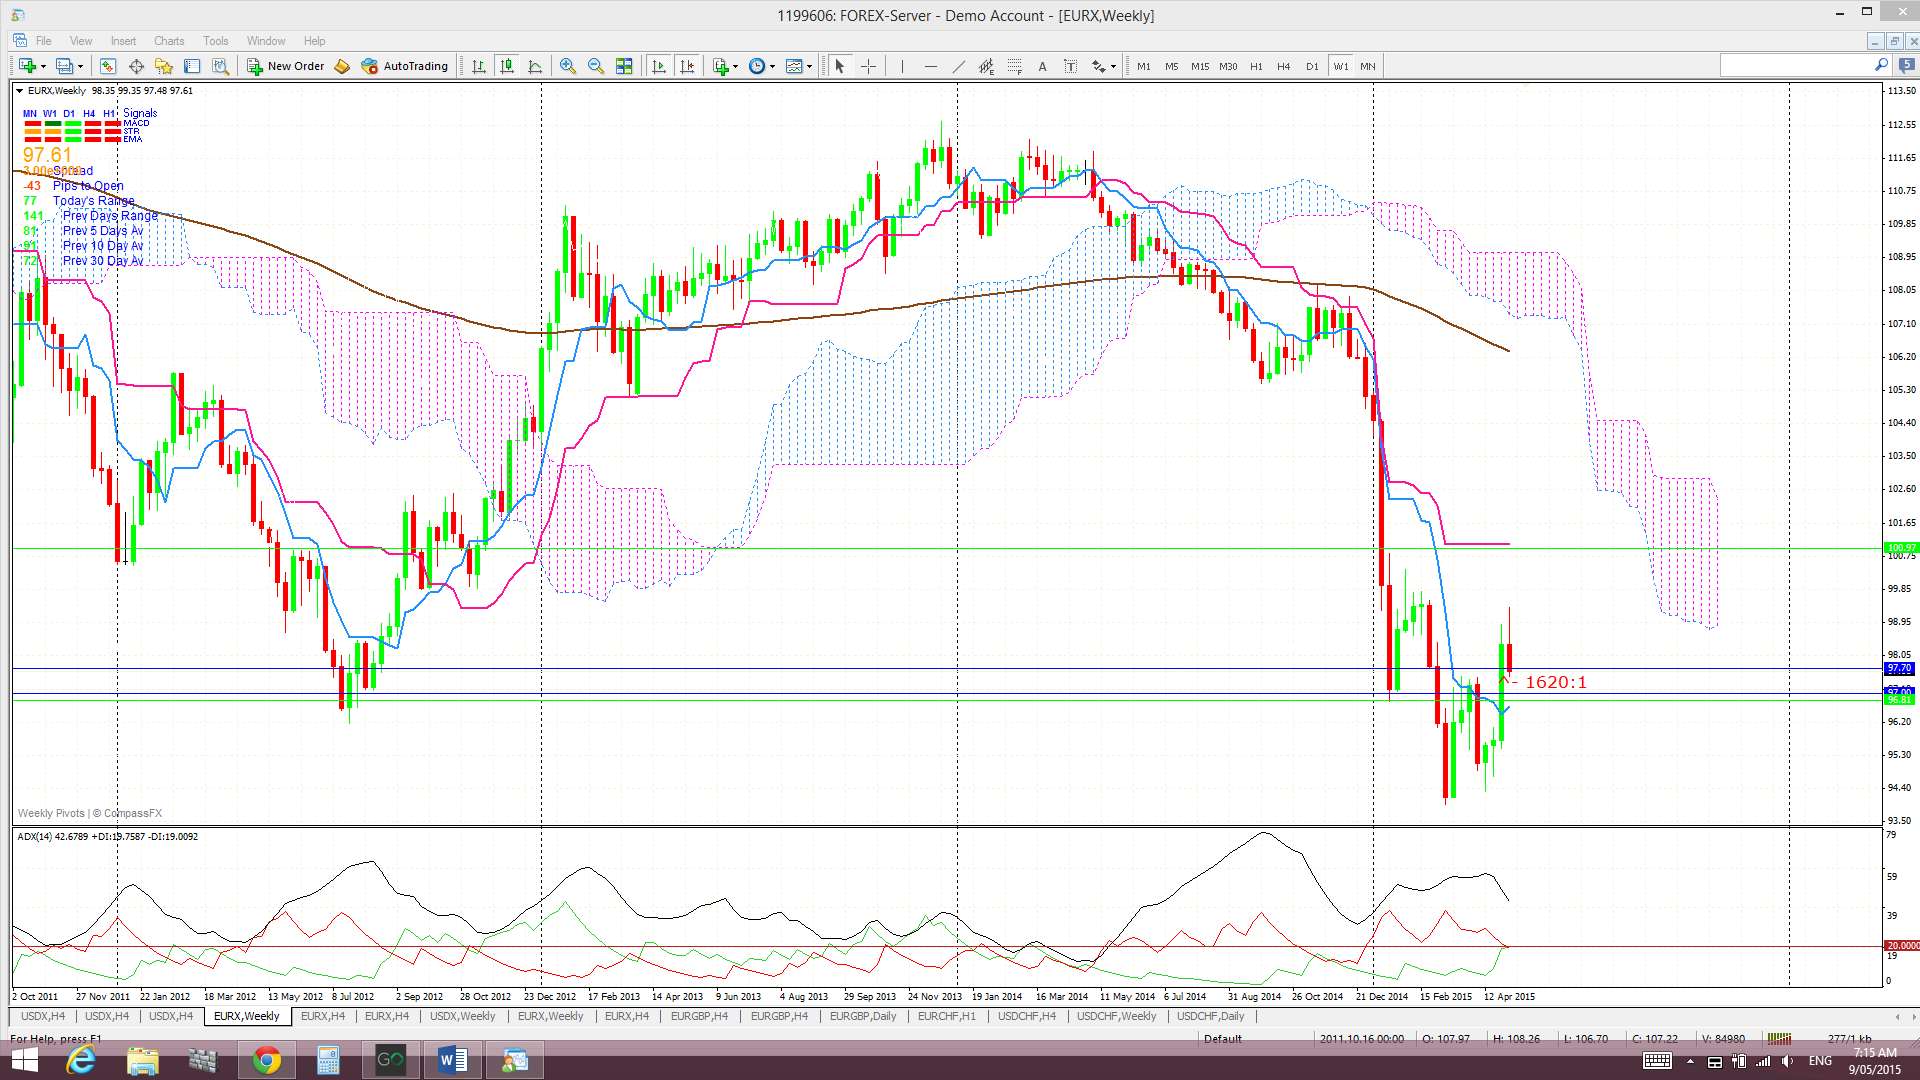
Weekly: The weekly candle closed as a small bearish coloured, almost ‘Inside’, candle. The weekly chart shows that a 61.8% fib retracement of the recent lengthy bear move is back up near the 105.50 level and weekly 200 EMA. Any hold above 96 and continued recovery effort might see the index ultimately target this region.

Weekly Ichimoku: Price is still trading well below the weekly Cloud.
Daily: Price chopped lower last week. Applying fibs to the most recent swing low move on this time frame shows that price stalled at the 38.2% Fib retracement and Monthly Resistance-1 region. The 50% fib above is aligned near the daily 200 EMA and I would expect the index might first target this region IF bullish continuation continues at all. A break and hold above the 38.2% Fib here would help this index to keep conforming to the Bear Market Truncation pattern:
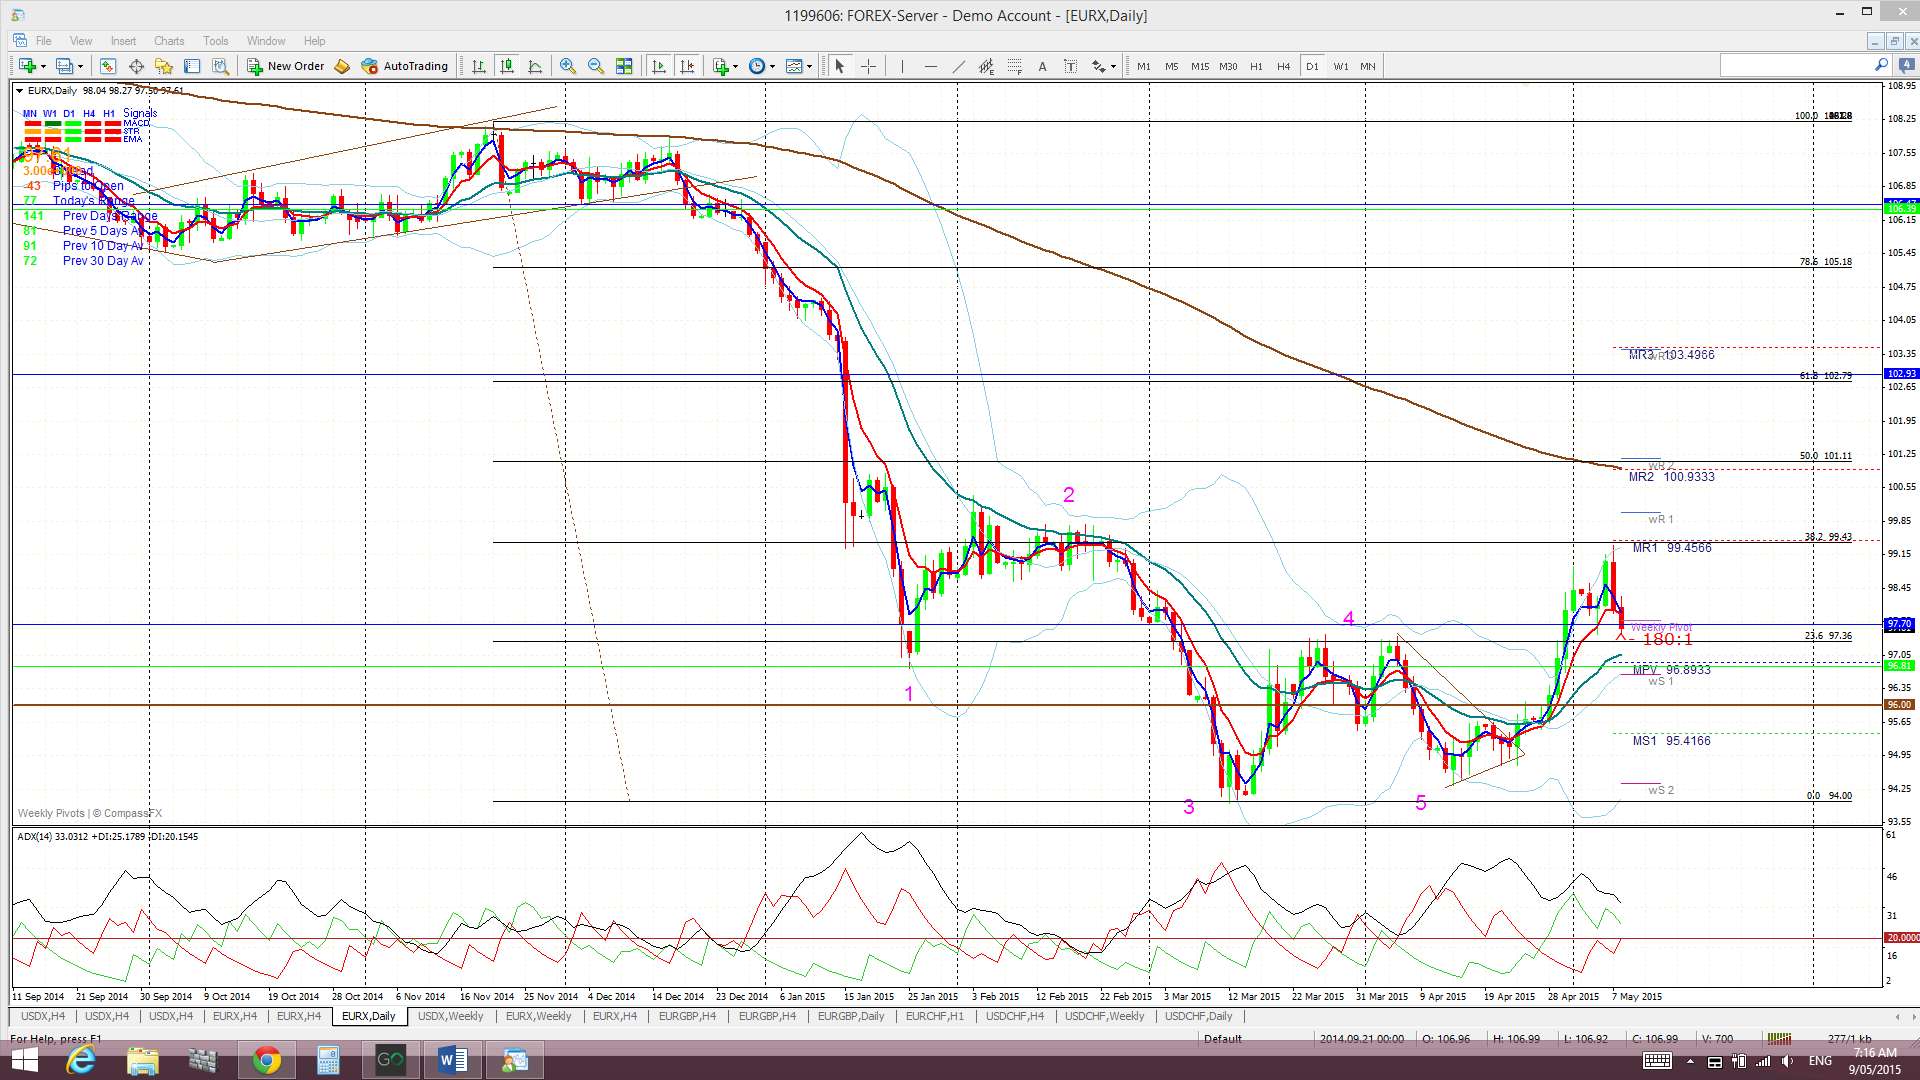

Daily Ichimoku Cloud chart: Price traded above the daily Cloud last week and the recent bullish Tenkan/Kijun cross remains open.
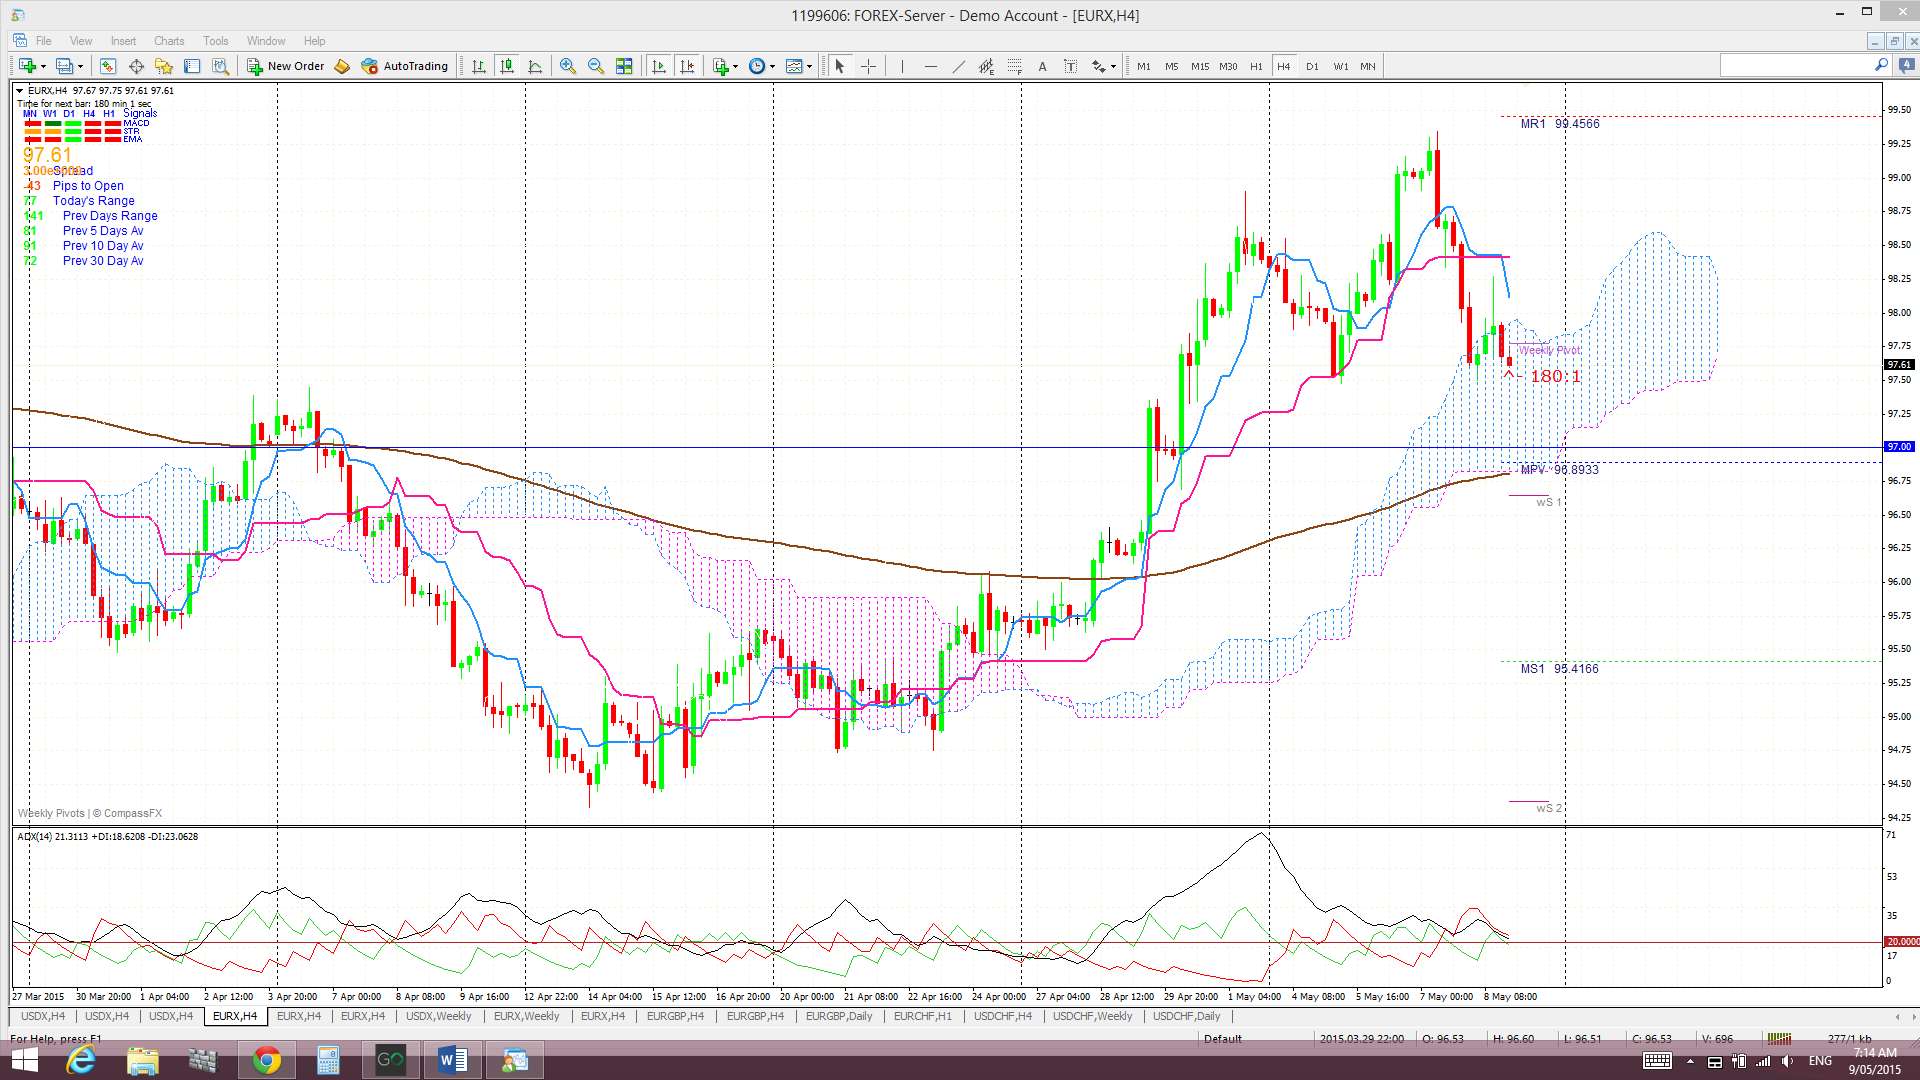
4 hr: Price chopped up and down last week. Applying Fibs to this time frame chart is useful as well. The EURX may continue higher as part of this recent bullish momentum BUT a pullback, as part of this overall bullish move, isn’t out of the question either and Fib levels can help you to locate possible pullback targets. The 50% Fib is near 97, the monthly pivot and 4hr 200 EMA and so could be a bit of a magnet and the 61.8% fib is near the key 96 level and could also attract price action. Watch these levels for any reaction if there is any further pullback here.

4 hr Ichimoku Cloud chart: The EURX traded above the 4hr Cloud until Friday at which point it dipped into the top of the Cloud where it closed for the week. This chart is back to being divergent from the daily chart and suggests choppiness.
Comments:
Daily and 4hr Cloud alignment: The USDX is aligned for SHORT USD but the EURX is not aligned and suggests choppiness ahead for EUR trades.
USDX: the USDX closed lower last week following further disappointing US economic data. Friday’s NFP revealed that whilst US employment seems steady wages growth has slipped and this failed to translate into any gains for the US$. The index has struggled to make any close and hold above the key 100 level and the recent break below 95.50 has helped to develop the ‘Double Top’ pattern.
It remains my thesis that a sustained hold below 95.50 support a ‘Double Top’ breakdown and that we could then be in for more of pull back with this index. However, the daily support trend line would need to be broken before any bearish follow-through can develop. Thus, the US$ index remains in a sort of ‘no-man’s land’ for the moment as it stuck below 95.50 ‘support-turned-resistance’ but above a support trend line. I want to see a breakout from this no-mans land to help inform about the next US$ directional move.
EURX: The EURX closed lower last week despite US$ weakness but has held above 96 support. Divergence between the EZ and US economies continues to be a dominant theme with the Eurozone entering a monetary easing cycle and the US emerging from one. The hold above 96 is helping the monthly chart’s Double Bottom pattern to shape up though.
The levels to watch on the EURX include:
- 105.5: The weekly chart reveals that a 61.8% fib retracement of the recent lengthy bear move is back up near the 105.50 level and weekly 200 EMA. Any move back above 96 and continued recovery effort might see the index target this region.
- 97: this happens to be near the 50% fib retracement level of the recent swing high move on the 4hr chart, as well as near the monthly pivot and 4hr 200 EMA.
- 96: this happens to be near the 61.8% fib retracement level of the recent swing high move on the 4hr chart.
- 94: Any hold below 96 might suggest bearish continuation as it represents a break of a monthly chart ‘Double Top’. If so, the recent low printed near 94 will come back into focus.
Note: The analysis provided above is based purely on technical analysis of the current chart set ups. As always, Fundamental-style events, by way of any Ukraine, Ebola, Eurozone or Middle East events and/or news announcements, continue to be unpredictable triggers for price movement on the indices. These events always have the potential to undermine any technical analysis.
The post US$: stuck in no-man’s land. appeared first on www.forextell.com.