Last week: The US$ remained choppy in shortened Easter trade last week and also whilst the markets waited to see how Friday’s NFP would result. As a result, there were no new TC signals off 4hr charts.
This week:
US$: The markets are still waiting for the next big move with the US$. Some weakness crept in late last week and this was helped by Friday’s weaker than expected NFP. I am still waiting for a decisive breakout move either above 100 or below 95.5 to gauge the next momentum move on the USDX. An update on the FX Indices can be found through this link.
EUR & Greece: The situation with Greece, and heightened rumblings of a possible Grexit, continue and could prove a game changer to all technical analysis this week. Greece has a substantial loan payment due this Thursday April 9th and any default or failure to renegotiate this debt could escalate Grexit consideration. This has the potential to increase volatility for not only EUR pairs but for all currencies. I am not an economist but I would expect Gold and the US$ to benefit and, even, the currently beleaguered GBP might get some relief from any Grexit related activity. Traders need to keep an eye on this situation so as to avoid being victim of any ‘SNB / Swiss France’ style major spike moves. One has to seriously consider whether it might be better to avoid EUR pairs for this week, at least.
AUD: Tuesday is shaping up as a very interesting day given a possible RBA interest rate cut might be in store for the AUD and with the currency sitting on parity with the NZD. Could we be about to see AUD/NZD dip below 1.0?
Data: Apart form April 9th and the Greece loan being due there is a fair bit of other high impact data in this shortened weak: three Central Banks release interest rate updates: Australia (Tue), Japan (Wed) and the UK (Thurs) and there is Chinese CPI data released on Friday.
I had thought I wouldn’t be able to get this post out until Tuesday but have managed to steal some time to complete this. It is shaping up to be an eventful week!
Events in the Ukraine and the Middle East, as well as with Greek Debt talks, continue to have the potential to undermine any developing ‘risk’ appetite and need to be monitored.
Stocks and broader market sentiment:
It has been a mixed week for stocks with the NASDAQ printing a bearish weekly candle but the S&P500, DJIA and Russell 2,000 all printing bullish coloured ‘Spinning Top’ candles. Friday’s NFP looks to be feeding into bearish sentiment ,according to Futures trade, and so I’m on the lookout for some bearish follow through here.
Stock traders also would be well advised to keep abreast of the Greek debt payment situation as any fallout there could flow across into risk aversion with stocks.
Thus, with all of this, I continue to watch out for further clues as to any new momentum move, long or short though! In particular I’m looking out for:
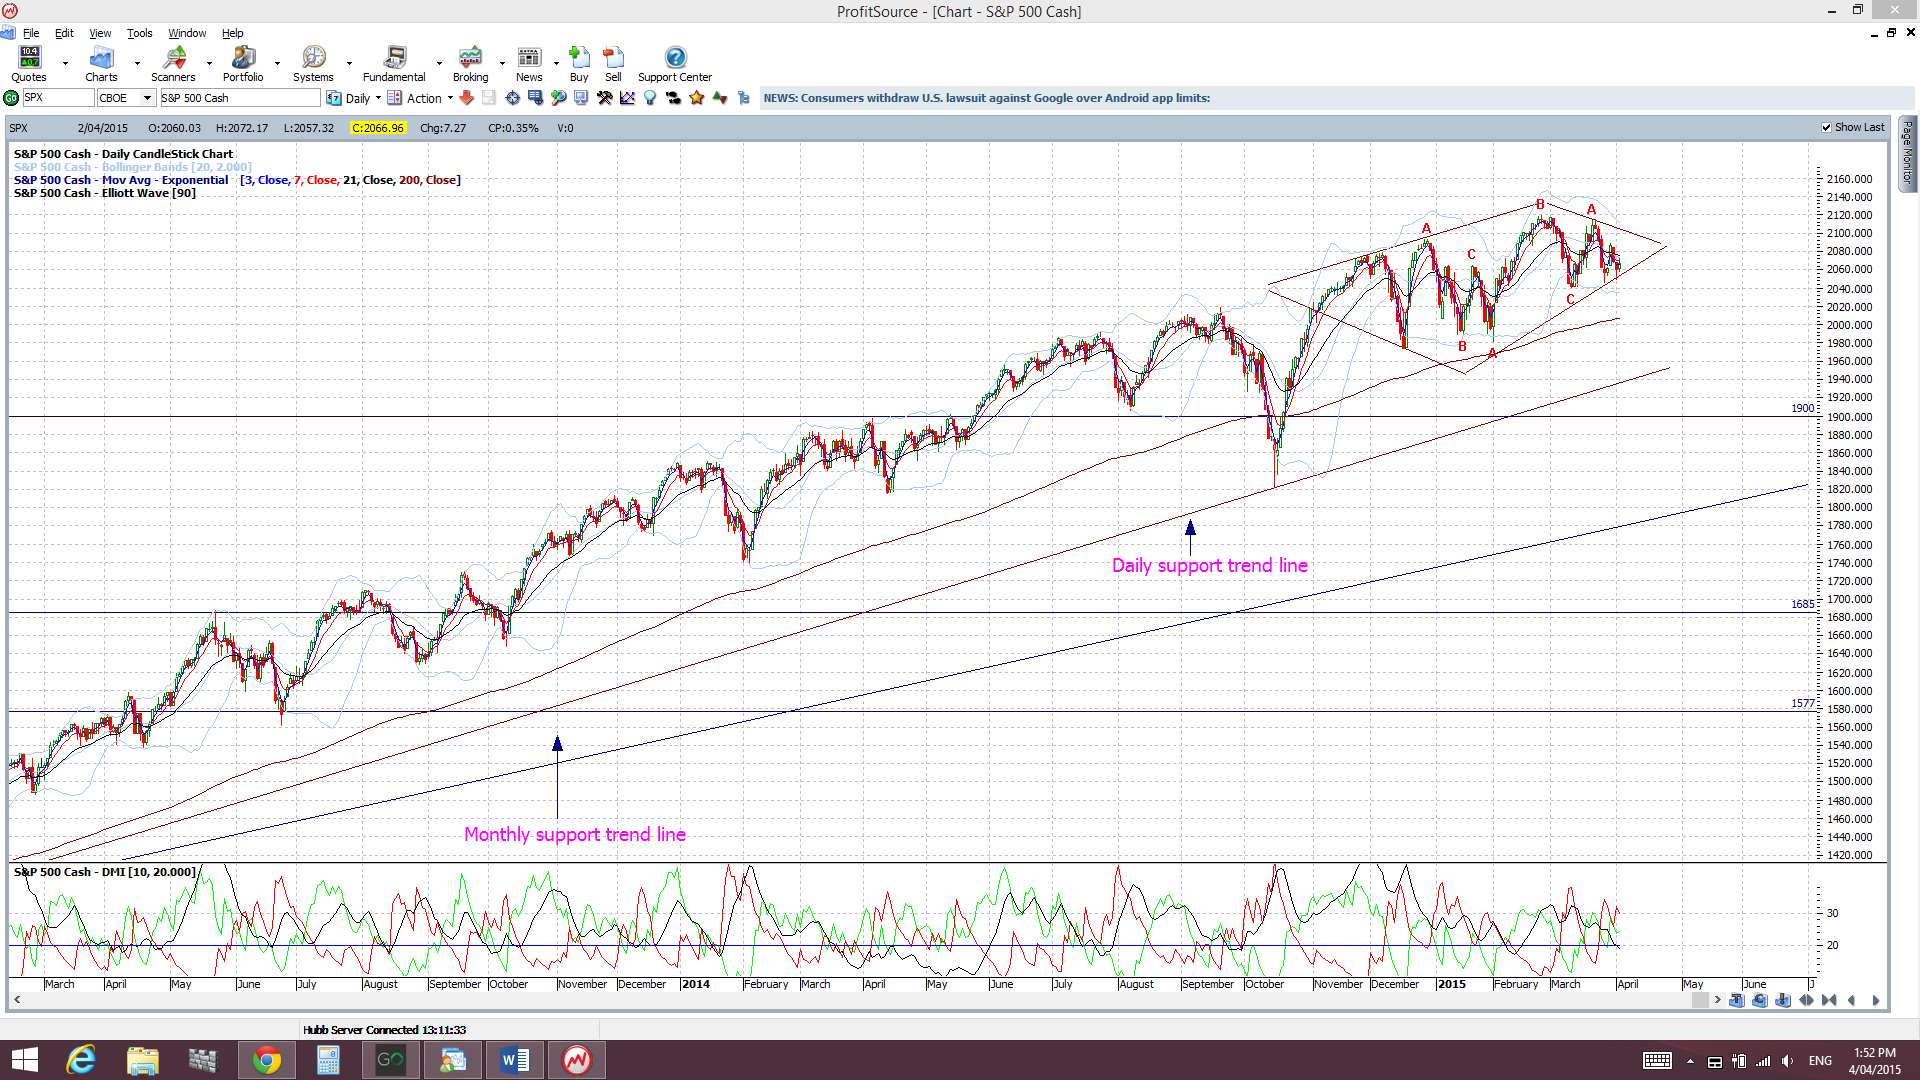
S&P500 daily chart: The index is still trading above the psychological 2,000 level and above daily trend line support. I’d read about the mention of a bearish ‘Diamond’ pattern building on the S&P500. I’m trying to see this (as per the chart below) but, if this is drawn correctly, it has yet to be confirmed by a bearish trend line break….all assuming I’ve got this right though:
Ichimoku S&P500 chart: a clear cross of the blue Tenkan-sen line below the pink Kijun-sen line. There has been a recent bearish Tenkan/Kijun cross here and price has now edged towards the bottom of the daily Cloud. Watch for any break and hold below the Cloud to suggest bearish continuation with this recent T/K cross:

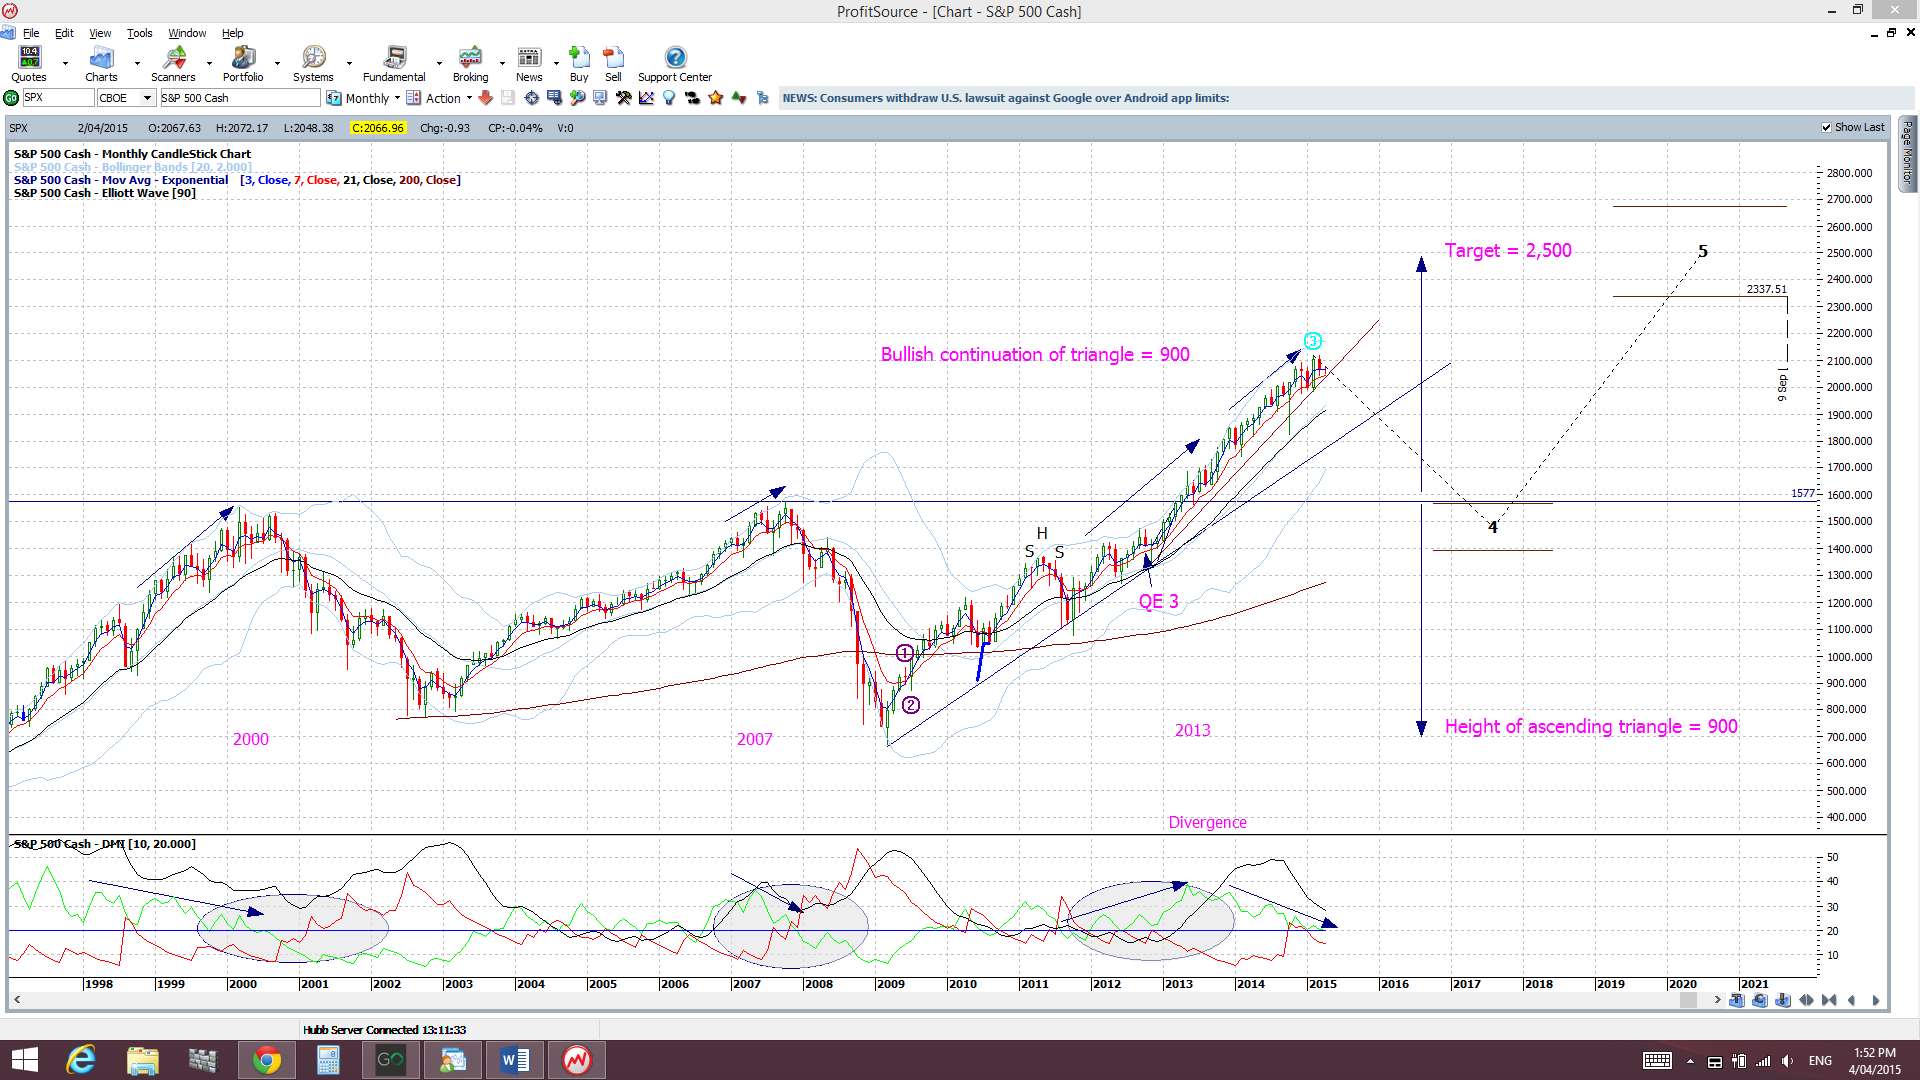
S&P500 monthly chart: a break of the monthly support trend line (see monthly chart). The monthly trend line remains intact. A break of this support level would suggest to me of a more severe pull back or correction.
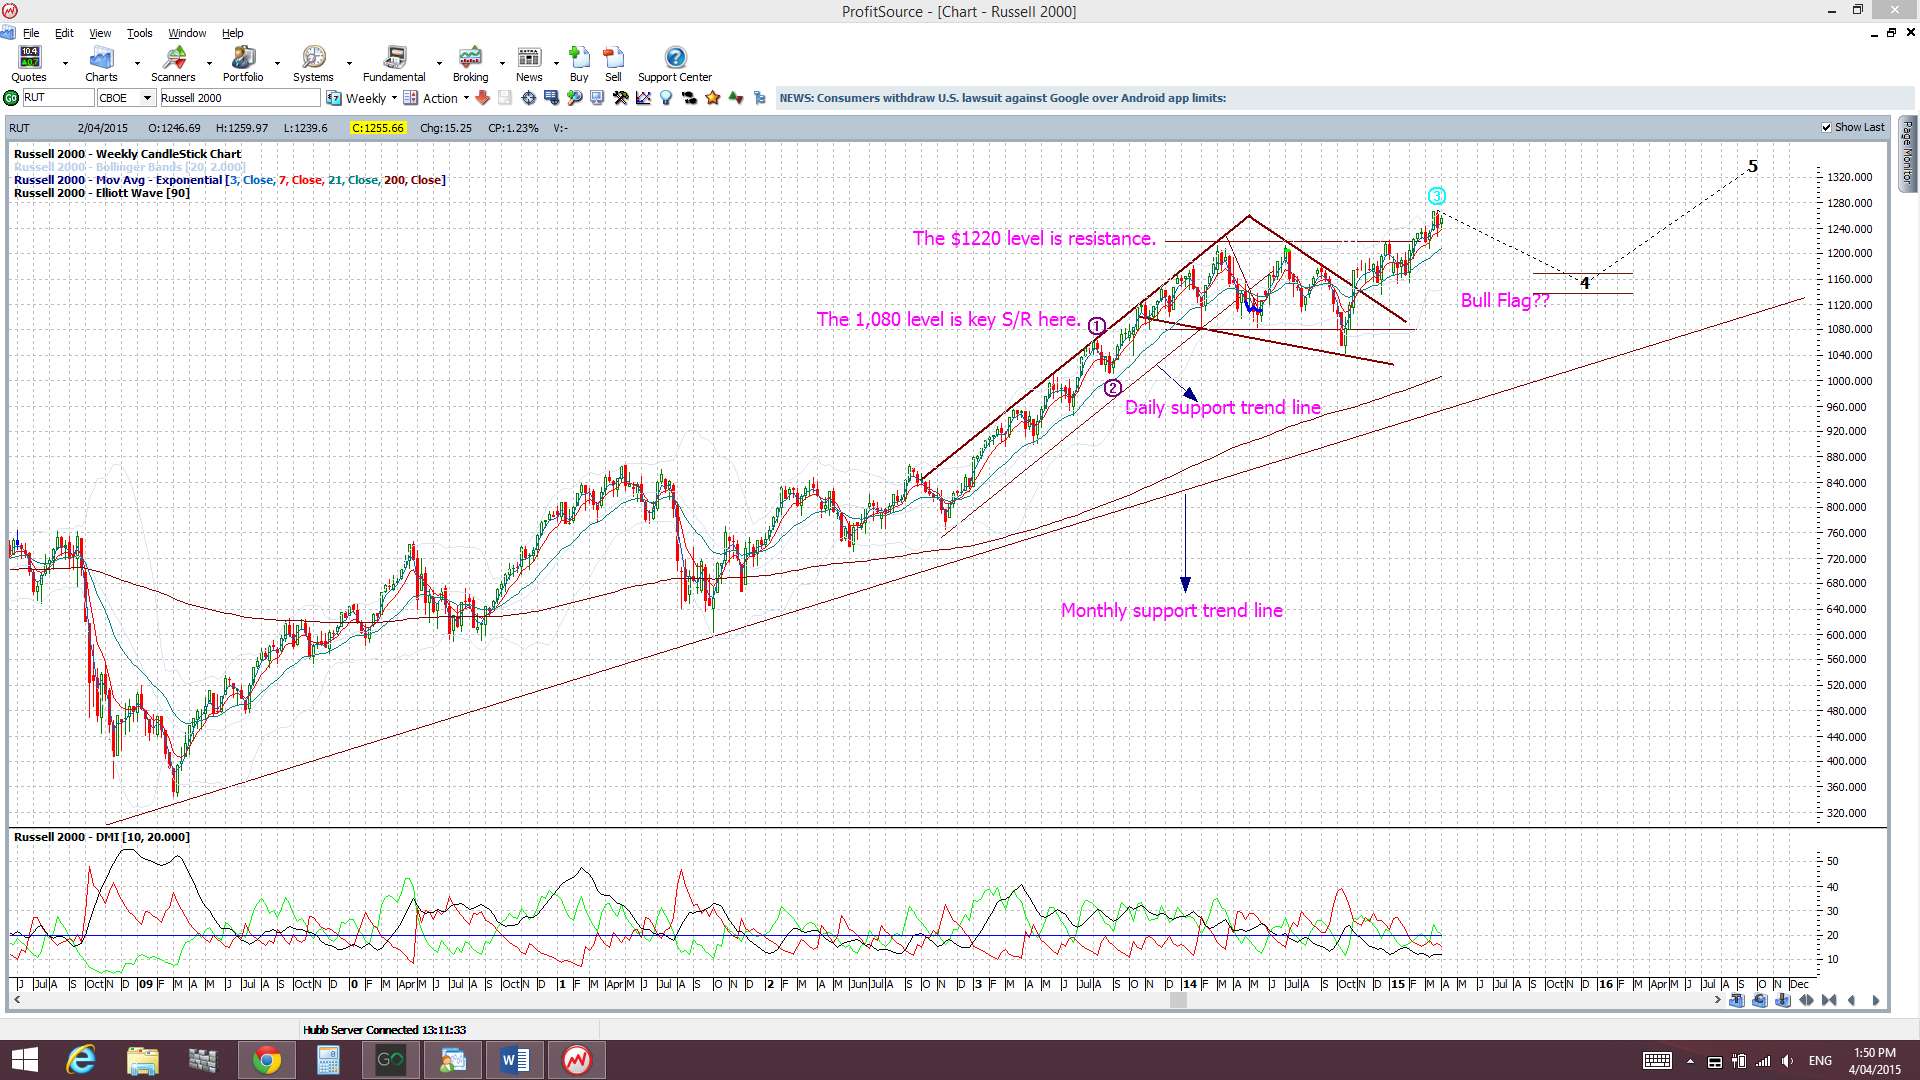
Russell 2000 Index: this small caps index is a bit of a US market ‘bellwether’ but continues to hold above 1,220 support for now. The index printed an indecision-style bullish coloured ‘Spinning Top’ that also closed as an ‘Inside’ candle.
VIX Index: For all the jitters across stock markets the ‘Fear’ index has, surprisingly, printed a bearish coloured Doji candle and is still below the 20 level.

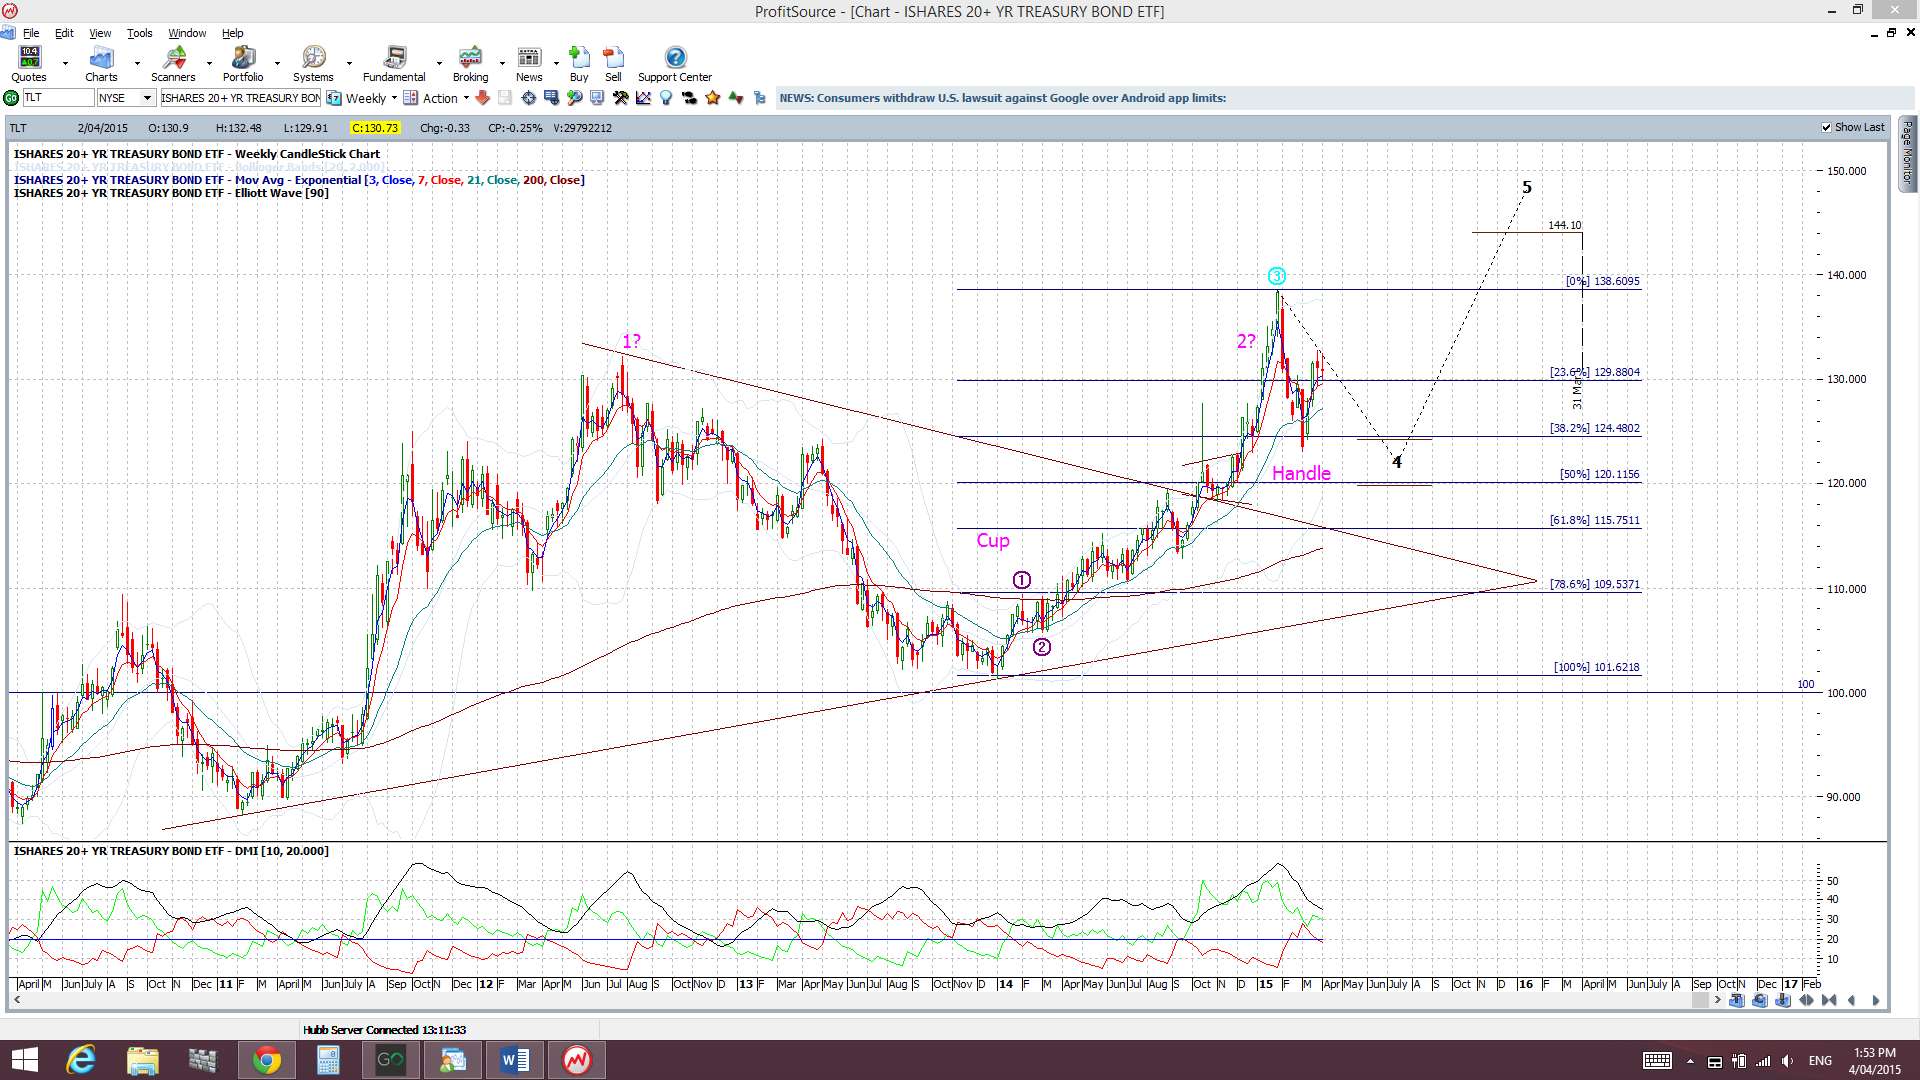
Bonds: The bond ETF has had a bearish week as indecision clouds the landscape with US interest rates.
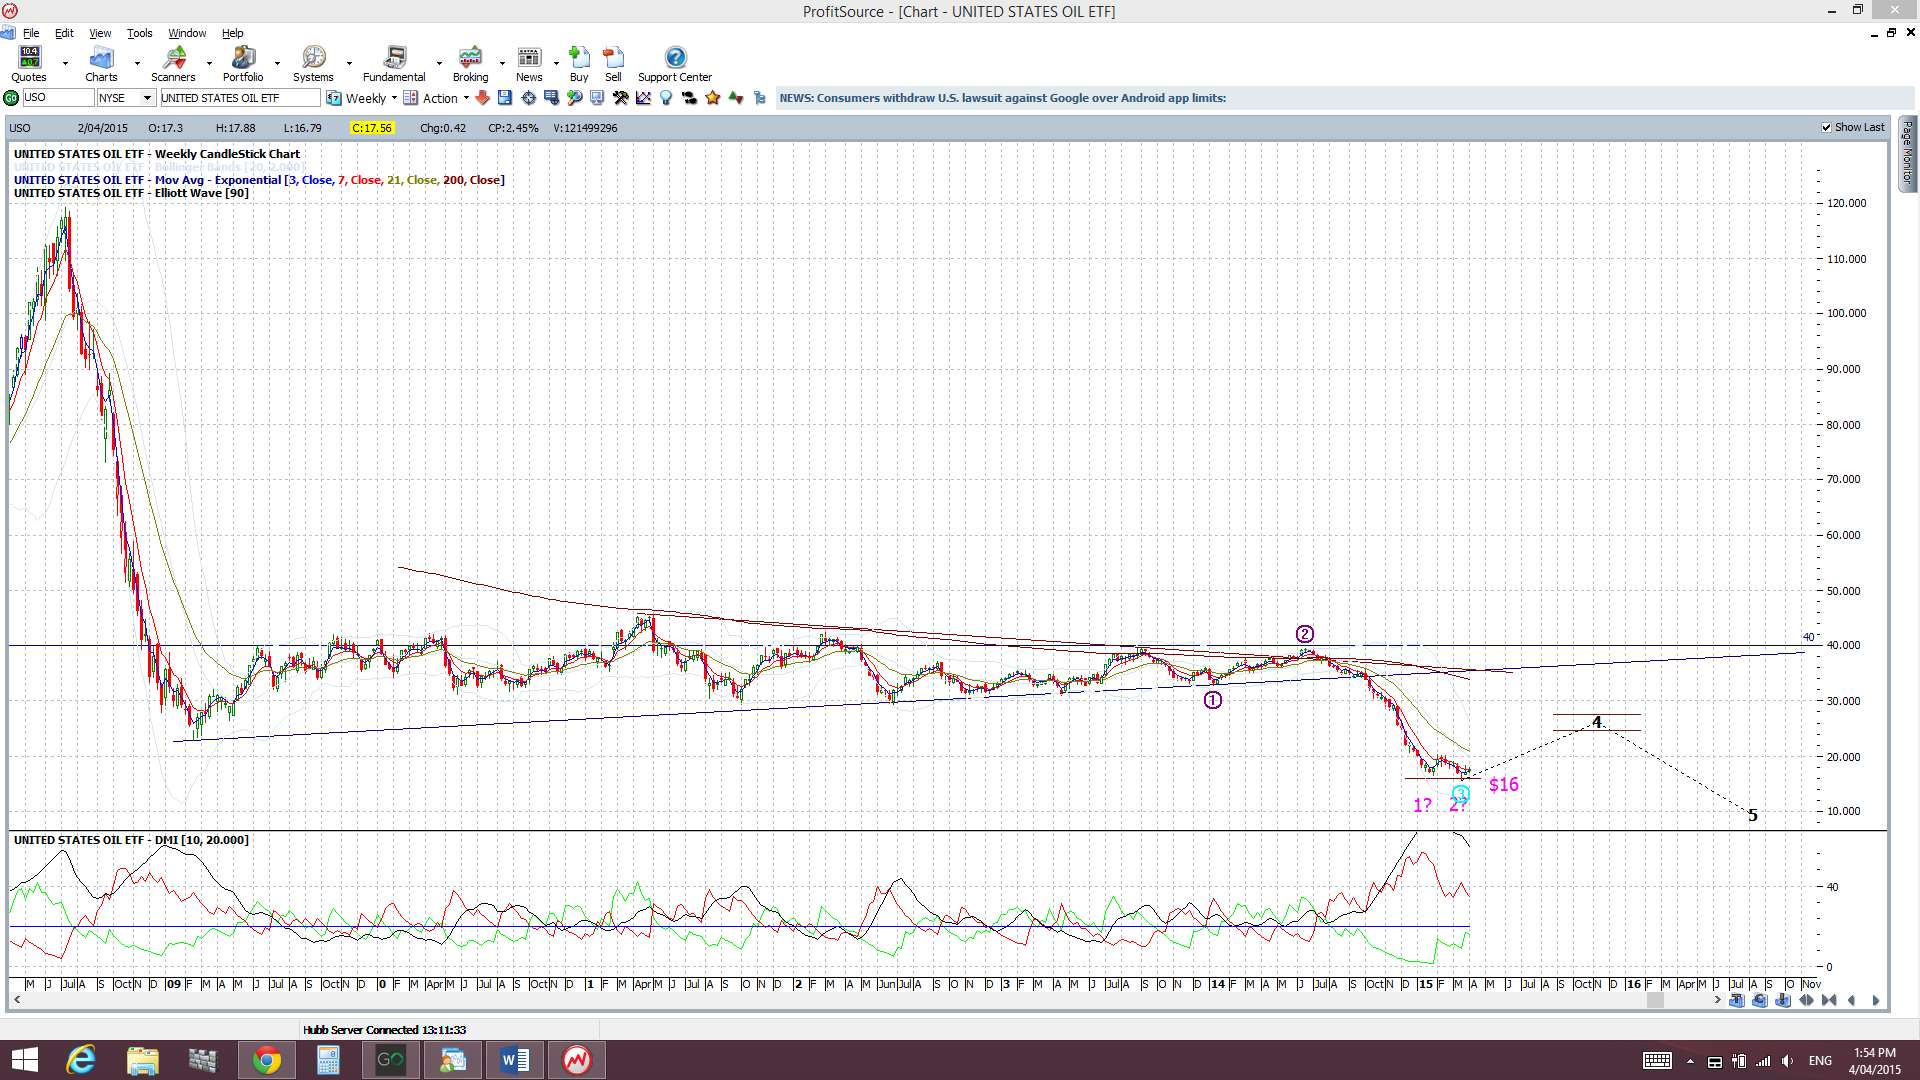
Oil: Oil printed another bullish candle for the week, albeit an indecision-style ‘Spinning Top’, and the bullish ‘Double Bottom’ above $40 support is still shaping up. USO still looks to be holding above $16 still and forming a bullish ‘Double Bottom’ as well. It also printed an indecision-style bullish coloured ‘Spinning Top’. Watch for continued follow through with both:

Trading Calendar Items to watch out for:
- Mon 6th: Easter Monday. Daylight Saving shift for AUD & NZD. EUR Spanish Unemployment change. CAD Ivey PMI. USD ISM Non-Manufacturing PMI.
- Tue 7th: AUD Retail Sales, RBA Monetary Policy & Statement. GBP Services PMI.
- Wed 8th: JPY BoJ Monetary Policy Statement & Press Conference. USD FOMC Meeting Minutes.
- Thurs 9th: GBP BoE Official Bank Rate & Statement. CAD Building Permits. USD Unemployment Claims. Greece due to pay IMF loan.
- Fri 10th: CNY CPI & PPI. GBP Manufacturing Production. CAD Employment data & Unemployment Rate.
Forex:
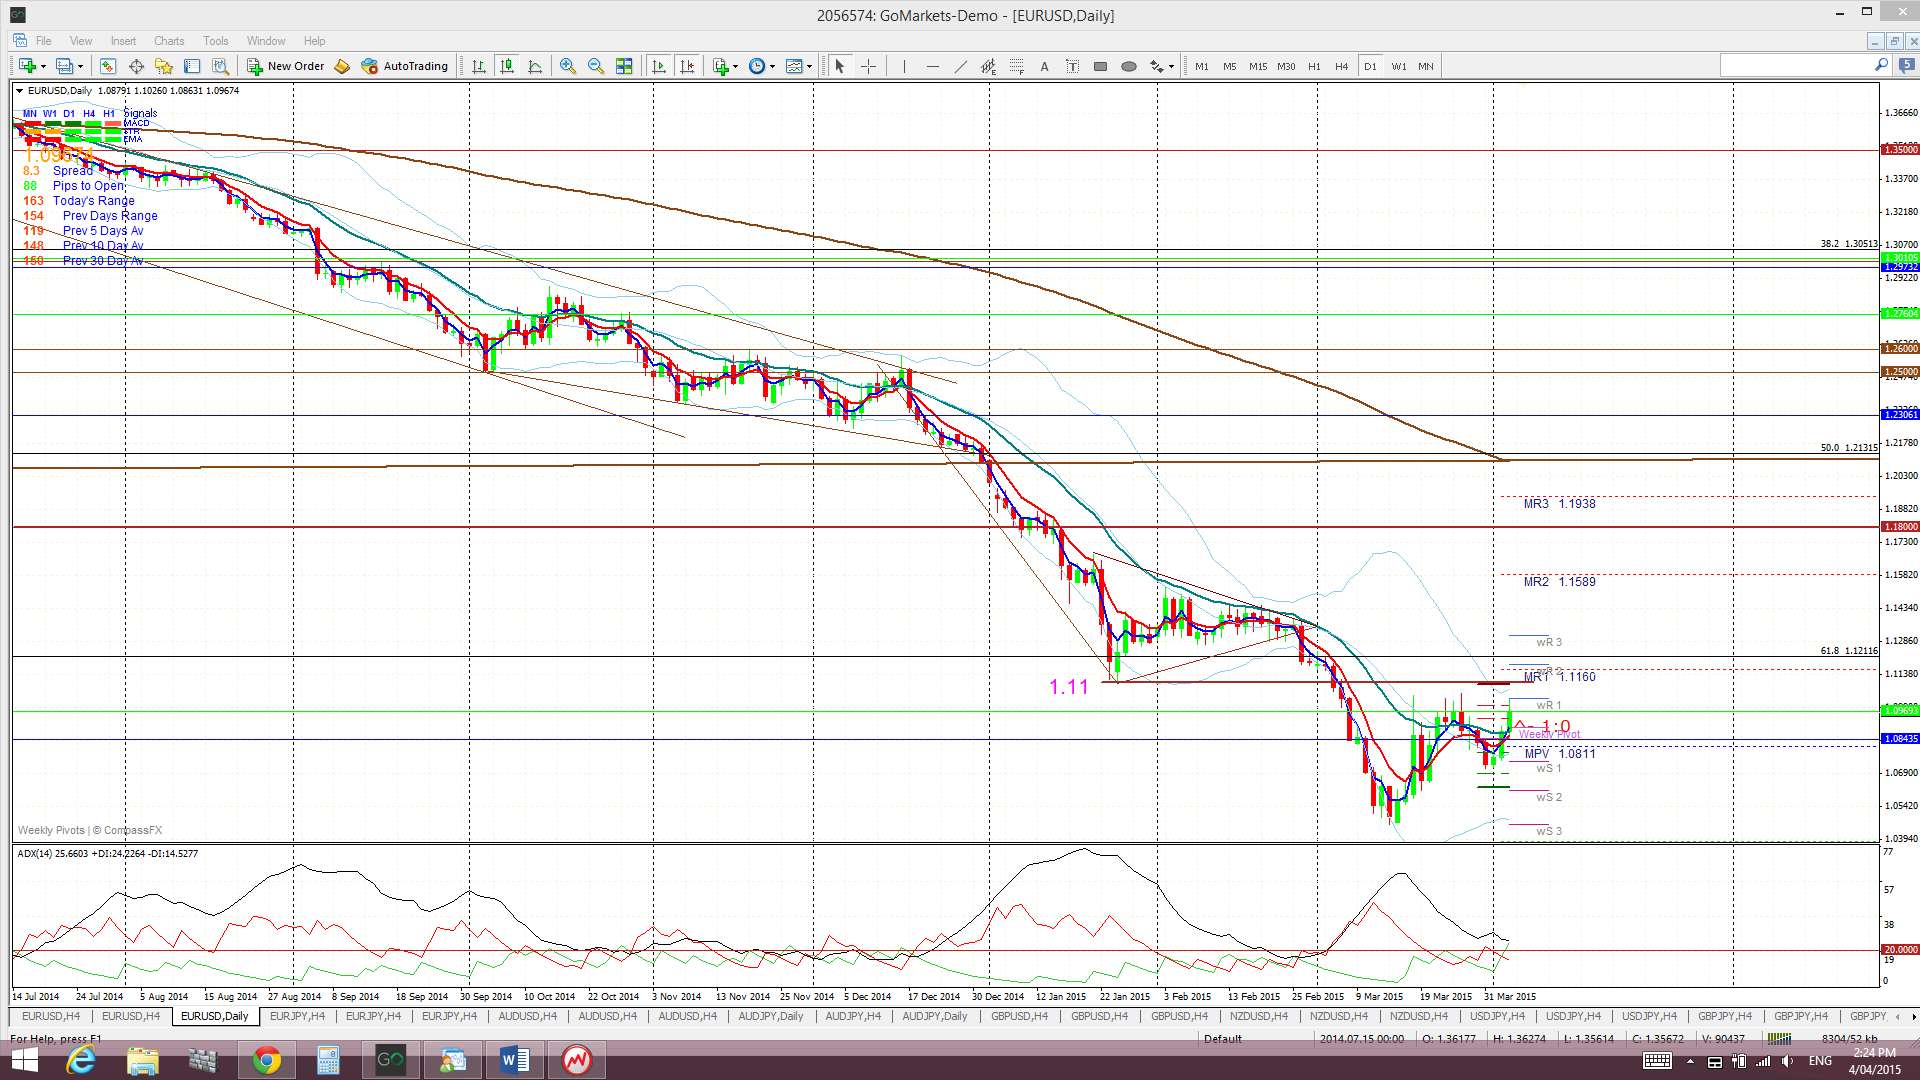
E/U: The E/U continued higher again last week and this now makes two bullish weekly candles following the earlier bullish-reversal ‘Railway Track’ pattern print of a few weeks ago. Whilst some of this flow would have come from US$ weakness one has to suspect that there would have been a bit of E/U short covering prior to the Easter break.
Most of the gains here seem to be Yin and Yang flows from US$ weakness, however, if this theme continues then the E/U could continue to benefit. The E/U has printed 9 consecutive bearish monthly candles and, so, a bit of a reprieve is not out of order even if overall bearish momentum does continue. The big questions are though:
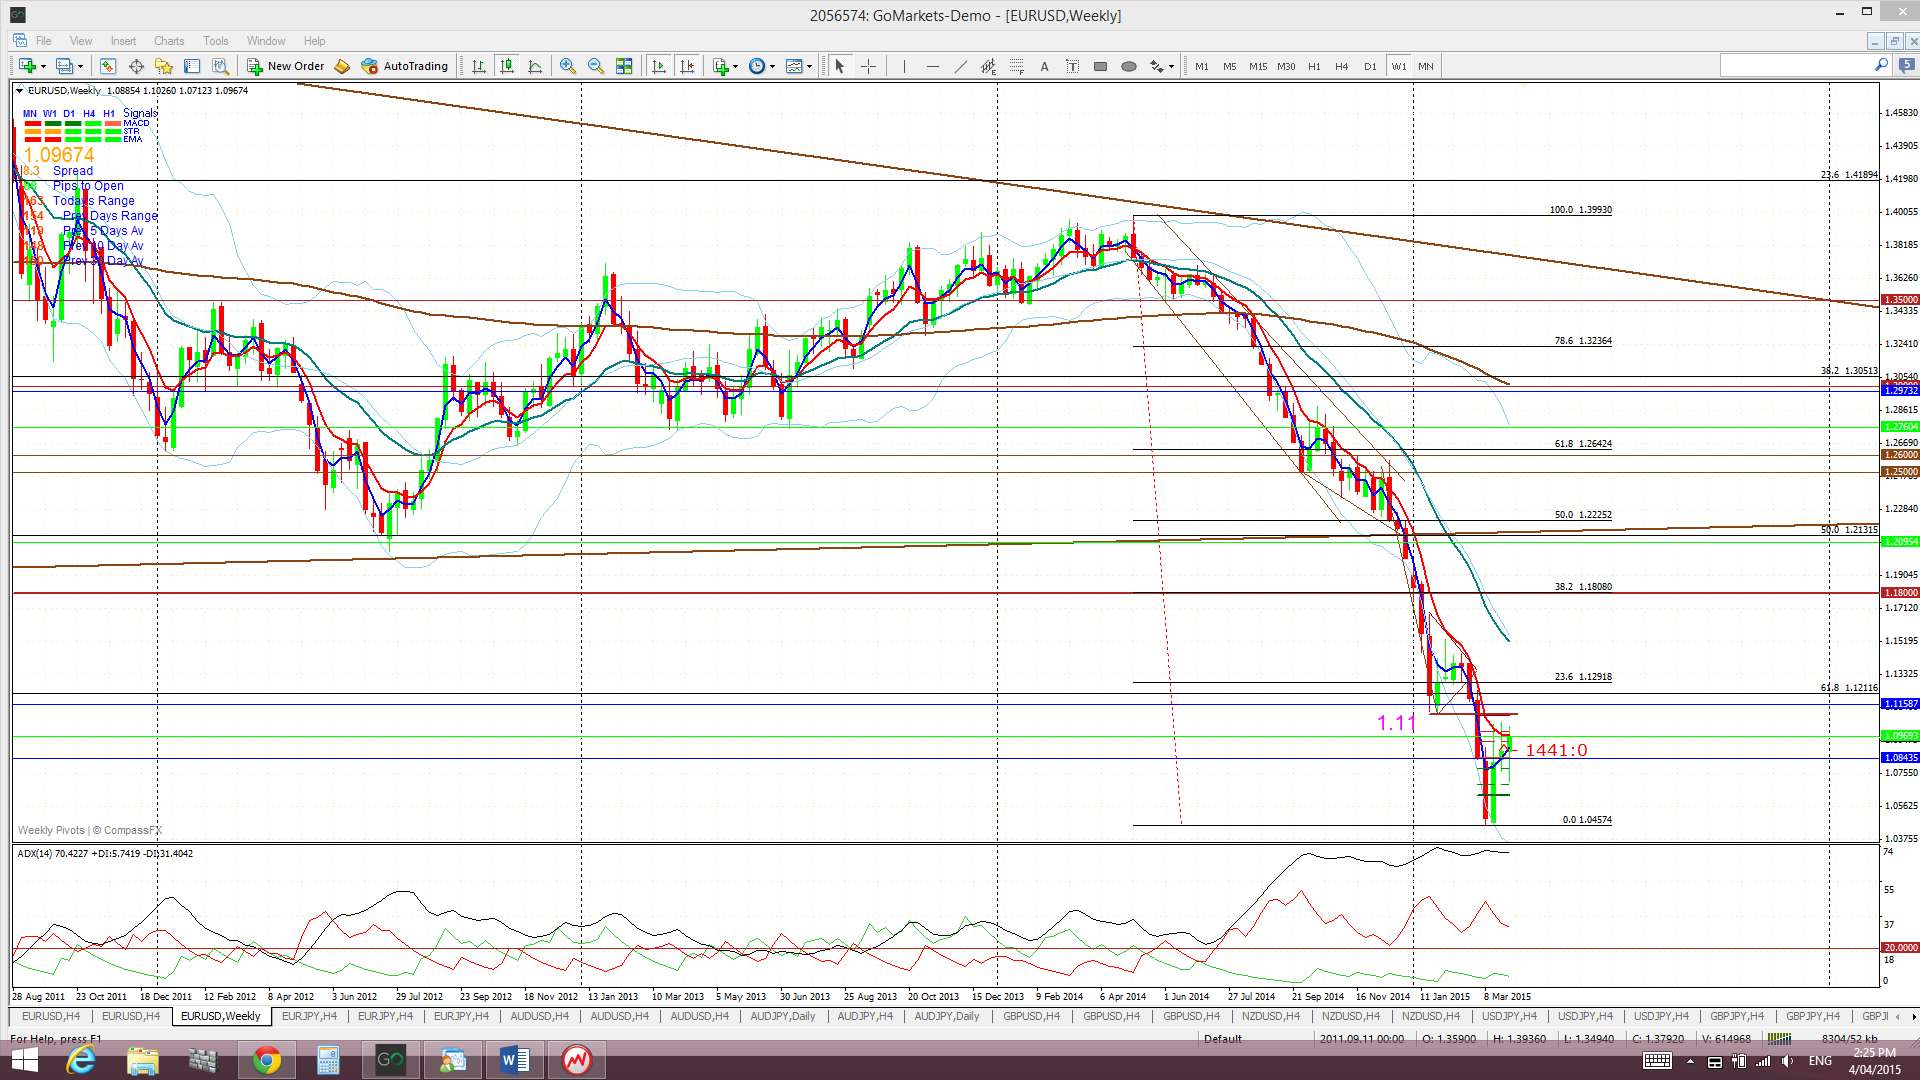
- how much of a reprieve could we see? The weekly chart shows the 61.8% fib of the recent bear move is up near 1.265 and the monthly 200 EMA so this could be a target.
- or is this the beginning of a longer term bullish reversal?
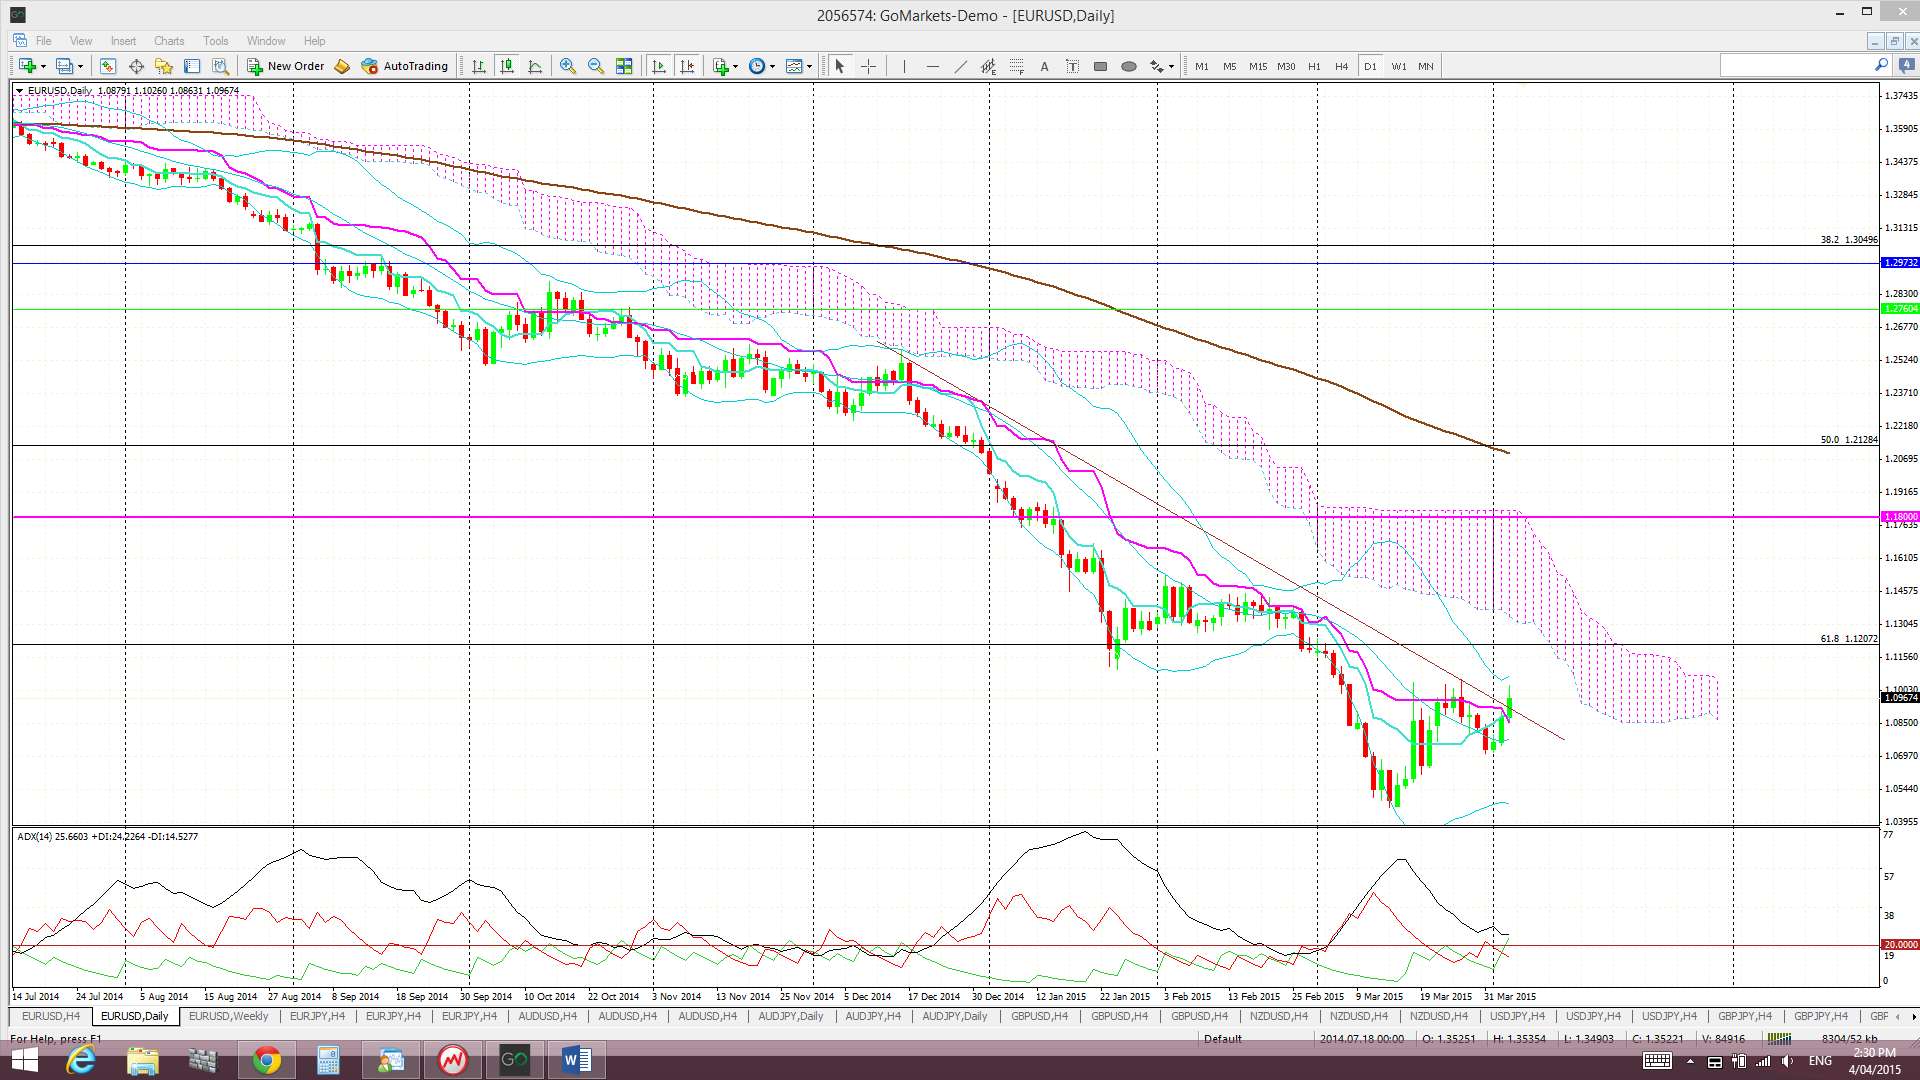
To this end, it is worth noting that Friday’s bullish close has resulted in the break of a four month bear trend line though:
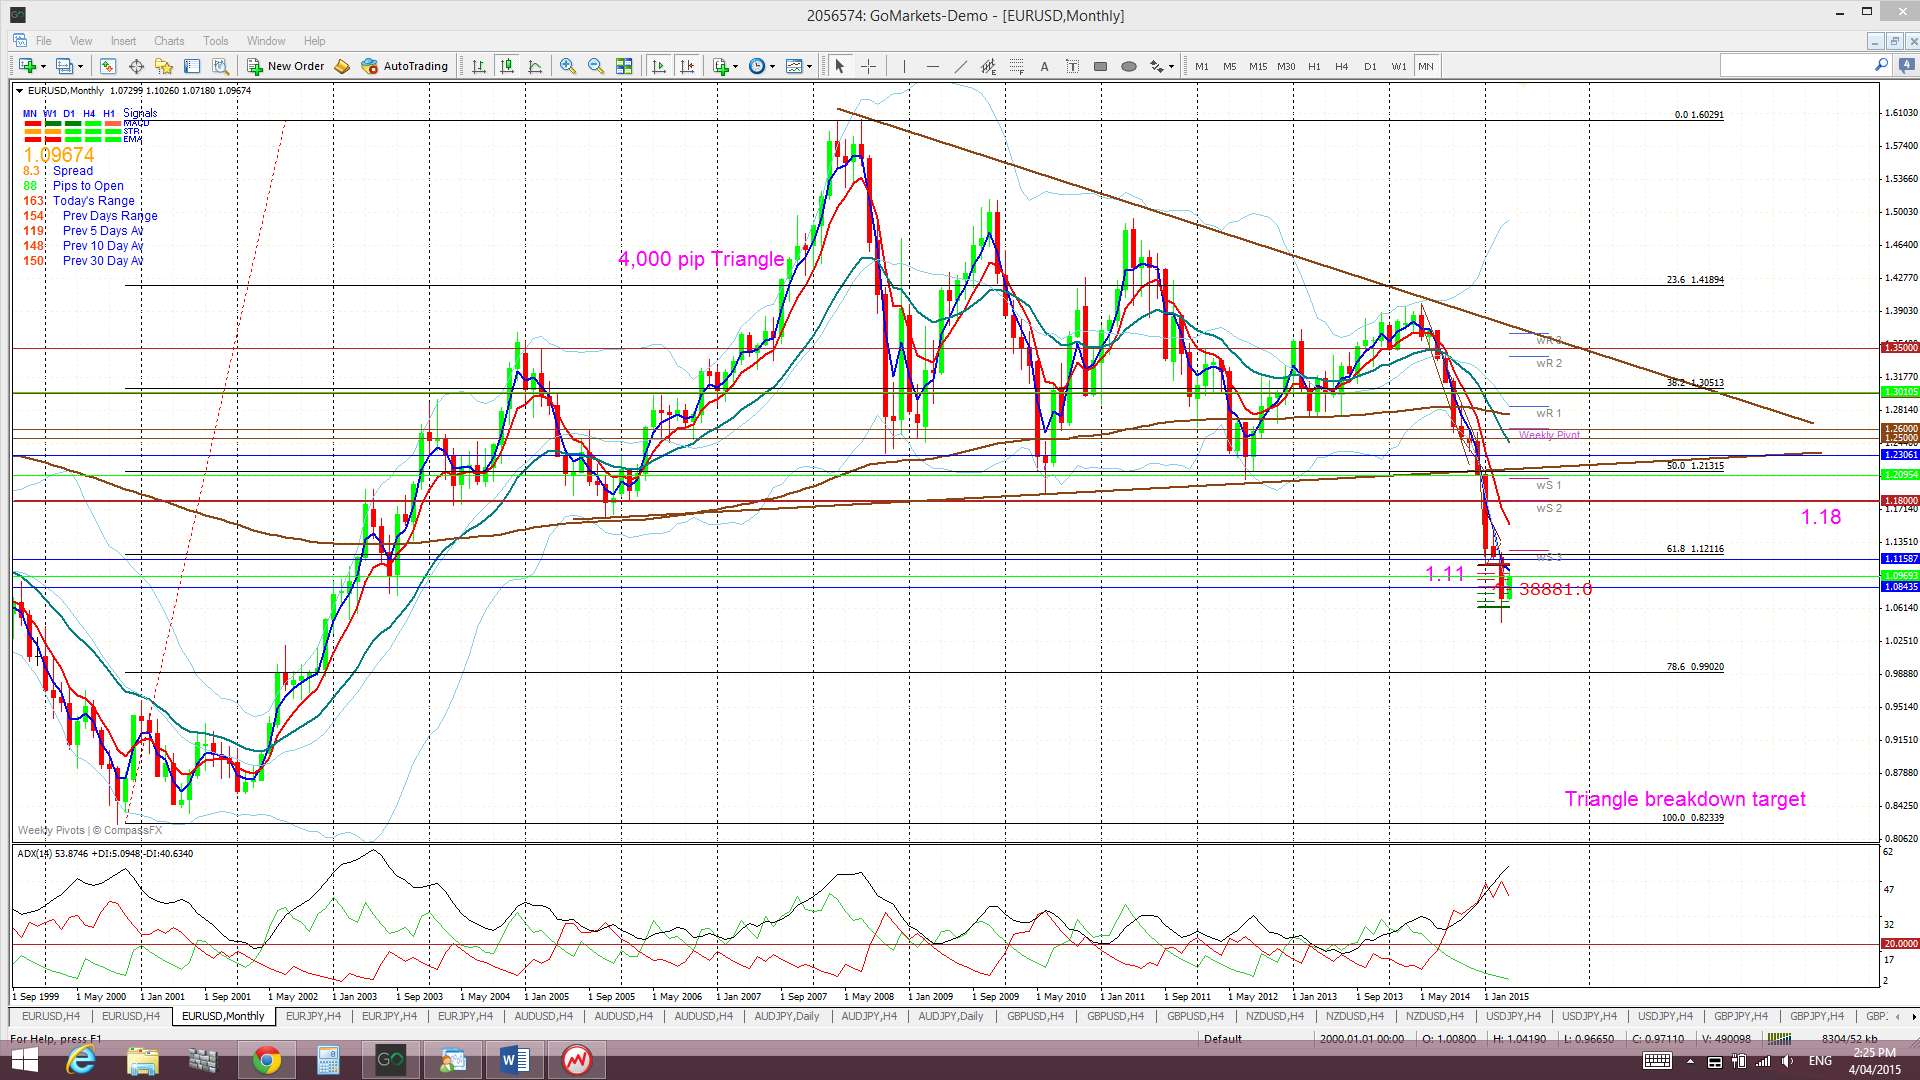
There is now really just one major bearish pattern in play on the E/U: a 4,000 pip bearish descending triangle breakdown on the monthly chart BUT this could be undermined if US$ sentiment changes.
Descending triangle on the monthly chart: the descending triangle pattern is a bearish continuation pattern and has a base at around the 1.18 level. The height of this triangle is about 4,000 pips. Technical theory would suggest that any bearish breakdown of this triangle below 1.18 might see a similar move. It is worth noting that this would bring the E/U down near 0.80 and to levels not seen since 2000/2001! The monthly chart shows how critical this 1.18 level is for the E/U. The Jan, Feb and March monthly candles closed below this key level and I was looking for a test of 1.18 before further possible bearish continuation. I’m beginning to wonder if we will see this ‘test’ though.
Price is still trading above the Ichimoku Cloud on the 4hr chart but below the Cloud on the daily, weekly and monthly charts.
The weekly candle closed as another bullish candle. The March candle closed a large bearish candle but the new April candle is bullish for the time being.
As mentioned in the introduction above, the situation with Greece and rumblings of a possible Grexit continue and could result in greatly increased volatility for all EUR pairs. April 9th is the deadline for Greece to make its IMF payment and traders need to keep an eye on this situation so as to avoid any potential ‘Swiss France’ style spikes. It may be best to avoid trading the E/U until after this current situation is sorted. This even has the potential to totally undermine this current technical analysis for the E/U.
- I’m watching for any new TC signal, momentum with the US$ and for Greek debt news on April 9th.

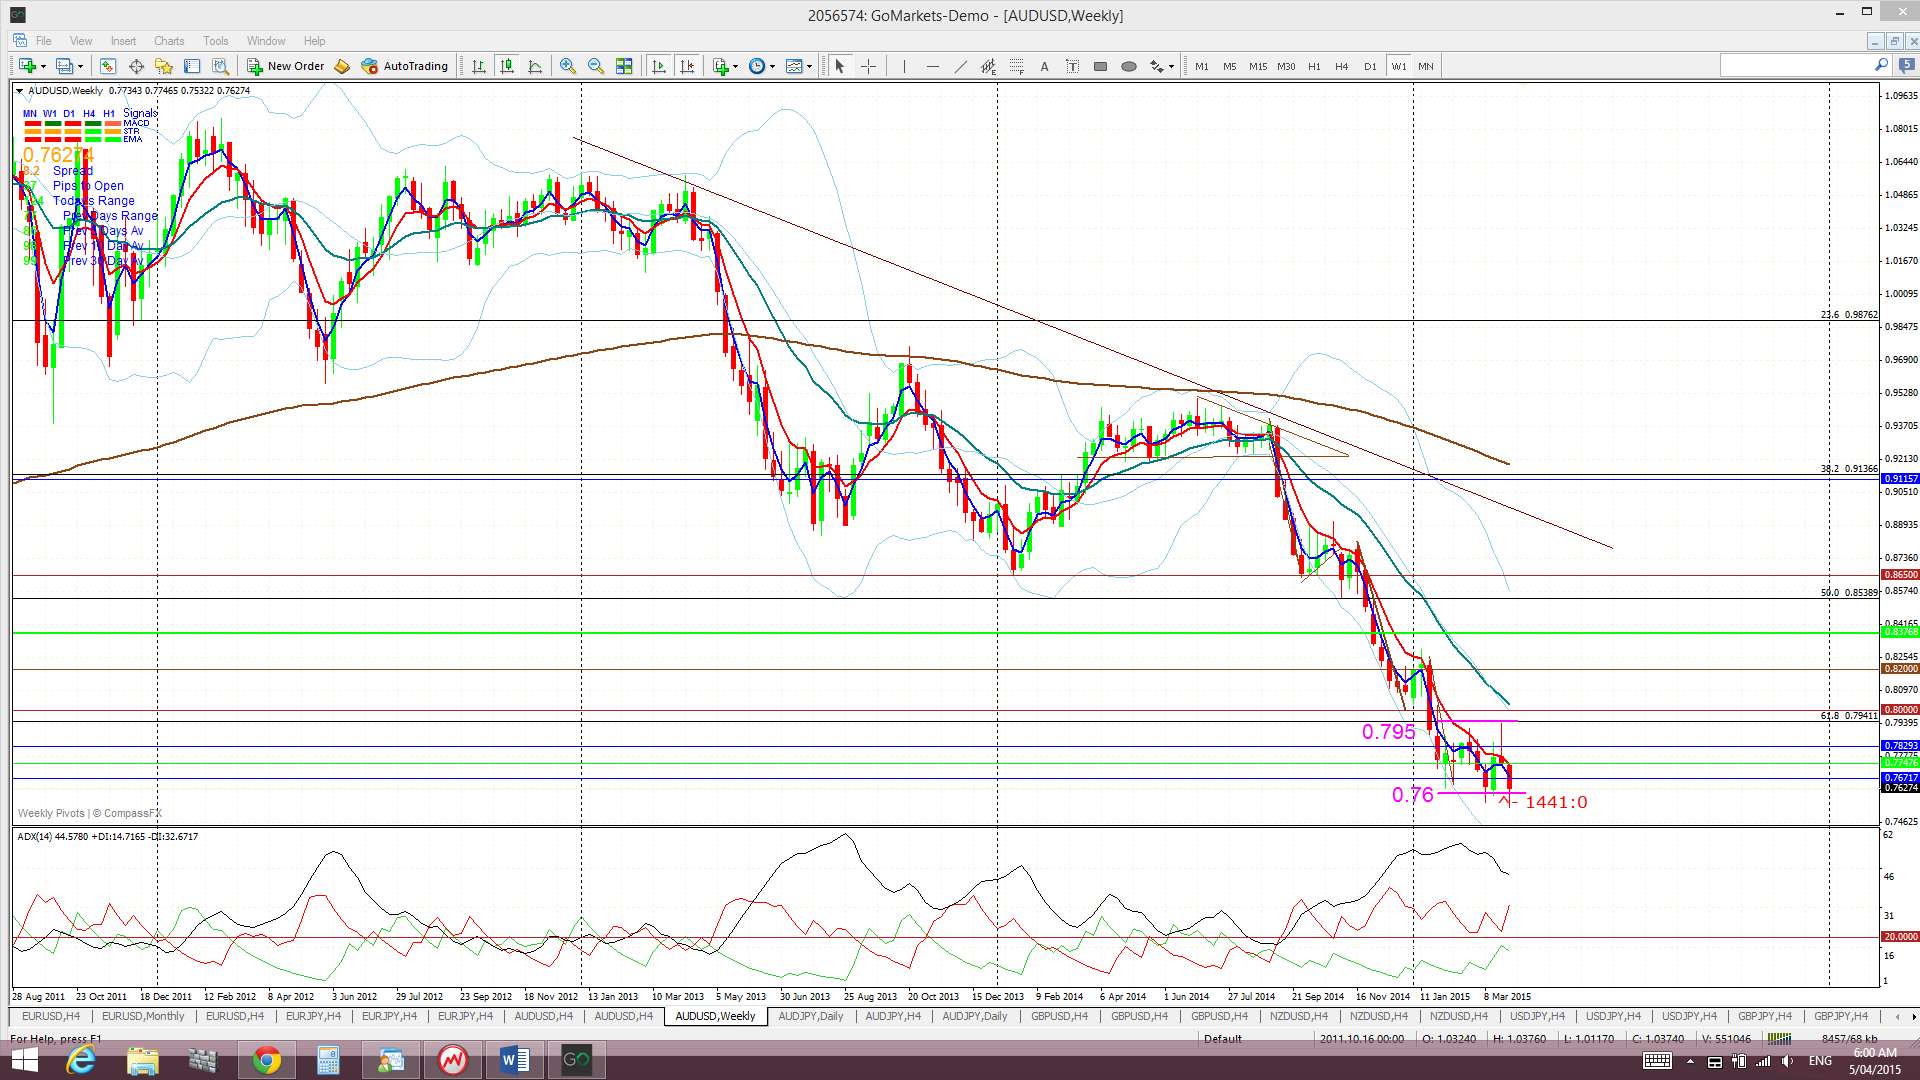
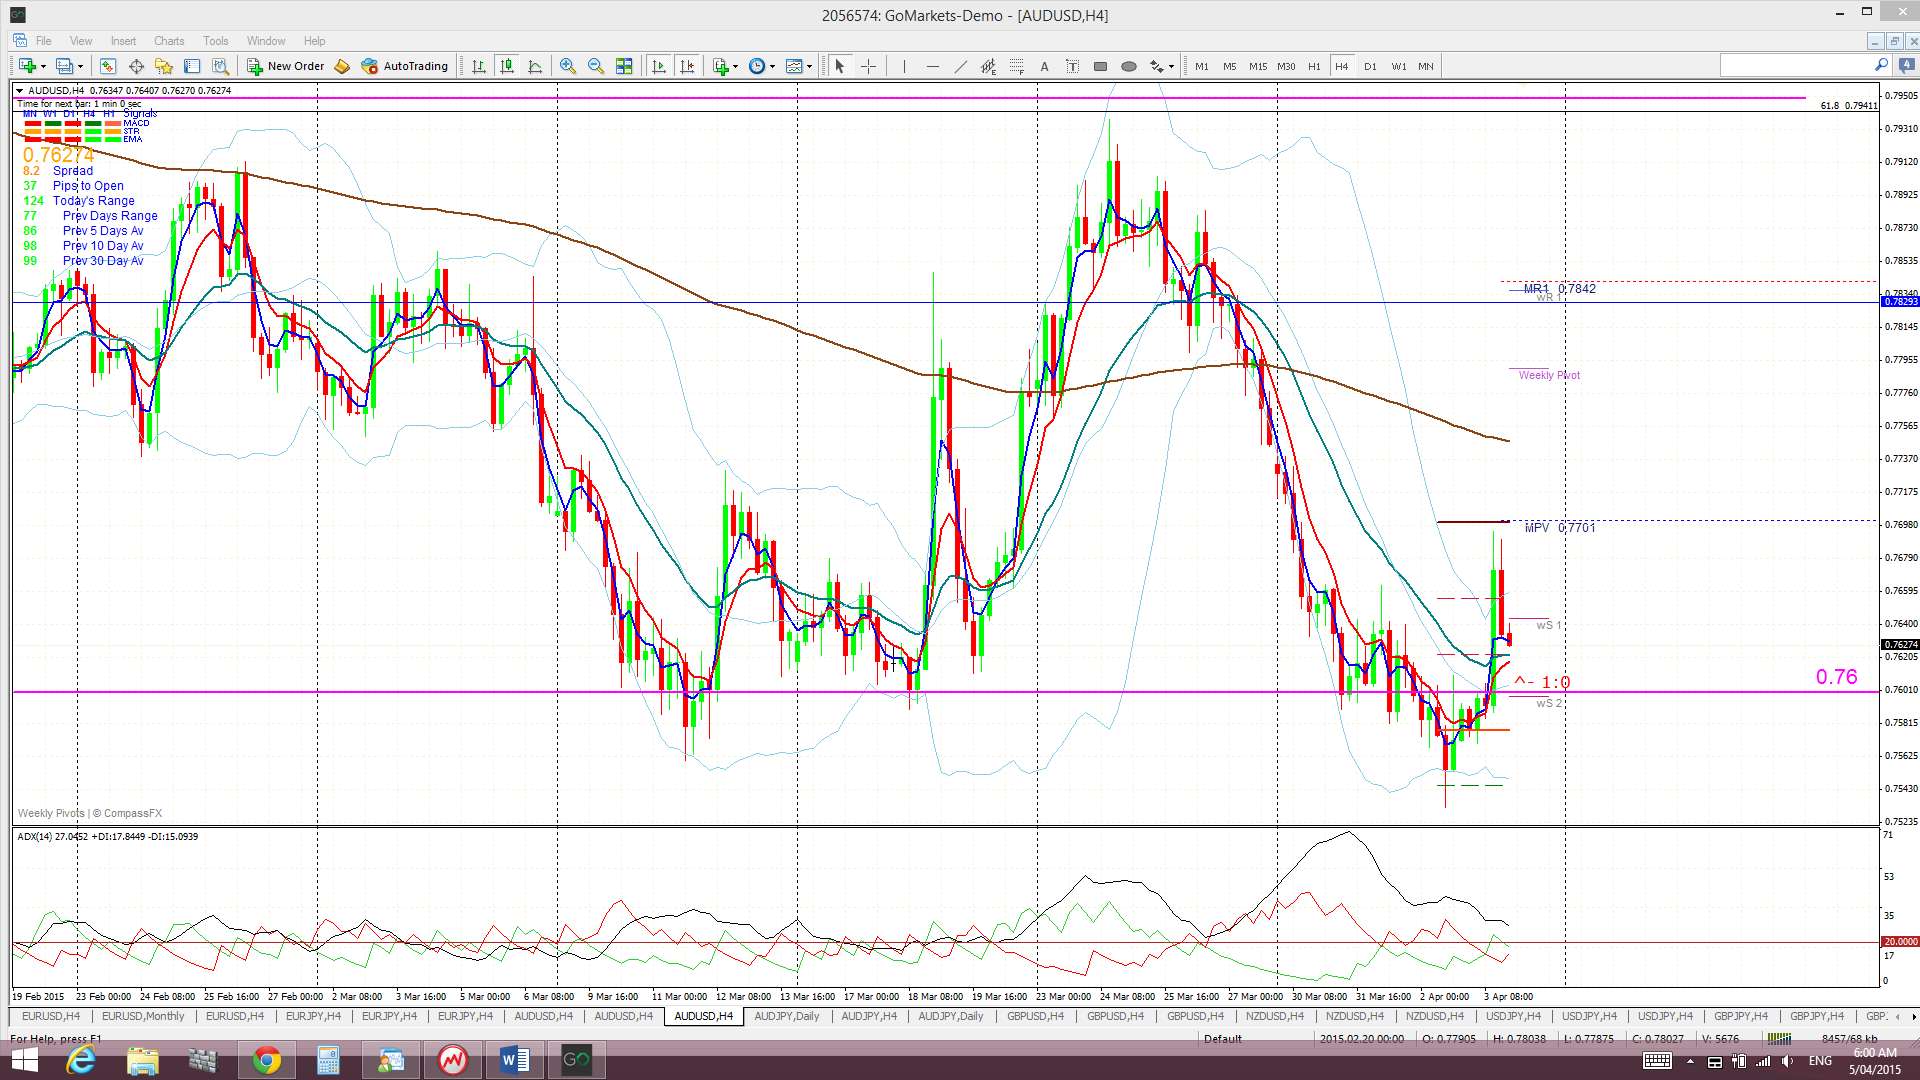
A/U: The A/U remains channel bound above 0.76 but below 0.795 ahead of this week’s RBA interest rate announcement.
Many economists are tipping for a rate cut which would no doubt put 0.76 support to the test. However, there is a school of thought thinking the RBA might hold off on a rate cut because of potential damage this may do to business confidence and the impact it might have on our over-heated housing market. Thus, Tuesday is shaping up as a pretty interesting day. Any failure to cut rates and continuing US$ weakness could see this pair rally up off 0.76 support. A rate cut though would probably see 0.76 fail.
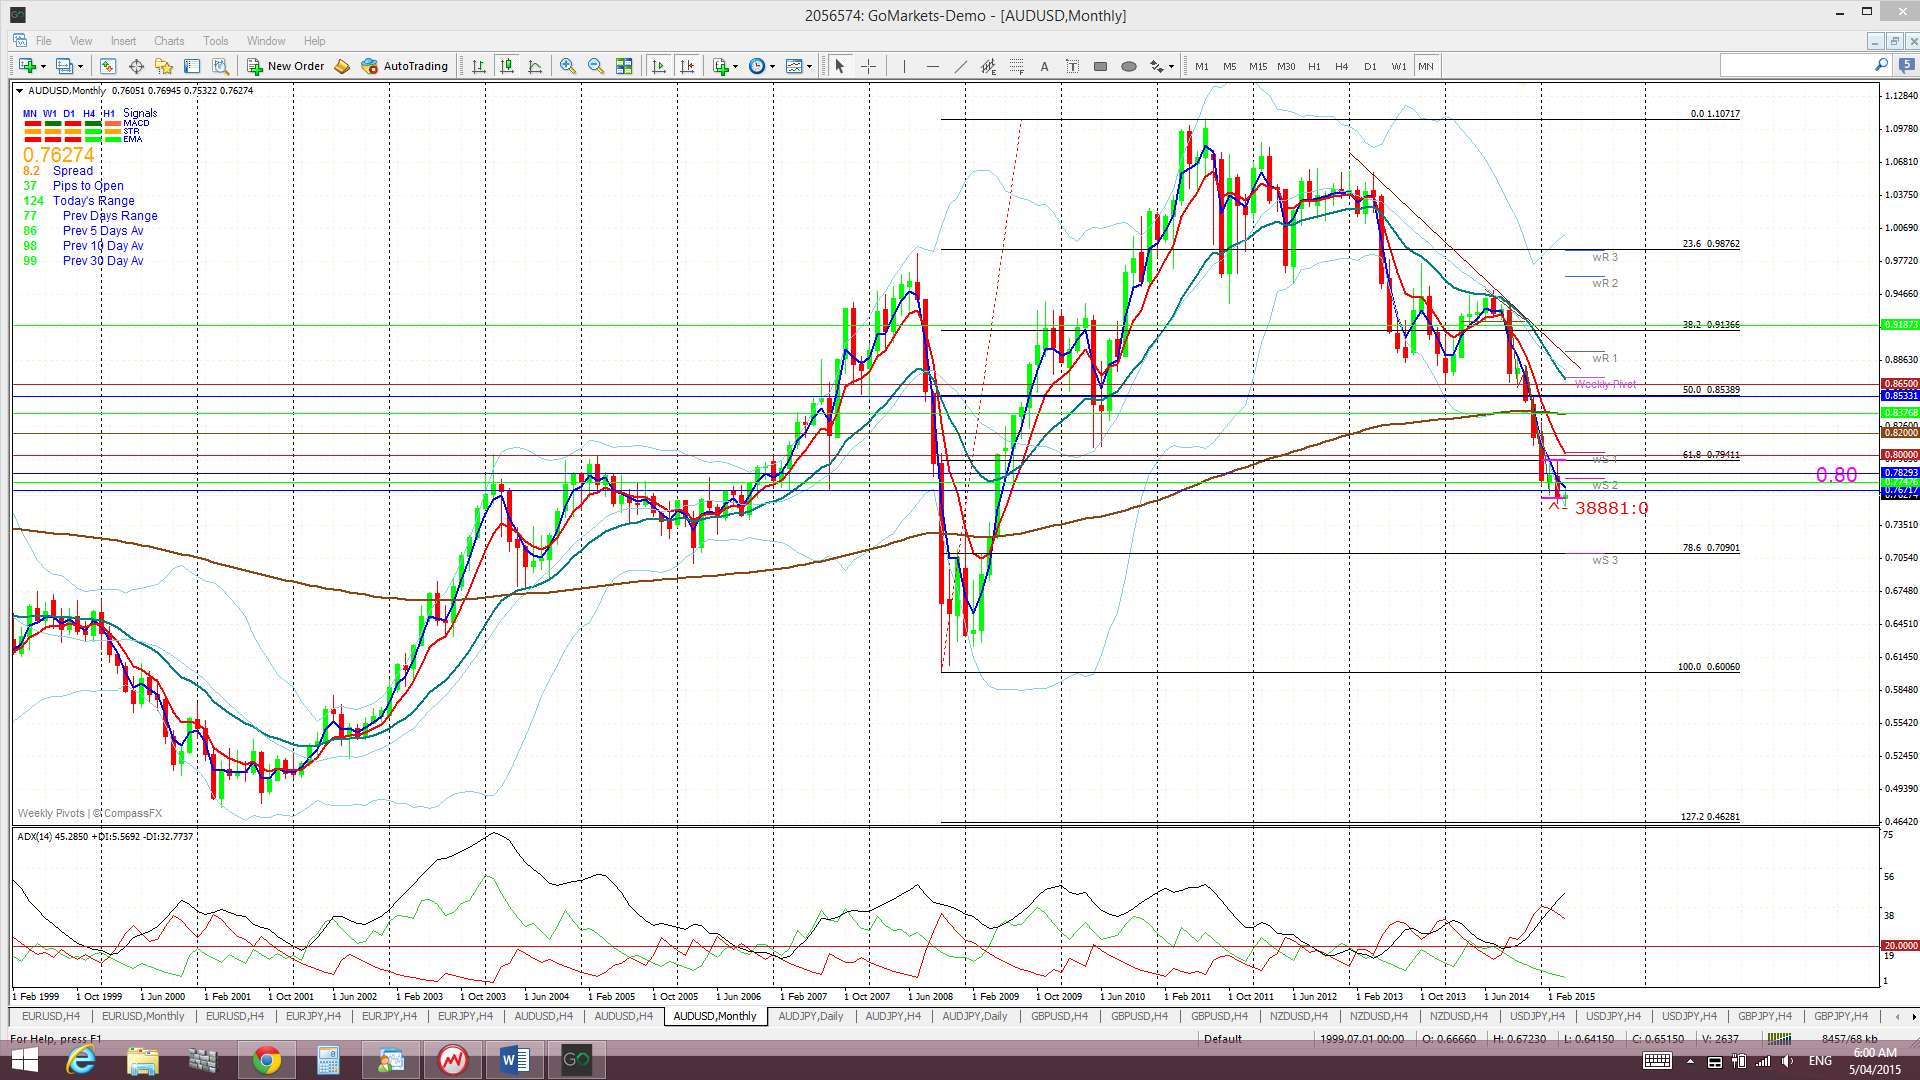
Price is trading below the Cloud on the 4hr, daily, weekly and monthly charts.
The weekly candle closed as a small bearish candle. However the March candle closed as a bearish , almost ‘engulfing’ candle.
Risk events for this pair include RBA interest rate news, FOMC minutes and Chinese CPI data as well as any Grexit related issues.
- I’m watching for any new TC signal on this pair and 0.765 support.

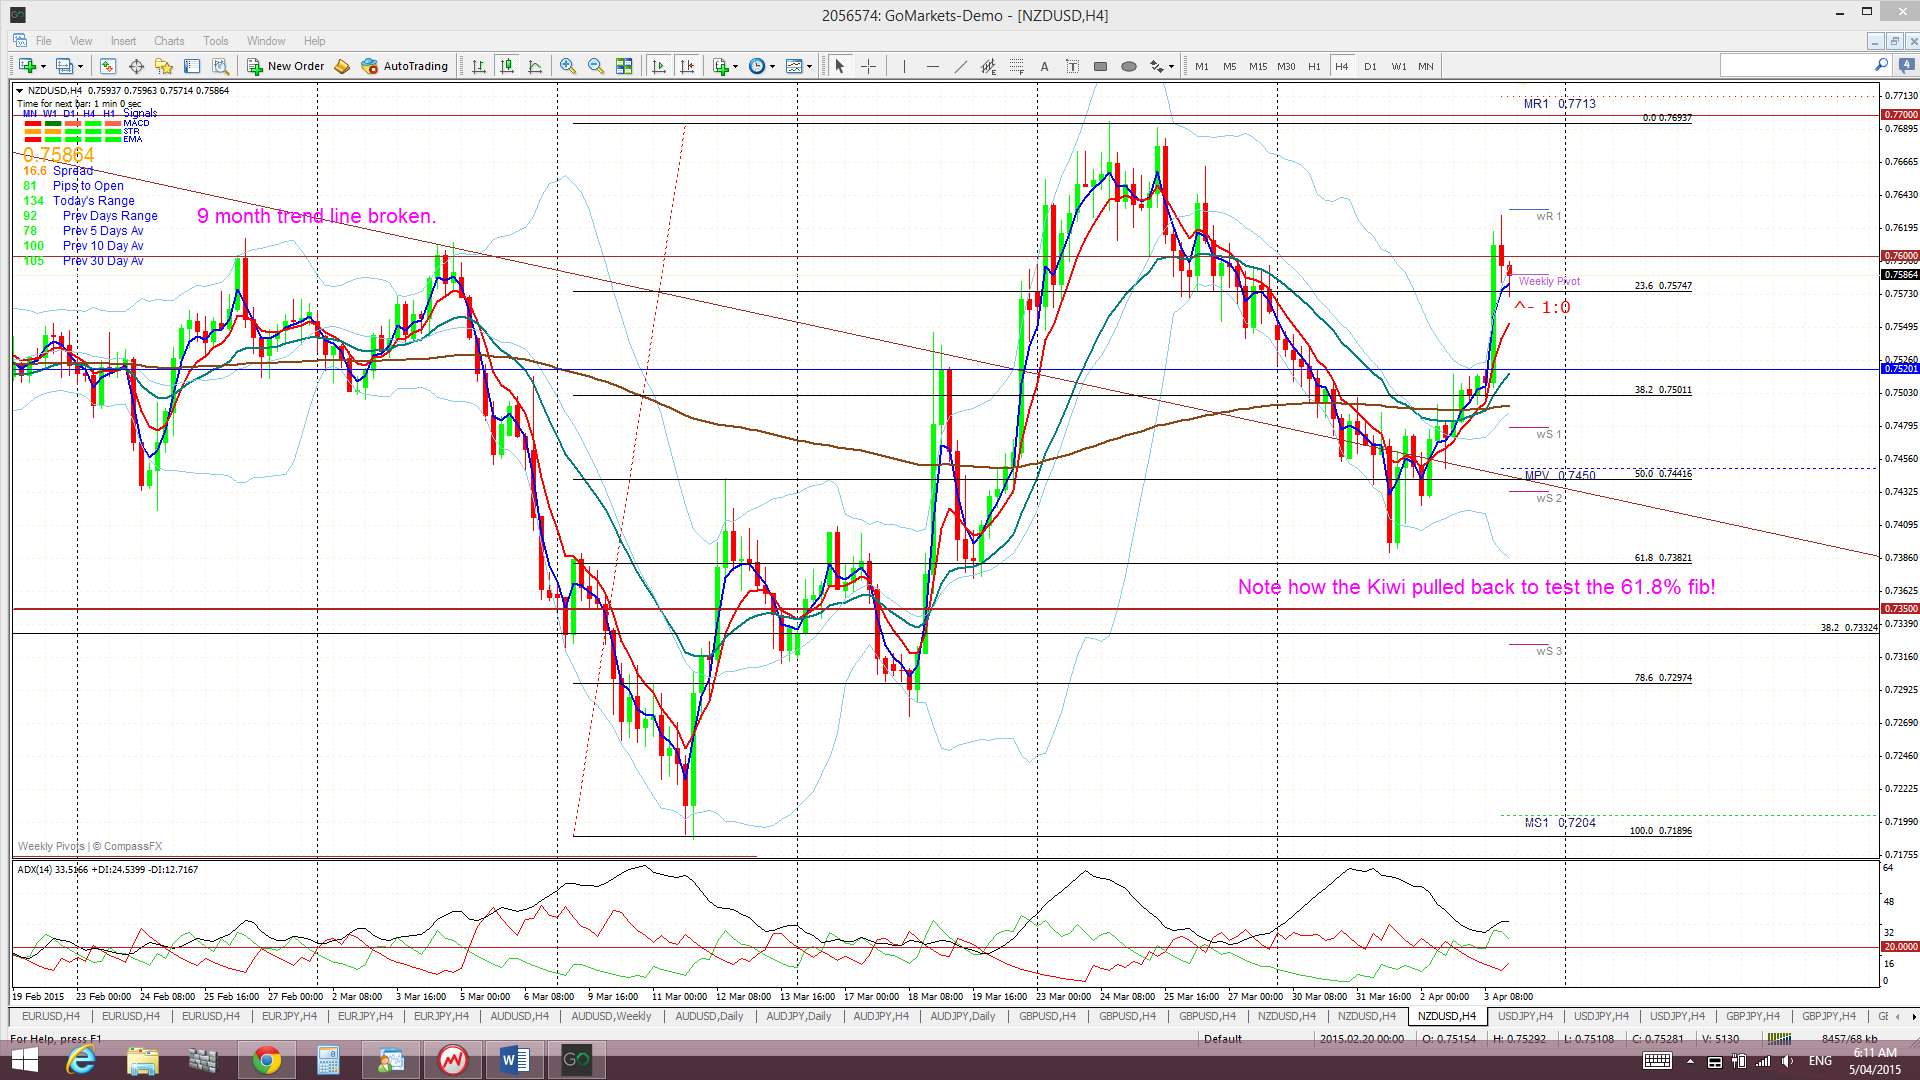
Kiwi: NZD/USD: The Kiwi pulled back last week and tested the 61.8% fib retracement level of the recent bull run. US$ weakness helped to support this pair and this was especially evident on Friday after NFP. Price closed the week near the weekly pivot and just under the 0.76 level whilst it considered it seems to be considering its options.
Next week will be an interesting one for the Kiwi as well given the AUD faces a potential routing on Tuesday if interest rates are cut. The AUD/NZD pair is trading just above parity at 1.005 and any AUD rate cut and fall could tip this pair below parity. It is not just because I’m an Aussie and find this situation untenable but, really, think about it. No offence intended but New Zealand has a population of just 4.5 million plus some grapes, sheep and cows! This currency situation won’t have escaped the NZ Prime Minister John Key as he is a former currency trader himself and he won’t be too happy with a dip below parity. Aussies make up the greatest number of tourists to New Zealand and, with tourism contributing 9% of GDP (directly and indirectly) and responsible for employing 6% of the population, a situation of AUD/NZD below parity won’t be popular for the Kiwis either! Tourism is vitally important to New Zealand, so much so, that Prime Minister John Key is also the Minister for Tourism! So, you can see why I suggested Tuesday was shaping up to be one interesting day!
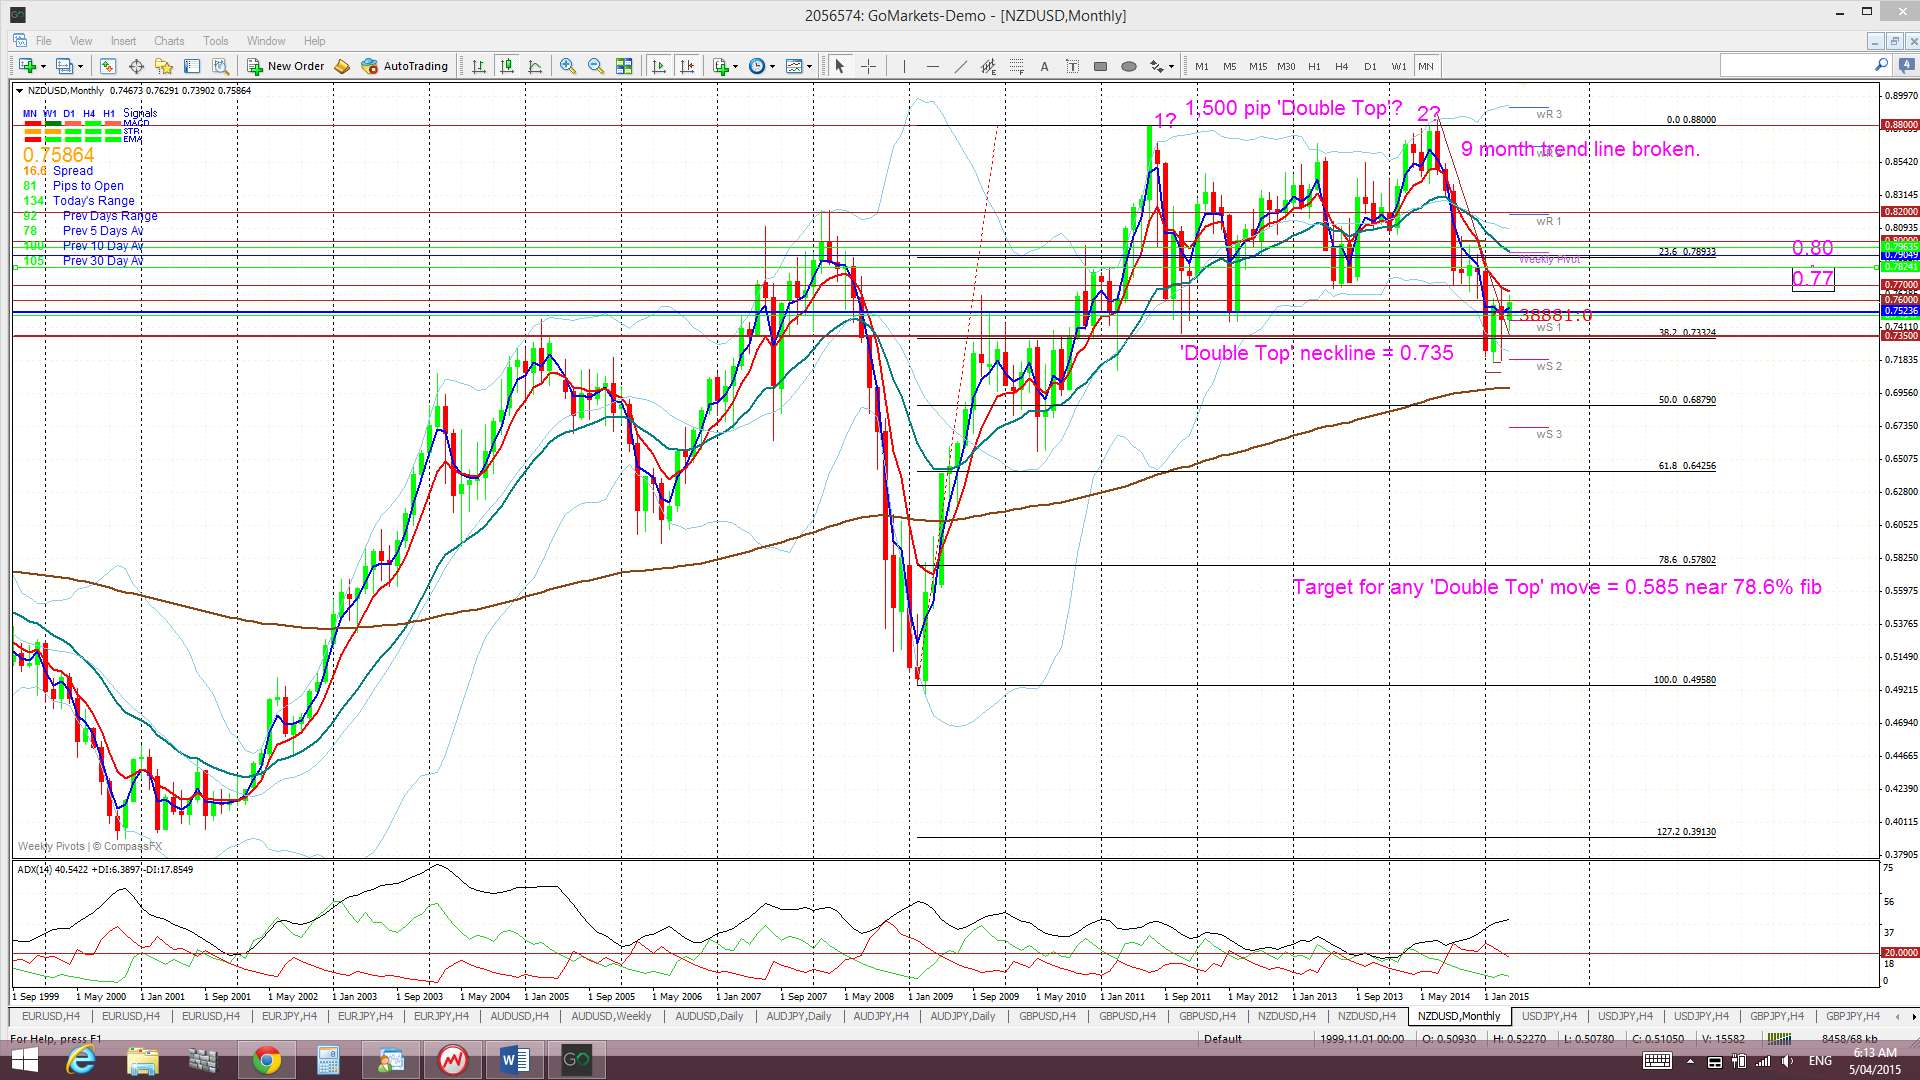
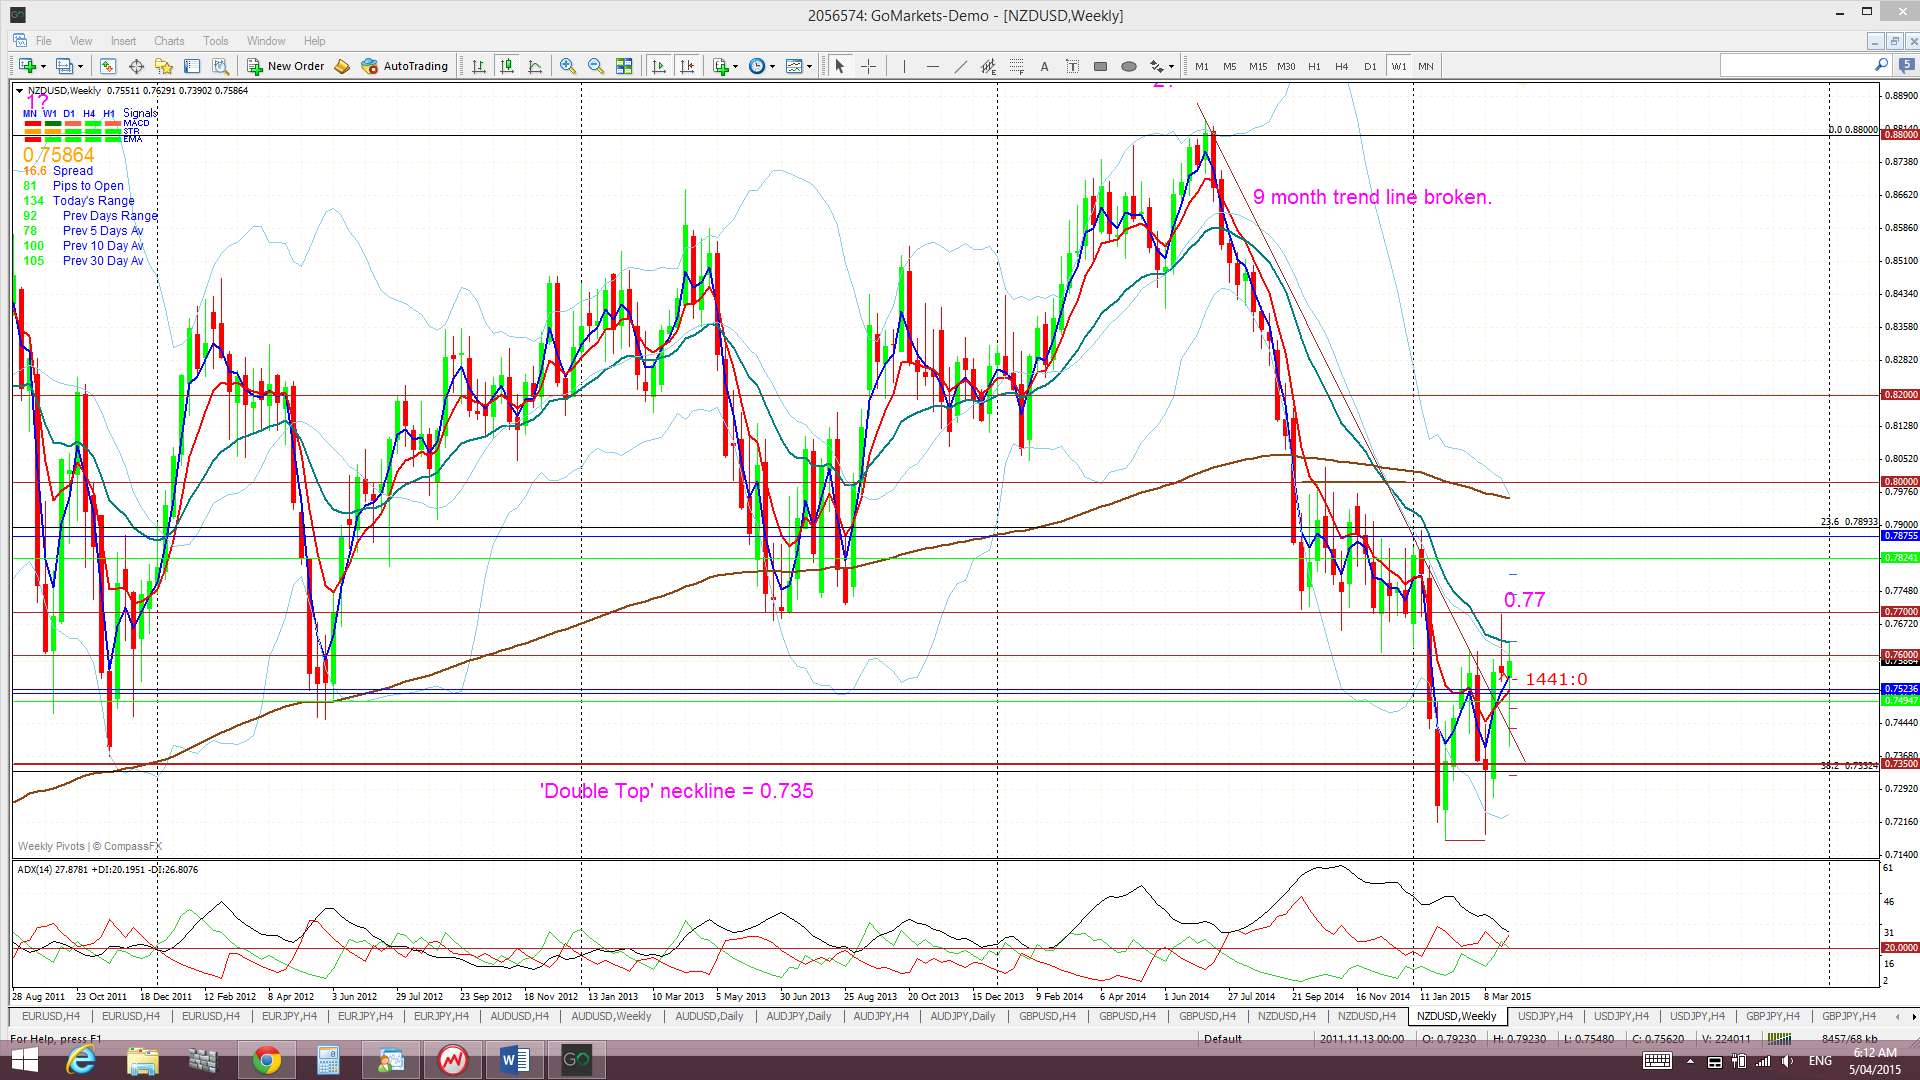
‘Double Top’ breakdown on Monthly chart? The monthly chart still reveals a possible ‘Double Top’ pattern with a neck line at 0.735 in the making. The monthly candle close below this level for January suggested a possible 2,000 pip bearish follow through move as this is the height of the ‘Double Top’ BUT there does not seem to be a hold below this key level JUST YET. This may still well evolve, especially if the USD index regains its bullish mojo but any reversal on the USD index could see Kiwi continue to bounce up off this major support.
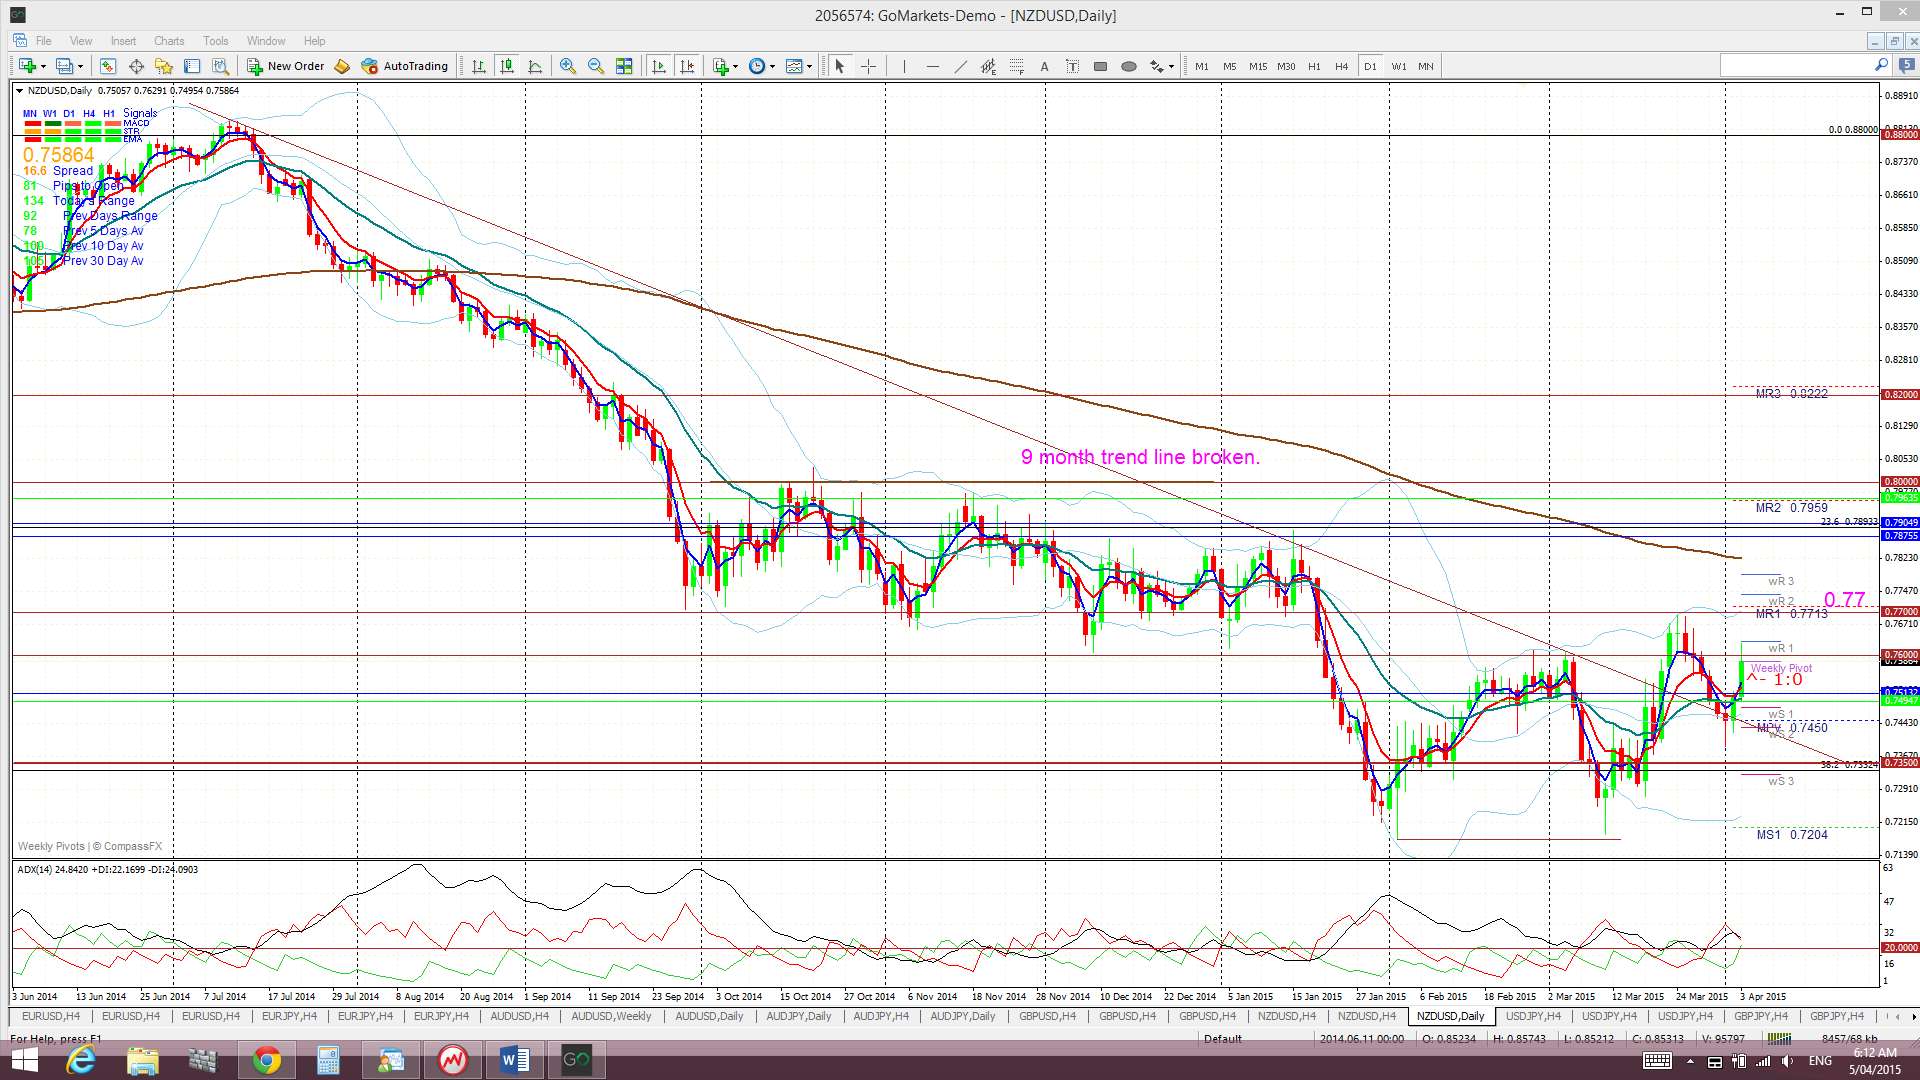
Price is still trading above the Ichimoku Cloud on the 4hr and daily charts, below on the weekly chart but in the middle of the Cloud on the monthly chart.
The weekly candle closed as a small bullish candle with a long lower shadow. However, the March candle closed as a bearish candle with long upper and lower shadows reflecting some indecision here.
Key risk events here include flow on effect from AUD interest rate news, FOMC minutes and Chinese CPI data and, of course, any major Grexit news events.
- I’m watching for any new TC signal on this pair.
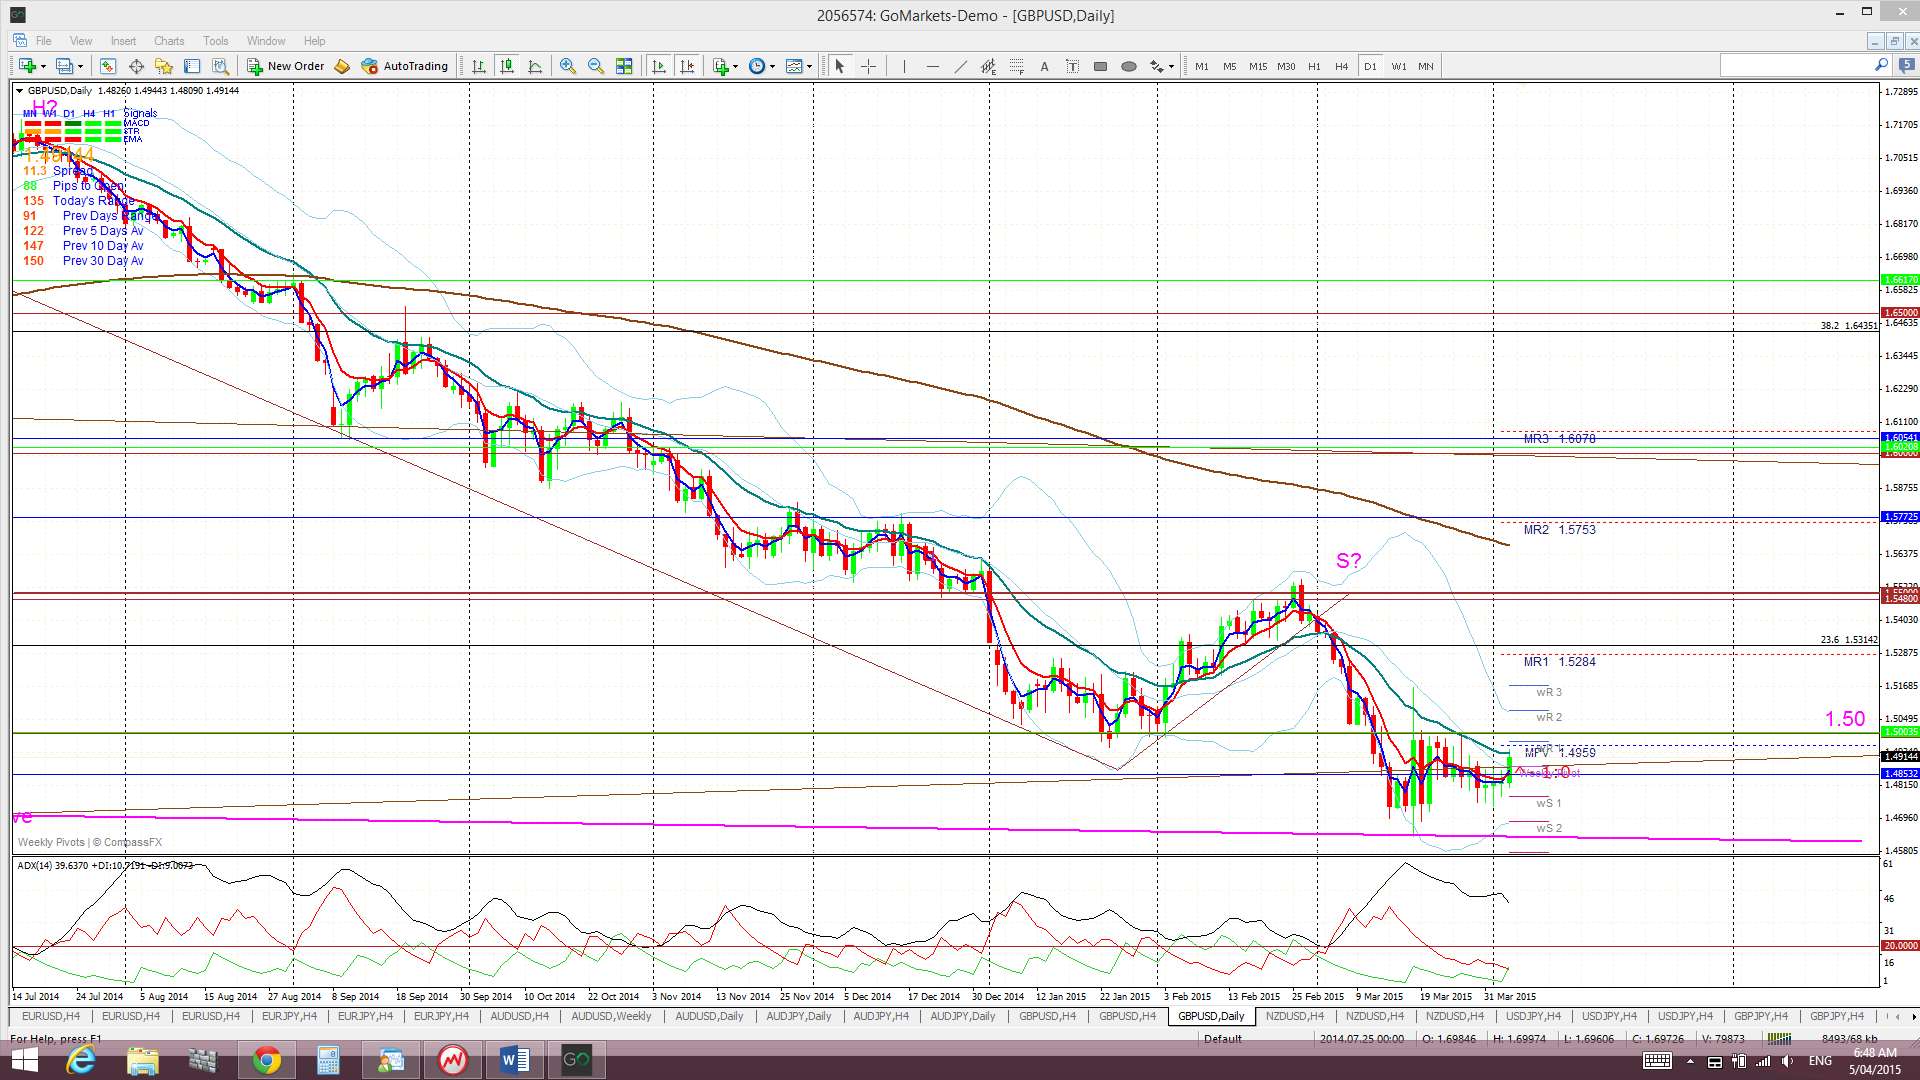
G/U: The Cable continued to chop along under the 1.50 level last week and this remains a key level to watch. US$ weakness crept in after Friday’s NFP result and continued weakness here could translate into positive news for the GBP/USD. The UK election landscape has been a negative for this pair of late BUT any negative EUR flows with Grexit concern could help to boost the GBP through EUR/GBP flows. Thus, the GBP/USD may also be a pair to experience some sharp movement from any April 9th Greek debt related currency movement.
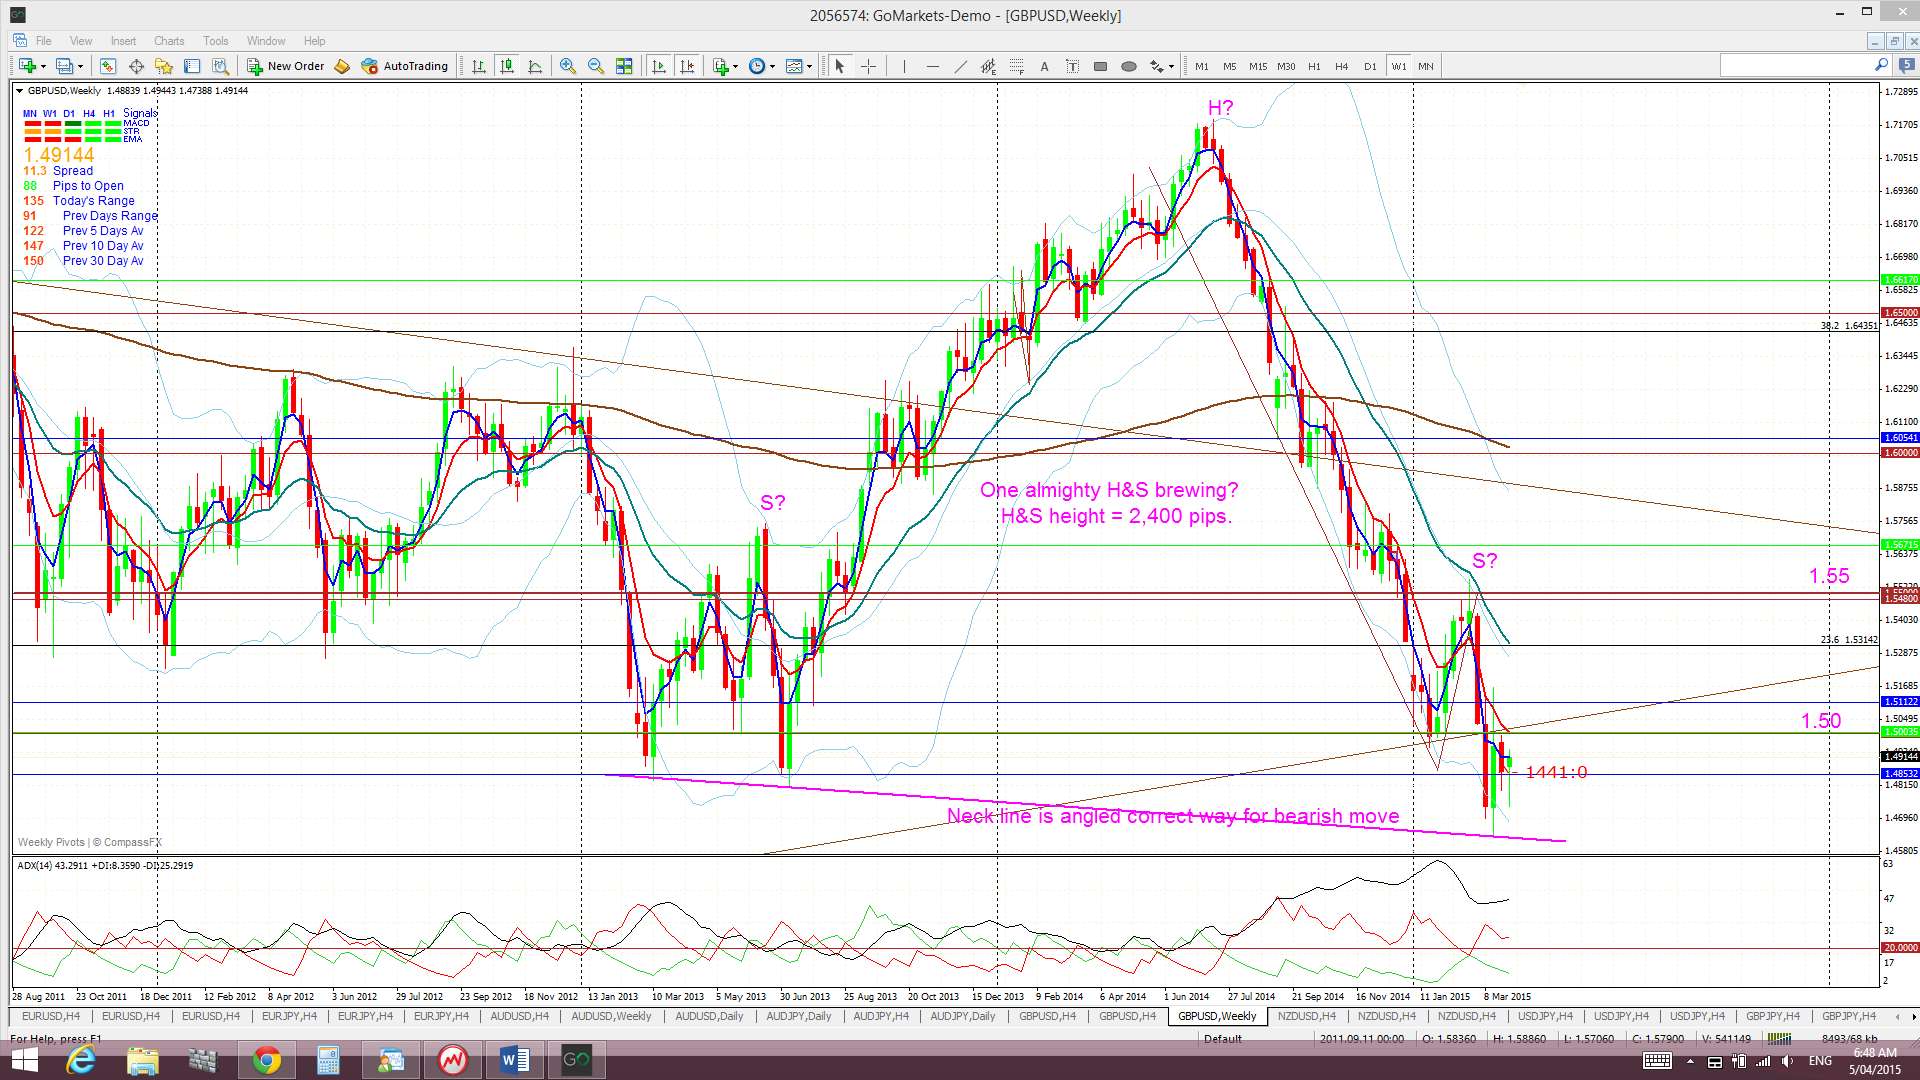
Despite all of this potential flow-on movement, the GBP/USD has now printed a monthly close below 1.50, the first since June 2010, and this is a bearish development that supports the H&S forming on the weekly chart.
Weekly chart H&S: There is a possible bearish H&S pattern forming on the weekly chart. The height of the pattern is about 2,400 pips and suggests a similar move lower with any break and hold below the ‘neck line’.
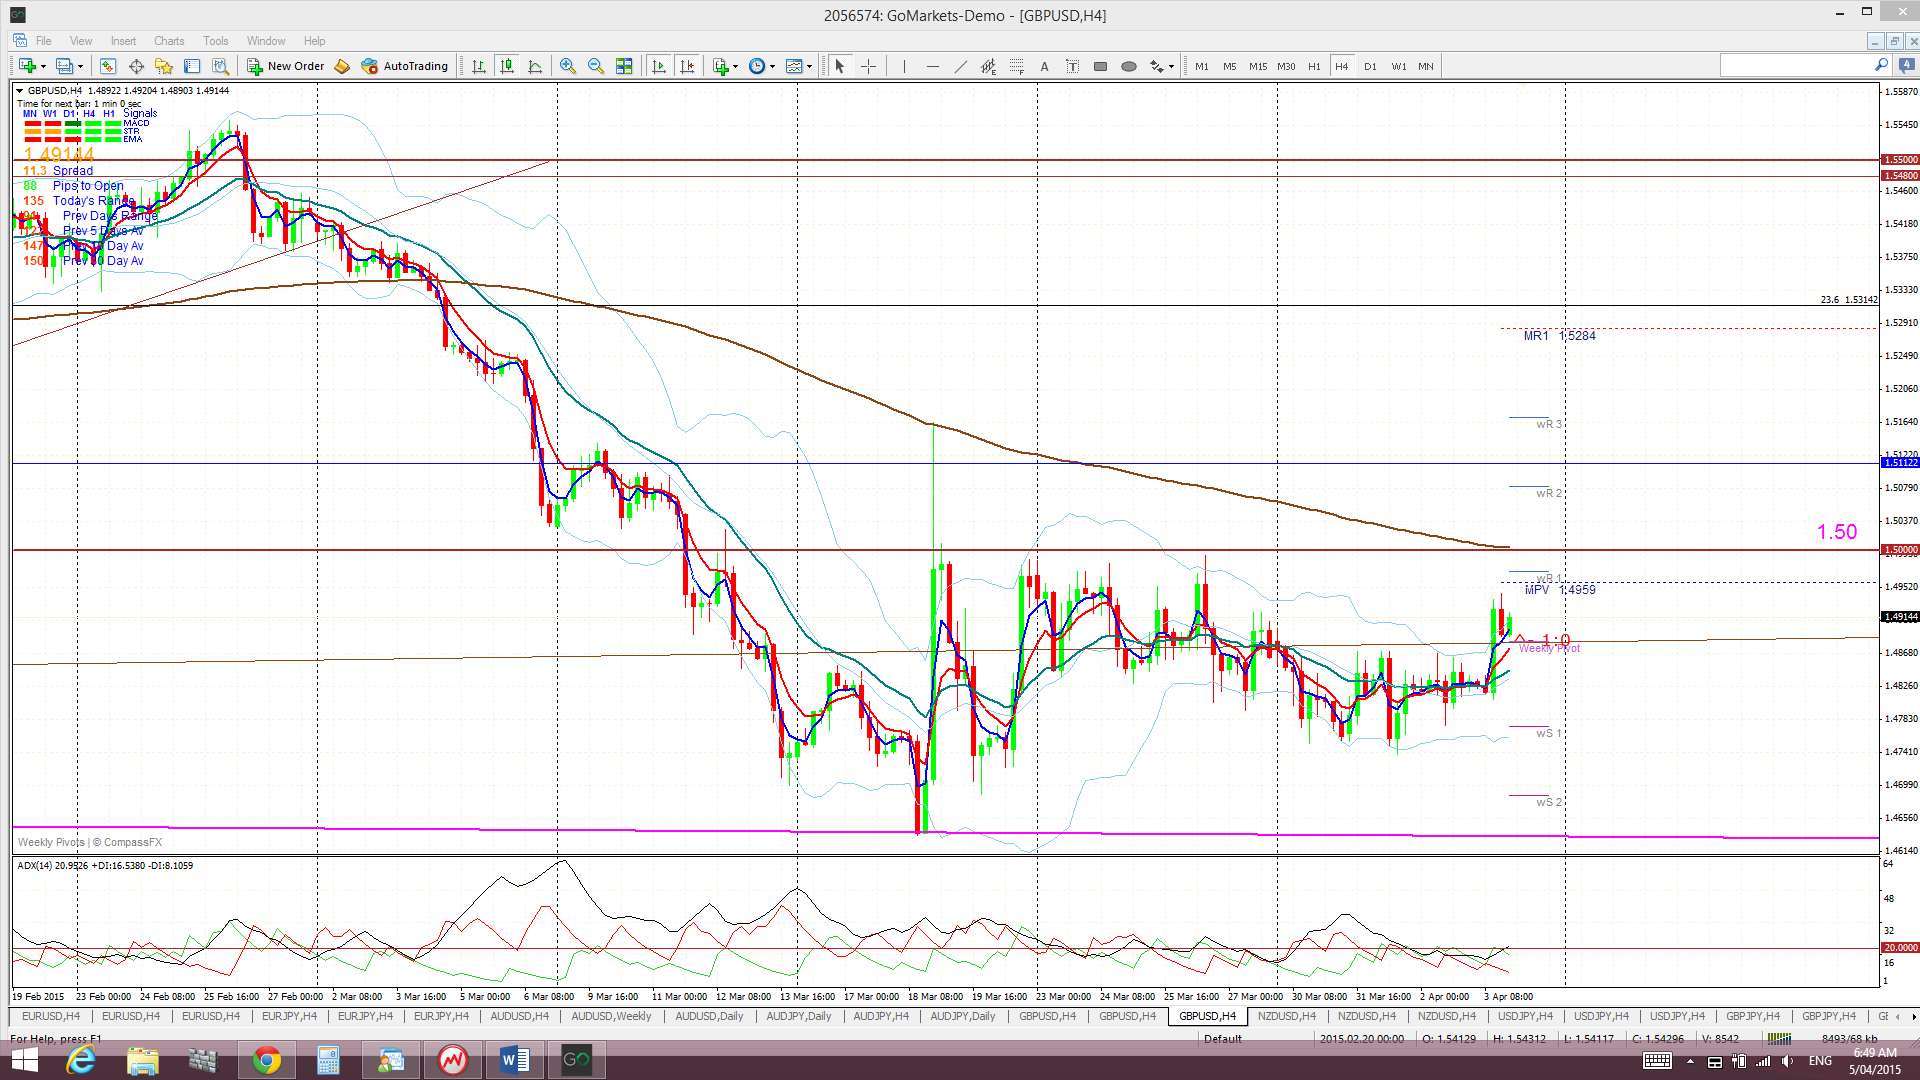
Price is trading above the Cloud on the 4hr chart but below the Cloud on the daily, weekly and monthly charts.
The weekly candle closed as a small bullish candle with a long lower shadow and also as an ‘inside’ candle reflecting the indecision here. However the March candle closed as a large bearish candle.
Risk events here include GBP interest rate news, FOMC minutes, the Greek debt payment on April 9th and GBP Services PMI.
- I’m watching for any new TC signal on this pair and the 1.50 level.

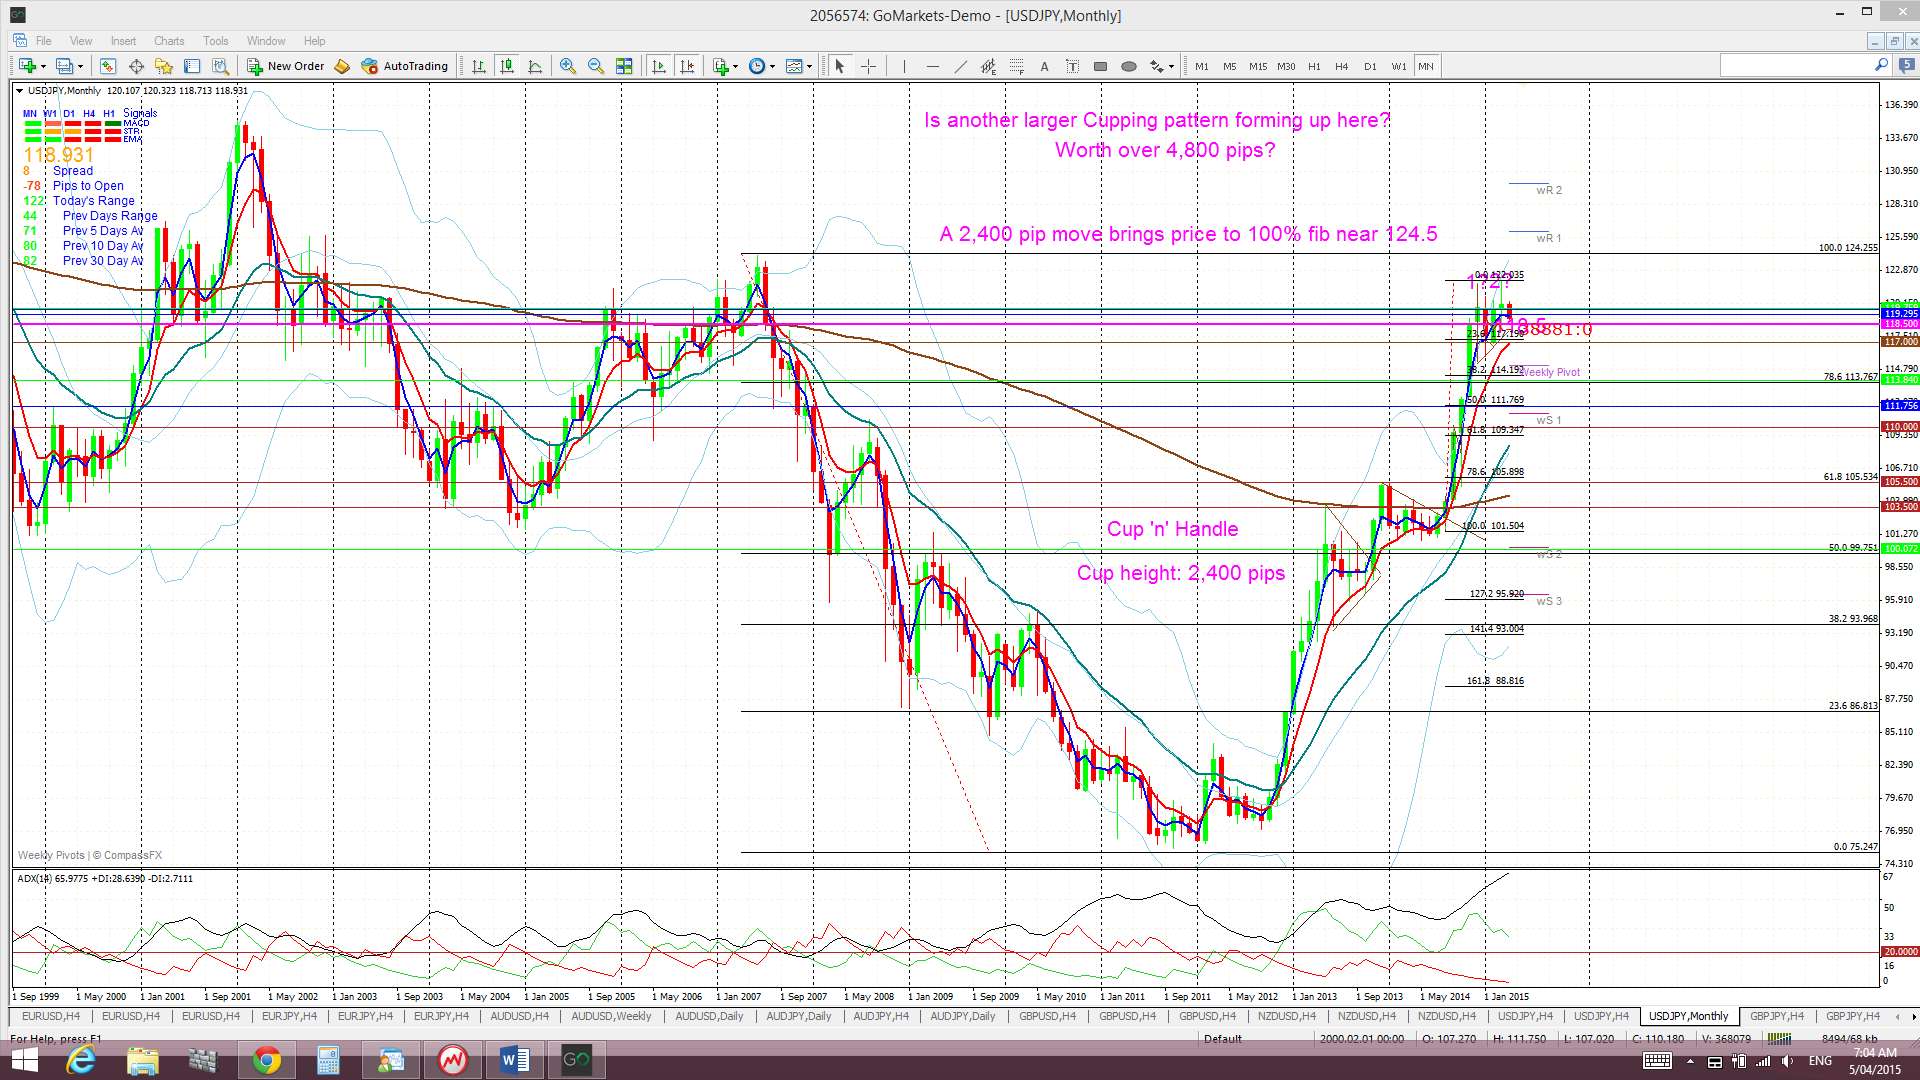
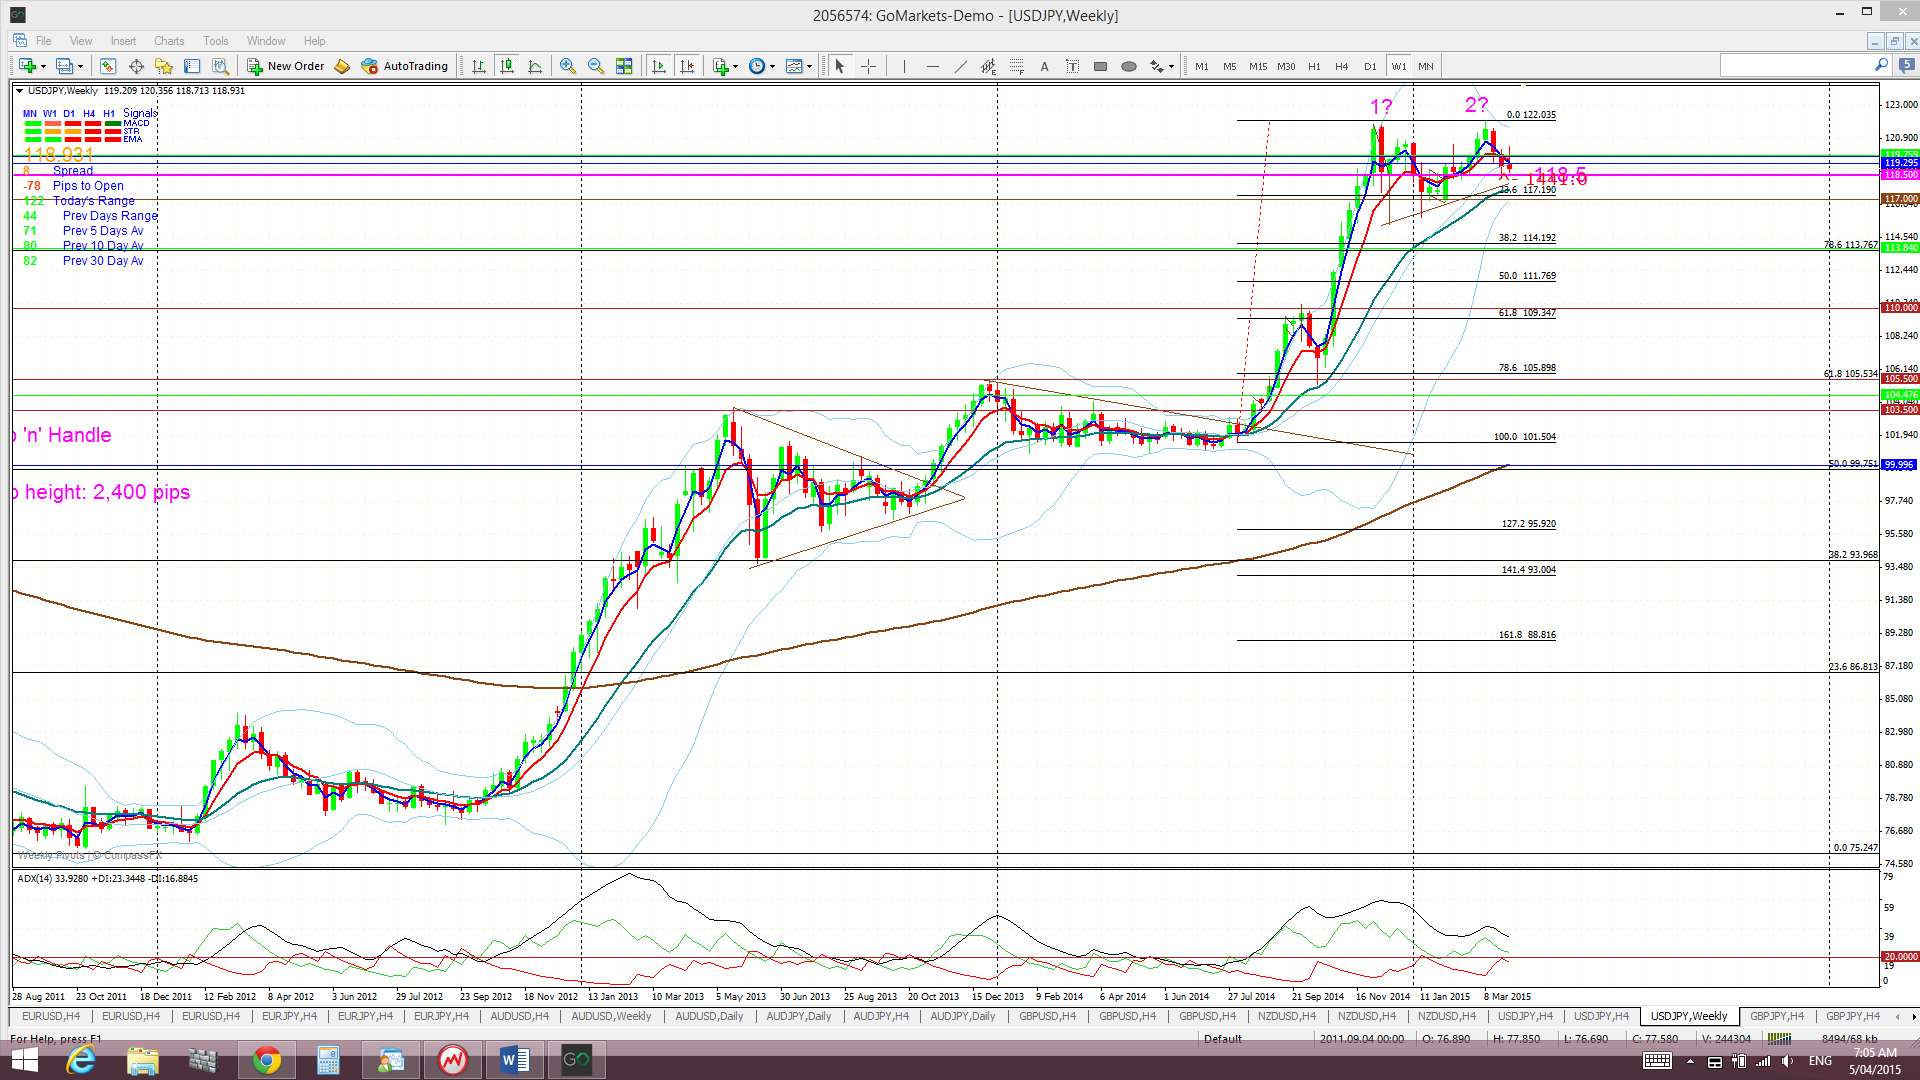
The Yen: U/J: Price action was choppy again here with US$ strength helping to lift the pair earlier in the week but US$ weakness then dragging this pair lower. Price managed to close the week above the 118.5 level and the daily/weekly charts show a bullish ascending triangle pattern of sorts. I do wonder though if this choppy triangle action isn’t the ‘Handle’ of the new Cup ‘n’ Handle that I am seeing develop on the monthly chart?
Price is still trading below the Cloud on the 4hr chart but above the Cloud on the daily (only just), weekly and monthly charts. November 2013 was the first monthly candle close above the Ichimoku Cloud since mid-2007 and the bullish hold above the monthly Cloud continues to be noteworthy.
The weekly candle closed as a small bearish candle and this makes two bearish candles now following on from a bearish engulfing candle. However, the March candle closed as a bullish coloured ‘Spinning Top’ reflecting the indecision here.
Weekly Chart Bullish Cup’ n’ Handle pattern: This pattern seems to have completed now just 200 pips short of the 2,400 pip target. The theory behind these patterns is that the height of the ‘Cup’ pattern is equivalent to the expected bullish move from the ‘handle’ breakout. The height of the Cup for the U/J weekly chart is around 2,400 pips. The interesting point here is that a 2,400 pip bullish move up from the ‘Handle’ would put price up near the 124 level. This level is the last major swing high for the U/J from back in 2007 and represents the 100% fib pullback for the move down in 2007 to the lows of 2012. This pattern has given up to 2,200 pips of the 2,400 pip target! Watch for another, larger Cup ‘n Handle forming up on the monthly chart worth a possible 4,800 pips though!
Risk events here include the BoJ interest rate announcement, FOMC minutes and any fallout from the Greek debt obligations.
- I’m watching for any new TC signal on this pair, the 118.5 level and the daily/ weekly chart triangle trend lines.


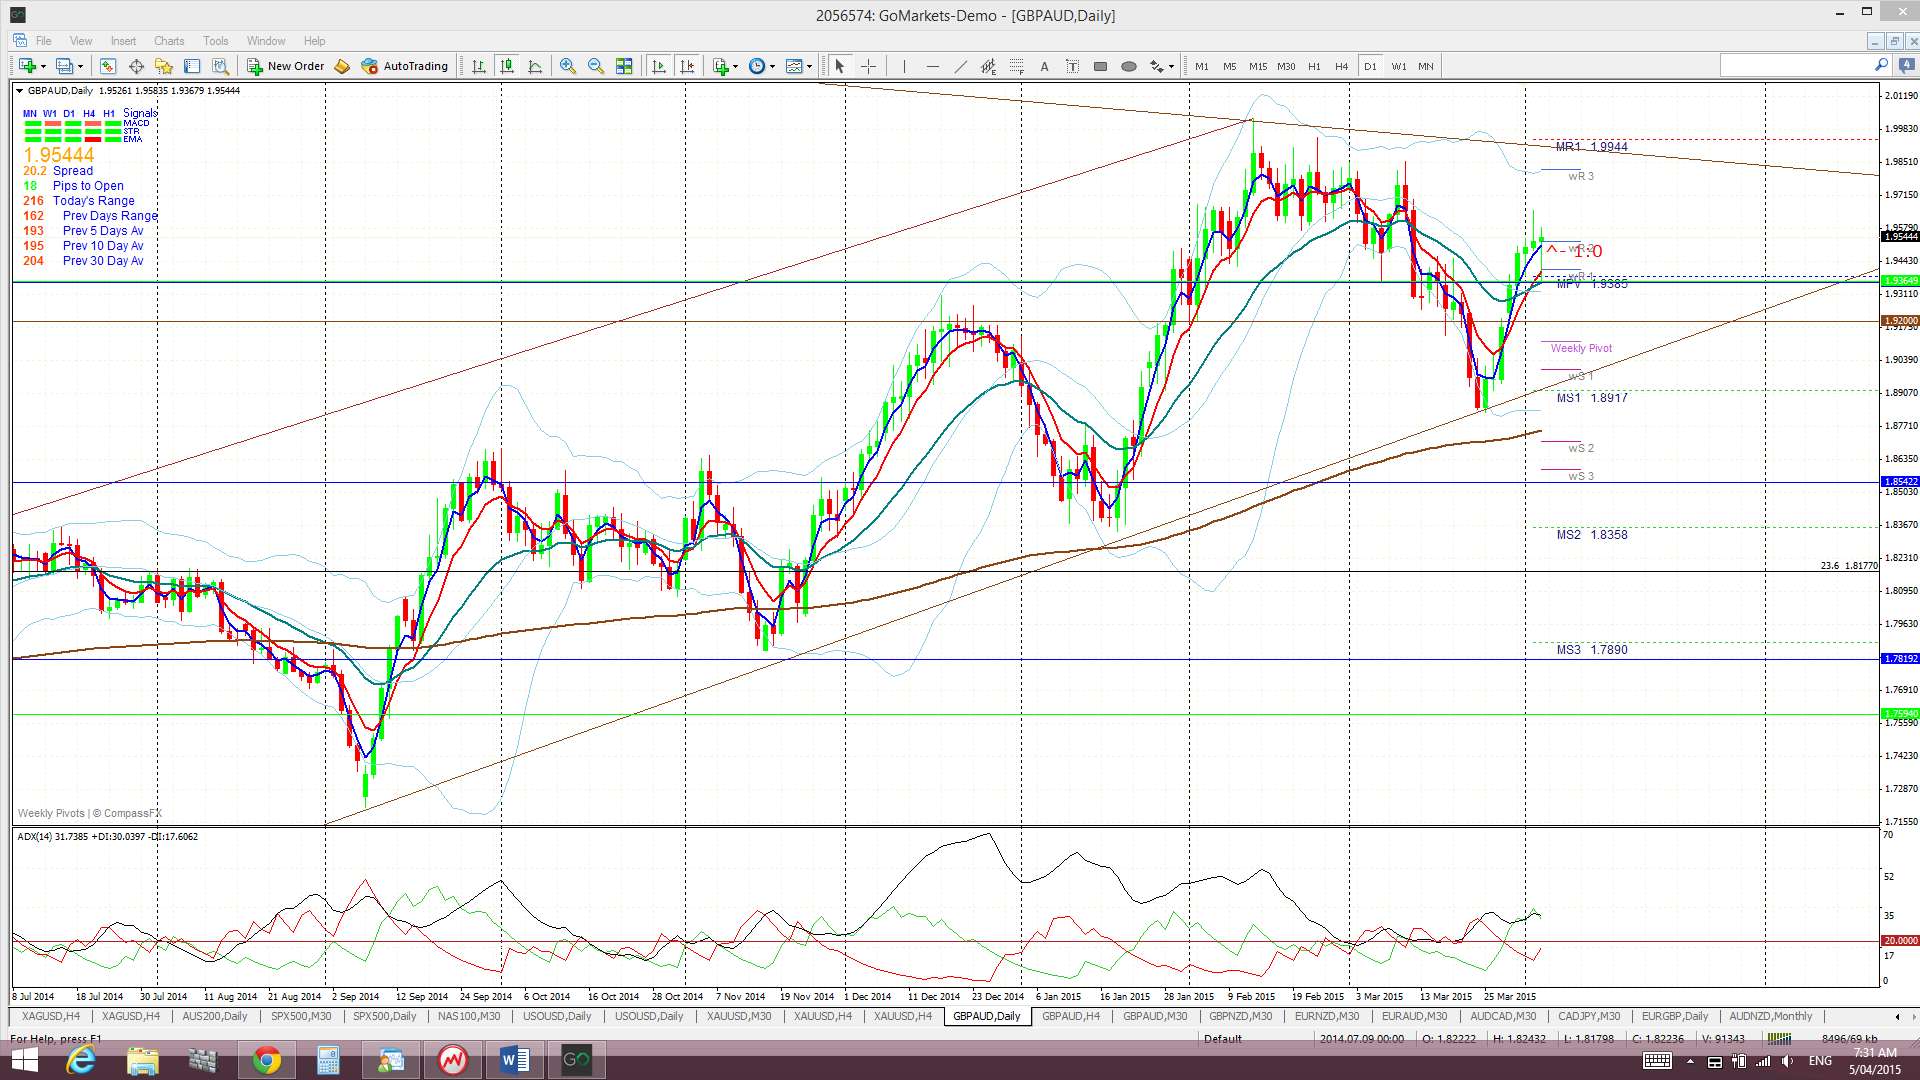
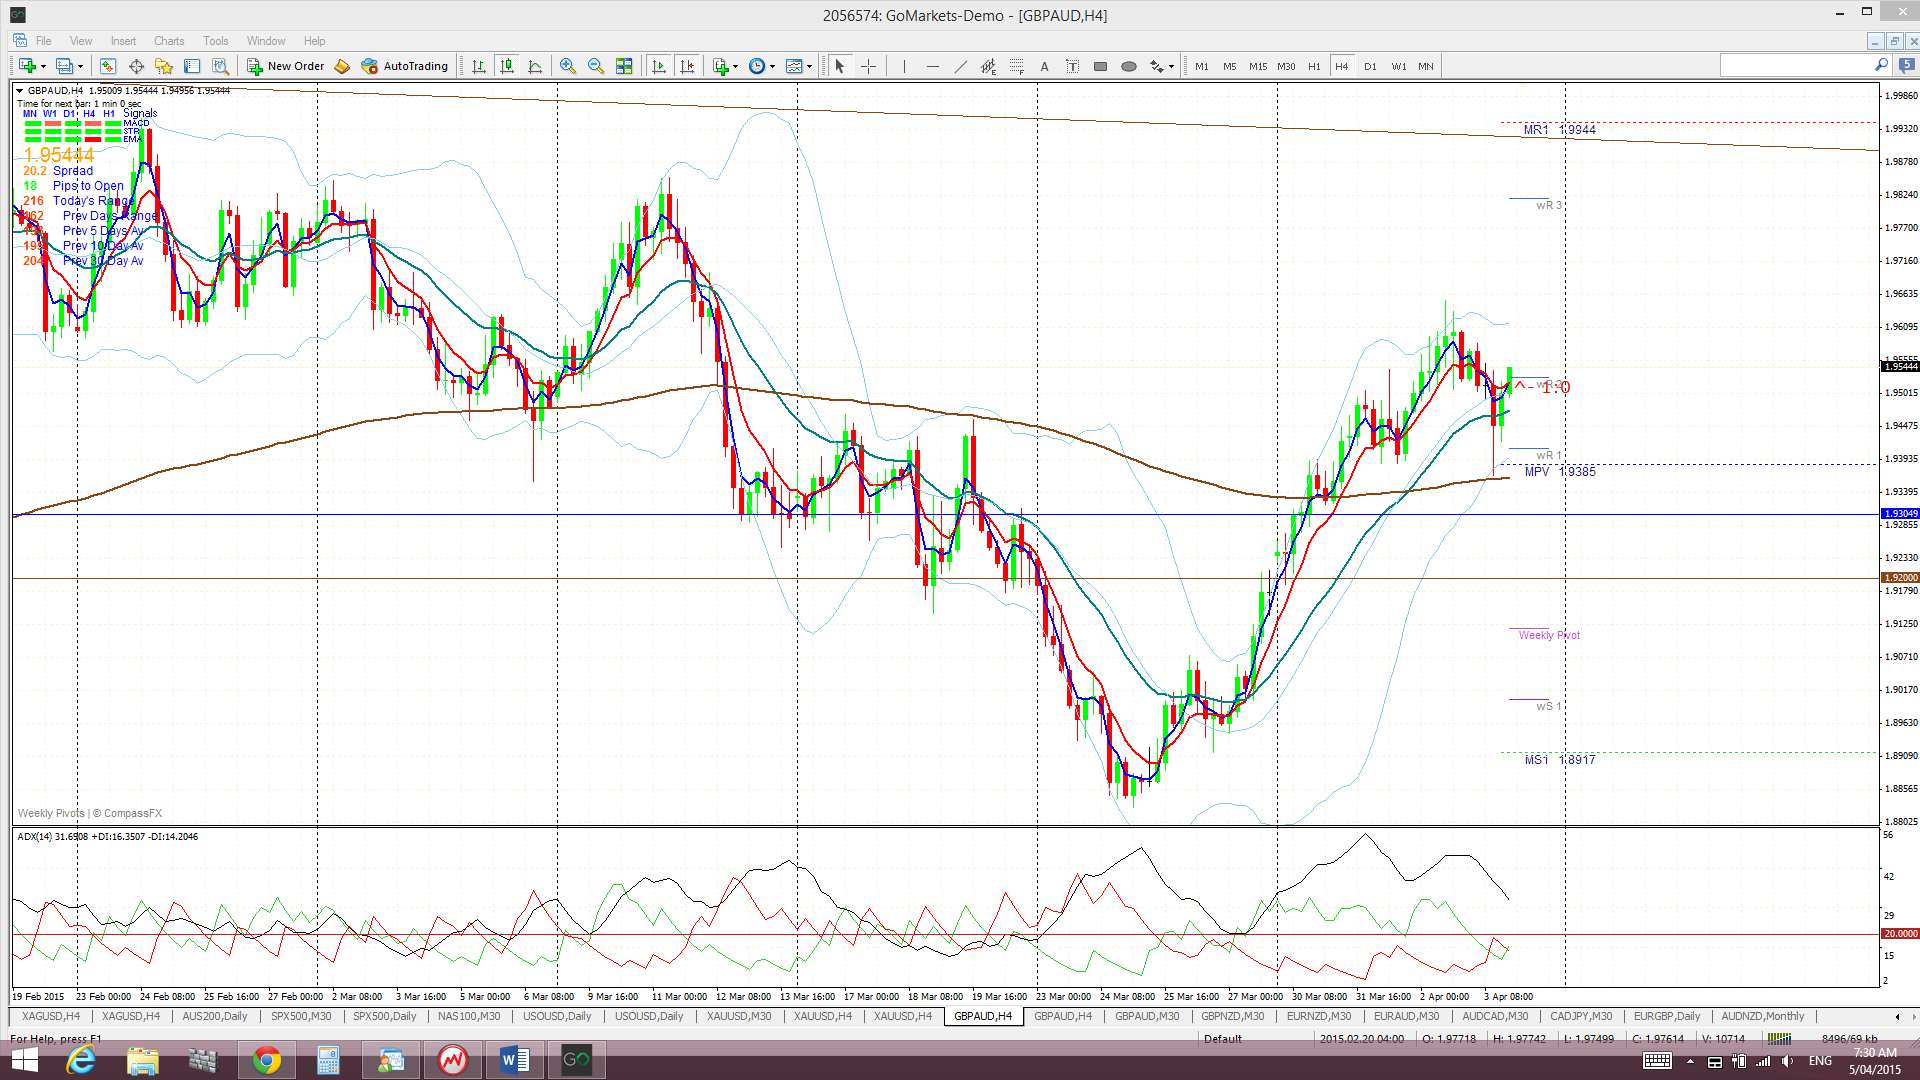
GBP/AUD: I used to cover this pair but dropped it in an effort to stream line my focus. It may be worth considering again given the current landscape with the A/U and GBP/USD though.
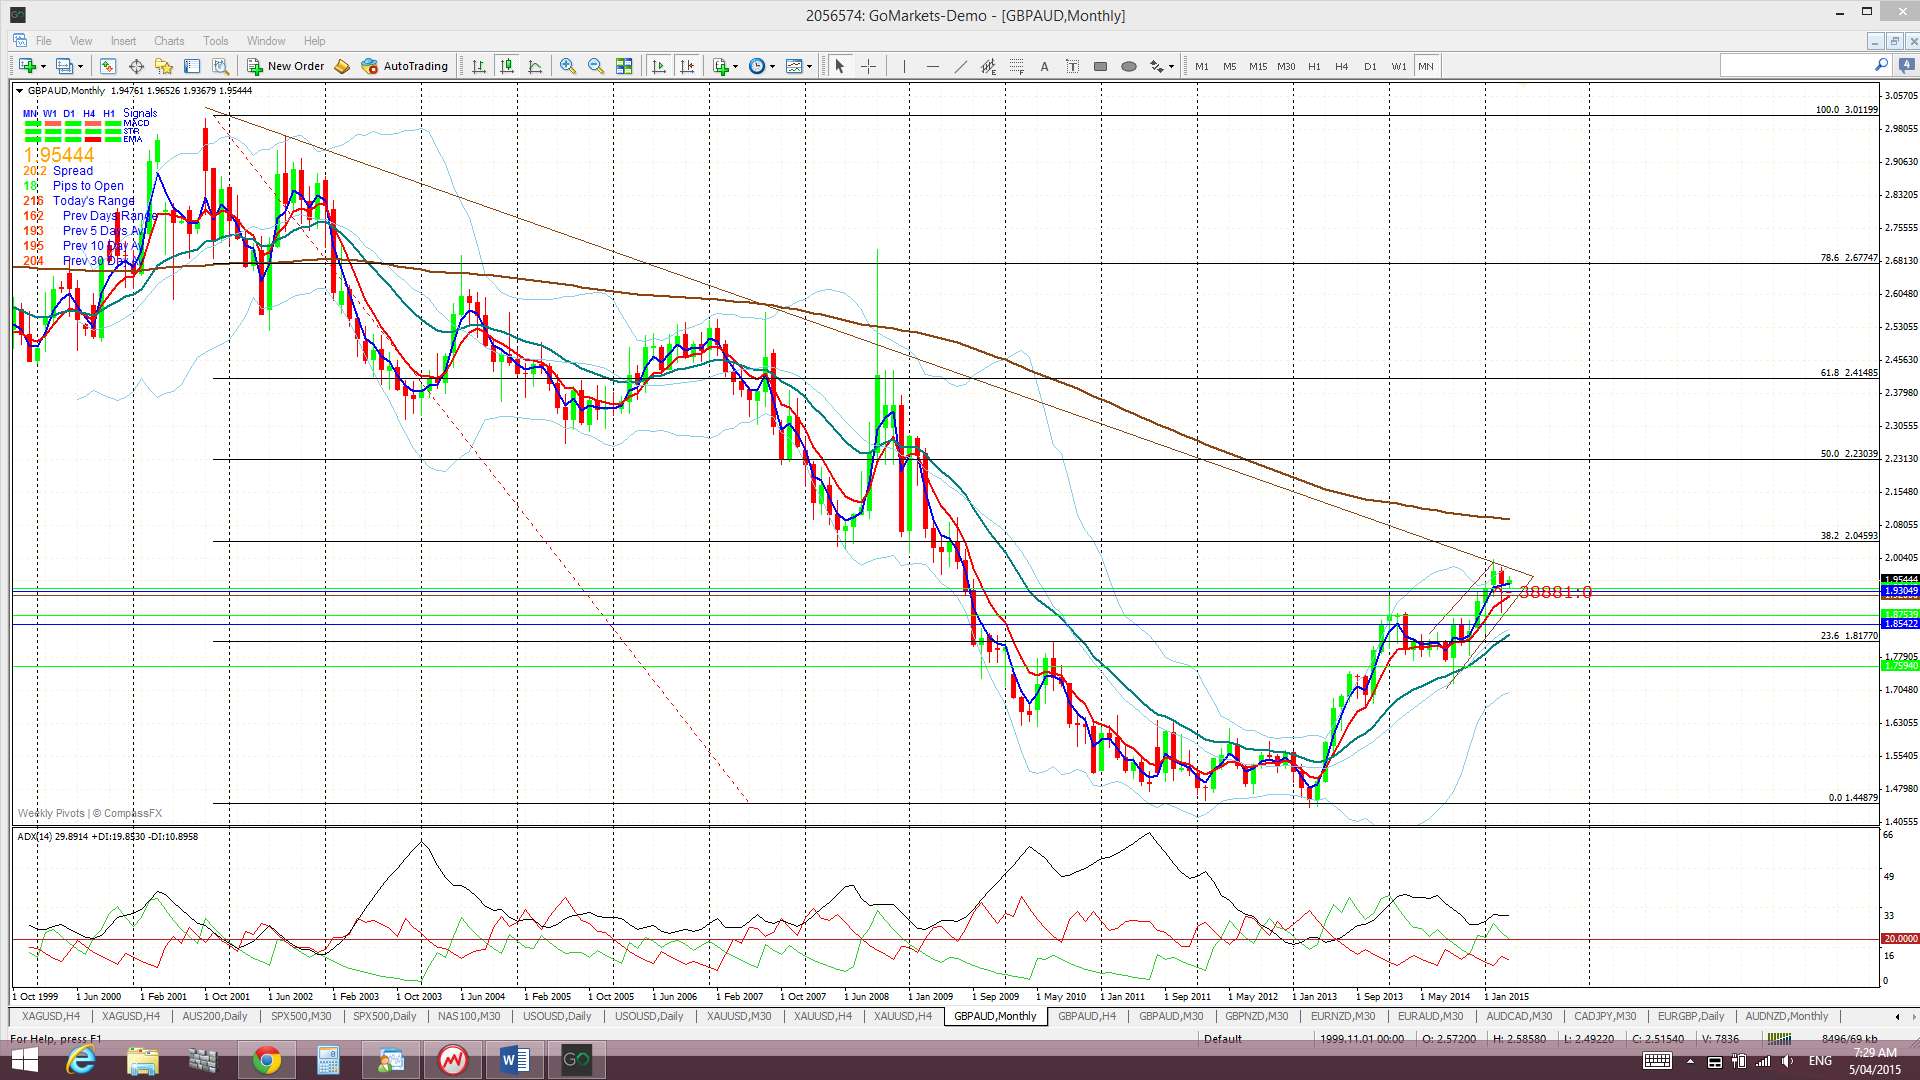
The AUD may be set to weaken if rates are cut this week and the GBP could strengthen in any EUR related flows from Greek debt negotiations. Tie this in with the fact that the GBP/AUD is sitting under a major monthly trend line and you can see why this pair has come back into focus for me.
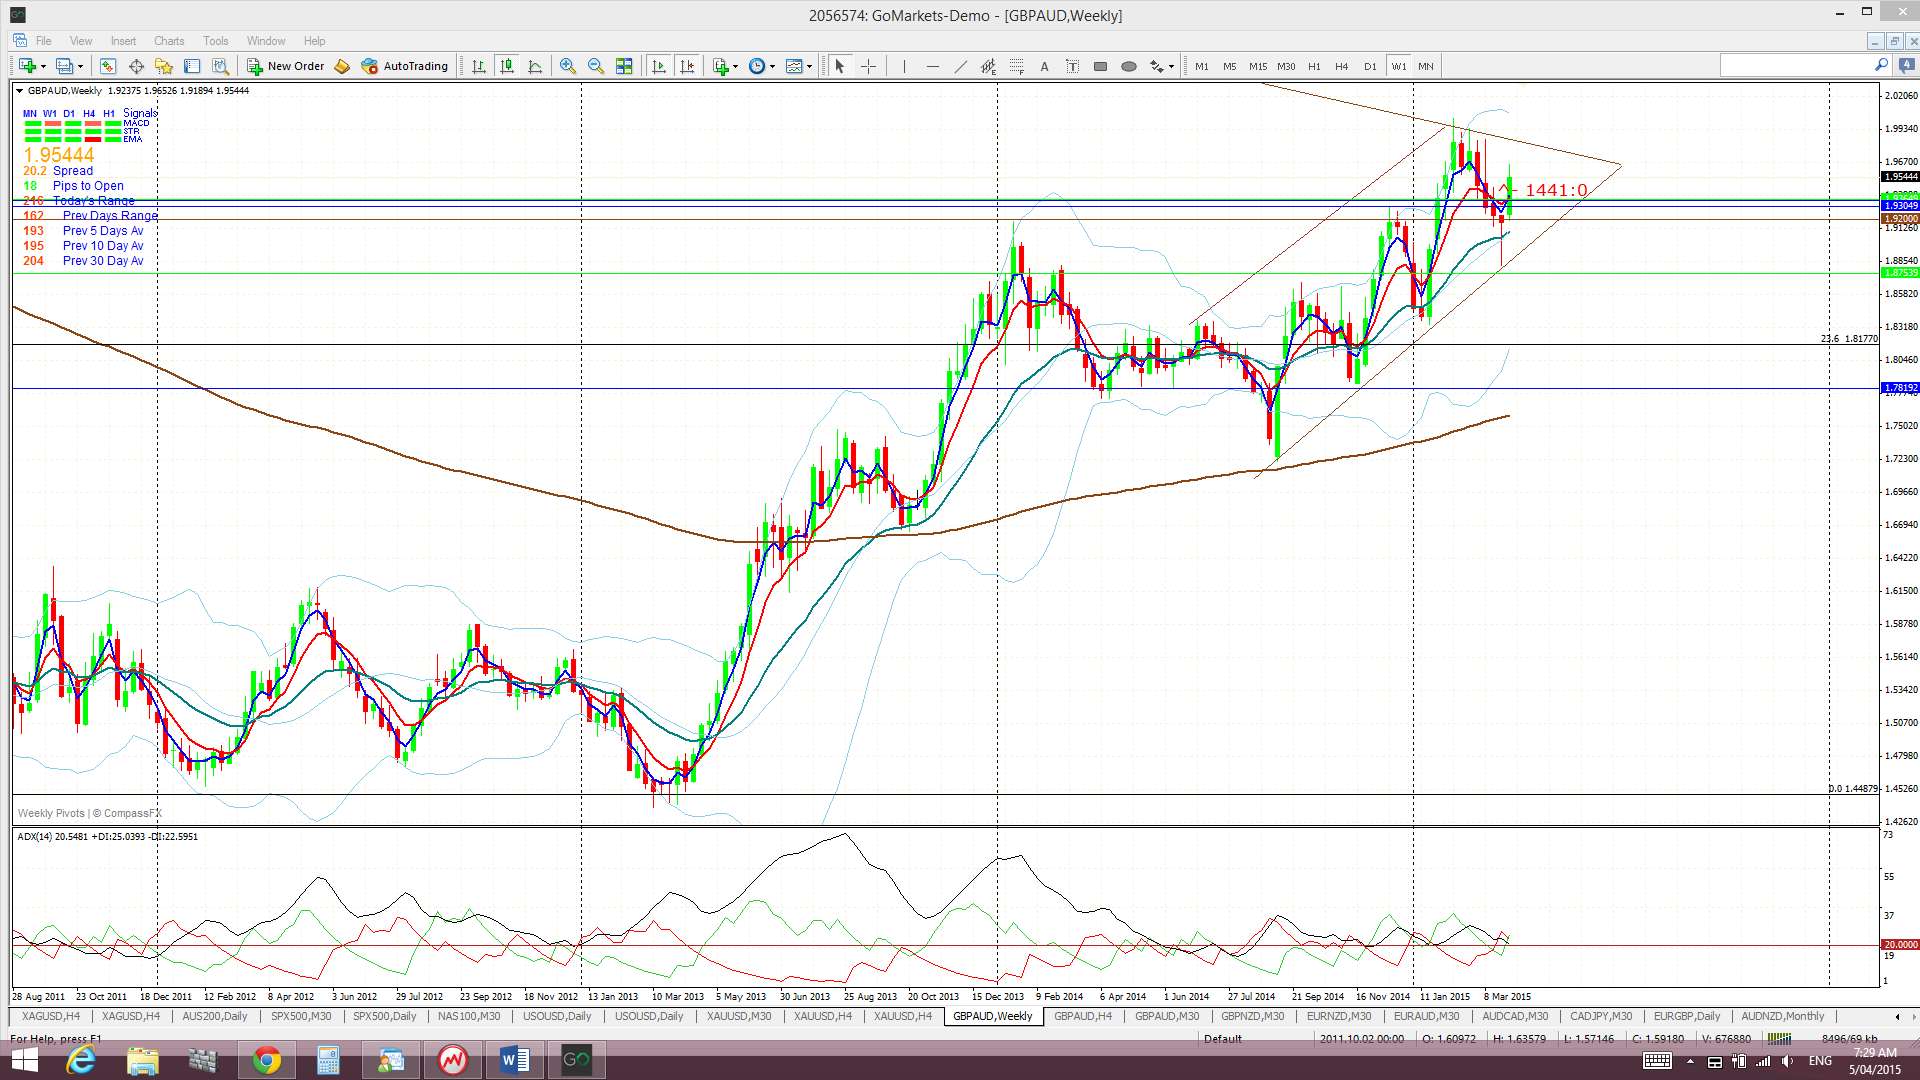
Price action has been conforming to an ascending trading channel on the weekly chart but this action is bringing price up to a bear trend line on the monthly chart.
I had previously discussed this pair as looking like it was about to make a major trend line break and possible Cup ‘n’ Handle breakout. This is still the case and it is also now trading above the Ichimoku Cloud on the 4hr, daily, weekly and monthly (albeit only just) time frames.
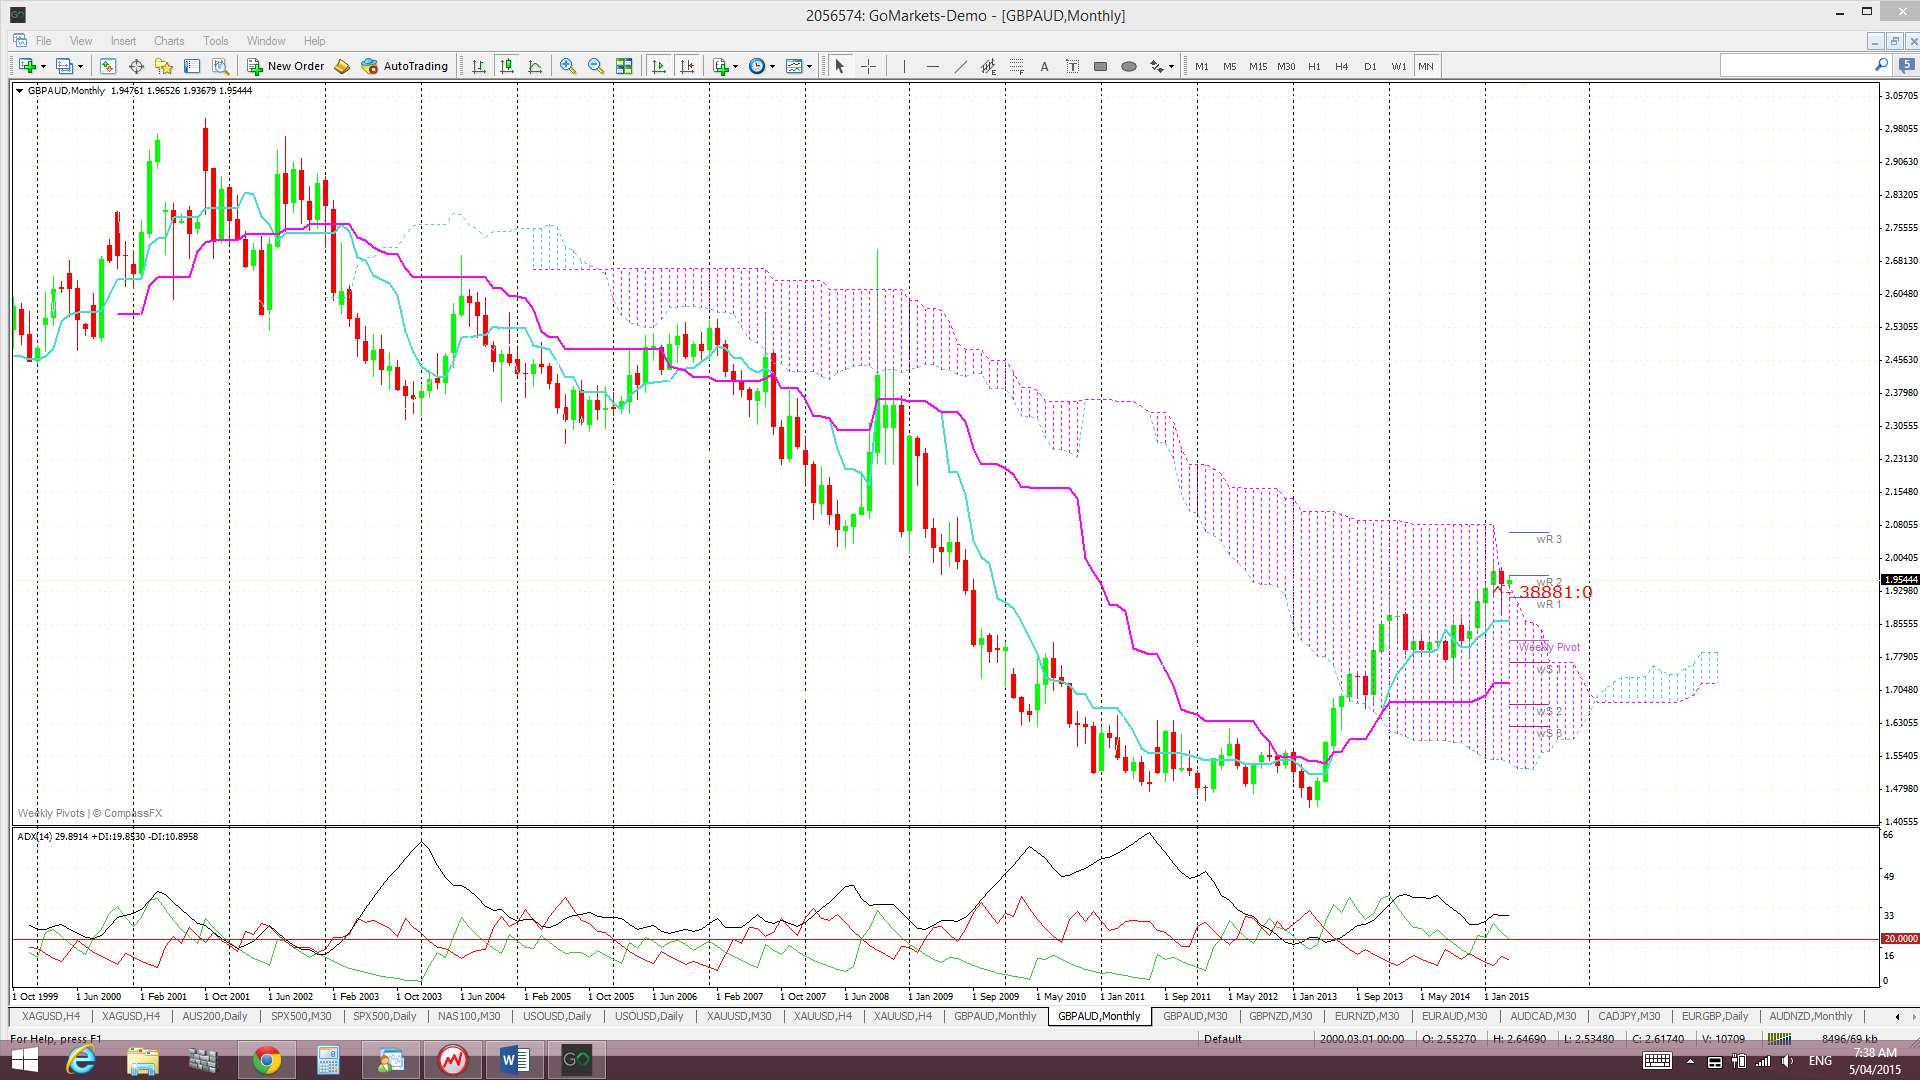
The weekly candle closed as a bullish candle after four bearish weeks. However, the March candle closed as a bearish coloured ‘Hanging Man’ candle and this candle type, formed at resistance as is the case here, suggests bearish reversal.
- I’m watching for any new TC signal, the weekly chart’s trading channel and the monthly chart’s bear trend line.
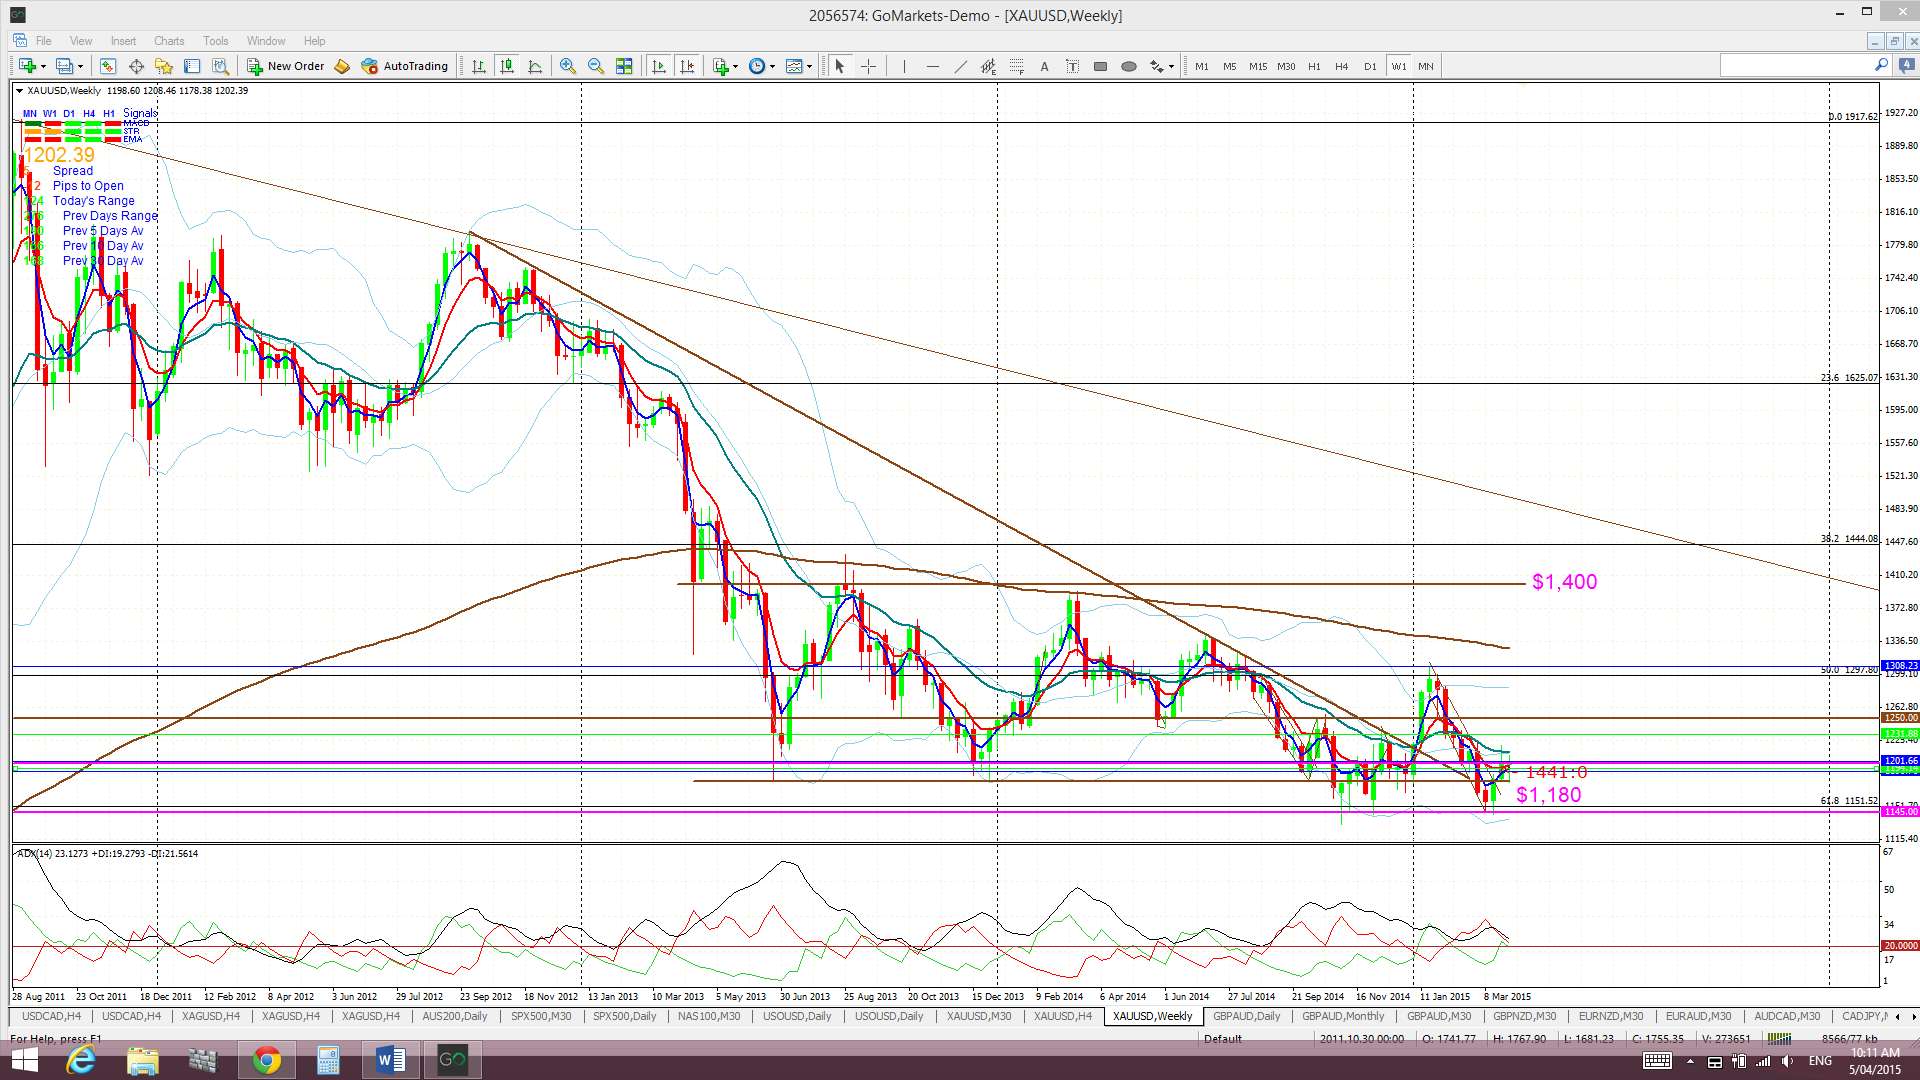
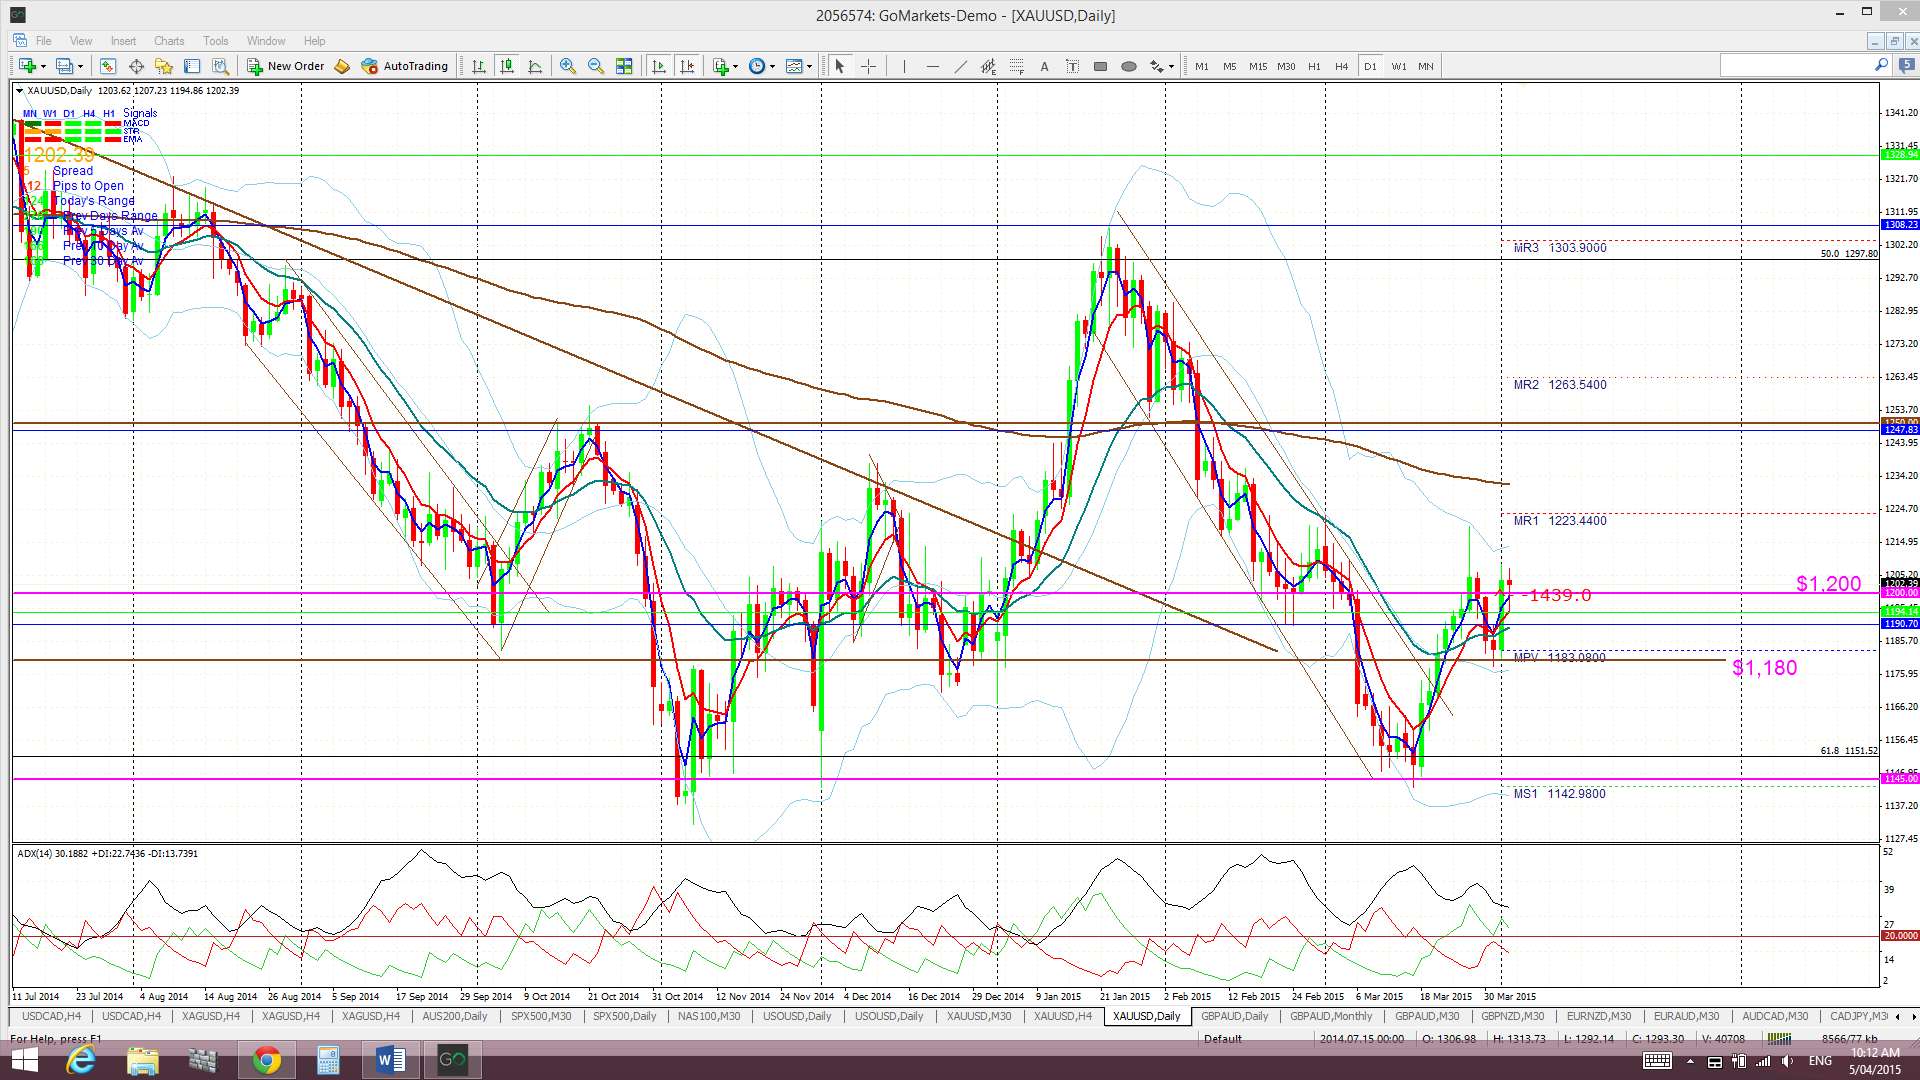
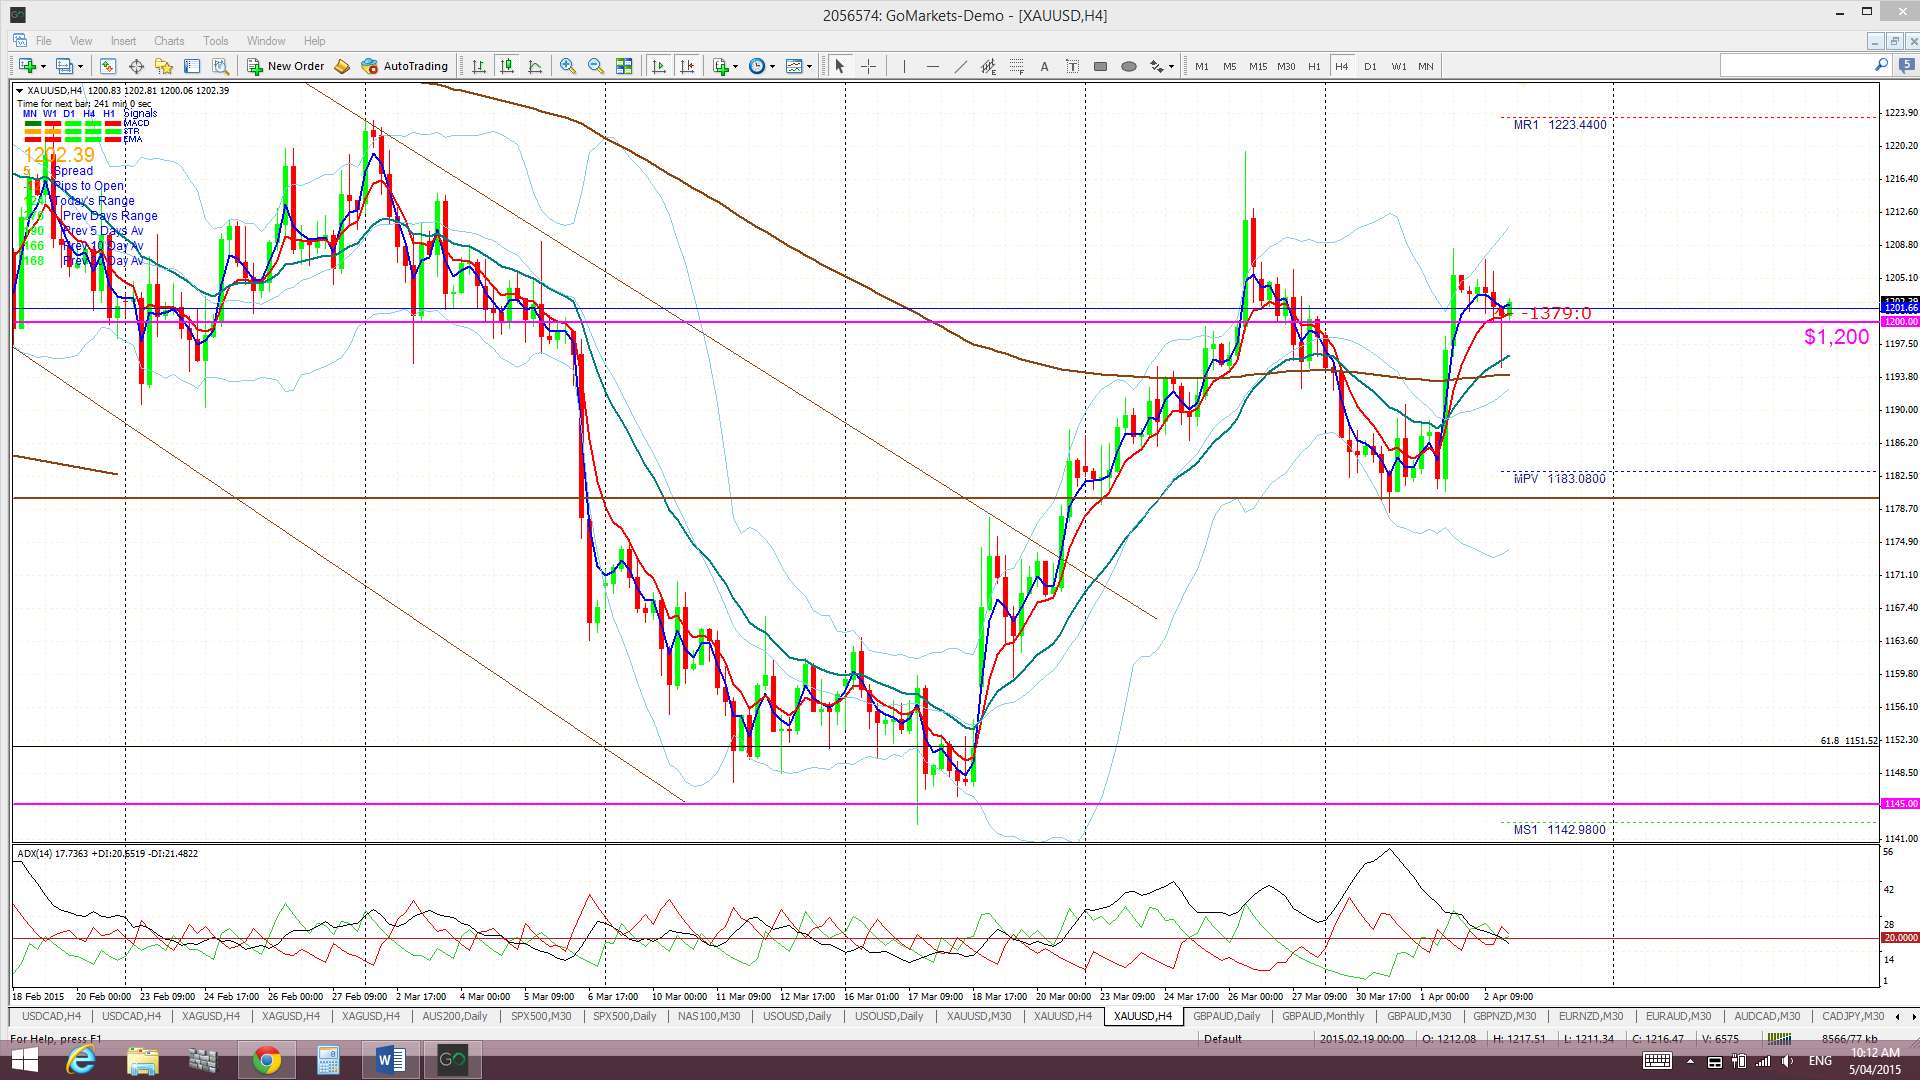
Gold: Gold continues to hold above the 61.8% Fib retracement of the 2008-2011 bull run that is near $1,145. Recent US$ weakness has helped to lift this metal and any continued US$ weakness and/or Greek debt drama should only help to keep Gold supported. Conversely, Gold may weaken if the US$ regains its bullish momentum and the Greek debt issue is resolved.
The $1,200 is recent support and Gold closed the week again just above this key level.
Any new break and hold below $1,145 would suggest a deeper pull back. Bearish targets below $1,145 include the $1,000 psychological level and, then, the 78.6% fib near $950.
Gold is still trading in the top edge of the Ichimoku Cloud on the 4hr chart but below the Cloud on the daily, weekly and monthly charts.
The weekly candle closed as a bullish coloured ‘Spinning Top’ candle but that makes two bullish candle following on from a recent bullish engulfing candle. However, the March candle closed as a bearish candle although the new April candle is bullish.
- I’m watching for any new TC signal and the $1,200 level.

The post US$ weakens but EUR & AUD risk events are in focus. appeared first on www.forextell.com.