I noted in my last update how things seemed to be warming up and that the FX indices were aligned for LONG EUR and SHORT US$; a period that often produces decent trending markets. How true this has turned out to be! The big moves over the last couple of trading sessions have resulted in the EURX attempting a bullish Flag breakout and the USDX is down testing Flag trend line support. There have been major moves across global stock indices and Gold as well and some long-awaited pullbacks might be about to evolve.
NB: I am away this w/e but the following charts are worth checking and taking note of key levels to keep watch over in coming sessions.
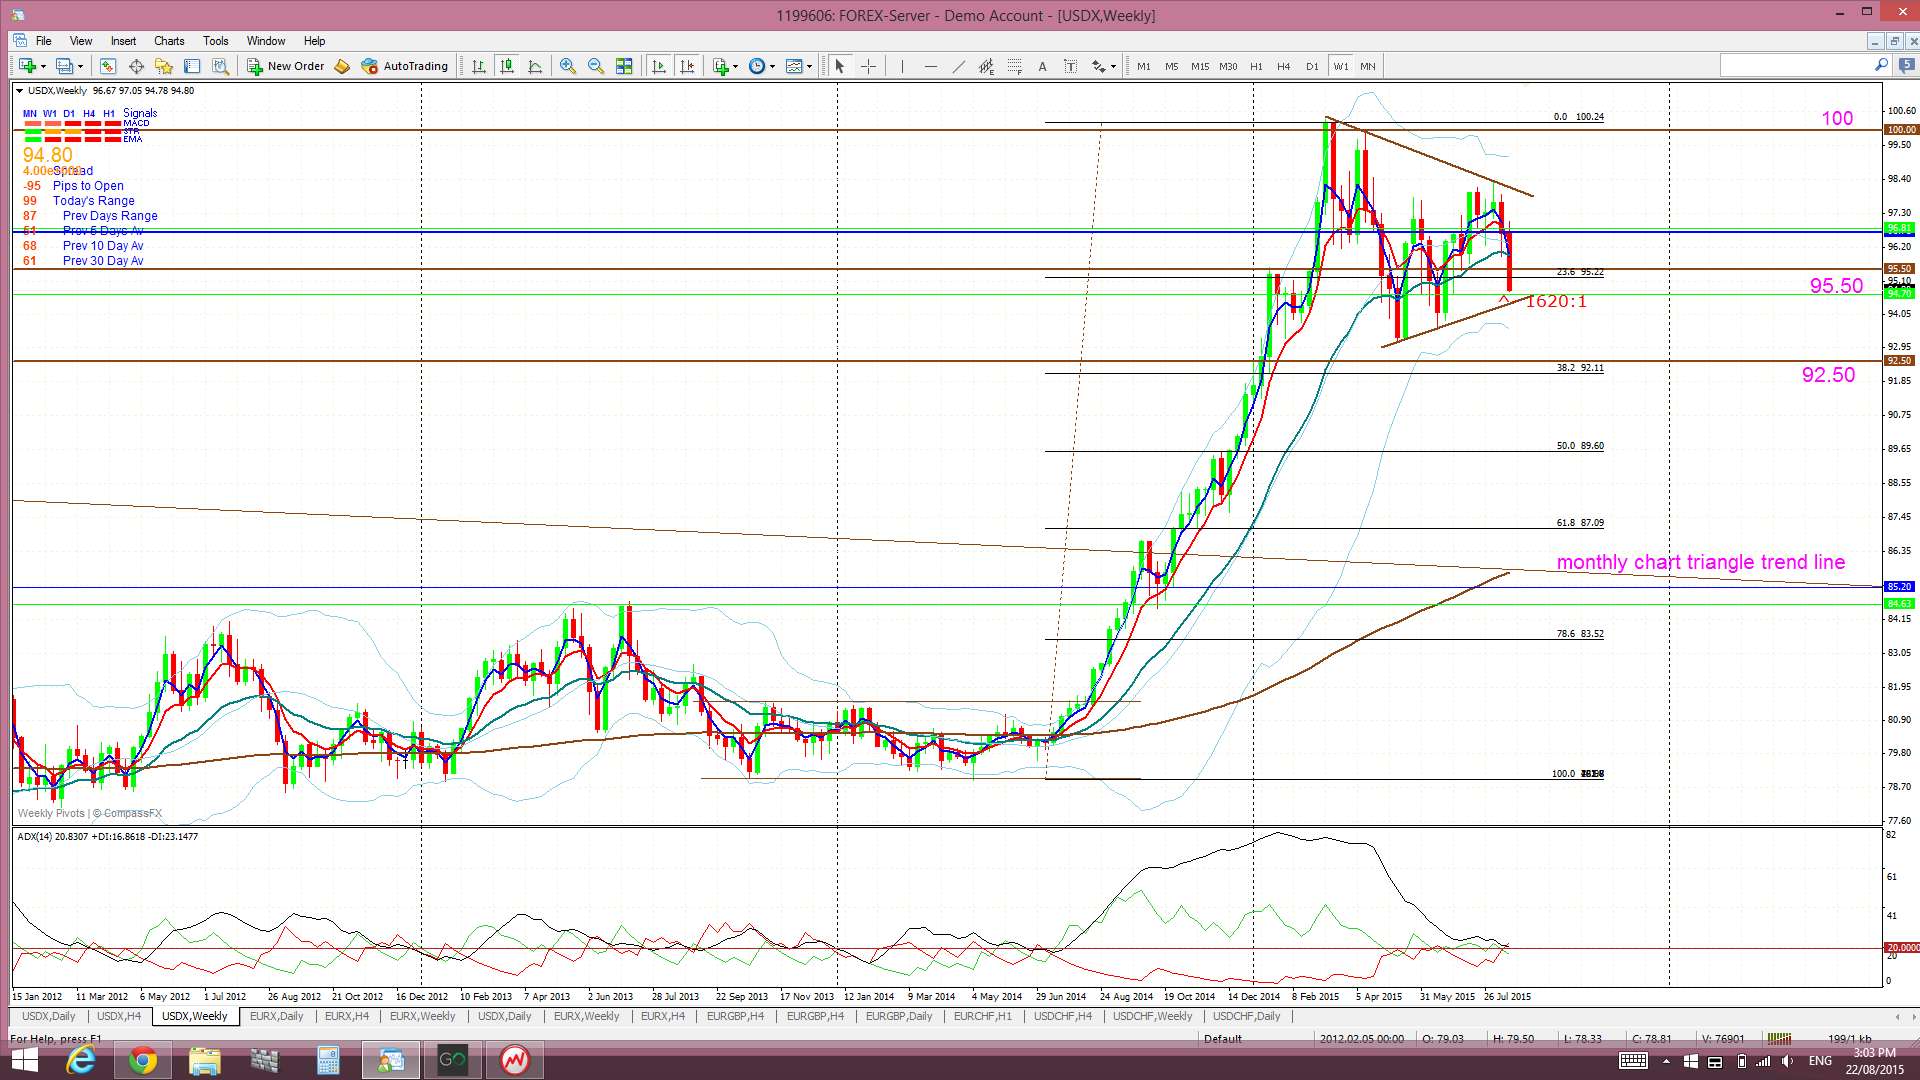
USDX weekly: the US$ has weakened and is down near trend line support. Watch for any bearish breakdown here as this would suggest the possibility of a move back down to test the 61.8% fib, weekly 200 EMA and major triangle breakout region:
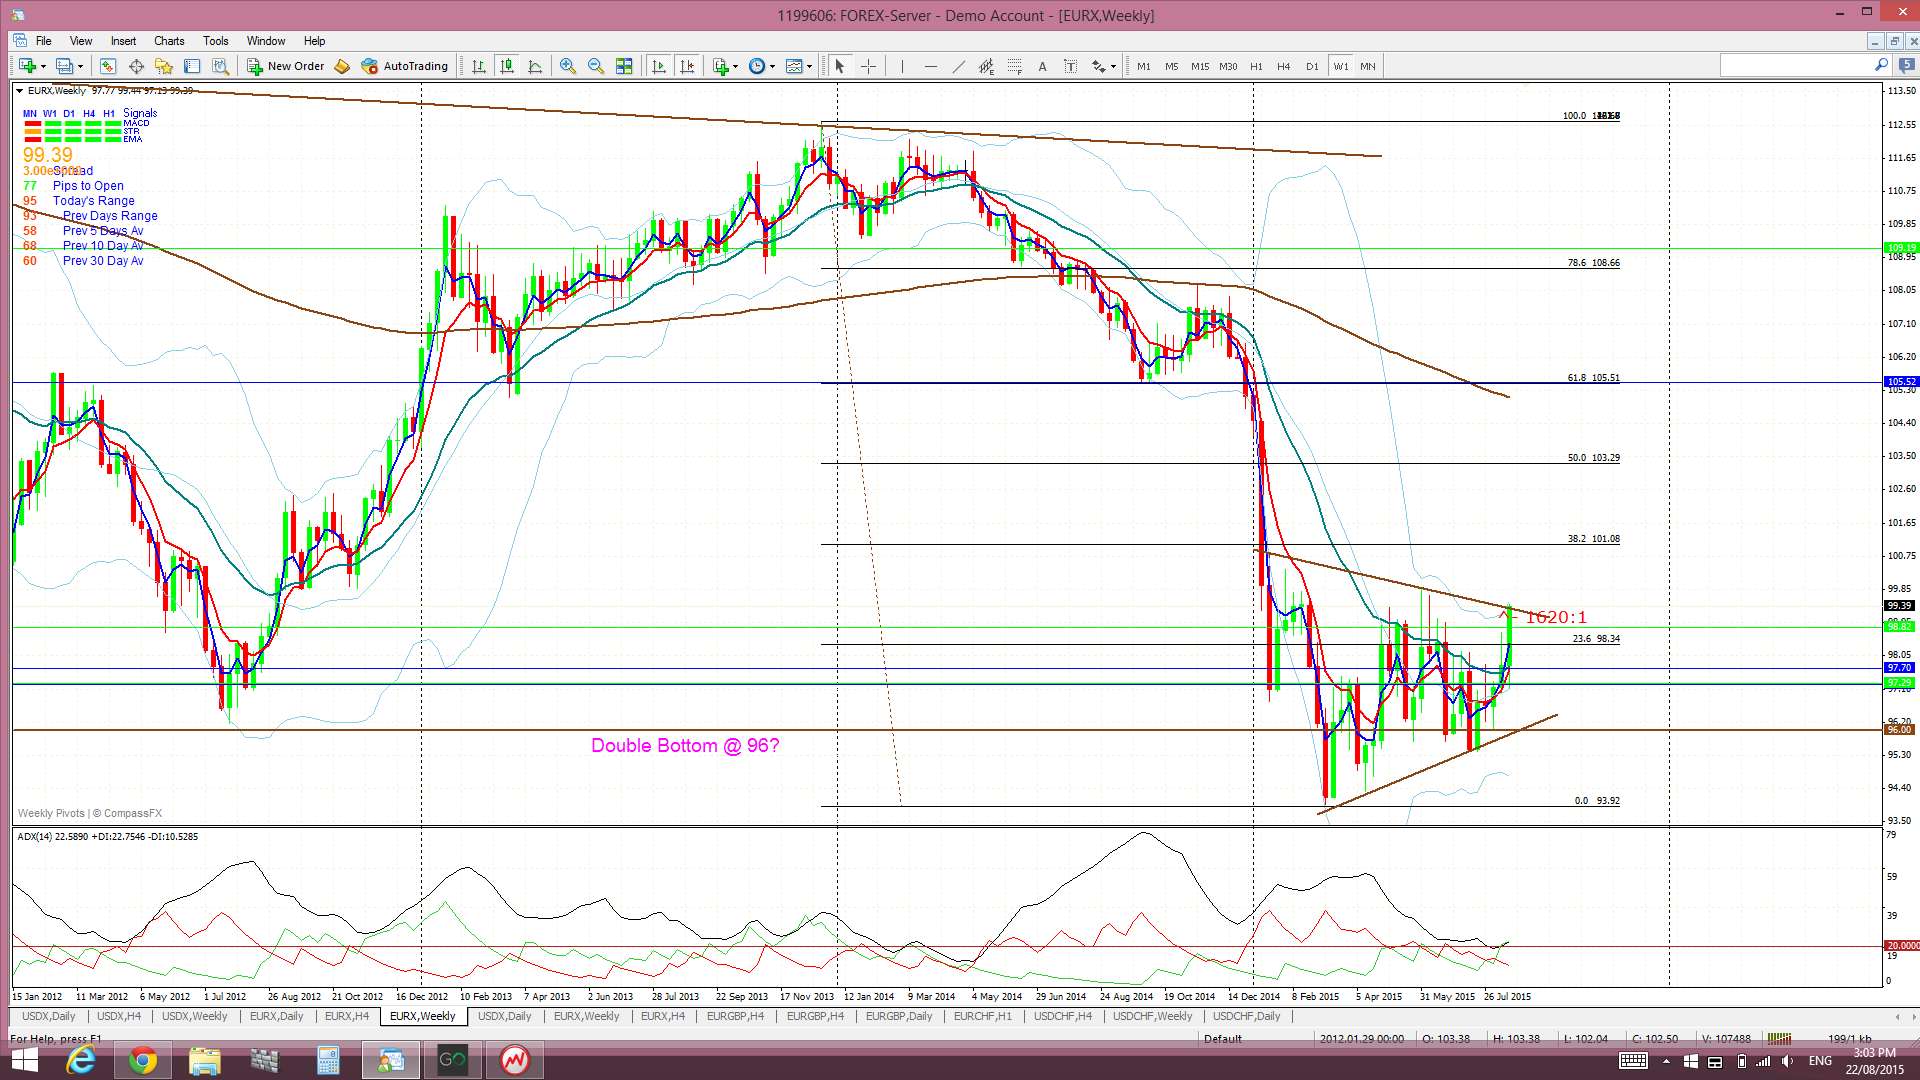
EURX weekly: this closed the week higher and testing the upper trend line of the Flag pattern. Any break and hold up from this Flag would suggest that this has been more of a basing pattern and, if so, watch for a potential move up to the 105.5 area near the 61.8% fib and weekly 200 EMA region.
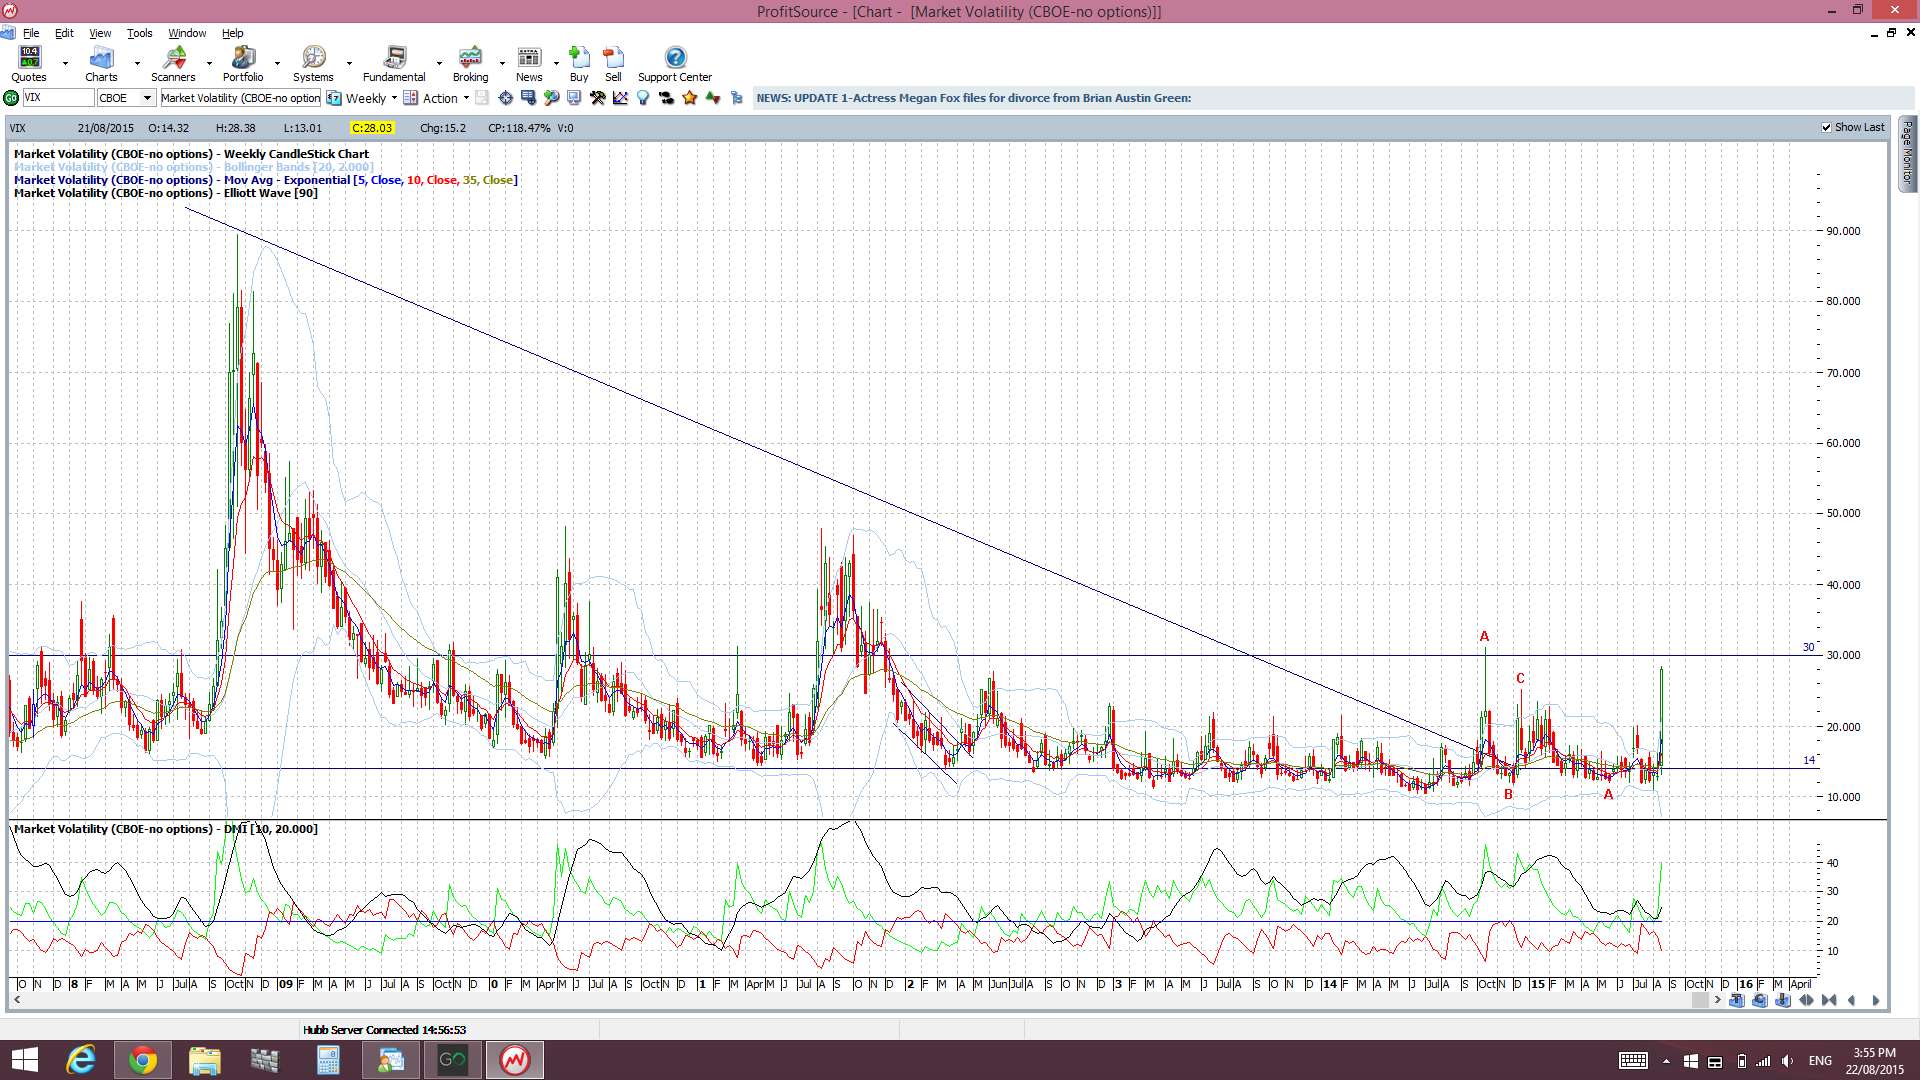
VIX: Fear Index: this printed a huge bullish candle but is still below 30 for now. However, any close and hold above 30 would be a further warning:
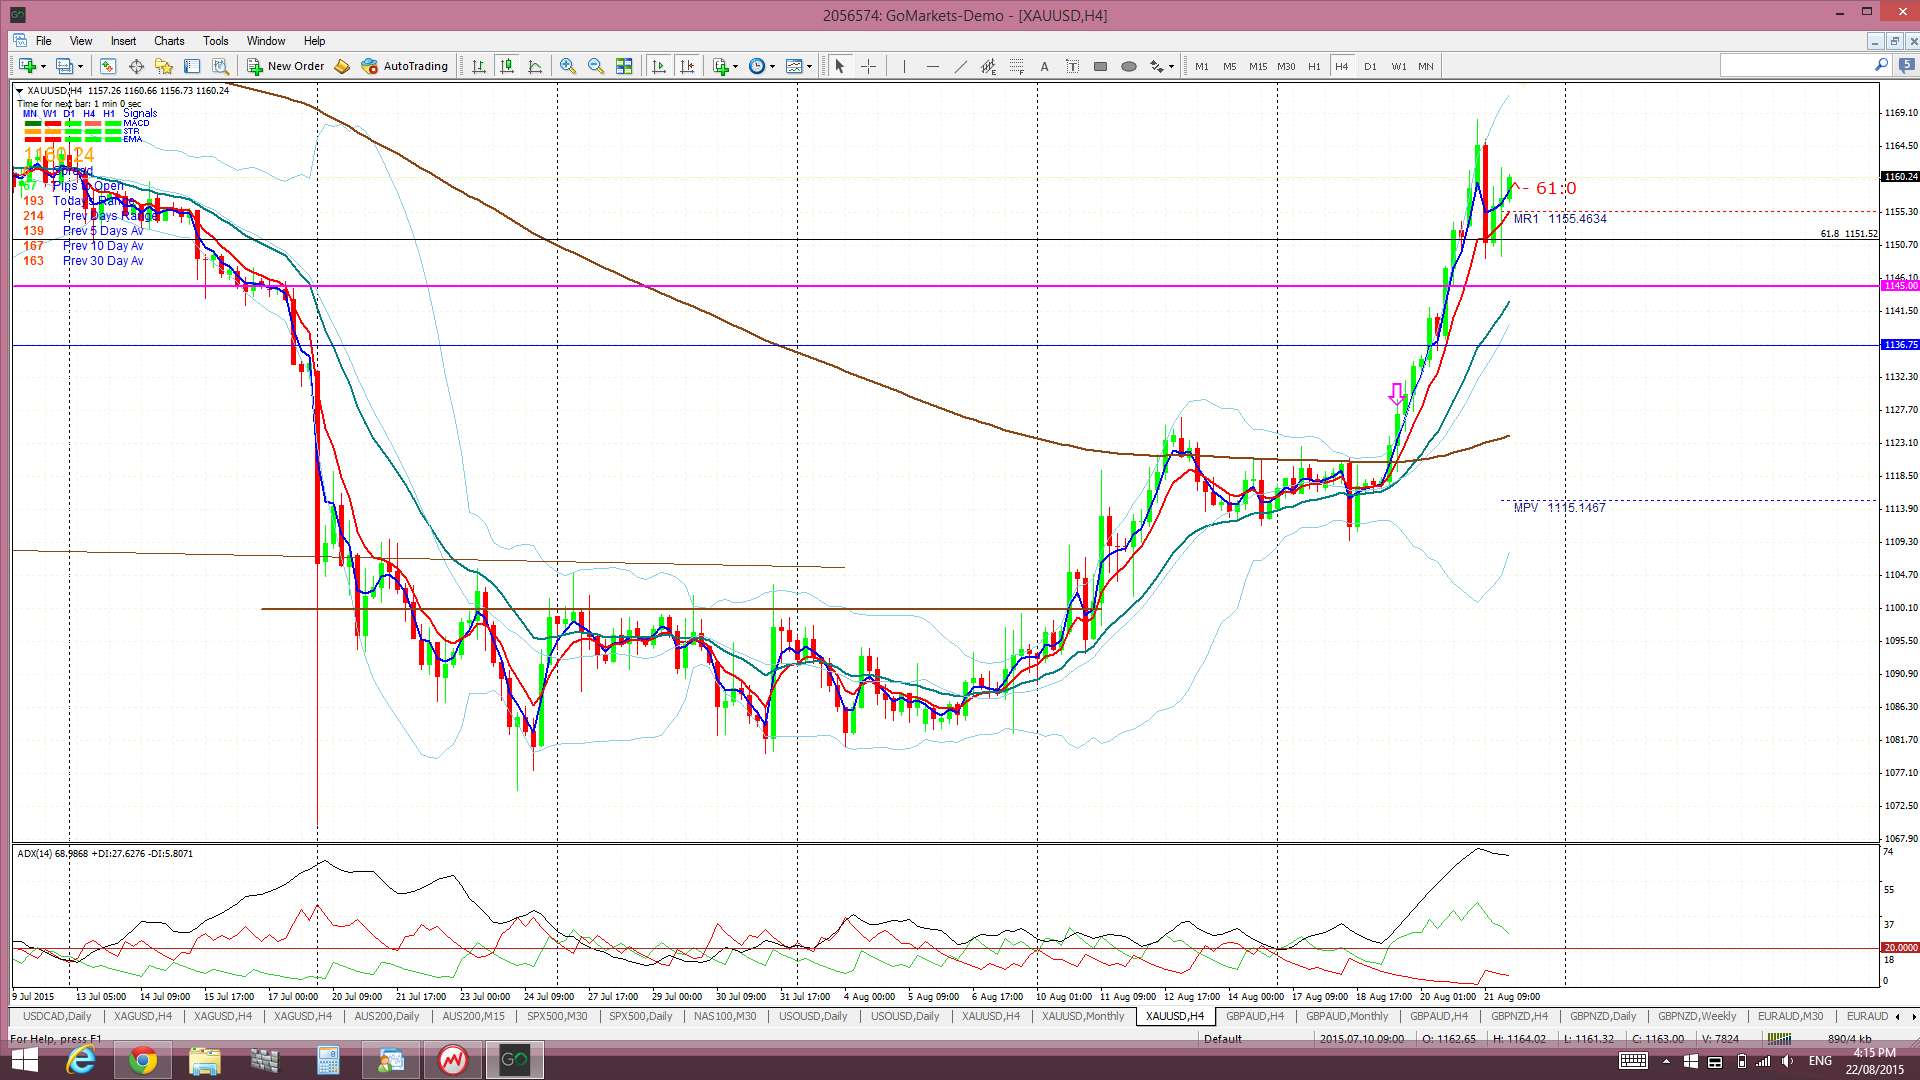
Gold: the TC signal from the 4hr chart has now delivered up to $42!
Gold 4hr: The TC signal here has given $42:
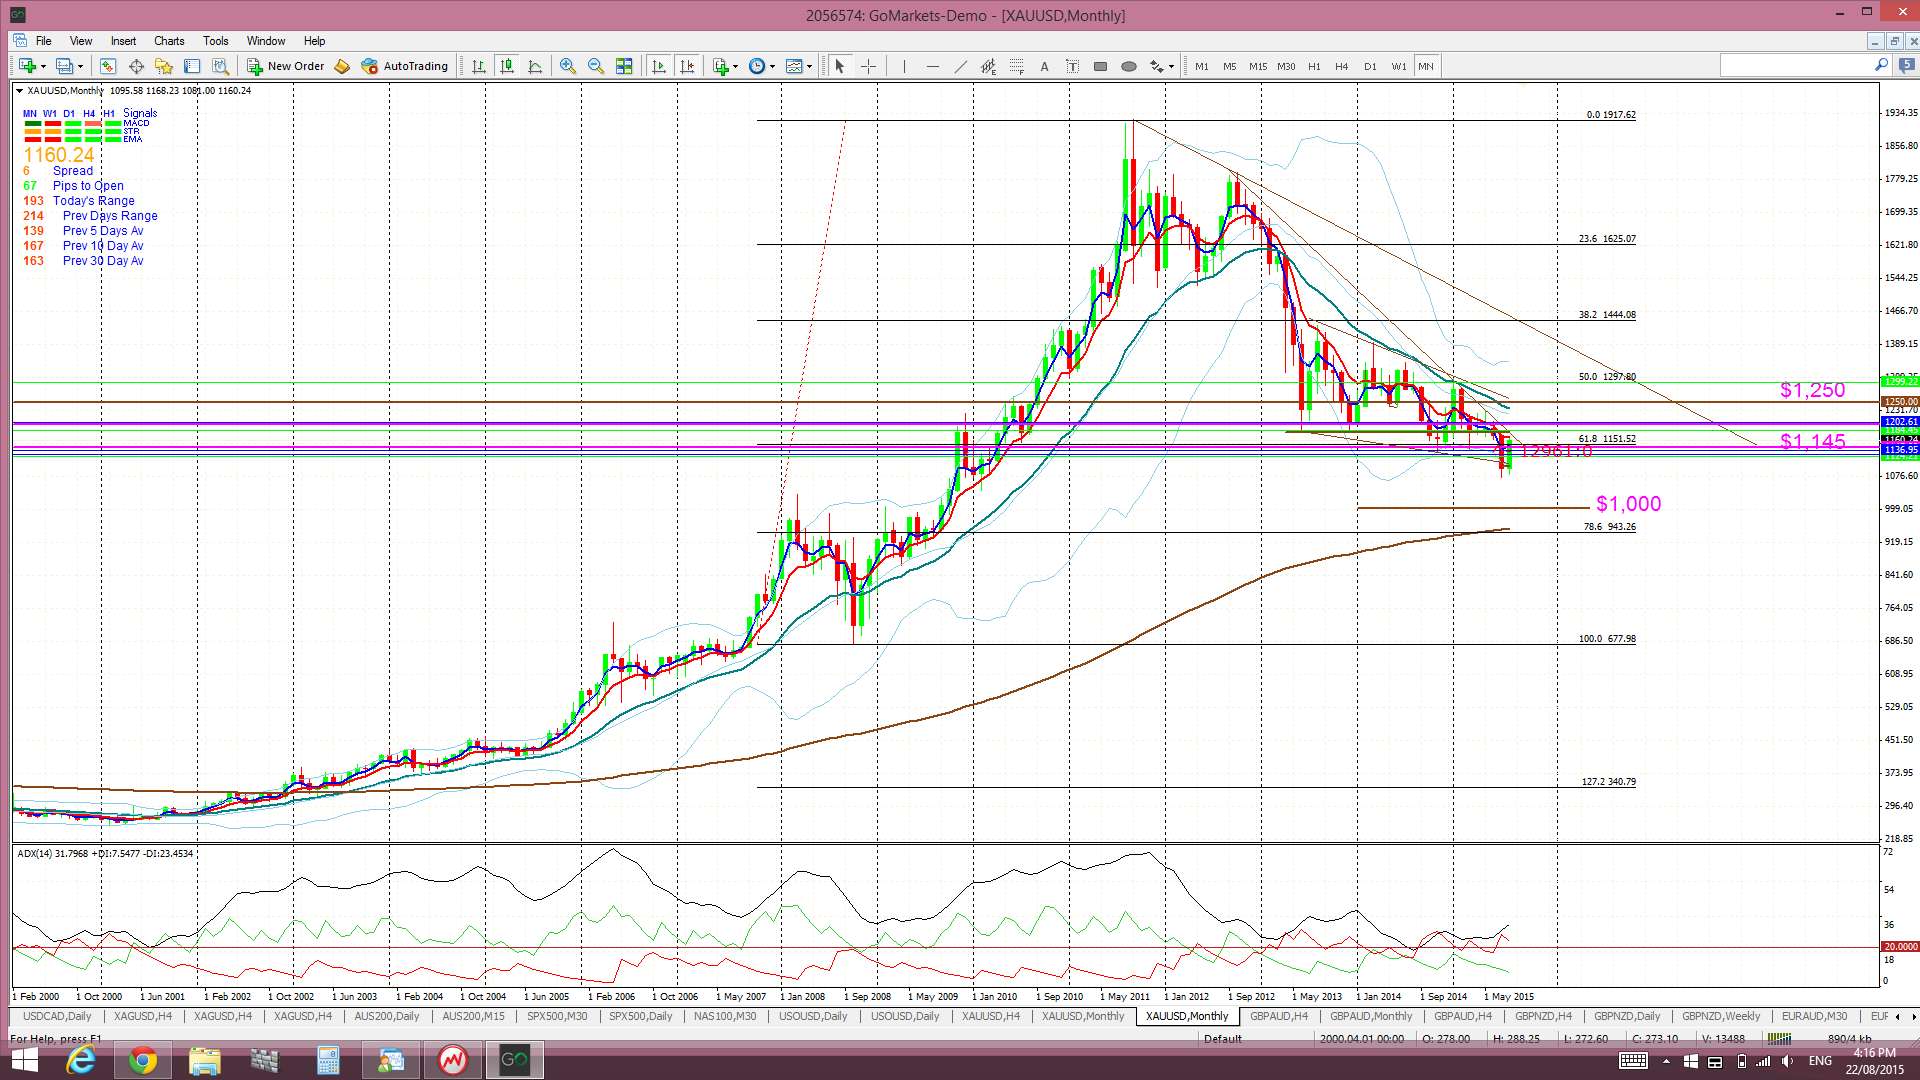
Gold monthly: many traders were looking for a test of the broken 61.8% fib region near $1,150 / $1,145 to take a SHORT trade. Gold has held above both of these levels into the weekend though and any continued US$ weakness is only likely to help support the precious metal. Traders need to keep an eye on the US$ index as any bounce up from the bottom trend line of the weekly Flag pattern could help to keep pressure on Gold:
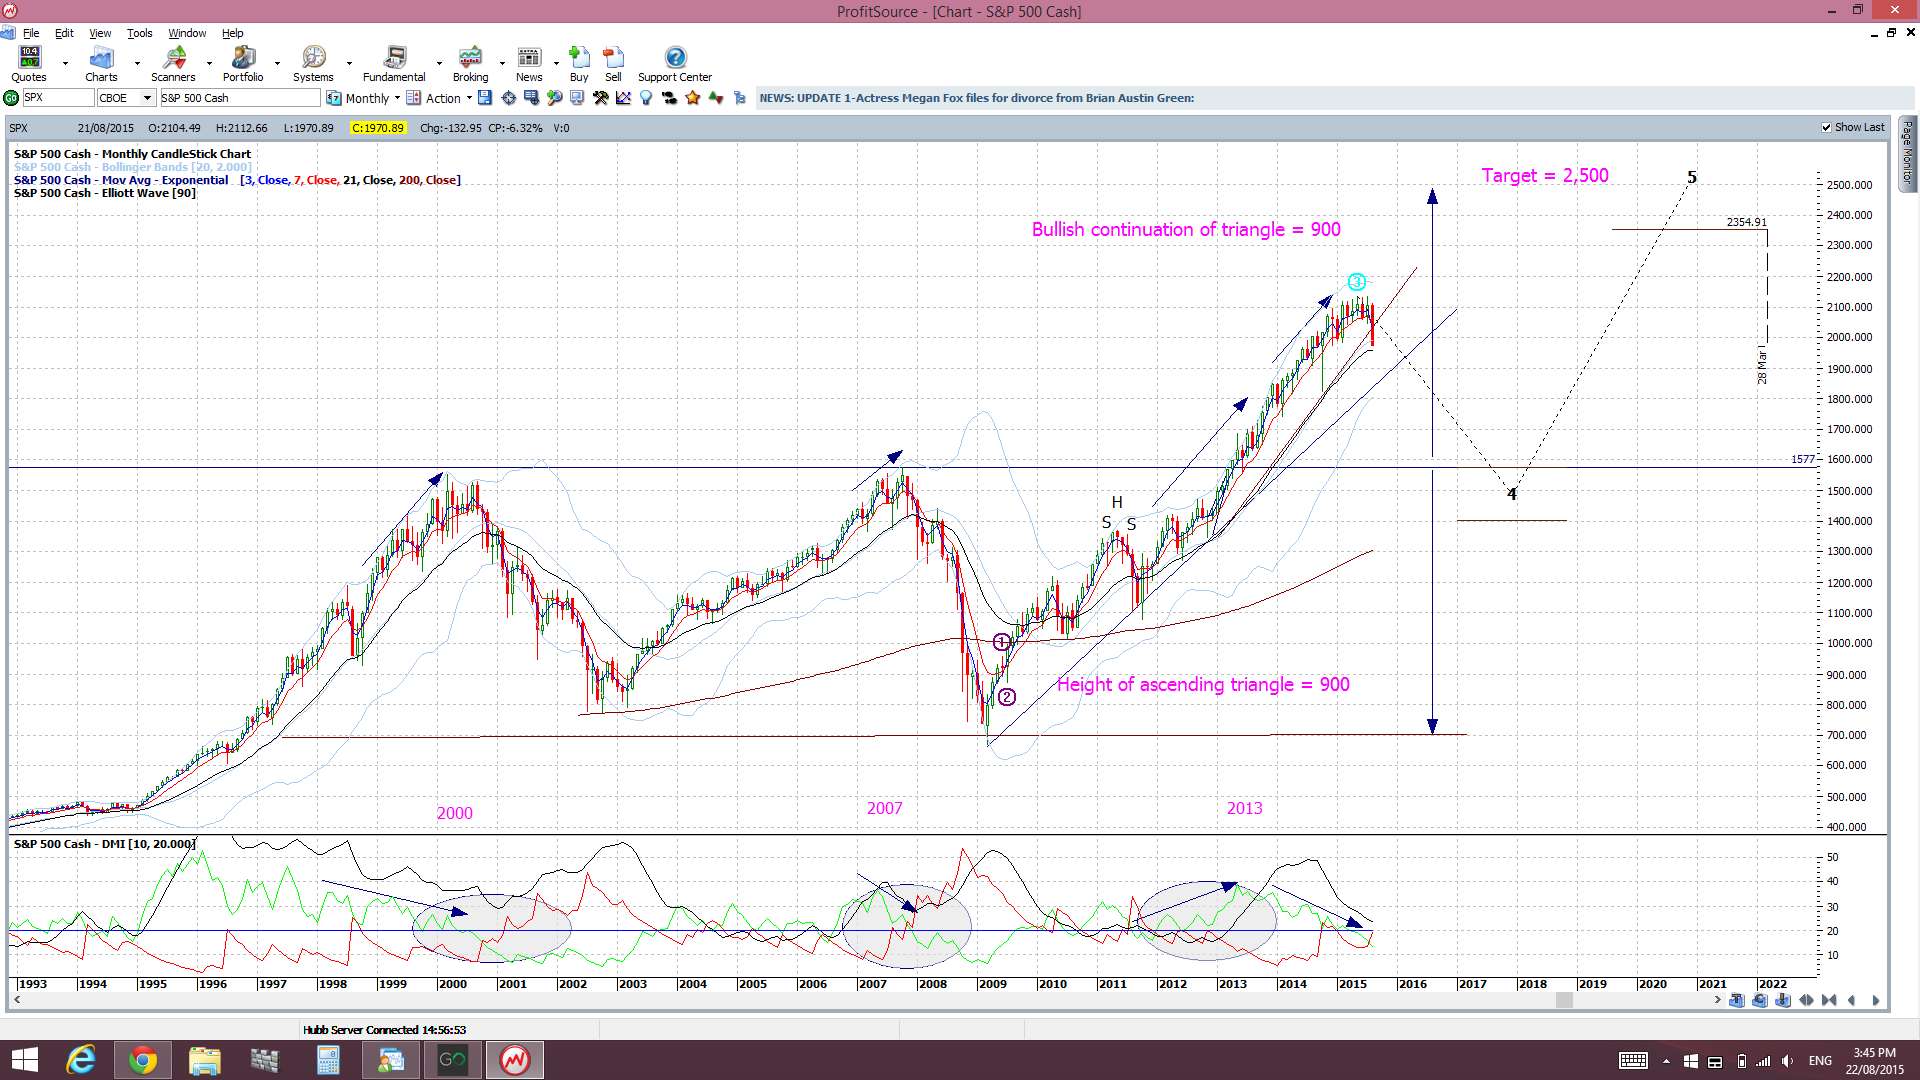
S&P500: daily support has been broken but monthly support is still a bit of a way off. Price is down testing the bottom of the weekly Cloud though and any further weakness will bring the previously broken triangle trend line, down near 1,600, into focus. FWIW: the default Elliott Wave indicator is looking for a test near 1,600 too:
S&P500 monthly:
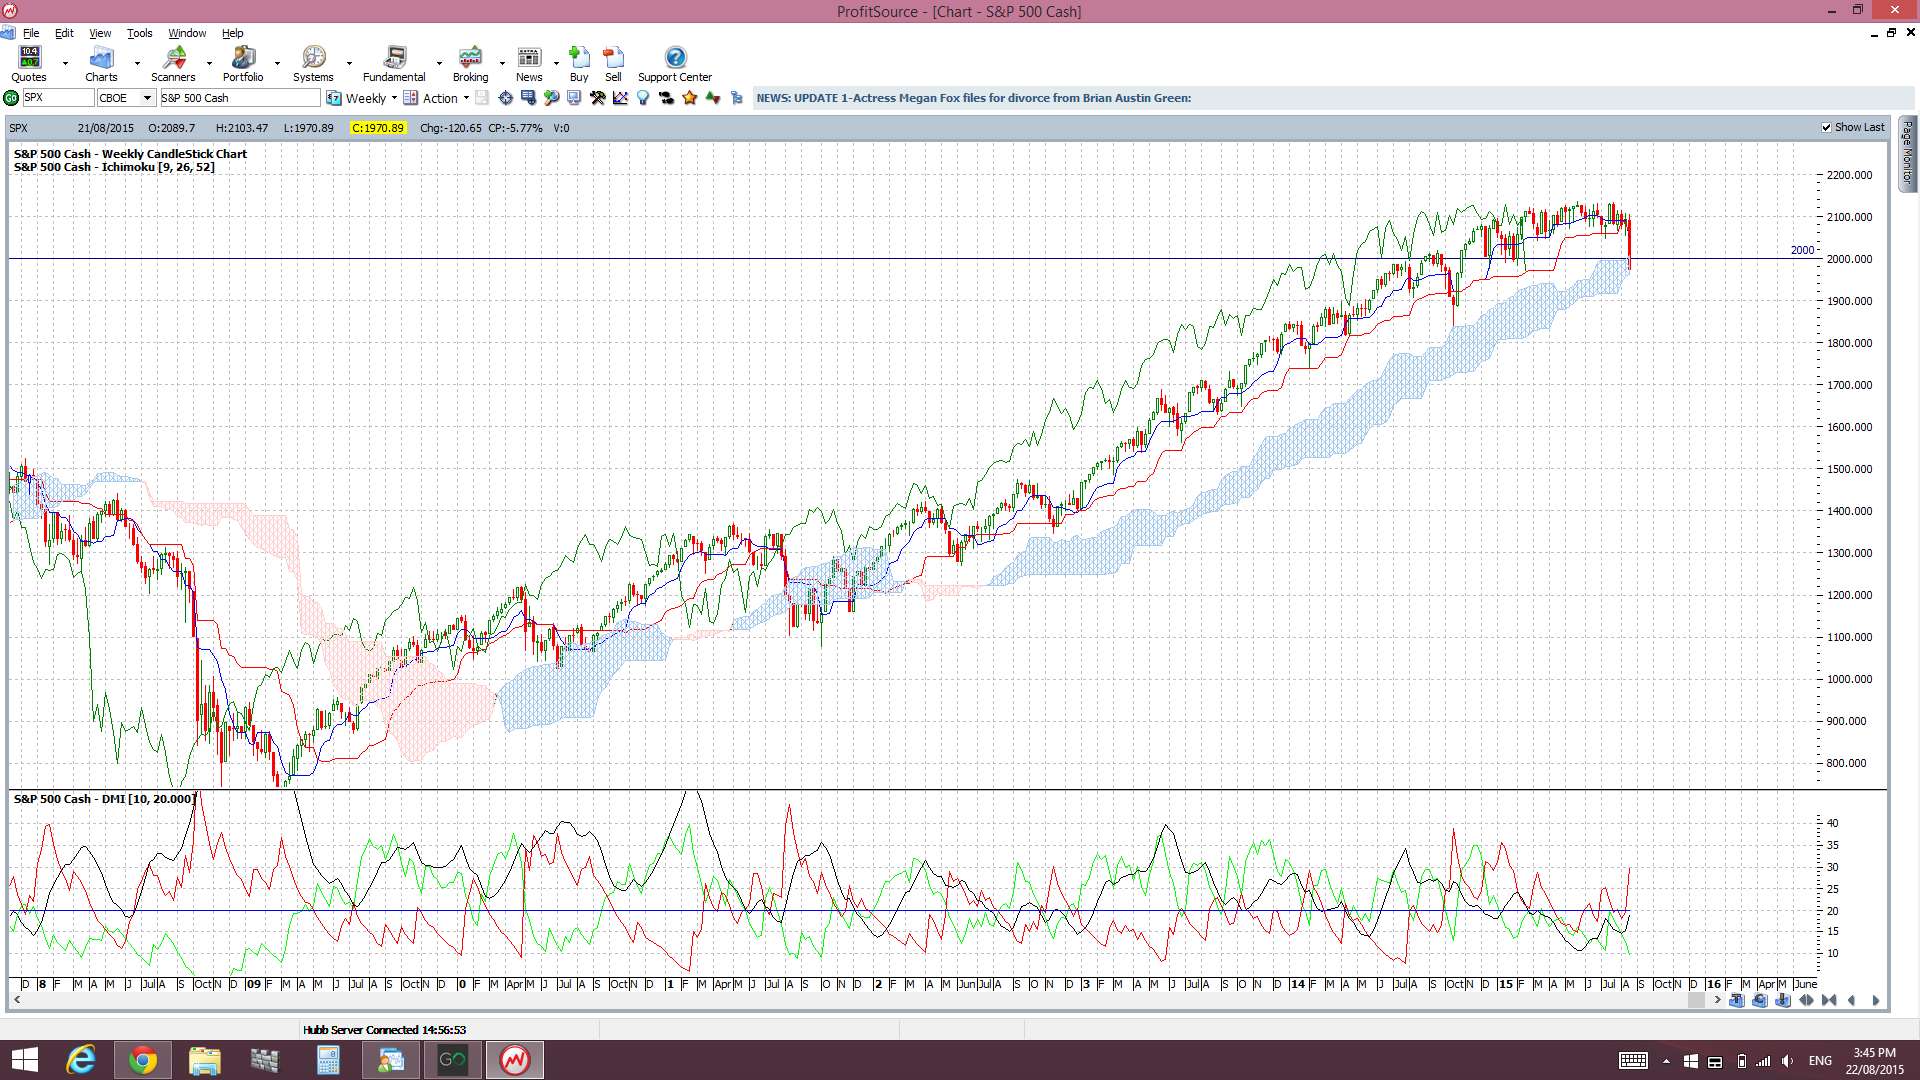
S&P500 weekly:
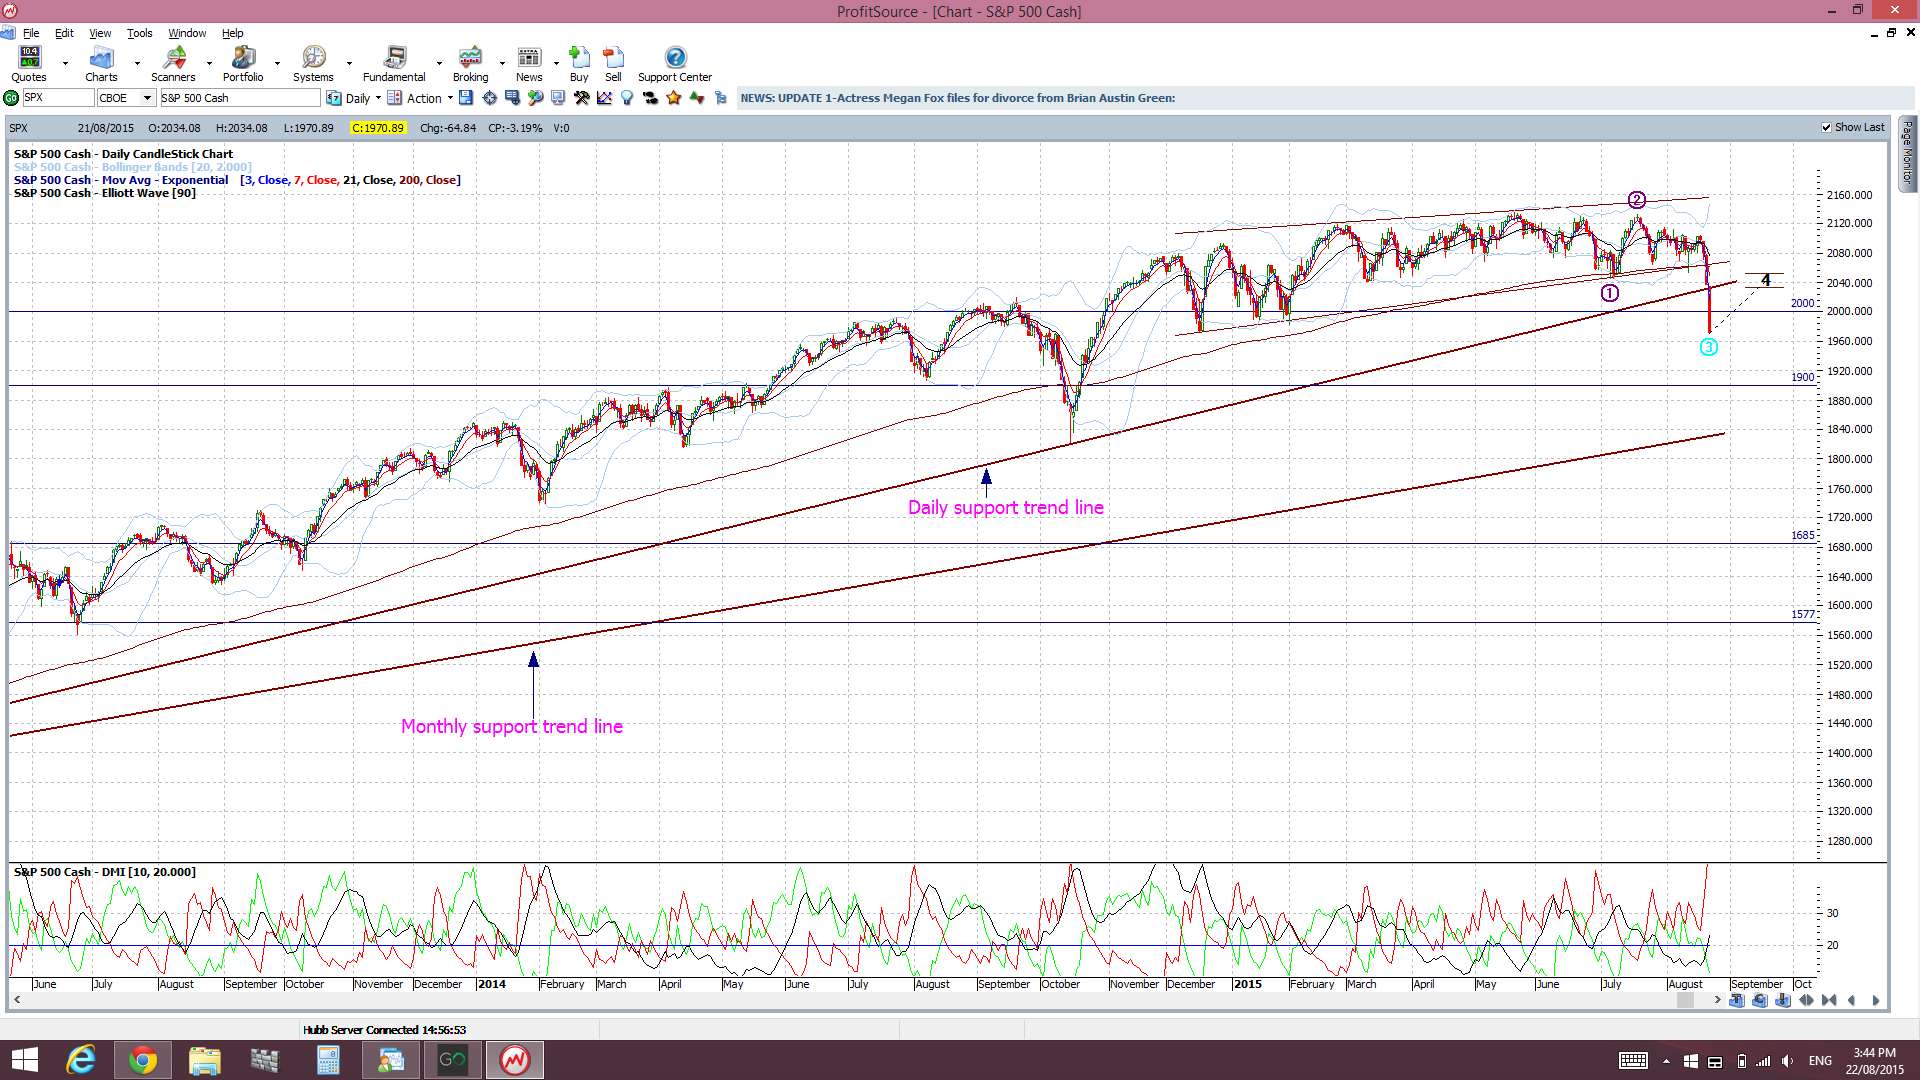
S&P500 daily:
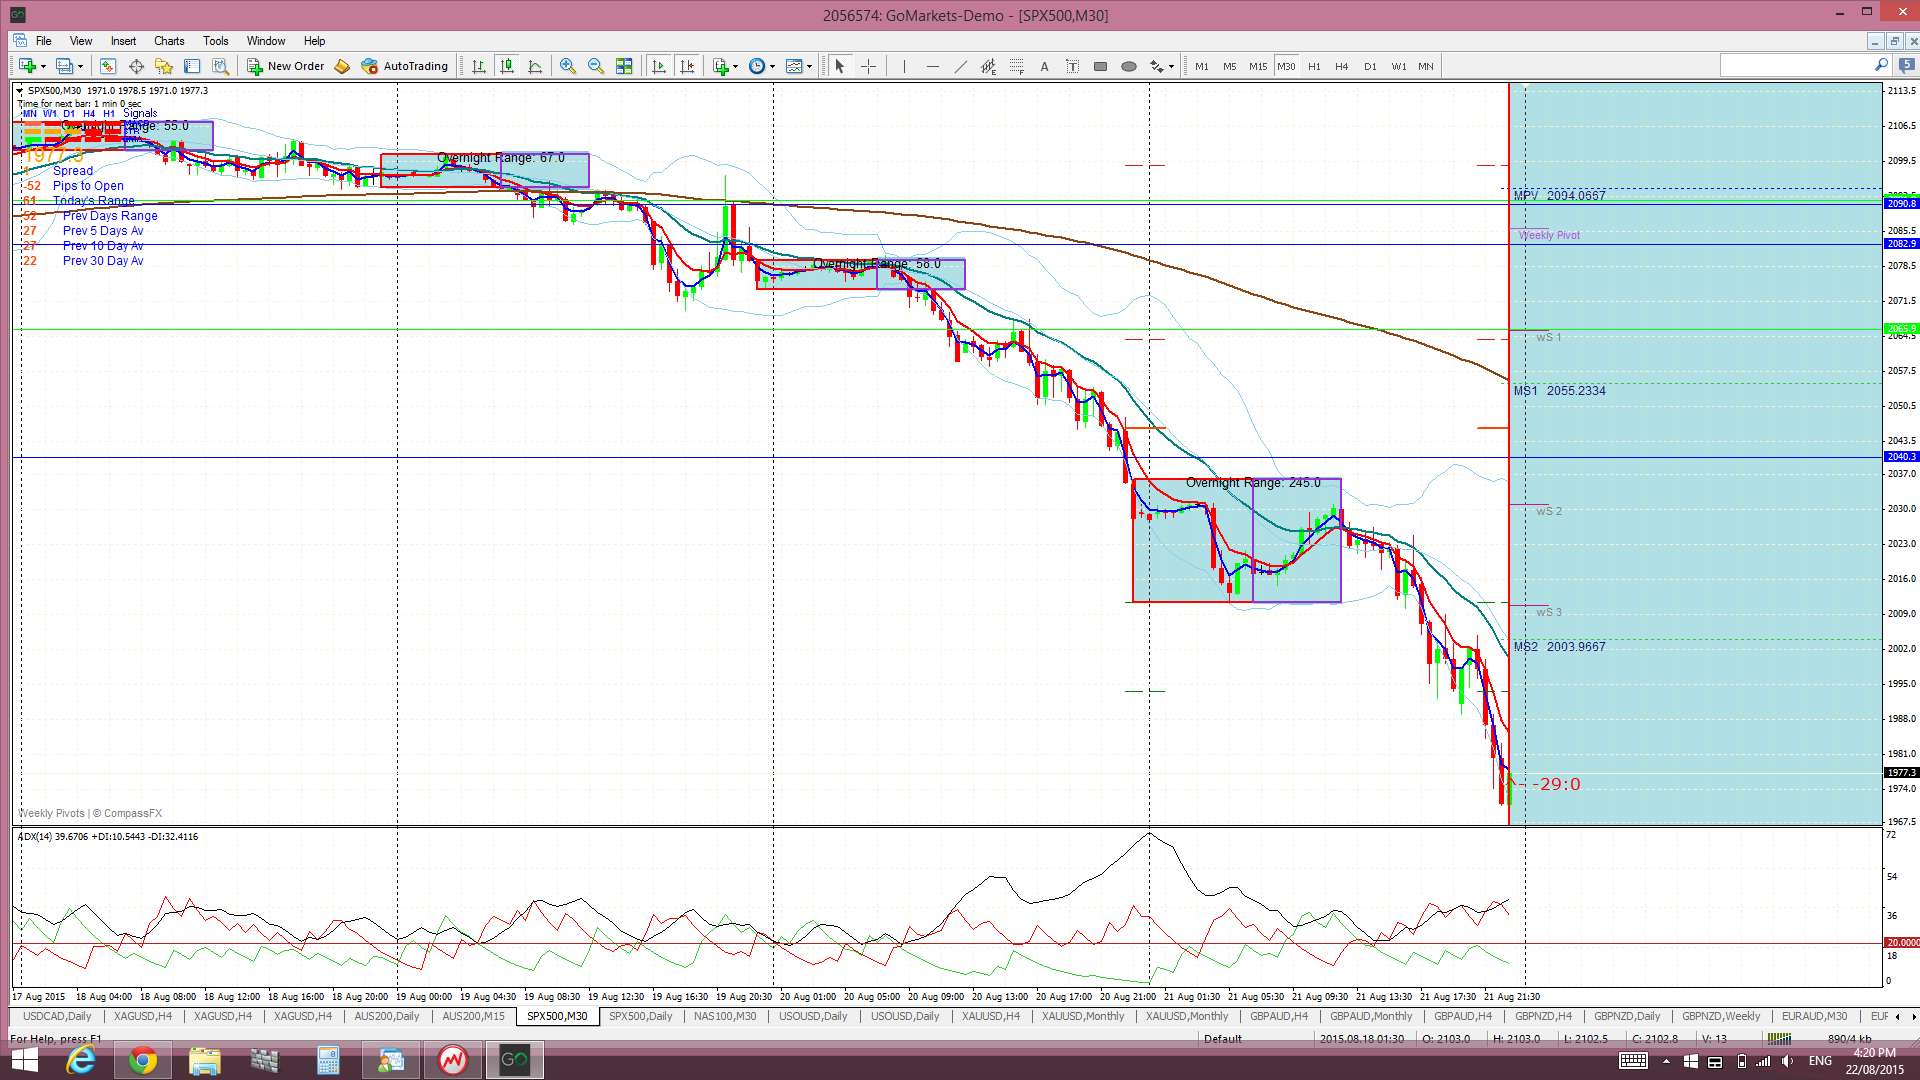
S&P500 30 min: those traders lucky enough to be able to trade the US session had two great days worth of trend trading opportunity on the S&P500:
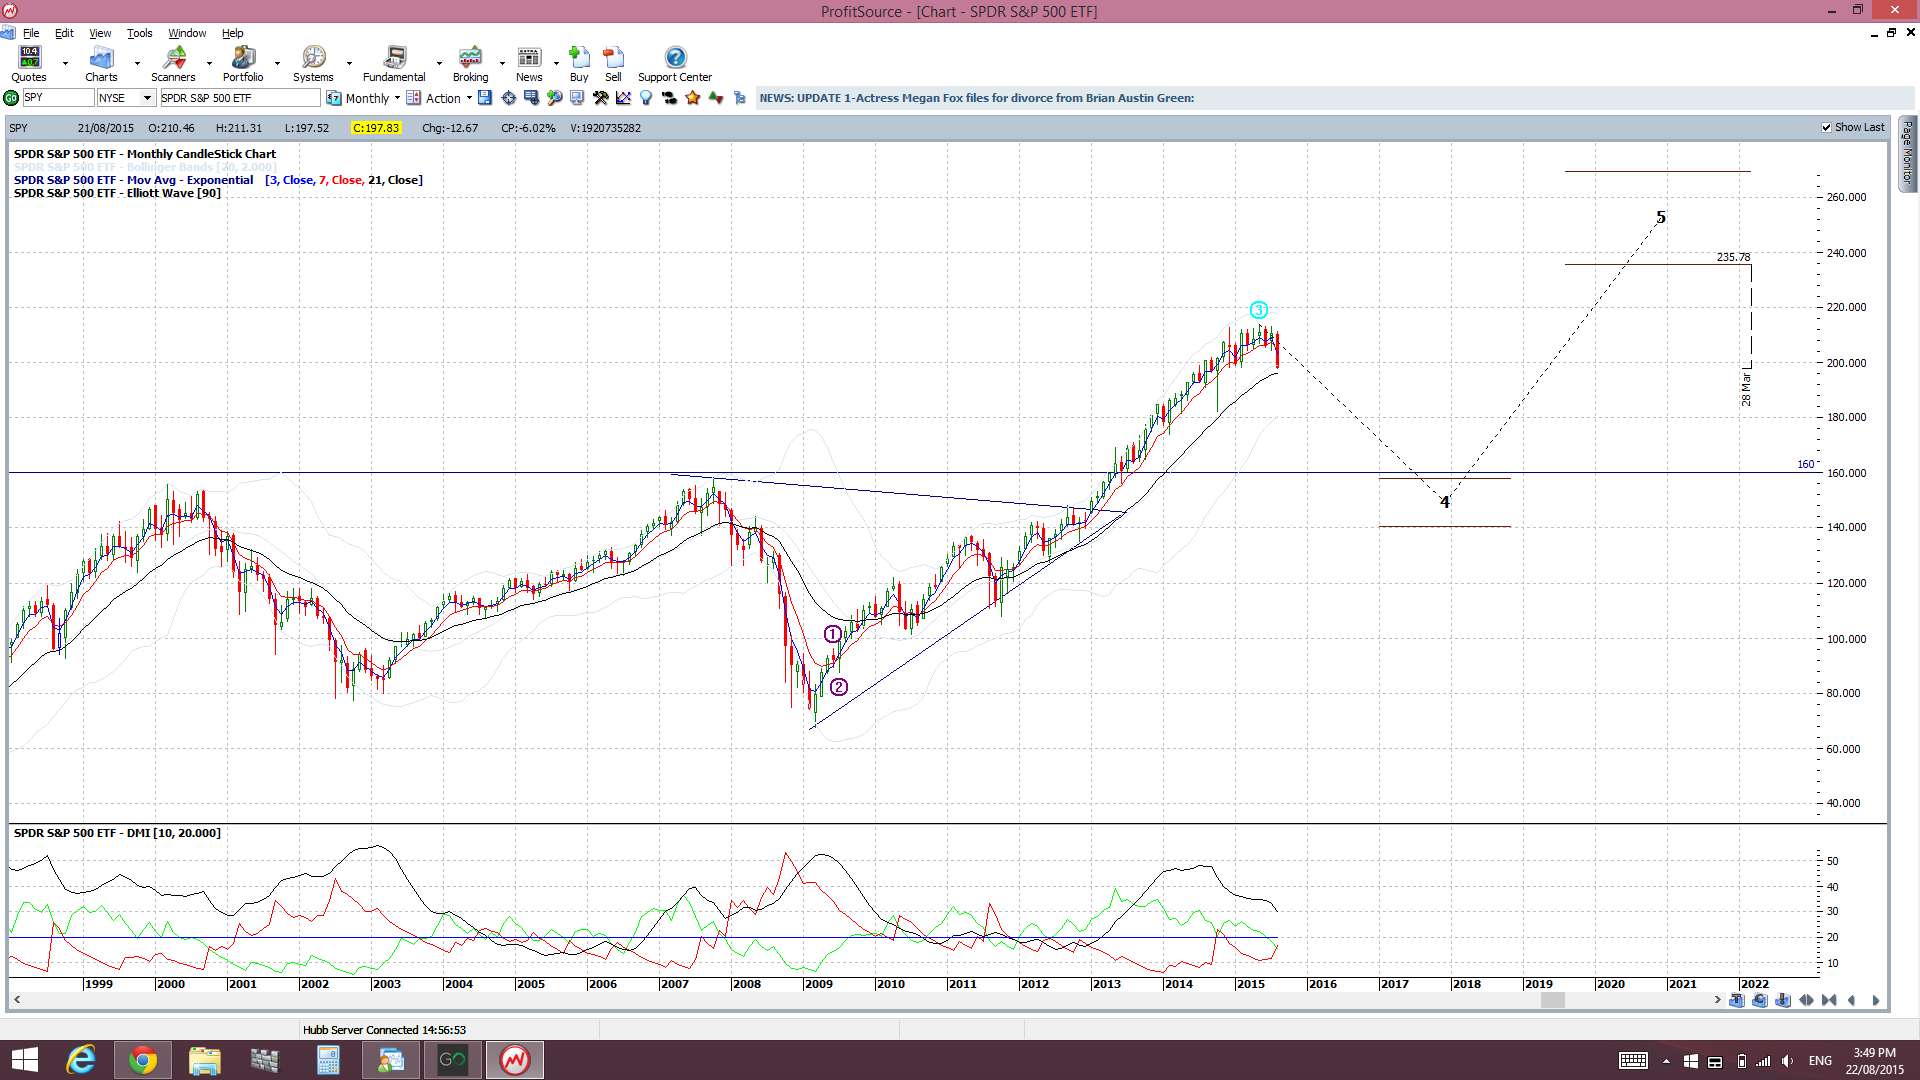
SPY (S&P500 ETF): it’s no surprise then that the SPY might be looking for a test of 160:
SPY monthly:
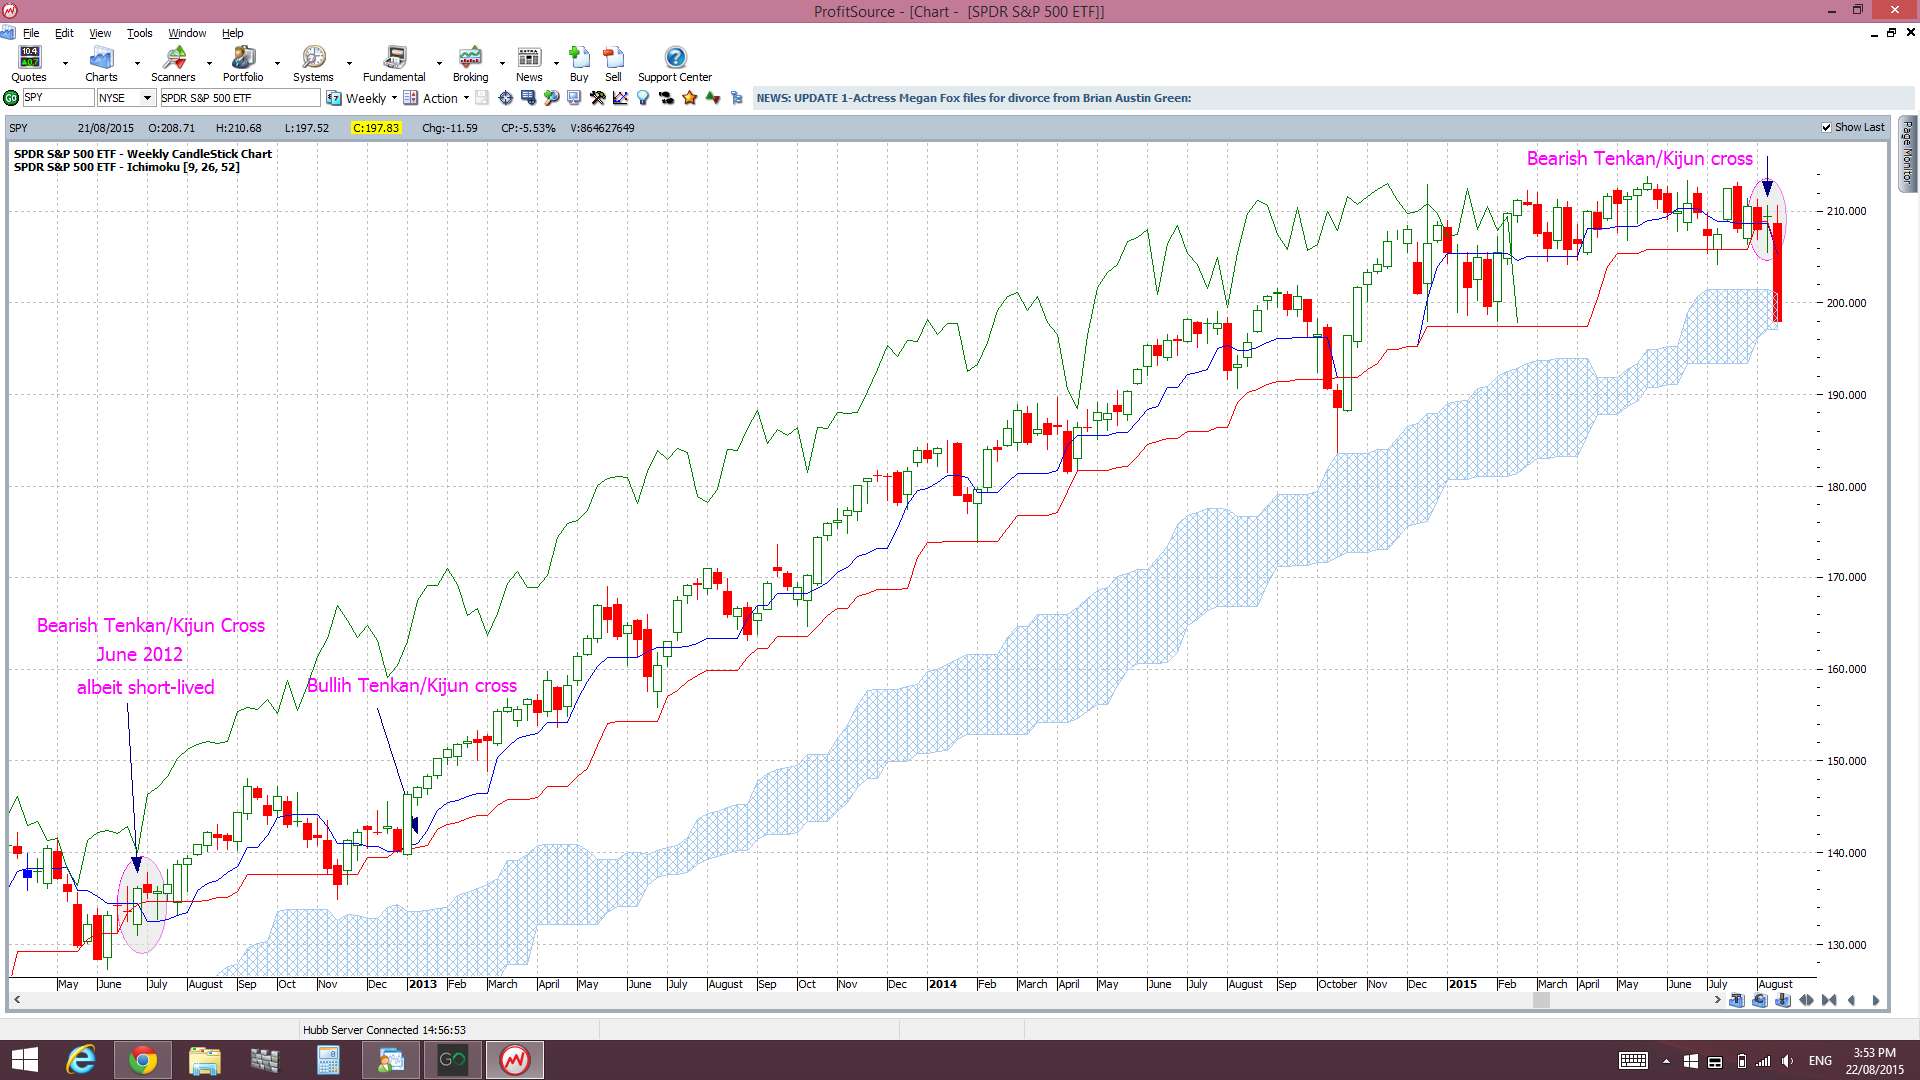
SPY weekly Cloud: the bearish Tenkan/Kijun cross was spot on here. Note that the last such bearish cross was fairly short-lived though:
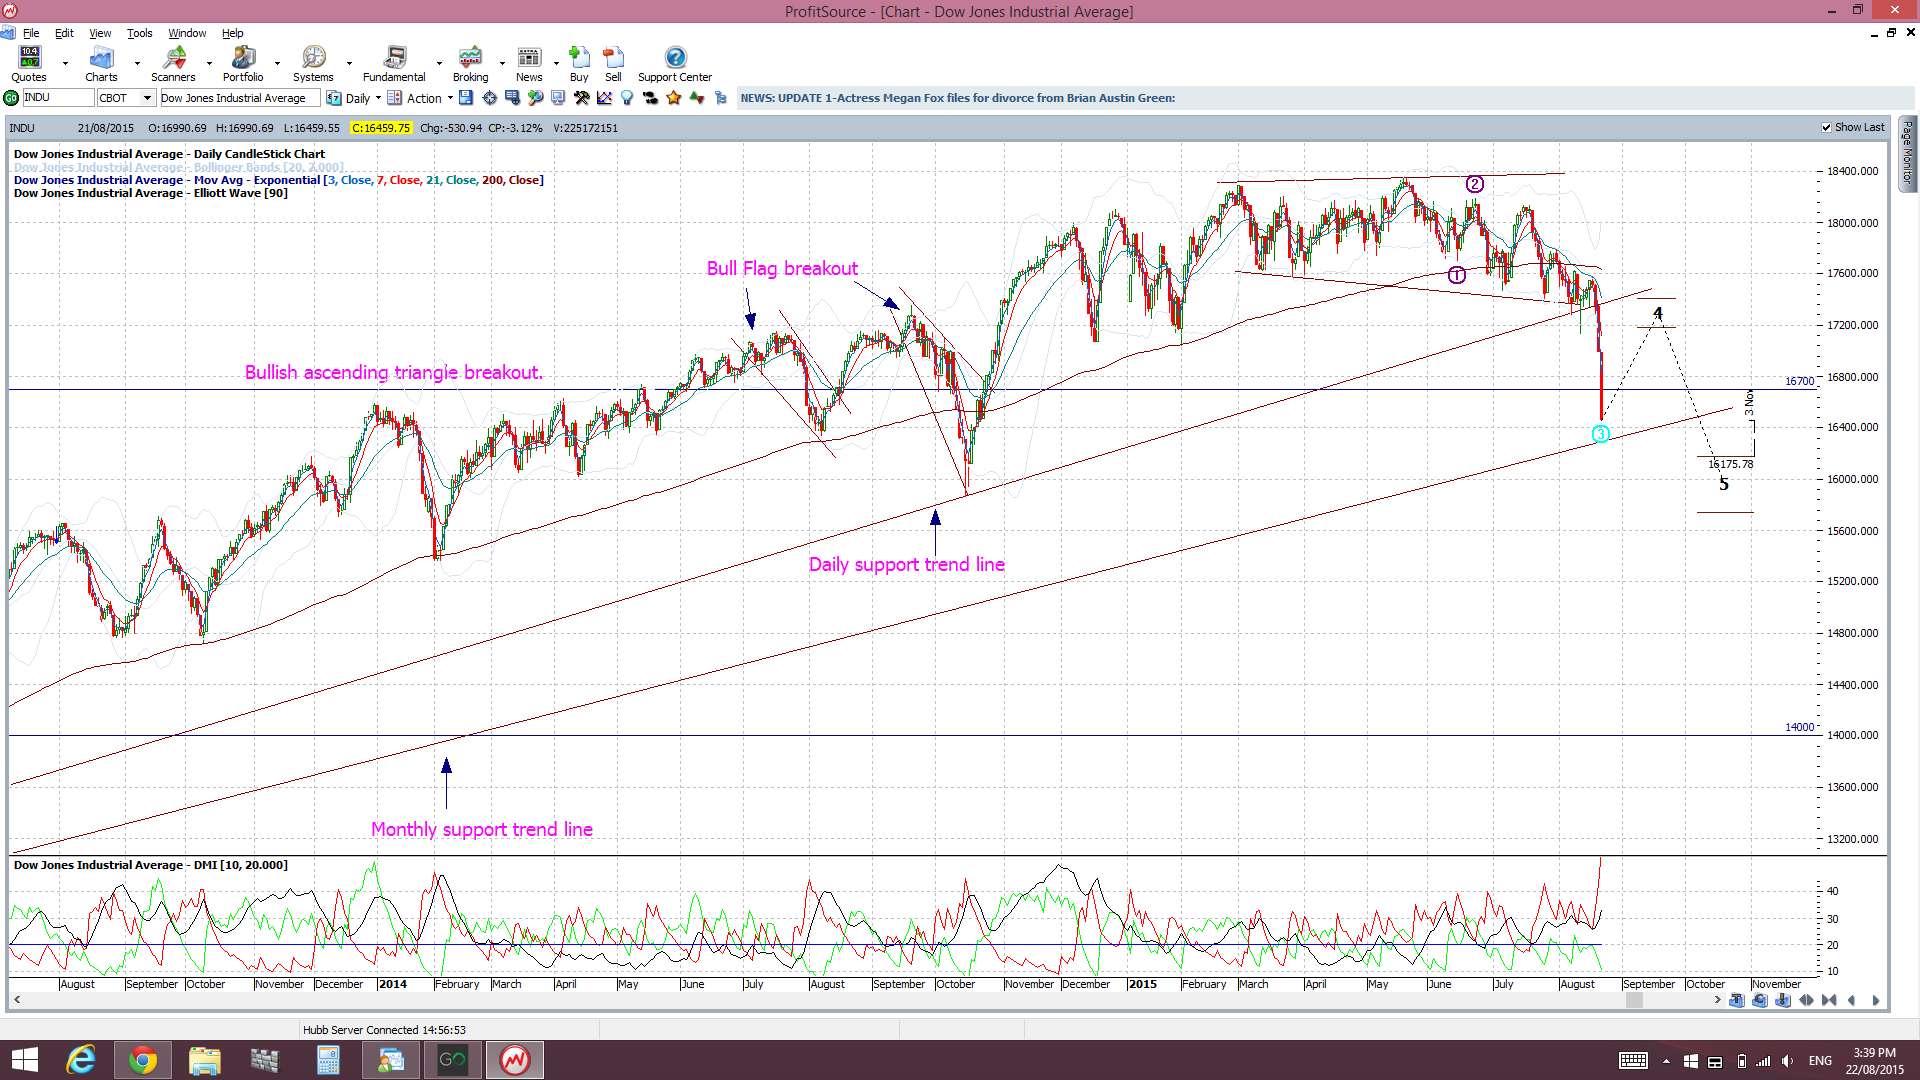
DJIA: The Dow Jones is down through daily support and near to testing the monthly support trend line. Any break and hold below the monthly support would have me looking for a test of the previously broken trend line at 14,000:

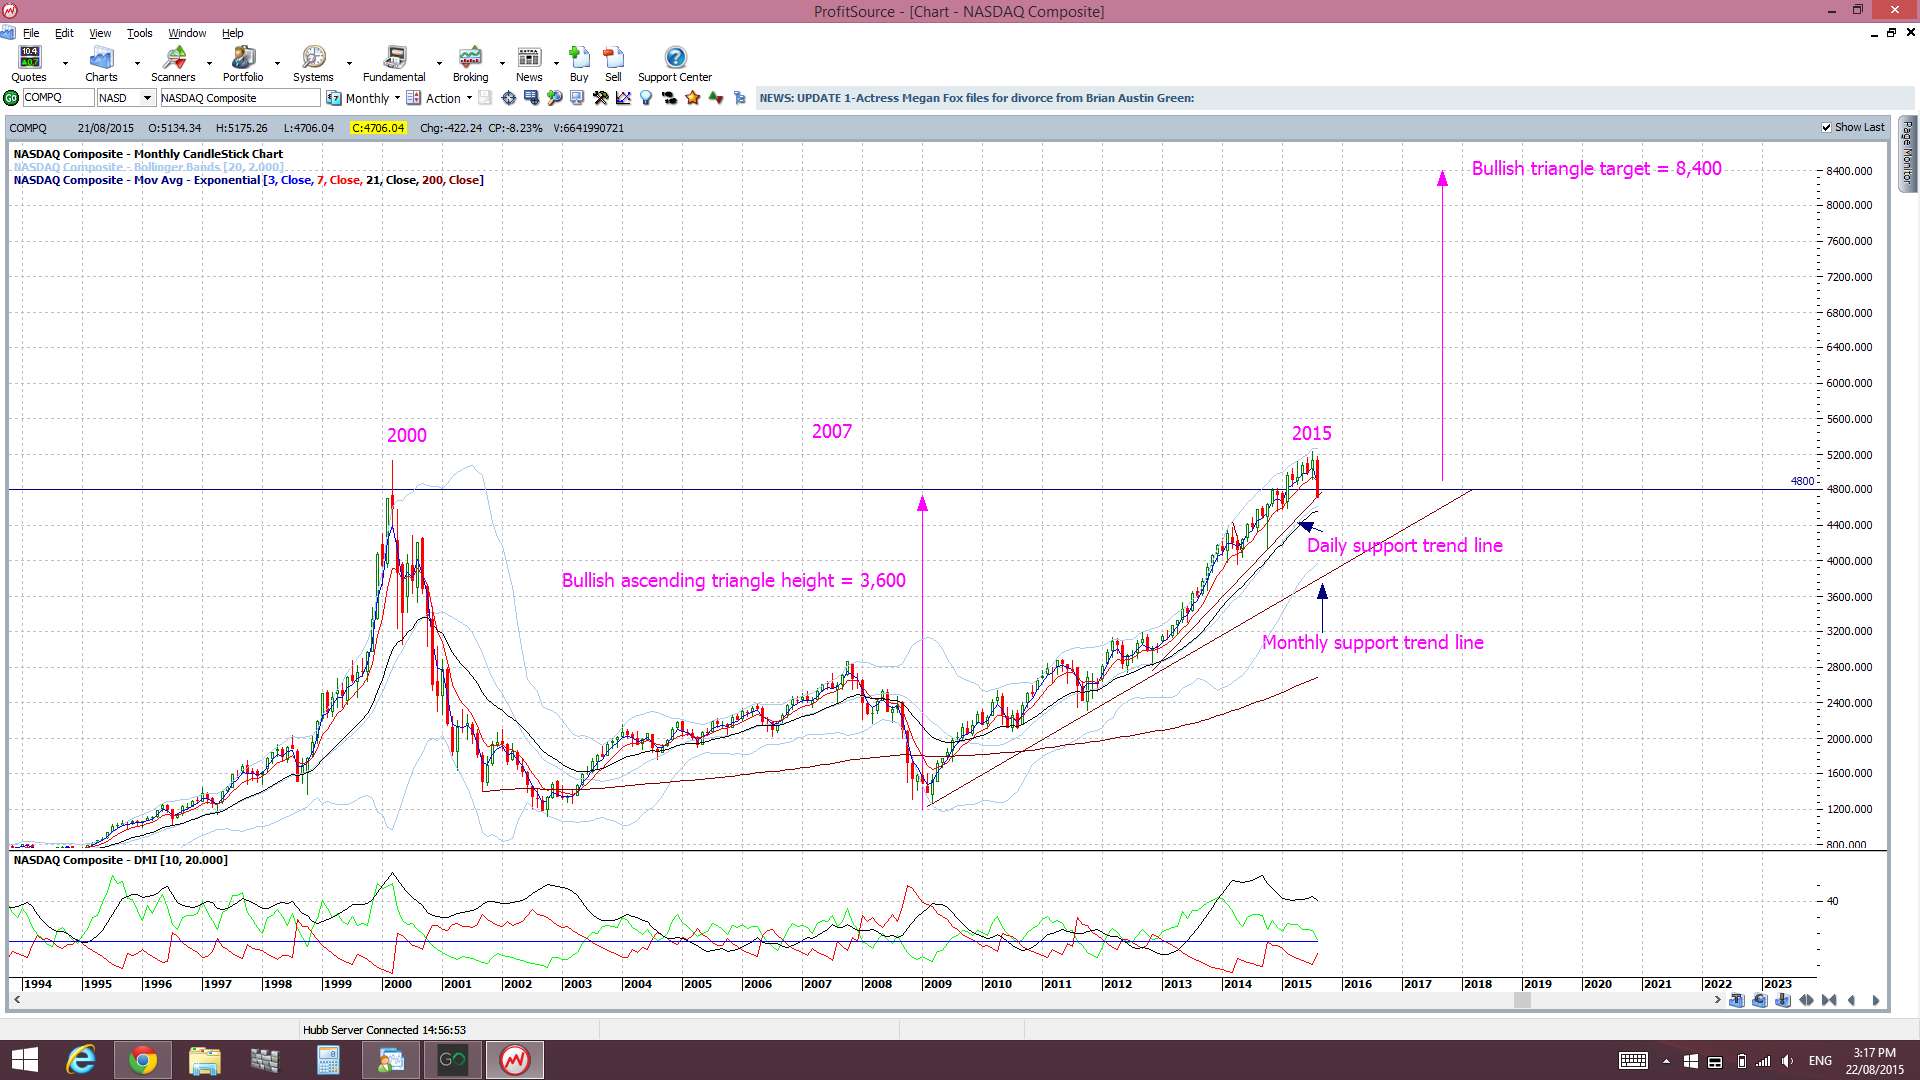
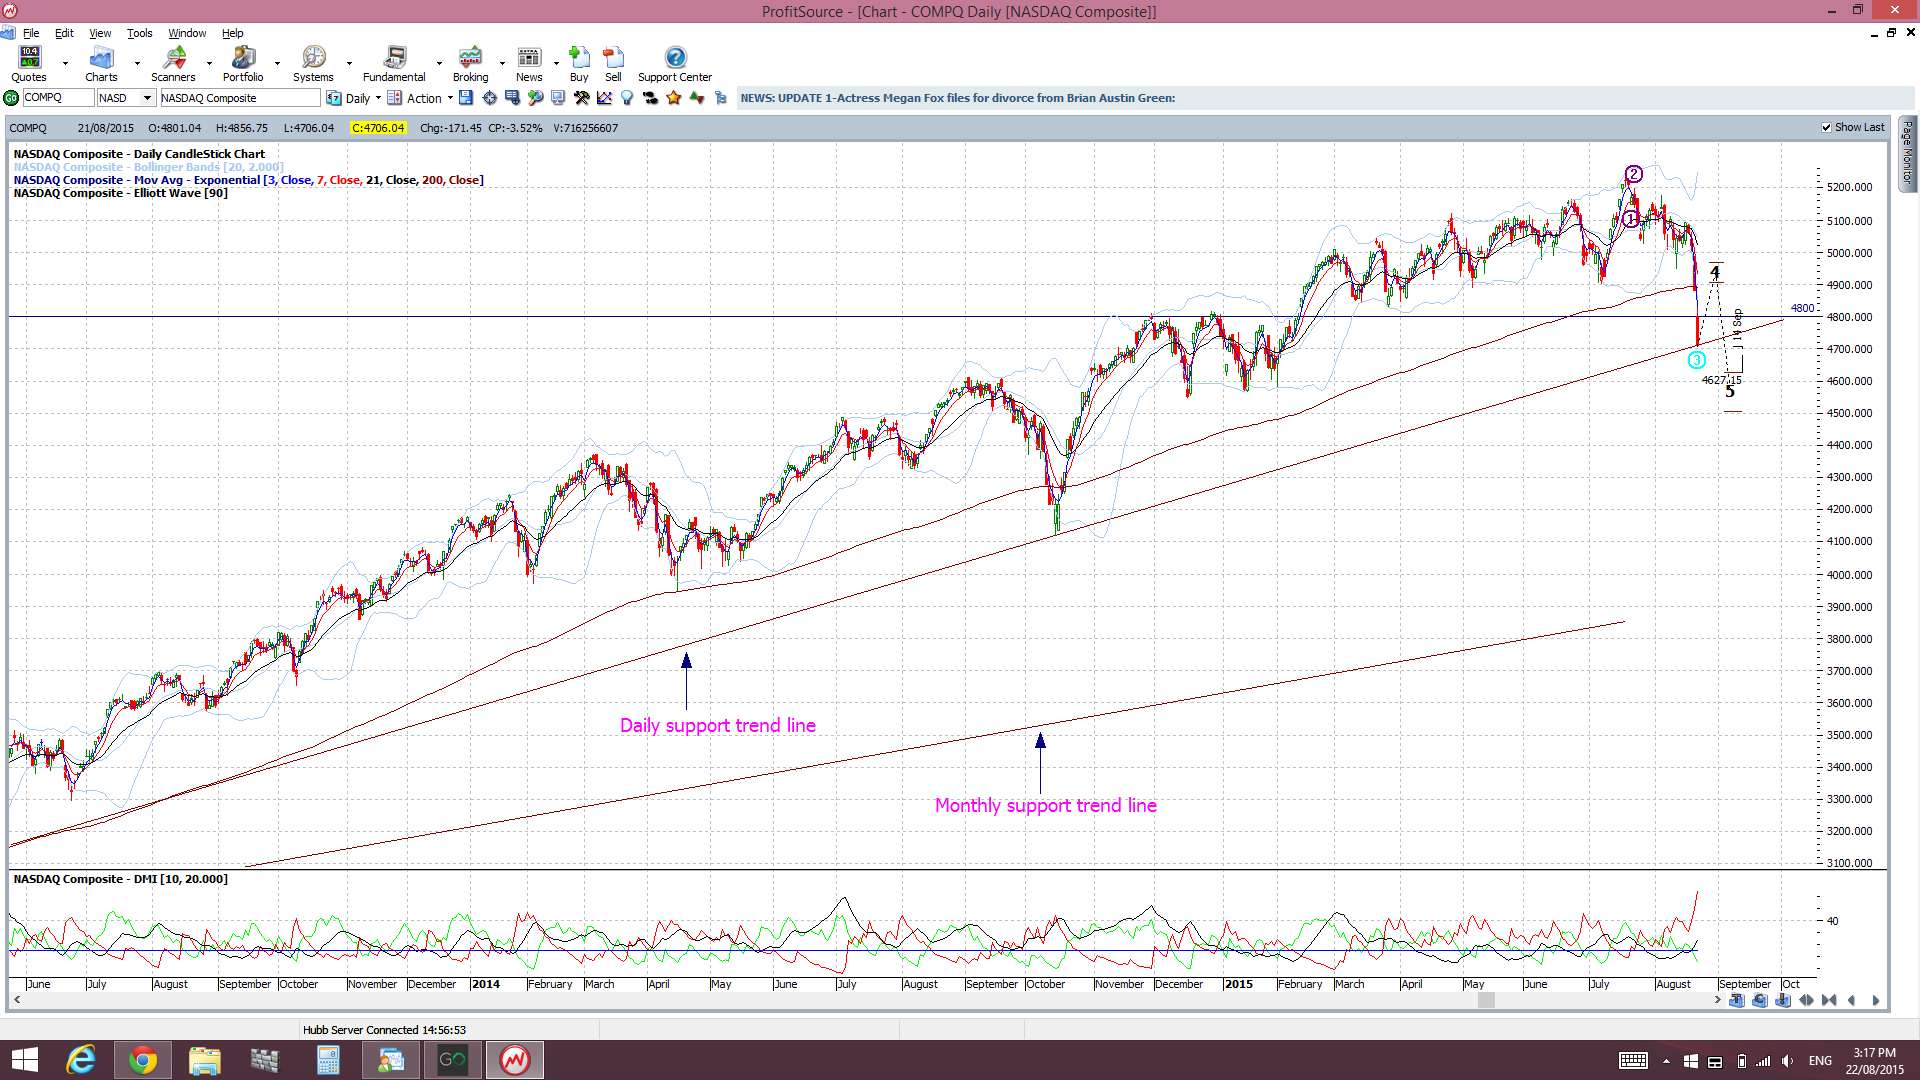
NASDAQ: I have finally seen a test of the broken S/R region of 4,800 as the index plunged down to daily trend line support on Friday. Any close and hold below this daily support would suggest watching the monthly support trend line:
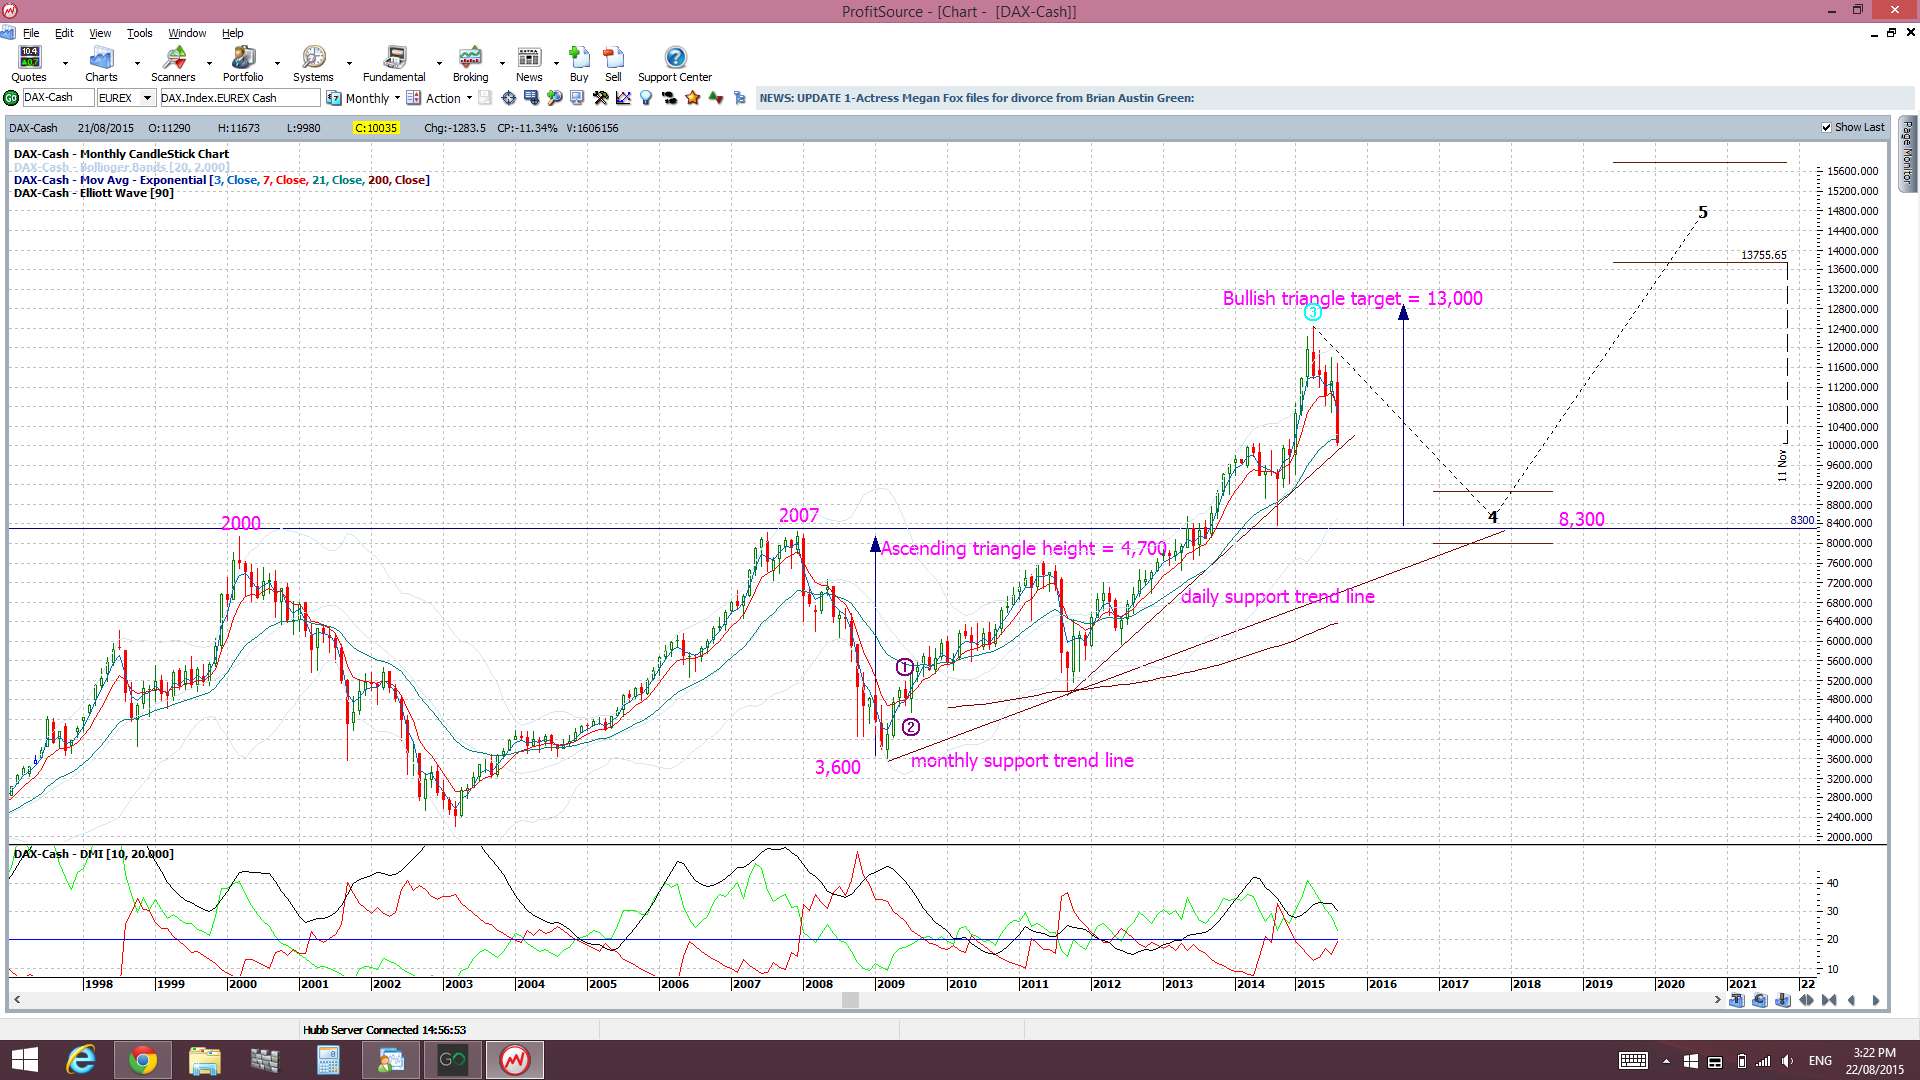
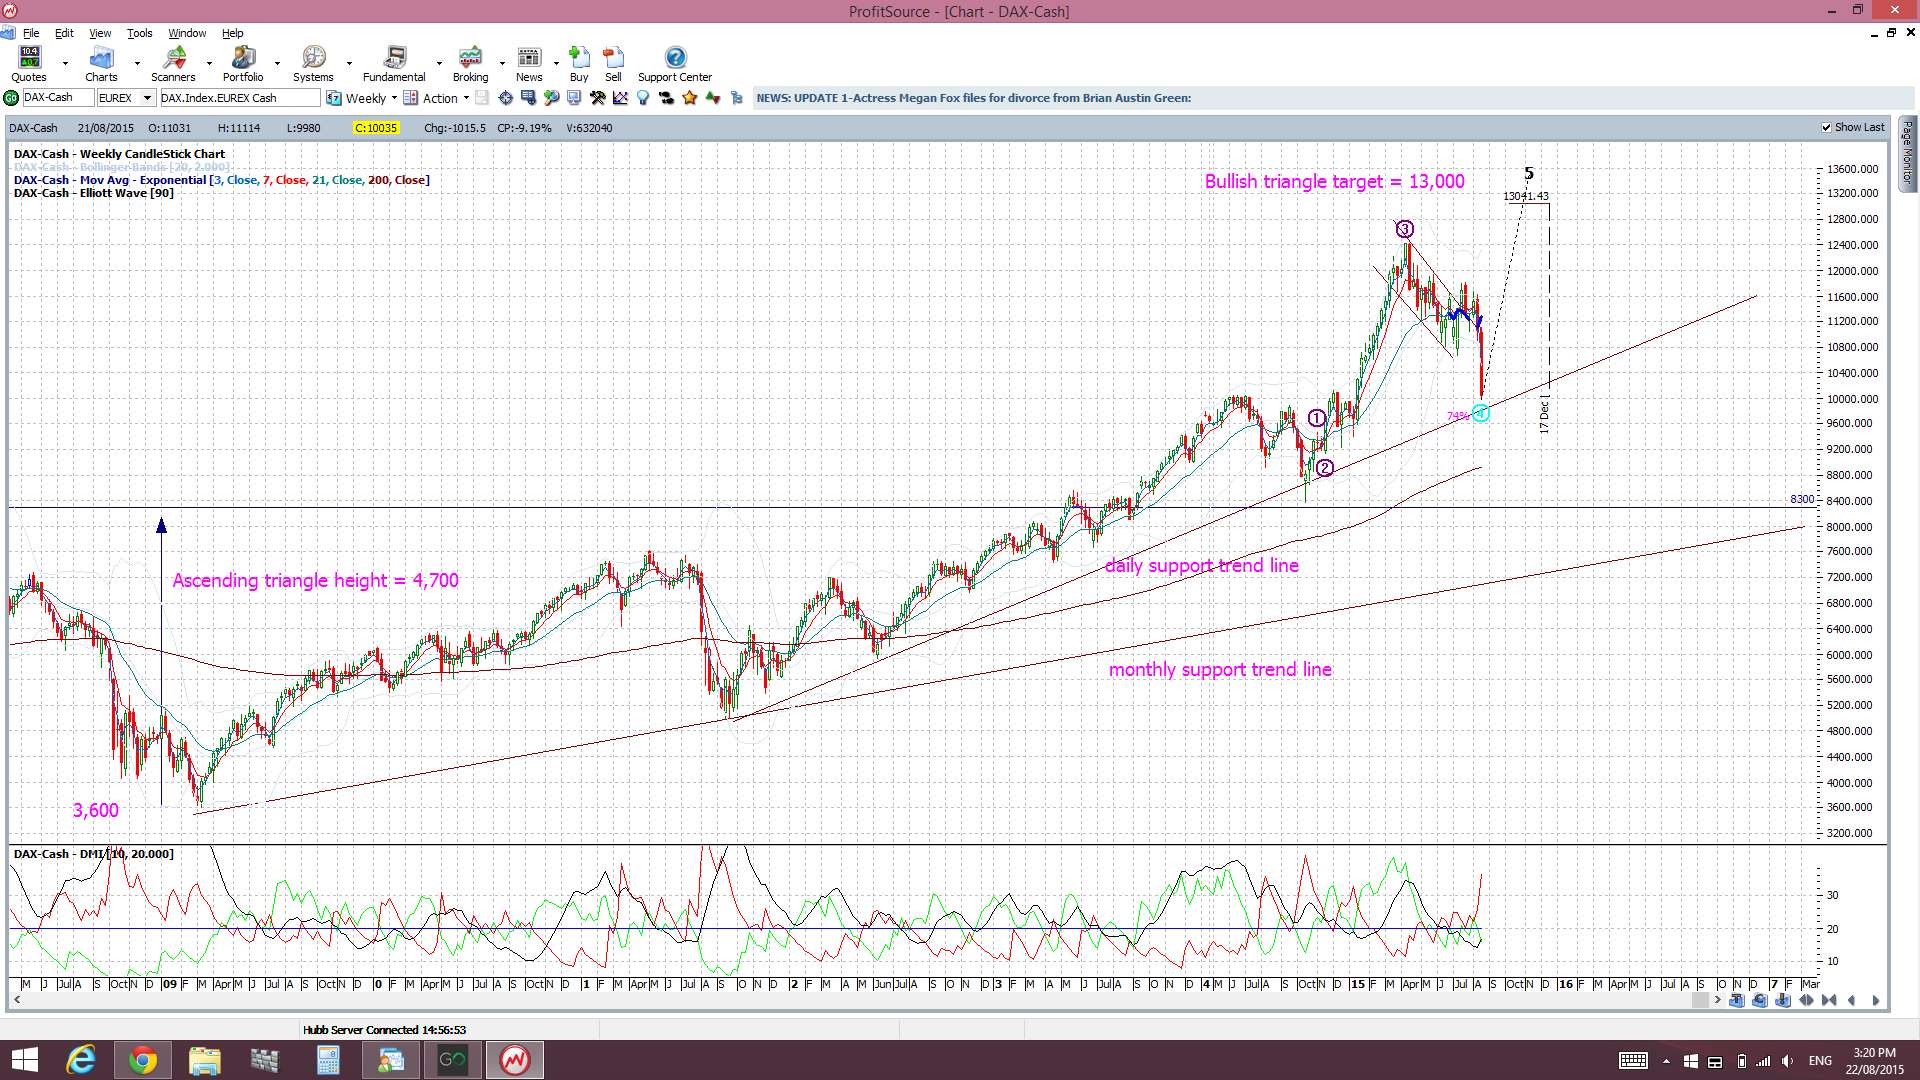
DAX: this is down testing the daily support trend line and any break and hold below this level will have me looking for a test of the 8,300 triangle breakout region. Note how the default Elliott Wave indicator is looking for this too:
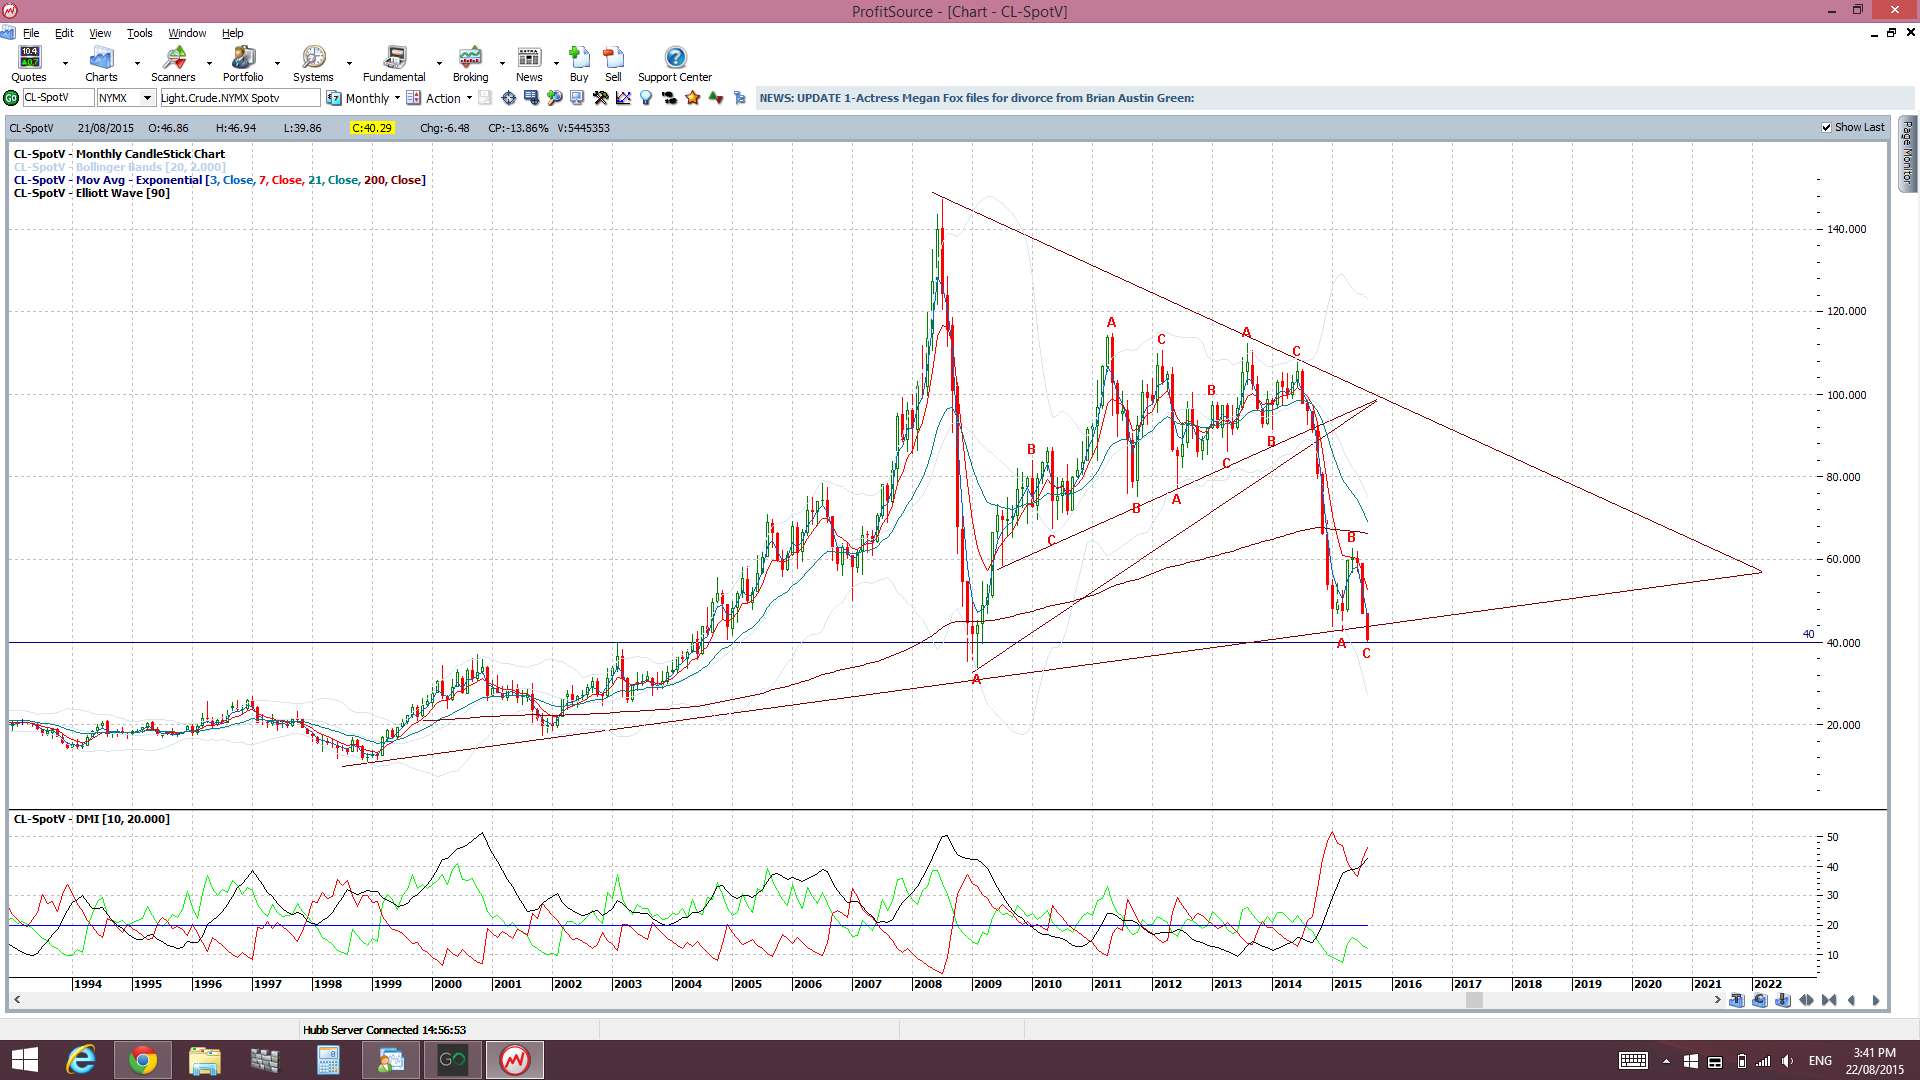
Oil: Time will tell whether the $40 level will hold:
CL monthly:
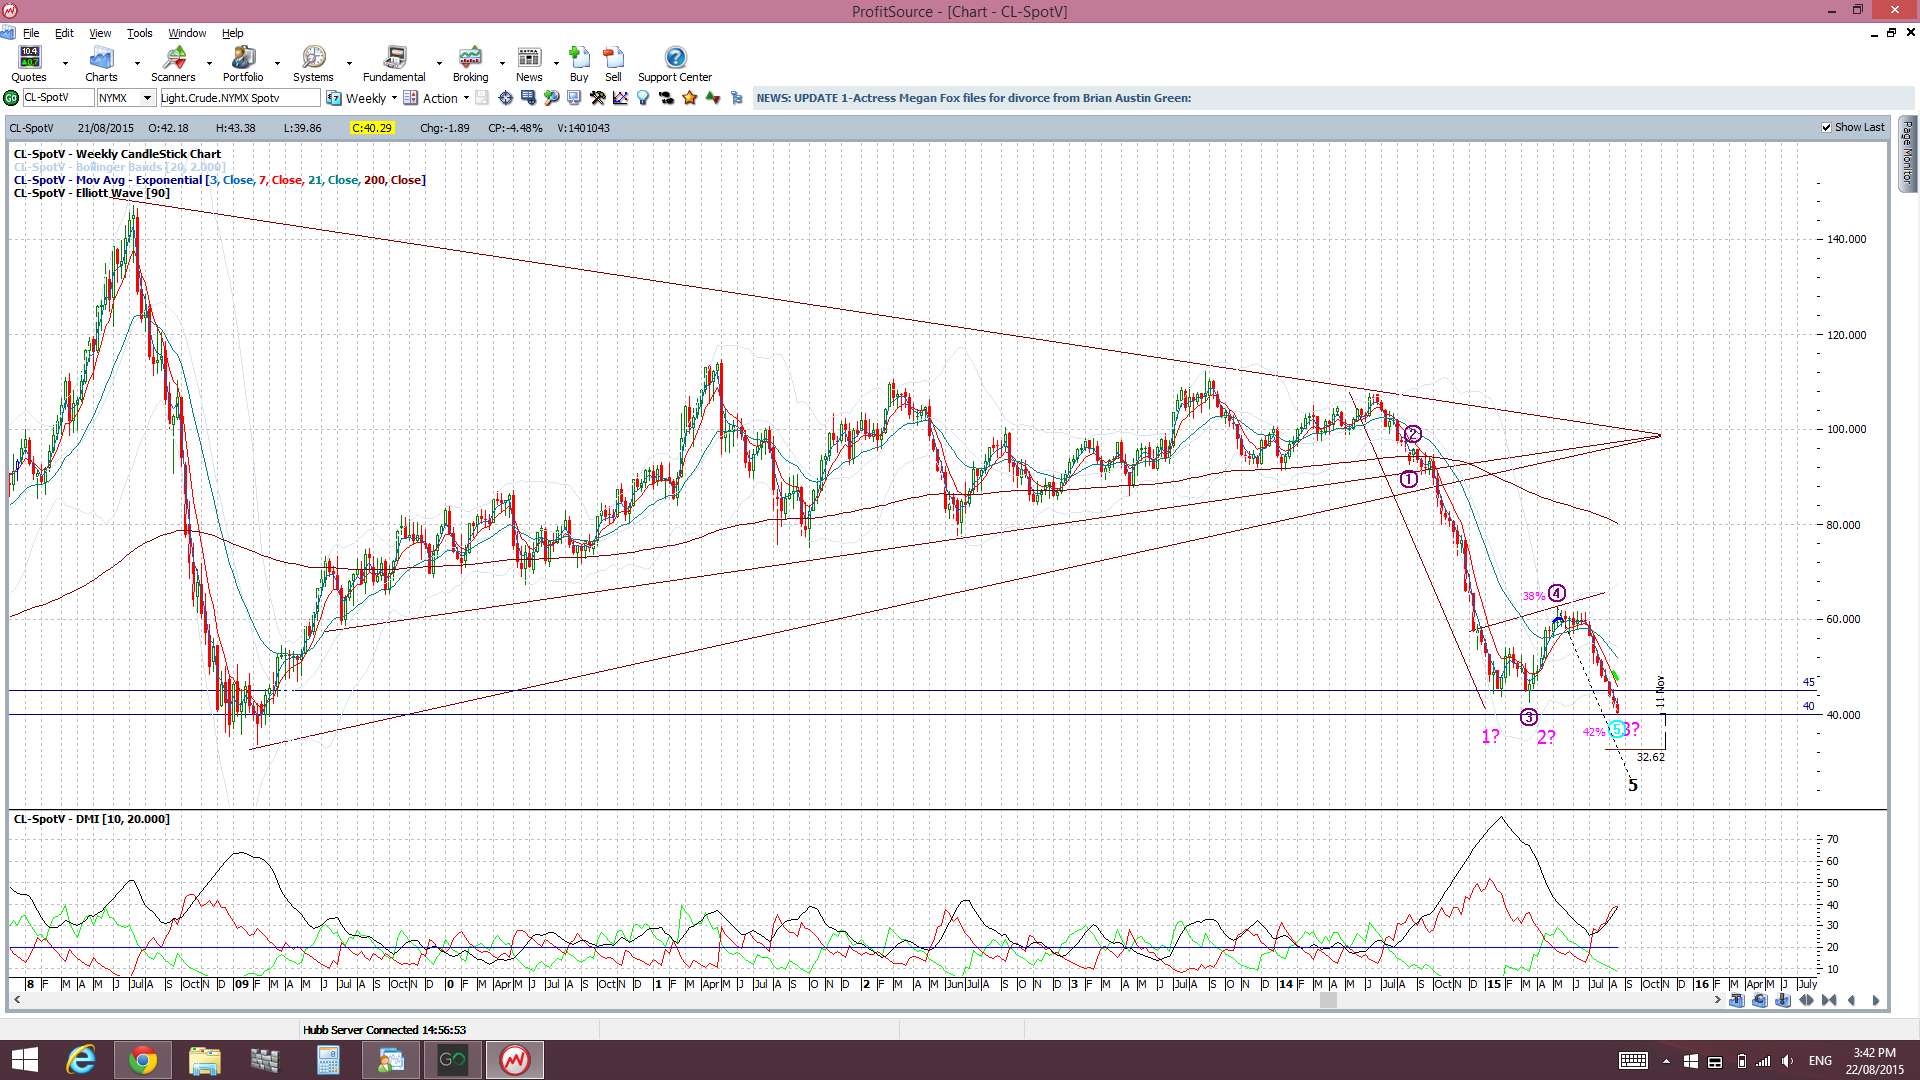
CL weekly: A ‘triple bottom’?
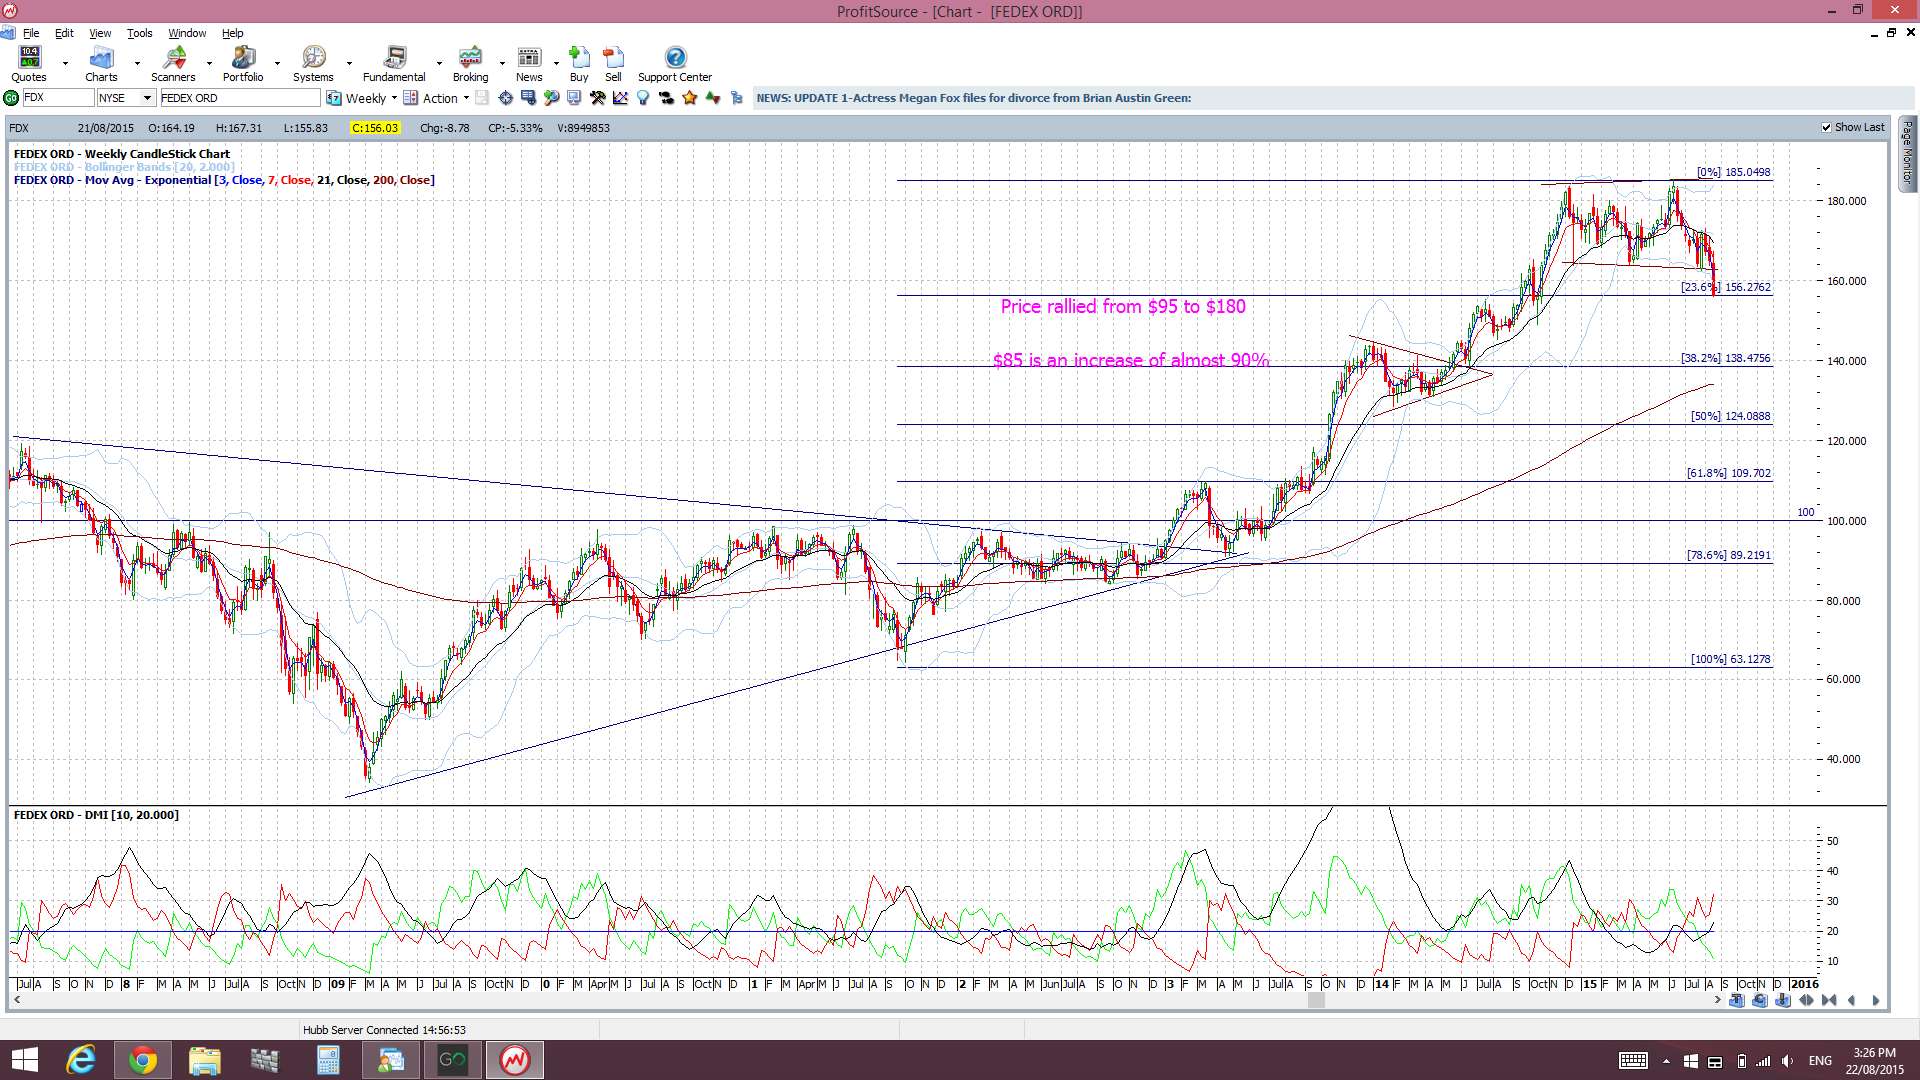
FDX: Fedex has broken down from a recent trading channel and any 61.8% pullback here would bring price back down to near the triangle breakout region:
FOREX:
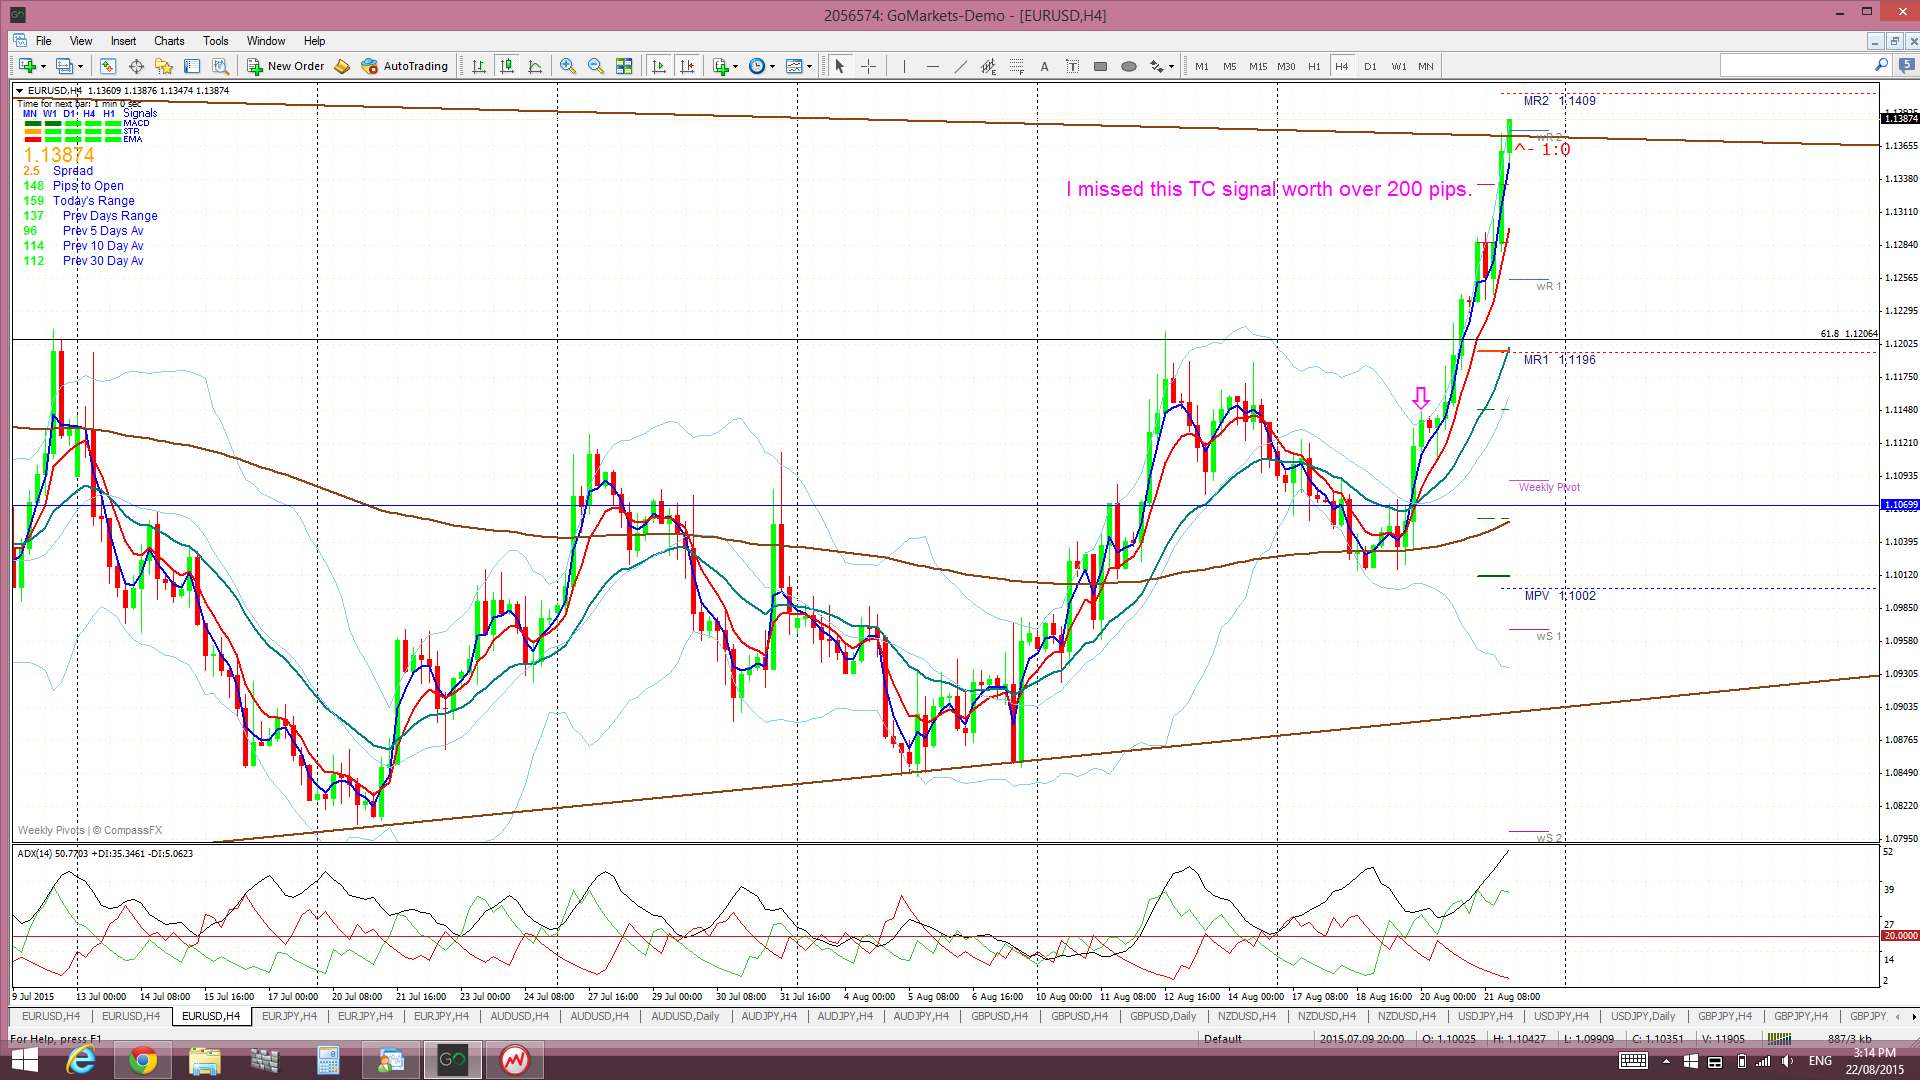
E/U: I was away from my charts for the last couple of sessions and this was the last E/U 4hr chart that I posted:
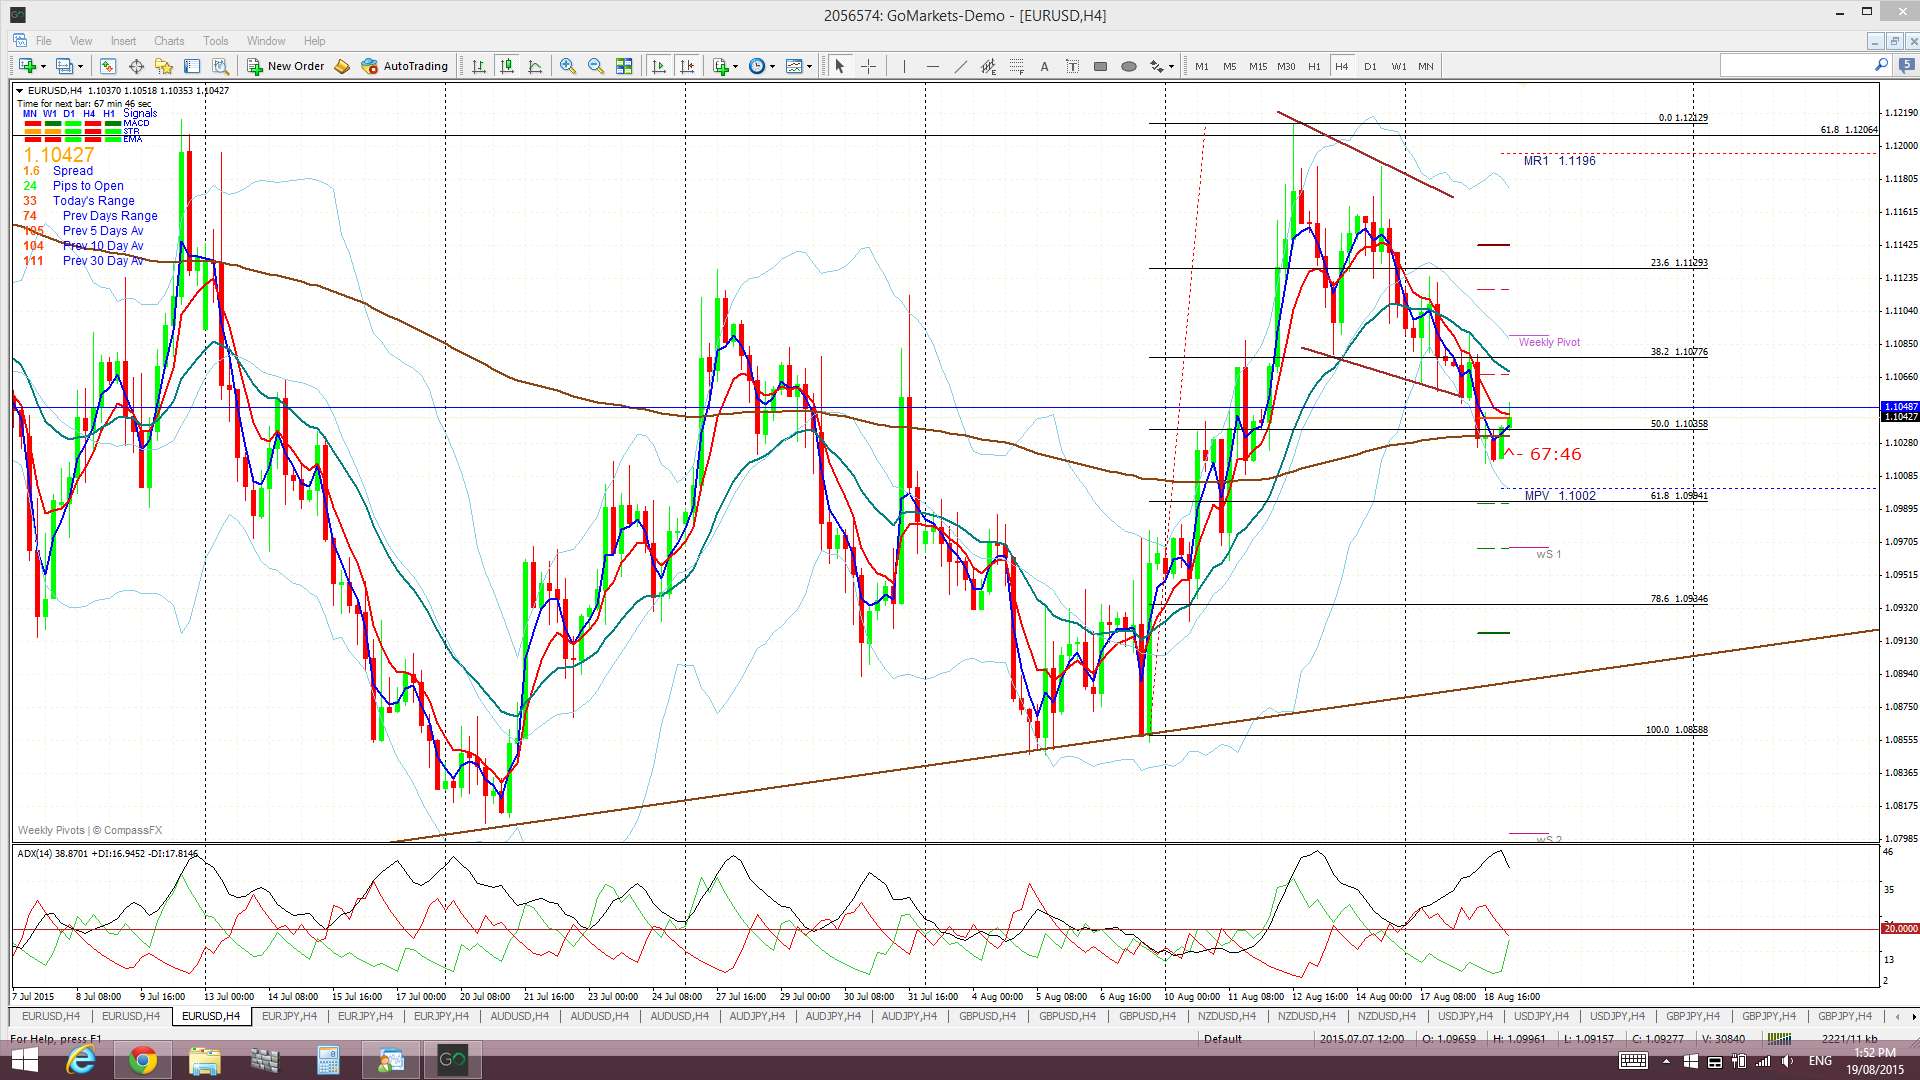
Since then the E/U has rallied and I missed a great 4hr-based TC signal. The E/U has also punched up through the Flag pattern:
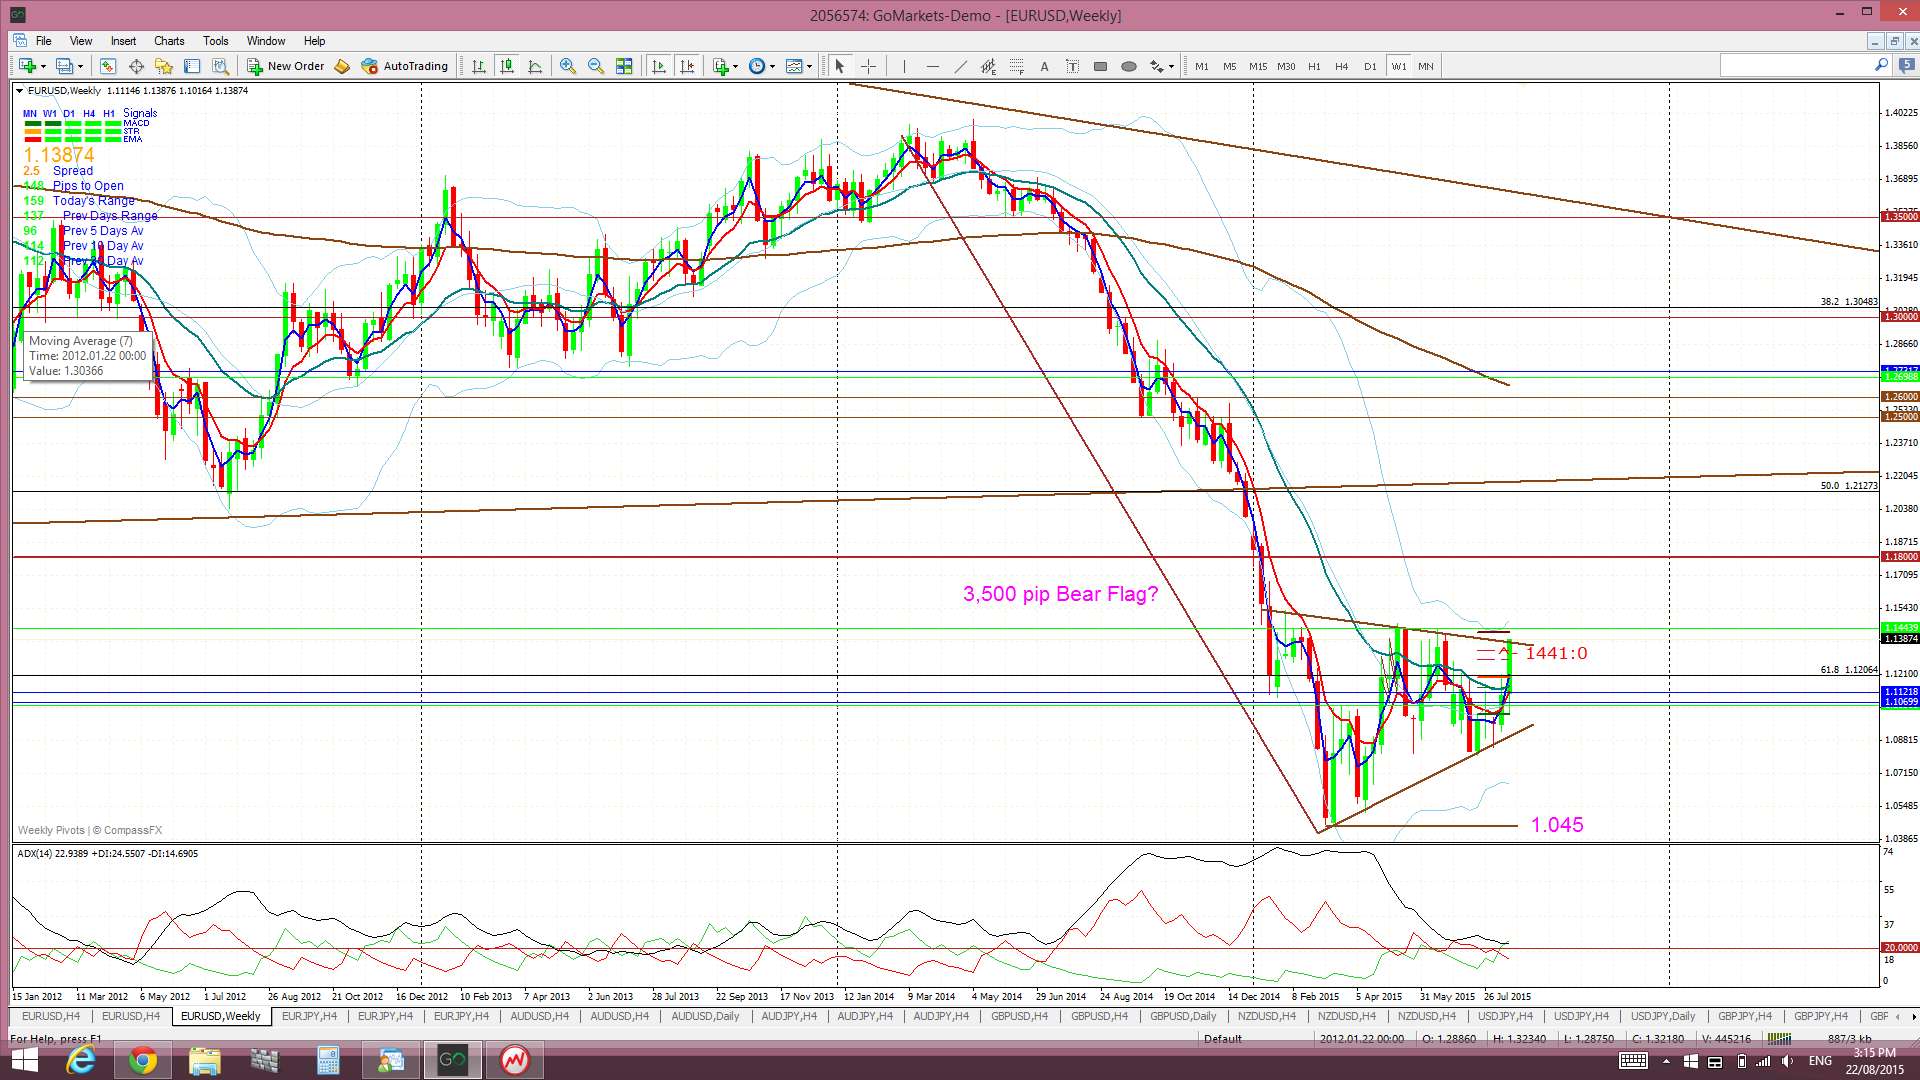
E/U weekly: watch for any break and hold up through this Flag trend line:
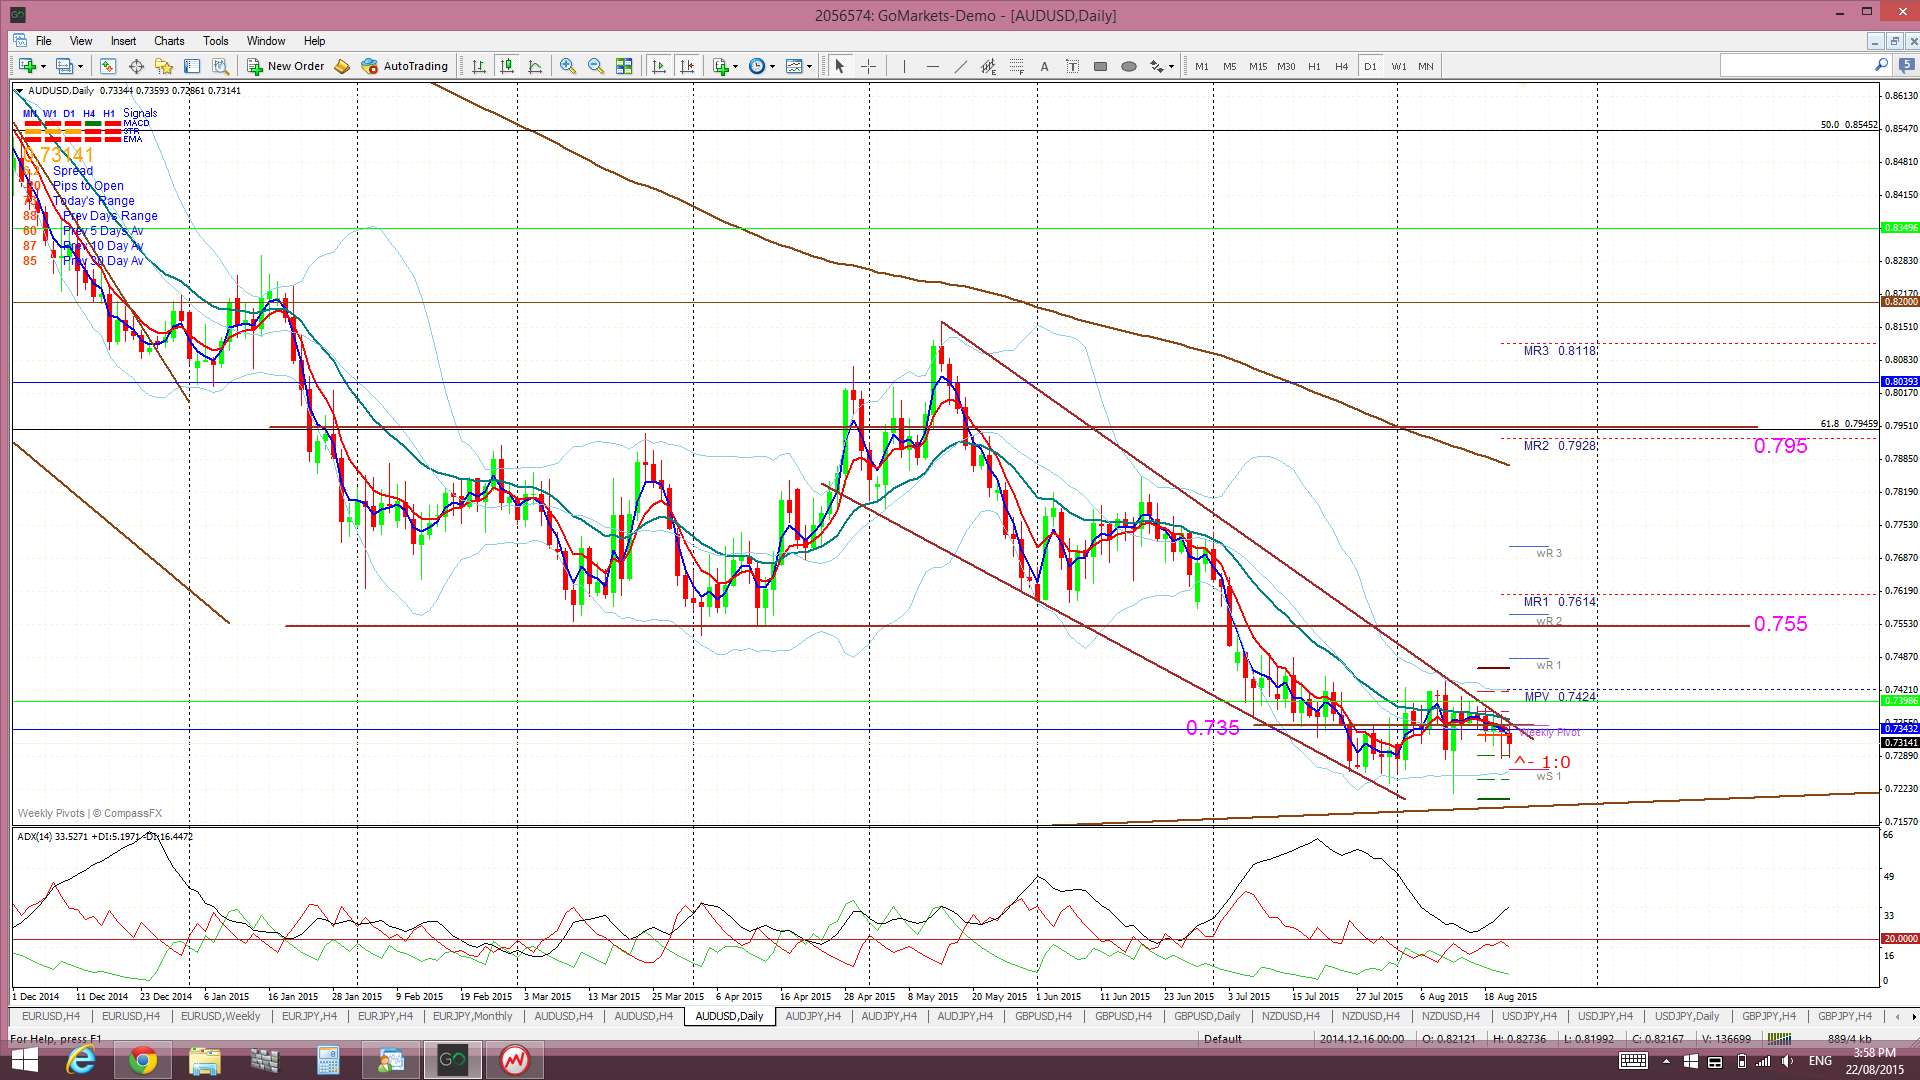
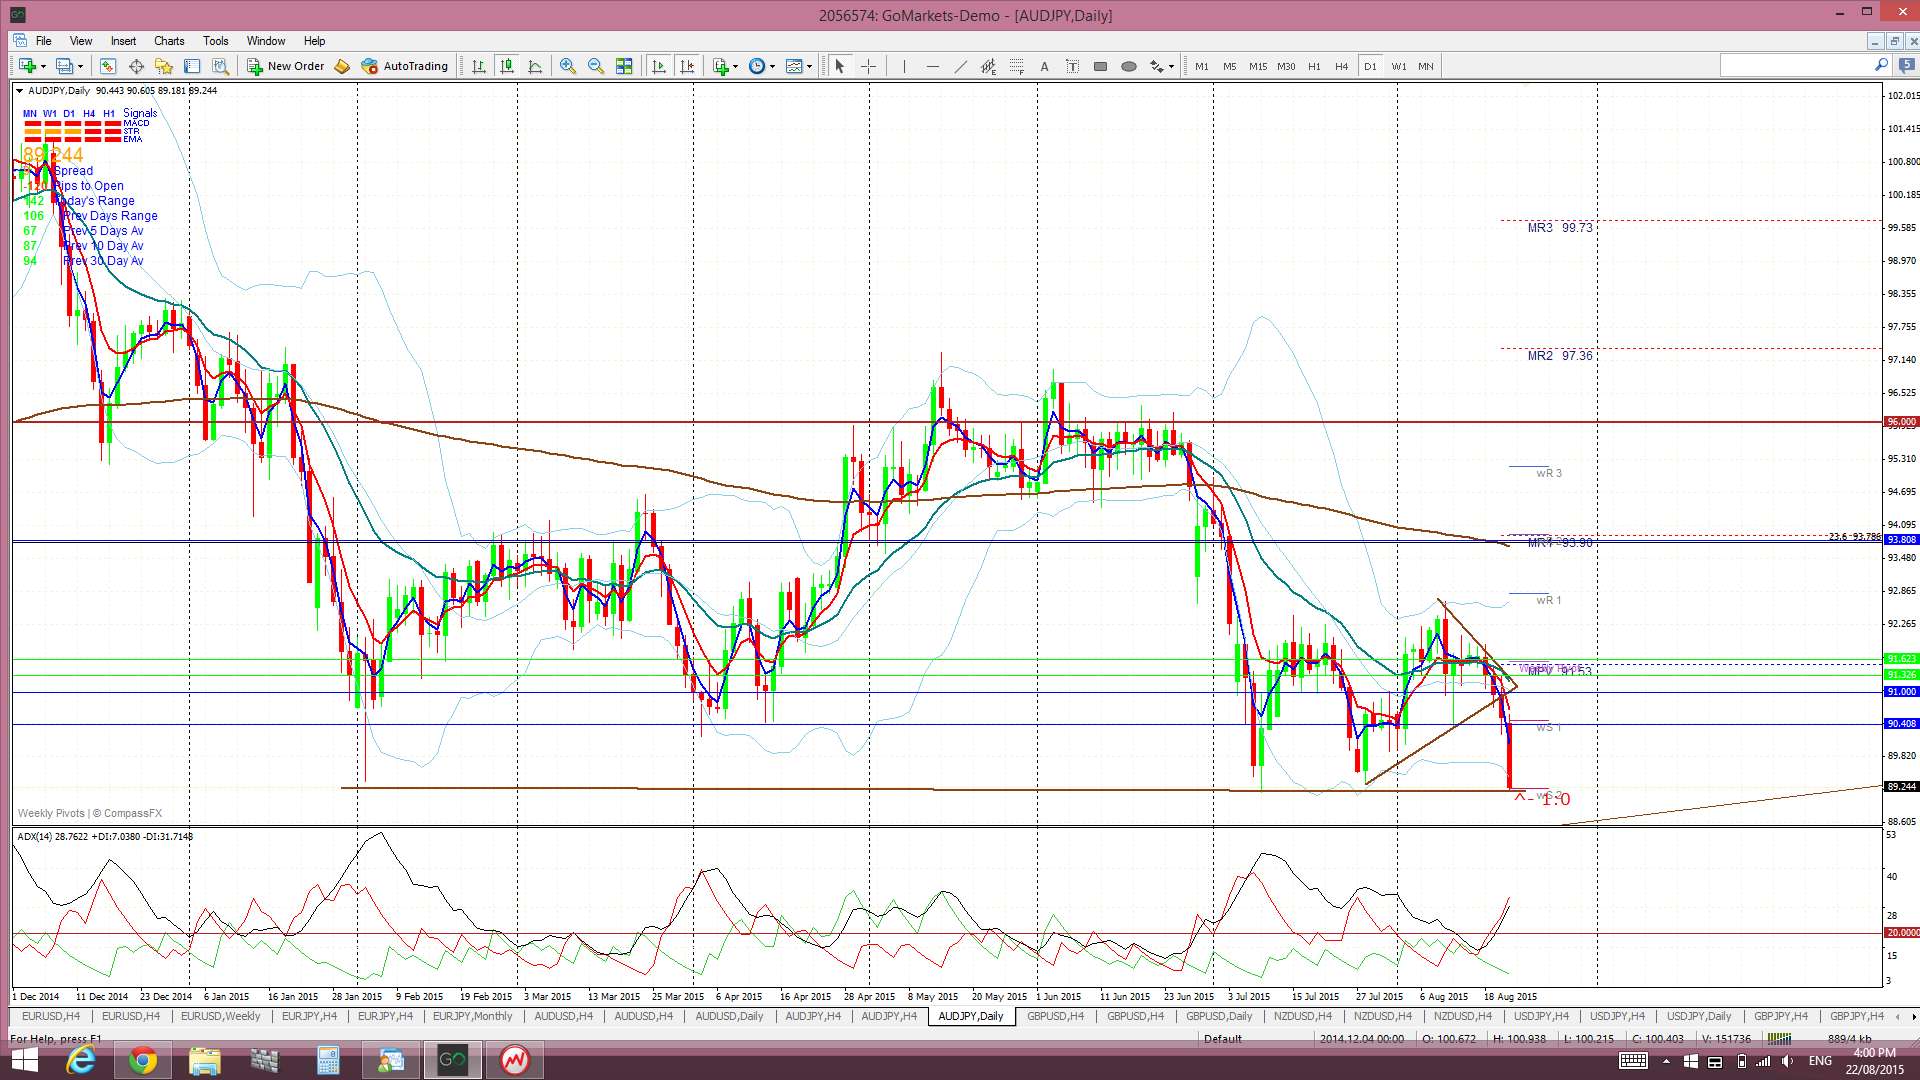
A/U: this has not changed much despite the carnage across other pairs and stocks:
A/J: this has experienced a bit of a move since my last post. The 4hr chart back then was as per below and showed a triangle pattern forming up:
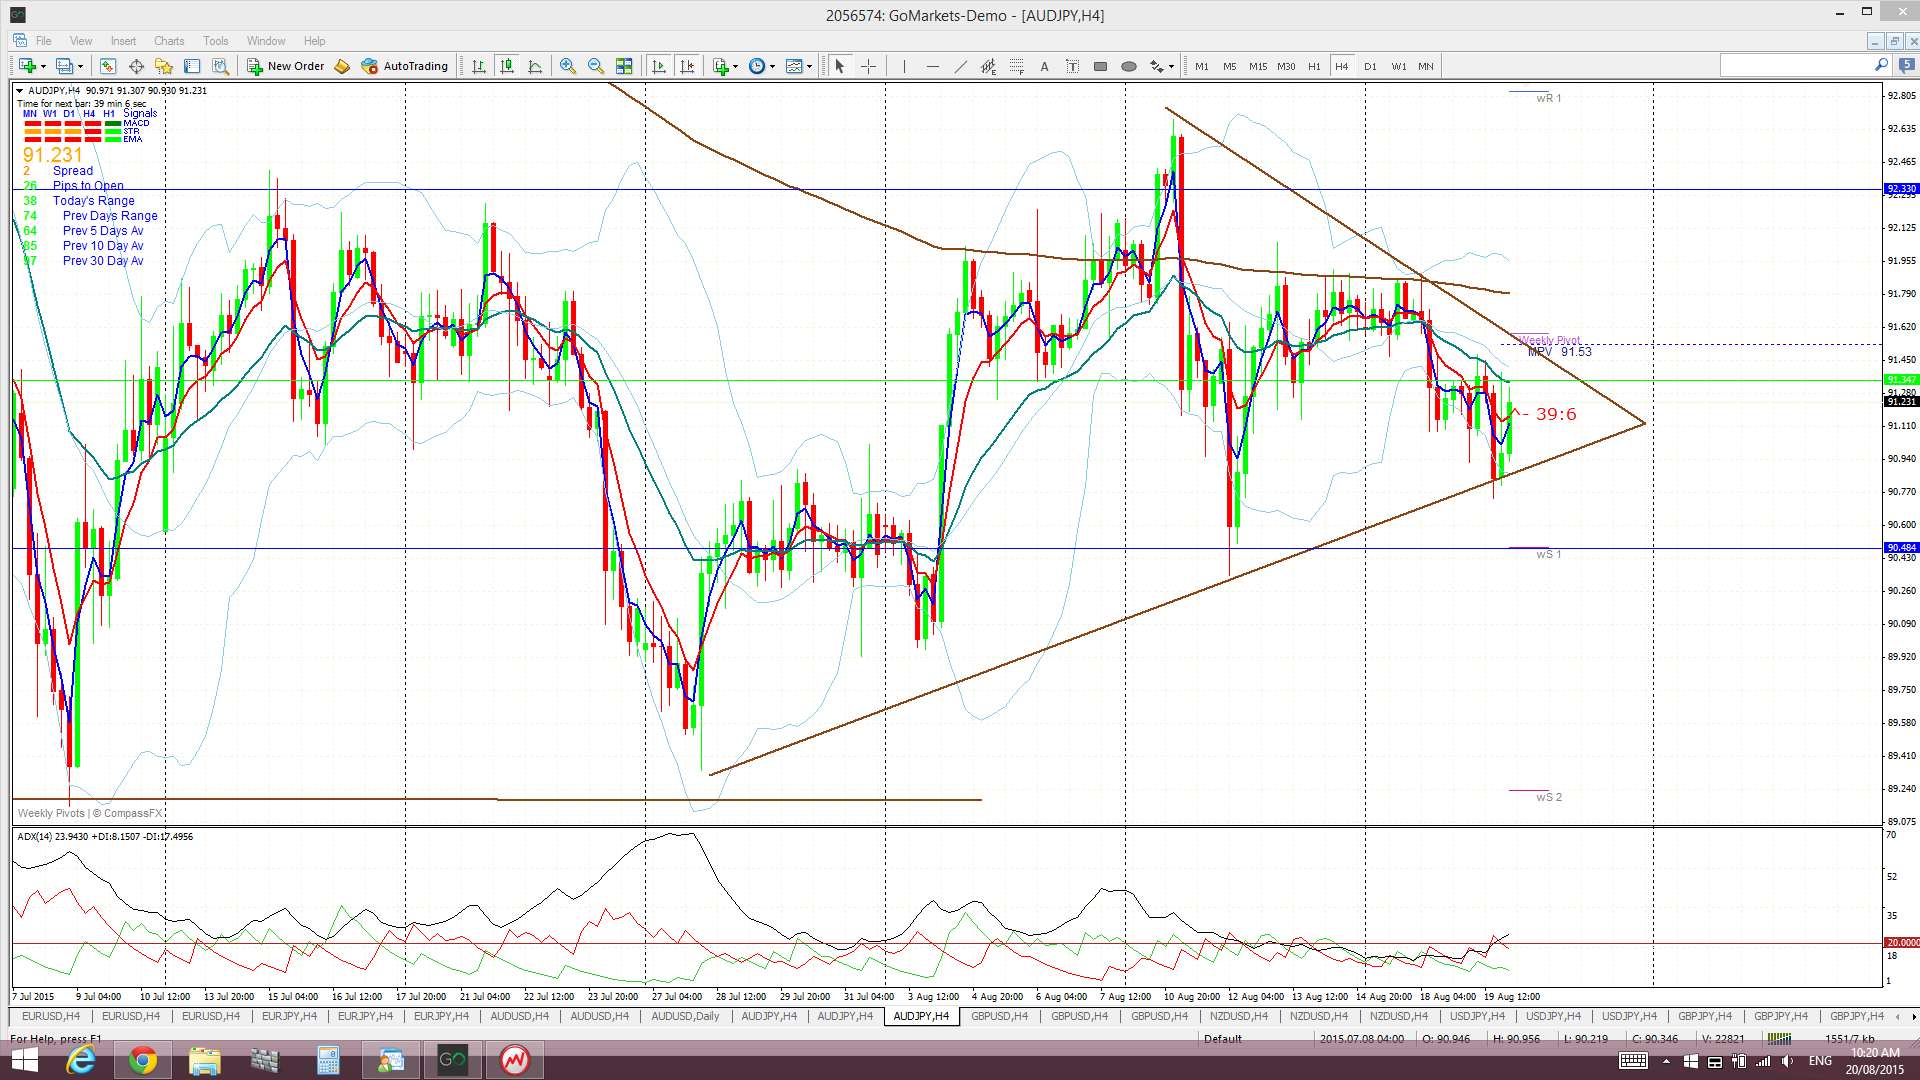
The 4hr chart now looks like this and the triangle breakout gave around 160 pips!:
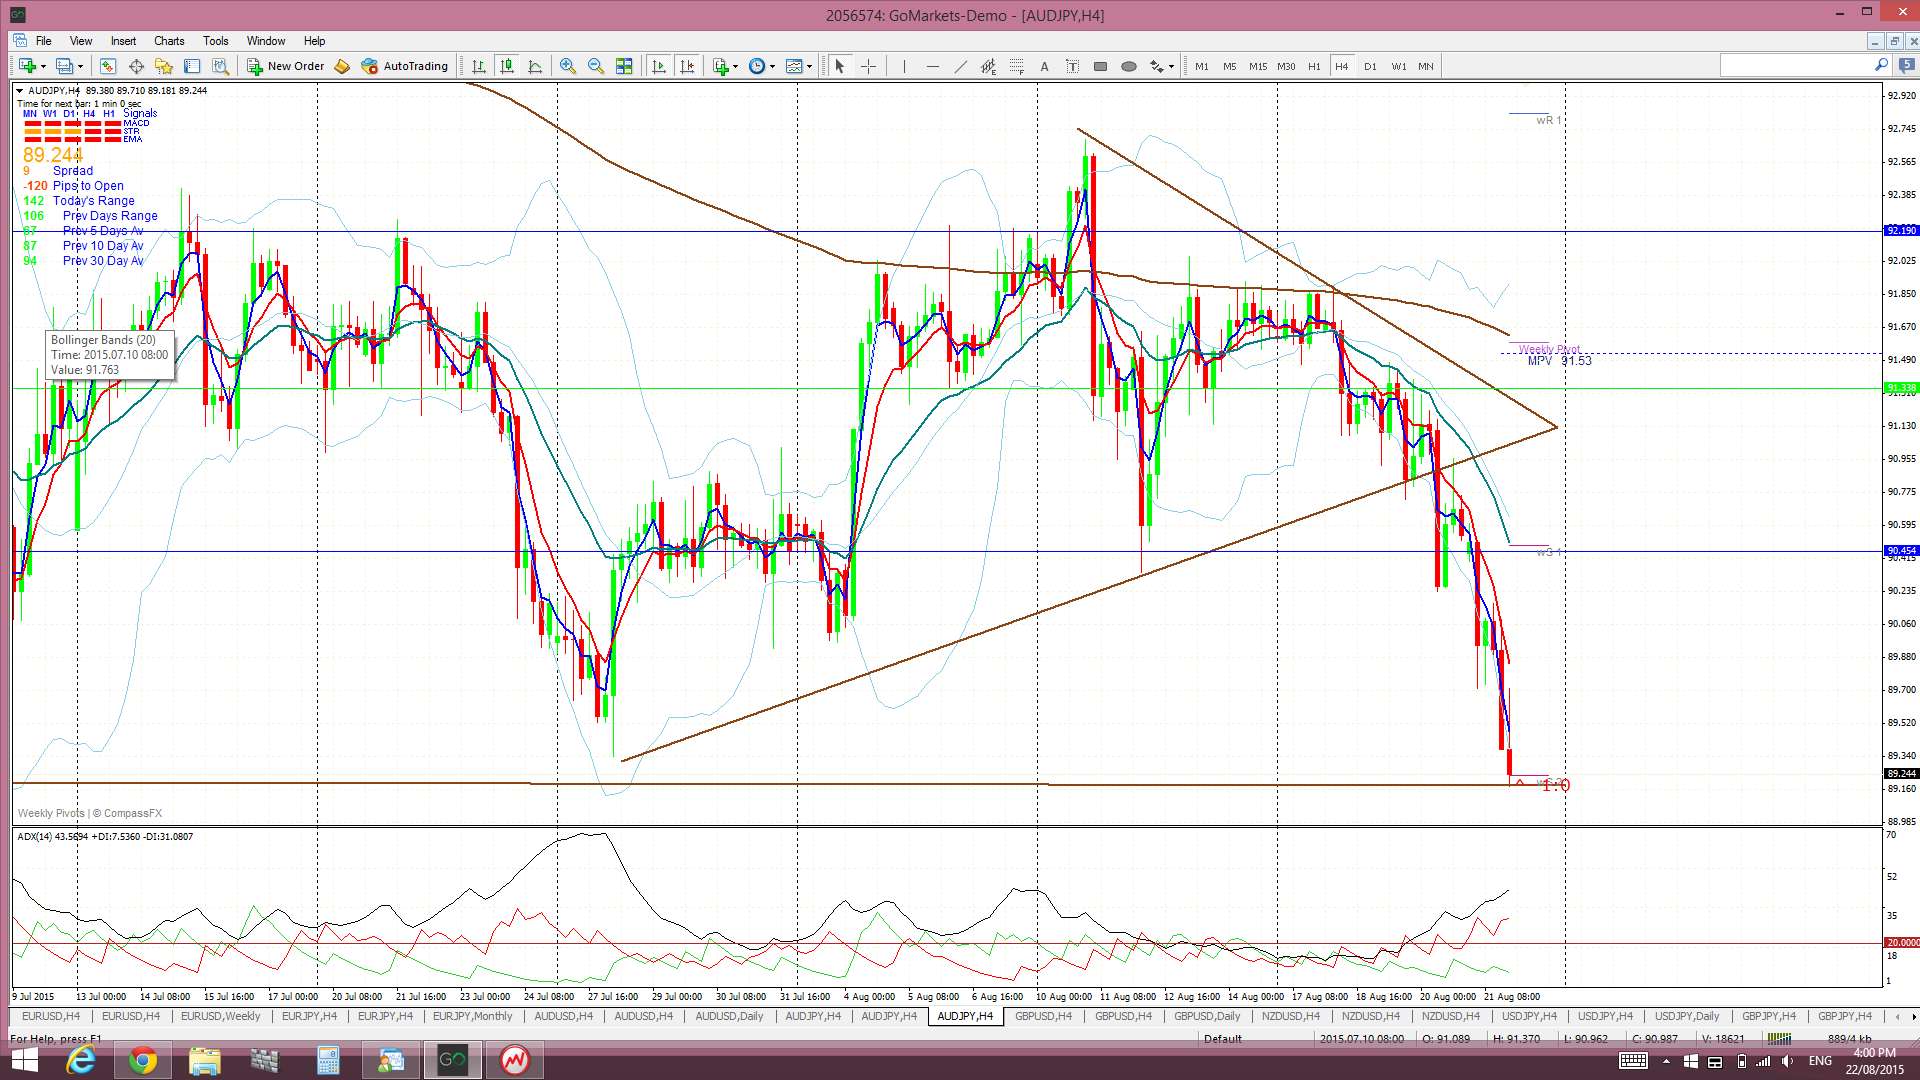
Where did it stop? At recent daily support:
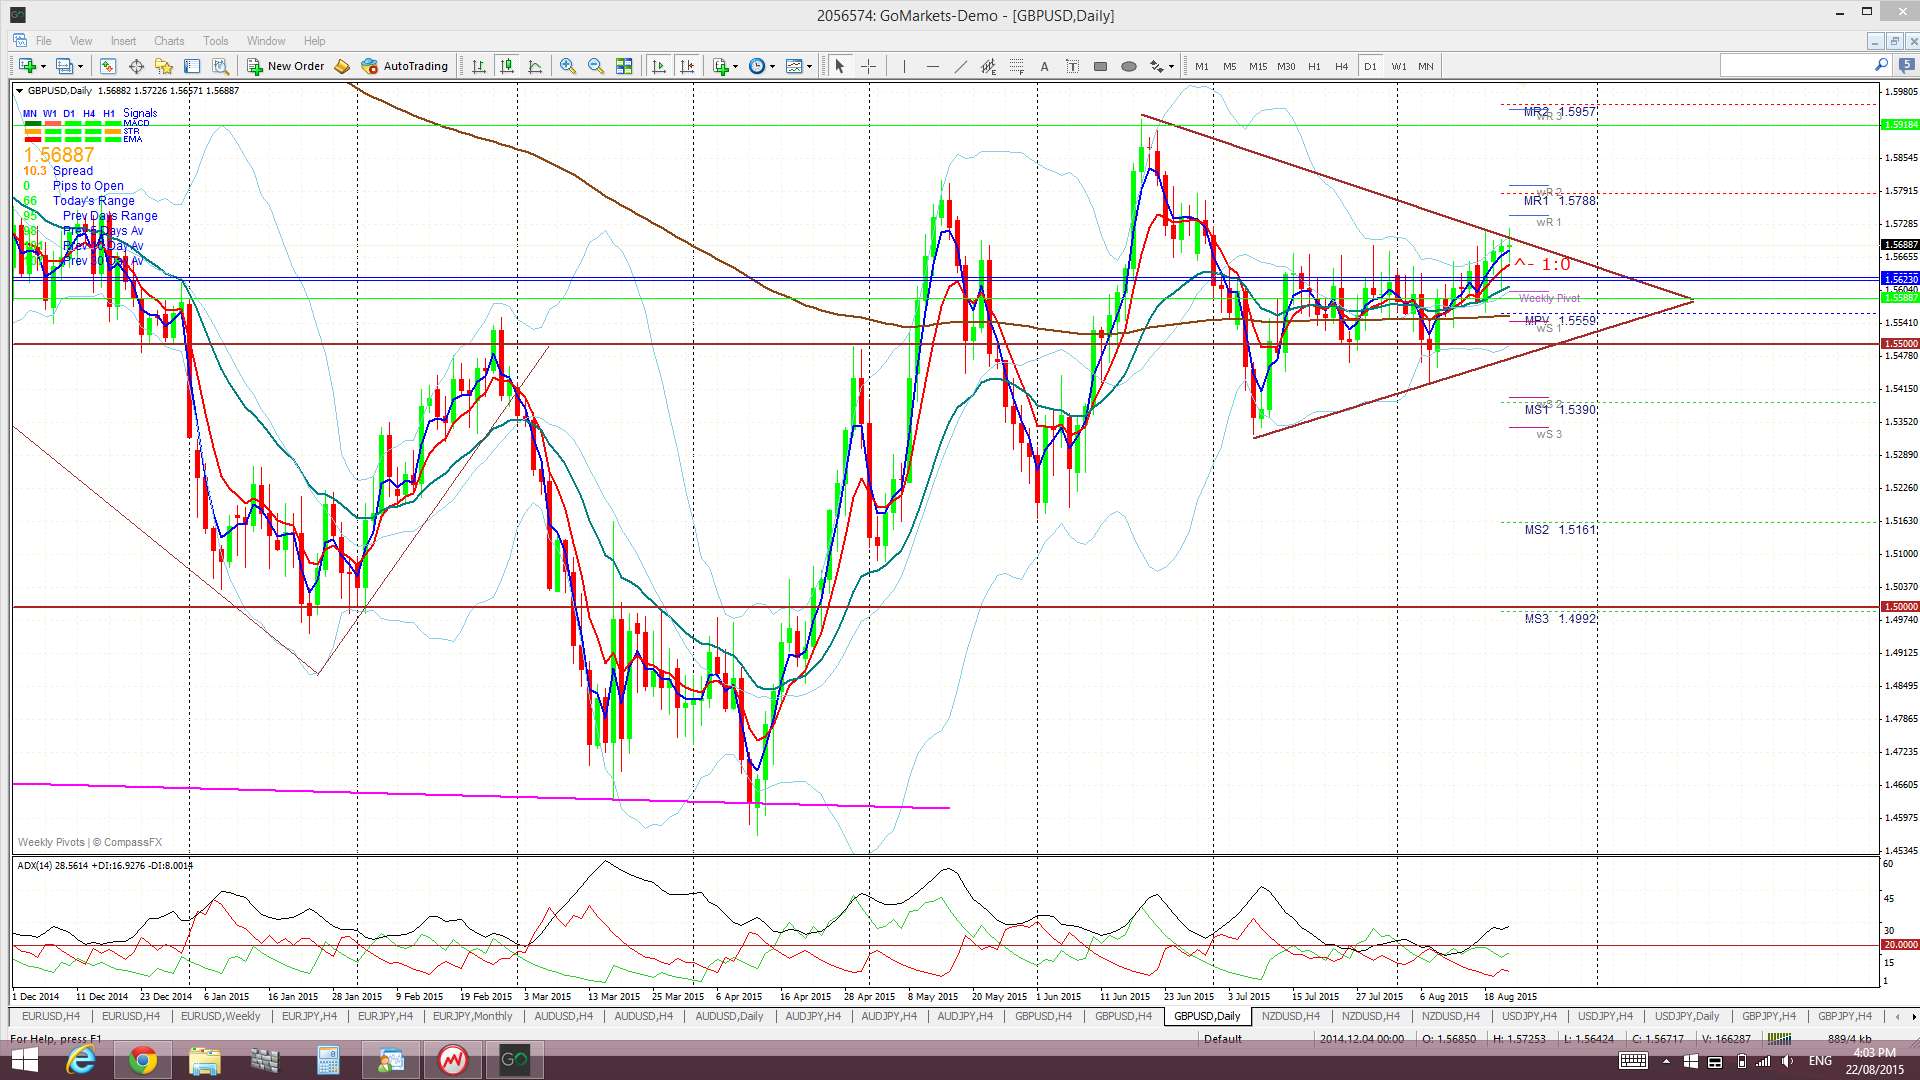
Cable daily: this hasn’t moved too far either:
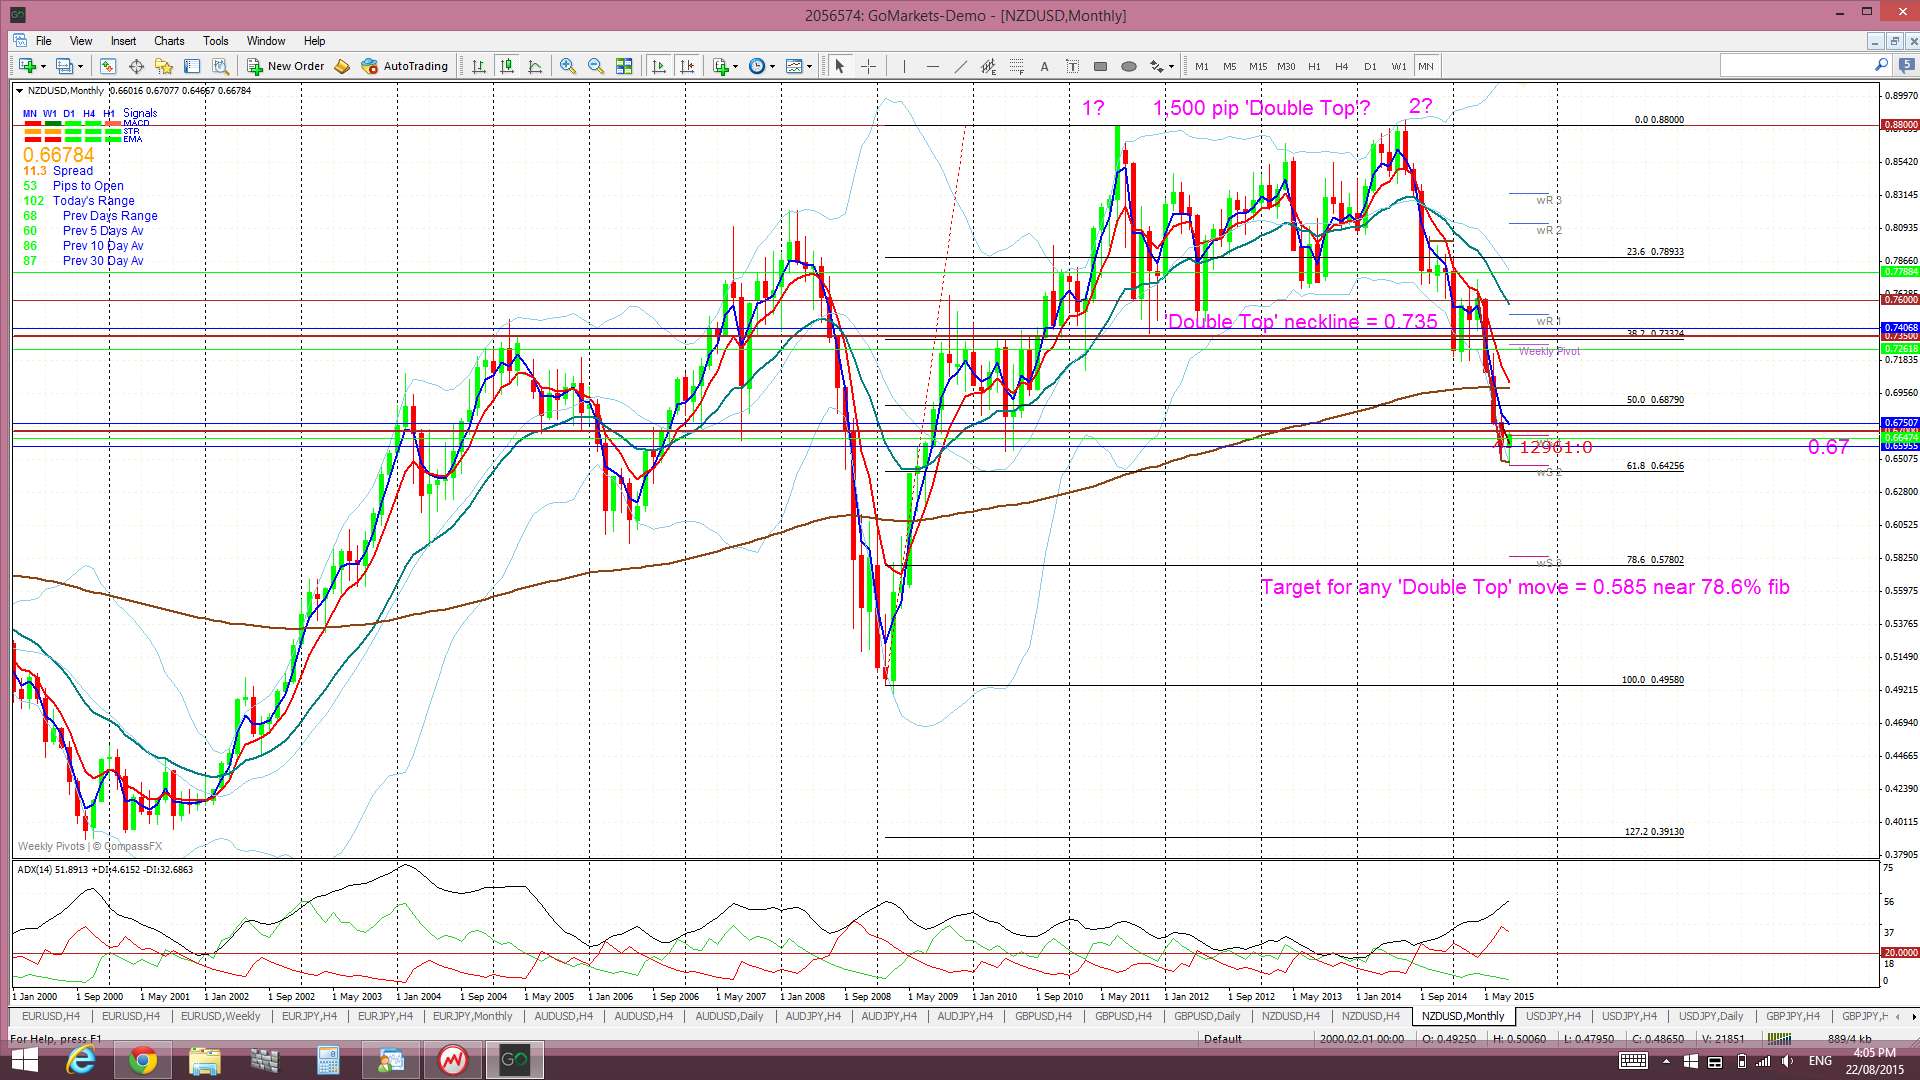
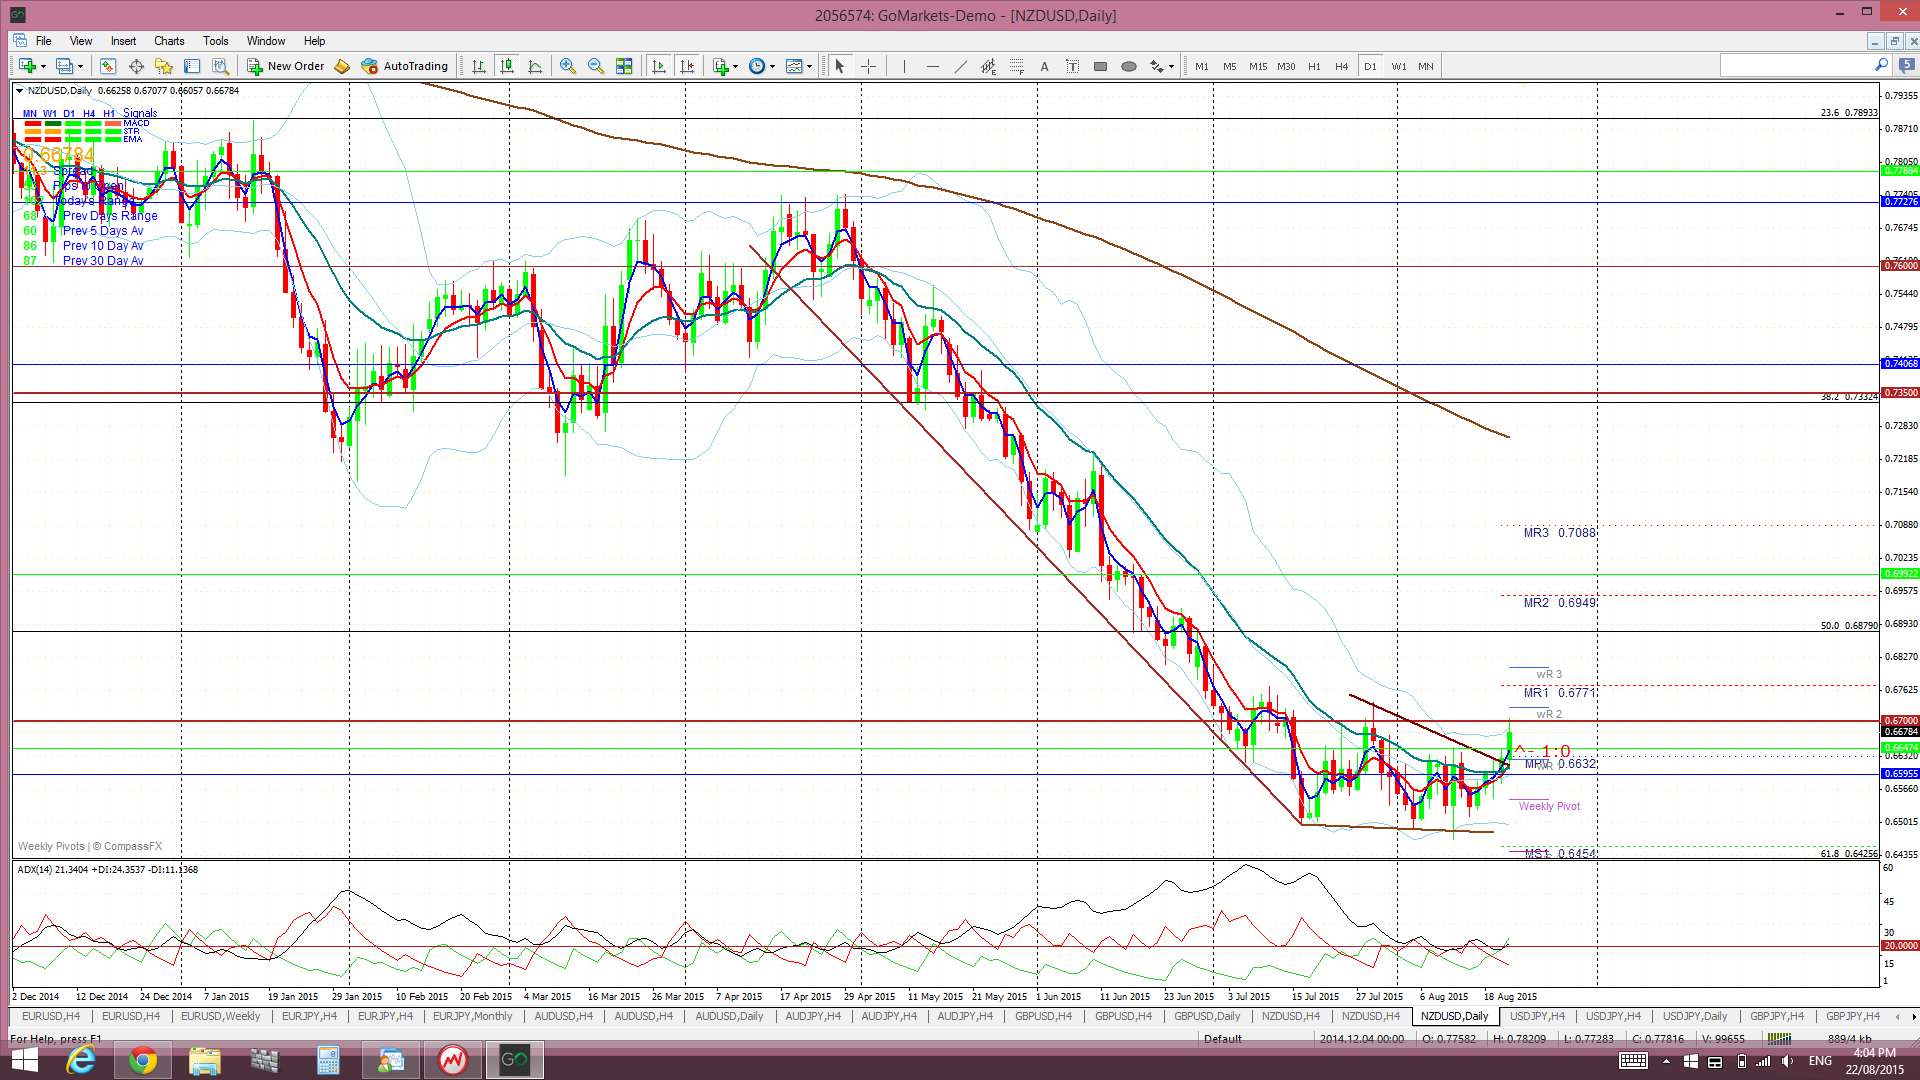
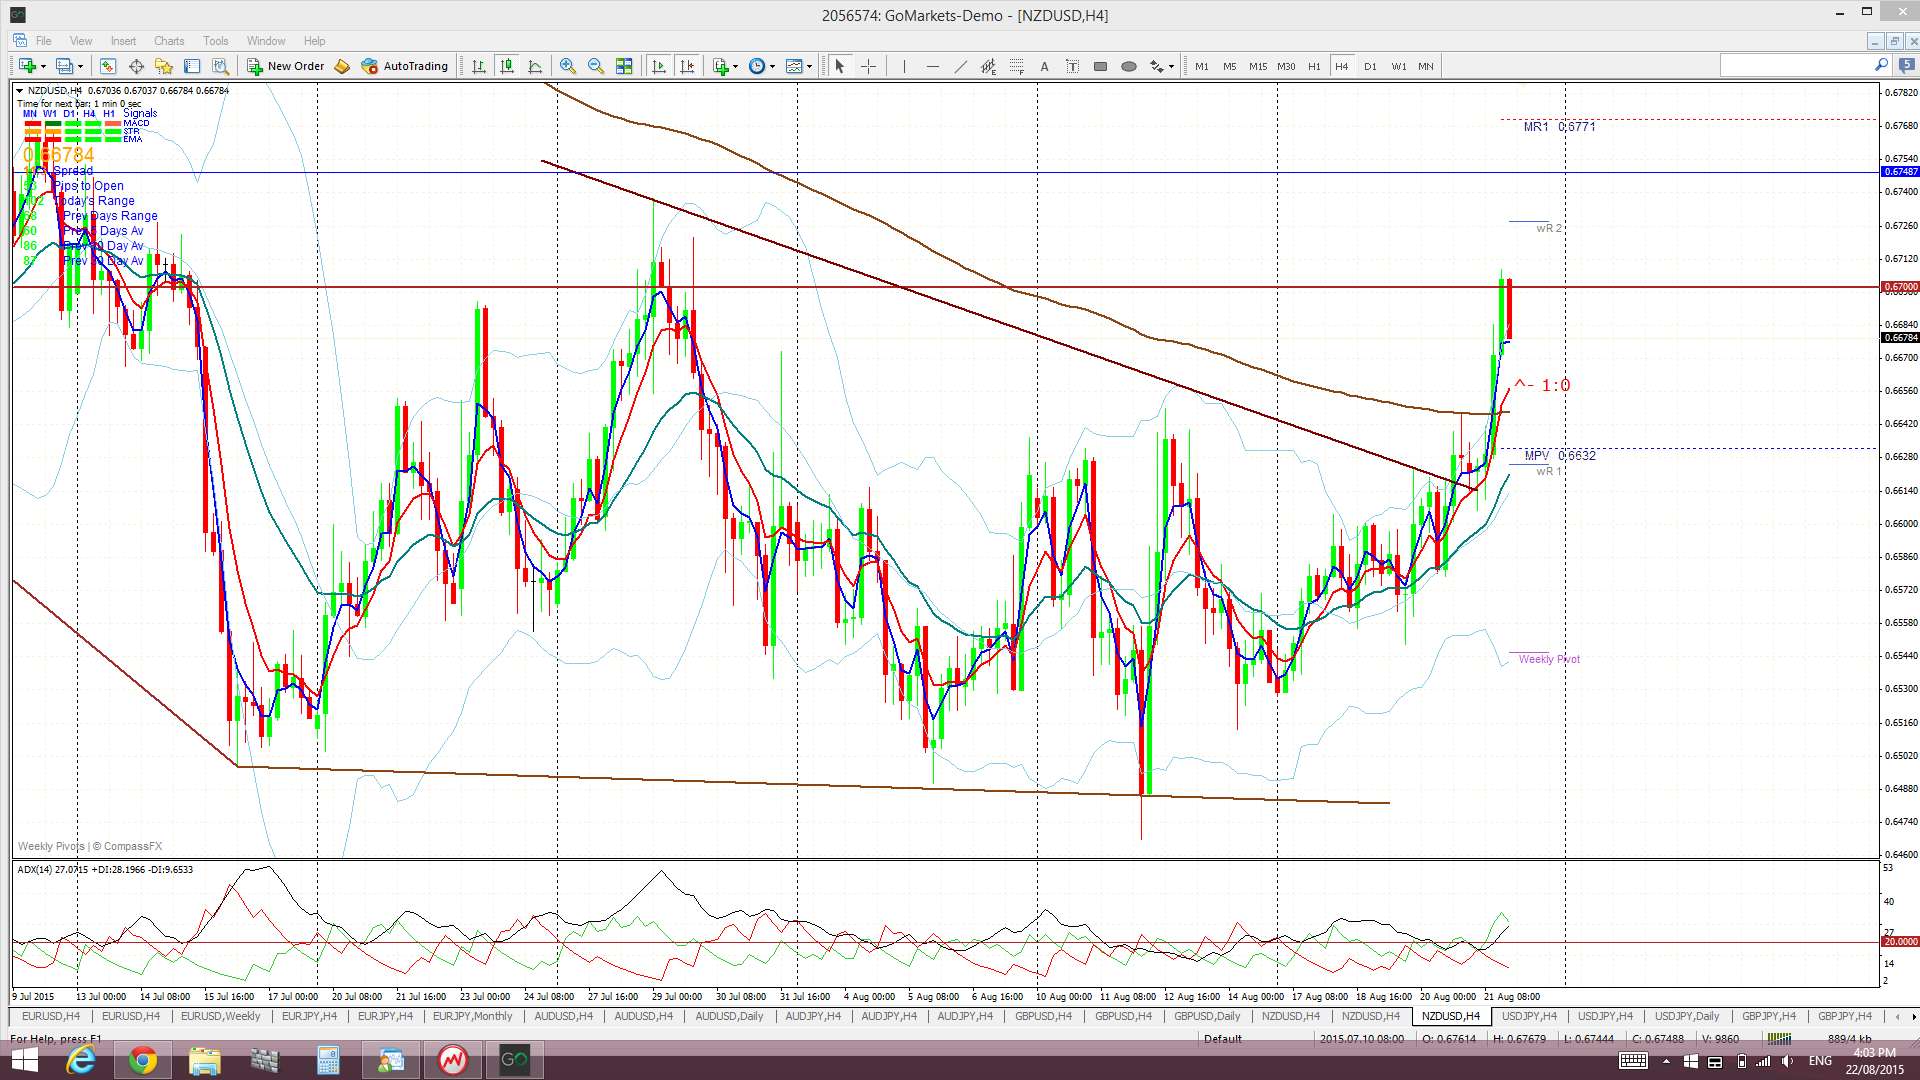
Kiwi: this has broken up above a 4hr chart recent bear trend line but stalled at the 0.67 level. Any close and hold back above 0.67 would be bullish and suggest that this could be a basing pattern. The monthly chart reveals the significance of this 0.67 level:
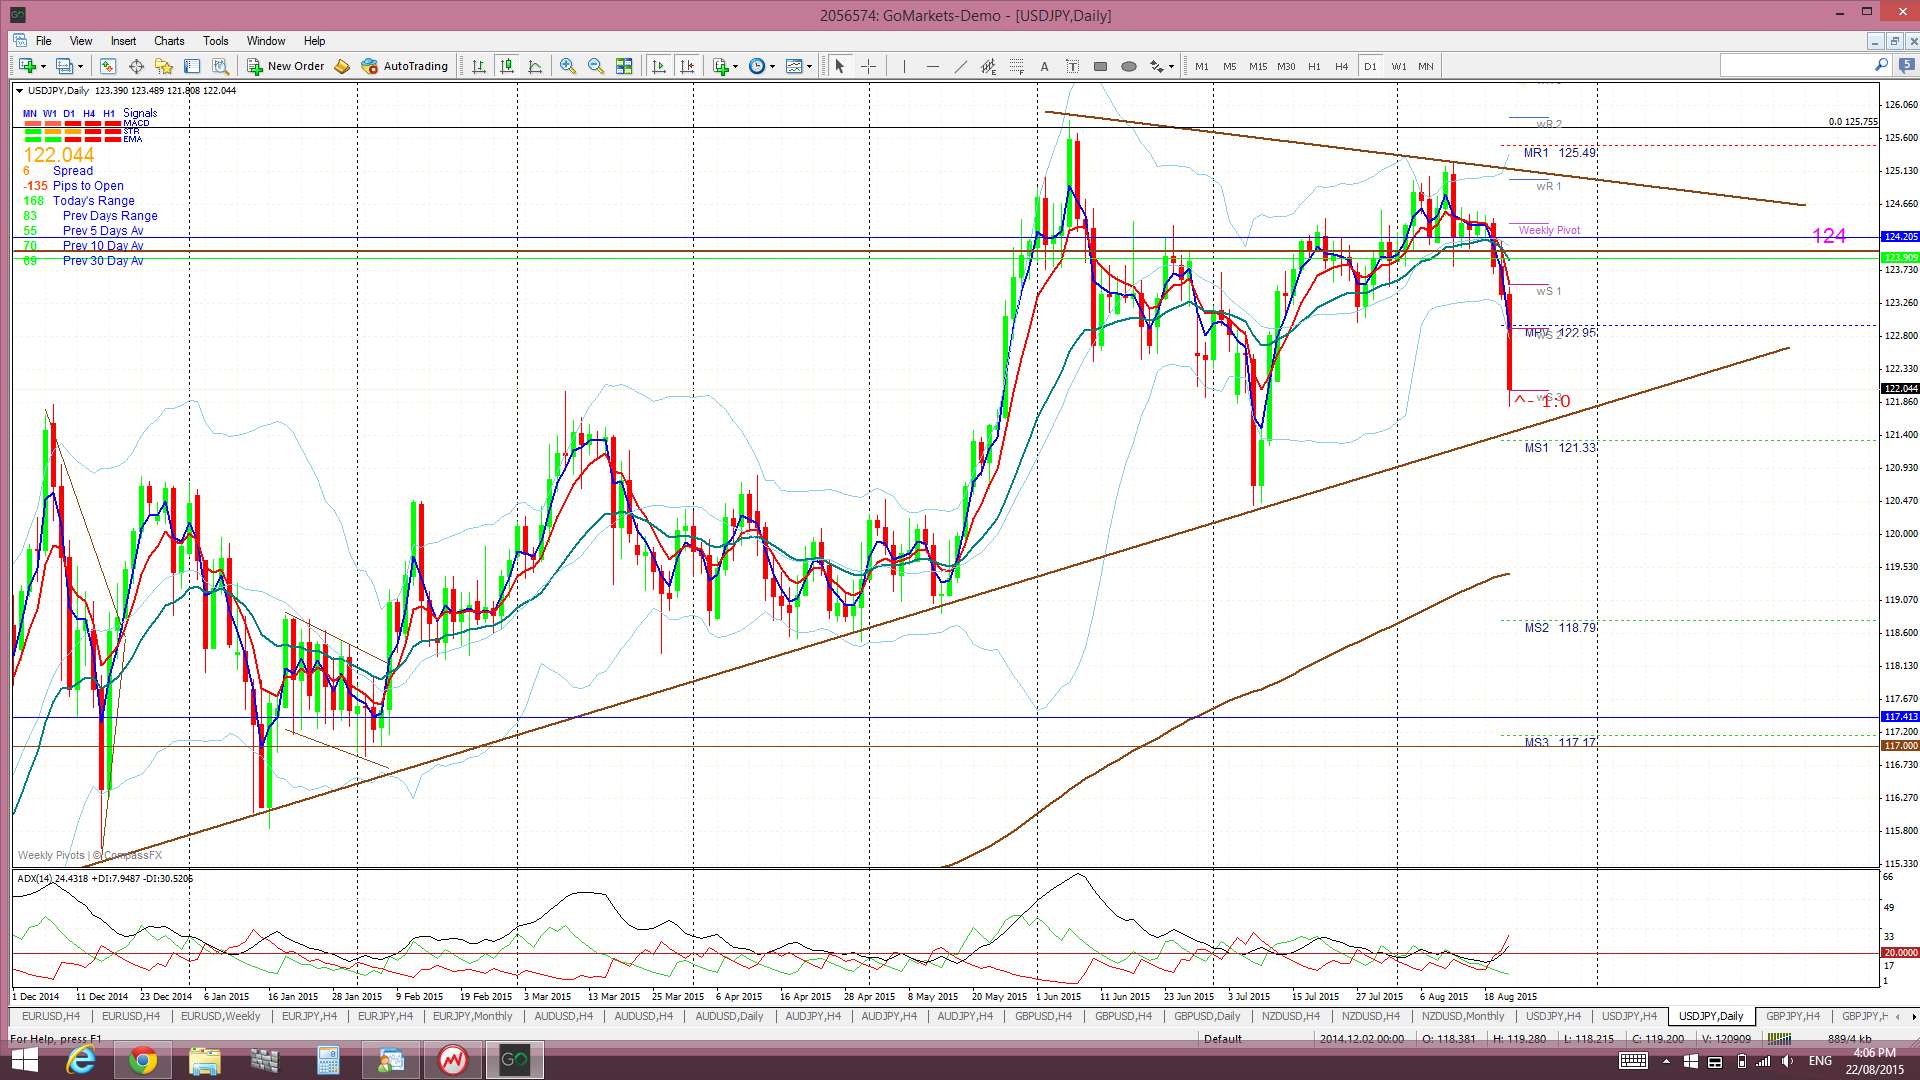
U/J daily: watch the bottom trend line here for any bearish breakdown:
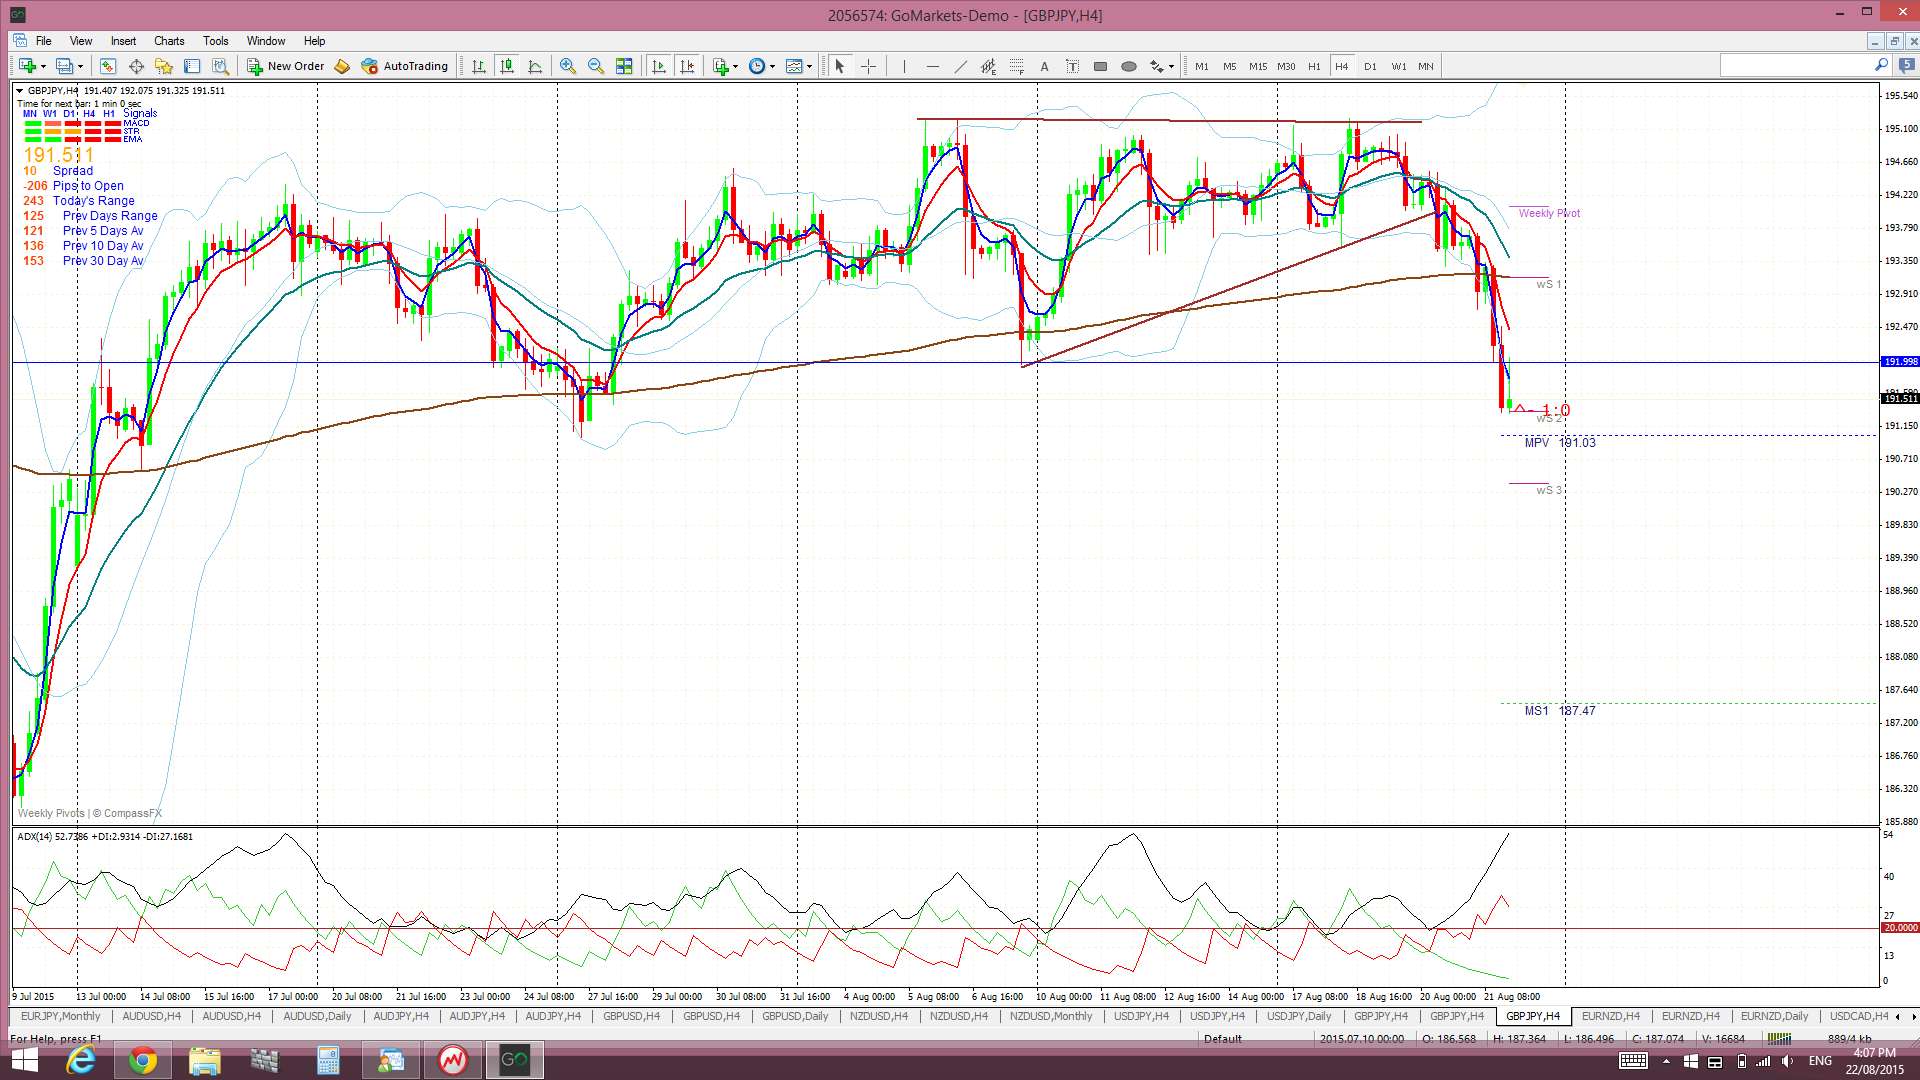
GBP/JPY 4hr: there has been a wedge breakdown here:
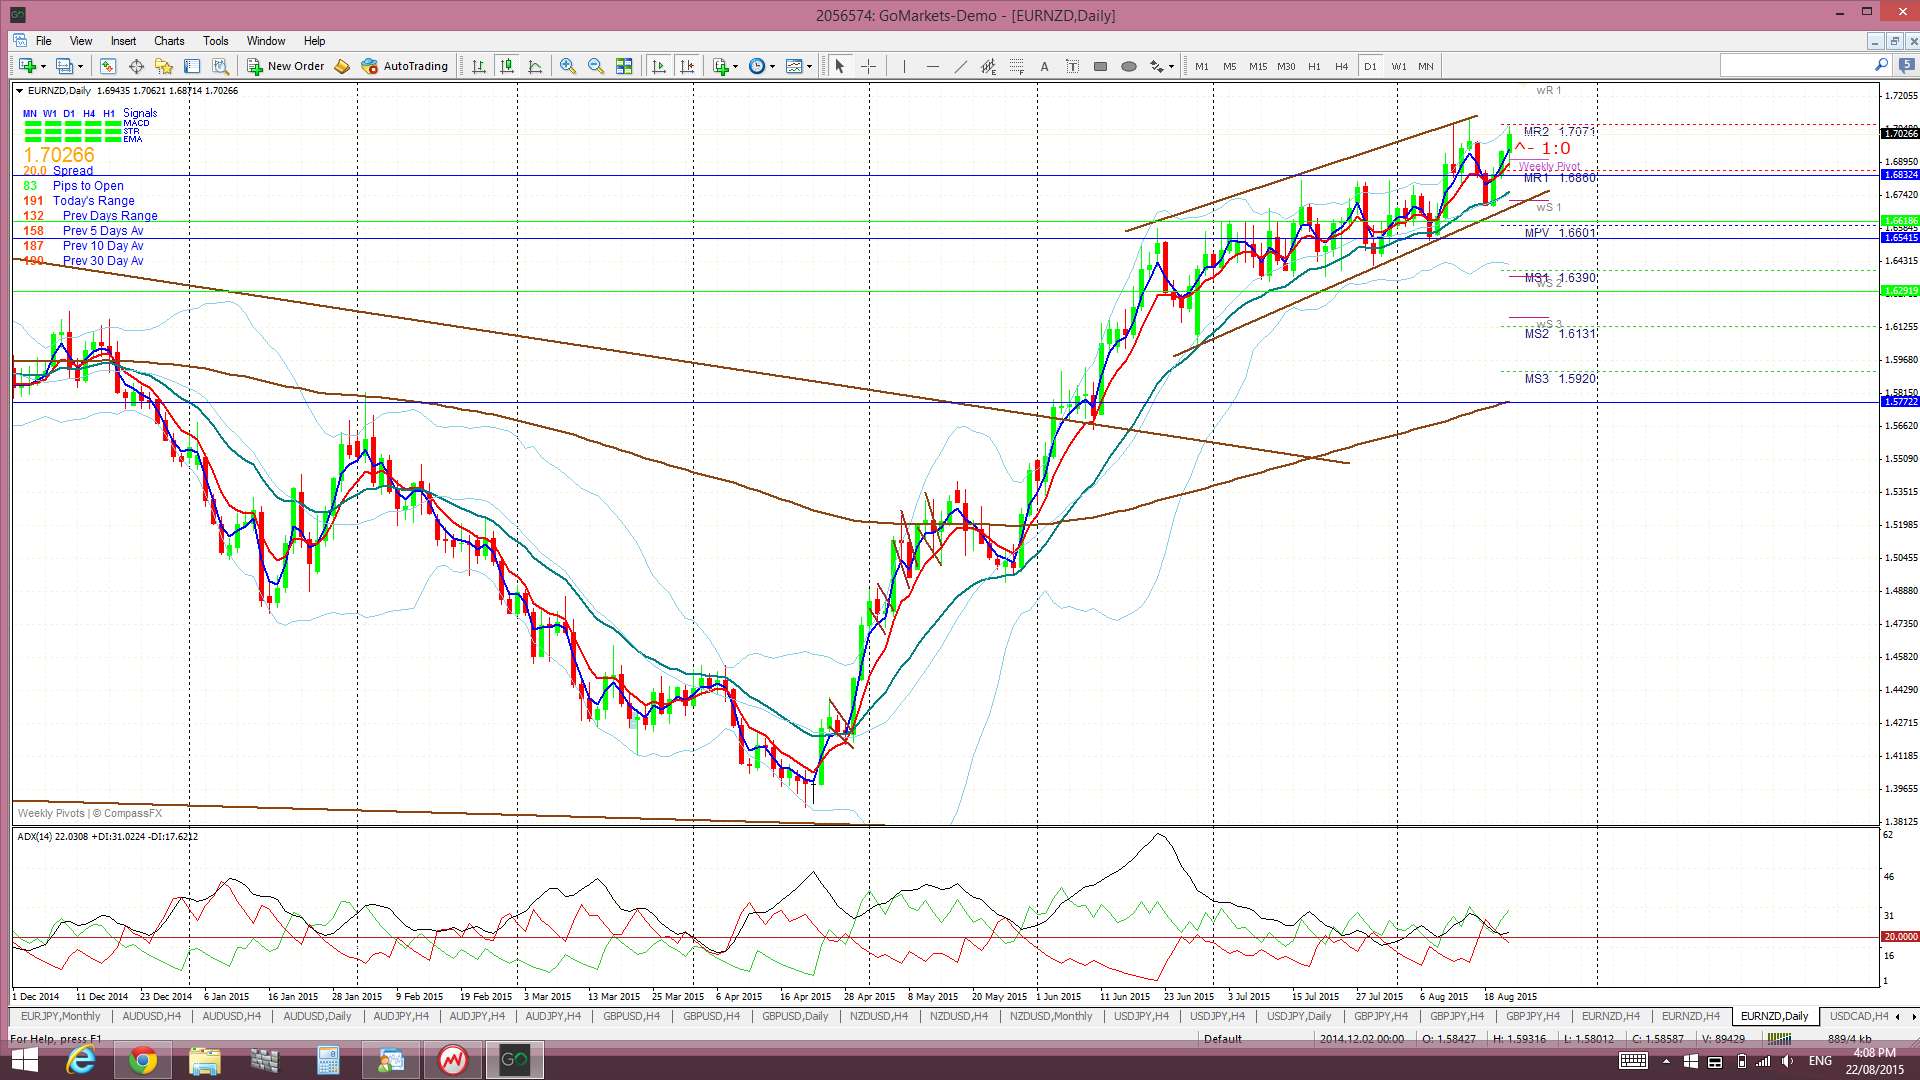
EUR/NZD daily: still ranging within an ascending channel:
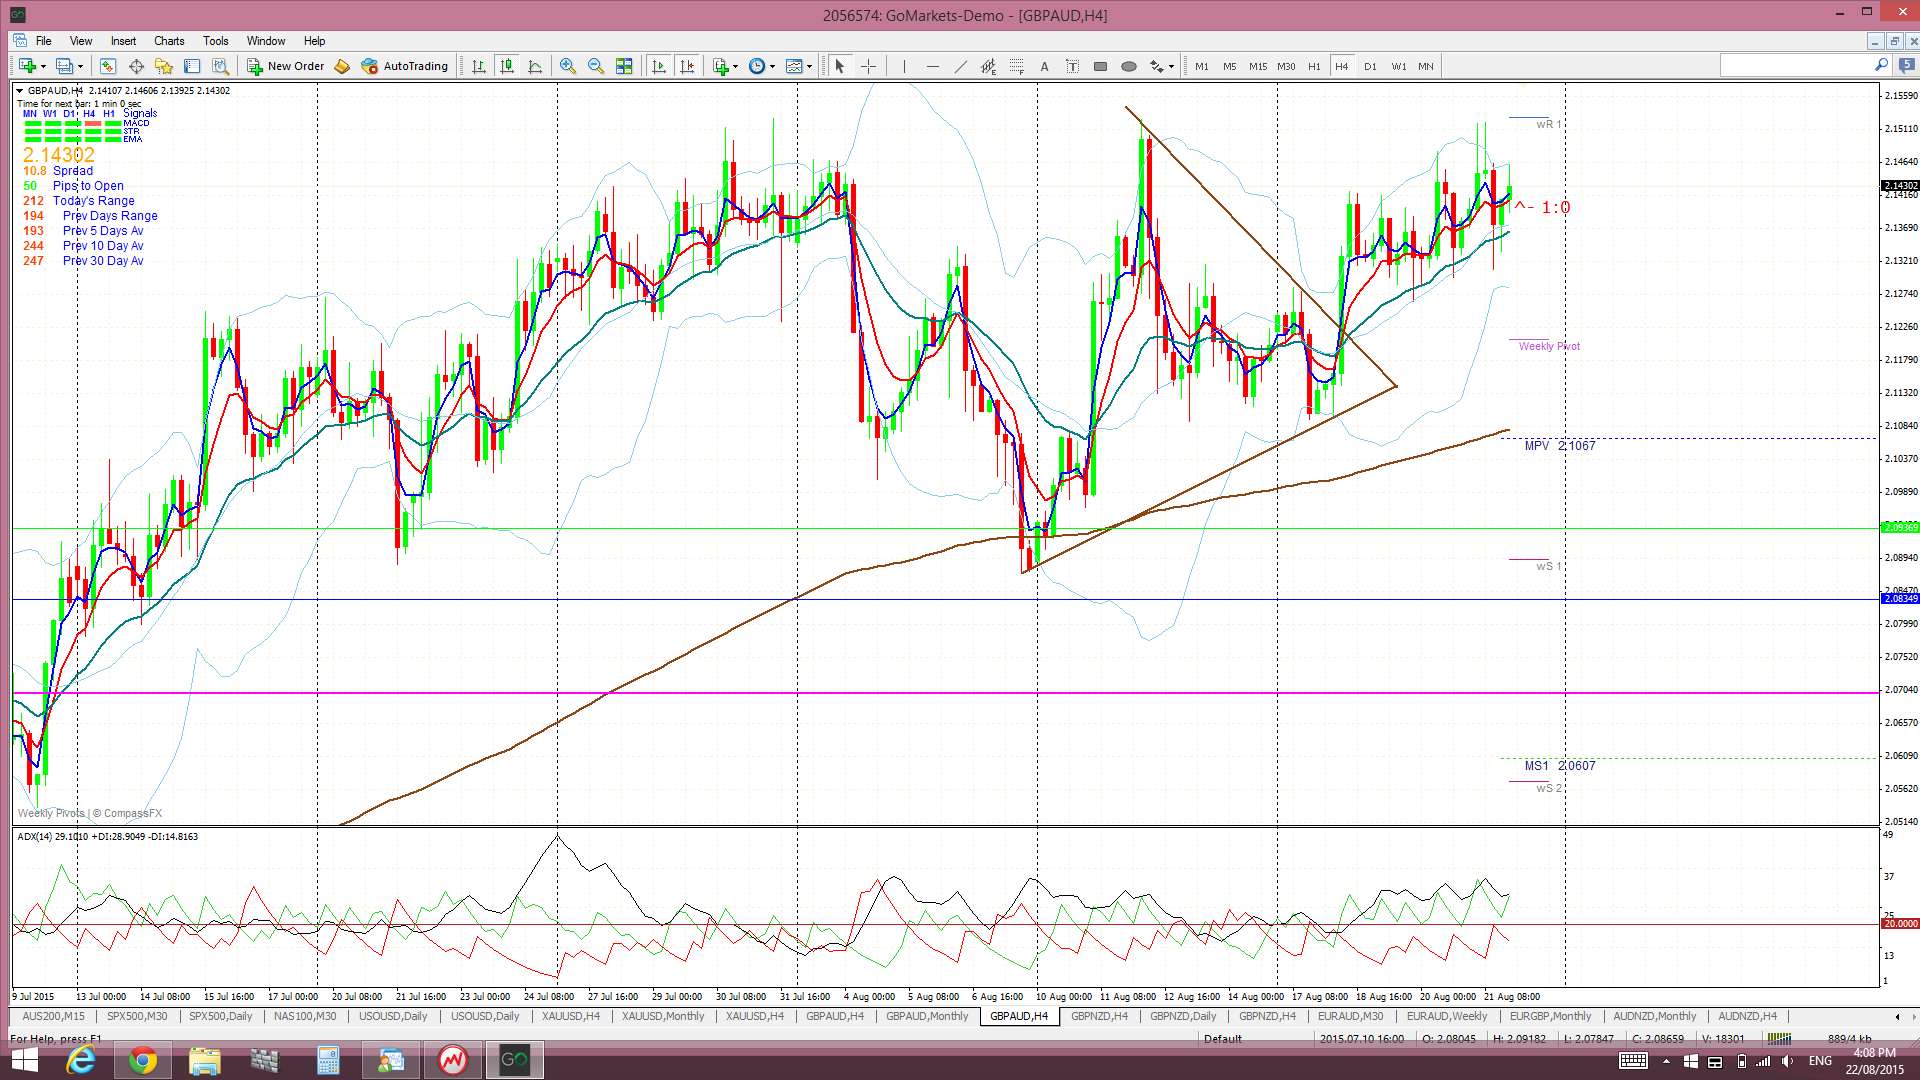
GBP/AUD 4hr: choppy as the GBP and AUD do little:
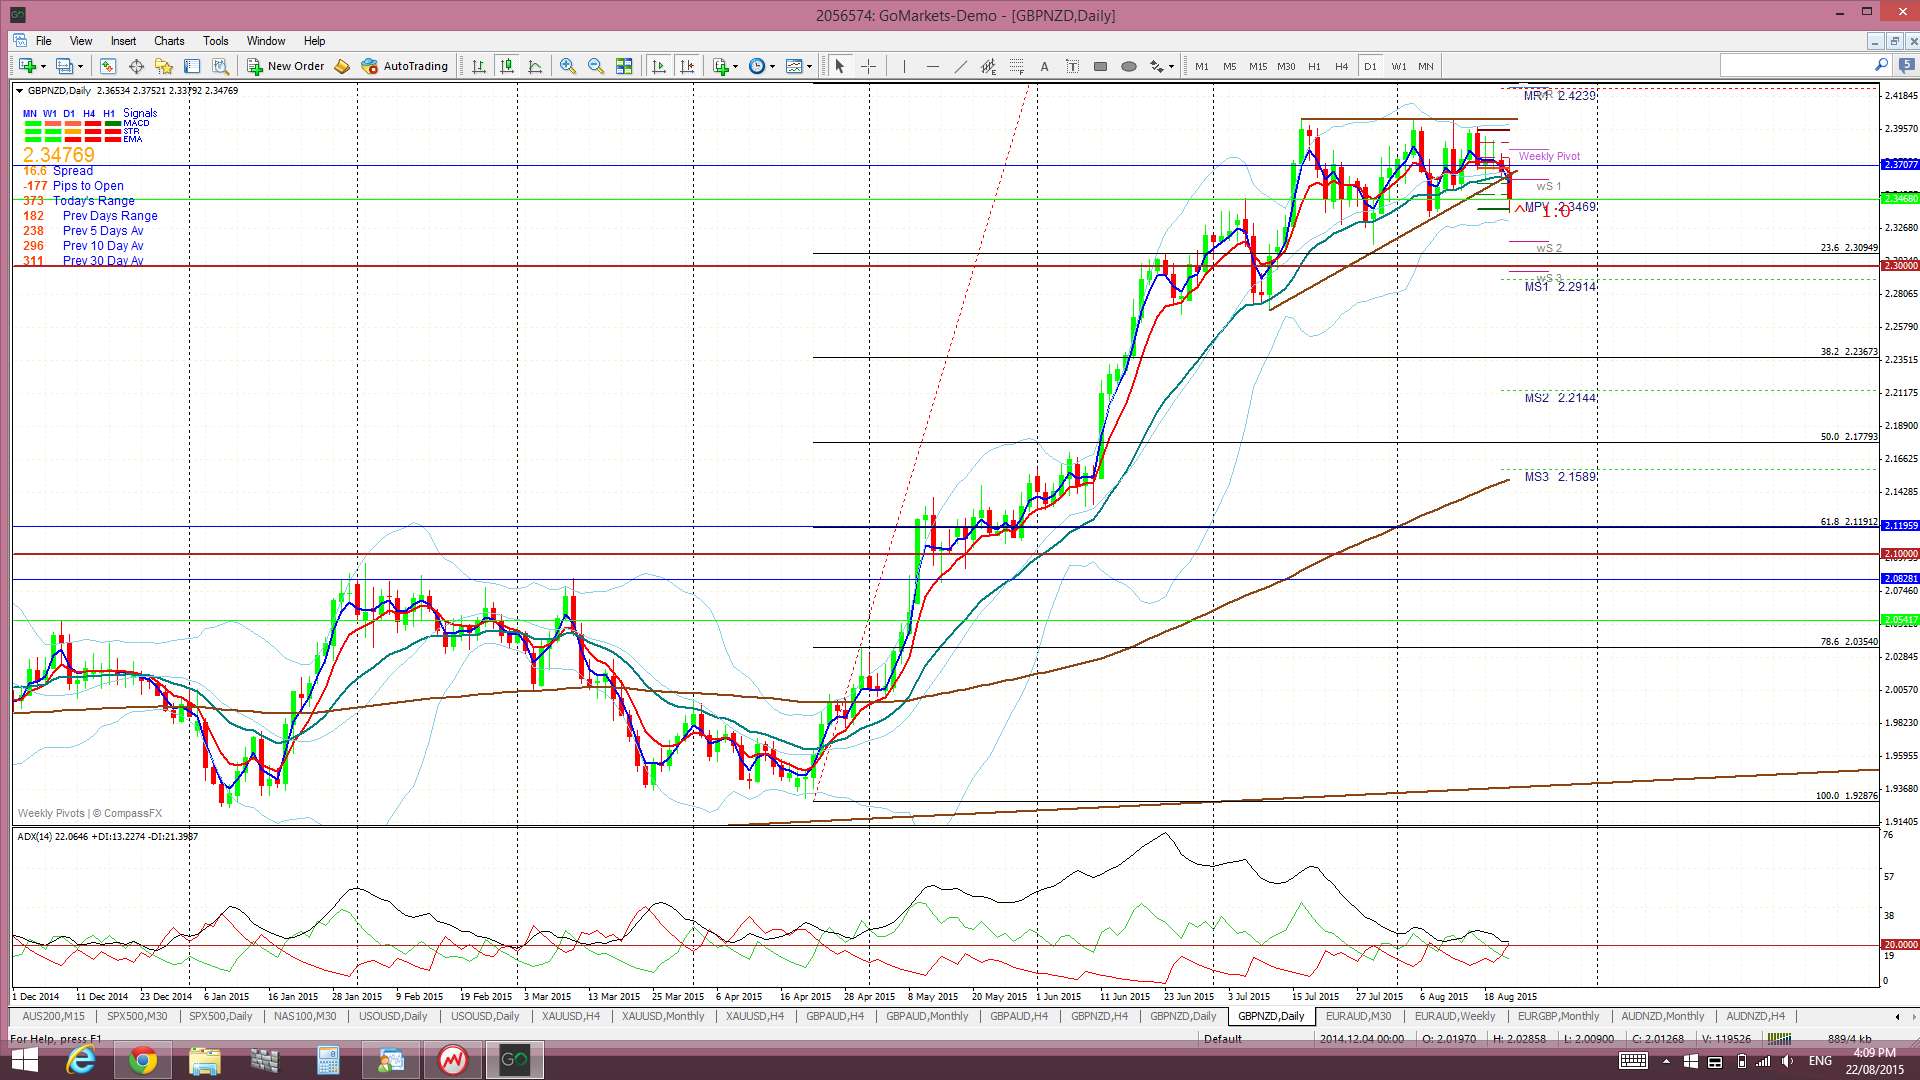
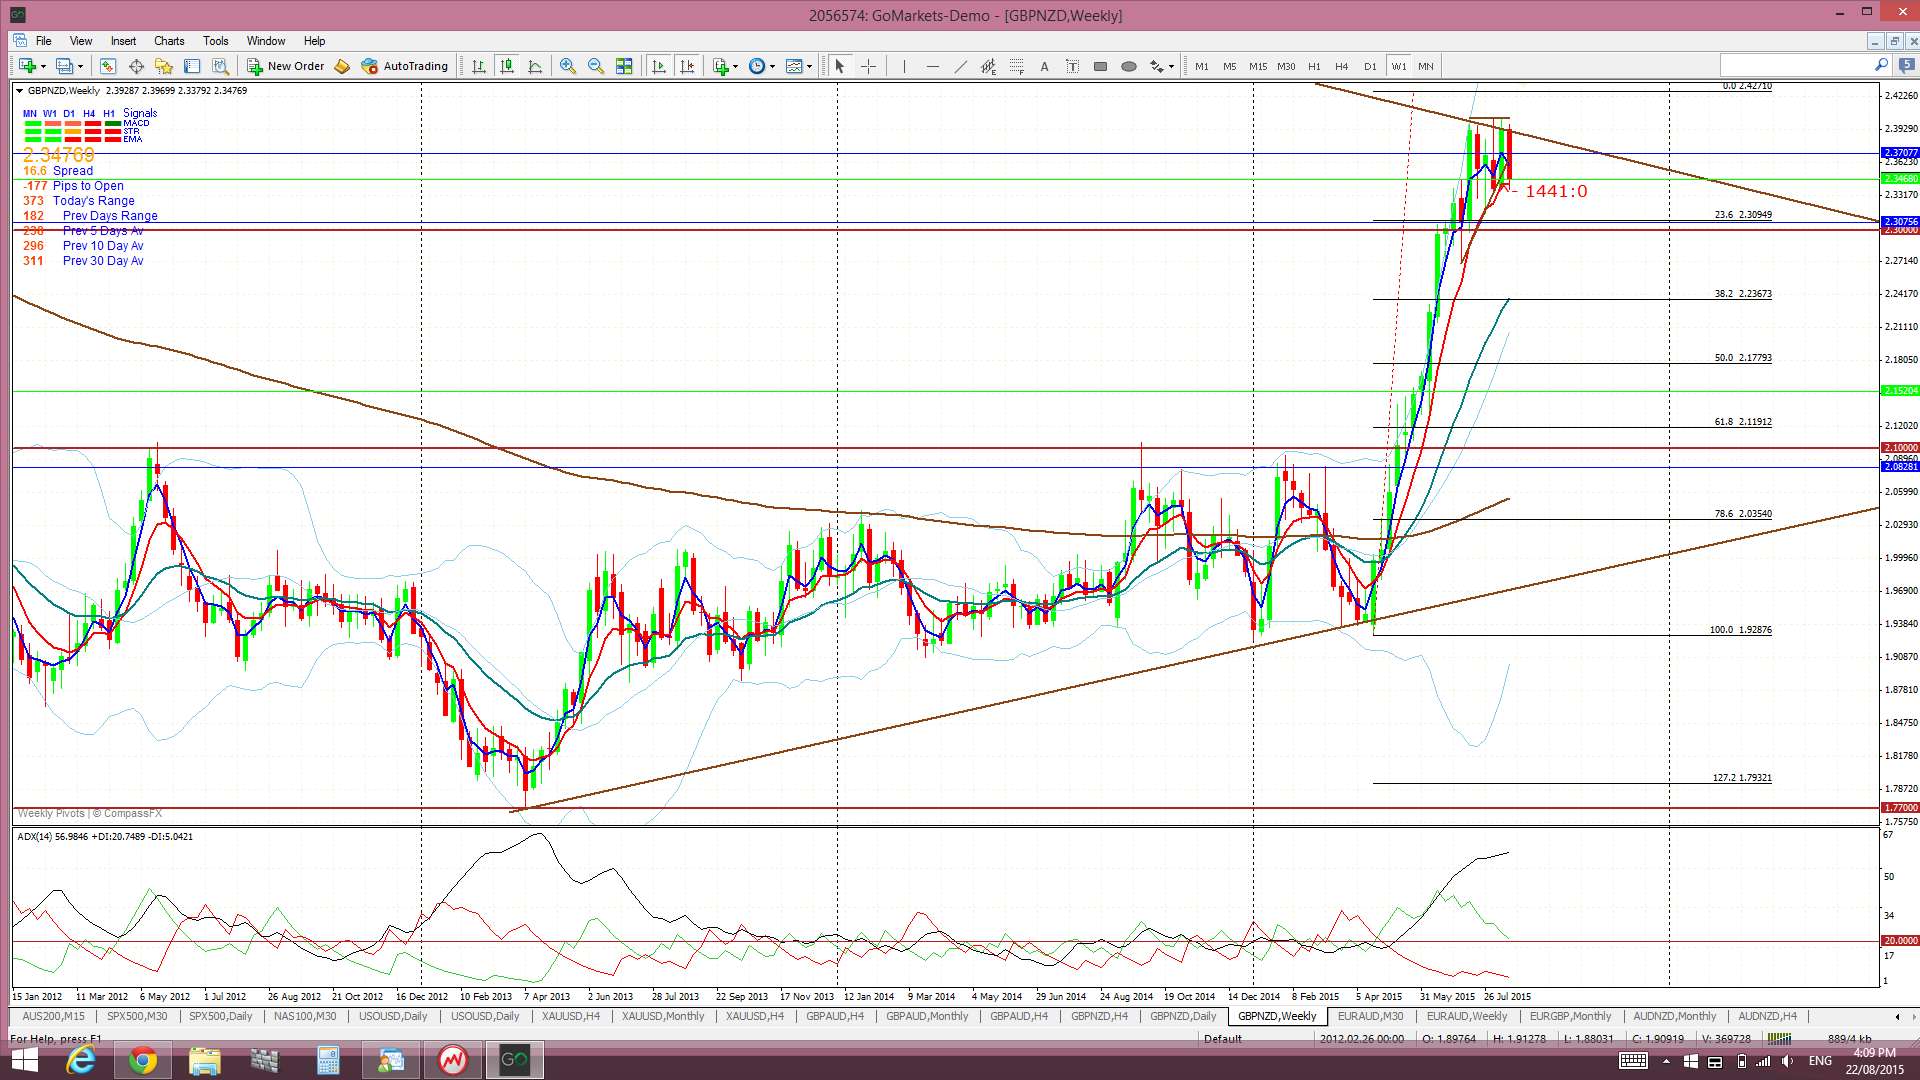
GBP/NZD: I’ve been looking for a pullback here and this may just be starting. A recent support trend line has broken and I’ll be on the lookout for any bearish follow through to possibly test the 2.10 region as this isn’t too far from the 61.8% fib level of the recent swing high move:
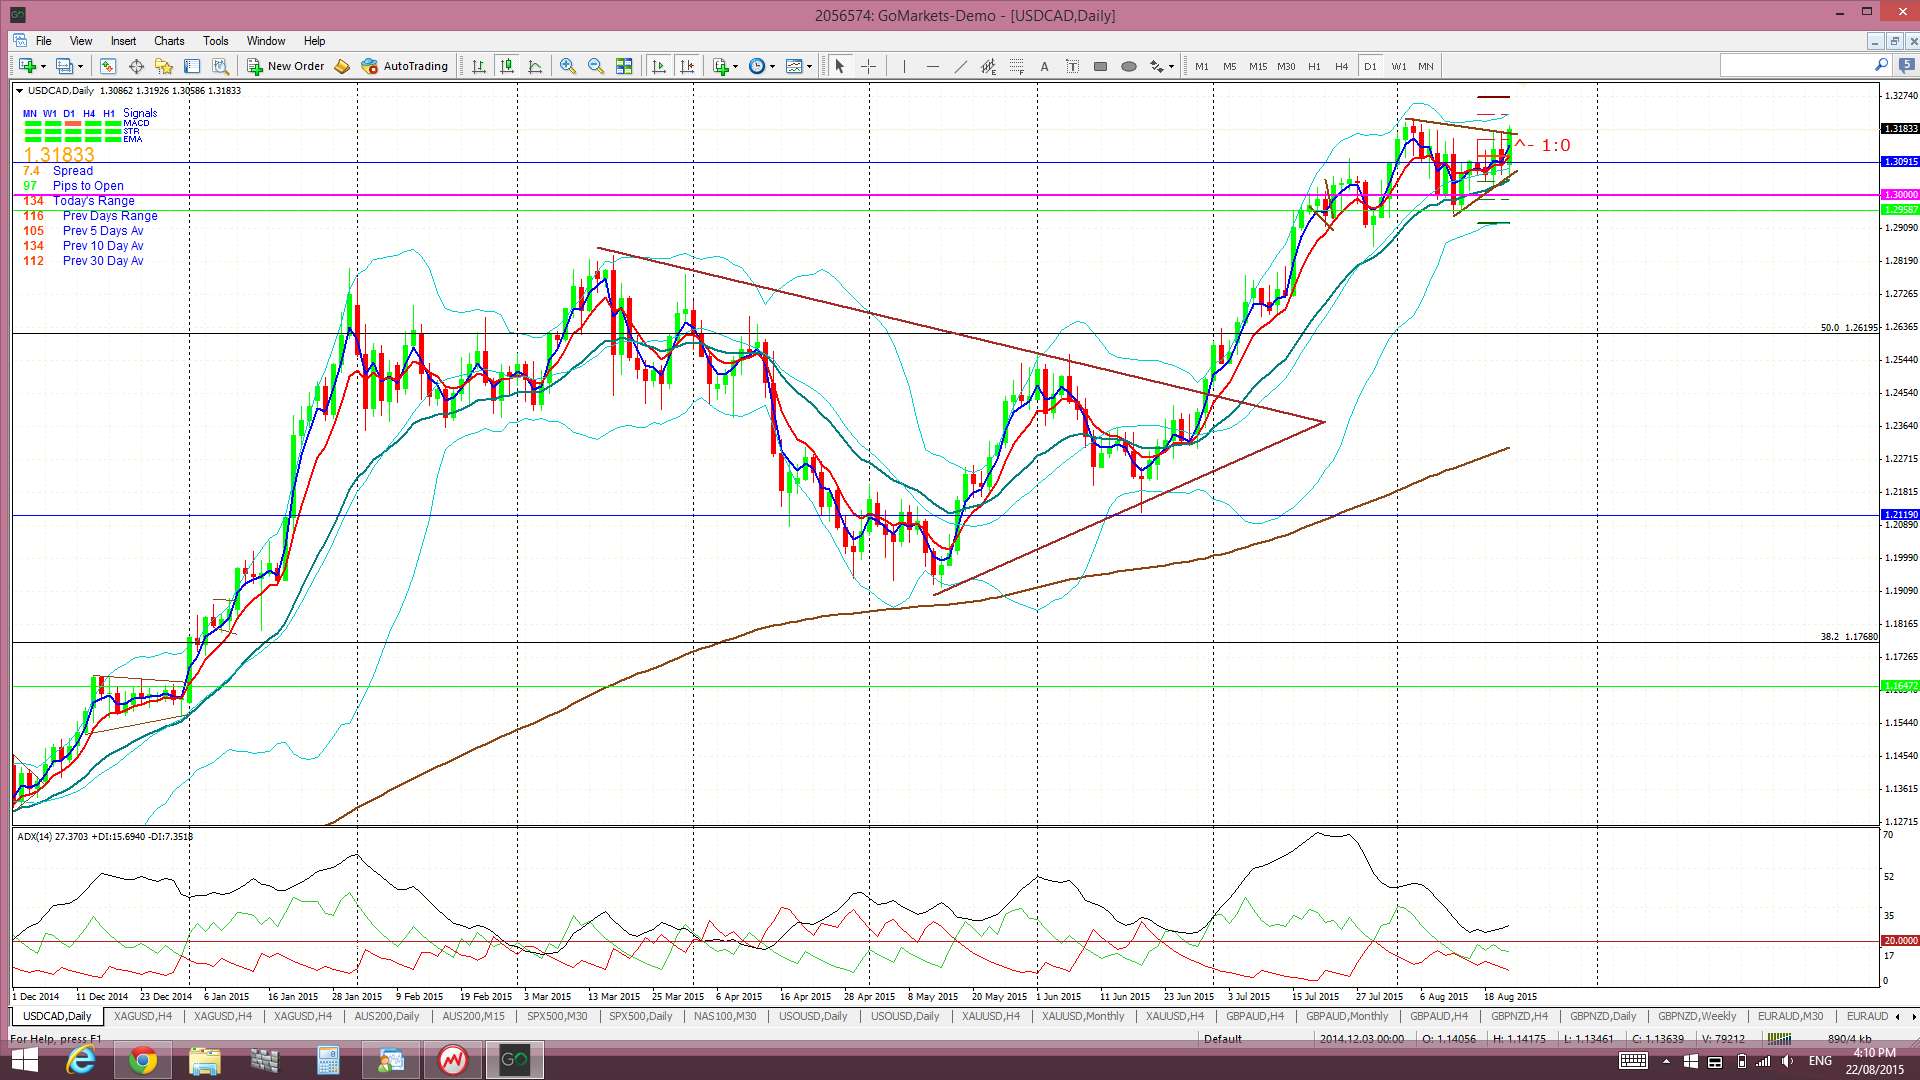
Loonie daily: watch for any Flag breakout and continuation here:
The post US$ weakness…. it isn’t alone! appeared first on www.forextell.com.