The US$ remains under pressure and below 92.50 resistance despite a hawkish Fed and up-beat US data which begs the question ‘What is it going to take to push the US$ higher?’. There is a bit of high impact data next week, starting on Sunday, so watch to see if any of these items get the index moving. There is also the ongoing North Korea tension to navigate as well.

NB: I head overseas to the US next Friday for a one month holiday so charting updates will be few during this period.
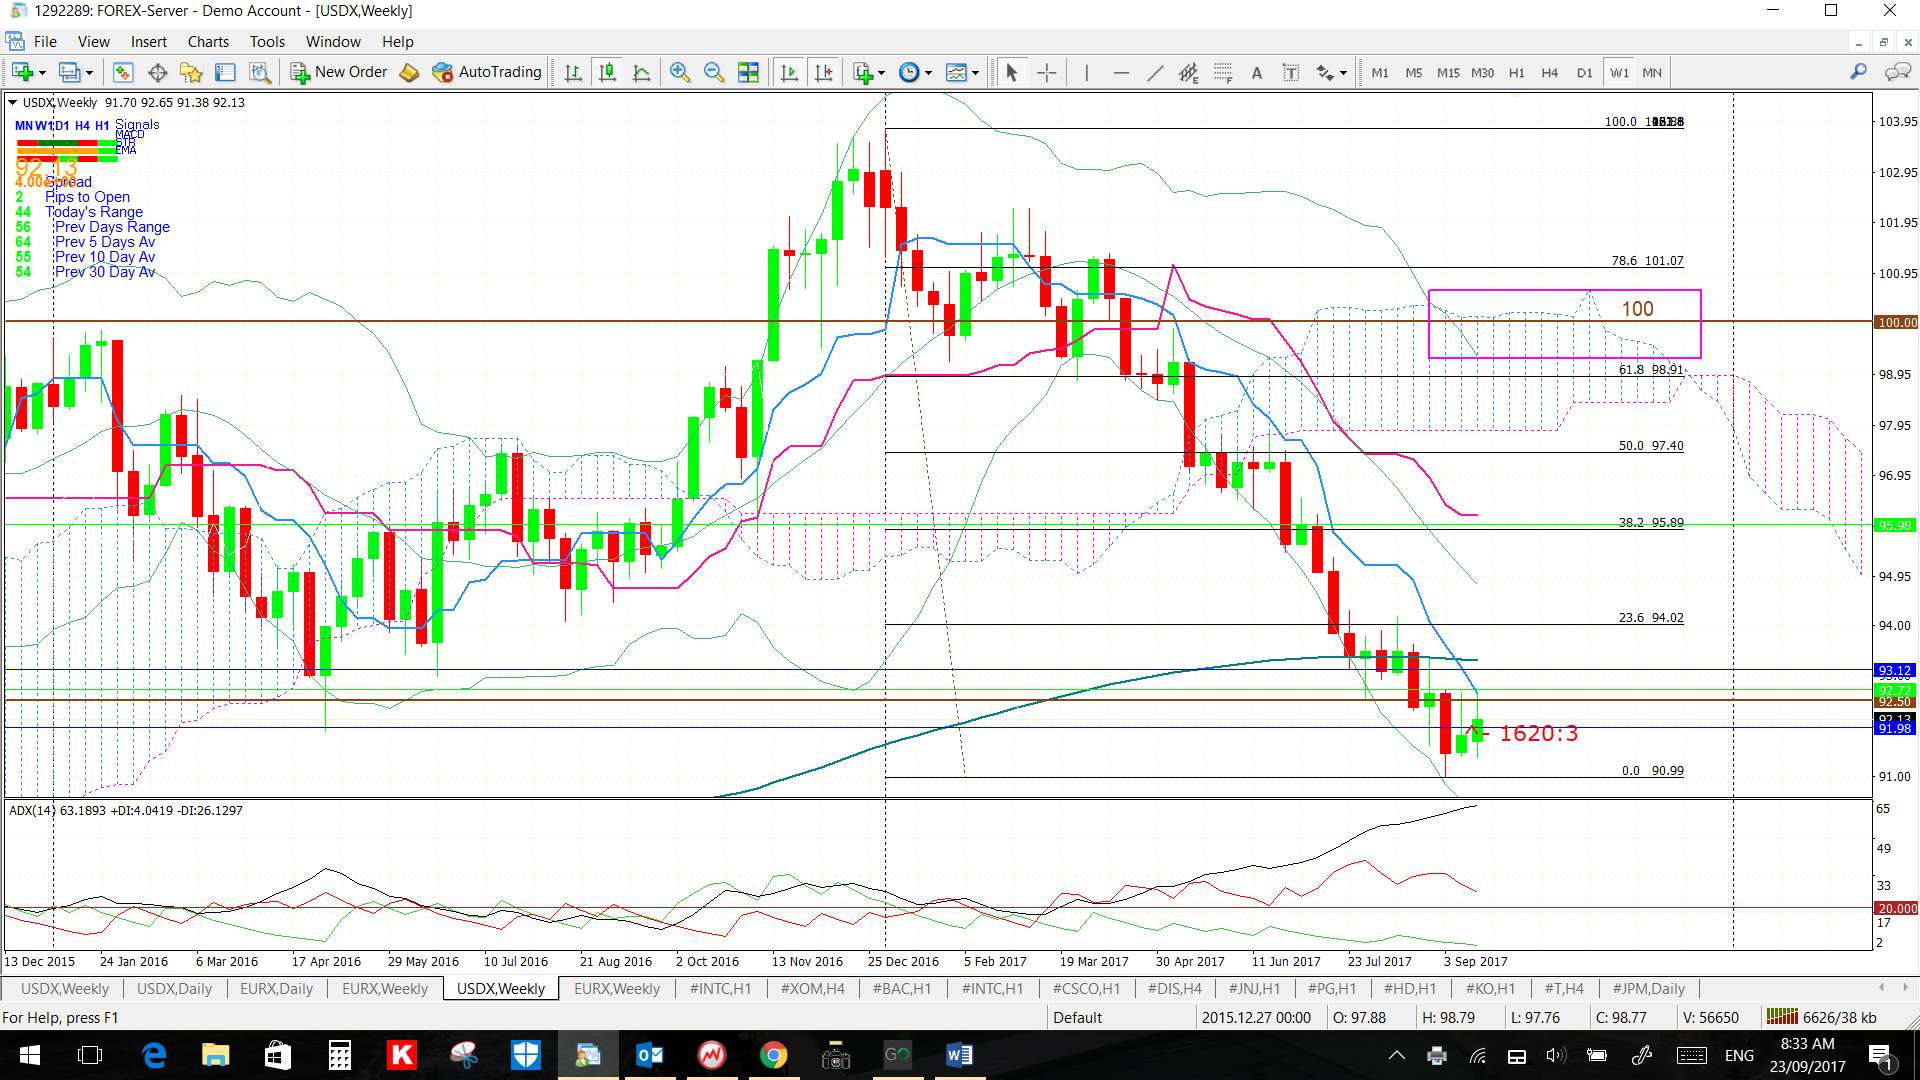
USDX: the index printed a bullish coloured ‘Spinning Top’ candle and, whilst bullish, this is somewhat of an indecision-style candle. The hold below 92.50 isn’t too convincing of anything just yet either.
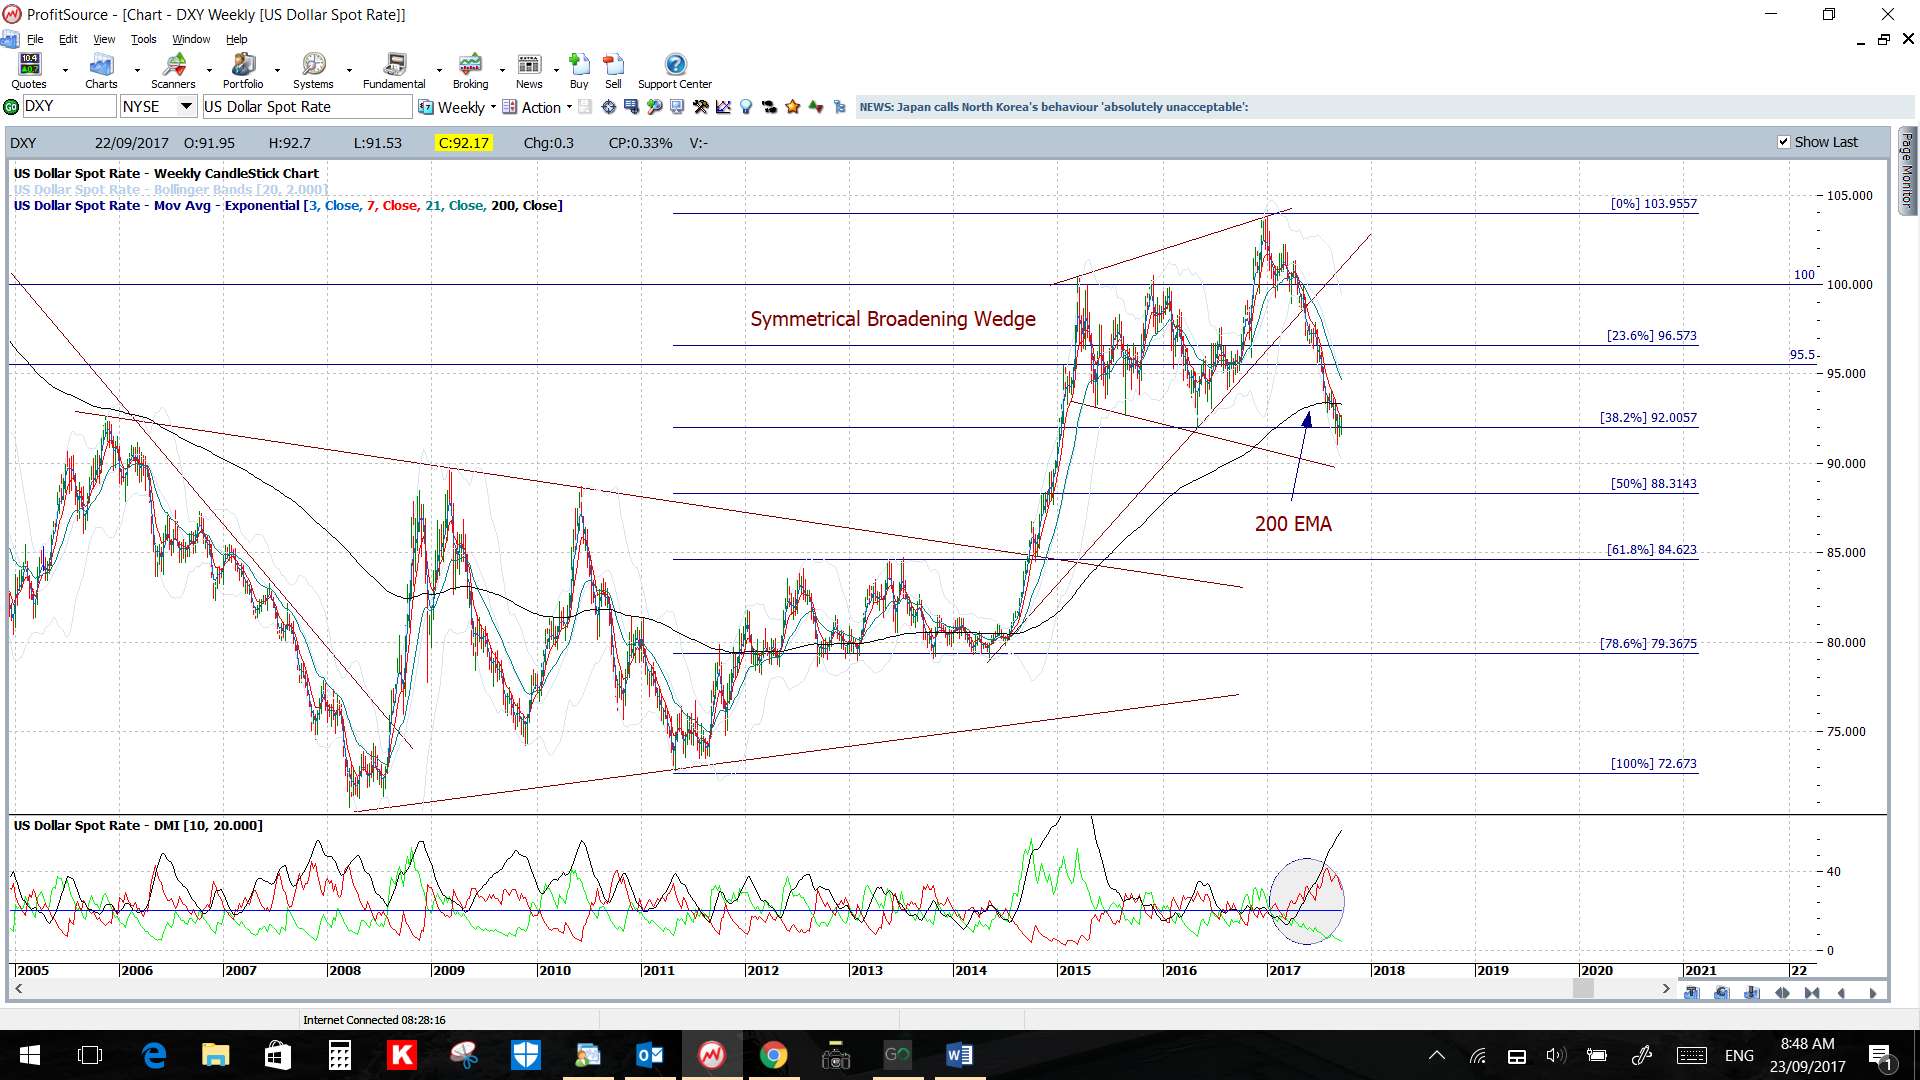
Recall: the US$ longer-term uptrend remains intact until such time as it breaks and holds below the 61.8% fib of the 2014-2016 weekly swing high and this level is down near 84.50.
Also, keep note of the fact that the Fibonacci retracement on the weekly swing low move, since the start of 2017, still has the 61.8% fib level up near the previous S/R level of 100. I will be watching this 100 level if there is any recovery move.
Keep watch of the following levels in coming sessions:
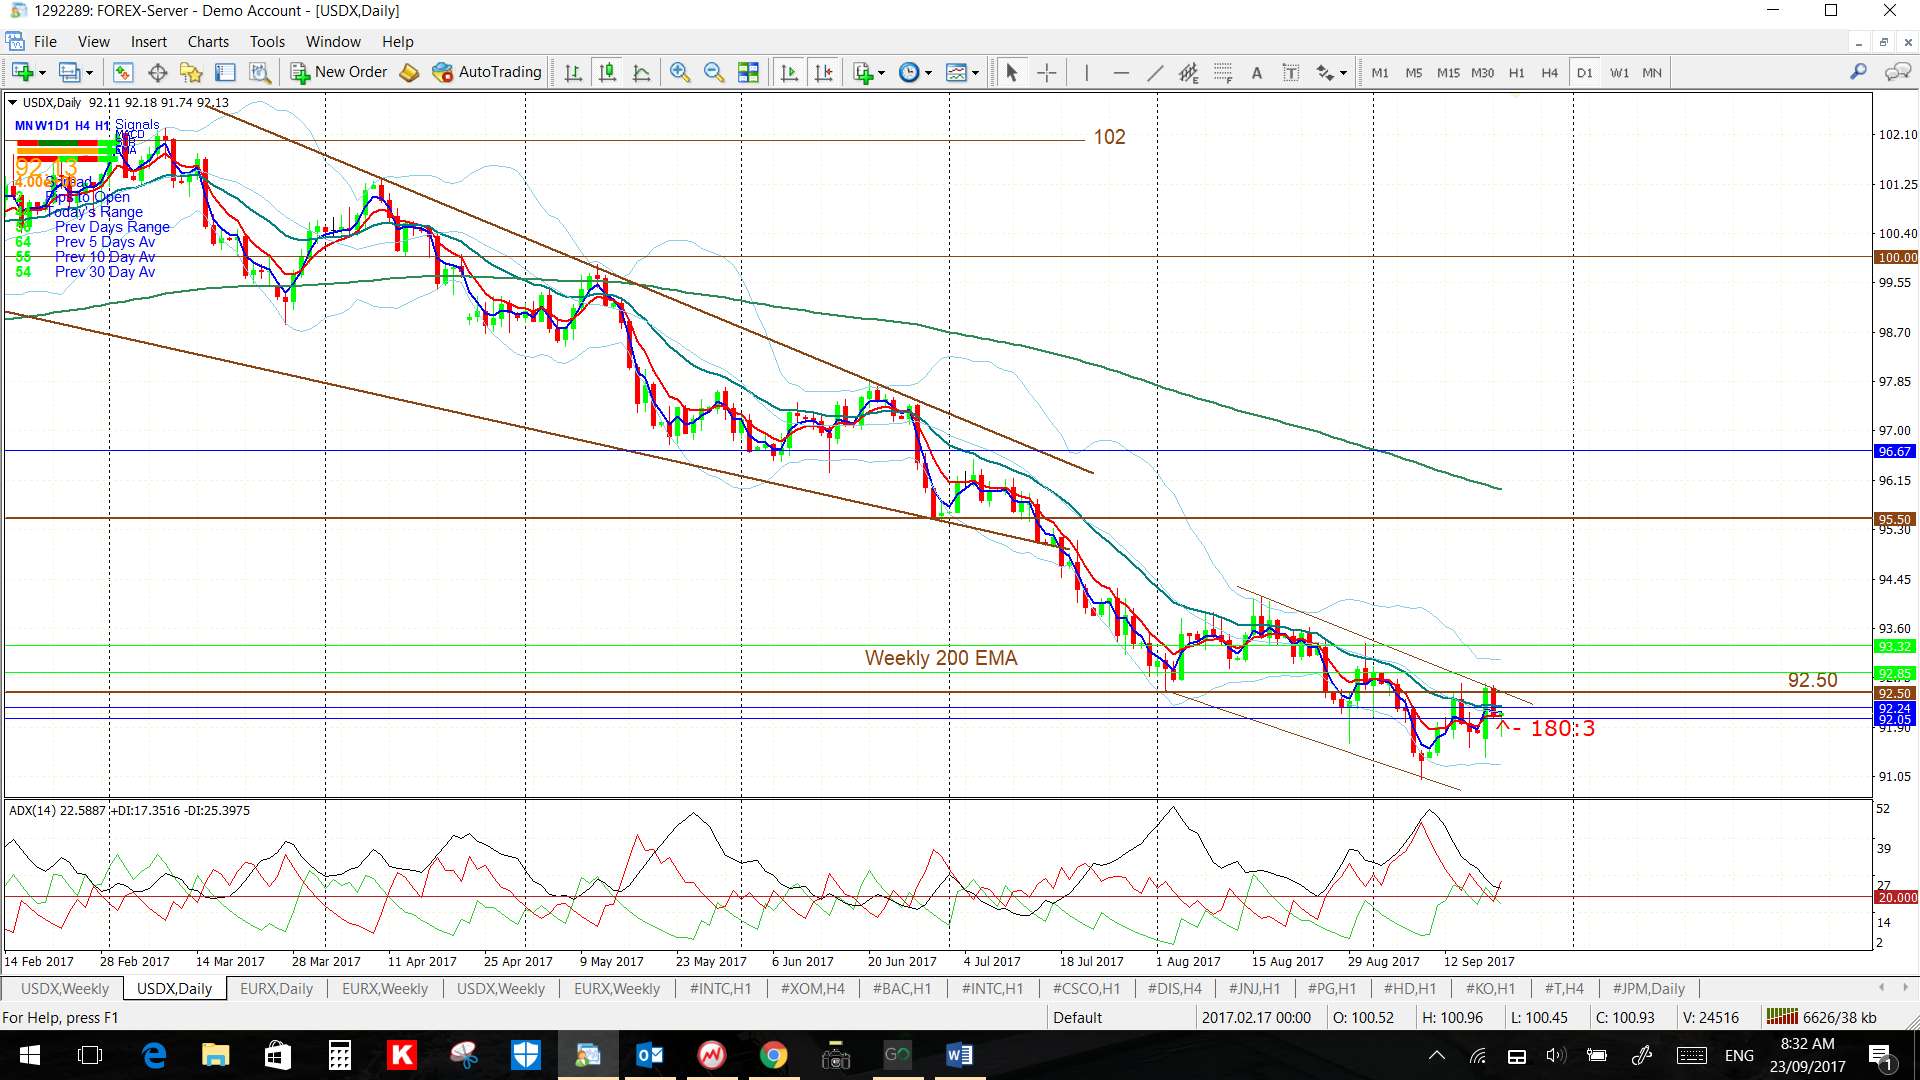
- the weekly 200 EMA.
- the S/R level of 92.50.
- the daily chart’s Flag trend lines.
- the bottom trend line of the weekly chart’s symmetrical wedge pattern.
- the longer-term weekly swing high 50% Fibonacci level; down near 88.
- the longer-term weekly swing high 61.8% Fibonacci level; down near 84.50.
- the recent weekly swing low 61.8% Fibonacci level, up near 100; if there is any recovery move.
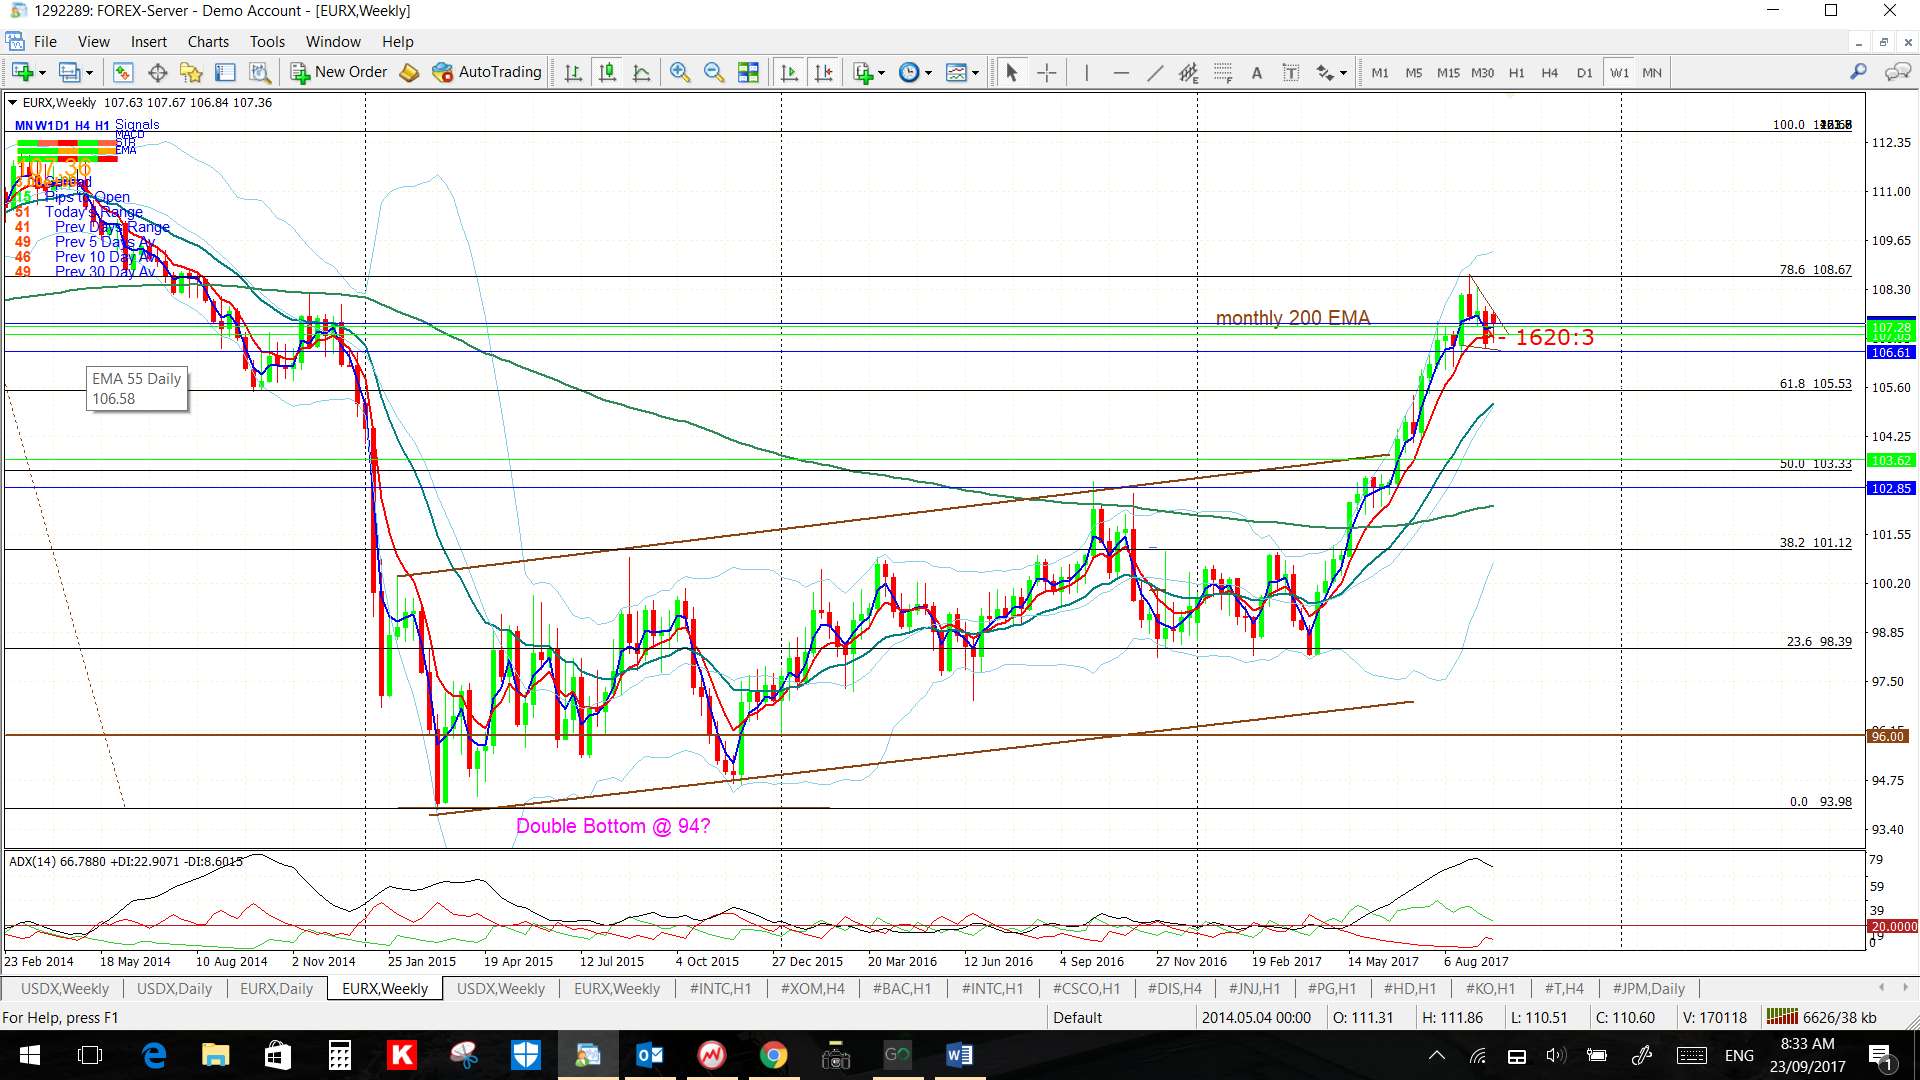
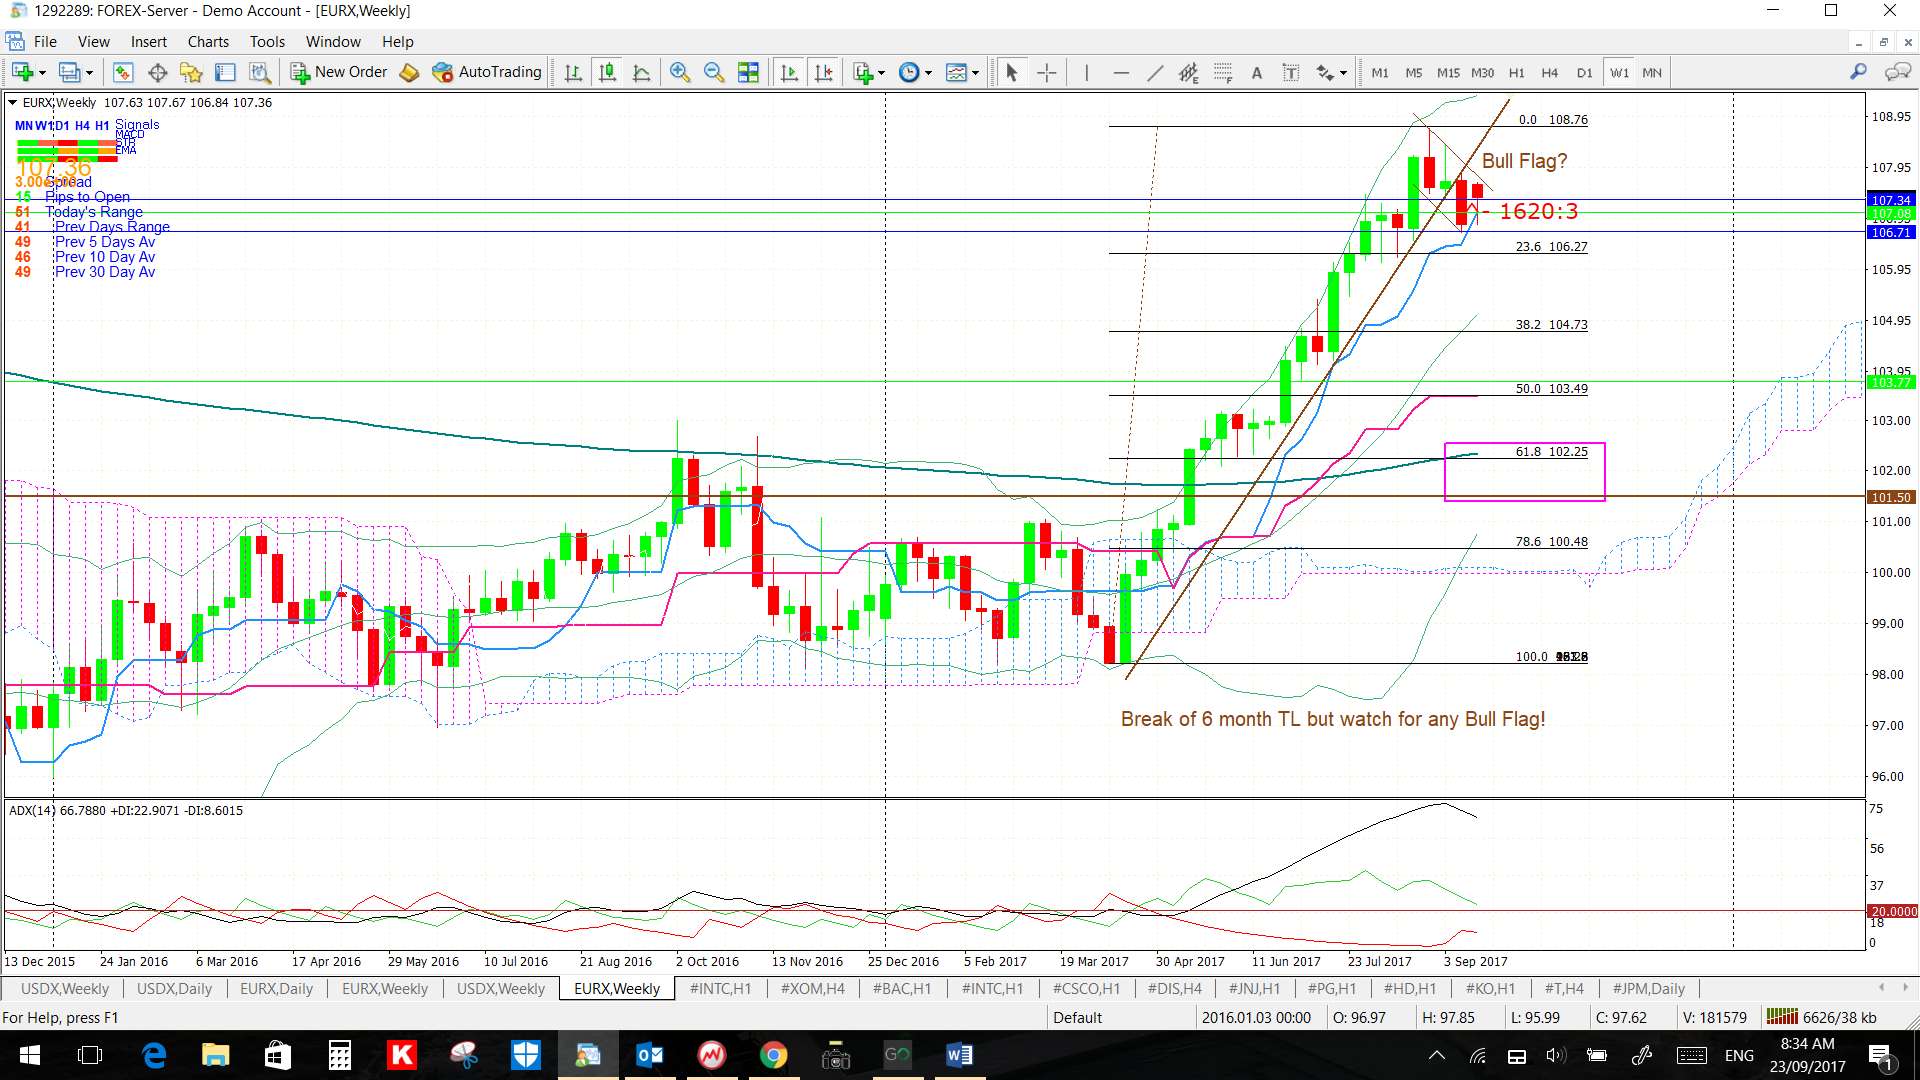
EURX weekly: The EURX printed a bearish coloured ‘Inside’ candle but this, too, is an indecision-style weekly candle. There is still the appearance of a Bull Flag consolidation pattern for now though so watch the Flag trend lines here for any new breakout. Also keep in mind that this is just the 6th bearish weekly candle out of the last 23 weeks.
Recall: This index has been in a long uptrend and a pause or pullback would not be out of order here, even if there is to be a longer-term recovery move. I note the 61.8% fib of this recent swing high move is back down near previous S/R around 101.5 and also near the weekly 200 EMA so this would be in focus if there is any correction move to the downside:
FX Index Alignment: The FX Indices are not aligned at the moment.
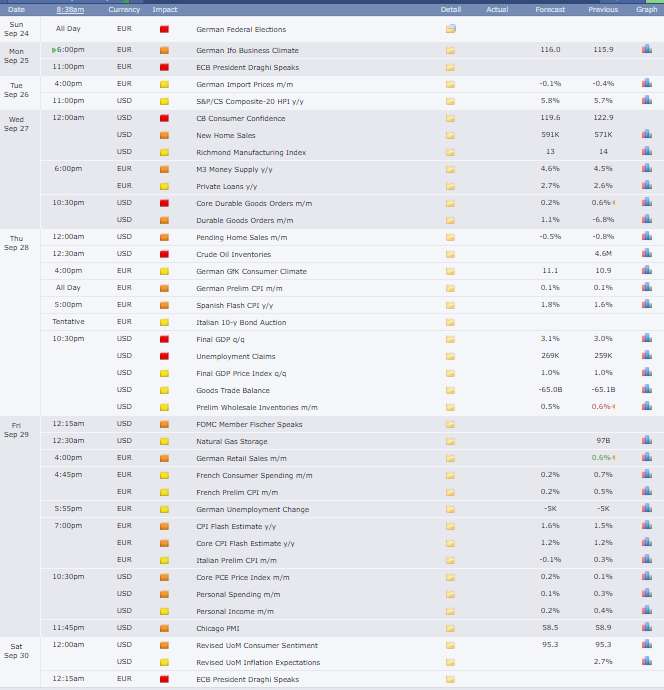
Calendar: There is quite a bit of high impact data next week and this starts on Sunday with the German Elections. Watch also for any North Korea news to feed into market impact (times set at GMT +10):