 Thurs 31st July
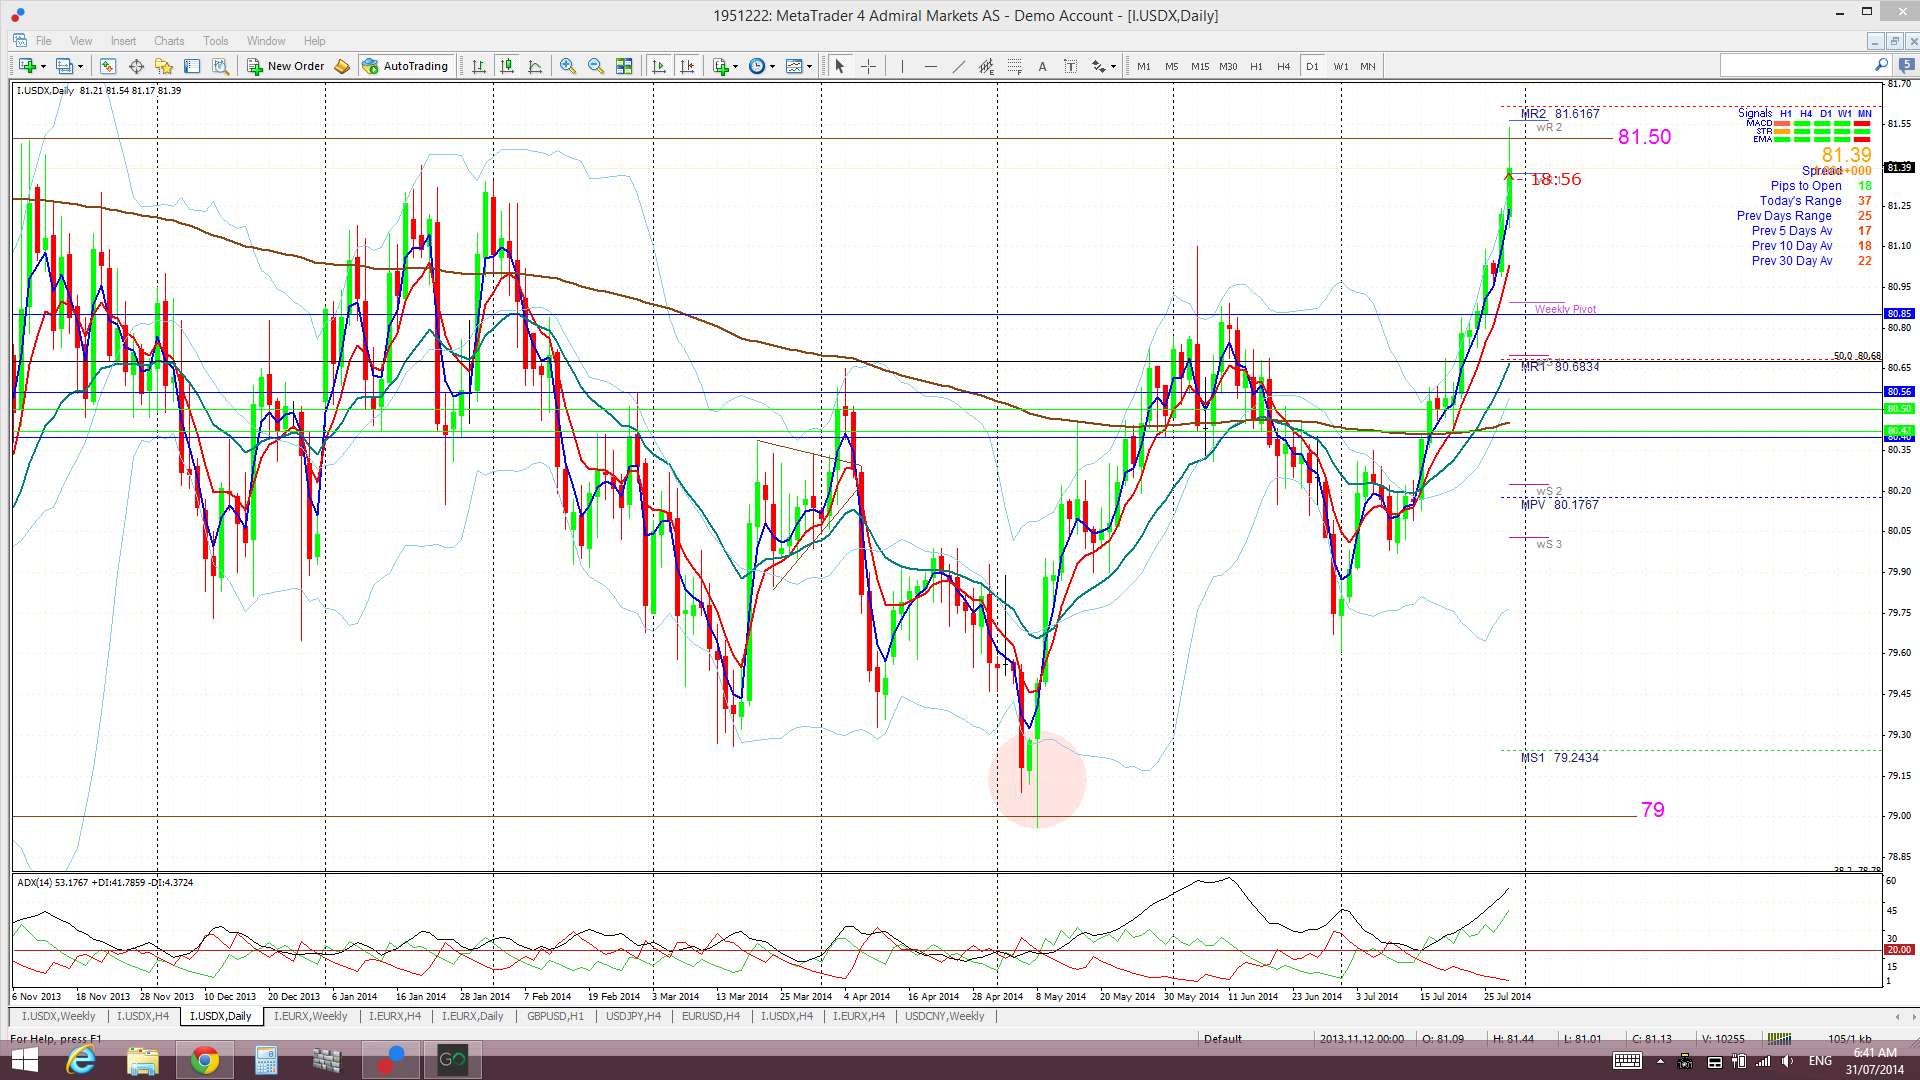
USD bulls certainly liked the outcome of FOMC and the stronger than expected US GDP figure. The USD index has rallied to trade right up under the key resistance of 81.50. This has been the upper level of a 10 month trading range for the USD. Will NFP get it over the line for the week though? The ADP NFP data was weaker than expected and this may be a bit of a ‘warning light’, ahead of NFP, for the USD to not get too far ahead of itself:
USDX daily: reached up to the 81.50 but looks set to close below this key level.
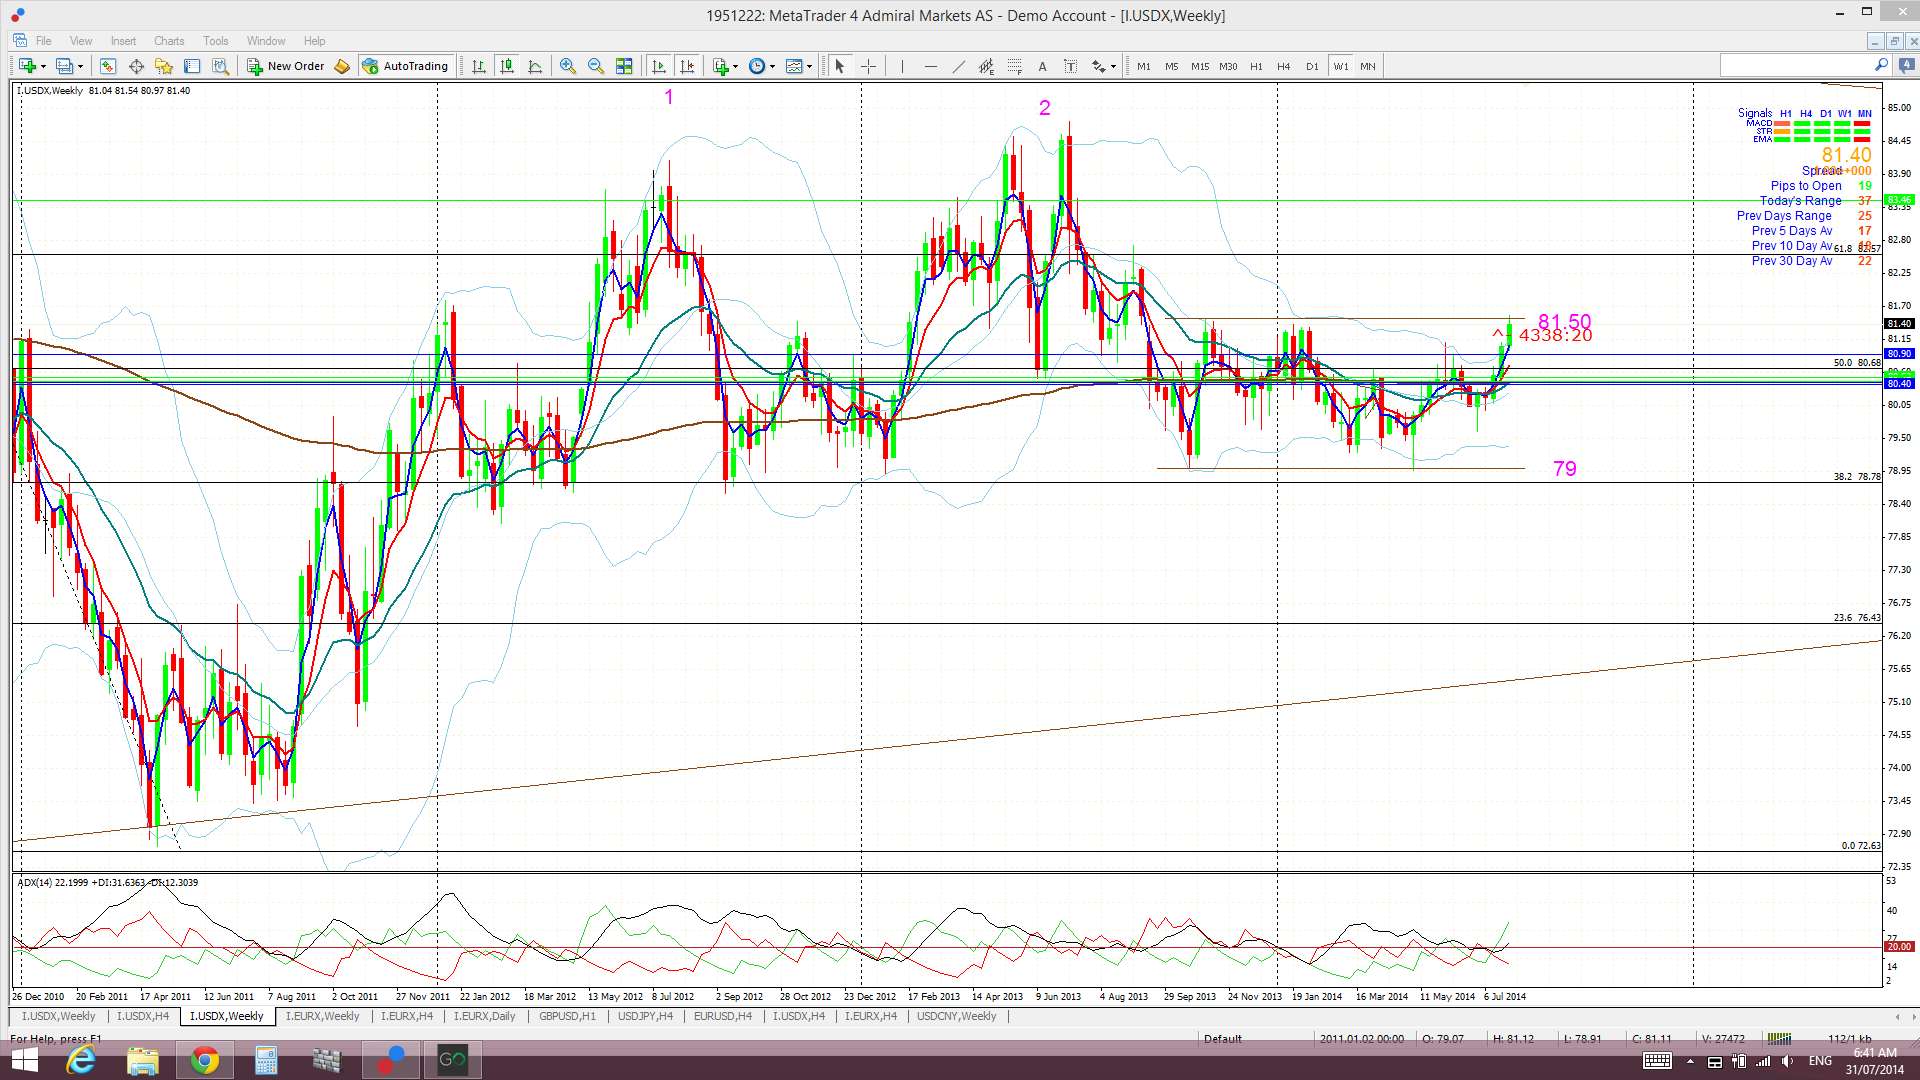
USDX weekly: any weekly close above the 81.50 would be the first since September 2013.
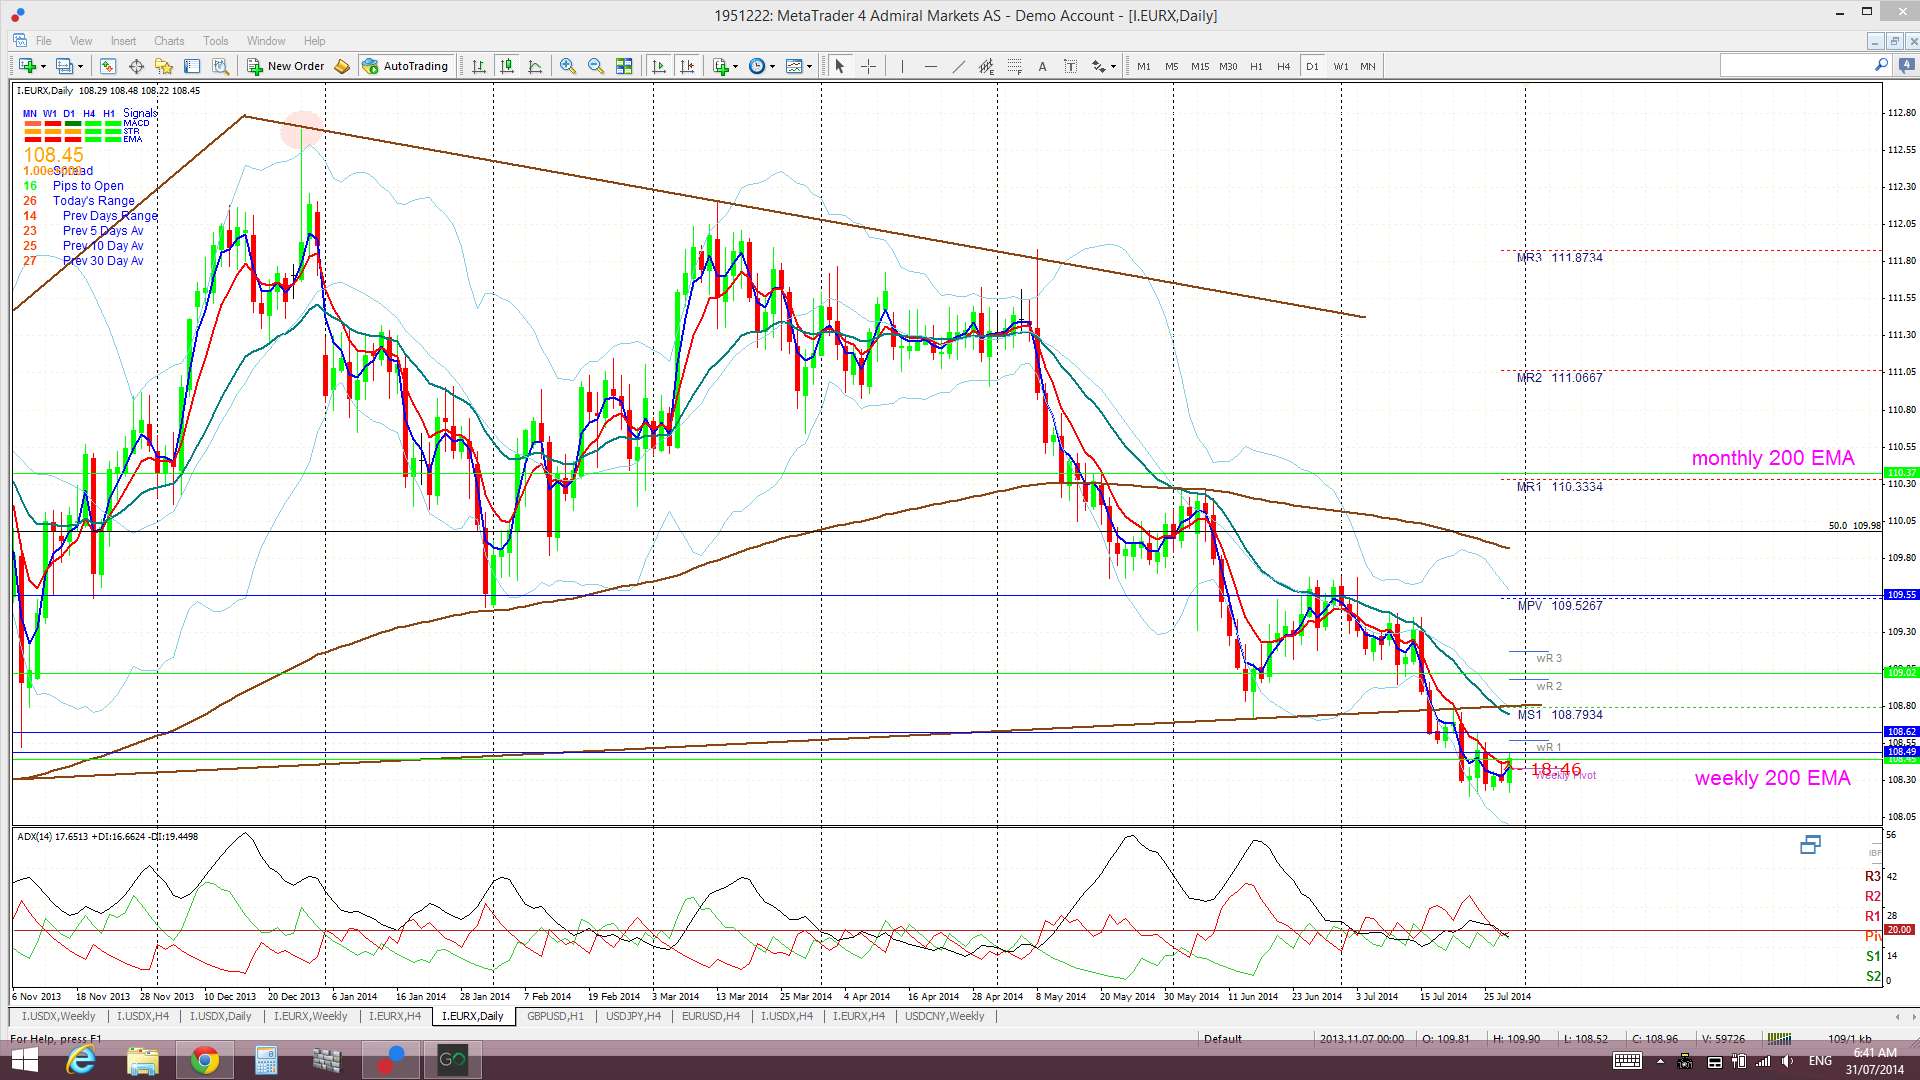
EURX: Interestingly, this index also had a good day:
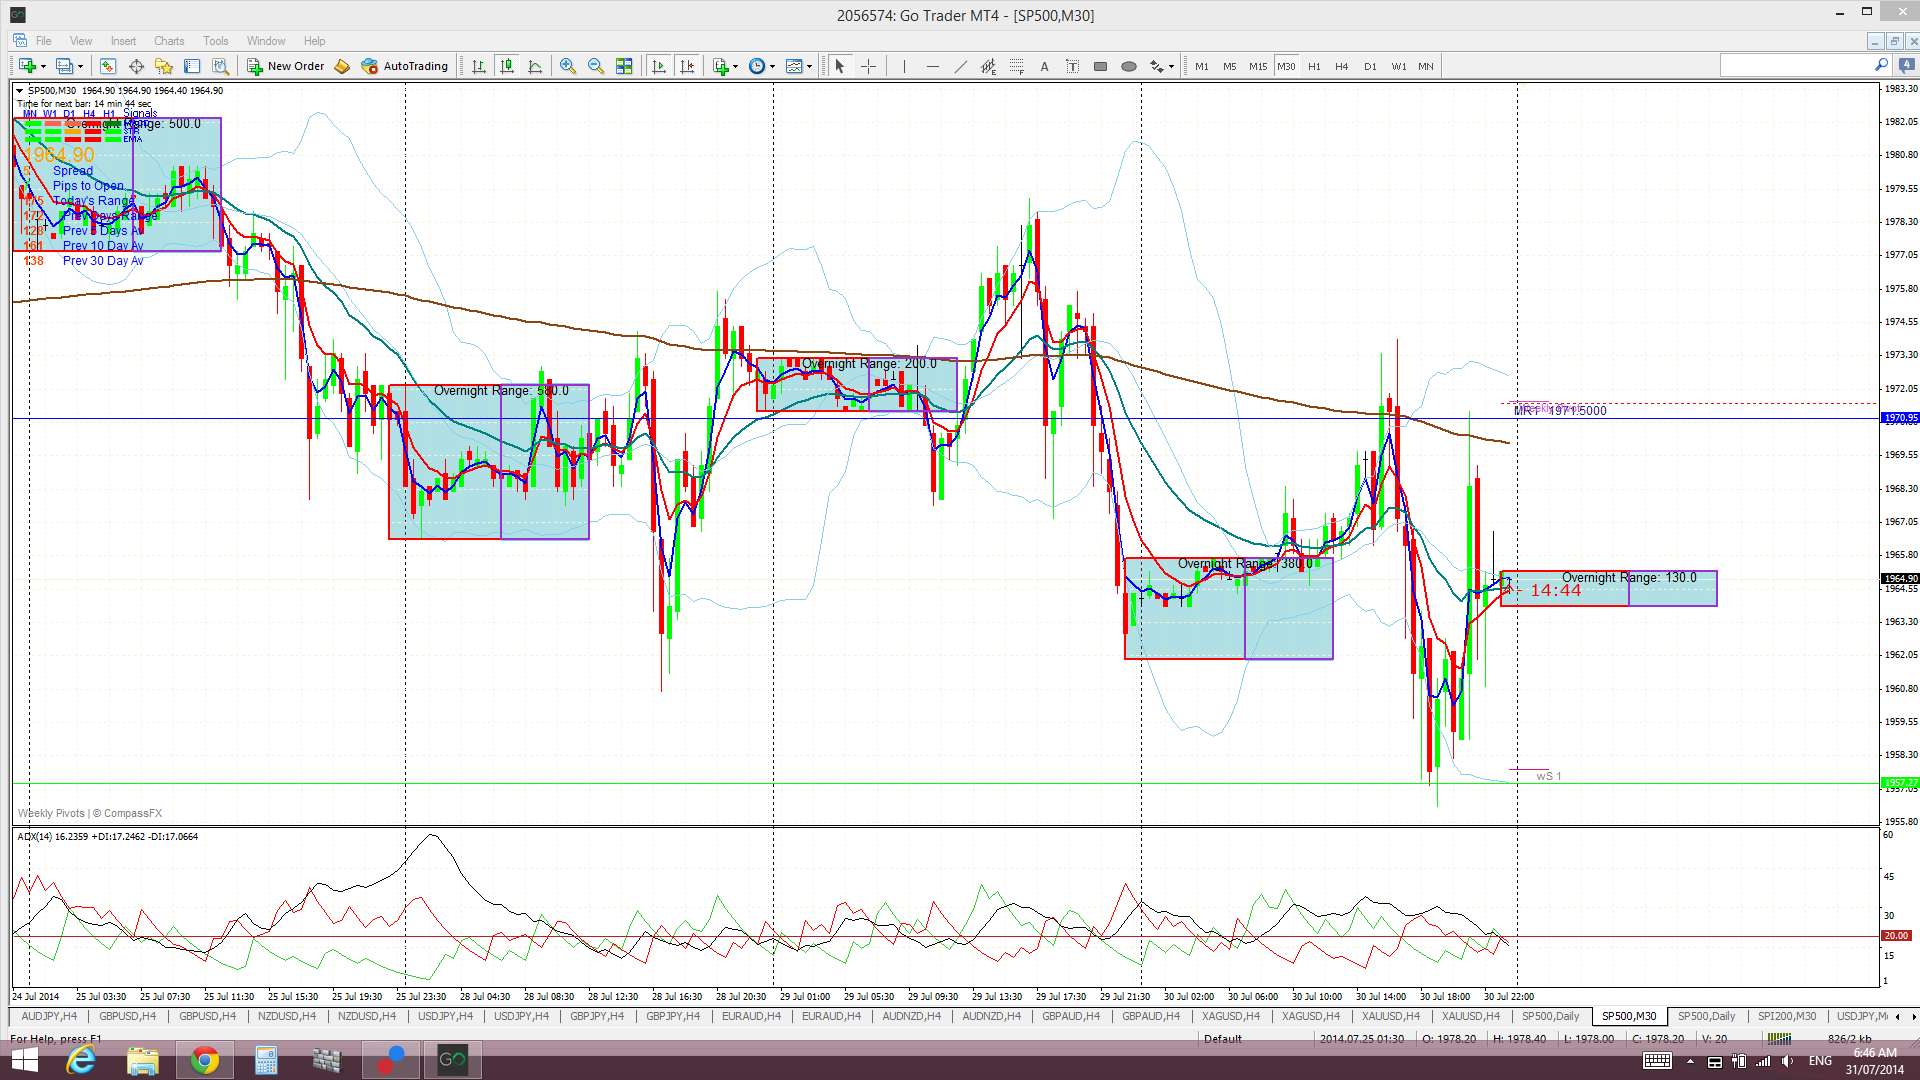
S&P500: stocks were mixed but the S&P500 ultimately carved out a positive close. Geopolitical concern continues to be the main issue for US stocks as earnings and data have ranged from ‘ok’ to ‘good’ for the most:
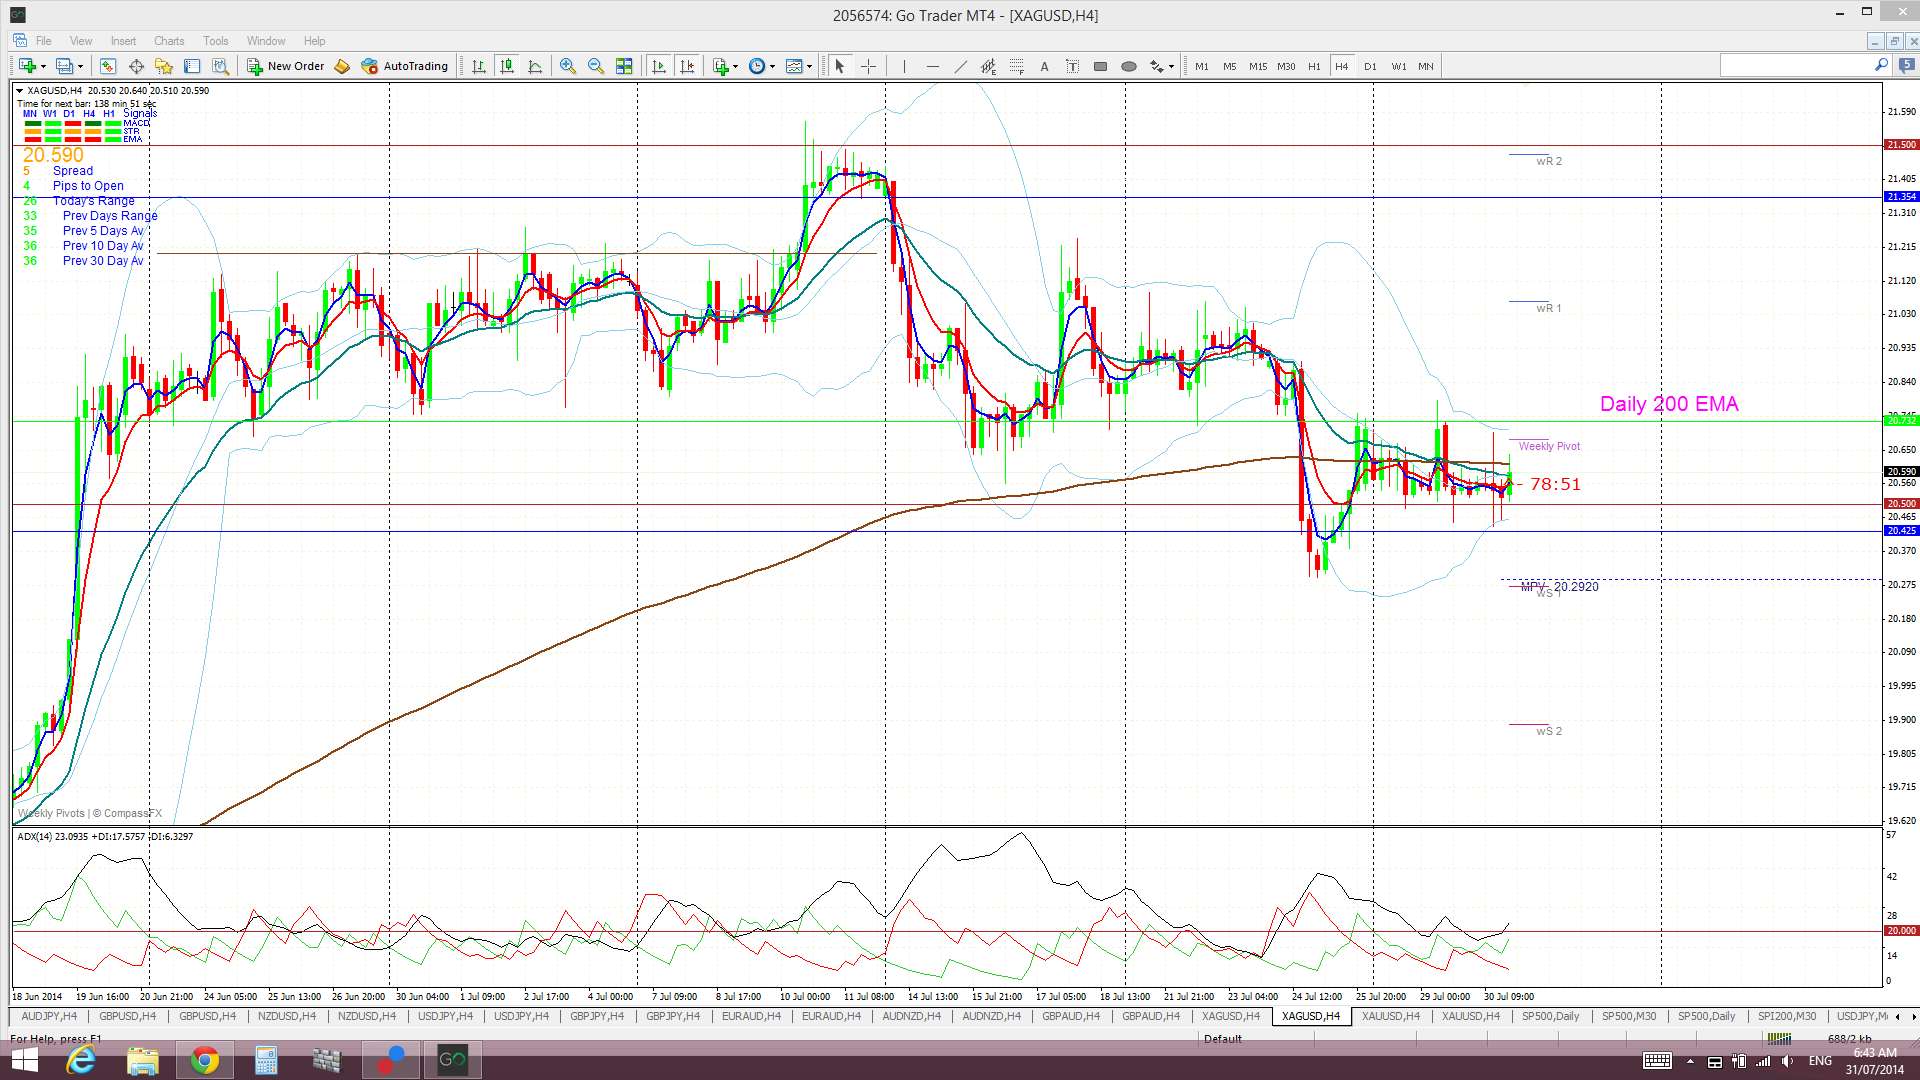
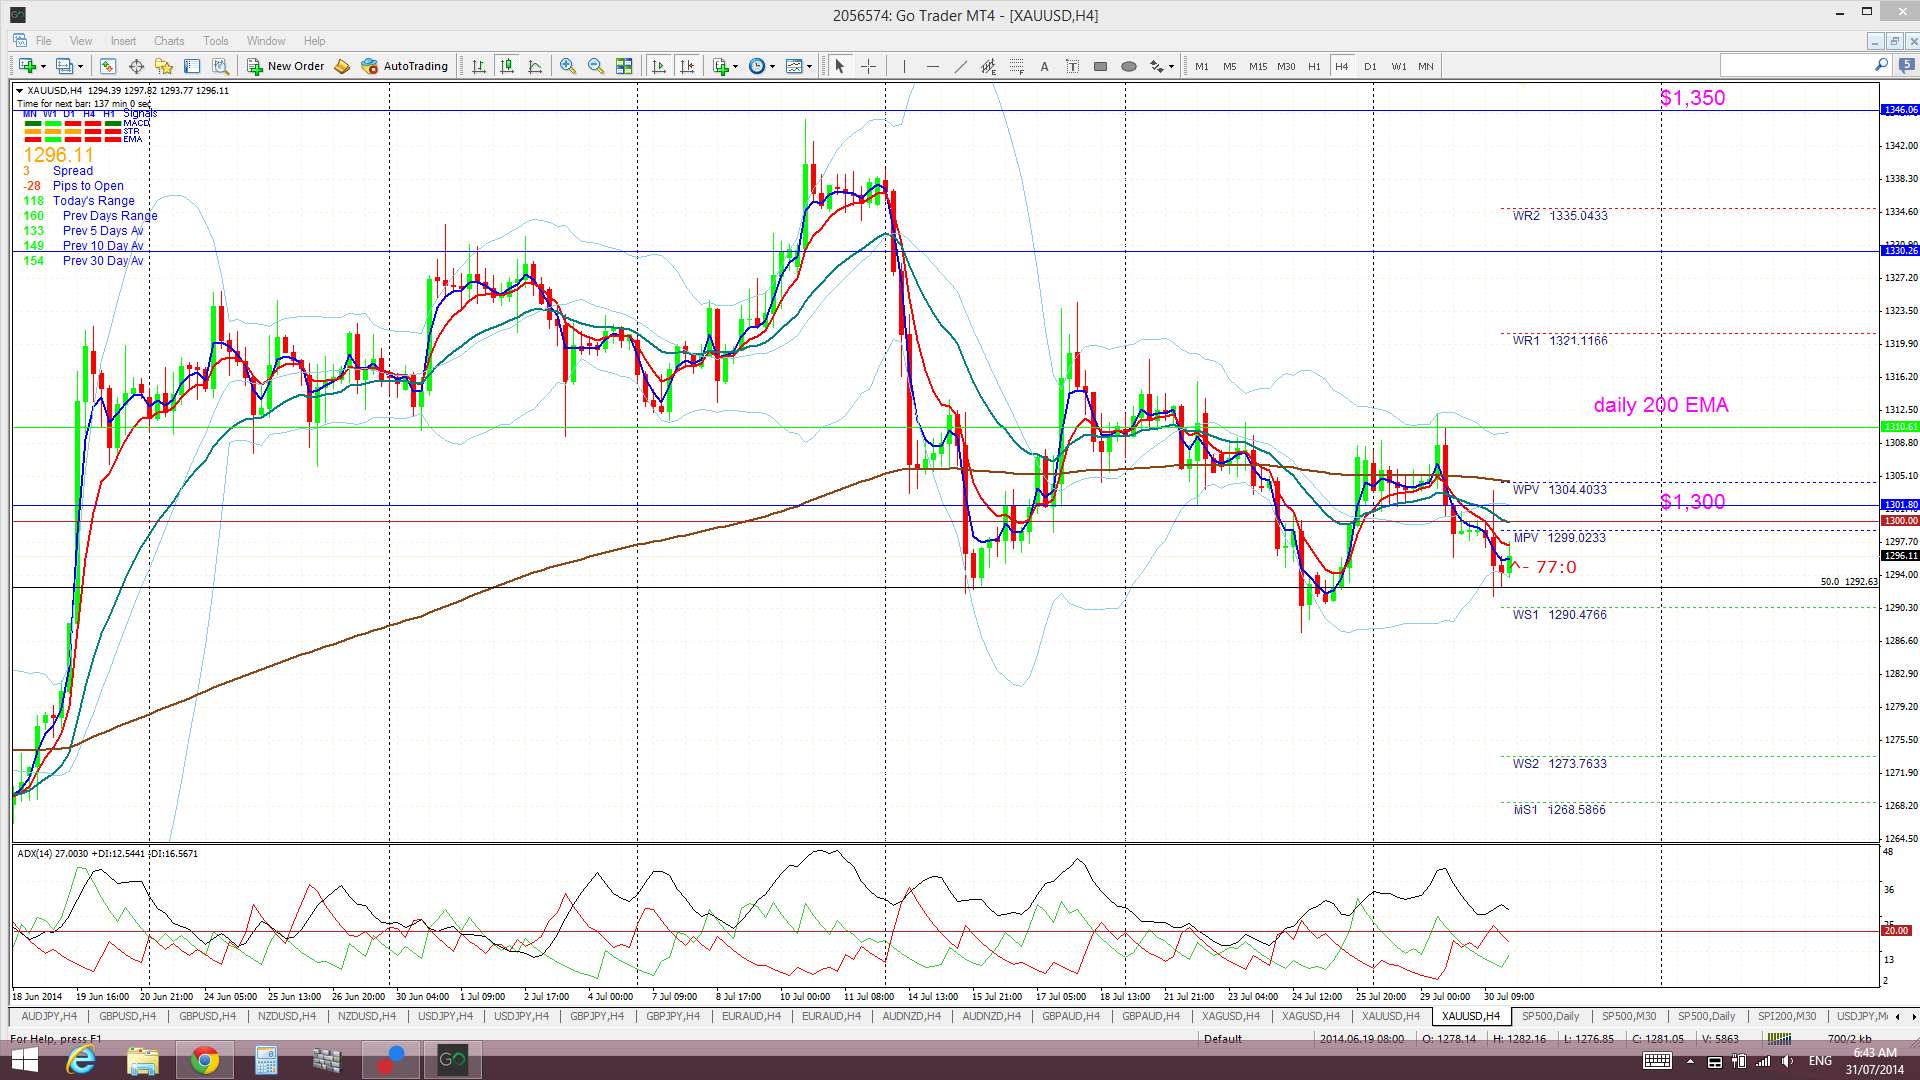
Silver and Gold:these have both held up fairly well in light of the strengthening USD. Geopolitical matters may be helping these though:
Silver: is holding above the $20.50 S/R level:
Gold: has slipped back below the $1,300 level but is holding above the other key support of the 50% fib of the 2007-2011 bull move:
Forex: FOMC triggered big moves with the USD and this has, in turn, triggered sharp moves with some FX pairs. The result being that some TC signal are not valid due to the candle size and falling outside the Bollinger band. Whilst my 4hr chart TC signals have been hard to come by of late there have been technical patterns delivering decent pip profits on the Loonie, Kiwi and even the E/U. The U/J looks to have broken out of a 7 month old consolidation pattern now as well and this may start to conform to a monthly chart technical pattern.
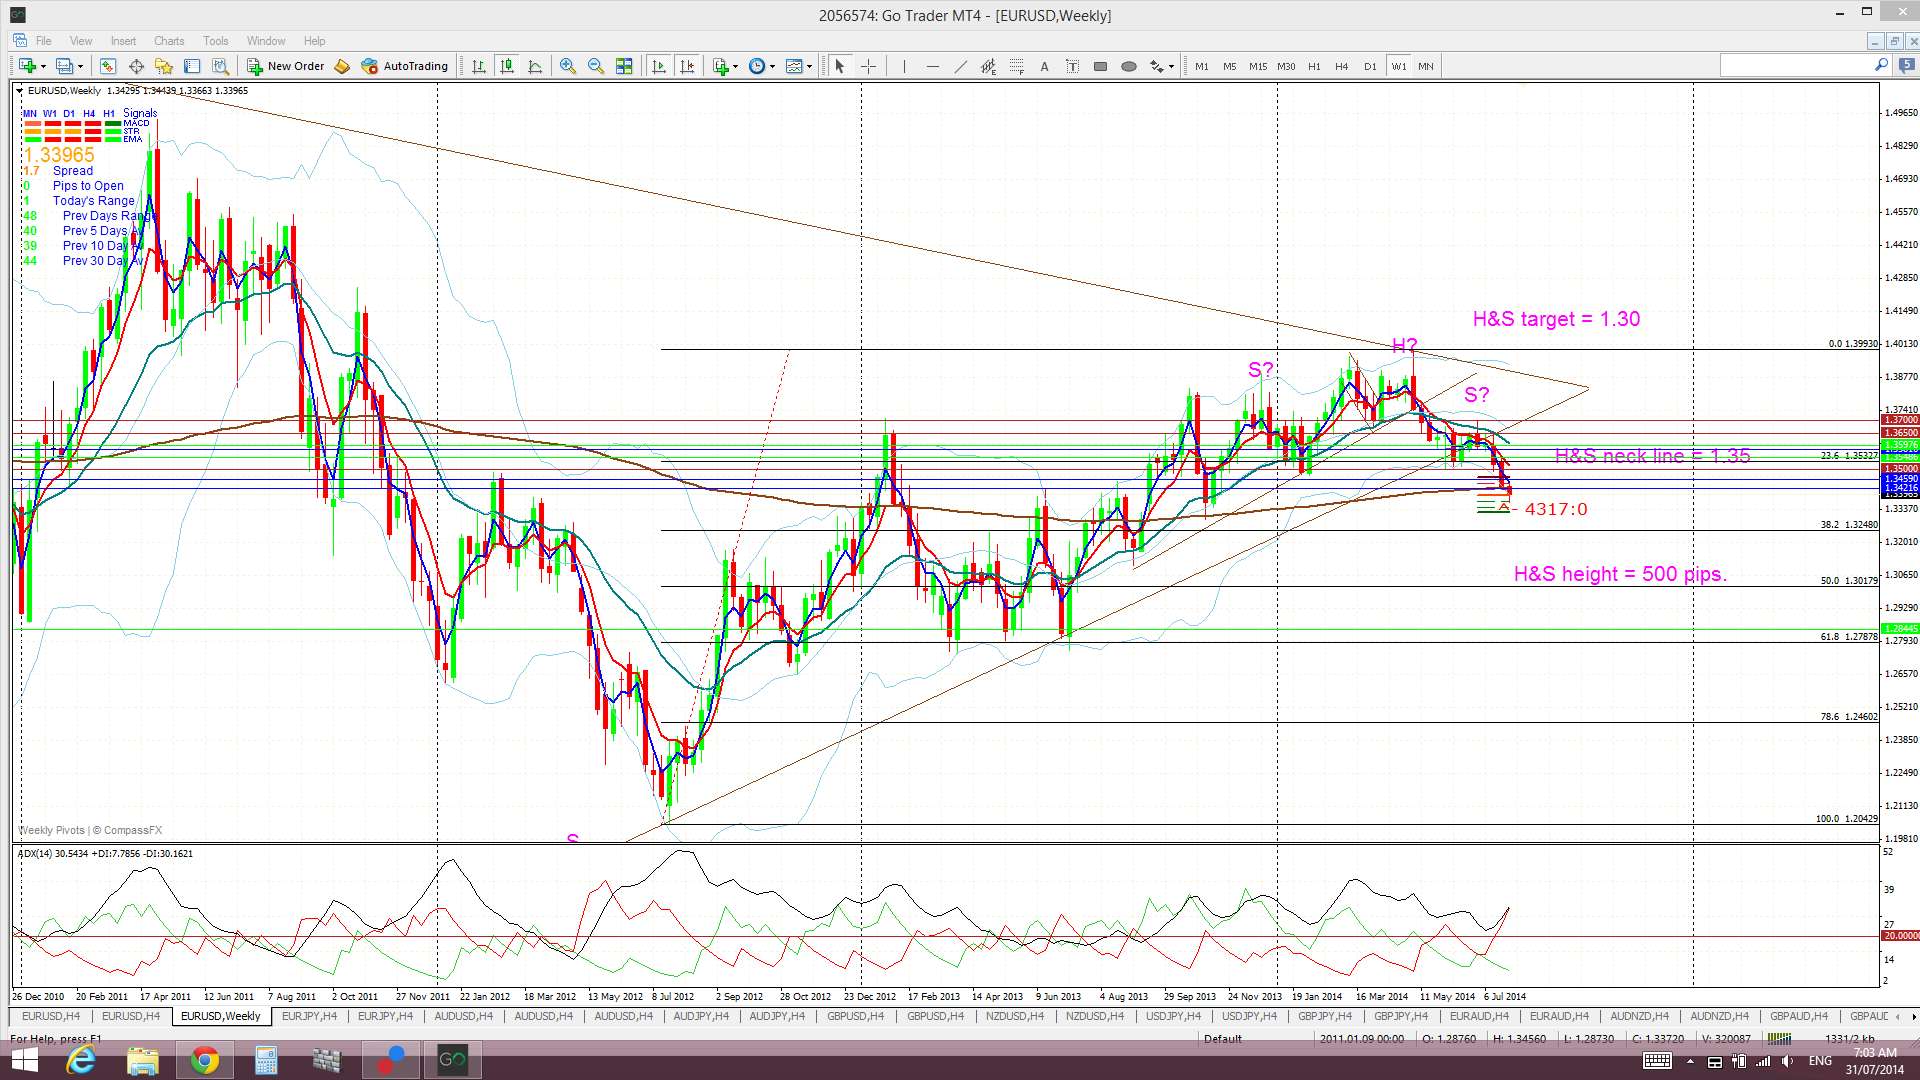
E/U: the weekly chart’s H&S is still yielding pips and is now up to 130 pips. Watch for any pull back above the weekly 200 EMA. This is a major support level for the E/U:
E/U weekly:
E/U 4 hr:

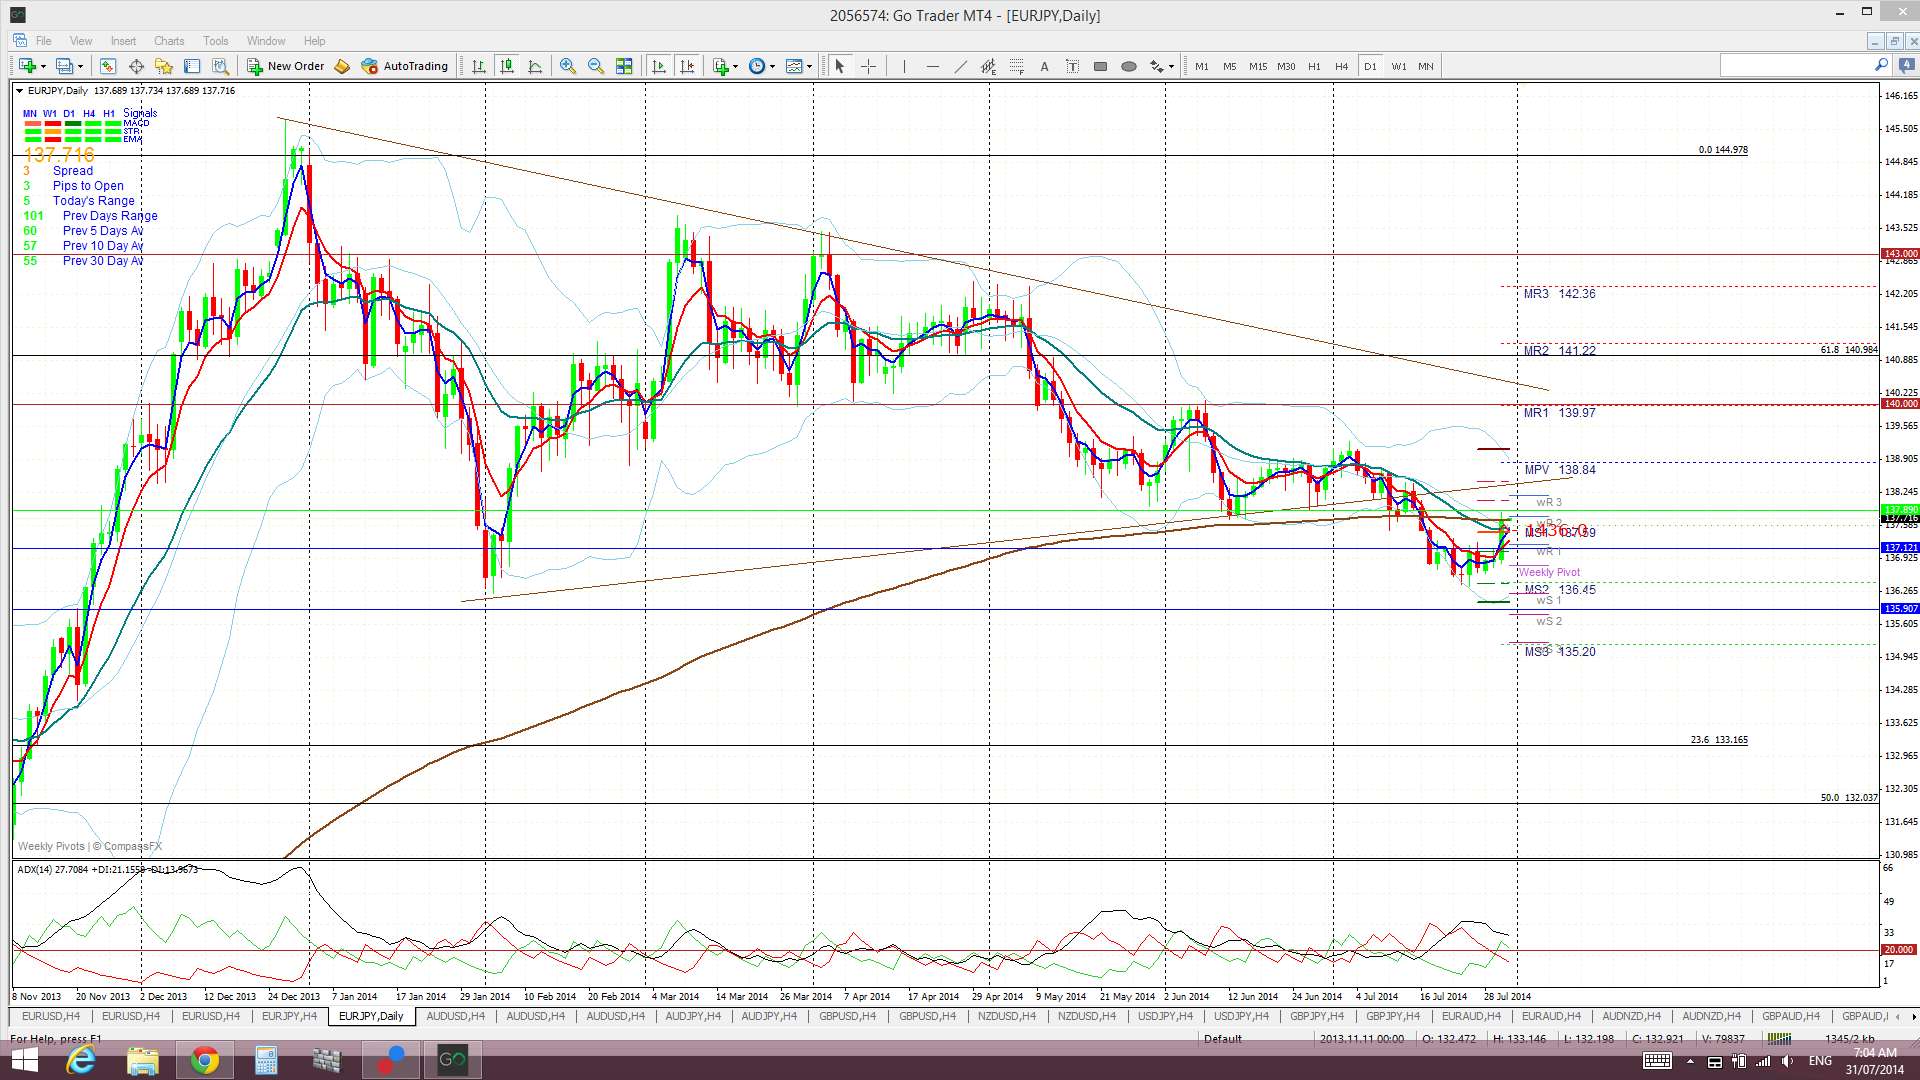
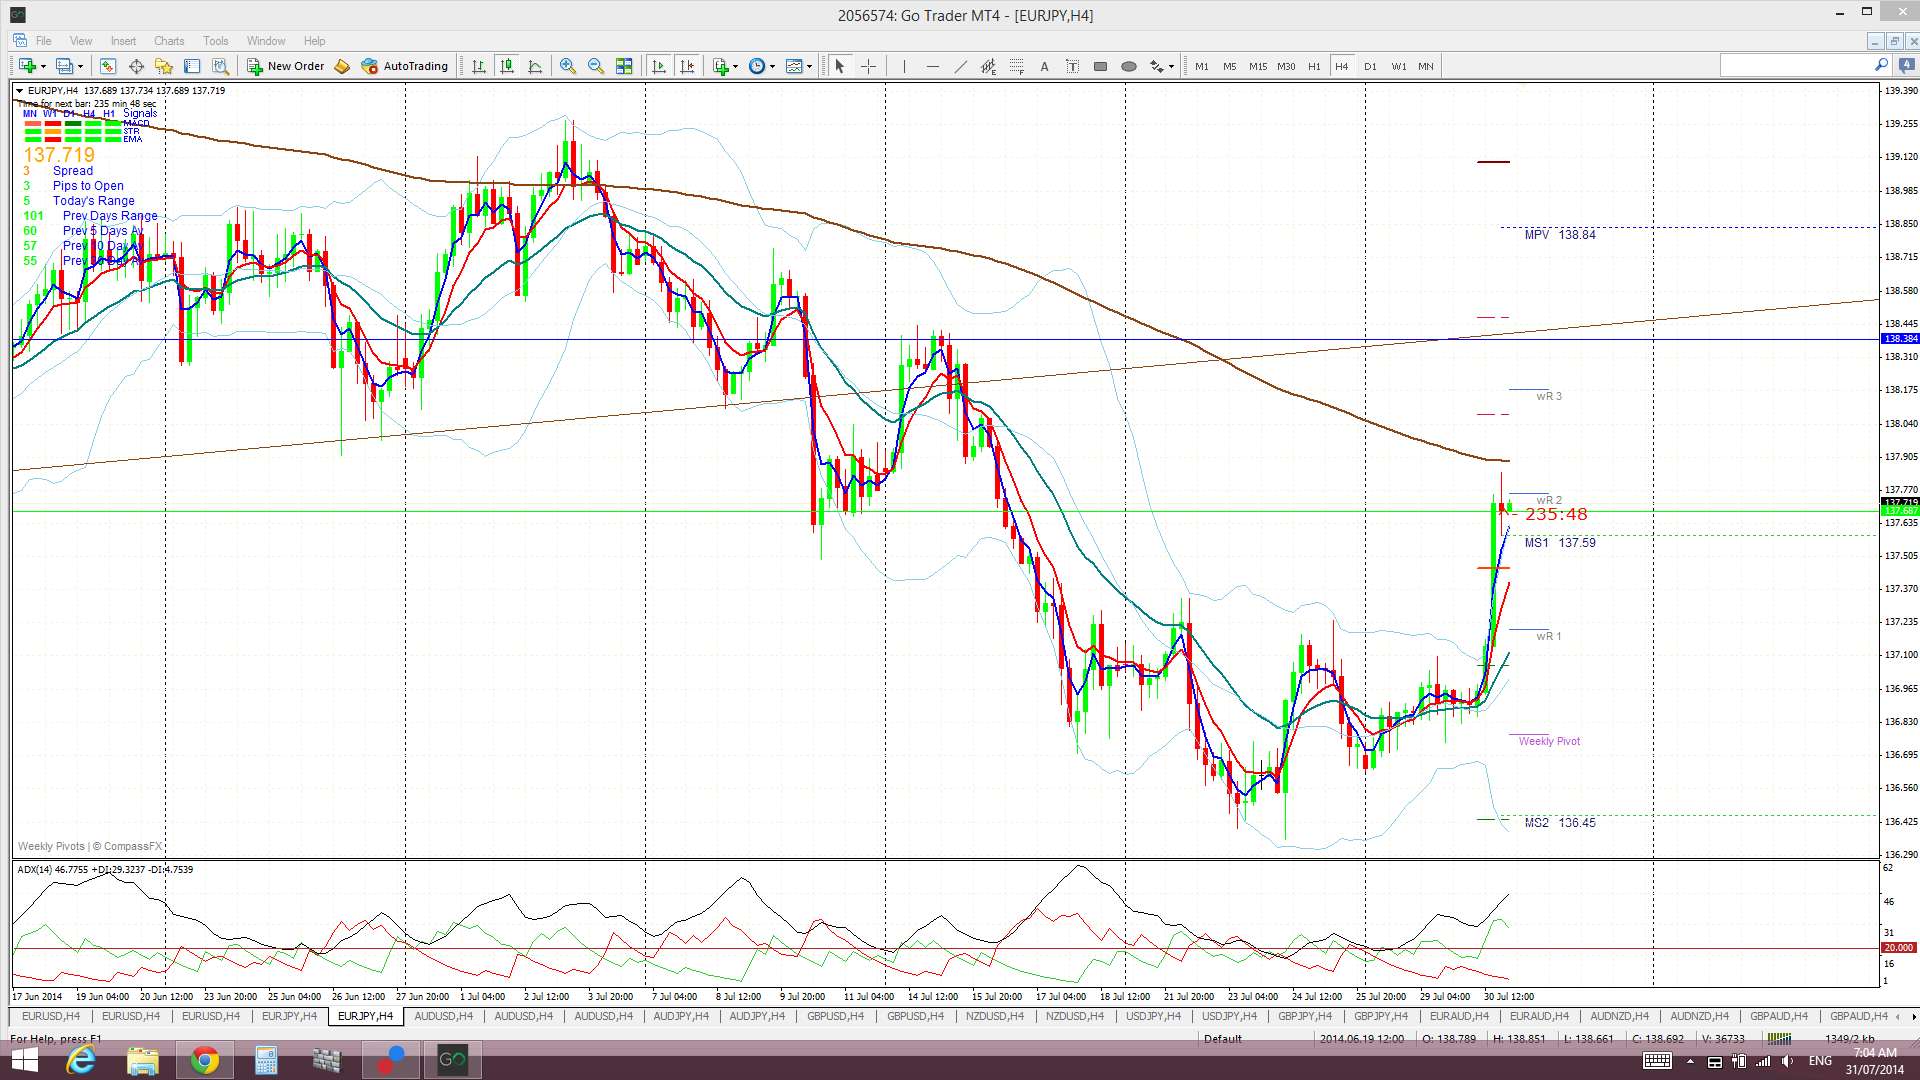
E/J: has been helped by bullish moves on the U/J no doubt and is now back at the key S/R level of the daily 200 EMA:
E/J daily:
E/J 4 hr:
A/U: lower with the stronger USD but finding some support from the daily 200 EMA:

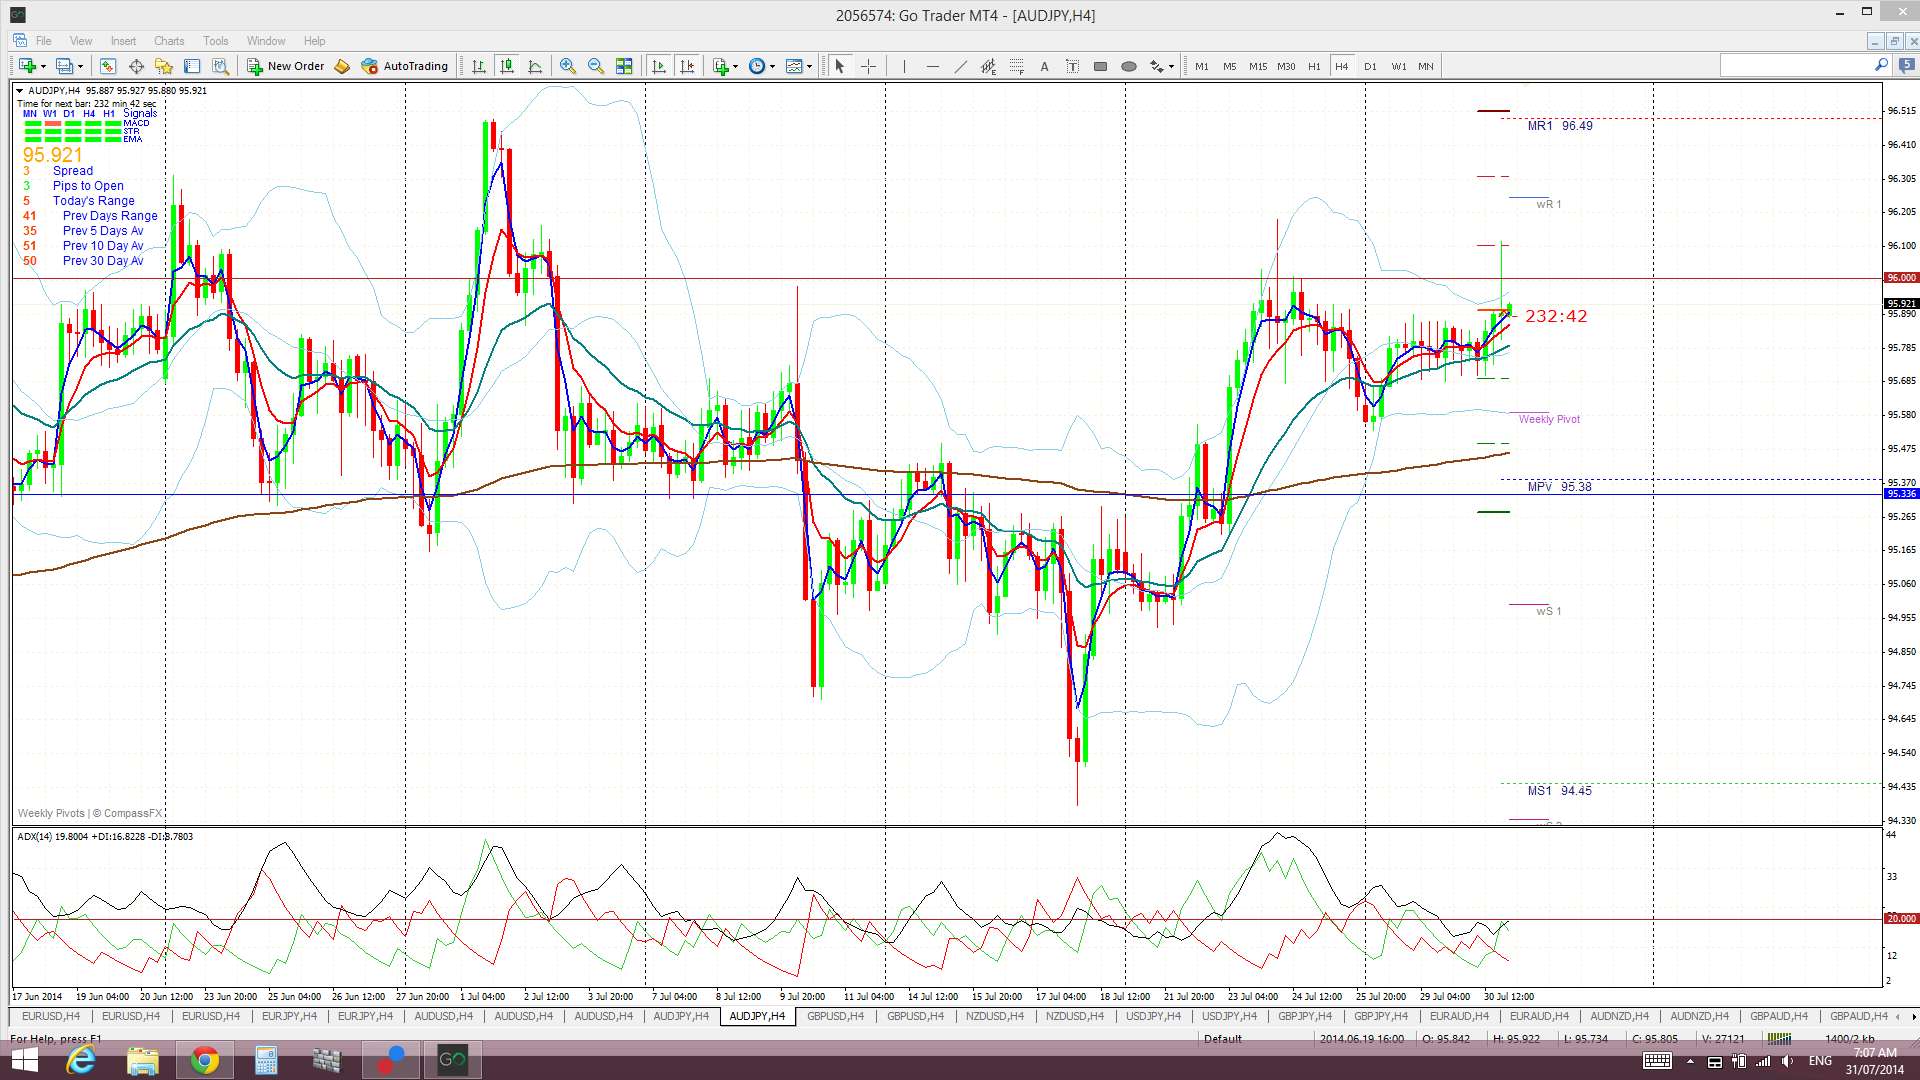
A/J: trading near the 96 and helped by the stronger U/J:
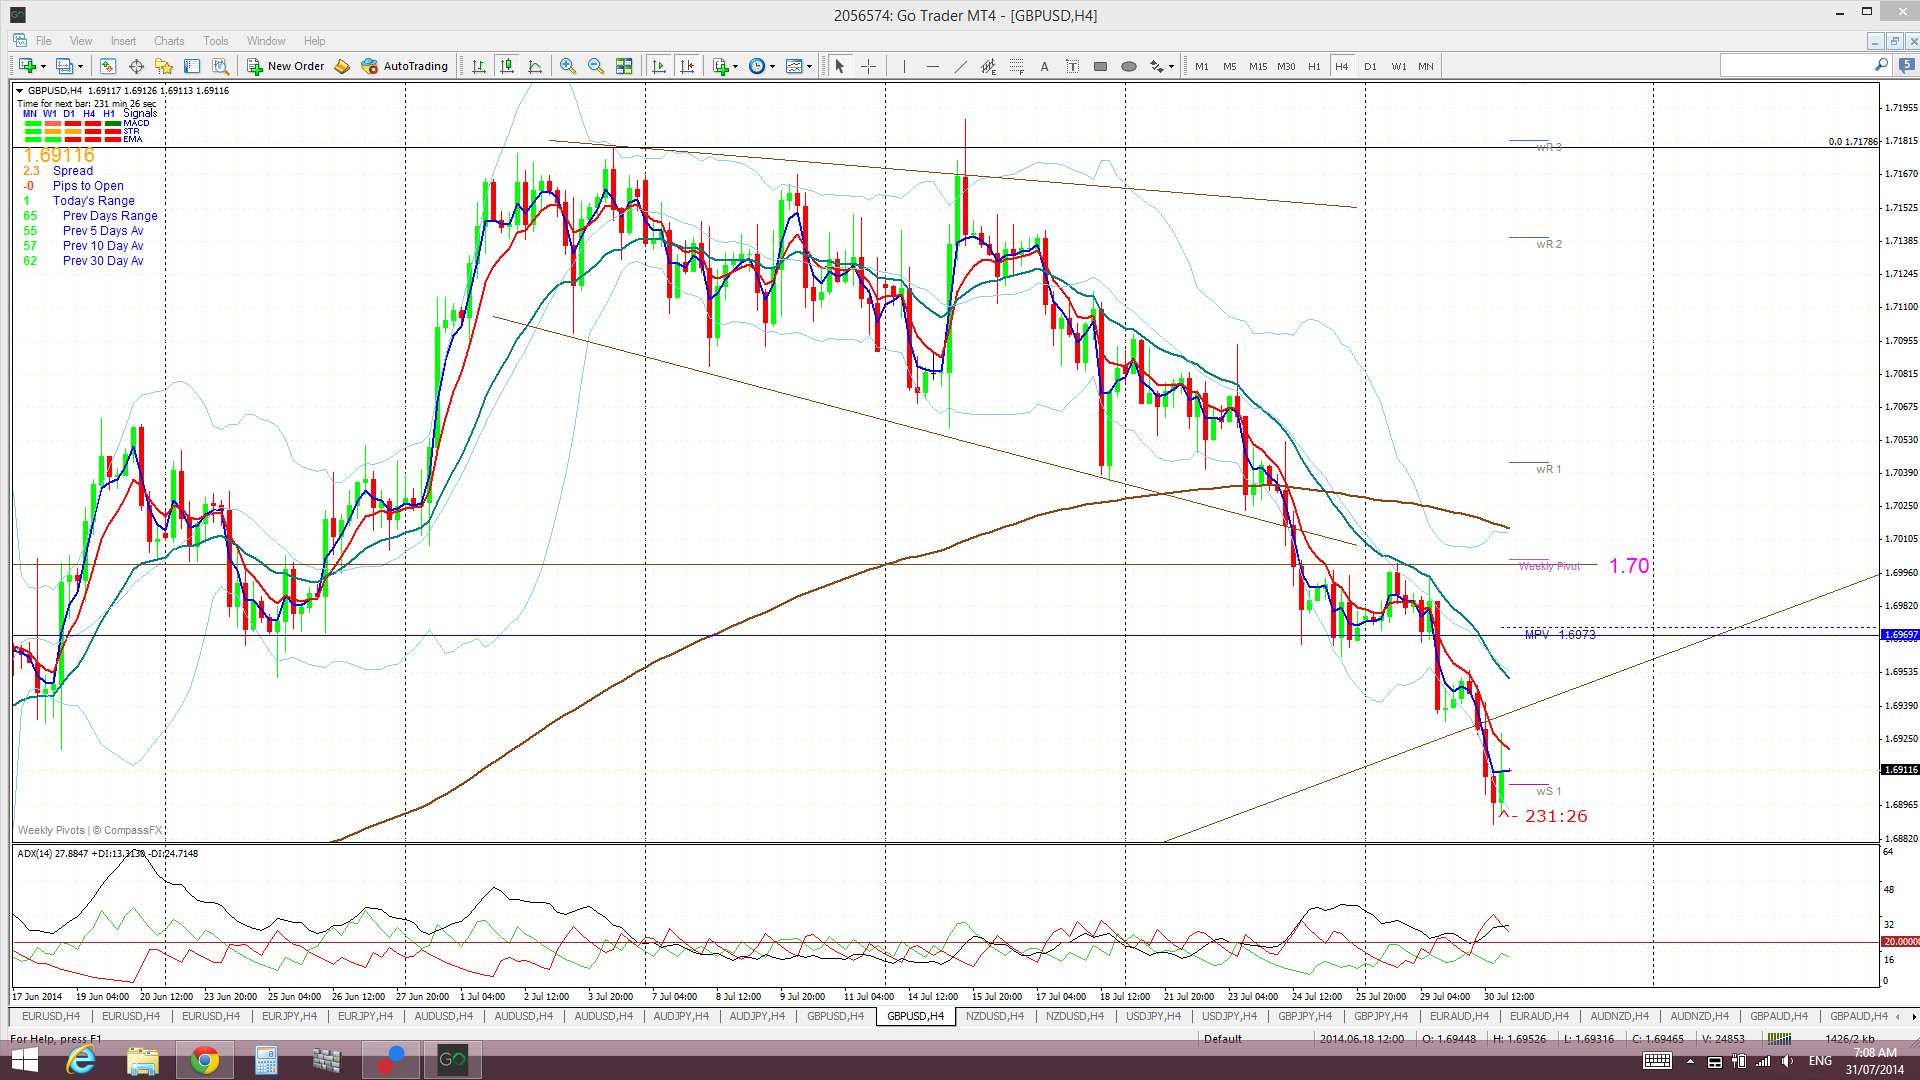
Cable: is also lower with the stronger USD. The Cable has broken below the weekly support trend line but, as this is a weekly trend line, confirmation of the break needs to be assessed after the weekly candle close:
Cable 4 hr:
Cable weekly: a weekly candle close below the trend line is yet to be confirmed. There is room for a pull back here though even as part of an overall bull move:

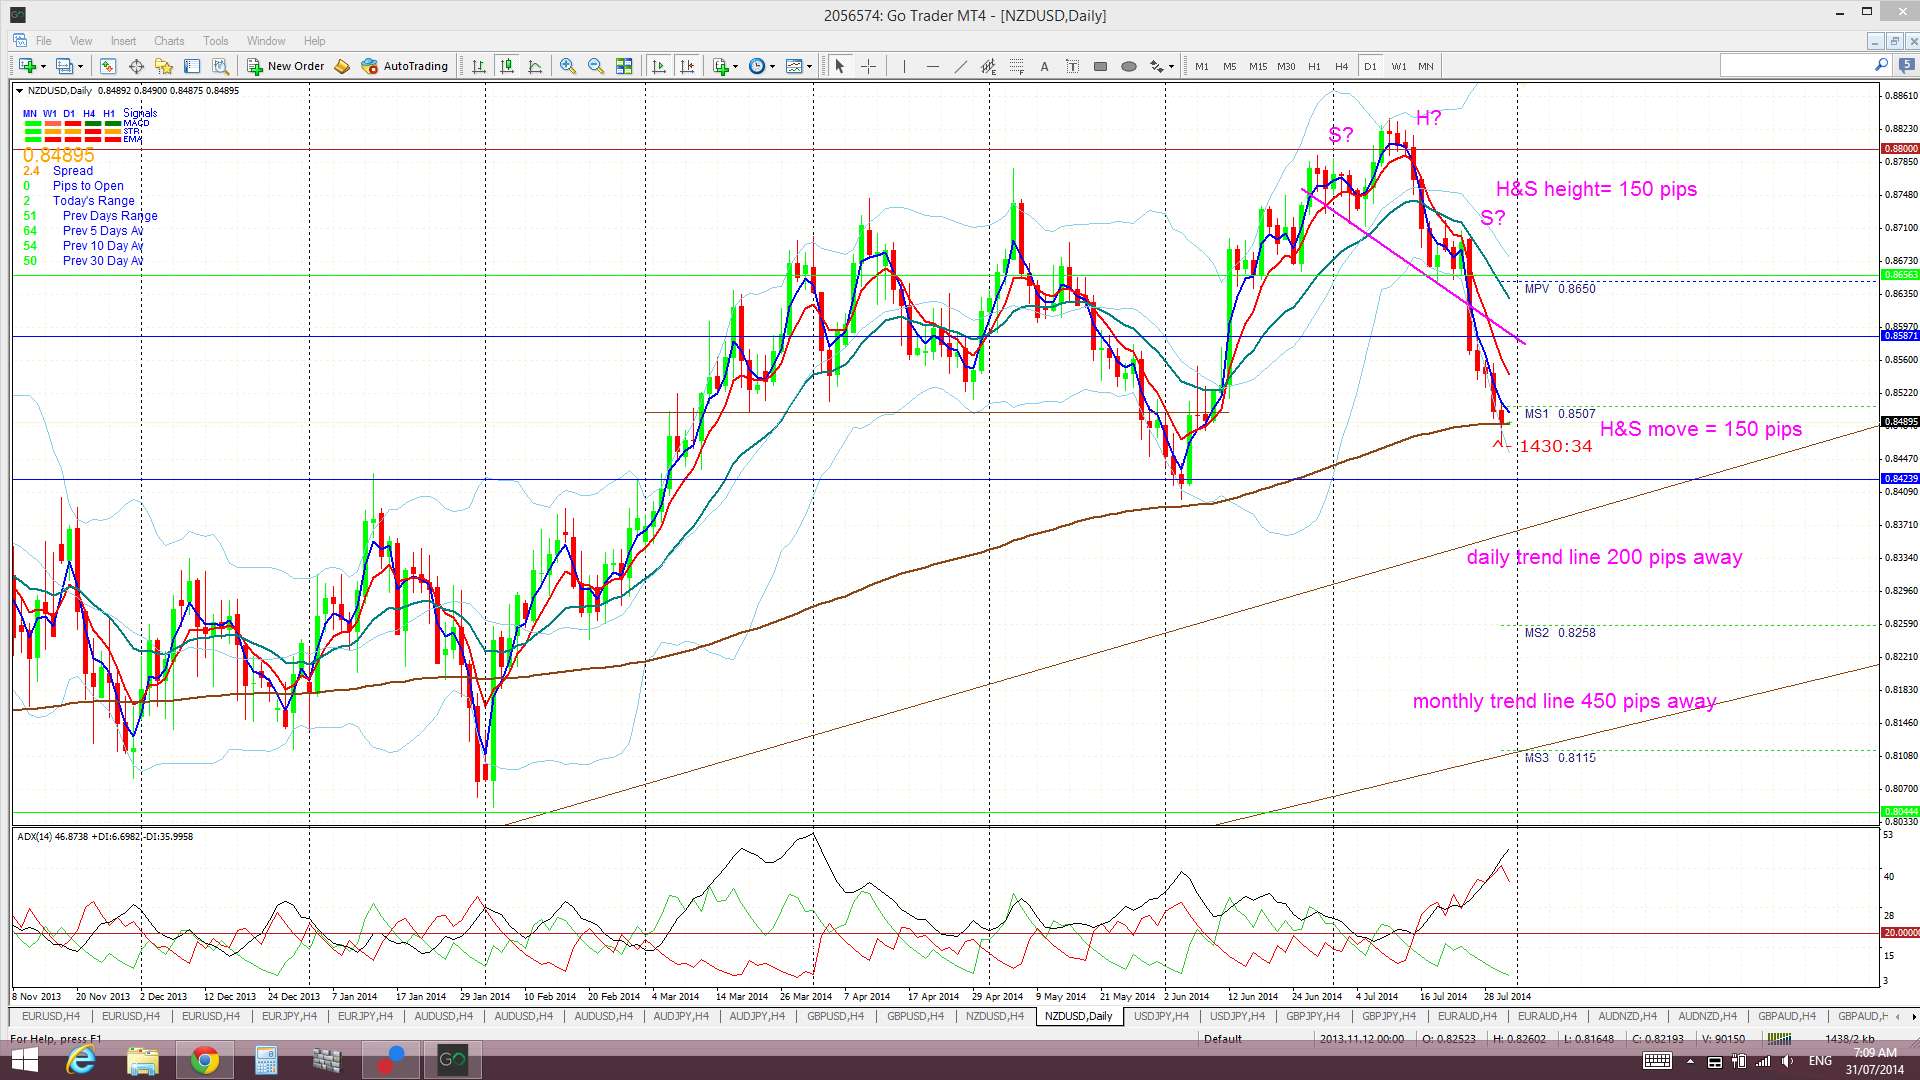
Kiwi: the 4hr chart’s H&S has delivered the full quota of pips now and the Kiwi is currently paused at the support of the daily 200 EMA. There is room to fall further here though, as the daily chart reveals, with both daily and weekly support trend lines still below current price:
Kiwi 4 hr:

Kiwi daily:
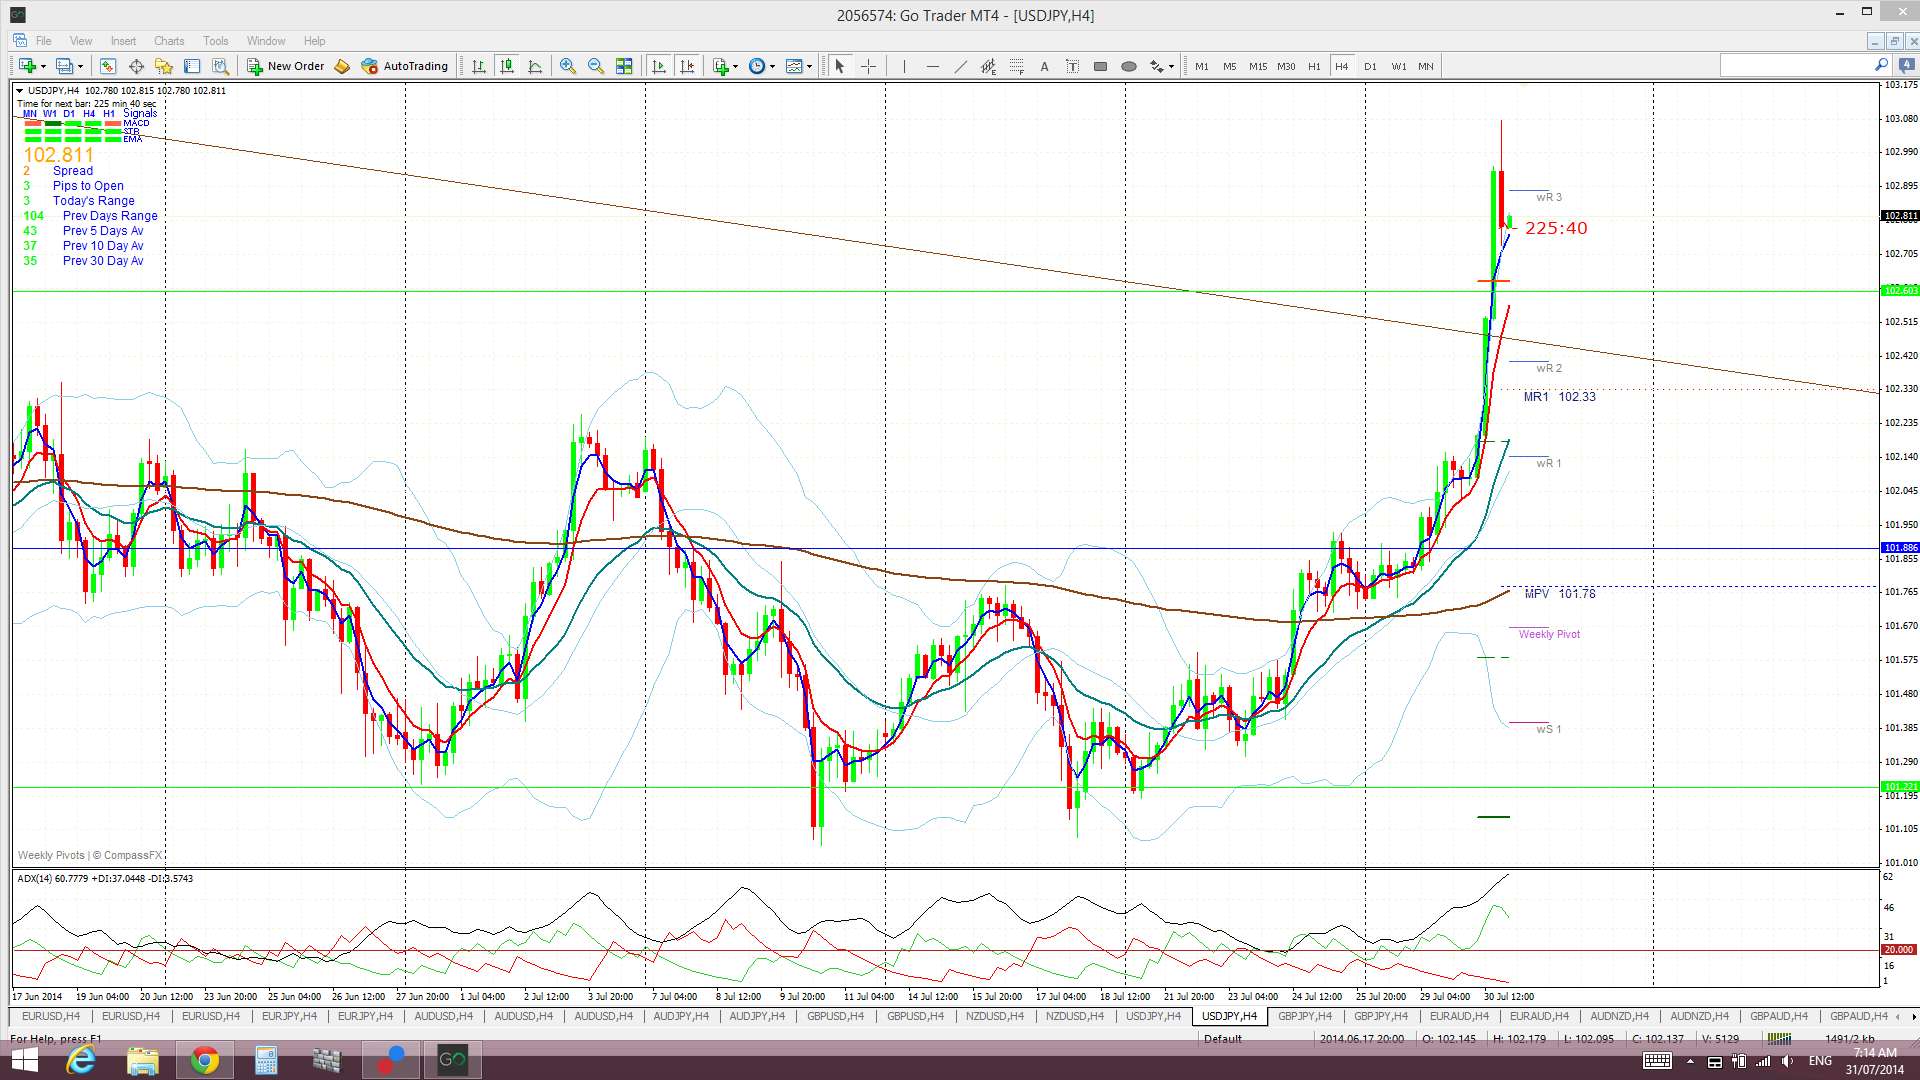
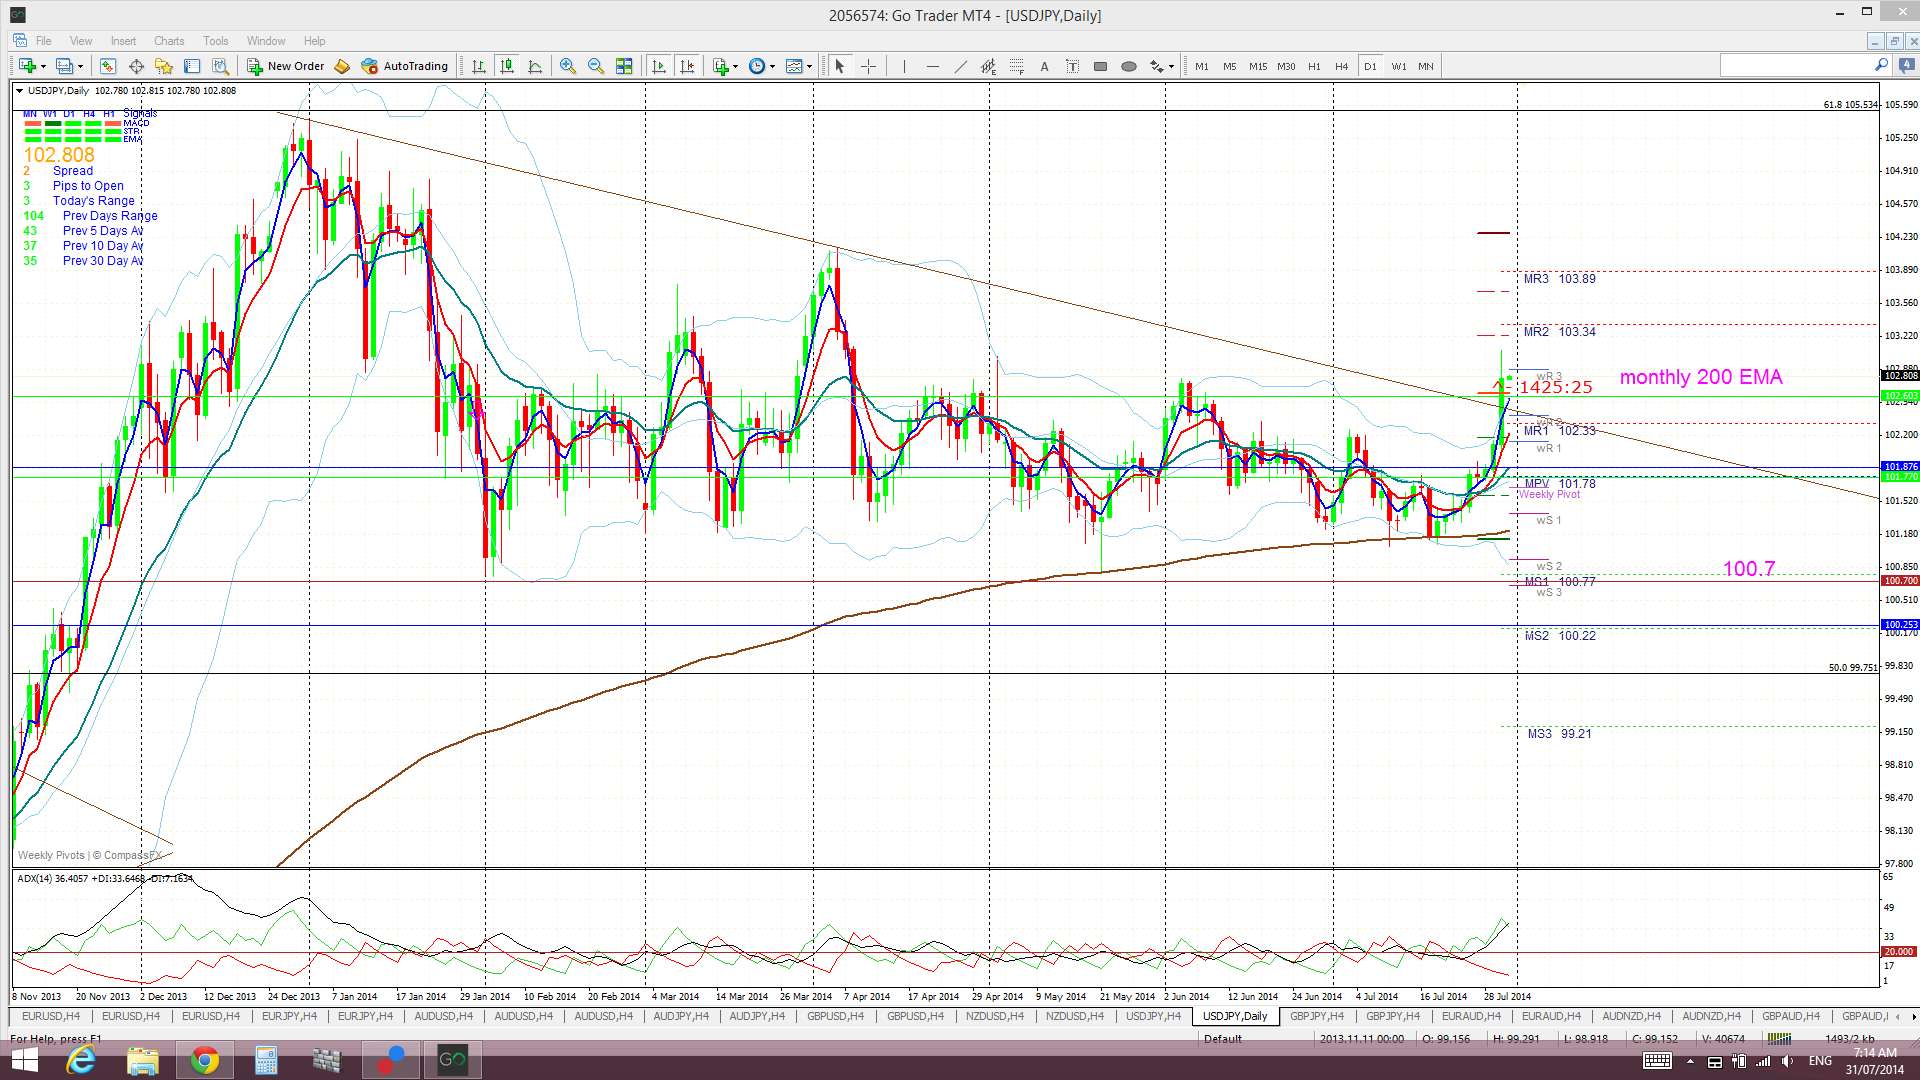
U/J: this has rallied with the stronger USD. The U/J has now broken out of the daily chart’s triangle pattern and this is a bullish development. The U/J had been consolidating within this triangle for 7 months. This triangle also contributes to the monthly charts bullish ‘Cup ‘n’ Handle’ pattern that I have been monitoring for many months now. A weekly chart hold up and out from this triangle pattern would be very bullish and would suggest continuation:
U/J 4 hr:
U/J daily: showing the 7 month triangle consolidation pattern:
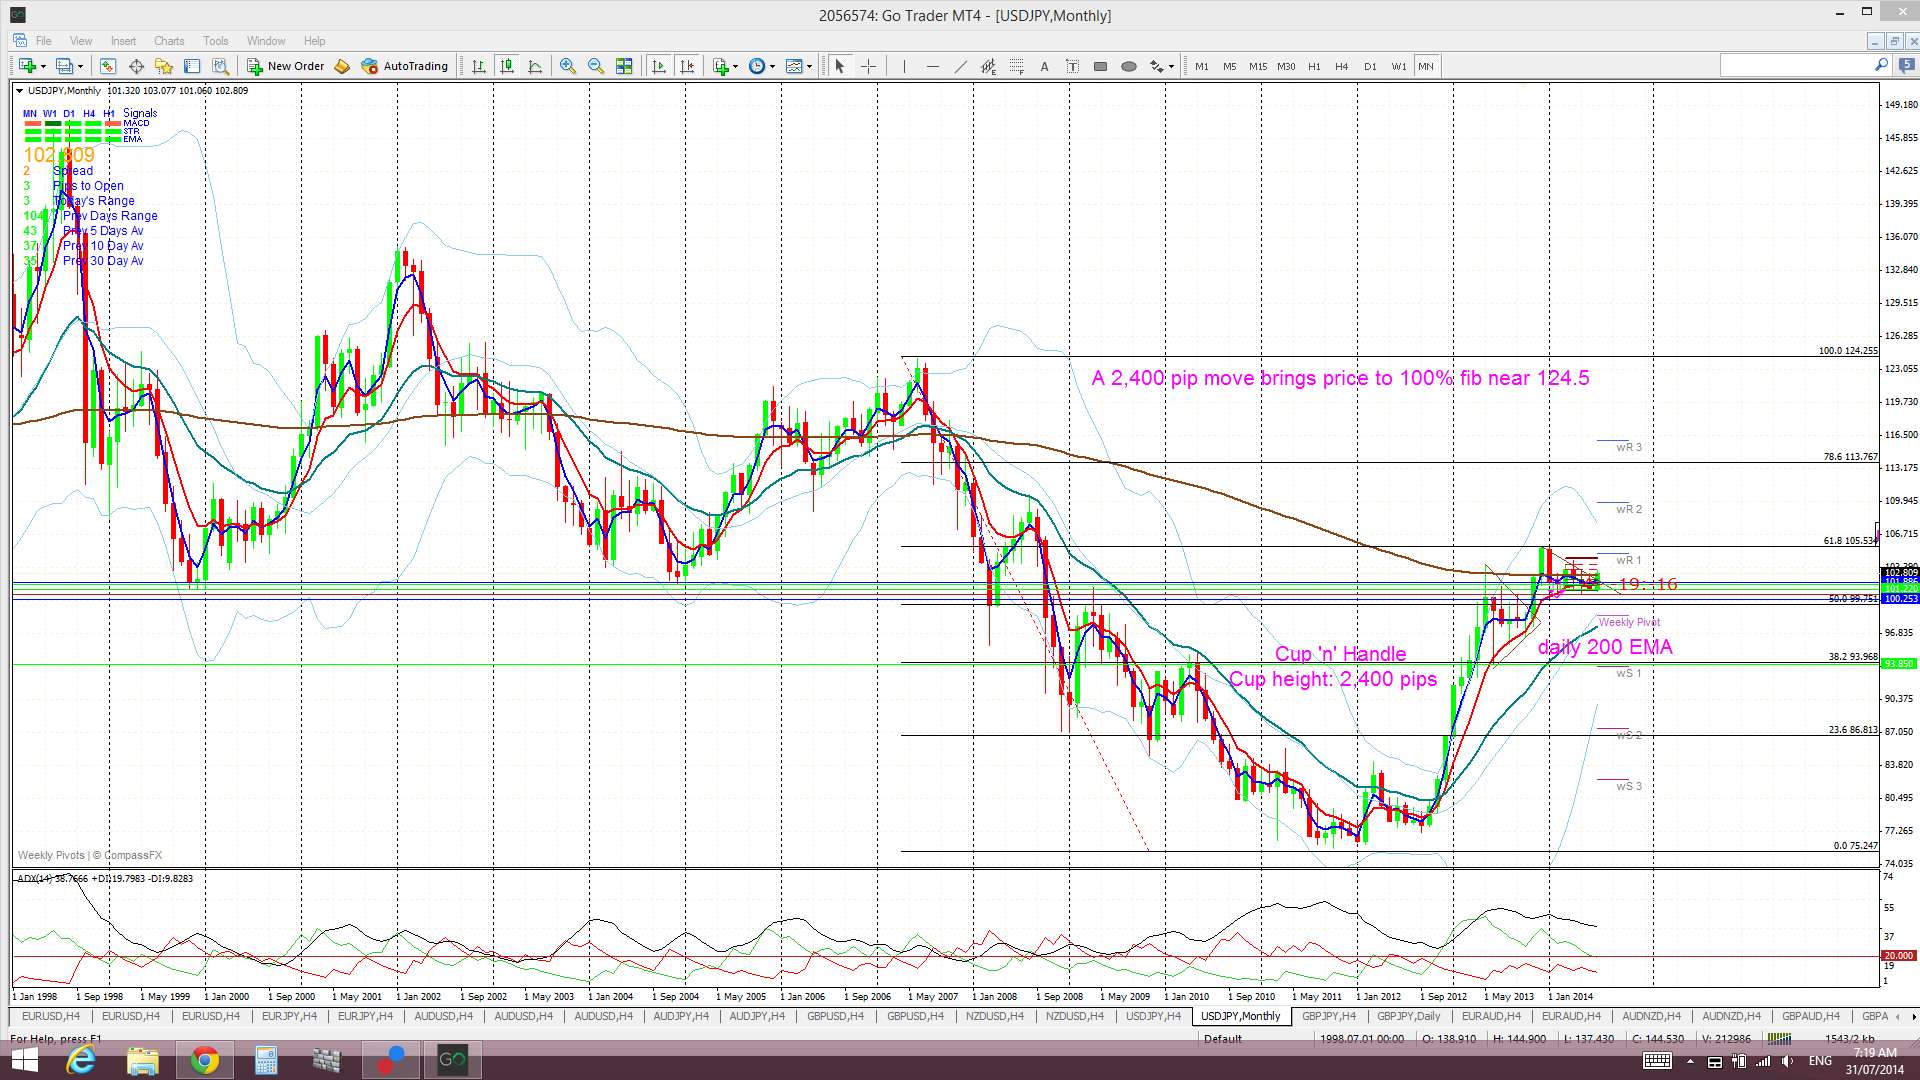
U/J weekly: a flag breakout looming. Confirmation needed after the weekly candle close:
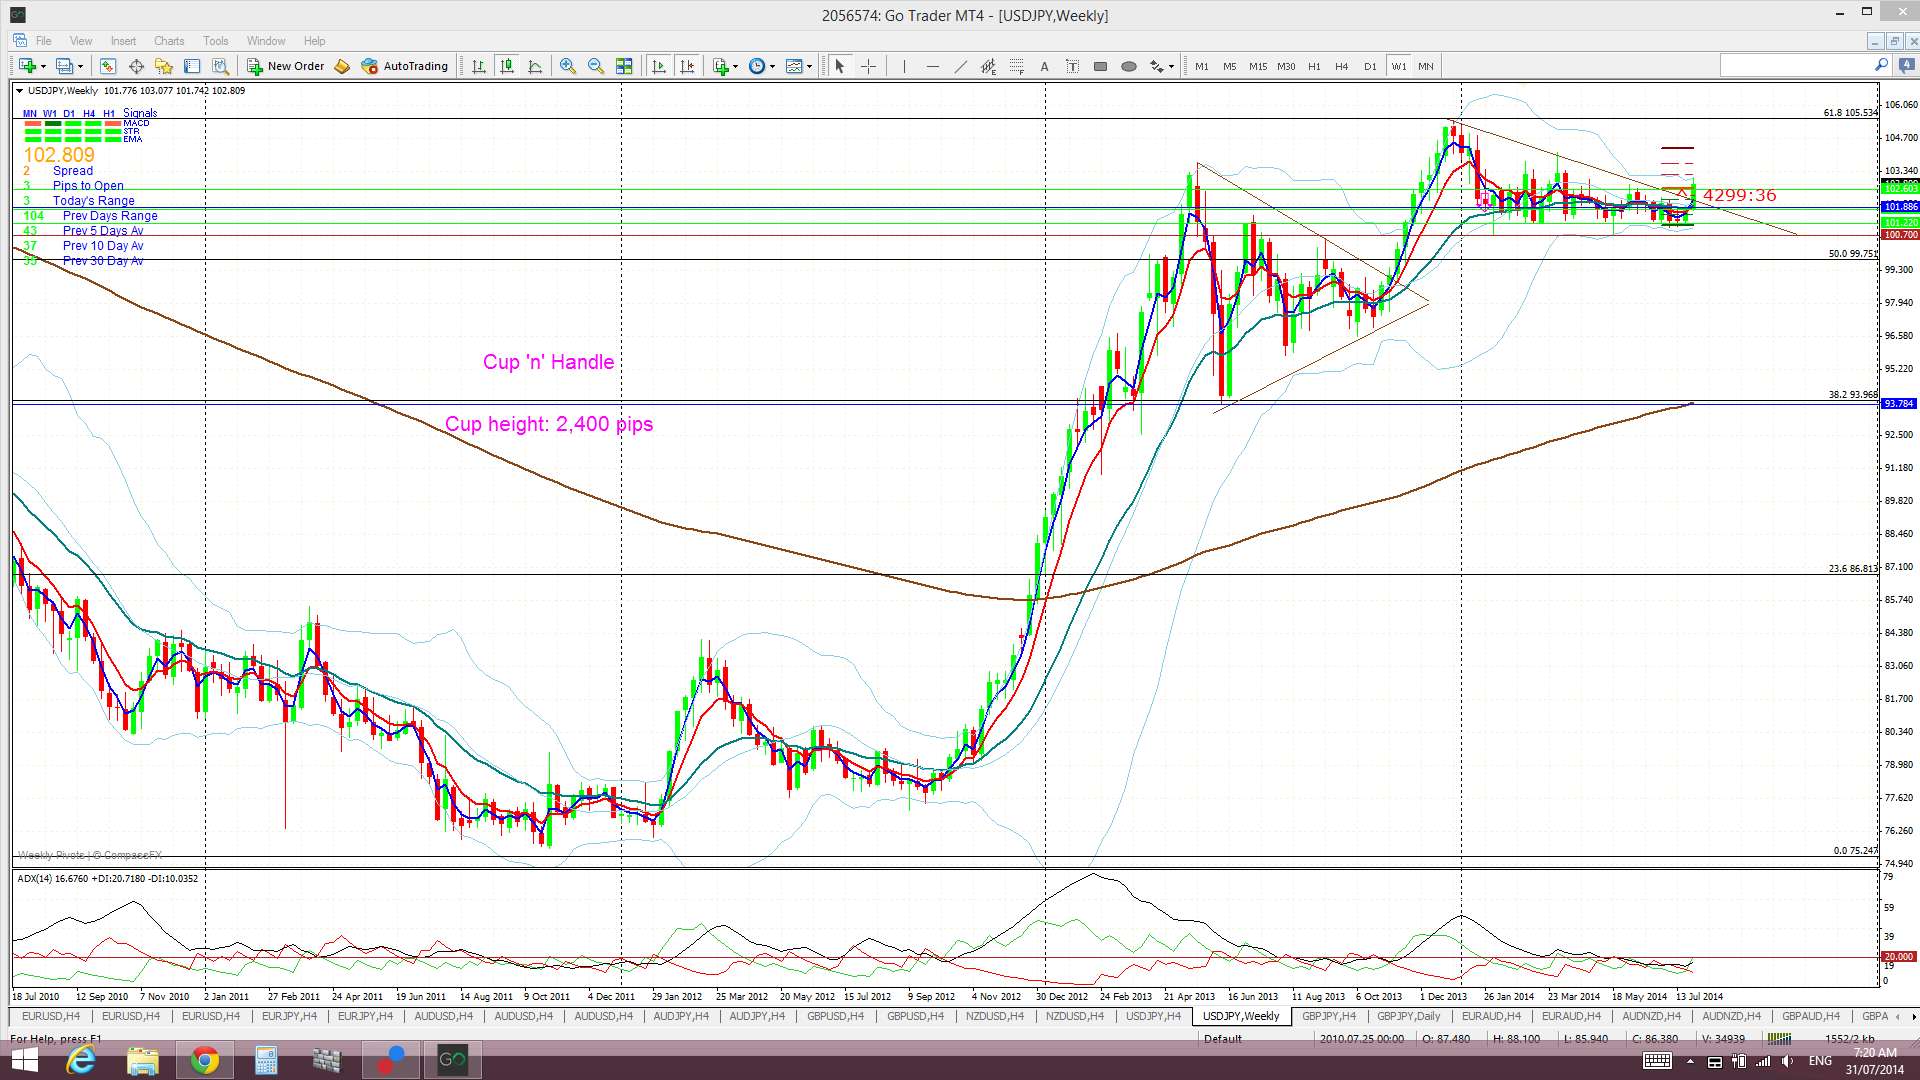
U/J monthly: that Cup ‘n Handle might be starting to get going now:
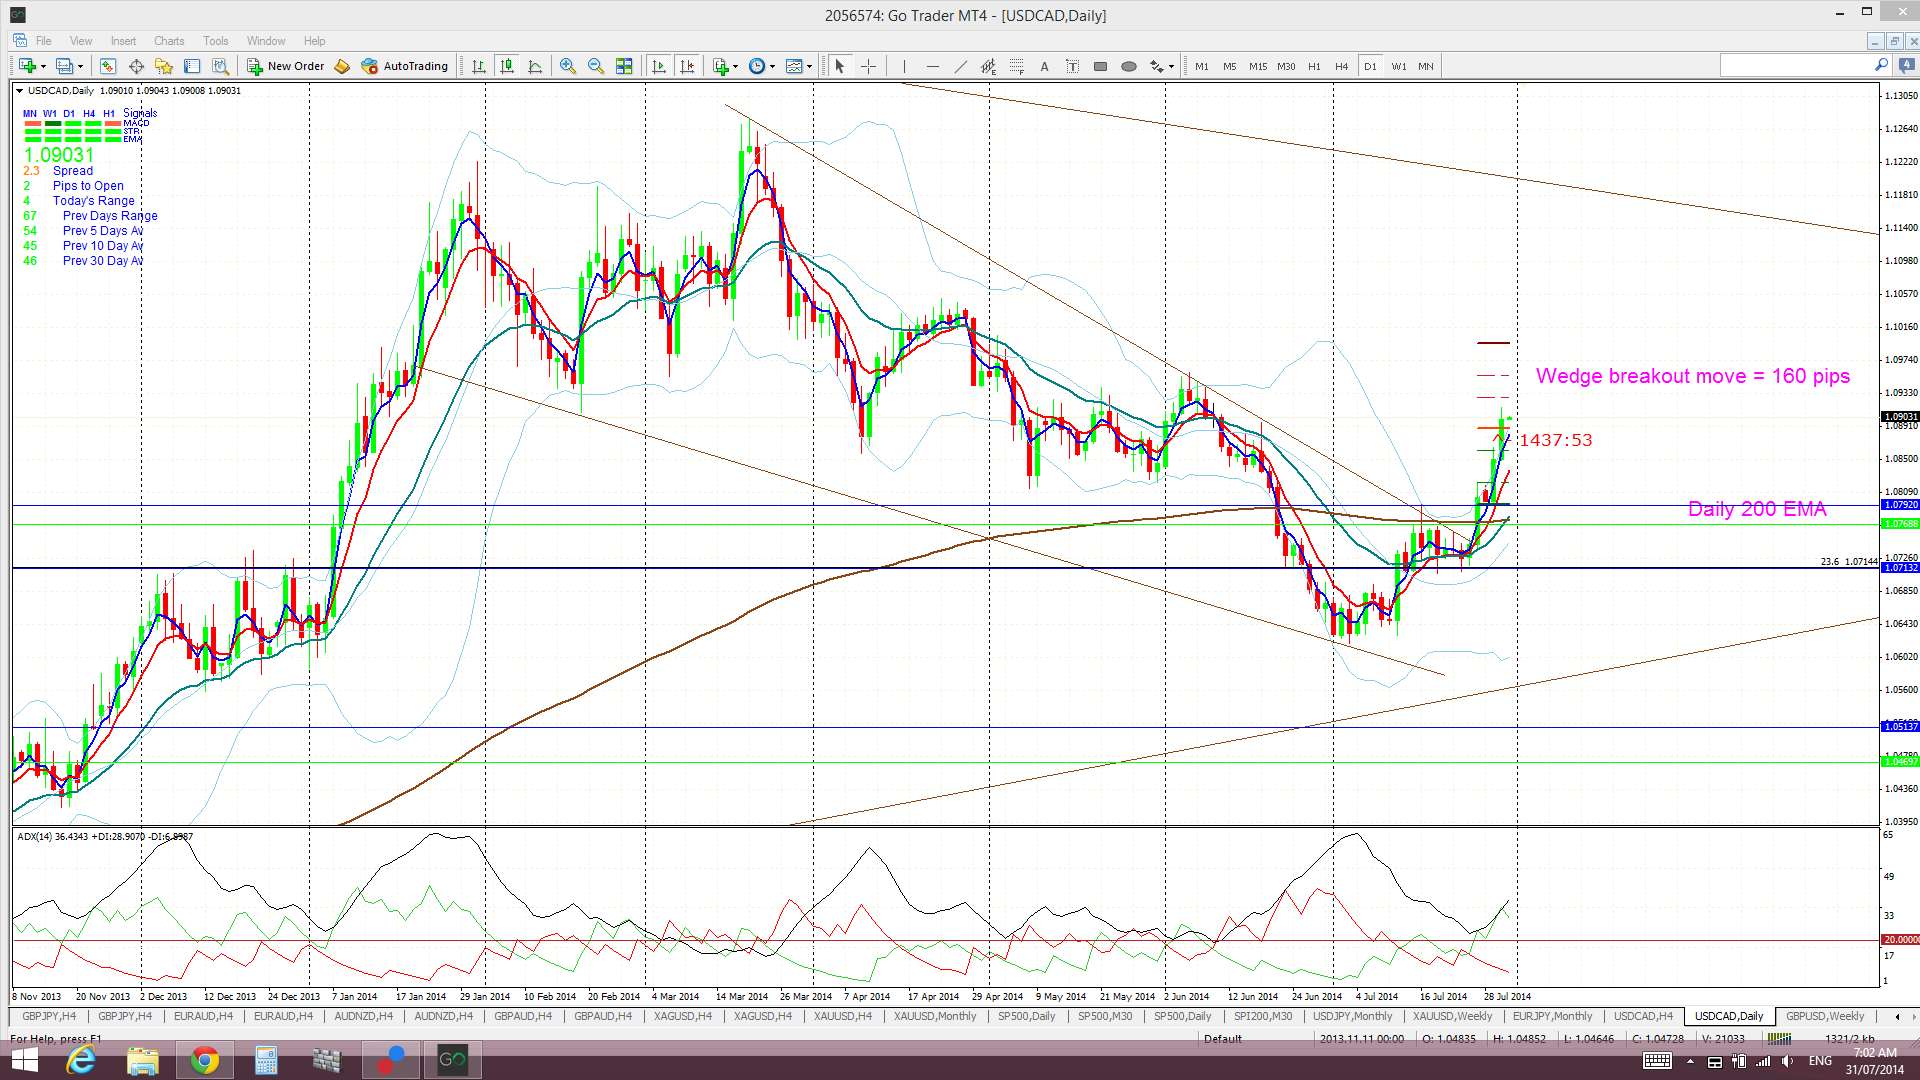
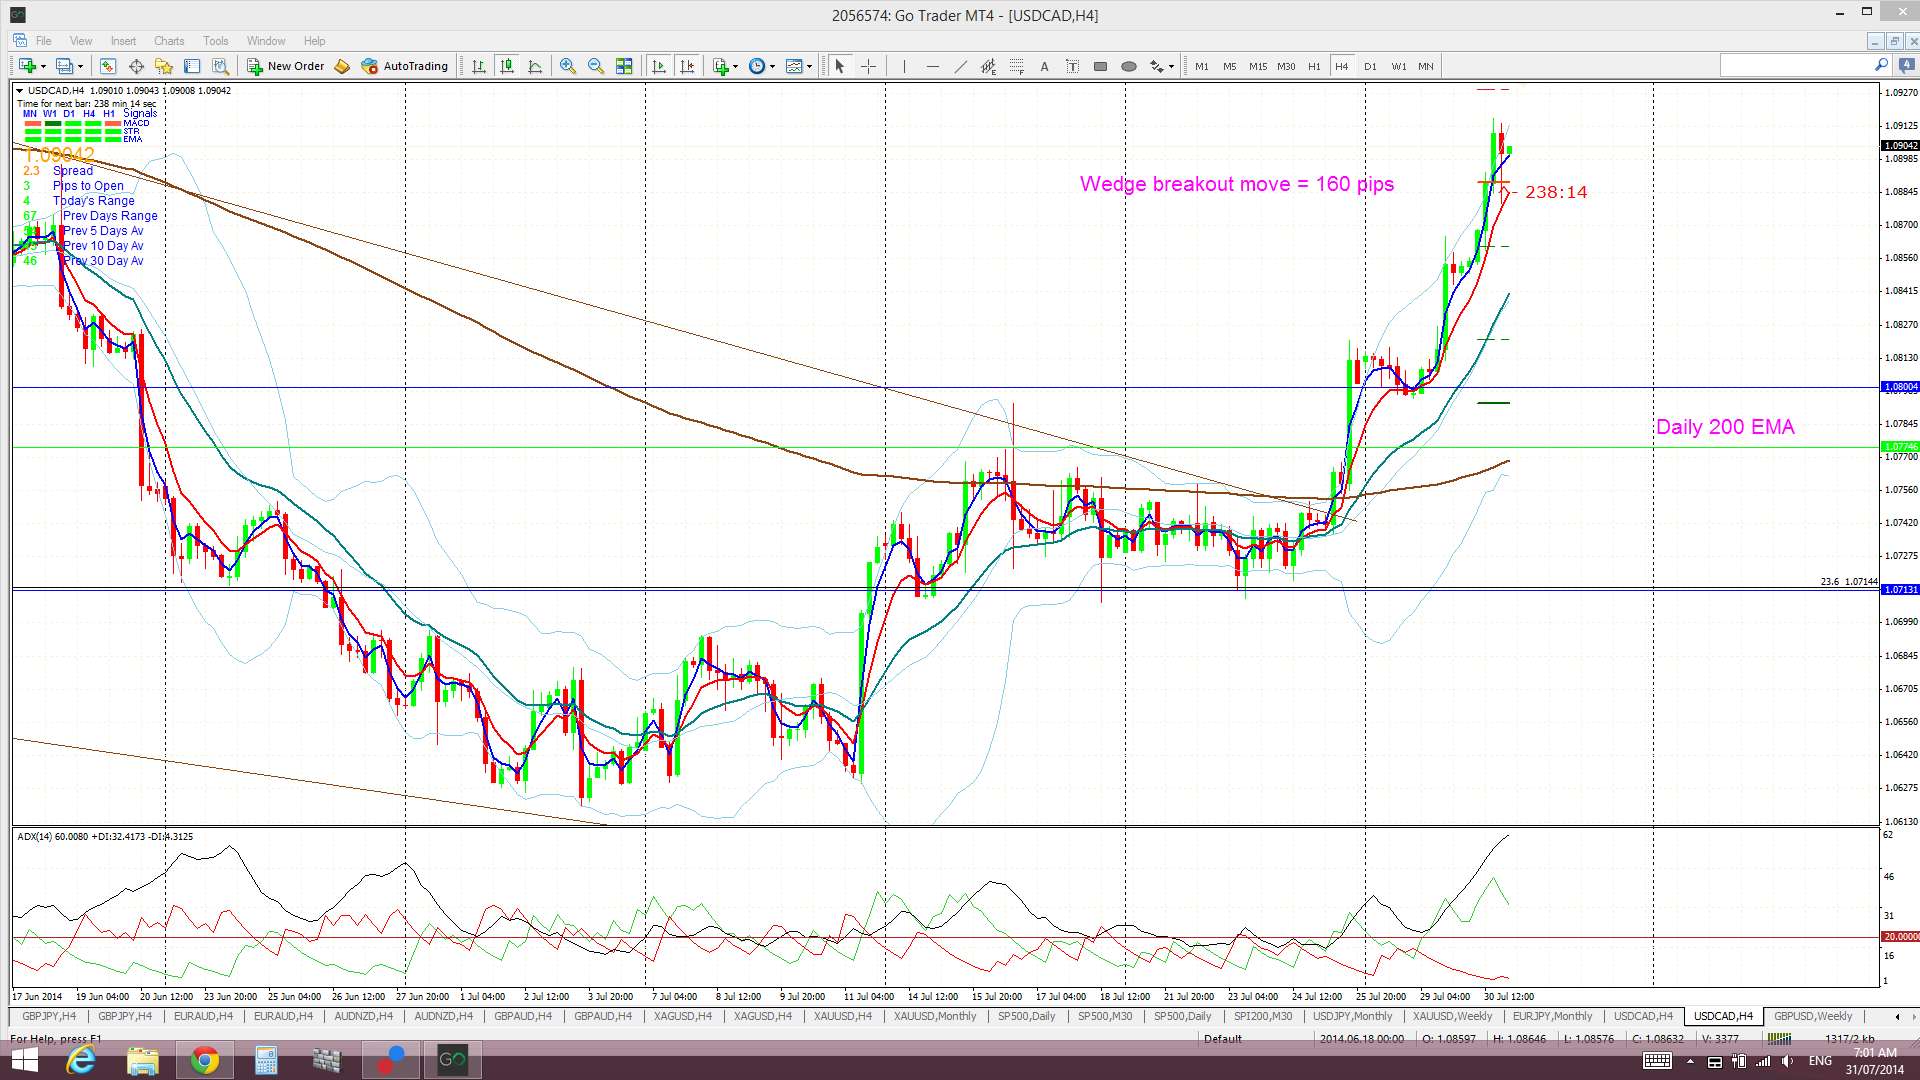
Loonie: this wedge breakout continues to deliver pips and is up 160 pips now:
Loonie daily:
Loonie 4hr:
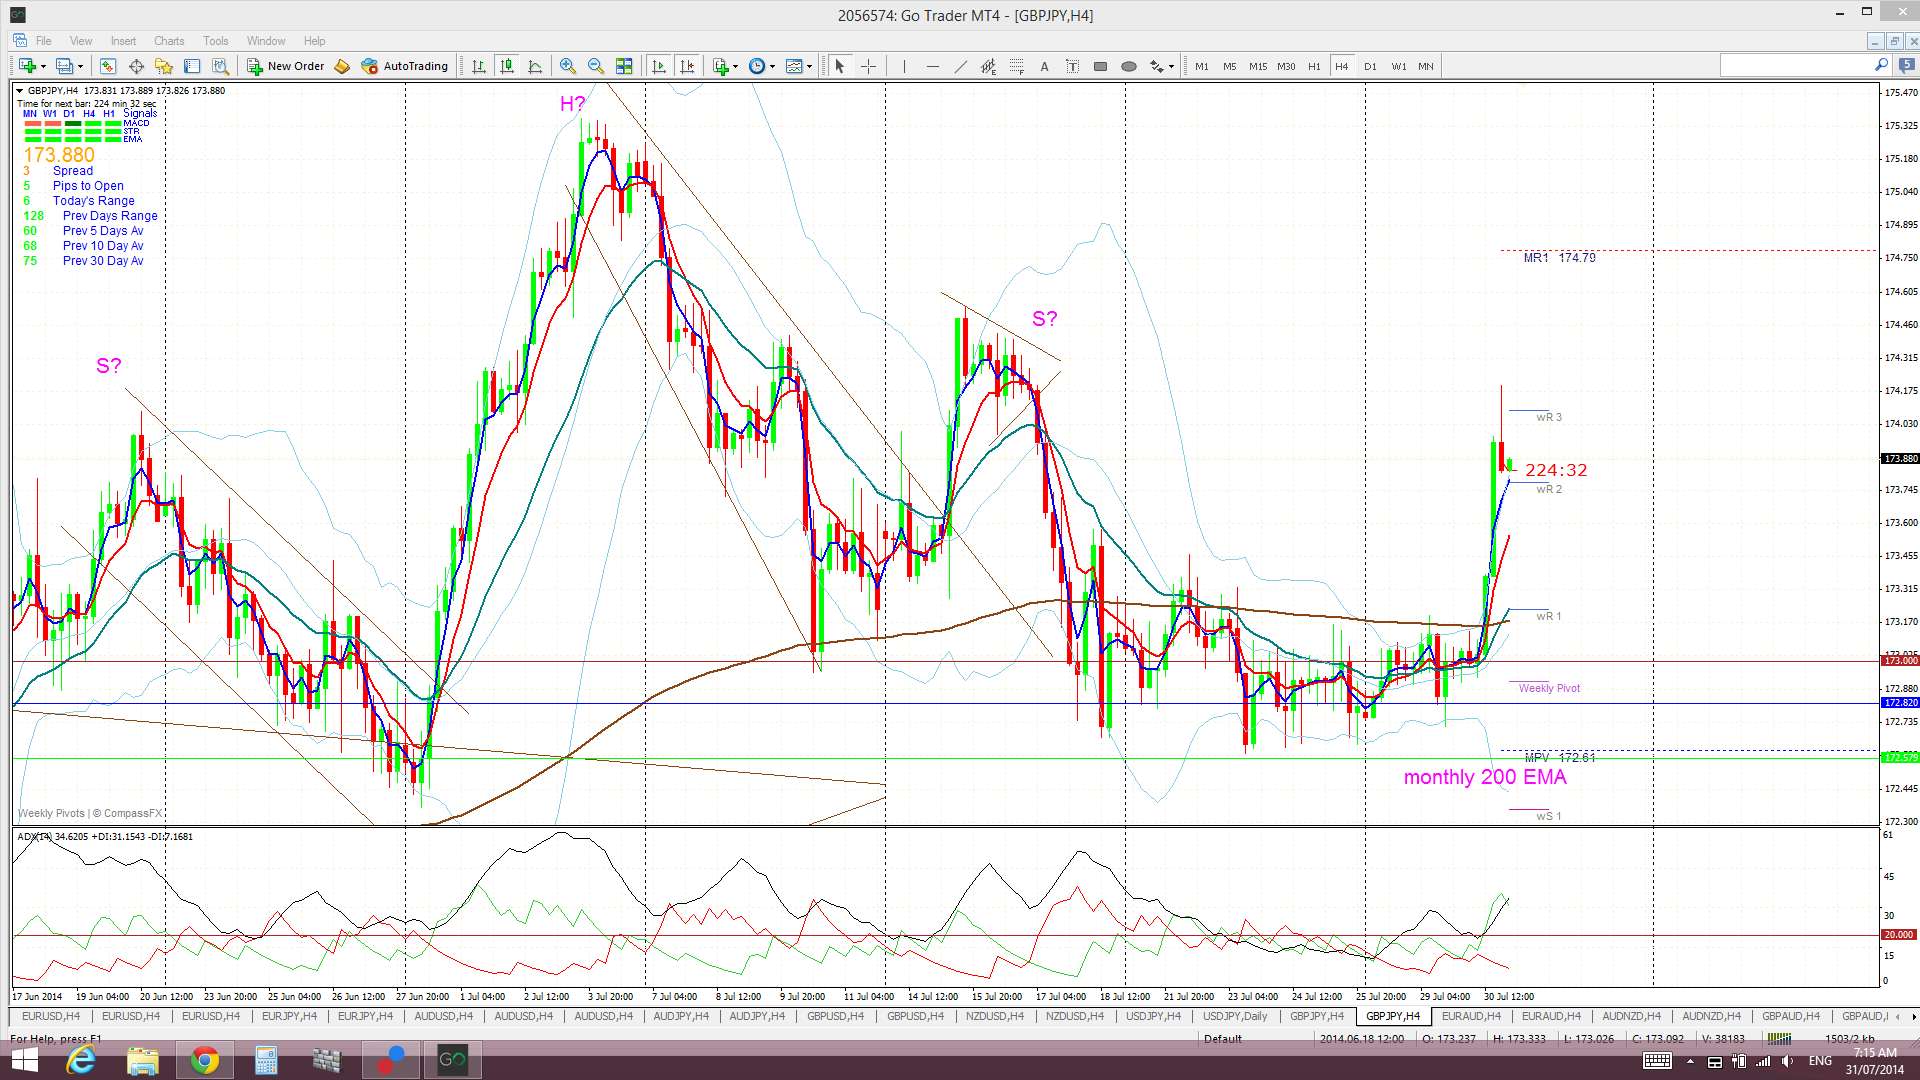
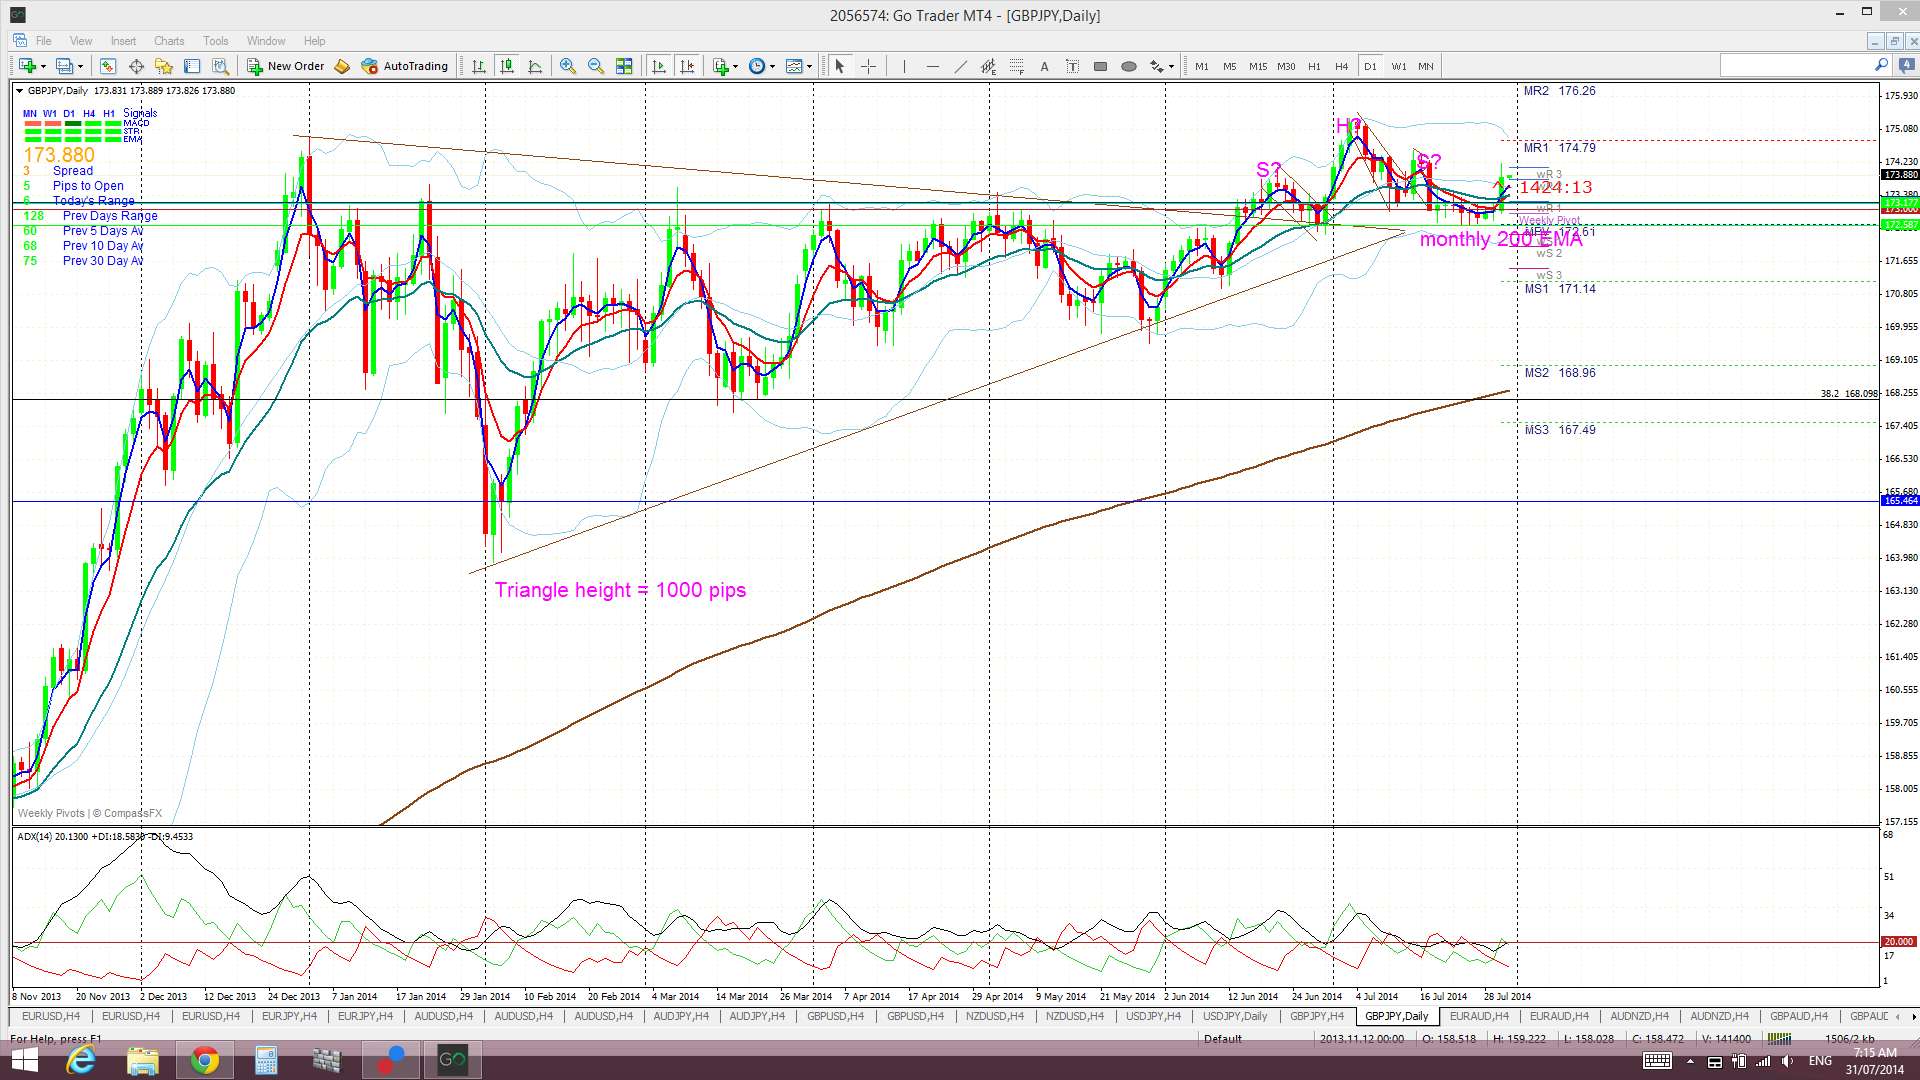
GBP/JPY: has been helped by the stronger U/J. The possible 4hr H&S may have been trumped by the daily chart’s previous bullish triangle breakout:
G/J 4hr:
G/J daily: showing the previous triangle breakout:
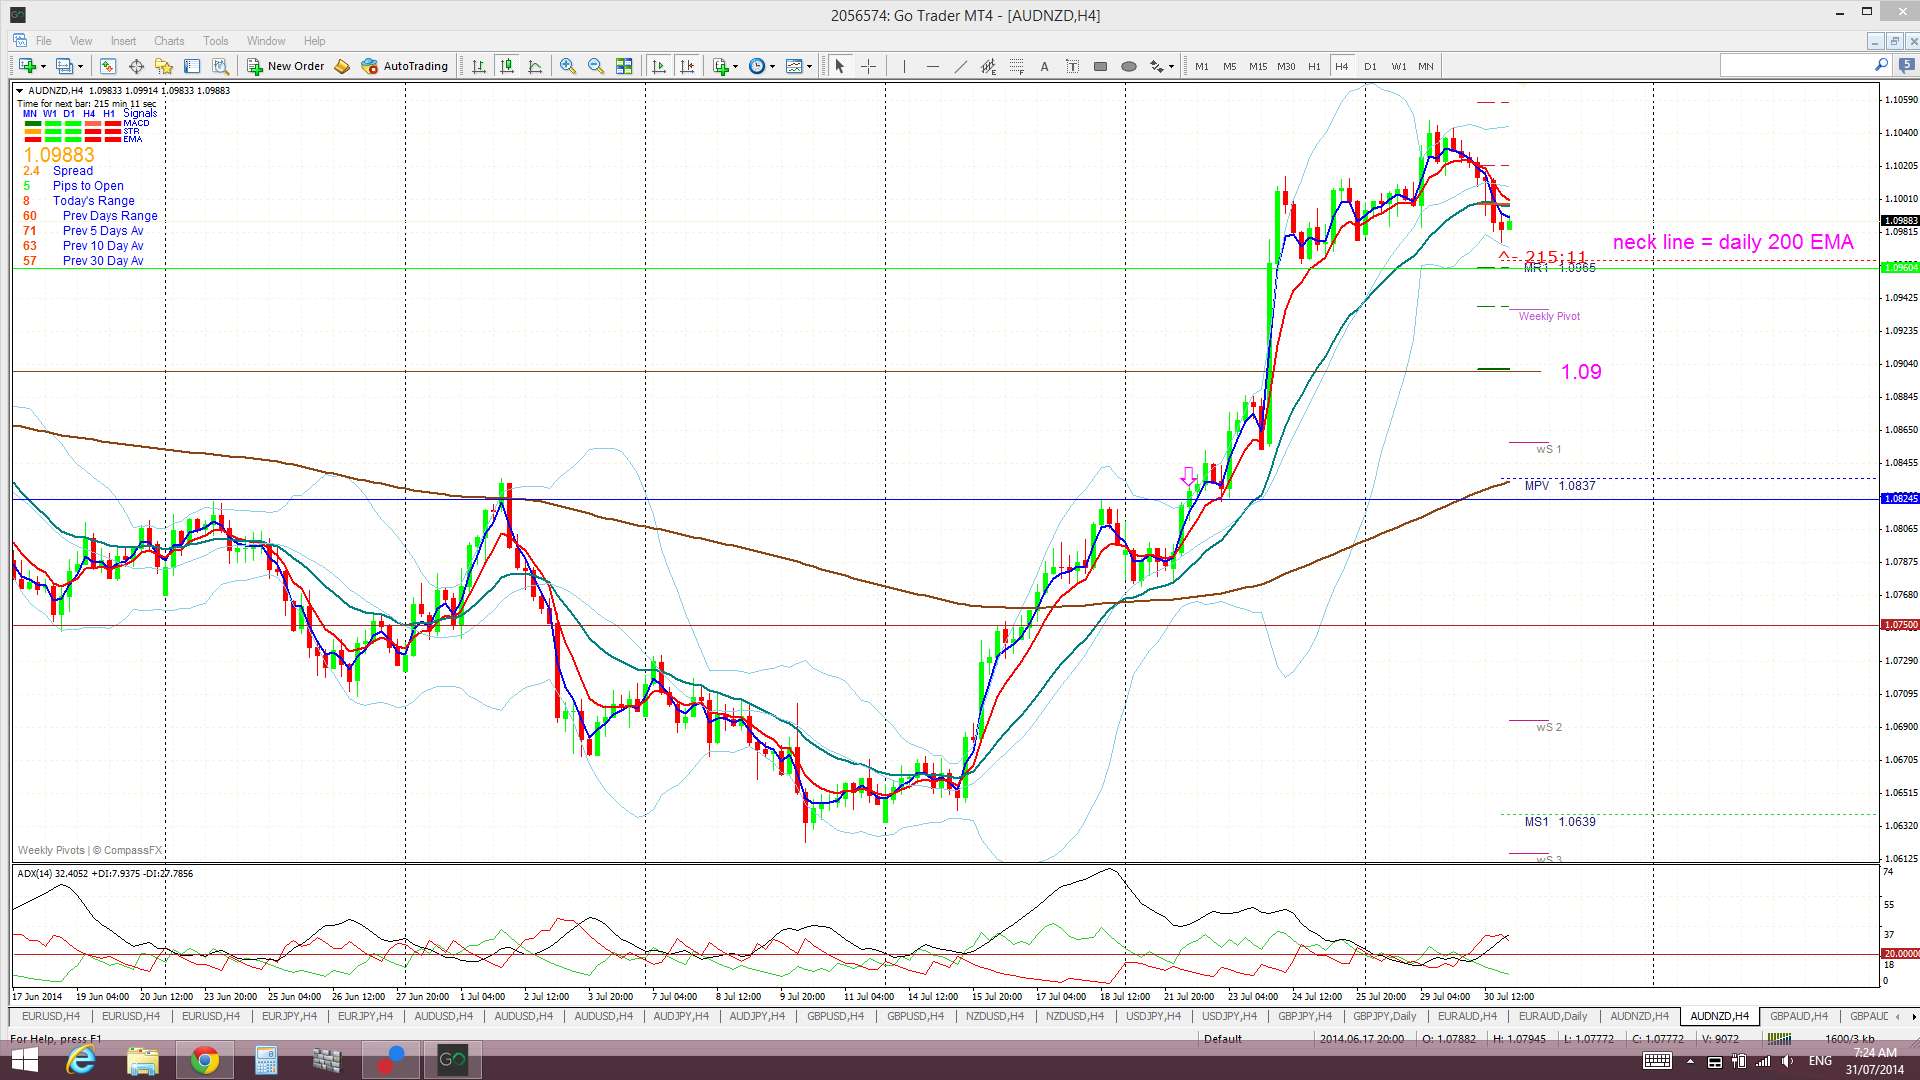
AUD/NZD: still holding above the ‘Triple Bottom’ neck line:
EUR/AUD: still channel bound:

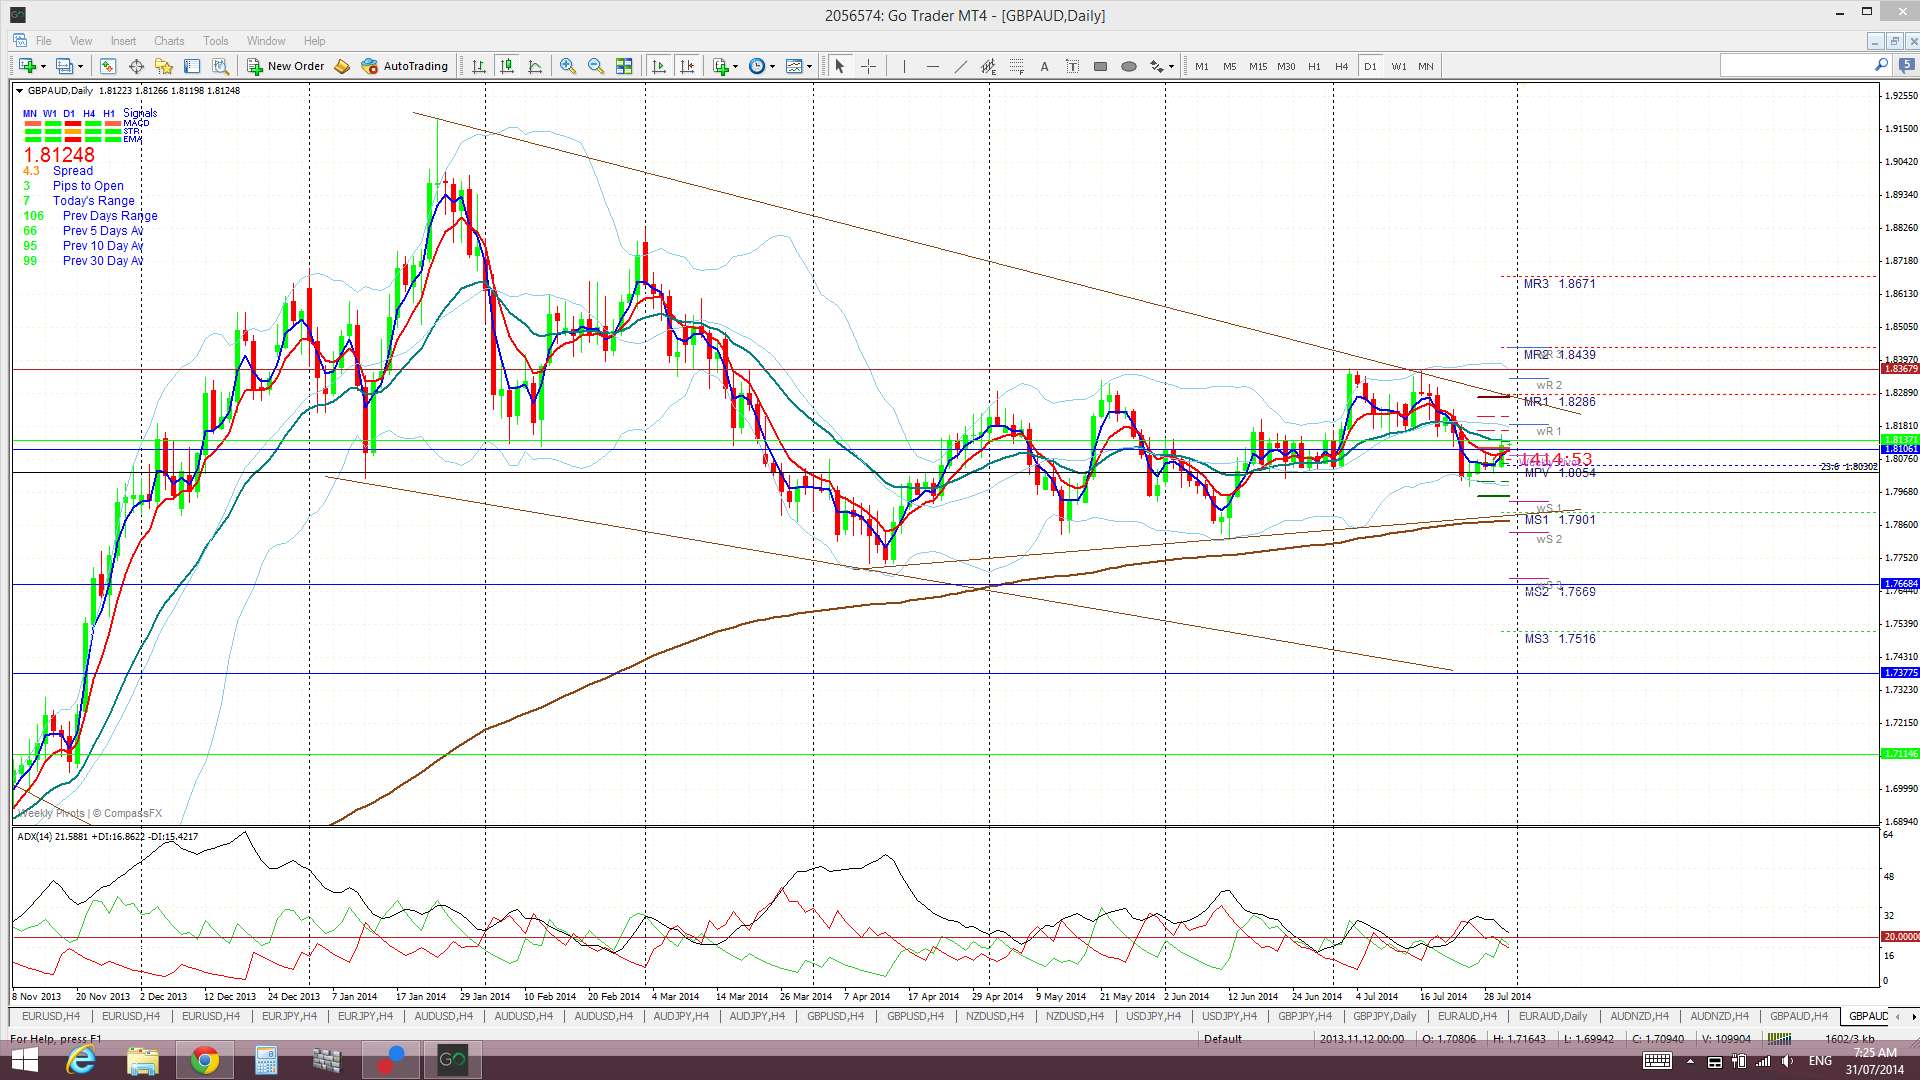
GBP/AUD: ditto here:
by