The USD/JPY has been behaving quite technically despite the unusual gyrations seen across some other trading instruments. Grexit fear has recently triggered Yen strength and this has resulted in the U/J taking a dip below the 122 S/R level. A recent trend line has held though and price has bounced up off this and is now heading back up towards the 122 level. In this post I take a look at the U/J charts and explain the key levels I consider worth monitoring as we approach the EU’s ‘Summit Sunday’.
There is increasing talk that a Greek-debt deal will most likely be brokered this w/e at the EU Summit. Any ‘deal’ may result in Yen strength waning and this would then help to support the USD/JPY. There are no trading guarantees of course but there are distinct support and resistance levels on the U/J that I will be watching to help me gauge the next significant directional move with this pair.
NB: I am holding off on my usual detailed weekend reviews until after either this weekend’s EU Summit or, if that fails, until after July 20th.
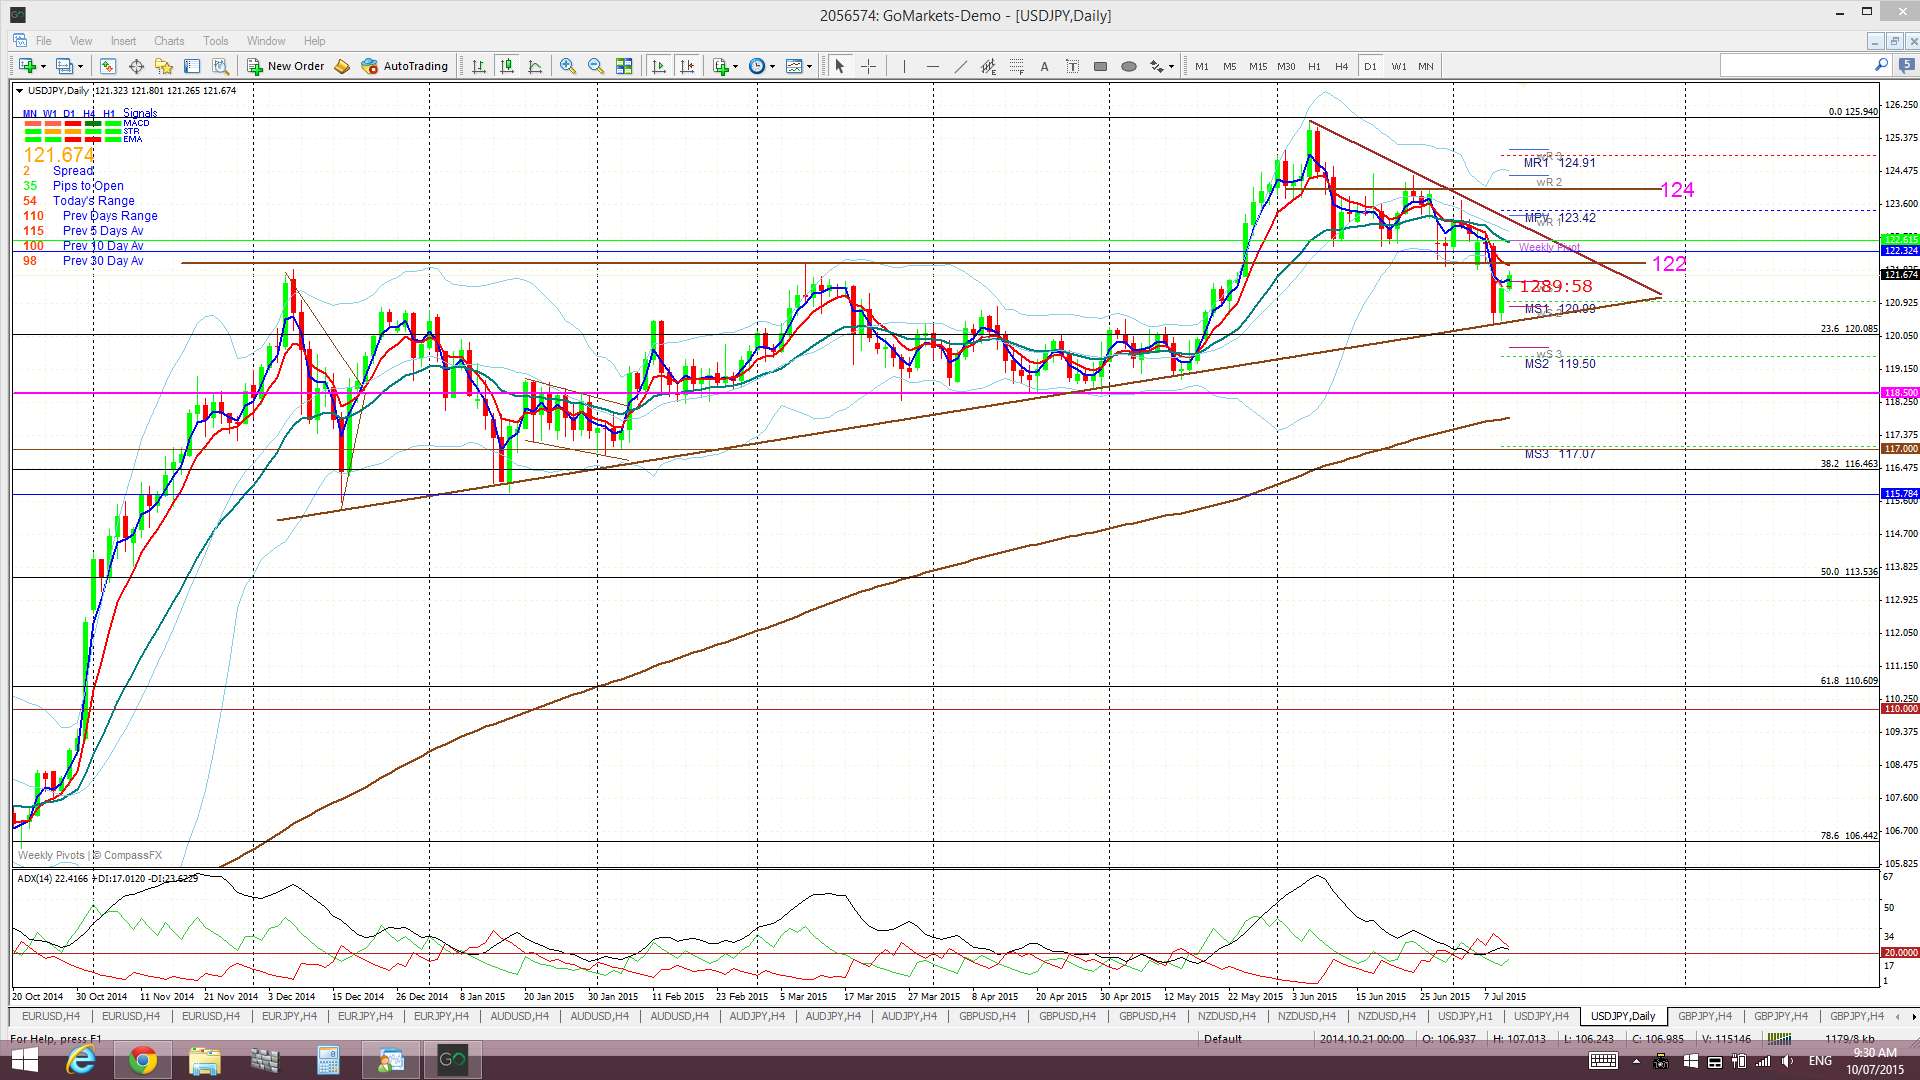
U/J daily: price has bounced up off trend line/triangle support and looks headed to test the recent 122 S/R level. For now though, price action is still range bound within a triangle pattern:
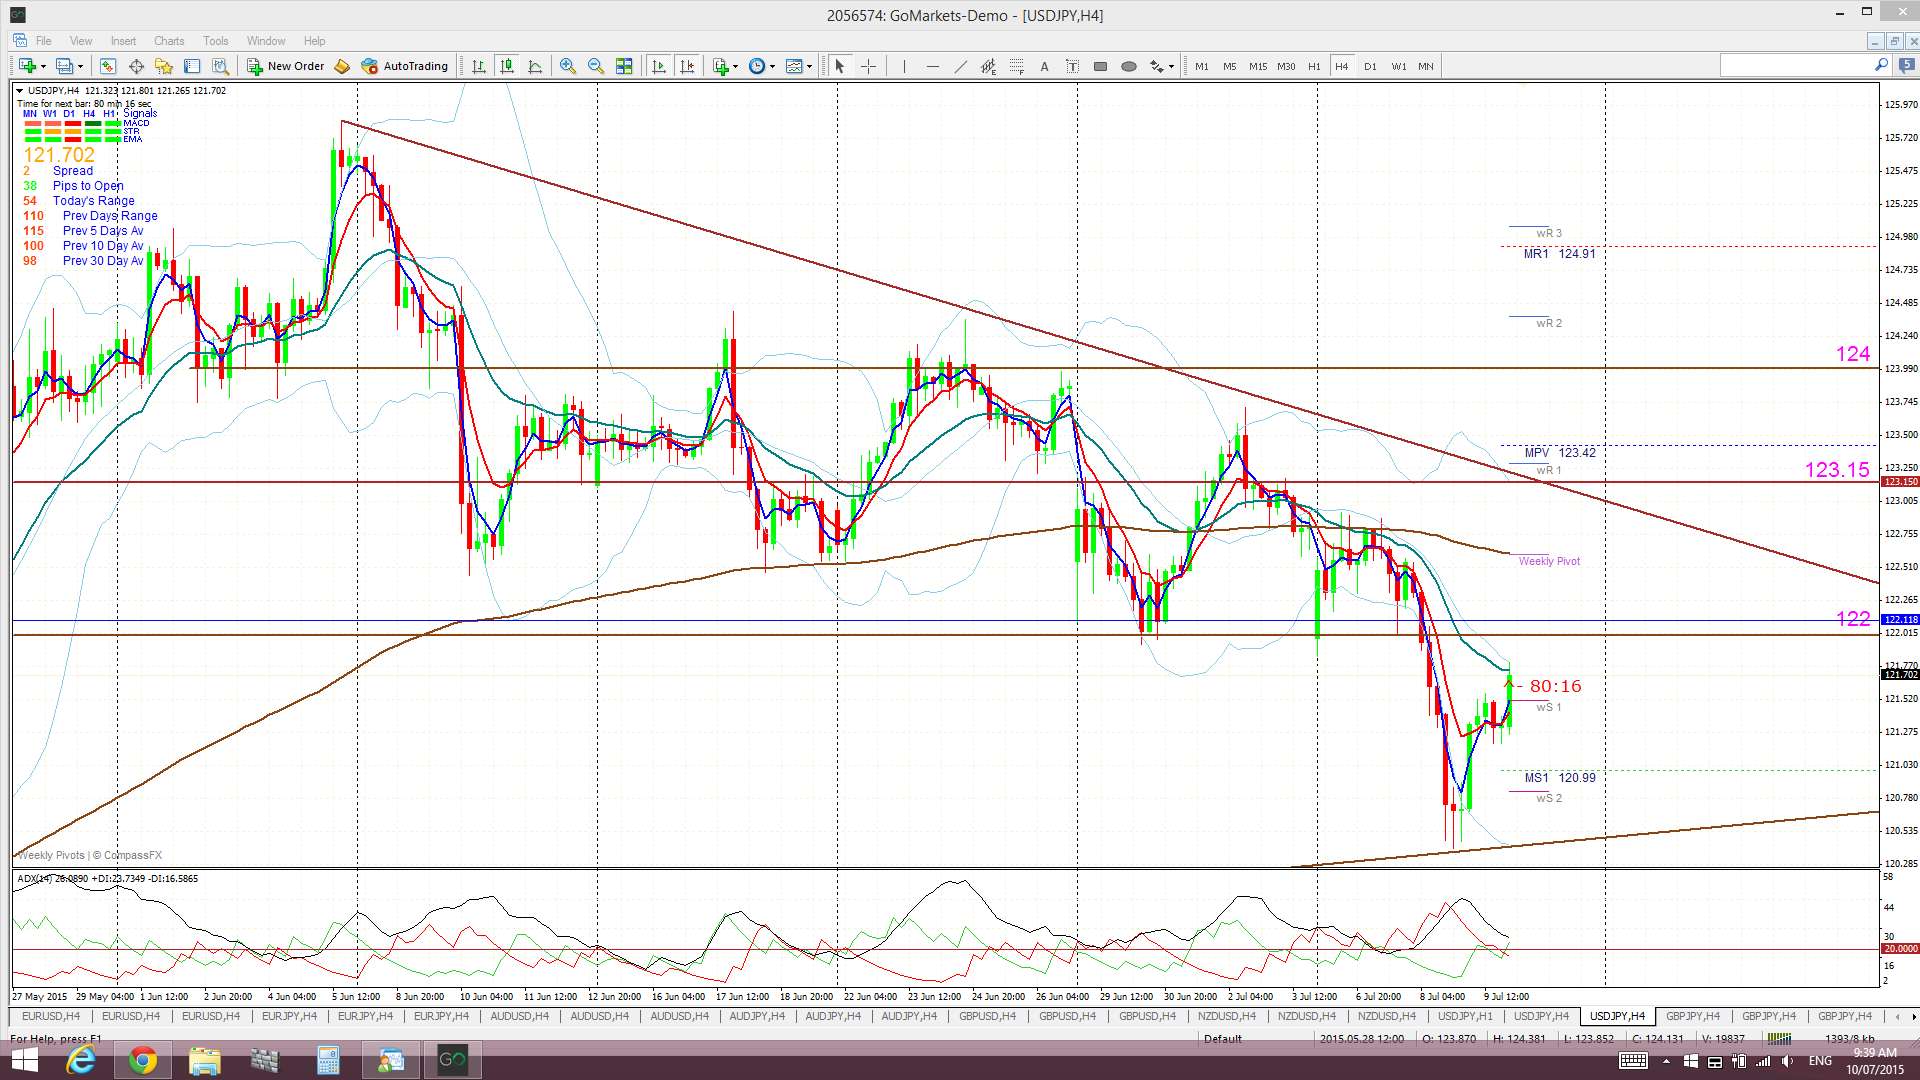
U/J 4hr Cloud: price is below the 4hr Cloud for now so any new TC signal would need to wait until such time as price was back above the Cloud. The top of the 4hr Cloud sits roughly near 123.15:

U/J 4hr: Price is still below 122 for now but any move and hold back above this level would be bullish. Note how the top of the 4hr Cloud region of 123.15 aligns near the bear triangle trend line. Some traders would be looking to LONG on a break and hold above 122 but others might wait for any break above the 4hr Cloud and bear trend line. Both levels are worth monitoring:
U/J weekly: A failure to broker a satisfactory Greek-debt solution after Sunday might see Yen strength continue and, if so, the support triangle trend line may come back under pressure. Any close and hold below this triangle trend line may suggest a deeper pullback and fibs placed on the last major swing high move put the 61.8% fib down near the previous S/R level of 110. Thus, any increased Grexit fear and bearish move on the U/J may target the 110 key S/R level:

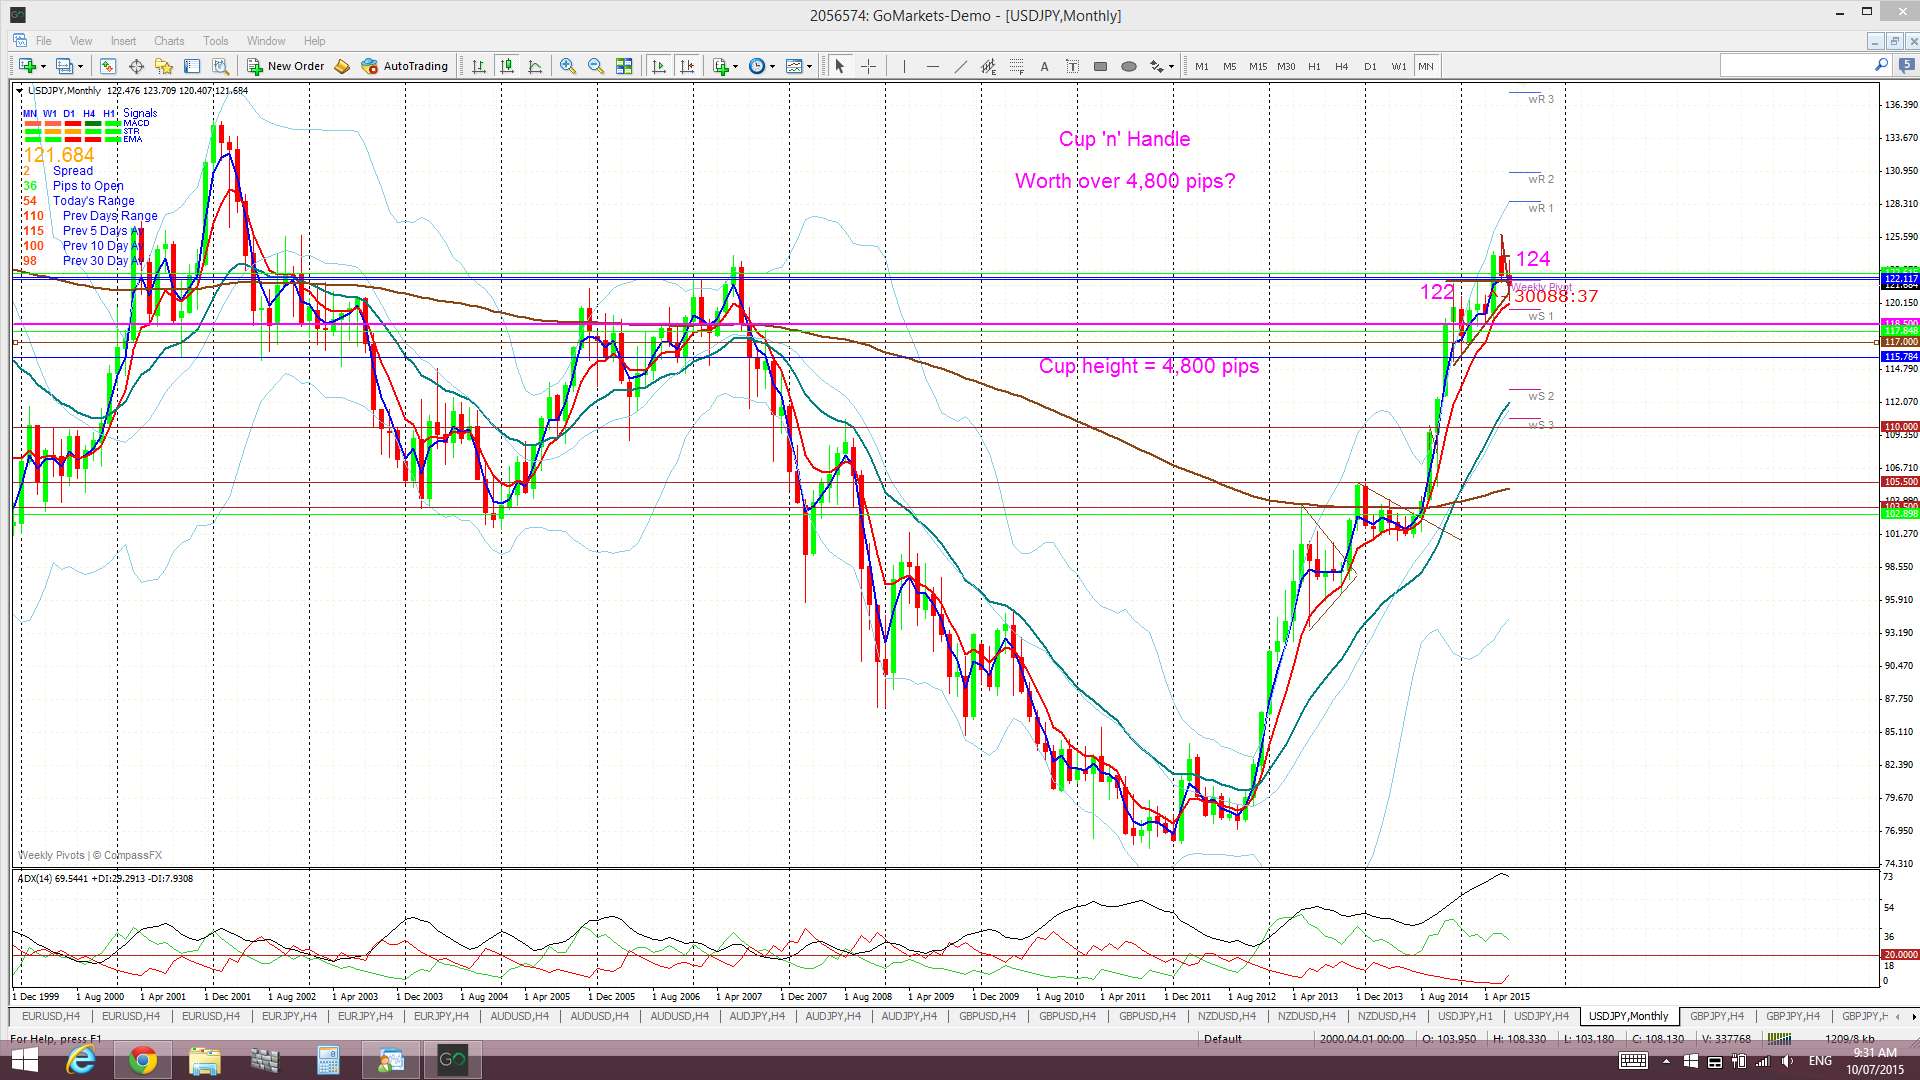
U/J monthly: the monthly chart continues to show a major ‘Cup’ pattern forming up and so I am conscious that this pair could be in for a period of extended sideways chop in the formation of any ‘Handle’ to add on to this ‘Cup’. It is worth noting that Cup ‘n’ Handle are overall continuation patterns and in this context, thus, bullish:
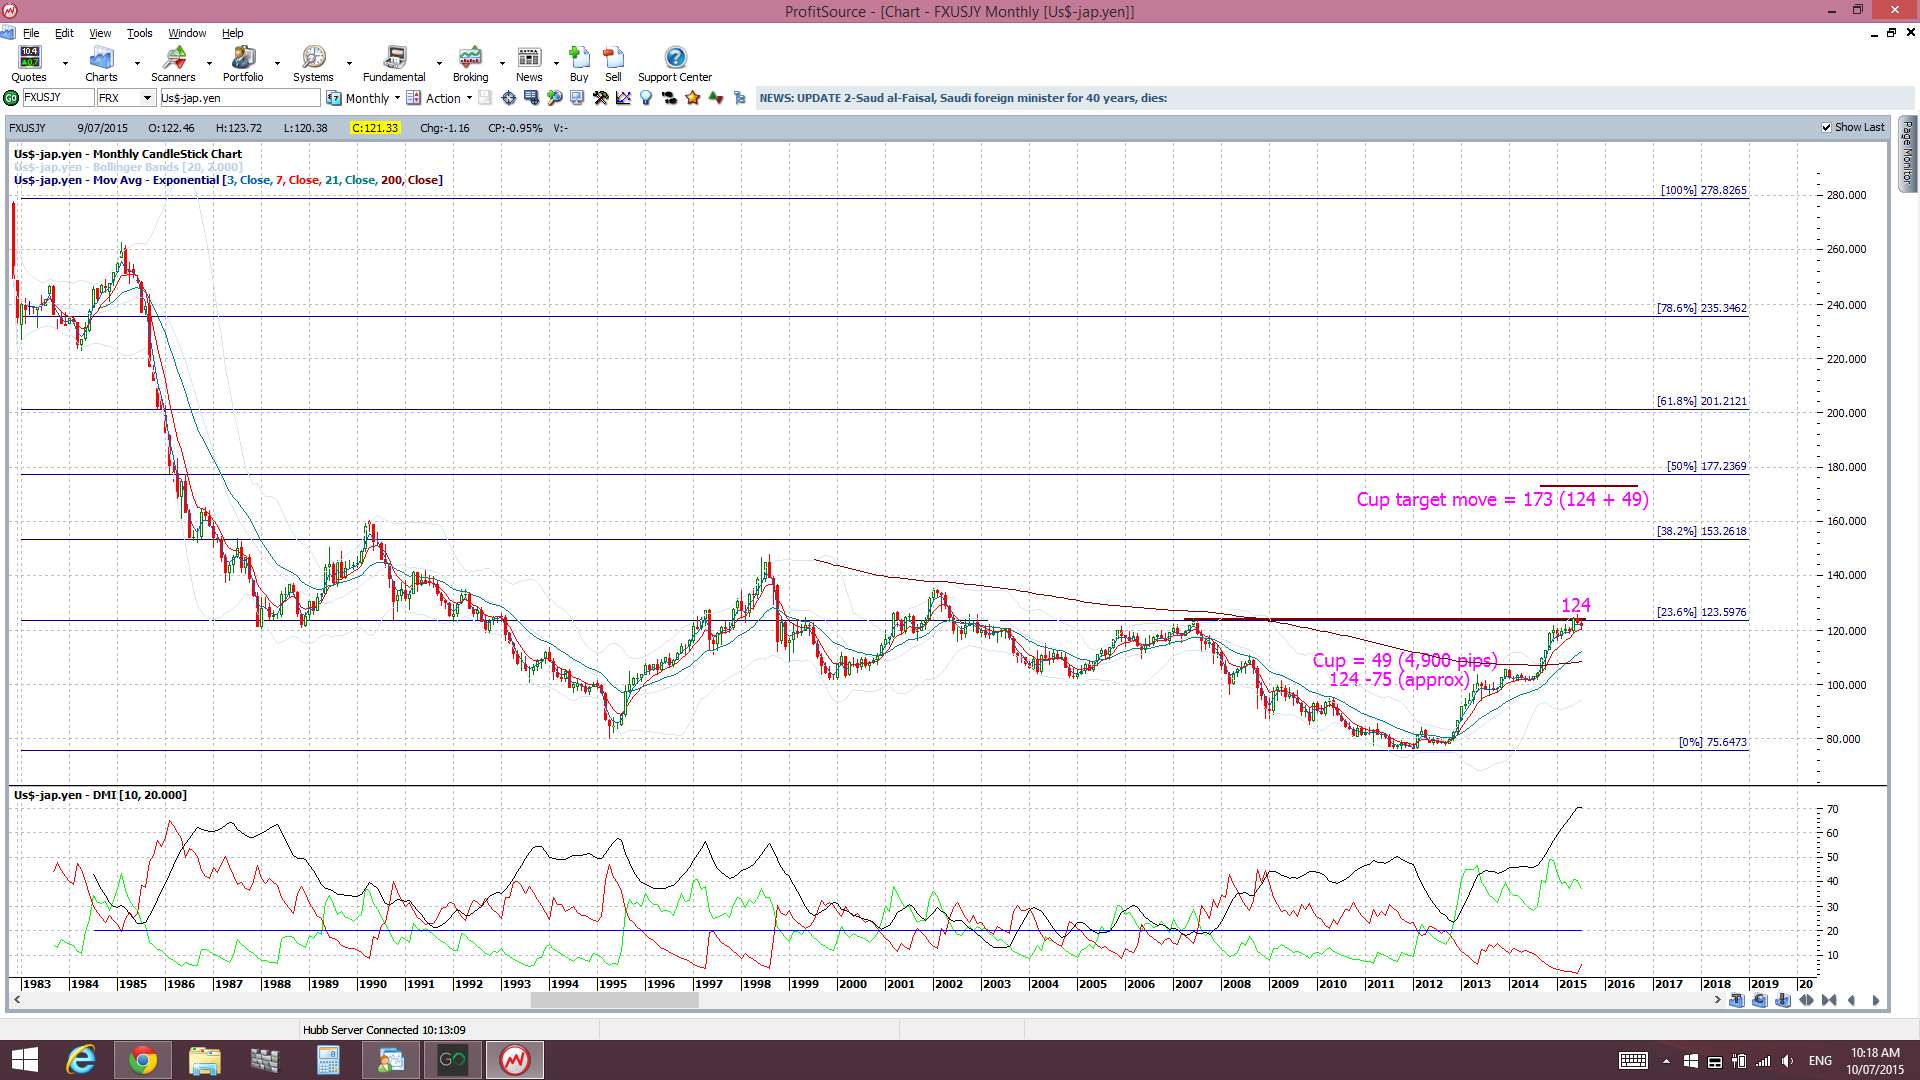
U/J monthly longer term: this monthly chart captures more data and the 124 level can be seen to be a decent S/R level here as far back as 1987. Thus, some extended volatility around this level would not be a surprise:
Summary: The U.J remains trading within a triangle pattern and traders should watch for any trend line breakout to help determine the next directional move with the U/J. This weekend’s EU Summit may end up providing the news to trigger a breakout. The key levels to watch on the U/J are summarised below:
- the bear triangle trend line.
- the support triangle trend line.
- the 122 and 124 levels.
- the top of the 4hr Cloud: currently near 123.15 and also near the bear triangle trend line.
The post USD/JPY: getting interesting as ‘Summit Sunday’ approaches. appeared first on www.forextell.com.