USDX
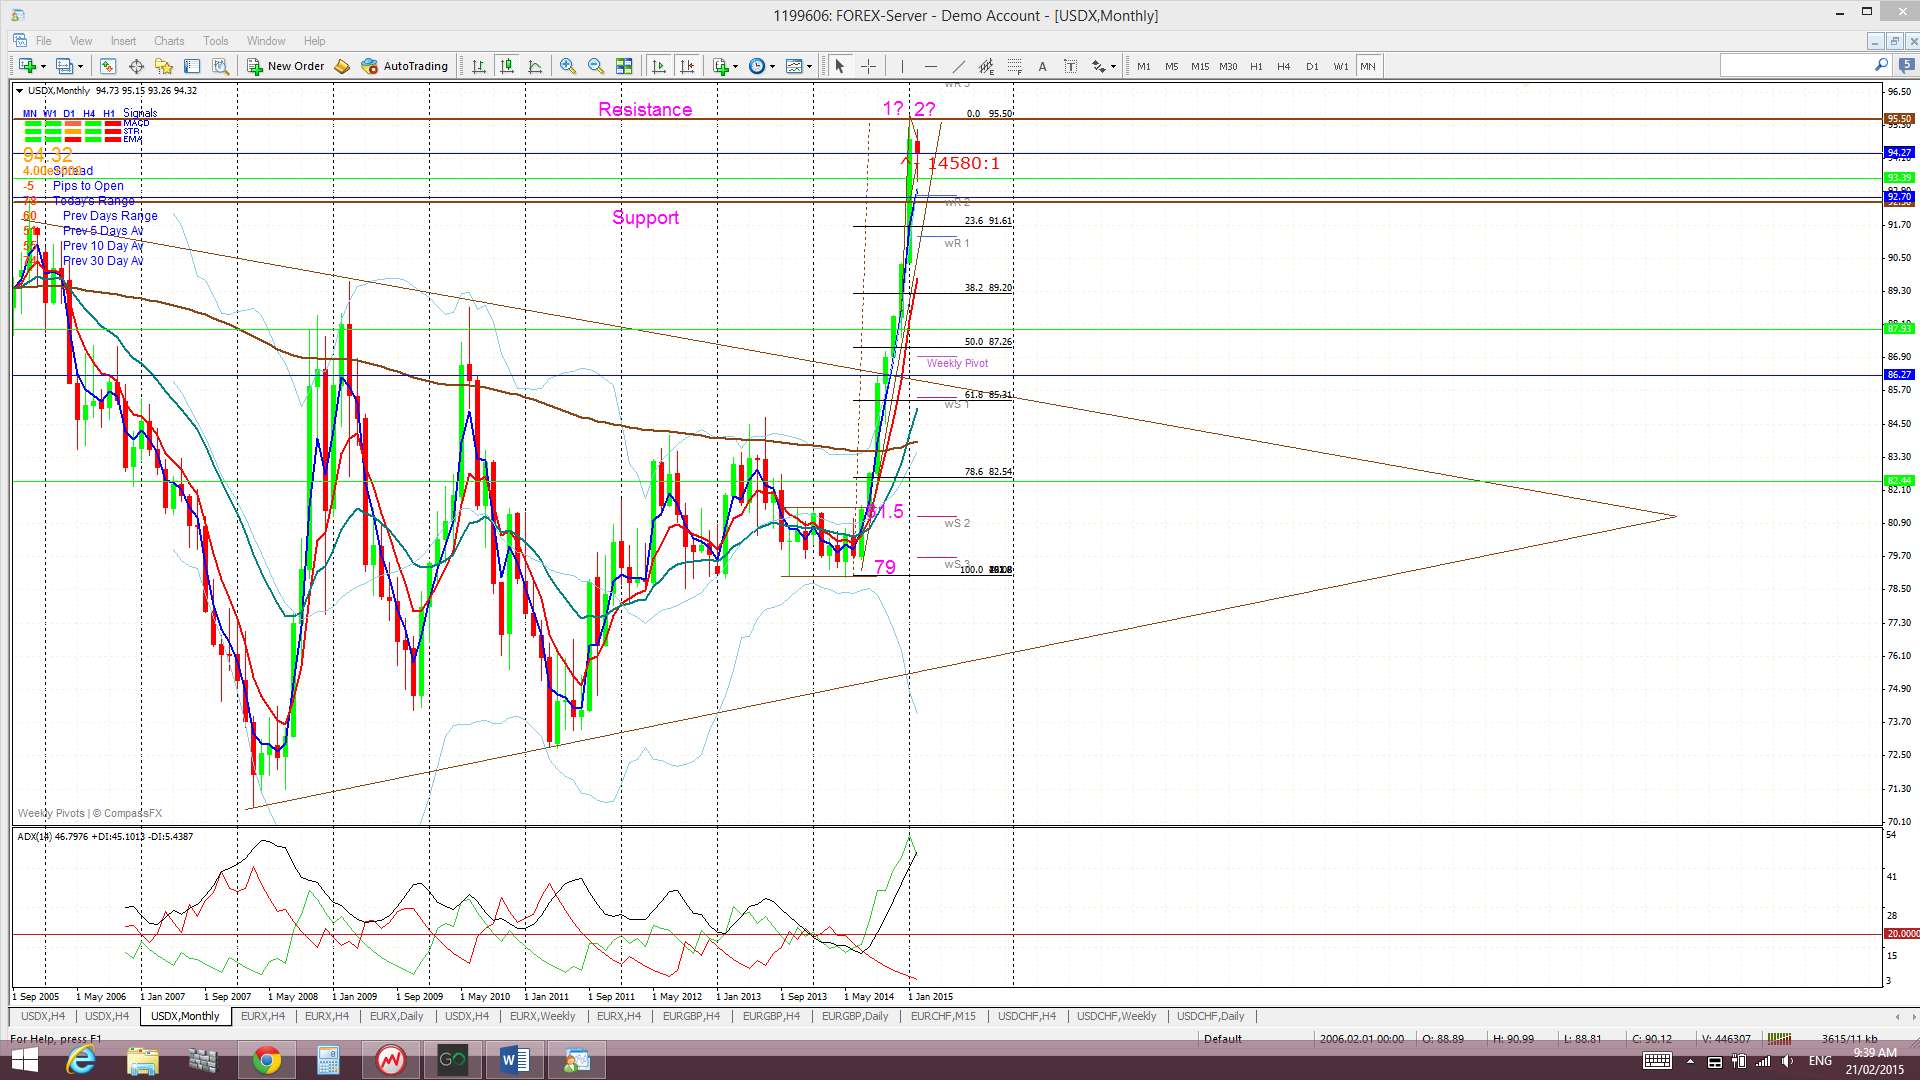
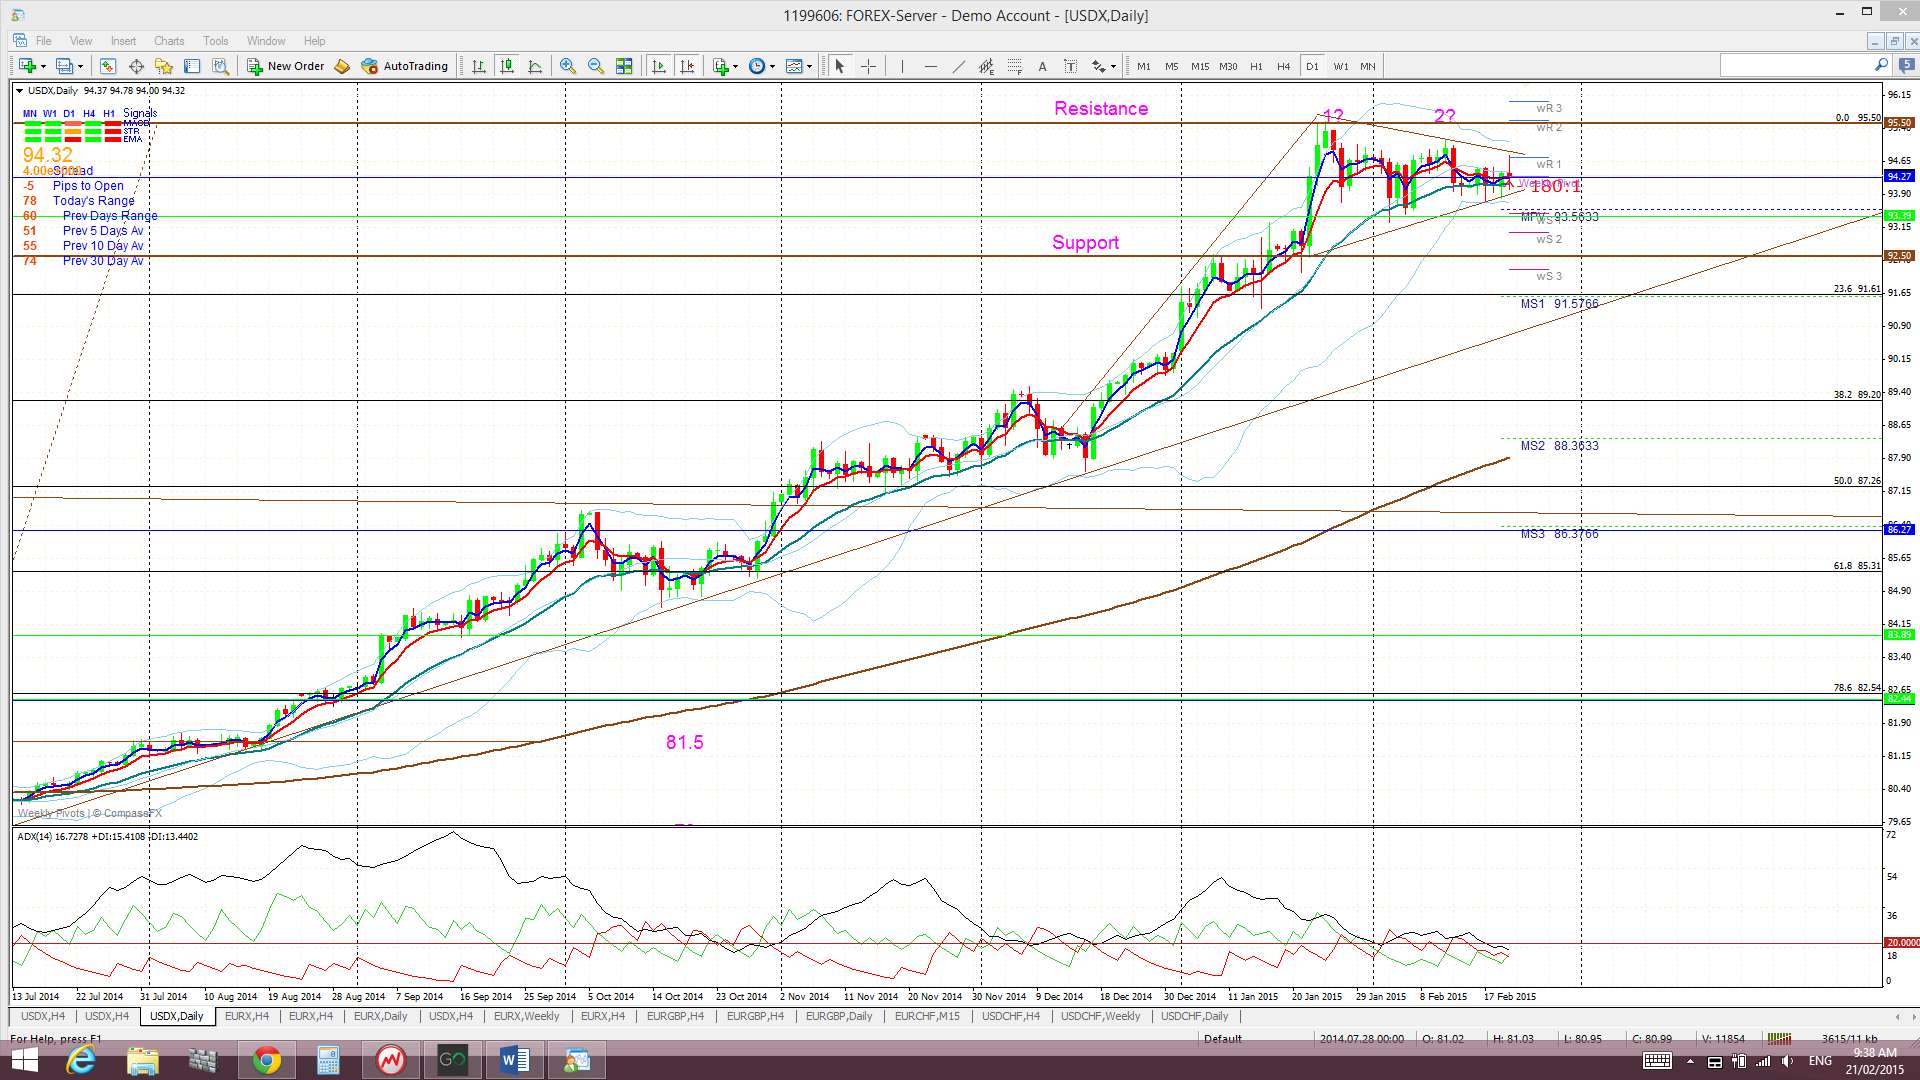
Monthly: The February candle is printing a bearish coloured ‘Hanging Man’ but still trading between the key S/R levels of 92.50 and 95.50.
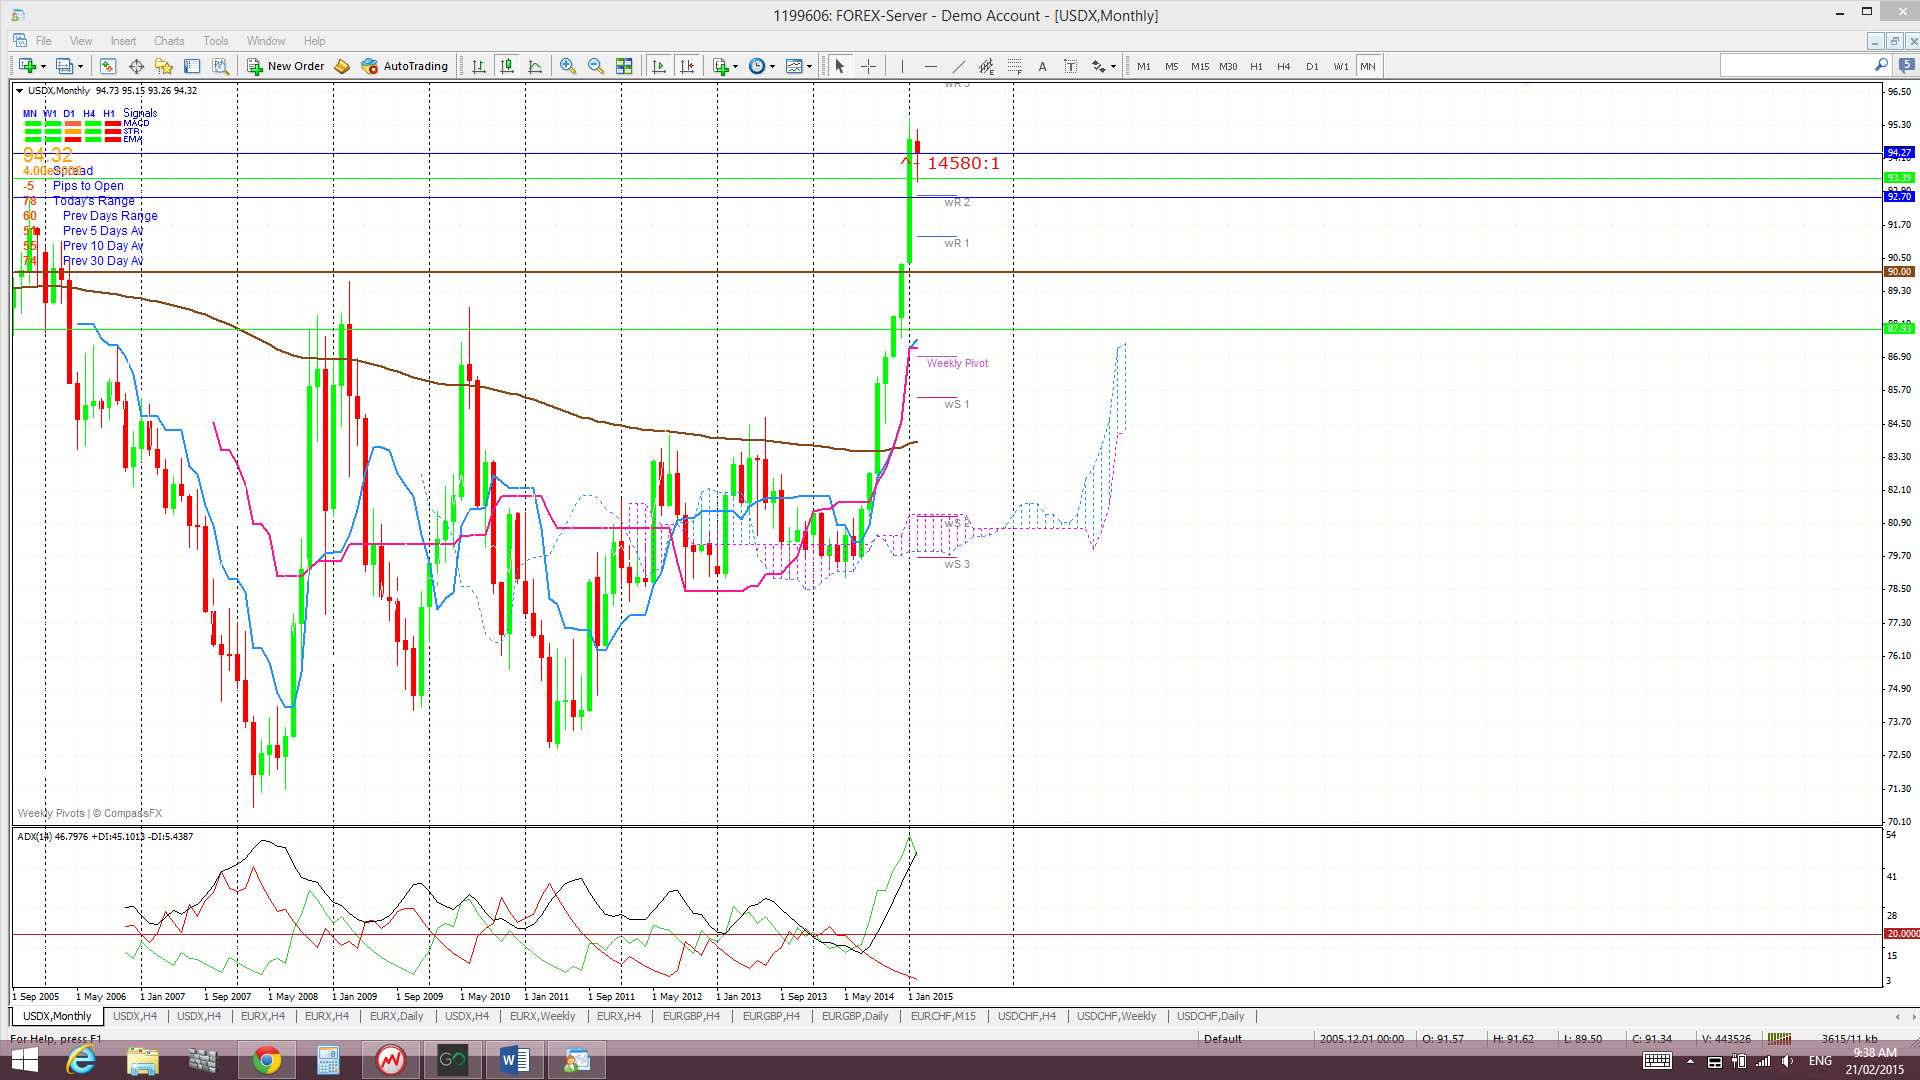
Monthly Ichimoku: The February candle is well above the monthly Cloud.
Weekly: Last week’s candle closed as a bullish coloured ‘Spinning Top’. It is worth keeping note of the fact that a 61.8% pull back would bring price down to near the broken trend line of the monthly chart’s triangle pattern.
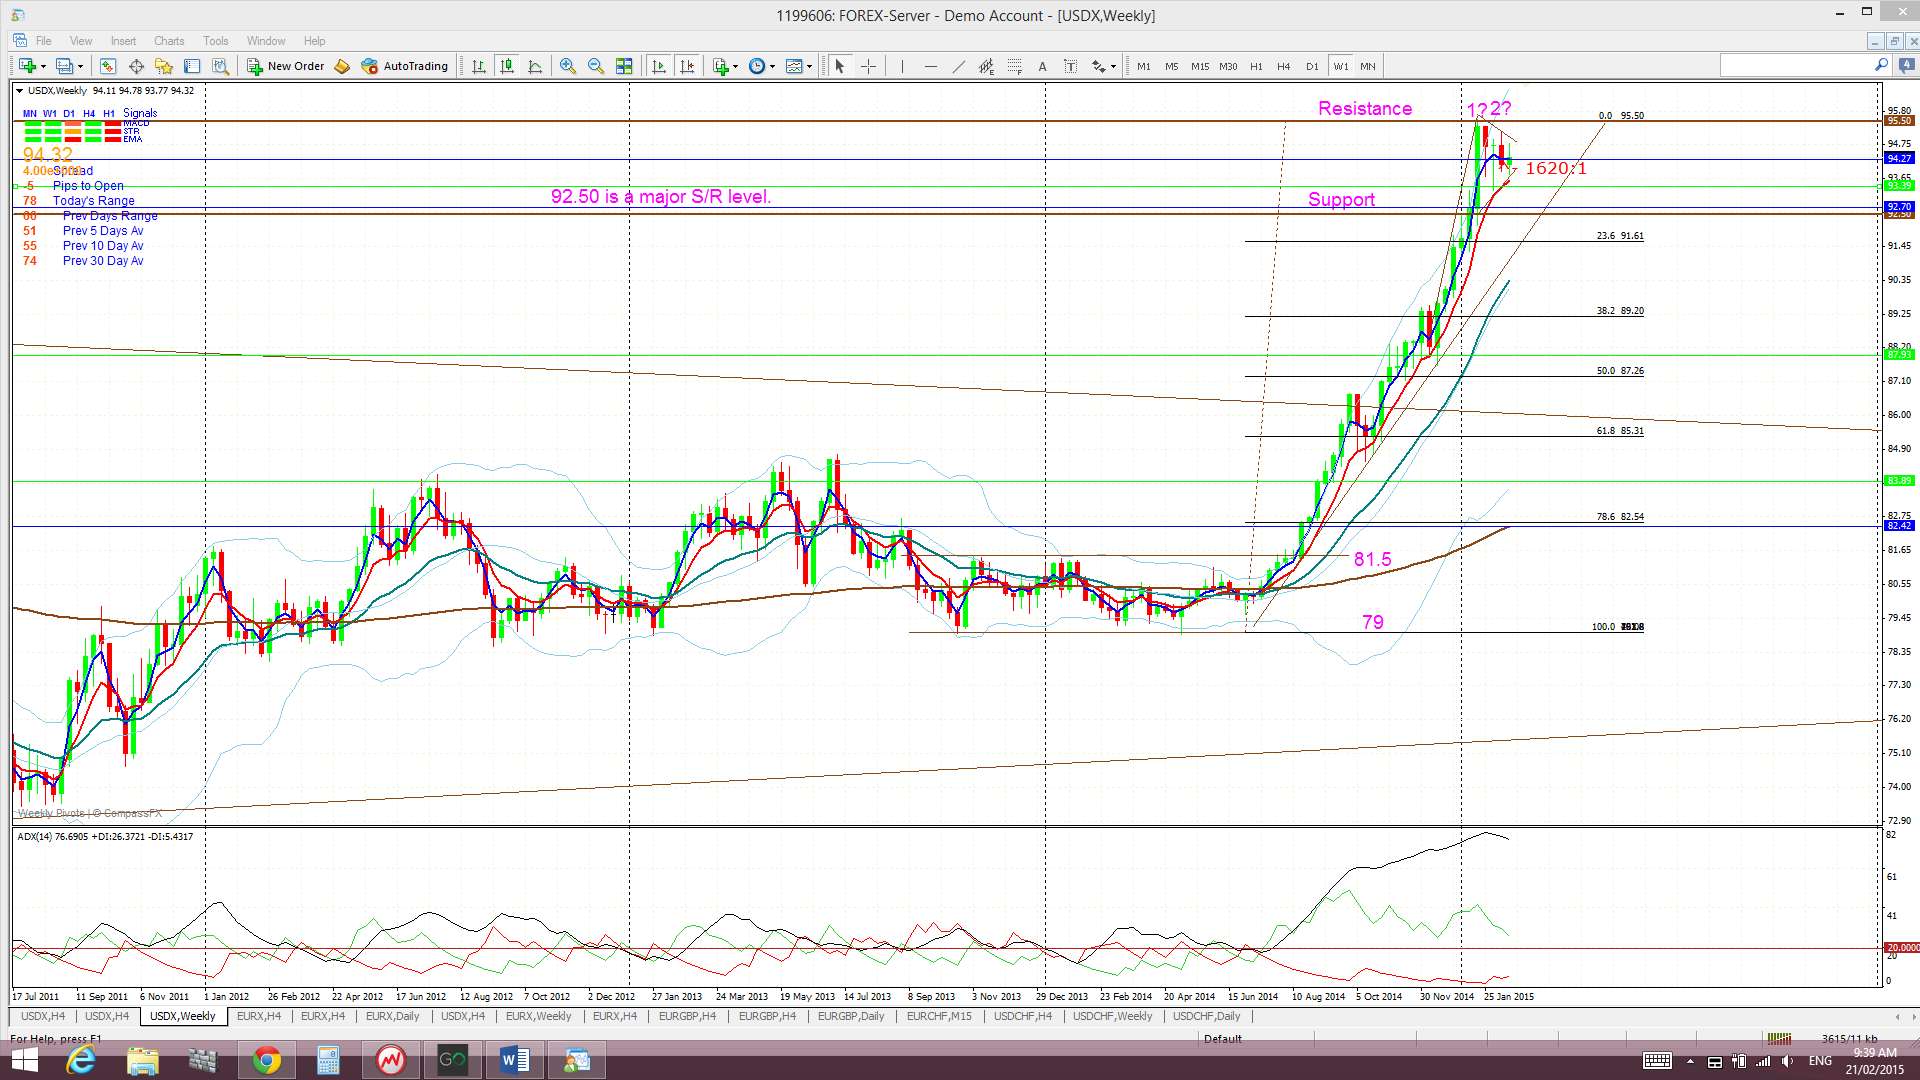
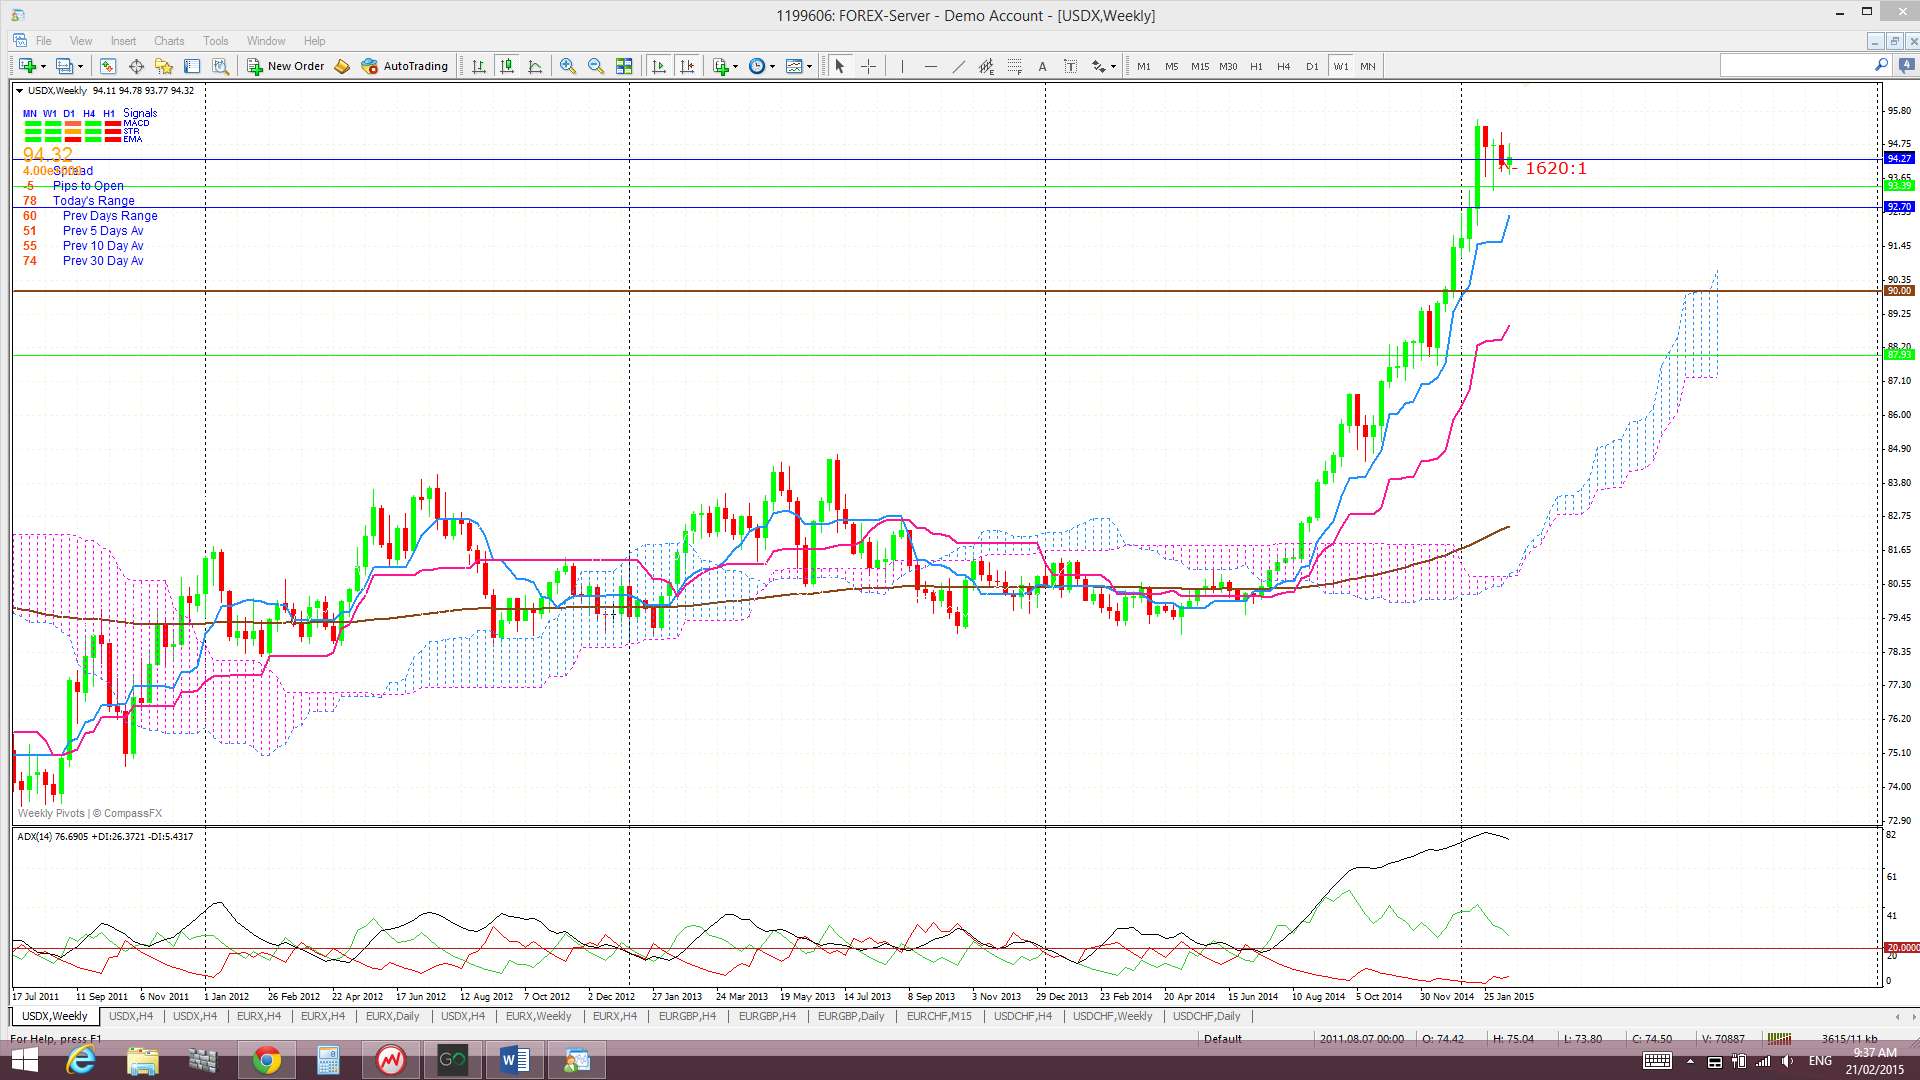
Weekly Ichimoku: The weekly candle is still trading well ABOVE the weekly Cloud.
Daily: Price continued to consolidate within a triangle throughout the last week which is still giving the daily chart a ‘Bull Flag’ appearance. Price is still below the recent 95.50 high though and so a bearish-reversal ‘Double Top’ also still looms as a possibility here.
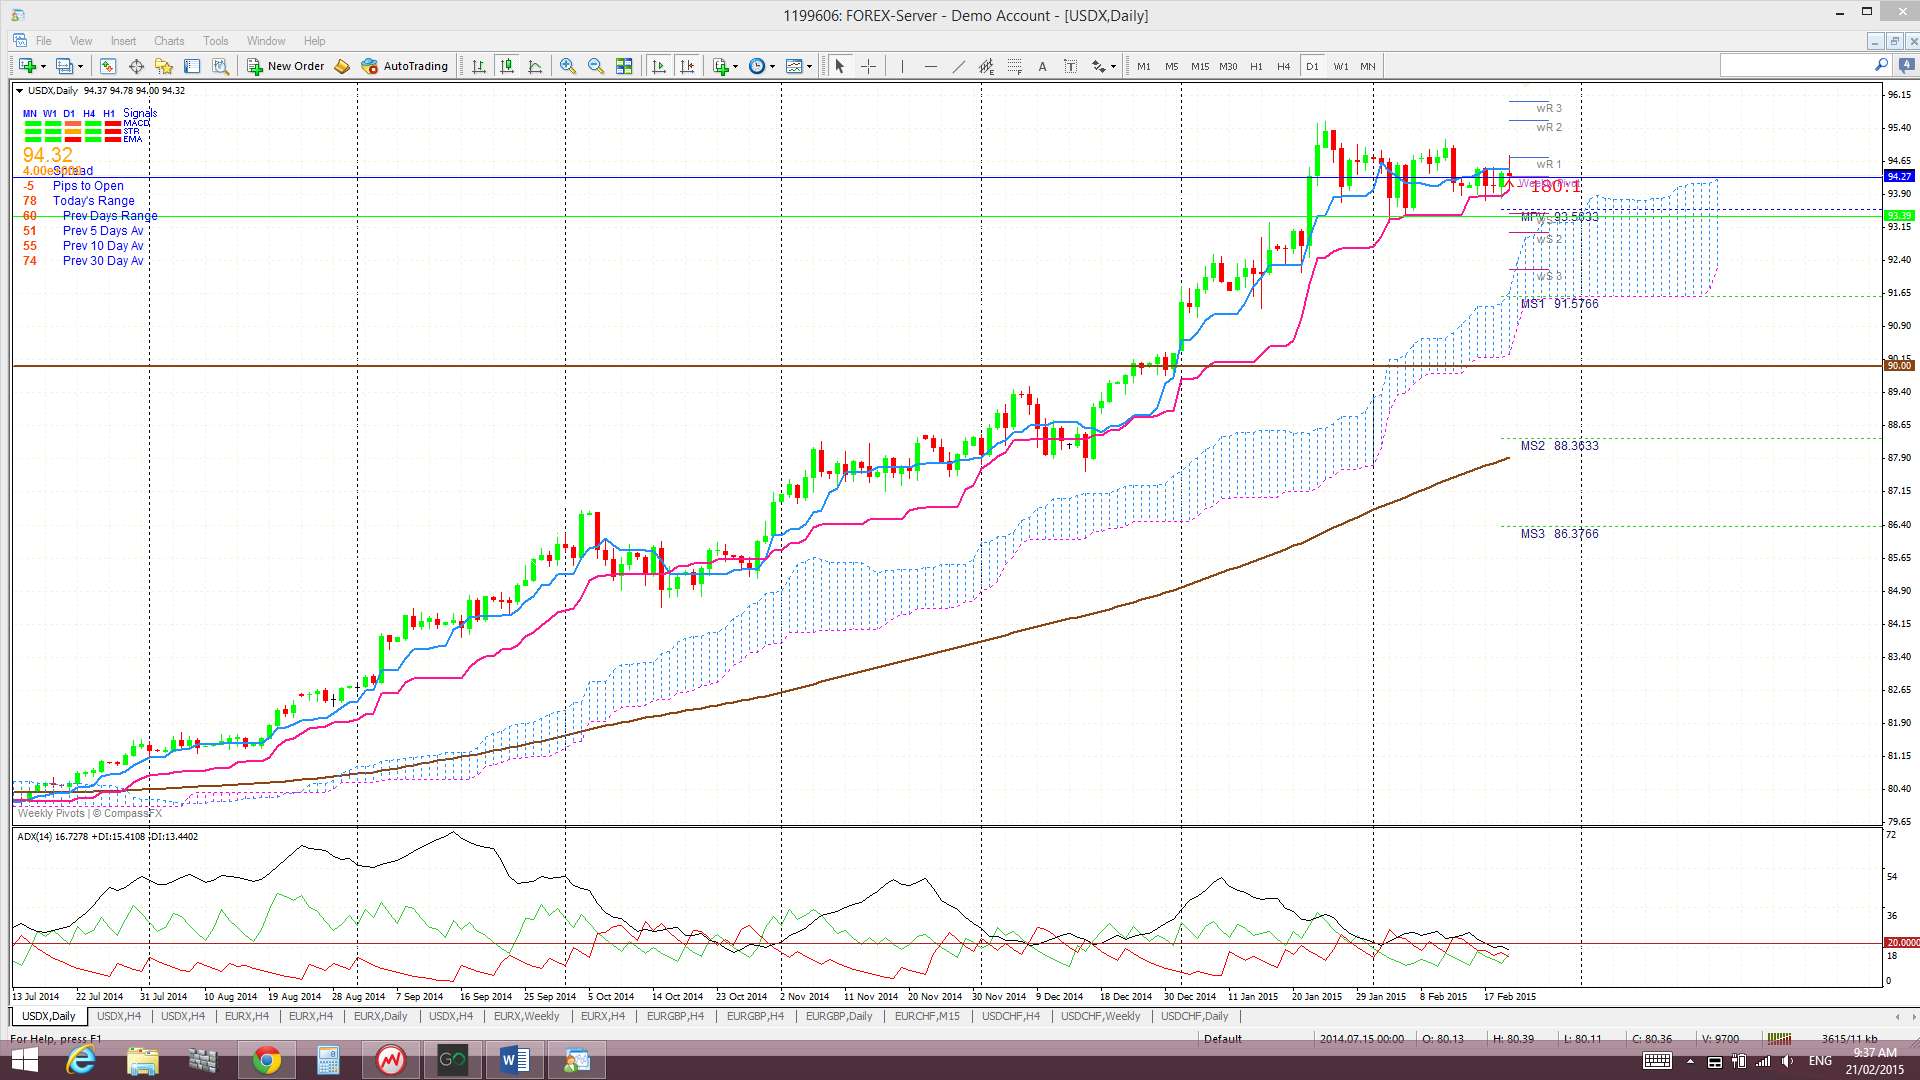
Daily Ichimoku Cloud chart: Price traded above the Cloud all week and there is still an open bullish Tenkan/Kijun cross in play.
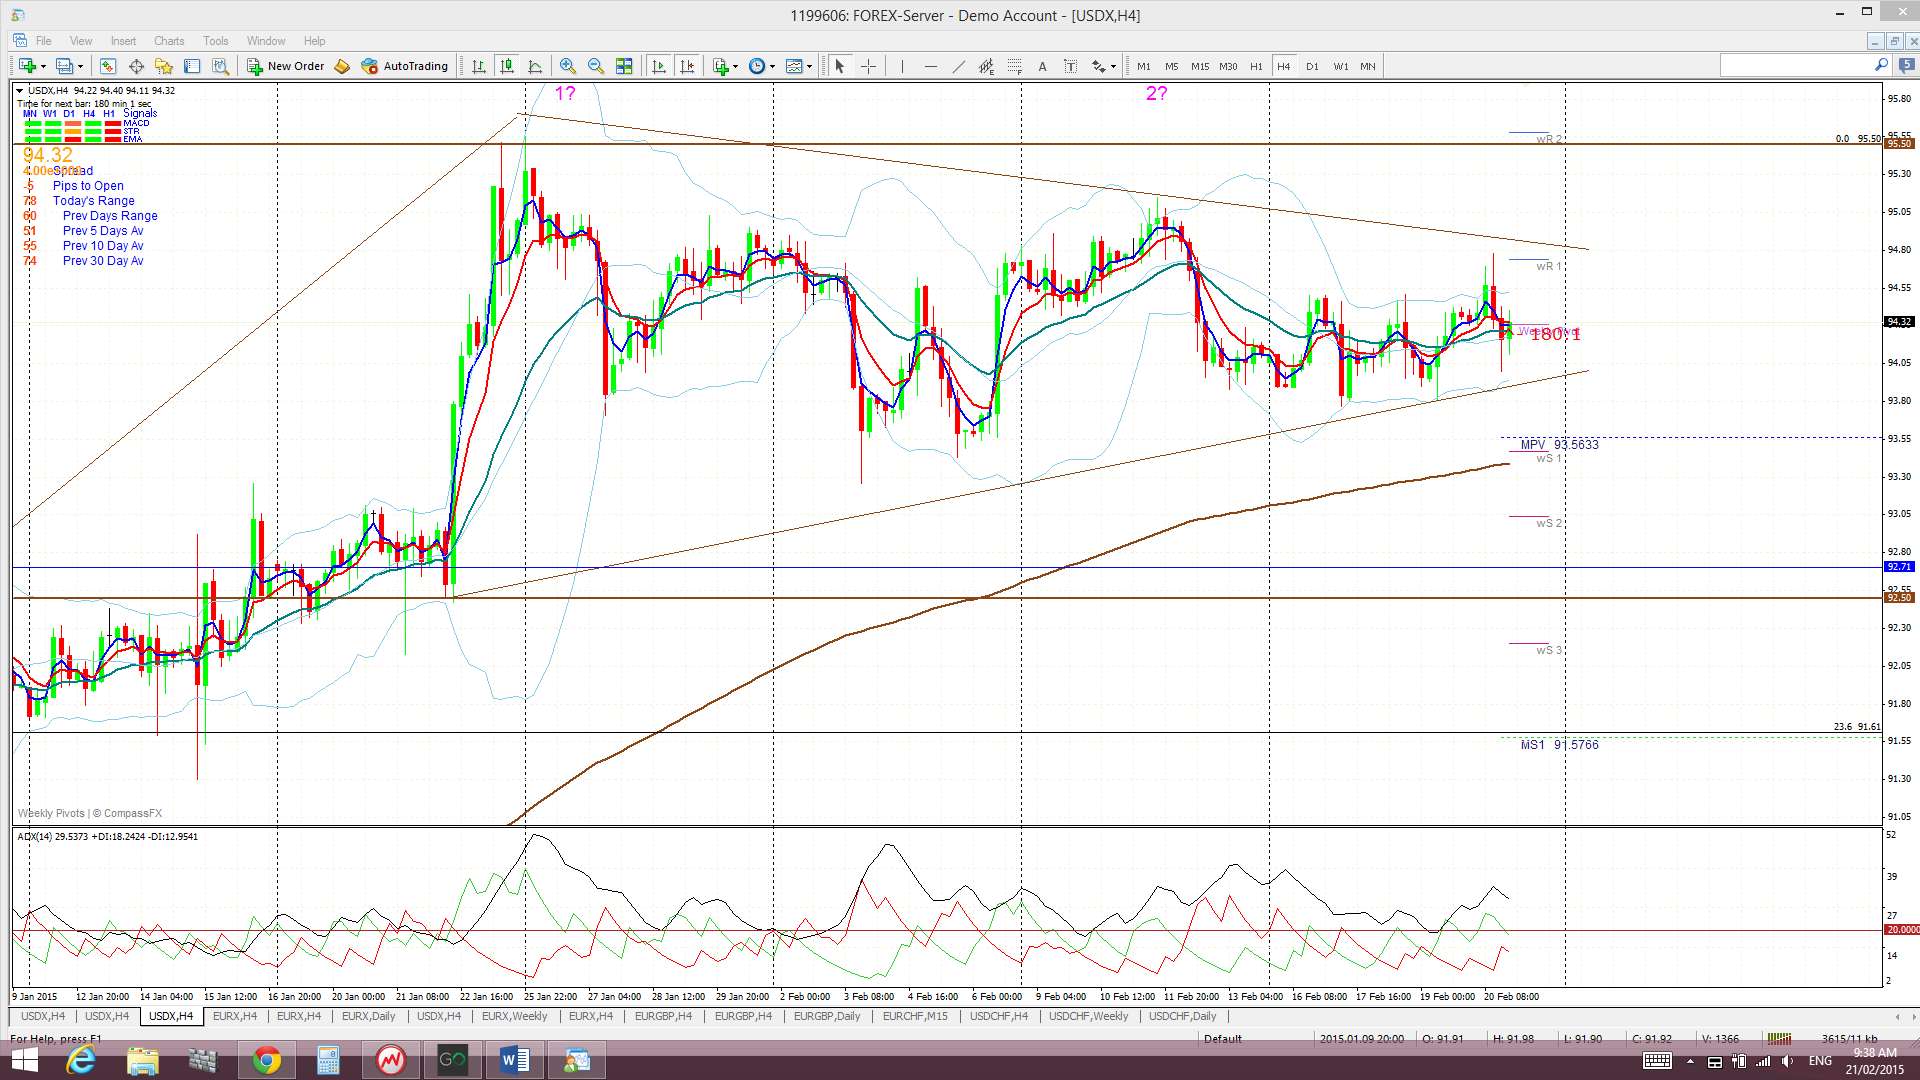
4hr: Price chopped sideways within the triangle all week.
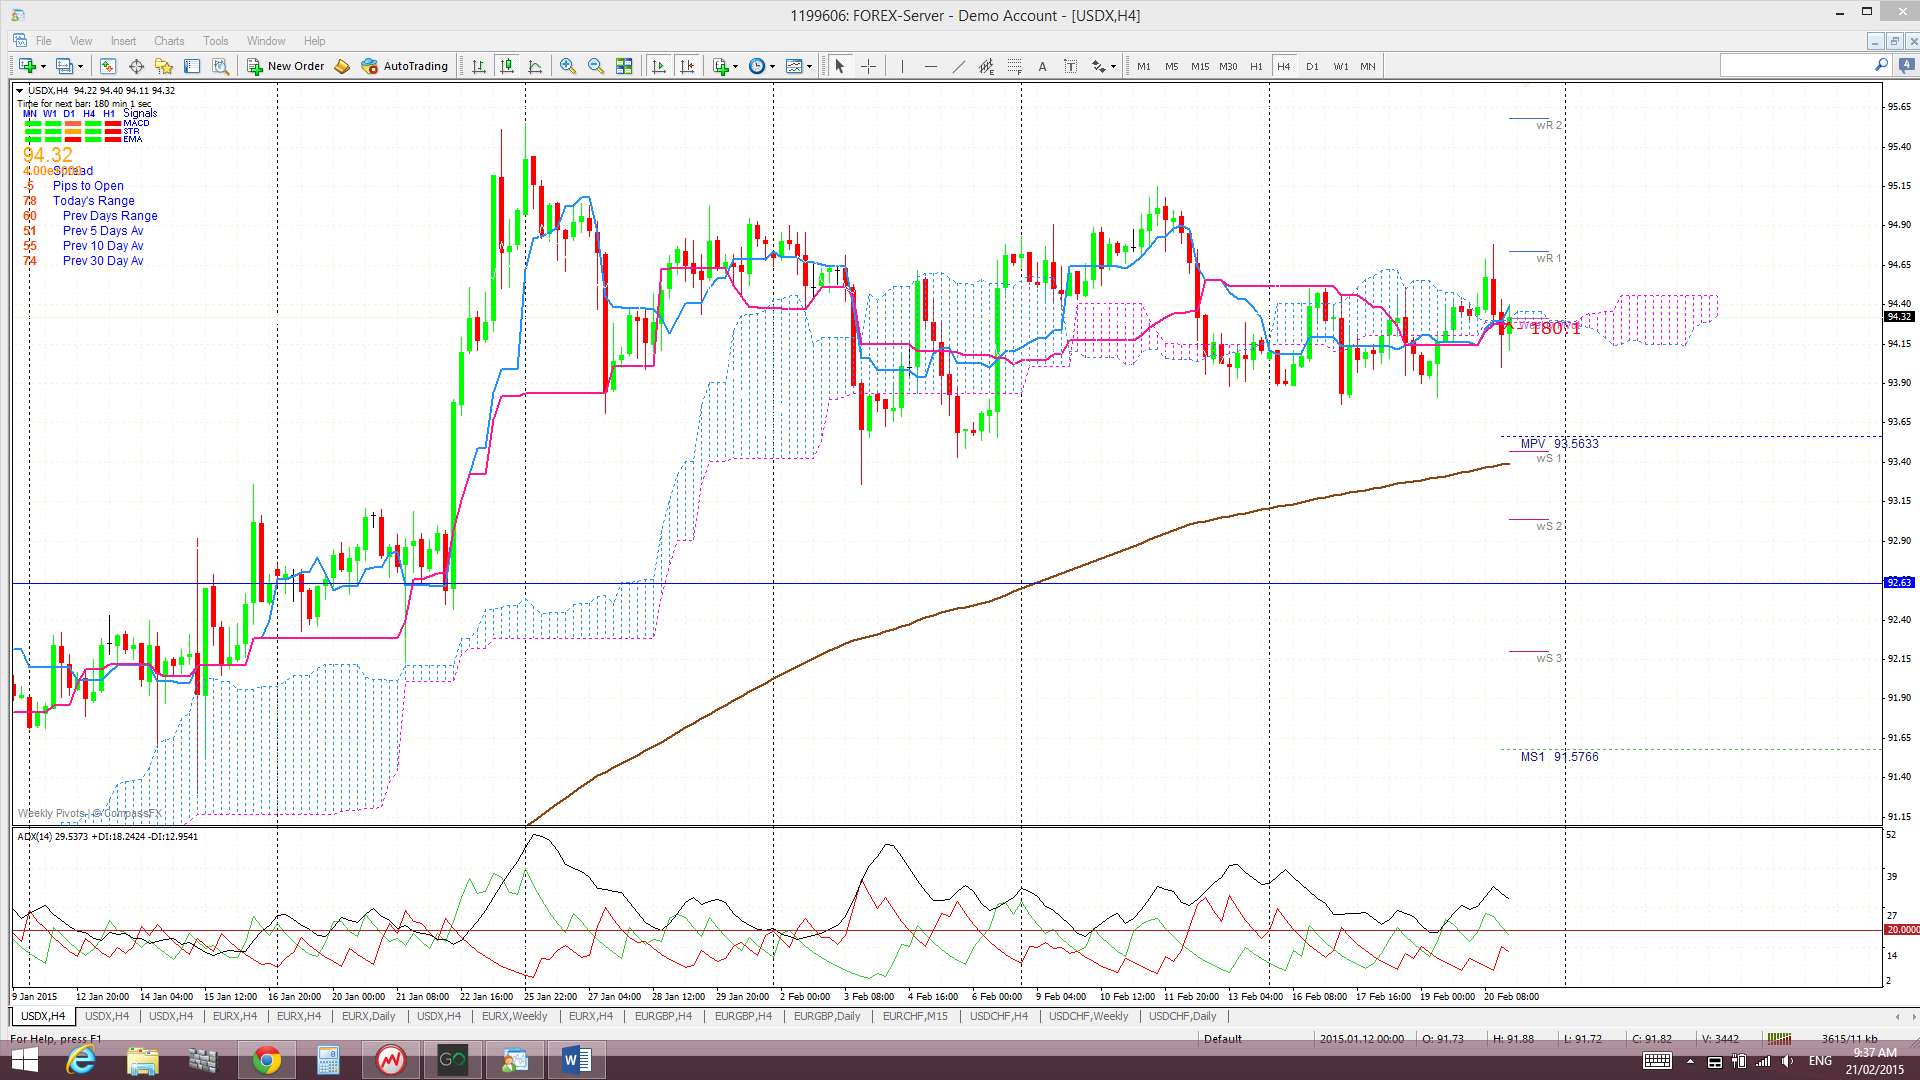
4hr Ichimoku Cloud chart: Price traded in and out of the Cloud all week but finished in the Cloud. This chart is divergent from the daily chart and suggests choppiness.
EURX
Monthly: The February candle is still printing a bullish-reversal ‘Inverted Hammer’ candle and is below the support of the 78.6% fib from the 2012-2014 bull move. My ‘inverse H&S’ pattern remains a possibility here but I’m keeping an open mind about an alternative ‘Double Bottom’ as well given the recent price action down near the 96 region.
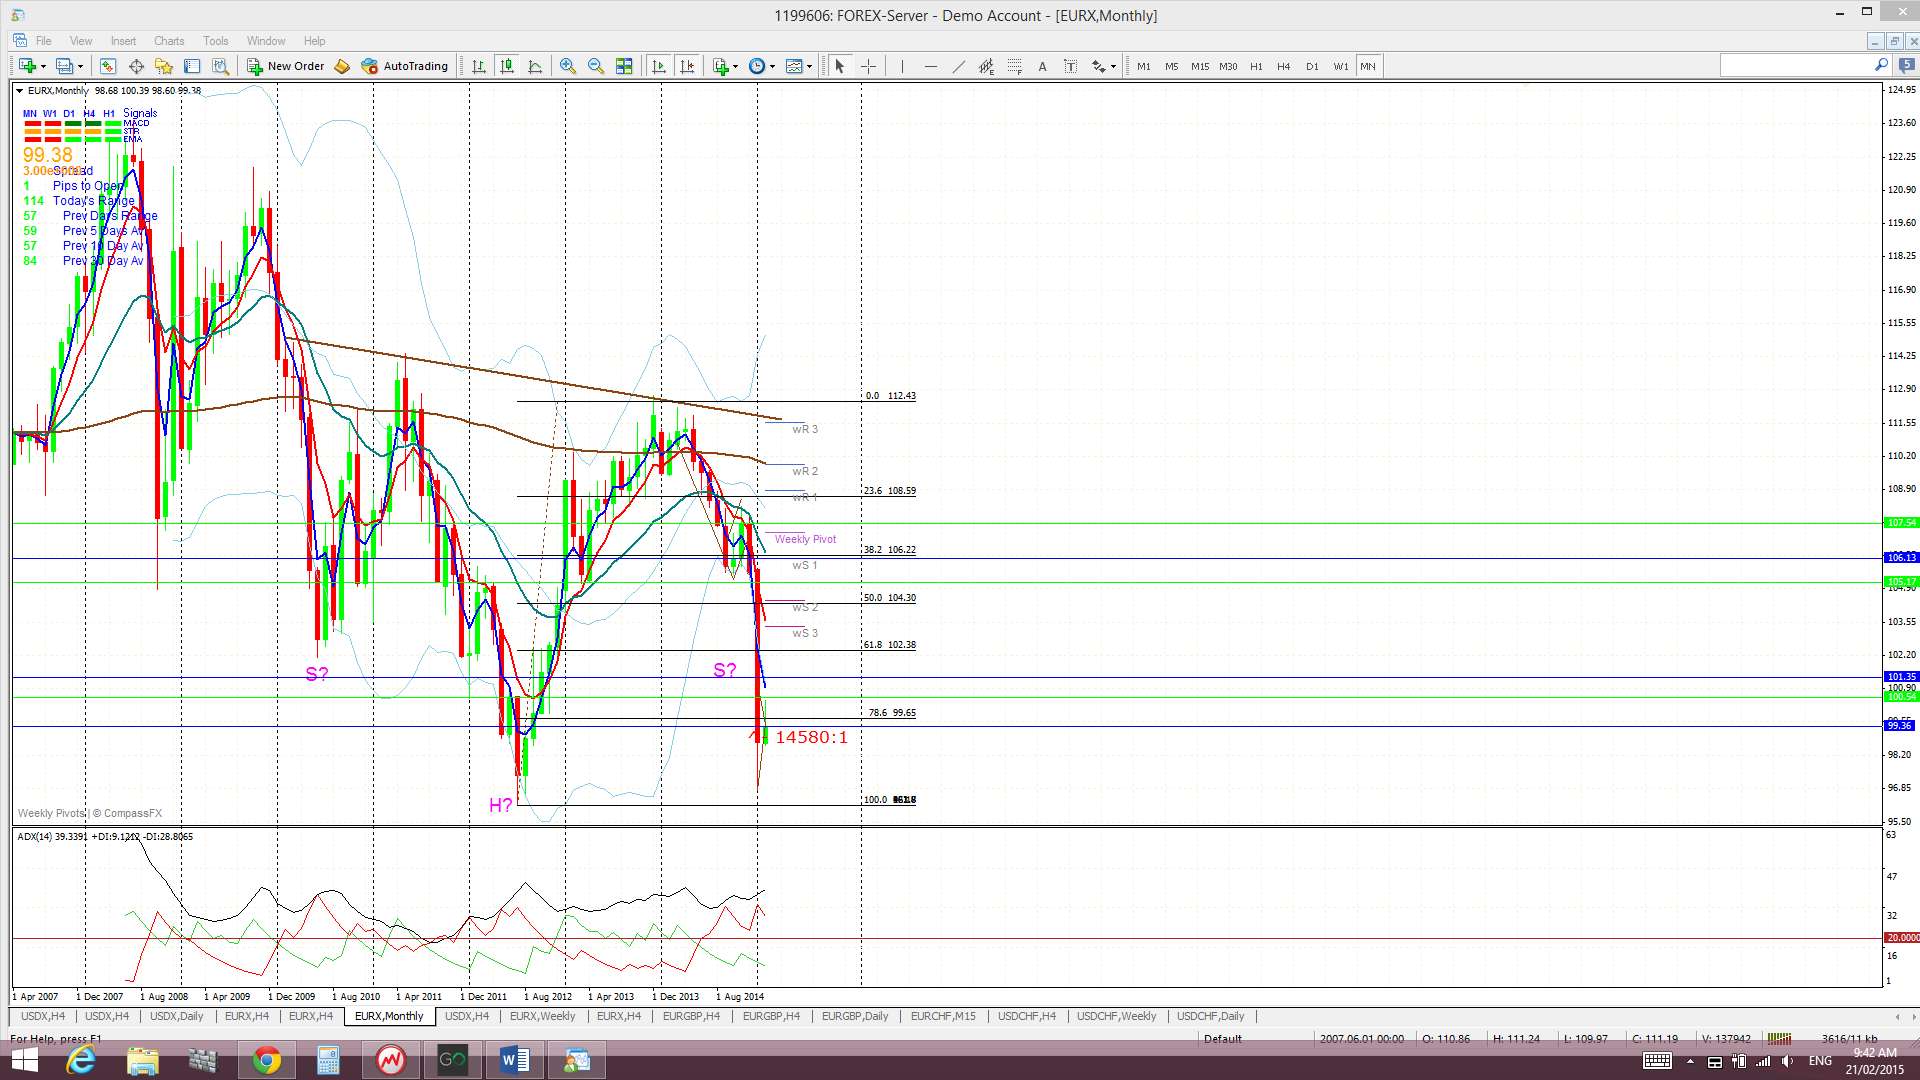
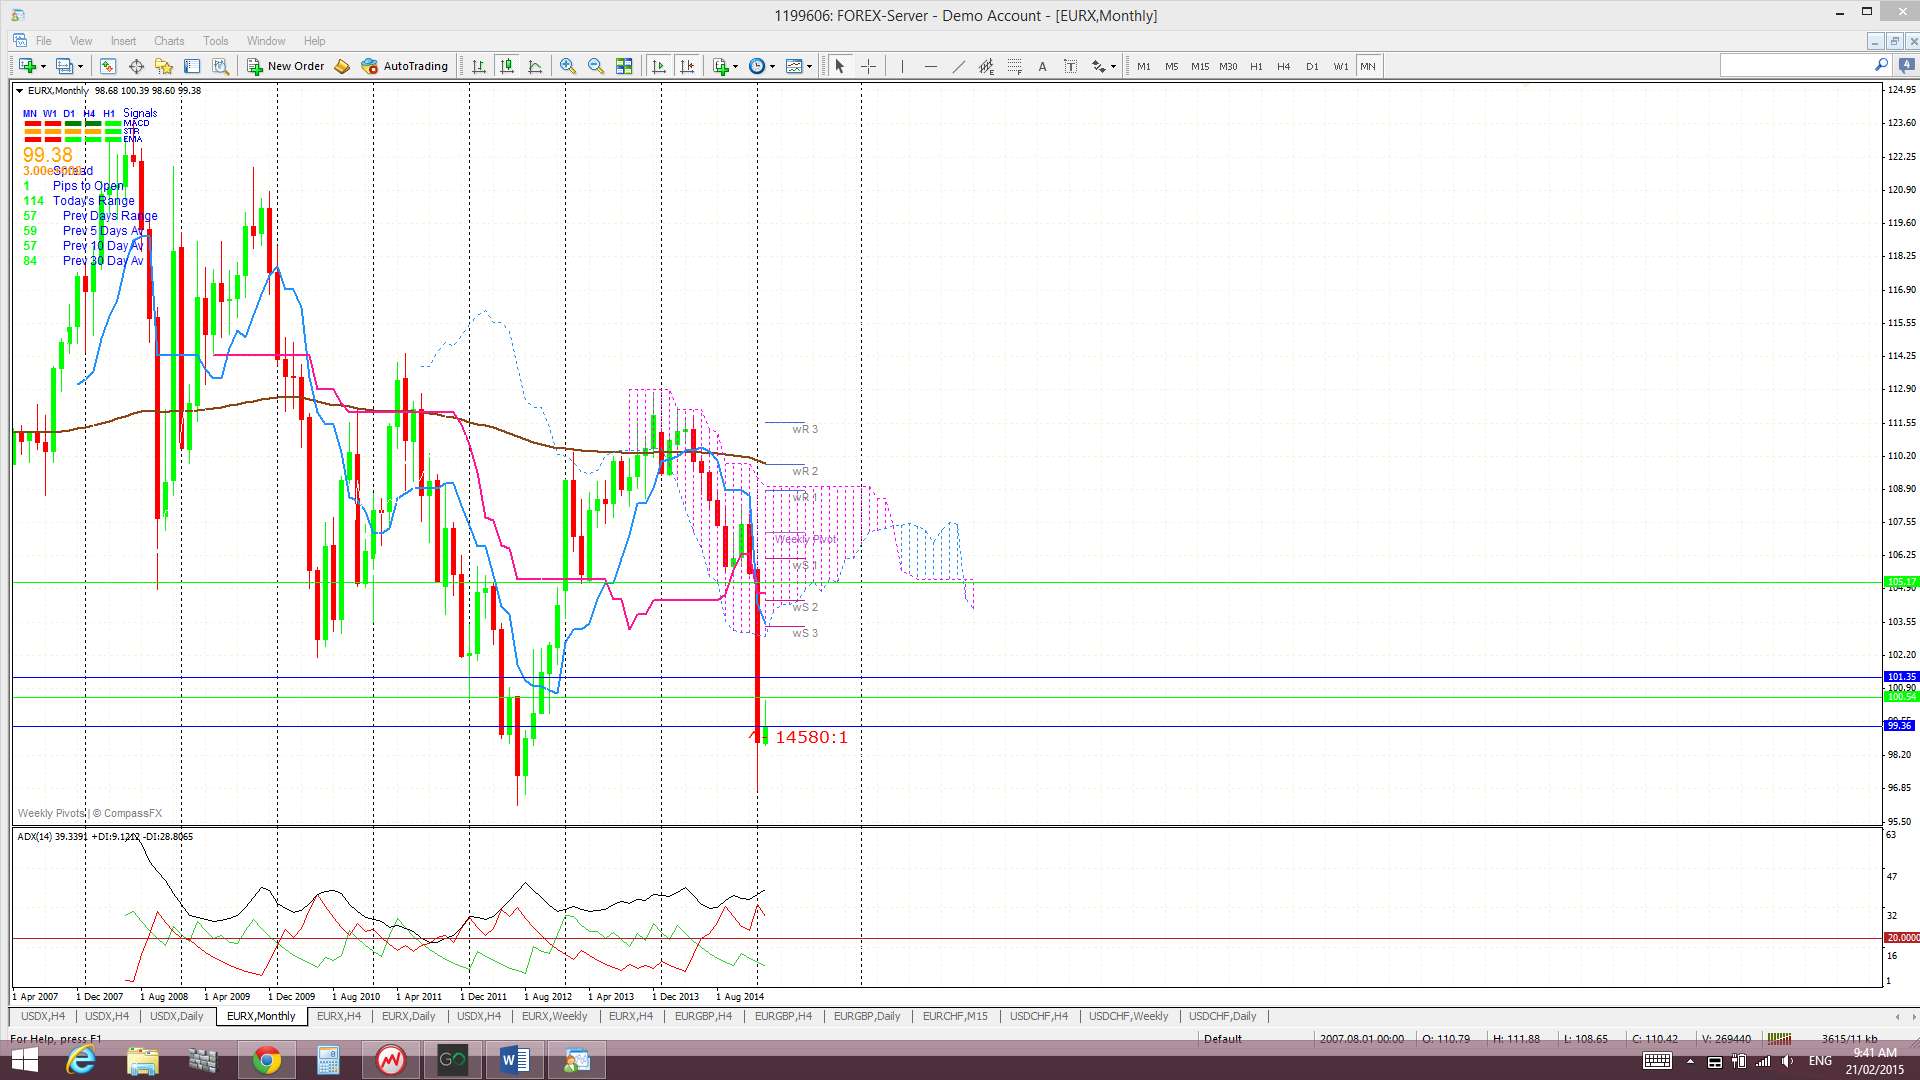
Monthly Ichimoku: The February candle is trading below the monthly Cloud.
Weekly: The weekly candle closed as a bearish coloured Doji candle. I’m still not sure whether this recent pullback represents a pause, before further bearish follow-through, or an attempt at a possible reversal.
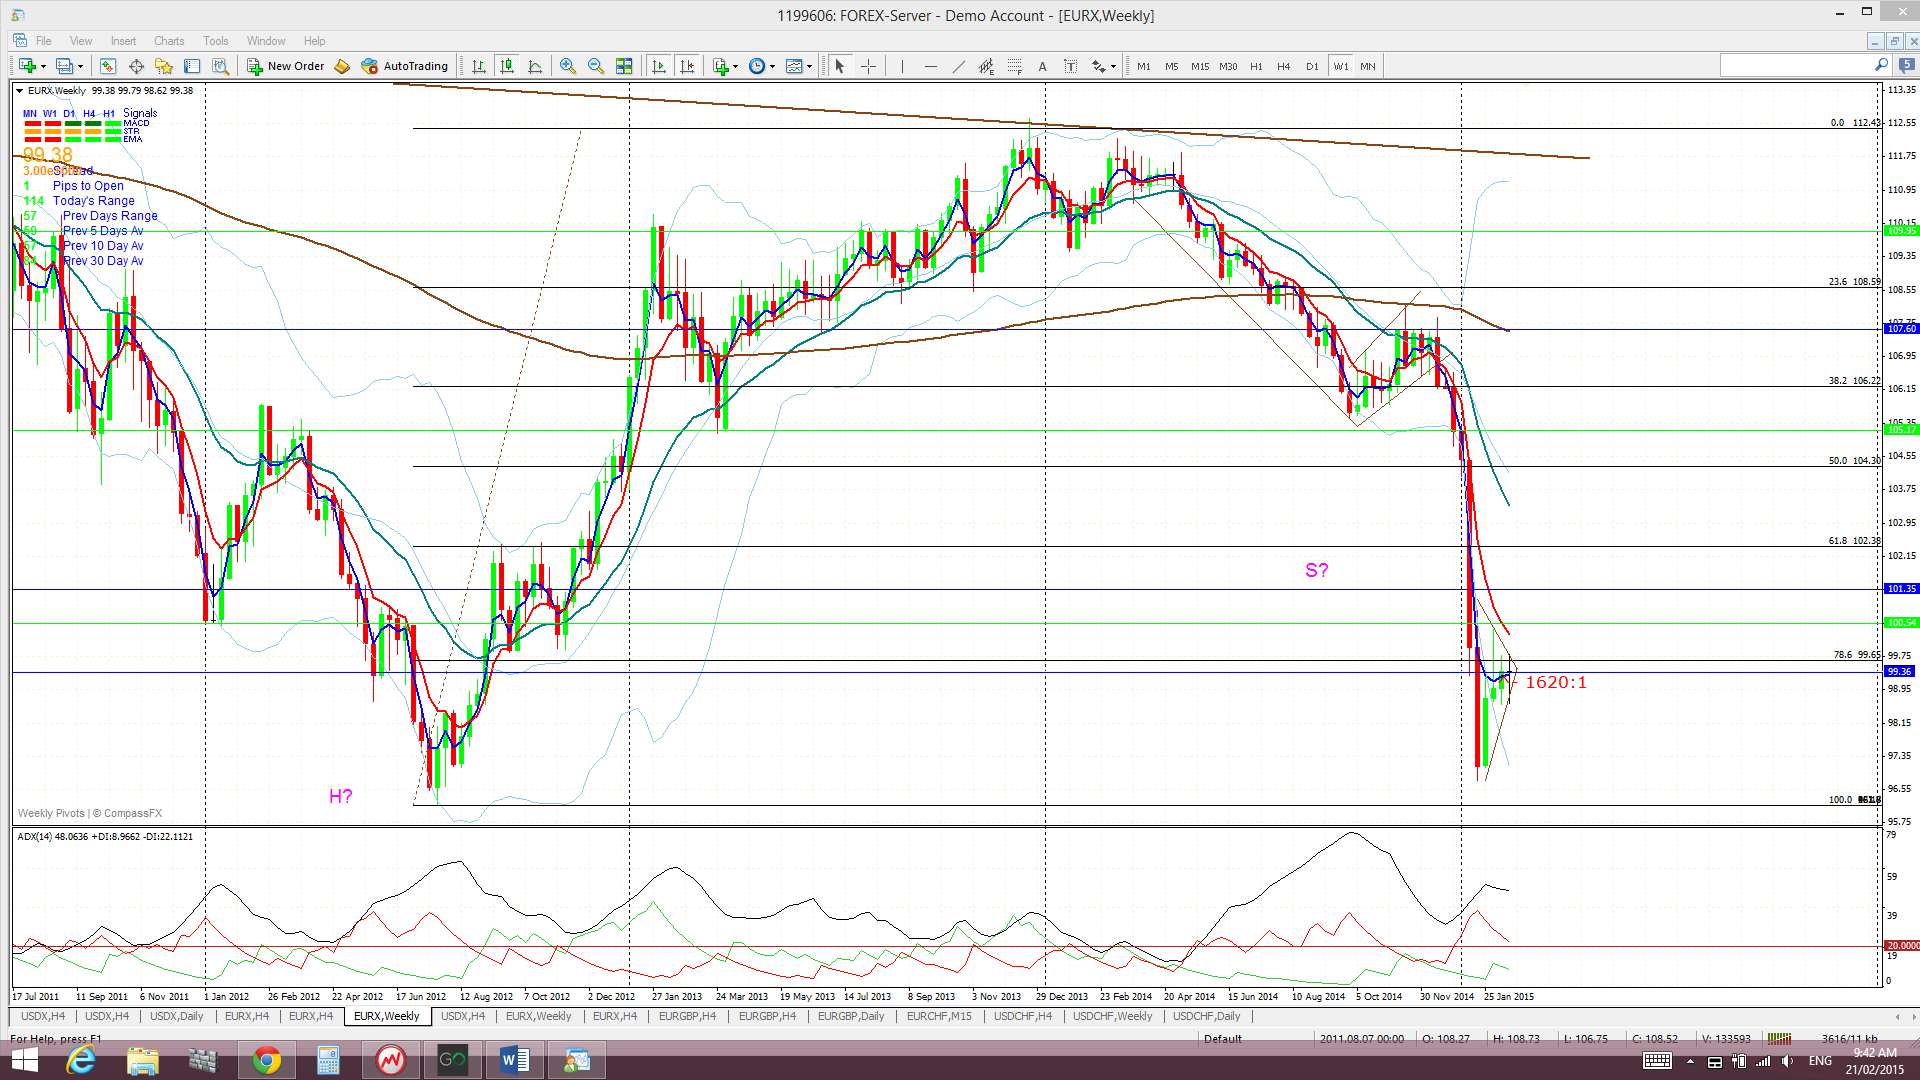
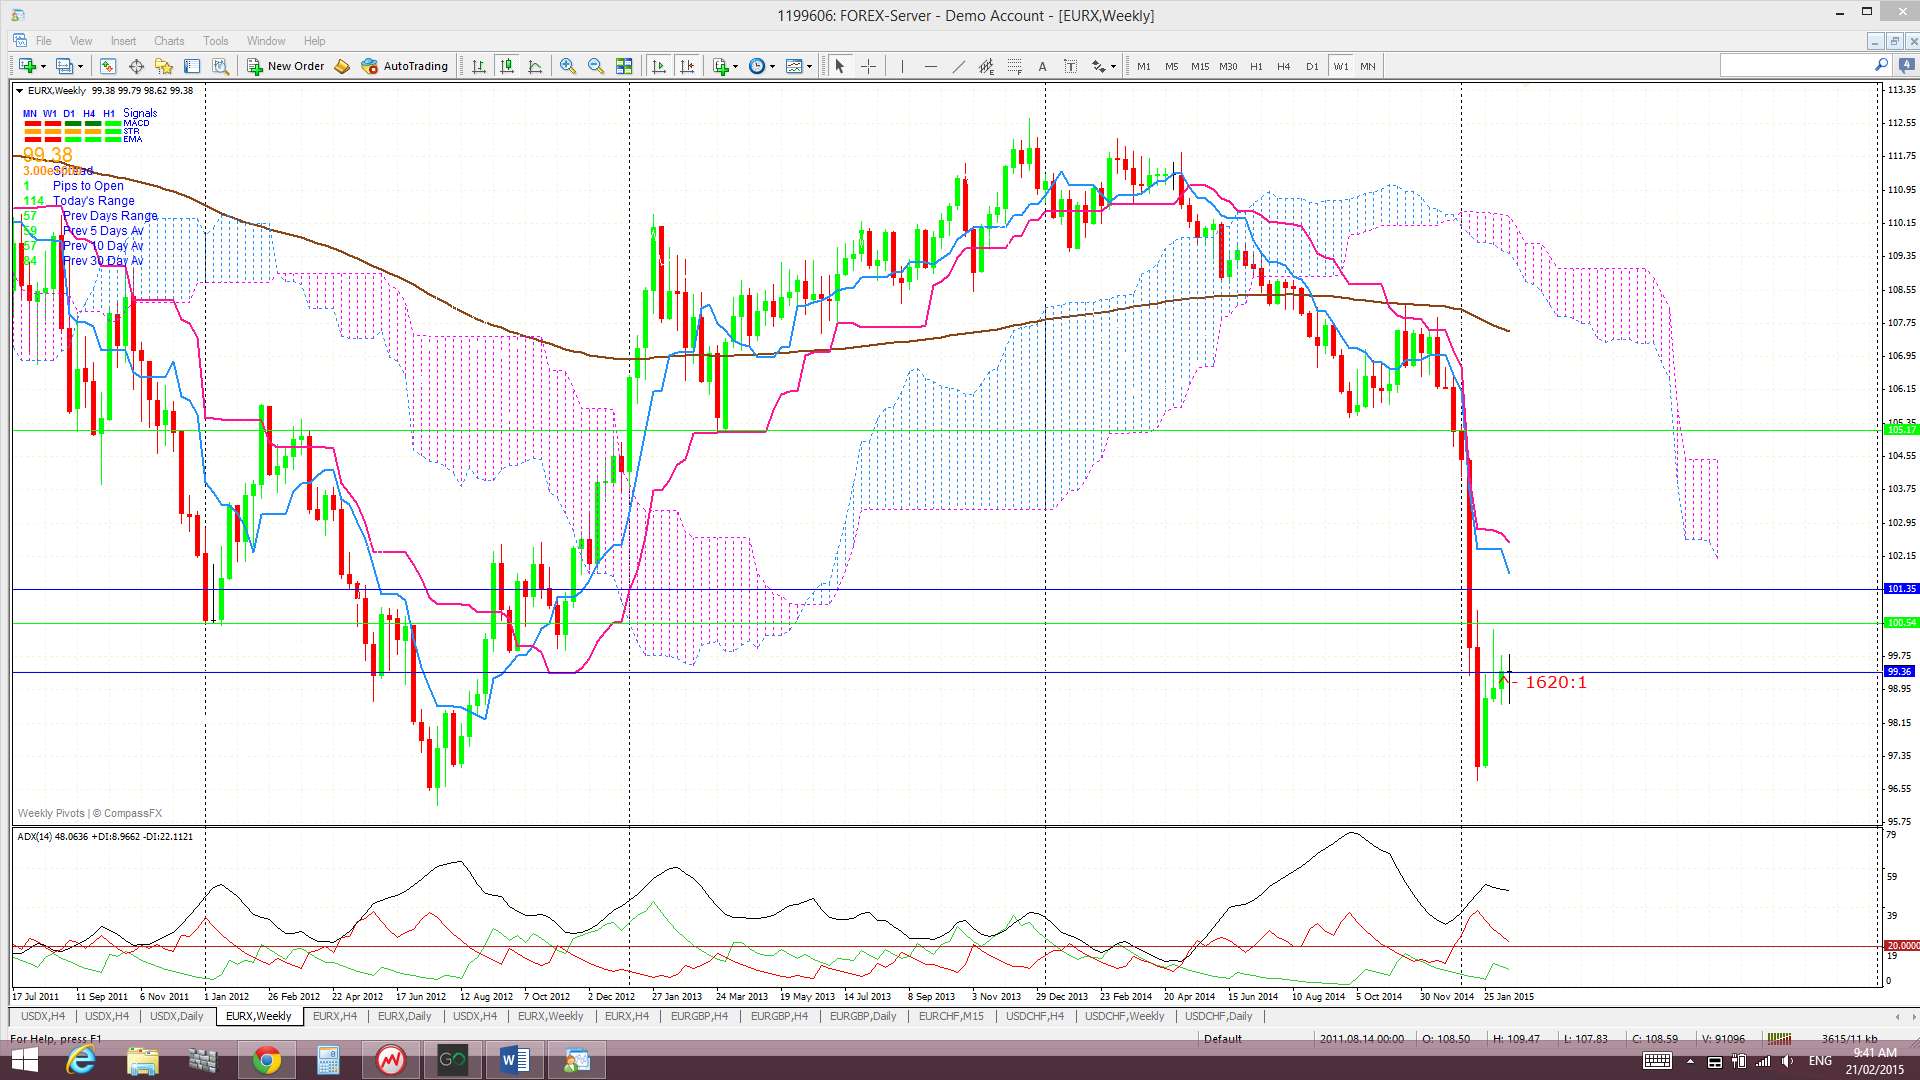
Weekly Ichimoku: Price is trading well below the weekly Cloud.
Daily: Price action is still below the 78.6% fib support but consolidating within a triangle that is giving this chart a ‘Bear Flag’ appearance.
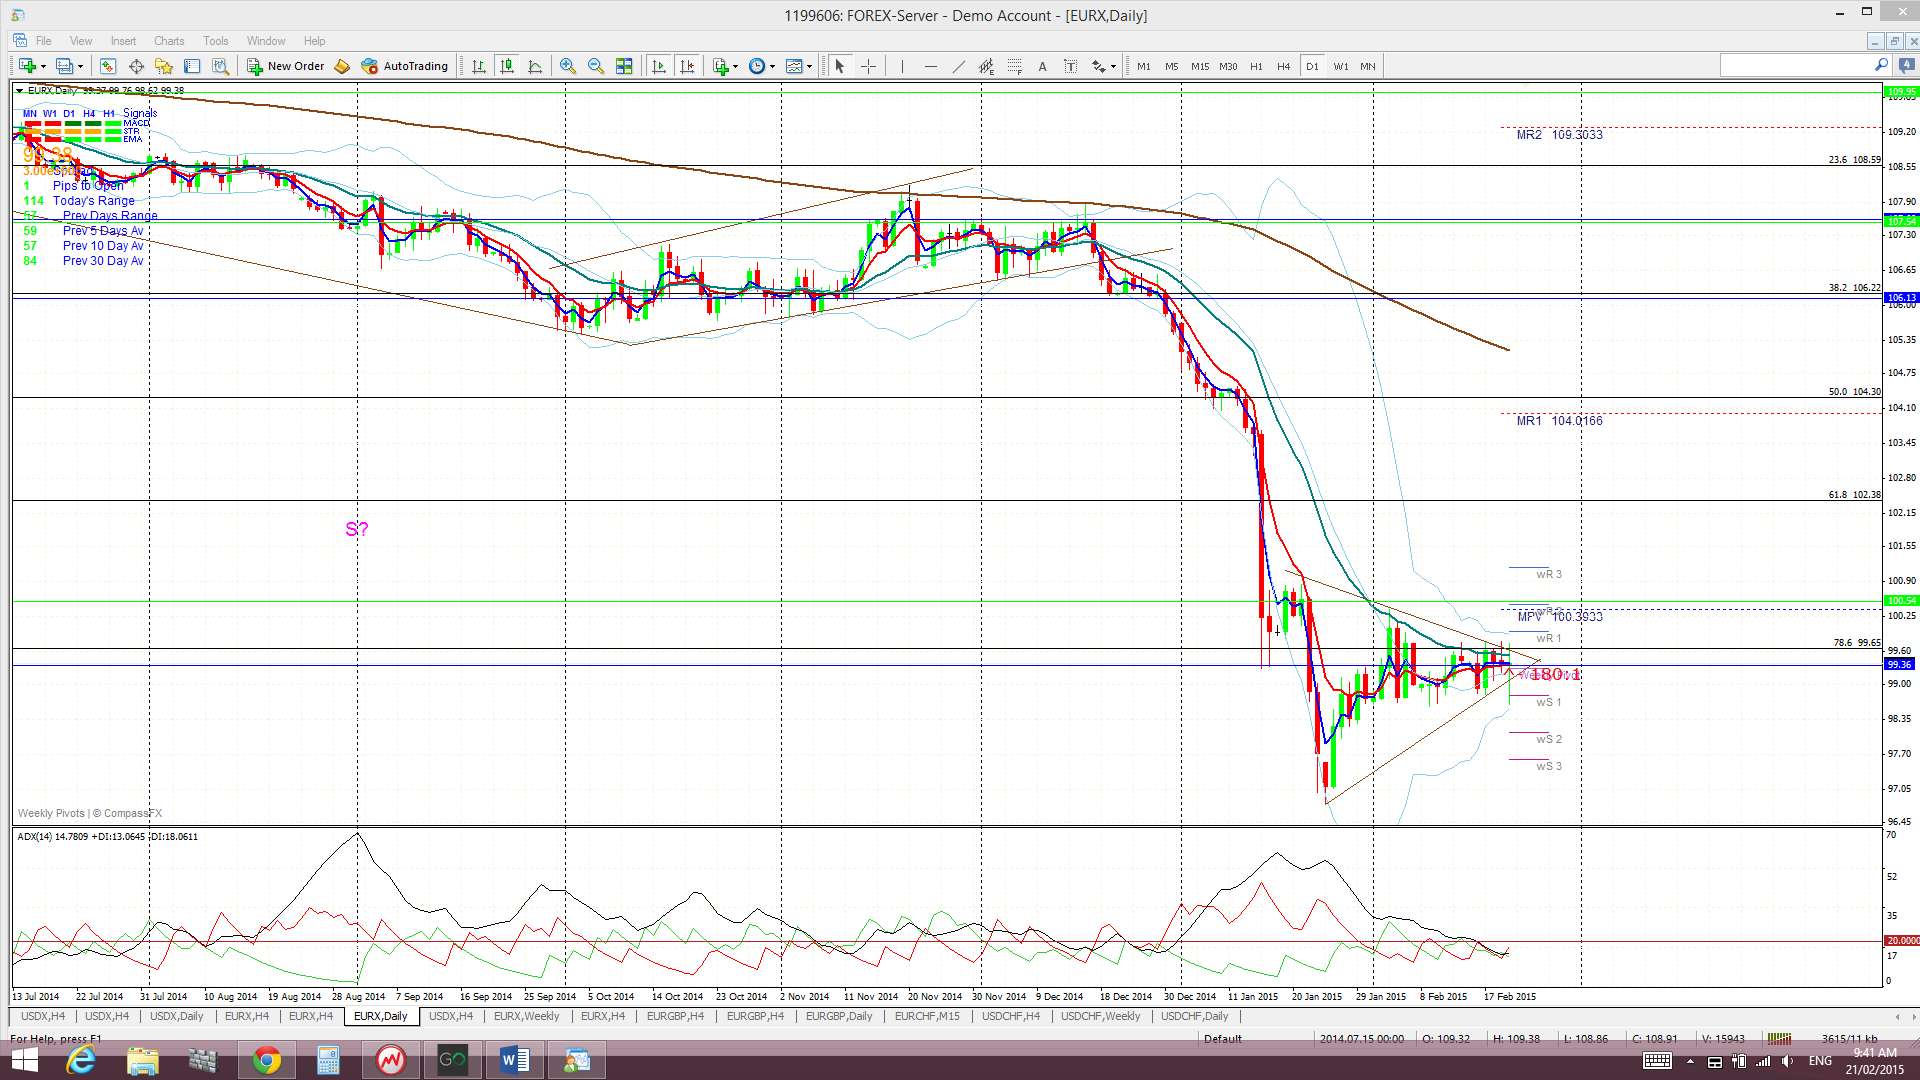
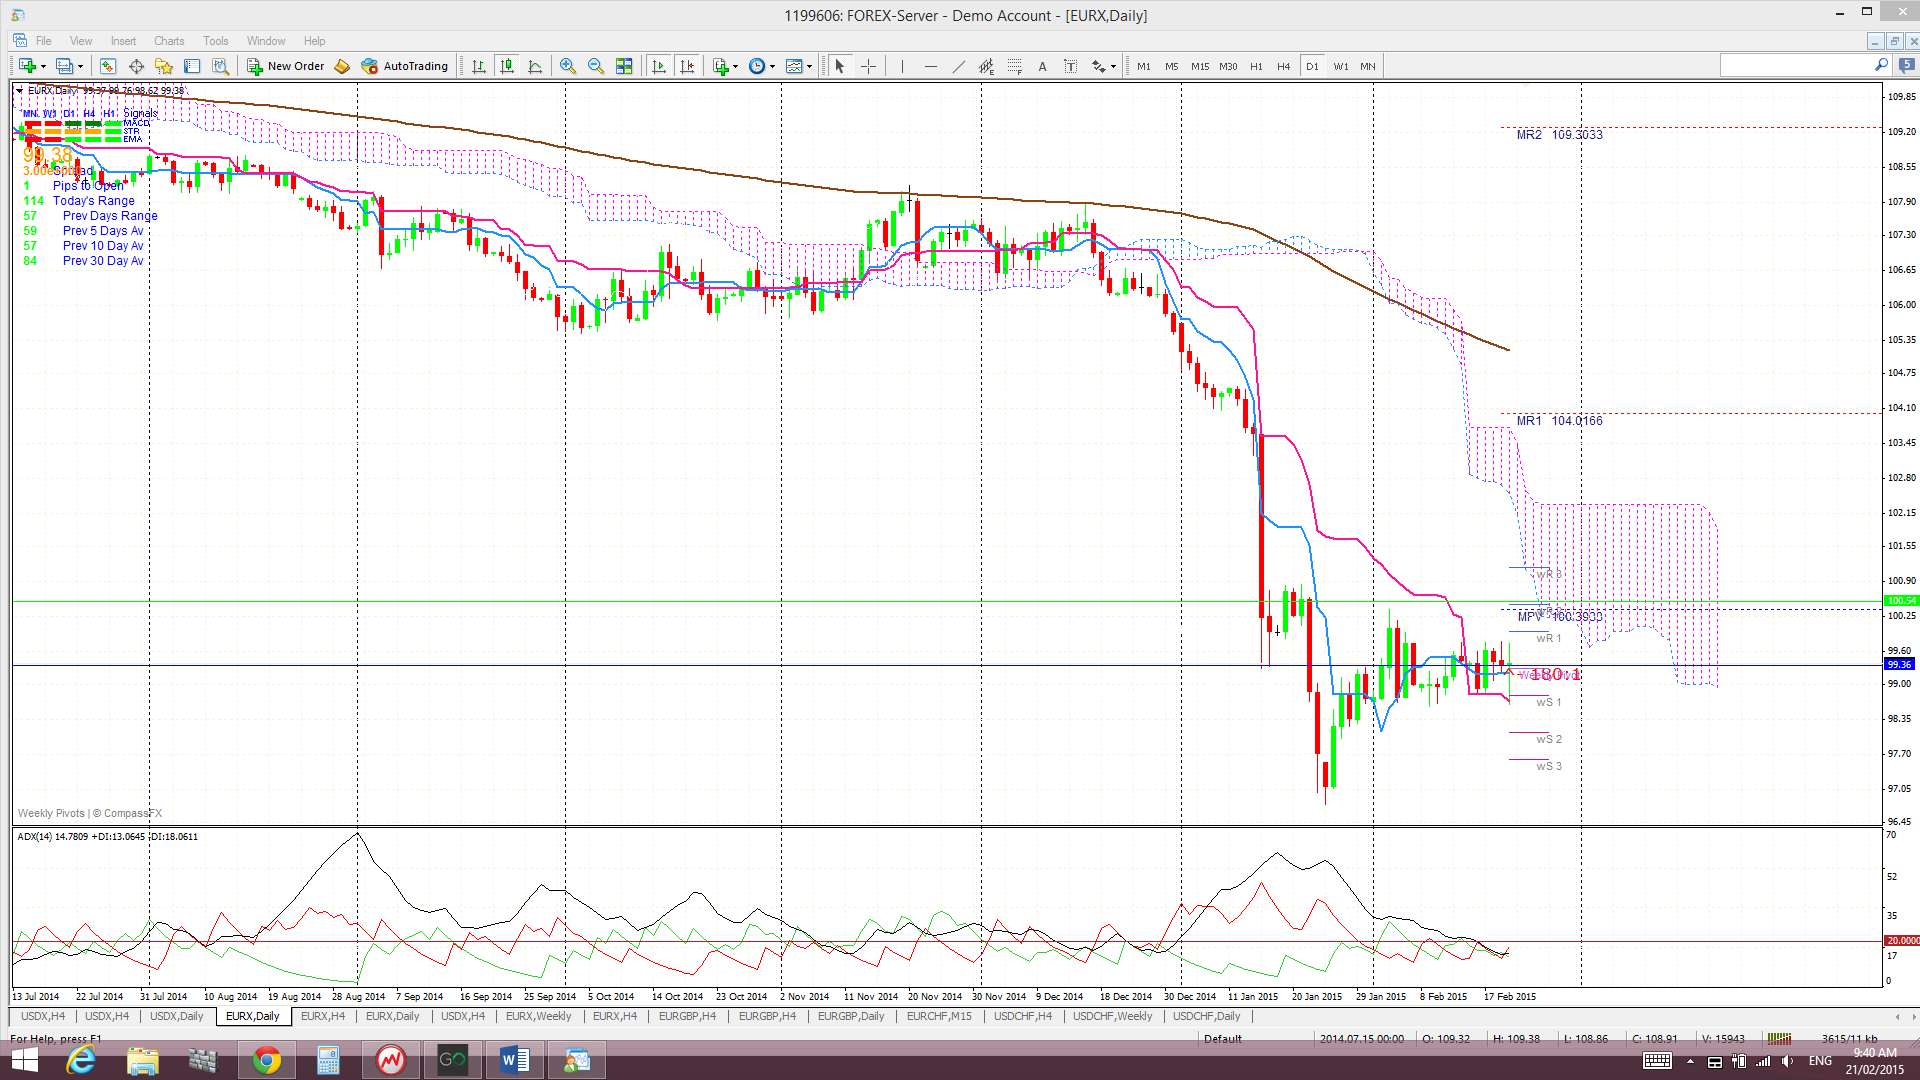
Daily Ichimoku Cloud chart: Price is still trading below the daily Cloud but the Cloud mass is looming large and just ahead of current price action.
4 hr: Price chopped up and down within the triangle last week.
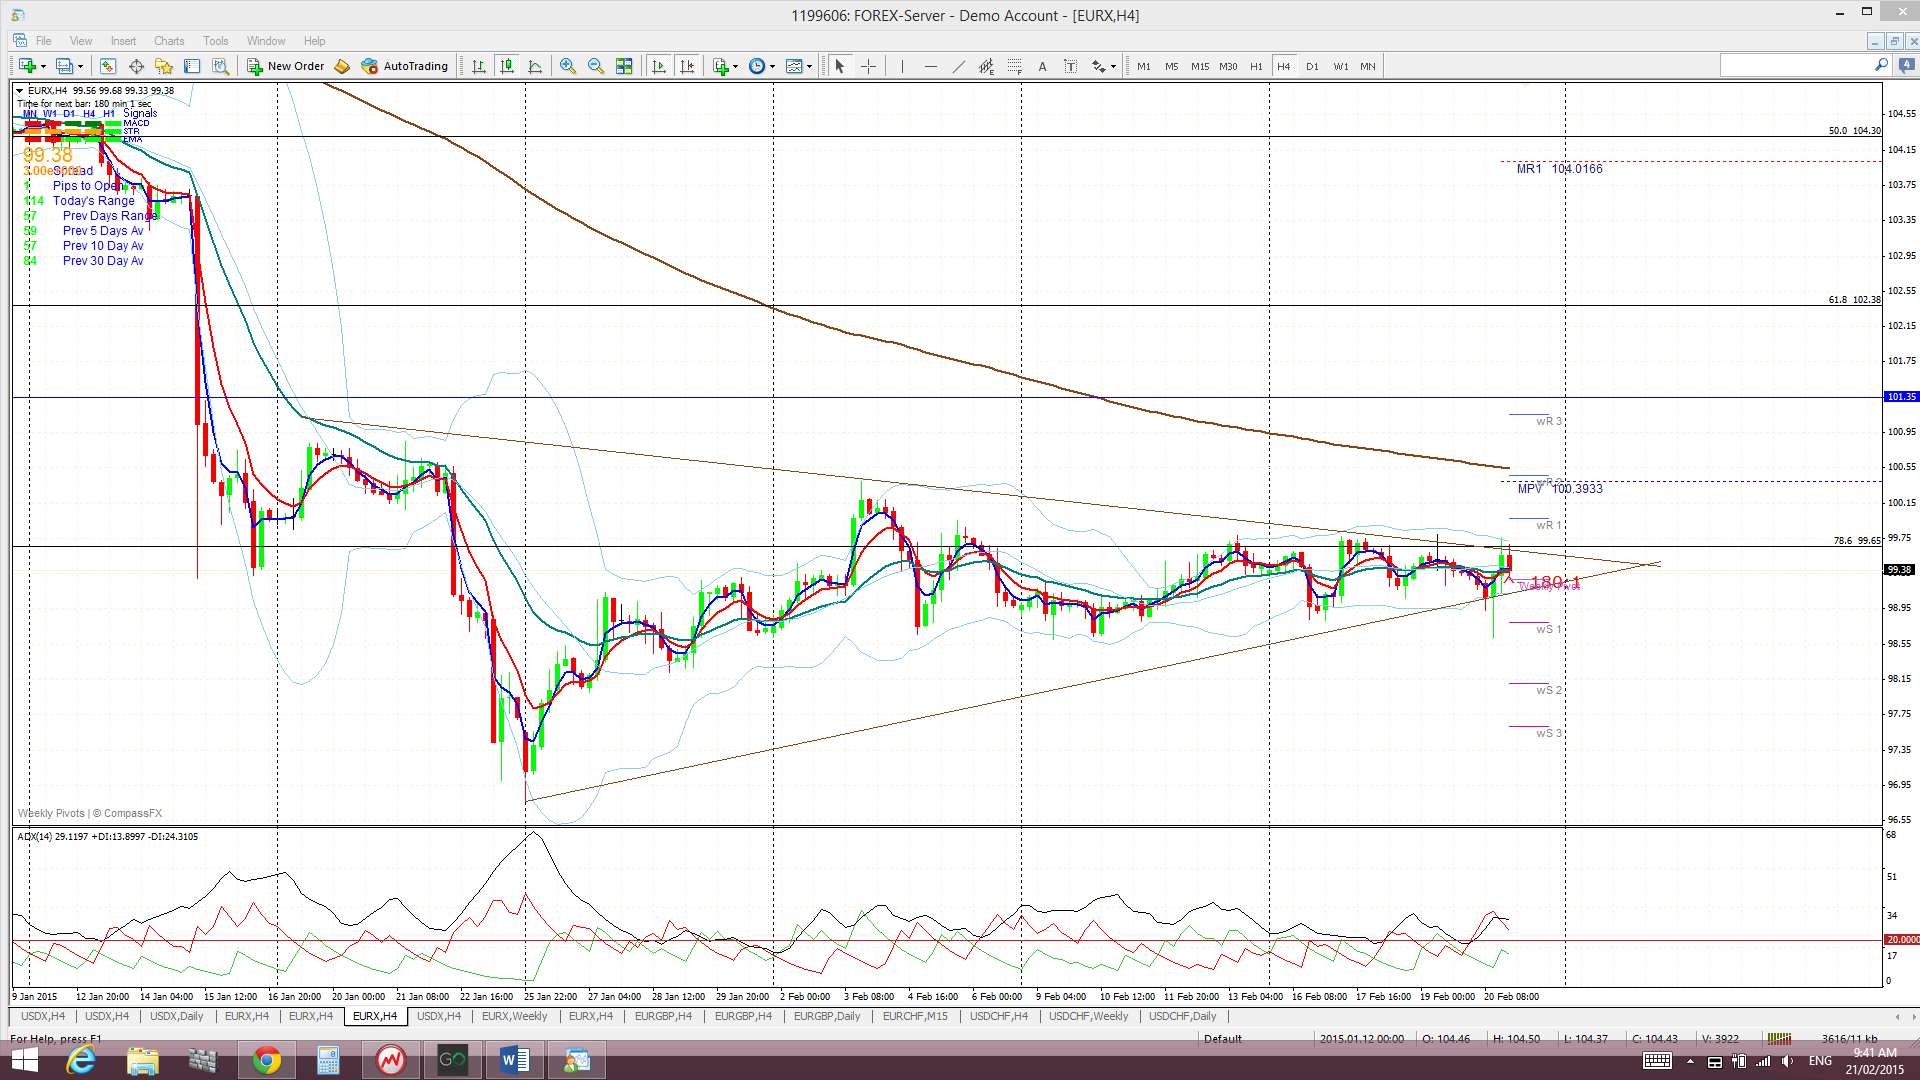
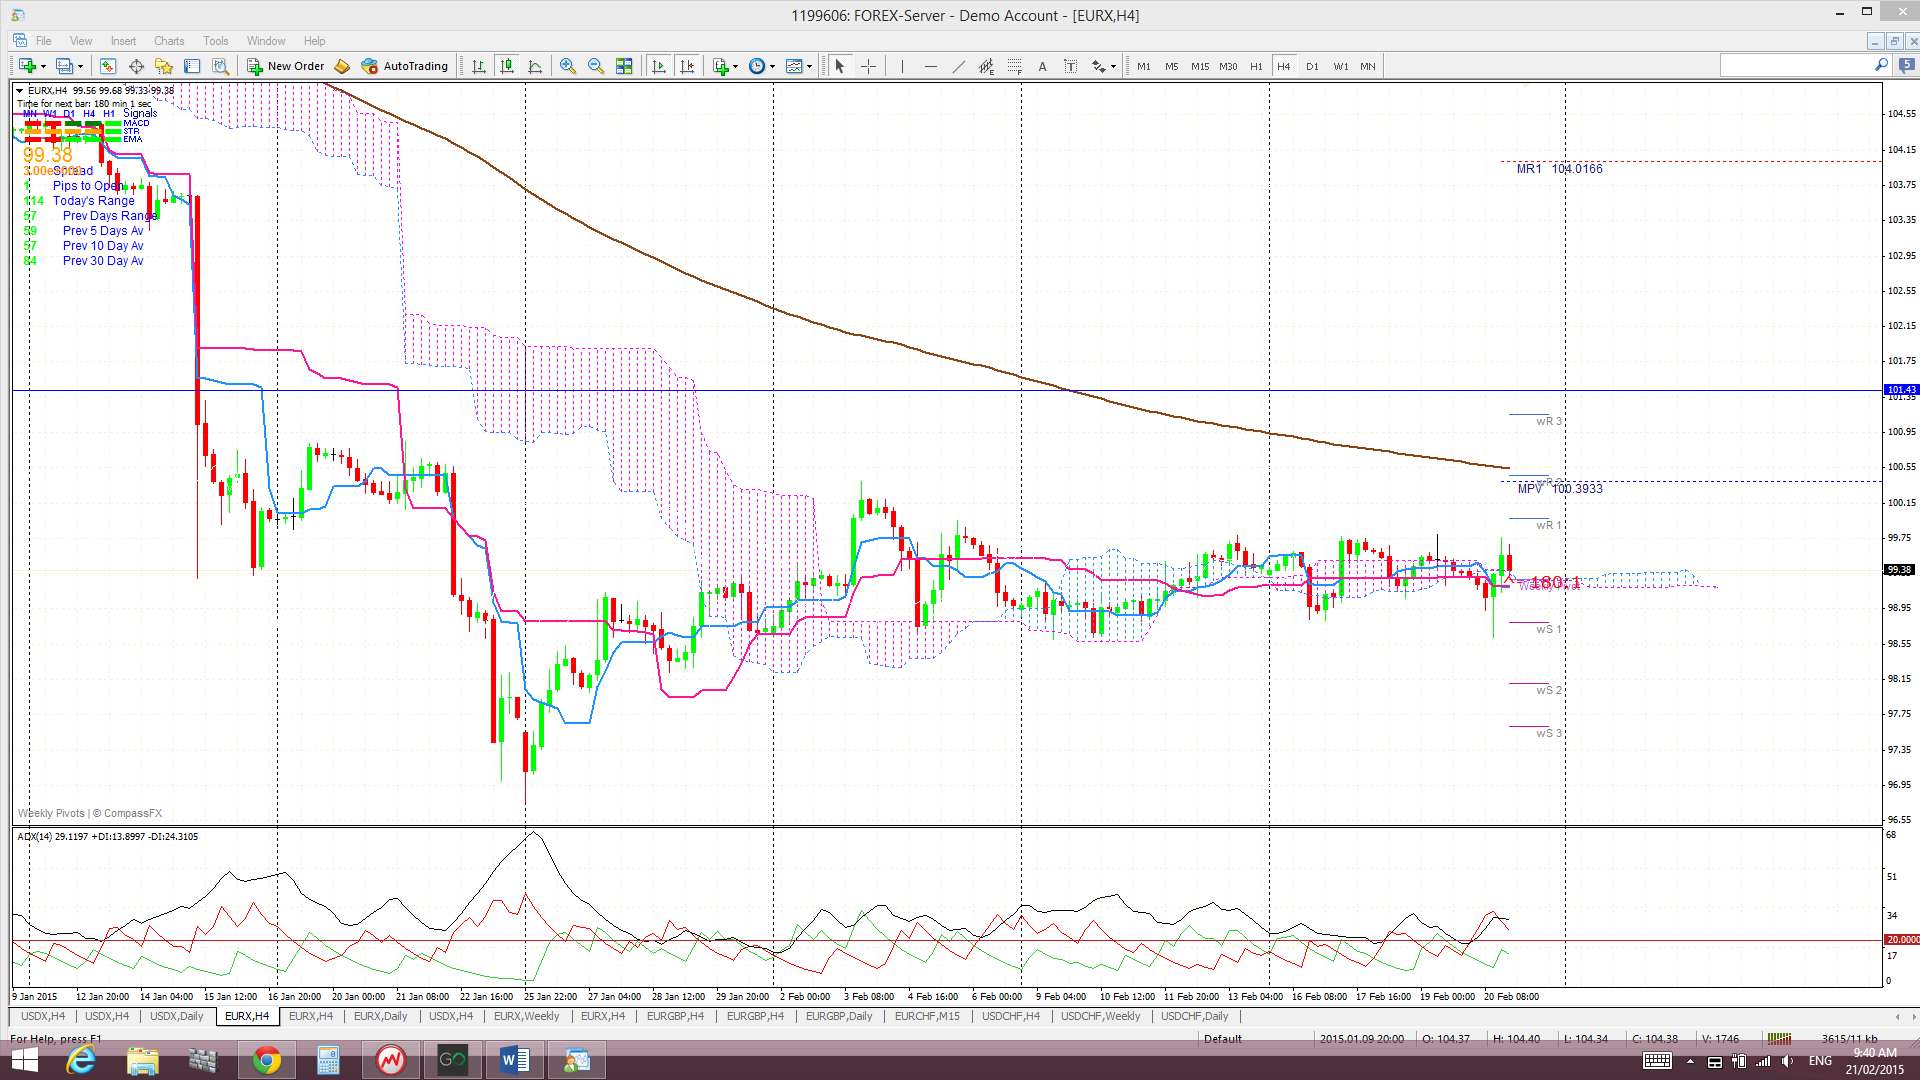
4 hr Ichimoku Cloud chart: The EURX chopped in and out of Cloud all week but finished just above this support. This chart is still divergent from the daily chart and suggests choppiness.
Comments:
USDX: the USDX closed slightly higher last week but is still range bound between two key S/R levels. The index is trading below 95.50 resistance but above 92.50 support. Price action has formed up into a triangle pattern on the 4hr chart but this is giving higher time frame charts a ‘Bull Flag’ appearance. However, the fact that price is trading below its recent high also presents the possibility of a bearish ‘Double Top’. A make or break of the two key S/R levels needs to be seen to help clarify this situation:
- A break and hold above 95.50 would support the ‘Bull Flag’.
- A break and hold below 92.50 would support the bearish ‘Double Top’.
Fibonacci levels on the weekly chart show that a 61.8% pull back of the recent bull run would bring price back down to test a previous breakout region from a monthly chart triangle pattern. This is something worth keeping in mind as this could be target for any potential pullback here.
The USA is still perceived as the best place to be invested but, just recently, money has been increasingly flowing into stocks rather than into the ‘flight to safety’ USD. It isn’t just the high-yield big cap US stocks enjoying this flow but the small cap ‘higher-risk’ sector is flying high too! UK stocks continue to enjoy gains following the ECB’s recent QE announcement and Aussie stocks continue higher as well. These stock-flows may be undermining the USD somewhat however and the recent FOMC statement did little to provide a ringing endorsement for USD Bulls either. From a charting perspective, the USD has been on a lengthy bull run and it may simply be running out of steam with the charts still crying out for a technically-based pullback. Many trading commentators are pinning their hopes on next week’s Fed Chair (Janet Yellen) testimony on the economy and monetary policy to help clear up the US rate rise situation. This may then decide the outcome of the ‘Double Top’ versus ‘Bull Flag’ situation here on the USDX and kick start wider spread FX trends again.
EURX: the EURX was little changed last week as Greek debt negotiations kept the EUR on tenterhooks. The Eurogroup have extended Greece an ‘olive branch’ of sorts but there is further negotiation set down for early next week. Thus, the situation here remains uncertain and this is reflected in the consolidation style price action seen on the 4hr chart. As noted over recent weeks, divergence between the EZ and US economies continues to be a dominant theme with the Eurozone entering a monetary easing cycle with the US emerging from one. The EURX, although flat for the week, is still shaping up within either a monthly chart ‘Inverse H&S’ or a possible ‘Double Bottom’. Any continuation move down towards the 100% fib near 96 would support the latter. Much will depend on whether the USD ‘Double Top’ or ‘Bull Flag evolves though.
Summary: The EURX and USDX both remain range bound with charting triangles and, as such, appear to be in holding patterns awaiting some news to trigger a breakout. The two main risk factors that might determine the direction of any triangle breakout on the EURX and on the USDX include:
- the finalising of Greek debt negotiations and
- the US Fed Chair Janet Yellen testimony.
Note: The analysis provided above is based purely on technical analysis of the current chart set ups. As always, Fundamental-style events, by way of any Ukraine, Ebola, Eurozone or Middle East events and/or news announcements, continue to be unpredictable triggers for price movement on the indices. These events always have the potential to undermine any technical analysis.
The post USDX and EURX still in holding patterns. appeared first on www.forextell.com.