USDX
Monthly: The January candle is still printing a large bullish candle and is currently sitting above the key S/R level of 92.50.

Monthly Ichimoku: The January candle is trading well above the monthly Cloud.

Weekly: Last week’s candle closed as a bullish candle with long shadows BUT above the key 92.50 level. Note the fib levels on the last major swing move higher though and how any 50% pull back would bring price down to near the broken trend line of the monthly chart’s triangle pattern.

Weekly Ichimoku: The weekly candle is still trading ABOVE the weekly Cloud.

Daily: Price traded within an ascending triangle for most of the week with a barrier at 92.50 but made a bullish breakout on Friday.

Daily Ichimoku Cloud chart: Price traded above the Cloud all week and there is still an open bullish Tenkan/Kijun cross in play.

4hr: Price traded under the 92.50 level for most of the last two weeks but broke out towards the end of last week:

4hr Ichimoku Cloud chart: Price traded above the Cloud for most of the week. This chart is aligned with the daily chart and suggests long USD.

EURX
Monthly: The January candle is currently printing a large bearish candle and has fallen through the support of the 50% fib of the 2012-2014 bull move and is sitting just above the 78.6% fib of this move. The monthly candle has yet to close but I am still seeing a larger-scale bullish ‘inverse H&S’ pattern developing here. The optimum target for this H&S would be down near the 102 region so I will watch to see where the monthly candle eventually closes.

Monthly Ichimoku: The January candle is now trading below the monthly Cloud.

Weekly: The weekly candle closed as a very large bearish candle and well outside the Bollinger Band, thus, a pullback would not surprise here.

Weekly Ichimoku: Price is trading well below the weekly Cloud.

Daily: Price traded lower last week but suffered a major fall on Thursday following the SNB intervention.

Daily Ichimoku Cloud chart: Price is still trading well below the daily Cloud.

4 hr: Price traded lower last week with one huge 4hr candle on Thursday contributing to most of the loss.
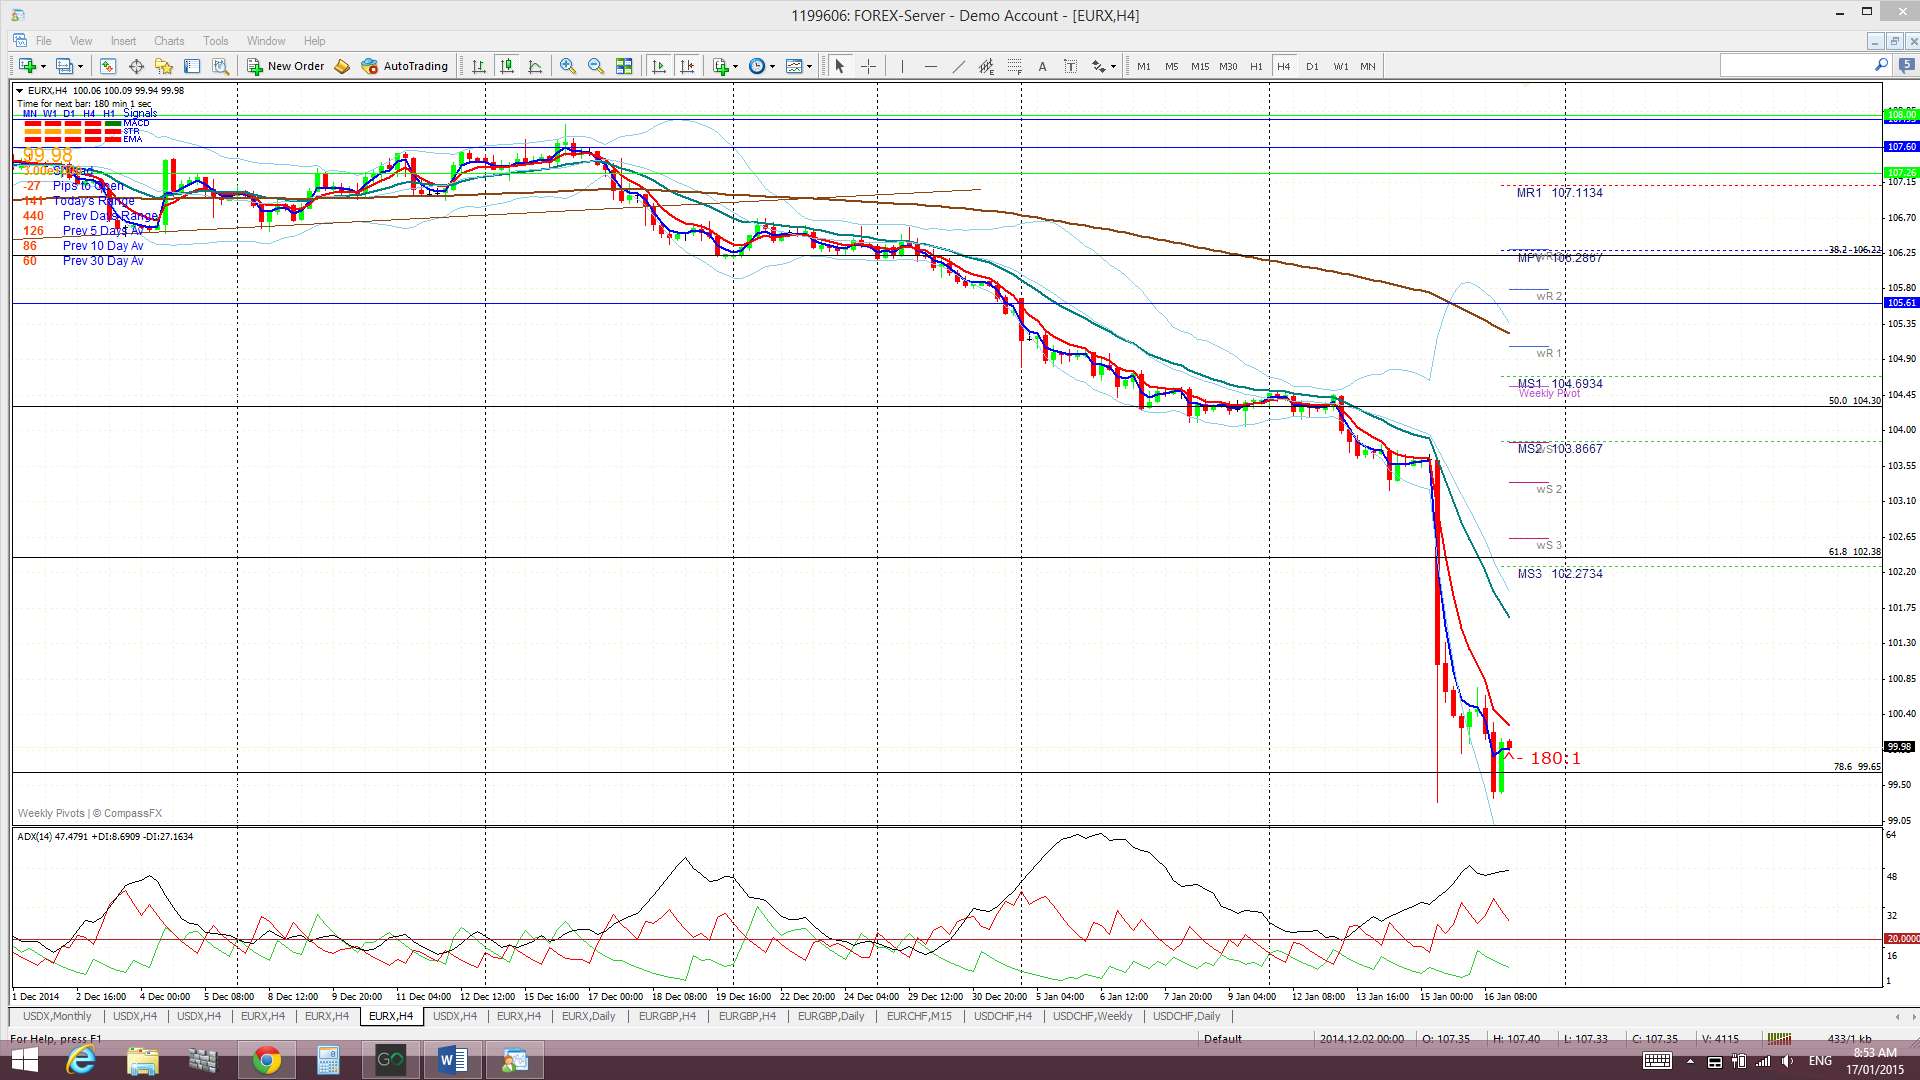
4 hr Ichimoku Cloud chart: The EURX traded below the Cloud all week. This chart is aligned with the daily chart and suggests short EUR.

Comments:
USDX: the USDX closed higher last week and has finally managed to print a weekly close above the major resistance level at 92.50. The longer term weekly chart below reveals the significance of this level:

I have to admit that given the weaker than expected US CPI data I’m surprised to see the index punch above this resistance. US Consumer Sentiment was upbeat though or maybe it was long w/e jubilation that helped get it over the line. Whatever, a hold above this 92.50 would seem to suggest continuation here despite the lengthy rally this index has been on. Global economics are such that USD is still being perceived as a safe haven currency and, so, this upward journey may continue despite the charts crying out for a technical pullback.
The daily USDX chart shows that the 6-month duration support trend line is well below current price and any future pull back would look to test the 90, 89.50, 89 and 88.50 levels and, then, this trend line. Interestingly, placing Fibonacci levels on the weekly chart’s last major swing move shows that a 50% pull back would bring price back down to test the previous the breakout region from monthly chart triangle pattern. Just something worth keeping in mind as this could be target for any deeper pullback here!
All trading eyes will be on the ECB next week (Thursday 22nd) for an update about potential further Quantitative Easing (QE). A package of some description is expected but it is the size and timing of the package that seems to be in question. News of generous easing could further enhance the appeal of the USD and sustain this latest rally. However, any ‘curve ball’ surprise of a delayed or smaller-scale QE package could trigger a pullback on both the USDX and EURX. The devil will be in the detail and traders will need to sift through this information.
EURX: the EURX closed much lower for the week primarily due to SNB intervention. However, divergence between the EZ and US economies continues to be a dominant theme as well. This action by the SNB helped to complete the EURX Bear Flag that I have been posting about for some weeks. The Bear Flag had been forming up within a larger bullish ‘Inverse H&S’ pattern and I’m watching for the monthly candle to close to see if this H&S pattern might evolve.
Bear Flag: This Bear Flag move has now completed. The weekly chart trend line break confirmed the start of a Bear Flag and the length of the ‘Flagpole’ was about 500 pips or so. This suggested a bearish continuation move below the trend line of about 500 pips as well. Such a move brought the index down to near the 102 region. SNB activity helped the EURX to reach this target and then some!
As mentioned above, traders need to monitor the outcome of next week’s ECB meeting to see how this QE news will impact EUR vs USD sentiment. The EURX is currently sitting at the 78.6% fib of the 2012-2-14 bull run but any further dip would suggest a target at the 100% fib near 96. This might then turn my ‘inverse H&S’ into a ‘Double Bottom’!
The post USDX breaks 92.50 & EURX Bear Flag completed. appeared first on www.forextell.com.