USDX
Monthly: The October candle is now printing a bearish Spinning Top candle and is sitting just below the key resistance of the monthly charts bear triangle trend line.
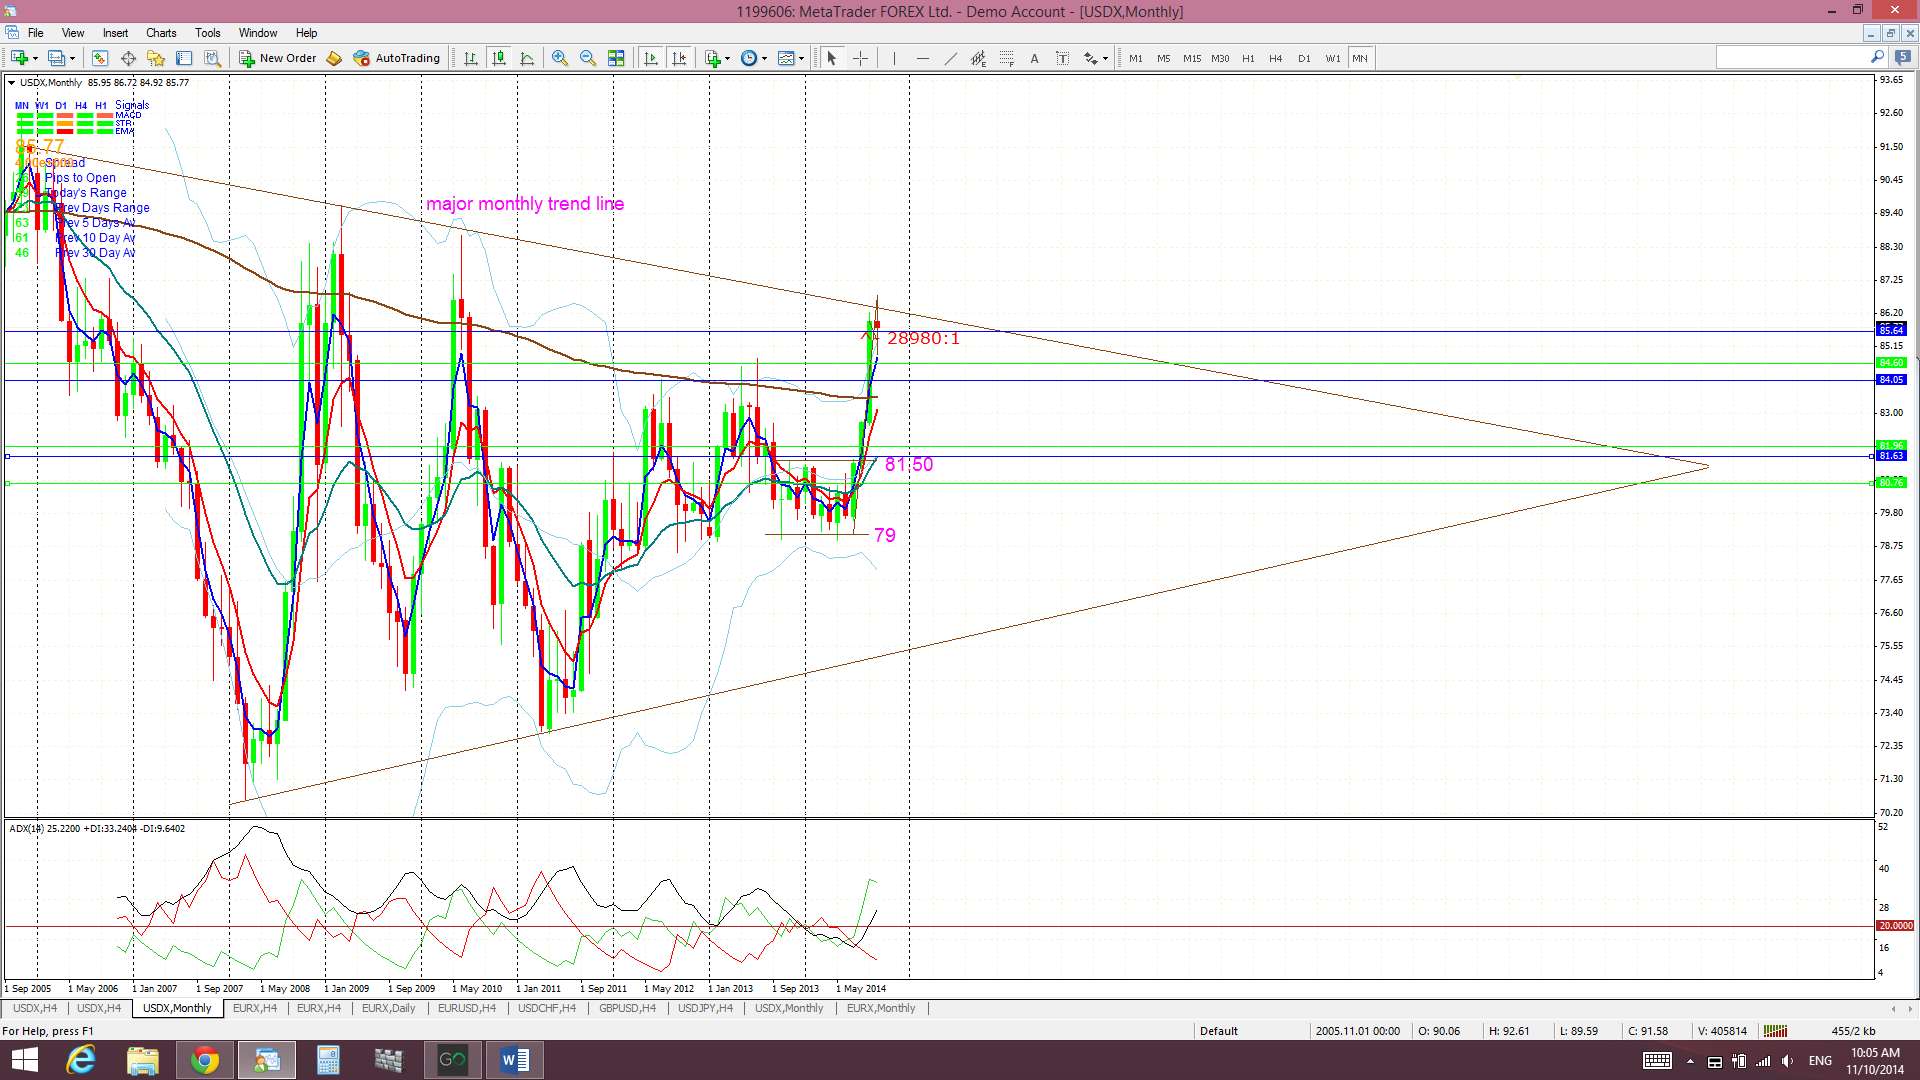
Monthly Ichimoku: The October candle is well above the monthly Cloud.
Weekly: The weekly candle closed as a bearish candle with a long lower shadow. It closed below the monthly chart’s bear trend line after previously testing this resistance zone the week before.
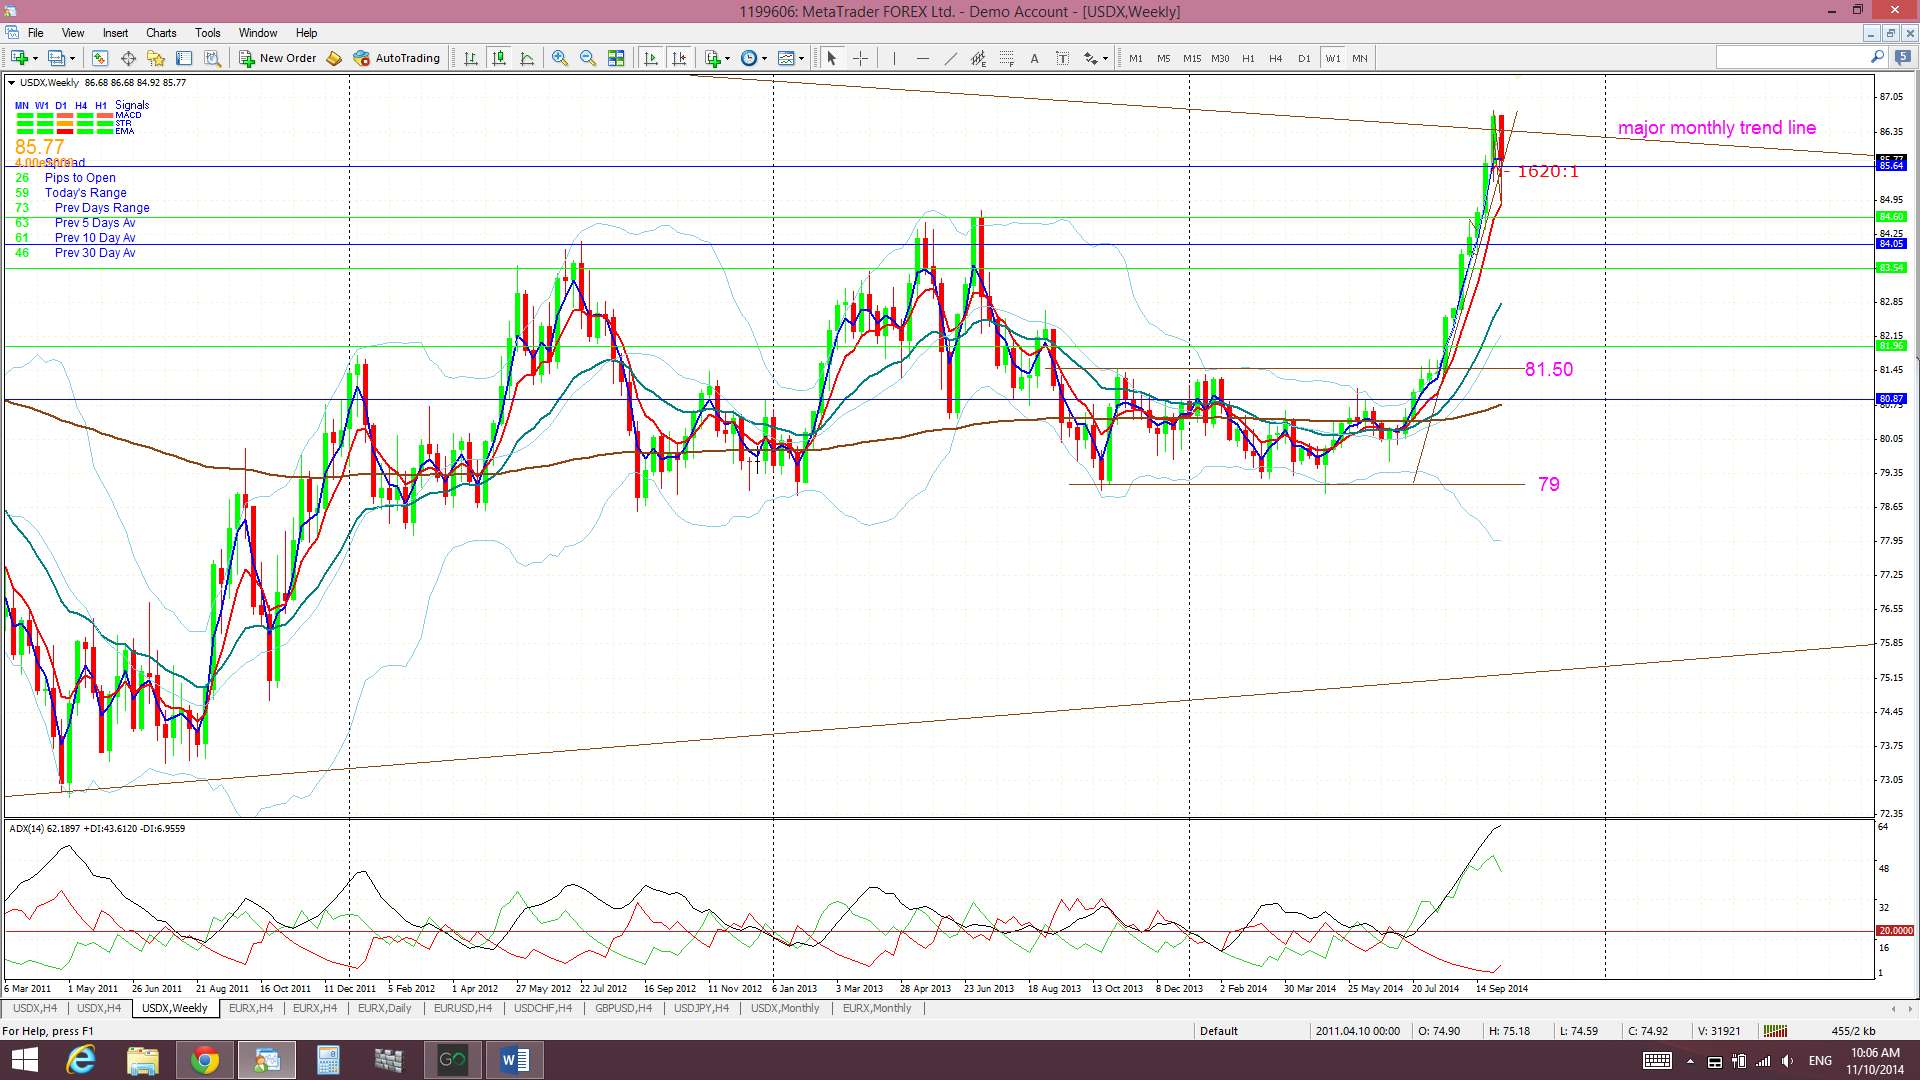
Weekly Ichimoku: Price is still trading ABOVE the weekly Cloud.
Daily: Price chopped lower for the first three days of last week and then higher for the last two.
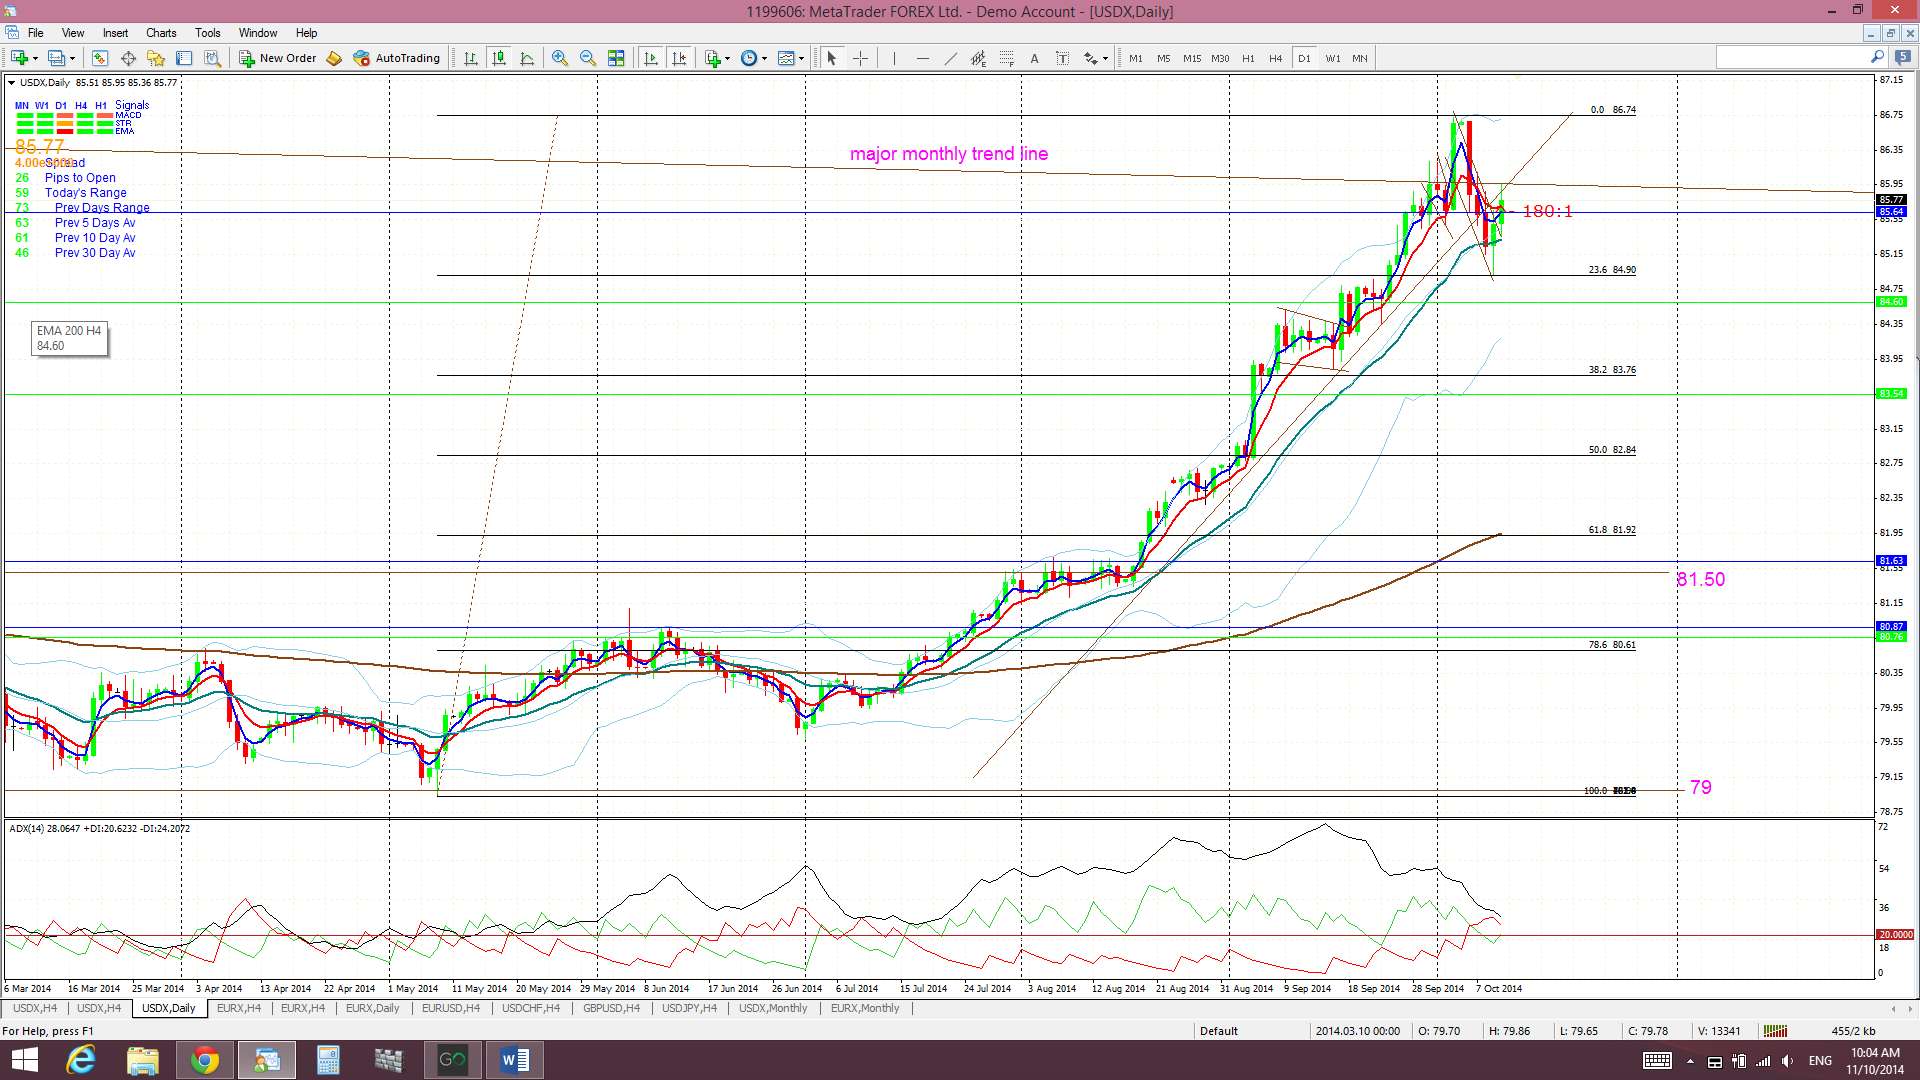
Daily Ichimoku Cloud chart: Price traded above the Cloud all week. Price is still well above the daily Cloud and some pull back here would not be out of order, even as part of a broader bullish continuation move. The pull back from the major trend line meant that the five daily candles last week closed below the Tenkan line.Â

4hr: Price consolidated within a new ‘Flag’ pattern last week under the key monthly trend line. The index made a bullish breakout from this ‘Flag’ on Friday but still couldn’t manage to close back above the previously broken daily support trend line.
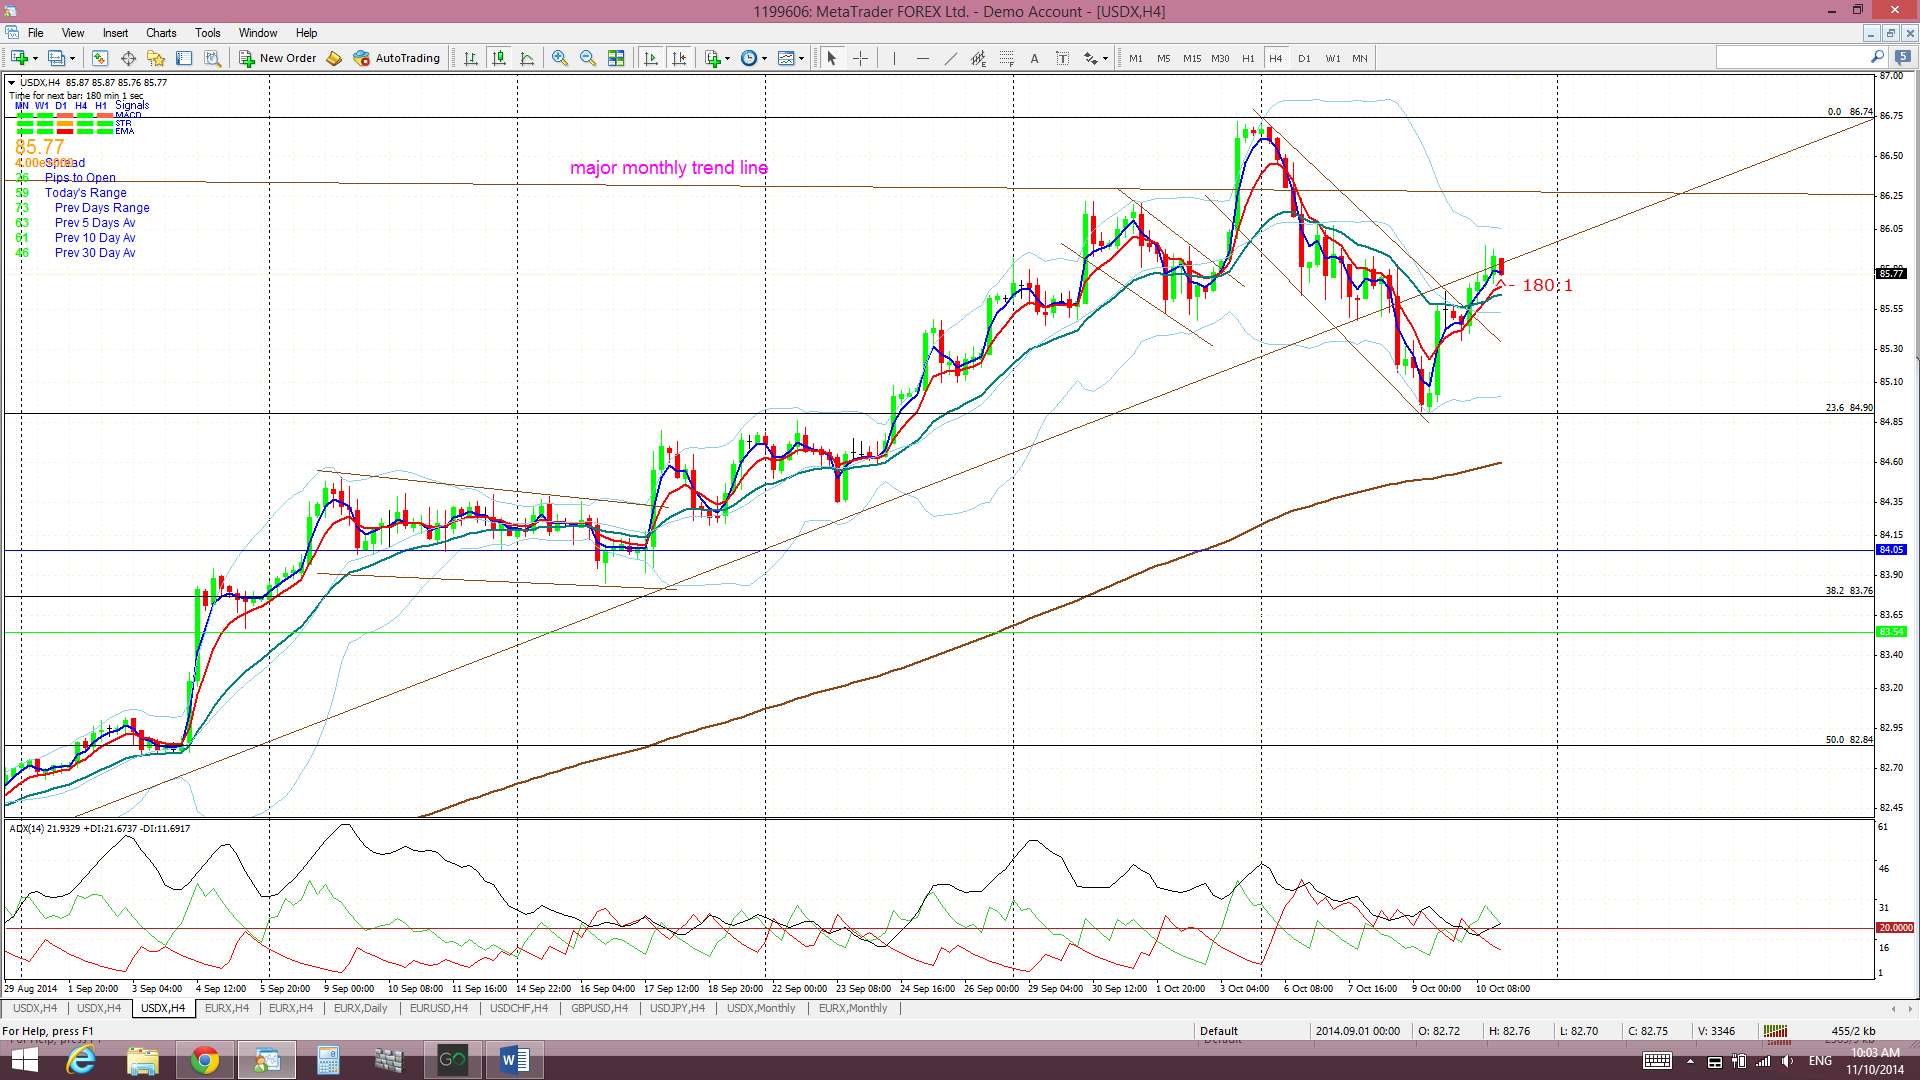
4hr Ichimoku Cloud chart: Price chopped back below the Cloud last week but recovered somewhat to close up within the Cloud. This chart is now divergent from the daily chart and suggests choppiness.
EURX
Monthly: The October candle is now printing a bearish Doji candle. I am still seeing a larger-scale bullish ‘inverse H&S’ pattern here.
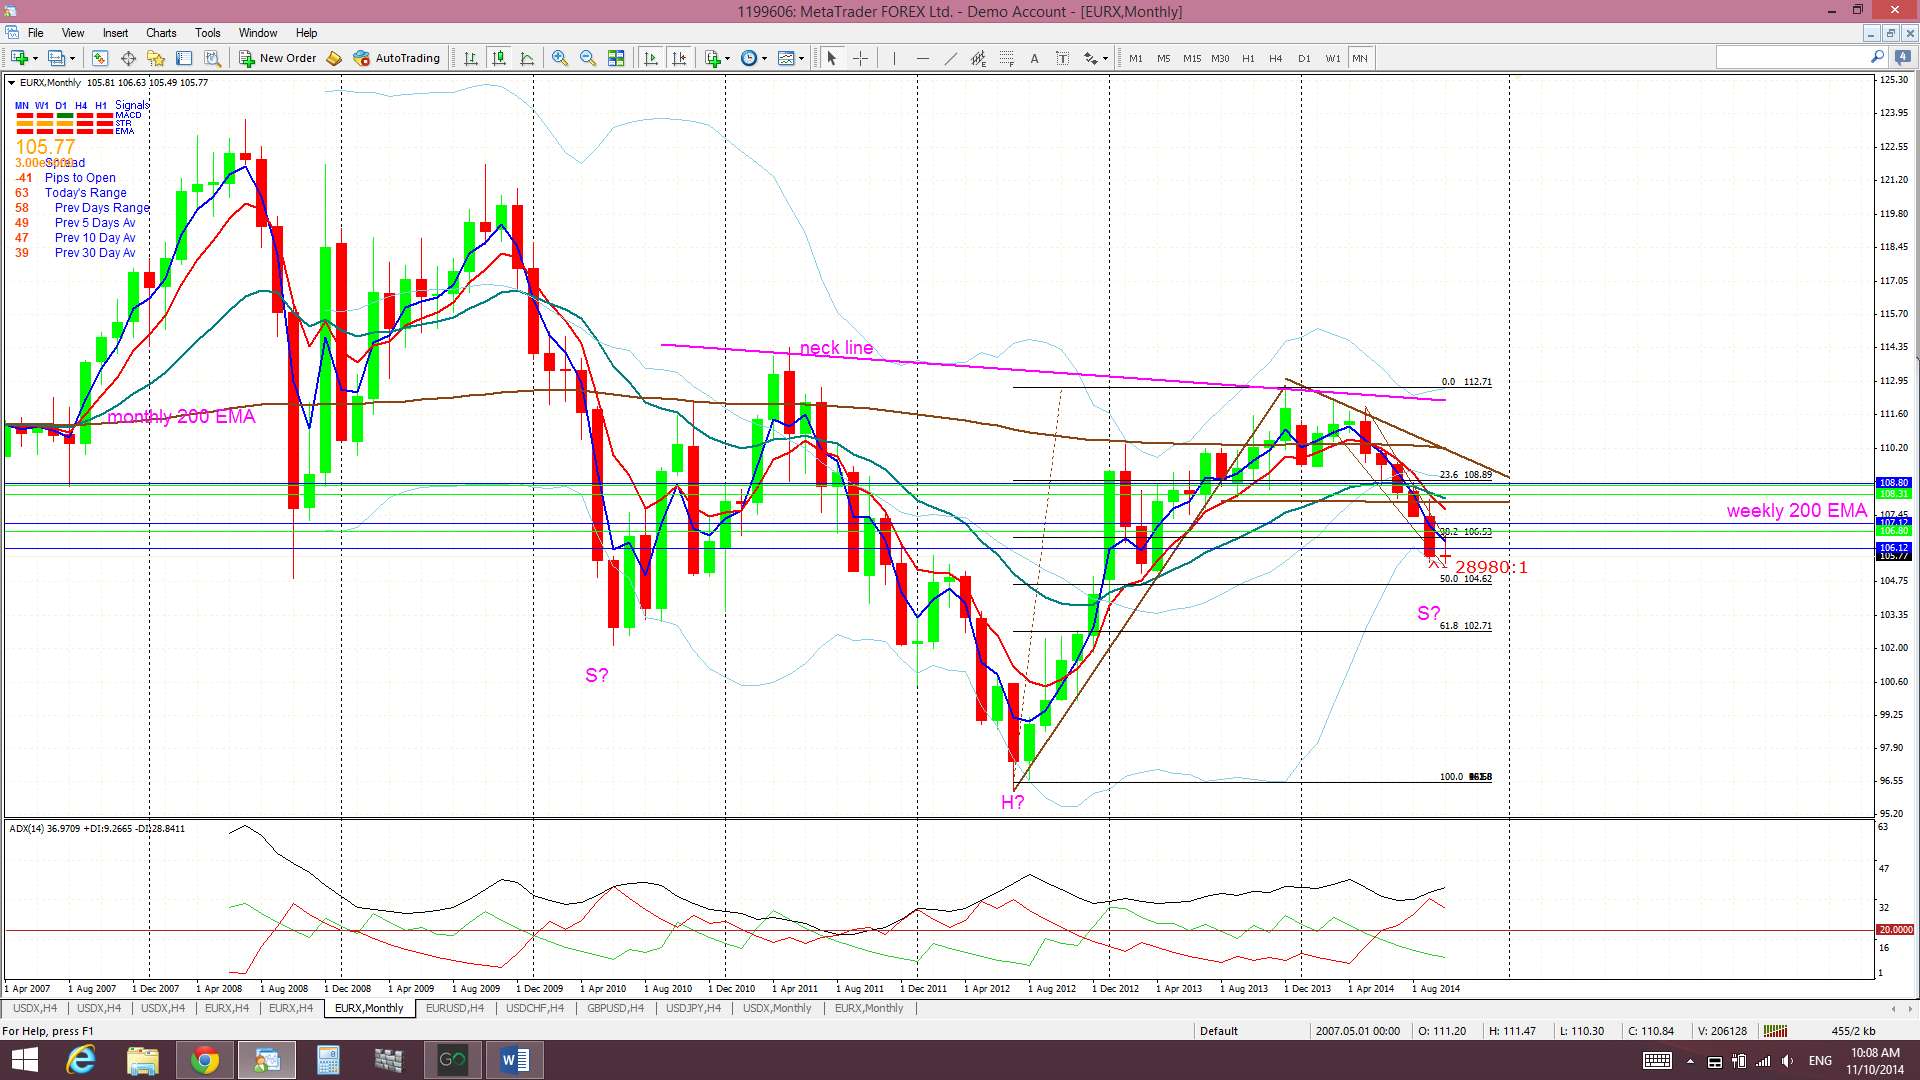
Monthly Ichimoku: The October candle is trading within the monthly Cloud.
Weekly: The weekly candle closed as a bullish-reversal ‘Inverted Hammer’ candle.
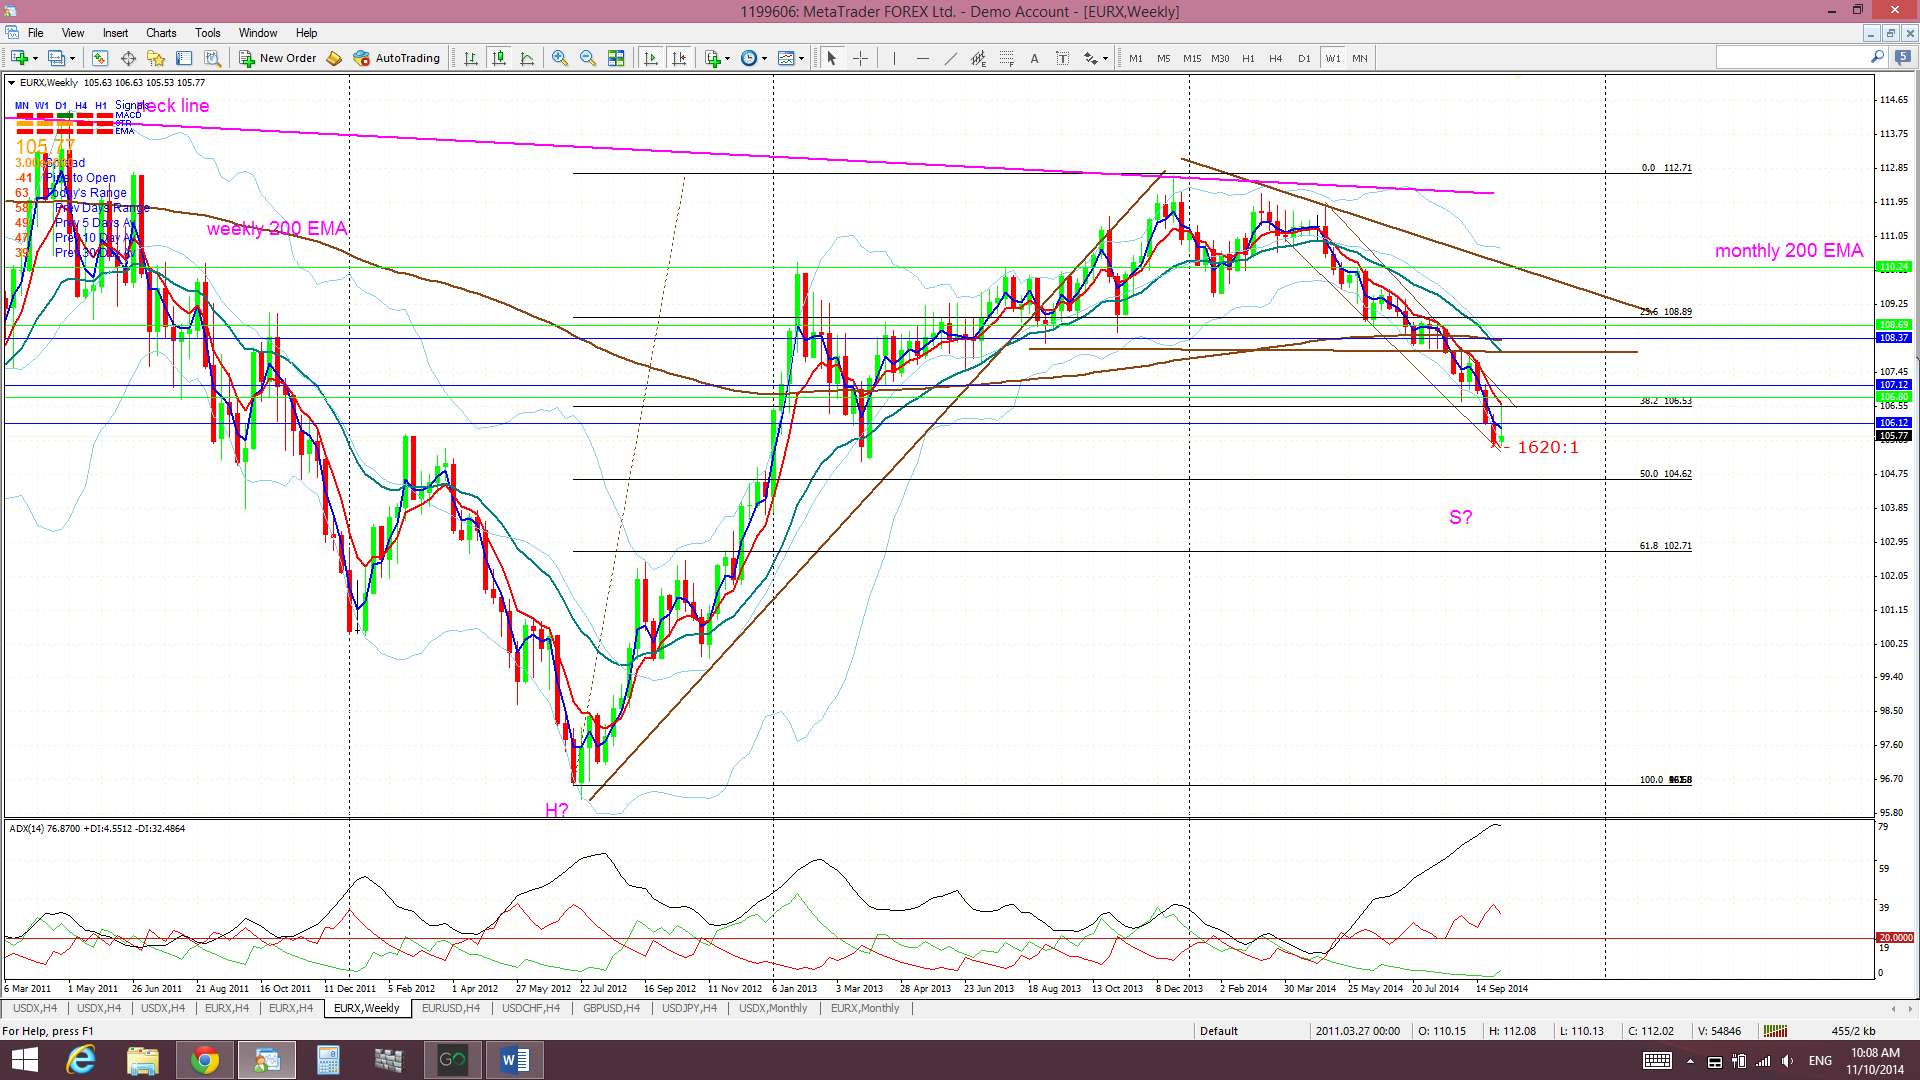
Weekly Ichimoku: Price is still trading below the weekly Cloud.
Daily: Price chopped up and down last week and still within the descending trading channel.
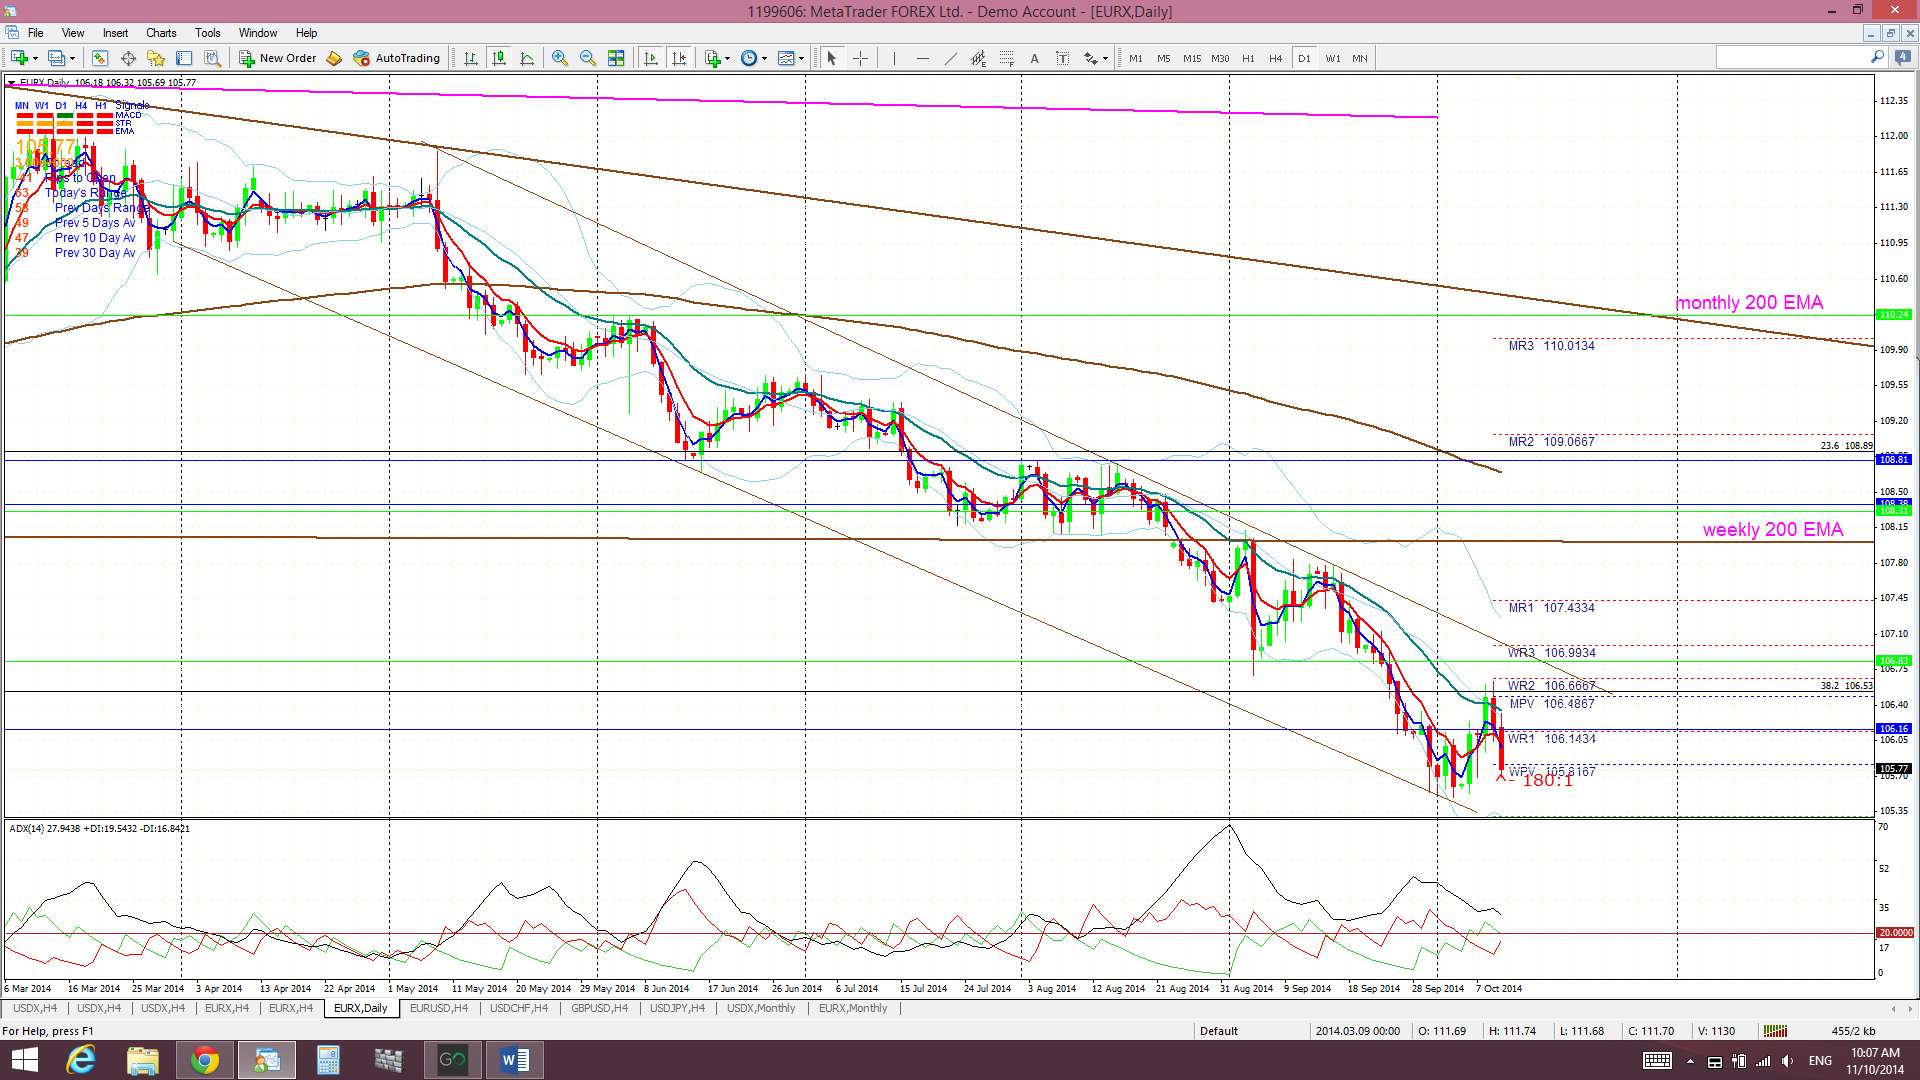
Daily Ichimoku Cloud chart: Price is still below the Cloud though.
4 hr: Price chopped higher then lower last week.

4 hr Ichimoku Cloud chart: The EURX chopped higher mid week and broke back above the 4hr Cloud but this rally faded and the index close the week back below the Cloud. This chart is aligned again with the daily chart and suggests short EUR.
Comments:
NB: I continue having some parallax issues with trend lines as I move from 4hr, to daily weekly and monthly time frames.
USDX: the USDX had a bearish week after peaking the previous week at the major resistance trend line from the monthly chart’s triangle pattern. As mentioned last week, given that this is a monthly pattern, traders really need to wait and see a monthly candle close and hold above this trend line to confirm a bullish breakout.
EURX: the EURX closed slightly higher for the week and the bullish-reversal weekly candle might be the brightest spot on the horizon for this pair! However, the index is still well below key support levels of the weekly Cloud, the 108.5 level, the weekly 200 EMA and the previously broken weekly support trend line. The main issue remains that divergence between the Eurozone and US economies continues to widen and this continues to put pressure on the EURX.
I am still on the lookout for a possible continued pull back down to the 103 region as this is a 61.8% fib pull back of the latest bull move (2012-2013) BUT I am keeping an open mind in light of the bullish weekly candle here. Any bearish continuation though would also tie in with the ‘inverse H&S’ that I’m seeing on the monthly chart. ECB President Draghi’s comments last week caused a EUR sell off and he speaks three times throughout the course of next week. These are obvious calendar events that need to be monitored.
Note: The analysis provided above is based purely on technical analysis of the current chart set ups. As always, Fundamental-style events, by way of any Ukraine, Euro zone or Middle East events and/or news announcements, continue to be unpredictable triggers for price movement on the indices. These events will always have the potential to undermine any technical analysis.
The post USDX: choppy under major resistance. FX Indices Review. appeared first on www.forextell.com.